UNITED STATES
SECURITIES AND EXCHANGE COMMISSION
WASHINGTON, D.C. 20549
FORM 20-F
| ¨ | REGISTRATION STATEMENT PURSUANT TO SECTION 12(b) OR 12(g) OF THE SECURITIES EXCHANGE ACT OF 1934 |
OR
| x | ANNUAL REPORT PURSUANT TO SECTION 13 OR 15(d) OF THE SECURITIES EXCHANGE ACT OF 1934 |
| | For the fiscal year ended December 31, 2015 |
OR
| ¨ | TRANSITION REPORT PURSUANT TO SECTION 13 OR 15(d) OF THE SECURITIES EXCHANGE ACT OF 1934 |
OR
| ¨ | SHELL COMPANY REPORT PURSUANT TO SECTION 13 OR 15(d) OF THE SECURITIES EXCHANGE ACT OF 1934 |
Date of event requiring this shell company report,
For the transition period from to
Commission file number: 001-12440
|
ENERSIS AMÉRICAS S.A. |
| (Exact name of Registrant as specified in its charter) |
ENERSIS AMÉRICAS S.A. |
| (Translation of Registrant’s name into English) |
CHILE |
| (Jurisdiction of incorporation or organization) |
Santa Rosa 76, Santiago, Chile |
| (Address of principal executive offices) |
Nicolás Billikopf, phone: (56-2) 2353-4639, nicolas.billikopf@enel.com, Santa Rosa 76, Piso 15, Santiago, Chile |
| (Name, Telephone, E-mail and/or Facsimile number and Address of Company Contact Person) |
Securities registered or to be registered pursuant to Section 12(b) of the Act:
| | |
Title of Each Class | | Name of Each Exchange on Which Registered |
| American Depositary Shares representing Common Stock | | New York Stock Exchange |
| Common Stock, no par value * | | New York Stock Exchange |
| US$ 249,734,000 7.40% Notes due December 1, 2016 | | New York Stock Exchange |
| US$ 858,000 6.60% Notes due December 1, 2026 | | New York Stock Exchange |
*Listed, not for trading, but only in connection with the registration of American Depositary Shares, pursuant to the requirements of the Securities and Exchange Commission.
Securities registered or to be registered pursuant to Section 12(g) of the Act: None
Securities for which there is a reporting obligation pursuant to Section 15(d) of the Act: None
Indicate the number of outstanding shares of each of the issuer’s classes of capital or common stock as of the close of the period covered by the annual report Shares
| | |
| of Common Stock: | | 49,092,772,762 |
Indicate by check mark if the registrant is a well-known seasoned issuer, as defined in Rule 405 of the Securities Act.
x Yes ¨ No
If this report is an annual or transition report, indicate by check mark if the registrant is not required to file reports pursuant to Section 13 or 15(d) of the Securities Exchange Act of 1934.
¨ Yes x No
Indicate by check mark whether the registrant (1) has filed all reports required to be filed by Section 13 or 15(d) of the Securities Exchange Act of 1934 during the preceding 12 months (or for such shorter period that the registrant was required to file such reports), and (2) has been subject to such filing requirements for the past 90 days.
x Yes ¨ No
Indicate by check mark whether the registrant has submitted electronically and posted on its corporate Web site, if any, every Interactive Data File required to be submitted and posted pursuant to Rule 405 of Regulation S-T (§232.405 of this chapter) during the preceding 12 months (or for such shorter period that the registrant was required to submit and post such files).
¨ Yes ¨ No
Indicate by check mark whether the registrant is a large accelerated filer, an accelerated filer, or a non-accelerated filer. See definition of “accelerated filer and large accelerated filer” in Rule 12b-2 of the Exchange Act.
| | | | | | | | |
| Large accelerated filerx | | Accelerated filer¨ | | | | Non-accelerated filer ¨ |
| | | | | | | | |
| Indicate by check mark which basis of accounting the registrant has used to prepare the financial statements included in this filing: |
| U.S. GAAP¨ | | International Financial Reporting Standards as issued by the International Accounting Standards Boardx | | Other¨ |
If “Other” has been checked in response to the previous question, indicate by check mark which financial statement item the registrant has elected to follow.
¨ Item 17 ¨ Item 18
If this is an annual report, indicate by check mark whether the registrant is a shell company (as defined in Rule 12b-2 of the Exchange Act).
¨ Yes x No
Enersis Américas’ Organizational Structure(1)
As of December 31, 2015 (assuming the spin-off of Enersis Chile S.A. had occurred as of such date)
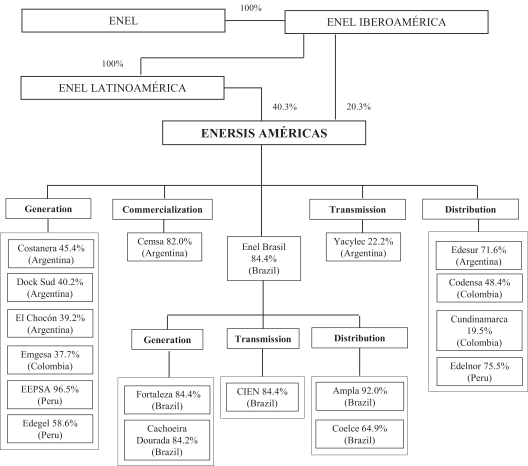
| (1) | Only principal operating subsidiaries are presented here. The percentage listed for each of our subsidiaries represents our economic interest in such subsidiary. |
2
TABLE OF CONTENTS
3
GLOSSARY
| | | | |
| AFP | | Administradora de Fondos de Pensiones | | A legal entity that manages a Chilean pension fund. |
| | |
| Ampla | | Ampla Energia e Serviços S.A. | | A publicly held Brazilian distribution company operating in Rio de Janeiro, owned by Enel Brasil, our subsidiary. |
| | |
| ANEEL | | Agência Nacional de Energia Elétrica | | Brazilian governmental agency for electric energy. |
| | |
| BNDES | | Banco Nacional de Desarrollo Económico y Social | | The National Bank for Economic and Social Development (“BNDES”) is the principal agent of development in Brazil with a focus on sustainable social and environmental development. |
| | |
| Cachoeira Dourada | | Centrais Elétricas Cachoeira Dourada S.A. | | Brazilian generation company owned by Enel Brasil, our subsidiary. |
| | |
| CAMMESA | | Compañía Administradora del Mercado Mayorista Eléctrico S.A. | | Argentine autonomous entity in charge of the operation of theMercado Eléctrico Mayorista (Wholesale Electricity Market), or MEM. CAMMESA’s stockholders are generation, transmission and distribution companies, large users and the Secretariat of Energy. |
| | |
| Cemsa | | Central Comercializadora de Energía S.A. | | Energy trading company with operations in Argentina, and our subsidiary. |
| | |
| Chilean Stock Exchanges | | Chilean Stock Exchanges | | The three principal stock exchanges located within Chile: the Santiago Stock Exchange, the Electronic Stock Exchange and the Valparaíso Stock Exchange. |
| | |
| Chilectra Américas | | Chilectra Américas S.A. | | Electricity distribution company holding minority interests in electricity distribution companies in Argentina, Brazil, Colombia and Peru, and our subsidiary. |
| | |
| Chilectra Chile | | Chilectra S.A. | | Chilean electricity distribution company operating in the Santiago metropolitan area and a combined entity of Enersis Chile. |
| | |
| CIEN | | Companhia de Interconexão Energética S.A. | | Brazilian transmission company, wholly-owned by Enel Brasil, our subsidiary. |
| | |
| Codensa | | Codensa S.A. E.S.P. | | Colombian distribution company that operates mainly in Bogotá and controlled by us. |
4
| | | | |
| | |
| Coelce | | Companhia Energética do Ceará S.A. | | A publicly held Brazilian distribution company operating in the state of Ceará. Coelce is controlled by Enel Brasil, our subsidiary. |
| | |
| COES | | Comité de Operación Económica del Sistema | | Peruvian entity in charge of coordinating the efficient operation and dispatch of generation units to satisfy demand. |
| | |
| Costanera | | Central Costanera S.A. | | A publicly held Argentine generation company controlled by Endesa Américas. Formerly known as Endesa Costanera. |
| | |
| CREG | | Comisión de Regulación de Energía y Gas | | Colombian Commission for the Regulation of Energy and Gas. |
| | |
| CTM | | Compañía de Transmisión del Mercosur S.A. | | Argentine transmission company and subsidiary of Enel Brasil. |
| | |
| DCV | | Depósito Central de Valores S.A. | | Chilean Central Securities Depositary. |
| | |
| DECSA | | Distribuidora Eléctrica de Cundinamarca S.A. | | Colombian distribution company and a subsidiary of Codensa. |
| | |
| Dock Sud | | Central Dock Sud S.A. | | Argentine generation company and our subsidiary. |
| | |
| Edegel | | Edegel S.A.A. | | A publicly held Peruvian generation company and a combined entity of Endesa Américas. |
| | |
| Edelnor | | Empresa de Distribución Eléctrica de Lima Norte S.A.A. | | A publicly held Peruvian distribution company, with a concession area in the northern part of Lima, and our subsidiary. |
| | |
| Edesur | | Empresa Distribuidora Sur S.A. | | Argentine distribution company, with a concession area in the south of the Buenos Aires greater metropolitan area, and our subsidiary. |
| | |
| EEB | | Empresa de Energía de Bogotá S.A. | | Colombian stated-owned financial and energy holding company, with investments in the electricity generation, transmission, trading and distribution sectors and in the natural gas transmission, distribution and trading sectors. |
| | |
| EEC | | Empresa de Energía de Cundinamarca S.A. E.S.P. | | Colombian distribution company and a subsidiary of DECSA, in which we hold 19.5% interest. |
| | |
| EEPSA | | Empresa Eléctrica de Piura S.A. | | A publicly held Peruvian generation company with natural gas thermal plants, and our subsidiary. |
| | |
| El Chocón | | Hidroeléctrica El Chocón S.A. | | Argentine generation company with two hydroelectric plants, El Chocón and Arroyito, both located in the Limay River, Argentina and a combined entity of Endesa Américas. |
5
| | | | |
| | |
| Emgesa | | Emgesa S.A. E.S.P. | | Colombian generation company controlled by Endesa Américas. |
| | |
| Endesa Américas | | Endesa Américas S.A. | | A limited liability stock corporation incorporated under the laws of the Republic of Chile, with electricity generation operations in Argentina, Colombia and Peru. Our subsidiary. |
| | |
| Endesa Chile | | Empresa Nacional de Electricidad S.A. | | A publicly held limited liability stock corporation incorporated under the laws of the Republic of Chile, with electricity generation assets in Chile, and a combined entity of Enersis Chile. |
| | |
| Enel | | Enel S.p.A. | | An Italian energy company with multinational operations in the power and gas markets. A 60.6% beneficial owner of us and our ultimate parent company. |
| | |
| Enel Brasil | | Enel Brasil S.A. | | Brazilian holding company and our subsidiary. Enel Brasil was formerly known as Endesa Brasil S.A. |
| | |
| Enel Iberoamérica | | Enel Iberoamérica, S.R.L. | | A wholly-owned subsidiary of Enel and owner of 20.3% of us, which it acquired from Endesa Spain in October 2014. Enel Iberoamérica was formerly known as Enel Energy Europe S.R.L. |
| | |
| Enel Latinoamérica | | Enel Latinoamérica, S.A. | | A wholly-owned subsidiary of Enel Iberoamérica and owner of 40.3% of us. |
| | |
| Enersis Américas | | Enersis Américas S.A. | | Our company, a publicly held limited liability stock corporation incorporated under the laws of the Republic of Chile, with subsidiaries engaged primarily in the generation, transmission and distribution of electricity in Argentina, Brazil, Colombia, and Peru. Registrant of this Report. |
| | |
| Enersis Chile | | Enersis Chile S.A. | | A publicly held limited liability stock corporation incorporated under the laws of the Republic of Chile, which holds combined entities engaged primarily in the generation and distribution of electricity in Chile controlled by Enel. |
| | |
| ENRE | | Ente Nacional Regulador de la Electricidad | | Argentine national regulatory authority for the energy sector. |
| | |
| ESM | | Extraordinary Shareholders’ Meeting | | Extraordinary Shareholders’ Meeting. |
| | |
| FONINVEMEM | | Fondo para Inversiones Necesarias que permitan Incrementar la Oferta de Energía Eléctrica en el Mercado Eléctrico Mayorista | | Argentine fund created to increase electricity supply in the MEM. |
| | |
| Fortaleza | | Central Geradora Termelétrica Fortaleza S.A. | | Brazilian generation company that operates in the state of Ceará. Fortaleza is wholly-owned by Enel Brasil, our subsidiary. |
| | |
| Gener | | AES Gener S.A. | | Chilean generation company that competes with the Company in Argentina and Colombia. |
6
| | | | |
| | |
| IFRS | | International Financial Reporting Standards | | International Financial Reporting Standards as issued by the International Accounting Standards Board (IASB). |
| | |
| LNG | | Liquefied Natural Gas. | | Liquefied natural gas. |
| | |
| MEM | | Mercado Eléctrico Mayorista | | Wholesale Electricity Market in Argentina, Colombia, and Peru. |
| | |
| MME | | Ministério de Minas e Energia | | Brazilian Ministry of Mines and Energy. |
| | |
| NCRE | | Non-Conventional Renewable Energy | | Energy sources which are continuously replenished by natural processes, such as wind, biomass, mini-hydro, geothermal, wave, or tidal energy. |
| | |
| NIS | | Sistema Interconectado Nacional | | National interconnected electric system. There are such systems in Argentina, Brazil, and Colombia. |
| | |
| ONS | | Operador Nacional do Sistema Elétrico | | Electric System National Operator. Brazilian non-profit private entity responsible for the planning and coordination of operations in interconnected systems. |
| | |
| Osinergmin | | Organismo Supervisor de la Inversión en Energía y Minería | | Energy and Mining Investment Supervisor Authority, the Peruvian regulatory electricity authority. |
| | |
| OSM | | Ordinary Shareholders’ Meeting | | Ordinary Shareholders’ Meeting. |
| | |
| SVS | | Superintendencia de Valores y Seguros | | Chilean Superintendence of Securities and Insurance, the authority that supervises public companies, securities and the insurance business. |
| | |
| TESA | | Transportadora de Energía S.A. | | Transmission company with operations in Argentina and a subsidiary of Enel Brasil. |
| | |
| UF | | Unidad de Fomento | | Chilean inflation-indexed, Chilean peso-denominated monetary unit. |
| | |
| UTA | | Unidad Tributaria Anual | | Chilean annual tax unit. One UTA equals 12Unidad Tributaria Mensual (“UTM”), which is a Chilean inflation-indexed monthly tax unit used to define fines, among other purposes. |
| | |
| VAD | | Valor Agregado de Distribución | | Value added from distribution of electricity. |
| | |
| XM | | Expertos de Mercado S.A. E.S.P. | | A subsidiary of Interconexión Eléctrica S.A. (“ISA”), a Colombian company that provides system management in real time services in electrical, financial and transportation sectors. |
7
INTRODUCTION
As used in this Report on Form 20-F (“Report”), first person personal pronouns such as “we”, “us” or “our” refer to Enersis Américas S.A. (“Enersis Américas” or the “Company”) and our consolidated subsidiaries unless the context indicates otherwise. Unless otherwise noted, our interest in our principal subsidiaries, and jointly-controlled companies and associates is expressed in terms of our economic interest as of December 31, 2015.
We are a Chilean company engaged through our subsidiaries and jointly-controlled companies in the electricity generation, transmission and distribution businesses in Argentina, Brazil, Colombia, and Peru. As of the date of this Report, we own 60.0% of Endesa Américas S.A. (“Endesa Américas”), a Chilean electricity generation company that holds electricity generation operations in Argentina, Colombia and Peru, minority interests in generation, distribution and transmission operations in Brazil, and 99.1% of Chilectra Américas S.A. (“Chilectra Américas”), a Chilean electricity distribution company that holds minority interests in distribution companies in Argentina, Brazil, Colombia and Peru. As of the date of this Report, Enel S.p.A. (“Enel”), an Italian energy company with multinational operations in the power and gas markets, beneficially owns 60.6% of us and our ultimate parent.
On April 21, 2016, (i) we completed the spin-off of Enersis Chile, (ii) Endesa Chile completed the spin-off of Endesa Americas and (iii) Chilectra completed the spin-off of Chilectra Americas. As a result of these transactions, we acquired our 60.0% interest in Endesa Americas and 99.1% interest in Chilectra Americas. The respective spin-offs were effected by means of a division or “demerger” under Chilean law of each of Enersis Américas, Endesa Chile and Chilectra effective as of March 1, 2016, which created Enersis Chile, Endesa Américas and Chilectra Américas, respectively. These spin-offs were followed by the distribution on April 21, 2016 of the shares of Enersis Chile, Endesa Américas and Chilectra Américas and on April 26, 2016 of the ADRs of Enersis Chile and Endesa Américas. Each of Enersis Chile, Endesa Chile and Chilectra continues to own the Chilean assets it owned prior to the respective spin-offs. Enersis Chile owns 60.0% of Endesa Chile and 99.1% of Chilectra. We do not hold any remaining interest in Enersis Chile, Endesa Chile or Chilectra, which collectively hold the Chilean assets owned by us prior to the spin-offs.
We have announced a plan for a merger of Endesa Americas and Chilectra Americas with us (the “Merger”) and for a related tender offer by us for shares of Endesa Americas (the “Tender Offer”). It is expected that the Merger and Tender Offer will be consummated in the third quarter of 2016, subject to satisfaction of the conditions to such transactions. All of the transactions referred to above collectively are referred to as the “Reorganization.” The purpose of the spin-offs and the Reorganization is to separate our generation, transmission and distribution businesses in Chile from the generation, transmission and distribution businesses in Argentina, Brazil, Colombia and Peru. The purpose of the Merger is to combine our non-Chilean generation, transmission and distribution businesses under a single holding company, to reduce inefficiencies and create more liquidity for our shareholders.
8
PRESENTATION OF INFORMATION
Financial Information
In this Report, unless otherwise specified, references to “U.S. dollars,” “US$,” are to dollars of the United States of America; references to “pesos” or “Ch$” are to Chilean pesos, the legal currency of Chile; references to “Ar$” or “Argentine pesos” are to the legal currency of Argentina; references to “R$,” or “reais” are to Brazilian reais, the legal currency of Brazil; references to “soles” are to Peruvian Soles, the legal currency of Peru; references to “CPs” or “Colombian pesos” are to the legal currency of Colombia; references to “€” or “Euros” are to the legal currency of the European Union; and references to “UF” are to Development Units (Unidades de Fomento).
The UF is a Chilean inflation-indexed, peso-denominated monetary unit that is adjusted daily to reflect changes in the official Consumer Price Index (“CPI”) of the Chilean National Institute of Statistics (Instituto Nacional de Estadísticasor “INE”). The UF is adjusted in monthly cycles. Each day in the period beginning on the tenth day of the current month through the ninth day of the succeeding month, the nominal peso value of the UF is indexed in order to reflect a proportionate amount of the change in the Chilean CPI during the prior calendar month. As of December 31, 2015, one UF was equivalent to Ch$ 25,629.09. The U.S. dollar equivalent of one UF was US$ 36.09 as of December 31, 2015, using the Observed Exchange Rate reported by the Central Bank of Chile (Banco Central de Chile) as of December 31, 2015 of Ch$ 710.16 per US$ 1.00. The U.S. dollar observed exchange rate (dólar observado) (the “Observed Exchange Rate”), which is reported by the Central Bank of Chile and published daily on its webpage, is the weighted average exchange rate of the previous business day’s transactions in the Formal Exchange Market
The Central Bank of Chile may intervene by buying or selling foreign currency on the Formal Exchange Market to maintain the Observed Exchange Rate within a desired range.
As of March 31, 2016, one UF was equivalent to Ch$ 25,812.05. The U.S. dollar equivalent of one UF was US$ 38.54 on March 31, 2016, using the Observed Exchange Rate reported by the Central Bank of Chile as of such date of Ch$ 669.80 per US$ 1.00.
Our consolidated financial statements and, unless otherwise indicated, other financial information concerning us included in this Report are presented in Chilean pesos. We have prepared our consolidated financial statements in accordance with International Financial Reporting Standards (“IFRS”), as issued by the International Accounting Standards Board (“IASB”).
All of our subsidiaries are integrated and all their assets, liabilities, income, expenses and cash flows are included in the consolidated financial statements after making the adjustments and eliminations related to intra-group transactions. Investments in associated companies over which we exercise significant influence are included in our consolidated financial statements using the equity method. For detailed information regarding consolidated entities, jointly-controlled entities and associated companies, see Appendices 1, 2 and 3 to the consolidated financial statements.
Since the conditions established under IFRS were met by December 31, 2015, in the financial statements included in this Report, all operations regarding the former Chilean businesses have been presented as discontinued operations.
For the convenience of the reader, this Report contains translations of certain Chilean peso amounts into U.S. dollars at specified rates. Unless otherwise indicated, the U.S. dollar equivalent for information in Chilean pesos is based on the Observed Exchange Rate for December 31, 2015, as defined in “Item 3. Key Information — A. Selected Financial Data — Exchange Rates”. The Federal Reserve Bank of New York does not report a noon buying rate for Chilean pesos. No representation is made that the Chilean peso or U.S. dollar amounts shown in this Report could have been or could be converted into U.S. dollars or Chilean pesos, as the case may be, at such rate or at any other rate. See “Item 3. Key Information — A. Selected Financial Data — Exchange Rates”.
Technical Terms
References to “TW” are to terawatts; references to “GW” and “GWh” are to gigawatts and gigawatt hours, respectively; references to “MW” and “MWh” are to megawatts and megawatt hours, respectively; references to “kW” and “kWh” are to kilowatts and kilowatt hours, respectively; references to “kV” are to kilovolts, and references to “MVA” are to megavolt amperes. References to “BTU” and “MBTU” are to British thermal unit and million British thermal units, respectively. A “BTU” is an energy unit equal to approximately 1,055 joules. References to “Hz” are to hertz; and references to “mtpa” are to metric tons per annum. Unless otherwise indicated, statistics provided in this Report with respect to the installed capacity of electricity generation facilities are expressed in MW. One TW equals 1,000 GW, one GW equals 1,000 MW and one MW equals 1,000 kW.
Statistics relating to aggregate annual electricity production are expressed in GWh and based on a year of 8,760 hours, except for leap years, which are based on 8,784 hours. Statistics relating to installed capacity and production of the electricity industry do not include electricity of self-generators.
9
Energy losses experienced by generation companies during transmission are calculated by subtracting the number of GWh of energy sold from the number of GWh of energy generated (excluding their own energy consumption and losses on the part of the power plant), within a given period. Losses are expressed as a percentage of total energy generated.
Energy losses during distribution are calculated as the difference between total energy purchased (GWh of electricity demand, including own generation) and the energy sold (also measured in GWh), within a given period. Distribution losses are expressed as a percentage of total energy purchased. Losses in distribution arise from illegally tapped energy as well as technical losses.
Calculation of Economic Interest
References are made in this Report to the “economic interest” of Enersis Américas in its related companies. In circumstances where we do not directly own an interest in a related company, our economic interest in such ultimate related company is calculated by multiplying the percentage of economic interest in a directly held related company by the percentage of economic interest of any entity in the ownership chain of such related company. For example, if we own 60% of a directly held subsidiary and that subsidiary owns 40% of an associate, our economic interest in such associate would be 60% times 40%, or 24%.
Rounding
Certain figures included in our consolidated financial statements have been rounded for ease of presentation. Percentages expressed in this Report may not have been calculated using rounded figures, but by using amounts prior to rounding. For this reason, percentages expressed in this Report may vary from those obtained by performing the same calculations using figures in our consolidated financial statements. Certain other amounts that appear in the tables in this Report may not total exactly due to rounding.
10
FORWARD-LOOKING STATEMENTS
This Report contains statements that are or may constitute forward-looking statements within the meaning of Section 27A of the Securities Act of 1933, as amended, and Section 21E of the Securities Exchange Act of 1934, as amended (the “Exchange Act”). These statements appear throughout this Report and include statements regarding our intent, belief or current expectations, including but not limited to any statements concerning:
| | • | | our capital investment program; |
| | • | | trends affecting our financial condition or results from operations; |
| | • | | the future impact of competition and regulation; |
| | • | | political and economic conditions in the countries in which we or our related companies operate or may operate in the future; |
| | • | | any statements preceded by, followed by or that include the words “believes”, “expects”, “predicts”, “anticipates”, “intends”, “estimates”, “should”, “may” or similar expressions; and |
| | • | | other statements contained or incorporated by reference in this Report regarding matters that are not historical facts. |
Because such statements are subject to risks and uncertainties, actual results may differ materially from those expressed or implied by such forward-looking statements. Factors that could cause actual results to differ materially include, but are not limited to:
| | • | | changes in the regulatory framework of the electricity industry in one or more of the countries in which we operate; |
| | • | | our ability to implement proposed capital expenditures, including our ability to arrange financing where required; |
| | • | | the nature and extent of future competition in our principal markets; |
| | • | | political, economic and demographic developments in the markets in South America where we conduct our business; and |
| | • | | the factors discussed below under “Risk Factors”. |
You should not place undue reliance on such statements, which speak only as of the date that they were made. Our independent registered public accounting firm has not examined or compiled the forward-looking statements and, accordingly, does not provide any assurance with respect to such statements. You should consider these cautionary statements together with any written or oral forward-looking statements that we may issue in the future. We do not undertake any obligation to release publicly any revisions to forward-looking statements contained in this Report to reflect later events or circumstances or to reflect the occurrence of unanticipated events.
For all these forward-looking statements, we claim the protection of the safe harbor for forward-looking statements contained in the Private Securities Litigation Reform Act of 1995.
11
PART I
| Item 1. | Identity of Directors, Senior Management and Advisers |
Not applicable.
| Item 2. | Offer Statistics and Expected Timetable |
Not applicable.
A. Selected Financial Data
The following summary of consolidated financial data should be read in conjunction with our consolidated financial statements included in this Report. The selected consolidated financial data as of December 31, 2015 and 2014 and for each of the years in the three-year period ended December 31, 2015 is derived from our audited consolidated financial statements included in this Report. The selected consolidated financial data as of December 31, 2013 is derived from our consolidated financial statements included in this Report. Since January 1, 2009, our consolidated financial statements were prepared in accordance with IFRS, as issued by the IASB.
Amounts are expressed in millions, except for ratios, operating data, shares and ADS (American Depositary Shares) data. For the convenience of the reader, all data presented in U.S. dollars in the following summary, as of and for the year ended December 31, 2015, has been converted at the U.S. dollar Observed Exchange Rate (dólar observado) for that date of Ch$ 710.16 per US$ 1.00. The Observed Exchange Rate, which is reported and published daily on the Central Bank of Chile’s web page, corresponds to the weighted average exchange rate of the previous business day’s transactions in the Formal Exchange Market.
For more information concerning historical exchange rates, see “ — Exchange Rates” below.
12
The following tables set forth our selected consolidated financial data for the years indicated and the operating data of subsidiaries:
| | | | | | | | | | | | | | | | |
| | | As of and for the year ended December 31, | |
| | | 2015(1) | | | 2015 | | | 2014 | | | 2013(2) | |
| | | (US$ millions) | | | | | | (Ch$ millions) | | | | |
| Consolidated Statement of Comprehensive Income Data | | | | | | | | | | | | | | | | |
| Revenues and other operating income | | | 7,465 | | | | 5,301,440 | | | | 5,206,370 | | | | 4,528,148 | |
| Operating expenses(3) | | | (5,698) | | | | (4,046,682) | | | | (3,818,370) | | | | (3,177,080) | |
| Operating income | | | 1,767 | | | | 1,254,758 | | | | (1,388,000) | | | | 1,351,068 | |
| Financial income (expense), net | | | 40 | | | | 28,287 | | | | (213,316) | | | | (118,899) | |
| Total gain (loss) on sale of non-current assets not held for sale | | | (9) | | | | (6,566) | | | | 877 | | | | 4,642 | |
| Other non-operating income | | | 5 | | | | 3,333 | | | | 2,560 | | | | 980 | |
| | | | |
| Income before income tax | | | 1,802 | | | | 1,279,812 | | | | 1,178,121 | | | | 1,237,791 | |
| Income tax expenses, continuing operations | | | (737) | | | | (523,663) | | | | (425,958) | | | | (442,455) | |
Income after tax from discontinued operations | | | 547 | | | | 388,321 | | | | 215,332 | | | | 318,065 | |
| Income after tax from continuing operations | | | 1,065 | | | | 756,149 | | | | 752,163 | | | | 795,336 | |
| | | | |
| Net income | | | 1,612 | | | | 1,144,470 | | | | 967,495 | | | | 1,113,401 | |
| Net income attributable to shareholders of the Company | | | 932 | | | | 661,587 | | | | 571,873 | | | | 658,514 | |
| | | | | | | | | | | | | | | | |
| Net income attributable to Minority interests | | | 680 | | | | 482,883 | | | | 395,622 | | | | 454,887 | |
| Net income (loss) from continuing operations per average number of shares basic and diluted (Ch$/US$) | | | 0.01 | | | | 8.35 | | | | 8.344 | | | | 9.49 | |
| Net income (loss) from continuing operations per average number of ADS (Ch$/US$) | | | 0.59 | | | | 417,50 | | | | 417.00 | | | | 474.50 | |
| Net income (loss) from discontinued operations per average number of shares basic and diluted (Ch$/US$) | | | 0.01 | | | | 5.13 | | | | 3.31 | | | | 5.08 | |
| Net income (loss) from discontinued operations per average number of ADSs (Ch$/US$) | | | 0.36 | | | | 256.50 | | | | 165.50 | | | | 254.00 | |
| Net income (loss) per average number of shares, basic and diluted (Ch$/US$ per share) | | | 0.01 | | | | 8.35 | | | | 8.34 | | | | 9.49 | |
| Net income (loss) per average number of ADSs (Ch$/US$ per ADS) | | | 0.59 | | | | 417.50 | | | | 417.00 | | | | 474.50 | |
| Cash dividends per share (Ch$/US$ per share) | | | 0.01 | | | | 6.21 | | | | 6.71 | | | | 4.25 | |
| Cash dividends per ADS (Ch$/US$ per ADS) | | | 0.44 | | | | 310.72 | | | | 335.34 | | | | 212.51 | |
| Weighted average number of shares of common stock (millions) | | | | | | | 49,093 | | | | 49,093 | | | | 45,219 | |
| Number of ADS (millions)(4) | | | | | | | 99.69 | | | | 102.65 | | | | 105,20 | |
| | | | |
| Consolidated Statement of Financial Position Data | | | | | | | | | | | | | | | | |
| Total assets | | | 21,754 | | | | 15,449,154 | | | | 15,921,322 | | | | 15,177,664 | |
| Non-current liabilities | | | 3,878 | | | | 2,753,965 | | | | 4,447,282 | | | | 3,688,940 | |
| Equity attributable to shareholders | | | 8,486 | | | | 6,026,149 | | | | 6,201,976 | | | | 6,168,554 | |
| Equity attributable to Minority interests | | | 3,047 | | | | 2,163,659 | | | | 2,077,243 | | | | 2,338,911 | |
| Total equity | | | 11,532 | | | | 8,189,808 | | | | 8,279,219 | | | | 8,507,464 | |
| Capital stock(5) | | | 8,173 | | | | 5,804,448 | | | | 5,804,448 | | | | 5,828,040 | |
| | | | |
| Other Consolidated Financial Data | | | | | | | | | | | | | | | | |
| Capital expenditures (CAPEX)(6) | | | 1,919 | | | | 1,362,561 | | | | 1,089,362 | | | | 774,820 | |
| Depreciation, amortization and impairment losses(7) | | | 507 | | | | 360,354 | | | | 389,073 | | | | 382,631 | |
| (1) | Solely for the convenience of the reader, Chilean peso amounts have been converted into U.S. dollars at the exchange rate of Ch$ 710.16 per U.S. dollar, as of December 31, 2015. |
| (2) | Restated as a result of the application of IFRS 11. |
| (3) | Operating expenses include selling and administration expense. |
| (4) | As of December 31 of each year. |
| (5) | Includes share premium. |
| (6) | CAPEX figures represent effective payments for each year. |
| (7) | For further detail please refer to Note 30 of the Notes to our consolidated financial statements. |
13
| | | | | | | | | | | | | | | | | | | | |
| | | As of and for the year ended December 31, | |
| | | 2015 | | | 2014 | | | 2013 | | | 2012 | | | 2011 | |
OPERATING DATA OF SUBSIDIARIES | | | | | | | | | | | | | | | | | | | | |
| | | | | |
Edesur (Argentina) | | | | | | | | | | | | | | | | | | | | |
Electricity sold (GWh)(1) | | | 18,492 | | | | 17,972 | | | | 18,110 | | | | 17,710 | | | | 17,210 | |
Number of customers (thousands) | | | 2,480 | | | | 2,464 | | | | 2,444 | | | | 2,389 | | | | 2,389 | |
Total energy losses (%)(2) | | | 12.3% | | | | 10.8% | | | | 10.8% | | | | 10.6% | | | | 10.5% | |
| | | | | |
Ampla (Brazil) | | | | | | | | | | | | | | | | | | | | |
Electricity sold (GWh)(1) | | | 11,547 | | | | 11,678 | | | | 11,025 | | | | 10,793 | | | | 10,202 | |
Number of customers (thousands) | | | 2,997 | | | | 2,875 | | | | 2,801 | | | | 2,712 | | | | 2,644 | |
Total energy losses (%)(2) | | | 20.9% | | | | 20.1% | | | | 19.8% | | | | 19.6% | | | | 19.7% | |
| | | | | |
Coelce (Brazil) | | | | | | | | | | | | | | | | | | | | |
Electricity sold (GWh)(1) | | | 11,229 | | | | 11,165 | | | | 10,705 | | | | 9,865 | | | | 8,958 | |
Number of customers (thousands) | | | 3,758 | | | | 3,625 | | | | 3,500 | | | | 3,338 | | | | 3,224 | |
Total energy losses (%)(2) | | | 13.7% | | | | 12.7% | | | | 12.5% | | | | 12.6% | | | | 11.9% | |
| | | | | |
Codensa (Colombia) | | | | | | | | | | | | | | | | | | | | |
Electricity sold (GWh)(1) | | | 13,946 | | | | 13,660 | | | | 13,332 | | | | 12,958 | | | | 12,552 | |
Number of customers (thousands) | | | 2,865 | | | | 2,772 | | | | 2,687 | | | | 2,588 | | | | 2,496 | |
Total energy losses (%)(2) | | | 7.3% | | | | 7.2% | | | | 7.0% | | | | 7.3% | | | | 7.8% | |
| | | | | |
Edelnor (Peru) | | | | | | | | | | | | | | | | | | | | |
Electricity sold (GWh)(1) | | | 7,624 | | | | 7,338 | | | | 7,030 | | | | 6,850 | | | | 6,560 | |
Number of customers (thousands) | | | 1,337 | | | | 1,293 | | | | 1,255 | | | | 1,203 | | | | 1,144 | |
Total energy losses (%)(2) | | | 8.3% | | | | 8.0% | | | | 8.0% | | | | 8.2% | | | | 8.2% | |
| | | | | |
Endesa Américas | | | | | | | | | | | | | | | | | | | | |
Installed capacity in Argentina (MW)(3)(4) | | | 3,632 | | | | 3,632 | | | | 3,632 | | | | 3,632 | | | | 3,632 | |
Installed capacity in Colombia (MW)(5) | | | 3,459 | | | | 3,059 | | | | 2,925 | | | | 2,914 | | | | 2,914 | |
Installed capacity in Peru (MW)(6) | | | 1,686 | | | | 1,652 | | | | 1,540 | | | | 1,657 | | | | 1,668 | |
Generation in Argentina (GWh)(3)(7) | | | 11,405 | | | | 9,604 | | | | 10,840 | | | | 11,207 | | | | 10,713 | |
Generation in Colombia (GWh)(5)7) | | | 13,705 | | | | 13,559 | | | | 12,748 | | | | 13,251 | | | | 12,051 | |
Generation in Peru (GWh)(6)(7) | | | 8,218 | | | | 8,609 | | | | 8,391 | | | | 8,570 | | | | 8,980 | |
| | | | | |
Enel Brasil (Brazil)(7) | | | | | | | | | | | | | | | | | | | | |
Installed capacity in Brazil (MW) | | | 987 | | | | 987 | | | | 987 | | | | 987 | | | | 987 | |
Generation in Brazil (GWh)(3) | | | 4,398 | | | | 5,225 | | | | 4,992 | | | | 5,183 | | | | 4,129 | |
| | | | | |
Dock Sud (Argentina)(3) | | | | | | | | | | | | | | | | | | | | |
Installed capacity in Argentina (MW) | | | 870 | | | | 870 | | | | 870 | | | | n.a | | | | n.a. | |
Generation in Argentina (GWh) | | | 3,799 | | | | 4,786 | | | | 3,582 | | | | n.a | | | | n.a. | |
| | | | | |
EEPSA (Peru)(3)(6) | | | | | | | | | | | | | | | | | | | | |
Installed capacity in Peru (MW) | | | 298 | | | | 297 | | | | 302 | | | | n.a | | | | n.a. | |
Generation in Peru (GWh) | | | 583 | | | | 453 | | | | 98 | | | | n.a | | | | n.a. | |
| (1) | Electricity sales may be different than reported in previous periods because currently sales do not reflect non-billable consumption. |
| (2) | Energy losses are calculated as the difference between total energy generated, and purchased (GWh) and the energy sold (GWh), within a given period. Losses are expressed as a percentage of total energy purchased. Losses in distribution arise from illegally tapped energy as well as technical losses. |
| (3) | As a result of the 2013 capital increase described under “Item 4. Information on the Company – A. History and Development of the Company – History”, Dock Sud in Argentina and EEPSA in Peru were contributed by Endesa Spain and their consolidation by Enersis began as of April 2013; therefore, 2013 data only includes the nine-month period from April 1, 2013 to December 31, 2013. |
| (4) | Values from 2011 to 2015 were modified and correspond to values reported to CAMMESA (Argentina TSO). |
| (5) | El Quimbo entered commercial operation during 2015, adding 400 MW of capacity. |
| (6) | In Peru, the Santa Rosa TG 7 unit was recommissioned in December 2014, and during 2015 there were capacity adjustments and upgrades to existing plants, totaling an additional 33 MW. Mainly, Huinco with 20 (MW), Santa Rosa with 6 (MW) and Callahuanca with 4 MW. |
| (7) | Beginning in 2013, we changed how we calculate our electricity generation. The impact of applying the new criteria on a cumulative basis for 2011 and 2012 is not material. We now report the energy effectively available for sales in all countries. |
14
Exchange Rates
Fluctuations in the exchange rate between the Chilean peso and the U.S. dollar will affect the U.S. dollar equivalent of the peso price of our shares of common stock on the Santiago Stock Exchange(Bolsa de Comercio de Santiago), the Chilean Electronic Stock Exchange (Bolsa Electrónica de Chile) and the Valparaíso Stock Exchange (Bolsa de Corredores de Valparaíso). These exchange rate fluctuations affect the price of our American Depositary Shares (“ADSs”) and the conversion of cash dividends relating to the common shares represented by ADSs from Chilean pesos to U.S. dollars. In addition, to the extent that significant financial liabilities of the Company are denominated in foreign currencies, exchange rate fluctuations may have a significant impact on earnings.
In Chile, there are two currency markets, the Formal Exchange Market (Mercado Cambiario Formal) and the Informal Exchange Market (Mercado Cambiario Informal). The Formal Exchange Market is comprised of banks and other entities authorized by the Central Bank of Chile. The Informal Exchange Market is comprised of entities that are not expressly authorized to operate in the Formal Exchange Market, such as certain foreign exchange houses and travel agencies, among others. The Central Bank of Chile has the authority to require that certain purchases and sales of foreign currencies be carried out on the Formal Exchange Market. Both the Formal and Informal Exchange Markets are driven by free market forces. Current regulations require that the Central Bank of Chile be informed of certain transactions that must be carried out through the Formal Exchange Market.
The U.S. dollar Observed Exchange Rate, which is reported by the Central Bank of Chile and published daily on its web page, is the weighted average exchange rate of the previous business day’s transactions in the Formal Exchange Market. Nevertheless, the Central Bank of Chile may intervene by buying or selling foreign currency on the Formal Exchange Market to attempt to maintain the Observed Exchange Rate within a desired range.
The Informal Exchange Market reflects transactions carried out at an informal exchange rate (the “Informal Exchange Rate”). There are no limits imposed on the extent to which the rate of exchange in the Informal Exchange Market can fluctuate above or below the Observed Exchange Rate. Foreign currency for payments and distributions with respect to the ADSs may be purchased either in the Formal or the Informal Exchange Market, but such payments and distributions must be remitted through the Formal Exchange Market.
The Federal Reserve Bank of New York does not report a noon buying rate for Chilean pesos. As of December 31, 2015, the U.S. dollar Observed Exchange Rate was Ch$ 710.16 per US$ 1.00.
The following table sets forth the low, high, average and period-end Observed Exchange Rate for U.S. dollars for the periods set forth below, as reported by the Central Bank of Chile:
| | | | | | | | | | | | | | | | |
| | | Daily Observed Exchange Rate (Ch$ per US$)(1) | |
| | | Low(2) | | | High(2) | | | Average(3) | | | Period-end | |
Year ended December 31, | | | | | | | | | | | | | | | | |
2015 | | | 597.10 | | | | 715.66 | | | | 654.66 | | | | 710.16 | |
2014 | | | 527.53 | | | | 621.41 | | | | 573.70 | | | | 606.75 | |
2013 | | | 466.50 | | | | 533.95 | | | | 498.83 | | | | 524.61 | |
2012 | | | 469.65 | | | | 519.69 | | | | 486.31 | | | | 479.96 | |
2011 | | | 455.91 | | | | 533.74 | | | | 483.45 | | | | 519.20 | |
Month ended | | | | | | | | | | | | | | | | |
March 2016 | | | 669.80 | | | | 694.82 | | | | n.a. | | | | 669.80 | |
February 2016 | | | 689.18 | | | | 715.41 | | | | n.a. | | | | 694.17 | |
January 2016 | | | 710.37 | | | | 730.31 | | | | n.a. | | | | 710.37 | |
December 2015 | | | 693.72 | | | | 711.52 | | | | n.a. | | | | 710.16 | |
November 2015 | | | 688.94 | | | | 715.66 | | | | n.a. | | | | 711.20 | |
October 2015 | | | 673.91 | | | | 695.53 | | | | n.a. | | | | 690.32 | |
Source: Central Bank of Chile.
| (2) | Exchange rates are the actual low and high, on a day-by-day basis for each period. |
| (3) | The average of the exchange rates on the last day of each month during the period. |
As of April 28, 2016, the U.S. dollar Observed Exchange Rate was Ch$ 663.40 per US$ 1.00.
15
Calculation of the appreciation or devaluation of the Chilean peso against the U.S. dollar in any given period is made by determining the percent change between the reciprocals of the Chilean peso equivalent of US$ 1.00 at the end of the preceding period and the end of the period for which the calculation is being made. For example, to calculate the devaluation of the year-end Chilean peso in 2015, one determines the percent change between the reciprocal of Ch$ 606.75, the value of one U.S. dollar as of December 31, 2014, or 0.001648, and the reciprocal of Ch$ 710.16, the value of one U.S. dollar as of December 31, 2015, or 0.001408. In this example, the percentage change between the two periods is negative 14.6%, which represents the 2015 year-end devaluation of the Chilean peso against the 2014 year-end U.S. dollar. A positive percentage change means that the Chilean peso appreciated against the U.S. dollar, while a negative percentage change means that the Chilean peso devaluated against the U.S. dollar.
The following table sets forth the period-end rates for U.S. dollars for the years ended December 31, 2011 through December 31, 2015, based on information published by the Central Bank of Chile.
| | | | |
| | | Ch$ per US$(1) |
| | | Period End | | Appreciation (Devaluation) |
| | | (in Ch$) | | (in %) |
Year ended December 31, | | | | |
2015 | | 710.16 | | (14.6) |
2014 | | 606.75 | | (13.5) |
2013 | | 524.61 | | (8.5) |
2012 | | 479.96 | | 8.2 |
2011 | | 519.20 | | (9.9) |
Source: Central Bank of Chile.
| (1) | Calculated based on the variation of period-end exchange rates. |
| B. | Capitalization and Indebtedness. |
Not applicable.
| C. | Reasons for the Offer and Use of Proceeds. |
Not applicable.
A financial or other crisis in any region worldwide can have a significant impact on the countries in which we operate, and consequently, may adversely affect our operations as well as our liquidity.
The four countries in which we have electricity investments are vulnerable to external shocks, including financial and political events, which could cause significant economic difficulties and affect their growth. If any of these economies experience lower than expected economic growth or a recession, it is likely that our customers will demand less electricity and that some of our customers may experience difficulties paying their electric bills, possibly increasing our uncollectible accounts. Any of these situations could adversely affect our results of operations and financial condition.
Financial and political crises in other parts of the world could also adversely affect our business. For example, instability in the Middle East or in other oil producing regions could result in higher fuel prices worldwide, which in turn could increase the cost of fuel for our thermal generation plants and adversely affect our results of operations and financial condition.
In addition, an international financial crisis and its disruptive effects on the financial industry could adversely impact our ability to obtain new bank financings on the same historical terms and conditions. A financial crisis could also diminish our ability to access the capital markets in the four countries in which we operate as well as the international capital markets for other sources of liquidity, or increase the interest rates available to us. Reduced liquidity could, in turn, adversely affect our capital expenditures, our long-term investments and acquisitions, our growth prospects and our dividend payout policy.
16
South American economic fluctuations may affect our results of operations and financial condition as well as the value of our securities.
All of our operations are located in four South American countries. Accordingly, our consolidated revenues may be affected by the performance of South American economies as a whole. If local, regional, or worldwide economic trends adversely affect the economy of any of the four countries in which we have investments or operations, our financial condition and results from operations could be adversely affected. Moreover, we have investments in volatile countries, such as Argentina and Brazil. In Brazil, during 2015, some instability arose from the political sector due to corruption scandals involving several government officials, which has led to a deterioration of the perception of the Brazilian market, which in turn has led Brazil to lose its investment grade rating from Standard & Poor’s and Fitch Ratings. In 2015, 63% of our operating revenues and 67% of our operating income came from Brazil and Colombia.
Insufficient cash flows for our subsidiaries located in these volatile countries, have, in some cases, resulted in their inability to meet debt obligations and the need to seek waivers to comply with some debt covenants, or, to a limited extent, to require guarantees or other emergency measures from us, including extraordinary capital increases.
Future adverse developments in these economies may impair our ability to execute our strategic plans, which could adversely affect our results of operations and financial condition.
In addition, South American financial and securities markets are, to varying degrees, influenced by economic and market conditions in other countries. Brazilian, Chilean and Colombian financial and securities markets may be adversely affected by events in other countries, which could adversely affect the value of our securities.
A deterioration of the economic situation in Argentina or a deeper devaluation of the Argentine peso could have an adverse effect on our debt.
The Argentine peso suffered a steep devaluation against the U.S. dollar during 2014, which has continued during 2015. Due to the decline in value of the Argentine peso relative to foreign currencies, the Argentine government has implemented policies to limit purchases of U.S. dollars. In 2014, the Argentine Central Bank raised the reference interest rate, which increased financing costs for banks and for private sector companies and it has been intervening in the market on a daily basis during 2015 in order to control further devaluation expectations. Although the pace of the devaluation of the Argentine peso against the U.S. dollar has slowed recently, the increase in interest paid on deposits has been insufficient to offset the inflation rate. The new government recently liberalized all currency restrictions imposed by the prior government, which resulted in the immediate devaluation of the Argentinean peso by more than 35% in one day. While the new government is expected to take actions to soften the impact of the one-time effect of devaluation, the devaluation of the Argentine peso may continue in 2016 and future years.
If Argentina’s economy were deemed hyperinflationary, a general price index would be used to present the amounts related to our Argentine subsidiaries in our consolidated financial statements under the provisions outlined in IAS 29, “Financial Reporting in Hyperinflationary Economies.” Amounts for the previous reporting periods would be restated by applying the general price index so that the financial statements between the periods presented would be comparative.
In 2014, the Argentine banking industry increased interest rates on loans and shortened maturities. Liquidity in the Argentine derivatives market also deteriorated, which limited access to swaps of Argentine peso denominated debt into other currencies. As a result our Argentine peso-denominated debt is exposed to further devaluation of the Argentine peso.
Argentina’s sovereign creditworthiness seriously deteriorated in 2014, based on market data and reports from credit ratings agencies and such situation has worsened during 2015. Argentina’s sovereign debt rating maintained its “selective default” rating by Standard & Poor’s and “restricted default” rating by Fitch, both ratings as a result of a default on Argentina’s sovereign bonds in July 2014. Moody’s maintained the long term foreign currency debt rating at “Caa1,” updated in November 2015 with positive outlook. Further deterioration of Argentina’s economy could adversely affect our results of operations and financial condition. For further information on our consolidated financial statements by segments, please see Note 35 of the Notes to our consolidated financial statements.
17
Certain South American countries have been historically characterized by frequent and occasionally drastic economic interventionist measures by governmental authorities, including expropriations, which may adversely affect our business and financial results.
Governmental authorities have altered monetary, credit, tariff, tax and other policies to influence the course of the economies of Argentina, Brazil, Colombia and Peru. Even though we do not have assets in Chile, we are a company established under the laws of the Republic of Chile. Therefore, taxes will be paid in Chile and we will be subject to changes in Chilean tax laws. To a lesser extent, the Chilean government continues to exercise substantial influence over many aspects of the private sector, which may result in changes to economic or other policies. For example, in September 2014, the Chilean government approved the progressive increase of the corporate income tax and a change in the tax system, which may have an additional negative effect upon non-Chilean holders of shares or ADSs. On February 8, 2016, Law 20,899 was enacted, which made adjustments to this tax reform. For further details regarding Chilean tax considerations, please refer to “Item 10. Additional Information — E. Taxation.” Other governmental actions in these South American countries have also involved wage, price and tariff rate controls and other interventionist measures, such as expropriation or nationalization.
For example, Argentina froze bank accounts and imposed capital restrictions in 2001, nationalized the private sector pension funds in 2008, used its Central Bank reserves to pay down indebtedness maturing in 2010, expropriated Repsol’s 51% stake in YPF in 2012 and imposed exchange controls in 2014, which limited Argentine access to foreign currencies. In 2010, Colombia imposed an equity tax to finance reconstruction and repair efforts related to severe flooding, which resulted in an extraordinary tax expense accrual recorded in January 2011 for taxes payable in 2011 through 2014.
Changes in governmental and monetary policies regarding tariffs, exchange controls, regulations and taxation could reduce our profitability. Inflation, devaluation, social instability and other political, economic or diplomatic developments, including the response by governments in the region to these circumstances, could also reduce our profitability. Any of these scenarios could adversely affect our results of operations and financial condition.
Our electricity business is subject to risks arising from natural disasters, catastrophic accidents and acts of terrorism, which could adversely affect our operations, earnings and cash flow.
Our primary facilities include power plants, transmission and distribution assets, pipelines, liquefied natural gas (“LNG”) terminals and re-gasification plants, storage and chartered LNG tankers. Our facilities may be damaged by earthquakes, flooding, fires, and other catastrophic disasters arising from natural or accidental human causes, as well as acts of terrorism. A catastrophic event could cause disruptions in our business, significant decreases in revenues due to lower demand or significant additional costs to us not covered by our business interruption insurance. There may be lags between a major accident or catastrophic event and the final reimbursement from our insurance policies, which typically carry a deductible and are subject to per event policy maximum amounts.
As an example, on May 6, 2013, a blade of Edegel’s Santa Rosa gas turbine unit No. 7 broke and produced catastrophic damage to the unit following a fire. The turbine damage was classified as a total loss and its replacement cost exceeded US$ 60 million in property damage and lost profits. The unit was out of service for 19 months, until December 5, 2014. Such accidents may affect our operations, earnings and cash flow.
We are subject to financing risks, such as those associated with funding our new projects and capital expenditures, and risks related to refinancing our maturing debt; we are also subject to debt covenant compliance, all of which could adversely affect our liquidity.
As of December 31, 2015, our consolidated debt totaled Ch$ 2,464 billion.
Our debt had the following maturity profile:
| | • | | Ch$ 617 billion in 2016; |
| | • | | Ch$ 682 billion from 2017 to 2018; |
| | • | | Ch$ 373 billion from 2019 to 2020; and |
| | • | | Ch$ 792 billion thereafter. |
Set forth below is a breakdown by country for debt maturing in 2016:
| | • | | Ch$ 183 billion for Chile; |
| | • | | Ch$ 170 billion for Colombia |
18
| | • | | Ch$ 135 billion for Brazil; |
| | • | | Ch$ 98 billion for Peru; and |
| | • | | Ch$ 31 billion for Argentina. |
Some of our debt agreements are subject to (1) financial covenants, (2) affirmative and negative covenants, (3) events of default, (4) mandatory prepayments for contractual breaches, and (5) certain change of control clauses for material mergers and divestments, among other provisions. A significant portion of our financial indebtedness is subject to cross default provisions, which have varying definitions, criteria, materiality thresholds and applicability with respect to subsidiaries that could give rise to such a cross default.
In the event that we or our subsidiaries breach any of these material contractual provisions, our creditors and bondholders may demand immediate repayment, and a significant portion of our indebtedness could become due and payable. For example, for the quarters ended December 31, 2014, March 31, 2015, June 30, 2015 and September 30, 2015, our Argentine subsidiary El Chocón did not comply with the interest coverage ratio test (EBITDA to interest expense) pursuant to a covenant requirement under the loan agreement with Standard Bank, Deutsche Bank and Itaú that matured and was paid in February 2016. El Chocón experienced difficulties in complying with this covenant several times in the past and obtained waivers from its lenders. If the lenders had decided to declare an event of default and accelerate the loan, the principal and interest would have become immediately due and payable under this facility. Because of cross-acceleration provisions of El Chocón’s other loans, an additional debt would also have been accelerated and El Chocón would have been forced into bankruptcy. In the distribution business, Ampla has been facing different financial problems as a consequence of the Brazilian economic and political situation, which led to a lower electricity demand, higher costs related to inflation and in the specific case of Ampla, to a deterioration of its cash flows and EBITDA, similar to other distribution companies in the Brazilian market. This required Ampla to renegotiate, among other measures, some of its financial covenants between December 2015 and January 2016, in order to avoid breaching them. There is an additional risk of noncompliance if the economic environment in Brazil continues to worsen. In March 2016, as a consequence of the political and economic situation prevailing in Brazil, we also have guaranteed Ampla’s US$ 75 million three-year bank term loan. The financing was granted in Chile in U.S. dollars, and has a swap from U.S. Dollars to Brazilian reais contracted in Brazil, which was also guaranteed by us.
We may be unable to refinance our indebtedness or obtain such refinancing on terms acceptable to us. In the absence of such refinancing, we could be forced to dispose of assets in order to make the payments due on our indebtedness under circumstances that might not be favorable to obtaining the best price for such assets. Furthermore, we may be unable to sell our assets quickly enough, or at sufficiently high prices, to enable us to make such payments.
We may also be unable to raise the necessary funds required to finish our projects under development or under construction. Market conditions prevailing at the moment we require these funds or other unforeseen project costs can compromise our ability to finance these projects and expenditures.
As of the date of this Report, we believe that Brazil is a country in which we operate with a high refinancing risk. As of December 31, 2015, the third-party debt of our Brazilian subsidiaries amounted to Ch$ 560 billion. Our inability to finance new projects or capital expenditures or to refinance our existing debt could adversely affect our results of operation and financial condition.
We may be unable to enter into suitable investments, alliances and acquisitions.
On an ongoing basis, we review acquisition prospects that may increase our market coverage or supplement our existing businesses, though there can be no assurance that we will be able to identify and consummate suitable acquisition transactions in the future. The acquisition and integration of independent companies that we do not control is generally a complex, costly and time-consuming process and requires significant efforts and expenditures. If we consummate an acquisition, it could result in the incurrence of substantial debt and assumption of unknown liabilities, the potential loss of key employees, amortization expenses related to tangible assets and the diversion of management’s attention from other business concerns. In addition, any delays or difficulties encountered in connection with acquisitions and the integration of multiple operations could have a material adverse effect on our business, financial condition or results of operations.
Because our generation business depends heavily on hydrological conditions, droughts and climate change may adversely affect our operations and profitability.
Approximately 53% of our consolidated installed generation capacity in 2015 was hydroelectric. Accordingly, extreme hydrological conditions and climate change could adversely affect our business, results of operations and financial condition. In the last few years, regional hydrological conditions have been affected by two climate phenomena — El Niño and La Niña — that influence rainfall and resulted in droughts. For example, in Brazil, where 67% of our installed capacity is hydroelectric, the low hydrological contributions recorded in 2014 and 2015 and the consequent higher thermal dispatch and spot prices, encouraged the authority in making regulatory changes through a modification of the upper limits. Also, El Niño phenomenon has affected Colombian
19
hydrologic conditions since May 2015, leading to a rainfall deficit and high temperatures, and as a consequence, higher energy prices. Each El Niño event is different and, depending on its intensity and duration, the magnitude of the social and economic effects could be more pronounced. Peru has also experienced rain deficits, especially towards the end of 2015, and forecasts show an expected decrease in the natural flow of the basins in which we operate. The hydrology situation will depend on the level of reservoirs by the beginning of May 2016.
Droughts also affect the operation of our thermal plants, including our facilities that use natural gas, fuel oil or coal as fuel, in the following manner:
| | • | | During drought periods, thermal plants are used more frequently. Thermal plant operating costs can be considerably higher than those of hydroelectric plants. Our operating expenses increase during these periods. In addition, depending on our commercial obligations, we may need to buy electricity at spot prices in order to comply with our contractual supply obligations and the cost of these electricity purchases may exceed our contracted electricity sale prices, thus potentially producing losses from those contracts. For further information with respect to the effect of hydrology on our business and financial results, please refer to “Item 5. Operating and Financial Review and Prospects— A. Operating Results—1. Discussion of Main Factors Affecting Operating Results and Financial Condition of the Company—a. Generation Business.” |
| | • | | Our thermal plants require water for cooling and droughts not only reduce the availability of water, but also increase the concentration of chemicals, such as sulfates in the water. The high concentration of chemicals in the water we use for cooling increases the risk of damaging the equipment at our thermal plants as well as the risk of violating environmental regulations. As a result, we may have to purchase water from agricultural areas that are also experiencing shortages of water. These water purchases may increase our operating costs and also require us to further negotiate with the local communities. |
| | • | | Thermal power plants burning natural gas generate emissions such as sulfur dioxide (SO2) and nitrogen oxide (NO) gases. When operating with diesel they also release particulate matter into the atmosphere. Coal fired plants generate emissions of SO2 and NO. Therefore, greater use of thermal plants during periods of drought increases the risk of producing a higher level of pollutants. |
In addition, according to certain weather forecast models, the drought that is affecting the regions where most of our hydroelectric plants are located may last for an extended period and may recur in the future. A prolonged drought may exacerbate the risks described above and have a further adverse effect upon our business, results of operations and financial condition.
Governmental regulations may adversely affect our business.
We are subject to extensive regulation on the tariffs we charge to our customers and on other aspects of our business and these regulations may adversely affect our profitability. For example, governments can impose electricity rationing during droughts or prolonged failures of power facilities. During rationing, if we are unable to generate enough electricity to comply with our contractual obligations, we may be forced to buy electricity at the spot price, as even a severe drought does not release us from our contractual obligations as aforce majeure event. If we are unable to buy enough electricity at the spot price to comply with our contractual obligations, we would have to compensate our regulated customers for the electricity we failed to provide at the rationed price. Rationing periods have occurred in the past and may occur in the future. Our generation subsidiaries may be required to pay regulatory penalties if they fail to provide adequate service under their contractual obligations. Material rationing policies imposed by regulatory authorities in any of the countries in which we operate could adversely affect our business, results of operations and financial condition.
Governmental authorities may also delay the distribution tariff review process, or tariff adjustments determined by governmental authorities may be insufficient to pass through our costs (as has been the case with Edesur, our Argentine distribution subsidiary and with Ampla and Coelce, our Brazilian distribution subsidiaries, for part of 2014). Similarly, electricity regulations issued by governmental authorities in the countries in which we operate may affect the ability of our generation companies to collect revenues sufficient to offset their operating costs.
The inability of any company in our consolidated group to collect revenues sufficient to cover operating costs may affect the ability of that company to operate as a going concern and may otherwise have an adverse effect on our business, financial results and operations.
In addition, changes in the regulatory framework are often submitted to the legislators and administrative authorities in the countries in which we operate and some of these changes could have a material adverse impact on our business, results of operations and financial condition. For example, commercial operations of Emgesa’s El Quimbo power plant have been intermittent due to legislative and judicial decisions regarding its authorization to commence commercial operations.
These changes could adversely affect our business, results of operations and financial condition.
20
Our business and profitability could be adversely affected if water rights are denied or if water concessions are granted with limited duration.
Approximately 53% of our installed capacity is hydroelectric. We own water rights for the supply of water from rivers and lakes near our production facilities, granted in Argentina by the Argentine State, in Colombia by the Ministry of Environment, Housing and Territorial Development (“MAVDT” in its Spanish acronym), in Peru by the Water National Authority (“ANA” in its Spanish acronym), and in Brazil by the Water National Authority (“ANA” in its Portuguese acronym). In Colombia, water rights or water concessions are granted for 50 years, renewable by equal periods; however, these concessions may be revoked, for example, due to a progressive decrease or depletion of water. In Colombia, human consumption is the first priority before any other use. A similar event may happen in Peru and we could lose our water rights, even when concessions are granted for indefinite periods, due to scarcity or decline in quality.
Any limitations on our current water rights, our need for additional water rights, or our current unlimited duration of water concessions could have a material adverse effect on our hydroelectric development projects and our profitability.
Regulatory authorities may impose fines on our subsidiaries, which could adversely affect our results of operations and financial condition.
Our electricity businesses may be subject to regulatory fines for any breach of current regulations, including energy supply failures, in the four countries in which we operate. In Peru, fines may be imposed for a maximum of 1,400 Treasury Tax Units (Unidad Impositiva Tributariaor “UIT”), or Ch $ 1,103 million, using the UIT and foreign exchange rates as of December 31, 2015. In Colombia, fines may be imposed for a maximum of 2,000 Minimum Monthly Salaries (Salarios Mínimos Mensuales), or Ch$ 291 million using the Minimum Monthly Salary and foreign exchange rates as of December 31, 2015. In Argentina, there is no maximum limit for relevant fines. In Brazil, fines may be imposed for up to 2.0% of an electricity company’s revenues.
Our electricity generation subsidiaries are supervised by their local regulatory entities and may be subject to these fines in cases where, in the opinion of the regulatory entity, operational failures affecting the regular energy supply to the system are the fault of the company such as when agents are not coordinated with the system operator. In addition, our subsidiaries may be required to pay fines or compensate customers if those subsidiaries are unable to deliver electricity, even if such failure is due to forces outside of the subsidiaries’ control.
For example, in April 2013, Edegel, our generation company in Peru, was fined Ch$ 73.9 million by the Osinergmin, the Peruvian regulatory electricity authority, for the unavailability in several occasions of some of its units in 2008. Edegel paid two of the four fines and appealed the other two, which are still under dispute. In 2015, the Electricity National Regulatory Agency (“ENRE” in its Spanish acronym) imposed fines on Edesur, our distribution company in Argentina, for a total of Ch$ 6.6 billion due to technical and commercial operation failures. For further information on fines, please refer to Note 38 of the Notes to our consolidated financial statements.
We depend on payments from our subsidiaries, jointly-controlled entities and associates to meet our payment obligations.
In order to pay our obligations, we rely on cash from dividends, loans, interest payments, capital reductions and other distributions from our subsidiaries and equity affiliates. The ability of our subsidiaries and equity affiliates to pay dividends, interest payments, loans and other distributions to us is subject to legal constraints such as dividend restrictions, fiduciary duties, contractual limitations and foreign exchange controls that may be imposed in any of the four countries where they operate.
Historically, we have not been able to access at all times the cash flows of our operating subsidiaries due to government regulations, strategic considerations, economic conditions and credit restrictions.
Our future results from operations may continue to be subject to greater economic and political uncertainties, such as government regulations, economic conditions and credit restrictions, and therefore we may not be able to rely on cash flows from operations in those entities to repay our debt.
Dividend Limits and Other Legal Restrictions. Some of our subsidiaries are subject to legal reserve requirements and other restrictions on dividend payments. Other legal restrictions, such as foreign currency controls, may limit the ability of our subsidiaries and equity affiliates to pay dividends and make loan payments or other distributions to us. In addition, the ability of any of our subsidiaries that are not wholly-owned to distribute cash to us may be limited by the directors’ fiduciary duties of such subsidiaries to their minority shareholders. Furthermore, some of our subsidiaries may be forced by local authorities, in accordance with applicable regulation, to diminish or eliminate dividend payments. As a consequence of such restrictions, our subsidiaries could, under certain circumstances, be impeded from distributing cash to us.
21
Contractual Constraints. Distribution restrictions included in certain credit agreements of our subsidiaries Costanera and El Chocón may prevent dividends and other distributions to shareholders if they are not in compliance with certain financial ratios. Generally, our credit agreements prohibit any type of distribution if there is an ongoing default.
Operating Results of Our Subsidiaries. The ability of our subsidiaries and equity affiliates to pay dividends or make loan payments or other distributions to us is limited by their operating results. To the extent that the cash requirements of any of our subsidiaries exceed their available cash, the subsidiary will not be able to make cash available to us, which was the case of Ampla and Enel Brazil as a consequence of the economic and political situation that Brazil and especially the distribution sector, is dealing with.
Any of the situations described above could adversely affect our business, results of operations and financial condition.
Foreign exchange risks may adversely affect our results and the U.S. dollar value of dividends payable to ADS holders.
The currencies of South American countries in which we and our subsidiaries operate have been subject to large devaluations and appreciations against the U.S. dollar and may be subject to significant fluctuations in the future. Historically, a significant portion of our consolidated indebtedness has been denominated in U.S. dollars. Although a substantial portion of our operating cash flows is linked to U.S. dollars (primarily coming from the generation business), we generally have been and will continue to be materially exposed to currency fluctuations of our local currencies against the U.S. dollar because of time lags and other limitations to peg our tariffs to the U.S. dollar.
In countries where operating cash flows are denominated in the local currency, we seek to maintain debt in the same currency, but due to market conditions it may not be possible to do so.
Because of this exposure, the cash generated by our subsidiaries can decrease substantially when local currencies devalue against the U.S. dollar. Future volatility in the exchange rate of the currencies in which we receive revenues or incur expenditures may adversely affect our business, results of operations and financial condition.
As of December 31, 2015, the amount of our total consolidated debt was Ch$ 2,464 billion. Of this amount, Ch$ 379 billion, or 15%, was denominated in U.S. dollars. As of December 31, 2015, our consolidated foreign currency-denominated indebtedness (other than U.S. dollars) included the equivalent of:
| | • | | Ch$ 1,182 billion in Colombian pesos; |
| | • | | Ch$ 558 billion in Brazilian reais; |
| | • | | Ch$ 290 billion in Peruvian soles; |
| | • | | Ch$ 30 billion in Argentine pesos; and |
| | • | | Ch$ 25 billion in Chilean pesos. |
These amounts total Ch$ 2,085 billion in currencies other than U.S. dollars.
For the twelve-month period ended December 31, 2015, our operating cash flows were Ch$ 1,933 billion (before consolidation adjustments) of which:
| | • | | Ch$ 550 billion, or 29%, came from Chile; |
| | • | | Ch$ 490 billion, or 25%, came from Colombia; |
| | • | | Ch$ 350 billion, or 18%, came from Argentina; |
| | • | | Ch$ 277 billion, or 14%, came from Peru; and |
| | • | | Ch$ 266 billion, or 14%, came from Brazil. |
We are involved in litigation proceedings.
We are currently involved in various litigation proceedings, which could result in unfavorable decisions or financial penalties against us. We will continue to be subject to future litigation proceedings, which could cause material adverse consequences to our business.
For example, in 2001, the inhabitants of Sibaté (part of the Cundinamarca Department, Colombia) sued Emgesa and two other unrelated parties because of the possible contamination of El Muña Reservoir, demanding that the defendants pay for damages of CPs 3 billion (approximately Ch$ 675 billion). The plaintiffs argued that the contamination is a consequence of the pumping of
22
polluted water from the Bogotá River. Emgesa argued that it is not responsible since the company had received the polluted water and requested the inclusion as additional defendants in the judicial proceedings, numerous public and private entities that discharged pollutants into the river or were responsible for the environmental management of the river’s basin. This request was originally accepted by the court, but in June 2015 the court decision was reversed and the new parties were subsequently excluded as defendants. Emgesa appealed such determination and the case remains pending. Our financial condition or results of operations could be adversely affected if we are unsuccessful in defending this litigation or other lawsuits and proceedings against us. For further information on litigation proceedings, please see Note 36.3 of the Notes to our consolidated financial statements.
The values of our generation business subsidiaries’ long-term energy supply contracts are subject to fluctuations in the market prices of certain commodities and other factors.
We have economic exposure to fluctuations in the market prices of certain commodities as a result of the long-term energy sales contracts into which we have entered. We and our subsidiaries have material obligations as selling parties under long-term fixed-price electricity sales contracts. Prices in these contracts are indexed according to different commodities, the exchange rate, inflation, and the market price of electricity. Adverse changes to these indices would reduce the rates we charge under our long-term fixed-price electricity sales contracts, which could adversely affect our business, results of operations and financial condition.
Our controlling shareholder may exert substantial influence over us and may have a different strategic view for our development than that of our minority shareholders.
Enel beneficially owns 60.6% of our share capital. Enel, our ultimate controlling shareholder, has the power to determine the outcome of substantially all material matters that require shareholders’ votes, such as the election of the majority of our board members and, subject to contractual and legal restrictions, our dividend policy. Enel also exercises decisive influence over our business strategy and operations. Its interests may in some cases differ from those of our minority shareholders. For example, Enel conducts its business operations in the field of renewable energies in South America through Enel Green Power S.p.A. and in the Chilean electricity business through Enersis Chile, in neither of which we have equity interests. Any present or future conflict of interest affecting Enel may be resolved against our best interests in these matters. As a consequence, our growth may be potentially limited, and our business and results of operations may be adversely affected.
Environmental regulations in the countries in which we operate and other factors may cause delays, impede the development of new projects or increase the costs of operations and capital expenditures.
Our operating subsidiaries are subject to environmental regulations which, among other things, require us to perform environmental impact studies for future projects and obtain permits from both local and national regulators. The approval of these environmental impact studies may take longer than planned and may be withheld by governmental authorities. Local communities and ethnic and environmental activists, among others, may intervene in the approval process to delay or prevent a project’s development. They may also seek injunctive or other relief, which could negatively impact us if they are successful.
In addition to environmental matters, there are other factors that may adversely affect our ability to build new facilities or to complete projects currently under development on time, including delays in obtaining regulatory approvals, shortages or increases in the price of equipment, materials or labor, strikes, adverse weather conditions, natural disasters, civil unrest, accidents, or other unforeseen events. Any such event could adversely impact our results of operations and financial condition.
Delays or modifications to any proposed project and laws or regulations may change or be interpreted in a manner that could adversely affect our operations or our plans for companies in which we hold investments, which could adversely affect our business, results of operations and financial condition.
Our power plant projects may encounter significant opposition from different groups that may delay their development, increase costs, damage our reputation and potentially result in impairment of our goodwill with stakeholders.
Our reputation is the foundation of our relationship with key stakeholders and other constituencies. If we are unable to effectively manage real or perceived issues that could negatively impact sentiments toward us, our business, results of operations and financial condition could be adversely affected.
The development of new and existing power plants may face opposition from several stakeholders, such as ethnic groups, environmental groups, land owners, farmers, local communities and political parties, among others, all of which may impact the sponsoring company’s reputation and goodwill. For example, El Quimbo hydroelectric project in Colombia faced constant demands from the public which delayed construction and increased costs. From April 27, 2014 to May 12, 2014, a national agricultural strike involving communities near the project blocked roads and occupied neighboring land. Additional protests during 2014 blocked the entrance to the Balseadero viaduct construction site and the reservoir basin.
23
The operation of our current thermal power plants may also affect our goodwill with stakeholders, due to emissions such as particulate matter, sulfur dioxide and nitrogen oxides, which could adversely affect the environment.
Damage to our reputation may exert considerable pressure on regulators, creditors, and other stakeholders and ultimately lead to projects and operations that may not be optimal, causing our share prices to drop and hindering our ability to attract or retain valuable employees, all of which could result in an impairment of our goodwill with stakeholders.
Our business may experience adverse consequences if we are unable to reach satisfactory collective bargaining agreements with our unionized employees.
A large percentage of our employees are members of unions and have collective bargaining agreements that must be renewed on a regular basis. Our business, financial condition and results of operations could be adversely affected by a failure to reach agreement with any labor union representing such employees or by an agreement with a labor union that contains terms we view as unfavorable. The laws of many of the countries in which we operate provide legal mechanisms for judicial authorities to impose a collective agreement if the parties are unable to come to an agreement, which may increase our costs beyond what we have budgeted.
In addition, we employ many highly-specialized employees, and certain actions such as strikes, walk-outs or work stoppages by these employees, could adversely impact our business, results of operations and financial condition as well as our reputation.
Interruption or failure of our information technology and communications systems or external attacks to or breaches of these systems could have an adverse effect on our operations and results.
We depend on information technology, communication and processing systems (“IT Systems”) to operate our businesses, the failure of which could adversely affect our business, results of operations and financial condition.
IT Systems are all vital to our generation subsidiaries’ ability to monitor our power plants’ operations, maintain generation and network performance, adequately generate invoices to customers, achieve operating efficiencies and meet our service targets and standards. Our distribution subsidiaries could also be affected adversely because they rely heavily on IT Systems to monitor their grids, billing processes for millions of customers and customer service platforms. Temporary or long-lasting operational failures of any of these IT Systems could have a material adverse effect on our results of operations. Additionally, cyber attacks can have an adverse effect on the company’s image and its relationship with the community. In the last few years, global cyber attacks on security systems, treasury operations, and IT Systems have intensified. We are exposed to cyber-terrorist attacks aimed at damaging our assets through computer networks, cyber spying involving strategic information that may be beneficial for third parties and cyber-theft of proprietary and confidential information, including information of our customers. During 2014, we suffered two cyber attacks perpetrated by a cyber-terrorist group, which impacted websites in Argentina, Brazil, Colombia and Peru. In one case, the attack resulted in a service interruption of 90 minutes. Further cyber attacks may occur and may affect us in the future.
We rely on electricity transmission facilities that we do not own or control. If these facilities do not provide us with an adequate transmission service, we may not be able to deliver the power we sell to our final customers.
We depend on transmission facilities owned and operated by other unaffiliated power companies to deliver the electricity we sell. This dependence exposes us to several risks. If transmission is disrupted, or transmission capacity is inadequate, we may be unable to sell and deliver our electricity. If a region’s power transmission infrastructure is inadequate, our recovery of sales costs and profits may be insufficient. If restrictive transmission price regulation is imposed, transmission companies upon whom we rely may not have sufficient incentives to invest in expansion of their transmission infrastructure, which could adversely affect our operations and financial results. Currently, the construction of new transmission lines is taking longer than in the past, mainly because of new social and environmental requirements that are creating uncertainty about the probability of completing the projects. In addition, the increase of new non-conventional renewable energy (“NCRE”) projects in the region is congesting the current transmission systems as these projects can be built relatively quickly, while new transmission projects may take longer to be built.
Any such disruption or failure of transmission facilities could interrupt our business, which could adversely affect our results of operations and financial condition.
The relative illiquidity and volatility of Chilean securities markets could adversely affect the price of our common stock and ADSs.
Even though we do not have assets in Chile, our shares are traded on the Chilean Stock Exchanges since we are organized under the laws of the Republic of Chile and we have our headquarters in Chile. Chilean securities markets are substantially smaller and less liquid than the major securities markets in the United States. In addition, Chilean securities markets may be affected materially by developments in other emerging markets. The low liquidity of the Chilean market may impair the ability of shareholders to sell shares,
24
or holders of ADSs to sell shares of our common stock withdrawn from the ADS program into the Chilean market in the amount and at the price and time they wish to do so. Also, the liquidity and the market for our shares or ADSs may be affected by a number of factors including variations in exchange and interest rates, the deterioration and volatility of the markets for similar securities and any changes in our liquidity, financial condition, creditworthiness, results and profitability.
Our historical performance may not be representative of our performance after the Spin-Off.
Our historical performance might have been different if we had been a separate entity during the periods presented in our financial statements. The historical financial information included in this Report is not necessarily indicative of what our results of operations, financial position and cash flows will be in the future. There may be changes that will occur in our cost structure, funding and operations as a result of the separation of Enersis Chile from us, including increased costs associated with reduced economies of scale.
Lawsuits against us brought outside of the South American countries in which we operate or complaints against us based on foreign legal concepts may be unsuccessful.
All of our assets are located outside of the United States. All of our directors and all of our officers reside outside of the United States and most of their assets are located outside the United States as well. If any investor were to bring a lawsuit against our directors, officers or experts in the United States, it may be difficult for them to effect service of legal process within the United States upon these persons, or to enforce against them, in United States or Chilean courts, judgments obtained in United States courts based upon the civil liability provisions of the federal securities laws of the United States. In addition, there is doubt as to whether an action could be brought successfully in Chile on the basis of liability based solely upon the civil liability provisions of the United States federal securities laws.
Our business and the shares and ADSs may be adversely impacted if the Merger is not consummated.
There can be no assurance that the Merger will occur, as the Merger is subject to certain conditions including shareholders approval, among others. The Company cannot guarantee that these conditions will be satisfied and that the Merger will be successfully completed. The failure to consummate the Merger following the Spin-Off will prevent the Company from reaping the expected benefits of the Merger, which could adversely affect our results of operations and financial condition and could adversely affect the price of the Company’s shares and ADSs.
| | Item 4. | Information on the Company |
| | A. | History and Development of the Company. |
History
We are a publicly held limited liability stock corporation organized under the law of the Republic of Chile. We were organized on June 19, 1981 and we operated under the name Enersis S.A. (“Enersis”) from 1988 until March 1, 2016, when our name was changed to Enersis Américas S.A. Since January 1983, we have been registered in Santiago with the SVS under Registration No. 0175. We also registered with the United States Securities and Exchange Commission under the commission file number 001-12440 on October 19, 1993.
Our contact information in Chile is:
| | |
| Street Address: | | Santa Rosa 76, Santiago, Código Postal 8330099, Chile |
| Telephone: | | (56-2) 2353-4639 |
| Web site: | | www.enersis.cl |
We are an electricity utility company engaged, through our subsidiaries and affiliates, in the generation, transmission and distribution of electricity businesses in Argentina, Brazil, Colombia, and Peru.
Since June 2009, our controlling shareholder has been the Italian company Enel S.p.A. (“Enel”), which holds a beneficial ownership of 60.6% of our shares. Enel is an international energy company operating worldwide in the power and gas markets, with a focus on Europe and Latin America. Enel operates in 32 countries across four continents, with over 95 GW of net installed capacity and distributes electricity and gas through a network covering approximately 1.9 million km. Enel has 61 million customers worldwide.
We are one of the largest publicly listed companies in the electricity sector in South America. We trace our origins to Compañía Chilena de Electricidad Ltda. (“CCE”), which was formed in 1921 as a result of the merger of Chilean Electric Tramway and Light Co., founded in 1889, and Compañía Nacional de Fuerza Eléctrica (“CONAFE”), with operations dating back to 1919. In 1970, the Chilean government nationalized CCE. During the 1980s, the sector was reorganized through the Chilean Electricity Law, known as the Decree No. with Force of Law Number 1 of 1982 (“DFL 1”), CCE’s operations were divided into one generation company, AES Gener S.A. (“Gener”), a currently unrelated company, and two distribution companies, one with a concession in the Valparaíso Region, Chilquinta S.A., a currently unrelated company, and the other with a concession in the Santiago metropolitan region, Compañía Chilena Metropolitana de Distribución Eléctrica S.A. From 1982 to 1987, the Chilean electric utility sector went through a
25
process of re-privatization. In August 1988, Compañía Chilena Metropolitana de Distribución Eléctrica S.A., our predecessor company, changed its name to Enersis S.A. and became the new parent company of Distribuidora Chilectra Metropolitana S.A., later renamed Chilectra S.A. In the 1990s, we diversified into electricity generation and transmission through our increasing equity stakes in Endesa Chile.
We began our international operations in 1992 with our investment in Edesur, an Argentine electricity distribution company. That same year, Endesa Chile, which at that time was an affiliated company, also started its international operations with its investment in Costanera, an Argentine electricity generation company. We then expanded primarily into electricity generation, transmission and distribution businesses in four South American countries: Argentina, Brazil, Colombia and Peru. We remain focused on the electricity sector, although we have small operations in other businesses that represent less than 1.0% of our consolidated assets, in the aggregate.
In 2005, Enel Brasil was formed to manage all generation, transmission and distribution assets that Endesa Latinoamérica, Endesa Chile, Chilectra and we held in Brazil; namely, Ampla, Fortaleza, CIEN, Cachoeira Dourada and Coelce. As of December 31, 2015, we had an 84.4% beneficial economic interest in Enel Brasil.
In 2006, in order to achieve synergies in Peru, we merged Edegel and Empresa de Generación Termoeléctrica Ventanilla S.A., a Peruvian generation company that was owned by the Spanish electric utility, Endesa, S.A. (“Endesa Spain”) at the time, creating a 457 MW thermoelectric generation company.
In September 2007, we merged our generation subsidiaries in Colombia to form Emgesa. As of December 31, 2015, we had a 37.7% beneficial economic interest in Emgesa, directly and indirectly through Endesa Chile. Pursuant to a shareholders’ agreement and the transfer of our 25.1% voting rights to Endesa Chile, we control Emgesa though Endesa Chile and therefore consolidate Emgesa. For more information regarding the control and consolidation of Emgesa, see “Item 5. Operating and Financial Review and Prospects — A. Operating Results. — 1. Discussion of Main Factors Affecting Operating Results and Financial Condition of the Company.”
In February 2009, Codensa, our Colombian distribution subsidiary, acquired approximately 49% of DECSA, an investment vehicle. The remaining 51% was acquired by Empresa de Energía de Bogotá (“EEB”). Codensa and EEB jointly control DECSA.
In March 2009, DECSA acquired 82.3% of Empresa de Energía de Cundinamarca S.A. (“EEC”), a formerly state-owned company that was privatized that year. EEC is a Colombian company primarily engaged in trading of electricity in Cundinamarca province.
In October 2009, Endesa Chile purchased an additional 29.4% of Edegel from Generalima, an indirect Peruvian subsidiary of Endesa Spain. With this transaction, Endesa Chile increased its economic interest in Edegel from 33.1% to 62.5%. As of December 31, 2015, we had a 58.6% beneficial economic interest in Edegel. In the same month, we acquired additional share capital of our Peruvian subsidiary, Edelnor, increasing our beneficial ownership stake in Edelnor to 75.5%.
In June 2012, Endesa Spain, our parent company at the time, proposed a capital increase in our Company, in which it would carry out an in-kind contribution of all of its equity interests in 25 companies in the five South American countries in which we operate. The rest of the shareholders would have the right to contribute their proportional participation in cash. The capital increase was approved by an Extraordinary Shareholders’ Meeting held on December 20, 2012. The capital increase was first offered to existing shareholders through a rights offering registered with both the Chilean SVS and the United States SEC and subsequently through a follow-on offering, which ended on March 28, 2013. The total Ch$ 2,846 billion (approximately US$ 6 billion) capital increase consisted of Ch$ 1,714 billion (approximately US$ 3.6 billion) of in-kind contributions from Endesa Spain and Ch$ 1,132 billion (approximately US$ 2.4 billion) in cash from minority shareholders (the “2013 capital increase”). We began consolidating Piura, Cemsa and Dock Sud as of April 1, 2013, following the in-kind contribution.
Following the 2013 capital increase, we acquired additional interests in certain companies in which we already had a minority economic interest, directly or indirectly through our subsidiaries, including the following transactions:
| | • | | On January 14, 2014, we submitted a voluntary public offer for the acquisition of shares from the shareholders of our subsidiary Coelce. A price of R$ 49 was offered per share, for all share classes. At the time of the announcement, we controlled Coelce and had an economic interest of 58.9%. We acquired 3,002,812 additional ordinary shares, 8,818,006 preferred A shares and 424 preferred B shares, equivalent to an investment of approximately Ch$ 133 billion. As a consequence of this transaction which closed in May 2014, we hold a 64.9% economic interest in Coelce. |
| | • | | On April 30, 2014, we announced the purchase of all indirectly held shares that Inkia Americas Holdings Limited had in Generandes Perú S.A. (equal to 39.0% of such company), the controlling company of Edegel. The total investment amounted to Ch$ 243 billion (equivalent to US$ 413 million). As result of this transaction, which closed in September 2014, we hold a 58.6% economic interest in Edegel. |
26
On October 23, 2014, Endesa Spain sold 9,967,630,058 of our shares (representing a 20.3% interest) directly held by it and 100% of its shareholding in Enel Latinoamérica (owner of 40.32% of our shares) to a subsidiary of Enel. As a result, Enel beneficially owns 60.6% of our shares and is our controller.
In the Extraordinary Shareholders’ Meeting (“ESM”) held on December 18, 2015, shareholders agreed to carry out a spin-off in order to separate the Chilean activities from those in other Latin American countries (Argentina, Brazil, Colombia and Peru). The new company, Enersis Chile S.A. (“Enersis Chile”), was established as a separate company effective as of March 1, 2016 and was assigned the equity interests, assets and associated liabilities of our businesses in Chile. We, the continuing company, hold the non-Chilean businesses and assets. On April 21, 2016, we distributed to our shareholders shares of Enersis Chile in proportion to their share ownership in our Company based on a ratio of one share of Enersis Chile for each of our outstanding shares.
Each of Endesa Chile and Chilectra also conducted a demerger to separate them into two companies. As part of the demerger, Endesa Américas S.A. (“Endesa Américas”) and Chilectra Américas S.A. (“Chilectra Américas”) were formed and hold the non-Chilean business, comprised exclusively of their respective ownership interests in shares of companies domiciled outside of Chile, formerly held by Endesa Chile and Chilectra, respectively.
We own 60.0% of Endesa Américas and 99.1% of Chilectra Américas. The minority shareholders of Endesa Chile and Chilectra (which changed its name to Chilectra Chile on March 1, 2016) own their respective percentage interests in Endesa Américas and Chilectra Américas, respectively, based on a pro rata distribution of the spin-off company shares. The shares of Endesa Américas and Chilectra Américas are listed and traded on the Chilean Stock Exchanges and the American Depositary Receipts (“ADRs”) of Endesa Américas are listed and traded on the New York Stock Exchange (“NYSE”).
Prior to the Extraordinary Shareholders’ Meeting to approve the Merger, we will conduct a public cash tender offer (oferta pública de adquisición de valores, or Tender Offer). This Tender Offer will provide protection to Endesa Américas’ minority shareholders and an opportunity for us to buy out minority shareholders using the funds from the 2013 capital increase. The Tender Offer will provide a floor to the stock price post-spin-off, will be directed equally to all Endesa Américas minority shareholders and will enable us to align incentives to approve the Merger, reducing uncertainty and providing additional liquidity for Endesa Américas shareholders. The Tender Offer is contingent on (i) the approval of the Merger by the respective shareholders of our Company, Endesa Américas and Chilectra Américas at separate ESM of the three companies, (ii) less than 10% of our outstanding shares, 7.72% of the outstanding shares of Endesa Américas and 0.91% of the outstanding shares of Chilectra Américas exercising the right of withdrawal in connection with the merger, and (iii) the absence of any significant adverse supervening events that would make the Tender Offer not in our best interest.
The Tender Offer will be for all shares of Endesa Américas, including in the form of ADSs represented by ADRs of Endesa Américas (other than those held by us), for a price of Ch$ 285.00 per share (or the equivalent in U.S. dollars at the date of payment in the case of ADSs), and will be subject to other terms and conditions which will be provided at the appropriate time. The Tender Offer is expected to occur by the third quarter of 2016.
Subject to approval by shareholders holding at least two-thirds of the outstanding shares of the relevant companies, Endesa Américas and Chilectra Américas intend to merge into our Company, which will continue as the surviving company and under the name Enersis Américas S.A.
Following completion of the Merger, we will continue to have our shares publicly traded and listed in Chile on the Chilean Stock Exchanges and our ADRs traded on the NYSE. In the Merger, the shares of Endesa Américas and Chilectra Américas will be converted into shares of our Company, shares of Endesa Américas and Chilectra Américas shares will cease trading on the Chilean Stock Exchanges and ADRs of Endesa Américas will cease to trade on the NYSE. Following the Merger, Enel is expected to continue to be our ultimate controlling shareholder, through its beneficial ownership. Our current minority shareholders, together with the former minority shareholders of both Endesa Américas and Chilectra Américas will own the minority interest in our Company.
In connection with the Merger, we, as well as Endesa Américas and Chilectra Américas, will each hold an ESM to approve the Merger. Prior to the ESM, we will register the shares to be issued in the Merger with the SEC under the Securities Act. In connection with the respective ESM to approve the Merger, which are expected to be held in the third quarter of 2016, we will distribute a prospectus/information statement to our and Endesa Américas’ shareholders, which contains information about the Merger and our Company post-Merger.
27
In the event that the Merger is not materialized, we, as well as Endesa Américas and Chilectra Américas, will remain as separate publicly traded companies.
As of December 31, 2015, we had 10,932 MW of installed capacity with 101 power units in the four countries in which we operate, consolidated assets of Ch$ 10,303.1 billion and operating revenues of Ch$ 5,301.4 billion.
Capital Investments, Capital Expenditures and Divestitures
We coordinate our overall financing strategy, including the terms and conditions of loans and intercompany advances entered into by our subsidiaries, in order to optimize debt and liquidity management. Generally, our operating subsidiaries independently plan capital expenditures financed by internally generated funds or direct financings. One of our goals is to focus on investments that will provide long-term benefits, such as energy loss reduction projects. Although we have considered how these investments will be financed as part of our budget process, we have not committed to any particular financing structure, and investments will depend on the prevailing market conditions at the time the cash flows are needed.
Our investment plan is flexible enough to adapt to changing circumstances by giving different priorities to each project in accordance with profitability and strategic fit. Investment priorities are currently focused on developing additional thermal capacity in Peru to guarantee adequate levels of reliable supply while remaining focused on the environment.
For the 2016-2020 period, we expect to make capital expenditures of Ch$ 3,781 billion in our subsidiaries, related to investments currently in progress, maintenance of our distribution network, maintenance of existing generation plants and in the studies required to develop other potential generation and distribution projects. For further detail regarding these projects, please see “Item 4. Information on the Company — D. Property, Plant and Equipment — Projects Under Development.”
The table below sets forth the expected capital expenditures for the 2016-2020 period and the capital expenditures incurred in 2015, 2014 and 2013:
| | | | | | | | | | | | | | | | |
| | | Estimated
2016-2020 | | | 2015 | | | 2014 | | | 2013 | |
| | | (in millions of Ch$) | |
| | | | |
Capital expenditures(1) | | | 3,780,986 | | | | 1,362,561 | | | | 1,089,362 | | | | 774,820 | |
| | | | | | | | | | | | | | | | |
| | (1) | Capex amounts represent effective payments for each year, net of contributions, except for future projections. |
Capital Expenditures 2015, 2014 and 2013
In the generation business, our capital expenditures in the last three years were related principally to the 400 MW El Quimbo project in Colombia. El Quimbo was completed and began commercial operations in November 2015. Additionally, in December 2014, the Salaco plant optimization was completed, adding a total of 145 MW to the Colombian system.
In addition, in our distribution business, we invested to expand the service in response to increasing demand for energy, to improve quality of service, improve safety and to prevent energy losses, especially in Brazil.
Investments currently in progress
An important part of our capital expenditures are related to non-discretionary investments that include maintenance of existing installed capacity in order to increase the quality and operation standards of our facilities.
In our distribution business, we plan to continue to expand our services, increasing the connections available to end customers, and reduce energy losses to improve efficiency and profitability.
We believe projects in progress will be financed with resources provided by external financing as well as internally generated funds.
28
We are a publicly held limited liability stock corporation with consolidated operations in Argentina, Brazil, Colombia, and Peru. Our core businesses are electricity generation, transmission and distribution.
The table below presents our revenues by business segment.
| | | | | | | | | | | | | | | | |
| | | Year ended December 31, | |
| | | 2015 | | | 2014 | | | 2013 | | | Change 2015 vs.
2014 | |
| | | (in millions of Ch$) | | | (in %) | |
Generation and Transmission Business | | | | | | | | | | | | | | | | |
Costanera (Argentina) | | | 100,857 | | | | 75,194 | | | | 94,888 | | | | 34.1 | |
El Chocón (Argentina) | | | 40,005 | | | | 30,174 | | | | 36,687 | | | | 32.6 | |
Cachoeira Dourada (Brazil) | | | 91,563 | | | | 158,965 | | | | 117,445 | | | | (42.4) | |
Fortaleza (Brazil) | | | 159,052 | | | | 210,793 | | | | 168,871 | | | | (24.5) | |
CIEN (Brazil) | | | 58,667 | | | | 70,800 | | | | 67,689 | | | | (17.1) | |
Emgesa (Colombia) | | | 778,756 | | | | 753,373 | | | | 639,503 | | | | 3.4 | |
Edegel (Peru) | | | 382,453 | | | | 353,795 | | | | 283,806 | | | | 8.1 | |
Cemsa (Argentina) | | | 2,270 | | | | 1,281 | | | | 1,591 | | | | 77.2 | |
Dock Sud (Argentina) | | | 69,963 | | | | 61,606 | | | | 41,186 | | | | 13.6 | |
EEPSA (Peru) | | | 58,093 | | | | 50,849 | | | | 33,752 | | | | 14.2 | |
Otros | | | (6,917) | | | | (3,961) | | | | (4,074) | | | | 74.6 | |
| | | | | | | | | | | | | | | | |
Total | | | 1,734,762 | | | | 1,762,869 | | | | 1,481,344 | | | | | |
| | | | |
Distribution Business | | | | | | | | | | | | | | | | |
Edesur (Argentina) | | | 607,345 | | | | 371,412 | | | | 528,653 | | | | 63.5 | |
Edelnor (Peru) | | | 562,046 | | | | 478,695 | | | | 413,911 | | | | 17.4 | |
Ampla (Brazil) | | | 1,026,680 | | | | 1,092,282 | | | | 945,131 | | | | (6.0) | |
Coelce (Brazil) | | | 810,184 | | | | 876,944 | | | | 688,981 | | | | (7.6) | |
Codensa (Colombia) | | | 884,468 | | | | 982,771 | | | | 852,780 | | | | (10.0) | |
Otros | | | | | | | 5 | | | | | | | | (100.0) | |
| | | | | | | | | | | | | | | | |
Total | | | 3,890,723 | | | | 3,802,109 | | | | 3,429,456 | | | | 2.3 | |
| | | | |
Less: Consolidation adjustments and non-core activities | | | (324,045) | | | | (358,608) | | | | (382,652) | | | | (9.6) | |
| | | | | | | | | | | | | | | | |
Total | | | 5,301,440 | | | | 5,206,370 | | | | 4,528,148 | | | | 1.8 | |
| | | | | | | | | | | | | | | | |
For further information related to operating revenues and total income by business segment, see “Item 5. Operating and Financial Review and Prospects — A. Operating Results” and Note 35.2 of the Notes to our consolidated financial statements.
Electricity Generation Business
As of December 31, 2015, electricity generation represented 33% of our operating revenues and 57% of our operating income before consolidation adjustments.
Our consolidated electricity sales in 2015 were 48,481 GWh and our production was 42,109 GWh, a 0.8% increase and a 0.3% decrease, respectively, compared to 2014.
Our total installed capacity in 2015 was 10,932 MW, a 435 MW increase compared to 2014, mainly due to the additional 400 MW of capacity of El Quimbo, a new hydroelectric plant with two operating units in Colombia, and 34 MW additional capacity in Peru due to capacity adjustments and upgrades to existing plants. Our electricity generation business is conducted primarily through Endesa Américas, which consolidates our operations in Argentina, Colombia and Peru. We also have separate consolidated operations in Brazil through Enel Brasil, in Argentina through Dock Sud and in Peru through EEPSA.
29
The following tables summarize the operating data relating to our electricity generation:
ELECTRICITY DATA BY COUNTRY
| | | | | | | | | | | | |
| | | Year ended December 31, | |
| | | 2015 | | | 2014 | | | 2013 | |
Argentina | |
Number of generating units(1) | | | 25 | | | | 25 | | | | 25 | |
Installed capacity (MW)(2) | | | 4,502 | | | | 4,502 | | | | 4,502 | |
Electricity generation (GWh) | | | 15,204 | | | | 14,390 | | | | 14,422 | |
Energy sales (GWh) | | | 15,770 | | | | 15,276 | | | | 16,549 | |
Brazil | | | | | | | | | | | | |
Number of generating units(1) | | | 13 | | | | 13 | | | | 13 | |
Installed capacity (MW)(2) | | | 987 | | | | 987 | | | | 987 | |
Electricity generation (GWh) | | | 4,398 | | | | 5,225 | | | | 4,992 | |
Energy sales (GWh) | | | 6,541 | | | | 7,108 | | | | 6,826 | |
Colombia | | | | | | | | | | | | |
Number of generating units(1)(3) | | | 36 | | | | 32 | | | | 29 | |
Installed capacity (MW)(2)(3) | | | 3,459 | | | | 3,059 | | | | 2,925 | |
Electricity generation (GWh) | | | 13,705 | | | | 13,559 | | | | 12,748 | |
Energy sales (GWh) | | | 16,886 | | | | 15,773 | | | | 16,090 | |
Peru | | | | | | | | | | | | |
Number of generating units(1) | | | 27 | | | | 27 | | | | 27 | |
Installed capacity (MW)(2)(4) | | | 1,984 | | | | 1,949 | | | | 1,842 | |
Electricity generation (GWh) | | | 8,801 | | | | 9,062 | | | | 8,489 | |
Energy sales (GWh) | | | 9,283 | | | | 9,916 | | | | 9,497 | |
Total | | | | | | | | | | | | |
| | | | | | | | | | | | |
Number of generating units(1) | | | 101 | | | | 97 | | | | 94 | |
Installed capacity (MW)(2) | | | 10,932 | | | | 10,497 | | | | 10,256 | |
Electricity generation (GWh) | | | 42,109 | | | | 42,237 | | | | 40,650 | |
Energy sales (GWh) | | | 48,481 | | | | 48,073 | | | | 48,963 | |
| | | | | | | | | | | | |
| (1) | For details on generation facilities, see “Item 4. Information on the Company — D. Property, Plant and Equipment — Property, Plant and Equipment of Generating Companies.” |
| (2) | Total installed capacity is defined as the maximum capacity (MW), under specific technical conditions and characteristics. In most cases, installed capacity is confirmed by satisfaction guarantee tests performed by equipment suppliers. Figures may differ from installed capacity declared to governmental authorities and customers in each country, according to criteria defined by such authorities and relevant contracts. |
| (3) | In Colombia, El Quimbo entered into commercial operations during 2015, adding 400 MW of capacity. |
| (4) | In Peru, the Santa Rosa TG 7 unit was recommissioned in December 2014, and during 2015 there were capacity adjustments to and upgrades to existing plants, totaling an additional 33 MW. We break down our sales to customers by using the two following criteria: |
| | • | | The first criterion corresponds to regulated and unregulated customers. Regulated customers are distribution companies that mainly serve residential customers. Unregulated customers, on the other hand, may freely negotiate the electricity price with generators, or may purchase electricity in the pool market at the spot price. The classification of regulated customers differs from one country to another. |
| | • | | The second criterion corresponds to contracted and non-contracted sales. This method is useful because it provides us a uniform way to compare the customers of each country. Contracted sales are defined uniformly throughout. |
In the electricity industry, it is common to divide the business into hydroelectric and thermoelectric generation, because each type of generation has significantly different variable costs. Thermoelectric generation requires the purchase of fuel, which leads to high variable costs compared with hydro generation from reservoirs or rivers that have minimal or no marginal costs. Of our total consolidated generation in 2015, 52.7% was from hydroelectric sources, and 47.3% was from thermal sources.
30
The following table summarizes our consolidated generation by type of energy:
CONSOLIDATED GENERATION BY TYPE OF ENERGY (GWh)
| | | | | | | | | | | | | | | | | | | | | | | | |
| | | Year ended December 31, | |
| | | 2015 | | | 2014 | | | 2013 | |
| | | Generation | | | % | | | Generation | | | % | | | Generation | | | % | |
Hydroelectric | | | 22,171 | | | | 52.7 | | | | 22,439 | | | | 53.1 | | | | 20,979 | | | | 51.6 | |
Thermal | | | 19,938 | | | | 47.3 | | | | 19,798 | | | | 46.9 | | | | 19,671 | | | | 48.4 | |
| | | | | | | | | | | | | | | | | | | | | | | | |
Total generation | | | 42,109 | | | | 100 | | | | 42,237 | | | | 100 | | | | 40,650 | | | | 100 | |
| | | | | | | | | | | | | | | | | | | | | | | | |
In the countries in which we operate, the potential for contracting electricity is generally related to electricity demand. Customers identified as small volume regulated customers, including residential customers, are subject to government regulated electricity tariffs, and must purchase electricity directly from a distribution company. These distribution companies, which purchase large amounts of electricity for small volume residential customers, generally enter into contractual agreements with generators at a regulated tariff price. Those identified as large volume industrial customers also enter into contractual agreements with energy suppliers. However, such large volume industrial customers are not subject to the regulated tariff price. Instead, these customers are allowed to negotiate the energy price with generators based on the characteristics of the service required. Finally, the pool market, where energy is normally sold at the spot price, is not carried out through contracted pricing.
The following table contains information regarding our consolidated sales of electricity by type of customer for each of the periods indicated:
CONSOLIDATED ELECTRICITY SALES BY CUSTOMER TYPE (GWh)
| | | | | | | | | | | | | | | | | | | | | | | | |
| | | Year ended December 31, | |
| | | 2015 | | | 2014 | | | 2013 | |
| | | Sales | | | % | | | Sales | | | % | | | Sales | | | % | |
Regulated customers | | | 17,937 | | | | 37,0 | | | | 17,125 | | | | 35.6 | | | | 17,344 | | | | 35.4 | |
Unregulated customers | | | 9,605 | | | | 19,8 | | | | 10,503 | | | | 21.8 | | | | 10,993 | | | | 22.5 | |
| | | | | | | | | | | | | | | | | | | | | | | | |
Total contracted sales(1) | | | 27,543 | | | | 56.8 | | | | 27,627 | | | | 57.5 | | | | 28,336 | | | | 57.9 | |
Electricity pool market sales | | | 20,938 | | | | 43.2 | | | | 20,446 | | | | 42.5 | | | | 20,626 | | | | 42.1 | |
| | | | | | | | | | | | | | | | | | | | | | | | |
Total electricity sales | | | 48,481 | | | | 100 | | | | 48,073 | | | | 100 | | | | 48,963 | | | | 100 | |
| | | | | | | | | | | | | | | | | | | | | | | | |
| (1) | Includes the sales to distribution companies without contracts in Peru. |
Specific energy consumption limits (measured in GWh) for regulated and unregulated customers are country specific. Moreover, regulatory frameworks often require that regulated distribution companies have contracts to support their commitments to small volume customers and also determine which customers can purchase energy in electricity pool markets.
In terms of expenses, the primary variable costs involved in the electricity generation business, in addition to the direct variable cost of generating hydroelectric or thermal electricity such as fuel costs, are energy purchases and transportation costs. During periods of relatively low rainfall conditions, the amount of our thermal generation normally increases. This involves an increase of the total fuel cost and the costs of its transportation to the thermal generation power plants. Under drought conditions, electricity that we have contractually agreed to provide may exceed the amount of electricity that we are able to generate, which requires us to purchase electricity in the pool market at spot prices in order to satisfy our contractual commitments. The cost of these purchases at spot prices may, under certain circumstances, exceed the price at which we sell electricity under contracts and, therefore, may result in a loss We attempt to minimize the effect of poor hydrological conditions on our operations in any year by limiting our contractual sales requirements to a quantity that does not exceed the estimated production in a dry year. To determine an estimated production in a dry year, we take into consideration the available statistical information concerning rainfall, hydrological levels, and the capacity of key reservoirs. In addition to limiting contracted sales, we may adopt other strategies including installing temporary thermal capacity, negotiating lower consumption levels with unregulated customers, negotiating with other water users and including pass-through cost clauses in contracts with customers. (For further details about hydrological conditions and their effects on our business, please refer to “Item 5. Operating and Financial Review and Prospects — A. Operating Results. — 1. Discussion of Main Factors Affecting Operating Results and Financial Condition of the Company — a. Hydrological Conditions).”
31
Seasonality
While our core businesses are subject to weather patterns, generally only extreme events such as prolonged droughts, which may adversely affect our generation capacity, rather than seasonal weather variations, may materially affect our operating results and financial condition.
The distribution business is directly influenced by seasonal changes in energy demand. Although the price at which a distribution company purchases electricity can change seasonally and has an impact on the price at which it is sold to end users, it does not have an impact on our profitability since the cost of electricity purchased is passed to end users through tariffs that are set for multi-year periods. In Argentina, there are typically extreme temperatures in both summer and winter, which are the peak periods for distributors. During these periods, demand increases due to the need for heating and air conditioning. The Company launched the “Winter 2015 Plan” and “Summer Plan 2014-2015” in order to address these critical periods with preventive actions. During 2015, the average temperatures in Brazil were similar to the previous year. During the past year Brazil went through a political and economic crisis, which resulted in significant tariff adjustments during 2015. On average, there was a 42% increase for Ampla and a 22% increase for Coelce. This, combined with poor hydrology, resulted in 0.4% weaker demand for Ampla and 1.6% greater demand for Coelce, in their respective concession areas. The Colombian distribution business is directly influenced by seasonal changes in energy demand. Although the price at which distribution companies purchase electricity can change seasonally and has an impact on the price at which it is sold to end users, it does not have an impact on our profitability since the cost of purchased electricity is passed to end users through tariffs that are set for multi-year periods. During 2015, the effects of higher than historical average temperatures, due to El Niño Phenomenon in Colombia, have impacted electricity prices paid October. In part, these effects were offset during the fourth quarter. Electricity demand Bogotá grew 2.4% in 2015 vs. 2.6% in 2014, mainly the residential sector. During 2015, Peruvian energy demand was higher than planned, mainly due to higher consumption in toll and medium-voltage customers, partially offset by the slightly lower consumption of low-voltage customers. The country’s fishing, mining, hydrocarbon and manufacturing sectors rebounded in the second half of the year. March is the month that typically has the highest energy demand (7% higher than the annual average) due to seasonal sectors and February is typically the month with the lowest consumption (4% less than the annual average), because of its shorter length.
The generation businesses in the countries where we operate are affected by seasonal changes throughout the year. The months with the most precipitation in Argentina are typically May through August, with snow melts typically occurring between October and December. The months with the most precipitation in our operating area in Colombia are typically April and May as well as October and November. The months with the most precipitation in Peru are typically November through March.
When there is more precipitation hydroelectric generating facilities can accumulate additional water to be used for generation. The increased level of our reservoirs allows us to generate more electricity with hydro power plants during months in which marginal electricity costs are lower.
In general, hydrological conditions such as droughts and insufficient rainfall may adversely affect our generation capacity. For example, severe prolonged drought conditions or reduced rainfall levels in the countries in which we operate caused by El Niño phenomenon reduces the amount of water that can be accumulated in reservoirs, thereby curtailing our hydroelectric generation capacity. In order to mitigate hydrological risk, hydroelectric generation may be substituted with thermal generation (natural gas, LNG, coal or diesel) and energy purchases on the spot market, both of which could result in higher costs, in order to meet our obligations under contracts with both regulated and unregulated customers.
Operations in Argentina
We participate in electricity generation in Argentina through subsidiaries of Endesa Américas (Costanera and El Chocón) and through our subsidiary Dock Sud, with an aggregate of 25 power units with a total installed capacity of 4,502 MW. Costanera owns eleven thermal units, with a total installed capacity of 2,304 MW, El Chocón owns nine hydroelectric units, with total installed capacity of 1,328 MW, and Dock Sud owns five thermal units with a total installed capacity of 870 MW. Our hydro and thermal generation units in Argentina represented 14.3% of the Argentine National Interconnected System’s (“Argentine NIS”) installed capacity in 2015.
Our Argentine subsidiaries have stakes in three additional companies: Termoeléctrica Manuel Belgrano S.A., Termoeléctrica San Martín S.A. and Central Vuelta de Obligado S.A. These companies were formed to undertake the construction of three new generation facilities for a fund called “FONINVEMEM”, whose purpose is to increase electricity capacity and generation within the Argentine wholesale electricity market. The first two plants began their operations in 2008 using gas turbines, with an aggregate capacity of 1,125 MW, and began its combined cycle operations in March 2010, with an additional capacity of 572 MW. The total aggregate capacity of these units is 1,697 MW (848 MW from Manuel Belgrano and 849 MW from San Martín). The third plant began its open cycle operations in mid-2015 (with an installed capacity of 550 MW), and it is expected to begin its combined cycle operations in 2016 (with a total installed capacity of 800 MW).
32
Since 2002, government intervention and energy industry authority actions, including limiting the spot price of electricity by considering the variable cost of generating electricity with natural gas and without considering the hydrological conditions of rivers and reservoirs or the use of more expensive fuels, have led to the lack of investment in the electric power sector. In addition, since 2002, the Argentine government has taken an active role in controlling the fuel supply to the electricity generation sector. (See “Item 4. Information on the Company— B. Business Overview — Electricity Industry Regulatory Framework — Argentina” for further detail).
In March 2013, the government intervened with the fuel markets through Resolution 95/2013. The electric market operator (“CAMMESA” in its Spanish acronym) is now responsible for the supply and the commercial management of fuels for electric generation purposes.
As of December 31, 2015, Costanera’s installed capacity accounted for 7.3% of the total installed capacity in the Argentine NIS. Both Costanera’s steam turbine power plant and second combined-cycle plant can operate with either natural gas or diesel.
El Chocón accounted for 4.2% of the installed capacity in the Argentine NIS as of December 31, 2015. El Chocón has a 30-year concession, ending in 2023, for two hydroelectric generation facilities with an aggregate installed capacity of 1,328 MW. The larger of the two facilities for which El Chocón has a concession of 1,200 MW of installed capacity is the primary flood control installation on the Limay River. The facility’s large reservoir, Ezequiel Ramos Mejía, enables El Chocón to be one of the Argentine NIS major peak suppliers. Variations in El Chocón’s water discharge are moderated by El Chocón’s Arroyito facility, a downstream dam with 128 MW of installed capacity. In November 2008, we completed construction on the Arroyito dam, and increased the elevation of the reservoir’s water level, which allows the release of water at an additional 1,150 m3/sec, for a total of 3,750 m3/sec. A portion of the Arroyito facility’s generation is sold under the “Energy Plus” program, which provides for the offer of new electricity capacity to supply the electricity demand growth, using the 2005 demand level for electricity as a base. (For details on “Energy Plus”, see “Item 4. Information on the Company — B. Business Overview — Electricity Industry Regulatory Framework — Argentina”).
Dock Sud’s installed capacity of 870 MW accounted for 2.7% of the total installed capacity in the Argentine NIS as of December 31, 2015. The Dock Sud combined-cycle plant consists of three generation units with an installed capacity of 798 MW that operate using either natural gas or diesel as fuel. The two gas turbine units of Dock Sud have 72 MW of installed capacity.
For information on the installed generation capacity for each of our Argentine subsidiaries, see “Item 4. Information on the Company — D. Property, Plant and Equipment—Property, Plant and Equipment of Generating Companies.”
Our total generation in Argentina amounted to 15,204 GWh in 2015. According to CAMMESA, our generation market share was approximately 11.1% of the total electricity production in Argentina during 2015.
Hydroelectric generation in Argentina accounted for nearly 21.3% of our total generation in 2015. This was due to the fact that hydrological levels of the Limay River were close to average levels due to higher than average precipitation during the winter months.
Generation by type and subsidiary is shown in the following table:
ELECTRICITY GENERATION IN ARGENTINA (GWh)
| | | | | | | | | | | | | | | | | | | | | | | | |
| | | Year ended December 31, | |
| | | 2015 | | | 2014 | | | 2013 | |
| | | Generation | | | % | | | Generation | | | % | | | Generation | | | % | |
Hydroelectric generation (El Chocón) | | | 3,238 | | | | 21,3 | | | | 2,632 | | | | 18.3 | | | | 2,317 | | | | 16.1 | |
Thermal generation (Costanera and Dock Sud) | | | 11,966 | | | | 78,7 | | | | 11,758 | | | | 81.7 | | | | 12,105 | | | | 83.9 | |
| | | | | | | | | | | | | | | | | | | | | | | | |
Total generation | | | 15,204 | | | | 100 | | | | 14,390 | | | | 100 | | | | 14,422 | | | | 100 | |
| | | | | | | | | | | | | | | | | | | | | | | | |
33
The following table sets forth our electricity generation and purchases in Argentina:
ELECTRICITY GENERATION AND PURCHASES IN ARGENTINA (GWh)
| | | | | | | | | | | | | | | | | | | | | | | | |
| | | Year ended December 31, | |
| | | 2015 | | | 2014 | | | 2013 | |
| | | (GWh) | | | % | | | (GWh) | | | % | | | (GWh) | | | % | |
Electricity generation | | | 15,204 | | | | 96,4 | | | | 14,390 | | | | 94.2 | | | | 14,422 | | | | 87.2 | |
Electricity purchases | | | 566 | | | | 3,6 | | | | 886 | | | | 5.8 | | | | 2,126 | | | | 12.8 | |
| | | | | | | | | | | | | | | | | | | | | | | | |
Total(1) | | | 15,770 | | | | 100 | | | | 15,276 | | | | 100 | | | | 16,549 | | | | 100 | |
| | | | | | | | | | | | | | | | | | | | | | | | |
| (1) | Electricity generation and electricity purchases may differ from total electricity sales because of transmission losses, our power plants’ own consumption and technical losses have already been deducted. |
The distribution of our electricity sales in Argentina by customer segment and per subsidiary is shown in the following tables:
ELECTRICITY SALES PER CUSTOMER SEGMENT IN ARGENTINA (GWh)
| | | | | | | | | | | | | | | | | | | | | | | | |
| | | Year ended December 31, | |
| | | 2015 | | | 2014 | | | 2013 | |
| | | Sales | | | % of
Sales
Volume | | | Sales | | | % of
Sales
Volume | | | Sales | | | % of
Sales
Volume | |
Contracted sales | | | 588 | | | | 3.7 | | | | 904 | | | | 5.9 | | | | 2,225 | | | | 13.4 | |
Non-contracted sales(1) | | | 15,182 | | | | 96.3 | | | | 14,372 | | | | 94.1 | | | | 14,324 | | | | 86.6 | |
| | | | | | | | | | | | | | | | | | | | | | | | |
Total electricity sales | | | 15,770 | | | | 100 | | | | 15,276 | | | | 100 | | | | 16,549 | | | | 100 | |
| | | | | | | | | | | | | | | | | | | | | | | | |
| (1) | Non-contracted electricity sales were made at spot prices determined by the regulator. |
| (2) | Electricity generation and electricity purchases may differ from total electricity sales because of transmission losses, our power plants’ own consumption and technical losses have already been deducted |
ELECTRICITY SALES PER SUBSIDIARY IN ARGENTINA (GWh)
| | | | | | | | | | | | |
| | | Year ended December 31, | |
| | | 2015 | | | 2014 | | | 2013 | |
Costanera | | | 8,168 | | | | 7,051 | | | | 8,962 | |
El Chocón | | | 3,801 | | | | 3,391 | | | | 3,392 | |
Dock Sud | | | 3,802 | | | | 4,834 | | | | 4,195 | |
| | | | | | | | | | | | |
Total | | | 15,770 | | | | 15,276 | | | | 16,549 | |
| | | | | | | | | | | | |
In March 2013, the government intervened in the commercial market for energy, except with respect to the “Energy Plus” program, through the one-time application of Resolution 95/2013. CAMMESA is now responsible for the administration of contracts with end customers, except for those under the “Energy Plus” program. The resolution defined a transition period in which the electricity generating companies will continue managing the contracts until their expiration dates.
As of December 31, 2015, Costanera did not have contracts with unregulated customers or distribution companies and sold all of its electricity to the pool market during the year.
As of December 31, 2015, El Chocón had only one contract with unregulated customers and no contracts with distribution companies. Energy is provided to Minera Alumbrera through CEMSA, our subsidiary.
El Chocón does not have the right to terminate its operating agreement with Endesa Américas, unless Endesa Américas fails to comply with its obligations under the agreement. Under the terms of the operating agreement, Endesa Américas is entitled to a fee payable in U.S. dollars based on El Chocón’s annual gross revenues, payable in monthly installments.
34
For the year ended December 31, 2015, Dock Sud did not have any contracts with regulated customers or distribution companies and sold all of its electricity to the pool market during the year.
According to CAMMESA, electricity demand throughout the Argentine NIS increased by 4.4% during 2015. The total electricity demand was 131,998 GWh in 2015, 126,397 GWh in 2014 and 125,167 GWh in 2013. Our Argentine subsidiaries compete with all the major power plants connected to the Argentine NIS. According to the installed capacity reported by CAMMESA, in its monthly report as of December 2015, our major competitors in Argentina are: (1) the state controlled company Enarsa (with an installed capacity of 1,133 MW), (2) the nuclear unit “NASA” (with an installed capacity of 1,010 MW), and (3) the hydroelectric units Yacyretá and Salto Grande (with an aggregate installed capacity of 3,690 MW). The main private competitors are: AES Group, Sociedad Argentina de Energía S.A. (“Sadesa”), and Pampa Energía. The AES Group has seven power plants connected to the Argentine NIS with a total installed capacity of 2,753 MW (43.7% of which is hydroelectric). Sadesa owns a total of approximately 3,858 MW of installed capacity, the most significant of which are Piedra del Águila (with an installed capacity of 1,400 MW) and Central Puerto (a thermal facility with 1,777 MW of installed capacity). Pampa Energía, with a total installed capacity of 2,217 MW, competes with us with six power plants, of which 653 MW is hydroelectric and 1,564 MW is thermal.
Operations in Brazil
Enel Brasil consolidates generation operations of Cachoeira Dourada and Fortaleza.
As of December 2015, we had a total installed capacity of 987 MW in Brazil, of which 665 MW is from Cachoeira Dourada and 322 MW is from Fortaleza.
For information on the installed generation capacity for each of our Brazilian subsidiaries, see “Item 4. Information on the Company — D. Property, Plant and Equipment — Property, Plant and Equipment of Generating Companies.”
Generation by type and subsidiary in Brazil is shown in the following table:
ELECTRICITY GENERATION IN BRAZIL (GWh)
| | | | | | | | | | | | | | | | | | | | | | | | |
| | | Year ended December 31, | |
| | | 2015 | | | 2014 | | | 2013 | |
| | | Generation | | | % | | | Generation | | | % | | | Generation | | | % | |
Hydroelectric generation (Cachoeira Dourada) | | | 2,057 | | | | 46.8 | | | | 2,741 | | | | 52.5 | | | | 2,404 | | | | 48.2 | |
Thermal generation (Fortaleza) | | | 2,342 | | | | 53.2 | | | | 2,484 | | | | 47.5 | | | | 2,588 | | | | 51.8 | |
| | | | | | | | | | | | | | | | | | | | | | | | |
Total | | | 4,398 | | | | 100 | | | | 5,225 | | | | 100 | | | | 4,992 | | | | 100 | |
| | | | | | | | | | | | | | | | | | | | | | | | |
During 2015, thermal generation exceeded hydroelectric generation because hydrological conditions were below the historical average in the Paranaiba basin, where Cachoeira Dourada is located, with rainfall at approximately 66% of the historical average.
The following table sets forth our electricity generation and purchases in Brazil:
ELECTRICITY GENERATION AND PURCHASES IN BRAZIL (GWh)
| | | | | | | | | | | | | | | | | | | | | | | | |
| | | Year ended December 31, | |
| | | 2015 | | | 2014 | | | 2013 | |
| | | (GWh) | | | % | | | (GWh) | | | % | | | (GWh) | | | % | |
Electricity generation | | | 4,398 | | | | 67.2 | | | | 5,225 | | | | 73.5 | | | | 4,992 | | | | 73.1 | |
Electricity purchases | | | 2,142 | | | | 32.8 | | | | 1,883 | | | | 26.5 | | | | 1,835 | | | | 26.9 | |
| | | | | | | | | | | | | | | | | | | | | | | | |
Total(1) | | | 6,541 | | | | 100 | | | | 7,108 | | | | 100 | | | | 6,827 | | | | 100 | |
| | | | | | | | | | | | | | | | | | | | | | | | |
| (1) | Electricity generation and electricity purchases may differ from total electricity sales because of transmission losses, our power plants’ own consumption and technical losses have already been deducted. |
Cachoeira Dourada is a hydroelectric company consisting of ten generation units with a total installed capacity of 665 MW, located in southern Brazil. Cachoeira Dourada’s market share is 0.5% of the total installed capacity of the Brazilian system. It had long-term contracts (originally seven-year terms, which expired in 2015) with 34 distribution companies due to the bids carried out for regulated customers by bilateral agreements, called Electric Power Trading Agreements within the Regulated Environment
35
(“CCEAR” in its Portuguese acronym). Contracts sales with regulated customers in 2015 were 1,109 GWh. Additionally, during 2015, Cachoeira Dourada had medium-term contracts (originally two to five year terms, expiring in 2015, and currently in negotiations) with 24 unregulated customers, with an average duration of three years. Cachoeira Dourada’s sales to unregulated customers were 1,645 GWh.
The distribution of Cachoeira Dourada’s electricity sales by customer segment is shown in the following table:
CACHOEIRA DOURADA’S ELECTRICITY SALES PER CUSTOMER SEGMENT (GWh)
| | | | | | | | | | | | | | | | | | | | | | | | |
| | | Year ended December 31, | |
| | | 2015 | | | 2014 | | | 2013 | |
| | | Sales | | | % of Sales
Volume | | | Sales | | | % of Sales
Volume | | | Sales | | | % of Sales
Volume | |
Contracted sales | | | 2,754 | | | | 85.7 | | | | 3,634 | | | | 93.1 | | | | 3,369 | | | | 94.5 | |
Non-contracted sales | | | 461 | | | | 14.3 | | | | 269 | | | | 6.9 | | | | 195 | | | | 5.5 | |
| | | | | | | | | | | | | | | | | | | | | | | | |
Total electricity sales(1) | | | 3,215 | | | | 100 | | | | 3,903 | | | | 100 | | | | 3,564 | | | | 100 | |
| | | | | | | | | | | | | | | | | | | | | | | | |
| (1) | Electricity generation and electricity purchases may differ from total electricity sales because of transmission losses, our power plants’ own consumption and technical losses have already been deducted. |
For the year ended December 31, 2015, Cachoeira Dourada’s principal unregulated customers were (ordered alphabetically): AES Tietê, Cargill, Guardian, Peugeot and Tractebel.
Fortaleza is wholly-owned by Enel Brasil. Fortaleza owns a combined-cycle plant with three generation units which use natural gas. The plant is located 50 kilometers from the capital of the State of Ceará, and began commercial operations in 2003. Since January 2010, Fortaleza has received natural gas from the Pecem regasification terminal, an unrelated company.
Fortaleza’s market share is 0.2% of the total installed capacity of the Brazilian system and 0.8% of the thermoelectric generators. Fortaleza has a long-term contract with Coelce that expires in 2023.
The distribution of Fortaleza’s electricity sales by customer segment is shown in the following table:
FORTALEZA’S ELECTRICITY SALES PER CUSTOMER SEGMENT (GWh)
| | | | | | | | | | | | | | | | | | | | | | | | |
| | | Year ended December 31, | |
| | | 2015 | | | 2014 | | | 2013 | |
| | | Sales | | | % of Sales
Volume | | | Sales | | | % of Sales
Volume | | | Sales | | | % of Sales
Volume | |
Contracted sales | | | 2,690 | | | | 80.9 | | | | 2,690 | | | | 83.9 | | | | 2,690 | | | | 82.5 | |
Non-contracted sales | | | 636 | | | | 19.1 | | | | 515 | | | | 16.1 | | | | 572 | | | | 17.5 | |
| | | | | | | | | | | | | | | | | | | | | | | | |
Total electricity sales | | | 3,326 | | | | 100 | | | | 3,205 | | | | 100 | | | | 3,262 | | | | 100 | |
| | | | | | | | | | | | | | | | | | | | | | | | |
For the year ended December 31, 2015, the Fortaleza’s principal distribution customer was Coelce.
Operations in Colombia
Our generation operations in Colombia are carried out through Emgesa. We hold a 37.7% stake in Emgesa as of December 31, 2015, which we control through Endesa Américas and consolidate as a result of Endesa Américas holding 56.4% of Emgesa’s voting rights and the right to appoint a majority of the Board members pursuant to a shareholder agreement. For more information on our control over Emgesa, see “Item 5. Operating and Financial Review and Prospects — A. Operating Results. — 1. Discussion of Main Factors Affecting Operating Results and Financial Condition of the Company.”
As of December 31, 2015, Emgesa operated 36 generation units, with a total installed capacity of 3,459 MW, of which 3,015 MW was from hydroelectric plants and 444 MW was from thermoelectric plants. According toExpertos de Mercado S.A. E.S.P. (“XM”), a Colombian company that provides system management in real time services in electrical, financial and transportation sectors, our hydroelectric and thermal generation plants represented 21.0% of the country’s total electricity generation capacity as of December 2015. For information on the installed generation capacity for each of our Colombian subsidiaries, see “Item 4. Information on the Company — D. Property, Plant and Equipment—Property, Plant and Equipment of Generating Companies.”
36
Approximately 89% of our installed capacity in Colombia is hydroelectric, and therefore, our electricity generation depends on reservoir levels and rainfall. According to XM, our generation market share was 20.6% in 2015, 21.2% in 2014 and 20.6% in 2013. In addition to hydrological conditions, the generation amount depends on our commercial strategy. Companies are free to offer their electricity at prices driven by market conditions and are dispatched by a centralized operating entity to generate according to the prices offered, as opposed to being dispatched according to the operating costs, as in other countries in which we operate.
During 2015, thermal generation represented 10.8% of total generation and hydroelectric generation represented the remaining 89.2%. In 2015, hydrological conditions were below the historical averages in Colombia, with rainfall around 79% of the historical averages. In the case of Emgesa, according to XM, the three rivers that supply water to Emgesa’s hydroelectric power plants were as follows compared to their historical levels: the Guavio River Basin was 13% higher, the Magdalena River (Betania) was 10% lower and the Bogotá River (Cadena Nueva) was 7% lower. For the year ended December 31, 2015, hydroelectric generation decreased by 3.2% compared to 2014.
Generation by type in Colombia is shown in the following table:
ELECTRICITY GENERATION IN COLOMBIA (GWh)
| | | | | | | | | | | | | | | | | | | | | | | | |
| | | Year ended December 31, | |
| | | 2015 | | | 2014 | | | 2013 | |
| | | Generation | | | % | | | Generation | | | % | | | Generation | | | % | |
Hydroelectric generation | | | 12,223 | | | | 89.2 | | | | 12,627 | | | | 93.1 | | | | 11,784 | | | | 92.4 | |
Thermal generation | | | 1,482 | | | | 10.8 | | | | 932 | | | | 6.9 | | | | 964 | | | | 7.6 | |
| | | | | | | | | | | | | | | | | | | | | | | | |
Total generation | | | 13,705 | | | | 100 | | | | 13,559 | | | | 100 | | | | 12,748 | | | | 100 | |
| | | | | | | | | | | | | | | | | | | | | | | | |
During 2015, Emgesa used 554 kilotons of coal for its coal-fired plants, which was obtained from 22 local suppliers compared to the 439 kilotons used during 2014.This higher consumption can be explained by the presence of El Niño climate phenomena which resulted in drier hydrology in Colombia than in 2014. The local coal price has remained below the export price as high transport costs make it difficult for domestic coal to compete in the export market. This trend is expected to continue in the Colombian coal market.
In 2013, Emgesa also entered into a fuel oil supply agreement with Esapetrol, in addition to the existing oil supply contracts with Petromil and Biomax. During 2015, the Cartagena power plant consumed 118 kilotons of fuel oil, primarily supplied from Petromil. We believe that Emgesa will have access to a reliable supply of fuel oil for the Cartagena power plant.
The following table sets forth our electricity generation and purchases in Colombia:
ELECTRICITY GENERATION AND PURCHASES IN COLOMBIA (GWh)
| | | | | | | | | | | | | | | | | | | | | | | | |
| | | Year ended December 31, | |
| | | 2015 | | | 2014 | | | 2013 | |
| | | (GWh) | | | % | | | (GWh) | | | % | | | (GWh) | | | % | |
Electricity generation | | | 13,705 | | | | 80.2 | | | | 13,559 | | | | 85.3 | | | | 12,748 | | | | 78.6 | |
Electricity purchases | | | 3,384 | | | | 19.8 | | | | 2,333 | | | | 14.7 | | | | 3,461 | | | | 21.4 | |
| | | | | | | | | | | | | | | | | | | | | | | | |
Total(1) | | | 17,089 | | | | 100 | | | | 15,893 | | | | 100 | | | | 16,209 | | | | 100 | |
| | | | | | | | | | | | | | | | | | | | | | | | |
| (1) | Electricity generation and electricity purchases may differ from total electricity sales because of transmission losses, our power plants’ own consumption and technical losses have already been deducted |
Colombia has a single interconnected electricity system, the National Interconnected System (“Colombian NIS”). Electricity demand in the Colombian NIS increased 4.1% during 2015. Total electricity consumption was 66,173 GWh in 2015, 63,570 GWh in 2014 and 60,890 GWh in 2013.
37
Colombia has an agreement with Ecuador to provide an interconnection between the electricity systems of both countries. During 2015, Colombian electricity generators sold 457 GWh of electricity to Ecuadorian customers.
In addition, Colombia has interconnection lines with Venezuela that operate under exceptional circumstances as needed by either of the two countries. In April 2011, Colombia and Venezuela signed an agreement to supply energy to Venezuela as part of the normalization of commercial relations. This agreement also includes the import of gasoline and diesel from Venezuela. The total energy exported to Venezuela was 3 GWh in 2015.
The distribution of our electricity sales in Colombia by customer segment is shown in the following table:
ELECTRICITY SALES PER CUSTOMER SEGMENT IN COLOMBIA (GWh)
| | | | | | | | | | | | | | | | | | | | | | | | |
| | | Year ended December 31, | |
| | | 2015 | | | 2014 | | | 2013 | |
| | | Sales | | | % of Sales
Volume | | | Sales | | | % of Sales
Volume | | | Sales | | | % of Sales
Volume | |
Contracted sales | | | 12,505 | | | | 74.1 | | | | 10,969 | | | | 69.5 | | | | 11,567 | | | | 71.9 | |
Non-contracted sales | | | 4,381 | | | | 25.9 | | | | 4,804 | | | | 30.5 | | | | 4,523 | | | | 28.1 | |
| | | | | | | | | | | | | | | | | | | | | | | | |
Total electricity sales(1) | | | 16,886 | | | | 100 | | | | 15,773 | | | | 100 | | | | 16,090 | | | | 100 | |
| | | | | | | | | | | | | | | | | | | | | | | | |
| (1) | Electricity generation and electricity purchases may differ from total electricity sales because of transmission losses, our power plants’ own consumption and technical losses have already been deducted |
During 2015, Emgesa served 440 customers, of which 422 were unregulated customers and 18 were distribution and trading companies. Emgesa’s sales to our Colombian distribution subsidiary, Codensa, accounted for 15% of our total contracted sales with regulated customers in 2015. Electricity sales to the five largest unregulated customers represented 23% of total contracted sales with unregulated customers.
For the year ended December 31, 2015, principal distribution customers were (ordered alphabetically): Codensa (our subsidiary), Compañia Energética del Tolima (“Enertolima”), Electrificadora del Caribe (“Electrocaribe”), Electrificadora del Huila, Electrificadora de Santander and Empresas Públicas de Medellín (“EPM”).
Our most significant competitors in Colombia include the following state-owned companies: Empresas Públicas de Medellín (with an installed capacity of 3,202 MW) and Isagen (with an installed capacity of 3,001 MW). We also compete with the following private sector companies in Colombia: Chivor (with an installed capacity of 1,000 MW), which is owned by Gener; Colinversiones (with an installed capacity of 1,862 MW), which includes Termoflores and Epsa; and Gecelca (with an installed capacity of 1,361 MW).
Operations in Peru
Through our subsidiaries, Edegel and EEPSA, we operate a total of 27 generation units in Peru, with a total installed capacity of 1,984 MW. As of December 31, 2015, Edegel owns 18 hydroelectric units, with a total installed capacity of 783 MW, and the remaining 903 MW consists of seven thermal units. EEPSA owns two thermal units with an aggregate installed capacity of 298 MW. On May 6, 2013, the TG 7 unit of Santa Rosa was decommissioned due to fire damage. The damage in the plant resulted in a total loss and the insurance covered both the assets and the business interruption for a period of up two years. On December 5, 2014, the TG 7 unit restarted commercial operations again. During 2015, no new generation units entered operation, but both Edegel and EEPSA adjusted the capacities of some units. Edegel’s hydroelectric plants had their capacities adjusted as follows: Chimay increased by 1 MW, Callahuanca increased by 4 MW, Huinco increased by 21 MW and Moyopampa increased 3 MW. Edegel also adjusted the capacity of some of its thermal plants as follows: Santa Rosa increased by 6 MW and Ventanilla was reduced by 1 MW. The capacity of EEPSA’s Malacas plant was also increased by 1 MW in 2014.
According to the Energy and Mining Investment Supervisory Authority (“Osinergmin” in its Spanish acronym) , the Peruvian regulatory electricity authority, our hydroelectric and thermal generation plants in Peru represented 20.7% of the country’s total electricity generation capacity as of December 31, 2015.
For information on the installed generation capacity for each of our power plants in Peru, see “Item 4. Information on the Company — D. Property, Plant and Equipment—Property, Plant and Equipment of Generating Companies.”
38
Generation by type and subsidiary in Peru is shown in the following table:
ELECTRICITY GENERATION IN PERU (GWh)
| | | | | | | | | | | | | | | | | | | | | | | | |
| | | Year ended December 31, | |
| | | 2015 | | | 2014 | | | 2013 | |
| | | Generation | | | % | | | Generation | | | % | | | Generation | | | % | |
Hydroelectric generation (Edegel) | | | 4,653 | | | | 52.9 | | | | 4,439 | | | | 49.0 | | | | 4,474 | | | | 52.7 | |
Thermal generation (Edegel and EEPSA) | | | 4,148 | | | | 47.1 | | | | 4,623 | | | | 51.0 | | | | 4,014 | | | | 47.3 | |
| | | | | | | | | | | | | | | | | | | | | | | | |
Total generation | | | 8,801 | | | | 100 | | | | 9,062 | | | | 100 | | | | 8,489 | | | | 100 | |
| | | | | | | | | | | | | | | | | | | | | | | | |
According to the Committee of Economic Operation of the Peruvian System (“COES” in its Spanish acronym), we generated 20.4% of total Peruvian electricity production in 2015.
Hydroelectric generation represented 52.9% of total production of our Peruvian generation subsidiaries in 2015. In the case of Edegel, hydrological levels were at or above their historical averages in 2015 in the rivers that supply Edegel’s hydroelectric power plants. According to COES, hydrological levels of the Rimac River Basin (Huinco, Matucana, Callahuanca, Moyopampa and Huampaní) were 5% higher than the average; hydrological levels of the Tulumayo River (C.H. Chimay) were 2.4% lower than the average; and hydrological levels of the Tarma River (C.H. Yanango) were 2.9% lower than the average.
Edegel has long-term gas supply, transportation and distribution contracts for its Ventanilla and Santa Rosa facilities. It has also signed transport capacity transfer agreements with other generators, which allows it to trade transport capacity in order to operate as instructed by COES, and optimize the use of the natural gas transport system.
The following table sets forth our electricity generation and purchases in Peru:
ELECTRICITY GENERATION AND PURCHASES IN PERU (GWh)(1)
| | | | | | | | | | | | | | | | | | | | | | | | |
| | | Year ended December 31, | |
| | | 2015 | | | 2014 | | | 2013 | |
| | | (GWh) | | | % | | | (GWh) | | | % | | | (GWh) | | | % | |
Electricity generation | | | 8,801 | | | | 94.8 | | | | 9,062 | | | | 91.4 | | | | 8,489 | | | | 89.4 | |
Electricity purchases | | | 482 | | | | 5.2 | | | | 854 | | | | 8.6 | | | | 1,009 | | | | 10.6 | |
| | | | | | | | | | | | | | | | | | | | | | | | |
Total | | | 9,283 | | | | 100 | | | | 9,916 | | | | 100 | | | | 9,497 | | | | 100 | |
| | | | | | | | | | | | | | | | | | | | | | | | |
| (1) | Includes sales to distribution companies without contracts. |
The Peruvian National Interconnected Electric System (“SEIN”) is the only interconnected system in Peru. Electricity sales in the SEIN increased by 6.6% in 2015 compared to 2014, amounting to 39,937 GWh.
The distribution of Edegel’s electricity sales by customer segment in Peru is shown in the following table:
EDEGEL’S ELECTRICITY SALES PER CUSTOMER SEGMENT (GWh)
| | | | | | | | | | | | | | | | | | | | | | | | |
| | | Year ended December 31, | |
| | | 2015 | | | 2014 | | | 2013 | |
| | | Sales | | | % of Sales
Volume | | | Sales | | | % of Sales
Volume | | | Sales | | | % of Sales
Volume | |
Contracted sales(1) | | | 7,971 | | | | 92.3 | | | | 8,719 | | | | 93.6 | | | | 7,892 | | | | 88.6 | |
Non-contracted sales | | | 662 | | | | 7.7 | | | | 601 | | | | 6.4 | | | | 1,011 | | | | 11.4 | |
| | | | | | | | | | | | | | | | | | | | | | | | |
Total electricity sales | | | 8,633 | | | | 100 | | | | 9,320 | | | | 100 | | | | 8,903 | | | | 100 | |
| | | | | | | | | | | | | | | | | | | | | | | | |
| (1) | Includes sales to distribution companies without contracts. |
39
Edegel’s electricity sales decreased by 7.4% in 2015 compared to 2014, mainly due to reduced mining activities by one of Edegel’s principal customers, resulting in reduced energy consumption. In 2015, sales to unregulated customers represented 43.2% of Edegel’s total contracted sales. During 2015, Edegel had nine regulated customers and seventeen unregulated customers.
For the year ended December 31, 2015. Edegel’s principal distribution customers were (ordered alphabetically): Edelnor (our subsidiary), ElectroSur, Electrosureste, Hidrandina, Luz del Sur and Seal. Edegel’s principal unregulated customers were (ordered alphabetically): Compañia Minera Casapalca, Creditex, Hudbay Perú, Minera Chinalco Perú, Minera La Arena and Refinería Cajamarquilla.
EEPSA has five long term sale and purchase agreements for “wet” gas, which is mixed with other hydrocarbons, under which EEPSA purchases “wet” gas and through a process obtains “dry” gas that is used for electric generation at its Malacas Power Plant; and is sold to the Talara refinery (owned by Petroperu, the Peruvian NOC) through a supply agreement. To satisfy its dry gas needs, EEPSA signed an agreement with Pariñas Processing Plant, which allows EEPSA to convert wet gas into dry gas, and also recover natural gas liquids, which are shared with Pariñas Processing Plant.
In 2015, EEPSA had contracts with seven regulated customers and four unregulated customers. Sales to regulated customers represented 90.2% of EEPSA’s total contracted sales.
The distribution of EEPSA’s electricity sales by customer segment is shown in the following table:
EEPSA’s ELECTRICITY SALES PER CUSTOMER SEGMENT (GWh)
| | | | | | | | | | | | | | | | | | | | | | | | |
| | | Year ended December 31, | |
| | | 2015 | | | 2014 | | | 2013(1) | |
| | | Sales | | | % of Sales
Volume | | | Sales | | | % of Sales
Volume | | | Sales | | | % of Sales
Volume | |
Contracted sales(2) | | | 597 | | | | 91.8 | | | | 498 | | | | 83.6 | | | | 594 | | | | 100 | |
Non-contracted sales | | | 54 | | | | 8.2 | | | | 98 | | | | 16.4 | | | | — | | | | — | |
| | | | | | | | | | | | | | | | | | | | | | | | |
Total electricity sales | | | 650 | | | | 100 | | | | 596 | | | | 100 | | | | 594 | | | | 100 | |
| | | | | | | | | | | | | | | | | | | | | | | | |
| (1) | Sales from April 2013 to December 2013. |
| (2) | Includes sales to distribution companies without contracts. |
For the year ended December 31, 2015, EEPSA’s principal distribution customers were (ordered alphabetically): Edelnor and Luz del Sur.
Our most significant competitors in Peru are: Enersur (GDF-Suez group, with an installed capacity of 1,248 MW), Electroperú (a state-owned competitor, with an installed capacity of 911 MW), Kallpa (Inkia Energy group, with an installed capacity of 1,060 MW), Egenor (Duke Energy group, with an installed capacity of 622 MW) and Fenix (Fenix Power Peru group, with an installed capacity of 570 MW).
Electricity Transmission Business
CIEN
Our electricity transmission business is conducted through CIEN, a wholly-owned subsidiary of Enel Brasil, in which we hold an 84.4% economic interest. CIEN consolidates CTM and TESA, which operate the Argentine side of the interconnection line between Argentina and Brazil. In 2015, CIEN represented 1.0% of our operating revenues and 2.4% of our operating income. Since April 2011, CIEN has been recognized by the local authority as a “regulatory asset” and as part of the Brazilian grid, and therefore, it is entitled to receive fixed payments called Permitted Annual Compensation (RAP).
CIEN enables the energy integration of Mercosur, as well as the import and export of electricity between Argentina, Brazil and Uruguay. It has two transmission lines covering a distance of 500 kilometers between Rincón in Argentina and the Santa Catarina substation in Brazil, with a total installed capacity of 2,100 MW. CIEN operates each transmission line under a 30-year concession granted by the Brazilian government that will be in force until 2020 and 2022 respectively. Its subsidiaries, CTM and TESA, have concessions for 87 and 85 years granted by the Argentine government, respectively, and both expire in 2087.
40
Electricity Distribution Business
Our electricity distribution business is conducted in Argentina through Edesur, in Brazil through Ampla and Coelce, in Colombia through Codensa, and in Peru through Edelnor. For the year ended December 31, 2015, electricity sales increased by 1.6% compared to 2014, totaling 62,838 GWh. For more information on energy sales by our distribution subsidiaries for the last five fiscal years, see “Item 3. Key Information — A. Selected Financial Data”.
Edesur (Argentina)
Edesur is one of the largest electricity distribution companies in Argentina in terms of energy purchases. Edesur operates in a concession area of 3,309 square kilometers in the south-central part of the Buenos Aires metropolitan area, serving approximately 2.5 million customers, under a 95-year concession granted by the Argentine government that will be in force until 2087. Our economic interest in Edesur is 71.6%. As of December 31, 2015, residential, commercial, industrial and other customers, primarily public and municipal, represented 45%, 24%, 8% and 23%, respectively, of Edesur’s total energy sales. In 2015, its energy losses were 12.3%, compared to 10.8% in 2014.
The following table sets forth Edesur’s principal operating data for each of the periods indicated:
| | | | | | | | | | | | |
| | | Year ended December 31, | |
| | | 2015 | | | 2014 | | | 2013 | |
Electricity sales (GWh) | | | 18,492 | | | | 17,972 | | | | 18,137 | |
Residential | | | 8,284 | | | | 7,907 | | | | 7,845 | |
Commercial | | | 4,489 | | | | 4,485 | | | | 4,432 | |
Industrial | | | 1,393 | | | | 1,363 | | | | 1,420 | |
Other customers(1) | | | 4,326 | | | | 4,217 | | | | 4,440 | |
Number of customers (thousands) | | | 2,479 | | | | 2,464 | | | | 2,444 | |
Residential | | | 2,174 | | | | 2,160 | | | | 2,140 | |
Commercial | | | 273 | | | | 270 | | | | 270 | |
Industrial | | | 21 | | | | 23 | | | | 23 | |
Other customers | | | 11 | | | | 11 | | | | 11 | |
Energy purchased (GWh)(2) | | | 21,084 | | | | 20,174 | | | | 20,334 | |
Total energy losses (%)(3) | | | 12.3% | | | | 10.8% | | | | 10.8% | |
| (1) | The figures for other customers include tolls. |
| (2) | Edesur purchased all of its energy from CAMMESA, the governmental agency that regulates and acts as an intermediary between generation and distribution. |
| (3) | Energy losses are calculated as the percent difference between energy purchased and energy sold (GWh) within a given period. Losses in distribution arise from illegally tapped lines as well as technical losses. |
For the year ended December 31, 2015, Edesur’s principal unregulated customers were (ordered alphabetically): Abbott Laboratories Argentina S.A., American Express, Arcor, Cencosud S.A., Gas Lanus S.A., Jumbo Retail S.A., Metalcris S.A., Petrobras Energía S.A., Pfizer S.R.L., Pluspetrol S.A., Praxair Argentina S.R.L, Telefónica Argentina S.A and Walmart Argentina.
In 2015, the collection rate from customers was 99.26%, compared to 99.98%, in 2014.
During 2015, Edesur maintained the distribution of energy in Buenos Aires and complied with the year’s investment plan that was presented to the Argentine government. This decision was made despite the delay in the Integral Tariff Revision (“RTI” in its Spanish acronym) process carried out by the Electricity National Regulatory Agency (“ENRE” in its Spanish acronym), that will enable an increase in its tariffs due to higher costs in its services provided and, therefore, ensure the viability of Edesur’s operations. During 2014, Edesur continued its negotiations with the Argentine government to ensure compliance with the “Agreement for Renegotiation of Concession Contract,” which includes the adjustment of Edesur income in proportion to costs and the definition of a fair and reasonable fee in an RTI process through the formulation of an integral agreement or equivalent alternative, that would meet these objectives and, in addition, ensure Edesur investments and operations for 2014 and 2015.
The Argentine Secretary of Energy, through Resolution No. 32/2015 (enacted on March 13, 2015), decided to approve a temporary revenue increase for Edesur retroactively effective from February 1, 2015. The additional revenue can only be used to pay for the energy it acquires from the electricity market, wages and supplies of goods and services. Like the PUREE funds, funds from the application of Resolution No. 32/2015 are recognized and considered as part of Edesur’s income. The revenue increase is due to the difference between a theoretical rate schedule and the current rate schedule for each category of users, according to calculations by ENRE, in order to not move the rate but instead it will be covered by fund transfers from the CAMMESA in order to compensate for the delay in the application of the RTI, which still does not have a completion date set.
41
On June 29, 2015, the Argentine Secretary of Energy issued Note No. 1,208 which instructed CAMMESA how to calculate the debts accrued through January 31, 2015 that Edesur has with the Wholesale Electricity Market (MEM), and how to calculate compensation claims arising from the application of MMC. As a result, approximately Ch$ 27 billion of net income of was recognized in 2015.
On June 24, 2014, the Argentine Secretary of Energy, through Note No. 4012/2014, authorized CAMMESA to sign a contract with Edesur and Edenor S.A. to fund higher salary costs due to the application of Resolution ST No. 836/2014.
For further details regarding regulation, see “Item 4. Information on the Company— B. Business Overview — Electricity Industry Regulatory Framework Development.” For further details regarding the financial impact, see “Item 5. Operating and Financial Review and Prospects— A. Operating Results — 2. Analysis of Results of Operations for the years ended December 31, 2015 and 2014 — Distribution Business: Revenues.”
Ampla (Brazil)
Ampla is the second largest electricity distribution company in the State of Rio de Janeiro, Brazil in terms of number of customers and annual energy sales. As of December 31, 2015, we held a 92% economic interest in Ampla. Ampla is mainly engaged in the distribution of electricity to 66 municipalities located in the State of Rio de Janeiro, and serves almost 3 million customers in a concession area of 32,615 square kilometers, with an estimated population of 8.0 million. Ampla operates under a 30-year concession granted by the Brazilian government and it will remain in force until December 2026. As of December 31, 2015, residential, commercial, industrial and other customers represented 41%, 19%, 7% and 33%; respectively of Ampla’s total sales of 11,547 GWh (self supply and energy losses are excluded). In 2015, its energy losses were 20.9%, compared to 20.3% in 2014.
The following table sets forth Ampla’s principal operating data for each of the periods indicated:
| | | | | | | | | | | | |
| | | Year ended December 31, | |
| | | 2015 | | | 2014 | | | 2013 | |
Electricity sales (GWh) | | | 11,547 | | | | 11,678 | | | | 11,025 | |
Residential | | | 4,715 | | | | 4,754 | | | | 4,512 | |
Commercial | | | 2,187 | | | | 2,232 | | | | 2,133 | |
Industrial | | | 872 | | | | 970 | | | | 918 | |
Other customers(1) | | | 3,773 | | | | 3,721 | | | | 3,462 | |
Number of customers (thousands) | | | 2,997 | | | | 2,875 | | | | 2,801 | |
Residential | | | 2,697 | | | | 2,607 | | | | 2,536 | |
Commercial | | | 175 | | | | 172 | | | | 171 | |
Industrial | | | 5 | | | | 5 | | | | 5 | |
Other customers | | | 120 | | | | 92 | | | | 90 | |
Energy purchased (GWh)(2) | | | 14,591 | | | | 14,647 | | | | 13,770 | |
Total energy losses (%)(3) | | | 20.9% | | | | 20.3% | | | | 19.9% | |
| (1) | The data for other customers includes tolls. |
| (2) | During 2015, 0.5% of the electricity purchased was acquired from Cachoeira Dourada, 0.4% in 2014 and 0.4% in 2013. |
| (3) | Energy losses are calculated as the percent difference between energy purchased and energy sold (GWh) within a given period. Losses in distribution arise from illegally tapped lines as well as technical losses. |
In 2015, the collection rate from customers was 97.5%, compared to 98.8% in 2014.
For the year ended December 31, 2015, Ampla’s main unregulated customers were (ordered alphabetically): Anglo Ferrous Minas-Rio Mineral, Braskem Petroquimica, Lafarge Brasil, LLX Minas-Rio Logistica, MAN Latin America, Michelin, Petrobras, Peugeot, Rio Polimeros S.A. and Votorantim.
Under Concession Contract No. 05/1996, which regulates the electricity distribution in Ampla’s concession area, Ampla is subject to a comprehensive tariff review by ANEEL every four years. Ampla underwent its third comprehensive tariff review effective as of March 15, 2014. For this review, ANEEL reduced the Weighted Average Cost of Capital (“WACC”) from 9.95% to 7.50%, net of taxes, which affected income and reduced the recognized operating costs. These modifications resulted in an average tariff reduction of 2.6% effective as of March 2014. This result was detailed in Technical Note No. 12/2014-SRE/ANEEL.
42
On March 10, 2015, ANEEL approved Ampla’s new tariff, which became effective on March 15, 2015. The average increase perceived by consumers was 42.2%. Low voltage customers had an average increase of 36.4% and medium voltage customers increased by an average of 56.2%. The main causes of these adjustments are the increased CDE (Energy Development Account surcharge), which represents approximately 30% of the 42.2% average increase. Price increases for purchased electricity represented approximately 10% of the total increase.
For further details regarding regulation, see “Item 4. Information on the Company— B. Business Overview — Electricity Industry Regulatory Framework Development.” For further details regarding the financial impact, see “Item 5. Operating and Financial Review and Prospects— A. Operating Results — 2. Analysis of Results of Operations for the years ended December 31, 2015 and 2014 — Distribution Business: Revenues.”
Coelce (Brazil)
Coelce is the sole electricity distributor of the State of Ceará, located in northeastern Brazil. Coelce serves over 3.8 million customers within a concession area of 148,825 square kilometers, under a 30-year concession granted by the Brazilian government, which will remain in force until May 2028. Residential, commercial, industrial and other customers represented 35%, 20%, 21% and 24%, respectively, of Coelce’s total energy sales. In 2015, its energy losses were 13.7%, compared to 12.8% in 2014.
The following table sets forth Coelce’s principal operating data for each of the periods indicated:
| | | | | | | | | | | | |
| | | Year ended December 31, | |
| | | 2015 | | | 2014 | | | 2013 | |
Electricity sales (GWh) | | | 11,229 | | | | 11,165 | | | | 10,705 | |
Residential | | | 3,959 | | | | 3,940 | | | | 3,703 | |
Commercial | | | 2,148 | | | | 2,076 | | | | 1,951 | |
Industrial | | | 1,196 | | | | 1,206 | | | | 1,169 | |
Other customers(1) | | | 3,925 | | | | 3,942 | | | | 3,881 | |
Number of customers (thousands) | | | 3,758 | | | | 3,625 | | | | 3,500 | |
Residential | | | 2,865 | | | | 2,802 | | | | 2,720 | |
Commercial | | | 232 | | | | 230 | | | | 223 | |
Industrial | | | 7 | | | | 7 | | | | 7 | |
Other customers | | | 654 | | | | 587 | | | | 550 | |
Energy purchased (GWh) | | | 13,016 | | | | 12,806 | | | | 12,246 | |
Total energy losses (%)(2) | | | 13.7% | | | | 12.8% | | | | 12.6% | |
| (1) | The data for other customers includes tolls. During 2015, 23% of the electricity purchased was acquired from Fortaleza, 21% in 2014 and 22% in 2013. |
| (2) | Energy losses are calculated as the percent difference between energy purchased and energy sold (GWh) within a given period. Losses in distribution arise from illegally tapped lines as well as technical losses. |
For the year ended December 31, 2015, Coelce’s main unregulated customers were (ordered alphabetically): Durametal, Esmaltec, Gerdau, Grandene, Lojas, Mecesa, Norsa Refrigerante, North Shopping, Petrobras, Vicunha Textil and Votorantim.
In 2015, the collection rate from customers was 97.5% compared to 98.2% in 2014.
On February 27, 2015, ANEEL approved the Extraordinary Tariff Review for 58 distribution companies, including Coelce. The average increase perceived by consumers was 23.4%. The review amortized increased CDE fees, rising energy costs and the energy auctions of 2014 and 2015. In the case of Coelce, final consumer’s tariffs, on average, increased 10.3%, primarily due to the increased CDE fees and increased energy costs. The average effect to be perceived by high voltage consumers was 12.9% and the average effect perceived by low voltage consumers was 9.1%.
On April 4, 2015, ANEEL provisionally approved Coelce’s tariff review which should result in positive financial. According to ANEEL’s decision, the result will be provisional until the final methodology for tariff revisions fourth cycle is defined. The application of the new methodology will be considered in the 2016 tariff adjustment process.
The most important points of the tariff review are the recognition of higher operating costs recognition, the approval of the Regulatory Remuneration Base and the change of WACC. Including the tariff adjustment that occurred in March 2015, the average rate increased to be perceived by consumers should be 11.7%. The new rates have been in effect since April 22, 2015.
43
For further details regarding regulation, see “Item 4. Information on the Company— B. Business Overview — Electricity Industry Regulatory Framework Development.” For further details regarding the financial impact, see “Item 5. Operating and Financial Review and Prospects— A. Operating Results — 2. Analysis of Results of Operations for the years ended December 31, 2015 and 2014 — Distribution Business: Revenues.”
Codensa (Colombia)
Codensa is a Colombian electricity distribution company that serves a concession area of 14,456 square kilometers in Bogotá and other 96 municipalities of the provinces of Cundinamarca, Tolima and Boyacá, with approximately 2.9 million customers. As of December 31, 2015, we held a 48.4% economic interest in Codensa, which we control through Chilectra Américas and consolidate pursuant the ownership of 57.2% of Codensa’s voting rights along with a shareholder agreement. For more information regarding the control and consolidation of Codensa, see “Item 5. Operating and Financial Review and Prospects — A. Operating Results. — 1. Discussion of Main Factors Affecting Operating Results and Financial Condition of the Company.”
Under Colombian law, since no concessions are granted, an administrative authorization is required to provide the distribution service. In the case of Codensa, the authorization is of indefinite duration.
Since 2001, Codensa only services regulated customers. The unregulated market is serviced directly by our generation company, Emgesa, with the exception of the public lighting in Bogotá. In 2015, its energy losses were 7.3%, compared to 7.2% in 2014.
The following table sets forth Codensa’s principal operating data for each of the periods indicated:
| | | | | | | | | | | | |
| | | Year ended December 31, | |
| | | 2015 | | | 2014 | | | 2013 | |
Electricity sales (GWh) | | | 13,946 | | | | 13,660 | | | | 13,332 | |
Residential | | | 4,665 | | | | 4,575 | | | | 4,491 | |
Commercial | | | 2,280 | | | | 2,213 | | | | 2,152 | |
Industrial | | | 1,011 | | | | 931 | | | | 862 | |
Other customers(1) | | | 5,990 | | | | 5,941 | | | | 5,827 | |
Number of customers (thousands) | | | 2,865 | | | | 2,772 | | | | 2,687 | |
Residential | | | 2,543 | | | | 2,459 | | | | 2,381 | |
Commercial | | | 273 | | | | 265 | | | | 259 | |
Industrial | | | 45 | | | | 44 | | | | 44 | |
Other customers | | | 4 | | | | 4 | | | | 3 | |
Energy purchased (GWh)(2) | | | 15,039 | | | | 14,726 | | | | 14,351 | |
Total energy losses (%)(3) | | | 7.3% | | | | 7.2% | | | | 7.0% | |
| (1) | The data for other customers includes tolls. |
| (2) | In 2015, 20% of the electricity purchased was acquired from Emgesa, 28% in 2014 and 41% in 2013. |
| (3) | Energy losses are calculated as the percent difference between energy purchased and energy sold (GWh) within a given period. Losses in distribution arise from illegally tapped lines as well as technical losses. |
For the year ended December 31, 2015, Codensa’s only unregulated customer was Alumbrado Público Distrito Capital Bogotá.
In 2015, the collection rate from customers was 100.5% compared to 100.9% in 2014. Codensa’s ordinary tariff review is currently in progress and it is expected to conclude in 2016.
Edelnor (Peru)
Edelnor is a Peruvian electricity distribution company that operates in a concession area of 1,518 square kilometers under an indefinite concession granted by the Peruvian government. As of December 31, 2015, we held a 75.5% economic interest in Edelnor. It has an exclusive concession to distribute electricity in the northern part of the Lima metropolitan area, as well as some provinces in the Lima region, including Huaral, Huaura, Barranca and Oyón, and the adjacent province of Callao. As of December 31, 2015, Edelnor distributed electricity to approximately 1.3 million customers, an increase of 3.4% compared to 2014.
As of December 31, 2015, Edelnor had total energy sales of 7,624 GWh, an increase of 3.8% year over year. In 2015, its energy losses were 8.3%, compared to 8.2% in 2014.
44
The following table sets forth Edelnor’s principal operating data for each of the periods indicated:
| | | | | | | | | | | | |
| | | Year ended December 31, | |
| | | 2015 | | | 2014 | | | 2013 | |
Electricity sales (GWh) | | | 7,624 | | | | 7,338 | | | | 7,030 | |
Residential | | | 2,839 | | | | 2,719 | | | | 2,634 | |
Commercial | | | 1,688 | | | | 1,641 | | | | 1,582 | |
Industrial | | | 1,213 | | | | 1,220 | | | | 1,239 | |
Other customers(1) | | | 1,884 | | | | 1,759 | | | | 1,575 | |
Number of customers (thousands) | | | 1,337 | | | | 1,293 | | | | 1,255 | |
Residential | | | 1,266 | | | | 1,223 | | | | 1,185 | |
Commercial | | | 42 | | | | 42 | | | | 41 | |
Industrial | | | 1 | | | | 1 | | | | 1 | |
Other customers | | | 27 | | | | 27 | | | | 28 | |
Energy purchased (GWh)(2) | | | 8,311 | | | | 7,995 | | | | 7,653 | |
Total energy losses (%)(3) | | | 8.3% | | | | 8.2% | | | | 8.0% | |
| (1) | The data for other customers includes tolls. |
| (2) | In 2015, 26% of the electricity purchased was acquired from Edegel, Chinango and EEPSA. In 2014, 27% of the electricity purchased was acquired from Edegel and EEPSA, and 37% in 2013. |
| (3) | Energy losses are calculated as the percent difference between energy purchased and energy sold (GWh) within a given period. Losses in distribution arise from illegally tapped lines as well as technical losses. |
For the year ended December 31, 2015, Edelnor’s primary unregulated customers are (ordered alphabetically): Alicorp, APM Terminals, Corporación Celima, Corporación JR Lindley, DP World, Fabrica Peruana de Eternit, Goodyear Peru, G&M Ferrovias S.A., Indeco, Lima Airport Partners, Molitalia and Refineria La Pampilla.
In 2015, the collection rate from customers was 98.7% compared to 99.8% in 2014.
On October 16, 2013, Osinergmin revised Edelnor’s distribution tariff rates for the four year period from November 2013 to October 2017. The new tariff rate was an increase of 1.2% compared to the previous period that ended in October 2013. The VAD will not increase until the new tariff becomes effective in November 2017.
Edelnor has entered into short-term contracts to supply power to the regulated and unregulated markets from 2015 to 2020. In addition, Edelnor has also entered into long-term power supply contracts for the period from 2015 to 2027.
On June 18, 2014, Resolution No. 120-2014-OS / CD (which was enacted on April 14, 2014) was amended, and established the tariff rate and compensation for secondary and complementary transmission systems for the period from May 1, 2014 to April 30, 2015.
Non-Electricity Businesses
Servicios Informáticos e Inmobiliarios Ltda. (Chile)
Servicios Informáticos e Inmobiliarios Ltda. (“SIEI”), a wholly-owned subsidiary, is a business consultancy in technology, information and computer science, telecommunications, data transmission and develops real estate projects in Chile. SIEI was formed following the merger of ICT Servicios Informáticos Ltda. with Inmobiliaria Manso de Velasco Ltda.
45
ELECTRICITY INDUSTRY REGULATORY FRAMEWORK
The following chart shows a summary of the main characteristics of the electricity regulatory framework by business segment in the countries in which operate.
| | | | | | | | | | |
| | | | | |
| | | | | Argentina | | Brazil | | Peru | | Colombia |
| | | | | | |
Gx | | Unregulated Market | | Regulated remuneration scheme (Resolution No. 482/2015) | | Spot markets with prices defined by the regulator | | Spot markets with costs audited by the regulator | | Spot market with auctioned cost (Price-offered) |
| | Regulated | | Seasonal Price | | Auction Thermal - 20 years / Hydro - 30 years | | Auction up to 20 years and node price | | Auction 3/5 years |
| | Capacity | | Contribution peak demand | | -- | | Income based on contributions during peak demand | | Firm energy contribution (energy auctions for at least 20 years) |
| | | |
| Tx | | Features | | Public - Open Access - Regulated Tariff Monopoly Regime for Transmission System Operators (“TSOs”) |
| | | | | |
| Dx | | Law | | Concession contract | | Administrative Concession (indefinite) | | Authorization Operation Zone |
| | Expansion | | 95 years | | 30 years | | Undefined | | |
| | Tariff review | | 5 years | | 4/5 years | | 4 years | | 5 years |
| | | | | | |
| Cx | | Unregulated customers | | > 0.03 MW | | > 0.5 MW to 3MW/ NCRE >0.5MW/conventional | | > 0.2 to 2.5 MW optional >2.5 MW mandatory | | > 0.1 MW |
| | Unregulated market (%) | | ≈ 20% | | ≈ 25% | | ≈ 45% | | ≈ 30% |
| | | | | | |
| Gx: Generation | | Tx: Transmission | | Dx: Distribution | | Cx: Trading |
Argentina
Industry Overview
Industry Structure
In the Argentine Wholesale Electricity Market (“Argentine MEM” in its Spanish acronym) there are four categories of local agents (generators, transmitters, distributors, and large customers) and two external agents (traders of generation and traders of demand) who are allowed to buy and sell electricity as well as related products.
46
The following chart shows the relationships among the various participants in the Argentine MEM:
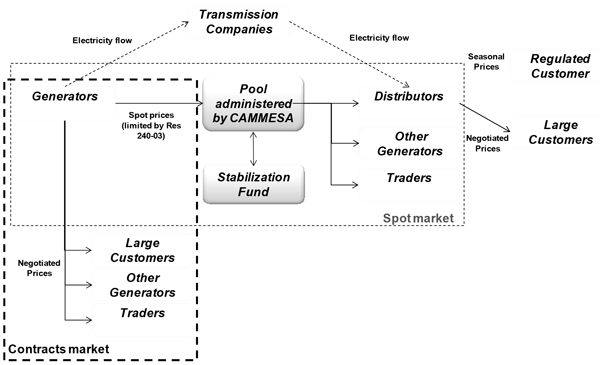
The generation sector was organized on a competitive basis until March 2013, with independent generating companies selling their output in the Argentine MEM spot market, through private contracts to purchasers in the Argentine MEM contract market or to CAMMESA, through special transactions.
On March 26, 2013, the Argentine Secretary of Energy published Resolution No. 95/2013 that set out a regulated remuneration scheme for power generation activity beginning retroactively from February 2013. The main features of the Resolution are as follows:
| | ● | | It applies to generators, co-generators and self-generators, except for power plants entered into operation after 2005, nuclear generation and cross-border hydro generation. |
| | ● | | CAMMESA, the market operator, became the single buyer/seller for the fuel needed for plant operations. This implies that market agents are not allowed to trade fuels. |
| | ● | | Free bilateral trading is suspended: large customers will have to buy electricity directly from CAMMESA (no change of supply for residential customers, who are still served by distribution companies). |
| | ● | | Generators began to receive a regulated remuneration, which should cover fixed and variable costs plus additional remuneration. |
The transmission sector is regarded as a public service, operating under monopoly conditions and is comprised of several companies to whom the Argentine government grants concessions. One concessionaire operates and maintains the highest voltage facilities and eight concessionaires operate and maintain high and medium voltage facilities, to which generation plants, distribution systems and large customers are connected. The international interconnected transmission systems also require concessions granted by the Argentine Secretary of Energy. Transmission companies are authorized to charge different tolls for their services.
Distribution is regarded as a public service, operating under monopoly conditions, and is comprised of companies that have been granted concessions by the Argentine government. Distribution companies have the obligation to make electricity available to end customers within a specific concession area, regardless of whether the customer has a contract with the distributor or directly with a generator. Accordingly, these companies have regulated tariffs and are subject to quality service specifications. Distribution companies may obtain electricity on the Argentine MEM’s spot market, at a price called “seasonal price”, which is defined by the Argentine Secretary of Energy as the cap for the costs of electricity bought by distributors that can be passed through to regulated customers. There are two electricity distribution areas subject to federal concessions. The concessionaires are Edesur (one of our
47
subsidiaries) and Edenor (an unrelated company), both of which are located in the greater Buenos Aires area. The local distribution areas are subject to concessions granted by the provincial or municipal authorities. However, all distribution companies acting on the Argentine MEM must operate under its rules.
Among customers, there are the regulated customers that are supplied by distributors at regulated tariffs and the large customers, who are classified into three categories: major large customers, minor large customers and private large customers. Each of these categories has different requirements with respect to purchases of their energy demand. For example, major large customers are required to purchase 50% of their demand through supply contracts and the remainder in the spot market, while minor large customers and private large customers are required to purchase all of their demand through supply contracts. Large customers participate in CAMMESA by appointing two directors and two acting directors through the Argentine Association of Electric Power for Large Customers. Since 2013, due to Resolution No. 95/2013, large customers buy electricity directly from CAMMESA, following the expiration of their bilateral contracts directly with generators.
There is one interconnected system, the Argentine NIS, and smaller systems that provide electricity to specific areas. According to the Argentine National Institute of Statistics and Census (Federal Planning Ministry provisional data of 2014), 99.4% of the energy required by the country is supplied by the Argentine NIS and only 0.6% is supplied by isolated systems.
Principal Regulatory Authorities
The Argentine Ministry of Energy and Mining, is primarily responsible for studying and analyzing the behavior of energy markets, preparing the strategic planning with respect to electricity, hydrocarbons and other fuels, promoting policies to increase competition and improve efficiency in the assignment of resources, leading actions for applying the sector policy, orienting new operators to the general interest, respecting the rational exploitation of the resources and the preservation of the environment.
The Argentine National Regulatory Authority for the Energy Sector (“ENRE” in its Spanish acronym) carries out the measures necessary for meeting national policy objectives with respect to the generation, transmission and distribution of electricity. Its principal objectives are to: protect the rights of customers; promote competitiveness in production; encourage investments that assure long-term supply; promote free access, non-discrimination and the generalized use of the transmission and distribution services; regulate transmission and distribution services to ensure fair and reasonable tariffs, and encourage private investment in production, transmission, and distribution, ensuring the competitiveness of the markets where possible. ENRE directly controls the management of Edenor and Edesur as distribution companies operating under a national concession. In the case of Edesur, on July 12, 2012, ENRE appointed an overseer, originally for 45 business days, a term that was extended for successive periods of the same duration, in order to monitor and actively control management of Edesur. ENRE Resolution No.243/2013 increased the term from 45 to 90 business days and it has been extended by successive 90 day-terms and may be extended further.
The principal functions of the CAMMESA are the coordination of dispatch operations, the establishment of wholesale prices and the administration of economic transactions made through the Argentine NIS. It is also responsible for executing the economic dispatch through economic considerations and rationality in the administration of energy resources, coordinating the centralized operation of the Argentine NIS to guarantee its security and quality, and managing the Argentine MEM, in order to ensure transparency through the participation of all the players involved and with respect to the respective regulations.
The principal functions of the Argentine Federal Electricity Council are the following: (i) managing specific funds for the electricity sector and (ii) advising the national executive authority and the provincial governments with respect to the electricity industry, the priorities in performing studies and works, concessions and authorizations, and prices and tariffs in the electricity sector. It also provides advice regarding modifications resulting from legislation referring to the electricity industry.
The Federal Environmental Council is an institutional branch of the federal government empowered to address environmental problems and solutions in Argentina. It has legal authority to coordinate the development of environmental policy among member states. The member states adopt regulations or rules that are issued by the Argentine Assembly, which are issued as resolutions.
The Ministry of Environment and Sustainable Development, a member of the Federal Environment Council, assists the Chief of Cabinet of Ministers in the implementation of environmental measures and articulates its insertion in the ministries and other areas of the national public administration. It seeks to foster rational exploitation and sovereignty over Argentina’s natural resources with consideration to fairness and social inclusion. The Secretary is involved in environmental planning and preservation, planning and implementation of national environmental management in the implementation of sustainable development, rational use of non-renewable resources and the diagnosis of environmental issues in coordination with different branches of the Argentine government.
48
The Electricity Law
General
The Argentine electricity industry was originally developed by private companies. As a result of service problems, the Argentine government began to intervene in the sector in the 1950s and initiated a nationalization process. Law 15,336/60 was passed to organize the sector and establish the federal legal framework for the start of major transmission and generation projects. Many government-owned corporations were created within this framework in order to carry out various hydroelectric and nuclear projects.
As a result of the electricity shortage in 1989, the following laws were passed starting in 1990: Law 23,696 (“State Reform”), Law 23,697 (“Economic Emergency”) and Law 24,065 (“Electricity Framework”). The objective of the new legislation was essentially to replace the vertically-integrated system based on a centrally-planned state monopoly with a competitive system based on the market and indicative planning.
Regulatory Developments: The Industry After the Public Emergency Law
Law 25,561, the Public Emergency Law, was enacted in 2002 to manage the economic crisis that began that year. It forced the renegotiation of public service contracts (such as electricity transmission and distribution concession contracts) and imposed the conversion of U.S. dollar denominated obligations into Argentine pesos at a pegged rate of Ar$ 1.00 per US$ 1.00. The mandatory conversion of transmission and distribution tariffs from U.S. dollars to Argentine pesos at this pegged rate (compared to the market exchange rate at that time of approximately Ar$ 3.00 per US$ 1.00) and the regulatory measures that cap and reduce the spot and seasonal prices hindered the pass-through of generation variable costs in the tariffs to end customers.
The Public Emergency Law also empowered the Argentine government to implement additional monetary, financial and foreign exchange measures to overcome the economic crisis in the medium term. These measures have been periodically extended. Most recently, Law 27,200 enacted on November 2015, further extended the measures until December 31, 2017.
The Argentine Secretary of Energy introduced several regulatory measures aimed at correcting the effects of the devaluation into the Argentine MEM’s costs and prices and to reduce the price paid by the end customers.
Resolution No. 240/2003 changed the method for calculating spot prices by decoupling such prices from the marginal cost of operation. Prior to this resolution, spot prices in the Argentine MEM were typically fixed by units operating with natural gas during the warm season (from September through April) and units operating with liquid fuel/diesel in the winter (May through August). Due to restrictions on natural gas supply, winter prices were higher and affected by the price of imported fuels priced in U.S. dollars. Resolution No. 240/2003 sought to avoid price indexation pegged to the U.S. dollar and, although generation dispatch is still based on actual fuels used, the calculation of the spot price under the resolution is defined as if all dispatched generation units did not have the existing restrictions on natural gas supply. In addition, water value is not considered if its opportunity cost is higher than the cost of generating with natural gas. The resolution also set a cap on the spot price at Ar$ 120 per MWh, which was valid until the adoption of Resolution No. 95/2013 (March 2013). The real variable costs of thermal units burning liquid fuels were paid by CAMMESA through the Transitory Additional Dispatch Cost (Sobrecosto transitorio de despacho) plus a margin of Ar$ 2.5 per MWh, according to the Resolutions No. 6,866/2009 and No. 6,169/2010, that came into effect in May 2010. The generators that have adopted Resolution No. 95/2013 are remunerated according to such resolution and later by Resolution No.529/2014 and Resolution No. 482/2015.
The Argentine government has avoided increases in electricity tariffs to end customers and seasonal prices have been maintained substantially fixed in Argentine pesos. In contrast, gas producers have received price revisions by the authority and thereby were able to recover part of the value that they lost as a result of the 2002 devaluation of the Argentine peso against the U.S. dollar.
Under this system, CAMMESA sells energy to distributors who pay seasonal prices and buys energy from generators at spot prices that recognize rising gas prices at a contractual price defined by the instructions of the Argentine Secretary of Energy. To overcome this imbalance, the Argentine Secretary of Energy — through Resolution No. 406/2003 — only allows payments to generators for amounts collected from the purchasers in the spot market. This resolution set a priority of payment for different services, such as capacity payment, fuel cost and energy sales margin, among others. As a result, CAMMESA accumulates debt with generators while the system gives a distorted price incentive to the market that encourages electricity consumption but discourages investments to satisfy the growth in electricity demand, including investments in transmission capacity. Additionally, electricity generators experience a reduction of estimated income from contract prices because of the reduction of the spot price. However, since 2013, generators that have adopted Resolution No. 95/2013 collect most of their income through CAMMESA.
The Argentine government had intentions to gradually reverse its decision to freeze distribution tariffs. During 2011, various resolutions authorizing the elimination of electricity and natural gas subsidies were issued. However, the subsidy elimination has been applied to only 5% of customers, and has not expanded to other customers. For further details, see “— Sales to Distribution Companies and Certain Regulated Customers” below.
49
In order to enhance the energy supply, the Argentine Secretary of Energy created different schemes to sell “more reliable energy.” Resolution No. 1,281/2006 created the Energy Plus Service Program, which was designed to increase generation capacity in order to meet growth in electricity demand over the “Base Demand,” which was the demand for electricity in 2005.
SE Resolutions No. 220/2007 and 724/2008 gave thermal generators the opportunity to reduce some of the adverse effects of Resolution No. 406/2003 by entering into MEM Supply Commitment Contracts (“CCAM” in its Spanish acronym). Under these resolutions, a thermal generator can perform maintenance or repowering investments to improve the availability of its units and add additional capacity to the system. After authorization, the thermal generator can then sign a CCAM at prices that would permit the recovery of such capital expenditures. Additionally, energy sales through a CCAM receive payment priority compared with spot energy sales under Resolution No. 406/2003. Generators with a CCAM can supply energy to CAMMESA for up to 36 months, renewable only for an additional six-month period.
During 2009, Resolution No. 762/2009 created the National Hydroelectric Program to promote the construction of new hydroelectric plants. The program enables authorized generators to enter into energy supply contracts with CAMMESA for up to 15 years at prices that would allow for the recoupment of their investment.
The Argentine government has adopted several other measures to encourage new investments, including the following: auctions to expand the capacity of natural gas transportation and electricity transmission; the implementation of certain projects for the construction of power plants; the creation of fiduciary funds to finance these expansions; and the awarding of contracts with renewable energy, called the “GENREN program.” For more details, refer to “— Environmental Regulation” below. In addition, Law 26,095/2006 created specific charges that must be paid by end customers, which are used to finance new electricity and gas infrastructure projects. The Argentine government has also enacted regulations to encourage the rational and efficient use of electricity.
Since the implementation of the Electricity Framework, the generation sector has sold the electricity it generates on the wholesale spot market and the private contract market. However, a series of resolutions have been published since 2005 that have permitted the Argentine government and generators to sign contracts for the incorporation of new generation plants and/or maintenance of existing plants to guarantee the availability of the units. On August 24, 2012, the Argentine government informed electricity sector companies that it would reform the Argentine MEM and end the marginal price system of the 1990s. To implement these changes, a Strategic Planning and Coordination Commission of the National Hydrocarbons Investment Plan was created. The principal change in the generation sector is the evolution of the “liberalized marginalist” model into a “Cost Plus” model in accordance with the following “Declared Principles”: (i) any income shall be applied to each company based on the sum of its equity and debt, less redundant assets, (ii) a “Reasonable Profit” would be recognized, and (iii) efficient operating costs would be recognized.
With this new regulatory model, the Argentine government has more information and control over (i) the profitability of companies, (ii) the quality of service, and (iii) the supply of fuels through CAMMESA, which is the sole supplier of fuels (through imports and a contract with YPF S.A., an Argentine company engaged in the exploration, distribution and sale of petroleum and its derivatives). Therefore, while generation companies will not pay for fuel, reducing their operating costs, they are not compensated for this expense in their prices, also reducing part of their revenues and changing the method employed to record revenues and operating costs.
The Argentine Secretary of Energy published Resolution No.95/2013, Resolution No. 529/2014 and Resolution No. 482/2015, in 2013, 2014 and 2015, respectively, which established a new remuneration scheme for all generation companies except for biomass/biogas, hydroelectric plants, nuclear plants and blocks of energy commercialized through energy contracts regulated by the Secretary of Energy. The remuneration scheme is based on average costs for generation companies, in contrast with the previous marginal price system. The new scheme establishes payments for fixed and variable costs depending on the type of technology, whether it be hydroelectric, thermal (gas turbine, steam turbine, combined cycle), internal combustion motor generators, wind, solar photovoltaic, biomass/biogas, as well as the size of the plant (small, medium or large units) separated by their technology and the type of fuel used (natural gas, fuel oil/gas oil, biofuels or coal). The generation companies received payments defined by Resolution No. 95/2013 from February 2013 until January 2014. From February 2014 until January 2015, generation companies received payments according to Resolution No. 529/2014. Since February 2015, generators have received payments according to Resolution No. 482/2015, which increased the amounts in order to compensate them for inflation effects. Resolution No. 482/2015 also includes the recognition of non-recurring maintenance costs for hydroelectric generation plants, and incorporates a new payment to finance new electric project investment.
The impact of Resolution No. 482/2015 has been favorable for generators in 2015 due to higher revenues received than those under Resolution No. 529/2014, leading to greater cash flows. However, the future effect of this regulation will depend on the remuneration values constantly being updated by the Argentine Secretary of Energy.
50
The increases in the payments to generators due to Resolution No. 482/2015, as compared to Resolution No 529/2014 are summarized as follows:
| | ● | | 28% increase in the fixed cost recognition for combined cycle gas turbines, CCGTs and hydroelectric plants. |
| | ● | | 23.5% and 23% increase in the variable cost recognition for CCGTs and hydroelectric plants. |
| | ● | | 25% and 10% increase in the additional remuneration in CCGTs hydroelectric plants, respectively. |
| | ● | | 18% increase in the non-recurring maintenance remuneration in hydroelectric plants, which before with Resolution No. 529/2014 did not receive this payment. |
| | ● | | Create a charge intended to finance new investment projects during 2015-2018, called 2015-2018 FONINVEMEM charge (Cargo Foninvemem 2015-2018). |
On July 2, 2015, El Chocón, Costanera and Dock Sud signed the “Agreement to manage and operate projects, increase thermal generation availability and adjust the remuneration for energy generated”. El Chocón, Costanera, Dock Sud and other companies decided to participate in an 800 MW combined-cycle gas turbine power plant project. The agreement states that the project will be funded with the receivables of the 2015-2018 FONINVEMEM remuneration and with a remuneration trust that was not used for other purposes, which is accrued between February 2015 and December 2018. Both the Secretary of Energy and the generators’ agents reserved the right to terminate this agreement if the respective complementary agreements were not signed within 90 days. To date there has been no further progress in the signing of the complementary agreements. Therefore, the contract is no longer valid.
Part of the additional remuneration set in Resolution No. 95/2013, adjusted by Resolution No. 529/2014 and Resolution No. 482/2015, went into a trust for the execution of works in the electricity sector. Resolution No. 95/2013 states that the payment deposited to the trust is not subject to any deduction or discount, and that the Secretary of Energy will define the mechanism under which the receivables collected by CAMMESA due to Resolution No. 406/2003 will be utilized.
Generators, including our subsidiaries, have the option to invest in new capacity, which can be financed with accruals of the trust. Costanera and El Chocón signed an agreement to install four new 9 MW generating units in Costanera. The investment of approximately US$ 44 million was financed with El Chocón’s Additional Remuneration Trust accruals. Resolution No. 482/2015 incorporated the payment values for this technology, generating units, that was not previously defined. The four generating units are expected to begin their commercial operation during the second quarter of 2016.
On December 16, 2015, the National Executive Branch enacted the Decree No. 134/2015, which declared a state of emergency for the National Electricity sector until December 31, 2017 and instructed the newly-created Ministry of Energy and Mining to prepare and implement a national program to improve the quality and safety of the electrical supply and guarantee that it is provided under the best technical and economic conditions.
FONINVEMEM
Resolution No. 712/2004 created FONINVEMEM, a fund whose purpose is to increase electricity capacity/generation within the Argentine MEM. Pursuant to Resolution No. 406/2003, the Argentine Secretary of Energy decided to pay generators for the spot prices up to the amount available in a stabilization fund, after collecting the funds from the purchasers in the spot market at seasonal prices, which were lower than spot prices for the same period. FONINVEMEM would receive the differences between spot prices and payments to sellers, according to Resolution No. 406/ 2003 from January 1, 2004 to December 31, 2006. CAMMESA was appointed to manage FONINVEMEM.
Pursuant to Resolution No. 1,193/2005, all private generators in the Argentine MEM were called upon to participate in the construction, operation and maintenance of the electricity generation plants to be built with the funds from FONINVEMEM, consisting of two combined-cycle generation plants of approximately 825 MW each.
Due to the insufficient resources to construct the plants, Resolution No. 564/2007 required all of the Argentine MEM’s private sector generators to commit to FONINVEMEM by including the differences between spot prices and payments made pursuant to Resolution No. 406/2003 for an additional period ending December 31, 2007. These plants were completed in 2010 and are powered by natural gas or alternative fuels.
51
The Energy Plus Program
In September 2006, the Argentine Secretary of Energy issued Resolution No. 1,281/2006 in an effort to respond to the continued increase in energy demand following Argentina’s economic recovery after the crisis. With this resolution, the Argentine government started the Energy Plus Program, which (i) create incentives to construct electricity generation plants; and (ii) ensure that energy available in the market is used primarily to service residential customers and industrial and commercial customers with an energy demand is at or below 300 kW as well as those who do not have access to other viable energy alternatives, as its principal objectives.
The resolution also established the price large customers are required to pay for excess demand that are not covered by a contract under the Energy Plus Program, which is equal to the marginal cost of operations. This marginal cost is equal to the generation cost of the last generation unit dispatched to supply the incremental demand for electricity at any given time.
Agreement to Manage and Operate Projects
On November 25, 2010, the Argentine Secretary of Energy signed an agreement with several generation companies, including our subsidiaries, in order to: (i) increase thermoelectric unit availability; (ii) increase energy and capacity prices; and (iii) develop new generation units through the contribution of outstanding debts of CAMMESA owed to the generation companies.
This agreement seeks to accomplish: (i) continue the reform of the Argentine MEM; (ii) enable the incorporation of new generation to meet the increased demand for energy in the Argentine MEM (pursuant to this agreement, our subsidiaries, together with the SADESA Group and Duke, formed a company to develop the combined-cycle project with a capacity of approximately 800 MW at theVuelta de Obligado thermal plant (“VOSA”); (iii) determine a mechanism to pay the generators’ sales settlements with maturity dates to be determined (“LVFVD”), which represent generators’ claims for the period from January 1, 2008 to December 31, 2011. These contributions shall be returned with the interests and converted into U.S. dollars at the date of VOSA’s completion, considering the exchange rate existing as of the date on which the agreement was signed; and (iv) determine the method for recognizing the total remuneration due to generators.
On October 24, 2012, the contract for the turnkey supply and construction of the VOSA was entered into among General Electric Internacional Inc., General Electric Internacional Inc. Argentina branch, and the Argentine Secretary of Energy.
The project also includes the expansion of theRío Coronda 500 kV transformer station which connects to the Argentine NIS, the construction of four new fuel tanks, the construction of a gas pipeline to supply natural gas from the national network, and maintenance of the plant during the single and combined-cycle operation periods for a period of ten years. On December 3, 2014, VOSA started to operate its open cycle, with a capacity of 540 MW. Total installed capacity is expected to reach approximately 800 MW in 2016.
Limits and Restrictions
To preserve competition in the electricity market, participants in the electricity sector are subject to vertical and horizontal restrictions, depending on the market segment in which they operate.
Vertical Integration Restrictions
The vertical integration restrictions apply to companies that intend to participate simultaneously in different sub-sectors of the electricity market. These vertical integration restrictions were imposed by Law 24,065 (“Electricity Framework”), and apply differently to each sub-sector as described below:
Generators
| | ● | | Neither a generation company nor any of its controlled or controlling companies can be an owner, majority shareholder or the controlling entity of a transmission company; and |
| | ● | | Since a distribution company cannot own generation units, a holder of generation units cannot own distribution concessions. However, the shareholders of the electricity generator may own an entity that holds distribution units, either by themselves or through any other entity created with the purpose of owning or controlling distribution units. |
52
Transmitters
| | ● | | Neither a transmission company nor any of its controlled or controlling companies can be an owner, majority shareholder or the controlling company of a generation company; |
| | ● | | Neither a transmission company nor any of its controlled or controlling companies can be an owner, majority shareholder or the controlling company of a distribution company; and |
| | ● | | Transmission companies cannot buy or sell electric energy. |
Distributors
| | ● | | Neither a distribution company nor any of its controlled or controlling companies can be an owner, majority shareholder or the controlling company of a transmission company; and |
| | ● | | A distribution company cannot own generation units. However, the shareholders of an electricity distributor may own generation units either by themselves or through any other entity created with the purpose of owning or controlling generation units. |
Horizontal Integration Restrictions
In addition to the vertical integration restrictions described above, distribution and transmission companies are subject to the following horizontal integration restrictions:
Transmitters
| | ● | | Two or more transmission companies can merge or be part of a same economic group only if they obtain an express approval from the ENRE. Such approval is also necessary when a transmission company intends to acquire shares of another transmission company. Pursuant to the concession agreements that govern the services rendered by private companies operating transmission lines between 132 kW and 140 kW, the service is rendered by the concessionaire on an exclusive basis in certain areas indicated in the concession agreement. Pursuant to the concession agreements that govern the services rendered by the private companies operating the high-tension transmission services of at least 220 kW, such companies must render the service on an exclusive basis and are entitled to render the service throughout the entire country, without territorial limitations. |
Distributors
| | ● | | Two or more distribution companies can merge or be part of a same economic group only if they obtain an express approval from the ENRE. Such approval is necessary when a distribution company intends to acquire shares of another transmission or distribution company; and |
| | ● | | Pursuant to the concession agreements that govern the services rendered by private companies operating distribution networks, the service is rendered by the concessionaire on an exclusive basis in certain areas indicated in the concession agreement. |
Regulation of Generation Companies
Concessions
Hydroelectric generators with a normal generation capacity exceeding 500 kW must obtain a concession to use public water sources. Concessions may be granted for a fixed or an indefinite term.
Such concession holders have the right to: (i) take control of the private properties within the concession area (subject to general laws and local regulations) that are necessary to create reservoirs as well as underground or above ground supply-line and release channels, (ii) flood lands that are necessary to raise water levels, and (iii) request the authorities to make use of the powers conferred in article 10 of Law 15,336 in cases where it is absolutely necessary to appropriate the property of a third-party that was not part of the concession and the concession holder has failed to reach an agreement with such third-party.
53
Dispatch and Pricing
CAMMESA controls the coordination of dispatch operations and the administration of the Argentine MEM’s economic transactions. All generators that are Argentine MEM agents must be connected to the Argentine NIS and are obliged to comply with the dispatch order to generate and deliver energy to the Argentine NIS. The emergency regulations enacted after the Argentine crisis in 2001 had a significant impact on energy prices. Among the measures implemented pursuant to the emergency regulations were the specification of prices in the Argentine MEM and the requirement that all spot prices be calculated based on the price of natural gas, even in circumstances where alternative fuels such as diesel are purchased to meet demand due to the lack of supply of natural gas.
The introduction of Resolution No. 95/2013 suppressed the market for energy transactions among generators, large customers and traders. This resolution defines a regulated remuneration scheme for each type of technology used in power generation (see— Argentina — Industry Overview” and “— Regulatory Developments: the Industry After the Public Emergency Law”).
Seasonal Prices
The emergency regulations also made significant changes to the seasonal prices charged to distributors in the Argentine MEM, including the implementation of a cap (which varies depending on the category of customer) on the cost of electricity charged by CAMMESA to distributors at a price significantly below the spot price charged by generators. These prices have not changed since November 2008.
Pursuant to Resolution No. 1,301/2011, which announced the elimination of subsidies, the Argentine MEM’s seasonal reference prices for non-subsidized electricity were published in November 2011. This resolution also provided for the (i) discontinuation of the practice of charging subsidized prices for non-residential customers based on their payment capacity and economic activity; (ii) creation of a Register of Exceptions including a list of customers exempt from the subsidy elimination, provided that they can certify their inability to bear the seasonal reference prices for non-subsidized electricity; and (iii) the identification of the National State Subsidy, requiring CAMMESA to explicitly identify the subsidies that it provides to each level of demand. Under the resolution, distributors are also required to notify residential customers that will be affected by the elimination of subsidies.
As a result of Decree No. 134/2015, which declared a state of emergency for the Argentine Electricity sector, the Ministry of Energy and Mining enacted Resolution No. 6/2016 on January 27, 2016, that changed the seasonal price between February 2016 and April 2017 for the MEM. The seasonal price was calculated based on the operational programming, dispatch and price calculations. This resolution allowed prices to reflect the actual energy cost, reducing the subsidies and creating differentiated prices for the residential customers based on their efficient energy usage. This is the first step towards the reconstitution of market conditions.
Stabilization Fund
The stabilization fund, managed by CAMMESA, was created to absorb the difference between purchases by distributors at seasonal prices and payments to generators for energy sales at the spot price. When the spot price is lower than the seasonal price, the stabilization fund increases and when the spot price is higher than the seasonal price, the stabilization fund decreases. The outstanding balance of this fund at any given time reflects the accumulation of differences between the seasonal price and the hourly energy price in the spot market. The stabilization fund is required to maintain a minimum balance to cover payments to generators if prices in the spot market during the quarter exceed the seasonal price.
The stabilization fund has been adversely affected as a result of the modifications to the spot price and the seasonal price made by the emergency regulations, pursuant to which seasonal prices were set below spot prices resulting in large deficits in the stabilization fund. These deficits have been financed by the Argentine government through loans to CAMMESA and with FONINVEMEM funds, but these continue to be insufficient to cover the differences between the spot price and the seasonal price.
Sales to Distribution Companies and Regulated Customers
In order to stabilize the prices for distribution, the market uses the seasonal price as the energy price to be paid by distributors for their purchases of electricity traded in the spot market. This is a fixed price determined every six months by the Argentine Secretary of Energy based on CAMMESA’s recommended seasonal price level for the next period according to its estimated spot price. CAMMESA estimates this price by evaluating its expected supply, demand and available capacity, as well as other factors. The seasonal price is maintained for at least 90 days. Since 2002, the Argentine Secretary of Energy has been approving seasonal prices lower than those recommended by CAMMESA.
At the end of 2011, the Argentine government issued various resolutions in order to begin a process to reduce subsidies to gas, electricity and water tariffs. These resolutions provide for, among other things (i) the approval of the seasonal programming of regulated tariffs for the period from November 2011 to April 2012; (ii) establishment of a new non-subsidized seasonal price, which increased from Ar$ 243 per MWh to Ar$ 320 per MWh; (iii) listing of economic activities that are subject to the reduction in subsidies; (iv) creation of a register recording the exceptions to the reduction in subsidies; (v) establishment of the effective date for the new tariffs as of January 1, 2012; and (vi) provisions for voluntarily renouncing gas, electricity and water subsidies through an online system.
54
Specific Regulatory Charges for Electricity Companies
The authority to impose regulatory charges in Argentina is administratively divided among the federal, provincial and the municipal governments. Therefore, the tax charge varies according to where the customer lives.
Incentives and Penalties
The Energy Plus Service Program, part of the Energy Plus Program, is provided by generators that have (i) installed new generation capacity or (ii) connected previously unconnected existing generation capacity to the Argentine NIS. All Large Customers that had a higher demand than their Base Demand as of November 1, 2006, were required to enter into a contract with the Energy Plus Service Program to cover their excess demand. Large Customers that did not enter into such contracts are required to pay additional amounts for any consumption that exceeds the Base Demand. The prices under the contracts with Energy Plus Service Program must be approved by the relevant authorities. Unregulated customers that were unable to secure an Energy Plus Service contract are able to request CAMMESA to conduct an auction in order to satisfy their demand.
Regulation of Distribution Companies
Concessions
Distributors are companies holding a concession to distribute electricity to customers (concessions are given to distributors by the jurisdiction where they operate, national, provincial or municipal). Distributors are required to supply any and all demand of electricity in their exclusive areas of concession at tariffs and under conditions in accordance with the relevant local regulations. Penalties for failing to supply the electricity demand are included in the concession agreements. Concessions are issued for distribution and retail sale, with specific terms for the concessionaire stated in the contract. The concession periods are divided into “management periods” that allow the concessionaire to give up the concession at certain intervals.
Energy Purchases
Through SE Resolution No. 2,016/2012, the Argentine Secretary of Energy approved seasonal prices for the period from November 2012 to April 2013. The resolution sets a sole monomic price (combining both energy and capacity prices) to value all purchases on the Argentine MEM by every distributor in the country and established the regulatory combining bodies and/or authorized entities that are responsible for instructing the distributors in their jurisdiction so that the distributors may correctly apply the seasonal reference prices to their respective price tables.
Distribution Tariff-Setting Process
Distribution under national jurisdiction and transmission companies have been renegotiating contracts since 2005 and although tariffs were partially and temporarily established, definitive tariffs are still pending. As a result, although the terms to define energy prices pursuant to the Argentine Electricity Act are still in force, their implementation reflects the measures taken by the authorities that reduce compensation for all electricity companies. On the other hand, distribution companies under provincial or municipal jurisdiction have seen their tariffs adjusted by local authorities.
During 2006, our subsidiary Edesur and Edenor (not related to us), the largest Argentine distributors, entered into the “Agreement for Renegotiation of Concession Contract.” This agreement established, among other things, (i) a transitional tariff regime contingent on the quality of service; and (ii) an Integral Rate Revision Process (“RTI” in its Spanish acronym) to be implemented by ENRE according to Law 25,561 that would set the conditions for a new tariff regime for a five-year period. In December 2009, Edesur presented to ENRE its tariff proposal pursuant to the RTI process and also submitted support studies in accordance with the requirements established by ENRE Resolution No 467/2008. This presentation only included the income requirements and did not include rate proposals, which were later presented to ENRE in May 2010. As of the date of this Report, ENRE has not defined new tariffs and the transitional tariff regime remains in effect.
Resolution 45/2010 of the Argentine Secretary of Energy determined bonus payments to residential customers under the Energy Efficiency Program (“PUREE” in its Spanish acronym), particularly to those with a demand that is less than 1,000 kWh during a two month period. PUREE was created in 2004 and established bonuses and penalties to customers depending on the level of energy savings. The net difference between the bonuses and penalties was originally deposited to the stabilization fund but this was subsequently modified at the request of Edesur and Edenor. The Argentine Secretary of Energy authorized Edesur and Edenor to use all of such amounts to compensate for the cost variations that were not passed on to the tariffs paid by regulated customers.
55
Edesur’s and Edenor’s distribution tariffs have been remained unchanged since July 2008. Combined with a constant increase in costs due to inflation, this has left Edesur in a very delicate financial position. As a result, Edesur made a request in July 2012 for a special payment plan for energy purchases to CAMMESA.
In 2012, the Argentine Secretary of Energy issued Note No. 3,787/2012 in order to facilitate financing for necessary investments to the distribution system. The resolution authorized CAMMESA to provide financing for high voltage projects in 2012 investment plan pursuant to the mechanism in Resolution No. 146/2002.
At the end of 2012, the ENRE issued ENRE Resolution No. 347/2012 titled “Trust for Financing Distribution Works” (“FOCEDE” in its Spanish acronym). The resolution mandated the formation of a trust with funds collected from customers’ payments in order to finance necessary investments in infrastructure, including any maintenance works to be carried out in the concession area. The funds collected from customers are to be differentiated depending on customer category and will be taken into consideration by the ENRE when it carries out the RTI process. The trust contract and its operative manual agreement were signed by Edesur on November 29, 2012 and December 18, 2012, respectively.
On May 7, 2013, the Argentine Secretary of Energy approved Resolution 250/2013 which defined the residual value of the MMC funds that are owed to Edesur and Edenor, allowing the compensation of costs and other debts that Edesur and Edenor accrued with the funds collected under the PUREE program. The resulting balance is allocated to the FOCEDE. The Argentine Secretary of Energy has retained the power to extend, either partially or entirely, the provisions of the Resolution No. 250/2013 on the basis of the information received from ENRE and from CAMMESA. This compensation mechanism is not recurrent but it was utilized several times during 2013 and 2014 by the following Argentine Secretary of Energy Notes: i) on November 6, 2013, Note No. 6852 authorized compensation for the period of March 2013 through September 2013; ii) on June 6, 2014 Note No. 2361/14 authorized compensation for the period of October 2013 through March 2014; iii) on October 9, 2014 Note No. 0486, authorized application of Resolution No. 250/2013 for the period of April 2014 through August 2014; and iv) on December 18, 2014 Note No. 1136 authorized compensation for the period of September 2014 through December 2014.
On June 2014, Argentine Secretary of Energy, through the Note No. 4012/2014, authorized CAMMESA to provide funds to Edesur and Edenor to finance their higher personnel costs due to the application of ST Resolution No. 836/2014
On March 13, 2015, SE Resolution No. 32/2015 was issued, which permitted Edenor and Edesur, to recognize temporary higher revenues to finance their higher costs of energy purchases in the spot market, salaries and procurement. This increase is to be offset with RTIs, which have not been defined yet and will be with CAMMESA funds. In addition, Resolution No. SE 32/2015 permits Edenor and Edesur to recognize funds from PUREE as their own income, and validated the cost recognition and compensation method until March 2015 as stated in SE Resolution No. 250/2013. It also instructed CAMMESA to provide LVFVD for the amounts defined by ENRE for the higher personnel costs due to the application of ST Resolution No. 836/2014. Lastly, it addresses the payment of amounts owed to MEM, through a payment plant which is still undefined.
The SE Resolution No. 32/2015 represents the first step toward the improvement of the financial conditions of Edesur and Edenor, although it still provides that the investments continue to be financed by debt with CAMMESA, without solving the amounts owed to MEM neither the tariff adjustments that includes the increase of operational cost. The customer tariffs have not changed since 2008.
In addition, in November 2015, ENRE reported Edesur’s and Edenor’s MMC variations from November 2014 to April 2015 and May 2015 to October 2015 to the Argentine Secretary of Energy. Therefore, the Argentine Secretary of Energy, through Notes 2097 and 2197, increased the temporary revenues as defined in the Resolution No. 32/2015. Note 2158 also increased temporary revenues due to higher personnel expenses during 2014, which were paid during 2015.
On January 28, 2016, following the seasonal price changes, emergency Resolution No. 7/2016 was issued by the Ministry of Energy and Mines. The resolution instructs ENRE to adjust the rates of Edenor and Edesur through a transitory tariff until the RTI begins to apply, which is expected by December 31, 2016. In addition, Resolution No. 7/2016 suspends PUREE and requires the application of a subsidized rate to eligible customers.
On January 29, 2016, ENRE issued Resolution No. 1/2016 with a new transitory tariff, which is on force since February 1, 2016. Its application is according to the MEM Resolution No. 7/2016, which changed supply procedures and defines monthly billing.
In addition, ENRE issued Resolution No, 2/2016, which terminated the FOCEDE and set a new procedure for funds from the ENRE Resolution No. 347/12, replacing Edesur’s and Edenor’s trust with a commercial account.
56
Penalties
The distributors are subject to three types of penalties:
| | 1) | Quality of service penalties related to normal operation such as temporary interruptions, technical, and commercial services; |
| | 2) | Extraordinary penalties, at the discretion of ENRE, apply when distributors do not comply with their service obligations (e.g., blackouts); and |
| | 3) | Supply penalties related to the system as a whole including generation, transmission, and distribution intended to compensate the customers. The latter are temporarily suspended because the system is not generating enough electricity. |
Regulation in Transmission
The transmission sector is regulated based on the principles established in the Electricity Framework and the terms of the concession granted to Transener S.A. (the main operator of transmission lines in Argentina and a company not related to us) under Decree No. 2,743/92. Due to technological reasons, the transmission sector is heavily affected by economies of scale that limit competition. As a result, the transmission sector operates under monopoly conditions and is subject to considerable regulation.
Natural Gas Market
Since the emergency economic measures of 2002, the lack of investment in natural gas production forced the system to burn increasing amounts of liquid fuels.
The Argentine government has adopted different measures to improve the natural gas supply. Since 2004, local gas producers and the Argentine government have entered into various agreements to guarantee gas supply. The last agreement was signed in July 2009 and resulted in a 30% increase in the natural gas price for power generators until December 2009. In addition, Argentina and Bolivia entered into a 20-year agreement in 2006 that guarantees Argentina’s right to receive up to 28 million cubic meters of natural gas on a daily basis.
The Electronic Gas Market (“MEG” in its Spanish acronym) was also recently created to increase the transparency of physical and commercial operations in the spot market.
Electricity Exports and Imports
In order to give priority to the internal market supply, the Argentine Secretary of Energy adopted additional measures that restricted electricity and gas exports. SE Resolution No. 949/2004 established measures that allowed agents to export and import electricity under very restricted conditions. These measures prevented generators from satisfying their export commitments.
The Argentine Secretary of Energy published Disposition 27/2004, together with related resolutions and decrees, which created a plan to ration natural gas exports and the use of transport capacity. These measures restricted gas delivery to Chile and Brazil. These restrictions are expected to continue as Enargas Resolution No.1,410 issued in October 2010, reinforced such restrictions on gas distribution to certain customers. Specifically, the resolution mandated that the distribution of gas be made in the following order, from highest to lowest priority: (i) residential and commercial customers; (ii) the compressed natural gas market; (iii) large customers; (iv) thermal generator units; and (v) exports.
Environmental Regulation
Electricity facilities are subject to federal and local environmental laws and regulations, including Law 24,051, the “Hazardous Waste Law” and its ancillary regulations.
Certain reporting and monitoring obligations and emission standards are imposed on the electricity sector. Failure to satisfy these requirements entitles the Argentine government to impose penalties such as suspension of operations which, in case of public services, could result in the cancellation of concessions.
57
Law 26,190, enacted in 2007, defined the use of nonconventional renewable energy as a national interest and set the target at 8% market share for generation from renewable sources within a term of ten years. During 2009, the government took actions to reach this objective by publishing Resolution No. 712/2009 and launching an international auction to promote the installation of up to 1,000 MW of renewable energy capacity. This resolution created a mechanism to sell renewable energy through fifteen-year contracts with CAMMESA under special price conditions through ENARSA, a state owned company engaged in upstream and downstream activities associated with hydrocarbons and electricity. In June 2010, the GENREN program awarded a total of 895 MW, distributed in the following manner: 754 MW of wind power, 110 MW of bio-fuels, 11 MW of mini-hydroelectric and 20 MW of solar units. The prices awarded vary from US$ 150 per MWh (for mini-hydroelectric units) to US$ 598 per MWh (for solar units). In 2011, the Argentine Secretary of Energy issued Resolution No. 108/11 which allowed CAMMESA to sign contracts directly with generators of renewable energy on conditions similar to Resolution No. 712/2009.
In October 2015, Law 27,191 “National Development Scheme for the Use of Renewable Energy Sources for the production of Electric Power”, was enacted and defined renewable energy sources as: wind energy, solar thermal, solar photovoltaic, geothermal, tidal, wave, ocean currents, hydroelectric, biomass, landfill gas, gas treatment plants, biogas and biofuels, except for the uses established in Law 26,093. The new capacity limit for hydroelectric plants that qualify under Law 27,191 was changed from 30 to 50 MW. The law establishes that large customers should meet their demand with contracts sourced renewable technologies according to the following values: 8% in 2017, 12% in 2019, 16% in 2021, 18% in 2023 and 20% in 2025. A maximum price of US$ 113.00 per MWh is set for renewable energy contracts in the MEM. The law does not set a specific commitment to distributors. It also establishes a penalty for those who do not comply with the rates contained in Art. 8 to pay a price equal to the variable cost of production of electricity generated with imported diesel fuel for the deficit of contracted renewable energy. Finally, Law 27,191 also establishes incentives for investments: anticipation of the added value tax refund, the application of accelerated depreciation, the creation of a common fund for project financing and import duty exemption.
Brazil
Industry Overview
Industry Structure
Brazil’s electricity industry is organized into one large interconnected electricity system, the “Brazilian NIS,” which comprises most of the regions of Brazil, and several other small isolated systems.
The following chart shows the relationships among the various participants in the Brazilian NIS:
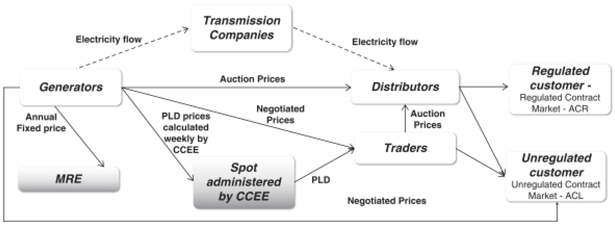
Generation, transmission, distribution and trading are legally separated activities in Brazil.
The generation sector is organized on a competitive basis, with independent generators selling their output through private contracts with distributors, traders or unregulated customers. Differences are sold on the short-term market or spot market at the Settlement Price for the Differences (“PLD” in its Portuguese acronym). There is also a special mechanism between hydroelectric generators that seek to re-allocate hydrological risk by offsetting differences between hydroelectric generators’ assured energy and that which is actually produced, called the Electricity Reallocation Mechanism (“MRE” in its Portuguese acronym).
58
The Brazilian constitution was amended in 1995 to authorize foreign investment in power generation. Before then, all generation concessions were held directly or indirectly by Brazilians or by the Brazilian state.
The transmission sector operates under monopoly conditions. Revenues from the transmission companies are fixed by the Brazilian government. This applies to all electricity companies with transmission operations in Brazil. The transmission revenue fee is fixed and, therefore, transmission revenues do not depend on the amount of electricity transmitted.
Distribution is a public service that operates under monopoly conditions and is comprised of companies who have been granted concessions. Distributors in the Brazilian NIS are not allowed to: (i) perform activities related to the generation or transmission of electricity; (ii) sell electricity to unregulated customers, except for those in their concession area and under the same conditions and tariffs with respect to captive customers in the Regulated Market; (iii) hold, directly or indirectly, any equity interest in any other company, corporation or partnership; or (iv) develop activities that are unrelated to their respective concessions, except for those permitted by law or in the relevant concession agreement. Similarly, generators are not allowed to hold equity interests in excess of 10.0% in distributors.
The selling of electricity is governed by Law 10,848/2004 and Decrees No. 5,163/2004 and No. 5,177/2004 of the Electricity Trading Chamber or Clearing House (“CCEE” in its Portuguese acronym), and ANEEL Resolution No. 109/2004, which introduced the Electricity Trading Convention. This convention defines the terms, rules and procedures of the trading in the CCEE. Two possible situations were introduced by these regulations for the execution of energy sales agreements: (i) the regulated contracting environment, in which energy generation and distribution agents participate, and (ii) the free market contracting environment, in which energy generation, trading, importing and exporting agents, and unregulated customers, participate.
Commercial relations between the agents participating in the CCEE are governed mainly by energy sales agreements. All the agreements between the agents in the Brazilian NIS should be registered with the CCEE. The register includes the amounts of energy and the terms. The energy prices agreed are not registered with the CCEE, but instead are specified by the parties involved in the agreements.
The CCEE records the differences between energy produced or consumed and the contracted amount. The positive or negative differences are settled in the short-term market and priced at the PLD and are determined weekly for each level of required energy or load and for each sub-market, based on the system’s marginal operating cost, within a minimum and maximum price range.
The unregulated market includes the sale of electricity between generation concessionaires, independent producers, self-producers, sellers of electricity, importers of electricity, unregulated, and special customers. It also includes contracts in place between generators and distributors until their expiration, at which point new contracts may be entered into under the terms of the new regulatory framework. According to the specifications set forth in Law 9,427/96, unregulated customers in Brazil are those who currently: (i) have a demand of at least 3,000 kW, generated from conventional sources and purchase their energy directly from generators or traders, but not from distributors or (ii) have a demand in the range of 500 to 3,000 kW, which is generated from NCRE and purchase their energy directly from generators, traders or distributors.
The Brazilian NIS is coordinated by the Brazilian Electricity System Operator (“ONS” in its Portuguese acronym) and is divided into four electric sub-systems: South-East/Center-West, South, North-East, and North. In addition to the Brazilian NIS, there are also the isolated systems that are not part of the Brazilian NIS. These isolated systems are generally located in the Northern and North-Eastern regions of Brazil and rely solely on electricity generated from coal-fired and oil-fueled thermal plants. According to the month electricity report of January 2015, (“EPE” in its Portuguese acronym), 99.2% of the energy required by Brazil is supplied by the Brazilian NIS and the remaining 0.8% is supplied by isolated systems.
Principal Regulatory Authorities
The Brazilian Ministry of Mines and Energy (“Brazilian MME”) regulates the electricity industry and its primary role is to establish the policies, guidelines and regulations for the sector.
The Brazilian National Energy Policy Council is in charge of developing the national electricity policy. Its principal responsibilities include advising the President in the formulation of energy policies and guidelines, promoting the stability and secure supply of the country’s energy resources, ensuring the energy supply to the most remote parts of the country, establishing directives for specific programs (such as the use of natural gas, alcohol, biomass, coal and thermonuclear energy) and establishing directives for the import and export of energy.
The Energy Research Company is an entity under the Brazilian MME. Its purpose is to conduct research and studies to support energy sector planning.
59
ANEEL, the Brazilian National Electric Energy Agency, is the entity that implements the regulatory policies. Its main responsibilities include, among others: (i) supervision of the concessions for electricity sale, generation, transmission and distribution; (ii) enactment of regulations for the electricity sector; (iii) implementation and regulation of the exploitation of electricity resources, including the use of hydroelectricity; (iv) promotion of a bidding process for new concessions; (v) resolution of administrative disputes between electricity sector agents; and (vi) setting the criteria and methodology for determining distribution and transmission tariffs, as well as the approval of all the electricity tariffs, ensuring that customers pay a fair price for energy supplied and, at the same time, preserving the economic-financial balance of the distribution companies, so that they can provide the service to agreed quality and continuity.
The Energy Sector Monitoring Committee (“CMSE” in its Portuguese acronym) is an entity created under the scope of the Brazilian MME and is under the Brazilian MME’s direct coordination. CMSE was established to evaluate the continuity and security of the energy supply across the country. CMSE has the mandate to: (i) follow the development of the energy generation, transmission, distribution, trading, import and export activities; (ii) assess the supply and customer service as well as the security of the system; (iii) identify difficulties and obstacles that affect the supply security and regularity; and (iv) recommend proposals for preventive actions that can help preserve the supply security and service.
CCEE is a non-profit company subject to authorization, inspection and regulation by ANEEL and its main purpose is to carry out the wholesale transactions and trading of electric power within the Brazilian NIS by registering the agreements resulting from market adjustments and whose agents are gathered into four categories: generation, distribution, trading and customers.
The ONS is comprised of generation, transmission and distribution companies, and independent customers, and is responsible for the coordination and control of the generation and transmission operations of the Brazilian NIS, subject to the ANEEL’s regulation and supervision.
The Brazilian Institute of Environment and Renewable Natural Resources (“IBAMA” in its Portuguese acronym) is an executive body of the National Environmental Policy, which acts as a federal independent organization. It is part of the Ministry of Environment, responsible for the implementation of the National Environmental Policy and the preservation and conservation of natural heritage, exercising control and supervision over the use of natural resources. IBAMA is also responsible for the environmental impact studies and the granting of environmental licenses for projects nationwide. The environmental license is a procedure by which the competent environmental agency at the federal, state or municipal levels, allows the location installation, expansion, and operation of businesses and activities that require natural resources. It also can consider the effective or potential pollution, in whatever form, and any cause of environmental degradation. This license seeks to ensure that preventive and control measures taken in the draft are compatible with sustainable development.
The Electricity Law
General
In 1993, the Brazilian electricity sector was reformed through Law 8,631/1993, which abolished the equalization of electricity tariffs system.
The Concessions Law 8,987 and the Electricity Sector Law 9,074, both enacted in 1995, intended to promote competition and attract private capital into the electricity sector. Since then, several assets owned by the Brazilian government and/or state governments have been privatized.
The Electricity Sector Law also introduced the concept of independent power producers, (“IPPs”), in order to open the electricity sector to private investments. IPPs are single agents, or agents acting in a consortium, who receive a concession, permit or authorization from the Brazilian government to produce electricity for sale.
Law 9,648/1998 created the wholesale energy market, composed by the generation and distribution companies. Under this new law, the purchase and sale of electricity are freely negotiated.
The spot price is used to value the purchase and sale of electric power in the short term market. According to the law, the CCEE is responsible for setting electricity prices in the spot market. These prices are calculated on a marginal cost basis, modeling future operation conditions and setting a merit order curve with variable costs for thermal units and opportunity cost for hydroelectric plants, resulting in one price for each subsystem set for the week subsequent to the determination.
60
Pursuant to Law 10,433/2002, the wholesale energy market structure is closely regulated and monitored by ANEEL. ANEEL is also responsible for setting wholesale energy market governance rules, including measures to stimulate permanent external investment.
During 2003 and 2004, the Brazilian government established the basis for a new model for the Brazilian electricity sector through Laws 10,847 and 10,848 of March 15, 2004, and Decree No. 5,163 of July 30, 2004. The principal objectives of these laws and decrees were to (i) guarantee the security of the electricity supply, promote the reasonability of tariffs, and (iii) improve social integration in the Brazilian electricity sector through programs designed to provide universal access to electricity.
The new model contemplates a series of measures to be followed by the agents, such as the obligation to contract all the demand of the distributors and unregulated customers. It also defines a new methodology for calculating the physical energy guarantee for sale of generation, contracting hydroelectric and thermal generating plants in proportions that ensure the best balance between guarantee and supply cost, plus the constant monitoring of the continuity and security of supply, seeking to detect occasional imbalances between supply and demand.
In terms of tariff reasonability, the model contemplates the purchase of electricity by distributors in a regulated environment through tenders carried out at the lowest tariff. As a result, the cost of acquiring electricity to be passed on to captive customers can be reduced. The new model includes electricity benefits for customers who are not yet included in this program, guaranteeing a subsidy for low income customers.
Limits and Restrictions
Regulatory Resolution No. 299/2008 repeals certain sections of ANEEL Resolution No. 278/2000, which established the limits and conditions for the participation of electricity distributors and traders. Specifically, the section of Resolution No. 278/2000 on limits to generation was repealed. Subsequently, Resolution No. 378/2009 establishes new procedures for analyzing mergers and violations of economic regulations in the electricity industry.
Regulation of Generation Companies
Concessions
The Concessions Law provides that, upon receiving a concession, IPPs and customers will have access to the distribution and transmission systems owned by other concessionaires, provided that they are reimbursed for their costs as determined by ANEEL.
Companies or consortia that intend to build or operate hydroelectric generation facilities with a capacity exceeding 30 MW or transmission networks in Brazil have to resort to a public tender process. Concessions granted to the holder give the right to generate, transmit or distribute electricity, as the case may be, in a given concession area for a certain period of time.
Concessions are limited up to 35 years for new generation concessions and up to 30 years for new transmission or distribution concessions. Existing concessions may be renewed at the Brazilian government’s discretion for a period equal to their initial term.
In September 2012, ANEEL’s Provisional Resolution No. 579/2012 established the criteria for the renewal of generation, transmission and distribution concessions that expire between 2015 and 2017. It foresees the reduction of energy tariffs and indemnities for non-depreciated investments in hydroelectric plants and transmission installations. In addition, Provisional Resolution No. 577/2012 defines procedures for the temporary provision of the electricity energy service in the case of cancellation of concessions due to management problems. It also reinforces the powers of ANEEL to intervene in the case of economic-financial imbalance in order to avoid affecting the service provided.
On January 23, 2013, the Brazilian Congress approved Law 12,783, which renewed electricity concessions according to Provisional Resolution No. 579/2013. This law requires companies to reduce the average electricity tariff by 20.2% from February 2013, and to extend generation, transmission and distribution concessions for a maximum of 30 years, for both hydroelectric and thermal plants, which expire between 2015 and 2017.
Dispatch and PLD Pricing
The PLD is used to value the purchase and the sale of electricity in the short term settlement market. The price-setting process of the electricity traded in the short-term market is based on the data used by the ONS to optimize the operation of the Brazilian NIS.
61
The mathematical models used to compute the PLD take into account the preponderance of hydroelectric plants within the Brazilian electricity generation grid. The purpose is to find an optimal equilibrium between the current benefit obtained from the use of the water and the future benefit resulting from its storage, measured in terms of the savings from the use of fuels for thermal plants.
The PLD is an amount computed on a weekly basis for each load level based on the Marginal Operational Cost, which in turn is limited by a maximum and minimum price in effect for each period and submarket. The intervals set for the duration of each level are determined by the ONS for each month and reported to the CCEE to be included into the accounting and settlement system.
The model used to compute the PLD seeks to achieve an optimal result for any given period and to define both the hydroelectric and thermal power generation for each submarket first considering the demand for electricity, then the hydrological conditions, the prices of fuel, the cost of the deficit, the entry of new projects into operation and the availability of equipment used for generation and transmission. As result of this process, the Marginal Operational Costs can be obtained for each load level and submarket.
The calculation of the price is based on the “ex-ante” dispatch that is determined based on estimated information existing prior to the actual operation of the system, taking into account the declared availability amounts regarding both the generation and the consumption envisaged for each submarket. The complete process for calculating the PLD involves the use of computational models to calculate the Marginal Operational Cost for each submarket on a monthly and weekly basis.
On November 25, 2014, ANEEL approved new limits for the PLD starting in 2015. The maximum limit decreased from R$ 823 per MWh to R$ 388 per MWh and the minimum increased from R$ 16 per MWh to R$ 30 per MWh. The main purpose of the new limits was to reduce the financial impact of the distributor’s exposure risks to the spot market for future contracted energy, principally as a reaction to the high spot prices in 2014. Also, the new maximum price mitigates risks faced by generators, such as unrecoverable economic and financial exposure when production is under contracted values. However, the possibility of selling surplus energy decreases with higher prices. Currently, generators can plan their surplus energy in order to boost their income by producing more energy in the months where higher prices are expected.
Annually, ANEEL defines new limits for the PLD. In December 2015, the range of the PLD for 2016 was set between R$ 30.25 per MWh to R$ 422.56 per MWh.
Electricity Reallocation Mechanism
The MRE provides financial protection against hydrological risks for hydroelectric generators by ensuring the optimal use of the hydroelectric resources of the interconnected power system.
The mechanism guarantees that notwithstanding the centralized dispatch, all hydroelectric generators that participate in the MRE will have a participation in the overall hydroelectric generation dispatched in proportion to their assured energy, or maximum firm energy, which is the electricity that a hydroelectric generation plant is able to deliver on a continual basis during a year, with poor hydrological conditions for the long term. The final value of the energy allocated to a hydroelectric generator can be greater or less than its assured energy depending on whether the hydroelectric generation is greater or less than the overall hydroelectric assured energy, respectively. This mechanism permits each hydroelectric generator, before buying energy in the spot market to fulfill its contracts, to purchase cheaper energy at a price that covers the incremental costs of operation, the maintenance of hydroelectric plants and the financial compensation for use of water. The tariff used for trading energy in the MRE, the Optimum Energy Tariff, was set as R$ 12.32 per MWh for 2016
As the overall hydroelectric generation is more stable than the individual hydroelectric production, the MRE is a very efficient mechanism to reduce the volatility of the individual production and the hydrological risk. Therefore, the energy contracts are only financial instruments in the Brazilian system and generation is totally disassociated from the energy contracts.
In November 2015, as a way of mitigating the impacts of drought, ANEEL approved the conditions for renegotiating hydrological risk with the hydroelectric generators that participate in the MRE, but approval by the Brazilian Senate is still pending.
Sales between the Agents of the Market
The current model for the electric sector states that the trading of electric power is accomplished in two market environments: the Regulated Contracting Environment (“ACR” in its Portuguese acronym) and the Free-Market Contracting Environment (“ACL” in its Portuguese acronym).
62
Contracting in the ACR is formalized by means of regulated, bilateral agreements, called Electric Power Trading Agreements within the Regulated Environment entered into between selling agents (sellers, generators, independent producers or self-producers) and purchasing agents (distributors) who participate in electric power purchase and sale auctions.
In the ACL environment, on the other hand, the negotiation among the generating agents, trading agents, free-market customers, importers and exporters of electric power is accomplished freely, whereby the agreements for the purchase and sale of electric power are entered into through bilateral agreements.
Generation agents, regardless of whether they are public generation concessionaires, IPPs, self-producers or trading agents, are allowed to sell electric power within the two environments. This allows the overall market to remain competitive. All agreements that have been entered into in the ACR or the ACL are registered in the CCEE and they serve as a basis for the accounting posting and the settlement of the differences in the short term market.
Sales by Generation Companies to Unregulated Customers
In the unregulated contracting environment, the conditions for purchasing energy are negotiable between suppliers and their customers. As for the regulated environment, where distribution companies operate, the purchase of energy must be conducted pursuant to a bidding process coordinated by ANEEL. In 2012, Brazilian MME’s Decree No. 455 mandated the creation of a price index and a requirement to register energy contracts ex-ante. The new price index was published in June 2014 and was tested internally over a six-month period before being officially published in the market in December 2014.
Sales by Distribution Companies and Regulated Customers
Pursuant to market regulations, all of distributors’ energy demand must be satisfied through regulated auctions coordinated by ANEEL. There are independent tender processes for the: (i) contracting of existing capacity in order to adjust the conditions of the current contracts or to enter into new power purchase agreements to replace expired agreements and (ii) contracting of new capacity to meet future demand.
Tenders for existing capacity are as follows: (i) A-0 tenders, energy adjustment tenders, for supplementing the energy needed to supply distribution customers in the concession market, with a limit of 1% of the energy needed; and (ii) A-1 tenders, for the acquisition of energy from all existing generation sources with purchase energy agreements of up to five years.
Future energy needs are covered through: (i) A-3 tenders, for the acquisition of energy from new generation sources (usually thermal and NCRE), and include reserve tenders that are also carried out to improve the stability of the system; and (ii) A-5 tenders, for energy purchases from any new generation source to be supplied five years following the tender. Both types of tenders involve purchase agreements ranging between 20 to 30 years
Two tenders were planned for 2012. An A-3 tender for December 12, 2012, was cancelled due to low demand from distributors. An A-5 tender for new energy was held on December 14, 2012. Of the 574.3 MW of total installed capacity available for tender, 303.5 MW were allocated. The average price was fixed at R$ 91.25 per MWh. Of the total energy allocated, 294.2 MW were allocated to two hydroelectric plants (at an average price of R$ 93.46 per MWh) and 281.9 MW were allocated to ten wind farms (at an average price of R$ 87.94 per MWh).
In 2013, six tenders took place: (i) an energy adjustments tender, in which no energy was allocated and the maximum price was fixed at R$ 163 per MWh; (ii) an A-0 tender in which no energy was allocated and the maximum price was fixed at R$ 177.22 per MWh; (iii) an A-1 tender in which only 39% of the distributors requirements were allocated at average price of R$ 177.22 per MWh; (iv) an A-3 tender with 332.5 MWh allocated to 39 wind farms at an average price of R$ 124.43 per MWh; (v) an A-5 tender in which 690.8 MWh were allocated (46% hydroelectric plants and 54% biomass thermal plants) at an average price of R$ 124.97 per MWh; and (vi) an A-5 tender in which 1,599.5 MWh (33% hydroelectric plants, 5% biomass thermal plants and 62% wind farms) were allocated at an average price of R$ 109.93 per MWh.
In 2014, an A-0 tender was held on April 30, which resulted in 2,046 MW at an average price of R$ 268 per MWh. An A-3 tender was held on June 6, 2014, and of the 2,744.6 MW energy bid, 418 MW were assigned to the Santo Antonio hydroelectric plant at an average price of R$ 121 per MWh and 551 MW were allocated to 21 wind farms at an average price of R$ 130 per MWh.
63
In 2015, six tenders took place: (i) one A-1 tender was held in December with 1,954 MW allocated to hydroelectric plants (94%), biomass thermal plants (4%) and gas thermal plants (2%) at average price of R$ 147.8 per MWh; (ii) four A-3 tenders (a) one in April with 97 MWh allocated to biomass thermal plants (70%) and wind farms (30%) at an average price of R$ 200 per MWh; (b) two in August, with 233 MWh allocated to solar power plant at average price of R$ 301.8 per MWh and 314.3 per MWh allocated to wind farms (72%), hydroelectric plants (15%), gas thermal plants (7%) and biomass thermal plants (6%) at an average price of R$ 189 per MWh; and (c) one in November with 508 MW allocated to wind farms (52%) and solar plants (48%) at average price of R$ 249 per MWh; and (iii) an A-5 tender in April in which 1,160 MWh was allocated to gas thermal plants (73%), hydroelectric plants (20%) and biomass thermal plants (7 %) at an average price of R$ 259.2 per MWh.
Sales of Capacity to Other Generation Companies
Generators can sell their energy to other generators through direct negotiation at freely-agreed prices and conditions.
Incentives and Penalties
Another change imposed on the electricity sector is the separation of the bidding process for “formerly existing power” and “new power” projects. The Brazilian government believes that a “new power project” needs more favorable contractual conditions such as long term power purchase agreements (15 years for thermal and 30 years for hydroelectric) and certain price levels for each technology in order to promote investment for the required expansion. On the other hand, “formerly existing power plants,” which include depreciated power plants, can sell their energy at lower prices under contracts with shorter terms.
Law 10,438/2002 created certain incentive programs for the use of alternative sources in the generation of electricity, known under the name of Proinfa. It assures the purchase of the electricity generated by Eletrobras for a period of 20 years and financial support from the Brazilian National Development Bank (“BNDES” in its Portuguese acronym), a state-owned development bank. Other programs include a discount of up to 50% on the distribution or transmission tariffs and a special exception for the customers with electricity demand in the range of 500 to 3,000 kW who decide to migrate to an unregulated environment, provided that such customers purchase electricity from generating companies using non-conventional sources of electricity.
Selling agents are responsible for paying the buying agent if they are unable to comply with their delivery obligations. ANEEL regulations set forth the fines applicable to electricity agents based on the nature and the materiality of the violation (including warnings, fines, temporary suspension of the right to participate in bids for new concessions, licenses or authorizations and forfeiture). For each violation, fines may be imposed for up to 2% of the concessionaire’s revenues arising from the sale of electricity and services provided (net of taxes) in the 12-month period immediately preceding any assessment notice. ANEEL may also impose restrictions on the terms and conditions of agreements between related parties and, under extreme circumstances, terminate such agreements.
Decree No. 5 163/2004 establishes that the selling agents must assure 100% physical coverage for their energy and power contracts. This coverage must be made up of physical guarantees from its own power plants or through the purchase of energy or power contracts from third parties.
Among other aspects, ANEEL’s Normative Resolution No. 109/2004 specifies that when these limits are not met, the generation companies and traders are subject to financial penalties. The determination of penalties is predicated on a 12-month period and the revenues obtained from the levying of the penalties are reverted to tariff modality within the ACR.
If the limits on contracting and physical coverage defined in the Trading Rules are not met, the relevant generation companies and traders are notified by the Superintendent of CCEE. Pursuant to the specific Trading Procedure, CCEE’s agents are allowed to file an appeal to be evaluated by CCEE’s Board of Directors who then decides whether to collect or to cancel the financial penalty.
Generation agents may sell power through contracts signed within the ACR or the ACL. IPPs must provide a physical coverage from their own power generation for 100% of their sales contracts. Self-producers generate energy for their own exclusive use and they may sell excess power through contracts with ANEEL’s authorization. In both cases, the verification of physical coverage is accomplished on a monthly basis, predicated on generation data and on sales contracts for the last 12 months. Generation agents must pay penalties if they fail to provide physical coverage.
64
Regulation of Distribution Companies
Energy Purchases
In the regulated market, electricity distribution companies buy electricity through public annual bids, regulated by ANEEL and organized by CCEE.
There are two types of regulated bids: (i) to contract existing capacity in order to adjust the conditions of the current contracts or enter into new power purchase agreements to replace expired agreements and (ii) to contract new capacity, including renewable electricity (biomass, mini-hydroelectric, solar and wind power), to meet future demand as previously described in “—Regulation of Generation Companies — Sales by Distribution Companies and Regulated Customers.”
Authorities define a cap price and all the participating distributors who call for bids enter into contracts on a prorated basis with each of the bidding generators.
Distribution Tariffs to End Customers
Distribution tariff rates to end customers are subject to review by ANEEL, which has the authority to adjust and review these tariffs in response to changes in energy purchase costs and market conditions.
Distribution Tariff-Setting Process
When adjusting distribution tariffs, ANEEL divides the Annual Reference Value, the costs of distribution companies, into: (i) costs that are beyond the control of the distributor, such as energy purchases and taxes (“Parcel A costs”), and (ii) costs that are under the control of distributors (“Parcel B costs”), the Value-Added Distribution. Each distribution company’s concession agreement provides for an annual adjustment.
The Concessions Law establishes three kinds of reviews for end customer tariffs: (i) ordinary tariff review according to the concession contracts of each distributor, (ii) annual inflation adjustments less an “X” factor (a unique value for each distributor which reflects its recent efficiency gains, the management of its operating costs, and its service quality) and (iii) extraordinary tariff reviews.
Distribution companies’ pricing is intended to maintain constant operating margins for the concessionaire by allowing for tariff gains due to Parcel A costs and by permitting the concessionaire to retain any efficiency gains achieved for defined periods of time. Tariffs to end customers are also adjusted according to the variation of costs incurred in purchasing electricity.
The value adjustment account (“CVA” in its Portuguese acronym) is a mechanism that helps to maintain stability in the energy market and enables the creation of deferred Parcel A costs, which are compensated through annual tariff adjustments based on fees to offset the deficits/surpluses of the previous year.
In December 2014, distributors in Brazil, including Ampla and Coelce, signed an amendment to the concession contracts that allowed deferred costs (CVA and others) to become part of the assets to be compensated at the end of the concession, if they were not previously compensated through tariffs. Currently, IFRS allows the recognition of deferred revenue, by ensuring that the amounts are recoverable.
Ordinary tariff reviews take into account the entire tariff-setting structure for the company, including the costs of providing services and purchasing energy, as well as a return for the investor. The tariff review period is defined by distributors at the time of signing their respective concession agreement. Therefore, in Brazil, some distributors have a period of three years, most have four year periods and some have five year periods. This means the tariff review applies to all distributors, but with different time periods.
Since 2003, ANEEL has carried out periodic tariff revisions every four years, which define the methodology to be applied during ordinary tariff reviews. Until the second cycle of periodic tariff revisions, the methodology was based on regulatory costs for a model company, which considered the special characteristics of each distribution concession area.
In November 2011, ANEEL approved a new methodology for the third cycle of periodic tariff revisions, effective from 2011 to 2014. The main changes were:
| | ● | | The values defined in the previous cycle, are adjusted by the variation in the number of customers, consumption and networks, discounting the productivity gains achieved by the distributors based on national electricity benchmarking; |
65
| | ● | | A new methodology to estimate the distribution of productivity gains and to maintain the economic and financial balance over the tariff cycle was adopted; and |
| | ● | | A new incentive mechanism for improving the quality of service was introduced. |
The law guarantees an economic and financial equilibrium for a company in the event that there is a substantial change in its operating costs. In the event that the Parcel A cost components increase significantly within the period between two annual tariff adjustments, the concessionaire may request that ANEEL pass those costs through to the end customers.
In June 2014, ANEEL published proposals to change the methodology for the fourth tariff cycle which included modifications to the WACC (proposed reduction from 11.36% to 10.85% real rate pre-tax), the regulatory asset base, the X factor and operating costs. After evaluating the contributions from distributors at Public Hearing 023/2014, ANEEL decided to review the proposed 12.26% WACC. As a result, the WACC increased from 11.36% to 12.26% (real rate pre-tax). The new rate was published in the Normative Resolution No. 648/2015 on March 2, 2015, effective retroactively to February 5, 2015. The methodology of the fourth tariff cycle is being applied to all distributors in their ordinary tariff reviews.
Revenue of Tariff Flags
Since January 2015, ANEEL has applied an additional monthly charge to the customers’ tariffs, whenever the marginal cost of the system is higher than the defined marginal cost. The regulated tariff does not recognize real costs that are beyond the control of the distributors, such as drought. The regulator’s aim is to provide to the consumer with the real cost of generation, considering the anticipated additional tariff rate to the distributor, as described in the chart below, that otherwise would have in the next annual tariff adjustment review.
This mechanism is composed of three main levels: green, yellow and red. Since its creation, the cost ranges and the additional tariffs have been changing according to new expectations of the marginal cost of generation. On January 26, 2016, ANEEL published its latest modification through Note 16/2016, which established two levels within the red criteria. The modification became effective on February 1, 2016.
| | | | | | |
| | | Description | | Applies when marginal cost
(MC) (R$/MWh) | | Additional Tariff Rate
(R$/MWh) |
Green | | Favorable generation conditions | | MC<211.28 | | No additional |
| | | |
Yellow | | Less favorable generation conditions | | 211.28£ MC< 422.56 | | +0.0015 |
| | | |
Red level 1 | | Less expensive generation conditions | | 422.56£ MC< 610.00 | | +0.0030 |
| | | |
Red level 2 | | More expensive generation conditions | | 610.00£ MC | | +0.0045 |
Energy Development Account, “Cuenta de Desarrollo Energético - CDE”
Created by Law 10,438/2002, the CDE is a government fund that aims to promote the development of alternative energy sources, promote globalization of energy services and subsidizes low-income residential customers. The fund is financed through charges included in consumers and generators tariffs and government contributions.
In September 2015, following a judicial pronouncement that suspended the payment of Embrace Association partners’ CDE charges, ANEEL allocated the lost contribution among other customers. The deficits generated by this loss of charges will be included in the next annual distribution tariff adjustment.
ANNEEL reduced the 2016 budget by 36% due to greater efficiency that allowed a reduction in the charge to customers to finance the energy cost in isolated locations.
66
Governmental Tariff Reduction Plan (Provisional Resolution No. 579/2012)
On September 12, 2012, the Brazilian government’s Provisional Resolution No. 579/2012 reduced tariffs for end customers and defined new concession renewal policies for generation and transmission companies.
In order to reduce the tariff, the Brazilian government proposed to eliminate two sector charges, the Global Reversal Reserve, which are funds to promote expansion in the electricity sector and to indemnify concessions, and the Fuel Consumption Bill, which is a subsidy to thermal generation companies mainly located in the northern region. It also reduced the CDE by 75%. These charges are compensated directly with funds from the Brazilian government.
In addition, this resolution provides new concession renewal policies for generation and transmission companies, with concession contracts expiring before 2017 (20% of the generation companies). Although existing laws provided for the possibility of renewing such concessions, there was no clear guidance on the terms of the renewed concessions. With the new policy, energy purchases charges will be reduced due to the non-recognition of assets already amortized, and therefore if the concession-holders choose to renew under such terms, then they would only be able to recover costs related to operation and maintenance. Affected companies represent 23 GW of hydroelectric capacity and 85,000 kilometers of transmission lines. Approximately 65% of the affected generation companies and all of the affected transmission companies agreed with the new rules.
Legislation containing Provisional Resolution No. 579/2012 was approved by the Brazilian House of Representatives and was sent to the President of Brazil for signature under Law 12,783/2013. The tariff reduction plan aimed at reducing tariffs to end customers by 20% was passed on January 24, 2013 after an extraordinary tariff review of all distribution companies.
At the beginning of 2013, distributors had a deficit between regulated demand and energy suppliers. They were involuntary forced to buy the required energy to serve their regulated customers at the spot market. Due to this imbalance, on March 8, 2013, Presidential Decree No. 7,945/2013 authorized the pass-through of federal resources to distributors in order for them to pay part of the extra energy costs to which they had been involuntary exposed. The extra energy costs not paid by federal resources were recovered via regulated tariffs in 2014 and 2015 as set forth by regulation of ANEEL, as adjusted by the SELIC interest rate.
In 2014, Decree No. 8,203 authorized the use of the CDE to cover part of the additional costs of distribution companies by involuntary exposure to the spot market. Thus, the decree allows the Treasury to anticipate CDE resources.
Extension of Distribution Concession Contracts
Since September 2012, the distribution concessions under the Law 9,074 /1995 may be extended by Brazilian government, one time, for a period of up to 30 years, in order to ensure continuity, efficient service, feasible rates and profitability for the distributors.
On October 20, 2015, ANEEL approved the draft to supplement the Concession Agreement and recommended the extension of the concessions to the Ministry of Mines and Energy. On December 28, 2015, the government extended the deadline for executing those extensions due to their complexity.
Generated Power Distribution
On November 24, 2015, ANEEL, in a public hearing, approved the regulation of Generated Power Distribution through an energy compensation mechanism. Power generation systems can have capacities up to 3MW for hydroelectric systems and up to 5MW for and other sources.
Regulation in Transmission
Transmission lines in Brazil are usually very extensive, since most hydroelectric plants are usually located far away from the large centers of energy consumption. Today, the country’s system is almost entirely interconnected. Only the states of Amazonas, Roraima, Acre, Amapá, Rondônia and a part of Pará still do not have access to the interconnected power system. In these states, supply is carried out by small thermal plants or hydroelectric plants located close to their respective capital cities, but the Brazilian government is gradually connecting these areas.
The interconnected electricity system provides for the exchange of electricity among the different regions when any region faces problems, such as a reduction in hydroelectric generation due to a drop in its reservoir levels. As the rain seasons are different in the south, southeast, north and northeast of Brazil, the higher voltage transmission lines (500 kV or 750 kV) make it possible for locations with insufficient energy production to be supplied by generation centers located in a more favorable location.
67
Any electricity market agent that produces or consumes energy is entitled to use the basic network. Free-market customers also have this right, provided that they comply with certain technical and legal requirements. This is called “free access” and is guaranteed by law and by ANEEL.
The operation and management of the basic network is the responsibility of ONS, which is also responsible for managing energy dispatched from plants in optimized conditions, involving use of the interconnected power system hydroelectric reservoirs and thermal plants’ fuel.
Similar to distribution companies, transmission companies also have three tariff reviews: (i) an ordinary tariff review every four years; (ii) annual tariff adjustments due to inflation and the annual allowed revenue (a fixed amount paid by consumers and generators); and (iii) extraordinary tariff review.
Environmental Regulation
The Brazilian constitution gives the federal, state and local governments power to enact laws designed to protect the environment, and to issue regulations under such laws. While the Brazilian government is empowered to enact environmental regulations, the state governments are usually more stringent. Most of the environmental regulations in Brazil are at the state and local level rather than at the federal level.
Hydroelectric facilities are required to obtain concessions for water rights and environmental approvals. Thermal electricity generation, transmission and distribution companies are required to obtain environmental approvals from environmental regulatory authorities.
Colombia
Industry Overview
Industry Structure
The Wholesale Electricity Market in Colombia (“Colombian MEM” in its Spanish acronym) is based on a competitive market model and operates under open access principles. The Colombian government participates in this market through an institutional structure that is responsible for setting forth policies and regulations, as well as for exercising supervision and control powers in respect of market participants. The Colombian MEM relies for its effective operation on a central agency, XM, which is in charge of the market central dispatch through the National Dispatch Center (“CND” in its Spanish acronym) and the management of the commercial exchange system through the Commercial Exchange System Authority.
The Colombian NIS includes generation plants, the interconnection grid, regional transmission lines, distribution lines and end customers.
There are two categories of agents, generators and traders, who are allowed to buy and sell electricity as well as related products in the Colombian MEM. All of the electricity supply offered by generation companies connected to the Colombian NIS and all of the electricity requirements of end-customers, whose demand is represented by trading companies, are traded on the Colombian MEM.
68
The following chart shows the relationships among the various participants in the Colombian MEM:
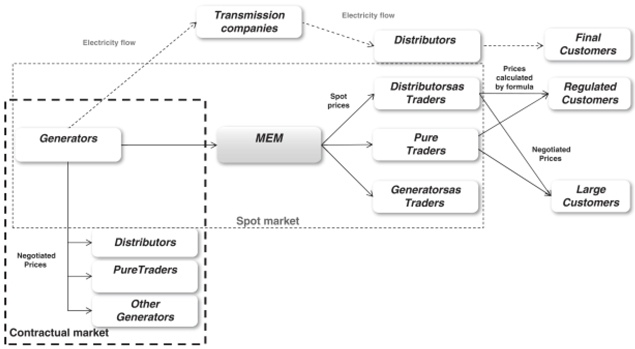
Generation activity consists of the production of electricity through hydroelectric, thermoelectric and all other generation plants connected to the Colombian NIS. The generation sector is organized on a competitive basis, with independent generators selling their output on the spot market or through private contracts with large customers, other generators and traders. Generation companies are required to participate in the Colombian MEM with all of their generation plants or units connected to the Colombian NIS with generation capacities of at least 20 MW. Generation companies declare their energy availability and the price at which they are willing to sell it. This electricity is centrally dispatched by the CND.
Trading consists of intermediation between the market participants that provide electricity generation, transmission and distribution services and the customers of these services, whether or not that activity is carried out together with other electricity-sector activities.
Electricity transactions in the Colombian MEM are carried out under the three following modes:
| | 1. | Energy spot market: short-term daily market |
| | 2. | Bilateral contracts: long-term market; and |
“Firm Energy” refers to the maximum electric energy that a generation plant is able to deliver on a continual basis during a year, in poor hydrological conditions. The generator who acquires a Firm Energy Commitment (“OEF” in its Spanish acronym) will receive a fixed remuneration during the commitment period, which is described in “— Incentives and Penalties” section below.
Transmission operates under monopoly conditions with a guaranteed annual fixed income that is determined by the new replacement value of the networks and equipment, and by the resulting value of bidding processes from the awarding of new projects for the expansion of the National Transmission System. This value is allocated among the traders of the National Transmission System in proportion to their energy demand.
Distribution is defined as the operation of local networks below 220 kV. Any customer may have access to a distribution network for which the customer pays a connection charge.
There is one interconnected system, the Colombian NIS, and several isolated regional and smaller systems that provide electricity to specific areas. According to the Colombian Mining and Energy Planning Agency, 96.8% of the Colombian population in 2014 received electricity through the public network.
69
Principal Regulatory Authorities
The Colombian Ministry of Mines and Energy (“MME”) is responsible for the policy-making of the electricity sector, which aims for a better use of the mining and energy resources available in Colombia, and in turn contributes to the country’s social and economic development.
The Colombian Mining and Energy Planning Agency is responsible for planning the expansion of the generation and transmission networks.
The Colombian National Council for Economic and Social Policy (“CONPES” in its Spanish acronym) is the highest national planning authority and works as an advisory entity to the government in all aspects related to Colombia’s economic and social development. It coordinates and directs the entities responsible for economic and social direction, through the study and approval of documents related to policy development.
The Colombian National Planning Department performs the functions of Executive Secretary of the CONPES and therefore is responsible for coordinating and presenting the documents for discussion at meetings.
The Energy and Gas Regulatory Commission (“CREG” in its Spanish acronym) implements the principles of the industry set out by the Colombian Electricity Act. This commission is constituted by eight experts named by the Colombian President, the MME, the Colombian Ministry of Public Credit and the director of the Colombian National Planning Department or their delegates. Such principles are: efficiency (the correct allocation and use of resources and the supply of electricity at minimum cost); quality (compliance with technical requirements); continuity (continuous electricity supply without unjustified interruptions); adaptability (the incorporation of modern technology and administrative systems to promote quality and efficiency); neutrality (impartial treatment of all electricity customers); solidarity (the provision of funds by high-income customers to subsidize the subsistence consumption of low-income customers); and fairness (an adequate and non-discriminatory supply of electricity to all regions and sectors of the country).
CREG is empowered to issue regulations that govern technical and commercial operations and to set charges for regulated activities. CREG’s main functions are to: (i) establish conditions for gradual deregulation of the electricity sector toward an open and competitive market, (ii) approve charges for transmission and distribution networks and for regulated customers (iii) establish the methodology for calculating maximum tariffs for supplying the regulated market, (iv) regulations for planning and coordination of operations of the Colombian NIS, (v) technical requirements for quality, reliability and security of supply, and (vi) protection of customers’ rights.
The National Operations Council is responsible for establishing technical standards to facilitate the efficient integration and operation of the Colombian NIS. It is a consultative entity composed of the CND’s Director and generation, transmission and distribution company representatives.
The Commercialization Advisory Committee is an advisory entity which assists CREG with the commercial aspects of the Colombian MEM.
The Colombian Superintendence of Industry and Commerce advises the national government and participates in the formulation of policies to promote competition, protect consumers, and protect industrial property, among others. It also investigates, corrects and sanctions restrictive commercial competition practices, such as antitrust practices, and oversees mergers of companies operating in the same industries in order to prevent excessive concentration or monopolies in certain industries.
The Colombian Superintendence of Domestic Public Services is responsible for the oversight of all public utility services companies. The Superintendence monitors the efficiency of all utility companies and the quality of services. The Superintendence can also assume control over utility companies when the availability of utility services or the viability of such companies is at risk. Other duties include enforcing regulations, imposing penalties and generally overseeing the financial and administrative performance of public utility companies, providing accounting norms and rules for public service companies, and in general, organizing information networks and databases pertaining to public utilities.
The Colombian Ministry of Environment and Sustainable Development (“MADS” in its Spanish acronym) is responsible for the management of the environment and renewable natural resources. It is also responsible for guiding and regulating environmental planning as well as developing policies and regulations. Its goal is to recover, preserve, protect, and promote sustainable use of renewable natural resources, the environment of the nation, and to ensure sustainable development, despite the functions assigned to other sectors.
70
The MADS, together with the Colombian President, aims to develop national environmental and renewable natural resource policies in order to ensure the right of Colombians to a healthy environment in which natural heritage and national sovereignty are protected.
The Electricity Law
General
In 1994, the Colombian Congress passed Law 142, known as the Public Utility Services Law, and Law 143, which form the basic legal framework that currently governs the electricity sector in Colombia. The most significant reforms included the opening of the electricity industry to private sector participation, the functional segregation of the electricity sector into four distinct activities (generation, transmission, distribution and trading), the creation of an open and competitive wholesale electricity market, the regulation of transmission and distribution activities as regulated monopolies and the adoption of universal access principles applicable to transmission and distribution networks.
The Colombian Electricity Act regulates electricity generation, trading, transmission, and distribution (collectively, the “Activities”). Under the law, any company existing before 1994, domestic or foreign, may undertake any of the Activities. Companies established subsequent to such date can engage exclusively in only one of such Activities. Trading, however, can be combined with either generation or distribution.
In 2014, the Colombian government published Renewable Energy Law 1,715/2014, which promotes the development of renewable energy and energy efficiency projects. The law proposes tax reductions for projects involved with renewable energies. Also, it establishes the development of a national fund that promotes research on related topics and defines the methodology for large and small scale self generation.
Limits and Restrictions
The market share for generators and traders is limited. The limit for generators is 25% of the Colombian system’s Firm Energy. The principal market share metric used by CREG to regulate the generation market is the percentage of Firm Energy that a market participant holds.
Additionally, if an electricity generation company’s share of Colombia’s total Firm Energy ranges from 25% to 30% and the market’s Herfindahl Hirschman Index, a measure of market concentration, is at least 1,800, such company becomes subject to monitoring by the Colombian Superintendence of Domestic Public Services. If an electricity generation company’s share of Colombia’s total Firm Energy exceeds 30%, such company may be required to sell its share exceeding the 25% threshold.
Similarly, a trader may not account for more than 25% of the trading activity in the Colombian NIS. Limitations for traders take into account international energy sales. Market share is calculated on a monthly basis according to the trader’s commercial demand and traders have up to six months to reduce their market share when the limit is exceeded.
Such limits are applied to economic groups, including companies that are controlled by, or under common control with, other companies. In addition, generators may not own more than a 25% interest in a distributor, and vice versa. However, this limitation only applies to individual companies and does not preclude cross-ownership by companies within the same corporate group.
A distribution company can hold over 25% of an integrated company’s equity if the market share of the latter company accounts for less than 2% of the national generation business. A company created before the enactment of Law 143 is prohibited from merging with another company created after Law 143 came into effect.
A generator, distributor, trader or an integrated company (i.e., a firm combining generation, transmission and distribution activities) cannot own more than 15% of the equity in a transmission company if the latter represents more than 2% of the national transmission business in terms of revenues.
Regulation of Generation Companies
Concessions
Under Laws 142 and 143 of 1994 economic activities related to the supply of the electricity service are governed by the constitutional principles of free market economic activity, free market private initiative, freedom to enter and leave the market, corporate freedom, free market competition and private property, with regulation and inspection, surveillance and control by the state.
71
According to Law 143, these constitutional principles of freedom are the general rule in the electricity industry, while the concession is the exception. Different economic, public, private or mixed agents may participate in the sector’s activities, which agents shall enjoy the freedom to develop their functions in a context of free market competition. In order to operate or start up projects, agents must obtain from the competent authorities the necessary environmental, sanitation and water-right permits as well as other municipal permits and licenses. All economic agents may build generation plants and their respective connection lines to the interconnection and transmission networks.
The Colombian government is not legally allowed to participate in the execution and exploitation of generation projects. As a general rule, such projects are to be carried out by the private sector. The Colombian government is only authorized to enter into concession agreements on its own behalf relating to generation when there are no agents prepared to assume these activities on comparable conditions.
Dispatch and Pricing
The purchase and sale of electricity can take place between generators, distributors acting in their capacity as traders, traders (who do not generate or distribute electricity) and unregulated customers. There are no restrictions for new entrants into the market as long as the participants comply with the applicable laws and regulations.
The Colombian MEM facilitates the sale of surplus energy that has not been committed under contracts. In the wholesale market, an hourly spot price for all dispatched units is established based on the offer price of the highest priced energy dispatched unit for that period. The CND receives price bids each day from all the generators participating in the Colombian MEM. These bids indicate prices and the hourly available capacity for the following day. Based on this information, the CND, guided by an “optimal dispatch” principle (which assumes an infinite transmission capacity through the network), ranks the dispatch optimized during the 24-hour period, taking into consideration initial operating conditions, and determining which generators will be dispatched the following day in order to satisfy expected demand. The price for all generators is set as the most expensive generator dispatched in each hourly period under the optimal dispatch. This price-ranking system is intended to ensure that national demand, increased by the total amount of energy exported to other countries, will be satisfied at the lowest cost combination of available generating units in the country.
Additionally, the CND plans for the dispatch, which takes into consideration the limitations of the network, as well as other conditions necessary to satisfy the energy demand expected for the following day in a safe, reliable and cost-efficient manner. The cost differences between the “planned dispatch” and the “optimal dispatch” are called “restriction costs”. The net value of such restriction costs is assigned proportionally to all the traders within the Colombian NIS, according to their energy demand, and these costs are passed through to the end customers. Some generators have initiated legal proceedings against the government arguing that recognized prices do not fully cover the costs associated with these restrictions because current regulations do not take into account all the costs of safe, reliable generation. However, CREG believes that Resolution No. 036/2010 modified the remuneration of hydroelectric plants by assigning the opportunity cost to the spot price, which compensated for these costs.
During 2012 and 2013, the “Statute for situations of scarcity in the MEM as part of the operative regulations” was under evaluation. In 2014, CREG published Resolution No. 026/2014 which enacted the Statute, which defines the rules of operation under critical supply conditions.
Since October 2015, Colombia has been affected by El Niño phenomenon, which has reduced rainfall in most of the country, decreasing hydroelectric generation. In order to guarantee the system’s reliability and security, CREG published several temporary regulations regarding the surplus capacity of small plants, limiting exports, changing the regulations of electricity trade in the MEM, among others.
Also, CREG defined a new option for power plants that have OEF commitments and operate with fuels such as diesel or kerosene allowing them to receive a higher price than the scarcity price, which triggers the OEF and is defined in the reliability charge methodology. The price differences are paid by customers.
Sales by Generation Companies to Unregulated Customers
In the unregulated market, generation companies and unregulated customers sign contracts in which terms and prices are freely agreed. Typically, these agreements establish that the customer pays for the energy that it consumes each month without a minimum or maximum. The prices are fixed in Colombian pesos indexed monthly to the Colombian PPI. According to CREG Resolution No. 131 of 1998, to be considered “unregulated”, customers are required to have an average monthly power demand for six months of at least 0.1 MW, or a minimum of 55 MWh in monthly average energy demand over the prior six months.
72
Sales by Distribution Companies to Regulated Customers
The regulated market is served by traders and by distributors acting as traders, who bill all service costs, according to prices regulated by CREG. The scheme allows distributors to pass through the average purchase price of all the market transactions that affect the regulated market into the customer’s tariff, thereby mitigating spot price volatility and providing an efficiency signal to the market. Additionally, CREG established a formula for the total cost of service, which transfers transmission, distribution, marketing costs, and physical losses costs to the regulated market.
Sales by Generation Companies to Traders for the Regulated Market
Traders in the regulated market are required to buy energy through procedures that ensure free market competition. For evaluating the bids, the buyer takes into account price factors as well as other technical conditions and commercial objectives to be defined before the contracting process. These agreements can be signed with different terms, such as for amounts contracted, demanded with or without a limit, or actually consumed, etc. Prices are denominated in Colombian pesos indexed monthly to the Colombian CPI.
Sales to Other Generation Companies
Generators can sell their energy to other generators through freely negotiated prices and conditions.
Regulatory Charges
Contribution by generation per Law 99 of 1993: Generation companies are obliged to pay monthly payments based on their generation to the regional autonomous corporations for environmental protection in areas where the plants are located and to the municipalities where the generation plants are situated. For more information, see “— Environmental Regulation” below.
Generation contribution to the Financial Support Fund for Energy for Unconnected Zones: Law 633 of 2000 (tax reform) states that generators must make a contribution of one Colombian peso to the Financial Support Fund for Energy for Unconnected Zones for every kilowatt dispatched on the Wholesale Energy Exchange. This requirement was extended to 2021 by both Law 1,715/2014 in May 2014 and by Decree No. 142/2015 of January 2015.
Incentives and Penalties
Generators connected to the Colombian NIS can also receive “reliability payments” which are a result of the OEF that they provide to the system. The OEF is a commitment on the part of generation companies backed by its physical resource capable of producing firm energy during scarcity periods. A generator that acquires an OEF will receive fixed compensation during the commitment period, whether or not the fulfillment of its obligation is required. To receive reliability payments, generators have to participate in firm energy bids by declaring and certifying such firm energy. During a transition period that ended in November 2012, the firm energy supply for reliability purposes was assigned proportionally to the declared firm energy of each generator. After the transition period, only the additional firm energy required by the system is allocated by bids. The OEF assignation auctions are oriented to generation projects with construction periods under four years and projects with long construction periods (“GPPS” in its Spanish acronym). In addition, CREG can carry out OEF reconfiguration auctions oriented to adjust the differences between the assigned OEF and expected demand. When demand is higher or lower than expected, CREG can organize auctions in which it can acquire more firm energy, or on the contrary, agents with exceeding OEF can sell their commitments.
During 2011, CREG published resolutions for the assignment of OEF for projects with construction periods under four years for the periods from December 2014 to November 2015 and from December 2015 to November 2016. For the first period, the OEF was assigned proportionally to the existing generators while, for the second period, it carried out an auction to supply the additional OEF on December 27, 2011. Since then it has not been necessary to carry out any auction to supply additional future firm energy requirements.
During 2013, Resolution No. 062/2013 created incentives for thermal plants to back up their OEF with imported natural gas to guarantee their OEF for ten years beginning from December 2015. The new resolution proposes the foundations of the remuneration for the group of thermal plants in order to develop the first regasification terminal in Colombia.
On March 10, 2014, CREG published Resolution No. 022/2014, which defined a transitory regulated revenue in order to motivate the system participants to build an LNG terminal. During 2014, the participants were beginning to contract trading and import agents; however, due to the delay in the construction phase, CREG has allowed thermal generators to comply with their OEF using alternative fuels.
73
During 2014, CREG adjusted requirements for thermal plants with the ability to utilize multiple fuels in order to allow them to use natural gas instead of petroleum-based liquid fuels. Projects under construction with delayed start dates are now able to exchange the terms of their OEF, under specific conditions, with geothermal power plants in order to include renewable energy (wind since 2011 and biomass since 2013). Through Resolution No. 022/2014, CREG defined a transitory regulated revenue in order to motivate the system participants to build a LNG terminal. The new terminal will be available in December 2016.
The tender for firm energy for the period from November 2015 to December 2016 was made on December 27, 2011. Seven companies participated with a total of eight projects of which five were assigned at a price of US$ 15.7 per MWh. The new projects are Río Ambeima (hydroelectric, 45 MW), Carlos Lleras Restrepo (hydroelectric, 78 MW), San Miguel (hydroelectric, 42 MW), Gecelca 32 (thermal, 250 MW) and Tasajero 2 (thermal, 160 MW). The new assignments were made for a period of twenty years beginning on December 1, 2015.
In addition, on January 26, 2012, the auction was concluded for projects with long construction periods which assigned OEFs for a period of twenty years to three hydroelectric projects and one thermal project. Two of these were assigned to new plants: Termonorte which will have a capacity of 88 MW by 2017 and thePorvenir II hydroelectric power plant which will have a capacity of 352 MW by 2018. The other two involved increases in OEF for plants already under construction and had available firm energy following the auction process conducted in 2008 (Sogamoso and Pescadero-Ituango hydroelectric plants). The process ended with assignment prices below the maximum defined (US$ 15.70 per MWh), and were in connection with Termonorte (US$ 14.90 per MWh);Porvenir II (US$ 11.70 per MWh);Sogamoso and Pescadero-Ituango (US$ 15.70 per MWh).
CREG regulated the reconfiguration auction scheme, under the methodology of reliability charge that allowed agents to change the beginning of the OEF by renouncing the “reliability payments” and paying a premium. XM published the results of the auction sale reconfiguration of OEF and Termocol, Amoya and Gecelca were the participating companies.
During 2012, CREG also issued Document No. 48/2012 regarding OEF allocation for the period from December 2016 to November 2017. CREG indicated that (i) an auction for OEF allocation was not necessary due to the conditions of the system and (ii) the assignment schedule will be published once there is greater certainty regarding the execution dates Colombia-Panama interconnection agreement and the processes for importing natural gas. In addition, in July 2012 a reconfiguration auction for the period of December 2012 to November 2013 took place in order to minimize the difference between the assigned OEF and the expected demand for that period.
The OEF was allocated to Termocol, which owns the Poliobras project (4.5 GWh per day) and to Amoyá, which owns the Isagen project (0.5 GWh per day). Such tenders are called when previously allocated OEFs exceed the projected demand for a certain period. The tender ended with a price margin of US$ 0.60 per MWh, which is greater than the reliability load price of December 2012 to November 2013. Projects such asAmbeimaandPorvenir II have lost their OEF.
In 2014, CREG published the Circular 088/2014, indicating that no auction is needed for the period from December 2016 to November 2020.
In 2015, CREG presented the methodology to calculate firm energy for wind plants. The new resolution allows projects without wind measurements for 10 years, to use proxy data in order to calculate the power-wind curve. The results of the approximation must be certified by the National Operations Council.
Also in 2015, CREG declared through Resolution No. 177 /2015 that existing firm energy was enough to supply the expected demand until 2019. For this reason, it assigned OEF to existing plants for the periods 2016-2017, 2017-2018 and 2018-2019. In addition, CREG published the new reliability charge methodology for small plants. According to Resolution No. 138/2015, the reliability charge clearing scheme for small plants will be centralized, as it is for large plants, and small plants must present a firm energy commitment for the reliability charge in order to have OEF assignations. CREG is allowing smalls plants to keep participating on the current remuneration mechanism if the differences between real and programmed generation are greater or lower than 5%. For the first year, the gap was defined as greater or lower 10%.
74
Electricity Exports and Imports
Andean Nation Community (“CAN” in its Spanish acronym) Decisions 536 of 2002, 720 of 2009, and 757 of 2011, signed by the countries that participate in the Andean Nations Community, Colombia, Ecuador, Bolivia and Peru, established the general framework for the interconnection of electrical systems that created a coordinated economic dispatch for the countries involved in the interconnections. Under this framework, the interconnection system between Colombia and Ecuador was inaugurated in March 2003. The two countries adopted a transitional regime pursuant to CAN 757, while adopting common standards in order to make such international transactions viable.
In addition to the interconnection with Ecuador, Colombia is also interconnected with Venezuela by three links, the most important being the Cuestecitas-Cuatricentenario line. During 2011 and 2012, there were energy transfers made from Colombia to Venezuela, through this line, under an agreement between the Presidents of both nations. The agreement allows for estimated transactions of 30 GWh per month, with a demand of 70 MW in periods of low and medium load and of 140 MW in periods of high load. The contract was signed on February 1, 2013 for a period of eleven months and was formalized by a contract between Isagen (Colombia) and Corpoelec (Venezuela).
There is also an energy interconnection project with Venezuela being carried out by the Institute of Planning and Promotion of Energy Solutions for Non-Interconnected Zones pursuant to an agreement between Colombia and Venezuela. Under the terms of this agreement, Colombia will sell electricity to Venezuela at a rate that is much cheaper than the costs to produce it. Venezuela will pay for the electricity with fuel rather than cash. This interconnection project is estimated to cost US$ 8 billion and includes the construction of a 35.6 kilometer transmission line with a capacity of 34,500 volts in order to supply electricity to the region of San Fernando de Atabapo, Venezuela.
In the first half of 2012, CREG and the National Public Services Authority of Panama issued resolutions that provided for enhancing the process for tendering of rights to construct the future interconnection line between Colombia and Panama.
The resolutions also supplement pre-existing resolutions by providing for provisions that allow Panamanian distribution companies to participate in future tenders in Colombia. The most important resolutions issued by Colombia are (i) CREG No. 002/2012, which attempts to resolve the discrepancies between firm capacity in Panama and the OEF in Colombia; (ii) CREG No. 004/2012, which outlines the exchanges in conditions of rationing; and CREG No. 057/2012, which is an operative agreement between the operators of the systems of Colombia and Panama. Panama has also issued parallel resolutions that enable Colombian companies to participate in tenders in Panama as international interconnection agents.
Emgesa, Isagen, Celsia and its subsidiary entity EPSA participated in the tender process to obtain line capacity rights in Panama that took place on August 21, 2012. These companies were able to participate in the tender by forming subsidiaries in Panama and complying with all requirements under Panamanian law, including the provisions related to guarantees.
In June 2012, Interconexión Eléctrica Colombia-Panamá (“ICP” in its Spanish acronym), which is jointly owned by Interconexión Eléctrica de Colombia and the state-ownedEmpresa de Transmisión Eléctrica de Panamá , was entrusted with the construction of an interconnection project and was allowed to join the tender for capacity rights. ICP submitted the base amount that is necessary to participate in the tender and proceeded to obtain prequalifications in July and August 2012. However, the tender process was suspended indefinitely on August 19, 2012. This was primarily due to financial reasons as the Panamanian government, citing budget constraints, refused to provide a firm commitment to contribute capital.
ICP is expected to continue to seek financial support in order to ensure the viability of the project and reduce uncertainties for the participants. With the support from the Interamerican Development Bank, ICP has hired a consultant to carry out a study that will explore alternatives plans that would result in more competitive energy prices and greater business opportunities. The Colombian government is also in discussions with its Panamanian counterpart in order to restart the process.
In November 2012, the Declaration of Santiago was signed by Chile, Colombia, Ecuador, Peru and Bolivia. The main purpose of this declaration was to facilitate regional electricity transactions by harmonizing regulatory frameworks of the member countries in order to connect the electricity networks of the signatory countries in the Pacific area.
Gas Market
Natural gas is important for the Colombian electricity sector, as natural gas is a key fuel for generation. The Colombian natural gas market operates under near monopolistic conditions and consists of a primary market, secondary market and short-term market. Supply contracts depend on a balance between supply and demand for the next five years, which is calculated by the regulatory authority every year. If demand exceeds supply, auctions take place, if the opposite happens, bilateral negotiations are carried out. Transportation contracts are traded under bilateral negotiation schemes or through auctions.
75
This regulatory framework is the result of a former proposal that sought to reform the wholesale market for natural gas and ensure that it operates under the principles of transparency and liquidity. This new framework also outlines entities that are eligible to participate in each market, the types of permitted transactions, and the kind of contracts that may be entered into. It even seeks to create standardized force majeure provisions for such contracts in order to clarify the responsibilities of the parties. The new rules took effect in August 2013.
During 2014, CREG defined the rules for choosing the Market Manager, invited participants for the subsequent selection as natural gas Market Manager, and regulated the creation of trust instruments in their care. In 2015, the gas Market Manager was chosen and started operations. Its main responsibilities are the validation and monitoring of participant registration, the primary and secondary market supply and transport contract registration, and the implementation of long term and short term auctions. During the second half of 2014, and in accordance with the new regulatory framework, work continued on the second phase of marketing natural gas, which describes short and long term gas bilateral supply negotiations and aftermarket supply negotiations as well as transportation.
The third trading process of natural gas took place between September 2015 and November 2015 and this third trading process considered bilateral negotiations given that the supply exceed the demand.
As a result of the implementation of the indexes in Annex IV of CREG Resolution No. 089/ 2013, prices of signed, long-term gas contracts were adjusted in November 2013, yielding an increase of around 25% for gas supply contracts in Guajira. CREG requested that agents resume the discussion to achieve a consensus among all participants in the natural gas chain to introduce tariffs for supply contracts and final rate regulated market.
During 2015, CREG presented the final scheme for supply contract indexation. It considers two methodologies, bilateral negotiation and regulated formula application.
Also, advancements were made in defining the methodology to be used for calculating the discount rate, based on the WACC to be applied in natural gas transmission and distribution, fuel gas and LPG transport via pipelines, transmission and distribution of electricity in the national grid, and the generation and distribution of electricity in areas that are not connected to the Colombian NIS.
Late in 2015, the MME issued regulations related to the reliability and security of natural gas supply; by modifying the definition of essential demand, the order of supply priority and to identify the essential elements for the elaboration of the “Supply Plan for Natural Gas” which is the responsibility of the Mining and Energy Planning Unit. The main objective of this plan is to prepare the sector in case of supply shortages and design the regulatory framework to improve the transport and supply infrastructure.
Regulation of Distribution Companies
Distributors (or network operators) are responsible for planning, investing, operating, and maintaining electricity networks below 220 kV. These include regional transmission systems and local distribution systems. Any customer may access the distribution network by paying a connection fee. Under this scheme, the distributor is responsible for operating the distribution network, including the transportation and control of the technical and non-technical energy losses.
Distribution Tariff-Setting Process
CREG regulates distribution prices that allow distribution companies to recover costs, including operating, maintenance and capital costs under efficient operations. Distribution charges are set by CREG for each company based on the replacement cost of the existing distribution assets, the cost of capital, as well as operational and maintenance costs that depend on the voltage level.
The methodology for remunerating the distribution business segment was defined by CREG in 2008. The WACC was set at 13.9% before taxes for assets operating above 57.5 kV and 13.0% before taxes for assets operating under this threshold. CREG also defined a methodology for the calculation of distribution charges by creating an incentive scheme for administrative, operating and maintenance costs, service quality and energy losses. During 2009, after auditing the information reported by the companies, CREG established the distribution charges applicable until October 2013 or until CREG establishes new distribution charges.
Distribution charges are set for a five-year period and are updated monthly according to the PPI, and defined for four different voltage levels which are applied depending on the customer’s connection point as follows:
| | • | | Level 1: less than 1 kV; |
76
| | • | | Level 2: at least 1 kV but less than 30 kV; |
| | • | | Level 3: at least 30 kV but less than 57.5 kV; and |
| | • | | Level 4: at least 57.5 kV but less than 220 kV. |
The review of distribution charges began in 2013 with the publication of the remuneration methodology proposed by CREG Resolution No. 043/2013. Such bases were augmented by CREG Resolution No. 079/2014 containing the Purposes and Guidelines for the Distribution Remuneration for the period 2015-2019 and CREG Resolution No. 179/2014 that defined a remuneration methodology. According to this, such bases and draft methodology incorporate replacement incentives by including depreciation as part of tariff formula, and an investment plan that will allow the incorporation of newer technology, improve service quality and control energy losses. The new distribution remuneration methodology and charges are expected to be published in during 2016.
Additionally, the CREG has issued Resolutions No. 083/2014 and 112/2014 which define the methodology to calculate the WACC for electricity transmission and distribution as well as natural gas distribution and transport.
Incentives and Penalties
In December 2011, CREG defined a coverage mechanism requiring traders who are the end customers, to guarantee distributors the payment of the regional transmission system and local distribution system tariffs. CREG established that these kinds of traders must use one of the following instruments, in order to provide security of payment to distributors: bank guarantees, stand-by letters of credit letters (either domestic or international) and monthly prepayments. These mechanisms will be in effect for three months after the issuance of the new trading remuneration methodology.
At the same time, CREG defined new regulation related to non technical losses. It defined that the companies that have higher losses than those approved in current regulation should design a plan to reduce them. CREG approved new criteria for losses that will be included in the tariff for companies that control losses at an efficient level, and established that non technical losses above the efficient level must be assumed by distributors.
The distribution business has tariff incentives contingent on the quality of service. Distributors also have to make compensatory payments to customers when they cannot meet the established continuity criteria. In 2012, CREG established the new quality of service regulation for the regional transmission systems. Specifically, it defined compensations for energy that was not provided and service interruptions in the regional transmission systems.
Also in 2012, CREG defined the power quality regulation. Overall, it established minimum quality standards and designed a mechanism in which customers can present their claims to distribution companies and receive compensation if standards are not met by the company. This mechanism introduces new measurement requirements.
Regulation in Transmission
Transmission companies which operate at least 220 kV grids constitute the National Transmission System (“NTS”). They are required to provide access to third parties on equal conditions and are authorized to collect a tariff for their services. The transmission tariff includes a connection charge that covers the cost of operating the facilities, and a usage charge, which applies only to traders.
CREG guarantees an annual fixed income to transmission companies. Income is determined by the new replacement value of the network and equipment and by the resulting value of the bidding processes of awarding new projects for the expansion of the NTS. This value is allocated among the traders of the NTS in proportion to their energy demand.
The review of regulated transmission charges began in 2013 with the publication of the remuneration bases methodology proposed by CREG Resolution No. 042/2013. Such bases were complemented by the development of the Purposes and Guidelines for the Transmission Remuneration for the period 2015-2019, which was presented in CREG Resolution No. 078/ 2014, and by the draft methodology contained in CREG Resolution No. 178 /2014. This resolution was defined by the MME and seeks to ensure timely expansions and adequate assets. The new transmission remuneration methodology and the new transmission charges are expected to be issued during 2016.
The expansion of the NTS is conducted according to model expansion plans designed by the Colombian Mining and Energy Planning Agency and pursuant to bidding processes opened to existing and new transmission companies, which are handled by the MME in accordance with the guidelines set by CREG. The construction, operation and, maintenance of new projects is awarded to the company that offers the lowest present value of future cash flows needed for carrying out the project.
In 2012, CREG established the new quality of service regulation for the NTS. It defined incentives for failure to provide energy and required companies to compensate customers, by reducing their charges, for service interruptions in the NTS.
77
Trading Regulation
The retail market is divided into regulated and unregulated customers. Customers in the unregulated market may freely and directly enter into electricity supply contracts with a generator or a distributor, acting as traders, or with a pure trader. The unregulated customer, which for 2013 represented about 33% of the market, consists of customers with a peak demand in excess of 0.1 MW or a minimum monthly energy consumption of 55 MWh.
Trading involves reselling the electricity purchased in the wholesale market. It may be conducted by generators, distributors or independent agents, which comply with certain requirements. Parties freely agree upon trading prices for unregulated customers.
Trading on behalf of regulated customers is subject to the “regulated freedom regime” under which tariffs are set by each trader using a combination of general cost formulas given by CREG and individual trading costs approved by CREG for each trader. Since CREG approves limits on costs, traders in the regulated market may set lower tariffs for economic reasons. Tariffs include, among other things, energy procurement costs, transmission charges, distribution charges and a trading margin.
The most recent trading tariff formula became effective in 2015, as set by CREG Resolution No. 180 /2014. The main changes to this formula were the establishment of a fixed monthly charge covering operating cost plus a variable income for traders covering credit risk, working capital subsidies, and other selling costs. Selling costs have been approved individually for traders during 2015 and 2016. In the case of Codensa, in 2015 CREG published Resolution No. 120/2015 approving Codensa’s selling costs. The new tariff will be applied by January 2016.
In May 2009, a company called Derivex was created so as to incorporate an energy derivatives market. In October 2010, Derivex began its operation with the first electricity forward derivative contract.
In December 2011, CREG issued the Retailing Code, which includes specific rules that improve retailers’ relations with other electricity market members. It established new regulations about energy measurement, non-technical losses, the retailers’ connection to the wholesale electricity market, and the retailers’ credit risks, among other considerations.
In October 2013, CREG published a new resolution that defines “technical equity” (equity corresponding to the minimum equity that allows agents to perform operations on the wholesale market, either as sellers or buyers) as a mechanism to rate the technical abilities of companies in order to protect the wholesale market from unstable companies. According to the new rule, any transaction in the spot market has to be lower than the technical equity of the companies involved in the transaction.
In order to improve wholesale price formation, CREG has been designing a new energy procurement scheme based on long term energy bids, known as Organized Market (“MOR” in its Spanish acronym). The final rules for this new system are not available, but CREG issued a draft version of the mechanism through Resolution No. 117/2013, and the deadline for consultations has passed. It is expected that the final resolution on MOR will be issued by the end of 2016, and the first auction will be called for by the beginning of next year.
Tariffs to End Customers
The energy trader is responsible for charging the electricity costs to end customers and the transfer of their payments to the industry’s agents. The tariffs applied to regulated customers are calculated according to a formula established by CREG. This formula reflects the costs of the industry (generation, transmission, distribution), depending on the customer’s connection level, trading losses, constraints, administrative costs, and market operating costs. The pricing formula is currently under review and CREG Resolution No. 135 /2014 establishes the basis of the studies to determine the unit cost formula of providing service to regulated customers. It is expected that the commission will issue the formula during 2016.
There are different factors that affect the final costs of the service. Subsidies and/or contributions are applied according to the socio-economic level of each customer, and when subsidies exceed contributions, the Colombian government compensates for the difference. Another factor that affects the final tariff is the distribution area, which establishes a single distribution tariff for the distribution companies in adjacent geographic zones.
In addition, to subsidize the value of electricity for the most financially vulnerable residential customers residing in the least developed rural areas, the MME established the Social Energy Fund (“FOES” in its Spanish acronym). Decree No. 011/2012 regulates FOES as defined in article 103 of Law 1450 of 2011 (published in 2012). FOES offsets CP$ 46 kWh of the price of electricity for the above mentioned customers.
78
Renewable Energy and Energy Efficiency
Since 2001, energy efficiency has been promoted in Colombia, through Law 697, which has been the framework for efficiency programs including the program for rational and efficient use of energy. In December 2012, the Colombian Mining and Energy Planning Agency published Resolution No. 0563, which establishes the procedure for the exclusion of sales tax for the programs or activities related to reduced energy consumption and energy efficiency.
On May 13, 2014, the Renewable Law (Law 1,715) was enacted. This new law establishes a general legal framework and created a fund intended to promote the development of non-conventional renewable energy, energy efficiency and programs designed to reduce electricity demand. One of its principal objectives is the progressive replacement of diesel generation in non-interconnected and isolated areas, in order to reduce energy cost and greenhouse gas emissions.
During the second half of 2014, the government worked on several aspects of the regulation, and as a result, in December the MME enacted Decree Nos. 2,492 and 2,469 establishing guidelines for the demand response mechanism and the sale of surplus energy by self-generators.
In 2015, MME enacted Decree No. 2,143 which defines the process agents must undertake in order to receive the tax and tariff benefits established by Law 1715. Regarding this rule, Mining and Energy Planning Agency also published Resolution No. 45 which establishes the procedures to receive the certificate that allows agents to access the benefits regarding taxes and import tariffs.
Environmental Regulation
The environmental framework in Colombia was established by Law 99/1993, which also established the Colombian Ministry of the Environment (now the Colombian Ministry of Environment and Sustainable Development) as the authority for determining environmental policies. The Colombian Ministry of Environment defines issues, executes policies and regulations that focus on the recovery, conservation, protection, organization, administration and use of renewable resources.
Any entity planning to develop projects or activities relating to generation, interconnection, transmission or distribution of electricity that may result in environmental deterioration must first obtain environmental permits and licenses and also establish environmental management plans.
Generation plants that have a total installed nominal capacity above 10 MW are required to contribute to the conservation of the environment. These resources are called “Transfers,” that electricity generation companies give to municipalities and regional environmental authorities, in accordance with article 222 of Law 1450 of 2011, which amended Article 45 of Law 99 of 1993. The amount to transfer is according to the plant’s generation and a tariff established by CREG, which is updated annually.
Law 1,450 of 2011 issued the National Development Plan 2010-2014. The plan establishes that between 2010 and 2014, the government must develop strategies for environmental sustainability and for the prevention of environment risks. These include measures such as the national plan for adaptation to climate change, the environmental licensing process and environmental impact studies.
In 2011, Institutional Decree No. 3,570 established a new regulatory structure for the environment, creating the MADS (previously, the functions of the Ministry of the Environment were established in conjunction with functions of the Ministry of Housing). The main objective of the MADS is the formulation and management of environmental and renewable natural resource policies. In 2012, the MADS published several resolutions. Resolution No. 1,517/2012 established the procedures relating to the Environmental Compensation for Biodiversity Loss while Decree No. 1,640 of 2012 set forth regulations for the planning and management of hydrographic basins. In addition, Resolution No. 1,526/2012 established the procedural requirements for the subtraction of the forest areas protected by Law 2 of 1,959.
In August 2013, the Colombian National Planning Department issued CONPES Document 3,762, a policy text that established guidelines for the identification and prioritization of infrastructure projects that are of national and strategic interest in the energy, mining, oil, gas, and transportation sectors. It defines the relevant issues related with the formalities and procedures for acquiring land, prior consultation, community relations, environmental licensing and permits, and institutional coordination, all of which need to be resolved in order to assure the correct formulation and development of those projects.
Due to national discussions about environmental licensing, the MADS enacted Decree No. 2,041/2014 which aims to reduce the timing needed to receive the necessary licenses.
During 2015, MADS issued the Single Regulatory Decree No. 1,076 (Decreto Único Reglamentario) for the environmental sector that compiles all existing decrees on environmental issues in the country.
79
MADS continued developing regulation to reduce water contamination caused by discharged water and ecological flow. It updated parameters and limits of specific maximum allowable discharges to surface water and public sewer systems.
Resolution No. 909/2008 was enacted increase air quality, to allow energy recovery from waste and/or hazardous waste in thermal generation plants.
The National Environmental License Authority granted licenses toPorvenir II hydroelectric project andCayao liquefaction plant and denied the license to theCañafisto hydroelectric project.
The Mayor’s Office of Bogotá, through its Decree No. 600/2015, established measures to renew the fleet of taxis in 2017 with electric vehicles.
MADS is leading Climate Change issues. MADS has included the Nationally Appropriate Mitigation Action in the Clean Development Mechanism portfolio. Also, MADS belongs to the negotiation team that represents Colombia at the Conferences of Parties. In 2015, the Climate Change unit presented the Intended Nationally Determined Contributions for Colombia and committed to reducing its greenhouse gas emissions by 20% by 2030 and subject to the provision of international support, Colombia could increase its goal from 20% reduction with respect to Business as Usual (“BAU”) to 30% with respect to BAU by 2030.
Peru
Industry Overview
Industry Structure
In the Peruvian Wholesale Electricity Market (“Peruvian MEM” in its Spanish acronym) there are four categories of local agents: generators, transmitters, distributors and large customers. Trading is carried out by generators and distributors.
The following chart shows the relationships among the various participants in the SEIN.
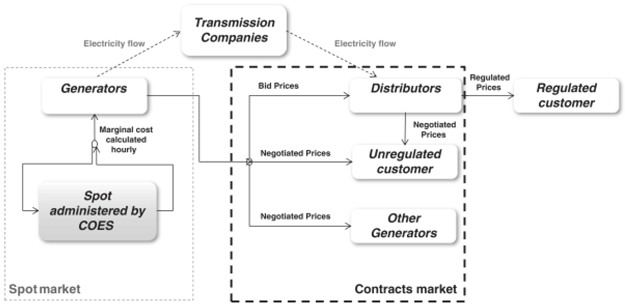
The generation segment is composed of companies that own generation plants. This segment is known for being a competitive market in which prices tend to reflect the marginal cost of production. Electricity generators, as energy producers, have capacity and energy sale commitments with their contracted customers. Generators may sell their capacity and energy to both distributors and unregulated customers.
The energy received by a generator’s customers does not necessarily match with the energy produced by that supplier since the generation plants’ production is allocated by the COES, through a centralized dispatch. The transfer cost is minimized by reviewing the variable production costs of each power plant, regardless of their contractual commitments. The only exception to this rule applies to the natural gas plants, which declare the natural gas price once a year for dispatch purposes. Therefore, there is a short-term market that is also managed by the COES, where an economic balance is made between the energy produced and the demand of the generators’ customers.
80
The generation plants’ production and the customers’ energy consumption are valued at the hourly marginal cost and the generators that have deficits buy energy from the generators that have surpluses. This principal related to the energy sales balances is also carried out for the capacity. The price of the capacity corresponds to a price regulated by the Energy and Mining Investment Supervisor (“Osinergmin” in its Spanish acronym).
In 2008, due to gas transport and electricity transmission problems, Osinergmin defined a new rule to calculate spot prices. Decree No. 049/2008 established two models, with one of them representing a theoretical dispatch without considering any restrictions and the other considering real dispatch with restrictions. The spot price is obtained from the theoretical dispatch (known as “ideal marginal cost”), and the additional operating costs resulting from system restrictions are paid through demand from the affected generators through a mechanism established by the authority. The “ideal marginal cost” regime was extended until December 31, 2016. In recent years, the ideal marginal cost has been very similar to the real cost and has not had a relevant impact. The settlements made by the COES also include payments and/or collections for supplementary services such as frequency and tension regulation. They also consider compensation for operating cost overruns, such as the operation at minimum load, random operational tests, etc.
The transmission system is made up of transmission lines, substations and equipment for the transmission of electricity from the power plants to the consumption centers or distribution points. Transmission in Peru is defined as all lines or substations with a tension higher than 60 kV. Some generation and distribution companies also operate sub-transmission systems at the transmission level.
Electricity distribution is an activity carried out in the concession areas granted to different distribution companies. Customers with a capacity demand lower than 200 kW are considered regulated customers, and their energy supply is considered to be a public service. Customers whose capacity demand is within the range of 200-2,500 kW are free to choose whether to be considered regulated or unregulated customers. Once this type of customer chooses an option, the customer must remain in that category for at least three years. If the customer wants to change its category from regulated to unregulated customer, or vice versa, at least one year advance notice must be provided.
There is only one interconnected system, the SEIN, and several isolated regional and smaller systems that provide electricity to specific areas. According to the National Institute of Statistics of Peru, as of December 31, 2014, 92.9% of the population obtained electricity through the public network.
Principal Regulatory Authorities
The Peruvian Ministry of Energy and Mining (“MINEM” in its Spanish acronym) defines energy policies applicable nationwide, regulates environmental matters applicable to the energy sector and oversees the granting, supervision, maturity and termination of licenses, authorizations and concessions for generation, transmission, and distribution activities. On August 10, 2012, Supreme Decree No. 030-2012-EM amended the articles of organization and defined the activities of MINEM and the Natural Gas Management Department.
The Peruvian Investment Promotion Agency is a public entity responsible for attracting private investment in public utilities and infrastructure works. It also advises to investors in making their investment decisions.
Osinergmin is an autonomous public regulatory entity that controls and enforces compliance with legal and technical regulations related to electrical and hydrocarbon activities, controls and enforces compliance with the obligations stated in the concession contracts, and is responsible for the preservation of the environment in connection with the development of these activities. Osinergmin’s Tariff Regulatory Bureau has the authority to publish the regulated tariffs. It also controls and supervises the bidding processes required by distribution companies to purchase energy from generators.
The COES coordinates the SEIN’s short, medium and long-term operations at minimum cost, maintaining the security of the system and optimizing energy resources. It also plans for the SEIN’s transmission development and manages the short-term market.
The National Institute for Defense of Competition and Intellectual Property is responsible for promoting competition, protecting customer rights and safeguarding all forms of intellectual property.
The General Electricity Authority is the regulatory technical entity responsible for evaluating the electricity sector, and proposes the necessary regulations for the development of the electricity generation, transmission and distribution activities.
81
The Peruvian Ministry of Environment defines environmental policies applicable nationwide and is the head of the National Environmental Management System, which includes the National Environmental Impact Assessment System, the National Environmental Information System, the Protected Natural Areas System, as well as the management of natural resources in its area of competence as biodiversity and climate change, among others.
The Electricity Law
General
The general legal framework applicable to the Peruvian electricity industry includes: the Law of Electricity Concessions (Decree Law No. 25,844/1992) and its ancillary regulations, the Law to Secure the Efficient Development of Electricity Generation (Law 28,832/2006), the Technical Regulation on the Quality of the Electricity Supply (Supreme Decree No. 020/1997), the Electricity Import and Export Regulation (Supreme Decree No. 049/2005), the Antitrust Law for the Electricity Sector (Law 26,876/1997), the law that regulates the activity of Osinergmin (Law 26,734/1996, together with Law 27,699/2002) ), and Decree Law No. 1,221/2015 that improves electricity distribution regulation to promote electricity access in Peru.
Some of the characteristics of the regulatory framework are (i) the separation of the three main activities: generation, transmission and distribution; (ii) freely-determined prices for the supply of energy in competitive market conditions; (iii) a system of regulated prices based on the principle of efficiency together with a bidding regime; and (iv) private operation of the interconnected electricity systems subject to the principles of efficiency and quality of service.
Law 29,852/2012 and Regulation No. 021-2012-EM created the Hydrocarbons Energy Security System and the Fund of Social Energy Inclusion. These laws also created a system of social compensation and universal service for the most vulnerable sectors of the population which will be financed by surcharges on the electricity billing of unregulated customers (equivalent to the surcharge that exists today for regulated customers on the Electrical Social Compensation Fund), transport surcharges for hydrocarbon-derivate liquids and natural gas multi pipelines and surcharges on the use of the natural gas pipeline.
Osinergmin and distribution companies manage the Fund of Social Energy Inclusion, which directs funds to the mass usage of natural gas to vulnerable sectors, (ii) develop new energy sources like photovoltaic cells, solar panels, etc., and (iii) supply liquefied petroleum gas to vulnerable sectors.
Law 29,969/2012 provides for the universal usage of natural gas. State electricity distributors are authorized to carry out natural gas programs, including the distribution of natural gas in their concession area. They are also able to associate with companies specializing in the development of gas distribution projects. Within a maximum period of three years from the start of the gas distribution, MINEM will start the process of promoting private investment by granting gas distribution concessions through the pipeline network.
Law 29,970/2012 guarantees energy security and promotes the development of the petro chemical complex in the south of the country. Under this law, the following agendas have been declared as a matter of national interest: (i) the guarantee of energy security, (ii) the transport of ethane to southern Peru; and (iii) the construction of regional pipelines in Huancavelica, Junín, and Ayacucho and their connection to existing gas pipelines.
Law 1,221/2015 enacted on September 24, 2015, will be applied during 2016, and once implemented, the main modifications are:
| | ● | | In the distribution tariffs, the VAD and the internal rate of return calculations will be defined for each distribution company with over 50,000 customers. |
| | ● | | The MINEM will define a responsibility technical area (“ZRT” in its Spanish acronym) for each distributor, given its operation areas. The investments in the ZRT, which can be carried out either by a distributor or by a third party, should be approved by the distributor. Investment and audited costs (with a cap) will be recognized through the VAD. |
| | ● | | The VAD will include a technology innovation charge and/or a distribution energy efficiency component. The VAD will also be adjusted to encourage improvements of service quality. |
| | ● | | Distributors will be obligated to guarantee their regulated demand for 24 months. |
82
| | ● | | Distributors will be required to execute the urban electrification investments or repay the contribution, if the investment is carried out for a third party, when the rate of occupancy is over 40%. |
| | ● | | Generation and transmission concessions originating in bidding processes are restricted to a 30-year term. In the case of hydroelectric generation concessions, a favorable report for the watershed, as issued by MINEM, will be required. |
| | ● | | Set conditions to NCRE sources and co-generation that enable them to inject surplus energy to the distribution system without affecting operating security. |
Limits and Restrictions
Since the enactment of the Law of Electricity Concessions, vertical integration is restricted, and activities in the generation, transmission and distribution segments must be developed by different companies. The Antitrust Law for the Electricity Sector regulates the cases in which vertical and horizontal integration is admissible.
An antitrust authorization is compulsory for those electricity companies that hold more than a 5% interest of another business segment, either before or as a result of a merger or integration. An authorization is also required for the horizontal integration of generation, transmission and distribution activities which result in a market share of 15% or higher of any business segment, either before or as a result of any operation. Such authorizations are granted by the Institute for Defense of the Consumer and Intellectual Property, using the market share information provided by Osinergmin.
Regulation of Generation Companies
Concessions
Generation companies that own or operate a power plant with an installed capacity greater than 500 kW require a concession granted by the MINEM. A concession for electricity generation activity is a unilateral permit granted to the generator by the MINEM. Authorizations are granted by the MINEM for an unlimited period of time, although their termination is subject to the same considerations and requirements as the termination of concessions under the procedures set forth in the Law of Electricity Concessions, and its related regulations.
In order to receive a concession, the applicant must first request for a temporary concession of two years, and must subsequently apply for a definitive concession. In order to receive an authorization, the applicant must file a petition before the MINEM. If the petition is admitted and no opposition is presented, the MINEM grants the authorization to develop generation activities for unlimited time, subject to compliance with applicable regulations.
Dispatch and Pricing
The coordination of electricity dispatch operations, the setting of spot prices and the control and management of economic transactions that take place in the SEIN are controlled by COES. Generators can sell energy directly to large customers and buy the deficit or transfer the surplus between contracted energy and actual production in the pool at the spot price. Resolution No. 080-2012-OS/CD established the criteria and methodology for deciding the real-time operation under exceptional conditions as declared by the MINEM.
Sales by Generation Companies to Unregulated Customers
Sales to unregulated customers are carried out at mutually agreed prices and conditions, which include tolls and compensation for the use of transmission systems and, if necessary, to distribution companies for the use of their network.
Sales to Distribution Companies and Certain Regulated Customers
Sales to distributors can be under bilateral contracts at a price no greater than the regulated price in the case of regulated customers, or at an agreed price in the case of unregulated customers. In addition to the bilateral method allowed under the Law of Electricity Concessions, Law 28,832/2006 has also established the possibility that distributors may meet their unregulated or regulated customers’ demand under contracts signed following a capacity and energy supply tender process.
83
Sales of Capacity to Other Generation Companies
COES determines a firm capacity for each power plant on an annual basis. Firm capacity is the highest capacity that a generator may supply to the system at certain peak hours, taking into consideration statistical information and accounting for time out of service for maintenance purposes and for extremely dry conditions in the case of hydroelectric plants.
A generation company may be required to purchase or sell capacity in the spot market, depending upon its contractual requirements in relation to the amount of electricity to be dispatched from such company and to its firm capacity.
Regulatory Charges
In addition to taxes applicable to all industries (mainly an income tax and a value added tax), the electricity industry operators are subject to a special regulation contribution that compensates the costs incurred by the state in connection with the regulation, supervision and monitoring of the electricity industry. The applicable rate for this contribution is up to 1% of the annual billing of each company and the funds levied are distributed proportionally to the MINEM and Osinergmin.
Generators that also have hydroelectric plants pay a water royalty as a function of the hydroelectric energy produced and the regulated energy tariff at peak hours.
Tenders Promoted by the State
During 2009, MINEM carried out several studies which concluded that there will be lack of electricity generation capacity in the system in the near future. MINEM recommended the construction of new electricity plants that would serve as backup to guarantee the flow of electricity to the system, avoiding blackouts. As a result, the Peruvian Investment Promotion Agency carried out a public bid in August 2010, seeking to secure investments for three projects located inReserva Fría de Talara,Trujillo andIlo that would add another 800 MW to the system. The bid resulted in two of the projects being awarded:Reserva Fría de Talara (200 MW, for EEPSA, an Enersis subsidiary and Ilo (400 MW, for Enersur, an unrelated company). These plants receive regular payments for being permanently available to operate and provide energy to the SEIN whenever the COES calls on them and will also be reimbursed for the fuel costs incurred for generating electricity. The Trujillo generation facility was later replaced by the Eten generation facility and awarded toPlanta de Reserva Fría de Generación de Eten S.A. (200 MW).
On March 21, 2013, Peruvian Investment Promotion Agency held an international public tender to promote private investments in the Hydroelectric Plant project (MollocoHydroelectric Plant—280 MW), which is located in the hills of theArequipa region. It was awarded to the Corsan Corviam – Engevix – Enex partnership.
Services provided by generation, transmission, and distribution companies must comply with technical standards stated in the Technical Regulations on the Quality of the Electric Supply. Failure to do so might result in the imposition of fines by Osinergmin.
Generators receive a capacity payment whose main component is the annuity of a peak-load plant. However, to be eligible to receive this payment, plants have to be part of the reserve margin established annually by Osinergmin. The capacity ranking is constructed in base of firm capacity of every power plant connected to the system and their relative efficiency (ordered by variable costs). Only plants included in the ranking as required to cover the peak demand plus the reserve margin receive the capacity payment. Every year, Osinergmin sets the power price that shall be assigned and paid to each generator pursuant to this concept.
Electricity Exports and Imports
A 220 kV transmission line has been implemented for the interconnection with Ecuador. However, the line has not operated continuously because of regulatory issues. In 2014, electricity exports to Ecuador totaled 12.7 GWh In 2015, the electricity exports net amounted to 54.3 GWh.
Internal regulations were also approved for the application of CAN Decision 757, which establishes that when bilateral electricity transactions are carried out with other CAN countries, the Economic Operation Committee of the SEIN should send weekly reports to the MINEM and to Osinergmin demonstrating that priority has been given to supplying the domestic market (Supreme Decree No. 011-2012-EM).
The governments of Peru and Chile have established a bilateral working group to discuss energy matters. The purpose of the working group is to identify and take advantage of the potential synergies between the two countries. At the request of the presidents of both nations, the working group is expected to propose a framework for an agreement in connection with both countries’ electricity integration that would establish the general rules for energy exchanges between them. As of the date of this Report, both countries have conducted negotiations but a final agreement is still pending.
84
Regulation of Distribution Companies
Bids for Supplying Regulated Customers
The Law to Secure the Efficient Development of Electricity Generation established a bidding regime for the acquisition of energy and capacity by distributors through competitive tenders and firm prices. The regulator approves the general conditions and establishes a price cap for the bidding process. In addition, distributors can sign bilateral short term contracts with generators in order to buy electricity blocks not covered by tenders and to fill any future imbalance.
The new contracts to sell energy to distribution companies for resale to regulated customers must be made at fixed prices determined by public bids. Only a small part of the electricity purchased by distribution companies (included in old contracts) is still maintained at node prices. These prices are set annually by Osinergmin and are the maximum prices for electricity purchased by distribution companies that can be transferred to regulated customers in those contracts.
Distribution Tariffs to End Customers
The electricity tariff for regulated customers includes charges for capacity and energy for generation and transmission and for the VAD which considers a regulated return on investments, operating and maintenance fixed charges and a standard percent for energy distribution losses.
Distribution Tariff-Setting Process
The VAD is set every four years. Osinergmin classifies companies into groups, according to “typical distribution areas”, based on economic factors that group companies with similar distribution costs due to population density, which determines equipment requirements in the network.
Actual return on investment for a distribution company depends on its performance relative to the standards chosen by the Osinergmin for a theoretical model company. The tariff system allows for a greater return for distribution companies that are more efficient than the model company. Tariff studies are performed by the Osinergmin and distribution companies. Preliminary tariffs are calculated as a weighted average of the results of the Osinergmin commissioned study and the companies’ study, with the results of the Osinergmin’s study bearing twice the weight of the companies’ study. Preliminary tariffs are then tested to ensure that they provide an average actual annual internal rate of return between 8% and 16% on the replacement cost of electricity-related distribution assets.
The most recent process of distribution tariff setting has been in effect since November 2013 and will be in effect until October 2017.
Regulatory Charges
The regulatory charges applied to the energy sales in distribution activities are:
| | • | | The contribution to regulatory authorities (Osinergmin, MINEM), which represents 1% of total sales. |
| | • | | The FOSE created to promote permanent access to the public electricity service for low-income residential customers. This fund established a cross subsidy system among customers that benefits customers with monthly consumption below 100 kWh through fixed and proportional discounts. |
| | • | | The rural electrification charge is a contribution for promoting the efficient and sustainable electrification development in rural, isolated or frontier areas of the country. The contribution of the electricity customers is of 0.002 UIT (a tax unit) per MWh billed, with the exception of those which are not served by the SEIN. |
85
Incentives and Penalties
Law 28,832 and Supreme Decree No. 052-2007-EM (“General Regulations of the Supply Auctions”) state that if auctions are called for with an anticipation of over three years, distributors will receive payment incentives which will be added to the generator price of the auctions, and then passed through to customers. This incentive cannot be higher than 3% of the tariffs applied.
The distribution concessionaire may lose its concession if it does not provide evidence of a guaranteed supply for the following 24 months, at a minimum, unless it has called for public auctions according to the current norm and has not received offers sufficient to comply with its total requirements for the established period.
Regulation in Transmission
Transmission activities are divided in two categories: “principal”, which are for common use and allow the flow of energy through the national grid; and “secondary”, which are those lines that connect a power plant with the national grid that connects principal transmission with the distribution network or that connect directly to certain end customers. Law 28,832 also defined “guaranteed transmission systems” and “supplementary transmission systems”, applicable to projects commissioned after the enactment of that law. Guaranteed system lines are the result of a public bid and supplementary system lines are freely constructed and exploited as private projects. Principal and guaranteed system lines are accessible to all generators and allow electricity to be delivered to all customers. Transmission concessionaires receive an annual fixed income, as well as variable tariff revenues and connection tolls per kW. The secondary and supplementary system lines are accessible to all generators but are used to serve only certain customers who are responsible for making payments related to their use of the system.
Environmental Regulation
The environmental legal framework applicable to energy related activities in Peru is established in the Environmental Law (Law 28,611/2005) and in the Regulation for Environmental Protection regarding Electricity Activities (Supreme Decree No. 029-94-EM). MINEM dictates the specific environmental legal dispositions applicable to electricity activities, and Osinergmin is in charge of supervising certain aspects of their application and implementation. According to the Environmental Law, the Peruvian Ministry of Environment has the principal duties of (i) designing the general environmental policies to every productive activity; and (ii) establishing the main guidelines of the different government authorities for their specific environmental sector regulations. During 2010, most supervision functions regarding the application and implementation of the Environmental Law’s dispositions were transferred from Osinergmin to the Peruvian Ministry of the Environment.
NCRE, referred to in Peruvian regulations as Renewable Energy Resources (“RER” in its Spanish Acronym), for electricity generation are considered to be from the following sources: biomass, wind, solar, geothermal and tidal sources, as well as hydroelectric plants with an installed capacity lower than 20 MW.
In 2008, the authority issued regulations to promote the use of NCRE. The principal investment incentives established by these regulations are (i) an objective percentage of national electricity consumption, set every five years, to be covered NCRE generation, excluding hydroelectric plants (for the first five-year period, this percentage is 5%); (ii) through tenders of energy to be covered by NCRE, the investor awarded the tender is guaranteed a firm price for the energy injected into the system during the supply contract period of up to 20 years; and (iii) priority in the dispatch of load and access to transmission and distribution networks.
The first NCRE tender was carried out in two steps. The first auction was held in June, 2009 for 1,314 GWh per year, of which 570 GWh was awarded to three wind farms projects, 173 GWh was awarded to four solar plants projects, 143 GWh was awarded to two biomass plants projects and 1,084 GWh was awarded to 19 mini-hydroelectric plants. The second auction was held in March, 2010 for 427 GWh per and 11.7 GWh was award to a biomass thermal plant project and two mini hydroelectric project for 92 GWh.
The second NCRE tender was held in August, 2011 for 1,300 GWh per year intended to non-hydroelectric sources. Out of 21 initiatives proposed, 473 GWh were awarded to three projects.
The third NCRE tender was held in December, 2013, with the objective to provide 1,300 GWh per year of hydroelectric power and 320 GWh of biomass derived electricity. Nineteen mini hydroelectric plant projects with individual capacities below 20 MW were awarded to supply 1,268 GWh.
The fourth NCRE tender was held in December, 2015, with the objective to provide 1,300 GWh to both the interconnected and isolated systems. In addition, 450 GWh per year are required from mini hydroelectric projects with a maximum capacity of 20 MW each. The results were published by the end of January 2016 and 1,741 GWh were awarded to the following projects: three wind farms (739 GWh), two solar power plant projects (523 GWh), two biomass thermal plant projects (30 GWh) and six small hydroelectric plant projects (449 GWh).
86
In addition, other regulations established tax incentives, including (i) accelerated asset depreciation for income tax purposes, and (ii) the advanced recovery of the sales tax. In 2011, the permanent congressional commission approved Law 29,764, extending these tax benefits through 2020.
Law 29,968/2012 created the National Environmental Certification Service for Sustainable Investments (“SENACE” in its Spanish acronym), a specialized public organization with technical autonomy and a separate legal constitution, which reports to the Peruvian Ministry of the Environment. This organization is responsible for reviewing and approving detailed environmental impact studies of public, private or mixed capital investment projects, whether national or multi-regional, that involve activities, construction and other commercial and service activities whose characteristics, importance and/or location can result in significant environmental impacts, with the exception of those expressly excluded by Supreme Decree No. with the consenting vote of the Council of Ministers.
SENACE seeks to implement a single system of environmental administrative procedures to guarantee sustainable investments through the implementation of a sole window of environmental certification.
Raw Materials
For information regarding our raw materials, please see “Item 11. Quantitative and Qualitative Disclosures About Market Risk — Commodity Price Risk.”
| C. | Organizational Structure. |
Principal Subsidiaries and Affiliates
We are part of an electricity group controlled by the Italian company, Enel, our ultimate parent company, which beneficially owns 60.6% of us through wholly-owned Spanish subsidiaries. Enel publicly trades on the Milan Stock Exchange. It is headquartered in Italy and is primarily engaged in the energy sector, with a presence in 32 countries across four continents, mainly in Europe and Latin America, and generating electricity from power plants with over 89 GW of net installed capacity. Enel provides service to more than 61 million customers through its electricity and gas businesses through distribution networks of 1.9 million kilometers.
87
Enersis Américas’ Organizational Structure(1)
As of December 31, 2015 (assuming the spin-off of Enersis Chile S.A. had occurred as of such date)
| (1) | Only principal operating subsidiaries are presented here. The percentage listed for each of our subsidiaries represents our economic interest in such subsidiary. |
88
The companies listed in the following table were consolidated by us as of December 31, 2015. In the case of subsidiaries, our economic interest is calculated by multiplying our percentage economic interest in a directly held subsidiary by the percentage economic interest of any entity in the chain of ownership of such ultimate subsidiary.
| | | | | | | | | | | | | | | |
Principal Subsidiaries and Country of Operations | | % Economic
Ownership of
Enersis | | Consolidated
Assets of Each
Main Subsidiary | | Operating
Income
of Each Main
Subsidiary |
| | | (in %) | | (in billions of Ch$) | | |
Electricity Generation | | | | | |
Fortaleza (Brazil) | | | | 84.38 | | | | | 151,222 | | | | | 159,052 | |
Cachoeira Dourada (Brazil) | | | | 84.17 | | | | | 121,390 | | | | | 91,563 | |
Dock Sud (Argentina)(1) | | | | 57.14 | | | | | 172,911 | | | | | 69,963 | |
EEPSA (Peru) | | | | 96.50 | | | | | 130,528 | | | | | 58,093 | |
Electricity Transmission | | | | | |
CIEN (Brazil) | | | | 84.38 | | | | | 214,341 | | | | | 55,534 | |
Electricity Distribution | | | | | |
Ampla (Brazil) | | | | 92.03 | | | | | 1,402,340 | | | | | 1,026,680 | |
Edesur (Argentina) | | | | 71.61 | | | | | 634,854 | | | | | 607,345 | |
Edelnor (Peru) | | | | 75.54 | | | | | 773,983 | | | | | 562,046 | |
Coelce (Brazil)(2) | | | | 64.86 | | | | | 836,903 | | | | | 810,184 | |
Codensa (Colombia) | | | | 48.39 | | | | | 1,049,139 | | | | | 884,467 | |
| (1) | Figures correspond to Inversora Dock Sud S.A., an investment vehicle through which we hold our 40.2% economic interest in Dock Sud. |
| (2) | As a consequence of a tender offer completed in 2014 our shareholding increased from 49.2% to 64.9%. |
Generation and Transmission Segment
The following companies include certain generation and transmission companies consolidated by us as of December 31, 2015 (marked with an asterisk), as well as other companies in which we have an interest.
Cemsa (Argentina)
Cemsa’s principal activities are the trading of electricity and fuels. Cemsa has signed several agreements with Argentine electricity power stations to support its supply contracts. The power stations that provide Cemsa’s electricity supply contracts are: Costanera, Dock Sud, Centrales Térmicas del Noroeste S.A., and El Chocón. Endesa Américas indirectly holds 45.0% of Cemsa and our economic interest in Cemsa is 82.0%.
Dock Sud (Argentina)*
Dock Sud owns and operates an 870 MW generation facility consisting of two plants. Dock Sud’s power station has four gas turbines and one steam turbine. Two of the gas turbines and the steam turbine comprise a combined-cycle power plant. In 2015, Dock Sud generated 3,799 GWh. We own 57.1% of Inversora Dock Sud S.A., an investment vehicle through which we hold Dock Sud. Our economic interest in Dock Sud is 40.2%.
Costanera (Argentina)
Costanera is a publicly-held Argentine electricity generation company, with 2,304 MW of total installed capacity in Buenos Aires. Costanera consists of six steam turbines with an aggregate capacity of 1,131 MW which burn oil and gas, and two natural gas combined-cycle facilities with a total capacity of 1,173 MW. Costanera was acquired from the Argentine government after the privatization of Servicios Eléctricos del Gran Buenos Aires S.A. Endesa Américas owns 75.7% of Costanera’s shares, and we own a 45.4% economic interest.
El Chocón (Argentina)
El Chocón is an Argentine electricity generation company. It has two hydroelectric power stations with an aggregate installed capacity of 1,328 MW located between Neuquén and Río Negro provinces, in the Comahue Basin in southern Argentina. A 30-year concession, which expires in 2023, was granted by the Argentine government to our subsidiary, Hidroinvest S.A., which bought 59.0% of El Chocón’s shares in July 1993 during the privatization process. Endesa Américas operates El Chocón for a fee pursuant to an operating agreement with a term equal to the duration of the concession. Endesa Américas beneficially holds 65.4% of El Chocón, and our economic interest is 39.2%.
89
Cachoeira Dourada (Brazil)*
Cachoeira Dourada owns and operates a run-of-the-river hydroelectric plant using the flows from the Paranaiba River, located in the State of Goias, consisting of ten generating units totaling 665 MW of installed capacity. Cachoeira Dourada began its operations in 1997, and as of December 31, 2015, had a concession that expires in 2027. Enel Brasil has a 99.8% ownership interest in Cachoeira Dourada and our economic interest is 84.2%.
CIEN (Brazil)*
CIEN is a Brazilian transmission and trading company that is wholly-owned by Enel Brasil. It transmits electricity through its two transmission lines that connect Argentina and Brazil, covering a distance of 500 kilometers, with a total interconnection capacity of 2,100 MW. As of December 31, 2015, CIEN-Line 1 had a concession that expires in 2020, and CIEN-Line 2 had a concession that expires in 2022. CIEN consolidates CTM and TESA, which operate the Argentine side of the interconnection line with Brazil. Our economic interest in CIEN is 84.4%.
Enel Brasil (Brazil)*
In 2005, Enel Brasil was formed in order to manage all Brazilian generation, transmission and distribution assets that Enel Latinoamérica owns in conjunction with us, Endesa Américas and Chilectra Américas. Enel Brasil consolidates operations of two generation companies (Cachoeira Dourada and Fortaleza), the transmission company CIEN, as well as two distribution companies (Ampla and Coelce). Endesa Américas owns 37.1% of Enel Brasil’s shares, and we beneficially own an 84.4% economic interest.
Fortaleza (Brazil)*
Fortaleza owns and operates a 322 MW natural gas combined-cycle power plant, with a capacity to generate one-third of the electricity requirements of the State of Ceará, a state with a population of 8.8 million people. As of December 31, 2015, Fortaleza had a concession that expires in 2031. Fortaleza is wholly-owned by Enel Brasil, and we hold an 84.4% economic interest.
Emgesa (Colombia)*
Emgesa has a total installed generating capacity of 3,459 MW, of which 87% is from hydroelectric power plants and 13% is from thermoelectric power plants. Empresa de Energía de Bogotá S.A. directly holds a 51.5% equity interest in Emgesa. Endesa Américas beneficially owns 26.9% of Emgesa’s shares and has 31.3% of the voting rights. However, due to a transfer of 25.1% of the voting rights in Emgesa from us, to Endesa Américas and a related shareholders’ agreement, Endesa Américas holds a majority of the voting rights and is allowed to appoint the majority of the Board members and, therefore, controls Emgesa. We beneficially own 37.7% of Emgesa. For more information, see “Item 5. Operating and Financial Review and Prospects — A. Operating Results. — 1. Discussion of Main Factors Affecting Operating Results and Financial Condition of the Company.”
Edegel (Peru)
Edegel, an electricity generation company, owns and operates seven hydroelectric plants and two thermal plants, with a consolidated installed capacity of 1,685 MW. In October 2009, Endesa Américas purchased an additional 29.4% stake in Edegel from Generalima, S.A.C., one of our subsidiaries, and as a result of this transaction, increased its ownership interest from 33.1% to 62.5%. In September 2014, we acquired a 39.0% stake that Inkia Americas Holdings Limited held in Generandes Perú S.A., a company that held a 54.2% stake of Edegel. With this transaction, we increased our economic interest in Edegel from 37.5% to 58.6%.
Edegel holds 80% of the shares of Chinango S.A.C. and Peruana de Energía S.A.A. (an unaffiliated entity) owns the remaining 20% of the shares.
EEPSA (Peru)*
EEPSA has 298 MW of generation capacity, consisting of two thermal plants, Malacas and Malacas II, both of which are located in the province of Talara-Piura, which operate using locally produced natural gas. We beneficially own 96.5% of EEPSA.
90
Distribution Segment
The following companies include distribution companies consolidated by us as of December 31, 2015.
Edesur (Argentina)
Edesur is one of the largest electricity distribution companies in Argentina in terms of energy purchases. Edesur operates in a concession area of 3,309 square kilometers in the south-central part of the Buenos Aires metropolitan area, serving approximately 2.5 million customers under a concession that expires in 2087. Our economic interest in Edesur is 71.6%.
Ampla (Brazil)
Ampla is the second largest electricity distribution company in the State of Rio de Janeiro, Brazil, in terms of number of customers and annual energy sales. Ampla is mainly engaged in the distribution of electricity to 66 municipalities located in the State of Rio de Janeiro, and serves 2.9 million customers in a concession area of 32,615 square kilometers. As of December 31, 2015, Ampla had a concession that expires in 2026. We have a 92.0% economic interest in Ampla.
Coelce (Brazil)
Coelce is the sole electricity distributor of the State of Ceará, located in the northeastern part of Brazil, and serves over 3.7 million customers within a concession area of 148,825 square kilometers. As of December 31, 2015, Coelce had a concession that expires in 2027. Prior to 2014, our economic interest in Coelce was of 49.2%, and as a result of the voluntary tender offer completed in May 2014, our shareholding increased to 64.9%.
Codensa (Colombia)
Codensa is a Colombian electricity distribution company that serves a concession area of 14,456 square kilometers in Bogotá and 96 other municipalities of the provinces of Cundinamarca, Tolima and Boyacá, serving approximately 2.8 million customers. Our economic interest in Codensa, held directly and indirectly through Chilectra Américas, is 48.4%, which represents 57.2% of the voting rights in Codensa, and as a result of this and pursuant to a shareholders’ agreement we appoint the majority of Codensa’s Board members, and therefore, have control over Codensa. For more information regarding the control and consolidation of Codensa, see “Item 5. Operating and Financial Review and Prospects — A. Operating Results. — 1. Discussion of Main Factors Affecting Operating Results and Financial Condition of the Company.”
Edelnor (Peru)
Edelnor, a Peruvian electricity distribution company, operates in a concession area of 1,517 square kilometers. It has an exclusive concession to distribute electricity in the northern part of the Lima metropolitan area, as well as some provinces in the Lima region, including Huaral, Huaura, Barranca and Oyón, and the adjacent province of Callao. As of December 31, 2015, Edelnor distributed electricity to approximately 1.3 million customers. We hold a 75.5% economic interest in Edelnor.
Selected Related and Jointly-Controlled Companies
Yacylec (Argentina)
Yacylec is an Argentine electricity transmission company. As of December 31, 2015, Yacylec had a concession that expires in 2088. The Yacylec transmission system consists of:
| | • | | Three 500 kV transmission lines, 4 kilometers each in length, from the Hidroeléctrica Yaciretá power station to the Rincón de Santa María transformer station. |
| | • | | The 500 kV Rincón de Santa María transformer station, located in the province of Corrientes. |
| | • | | A 500 kV transmission line (296 kilometers long) from the Rincón de Santa María transformer station to the Resistencia transformer station, and an expansion of the Resistencia transformer station, located in the province of Chaco. |
| | • | | A communications system. |
91
Our economic interest in Yacylec is 22.2%.
| D. | Property, Plant and Equipment. |
Our property, plant and equipment are concentrated primarily on electricity generation, distribution and transmission assets in the four countries in which we operate.
Property, Plant and Equipment of Generating Companies
We conduct our generation and transmission businesses directly and through our subsidiaries, Endesa Américas and Enel Brasil. Endesa Américas combines revenues from other non-wholly-owned generation companies in Argentina, Colombia and Peru, which in turn own 26 additional generation power plants. We conduct our Brazilian operations through Enel Brasil and consolidate revenues from two generation power plants. In addition, we directly consolidate revenues from two other non-wholly-owned generation companies, which own two generation power plants, one in Argentina and one in Peru. As a result, we have an aggregate of 30 power plants in South America. Through Enel Brasil, we also own and operate a transmission system consisting of two 500 kilometer 2,100 MW transmission lines that link Rincón de Santa María in Argentina with Itá in the State of Santa Catarina in Brazil.
A substantial portion of our generating subsidiaries’ cash flow and net income is derived from the sale of electricity produced by our electricity generation facilities. Significant damage to one or more of our main electricity generation facilities or interruption in the production of electricity, whether as a result of an earthquake, flood, volcanic activity or any other such cause, could have a material adverse effect on our operations.
Our electricity generation facilities are insured against damage due to earthquakes, fires, floods, other acts of god (but not for droughts, which are notforce majeure risks, and are not covered by insurance) and from damage due to third-party actions, based on the appraised value of the facilities as determined from time to time by an independent appraiser. Based on geological, hydrological and engineering studies, management believes that the risk of an event with a material adverse effect is remote. Claims under our generating subsidiaries’ insurance policies are subject to customary deductibles and other conditions. We also maintain business interruption insurance providing coverage for the failure of any of our facilities for a period of up to 24 months, including the deductible period. The insurance coverage taken for our property is approved by each company’s management, taking into account the quality of the insurance companies and the needs, conditions and risk evaluations of each generating facility, and is based on general corporate guidelines. All insurance policies are purchased from reputable international insurers. We continuously monitor and meet with the insurance companies in order to obtain what we believe is the most commercially reasonable insurance coverage.
92
The following table identifies the power plants that we own, at the end of each year, by country and their basic characteristics:
| | | | | | | | | | | | | | | | |
| | | | | | | Installed Capacity
As of December 31, | |
Country/Company | | Power Plant Name | | Power Plant Type | | 2015 | | | 2014 | | | 2013 | |
| | | | | | | (in MW) | |
Argentina | | | | | | | | |
Costanera(1) | | | | | | | | | | | | | | | | |
| | Costanera Steam Turbine | | Steam Turbine/Natural Gas+Fuel Oil | | | 1,131 | | | | 1,131 | | | | 1,131 | |
| | Costanera Combined Cycle II | | Combined Cycle/Natural Gas+Diesel Oil | | | 851 | | | | 851 | | | | 851 | |
| | Buenos Aires Combined Cycle I | | Combined Cycle/Natural Gas | | | 322 | | | | 322 | | | | 322 | |
| | | | | | | | | | | | | | | | |
| | Total | | | | | 2,304 | | | | 2,304 | | | | 2,304 | |
El Chocón | | | | | | | | | | | | | | | | |
| | Chocón | | Reservoir | | | 1,200 | | | | 1,200 | | | | 1,200 | |
| | Arroyito | | Pass-through | | | 128 | | | | 128 | | | | 128 | |
| | | | | | | | | | | | | | | | |
| | Total | | | | | 1,328 | | | | 1,328 | | | | 1,328 | |
Dock Sud | | | | | | | | | | | | | | | | |
| | Dock Sud CC | | Combined Cycle/Natural Gas+Diesel Oil | | | 798 | | | | 798 | | | | 798 | |
| | Dock Sud TG | | Gas Turbine/Natural Gas+Diesel Oil | | | 72 | | | | 72 | | | | 72 | |
| | | | | | | | | | | | | | | | |
| | Total | | | | | 870 | | | | 870 | | | | 870 | |
| | | | | | | | | | | | | | | | |
Total capacity in Argentina | | | | | | | 4,502 | | | | 4,502 | | | | 4,502 | |
| | | | | | | | | | | | | | | | |
Brazil | | | | | | | | | | | | | | | | |
Cachoeira Dourada | | Cachoeira Dourada | | Pass-through | | | 665 | | | | 665 | | | | 665 | |
Fortaleza | | Fortaleza | | Combined Cycle/Gas | | | 322 | | | | 322 | | | | 322 | |
| | | | | | | | | | | | | | | | |
Total capacity in Brazil | | | | | | | 987 | | | | 987 | | | | 987 | |
| | | | | | | | | | | | | | | | |
93
| | | | | | | | | | | | | | | | |
| | | | | | | Installed Capacity
As of December 31, | |
Country/Company | | Power Plant Name | | Power Plant Type | | 2015 | | | 2014 | | | 2013 | |
| | | | | | | (in MW) | |
Colombia | | | | | | | | | | | | | | | | |
Emgesa | | | | | | | | | | | | | | | | |
| | Guavio | | Reservoir | | | 1,213 | | | | 1,213 | | | | 1,213 | |
| | Paraíso | | Reservoir | | | 276 | | | | 276 | | | | 276 | |
| | La Guaca | | Pass-through | | | 325 | | | | 325 | | | | 325 | |
| | Termozipa | | Steam Turbine/Coal | | | 236 | | | | 236 | | | | 236 | |
| | Cartagena | | Steam Turbine/ Natural Gas | | | 208 | | | | 208 | | | | 208 | |
| | Minor plants(2) | | Pass-through | | | 57 | | | | 57 | | | | 77 | |
| | Betania | | Reservoir | | | 541 | | | | 541 | | | | 541 | |
| | Dario Valencia(3) | | Pass-through | | | 150 | | | | 150 | | | | 50 | |
| | Salto II(4) | | Pass-through | | | 35 | | | | 35 | | | | — | |
| | Laguneta(5) | | Pass-through | | | 18 | | | | 18 | | | | — | |
| | Quimbo(6) | | Reservoir | | | 400 | | | | — | | | | — | |
| | | | | | | | | | | | | | | | |
Total capacity in Colombia | | | | | | | 3,459 | | | | 3,059 | | | | 2,926 | |
| | | | | | | | | | | | | | | | |
Peru | | | | | | | | | | | | | | | | |
Edegel | | | | | | | | | | | | | | | | |
| | Huinco(7) | | Pass-through | | | 268 | | | | 247 | | | | 247 | |
| | Matucana(8) | | Pass-through | | | 137 | | | | 137 | | | | 133 | |
| | Callahuanca(7) | | Pass-through | | | 84 | | | | 80 | | | | 80 | |
| | Moyopampa(7) | | Pass-through | | | 69 | | | | 66 | | | | 66 | |
| | Huampani | | Pass-through | | | 30 | | | | 30 | | | | 30 | |
| | Santa Rosa(7)(9)(10) | | Gas Turbine/Diesel Oil | | | 419 | | | | 413 | | | | 305 | |
| | Ventanilla(7) | | Combined Cycle/Natural Gas | | | 484 | | | | 485 | | | | 485 | |
| | | | | | | | | | | | | | | | |
| | Total | | | | | 1,491 | | | | 1,458 | | | | 1,346 | |
Chinango | | | | | | | | | | | | | | | | |
| | Yanango | | Pass-through | | | 43 | | | | 43 | | | | 43 | |
| | Chimay(7) | | Pass-through | | | 152 | | | | 151 | | | | 151 | |
| | | | | | | | | | | | | | | | |
| | Total | | | | | 195 | | | | 194 | | | | 194 | |
EEPSA | | Malacas(11)(12) | | Gas Turbine/Natural Gas+Diesel Oil | | | 298 | | | | 297 | | | | 302 | |
| | | | | | | | | | | | | | | | |
| | Total | | | | | 298 | | | | 297 | | | | 302 | |
| | | | | | | | | | | | | | | | |
Total capacity in Peru | | | | | | | 1,984 | | | | 1,949 | | | | 1,842 | |
| | | | | | | | | | | | | | | | |
Consolidated capacity | | | | | | | 10,932 | | | | 10,497 | | | | 10,257 | |
| | | | | | | | | | | | | | | | |
| (1) | Values for 2013, 2014 and 2015 were modified and correspond to values reported to CAMMESA (Argentina TSO). |
| (2) | Minor plants have an aggregate capacity of 57 MW. As of December 31, 2015 and 2014, Emgesa owned and operated three minor plants: Charquito (19.5 MW), El Limonar (18 MW) and Tequendama (19.5 MW). In March 2014, the San Antonio (19.5 MW) plant was decommissioned. |
| (3) | In November 2013, the Dario Valencia power plant began commercial operations with 50 MW of installed capacity. During 2014 unit 1 (January) and unit 5 (April) also began commercial operations, adding 100 MW of capacity. This power plant is part of the Salaco Hydroelectric project, together with the El Limonar, El Salto II and Laguneta power plants. |
| (4) | In June 2014, the El Salto II (35 MW) power plant began commercial operations. |
| (5) | In December 2014, the Laguneta (18 MW) power plant began commercial operations. |
| (6) | In November 2015, El Quimbo (400 MW) power plant began commercial operations. |
| (7) | The variation in the installed capacity of this power plant in 2015 was the result of tests performed by COES. |
| (8) | The Matucana power plant increased its installed capacity by 4 MW in June 2013 and by 4 MW in July 2014 as a result of tests performed by COES. |
| (9) | The variation in the installed capacity of this power plant in 2014 was the result of tests performed by COES. |
| (10) | In October 2013, unit TG 7 (121 MW) of the Santa Rosa power plant was decommissioned and in December 2014 it began commercial operations again. |
| (11) | As a result of the 2013 capital increase, we began consolidating EEPSA as of April 2013. In August 2014, unit TG 1 (11.7 MW) of the Malacas power plant was decommissioned. |
| (12) | Includes the installed capacity (193 MW) of the Reserva Fría de Talara power plant. |
As of December 31, 2015, we received the ISO 14,001 certification for 96.3% of our installed capacity in South America, which included all of our generation facilities that produced 99.1% of the total annual generation in accordance with the this standard.
94
Property, Plant and Equipment of Transmission and Distribution Companies
We have significant interests or investments in electricity distribution. The description for each distribution company is included in this “Item 4. Information on the Company.” The table below describes our main equipment used for our distribution business, such as transmission lines, substations, distribution networks and transformers.
We are insured against damage to substations, transformers that are within the substations, the distribution network that is less one kilometer from the substations and administrative buildings. Risks covered include losses caused by fires, explosions, earthquakes, floods, lightning, damage to machinery and other such events. Insurance policies include liability clauses, which protect our companies from complaints made by third parties.
Transmission lines and the equipment attached to them do not qualify as insurable assets for property damage, although they have insurance policies including civil liability clauses for damages against third parties caused by these transmission installations. These criteria apply in the case of the Argentina-Brazil interconnection line, our main transmission asset, for which there is insurance coverage for damage to the assets and civil liability for the Garabí conversion station, the Argentina/Brazil connection substations and up to one kilometer of lines from the substations. Only third-party liability coverage is applicable for the rest of the transmission lines.
TABLE OF DISTRIBUTION FACILITIES
General Characteristics
| | | | | | | | | | | | | | | | | | |
| | | Location | | Concession Area | | | Transmission
Lines(1) | |
| | | | 2015 | | | 2014 | | | 2013 | |
| | | | | (in km2) | | | (in kilometers) | |
Edesur | | Argentina | | | 3,309 | | | | 1,120 | | | | 1,115 | | | | 1,115 | |
Ampla | | Brazil | | | 32,615 | | | | 2,401 | | | | 2,351 | | | | 2,363 | |
Coelce | | Brazil | | | 148,920 | | | | 5,316 | | | | 5,069 | | | | 4,875 | |
Codensa(2) | | Colombia | | | 14,456 | | | | 1,247 | | | | 1,247 | | | | 1,247 | |
Edelnor | | Peru | | | 1,517 | | | | 573 | | | | 534 | | | | 501 | |
| | | | | | | | | | | | | | | | | | |
Total | | | | | 200,818 | | | | 10,657 | | | | 10,316 | | | | 10,101 | |
| | | | | | | | | | | | | | | | | | |
| (1) | The transmission lines consist of circuits with voltages in the 27-220 kV range. |
| (2) | The concession area figure differs from previous disclosures. Amounts were updated following a review in 2014 of the territorial area of municipalities, conducted by National Administrative Department of Statistics (“DANE” in its Spanish acronym). |
95
Power and Interconnection Substations and Transformers(1)
| | | | | | | | | | | | | | | | | | | | | | | | | | | | | | | | | | | | |
| | | Year ended December 31, | |
| | | 2015 | | | 2014 | | | 2013 | |
| | | Number of
Substations | | | Number of
Transformers | | | Capacity
(MVA) | | | Number of
Substations | | | Number of
Transformers | | | Capacity
(MVA) | | | Number of
Substations | | | Number of
Transformers | | | Capacity
(MVA) | |
Edesur | | | 71 | | | | 180 | | | | 12,424 | | | | 70 | | | | 174 | | | | 11,949 | | | | 67 | | | | 170 | | | | 11,599 | |
Ampla | | | 117 | | | | 220 | | | | 4,725 | | | | 117 | | | | 225 | | | | 4,658 | | | | 117 | | | | 223 | | | | 4,695 | |
Coelce | | | 111 | | | | 179 | | | | 2,955 | | | | 108 | | | | 175 | | | | 2,807 | | | | 106 | | | | 170 | | | | 2,620 | |
Codensa | | | 61 | | | | 238 | | | | 9,448 | | | | 61 | | | | 233 | | | | 8,955 | | | | 61 | | | | 231 | | | | 8,875 | |
Edelnor | | | 35 | | | | 84 | | | | 3,806 | | | | 35 | | | | 81 | | | | 3,621 | | | | 33 | | | | 76 | | | | 3,325 | |
| | | | | | | | | | | | | | | | | | | | | | | | | | | | | | | | | | | | |
Total | | | 395 | | | | 901 | | | | 33,357 | | | | 391 | | | | 888 | | | | 31,990 | | | | 384 | | | | 870 | | | | 31,114 | |
| | | | | | | | | | | | | | | | | | | | | | | | | | | | | | | | | | | | |
| (1) | Voltage of these transformers is in the range of 500 kV (high voltage) and 7 kV (medium voltage). |
Distribution Network - Medium and Low Voltage Lines(1)
| | | | | | | | | | | | | | | | | | | | | | | | |
| | | Year ended December 31, | |
| | | 2015 | | | 2014 | | | 2013 | |
| | | Medium Voltage | | | Low Voltage | | | Medium Voltage | | | Low Voltage | | | Medium Voltage | | | Low Voltage | |
| | | | | | | | | (in Kilometers) | | | | | | | |
Edesur | | | 7,872 | | | | 17,018 | | | | 7,577 | | | | 16,541 | | | | 7,417 | | | | 16,021 | |
Ampla | | | 35,211 | | | | 18,394 | | | | 34,649 | | | | 17,858 | | | | 34,000 | | | | 17,858 | |
Coelce | | | 84,290 | | | | 50,223 | | | | 83,318 | | | | 49,718 | | | | 82,244 | | | | 48,951 | |
Codensa | | | 20,266 | | | | 28,270 | | | | 20,016 | | | | 28,136 | | | | 19,902 | | | | 27,825 | |
Edelnor | | | 4,484 | | | | 22,267 | | | | 4,308 | | | | 21,819 | | | | 4,191 | | | | 21,402 | |
| | | | | | | | | | | | | | | | | | | | | | | | |
Total | | | 152,123 | | | | 136,172 | | | | 149,868 | | | | 134,072 | | | | 147,754 | | | | 132,057 | |
| | | | | | | | | | | | | | | | | | | | | | | | |
| (1) | Medium voltage lines: 7 kV - 34.5 kV; low voltage lines: 380-110 V. |
Transformers for Distribution(1)
| | | | | | | | | | | | | | | | | | | | | | | | |
| | | Year ended December 31, | |
| | | 2015 | | | 2014 | | | 2013 | |
| | | Number of
Transformers | | | Capacity
(MVA) | | | Number of
Transformers | | | Capacity
(MVA) | | | Number of
Transformers | | | Capacity
(MVA) | |
Edesur | | | 20,487 | | | | 6,159 | | | | 22,155 | | | | 6,062 | | | | 22,912 | | | | 5,918 | |
Ampla | | | 120,387 | | | | 4,858 | | | | 118,358 | | | | 4,666 | | | | 115,024 | | | | 4,483 | |
Coelce | | | 145,686 | | | | 4,806 | | | | 142,837 | | | | 4,719 | | | | 140,336 | | | | 4,655 | |
Codensa | | | 69,490 | | | | 9,379 | | | | 68,594 | | | | 9,147 | | | | 67,727 | | | | 8,710 | |
Edelnor | | | 10,758 | | | | 1,774 | | | | 10,532 | | | | 1,699 | | | | 10,368 | | | | 1,617 | |
| | | | | | | | | | | | | | | | | | | | | | | | |
Total | | | 366,808 | | | | 26,976 | | | | 362,476 | | | | 26,293 | | | | 356,367 | | | | 25,383 | |
| | | | | | | | | | | | | | | | | | | | | | | | |
| (1) | Voltage of these transformers is in the range of 34.5 kV (medium voltage) and 110 V (low voltage). |
96
Project Investments
The total investment for each project described below was translated into Chilean pesos at the exchange rate of Ch$ 710.16 per U.S. dollar, the U.S. dollar Observed Exchange Rate as of December 31, 2015. Budgeted amounts include connecting lines that could eventually be owned by third parties and paid as tolls, unless otherwise indicated.
Investment Projects Completed during 2015
El Quimbo Hydroelectric Project (Colombia)
El Quimbo hydroelectric project is located in the province of Huila, southeast of Bogotá, using the flows of the Magdalena and Suaza Rivers, upstream of the Betania power plant. The project has two generation units and a total installed capacity of 400 MW. The estimated average generation is 2,216 GWh per year, with a flooded reservoir area of 8,250 hectares.
On October 6, 2015, the Colombian government enacted the Decree No. 1979/2015, which authorizes energy generation for El Quimbo starting from October 7, 2015. On November 16, 2015, El Quimbo began its commercial operations. On December 15, 2015, the Colombian Constitutional Court declared Decree No. 1979/2015 unconstitutional on the grounds that the injunction issued by the Administrative Tribunal of Huila was still in effect. Emgesa therefore suspended operations of El Quimbo as of midnight on December 16, 2015. On January 10, 2016 at midnight, El Quimbo resumed its commercial operations following a court decision allowing El Quimbo to restart operations on a temporary basis.
This project was financed primarily with external sources, through local and international bonds. The estimated total investment accrued as of December 31, 2015 was Ch$ 683,879 million.
Projects Under Development
We continuously analyze different growth opportunities in the countries in which we participate. Currently, we are studying and assessing our project portfolio, focusing on constructing smaller, less invasive power plants. These plants are constructed faster, allow greater flexibility to activate or deactivate according to system needs, and are generally more acceptable to area residents. Additionally, an additional focus will be placed on the development of renewable technologies. Thus, the expected start-up for each project is continuously assessed and will be defined based on the commercial opportunities and our financing capacity to fund these projects. The most relevant projects in the pipeline are as follows:
Generation Business
Curibamba Hydroelectric Project (Peru)
Curibamba consists of a 188 MW run-of-the-river power plant and a 134 km transmission line that will connect it to SEIN at the Pachachaca substation (220 kV). This power plant will be located 385 km northeast of Lima, which is upstream from the Chimay hydroelectric power plant (province of Junín), and will use the waters of the Comas and Uchubamba Rivers through an 8.1 km penstock.
During 2015, we continued with the bidding process for the project’s main contracts (civil works, equipment supply and electrical interconnection), and we started the studies required for obtaining prior permits to the project construction.
Currently, the project has a generation concession for the power plant, an approved Environmental Impact Study, and compliance certificates stating the non-existence of archaeological remains, both for the power plant and the transmission line.
In January 2015, the Peruvian Ministry of Energy and Mining approved the 2015—2024 Binding Transmission Plan. The connection of the power plant is being reviewed as the 2015—2024 Binding Transmission Plan allows the project to be connected to a closer substation. During 2015, the Pre-Operation Study for the connection to the Yanango Substation, located 40 km from the project, was approved as well as the extension of the validity of the environmental impact study of the power plant. We anticipate our participation in hydroelectric bids that the Peruvian government expects to hold in the future and are currently pending of tender date.
The construction is expected to start in 2016 and last until 2021 as per the timeline in the definitive concession schedule. The construction is expected to last until 2021. This project is being financed primarily with internally generated funds, with an estimated total investment of Ch$ 424,321 million, of which Ch$ 18,177 million has been accrued as of December 31, 2015.
97
Distribution Business
Argentina
In 2015, Edesur invested Ch$ 145 billion in over 513 construction works, enabling an increase in the power carried by the network by 475 MVA. These increases are due to the repowering of Bosques, Caballito, Calzada, Gerli, Gutiérrez, Pérez Galdós, Piñeyro, Santa Rita, Sarandí and Transradio substations. These construction works are complemented by their respective medium voltage distribution networks.
In addition, the installation of medium voltage cables for the three 35 MVA substations acquired in 2014 and located in Azcuénaga, Liniers and Santa Rita were finalized.
For medium and low voltage, 83 transformation centers were installed and/or renovated.
In 2015, Edesur implemented the following contingency plans to cope with extreme temperatures that affected energy consumption: the “2015 Winter Plan” and “2015-2016 Summer Plan”, which established contingency plans, preventive and corrective maintenance of facilities and networks, deepening communication plans, plans of allocation and reallocation of human resources to emergency conditions and implementation of the Emergency Center to manage movement, availability and fuel supplies for generators.
During 2015, a new control and data acquisition systems were installed, which allows monitoring and remote operations of high voltage facilities and equipment of high/high voltage substations and high/medium voltage substations (SCADA system).
In addition, the first stage of the STM system (SCADA for the medium voltage network) was developed and it is expected to begin production in 2016.
Brazil
In 2015, Ampla invested a total of Ch$ 158 billion, allocated to implementing new connections, improving the quality of distribution networks and carrying out projects to reduce energy losses. Ampla invested in control systems, through the use of technology and social activities.
Coelce invested Ch$ 89 billion targeted at satisfying network and connection needs of clients and to support the recent sustained growth in demand in the State of Ceará.
Colombia
In 2015, Codensa invested Ch$ 108 billion, of which Ch$ 61 billion was used for the expansion mainly focused on connections to new clients and networks to improve service quality. In addition, Ch$ 47 billion was invested in projects meant to ensure the sustainability of the distribution business, meet load increases, comply with legal requirements, provide corrective maintenance, improve public lighting infrastructure, invest in systems and communications.
Peru
In 2015, Edelnor invested Ch$ 98 billion, representing an increase of 13% in comparison to 2014. The most important investments were the extension of capacity of transformation substations and transmission lines including works for the new Malvinas, Philadelphia and Comas substations (Ch$ 29 billion), the extension and strengthening of medium and low voltage networks (Ch$ 26 billion), the extension of capacity in feeders in medium and low voltage (Ch$ 6 billion), the assistance/electrification of new projects for the extension of electric networks in shanty towns (Ch$ 6 billion), the safety improvement in facilities (Ch$ 11 billion), the improvement in public lighting infrastructure (Ch$ 2 billion) and other investments focused on reducing commercial losses (Ch$ 3 billion).
Major Encumbrances
Costanera’s supplier debt with Mitsubishi Corporation (“MC”) corresponds to the remaining payments on equipment purchased from MC in November 1996, which was refinanced in October 2014. The value of the assets pledged to secure this debt was Ch$ 10.8 billion as of December 31, 2015. Additionally, Costanera has granted liens in favor of Credit Suisse in guarantee of a loan, which were valued at Ch$ 3.1 billion as of December 31, 2015.
98
Climate Change
In recent years, the countries in which we operate have seen an increase of developments related to NCRE and strategies to combat climate change. This has required both the public and private sectors to adopt strategies in order to comply with the new environmental requirements, as evidenced by legal obligations at the local level, commitments assumed by countries at the international level, and the demanding requirements of the international markets.
NCREs provide energy with minimal environmental impact and with almost no CO2 emissions. They are therefore considered technological options that strengthen sustainable energy development as they supplement the production of traditional generators.
The Callahuanca hydroelectric power station (80.2 MW in operation since 1938) is the NCRE facility that we own, and which has contributed clean and renewable energy to its national grid. Regarding the development of CO2 emission reduction mechanisms, the projects in the Clean Development Mechanism (“CDM”) circuit were as follows:
Ventanilla Conversion from Single-Cycle to Combined-Cycle Power Generation Project: On June 20, 2011, the UNFCCC approved the registration of this project in Peru as a CDM for 7 years, which term is subject to renewal, which recognizes that it may verify and trade the greenhouse gas emissions that it will be avoided during its useful life.
On October 31, 2013, the Ventanilla Conversion from Single-Cycle to Combined-Cycle Power Generation Project obtained the registration/verification under the Voluntary Emission Reductions (“VER”) + standard. A total amount of 2,496,494 tons of CO2 were avoided during the period of October 19, 2006 through June 19, 2011. As a result, Edegel received credit for 2,496,494 tons of CO2 emissions in the form of pre-CDM VERs. Additionally, in June 2014, 7,314 tons of CO2of VERs were negotiated at a value of €0.5 per tons of CO2as part of the voluntary neutralization policy of the group.
The Rehabilitation of the Callahuanca Hydroelectric Power Station Project: On January 4, 2008, the UNFCCC approved the registration of this project in Peru as a CDM for 7 years, which term is subject to renewal, which recognizes that it may verify and trade the greenhouse gas emissions that it will be avoided during its useful life.
On July 7, 2008 the Rehabilitation of the Callahuanca Hydroelectric Power Station Project obtained the registration/verification under the VER + standard. A total amount of 19,951 tons of CO2 were avoided during 2007. As a result, Edegel received credit for 19,949 tons of CO2 emissions in the form of pre-CDM VERs.
Detail of CDM Projects Processed in 2015
| | | | | | | | |
CDM project | | Company/country | | Position as of December 31, 2015 | | Emission factor
(tons
CO2e/MWh) | | Approximate
emissions avoided
(tons CO2e/year)(1) |
| | | | |
| Ventanilla Conversion from Single-Cycle to Combined-Cycle Power Generation Project | | Edegel (Peru) | | Registered with the Executive Authority of the UNFCCC since 2011. CDM procedure implemented. | | 0.454 | | 407,296 |
| | | | |
| Ventanilla Conversion from Single-Cycle to Combined-Cycle Power Generation Project | | Edegel (Peru) | | Registered with the VER + Standard (Voluntary Standard) since October 2013. | | 0.454 | | 407,296 |
| | | | |
| Rehabilitation of the Callahuanca hydroelectric power station | | Edegel (Peru) | | Registered with the Executive Authority of the UNFCCC since 2008. CDM procedure implemented. | | 0.449 | | 18,189 |
| | | | |
| Rehabilitation of the Callahuanca hydroelectric power station | | Edegel (Peru) | | Registered with the VER + Standard (Voluntary Standard) since July 2008. | | 0.449 | | 18,189 |
| | (1) | Obtained from the PDD (Project Design Document) of each project. |
It is expected that our climate change guidelines will be similar to the current Enel group climate change guidelines as part of our commitment to combat climate change.
In compliance with the group climate change guidelines, Edegel has secured the certification of its carbon footprint for a fourth time. The Spanish Association of Standards and Certification (Asociación Española de Normalización y Certificación or “AENOR”), an independent certification authority, acknowledged the validity of the methodology. Acknowledgement by AENOR includes verification of the group’s carbon footprint reports from 2009 to 2014. A carbon footprint is the sum of all greenhouse gases (“GHGs”) produced by a company in the course of its business activity. The first step involves measuring our carbon footprint.
99
The tools used to calculate emissions in Edegel include audits at its facilities. This enables Edegel to monitor carbon footprint in all installations associated with the generation of electrical energy. Calculating the carbon footprint also enables Edegel to identify phases of its activities with the greatest potential to reduce emissions.
As part of the process of calculating our carbon footprint, we plan to obtain a GHG inventory, including direct emissions associated with activities controlled by us. We also plan to obtain a GHG inventory of indirect emissions, which are not generated through sources we control but are consequences of our activities.
| Item 4A. | Unresolved Staff Comments |
None
| Item 5. | Operating and Financial Review and Prospects |
General
The following discussion should be read in conjunction with our consolidated financial statements and the notes thereto, included in Item 18 in this Report, and “Selected Financial Data,” included in Item 3 herein. Our audited consolidated financial statements as of December 31, 2015 and 2014 and for the three years ended December 31, 2015 have been prepared in accordance with IFRS, as issued by the IASB.
| 1. | Discussion of Main Factors Affecting Operating Results and Financial Condition of the Company |
We are an electricity company that owns and operates generation, transmission and distribution companies in Argentina, Brazil, Colombia and Peru. Virtually all of our revenues, income and cash flows come from the operations of our subsidiaries, jointly-controlled companies and associates in these countries.
Factors such as (i) hydrological conditions, (ii) fuel prices, (iii) regulatory developments, (iv) exceptional actions adopted by governmental authorities and (v) changes in the economic conditions in countries in which we operate may materially affect our financial results. In addition, our results from operations and financial condition are affected by variations in the exchange rates between the Chilean peso and the currencies of the countries in which we operate. These exchange variations may materially impact the consolidation of the results of our companies. We have certain critical accounting policies that affect our consolidated operating results.
Our diversification strategy aims to balance the impact of significant changes in one country with opposing changes in other countries, or within generation and distribution, in order to reduce, as much as practicable, the adverse impact of variations in the main factors that affect our consolidated operating results. The impact of these factors on us, for the years covered by this Report, is discussed below.
While we own less than 21.6% of the equity interests and 25.1% of the voting rights of Emgesa as of the date of this Report, Emgesa is regarded as our subsidiary because of Endesa Américas’ control over Emgesa. Endesa Américas directly owns 26.9% of the equity interest and 31.3% of the voting rights of Emgesa (through the ownership of shares with voting rights). Although Endesa Chile owns less than 50% of the equity interest and the voting rights of Emgesa, Endesa Américas is deemed to exercise control over Emgesa as a result of the transfer of 25.1% of the voting rights to Endesa Américas by us and pursuant to a shareholders’ agreement with Empresa de Energía de Bogotá S.A (which owns 51.5% of the equity interest in Emgesa) signed on August 27, 1997. The transfer of the voting rights originated with a prior owner of the 21.6% equity interest and has been continued with each subsequent owner (currently Enersis Américas). The shareholders’s agreement along with the voting rights transferred to Endesa Américas, gives it the right to appoint a majority of Emgesa’s Board members and, therefore Endesa Américas consolidates Emgesa in its consolidated financial statements.
On October 23, 1997, Enersis and Chilectra acquired 48.4% of the equity interest in Codensa through an international public bidding process held by the Colombian government. The remaining interest is held by EEB. As of the date of this Report, we own 48.4% of the equity interest and 57.2% of the voting rights of Codensa (through the ownership of shares with voting rights) both directly and indirectly through our ownership of Chilectra Américas. While we own less than 50% of the equity interests, Codensa is regarded as our subsidiary because of our voting rights. Pursuant to a shareholders’ agreement with EEB (which owns 51.6% of the equity interest in Codensa) signed on October 23, 1997, we have the right to appoint the majority of Codensa’s Board members and, therefore, we continue to consolidate Codensa in our consolidated financial statements.
100
Since April 1, 2013, we have consolidated certain companies contributed by Endesa Spain to us in connection with our 2013 capital increase, which affected the comparison of results of operations for the years ended December 31, 2014 and 2013.
Our electricity generation business is conducted in Argentina through Costanera, El Chocón and Dock Sud, in Brazil through Cachoeira Dourada and Fortaleza, in Colombia through Emgesa, and in Peru through Edegel and EEPSA. A substantial part of our generation capacity depends on the hydrological conditions prevailing in the countries in which we operate. Our installed capacity as of December 31, 2015, 2014 and 2013 was 10,932 MW, 10,497 MW and 10,257 MW, respectively. In those years, our hydroelectric installed capacity represented 53.0%, 51.1% and 50.9% of our total installed capacity, respectively. See “Item 4. Information on the Company – D. Property, Plant and Equipment.”
Hydroelectric generation was 22,171 GWh, 22,439 GWh and 20,979 GWh in 2015, 2014 and 2013, respectively. Our hydroelectric generation in 2015 was 1.2% lower than in 2014 mainly due to less favorable hydrological conditions in Brazil and Colombia, partially offset by better hydrological conditions in Argentina and Peru.
In the countries in which we operate, hydrological conditions can range from very wet to extremely dry. In between these two extremes, there are a wide range of possible hydrological conditions. For instance, a new year of drought has very different impacts on our business, depending on whether it follows several years of drought or a period of abundant rainfall. On the other hand, a good hydrological year has less marginal impact if it comes after several wet years than after a prolonged drought.
In Argentina, the months that typically have the most precipitation are May through August, and the months when snow and ice melts typically occur from October through December, providing flow to the Collon Cura and Limay Rivers which feed El Chocón’s reservoir and hydroelectric plant, located in southwestern Argentina, in the Comahue region.
Brazil has several river basins, with waterfalls that are used for hydroelectric generation. Most of Brazil’s rivers are fed primarily from rainfall. Due to its tropical weather, rainfall is mostly concentrated in summer from November through May, and it is lightest during the winter. These hydrological conditions prevail in southern Brazil at the Paranaiba River at the Parana basin, where our subsidiary, Cachoeira Dourada hydroelectric plant is located.
Hydrological conditions in Colombia vary significantly throughout the different regions and depend on geographical conditions and topography. There are two rainfall patterns. One is characterized by two rainy periods separated by a drier season, that is observed in the Andean region and in the center of the country, the most populated area and the center of economic activity, where all our hydroelectric plants, except the Guavio plant, are located. The second pattern is characterized by a rainy season followed by a drier season, which is observed in the Orinoquia region (eastern part of the country), where our largest hydroelectric plant, Guavio (1,213 MW), is located and its hydrological conditions are influenced by the Amazon.
Hydrological conditions in Peru also vary significantly depending on the location. The coast, which concentrates most of the population and economic activity, typically has less rainfall than the rest of the country. In the Andean mountains, rainfall typically is most abundant from November through March, providing flow to the basin of the Rimac River, feeding five of our seven hydroelectric plants. The jungle area also has most of its rainfall in the same period but in larger volumes, feeding the Tarma and Tulumayo River basins, where our other two hydroelectric plants are located.
For purposes of discussing the impact of hydrological conditions on our business, we generally categorize our hydrological conditions into dry, wet or normal, although there are many other possible scenarios. Extreme hydrological conditions may materially affect our operating results and financial conditions. However, it is difficult to calculate the effects of hydrology on our operating income, without also taking into account other factors, because our operating income can only be explained by looking at a combination of factors and not individually on a stand-alone basis.
Hydrological conditions affect electricity market prices, generation costs, spot prices, tariffs and the mix of hydroelectric or thermal generation, which is constantly being defined by the market operator to minimize the operating cost of the entire system. Pass through hydroelectric generation is almost always the least expensive method to generate electricity and normally has a marginal cost close to zero. However, authorities might assign a cost for the use of water of reservoirs, which may lead to hydroelectric generation not necessarily being the lowest marginal cost. The cost of thermal generation does not depend on hydrological conditions but instead on international commodity prices for LNG, coal, diesel and fuel oil.
Spot prices primarily depend on hydrological conditions and commodity prices. Under most circumstances, abundant hydrological conditions lower spot prices while dry conditions normally increase prices. Spot market prices affect us because we purchase electricity in the spot market in case that we have deficits between our contracted energy sales and our generation, and we sell electricity in the spot market if we have electricity surpluses.
101
There are many other factors that may affect operating income, including the level of contracted sales, purchases/sales in the spot electricity market, commodity prices, energy demand, technical and unforeseen problems that can affect the availability of our thermal plants, plant locations in relation to urban demand centers, and transmission system conditions, among others.
Hydrological conditions do not have an isolated effect but need to be evaluated in conjunction with other factors to better understand the impact on our operating results.
Argentina is a controlled market, with a defined remuneration scheme and no energy and commodity trading. Market prices are unrelated to hydrological conditions or commodity prices. There is no electricity market since free bilateral trading has been suspended. As a consequence, El Chocón sells most of its energy to the market operator at the regulated price, which is not affected by hydrological conditions and its results depend mainly on the amount of electricity it generates. In 2015, El Chocón’s generation increased, resulting in a higher operating income than during the same period in 2014, primarily as a result of better hydrological conditions in the Comahue region. Hydrological conditions were better during 2014 than 2013 for El Chocón but because of the devaluation of the Argentine peso in relation to the Chilean peso, operating income was similar to that in 2013. Costanera and Dock Sud are thermal plants, and therefore their operating results depend on their own thermal generation.
In Brazil, there is an electricity relocation mechanism that provides financial protection against hydrological risks for hydroelectric generators. The market operator defines which hydroelectric plants generate electricity to minimize the system cost and the generators with deficits buy energy from the generators with surpluses at a defined price, the marginal operating cost is set annually by ANEEL. All hydroelectric generators that participate in the Electricity Reallocation Mechanism (“MRE” in its Portuguese acronym), participate in the overall hydroelectric generation dispatched in proportion to their assured energy, regardless their contracted sales. Since 2014, drought has affected all hydroelectric generators that participate in the MRE, and the overall hydroelectric generation system has not been able to cover the assured energy; therefore, hydroelectric generators, including our subsidiaries, buy additional energy in the spot market, at higher prices. Operating results of Cachoeira Dourada were adversely affected in 2014 and 2015 compared to 2013. However, during 2015, Cachoeira Dourada reduced its exposure to the spot market with a positive impact in operating results. Operating income was negatively affected by devaluation of the Brazilian real in relation to the Chilean peso in 2015, and positively by its appreciation in 2014. Fortaleza is a thermal plant, and its results depend mainly on its thermal generation, its generation costs, energy purchase cost and its commercial policy.
In Colombia, hydrological conditions in 2015 and 2014 were influenced by El Niño phenomenon which resulted in drought conditions for the whole system with very high spot prices. However, hydrological conditions affecting our Guavio hydroelectric plant were wet, allowing Emgesa to compensate for the lower hydroelectric generation of its other hydroelectric plants affected by the drought in 2015. In 2014, Emgesa increased its hydroelectric generation compared to 2013. In 2015 and 2014, Emgesa increased its contracted sales and was able to sell its surpluses on the spot market at higher prices, positively affecting Emgesa’s operating income in both years. Operating income was negatively affected by the devaluation of the Colombian peso in relation to the Chilean peso in 2015, and positively by its appreciation in 2014.
In Peru, since 2013, hydrological conditions have been better than the historical average, allowing slightly higher hydroelectric generation, which combined with a drop in commodity prices, the slowing economic growth rate and delays in mining projects, has resulted in electricity oversupply, and even lower spot prices. In 2015, Edegel generated more energy than its contracted sale requirements, despite a decrease in its thermal generation, due to the lower demand of one of its main mining customers. Edegel’s energy surplus is sold on the spot market at a lower price, with negative impact on operating income, which was partially offset by appreciation of the Peruvian sol in relation to the Chilean peso in 2015. Operating income in 2014 was higher than in 2013, mainly due to higher physical sales to regulated customers and being able to purchase energy on the spot market at lower prices. EEPSA is a thermal plant, and its results depend mainly on its generation, its generation costs, energy purchase costs and its commercial policy.
Our electricity distribution business is conducted in Argentina through Edesur, in Brazil through Ampla and Coelce, in Colombia through Codensa, and in Peru through Edelnor. For the year ended December 31, 2015, electricity sales increased by 1.6% compared to 2014, totaling 62,838 GWh. Currently, our distributors serve important South American cities, providing electricity to over 13 million customers. These companies face growing electricity demand, partly because of demographic growth and partly because of higher consumption, which obliges them to continually invest in their facilities.
In the distribution business, revenues are mainly derived from the resale of electricity purchased from generators. Revenues associated with distribution include the recovery of the cost of electricity purchased and the resulting revenue from the “Value Added from Distribution,” or VAD, which is associated with the recovery of costs and the return on the investment with respect to the distribution assets, plus the physical energy losses permitted by the regulator. Other revenues derived from our distribution services consist of charges for new connections and the maintenance and rental of meters, among others.
102
Among the key factors that impact financial results in the distribution business are regulations. This is especially true when the actions adopted by government authorities define or intervene with directly regulated customer tariffs, or affect the price at which distributors can buy their energy. Our ability to buy electricity relies highly on generation availability and to a lesser degree on regulation. In addition, we are focusing on reducing physical losses, especially those due to illegally tapped energy, and improving our collectability indices and our efficiency. The ability to buy electricity relies highly on generation availability and government regulation.
| c. | Selective Regulatory Developments |
The regulatory framework governing our businesses in the countries in which we operate has a material effect on our operating results. In particular, regulators set (i) energy prices in the generation business, taking into consideration factors such as fuel costs, reservoir levels, exchange rates, future investments in installed capacity and demand growth, and (ii) distribution tariffs taking into account the costs of energy purchases paid by distribution companies (which distribution companies pass on to their customers) and the “VAD, all of which are intended to reflect investment and operating costs incurred by distribution and generation companies and to allow our companies to earn a regulated level of return on their investments and guarantee service quality and reliability. The earnings of our electricity subsidiaries are determined to a large degree by regulators, mainly through the tariff setting process.
The distribution tariff setting processes are carried out according to calendars defined by the regulators in each country. For example, in Colombia, Codensa’s tariff review is currently in progress and it is expected to conclude in 2016. In Peru, Edelnor’s tariffs will be reviewed in 2017, and in the case of Coelce and Ampla, the next review is expected in 2019. Each of these reviews presents its own particularities and challenges, since tariff reviews seek to capture distribution efficiency and economies of scale based on economic growth.
In Argentina, the Argentine Secretary of Energy published Resolutions No. 95/2013, No. 529/2014 and No. 482/2015, which set forth a regulated remuneration schedule for generators. In addition, the Secretary of Energy published several Resolutions, including Resolutions No. 250/2013 and No. 32/2015, oriented to increase distributor’s revenues to finance their higher operating costs since the tariff has been unchanged since 2008. On January 27, 2016, the Ministry of Energy and Mining enacted Resolution No. 6/2016 allowing increases in the tariff for the period February 2016 to April 2017.
For additional information relating to the Argentine regulatory frameworks or the regulatory frameworks in the countries where we operate, see “Item 4. Information on the Company — B. Business Overview — Electricity Industry Regulatory Framework.”
Macroeconomic conditions, such as changes in employment levels and inflation or deflation in the countries in which we operate may have a significant effect on our operating results. Macroeconomic factors, such as the variation of a local currency against the U.S. dollar, may impact our operating results, as well as our assets and liabilities, depending on the amounts denominated in U.S. dollars. For example, a devaluation of local currencies against the U.S. dollar increases the cost of capital expenditure plans. For additional information, see “Item 3. Key Information — D. Risk Factors — Foreign exchange risks may adversely affect our results and the U.S. dollar value of dividends payable to ADS holders.” and “— South American economic fluctuations may affect our results from operations and financial condition as well as the value of our securities.”
In order to determine whether Argentina could be qualified as a hyperinflationary economy, we have considered the behavior of historical and projected inflation, along with other indicators established in IAS 29, Financial Reporting in Hyperinflationary Economies. We have also taken into consideration various analyses and studies issued by international agencies such as the International Practices Task Force of the SEC Regulations Committee, which have suggested that Argentina is not currently a hyperinflationary economy. In addition, we have checked with our peers in Argentina and, in that context, have noted that publicly held Argentine companies which adopted IFRS have not introduced adjustments to reflect inflation since the date of their transition to IFRS. In brief, we have not observed objective verifiable data leading to a conclusion that the Argentine economy should be considered a hyperinflationary economy in accordance with the indicators set forth in IAS 29.
103
Local Currency Exchange Rate
Variations in the parity of the U.S. dollar and the local currency in each of the countries in which we operate may have an impact on our operating results and overall financial position. The impact will depend on the level at which tariffs are pegged to the U.S. dollar, U.S. dollar-denominated assets and liabilities and also the translation of financial statements of our foreign subsidiaries for consolidation purposes to the presentation currency, which is the Chilean peso.
As of December 31, 2015, our consolidated debt totaled Ch$ 2,464 billion, of which 15.4% was denominated in U.S. dollars, 48.0% in Colombian pesos, 22.7% in Brazilian reais, 11.8% in Peruvian soles, 1.2% in Argentine pesos and 1.0% in Chilean pesos (including the Chilean UF, which is inflation-indexed).
The following table sets forth the closing and average local currencies per U.S. dollar exchange rates for the years indicated:
| | | | | | | | | | | | | | | | | | | | | | | | |
| | | Local Currency U.S. Dollar Exchange Rates | |
| | | 2015 | | | 2014 | | | 2013 | |
| | | Average | | | Year End | | | Average | | | Year End | | | Average | | | Year End | |
Argentina (Argentine pesos per U.S. dollar) | | | 9.25 | | | | 13.04 | | | | 8.11 | | | | 8.55 | | | | 5.48 | | | | 6.52 | |
Brazil (Brazilian reais per U.S. dollar) | | | 3.34 | | | | 3.90 | | | | 2.35 | | | | 2.66 | | | | 2.16 | | | | 2.34 | |
Colombia (Colombian pesos per U.S. dollar) | | | 2,748 | | | | 3,149 | | | | 1,997 | | | | 2,392 | | | | 1,870 | | | | 1,927 | |
Peru (Peruvian soles per U.S. dollar) | | | 3.18 | | | | 3.41 | | | | 2.84 | | | | 2.99 | | | | 2.70 | | | | 2.80 | |
Chile (Chilean pesos per U.S. dollar) | | | 654.66 | | | | 710.16 | | | | 570.40 | | | | 606.75 | | | | 495.18 | | | | 524.61 | |
Sources: Central banks of each country.
For the year ended December 31, 2015, our revenues were Ch$ 5,301 billion or US$ 8.1 billion, of which 38.0% was generated in Brazil, 29.6% in Colombia, 17.0% in Peru and 15.4% in Argentina.
The appreciation or devaluation of a currency compared to the Chilean peso is calculated by dividing the average foreign currency’s U.S. Dollar Exchange rate by the average Chilean Peso U.S. Dollar Exchange Rate for the same year and comparing the result to the previous year using the same methodology.
The following table show the appreciation or devaluation of 2015 versus 2014 and 2014 versus 2013. When their impacts are significant, they are disclosed and explained in the analysis of results of operations included below.
A positive value signifies that the foreign currency has appreciated with respect to the Chilean peso. A negative value signifies that the foreign currency has devaluated respect to the Chilean peso.
| | | | | | | | |
| | | 2015/2014 | | | 2014/2013 | |
Argentine peso | | | +0.8 | % | | | -22.3 | % |
Brazilian real | | | -19.1 | % | | | +5.7 | % |
Colombian peso | | | -16.5 | % | | | +7.6 | % |
Peruvian sol | | | +2.4 | % | | | +9.6 | % |
Argentina
As a result of the Argentine economic crisis in the early 2000s and the significant governmental intervention in the electricity sector in 2002, we have not received dividends from our Argentine subsidiaries Costanera, Edesur, El Chocón and Dock Sud since 2000, 2009, 2012 and 2013 (the year in which Dock Sud became our subsidiary), respectively. In 2011, we recognized a Ch$ 5.4 billion goodwill impairment charge for Costanera and a Ch$ 115.4 billion infrastructure and goodwill impairment charge for Edesur. Additional economic deterioration of Argentina, or of our subsidiaries that operate in that country, is not expected to have any material effect on our financial and operating results. For more information, see “Item 5. Operating and Financial Review and Prospects. — B. Liquidity & Capital Resources.”
Our Argentine operations do not affect our consolidated liquidity. Our Argentine cash and cash equivalents were Ch$ 46.2 billion as of December 31, 2015, which represents 3.9% of our total cash and cash equivalents. Of the total Argentine cash and cash equivalents, 97.2% is denominated in local currency, and the remaining 2.8% is denominated in U.S. dollars. Our Argentine debt was Ch$ 69.5 billion as of December 31, 2015, representing 2.8% of our total debt. Of the total Argentine debt, 43.4% is denominated in local currency, and the remaining 56.6% is denominated in U.S. dollars. The currency translation effect of converting the statements of comprehensive income from the Argentine peso to the Chilean peso led to a 0.8% increase in the amount in Chilean
104
pesos in 2015 compared to 2014. A default by any of our Argentine subsidiaries on their indebtedness would not affect us since we do not have any debt agreements that include cross default provisions that could be triggered by any Argentine or any other non-Chilean subsidiary’s default. For more information, see “Item 5. Operating and Financial Review and Prospects. — B. Liquidity & Capital Resources.”
The Argentine government avoided increasing electricity distribution tariffs to end customers, and seasonal prices remained fixed in Argentine peso until January 2016. From February 2016, seasonal price was calculated based on the operational programming, dispatch and price calculations, reflecting the actual energy cost and reducing subsidies. On the other hand, generators’ tariffs are also regulated based on defined fixed and variable remuneration. In the recent past, due to tariff controls, revenues of electric utility companies do not always cover their operating costs. Argentine authorities have created a new mechanism to improve the financial situation of these companies in recognition that their performance is directly related to the regulatory framework. For more detail, see “Item 4. Information on the Company — B. Business Overview — Electricity Industry Regulatory Framework — Argentina.”
| e. | Critical Accounting Policies |
Critical accounting policies are defined as those that reflect significant judgments and uncertainties which would potentially result in materially different results under different assumptions and conditions. We believe that our most critical accounting policies with reference to the preparation of our combined financial statements under IFRS are those described below.
For further detail of the accounting policies and the methods used in the preparation of the consolidated financial statements, see Notes 2 and 3 of the Notes to our consolidated financial statements.
Impairment of Long-Lived Assets
During the year, and principally at year end, we evaluate whether there is any indication that an asset has become impaired. Should any such indication exist, we estimate the recoverable amount of that asset to determine, where appropriate, the amount of impairment. In the case of identifiable assets that do not generate cash flows independently, we estimate the recoverability of the cash generating unit to which the asset belongs, which is understood to be the smallest identifiable group of assets that generates independent cash inflows.
Notwithstanding the preceding paragraph, in the case of cash generating units to which goodwill or intangible assets with an indefinite useful life have been allocated, a recoverability analysis is performed routinely at each period end.
The recoverable amount is the greater of (i) the fair value less the cost needed to sell the asset and (ii) the value in use. “Value in use” is defined as the present value of the estimated future cash flows. In order to calculate the recoverable value of property, plant and equipment, goodwill and intangible assets, that form part of a cash generating unit, we use value in use criteria in nearly all cases.
To estimate the value in use, we prepare future pre-tax cash flow projections based on the most recent budgets available. These budgets incorporate management’s best estimates of cash generating units’ revenues and costs using sector projections, past experience and future expectations.
In general, these projections cover the next five years, estimating cash flows for subsequent years by applying reasonable growth rates, between 3.1% and 11.1%, which are not increasing nor do they exceed the average long-term growth rates for the particular sector and country.
These cash flows are discounted at a given pre-tax rate in order to calculate their present value. This rate reflects the cost of capital of the business and the geographical area in which the business is conducted. The discount rate is calculated taking into account the current time value of money and the risk premiums generally used by market participants for the specific business activity and the country involved.
105
The pre-tax nominal discount rates applied in 2015, 2014 and 2013 are as follows:
| | | | | | | | | | | | | | | | | | | | | | | | | | |
| | | | | Year ended December 31, | |
| | | | | 2015 | | | 2014 | | | 2013 | |
Country | | Currency | | Minimum | | | Maximum | | | Minimum | | | Maximum | | | Minimum | | | Maximum | |
| | | | | (in %) | |
Argentina | | Argentine peso | | | 32.7 | | | | 39.4 | | | | 23.3 | | | | 38.9 | | | | 39.2 | | | | 44.4 | |
Brazil | | Brazilian reais | | | 11.1 | | | | 21.1 | | | | 9.7 | | | | 22.7 | | | | 9.0 | | | | 18.8 | |
Colombia | | Colombian peso | | | 8.5 | | | | 15.1 | | | | 8.0 | | | | 13.3 | | | | 8.5 | | | | 14.2 | |
Peru | | Peruvian sol | | | 7.3 | | | | 13.5 | | | | 7.3 | | | | 14.3 | | | | 7.3 | | | | 13.9 | |
If the recoverable amount is less than the net carrying amount of the cash generating unit, the corresponding impairment loss provision is recognized for the difference, and charged to “Reversal of impairment loss (impairment loss) recognized in profit or loss” in the consolidated statement of comprehensive income.
Impairment losses recognized for an asset in prior periods are reversed when its estimated recoverable amount changes, increasing the asset’s value with a credit to earnings, limited to the asset’s carrying amount if no adjustment had occurred. In the case of goodwill, any adjustments made are not reversible.
Litigation and Contingencies
We are currently involved in certain legal and tax proceedings. As discussed in Note 24 of the Notes to our consolidated financial statements as of December 31, 2015, we have estimated the probable outflows of resources for resolving these claims to be Ch$ 187 billion. We have reached this estimate after consulting our legal and tax advisors who are defending us in these matters and after an analysis of potential results, assuming a combination of litigation and settlement strategies.
Hedge Revenues Directly Linked to the U.S. Dollar
We have established a policy to hedge the portion of our revenues directly linked to the U.S. dollar by obtaining financing in U.S. dollars. Exchange differences related to this debt, as they are cash flow hedge transactions, are charged net of taxes to an equity reserve account that forms part of Other Comprehensive Income and recorded as income during the period in which the hedged cash flows are realized. This term has been estimated at ten years.
This policy reflects a detailed analysis of our future U.S. dollar revenue streams. Such analysis may change in the future due to new electricity regulations limiting the amount of cash flows tied to the U.S. dollar.
Pension and Post-Employment Benefit Liabilities
We have various defined benefit plans for our employees. These plans pay benefits to employees at retirement and use formulas based on years of service and the compensation of the participants. We also offer certain additional benefits for particular retired employees.
The liabilities shown for the pensions and post-employment benefits reflect our best estimate of the future cost of meeting our obligations under these plans. The accounting applied to these defined benefit plans involves actuarial calculations which contain key assumptions including employee turnover, life expectancy, retirement age, discount rates, the future level of employee compensation and benefits, the claims rate under medical plans and future medical costs. These assumptions change as economic and market conditions vary and any change in any of these assumptions could have a material effect on the reported results from operations.
The effect of an increase of one percentage in the discount rate used to determine the present value of the post-employment defined benefits would decrease the liability by Ch$ 32.6 billion, Ch$ 46.8 billion and Ch$ 42.0 billion as of December 31, 2015, 2014 and 2013, respectively, and the effect of a decrease of one percentage in the rate used to determine the present value of the post-employment defined benefits would increase the liability by Ch$ 38.0 billion, Ch$ 56.7 billion and Ch$ 49.3 billion as of December 31, 2015, 2014 and 2013, respectively.
106
Recent Accounting Pronouncements
Please see Note 2.2 of the Notes to our consolidated financial statements for additional information regarding recent accounting pronouncements.
| 2. | Analysis of Results of Operations for the Years Ended December 31, 2015 and 2014. |
I. Analysis of Results from Continuing Operations
Revenues from Continuing Operations
Generation and Transmission Business
The following table sets forth the electricity sales of our subsidiaries and the corresponding changes for the years ended December 31, 2015 and 2014:
| | | | | | | | | | | | | | | | |
| | | Electricity sales during the year ended December 31, | |
| | | 2015 | | | 2014 | | | Change | | | Change | |
| | | (in GWh) | | | (in %) | |
Costanera (Argentina) | | | 8,168 | | | | 7,051 | | | | 1,117 | | | | 15.8 | |
El Chocón (Argentina) | | | 3,801 | | | | 3,391 | | | | 410 | | | | 12.1 | |
Dock Sud (Argentina) | | | 3,802 | | | | 4,834 | | | | (1,032) | | | | (21.3) | |
Cachoeira Dourada (Brazil) | | | 3,215 | | | | 3,903 | | | | (688) | | | | (17.6) | |
Fortaleza (Brazil) | | | 3,326 | | | | 3,205 | | | | 121 | | | | 3.8 | |
Emgesa (Colombia) | | | 16,886 | | | | 15,773 | | | | 1,113 | | | | 7.1 | |
Edegel (Peru) | | | 8,633 | | | | 9,320 | | | | (687) | | | | (7.4) | |
EEPSA (Peru) | | | 650 | | | | 596 | | | | 54 | | | | 9.1 | |
| | | | | | | | | | | | | | | | |
Total | | | 48,481 | | | | 48,073 | | | | 408 | | | | 0.8 | |
| | | | | | | | | | | | | | | | |
Distribution Business
The following table sets forth the electricity sales of our subsidiaries, by country, and their corresponding variations for the years ended December 31, 2015 and 2014:
| | | | | | | | | | | | | | | | |
| | | Electricity sales during the year ended December 31, | |
| | | 2015 | | | 2014 | | | Change | | | Change | |
| | | (in GWh) | | | (in %) | |
Edesur (Argentina) | | | 18,492 | | | | 17,972 | | | | 520 | | | | 2.9 | |
Ampla (Brazil) | | | 11,547 | | | | 11,678 | | | | (131) | | | | (1.1) | |
Coelce (Brazil) | | | 11,229 | | | | 11,165 | | | | 64 | | | | 0.6 | |
Codensa (Colombia) | | | 13,946 | | | | 13,660 | | | | 286 | | | | 2.1 | |
Edelnor (Peru) | | | 7,624 | | | | 7,338 | | | | 286 | | | | 3.9 | |
| | | | | | | | | | | | | | | | |
Total | | | 62,838 | | | | 61,813 | | | | 1.025 | | | | 1.6 | |
| | | | | | | | | | | | | | | | |
107
The following table sets forth the revenues from continuing operations, by business segment and company for the years ended December 31, 2015 and 2014:
| | | | | | | | | | | | | | | | |
| | | Year ended December 31, | |
| | | 2015 | | | 2014 | | | Change | | | Change | |
| | | (in millions of Ch$) | | | (in %) | |
Generation and Transmission Business | | | | | | | | | | | | |
Costanera (Argentina) | | | 100,857 | | | | 75,194 | | | | 25,663 | | | | 34.1 | |
El Chocón (Argentina) | | | 40,005 | | | | 30,174 | | | | 9,831 | | | | 32.6 | |
Dock Sud (Argentina) | | | 69,963 | | | | 61,606 | | | | 8,357 | | | | 13.6 | |
Cemsa (Argentina) | | | 2,270 | | | | 1,281 | | | | 989 | | | | 77.2 | |
Cachoeira Dourada (Brazil) | | | 91,563 | | | | 158,965 | | | | (67,402) | | | | (42.4) | |
Fortaleza (Brazil) | | | 159,052 | | | | 210,793 | | | | (51,741) | | | | (24.5) | |
CIEN (Brazil) | | | 58,667 | | | | 70,800 | | | | (12,133) | | | | (17.1) | |
Emgesa (Colombia) | | | 778,756 | | | | 753,373 | | | | 25,383 | | | | 3.4 | |
Edegel (Peru) | | | 382,453 | | | | 353,795 | | | | 28,658 | | | | 8.1 | |
EEPSA (Peru) | | | 58,093 | | | | 50,849 | | | | 7,244 | | | | 14.2 | |
Other | | | (6,917) | | | | (3,961) | | | | (2,956) | | | | 74.6 | |
| | | | | | | | | | | | | | | | |
Total | | | 1,734,762 | | | | 1,762,869 | | | | (28,107) | | | | (1.6) | |
| | | | |
Distribution Business | | | | | | | | | | | | | | | | |
Edesur (Argentina) | | | 607,345 | | | | 371,412 | | | | 235,933 | | | | 63.5 | |
Ampla (Brazil) | | | 1,026,680 | | | | 1,092,282 | | | | (65,602) | | | | (6.0) | |
Coelce (Brazil) | | | 810,184 | | | | 876,944 | | | | (66,760) | | | | (7.6) | |
Codensa (Colombia) | | | 884,468 | | | | 982,771 | | | | (98,303) | | | | (10.0) | |
Edelnor (Peru) | | | 562,046 | | | | 478,700 | | | | 83,346 | | | | 17.4 | |
| | | | | | | | | | | | | | | | |
Total | | | 3,890,723 | | | | 3,802,109 | | | | 88,614 | | | | 2.3 | |
Less: consolidation adjustments and non-core activities | | | (324,045) | | | | (358,608) | | | | 34,563 | | | | (9.6) | |
| | | | | | | | | | | | | | | | |
Total | | | 5,301,440 | | | | 5,206,370 | | | | 95,070 | | | | 1.8 | |
| | | | | | | | | | | | | | | | |
Generation and Transmission Business: Revenues from Continuing Operations
In Argentina, revenues from Costanera increased by Ch$ 25.7 billion or 34.1% in 2015, comprised principally of Ch$ 8.8 billion due to tariff increases related to Resolution No. 482/2015, Ch$ 5.6 billion due to 1,195 GWh higher thermal dispatch, and Ch$ 3 billion related to its combined-cycle availability contracts executed with the Secretary of Energy. Revenues from El Chocón also increased by 32.6%, or Ch$ 9.8 billion, mostly due to Ch$ 7.6 billion related to 607 GWh higher hydroelectric dispatch because of improved hydrological conditions and Ch$ 2.6 billion attributable to higher tariffs related to Resolution No. 482/2015. In addition, revenues from Dock Sud also increased by 13.6% or Ch$ 8.4 billion principally due to a Ch$ 7.3 billion increase in energy sales, mainly due to higher tariffs related to Resolution No. 482/2015.
In Brazil, revenues from Cachoeira Dourada decreased by Ch$ 67.4 billion, or 42.4%, in 2015, mainly due to a Ch$ 37.1 billion decrease as a consequence of a lower price on the spot market and a Ch$ 30.3 billion decrease due to the devaluation of Brazilian real in relation to the Chilean peso, which resulted in a 19.1% decline in Chilean peso in 2015 as compared to 2014. Revenues from Fortaleza decreased by 24.5% or Ch$ 51.7 billion for the year 2015 as a result of a Ch$ 40.2 billion decrease due to devaluation of Brazilian real and a Ch$ 11.6 billion decline of the price on the spot market. Revenues from CIEN decreased by 17.1% or Ch$ 12.1 billion mainly due to devaluation of Brazilian real that resulted in Ch $ 12.9 million lower revenues.
Revenues from Emgesa in Colombia increased by Ch$ 25.4 billion, or 3.4%, in 2015, due to Ch$ 60.2 billion higher physical sales of 1,113 GWh, mainly contracted sales, and Ch$ 90.2 billion increase related to higher sales price on the spot market as a result of drought caused by El Niño phenomenon. These increases were partially offset by a Ch$ 124.1 billion loss due to the devaluation of Colombian peso in relation to the Chilean peso, which resulted in a 16.5% decline in terms of Chilean peso in 2015 as compared to 2014.
Revenues from Edegel in Peru grew by 8.1%, or Ch$ 28.7 billion in 2015. The appreciation of the Peruvian sol in relation to the Chilean peso resulted in a 2.4% increase in revenues, or Ch$ 52.8 billion compared to 2014. This was partly offset by a Ch$ 19.1billion decrease from 687 GWh of lower physical sales primarily to distribution companies, and a Ch$ 4.8 billion decrease due to lower spot prices because of lower demand. In EEPSA, revenues were 14.2%, or Ch$ 7.2 billion, higher than in 2014 mainly due to Ch$ 7.6 billion increase due to the appreciation of the Peruvian sol.
108
Distribution Business: Revenues from Continuing Operations
Revenues from Edesur in Argentina increased by Ch$ 235.9 billion, or 63.5% in 2015, mainly due to a Ch$351.5 billion increase related to the application of Resolution No. 32/2015, which was comprised of: (i) Ch$ 305.9 billion of anon-recurring revenues to finance the expenses and investments associated with the normal public electricity energy distribution service; (ii) Ch$ 34.0 billion due to the recognition as revenues from PUREE funds beginning on February 1, 2015; and (iii) Ch$ 11.6 billion of additional revenues due to recognition in January 2015 of costs not transferred to tariff. In 2014, Edesur also recorded extraordinary revenues of Ch$ 144.3 billion as a result of the application of Resolution No. 250/2013, which recognized costs not transferred to tariff between October 2013 and December 2014.
Revenues from Ampla, in Brazil, decreased by Ch$ 65.6 billion, or 6.0% in 2015, mainly due to the devaluation of the Brazilian real in relation to the Chilean peso of Ch$ 208.2 billion, partially offset by Ch$ 142.6 billion higher revenues from operations mainly composed by (i) Ch$ 83.5 billion increase due to 11% greater average sale price due to tariff adjustments, (ii) Ch$ 50 billion mainly due to regulatory revenues and (iii) Ch$ 16.3 billion greater revenues due to higher tolls. Revenues from Coelce decreased by Ch$ 66.8 billion, or 7.6%, in 2015, mainly due to the devaluation of Brazilian real of Ch$ 167.1 billion, partially offset by (i) Ch$ 57.5 billion increase due to 9% greater average sale price due to tariff adjustments and (ii) Ch$ 31 billion mainly due to regulatory revenues.
Revenues from Codensa decreased by Ch$ 98.3 billion, or 10.0%, in 2015, mainly due to Ch$162.1 billion related to the devaluation of the Colombian peso in relation to the Chilean peso, which was partially offset by (i) Ch$ 33.9 billion due to 5% increase of the average sale price due to tariff adjustments, (ii) Ch$ 14.2 billion higher physical energy sales of 286 GWh mainly due to greater commercial and industry activity and (iii) Ch$ 10.2 billion higher other distribution services.
In Peru, revenues from Edelnor increased by Ch$ 83.4 million in 2015, mainly attributable to higher sales of Ch$ 80.4 billion due to (i) Ch$ 51.9 billion, or 11%, higher average sale prices due to tariff adjustments, (ii) Ch$ 17.9 billion higher physical energy sales of 286 GWh and (iii) Ch$ 10.6 billion due to the appreciation of the Peruvian sol in relation to the Chilean peso.
Total Operating Costs from Continuing Operations
Total operating costs from continuing operations consist primarily of energy purchases from third parties, fuel consumption, depreciation, amortization and impairment losses, maintenance costs, tolls paid to transmission companies, employee salaries and administrative and selling expenses.
The following table sets forth the consolidated operating costs in Chilean pesos and, as a percentage of total consolidated operating costs from continuing operations, for the years ended December 31, 2015 and 2014:
| | | | | | | | | | | | | | | | |
| | | Year ended December 31, | |
| | | 2015 | | | 2014 | |
| | | (in millions of Ch$) | | | (in %) | | | (in millions of Ch$) | | | (in %) | |
Energy purchases | | | 1,885,916 | | | | 46.6 | | | | 1,824,003 | | | | 47.8 | |
Fuel consumption | | | 258,114 | | | | 6.4 | | | | 205,534 | | | | 5.4 | |
Transportation costs | | | 245,813 | | | | 6.1 | | | | 265,185 | | | | 6.9 | |
Other raw materials and combustibles | | | 387,358 | | | | 9.6 | | | | 336,947 | | | | 8.8 | |
Other expenses (1) | | | 488,529 | | | | 12.0 | | | | 463,729 | | | | 12.2 | |
Employee benefit expense and other (1) | | | 420,597 | | | | 10.4 | | | | 333,898 | | | | 8.7 | |
Depreciation, amortization and impairment losses (1) | | | 360,354 | | | | 8.9 | | | | 389,073 | | | | 10.2 | |
| | | | | | | | | | | | | | | | |
Total Operating Cost from Continuing Operations | | | 4,046,681 | | | | 100.0 | | | | 3,818,369 | | | | 100.0 | |
| | | | | | | | | | | | | | | | |
| (1) | Corresponds to selling and administration expenses |
109
The following table sets forth our total operating costs (excluding selling and administrative expenses) from continuing operations by business segment and company for the years ended December 31, 2015 and 2014:
| | | | | | | | | | | | | | | | |
| | | Year ended December 31, | |
| | | 2015 | | | 2014 | | | Change | | | Change | |
| | | (in millions of Ch$) | | | (in %) | |
Generation and Transmission Business | | | | | | | | | | | | |
Costanera (Argentina) | | | 4,598 | | | | 6,777 | | | | (2,179) | | | | (32.2) | |
El Chocón (Argentina) | | | 4,574 | | | | 8,427 | | | | (3,853) | | | | (45.7) | |
Dock Sud (Argentina) | | | 43,266 | | | | 34,976 | | | | 8,290 | | | | 23.7 | |
Cemsa (Argentina) | | | 1,018 | | | | 203 | | | | 815 | | | | 401.5 | |
Cachoeira Dourada (Brazil) | | | 17,396 | | | | 72,988 | | | | (55,592) | | | | (76.2) | |
Fortaleza (Brazil) | | | 111,229 | | | | 158,318 | | | | (47,089) | | | | (29.7) | |
CIEN (Brazil) | | | 3,126 | | | | 3,343 | | | | (217) | | | | (6.5) | |
Emgesa (Colombia) | | | 321,529 | | | | 220,303 | | | | 101,226 | | | | 45.9 | |
Edegel (Peru) | | | 151,046 | | | | 133,735 | | | | 17,311 | | | | 12.9 | |
EEPSA (Peru) | | | 26,124 | | | | 20,916 | | | | 5,208 | | | | 24.9 | |
Other | | | (5,965) | | | | (6,298) | | | | (333) | | | | (5.3) | |
| | | | | | | | | | | | | | | | |
Total | | | 677,941 | | | | 653,688 | | | | 24,253 | | | | 3.7 | |
| | | | |
Distribution Business | | | | | | | | | | | | | | | | |
Edesur (Argentina) | | | 157,387 | | | | 161,995 | | | | (4,608) | | | | (2.8) | |
Ampla (Brazil) | | | 804,701 | | | | 707,301 | | | | 97,400 | | | | 13.8 | |
Coelce (Brazil) | | | 581,689 | | | | 606,422 | | | | (24,733) | | | | (4.1) | |
Codensa (Colombia) | | | 500,572 | | | | 547,594 | | | | (47,022) | | | | (8.6) | |
Edelnor (Peru) | | | 379,015 | | | | 315,116 | | | | 63,899 | | | | 20.3 | |
| | | | | | | | | | | | | | | | |
Total | | | 2,423,364 | | | | 2,338,428 | | | | 84,936 | | | | 3.6 | |
Less: consolidation adjustments and non-core activities | | | (324,103) | | | | (360,447) | | | | (36,344) | | | | (10.1) | |
| | | | | | | | | | | | | | | | |
Total | | | 2,777,202 | | | | 2,631,669 | | | | 145,533 | | | | 5.5 | |
| | | | | | | | | | | | | | | | |
Generation and Transmission Business: Operating Costs from Continuing Operations
In Argentina, operating costs decreased by Ch$ 2.2 billion, or 32.2% and Ch$ 3.9 billion, or 45.7% in Costanera and El Chocón respectively, mainly due to lower energy purchases in Costanera by Ch$ 2.3 billion and in El Chocón Ch$ 2.2 billion both because of the termination of sale contracts, which were not renewed under the actual regulation. Operating costs of Dock Sud rose by Ch$ 8.3 billion, or 23.7%, in 2015, mainly due to higher fuel consumption of Ch$ 7.8 billion, which was ultimately reimbursed by CAMMESA in the scheme remuneration.
In Brazil, operating costs of Cachoeira Dourada decreased by Ch$ 55.6 billion, or 76.2%, in 2015, mainly due to a lower spot average purchase price equivalent of Ch$ 37.8 billion and devaluation of the Brazilian real in relation to the Chilean peso that implied Ch$ 11.2 billion of lower costs. Operating costs of Fortaleza decreased by Ch$ 47.1 billion, or 29.7%, in 2015, mainly due to lower average purchase price amounting Ch$ 31.1 billion lower costs and the devaluation of the Brazilian real that resulted in Ch$ 17.8 billion decrease. Operating costs of CIEN decreased by Ch$ 0.2 billion, or 6.5%, in 2015, mainly due to other variable procurement and services expenses.
In Colombia, operating costs of Emgesa increased by Ch$ 101.2 billion, or 45.9%, in 2015, mainly attributable to Ch$ 95.2 billion higher energy purchases due higher spot prices, which in turn was as a result of the drought, and Ch$ 35.4 billion related to 550 MWh higher thermal generation. These increases were partially offset by a Ch$ 36.5 billion gain due to the devaluation of the Colombian peso in relation to the Chilean peso.
In Peru, operating costs of Edegel rose by Ch$ 17.3 billion, or 12.9%, in 2015, mainly due to a Ch$ 20.0 billion higher cost related to the appreciation of the Peruvian sol in relation to the Chilean peso. This increase was partially offset by a Ch$ 2.8 billion decrease related to lower spot prices. In EEPSA, operating costs increased by Ch$ 5.2 billion or 24.9% in 2015, mainly due to a Ch$ 3.1 billion increase due to the appreciation of the Peruvian sol and Ch$ 2.1 billion due to higher transportation costs.
110
Distribution Business: Operating Costs from Continuing Operations
In Argentina, Edesur’s operating costs decreased by Ch$ 4.6 billion, or 2.8% in 2015, mainly to lower energy purchases explained by a Ch$ 14.5 billion reduction related to lower average energy purchase prices partially offset by Ch$ 8.7 billion higher energy physical purchases and Ch$ 1.2 billion higher costs because of the appreciation of the Argentine peso in relation to the Chilean Peso.
In Brazil, operating costs of Ampla increased by Ch$ 97.4 billion, or 13.8%, in 2015, mainly due to Ch$ 175.3 billion higher energy purchase prices related to the drought, and Ch$ 58 billion higher regulatory costs, which was partially offset by Ch$ 134.8 billion lower costs related to the devaluation of the Brazilian real in relation to the Chilean peso. In Coelce, operating costs decreased by Ch$ 24.7 billion, or 4.1%, in 2015, due to depreciation of Brazilian real, which resulted in Ch$ 115.6 billion lower costs, which was partially offset by Ch$ 50.8 billion higher energy purchases due to higher purchase prices because of the drought and Ch$ 31 billion higher other procurement expenses related to higher regulatory costs.
In Codensa, operating costs decreased by Ch$ 47.0 billion, or 8.6%, in 2015, mainly due to the devaluation of the Colombian peso in relation to the Chilean peso that resulted in Ch$ 90.4 billion lower costs, which was partially offset by (i) Ch$ 28.1 billion higher energy purchase due to Ch$ 17.8 billion related to a 4.9% higher purchase price and Ch$ 10.3 billion increased physical energy purchases due to greater demand and (ii) Ch$ 9.3 billion higher transportation expenses.
Operating costs of Edelnor increased by Ch$ 63.9 billion, or 20.3%, in 2015, mainly due to Ch$ 43.8 billion increase attributable to 14% higher energy prices due to the incorporation of new contract as result of the latest energy bids and Ch$ 8.2 billion increased physical energy purchases. In addition, due to the appreciation of the Peruvian sol in relation to the Chilean peso, operating costs increased by Ch$ 7.4 billion.
Selling and Administrative Expenses from Continuing Operations
Selling and administrative expenses relate to salaries, compensation, administrative expenses, depreciation, amortization and impairment losses, and office materials and supplies.
The following table sets forth our consolidated selling and administrative expenses, as a percentage of total consolidated selling and administrative expenses from continuing operations, for the years ended December 31, 2015 and 2014:
| | | | | | | | |
| | | Year ended December 31, | |
| | | 2015 | | | 2014 | |
| Selling and Administrative Expenses as a Percentage of Total Selling and Administrative Expenses | | (in %) | |
Other expenses | | | 38.5 | | | | 39.1 | |
Employee benefit expense and other | | | 33.1 | | | | 28.1 | |
Depreciation, amortization and impairment losses | | | 28.4 | | | | 32.8 | |
| | | | | | | | |
Total | | | 100 | | | | 100 | |
| | | | | | | | |
111
The following table sets forth the selling and administrative expenses by business segment and company for the years ended December 31, 2015 and 2014:
| | | | | | | | | | | | | | | | |
| | | Year ended December 31, | |
| | | 2015 | | | 2014 | | | Change | | | Change | |
| | | (in millions of Ch$) | | | (in %) | |
Generation and Transmission Business | | | | | | | | | | | | |
Costanera (Argentina) | | | 75,887 | | | | 54,715 | | | | 21,172 | | | | 38.7 | |
El Chocón (Argentina) | | | 8,422 | | | | 7,408 | | | | 1,014 | | | | 13.7 | |
Dock Sud (Argentina) | | | 23,387 | | | | 17,165 | | | | 6,222 | | | | 36.3 | |
Cemsa (Argentina) | | | 2,507 | | | | 1,912 | | | | 595 | | | | 31.1 | |
Cachoeira Dourada (Brazil) | | | 12,194 | | | | 14,124 | | | | (1,930) | | | | (13.7) | |
Fortaleza (Brazil) | | | 12,956 | | | | 15,481 | | | | (2,525) | | | | (16.3) | |
CIEN (Brazil) | | | 19,503 | | | | 25,336 | | | | (5,833) | | | | (23.0) | |
Emgesa (Colombia) | | | 84,362 | | | | 83,435 | | | | 927 | | | | 1.1 | |
Edegel (Peru) | | | 91,751 | | | | 78,902 | | | | 12,849 | | | | 16.3 | |
EEPSA (Peru) | | | 14,305 | | | | 12,345 | | | | 1,960 | | | | 15.9 | |
Other | | | (3,149) | | | | (1,944) | | | | 1,205 | | | | (62.0) | |
| | | | | | | | | | | | | | | | |
Total | | | 342,125 | | | | 308,879 | | | | 33,246 | | | | 10.8 | |
| | | | |
Distribution Business | | | | | | | | | | | | | | | | |
Edesur (Argentina) | | | 346,183 | | | | 260,646 | | | | 85,537 | | | | 32.8 | |
Ampla (Brazil) | | | 195,556 | | | | 201,135 | | | | (5,579) | | | | (2.8) | |
Coelce (Brazil) | | | 127,584 | | | | 153,142 | | | | (25,558) | | | | (16.7) | |
Codensa (Colombia) | | | 148,308 | | | | 173,202 | | | | (24,894) | | | | (14.4) | |
Edelnor (Peru) | | | 75,326 | | | | 72,598 | | | | 2,733 | | | | 3.8 | |
Other | | | 1,383 | | | | 1,250 | | | | 128 | | | | 10.2 | |
| | | | | | | | | | | | | | | | |
Total | | | 894,340 | | | | 861,973 | | | | 32,367 | | | | 3.7 | |
Less: consolidation adjustments and non-core activities | | | 33,015 | | | | 15,849 | | | | 17,166 | | | | 108.3 | |
| | | | | | | | | | | | | | | | |
Total | | | 1,269,480 | | | | 1,186,701 | | | | 82,779 | | | | 7.0 | |
| | | | | | | | | | | | | | | | |
Selling and administrative expenses from continuing operations increased by Ch$ 82.8 billion, or 7.0%, in 2015 as compared to 2014, as explained below.
In Argentina, selling and administrative expenses of Costanera increased by Ch$ 21.2 billion primarily due to higher payroll expenses of Ch$12.7 billion following increases in the workforce and in wages and benefits and higher depreciation and impairment loss expenses of Ch$ 5.3 billion. In Dock Sud, selling and administrative expenses increased by Ch$ 6.2 billion in 2015 as compared to 2014 mainly due to higher depreciation of Ch$ 5.8 billion and higher payroll expenses of Ch$ 2.1 billion resulting from increases in wages and benefits. In Edesur, selling and administrative expenses increased by Ch$ 85.5 billion mainly due to higher payroll expenses of Ch$ 72.9 billion, following increases in wages and benefits, higher other expenses of Ch$ 10.5 billion due to contractor costs and higher depreciation expenses of Ch$ 2.5 billion.
In our Brazilian and Colombian subsidiaries, selling and administrative expenses decreased mainly related to the favorable currency translation effect of converting the Brazilian real and Colombian peso to the Chilean peso, respectively.
In Peru, selling and administrative expenses of Edegel increased by Ch$12.9 billion in 2015 as compared to 2014, mainly attributable to higher depreciation expense and impairment losses of Ch$ 7.3 billion, higher other expenses related contract services of Ch$ 3.7 billion and higher payroll expenses of Ch$ 1.8 billion.
112
Operating Income from Continuing Operations
The following table sets forth our operating income from continuing operations by business segment and company for the years ended December 31, 2015 and 2014:
| | | | | | | | | | | | | | | | |
| | | Year ended December 31, | |
| | | 2015 | | | 2014 | | | Change | | | Change | |
| | | (in millions of Ch$) | | | (in %) | |
Generation and Transmission Business | | | | | | | | | | | | |
Costanera (Argentina) | | | 20,372 | | | | 13,702 | | | | 6,670 | | | | 48.7 | |
El Chocón (Argentina) | | | 27,009 | | | | 14,339 | | | | 12,670 | | | | 88.4 | |
Dock Sud (Argentina) | | | 3,310 | | | | 9,465 | | | | (6,155) | | | | (65.0) | |
Cemsa (Argentina) | | | (1,255) | | | | (834) | | | | (421) | | | | 50.5 | |
Cachoeira Dourada (Brazil) | | | 61,973 | | | | 71,853 | | | | (9,880) | | | | (13.8) | |
Fortaleza (Brazil) | | | 34,867 | | | | 36,994 | | | | (2,127) | | | | (5.7) | |
CIEN (Brazil) | | | 36,038 | | | | 42,121 | | | | (6,083) | | | | (14.4) | |
Emgesa (Colombia) | | | 372,865 | | | | 449,635 | | | | (76,770) | | | | (17.1) | |
Edegel (Peru) | | | 139,656 | | | | 141,158 | | | | (1,502) | | | | (1.1) | |
EEPSA (Peru) | | | 17,664 | | | | 17,588 | | | | 76 | | | | 0.4 | |
Other | | | 2,197 | | | | 4,281 | | | | (2,084) | | | | (48.7) | |
| | | | | | | | | | | | | | | | |
Total | | | 714,696 | | | | 800,302 | | | | (85,606) | | | | (10.7) | |
| | | | |
Distribution Business | | | | | | | | | | | | | | | | |
Edesur (Argentina) | | | 103,775 | | | | (51,229) | | | | 155,004 | | | | 302.6 | |
Ampla (Brazil) | | | 26,423 | | | | 183,846 | | | | (157,423) | | | | (85.6) | |
Coelce (Brazil) | | | 100,911 | | | | 117,380 | | | | (16,469) | | | | (14.0) | |
Codensa (Colombia) | | | 235,588 | | | | 261,975 | | | | (26,388) | | | | (10.1) | |
Edelnor (Peru) | | | 107,705 | | | | 90,986 | | | | 16,727 | | | | 18.4 | |
Other | | | (1,383) | | | | (1,250) | | | | (133) | | | | 10.6 | |
| | | | | | | | | | | | | | | | |
Total | | | 573,019 | | | | 601,708 | | | | (28,689) | | | | (4.8) | |
Less: consolidation adjustments and non-core activities | | | (32,956) | | | | (14,010) | | | | (18,946) | | | | 135.2 | |
| | | | | | | | | | | | | | | | |
Total | | | 1,254,759 | | | | 1,388,000 | | | | (133,241) | | | | (9.6) | |
| | | | | | | | | | | | | | | | |
113
Other Results from Continuing Operations
The following table sets forth the other results from continuing operations for the years ended December 31, 2015 and 2014:
| | | | | | | | | | | | | | | | |
| | | Year ended December 31, | |
| | | 2015 | | | 2014 | | | Change | | | Change | |
| | | (in millions of Ch$) | | | (in %) | |
Financial results | | | | | | | | | | | | |
Financial income | | | 294,770 | | | | 251,122 | | | | 43,648 | | | | 17.4 | |
Financial costs | | | (385,455) | | | | (432,314) | | | | 46,859 | | | | (10.8) | |
Results from indexed assets and liabilities | | | (9,266) | | | | (13,630) | | | | 4,364 | | | | (32.0) | |
Net foreign currency exchange gains (losses) | | | 128,238 | | | | (18,494) | | | | 146,732 | | | | n.a. | |
| | | | | | | | | | | | | | | | |
Total | | | 28,287 | | | | (213,316) | | | | 241,603 | | | | n.a. | |
| | | | |
Other | | | | | | | | | | | | | | | | |
Other gains (losses) | | | (6,566) | | | | 877 | | | | (7.443) | | | | n.a. | |
Share of the profit of associates and joint ventures accounted for using the equity method | | | 3,333 | | | | 2,560 | | | | 773 | | | | 30.2 | |
| | | | | | | | | | | | | | | | |
Total | | | (3,233) | | | | 3,437 | | | | (6,670) | | | | n.a. | |
| | | | | | | | | | | | | | | | |
Total other results | | | 25,054 | | | | (209,879) | | | | 234,933 | | | | n.a. | |
| | | | | | | | | | | | | | | | |
Financial Results from Continuing Operations
Our net financial result in 2015 was a net gain of Ch$ 28.3 billion in 2015, a Ch$ 241.6 billion increase compared to 2014.
This improvement was mainly explained by a Ch$ 146.7 billion increase in non-recurring foreign currency exchange gain differences, mainly due to Ch$ 141.6 billion positive foreign exchange rate differences related to accounts receivable denominated in U.S. Dollars from the Vuelta de Obligado thermal plant (“VOSA”). This plant was financed through the contribution of outstanding debts of CAMMESA owed to our Argentine generation subsidiaries. These contributions were returned with interest according to the agreement (recorded as a financial income as explained below) and recognized in U.S. Dollars, based on the exchange rate existing as of the date on which the agreement was signed. In December 2015, a technical report confirmed that the gas plant passed all operational tests; therefore, we accounted for the effects of the dollarization of the receivables considering the current exchange rate between the Argentine peso and the U.S. Dollar.
Financial costs decreased by Ch$ 46.9 billion in 2015 as compared to 2014, mainly due to (i) Ch$ 68.7 billion lower financial costs in Ampla and Coelce as result of the revaluation of their non-amortized assets at the end of the concessions at their new replacement values, and (ii) Ch$18.2 billion lower financial costs due to the currency translation effect of converting from the various functional currencies of our foreign subsidiaries to the Chilean peso, particularly our Brazilian subsidiaries. These decreases were offset by higher financial costs in Edesur and Costanera of Ch$ 40.0 billion, mainly due to higher outstanding debt balances with CAMMESA.
In addition, financial income increased by Ch$ 43.6 billion in 2015 as compared to 2014, mainly due to (i) Ch$ 57.1 billion higher non-recurring interest accrued in accounts receivable from VOSA, (ii) Ch$ 38.6 billion higher non-recurring income due to a waiver of interest payments for the debt that Edesur and Costanera owe to CAMMESA related to the application of Resolution No. 1208/2015, (iii) Ch$ 37.6 billion higher financial income in Ampla and Coelce due to the revaluation of their non-amortized assets at the end of the concessions at their new replacement values and (iv) Ch$ 19.9 billion higher interest income in Ampla and Coelce accrued due to regulated assets and liabilities. These increases were partially offset by lower income from investments and other financial securities of Ch$ 23.1 billion and the non-recurring income recorded in 2014 of Ch$ 84.5 billion from a debt restructuring agreed between Costanera and Mitsubishi Corporation (“MC”) in October 2014.
Income Taxes
Total income tax expenses increased by 22.9% in 2015 or Ch$ 97.7 billion as compared to 2014, mostly due to higher tax expenses as a result of higher taxable income as compared to the previous year of Ch$53.1 billion in El Chocón, Ch$ 21.1 billion in Coelce, Ch$ 11.9 billion in Dock Sud, Ch$ 8.0 billion in Edelnor and Ch$ 4.3 billion in Edesur.
The effective tax rate was 40.9% in 2015 and 36.2% in 2014, mainly as result of higher taxes due to the devaluation of the Chilean peso in terms of the U.S. dollar and the higher corporate tax rate in Colombia.
114
Net Income
The following table sets forth our consolidated net income from continuing operations before income taxes, income taxes and net income from continuing operations for the periods indicated.
| | | | | | | | | | | | | | | | |
| | | Year ended December 31, | |
| | | 2015 | | | 2014 | | | Change | | | Change | |
| | | (in millions of Ch$) | | | (in %) | |
Operating income | | | 1,254,758 | | | | 1,388,000 | | | | (133,242) | | | | (9,6) | |
Other results | | | 25,054 | | | | (209,879) | | | | 234,933 | | | | 111.9 | |
| | | | | | | | | | | | | | | | |
Income from Continuing Operations before income taxes | | | 1,279,812 | | | | 1,178,121 | | | | 101,691 | | | | 8.6 | |
Income taxes | | | (523,663) | | | | (425,958) | | | | (97,705) | | | | 22.9 | |
| | | | | | | | | | | | | | | | |
Net Income from continuining operations | | | 756,149 | | | | 752,163 | | | | 3,986 | | | | 0.5 | |
Income from discontinued operations | | | 388,321 | | | | 215,332 | | | | 172,989 | | | | 80.3 | |
| | | | | | | | | | | | | | | | |
Net income attributable to: | | | 1,144,470 | | | | 967,495 | | | | 176,975 | | | | 18.3 | |
Net income attributable to the parent company | | | 661,587 | | | | 571,873 | | | | 89,714 | | | | 15.7 | |
Net income attributable to non-controlling interests | | | 482,883 | | | | 395,622 | | | | 87,261 | | | | 22.1 | |
II. Analysis of Results from Discontinued Operations
Revenues from Discontinued Operations
Generation Business
The following table sets forth the physical electricity sales of Endesa Chile and its subsidiaries and the corresponding changes for the years ended December 31, 2015 and 2014:
| | | | | | | | | | | | | | | | |
| | | Years ended December 31, | |
| | | 2015 | | | 2014 | | | Change | | | Change | |
| | | (in GWh) | | | (in %) | |
Endesa Chile and subsidiaries | | | 23,558 | | | | 21,157 | | | | 2,401 | | | | 11.3 | |
| | | | | | | | | | | | | | | | |
Distribution Business
The following table sets forth the physical electricity sales of Chilectra Chile and the corresponding changes for the years ended December 31, 2015 and 2014:
| | | | | | | | | | | | | | | | |
| | | Years ended December 31, | |
| | | 2015 | | | 2014 | | | Change | | | Change | |
| | | (in GWh) | | | (in %) | |
Chilectra Chile | | | 15,893 | | | | 15,690 | | | | 203 | | | | 1.3 | |
| | | | | | | | | | | | | | | | |
115
The following table sets forth our revenues from discontinued operations by business for the years ended December 31, 2015 and 2014:
| | | | | | | | | | | | | | | | |
| | | Years ended December 31, | |
| | | 2015 | | | 2014 | | | Change | | | Change | |
| | | (in millions of Ch$) | | | (in %) | |
Generation Business | | | | | | | | | | | | |
Endesa Chile and subsidiaries | | | 1,543,812 | | | | 1,220,566 | | | | 323,246 | | | | 26.5 | |
| | | | | | | | | | | | | | | | |
Distribution Business | | | | | | | | | | | | | | | | |
Chilectra Chile and subsidiaries | | | 1,257,732 | | | | 1,127,893 | | | | 129,839 | | | | 11.5 | |
| | | | | | | | | | | | | | | | |
Non-electricity business and combination adjustments | | | (404,137) | | | | (300,952) | | | | (103,185) | | | | 34.3 | |
| | | | | | | | | | | | | | | | |
Total revenues from discontinued operations | | | 2,397,407 | | | | 2,047,507 | | | | 349,964 | | | | 17.1 | |
| | | | | | | | | | | | | | | | |
Generation Business: Revenues
Revenues from Endesa Chile increased by Ch$ 323.2 billion, or 26.5% in 2015 compared to 2014, mainly due to (i) Ch$153.6 billion as a result of 16.0% increase in average energy sale prices, (ii) Ch$ 88.9 billion increased physical sales of 2,401 GWh, or 11.3%, due to both increased contractual sales, especially to distributors, and increased sales in the spot market, and (iii) Ch$ 69.9 billion of higher revenues contributed by GasAtacama, which has been consolidated by Endesa Chile since May 2014.
Distribution Business: Revenues
Revenues from Chilectra Chile increased by Ch$ 129.8 billion, or 11.5%, in 2015 compared to 2014. This increase is a result of (i) higher energy sales of Ch$ 115.1 billion, mainly due to Ch$ 7.1/MWh (10.7%) increase of the tariff to regulated clients due to regular indexed cost adjustment in the tariff, which accounted for Ch$ 105.4 billion of the increase and (ii) Ch$ 16.4 billion higher revenues from other services, mainly related to tolls charged to generating companies and rental and maintenance of street lighting and network installments. The number of customers rose by approximately 43,500 in 2015, compared to 2014, totaling approximately 1,780,800.
Operating Costs from Discontinued Operations
Total operating costs consist primarily of energy purchases from third parties, fuel purchases, tolls paid to transmission companies, depreciation, amortization and impairment losses, maintenance costs, employee salaries and administrative and selling expenses.
116
The following table sets forth our operating costs in Chilean pesos, and as a percentage of our consolidated operating costs from discontinued operations for the years ended December 31, 2015 and 2014:
| | | | | | | | | | | | | | | | |
| | | Years ended December 31, | |
| | | 2015 | | | 2014 | |
| | | (in millions of Ch$) | | | (in %) | | | (in millions of Ch$) | | | (in %) | |
Energy purchases | | | 860,203 | | | | 45.9 | | | | 788,421 | | | | 47.3 | |
Fuel consumption | | | 327,503 | | | | 17.5 | | | | 305,480 | | | | 18.3 | |
Transportation costs | | | 182,453 | | | | 9.7 | | | | 151,949 | | | | 9.1 | |
Depreciation, amortization and impairment losses (1) | | | 150,147 | | | | 8.0 | | | | 141,623 | | | | 8.5 | |
Other fixed costs (1) | | | 125,849 | | | | 6.7 | | | | 110,321 | | | | 6.7 | |
Employee benefit expense and others (1) | | | 115,551 | | | | 6.2 | | | | 104,836 | | | | 6.3 | |
Other variable procurement and services | | | 111,826 | | | | 6.0 | | | | 63,553 | | | | 3.8 | |
| | | | | | | | | | | | | | | | |
Total operating costs from discontinued operations | | | 1,873,532 | | | | 100.0 | | | | 1,666,182 | | | | 100.0 | |
| | | | | | | | | | | | | | | | |
| | (1) | Corresponds to selling and administration expenses. |
The following table sets forth our operating costs (excluding selling and administrative expenses) from discontinued operations by business for the years ended December 31, 2015 and 2014.
| | | | | | | | | | | | | | | | |
| | | Years ended December 31, | |
| | | 2015 | | | 2014 | | | Change | | | Change | |
| | | (in millions of Ch$) | | | (in %) | |
Generation Business | | | | | | | | | | | | |
Endesa Chile and subsidiaries | | | 880,891 | | | | 750,213 | | | | 130,678 | | | | 17.4 | |
| | | | | | | | | | | | | | | | |
| | | | |
Distribution Business | | | | | | | | | | | | | | | | |
Chilectra Chile and subsidiaries | | | 983,733 | | | | 855,758 | | | | 127,975 | | | | 15.0 | |
| | | | | | | | | | | | | | | | |
Non-electricity business activities and combination adjustments | | | (382,639) | | | | (296,569) | | | | (86,070) | | | | 29.0 | |
| | | | | | | | | | | | | | | | |
Total operating cost from discontinued operations | | | 1,481,985 | | | | 1,309,402 | | | | 172,583 | | | | 13.2 | |
| | | | | | | | | | | | | | | | |
Generation Business: Operating Costs
Operating costs increased by Ch$ 130.7 billion, or 17.4%, in 2015, mainly due to (i) Ch$ 39.5 billion of higher other variable procurement and services costs mostly attributable to (a) Ch$ 23.7 billion related to the cost of the agreement with Gener’s Nueva Renca combined-cycle power plant that allows Endesa Chile to use its available LNG and (b) Ch$ 9.4 billion of higher water transportation costs for the operation of the San Isidro power plant, (ii) Ch$36.9 billion of higher gas transportation costs related to additional energy purchases, (iii) Ch$ 22.0 billion higher fuel consumption costs mainly due to Endesa Chile’s higher coal consumption costs of Ch$ 16.0 billion, and (iv) increased purchases of energy on the spot market of Ch$ 32.2 billion due to higher sales.
Distribution Business: Operating Costs
Operating costs of Chilectra Chile increased by Ch$ 128.0 billion, or 15.0%, in 2015, compared to 2014, mainly due to Ch$ 115.3 billion greater energy purchases, primarily due to a higher average purchase price of Ch$6.5 /GWh (13.2%) as a result of regular indexed costs adjustment that accounted for Ch$ 105.3 billion. In addition, operating costs increased because of variable procurement and service costs of Ch$ 8.2 billion, and higher transportation costs of Ch$ 4.5 billion.
117
Selling and Administrative Expenses from Discontinued Operations
Selling and administrative expenses relate to salaries, compensation, administrative expenses, depreciation, amortization and impairment losses, and office materials and supplies.
The following table sets forth our selling and administrative expenses as a percentage of our consolidated total selling and administrative expenses from discontinued operations for the years ended December 31, 2015 and 2014:
| | | | | | | | |
| | | Years ended December 31, | |
| | | 2015 | | | 2014 | |
| | | (in %) | |
Selling and Administrative Expenses as a Percentage of Total Selling and Administrative Expenses from discontinued operations | | | | | | | | |
Other fixed costs | | | 32.1 | | | | 30.9 | |
Employee benefit expense and others | | | 29.5 | | | | 29.4 | |
Depreciation, amortization and impairment losses | | | 38.4 | | | | 39.7 | |
| | | | | | | | |
Total | | | 100.0 | | | | 100.0 | |
| | | | | | | | |
The following table sets forth our selling and administrative expenses from discontinued operations by business for the years ended December 31, 2015 and 2014:
| | | | | | | | | | | | | | | | |
| | | Years ended December 31, | |
| | | 2015 | | | 2014 | | | Change | | | Change | |
| | | (in millions of Ch$) | | | (in %) | |
Generation Business | | | | | | | | | | | | |
Endesa Chile and subsidiaries | | | 261,088 | | | | 224,627 | | | | 36,461 | | | | 16.2 | |
| | | | | | | | | | | | | | | | |
| | | | |
Distribution Business | | | | | | | | | | | | | | | | |
Chilectra Chile and subsidiaries | | | 124,706 | | | | 118,028 | | | | 6,678 | | | | 5.7 | |
| | | | | | | | | | | | | | | | |
Non-electricity business and combination adjustments | | | 5,753 | | | | 14,125 | | | | (8,372) | | | | (59.3) | |
| | | | | | | | | | | | | | | | |
Total selling and administrative expenses from discontinued operations | | | 391,547 | | | | 356,780 | | | | 34,767 | | | | 9.7 | |
| | | | | | | | | | | | | | | | |
Selling and administrative expenses from discontinued operations increased by Ch$ 34.8 billion, or 9.7%, in 2015, compared to 2014, mainly due to (i) higher other fixed costs of Ch$ 24.9 billion mostly attributable to increased costs related to the corporate reorganization and higher fines for sanctions and litigations, and (ii) higher charges in Endesa Chile for depreciation of Ch$ 2.8 billion from the full consolidation of GasAtacama.
Operating Income from Discontinued Operations
The following table sets forh our operating income from discontinued operations by business for the years ended December 31, 2015 and 2014:
| | | | | | | | | | | | | | | | |
| | | Years ended December 31, | |
| | | 2015 | | | 2014 | | | Change | | | Change | |
| | | (in millions of Ch$) | | | (in %) | |
Generation Business | | | | | | | | | | | | |
Endesa Chile and subsidiaries | | | 401,833 | | | | 245,726 | | | | 156,107 | | | | 63.5 | |
| | | | | | | | | | | | | | | | |
| | | | |
Distribution Business | | | | | | | | | | | | | | | | |
Chilectra Chile and subsidiaries | | | 149,294 | | | | 154,107 | | | | (4,813) | | | | (3.1) | |
| | | | | | | | | | | | | | | | |
Non-electricity business and combination adjustments | | | (27,637) | | | | (18,508) | | | | (8,743) | | | | 47.2 | |
| | | | | | | | | | | | | | | | |
Total operating income from discontinued operations | | | 523,875 | | | | 381,325 | | | | 142,550 | | | | 37.4 | |
| | | | | | | | | | | | | | | | |
118
Other Results from Discontinued Operations
The following table sets forth our other results from discontinued operations for the years ended December 31, 2015 and 2014:
| | | | | | | | | | | | | | | | |
| | | Years ended December 31, | |
| | | 2015 | | | 2014 | | | Change | | | Change | |
| | | (in millions of Ch$) | | | (in %) | |
Financial results | | | | |
Financial income | | | 15,270 | | | | 14,763 | | | | 507 | | | | 3.4 | |
Financial costs | | | (61,617 | ) | | | (59,544 | ) | | | (2,073 | ) | | | (3.5 | ) |
Profit for indexed assets and liabilities | | | 4,839 | | | | 15,264 | | | | (10,425 | ) | | | (68.3 | ) |
Foreign currency exchange differences | | | (13,395 | ) | | | (20,328 | ) | | | 6,933 | | | | 34.1 | |
| | | | | | | | | | | | | | | | |
Total | | | (54,903 | ) | | | (49,845 | ) | | | (5,058 | ) | | | (10.1 | ) |
| | | | |
Others | | | | | | | | | | | | | | | | |
Gain from sales of assets | | | 20,056 | | | | 70,893 | | | | (50,837 | ) | | | (71.7 | ) |
Share of the profit (loss) of associates and joint ventures accounted for using the equity method | | | 8,905 | | | | (54,353 | ) | | | 63,258 | | | | 116.4 | |
| | | | | | | | | | | | | | | | |
Total | | | 28,961 | | | | 16,540 | | | | 12,421 | | | | 75.1 | |
| | | | | | | | | | | | | | | | |
Total other results from discontinued operations | | | (25,942 | ) | | | (33,305 | ) | | | 7,363 | | | | 22.1 | |
| | | | | | | | | | | | | | | | |
Financial Results from Discontinued Operations
The net financial results for the year ended December 31, 2015 was an expense of Ch$ 54.9 billion, an increase of Ch$ 5.1 billion, or 10.1%, compared to 2014, which was mainly explained by a lower gain for indexed assets and liabilities of Ch$ 10.4 billion due to a lower inflation rate in 2015.
Others from Discontinued Operations
The gain from sales of assets for the year ended December 31, 2015 was Ch$ 20.1 billion, a decrease of Ch$ 50.8 billion or 71.7%, compared to 2014. This decrease was primary due non-recurring gains in 2014 of (i) Ch$ 42.6 billion recorded in 2014 arising from the revaluation of the 50% pre-existing investment in GasAtacama and a recognition of its accumulated currency exchange differences and (ii) Ch$ 21.1 billion recorded in 2014 from the sale of the equity interest in Los Maitenes and Aguas Santiago Poniente (ENEA Project). The decrease was partially offset by a net gain of Ch$ 14.6 billion from the sale of land (Alonso de Córdova substation) during the fourth quarter of 2015.
Our share of the profit (loss) of associates and joint ventures investments accounted for using the equity method in 2015 was Ch$ 8.9 billion, an increase of Ch$ 63.3 billion as compared to 2014, primarly due to the non-recurring impairment loss of Ch$ 69.1 billion recorded in December 2014 in connection with HidroAysén project, due to Endesa Chile’s decision not to proceed with this project. This decision was based on the uncertainty of recovering the investment made in the project, mainly as a consequence of the long judicial process in order to obtain environmental approvals.
Income Tax Expenses from Discontinued Operations
Income tax expenses totaled Ch$ 109.7 billion in 2015, a decrease of Ch$ 23.0 billion, or 17.4%, compared to 2014. The decrease in corporate income tax expense was mainly due to the absence in 2015 of a one-time effect recorded as a net deferred tax liability of Ch$ 66.7 billion in 2014, following the tax reform enacted in Chile on September 29, 2014. The 2014 tax reform established a gradual increase in the taxation rate until 2018 and is expected to slightly affect our results in the future, considering that the main impacts on deferred taxes have already been recognized.
The effective tax rate was 24.0% in 2015 and 39.9% in 2014.
119
Net Income from Discontinued Operations
The following table sets forth our net income before taxes, income tax expenses and net income for the years ended December 31, 2015 and 2014:
| | | | | | | | | | | | | | | | |
| | | Years ended December 31, | |
| | | 2015 | | | 2014 | | | Change | | | Change | |
| | | (in millions of Ch$) | | | (in %) | |
Operating income | | | 523,875 | | | | 381,325 | | | | 142,550 | | | | 37.4 | |
Other results | | | (25,942) | | | | (33,305) | | | | 7,363 | | | | 22.1 | |
| | | | | | | | | | | | | | | | |
Net income before taxes | | | 497,433 | | | | 348,020 | | | | 149,913 | | | | 43.1 | |
Income tax expenses | | | (109,613) | | | | (132,688) | | | | 23,075 | | | | 17.4 | |
| | | | | | | | | | | | | | | | |
Net income | | | 388,321 | | | | 215,332 | | | | 172,988 | | | | 80.3 | |
Net income attributable to the Parent Company | | | 293,191 | | | | 178,231 | | | | 114,960 | | | | 64.5 | |
Net income attributable to non-controlling interests | | | 95,130 | | | | 37,101 | | | | 58,029 | | | | 156.4 | |
The increase in net income attributable to non-controlling interests of Ch$ 58.0 billion in 2015 compared to 2014, is primarily due to the Ch$ 69.3 billion increase of net income attributable to the non-controlling interests of Endesa Chile for 2015, which in turn is mainly due to the increase in net income in Endesa Chile by Ch$ 154.7 billion. The controlling and economic interest in Endesa Chile is the same in both years (59.98%).
| 3. | Analysis of Results of Operations for the Years Ended December 31, 2014 and 2013. |
I. Analysis of Results from Continuing Operations
Revenues from Continuing Operations
Generation and Transmission Business from continuing operations
The following table sets forth the electricity sales of our subsidiaries and the corresponding changes for the years ended December 31, 2014 and 2013:
| | | | | | | | | | | | | | | | |
| | | Electricity sales during the year ended December 31, | |
| | | 2014 | | | 2013 | | | Change | | | Change | |
| | | (in GWh) | | | (in %) | |
Costanera (Argentina) | | | 7,051 | | | | 8,962 | | | | (1,911) | | | | (21.3) | |
El Chocón (Argentina) | | | 3,391 | | | | 3,392 | | | | (1) | | | | 0.02 | |
Dock Sud (Argentina) | | | 4,834 | | | | 4,195 | | | | 639 | | | | 15.2 | |
Cachoeira Dourada (Brazil) | | | 3,903 | | | | 3,564 | | | | 339 | | | | 9.5 | |
Fortaleza (Brazil) | | | 3,205 | | | | 3,262 | | | | (57) | | | | (1.7) | |
Emgesa (Colombia) | | | 15,773 | | | | 16,090 | | | | (317) | | | | (2.0) | |
Edegel (Peru) | | | 9,320 | | | | 8,903 | | | | 417 | | | | 4.7 | |
EEPSA (Peru) | | | 596 | | | | 594 | | | | 2 | | | | 0.3 | |
| | | | | | | | | | | | | | | | |
Total | | | 48,073 | | | | 48,962 | | | | (889) | | | | (1.8) | |
| | | | | | | | | | | | | | | | |
120
Distribution Business from continuing operations
The following table sets forth the electricity sales of our subsidiaries, by country, and their corresponding variations for the years ended December 31, 2014 and 2013:
| | | | | | | | | | | | | | | | |
| | | Electricity sales during the year ended December 31, | |
| | | 2014 | | | 2013 | | | Change | | | Change | |
| | | (in GWh) | | | (in %) | |
Edesur (Argentina) | | | 17,972 | | | | 18,137 | | | | (165) | | | | (0.9) | |
Ampla (Brazil) | | | 11,678 | | | | 11,049 | | | | 629 | | | | 5.7 | |
Coelce (Brazil) | | | 11,165 | | | | 10,718 | | | | 447 | | | | 4.2 | |
Codensa (Colombia) | | | 13,660 | | | | 13,342 | | | | 318 | | | | 2.4 | |
Edelnor (Peru) | | | 7,338 | | | | 7,045 | | | | 293 | | | | 4.5 | |
| | | | | | | | | | | | | | | | |
Total | | | 61,813 | | | | 60,291 | | | | 1,522 | | | | 2.5 | |
| | | | | | | | | | | | | | | | |
The table below presents our revenues from continuing operations by business segment and company for the years ended December 31, 2014 and 2013:
| | | | | | | | | | | | | | | | |
| | | Year ended December 31, | |
| | | 2014 | | | 2013 | | | Change | | | Change | |
| | | (in millions of Ch$) | | | (in %) | |
Generation and Transmission Business | | | | | | | | | | | | |
Costanera (Argentina) | | | 75,194 | | | | 94,888 | | | | (19,694) | | | | (20.8) | |
El Chocón (Argentina) | | | 30,174 | | | | 36,687 | | | | (6,513) | | | | (17.8) | |
Dock Sud (Argentina) | | | 61,606 | | | | 41,186 | | | | 20,420 | | | | 49.6 | |
Cemsa (Argentina) | | | 1,281 | | | | 1,591 | | | | (310) | | | | (19.5) | |
Cachoeira Dourada (Brazil) | | | 158,965 | | | | 117,445 | | | | 41,520 | | | | 35.4 | |
Fortaleza (Brazil) | | | 210,793 | | | | 168,871 | | | | 41,922 | | | | 24.8 | |
CIEN (Brazil) | | | 70,800 | | | | 67,689 | | | | 3,111 | | | | 4.6 | |
Emgesa (Colombia) | | | 753,373 | | | | 639,503 | | | | 113,870 | | | | 17.8 | |
Edegel (Peru) | | | 353,795 | | | | 283,806 | | | | 69,989 | | | | 24.7 | |
EEPSA (Peru) | | | 50,849 | | | | 33,752 | | | | 17,097 | | | | 50.7 | |
Other | | | (3,961) | | | | (4,074) | | | | 113 | | | | (2.8) | |
| | | | | | | | | | | | | | | | |
Total | | | 1,762,869 | | | | 1,481,344 | | | | 281,525 | | | | 19.0 | |
| | | | |
Distribution Business | | | | | | | | | | | | | | | | |
Edesur (Argentina) | | | 371,412 | | | | 528,653 | | | | (157,241) | | | | (29.7) | |
Ampla (Brazil) | | | 1,092,282 | | | | 945,131 | | | | 147,151 | | | | 15.6 | |
Coelce (Brazil) | | | 876,944 | | | | 688,981 | | | | 187,963 | | | | 27.3 | |
Codensa (Colombia) | | | 982,771 | | | | 852,780 | | | | 129,991 | | | | 15.2 | |
Edelnor (Peru) | | | 478,700 | | | | 413,911 | | | | 64,794 | | | | 15.7 | |
| | | | | | | | | | | | | | | | |
Total | | | 3,802,109 | | | | 3,429,456 | | | | 372,653 | | | | 10.9 | |
Less: consolidation adjustments and non-core activities | | | (358,608) | | | | (382,652) | | | | 24,044 | | | | (6.3) | |
| | | | | | | | | | | | | | | | |
Total | | | 5,206,370 | | | | 4,528,148 | | | | 678,222 | | | | 15.0 | |
| | | | | | | | | | | | | | | | |
Generation and Transmission Business: Revenues from Continuing Operations
In Argentina, revenues from Costanera fell by Ch$ 19.7 billion, or 20.8% in 2014, mainly as a result of the devaluation of Argentine peso to the Chilean peso, which led to a 22.3% decrease, or Ch$ 21.2 billion, in 2014 when compared to 2013, partially offset by a Ch$ 1.5 billion revenue increase related to its combined-cycle availability contract executed with the Secretary of Energy. Revenues from El Chocón decreased by 17.8% or Ch$ 6.5 billion, mainly due to devaluation of the Argentine peso by Ch$ 8.2 billion, partially offset by the impact of Resolution No 529/2014 that updated tariffs and increased El Chocón’s revenues by Ch$ 1.5 billion. Revenues
121
of Dock Sud increased by Ch$ 20.4 billion in 2014, mainly as a consequence of its full consolidation in 2014 compared to 2013, when it was consolidated only since April 2013, following our 2013 capital increase, which implied in 2014 Ch$ 21.5 billion in additional revenues, in addition to Ch$ 7.7 billion greater thermal dispatch of 1,204 GWh. The increases were partially compensated by the devaluation of the Argentine peso that implied Ch$ 9.2 billion of less revenue.
In Brazil, revenues from Cachoeira Dourada rose by Ch$ 41.5 billion, or 35.4%, in 2014, mainly as a result of an Ch$ 20.0 billion increase related to higher spot market sale prices and a Ch$ 13.6 billion increase due to 339 GWh higher physical energy sales. Revenues from Fortaleza increased by 24.8% or Ch$ 41.9 billion for 2014 mainly due to Ch$ 32.3 billion higher average sale prices. Revenues from CIEN improved by 4.6% or Ch$ 3.1 billion mainly due to appreciation of the Brazilian real in relation to the Chilean peso that implied Ch $ 3.8 billion higher revenues.
Revenues from Emgesa, in Colombia, increased by Ch$ 113.9 billion, or 17.8%, in 2014, mainly due to a Ch$ 65 billion increase in energy sale revenues mainly due to higher spot price because of the drought and the appreciation of the Colombian peso in relation to the Chilean peso, which in both periods resulted in a 7.6% increase in terms of Chilean peso, or Ch$ 48 billion higher revenues in 2014 when compared to 2013.
Revenues from Edegel in Peru increased by Ch$ 70.0 billion, or 24.7%, in 2014, mainly due to a 13.6% increase in electricity sales as a consequence of 417 GWh higher physical sales, amounting to Ch$ 43 billion and a Ch$ 27 billion increase as result of the appreciation of the Peruvian sol in relation to the Chilean peso for both periods which resulted in a 9.6% increase in terms of Chilean peso when compared to 2013. In EEPSA, revenues were 50.7%, or Ch$ 17.1 billion, higher than in 2013 mainly as a consequence of its full consolidation in 2014 compared to 2013, when it was consolidated only since April 2013, following our 2013 capital increase, which resulted in 2014 Ch$ 14.3 billion of additional revenues in 2014.
Distribution Business: Revenues from Continuing Operations
Revenues from Edesur in Argentina fell by Ch$ 157.2 billion, or 29.7%, in 2014 mainly due to lower cost compensations recognition in the tariffs compared to 2013. In 2014, this amounted to Ch$ 144.3 billion compared with Ch$ 250.5 billion in 2013 due to the effects of Resolution No. 250/2013, which recognized costs not transferred to tariffs in 2013 for the period from May 2007 to September 2013 and in 2014 for the period from October 2013 to December 2014. In addition, sales revenue decreased by Ch$ 47.9 billion mainly due to depreciation of the Argentine peso in relation to the Chilean peso and the recognition of service quality fines of Ch$ 11.9 billion.
In Brazil, revenues from our subsidiary Ampla rose by Ch$ 147.1 billion, or 15.6%, in 2014, mainly due to the appreciation of the Brazilian real in relation to the Chilean peso of Ch$ 53.6 billion coupled to Ch$ 93.4 billion higher revenues from operations mainly composed by (i) Ch$ 49.1 billion increase due to higher physical sales and (ii) Ch$ 33.9 billion increase due to 4% greater average sale price due to the tariff review carried out by the regulator in 2014. Revenues from Coelce increased by Ch$ 188 billion, or 27.3%, in 2014, mainly due to the appreciation of the Brazilian real of Ch$ 39.1 billion coupled to Ch$ 148.8 billion higher revenues from operations mainly composed by (i) Ch$ 118.9 billion increase due to 18% greater average sale price due to the tariff review carried out by the regulator in 2014 and (ii) Ch$ 27.3 billion increase due to higher physical sales.
Revenues from Codensa increased by Ch$ 130 billion, or 15.2%, in 2014 related to the appreciation of the Colombian peso to the Chilean peso by Ch$ 65.2 billion coupled to Ch$ 64.8 billion higher revenues from operations mainly composed by (i) Ch$ 39.3 billion related to 5% increase of the average sale price due to tariff adjustments and (ii) Ch$ 18.4 billion higher physical energy sales of 286 GWh mainly related to the commercial and industrial activity.
In Peru, revenues from Edelnor rose by Ch$ 64.8 billion, or 15.7%, in 2014 mainly due to Ch$ 51.2 billion higher energy sale due to a 13% higher average sale price as of result of tariff adjustments and Ch$ 9.8 billion higher revenue due to the appreciation of the Peruvian sol peso to Chilean peso.
Total Operating Costs from Continuing Operations
Total operating costs consist primarily of energy purchases from third parties, fuel consumption, depreciation, amortization and impairment losses, maintenance costs, tolls paid to transmission companies, employee salaries and administrative and selling expenses.
122
The following table shows the breakdown of our consolidated operating costs in Chilean pesos and, as a percentage of total consolidated operating costs, for the years ended December 31, 2014 and 2013:
| | | | | | | | | | | | | | | | |
| | | Year ended December 31, | |
| | | 2014 | | | 2013 | |
| | | (in millions
of Ch$) | | | (in %) | | | (in millions
of Ch$) | | | (in %) | |
Energy purchases | | | 1,824,003 | | | | 47.8 | | | | 1,252,147 | | | | 39.4 | |
Fuel consumption | | | 205,534 | | | | 5.4 | | | | 174,504 | | | | 5.5 | |
Transportation expense | | | 265,185 | | | | 6.9 | | | | 216,859 | | | | 6.8 | |
Other raw materials and combustibles | | | 336,947 | | | | 8.8 | | | | 446,758 | | | | 14.1 | |
Other expenses(1) | | | 463,729 | | | | 12.2 | | | | 405,748 | | | | 12.8 | |
Employee benefit expense and other (1) | | | 333,898 | | | | 8.7 | | | | 298,434 | | | | 9.4 | |
Depreciation, amortization and impairment losses(1) | | | 389,073 | | | | 10.2 | | | | 382,631 | | | | 12.0 | |
| | | | | | | | | | | | | | | | |
Total Operating Cost from Continuing Operations | | | 3,818,369 | | | | 100.0 | | | | 3,177,080 | | | | 100.0 | |
| | | | | | | | | | | | | | | | |
| (1) | Corresponds to selling and administration expenses |
The following table sets forth our operating costs (excluding selling and administrative expenses) from continuing operations by business segment and company for the years ended December 31, 2014 and 2013:
| | | | | | | | | | | | | | | | |
| | | Year ended December 31, | |
| | | 2014 | | | 2013 | | | Change | | | Change | |
| | | (in millions of Ch$) | | | (in %) | |
Generation and Transmission Business | | | | | | | | | | | | |
Costanera (Argentina) | | | 6,777 | | | | 24,318 | | | | (17,541) | | | | (72.1) | |
El Chocón (Argentina) | | | 8,427 | | | | 12,161 | | | | (3,734) | | | | (30.7) | |
Dock Sud (Argentina) | | | 34,976 | | | | 23,933 | | | | 11,043 | | | | 46.1 | |
Cemsa (Argentina) | | | 203 | | | | — | | | | 203 | | | | n.a. | |
Cachoeira Dourada (Brazil) | | | 72,988 | | | | 23,087 | | | | 49,901 | | | | 216.1 | |
Fortaleza (Brazil) | | | 158,318 | | | | 106,806 | | | | 51,512 | | | | 48.2 | |
CIEN (Brazil) | | | 3,343 | | | | 12,362 | | | | (9,019) | | | | (73.0) | |
Emgesa (Colombia) | | | 220,303 | | | | 204,500 | | | | 15,803 | | | | 7.7 | |
Edegel (Peru) | | | 133,735 | | | | 95,079 | | | | 38,656 | | | | 40.7 | |
EEPSA (Peru) | | | 20,916 | | | | 19,030 | | | | 1,886 | | | | 9.9 | |
Other | | | (6,298) | | | | (6,465) | | | | (167) | | | | (2.6) | |
| | | | | | | | | | | | | | | | |
Total | | | 653,688 | | | | 514,811 | | | | 138,877 | | | | 27.0 | |
| | | | |
Distribution Business | | | | | | | | | | | | | | | | |
Edesur (Argentina) | | | 161,995 | | | | 169,802 | | | | (7,807) | | | | (4.6) | |
Ampla (Brazil) | | | 707,301 | | | | 574,463 | | | | 132,838 | | | | 23.1 | |
Coelce (Brazil) | | | 606,422 | | | | 485,731 | | | | 120,691 | | | | 24.8 | |
Codensa (Colombia) | | | 547,594 | | | | 464,476 | | | | 83,119 | | | | 17.9 | |
Edelnor (Peru) | | | 315,116 | | | | 266,450 | | | | 48,665 | | | | 18.3 | |
| | | | | | | | | | | | | | | | |
Total | | | 2,338,428 | | | | 1,960,922 | | | | 377,506 | | | | 19.3 | |
Less: consolidation adjustments and non-core activities | | | (360,447) | | | | (385,466) | | | | 25,019 | | | | (6.5) | |
| | | | | | | | | | | | | | | | |
Total | | | 2,631,669 | | | | 2,090,267 | | | | 541,402 | | | | 25.9 | |
| | | | | | | | | | | | | | | | |
Generation and Transmission Business: Operating Costs from Continuing Operations
Costanera’s operating costs declined by Ch$ 17.5 billion, or 72.1%, in 2014, primarily as a consequence of an 18.2% decline in its generation which in turn reduced its fuel expenses by Ch$ 7.6 billion and its energy purchases by Ch$ 7.1 billion, related to lower energy sales. Operating costs of El Chocón were Ch$ 3.7 billion lower, or 30.7%, in 2014, mostly due to lower energy purchases of
123
Ch$ 3.8 billion related to a higher generation in the period. Operating costs of Dock Sud rose by Ch$ 11 billion, or 46.1%, in 2014, mainly due to Ch$ 16 billion higher costs mainly as a consequence of its consolidation for the complete year compared to 2013, when it was consolidated only from the beginning of April 2013, following our 2013 capital increase.
In Brazil, operating costs of Cachoeira Dourada increased by Ch$ 49.9 billion in 2014, mainly due to higher energy purchases because of the drought that implied Ch$ 28.9 billion higher physical purchases and Ch$ 22.3 billion higher purchase prices in the spot market. Operating costs of Fortaleza rose by Ch$ 51.5 billion, or 48.2%, in 2014, mainly due to higher energy purchases of Ch$ 52.2 billion related to the increase in the energy price due to the drought of Ch$ 49.9 billion. Operating costs of CIEN decreased by Ch$ 9.0 billion, or 73.0%, in 2014, mainly due to other variable procurement and services expenses of Ch$ 8.4 billion.
In Colombia, operating costs of Emgesa increased by Ch$ 15.8 billion or 7.8%, in 2014, principally due to higher other variable procurement and services expenses of Ch$ 16.1 billion related to environmental royalties and other technical support services.
In Peru, operating costs of Edegel rose by Ch$ 38.7 billion, or 40.7%, in 2014, due to a Ch$ 14.0 billion higher fuel costs as a consequence of a 6.5% higher thermal generation due to the unavailability of some relevant generation units of the Peruvian system during the period; Ch$ 13.4 billion higher energy purchases in the spot market, and Ch$ 12.1 billion higher transportation costs related to higher toll costs. In EEPSA, operating costs increased by Ch$ 1.9 billion, or 9.9%, in 2014, mainly as a consequence of its consolidation for the complete year compared to 2013, when it was consolidated only from the beginning of April 2013, following our 2013 capital increase.
Distribution Business: Operating Costs from Continuing Operations
Operating costs of Edesur declined by Ch$ 7.8 billion, or 4.6%, in 2014, mainly due to the devaluation of Argentine peso in relation to the Chilean peso that resulted in Ch$ 37.9 billion lower costs, partially offset by Ch$ 29.6 billion higher energy purchase cost due to greater purchase price.
In Brazil, operating costs of Ampla increased by Ch$ 132.8 billion, or 23.1%, in 2014, mainly as result of Ch$ 145.2 billion increase energy purchases attributable to higher purchase price because of the drought, Ch$ 32.6 billion due to the appreciation of the Brazilian real in relation to the Chilean peso and Ch$ 25.2 billion because of higher physical purchases. These increases were partially offset by a Ch$ 71.1 billion reduction on other variable procurement and services expenses due to regulatory charges. In Coelce, operating costs rose by Ch$ 120.7 billion, or 24.8%, in 201, mainly due to Ch$ 112.2 billion greater energy purchases due to higher prices as a result of the drought, Ch$ 37.6 billion due to the appreciation of the Brazilian real and Ch$ 21.6 billion due to higher physical purchases, partially offset by a Ch$ 50.8 billion reduction on other variable procurement and services expenses due to regulatory charges.
In Codensa, operating costs rose by Ch$ 83.1 billion, or 17.9%, in 2014, mainly due to Ch$42.0 billion higher energy cost due to 11% higher average purchase price in the spot market and Ch$ 35.5 billion higher cost due to appreciation of the Colombian peso in relation to the Chilean peso.
Operating costs of Edelnor increased by Ch$ 48.7 billion, or 18.3%, in 2014, mainly due to Ch$ 36.7 billion higher energy purchase due to 14% higher average purchase price and Ch$ 6.3 billion higher cost due to appreciation of the Peruvian sol in relation to the Chilean peso.
Selling and Administrative Expenses from Continuing Operations
Selling and administrative expenses relate to salaries, compensation, administrative expenses, depreciation, amortization and impairment losses, and office materials and supplies.
124
The following table sets forth our consolidated selling and administrative expenses from continuing operations, as a percentage of total consolidated selling and administrative expenses from continuing operations, for the years ended December 31, 2014 and 2013:
| | | | | | | | |
| | | Year ended December 31, | |
| | | 2014 | | | 2013 | |
| Selling and Administrative Expenses as a Percentage of Selling and Administrative Expenses | | (in %) | |
Other expenses | | | 39.1 | | | | 37.3 | |
Staff benefit costs | | | 28.1 | | | | 27.5 | |
Depreciation, amortization and impairment losses | | | 32.8 | | | | 35.2 | |
| | | | | | | | |
Total | | | 100 | | | | 100 | |
| | | | | | | | |
The following table sets forth our selling and administrative expenses from continuing operations by business segment and company for the years ended December 31, 2014 and 2013:
| | | | | | | | | | | | | | | | |
| | | Year ended December 31, | |
| | | 2014 | | | 2013 | | | Change | | | Change | |
| | | (in millions of Ch$) | | | (in %) | |
Generation and Transmission Business | | | | | | | | | | | | |
Costanera (Argentina) | | | 54,715 | | | | 49,426 | | | | 5,289 | | | | 10.7 | |
El Chocón (Argentina) | | | 7,408 | | | | 10,290 | | | | (2,882) | | | | (28.0) | |
Dock Sud (Argentina) | | | 17,165 | | | | 19,788 | | | | (2,623) | | | | (13.3) | |
Cemsa (Argentina) | | | 1,912 | | | | 2,032 | | | | (120) | | | | (5.9) | |
Cachoeira Dourada (Brazil) | | | 14,124 | | | | 12,550 | | | | 1,574 | | | | 12.5 | |
Fortaleza (Brazil) | | | 15,481 | | | | 13,026 | | | | 2,455 | | | | 18.8 | |
CIEN (Brazil) | | | 25,336 | | | | 22,797 | | | | 2,539 | | | | 11.1 | |
Emgesa (Colombia) | | | 83,435 | | | | 71,010 | | | | 12,425 | | | | 17.5 | |
Edegel (Peru) | | | 78,902 | | | | 76,535 | | | | 2,367 | | | | 3.1 | |
EEPSA (Peru) | | | 12,345 | | | | 7,473 | | | | 4,872 | | | | 65.2 | |
Other | | | (1,944) | | | | (35) | | | | (1,909) | | | | n.a. | |
| | | | | | | | | | | | | | | | |
Total | | | 308,879 | | | | 284,892 | | | | 23,987 | | | | (8.4) | |
| | | | |
Distribution Business | | | | | | | | | | | | | | | | |
Edesur (Argentina) | | | 260,646 | | | | 236,853 | | | | 23,793 | | | | 10.0 | |
Ampla (Brazil) | | | 201,135 | | | | 198,469 | | | | 2,666 | | | | 1.3 | |
Coelce (Brazil) | | | 153,142 | | | | 141,833 | | | | 11,309 | | | | 8.0 | |
Codensa (Colombia) | | | 173,202 | | | | 147,417 | | | | 25,785 | | | | 17.5 | |
Edelnor (Peru) | | | 72,598 | | | | 63,356 | | | | 9,242 | | | | 14.6 | |
Other | | | 1,250 | | | | 1,178 | | | | 72 | | | | 6.1 | |
| | | | | | | | | | | | | | | | |
Total | | | 861,973 | | | | 789,106 | | | | 72.867 | | | | 9.2 | |
Less: consolidation adjustments and non-core activities | | | 15,849 | | | | 12,815 | | | | 3,034 | | | | 23.7 | |
| | | | | | | | | | | | | | | | |
Total | | | 1,186,701 | | | | 1,086,813 | | | | 99,888 | | | | 9.2 | |
| | | | | | | | | | | | | | | | |
Selling and administrative expenses from continuing operations increased by Ch$ 99.9 billion, or 9.2%, in 2014 as compared to 2013 as explained below.
In Codensa, selling and administrative expenses increased by Ch$ 25.8 billion mainly due to Ch$ 12.3 billion in depreciation and impairment expenses and Ch$ 11.8 billion increase of other fixed expenses related to network maintenance.
In Edesur, selling and administrative expenses increased by Ch$ 23.8 billion mainly due to Ch$ 16.2 billion higher personnel expenses and Ch$ 7.6 billion due to network maintenance.
In Emgesa, expenses increased by Ch$ 12.4 billion, mainly as a result of Ch$ 7.0 billion higher charges of depreciation, amortization and impairment losses and Ch$ 4.3 billion higher other fixed operating and higher payroll expenses related to El Quimbo project.
125
In Coelce, selling and administrative expenses increased by Ch$ 11.3 billion mainly due to Ch$ 8.7 billion higher network maintenance and to Ch$ 2.7 billion higher personnel cost.
In Edelnor, selling and administrative expenses increased by Ch$ 9.2 billion mainly due to Ch$ 3.7 billion higher network maintenance, Ch$3.4 billion higher charges of depreciation, amortization and impairment losses and Ch$ 2.1 billion higher personnel expenses.
In Costanera, selling and administrative expenses increased by Ch$ 5.3 billion mainly due Ch$ 4.8 billion resulting from wage increases in 2014.
Operating Income from Continuing Operations
The following table sets forth our income from continuing operations by business segment and company for the years ended December 31, 2014 and 2013:
| | | | | | | | | | | | | | | | |
| | | Year ended December 31, | |
| | | 2014 | | | 2013 | | | Change | | | Change | |
| | | (in millions of Ch$) | | | (in %) | |
Generation and Transmission Business | | | | | | | | | | | | |
Costanera (Argentina) | | | 13,702 | | | | 21,144 | | | | (7,442) | | | | (35.2) | |
El Chocón (Argentina) | | | 14,339 | | | | 14,236 | | | | 103 | | | | 0.7 | |
Dock Sud (Argentina) | | | 9,465 | | | | (2,535) | | | | 12,000 | | | | (473.4) | |
Cemsa (Argentina) | | | (834) | | | | (441) | | | | (393) | | | | 89.1 | |
Cachoeira Dourada (Brazil) | | | 71,853 | | | | 81,808 | | | | (9,955) | | | | (12.2) | |
Fortaleza (Brazil) | | | 36,994 | | | | 49,039 | | | | (12,045) | | | | (24.6) | |
CIEN (Brazil) | | | 42,121 | | | | 32,530 | | | | 9,591 | | | | (29.5) | |
Emgesa (Colombia) | | | 449,635 | | | | 363,993 | | | | 85,642 | | | | 23.5 | |
Edegel (Peru) | | | 141,158 | | | | 112,192 | | | | 28,966 | | | | 25.8 | |
EEPSA (Peru) | | | 17,588 | | | | 7,249 | | | | 10,339 | | | | 142.6 | |
Other | | | 4,281 | | | | 2,426 | | | | 1,855 | | | | 76.5 | |
| | | | | | | | | | | | | | | | |
Total | | | 800,302 | | | | 681,641 | | | | 118,661 | | | | 17.4 | |
| | | | |
Distribution Business | | | | | | | | | | | | | | | | |
Edesur (Argentina) | | | (51,229) | | | | 121,998 | | | | (173,227) | | | | (142.0) | |
Ampla (Brazil) | | | 183,846 | | | | 172,199 | | | | 11,647 | | | | 6.8 | |
Coelce (Brazil) | | | 117,380 | | | | 61,417 | | | | 55,963 | | | | 91.1 | |
Codensa (Colombia) | | | 261,975 | | | | 240,887 | | | | 21,088 | | | | 8.8 | |
Edelnor (Peru) | | | 90,986 | | | | 84,105 | | | | 6,881 | | | | 8.2 | |
Other | | | (1,250) | | | | (1,178) | | | | (59) | | | | 5.0 | |
| | | | | | | | | | | | | | | | |
Total | | | 601,708 | | | | 679,428 | | | | (77,720) | | | | (11.4) | |
Less: consolidation adjustments and non-core activities | | | (14,010) | | | | (10,001) | | | | (4,009) | | | | 40.1 | |
| | | | | | | | | | | | | | | | |
Total | | | 1,388,000 | | | | 1,351,068 | | | | 36,932 | | | | 2.7 | |
| | | | | | | | | | | | | | | | |
126
Other Results from Continuing Operations
The following table sets forth our other results from continuing operations for the years ended December 31, 2014 and 2013:
| | | | | | | | | | | | | | | | |
| | | Year ended December 31, | |
| | | 2014 | | | 2013 | | | Change | | | Change | |
| | | (in millions of Ch$) | | | (in %) | |
Financial result | | | | | | | | | | | | |
Financial income | | | 251,122 | | | | 246,616 | | | | 4,506 | | | | 1.8 | |
Financial costs | | | (432,314) | | | | (325.972) | | | | (106,342) | | | | (32.6) | |
Results from indexed assets and liabilities | | | (13,630) | | | | (11,008) | | | | (2,622) | | | | (23.8) | |
Net foreign currency exchange gains (losses) | | | (18,494) | | | | (28,535) | | | | 10,041 | | | | 35.2 | |
| | | | | | | | | | | | | | | | |
Total | | | (213,316) | | | | (118,899) | | | | (94,417) | | | | (79.4) | |
| | | | |
Other | | | | | | | | | | | | | | | | |
Other gain (losses) | | | 877 | | | | 4,642 | | | | (3,765) | | | | (81.1) | |
| Share of the profit of associates and joint ventures accounted for using the equity method | | | 2,560 | | | | 980 | | | | 1,580 | | | | 161.2 | |
| | | | | | | | | | | | | | | | |
Total | | | 3,437 | | | | 5,622 | | | | (2,185) | | | | (38.9) | |
| | | | | | | | | | | | | | | | |
Total other results | | | (209,879) | | | | (113,277) | | | | (96,602) | | | | (85.3) | |
| | | | | | | | | | | | | | | | |
Financial Results from Continuing Operations
The net financial results for 2014 was an expense of Ch$ 213.1 billion. The expense increased Ch$ 94.4 billion, or 79.4%, in comparison to 2013.
This was mainly explained by higher financial costs of Ch$ 106.4 billion, mainly due to (i) an increase of Ch$ 68.7 billion related to the revaluation of non-amortized assets at the end of the concessions in Ampla and Coelce to their new replacement values, (ii) Ch$ 26.9 billion relating to interest on loans and bonds and (iii) Ch$ 8.9 billion in higher financial provisions.
In addition, we recorded higher financial income of Ch$ 4.5 billion, mainly due to increased non-recurring income of Ch$ 84.5 billion from a debt restructuring agreed between Mitsubishi Corporation (“MC”) and Costanera in October 2014, which resulted in US$ 107 million in higher financial income, including principal and interest. In accordance with the terms, MC forgave accrued interest of US$ 66 million as of September 30, 2014. This result was offset by (i) reduced income of Ch$ 54.6 billion as a result of the revaluation of non-amortized assets at the end of the concessions in Ampla and Coelce to their new replacement values, (ii) lower income from time deposits and other financial instruments of Ch$ 11.6 billion, (iii) lower financial income of Ch$ 8.5 billion, mainly from customer financing agreements and (iv) reduced income of Ch$ 4.0 billion in Edesur as a result of lower compensation under Resolution No. 250/2013 (Costs Monitoring Mechanism or “MMC” in its Spanish acronym), compared to 2013.
Income Taxes
Income tax expenses decreased by Ch$ 16.5 billion, mainly due to the positive recognition of net deferred tax assets in the Peruvian companies for Ch$ 24.8 billion following the application of Law 30,296 which establishes gradual reductions in the tax rate from 2015. This was partially compensated by Ch$ 6.9 billion increase in Codensa due to higher net taxable income.
The effective tax rate was 36.2% in 2014 and 35.8% in 2013, mainly as result of higher taxes due to the devaluation of the Chilean peso in terms of U.S. dollar.
127
Net Income
The following table sets forth our consolidated income from continuing operations before income taxes, income taxes, net income from discontinued operations and net income for the years ended December 31, 2014 and 2013:
| | | | | | | | | | | | | | | | |
| | | Year ended December 31, | |
| | | 2014 | | | 2013 | | | Change | | | Change | |
| | | (in millions of Ch$) | | | (in %) | |
Operating income | | | 1,388,000 | | | | 1,351,068 | | | | 36,932 | | | | 2.7 | |
Other results | | | (209,879) | | | | (113,277) | | | | (96,602) | | | | 85.3 | |
| | | | | | | | | | | | | | | | |
Income before tax | | | 1,178,121 | | | | 1,237,791 | | | | (59,670) | | | | (4.8) | |
Income tax | | | (425,958) | | | | (442,455) | | | | 16,497 | | | | (3.7) | |
| | | | | | | | | | | | | | | | |
Net Income from continuing operations | | | 752,163 | | | | 795,336 | | | | (43,173) | | | | (5.4) | |
Income from discontinued operations | | | 215,332 | | | | 318,065 | | | | (102,733) | | | | (32.3) | |
| | | | | | | | | | | | | | | | |
Net income attributable to: | | | 967,495 | | | | 1,113,401 | | | | (145,906) | | | | (13.1) | |
Net income attributable to the parent company | | | 571,873 | | | | 658,514 | | | | (86,641) | | | | (13.2) | |
Net income attributable to non-controlling interests | | | 395,622 | | | | 454,887 | | | | (59,265) | | | | (13.0) | |
| II. | Analysis of Results from Discontinued Operations |
Revenues from Discontinued Operations
Generation Business
The following table sets forth the physical electricity sales of Endesa Chile and its subsidiaries and the corresponding changes for the years ended December 31, 2014 and 2013:
| | | | | | | | | | | | | | | | |
| | | Years ended December 31, | |
| | | 2014 | | | 2013 | | | Change | | | Change | |
| | | (in GWh) | | | (in %) | |
Endesa Chile and subsidiaries | | | 21,156 | | | | 20,406 | | | | 750 | | | | 3.7% | |
| | | | | | | | | | | | | | | | |
Distribution Business
The following table sets forth the physical electricity sales of Chilectra Chile and the corresponding changes for the years ended December 31, 2014 and 2013:
| | | | | | | | | | | | | | | | |
| | | Years ended December 31, | |
| | | 2014 | | | 2013 | | | Change | | | Change | |
| | | (in GWh) | | | | | | (in %) | |
Chilectra Chile | | | 15,690 | | | | 15,140 | | | | 550 | | | | 3.6% | |
| | | | | | | | | | | | | | | | |
128
The following table sets forth our revenues by business for the years ended December 31, 2014 and 2013:
| | | | | | | | | | | | | | | | |
| | | Years ended December 31, | |
| | | 2014 | | | 2013 | | | Change | | | Change | |
| | | (in millions of Ch$) | | | (in %) | |
Generation Business | | | | | | | | | | | | |
Endesa Chile and subsidiaries | | | 1,220,566 | | | | 959,787 | | | | 260,779 | | | | 27.2 | |
| | | | | | | | | | | | | | | | |
| | | | |
Distribution Business | | | | | | | | | | | | | | | | |
Chilectra Chile and subsidiaries | | | 1,127,893 | | | | 975,024 | | | | 152,869 | | | | 15.7 | |
| | | | | | | | | | | | | | | | |
Non-electricity business and combination adjustments | | | (300,952) | | | | (198,513) | | | | (102,439) | | | | 51.6 | |
| | | | | | | | | | | | | | | | |
Total | | | 2,047,507 | | | | 1,736,298 | | | | 311,209 | | | | 17.9 | |
| | | | | | | | | | | | | | | | |
Generation Business: Revenues
Revenues increased by Ch$ 260.8 billion, or 27.2%, in 2014 compared to 2013, mainly due to (i) Ch$ 160 billion as result of a 29.5% increase in average energy sales prices; (ii) Ch$ 113.0 billion of revenues contributed by GasAtacama, which has been consolidated by Endesa Chile since May 2014, and (iii) Ch$ 30 billion as a consequence of an increase in physical sales of 3.7% mainly to distribution companies. This increase was partially offset by Ch$ 39.7 billion lower revenues from other services, mostly tolls.
Distribution Business: Revenues
Revenues from Chilectra Chile increased by Ch$ 152.9 billion, or 15.7%, in 2014 compared to 2013, as a result of (i) higher average energy prices due to indexed cost adjustments not previously reflected that contributed higher revenues of Ch$ 124.5 billion and (ii) Ch$ 30.6 billion due to 550 GWh, or 3.6%, higher physical sales due to lower temperatures than the previous year. The number of customers rose by approximately 43,400 in 2014 compared to 2013, totaling approximately 1,737,300.
Operating Costs from Discontinued Operations
Operating costs consist primarily of energy purchases from third parties, fuel purchases, depreciation, amortization and impairment losses, maintenance costs, tolls paid to transmission companies, employee salaries and administrative and selling expenses.
The following table sets forth our operating costs in Chilean pesos and as a percentage of total operating costs for the years ended December 31, 2014 and 2013:
| | | | | | | | | | | | | | | | |
| | | Years ended December 31, | |
| | | 2014 | | | 2013 | |
| | | (in million
of Ch$) | | | (in %) | | | (in million
of Ch$) | | | (in %) | |
Energy purchases | | | 788,421 | | | | 47.3 | | | | 568,437 | | | | 42.2 | |
Fuel purchases | | | 305,480 | | | | 18.3 | | | | 211,612 | | | | 15.7 | |
Transportation costs | | | 151,949 | | | | 9.1 | | | | 182,821 | | | | 13.6 | |
Depreciation, amortization and impairment losses(1) | | | 141,623 | | | | 8.5 | | | | 127,720 | | | | 9.5 | |
Other fixed costs(1) | | | 110,321 | | | | 6.7 | | | | 114,351 | | | | 8.5 | |
Employee benefit expense and others(1) | | | 104,836 | | | | 6.3 | | | | 105,283 | | | | 7.8 | |
Other variable cost | | | 63,553 | | | | 3.8 | | | | 36,004 | | | | 2.7 | |
| | | | | | | | | | | | | | | | |
Total operating costs from discontinued operations | | | 1,666,182 | | | | 100.0 | | | | 1,346,228 | | | | 100.0 | |
| (1) | Corresponds to selling and administration expenses. |
Our 2014 total operating cost structure from discontinued operations remained similar to our 2013 operating cost structure, except for the energy purchases that increased due to the stoppage of the Bocamina II thermal plant from December 2013 through 2014.
129
The following table sets forth our operating costs (excluding selling and administrative expenses) from discontinued operations by business for the years ended December 31, 2014 and 2013:
| | | | | | | | | | | | | | | | |
| | | Years ended December 31, | |
| | | 2014 | | | 2013 | | | Change | | | Change | |
| | | (in millions of Ch$) | | | (in %) | |
Generation Business | | | | | | | | | | | | |
Endesa Chile and subsidiaries | | | 750,213 | | | | 494,892 | | | | 255,321 | | | | 51.6 | |
| | | | | | | | | | | | | | | | |
| | | | |
Distribution Business | | | | | | | | | | | | | | | | |
Chilectra Chile and subsidiaries | | | 855,758 | | | | 712,458 | | | | 143,300 | | | | 20.1 | |
| | | | | | | | | | | | | | | | |
Non-electricity business and combination adjustments | | | (296,569) | | | | (208,476) | | | | (88,093) | | | | (42.3) | |
| | | | | | | | | | | | | | | | |
Total | | | 1,309,402 | | | $ | 998,874 | | | | 310,528 | | | | 31.1 | |
| | | | | | | | | | | | | | | | |
Generation Business: Operating Costs
Operating costs of Endesa Chile increased by Ch$ 255.3 billion, or 51.6%, in 2014 compared to 2013, mainly due to (i) Ch$ 164.0 billion increased purchases of energy on the spot market, primarly due to the stoppage of the Bocamina II thermal power plant from December 2013 through 2014 and (ii) Ch$ 93.9 billion higher fuel consumption costs mainly as a consequence of the full consolidation of GasAtacama since May 2014, which increased costs by Ch$ 53.9 billion and a Ch$ 35.0 billion increase associated with the San Isidro and Tarapaca thermal plants due to higher price of LNG.
Distribution Business: Operating Costs
Operating costs of Chilectra Chile increased by Ch$ 143.3 billion, or 20.1%, in 2014 compared to 2013, mainly due to greater energy purchases of Ch$ 137.9 billion to cover the physical energy sales, of which Ch$ 111.4 billion was the result of higher average purchase price of Ch$ 6.9/GWh due to the regular indexed cost adjustments and Ch$ 26.5 billion by 589 GWh of higher physical energy purchases.
Selling and Administrative Expenses from Discontinued Operations
Selling and administrative expenses relate to salaries, compensation, administrative expenses, depreciation, amortization and impairment losses, and office materials and supplies.
The following table sets forth our selling and administrative expenses, as a percentage of our consolidated selling and administrative expenses from discontinued operations, for the years ended December 31, 2014 and 2013:
| | | | | | | | |
| | | Years ended December 31, | |
| | | 2014 | | | 2013 | |
| | | (in %) | |
Selling and Administrative Expenses as a Percentage of Selling and Administrative Expenses | | | | |
Other fixed costs | | | 30.9 | | | | 32.9 | |
Employee benefit expense and others | | | 29.4 | | | | 30.3 | |
Depreciation, amortization and impairment losses | | | 39.7 | | | | 36.8 | |
| | | | | | | | |
Total | | | 100.0 | | | | 100.0 | |
| | | | | | | | |
130
The following table sets forth our selling and administrative expenses from discontinued operations by business for the years ended December 31, 2014 and 2013:
| | | | | | | | | | | | | | | | |
| | | Years ended December 31, | |
| | | 2014 | | | 2013 | | | Change | | | Change | |
| | | (in millions of Ch$) | | | (in %) | |
Generation Business | | | | | | | | | | | | |
Endesa Chile and subsidiaries | | | 224,627 | | | | 202,030 | | | | 22,597 | | | | 11.2 | |
| | | | | | | | | | | | | | | | |
| | | | |
Distribution Business | | | | | | | | | | | | | | | | |
Chilectra Chile and subsidiaries | | | 118,028 | | | | 122,503 | | | | (4,475) | | | | (3.7) | |
| | | | | | | | | | | | | | | | |
Non-electricity business and combination adjustments | | | 14,125 | | | | 22,821 | | | | (8,696) | | | | (38.1) | |
| | | | | | | | | | | | | | | | |
Total selling and administrative expenses from discontinued operations | | | 356,780 | | | | 347,354 | | | | 9,426 | | | | 2.7 | |
| | | | | | | | | | | | | | | | |
Selling and administrative expenses from discontinued operations increased by Ch$ 9.4 billion, or 2.7%, in 2014 compared to 2013, mainly due to higher charges for depreciation and an impairment of Ch$ 21.2 billion in the generation business, which includes Ch$ 12.6 billion of impairment losses with respect to the Punta Alcalde project. On January 29, 2015, Endesa Chile halted development of the power plant and the related transmission project in light of the changes requested by a Chilean court, which may require major modifications to make the project economically and technologically more sustainable. This was offset by Ch$7.2 billion lower depreciation and impairment losses in Chilectra Chile.
Operating Income from Discontinued Operations
The following table sets forth our operating income from discontinued operations by business for the years ended December 31, 2014 and 2013:
| | | | | | | | | | | | | | | | |
| | | Years ended December 31, | |
| | | 2014 | | | 2013 | | | Change | | | Change | |
| | | (in millions of Ch$) | | | (in %) | |
Generation Business | | | | | | | | | | | | |
Endesa Chile and subsidiaries | | | 245,726 | | | | 262,865 | | | | (17,139) | | | | (6.5) | |
| | | | | | | | | | | | | | | | |
| | | | |
Distribution Business | | | | | | | | | | | | | | | | |
Chilectra Chile and subsidiaries | | | 154,107 | | | | 140,063 | | | | 14,044 | | | | 10.0 | |
| | | | | | | | | | | | | | | | |
Non-electricity business and combination adjustments | | | (18,508) | | | | (12,858) | | | | (5,670) | | | | (43.9) | |
| | | | | | | | | | | | | | | | |
Total | | | 381,325 | | | | 390,070 | | | | (8,745) | | | | (2.2) | |
| | | | | | | | | | | | | | | | |
Other Results from Discontinued Operations
The following table sets forth other results from discontinued operations for the years ended December 31, 2014 and 2013:
| | | | | | | | | | | | | | | | |
| | | Years ended December 31, | |
| | | 2014 | | | 2013 | | | Change | | | Change | |
| | | (in millions of Ch$) | | | (in %) | |
Financial results | | | | | | | | | | | | |
Financial income | | | 14,763 | | | | 13,511 | | | | 1,252 | | | | 9.3 | |
Financial costs | | | (59,544) | | | | (62,395) | | | | 2,851 | | | | 4.6 | |
Profit for indexed assets and liabilities | | | 15,264 | | | | 1,593 | | | | 13,671 | | | | n.a. | |
Foreign currency exchange differences | | | (20,328) | | | | (1,838) | | | | (18,490) | | | | n.a. | |
| | | | | | | | | | | | | | | | |
Total | | | (49,845) | | | | (49,130) | | | | (715) | | | | (1.5) | |
| | | | |
Others | | | | | | | | | | | | | | | | |
Gain from sales of assets | | | 70,893 | | | | 14,528 | | | | 56,365 | | | | n.a. | |
Share of the profit (loss) of associates and joint ventures accounted for using the equity method | | | (54,353) | | | | 24,309 | | | | (78,662) | | | | n.a. | |
| | | | | | | | | | | | | | | | |
Total | | | 16,540 | | | | 38,837 | | | | (22,297) | | | | (57.4) | |
| | | | | | | | | | | | | | | | |
Total other results from discontinued operations | | | (33,305) | | | | (10,293) | | | | (23,012) | | | | n.a. | |
| | | | | | | | | | | | | | | | |
131
Financial Results from Discontinued Operations
The net financial results for 2014 was a net expense of Ch$ 49.8 billion very similar to 2013 mainly explained by increased charges for foreign currency exchange differences of Ch$ 18.5 billion, as a result of the devaluation of the Chilean peso against the U.S. dollar that affected the valuation of derivative instruments that was partially offset by a gain for indexation adjustments of Ch$ 13.7 billion mainly due to the positive variation of financial derivatives asset positions over the UF and lower financial costs by Ch$ 2.9 billion.
Others from Discontinued Operations
Gains from sales of assets increased by Ch$ 56.4 billion, mainly due to the recognition of a Ch$ 42.5 billion gain arising from the revaluation of the 50% pre-existing investment in GasAtacama and the recognition of its accumulated currency exchange differences, and a Ch$ 21.1 billion gain on the sale of Los Maitenes and Aguas Santiago Poniente (Enea Project in former Manso de Velasco), partially offset by reduced sales of investment properties and transmission lines of Ch$ 11.0 billion.
The share of profits (loss) of associates and joint ventures accounted for using the equity method decreased by Ch$ 78.7 billion, mainly as a result of an impairment loss of Ch$ 69.1 billion in connection with the HidroAysén project, due to Endesa Chile’s decision not to proceed with this project. This decision was based on the uncertainty of recovering the investment made in the project, mainly as a consequence of the long judicial process required to obtain environmental approvals. This result also decreased by Ch$13.9 billion as a result of the full consolidation of GasAtacama Holding beginning in 2014 and not being accounted under the equity method as it was during the 2013. Such decreases were partially offset by an increase of Ch$ 4.4 billion relating to Electrogas.
As a result of all the foregoing, total non-operating results for 2014 amounted to a net expense of Ch$ 33.4 billion.
Income Taxes from Discontinued Operations
Income tax increased by Ch$ 71.0 billion in 2014 compared to 2013 mainly due to (i) increased charges of Ch$ 62.0 billion due to the one-time recognition effect of net deferred tax liabilities as a result of the application of the tax reform enacted in Chile on September 29, 2014, which established a gradual increase in the taxation rate and, (ii) the additional net income due to the the full consolidation of GasAtacama that resulted in additional income tax by Ch$ 10.2 billion.
The effective tax rate was 39.9% in 2014 and 16.5% in 2013.
Net Income from Discontinued Operations
The following table sets forth our net income before taxes, income tax expenses and net income for the years ended December 31, 2014 and 2013:
| | | | | | | | | | | | | | | | |
| | | Years ended December 31, | |
| | | 2014 | | | 2013 | | | Change | | | Change | |
| | | (in millions of Ch$) | | | (in %) | |
Operating income | | | 381,325 | | | | 390,070 | | | | (8,745) | | | | (2.2) | |
Other results | | | (33,305) | | | | (10,293) | | | | (23,012) | | | | n a | |
| | | | | | | | | | | | | | | | |
Net income before taxes | | | 348,020 | | | | 379,777 | | | | (31,757) | | | | (8.4) | |
Income tax expenses | | | (132,688) | | | | (61,712) | | | | (70,976) | | | | n.a. | |
| | | | | | | | | | | | | �� | | | |
Net income | | | 215,332 | | | | 318,065 | | | | (102,733) | | | | (32.3) | |
Net income attributable to the Parent Company | | | 178,231 | | | | 235,207 | | | | (56,976) | | | | (24.2) | |
Net income attributable to non-controlling interests | | | 37,101 | | | | 82,858 | | | | (45,758) | | | | (55.2) | |
132
The net income attributable to non-controlling interests decreased by Ch$ 45.8 billion in 2014 compared to 2013 primarily due to the Ch$ 46.9 billion of lower net income attributable to the non-controlling interests of Endesa Chile for the corresponding years, which in turn is mainly due to the decrease in the net income contributed by Endesa Chile of Ch$ 117 billion. The controlling and economic interest in Endesa Chile remained the same in both periods (59.98%).
| B. | Liquidity and Capital Resources. |
We are a company with no significant assets other than the stock of our subsidiaries. The following discussion of cash sources and uses reflects the key drivers of our cash flow.
We, on a stand-alone basis, receive cash inflows from our subsidiaries, as well as from related companies. Our subsidiaries and associates’ cash flows may not be available to satisfy our own liquidity needs, mainly because they are not wholly-owned, and because there is a time lag before we have effective access to those funds through dividends or capital reductions. However, we believe that cash flow generated from our business operations, as well as cash balances, borrowings from commercial banks, and ample access to both Chilean and foreign capital markets will be sufficient to satisfy all our needs for working capital, debt service, dividends and routine capital expenditures in the foreseeable future.
In March 2013, we completed a Ch$ 2,846 billion (US$ 6.0 billion) capital increase, pursuant to which our minority shareholders contributed approximately Ch$ 1,121 billion (US$ 2.4 billion) in cash and Endesa Spain contributed in-kind with assets worth Ch$ 1,700 billion (US$ 3.6 billion) (see “Item 4. Information on the Company — A. History and Development of the Company”).
Set forth below is a summary of our consolidated cash flow information (including both contiunued and discontinued operations) for the years ended December 31, 2015, 2014 and 2013.
| | | | | | | | | | | | |
| | | Year ended December 31, | |
| | | 2015 | | | 2014 | | | 2013 | |
| | | (in billions of Ch$) | |
Net cash flows from (used in) operating activities | | | 1,923 | | | | 1,698 | | | | 1,701 | |
Net cash flows from (used in) investing activities | | | (1,215) | | | | (300) | | | | (1,224) | |
Net cash flows from (used in) financing activities | | | (1,060) | | | | (1,283) | | | | 337 | |
| | | | | | | | | | | | |
Net increase (decrease) in cash and cash equivalents before effect of exchange rates changes | | | (352) | | | | 115 | | | | 814 | |
Effects of exchange rate changes on cash and cash equivalents | | | 23 | | | | (17) | | | | (24) | |
Cash and cash equivalents at beginning of period | | | 1,705 | | | | 1,606 | | | | 816 | |
| | | | | | | | | | | | |
Cash and cash equivalents at end of period | | | 1,329 | | | | 1,705 | | | | 1,606 | |
Set forth below is a summary of the net cash flow attributable to discontinued operations for the years ended December 31, 2015, 2014 and 2013.
| | | | | | | | | | | | |
| | | Year ended December 31, | |
| | | 2015 | | | 2014 | | | 2013 | |
| | | (in billions of Ch$) | |
Net cash flows from (used in) operating activities | | | 577 | | | | 265 | | | | 443 | |
Net cash flows from (used in) investing activities | | | (297) | | | | (189) | | | | (106) | |
Net cash flows from (used in) financing activities | | | (273) | | | | (159) | | | | (216) | |
| | | | | | | | | | | | |
Net increase (decrease) in cash and cash equivalents before effect of exchange rates changes | | | 6 | | | | (83) | | | | 120 | |
Effects of exchange rate changes on cash and cash equivalents | | | 5 | | | | 1 | | | | 0.4 | |
Cash and cash equivalents at beginning of period | | | 133 | | | | 215 | | | | 94 | |
| | | | | | | | | | | | |
Cash and cash equivalents at end of period | | | 144 | | | | 133 | | | | 215 | |
For the year ended December 31, 2015, net cash flow from operating activities was Ch$ 1,923 billion, an increase of Ch$ 225 billion, or 13.3%, compared to Ch$ 1,698 billion for the same period of 2014, primarily as a consequence of an increase in collections from the sale of goods and services of Ch$ 1,197 billion comprised of (i) Ch$ 337 billion from Chilectra Chile due to an increase of the tariff to regulated customers, despite the slight decrease in the collection rate from 99.6% to 97.0% in 2015 compared
133
to 2014, (ii) Ch$ 286 billion of Endesa Chile on a stand-alone basis as a consequence of an increase in physical sales, (iii) Ch$ 265 billion from Edesur due to higher revenues as a result of the application of Resolution No. 32/2015, (iv) Ch$ 116 billion from the full consolidation of GasAtacama, and (v) Ch$ 88 billion from Edelnor as a consequence of increased revenues of Ch$ 83.4 million in 2015.
The increase in collections from the sale of goods and services in 2015 was partially offset by:
| | (i) | an increase in payments to suppliers for goods and services of Ch$ 479 billion comprised of: (a) Ch$ 135 billion from Edesur due to the application of Resolution No. 32/2015, which allows trade and other payables to be offset against trade and other receivables, (b) Ch$ 133 billion from Chilectra Chile mainly due to Ch$ 115.3 billion of higher energy purchases due to the higher indexation cost adjustments, (c) Ch$ 86 billion from Endesa Chile, on a stand-alone basis, of payments to third parties, which was mostly a consequence of higher variable procurement and services of Ch$ 39.5 billion, mostly attributable to costs related to the lease of Gener’s Nueva Renca combined-cycle power plant for use of Endesa Chile’s available LNG and Ch$ 36.9 billion higher transportation costs related to additional energy purchases, (d) Ch$ 80 billion from Emgesa as a consequence of Ch$ 82 billion higher energy purchases, (e) Ch$ 80 billion from Ampla due to higher energy purchases of Ch$ 75 billion related to the drought, and (f) Ch$ 64 billion from the full inclusion of GasAtacama, compensated by Ch$ 94 billion from Codensa mainly due to the currency translation effect of converting Colombian pesos to Chilean pesos; |
| | (ii) | a decrease in other collections from operating activities of Ch$ 200 billion mainly due to a decrease in Ampla of Ch$ 113 billion and in Coelce of Ch$ 72 billion, in both cases as a consequence of less collection of the CDE charges (see “Item 4. Information on the Company — B. Business Overview — Electricity Industry Regulatory Framework — Brazil — Regulation of Distribution Companies — Energy Development Account, “Cuenta de Desarrollo Energético - CDE”); |
| | (iii) | an increase in other payments for operating activities of Ch$ 155 billion mainly attributable to lower VAT payments by Ampla of Ch$ 159 billion as a consequence of lower sales; |
| | (iv) | an increase in payments to and on behalf of employees of Ch$ 72 billion mainly attributable to Ch$ 69 billion of increases in wages and benefits in Edesur; |
| | (v) | an increase in other outflows of cash of Ch$ 34 billion mainly attributable to Ch$ 25 billion as a consequence of higher VAT related to higher sales in Chilectra Chile; and |
| | (vi) | an increase in income taxes paid of Ch$ 23 billion, mainly due to higher sales in Endesa Chile. |
See “Item 5. Operating and Financial Review and Prospects — A. Operating Results.— 2. Analysis of Results of Operations for the Years Ended December 31, 2015 and 2014.”
For the year ended December 31, 2014, net cash flow from operating activities was Ch$ 1,698 billion, a decrease of Ch$ 3 billion, or 0.2%, compared to 2013, primarily as a consequence of:
| | (i) | an increase in payments to suppliers for goods and services of Ch$ 705 billion (Ch$ 205 billion from Endesa Chile, on a stand-alone basis, mainly due to Ch$ 164.0 billion greater purchases of energy on the spot market, principally as a consequence of the stoppage of Bocamina II coal fired power plant during 2014, Ch$ 90 billion from the full consolidation of GasAtacama, Ch$ 236 billion from Brazilian subsidiaries due to higher energy purchases of Ampla, Coelce, Cachoeira and Fortaleza, all of whom were affected by higher energy prices caused by the drought); |
| | (ii) | an increase in other payments for operating activities of Ch$ 242 billion mainly related to Codensa’s credit card program which is offered through an unrelated bank and in Edelnor related to other maintenance costs; |
| | (iii) | a decrease in collections from insurance policies and services, annual payments, and other benefits from policies held of Ch$ 54 billion mainly in Endesa Chile since in 2013, Endesa Chile received a Ch$ 72.2 billion reimbursement from the insurance company for the loss of profits from the Bocamina I power plant and Ch$ 1.4 billion of material damages at the Bocamina II power plant, both related to the 2010 earthquake in Chile; |
| | (iv) | an increase in income tax payments of Ch$ 47 billion, mainly in Enersis Américas on a stand-alone basis due to greater anticipated payments of income tax; and |
| | (v) | an increase in payments to and on behalf of employees of Ch$ 34 billion, mainly in Argentina and Brazil. |
134
All of which were partially offset by the increase in collections from the sale of goods and services of Ch$ 840 billion (Ch$ 169 billion from Endesa Chile, on a stand-alone basis, mainly due to higher physical sales, Ch$ 122 billion from the full consolidation of GasAtacama, Ch$ 122 billion from Emgesa and Chinango due to higher physical sales and the positive effect of converting Colombian pesos into Chilean pesos and Ch$ 88 billion from Edegel as a result of higher physical sales of 417 GWh), and the increase in other collections from operating activities of Ch$ 290 billion mainly in Ampla and Coelce related to CDE’s charges and related to collections of Codensa’s credit card program (see “Item 5. Operating and Financial Review and Prospects — A. Operating Results.— 3. Analysis of Results of Operations for the Years Ended December 31, 2014 and 2013”).
For the year ended December 31, 2015, net cash used in investing activities was Ch$ 1,215 billion, mostly explained by the acquisition of fixed assets totaling Ch$ 1,363 billion mainly by Endesa Chile, on a stand-alone basis, related to the 150 MW Los Cóndores project, by Emgesa, related to the construction of El Quimbo and the incorporation of intangible assets (under IFRIC 12) of the Brazilian distribution companies (see “Item 4. Information on the Company — A. History and Development of the Company — Investment, Capital Expenditures and Divestitures”), all of which was partially offset by interest received of Ch$ 59 billion, investments in time deposits with a maturity greater than 90 days for Ch$ 43 billion, collections from derivatives contracts of Ch$ 17 billion and other inflows for Ch$ 18 billion, mainly the collection of cash collateral related to derivatives.
For the year ended December 31, 2014, net cash used in investing activities was Ch$ 300 billion, mostly explained by investments in time deposits with a maturity greater than 90 days for Ch$ 646 billion, mainly of Enersis Américas, on a stand-alone basis from the proceeds of the 2013 capital increase, the acquisition of fixed assets totaling Ch$ 826 billion mainly Endesa Chile and Emgesa (see “Item 4. Information on the Company — A. History and Development of the Company — Investment, Capital Expenditures and Divestitures”), incorporation of intangible assets (under IFRIC 12) for Ch$ 261 billion in Brazil, the consolidation of GasAtacama, after the purchase of an additional 50% participation, for Ch$ 38 billion, all of which was partially offset by interest received of Ch$ 93 billion, loss of control of subsidiaries for Ch$ 41 billion, due to the sale of all the shareholding in Maitenes and Aguas Santiago Poniente, and other inflows for Ch$ 44 billion related to derivatives contracts of Enersis Américas and Endesa Chile, each on a stand-alone basis.
For the year ended on December 31, 2015, net cash used in financing activities decreased to Ch$ 1,060 billion from Ch$ 1,283 billion for 2014. The main drivers of this change are described below.
The aggregate cash outflows were primarily due to:
| | • | | Ch$ 612 billion in dividend payments (including Ch$ 305 billion from Enersis Américas on a stand-alone basis, Ch$ 135 billion from Emgesa, excluding dividends paid to us, Ch$ 64 billion from Endesa Chile on a stand-alone basis, Ch$ 72 from Codensa, among others). |
| | • | | Ch$ 615 billion of payments of loans and bonds (Ch$ 207 billion for Emgesa, Ch$ 141 billion for Endesa Chile on a stand-alone basis, Ch$ 92 billion for Edegel and Chinango, Ch$ 63 billion for Ampla, Ch$ 49 billion of Edelnor, among others). |
| | • | | Ch$ 267 billion of interest expense (including Ch$ 80 billion in Emgesa, Ch$ 60 billion in Endesa Chile on a stand-alone basis, Ch$ 36 billion in Ampla, Ch$ 27 billion in Codensa, among others). |
The aggregate cash inflows from financing activities were primarily due to:
| | • | | Ch$ 290 billion in loans by Emgesa. |
| | • | | Ch$ 47 billion in loans by Edegel and Chinango. |
| | • | | Ch$ 48 billion in loans and bonds by Edelnor. |
For the year ended on December 31, 2014, net cash used in financing activities was Ch$ 1,283 billion in comparison to Ch$ 337 billion of net cash flows from financing activities in 2013. The main drivers of this change are described below.
The aggregate cash inflows from financing activities were primarily due to:
| | • | | Ch$ 165 billion in bond issuances by Emgesa. |
| | • | | Ch$ 118 billion in loans by Coelce. |
| | • | | Ch$ 77 billion in bond issuances by Edelnor. |
| | • | | Ch$ 75 billion in bond issuances by Ampla. |
135
| | • | | Ch$ 53 billion in bond issuances by Codensa. |
| | • | | Ch$ 28 billion in loans by Edegel. |
| | • | | Ch$ 9 billion in capital increase by Dock Sud. |
The aggregate cash outflows were primarily due to:
| | • | | Ch$ 633 billion in dividend payments (including Ch$ 332 billion from Enersis Américas on a stand-alone basis, Ch$ 108 billion from Emgesa, excluding dividends paid to us, among others). |
| | • | | Ch$ 385 billion in purchases of minority shareholdings (Coelce for Ch$ 134 billion and Edegel for Ch$ 251 billion). |
| | • | | Ch$ 247 billion of interest expense (including Ch$ 66 billion in Emgesa among others). |
| | • | | Ch$ 210 billion on payments of loans, bonds and other financial instruments from Endesa Chile on a consolidated basis. |
| | • | | Ch$ 187 billion on payments of loans and bonds in Enersis Américas on a stand-alone basis. |
| | • | | Ch$ 100 billion on payments of loans and bonds in Enel Brasil on a consolidated basis. |
| | • | | Ch$ 87 billion on payments of loans and bonds by Codensa. |
| | • | | Ch$ 34 billion on payments of loans, bonds and other financial instruments in Edelnor. |
For a description of liquidity risks resulting from the inability of our subsidiaries to transfer funds, please see “Item 3. Key Information — D. Risk Factors — We depend in part on payments from our subsidiaries, jointly-controlled entities and associates to meet our payment obligations.”
We coordinate the overall financing strategy of our controlled subsidiaries. Our operating subsidiaries independently develop their capital expenditure plans and finance their capital expansion programs through internally generated funds or direct financings. We have no legal obligations or other commitments to financially support our subsidiaries. In addition, and as disclosed later in this section, none of our debt agreements include cross default provisions that could be triggered by Argentine or any other foreign subsidiary defaults. According to the current terms of our debt agreements, only defaults by certain Chilean subsidiaries could trigger a cross default for us. However, following the spin-off of Enersis Chile, we no longer have any Chilean subsidiaries. In some cases, our subsidiaries may be financed by us through intercompany loans. For information regarding our commitments for capital expenditures, see “Item 4. Information on the Company — A. History and Development of the Company — Capital Investments, Capital Expenditures and Divestitures” and our contractual obligations table set forth below under “F. Tabular Disclosure of Contractual Obligations.
Having stated our corporate policy in connection with the financial autonomy that we expect from our subsidiaries, we have in the recent past, and to a very limited extent, provided financial support in Argentina in the form of intercompany loans and capital contributions in which debt was capitalized. We have also guaranteed a loan with a third party for an immaterial amount. Most of the loans have been provided by our wholly-owned investment vehicle, Endesa Argentina S.A., using local funds such as dividends from other Argentine subsidiaries.
Additionally, information about Endesa Chile’s participation in Costanera’s 2013 capital increase can be found later in this section, and information regarding structured loans from Endesa Chile to Costanera can be found in “Item 7—Major Shareholders and Related Party Transactions — B. Related Party Transactions.”
We believe that the level of such financial support is insignificant in the context of our consolidated financial statements taken as a whole. The fundamental drivers of such limited support are recent regulatory changes implemented by Argentine authorities, including Resolutions 95, 529 and 482, among others, and our expectation that our Argentine long-lived assets will eventually be appropriately recovered by free cash flows arising from new and more favorable electricity sector regulations.
To the extent there may be positive market signals regarding regulatory improvements which allow us to forecast favorable effects on our Argentine subsidiaries’ operating results, we may continue to evaluate additional, temporary and exceptional financial support (primarily in the form of intercompany loans) on a case by case basis, as described in this context.
In March 2016, as a consequence of the political and economic situation prevailing in Brazil, explained in further details below, we also have guaranteed Ampla’s US$ 75 million three-year bank term loan. The financing was provided in Chile in U.S. dollars, and has a swap from U.S. Dollars to Brazilian reais contracted in Brazil, which was also guaranteed by us.
136
We have accessed the international equity capital markets (including several SEC-registered ADS issuances) in 1993, 1996, 2000, 2003 and 2013. We have also issued bonds in the United States (“Yankee Bonds”). Since 1996, we have issued a total of US$ 1,150 million in Yankee Bonds.
The following table lists the Yankee Bonds issued by us outstanding as of December 31, 2015. The weighted average annual coupon interest rate for such bonds is 7.4%, without giving effect to each bond’s duration, or put options.
| | | | | | | | | | | | | | | | | | | | |
| | | | | | | | | | | | Aggregate Principal Amount | |
Issuer | | Term | | | Maturity | | | Coupon | | | Issued | | | Outstanding | |
| | | | | | | | | (%) | | | (in millions of US$) | |
Enersis Américas(1) | | | 10 years | | | | December 2016 | | | | 7.400 | | | | 350 | | | | 250 | |
Enersis Américas(2) | | | 30 years | | | | December 2026 | | | | 6.600 | | | | 150 | | | | 1 | |
| | | | | | | | | | | | | | | | | | | | |
Total | | | | | | | | | | | 7.400 (3) | | | | 500 | | | | 251 | |
| | | | | | | | | | | | | | | | | | | | |
| (1) | Enersis repurchased some of these bonds in 2001. |
| (2) | Holders of our 6.6% Yankee Bonds due 2026 exercised a put option on December 1, 2003 for an aggregate principal amount of US$ 149 million, leaving US$ 1 million outstanding. |
| (3) | Weighted-average coupon. |
The following table lists Emgesa’s bond issued in the United States. The bond is denominated in Colombian pesos. The annual interest rate for such bond is 10.17%.
| | | | | | | | | | | | | | | | | | | | | | | | |
Issuer | | Term | | | Maturity | | | Coupon
(inflation
adjusted rate) | | | Aggregate Principal Amount | |
| | | | | Issued | | | Outstanding | |
| | | | | | | | | ( %) | | | (in billions of
CP$) | | | (in billions of
CP$) | | | (in billions
of Ch$) (1) | |
Emgesa | | | 10 years | | | | January 2021 | | | | 10.17 | | | | 737 | | | | 737 | | | | 166 | |
| (1) | Calculated based on the Observed Exchange Rate as of December 31, 2015, which was CP$ 4.435 per Ch$ 1.00 |
We, as well as our subsidiaries in the countries in which we operate, have access to the domestic capital markets where we have issued debt instruments including commercial paper and medium and long-term bonds that are primarily sold to pension funds, life insurance companies and other institutional investors.
The following table lists UF-denominated Chilean bonds issued by us outstanding as of December 31, 2015.
| | | | | | | | | | | | | | | | | | | | | | | | |
Issuer | | Term | | | Maturity | | | Coupon
(inflation
adjusted rate) | | | Aggregate Principal Amount | |
| | | | | Issued | | | Outstanding | |
| | | | | | | | | ( %) | | | (in millions
of UF) | | | (in millions
of UF) | | | (in billions
of Ch$) | |
Enersis Series B2 | | | 21 years | | | | June 2022 | | | | 5.75 | | | | 2.5 | | | | 1.0 | | | | 26 | |
For a full description of local bonds issued by us, see “Secured and unsecured liabilities by company” in Note 20 of the Notes to our consolidated financial statements.
The following table lists local bonds issued by our foreign subsidiaries, outstanding as of December 31, 2015. We present aggregate information for each company. The maturity column for each company reflects the issuance with the longest maturity, and the coupon rate corresponds to the weighted average coupon of all issuances for each company.
| | | | | | | | | | | | |
Issuer | | Maturity | | | Coupon(1) | | | Aggregate Principal
Amount Outstanding | |
| | | | | | (%) | | | (in billions of Ch$) | |
Ampla | | | July 2019 | | | | 16.47 | | | | 198 | |
Codensa | | | November 2025 | | | | 11.25 | | | | 265 | |
Coelce | | | October 2018 | | | | 17.35 | | | | 81 | |
Edegel | | | January 2028 | | | | 6.43 | | | | 52 | |
Edelnor | | | November 2038 | | | | 6.39 | | | | 223 | |
Emgesa | | | May 2030 | | | | 11.21 | | | | 530 | |
| | | | | | | | | | | | |
Total | | | | | | | | | | | 1,349 | |
| | | | | | | | | | | | |
| (1) | Many of the coupon rates are variable rates based on local indices, such as inflation. The table reflects the coupon rate taking into account each local index as of December 31, 2015. |
137
We frequently participate in the international commercial bank markets through syndicated senior unsecured loans, including both fixed term and revolving credit facilities. We also borrow from banks in Chile under fully committed facilities under which a potential “Material Adverse Effect” (“MAE”) would not be an impediment to this source of liquidity. In 2013, we entered into 3-year bilateral revolving loan for an aggregate of UF 2.4 million (Ch$ 61 billion as of December 31, 2015) as shown below. These loans were closed voluntarily in January 2016, before their due date and were renewed for an aggregate amount of UF 2.8 million (Ch$ 73 billion using the exchange rate as of December 31, 2015) with a 3-year term starting in March 2016.
| | | | | | | | | | | | | | | | |
Borrower | | Type | | | Maturity | | | Facility Amount | | | Amount Drawn | |
| | | | | | | | | (in millions of UF$) | | | (in billions of UF$) | |
Enersis Américas | | | Bilateral revolving loan | | | | April 2016 | | | | 2.4 | | | | — | |
Our subsidiaries also have access to fully committed credit lines in the local markets, as detailed below. | |
| | | | |
Borrower | | Type | | | Last Maturity | | | Facility Amount | | | Amount Drawn | |
| | | | | | | | | (in billions of Ch$) | | | (in billions of Ch$) | |
Ampla | | | Bilateral revolving loans | | | | May 2016 | | | | 31 | | | | — | |
Coelce | | | Bilateral revolving loans | | | | September 2016 | | | | 35 | | | | 9 | |
Fortaleza | | | Bilateral revolving loans | | | | June 2016 | | | | 1 | | | | — | |
| | | | | | | | | | | | | | | | |
Total | | | | | | | | | | | 67 | | | | 9 | |
| | | | | | | | | | | | | | | | |
As a result of the foregoing, we have access to fully committed undrawn revolving loans, both international and domestic, for up to approximately Ch$ 174 billion in the aggregate as of December 31, 2015 and Ch$ 186 billion in the aggregate (using 2015 year-end exchange rate) considering the renewal of our own bilateral revolving loans.
We also borrow routinely from uncommitted Chilean bank facilities with approved lines of credit for approximately Ch$ 70 billion in the aggregate, none of which are currently drawn. Unlike the committed lines described above, which are not subject to MAE conditions precedent prior to disbursements, these facilities are not guaranteed, and therefore could limit our liquidity under certain circumstances. Our subsidiaries also have access to uncommitted local bank facilities, for a total amount of Ch$ 289 billion, of which Ch$ 12 billion were drawn as of December 31, 2015.
We may also access the Chilean commercial paper market under programs that have been registered with the Chilean SVS for a maximum of US$ 200 million. In addition, we have a local bond program registered with the SVS for UF 12.5 million (Ch$ 320 billion as of December 31, 2015), which has not been drawn upon yet. Finally, our foreign subsidiaries also have access to other types of financing, including governmental facilities, supplier credit and leasing, among others.
Except for our SEC-registered Yankee Bonds, which are not subject to financial covenants, our outstanding debt facilities include financial covenants. The types of financial covenants, and their respective limits, vary from one type of debt to another. As of December 31, 2015, the most restrictive financial covenant affecting us was the Indebtedness to EBITDA Ratio covenant, as defined contractually, corresponding to the syndicated bilateral loan facility that was closed in January 2016. Under such covenant, the maximum additional debt that could be incurred without a breach of the most restrictive covenant is Ch$ 2,979 billion. As of December 31, 2015 and as of the date of this Report, we and our subsidiaries are in compliance with the financial covenants contained in our debt instruments with the exception of our Argentine subsidiary, El Chocón, as described below.
For the quarters ended December 31, 2014, March 31, 2015, June 30, 2015 and September 30, 2015, El Chocón did not comply with the interest coverage ratio test (EBITDA to interest expense) pursuant to a covenant requirement under a loan agreement with Standard Bank, Deutsche Bank and Itaú that matured and was paid in February 2016. If the lenders had decided to declare an event of default and accelerate the loan, the principal and interest would have become immediately due and payable under this facility.
138
Because of cross-acceleration provisions of El Chocón’s other loans, additional debt would also have been accelerated and El Chocón would have been forced into bankruptcy. In the distribution business, Ampla has been facing different financial problems as a consequence of the Brazilian economic and political situation, which led to a lower electricity demand, higher costs related to inflation and in the specific case of Ampla, to a deterioration of its cash flows and EBITDA, similar to other distribution companies in the Brazilian market. This required Ampla to renegotiate, among other measures, some of its financial covenants between December 2015 and January 2016, in order to avoid breaching them. There is an additional risk of noncompliance if the economic environment in Brazil continues to worsen. In this context, we guaranteed a loan of Ampla, as mentioned above. As is customary for certain credit and capital market debt facilities, a significant portion of our financial indebtedness is subject to cross default provisions. Each of the revolving credit facilities described above, as well as all of our Yankee Bonds, have cross default provisions with different definitions, criteria, materiality thresholds, and applicability as to the subsidiaries that could give rise to a cross default.
Neither our local facility which was terminated in January 2016, nor the new one due in March 2019 have cross default provisions to debt other than the respective borrower’s own indebtedness.
Cross default provisions of our Yankee Bonds may be triggered only by our or Chilean subsidiaries’ debt, which after the spin-off of Enersis Chile, are no longer part of our consolidation perimeter. A matured default on an individual basis could result in a cross default to our Yankee Bonds if such matured default, on an individual basis, has a principal exceeding US$ 30 million, or its equivalent in other currencies. In the case of a matured default above the materiality threshold, Yankee bondholders would have the option to accelerate if either the trustee or bondholders representing no less than 25% of the aggregate debt of a particular series then outstanding choose to do so. A payment default or a bankruptcy/insolvency default outside of Chile has no contractual effect on our Yankee Bond indentures, no matter how material. Likewise, our local bonds do not have subsidiary cross default provisions.
All of our Yankee Bonds are unsecured and not subject to any guarantees by any of our subsidiaries or parent company, or contain any financial covenants.
Our Argentine subsidiary, Costanera, did not make any installment payments due in 2012, 2013 and 2014 under the terms of a 1996 supplier credit agreement with Mitsubishi Corporation (“MC”) for a total amount of US$ 107 million in payments, including principal and interest. On October 27, 2014, Costanera and MC agreed to refinance the debt under the following summary terms: (i) forgiveness of accrued interest under the agreement for US$ 66 million as of September 30, 2014; (ii) the rescheduling of US$ 120.6 million in capital maturities for a period of 18 years, with a grace period of 12 months; (iii) the debt must be completely paid by December 15, 2032; (iv) an annual amortization of capital of at least US$ 3 million, in quarterly installments; (v) a 0.25% annual interest rate; (vi) maintenance of the lien on the combined-cycle power plant at Costanera in favor of MC; (vii) restrictions to dividend payment; and (viii) the condition precedent for the rescheduling agreement effectiveness was the payment of US$ 5 million of capital, which was made on November 14, 2014.
As explained elsewhere in this section, payment defaults and bankruptcy proceedings of non-Chilean subsidiaries have no financial effect on our debt obligations.
Our companies have access to existing credit lines sufficient to satisfy all of their present working capital needs. However, during 2015, access to the capital markets on the part of our Brazilian subsidiaries has been very limited due to the financial situation prevailing in Brazil. Notwithstanding these circumstances, these subsidiaries were still able to refinance debt maturing in 2015.
Payment of dividends and distributions by our subsidiaries and affiliates represent an important source of funds for us. The payment of dividends and distributions by certain subsidiaries and affiliates are subject to legal restrictions, such as legal reserve requirements, and capital and retained earnings criteria, and other contractual restrictions. Legal counsel in the countries where our subsidiaries and affiliates operate have informed us of the current legal restrictions regarding the payment of dividends or distributions to us in the jurisdictions where such subsidiaries or affiliates are incorporated. We are currently in compliance with the legal restrictions, and therefore, they currently do not affect the payment of dividends or distributions to us. Certain credit facilities and investment agreements of our subsidiaries restrict the payment of dividends or distributions in certain special circumstances. For instance, one of Endesa Chile’s UF-denominated Chilean bonds restricts the amount of intercompany loans that Endesa Chile and its consolidated subsidiaries are allowed to lend to us or Enersis Chile. The threshold for such aggregate restriction of intercompany loans is US$ 100 million equal to approximately Ch$ 71 billion. For a description of liquidity risks resulting from our company status, please see “Item 3. Key Information — D. Risk factors —We depend in part on payments from our subsidiaries, jointly-controlled entities and associates to meet our payment obligations.”
Our estimated capital expenditures for 2016 through 2020 amount to Ch$ 3,781 billion, of which Ch$ 3,210 billion are considered non-discretionary investments. Maintenance capital expenditures is considered non-discretionary because it is necessary to maintain the quality and operation standards required for our facilities, but we do have some flexibility regarding the timing for these investments. We consider the investment in expansion projects under execution as non-discretionary expenditures. We consider the remaining Ch$ 571 billion as discretionary capital expenditures. The latter includes expansion projects that are still under evaluation, in which case we would undertake them only if deemed profitable.
139
Other than in Brazil, we do not currently anticipate liquidity shortfalls affecting our ability to satisfy the material obligations described in this Report. We expect to be able to refinance our indebtedness as it becomes due, fund our purchase obligations outlined previously with internally generated cash and fund capital expenditures with a mixture of internally generated cash and borrowings.
| C. | Research and Development, Patents and Licenses, etc. |
None.
Our subsidiaries are engaged in the generation, transmission and distribution of electricity in Argentina, Brazil, Colombia and Peru. Our businesses are subject to a wide range of conditions that may result in significant variability in our earnings and cash flows from year to year.
Our net income is principally the result of operating income from our generation and distribution businesses, and non-operating income including primarily income arising from related companies accounted for under the equity method and foreign currency exchange rate effects.
Our generation operating income consolidates the results of operations in the four countries (Argentina, Brazil, Colombia and Peru) where we operate and is impacted by the combined effect of several factors, including our contracted electricity prices, prevailing hydrological conditions, the price of fuels used to generate thermal electricity, contracted obligations, generation mix, and electricity prices prevailing in the spot market, among others. The combined effect of many, and sometimes all, of these factors impacts our operating income, which can be more or less favorable from year to year. For example, for the year ended December 31, 2015, our operating income decreased by 10.7 % as compared to the same period in 2014 because of a better combination of these factors, as described in further detail in “Item 5. Operating and Financial Review and Prospects — A. Operating Results — 2. Analysis of results of operations for the Years Ended December 31, 2015 and 2014.”
One of the main drivers of our results of operations is our sale prices and energy costs. Generally, the quantity of electricity sold has been relatively stable over time, with increases reflecting economic and demographic growth. Our profits from contracted sales are driven by the ability to generate or buy electricity at a cost lower than the contracted price. However, the applicable price for sales and purchases for electricity sold and purchased in the spot market is much harder to predict because the spot generation price is influenced by many factors, which can differ in each of the countries where we operate. In general, abundant hydrological conditions lower spot prices while dry conditions increase them. However, our operating income may not be impacted even when we are required to buy at high prices in the spot market if our commercial policy is appropriately managed. Our goal is to have a conservative and well-balanced commercial policy on a country by country basis, which aims at controlling relevant variables, provides stability to profits, and mitigates our exposure to the volatility of the spot market by contracting sales of a significant portion of our expected electricity generation through long-term electricity supply contracts. Our optimal level of electricity supply commitments is one that allows us to protect ourselves against low marginal cost conditions, such as those existing during the rainy season, while still taking advantage of high marginal cost conditions, such as higher spot market prices during dry years. In order to determine the optimal mix of long-term contracts and sales in the spot market: (i) we project our aggregate generation taking into consideration our generation mix, the incorporation of new projects under construction and a dry hydrology scenario, (ii) create demand estimates using standard economic theory, and (iii) forecast the system’s marginal cost using proprietary stochastic models. This commercial policy is not applicable in Argentina, since contracted sales are immaterial and our margin is strongly dependent on the regulatory framework, as explained further below.
International prices for commodities such as fuel oil, coal and LNG also affect spot prices. Fuel prices affect our results since commodity prices directly impact generation costs of our thermal power plants, mainly in Peru. Commodity prices have materially decreased since the second half of 2014 and we expect that this trend will continue until the end of 2016, when oil prices are expected to begin increasing. This trend will likely lower our costs, especially in our Peruvian power plants, which are primarily thermal plants. Our costs also depend on other factors such as spot prices, generation mix, hydrology conditions and our contractual surpluses/deficits. Other factors that affect operating income include transmission costs incurred when delivering electricity from its source to end consumers. In Colombia and Peru, transmission costs are mostly passed through to the customers and mainly depend on physical sales. The transmission system charge is set by the regulator, and has tended to remain stable over time. In Argentina, the transmission cost is mainly assumed by the market operator; therefore, it does not significantly affect generators’ operating income. In Brazil, transmission costs are passed through to the customers and ANEEL, the Brazilian National Electric Energy Agency, approves the electricity tariffs, which is a fixed tariff and do not rely on physical sales.
140
This general framework applies to most of the countries where we operate, but there are some variations in some of these factors. In Argentina, the electricity market is highly regulated and electricity prices are determined by CAMMESA, which is the sole seller for the fuel needed for thermal generation operations. This implies that market agents will not be allowed to trade fuels and, as a result, fuel and commodity prices do not have a direct impact on our Argentine operations.
In Brazil, more than 67% of our installed capacity is hydroelectric and electricity prices are therefore significantly affected by hydrological conditions. In order to provide a financial protection against the hydrological risks for hydro-generators, the Electricity Reallocation Mechanism (“MRE”) was implemented, ensuring the optimal use of the hydroelectric resources of the interconnected power system. This mechanism permits each hydroelectric generator, before buying energy in the spot market to fulfill its contracts, to purchase cheaper energy at a price that covers the incremental costs of operation, the maintenance of hydroelectric plants and the financial compensation for use of water. For our Brazilian operations, fuel and commodity prices are not relevant factors because Power Purchase Agreements are indexed to the official inflation index (IPCA) and the gas price in Fortaleza is indexed mainly to local and USA consumer price indices.
In Colombia, more than 85% of our installed capacity is hydroelectric and electricity prices are therefore significantly affected by hydrological conditions. For our Colombian operations, fuel and commodity prices are not relevant factors because electricity prices are indexed to the local consumer price index (Indice de Precios al Productoror “IPP”) and contracted obligations are committed for periods of three to four years, which enables us to weather short-term trends and better achieve our projected costs, thereby reducing market risk exposure. Colombian electricity prices are very volatile because of the energy trading activity, which is based on forecasts. For example, it could be affected by the expectation of El Niño’s arrival, which will increase prices (dry context). Our electricity supply contracts are not standardized and the terms and conditions of these contracts are individually negotiated. Typically, when these contracts are negotiated, we try to set the price at a premium over future expected spot prices in order to mitigate the risk of future spot price increases. However, the premium can vary substantially depending on a variety of conditions. During 2015, Emgesa used 554 kilotons of coal for its coal-fired plants, an increase of 26.1% compared to 2014, as a consequence of drier hydrological conditions in Colombia due to El Niño phenomenon. The local coal price has remained below the export price since high transportation costs make it difficult for domestic coal to compete in the export market. We expect this trend to continue in the Colombian coal market. In 2013, Emgesa entered into a fuel oil supply agreement with Esapetrol, in addition to the existing oil supply contracts with Petromil and Biomax. Therefore, we believe that Emgesa will have access to a reliable supply of fuel oil for the Cartagena power plant, which represents approximately 47% of our Colombian thermal capacity.
In Peru, we also have long-term supply contract, but for longer periods between 10 to 20 years. The proportion of contracted sales with regulated customers (distributors) has increased in relation to the non-regulated customers. This allows us to have consistent prices for longer periods, which combined with our conservative commercial policy, provides for our profitability.
We expect that during the next three years, regulated tariff rates for the countries where we operate, with the exception of Argentina, will remain fairly stable, without material changes. In Argentina, we expect that the new government in power since December 2015 will implement reforms to the current regulatory framework, which would have a positive effect in our Argentina results.
Finally, variability in our earnings and cash flows can also arise from non-operating factors as well, such as foreign currency exchange rates. Operating results in each of the countries where we operate are first expressed in their own functional currencies and then are converted to Chilean pesos, the reporting currency used in our financial statements. As result of exchange rate effects, the operating results in Chilean pesos may differ significantly from those expressed in their own functional currencies. There may be cases in which we have a profit in local terms but a loss in Chilean accounting terms, and vice versa. Based on the next 12 months’ forward rates available on Bloomberg, we do not anticipate significant impacts on results when converting Peruvian Sol and Colombian pesos to Chilean pesos. However, we expect a significant impact (16% reduction) on results when converting Argentine pesos to Chilean pesos and a moderate impact (approximately 6% reduction) in the case of converting Brazilian reais to Chilean pesos.
For more detail on how each of these factors impacts the net income of our electricity generation business, see “Item 5. Operating and Financial Review and Prospects—A. Operating Results—1. Discussion of Main Factors Affecting Operating Results and Financial Condition of the Company.”
We expect reasonably good operating performance during the coming years given the favorable macroeconomic perspective in Colombia and Peru, which represented 41.1% and 17.9%, respectively, of our operating income. The expected growth in gross domestic product in 2016 of Argentina, Brazil, Colombia and Peru are -0.7%, -3.5%, 2.5% and 3.4%, respectively. These percentages are based on Latin American Consensus Forecasts published by Consensus Economic Inc. on March 14, 2016. The annual electricity demand growth in 2016 of Argentina, Brazil, Colombia and Peru are expected to be 2.3%, 0.3%, 3.2% and 4.9%, respectively.
141
On the other hand, development of new generation facilities in South America has always lagged behind demand growth. We anticipate that this tendency will continue for the foreseeable future. Also, due to growing environmental restrictions, transmission line saturation, obstacles for fuel transportation, and scarcity of places where to locate plants; these new projects involve higher development costs than in the past.
Enel, our ultimate controller, has announced that it will no longer build coal power plants because it considers the technology to be obsolete, and the company expects to have no CO2emissions by 2050. Closure of these coal power plants are scheduled between now and 2040 or 2045. Their capacity must be substituted by other types of generation. Natural gas power plants are not an option because of the CO2 costs and current carbon capture and storage technology are not economically viable and therefore, the focus will be on NCRE energy.
We expect that average electricity prices will rise to recognize these higher costs. This could increase the value of our assets, especially in the case of hydroelectric power plants, which have lower production costs, and thus have greater profitability in scenarios of increasing prices to end customers. Furthermore, an important part of the new installed capacity under development in which we have investments corresponds to hydroelectric power plants. We expect this situation will also impact long term spot prices positively. Long-term contracts awarded to us in different bids, directly and through our subsidiaries, have already incorporated these expected price levels. Currently, 15.7% of our expected annual generation is sold under contracts with terms of at least ten years and an additional 30.7% under contracts with terms of at least five years.
In order to mitigate the risk of increasing fuel costs, we have entered into supply contracts to cover part of the fuel needed to operate the thermal generation units, which operate with coal, natural gas, diesel, and fuel oil. This is becoming more important as there is an increasing trend to penalize fuel intensive technologies, such as coal and diesel, which have greater environmental impacts.
With respect to our distribution business, our operating income for the year ended December 31, 2015 decreased by 4.8% as compared to the same period of 2014. In connection with the distribution segment tariffs, we anticipate that our distribution companies will maintain their profitability during the period between periodic tariff setting processes, according to price cap tariff model, due to growth and economies of scale. After tariffs have been set, the companies have the opportunity to increase their efficiency, and obtain extra profits associated with such efficiencies, during the period subsequent to each new tariff setting.
The schedule for distribution tariff revisions is well defined for the following years:
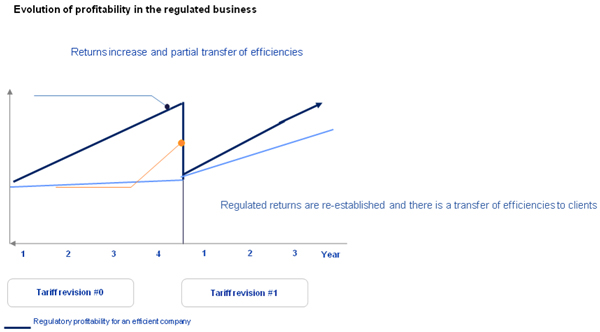
Although the price at which a distribution company purchases electricity has an impact on the price at which it is sold to end customers, it does not have an impact on our profitability since the cost of electricity purchased is passed to end customers through tariffs. Regulation dictates that purchase contracts must be made through long-term contracts and are the result of a regulated tender.
Although having operations in the four countries allows us to somewhat offset and counterbalance variations with respect to the main factors that can affect our operating results, we cannot claim that our portfolio of assets is fully hedged. Furthermore, there can
142
be no assurance that past performance will be indicative of future performance with respect to our business. Any significant change with respect to hydrological conditions, fuel or electricity prices, among other factors, could affect our operating income in the generation business. More broadly, any significant change with respect to economic or population growth, as well as changes in the regulatory regimes in the countries in which we operate, among other factors, could affect our operating income.
For further information regarding our 2015 results compared with those recorded in previous periods, please see “— A. Operating Results — Results of Operations for the years ended December 31, 2015 and 2014” and “— A. Operating Results — Results of Operations for the Years Ended December 31, 2014 and 2013.” Investors should not look at our past performance as indicative of future performance.
We do not expect that our current debt agreements, which impose certain restrictions, would have a negative impact on our capital expenditure plan and we have many sources of proven liquidity in the international and domestic capital markets. As of December 31, 2015, we are able to incur up to Ch$ 2,979 billion in incremental debt, without entering into a breach of the debt covenants, beyond current levels of consolidated indebtedness. We believe that we will continue to have similar comfortable levels of leverage capacity for the foreseeable future (see “Item 5. Operating and Financial Review and Prospects — B. Liquidity and Capital Resources”).
We expect that we will continue generating substantial operating cash, which can be used to finance a significant part of our capital expenditure plan. If needed, our shareholders can also decrease the dividend payout ratio, subject to certain minimum legal restrictions, in order to finance our investment plan and future growth.
| E. | Off-balance Sheet Arrangements. |
We are not a party to any off-balance sheet arrangements.
| F. | Tabular Disclosure of Contractual Obligations. |
The table below sets forth the Company’s cash payment obligations as of December 31, 2015:
| | | | | | | | | | | | | | | | | | | | |
| | | Payments due by Period | |
Ch$ billion | | Total | | | 2016 | | | 2017-2018 | | | 2019-2020 | | | After 2020 | |
Bank debt | | | 399 | | | | 164 | | | | 158 | | | | 49 | | | | 28 | |
Local bonds(1) | | | 1,374 | | | | 136 | | | | 440 | | | | 270 | | | | 528 | |
Yankee bonds(1) | | | 409 | | | | 243 | | | | 0 | | | | 0 | | | | 167 | |
Other debt(2) | | | 237 | | | | 71 | | | | 81 | | | | 47 | | | | 38 | |
Interest expense(3) | | | 856 | | | | 216 | | | | 275 | | | | 159 | | | | 207 | |
Pension and post-retirement obligations(4) | | | 3 | | | | 0 | | | | 0 | | | | 0 | | | | 2 | |
Purchase obligations(5) | | | 26,585 | | | | 1,667 | | | | 2,719 | | | | 2,589 | | | | 19,610 | |
Financial leases | | | 88 | | | | 23 | | | | 36 | | | | 9 | | | | 20 | |
| | | | | | | | | | | | | | | | | | | | |
Total contractual obligations | | | 29,951 | | | | 2,520 | | | | 3,709 | | | | 3,123 | | | | 20,600 | |
| | | | | | | | | | | | | | | | | | | | |
| (1) | Net value, hedging instruments included substantially modify the principal amount of debt. |
| (2) | Other debt includes governmental loan facilities, supplier credits and short-term commercial paper among others. |
| (3) | Interest expenses are the interest payments for all outstanding financial obligations, calculated as principal multiplied by the interest rate, presented according to when the interest payment comes due. |
| (4) | We have funded and unfunded pension and post-retirement benefit plans. Our funded plans have contractual annual commitments for contributions, which do not change based on funding status. Cash flow estimates in the table are based on such annual contractual commitments including certain estimable variable factors such as interest. Cash flow estimates in the table relating to our unfunded plans are based on future discounted payments necessary to meet all of our pension and post-retirement obligations. |
| (5) | Includes generation and distribution business purchase obligations which are comprised mainly of energy purchases, operating and maintenance contracts, and other services. Of the total contractual obligations of Ch$ 26,585 billion, 92% corresponds to energy purchased for distribution, 6% corresponds primarily to fuel supply, maintenance of medium and low voltage lines, supplies of cable and utility poles, and energy purchased for generation. The remaining 2% corresponds to miscellaneous services, such as LNG regasification, fuel transport and coal handling. |
143
The information contained in the Items 5.E and 5.F contains statements that may constitute forward-looking statements. See “Forward-Looking Statements” in the “Introduction” of this Report, for safe harbor provisions.
| Item 6. | Directors, Senior Management and Employees |
| A. | Directors and Senior Management. |
Our Board of Directors consists of seven members who are elected for a three-year term at an Ordinary Shareholders’ Meeting (“OSM”). If a vacancy occurs in the interim, the Board of Directors elects a temporary director to fill the vacancy until the next OSM, at which time the entire Board of Directors will be elected. Our Executive Officers are appointed and hold office at the discretion of the Board of Directors.
The business address of our directors is c/o Enersis Américas S.A., Santa Rosa 76, Santiago, Chile.
| | | | |
Directors | | Position | | Current Position
Held Since |
Borja Acha B. | | Chairman | | 2015 |
Francesco Starace | | Vice Chairman | | 2015 |
Herman Chadwick P. | | Director | | 2015 |
Alberto De Paoli. | | Director | | 2014 |
Francesca Di Carlo | | Director | | 2015 |
Rafael Fernández M. | | Director | | 2013 |
Hernán Somerville S. | | Director | | 2013 |
At the OSM held on April 28, 2016, our new Board of Directors was elected for a term of three years starting from the date of the meeting. At the Board of Directors meeting held on April 29, 2016, the directors agreed to appoint Mr. Domingo Cruzat A., Mr. Patricio Gómez S. and Mr. Hernán Somerville S. as members of the Directors’ Committee. Additionally, Mr. Somerville was appointed as Financial Expert of the Directors’ Committee.
The members of our new Board of Directors are as follows:
| | • | | Mr. Francisco de Borja Acha B. (Chairman) |
| | • | | Mr. José Antonio Vargas L. (Vice Chairman) |
| | • | | Mr. Hernán Somerville S. |
Set forth below are brief biographical descriptions of our directors, of whom three reside in Chile and the rest in Europe, as of December 31, 2015.
Borja Acha B.
Chairman of the Board of Directors
Mr. Acha has been the Director of Legal Affairs and Corporate Matters of Enel S.p.A (“Enel”) since February 2012 and is currently the Chairman of our Board of Directors and a member of the Board of Directors ofEnel Iberoamérica, S.R.L.,Enel Latinoamérica S.A., and Secretary and General Counsel ofEndesa, S.A. in Spain. Prior to joining theEnel group, he served as a professor of commercial law atUniversidad Carlos III de Madrid, as State Attorney for the State Legal Service before the High Court of Madrid, Chief State Attorney of the Regional Legal Service of Madrid of the Spanish Revenue Service, Secretary of the Board of Directors and Director of the Legal Department of the State Industrial Agency, an organization controlled by the Spanish government with the aim of implementing government guidelines on restructuring and industrial restructuring, special schemes and partial derogations from community rules on competition, and Director of the Legal Department ofSociedad Estatal de Participaciones Industriales, an organization controlled by the Spanish government with the aim of promoting privatizations of state-owned public investments. Mr. Acha holds a degree in law fromUniversidad Complutense de Madrid (Madrid, Spain).
144
Francesco Starace
Vice Chairman of the Board of Directors
Mr. Starace has been the Chief Executive Officer ofEnel since May 2014. He served as the Chief Executive Officer (“CEO”) ofEnel Green Power S.A., a subsidiary ofEneldedicated to the generation of energy from renewable sources (“Enel Green Power”), from October 2008 to May 2014. Mr. Starace joinedEnel in 2000 and has held several senior managerial positions in the company, including Director of the Business Power Division (from July 2002 to October 2005) and Director of the Market Division (from November 2005 to September 2008). In November 2010, Mr. Starace led the Initial Public Offering ofEnel Green Power in the Madrid and Milan stock exchanges, with a market capitalization of approximately € 8 billion. Additionally, Mr. Starace has consolidated his professional experience at an international level, working in countries such as the United States, Saudi Arabia, Egypt and Bulgaria. Prior to joiningEnel, he started his career in the construction of electricity generation power plants, initially forGeneral Electric, then forABB Group and subsequently forAlstom Power Corporation, where he was appointed Head of global sales of the gas turbines division. In May 2015, he was named a member of the Board of Directors of United Nations Global Compact, a worldwide corporate sustainability initiative. In addition, he has served as a member of the Advisory Board of the“Sustainable Energy 4 All,”an initiative of the United Nations since June 2014. Mr. Starace holds a degree in nuclear engineering from Politecnico di Milano (Milan, Italy).
Herman Chadwick P.
Director and Member of the Directors’ Committee
Mr. Chadwick was elected a Director of our Company in June 2015. He is currently Chairman of the Chile-Spain Business Committee (as part of theSociedad de Fomento Fabril, a non-profit trade association representing the views and interests of Chilean businessmen), Vice Chairman of theIntervial Chile S.A., a Chilean operator of interurban road concessions, Vice Chairman of theRuta del Maipo Sociedad Concesionaria S.A., Vice Chairman of theRuta del MauleSociedad Concesionaria S.A., Vice Chairman of theBosque Sociedad Concesionaria S.A.,Vice Chairman of theRuta de la Araucanía Sociedad Concesionaria S.A.,Vice Chairman of theRuta de los RíosSociedad Concesionaria S.A. Mr. Chadwick also serves as Elective Counselor of theSociedad de Fomento Fabril (“SOFOFA”), director ofViña Santa Carolina S.A., a Chilean winery, director of the Center for Arbitration and Mediation of the Chamber of Commerce of Santiago, director of theInversiones Aguas Metropolitanas S.A., a company that through its subsidiaries, delivers raw water capture, production, transport and distribution of drinking water, collection, treatment and disposal of sewage, director of Aguas Andinas, a utility company. Mr. Chadwick is also member of the Board of Directors of the Academic Advisory Council of Military Studies and Research (CACEIM), Chairman ofEl Golf 50 Club, a private club and Chairman of the Corporation for the Development of Zapallar, a Chilean municipality. He served for thirteen years as Director, Vice Chairman and Chairman of the Chilean National Television Council, until April 2014. Mr. Chadwick holds a degree in law from thePontificia Universidad Católica de Chile (Santiago, Chile) and he is the main partner ofChadwick y Cía, a Chilean law firm.
Alberto De Paoli
Director
Mr. De Paoli has served as both the Chief Financial Officer (“CFO”) ofEnel and as a director of our Company, since November 2014. He was the CFO ofEnel Green Power from April 2008 to April 2012, where he led the start-up and public listing of the company. Mr. De Paoli served as the Head of Group Strategy of Enel from May 2012 to November 2014. Between 1993 and 2008, he worked in the telecommunications sector, first atTelecom Italia, thenWind Telecomunicazioni and finally atTiscali, where his roles included Manager of Planning and Control, CFO, Head of Strategy, M&A and Business Development. Mr. De Paoli holds a degree in economics fromUniversità di Roma “La Sapienza” (Rome, Italy).
Francesca Di Carlo
Director
Ms. Francesca Di Carlo has served as the Head of Human Resources and Organization ofEnel since July 2014. Ms. Di Carlo joinedEnel in September 2006 as Head of the Corporate Strategy, before becoming Audit Director of the Group Audit department from January 2008 to July 2014. Her professional career began at theSG Warburg Group (NowUBS Warburg) in 1987, a financial services company, where she specialized in corporate finance operations at both Italian and international businesses. Prior to joining theEnel group, she served as Head of Investor Relations, Head of Financial Planning and Head of Corporate Development and Mergers & Acquisitions inTelecom Italia Group, a telecommunication company. She led several projects at theTelecom Italia Group, among them the completion of the group’s international portfolio divestment program, the demerger and sale ofSeat-PG, a company specializing in directories, directory assistance and business information, through a Leveraged Buyouts, andTelecom Italia’s European broadband activity. As the Chairman of Stream, she was responsible for completing the merger withTele+, becoming a Director ofSky Italy as a representative ofTelecom Italia. She also served as Chairman ofTelespazio, a provision of satellite technology and geoinformation applications, where she led the company’ sale to theFinmeccanica Group. In 2001, she won the M. Bellisario award, for Women and Finance. Ms. Di Carlo holds a degree in Economics fromUniversità di Roma “La Sapienza” (Rome, Italy).
145
Rafael Fernández M.
Director and Member of the Directors’ Committee
Mr. Fernández was elected a Director of our Company in April 2010. From 1997 to 2006, Mr. Fernández served as Chairman of the Board and Director of various Argentine electricity companies in generation, transmission, distribution, and trading, as well as in natural gas production and transport companies. Before that, he was CEO of several power generation companies. He also founded and was a member of the Academic Committee in the Masters Program in Electricity Business atITBA, an Argentine university, until 2006, and from 2006 until 2010, was a member of the Advisory Committee of the Development Department ofUniversidad Alberto Hurtado, a Chilean university. Between 2002 and 2006, he was the Executive Director of the Gas and Energy Business Division and member of the Board of Directors ofPetrobras Energía, a Brazilian state-owned oil and gas company, in Argentina. Between 2006 and January 2010, he served as CEO and Director ofPetrobras Chile Petrolera Ltda. Since October 2011, he has been a member of the Board of Directors ofAustralis Seafood S.A., a Chilean salmon company, and Chairman ofAustralis Seafood’s Director’s Committee. From June 2010 to December 2013, he was CEO ofCorporación de Capacitación y Empleo, a subsidiary of SOFOFA. Mr. Fernández received a degree in civil industrial engineering fromPontificia Universidad Católica de Chile (Santiago, Chile). He also engaged in graduate studies atE.S.A.E. in the same university in 1988-1989, and the Advanced Management Program at Duke University (North Carolina, USA) in 2004.
Hernán Somerville S.
Director, Chairman and Financial Expert of the Directors’ Committee
Mr. Somerville has been a Director since 1999 and the Committee’s Financial Expert since April 2013. From 1983 to 1988, he was Director of the Central Bank of Chile, serving as Chief Debt Negotiator for Chilean public and private commercial bank debt. Mr. Somerville was the Chairman of CPC, the Chilean Confederation of Production & Commerce. Since 1989, he has been the Managing Director and Partner ofFintec, a Chilean investment, advisory and management company. He was the Chairman of the Chilean Association of Banks and Financial Institutions, and also was Chairman of the Latin American Federation of Banks. He was the former Chairman ofTransbank S.A., which manages credit and debit cards in Chile. He was also a Board Member ofINACAP, a Chilean vocational school, and the former Chairman of the Chilean Pacific Foundation, a Chilean foundation with links to Pacific Ocean countries. Mr. Somerville earned a law degree fromUniversidad de Chile (Santiago, Chile) and studied Comparative Law at New York University Law School (New York, USA).
Executive Officers
Set forth below are our Executive Officers as of December 31, 2015, except as otherwise noted below.
The business address of our Executive Officers is c/o Enersis Américas S.A., Santa Rosa 76, Santiago, Chile.
| | | | |
Executive Officers | | Position | | Current Position Held Since |
| Luca D’Agnese | | Chief Executive Officer | | 2015 |
| Daniel Fernández K. | | Deputy Chief Executive Officer | | 2014 |
| Antonio Barreda T. | | Procurement Officer | | 2015 |
| Marco Fadda | | Planning and Control officer | | 2013 |
| Javier Galán A. | | Chief Financial Officer | | 2014 |
| Francesco Giorgianni | | Institutional Affairs Officer | | 2014 |
| José Miranda M. | | Communications Officer | | 2014 |
| Alain Rosolino | | Internal Audit Officer | | 2012 |
| Domingo Valdés P. | | General Counsel | | 1999 |
| Paola Visintini V. | | Human Resources Officer | | 2014 |
Set forth below are brief biographical descriptions of our Executive Officers, all of whom reside in Chile.
Luca D’Agnesewas appointed our CEO in January 2015. He started his career at Hewlett-Packard, an information technology firm. In 1988, worked forMcKinsey & Company, a management consulting company, where he became partner. From 2003 to 2005, Mr. D’Agnese was the CEO of the Italian company,Gestore della Rete di Transmissione Nazionale (GRTN), which later merged with Terna, an Italian electricity transmission grid operator. In Terna, he was Operations Director and was in charge of planning and implementation of investments, as well as network operations and maintenance. Between 2007 and 2010, he was the CEO ofErgycapital, an Italian investment company listed on the Milan Stock Exchange specializing in renewable energy. Mr. D’Agnese joined Enel in 2011 as Romanian country manager. In 2014, he became Director of the Eastern European Division, as well as
146
Chairman of the Board of Directors and CEO ofSlovenské Elektrárne, an Enel subsidiary in the Slovak Republic. Mr. D’Agnese holds a degree in physics fromScuola Normale Superiore di Pisa (Pisa, Italy) and holds an M.B.A. from the INSEAD business school (Fontainebleau, France).
Daniel Fernández K.was appointed the Deputy Chief Executive Officer and Country Manager for Chile in November 2014. He was previously Vice Chairman ofHidroAysén, a hydrological power plant project. Mr. Fernández has vast experience in the oil & gas sectors, urban infrastructure, concessions, ports, drinking water, housing, mining logistics, media, energy and public policy in public and private companies. Mr. Fernández was Chairman of the Board of Directors ofMetro S.A., the Santiago subway system, Ferronor S.A., a Chilean railway transport company, and Chairman of the Latin-Iberoamerican Association of Subway and Underground (ALAMYS, in its Spanish acronym). He was member of the Board of Directors ofEsval, a Chilean water utility,EFE, a state-owned Chilean railway company and of theCorporación para la Promoción del Financiamiento de la Vivienda, a corporation which promotes housing finance. He was CEO ofENAP, a Chilean state-owned petroleum company and of theComplejo Portuario Mejillones S.A., aCodelco subsidiary created to promote port development in the Bay of Mejillones, Chile. Mr. Fernández was advisor to the Minister of Transportation and Telecommunications in Urban Transportation Planning and was Executive Secretary of the Investment Planning Commission in Transportation Infrastructure (SECTRA). Additionally, Mr. Fernández taught Transportation Planning and Traffic Management Models atUniversidad de Chile’s Transportation Engineering Program and, recently, has been professor of Social Environments Complexity in the M.B.A. program ofUniversidad Adolfo Ibañez (Santiago, Chile). Mr. Fernández holds a degree in civil engineering fromUniversidad de Chile (Santiago, Chile). He is certified in Spiral Dynamics (an analysis and cultural change tool) by the National Values Center of California (California, USA).
Antonio BarredaT. has served as our Procurement Officer since January 2015. Between 2008 and 2014, he served as deputy director of Works and Services Latam. Between 2001 and 2008, he served in our Company as deputy director of both Business Relations Providers and of Corporate Service Purchases. Between 2000 and 2001, Mr. Barreda served as Contracts Manager forCAM, our former subsidiary. Mr. Barreda holds a degree in electrical engineering fromUniversidad de Santiago(Santiago, Chile) and an M.B.A. fromPontificia Universidad Católica de Chile (Santiago, Chile).
Marco Fadda was appointed our Planning and Control Officer in April 2013. In 1998, he joined Enel, and in 1999 he was promoted to head of Management Control at Enel Trade S.p.A. in the Administration, Finance and Control Department, where he assumed his position for four years. He later joined the Department of Planning and Control of Generation & Energy Management (GEM Division), and in 2009 was promoted to Manager of Planning and Control of the GEM Division. He has been a member and team coordinator on significant international projects. Mr. Fadda holds a degree in economics from the Università degli Studi di Genova (Genoa, Italy) and received a masters in network business administration at the Polytecnico di Milano (Milan, Italy).
Javier Galán A. was appointed our CFO in December 2014. He joined Endesa Spain in 1992 as International Operations Officer. In 1993, he became CFO ofEndesa Desarrollo, a subsidiary ofEndesa Spain, where he initiated the international expansion ofEndesa Spain’s operations, mainly in Latin America. Since then, he has held various managerial positions within the group with responsibilities in Finance, Management Control, Strategy, and M&A, as well as serving on several Boards of Directors. In 2006, he was appointedEndesa Spain’s CFO and in 2013 CFO of anEnel division in Italy. Prior to joining Endesa Spain, Mr. Galán worked at the Chase Manhattan Bank, N.A., in London, as the Vice Chairman of Corporate Finance and in Madrid as Senior Analyst in the Corporate Finance and Treasury Program, as Treasurer ofRed Eléctrica de España S.A., the operator of the Spanish electricity system. Mr. Galán holds an economics degree fromUniversidad Complutense de Madrid (Madrid, Spain) and an M.B.A. from theInstituto de Empresas de Madrid (Madrid, Spain), and a graduate degree in Senior Management from the IESE Business School (Madrid, Spain).
Francesco Giorgianni was appointed our Institutional Affairs Officer and Shareholder’s Management Officer in November 2014. Mr. Giorgianni is a lawyer specialized in public policy, regulatory and antitrust. Since 2000, he has worked in the management of Institutional Affairs of theEnel Group, where he successively served as director of Regulatory and Antitrust Policies (until 2004), director of European and Italian Institutional Affairs in official representation ofEnel in Brussels (until 2007), director of European and Italian Institutional Affairs based in Rome and Brussels (until June 2011) and since July 2011, he served as Director General ofEnel’s Institutional Affairs, worldwide. Prior to joiningEnel Group, Mr. Giorgianni worked in the privatization team of the Italian Ministry of the Treasury advising the Italian Government on the liberalisation of energy, water and telecommunications markets, and preparing the IPO ofENI S.p.A., an energy company,Enel,Telecom Italia andBNL BNP Paribas, a bank. He was also member of the Board of Directors ofST Microelectronics, a semiconductor company, ofSviluppo Nucleare Italia, a nuclear energy company, and he served as CEO ofEnel Gas Storage. Mr. Giorgianni holds a degree in law fromUniversità di Roma “La Sapienza” (Rome, Italy), with a Masters in Public Administration from theScuola Nazionale dell’Ammninistrazione (Rome, Italy), and graduate degrees from the London Business School (London, England) and Harvard University (Massachusetts, USA).
José Miranda M. was appointed our Communications Officer in December 2014. Mr. Miranda worked 11 years inTelevisión Nacional de Chile (TVN), a Chilean TV channel, as producer of many shows and covering events such as presidential elections in Peru, Venezuela and the rescue of 33 underground miners in Chile. From 2008 to 2010, he worked as General Producer of the
147
Chilean news channel “Canal 24 Horas de Noticias,” another TVN channel. In 2011, Mr. Miranda joined TVN again, as General Producer of the Entertainment Area and later as Executive Producer of Children’s Content and Executive Producer of Purchasing International and National Contents. Mr. Miranda is an Audiovisual Communicator with a degree fromDUOC UC (Santiago, Chile), holds a graduate degree in Management Skills fromUniversidad de Chile (Santiago, Chile) and he participated in the program “Corporate Entrepreneur and Open Innovation” from Berkeley University-Fundación Chile.
Alain Rosolino was appointed our Internal Audit Officer in December 2012. He joined Enel in 2003, having held several positions in the audit area atEnel,Enel Romania,Enel Green Power,Enel Latin America, and from 2011 to 2012, atEnel EGP IBAL (Iberian Peninsula and Latin America). Mr. Rosolino holds a Business Administration Degree fromLibera Università Internazionale degli Studi Sociali Guido Carli (Rome, Italy).
Domingo Valdés P. was appointed our General Counsel in May 1999. Mr. Valdés is also currently in charge of Legal Counsel and Corporate Governance Department of our Company. He joinedChilectra in 1993 and our Company in 1997. Mr. Valdés worked as an intern at the New York City law firms of Milbank, Tweed, Hadley & McCloy LLP and Chadbourne & Parke LLP. Before joiningChilectra, Mr. Valdés was a lawyer at Chase Manhattan Bank, N.A., Corporate Department (Chile) and an associate at Carey & Cía., a Santiago based law firm. Mr. Valdés is also Secretary of our Board of Directors and a Professor of Economic and Antitrust Law atUniversidad de Chile. Mr. Valdés holds a law degree fromUniversidad de Chile (Santiago, Chile), a Master of Law Degree from University of Chicago (Illinois, USA) and he attended a Management Program for Lawyers at the Yale University School of Management (Connecticut, USA).
Paola Visintini V. was appointed our Human Resources Officer in December 2014. She joinedChilectra in 2005 as Commercial Development Assistant Officer. After six years, she became our Communications Officer. In 2013, she was appointed Head of the Communications Agency of the Latin American Division of our Company. Prior to joining our Company, Ms. Visintini worked as the Advertising and Market Research Assistant Manager inBellsouth Chile S.A., a telecommunications company, as the Head of the IT Department atBanco Santander, as Studies Director at Search Marketing S.A. and as a clinical psychologist in theConsultorio El Roble CIDECO. Ms. Visintini holds a degree in psychology fromUniversidad de Chile (Santiago, Chile) with graduate studies in leadership and coaching, and trained as an Ontological Coach byNewfield(Santiago, Chile).
B. Compensation.
At the OSM held on April 28, 2015, our shareholders approved the current compensation policy for our Board of Directors. Directors are paid an annual variable fee equivalent to 0.1% of our net earnings for the current year based on the consolidated financial statements. Directors are also paid a monthly fee, in advance, depending on their attendance at Board meetings and their participation as Director of any of our subsidiaries. Director compensation consists of a monthly fixed compensation of UF 180 per month and an additional fee of UF 66 per meeting, depending on attendance to Board meetings. The monthly fixed fees are considered as advances on the annual variable fee and creditable against that amount. Once our net earnings are approved at the OSM of the following year, the difference between the accrued annual variable fee and the total fees paid in advance will be paid to directors, but only if the resulting amount is positive. The Chairman of the Board is entitled to double the compensation compared to other directors under this policy, while the Vice Chairman receives fixed compensation higher than the directors but lower than the Chairman. The members of our Directors’ Committee are paid a variable annual fee, equivalent to a percentage of our net earnings of the current year. If a Director serves on one or more Boards of Directors of the subsidiaries and/or related companies or serves as director of other companies or corporations in which the economic group holds an interest directly or indirectly the Director can only receive compensation in one of these Boards of Directors. Executive Officers of our Company and/or of our subsidiaries or related companies will not receive compensation in the case that they serve as Director of any subsidiary, related company or are affiliated in any way to our Company.
148
In 2015, the total compensation paid to each of our directors, including fees for attending Directors’ Committee meetings was as follows:
| | | | | | | | | | | | | | | | |
| | | Year ended December 31, 2015 | |
Director | | Fixed
Compensation | | | Variable
Compensation(1) | | | Directors’
Committee | | | Total | |
| | | (in Ch$) | | | | |
Borja Acha B.(2) | | | — | | | | — | | | | — | | | | — | |
Francesco Starace(2) | | | — | | | | — | | | | — | | | | — | |
Alberto De Paoli(2) | | | — | | | | — | | | | — | | | | — | |
Francesca Di Carlo(2) | | | — | | | | — | | | | — | | | | — | |
Herman Chadwick P. | | | 53,679,424 | | | | — | | | | 21,427,898 | | | | 75,107,322 | |
Rafael Fernández M. | | | 85,192,935 | | | | 17,741,473 | | | | 31,282,727 | | | | 134,217,135 | |
Hernán Somerville S. | | | 83,502,990 | | | | 17,741,473 | | | | 31,282,728 | | | | 132,527,191 | |
Jorge Rosenblut(3) | | | 73,824,836 | | | | 4,036,727 | | | | — | | | | 77,861,563 | |
Pablo Yrarrázaval V.(4) | | | — | | | | 20,183,636 | | | | — | | | | 20,183,636 | |
Borja Prado E.(5) | | | 27,126,927 | | | | 18,165,273 | | | | — | | | | 45,292,200 | |
Andrea Brentan(5) | | | 19,715,829 | | | | 3,027,545 | | | | — | | | | 22,743,374 | |
Leonidas Vial E.(4) | | | — | | | | 14,784,561 | | | | — | | | | 14,784,561 | |
Carolina Schmidt Z.(6) | | | 31,513,511 | | | | 7,806,228 | | | | 2,956,913 | | | | 42,276,652 | |
| | | | | | | | | | | | | | | | |
Total | | | 374,556,452 | | | | 103,486,916 | | | | 86,950,266 | | | | 564,993,634 | |
| | | | | | | | | | | | | | | | |
| (1) | Includes the monthly variable fee paid in advance and any positive balance against the annual variable fee. |
| (2) | Mr. Acha, Mr. Starace, Mr. De Paoli and Ms. Di Carlo waived their compensation for their position as director. |
| (3) | Mr. Rosenblut ceased to be a director in July 2015. |
| (4) | Messrs. Vial and Yrarrázaval ceased to be directors in October 2014. |
| (5) | Messrs. Prado and Brentan ceased to be a directors on April 28, 2015. |
| (6) | Ms. Schmidt ceased to be a director in June 2015. |
We do not disclose, to our shareholders or otherwise, any information about an individual Executive Officer’s compensation. For the year ended December 31, 2015, the aggregate gross compensation, paid or accrued, for all our Executive Officers, attributable to fiscal year 2015, was Ch$ 3,308 million in fixed compensation and Ch$ 275 million in variable compensation. Executive Officers are eligible for variable compensation under a bonus plan. The annual bonus plan is paid to our Executive Officers for achieving company-wide objectives and for their individual contribution to our results and objectives. The annual bonus plan provides for a range of bonus amounts according to seniority level and consists of a certain multiple of gross monthly salaries.
We entered into severance indemnity agreements with all of our Executive Officers, pursuant to which we will pay a severance indemnity in the event of voluntary resignation or termination by mutual agreement among the parties. The severance indemnity does not apply if the termination is due to willful misconduct, prohibited negotiations, unjustified absences or abandonment of duties, among other causes, as defined in Article 160 of the Chilean Labor Code. All of our employees are entitled to legal severance pay if terminated due to our needs, as defined in Article 161 of the Chilean Labor Code.
The amounts accrued in 2015 to provide severance indemnity to our Executive Officers totaled Ch$ 607,97 million, of which Ch$ 199.46 million was accrued during 2015. There are no other amounts set aside or accrued to provide for pension, retirement or similar benefits for our Executive Officers.
Our Board of Directors in office as of December 31, 2015 was elected at the OSM held on April 28, 2015, for a three-year term which ends in April 2018. However, given that several members of the elected Board of Directors resigned from their positions during 2015, our Board, exercising the power under article 32 of the Companies Act, replaced the directors at the 2016 OSM held in April, at which a new Board of Directors was elected for a new three-year term. For information about each of the directors and the year that they began their service on the Board of Directors, see “— A. Directors and Senior Management” above. Members of the Board of Directors do not have service contracts with us or with any of our subsidiaries that provide them benefits upon termination of their service.
149
Corporate Governance
We are managed by a Board of Directors, which, in accordance with our by-laws, consists of seven directors who are elected by our shareholders at an OSM. Each director serves for a three-year term. Following the end of their term, they may be re-elected or replaced. Directors can be re-elected indefinitely. Staggered terms are not permitted under Chilean law. If a vacancy occurs on the Board of Directors during the three-year term, the Board of Directors may appoint a temporary director to fill the vacancy. Any vacancy triggers an election for every seat on the Board of Directors at the next OSM.
Chilean corporate law provides that a company’s Board of Directors is responsible for the management and representation of a company in all matters concerning its corporate purpose, subject to the provisions of the company’s by-laws and the stockholders’ resolutions. In addition to the by-laws, our Board of Directors has adopted regulations and policies that guide our corporate governance principles.
Our corporate governance policies are included in the following policies or procedures: the Charter Governing Executives, The Employee Code of Conduct, the Manual for the Management of Information of Interest to the Market” (the “Manual”), the Human Rights Policy (Política de Derechos Humanos), the Code of Ethics and a Zero Tolerance Anti-Corruption Plan (“ZTAC Plan”), the Penal Risk Prevention Model, the “Guidelines 231: Guidelines applicable to non-Italian subsidiaries in accordance with Legislative Decree No. 231 of June 8, 2001” and procedures issued in compliance with General Regulation No. 385 issued by the SVS.
The Charter Governing Executives, approved by our Board on May 28, 2003, and the Employee Code of Conduct, explain our principles and ethical values, establish the rules governing our contact with customers and suppliers, and establish the principles that should be followed by employees, including ethical conduct, professionalism and confidentiality. They also impose limitations on the activities that our executives and other employees may undertake outside the scope of their employment with us.
In order to ensure compliance with Securities Market Law No. 18,045 and SVS regulations, our Board of Directors, at its meeting held on May 28, 2008, approved the “Manual for the Management of Information of Interest to the Market” (the “Manual”). This document addresses applicable standards regarding the information in connection with transactions of our securities and those of our affiliates, entered into by directors, management, principal executives, employees and other related parties, the existence of blackout periods for such transactions undertaken by directors, principal executives and other related parties, the existence of mechanisms for the continuous disclosure of information that is of interest to the market and mechanisms that provide protection for confidential information. The Manual was released to the market in 2008, and is posted on our website at www.enersis.cl. In 2010, the Manual was modified in order to comply with the provisions of Law No. 20,382 (Corporate Governance Improvement Law). The provisions of this Manual apply to the members of our Board, as well as our executives and employees who have access to confidential information, and especially those who work in areas related to the securities markets.
Our Board of Directors approved a procedure for relationship between People Politically Exposed (Procedimiento Personas Expuestas y Conexas) and our Company, which established a specific regulation for their commercial and contractual relationships.
The Human Rights Policy incorporates and adapts the United Nations’ general principles related to human rights into the corporate reality.
In order to supplement the aforementioned corporate governance regulations, at its meeting held on June 24, 2010, our Board of Directors approved a Code of Ethics and a Zero Tolerance Anti-Corruption Plan (“ZTAC Plan”). The Code of Ethics is based on general principles such as impartiality, honesty, integrity and other ethical standards of similar importance, all of which are expected from our employees. The ZTAC Plan reinforces the principles included in the Code of Ethics, but with special emphasis on avoiding corruption in the form of bribes, preferential treatment, and other similar matters.
At its meeting held on March 29, 2011, our Board approved the Penal Risk Prevention Model required by Law No. 20,393 of December 2, 2009, which imposes criminal responsibility on legal entities for the crimes of asset laundering, financing of terrorism and bribing of public officials. The law encourages companies to adopt this model, whose implementation involves compliance with managerial and supervision duties. The adoption of the Penal Risk Prevention Model mitigates, and in some cases relieves, the effects of criminal responsibility even when a crime is committed. One of the elements of this model is the Penal Risk Prevention Officer, who was appointed by the Board at its meeting held on October 27, 2010. As of December 31, 2015, our Penal Risk Prevention Officer was Mr. Alain Rosolino, our Internal Audit Officer.
On October 27, 2010, our Board of Directors approved the “Guidelines 231: Guidelines applicable to non-Italian subsidiaries in accordance with Legislative Decree No. 231 of June 8, 2001.” (“Guidelines 231”) The Guidelines 231 is defined by Italian Legislative Decree No. 231, which was enacted on June 8, 2001. It establishes a compliance program that identifies the behaviors expected of related parties for the non-Italian subsidiaries of Enel. Given that our ultimate parent company, Enel, has to comply with Italian Legislative Decree No. 231, which establishes management responsibility for Italian companies as a consequence of certain crimes committed in Italy or abroad, in the name of or for the benefit of such entities, including those crimes described in Chilean Law No. 20,393, these guidelines set a group of measures, with standards of behavior expected from all employees, advisers, auditors, officials, directors as well as consultants, contractors, commercial partners, agents and suppliers. Legislative Decree No. 231 includes various activities of a preventive nature that are coherent with and integral to the requirements and compliance with Chilean Law No. 20,393, which deals with the criminal responsibility of legal entities. These guidelines are supplementary to the standards included in the Code of Ethics and the ZTAC Plan.
150
On November 29, 2012, the SVS issued General Regulation No. 341 which established regulations for the disclosure of information with respect to the standards of corporate governance compliance adopted by publicly held limited liability corporations and set the procedures, mechanisms and policies that are indicated in the Appendix to the regulation. The objective of this regulation is to provide credible information to investors with respect to good corporate governance policies and practices adopted by publicly held limited liability corporations, which include us, and permit entities like stock exchanges to produce their own analyses to help the various market participants to understand and evaluate the commitment of companies. General Regulation No. 341 was substituted by General Regulation No. 385, issued by the SVS on June 8, 2015. This regulation has similar objectives than the former General Regulation No. 341, but includes additional issues; by the way of separating each policy in several more detailed policies. Subjects such as non discrimination, inclusion and sustainability are particularly important in this new regulation. The Appendix of General Regulation No. 385 is divided into the following four sections with respect to which companies must report the corporate practices that have been adopted: (i) the functioning and composition of the board, (ii) relations between the company, shareholders and the general public, (iii) risk management and control, and (iv) assessment by a third party. Publicly held limited liability corporations should send the information with respect to corporate governance practices to the SVS no later than March 31 of each year, using the contents of the Appendix to this regulation as criteria. If none of them is adopted, the company must explain its reasons to the SVS. The information should refer to December 31 of the calendar year prior to its dispatch. At the same time, such information should also be at the public’s disposal on the company’s website, and must be sent to the stock exchanges.
Compliance with the New York Stock Exchange Listing Standards on Corporate Governance
The following is a summary of the significant differences between our corporate governance practices and those applicable to U.S. domestic issuers under the corporate governance rules of the NYSE.
Independence and Functions of the Directors’ Committee (Audit Committee)
Under the NYSE corporate governance rules, all members of the Audit Committee must be independent. We have been subject to this requirement since July 31, 2005. On April 22, 2010, at an Extraordinary Shareholders’ Meeting (“ESM”), our by-laws were amended and the Audit Committee was merged with the Directors’ Committee. According to our by-laws, all members of this Committee must satisfy the requirements of independence as stipulated by the NYSE. Also, Chilean law requires that at least two thirds of the Directors’ Committee be independent directors. According to Chilean law, a member would not be considered independent if, at any time, within the last 18 months he (i) maintained any relationship of a relevant nature and amount with the company, with other companies of the same group, with its controlling shareholder or with the principal officers of any of them or has been a director, manager, administrator or officer of any of them; (ii) maintained a family relationship with any of the members described in (i) above; (iii) has been a director, manager, administrator or principal officer of a non-profit organization that has received contributions from (i) above; (iv) has been a partner or a shareholder that has controlled, directly or indirectly, 10% or more of the capital stock or has been a director, manager, administrator or principal officer of an entity that has provided consulting or legal services for a relevant consideration or external audit services to the persons listed in (i) above; and (v) has been a partner or a shareholder that has controlled, directly or indirectly, 10% or more of the capital stock or has been a director, manager, administrator or principal officer of the principal competitors, suppliers or customers. In case there are not sufficient independent directors on the Board to serve on the Directors’ Committee, Chilean law determines that the independent director nominates the rest of the members of the Directors’ Committee among the remaining Board members that do not meet the Chilean law independence requirements. Chilean law also requires that all publicly held limited liability stock corporations that have a market capitalization of at least UF 1,500,000 (Ch$ 38.4 billion as of December 31, 2015) and at least 12.5% of its voting shares are held by shareholders that individually control or own less than 10% of such shares, must have at least one independent director and a Directors’ Committee.
Under the NYSE corporate governance rules, all members of the Audit Committee must be independent. The Audit Committee of a U.S. company must perform the functions detailed in, and otherwise comply with the requirements of NYSE Listed Company Manual Rules 303A.06 and 303A.07. As of July 31, 2005, non-U.S. companies have been required to comply with Rule 303A.06, but not with Rule 303A.07. Since July 31, 2005, we have complied with the independence and the functional requirement of Rule 303A.06.
On June 29, 2005, our Board of Directors created an Audit Committee, composed of three directors who were also members of the Board, as required by the Sarbanes-Oxley Act (“SOX”) and the NYSE corporate governance rules. In April 2010, this Audit Committee was merged into the Directors’ Committee. Pursuant to our by-laws, all members of the Directors’ Committee must satisfy the requirements of independence, as stipulated by the NYSE. The Director’s Committee is composed of three members of the Board and complies with Chilean law, as well as with the criteria and requirements of independence prescribed by the SOX, the SEC and the NYSE. As of the date of this Report, the Directors’ Committee complies with the conditions of the Audit Committee as required by the SOX, the SEC and the NYSE corporate governance rules. As a result, we have a single Committee, the Directors’ Committee, which includes among its functions the duties performed by the Audit Committee.
151
Our Directors’ Committee performs the following functions:
| | • | | review of financial statements and the reports of the external auditors prior to their submission for shareholders’ approval; |
| | • | | formulate proposals to the Board of Directors, which will make its own proposals to shareholders’ meetings, for the selection of external auditors and private rating agencies; |
| | • | | review of information related to our transactions with related parties and reports the opinion of the Directors’ Committee to the Board of Directors; |
| | • | | the examination of the compensation framework and plans for managers, executive officers and employees; |
| | • | | the preparation of an Annual Management Report, including its main recommendations to shareholders; |
| | • | | provide information to the Board of Directors about the convenience of recruiting external auditors to provide non-auditing services, when such services are not prohibited by law, depending on whether such services might affect the external auditors’ independence; |
| | • | | oversee the work of external auditors; |
| | • | | review and approval of the annual auditing plan by the external auditors; |
| | • | | evaluate the qualifications, independence and quality of the auditing services; |
| | • | | elaborate on policies regarding employment of former members of the external auditing firm; |
| | • | | review and discuss problems or disagreements between management and external auditors regarding the auditing process; |
| | • | | establish procedures for receiving and dealing with complaints regarding accounting, internal control and auditing matters; |
| | • | | any other function mandated to the committee by the by-laws, our Board of Directors or our shareholders. |
Corporate Governance Guidelines
The NYSE’s corporate governance rules require U.S.-listed companies to adopt and disclose corporate governance guidelines. Chilean law provides for this practice through the disclosure of the procedures related to the General Resolution No. 385 and the Manual. We have also adopted the codes of conduct described above, and at our ESM held in March 2006, we approved the inclusion of articles in our by-laws that govern the creation, composition, attributions, functions and compensation of both Directors’ and Audit Committees described above.
152
The following table sets forth the total number of our personnel (both permanent and temporary employees) and the number of personnel (both permanent and temporary employees) of each of our consolidated subsidiaries as of December 31, 2015, 2014 and 2013, assuming that the Spin-Offs had been completed as of December 31, 2015:
| | | | | | | | | | | | |
Company | | 2015 | | | 2014 | | | 2013 | |
Argentina | | | | | | | | | | | | |
Costanera | | | 485 | | | | 485 | | | | 481 | |
El Chocón | | | 47 | | | | 49 | | | | 48 | |
Edesur | | | 4,157 | | | | 3,823 | | | | 3,320 | |
Cemsa(1) | | | 16 | | | | 13 | | | | 31 | |
Dock Sud(1) | | | 84 | | | | 69 | | | | 68 | |
CTM and TESA | | | 5 | | | | 5 | | | | 5 | |
| | | | | | | | | | | | |
Total personnel in Argentina | | | 4,794 | | | | 4,444 | | | | 3,953 | |
| | | | | | | | | | | | |
| | | |
Brazil | | | | | | | | | | | | |
Cachoeira Dourada | | | 79 | | | | 76 | | | | 71 | |
Fortaleza | | | 76 | | | | 70 | | | | 68 | |
CIEN | | | 39 | | | | 62 | | | | 61 | |
Ampla(2) | | | 1,217 | | | | 1,202 | | | | 1,169 | |
Coelce | | | 1,186 | | | | 1,213 | | | | 1,234 | |
Enel Brasil | | | 62 | | | | 72 | | | | 69 | |
| | | | | | | | | | | | |
Total personnel in Brazil | | | 2,659 | | | | 2,695 | | | | 2,672 | |
| | | | | | | | | | | | |
| | | |
Chile | | | | | | | | | | | | |
Enersis Américas | | | 81 | | | | — | | | | — | |
Endesa Américas | | | 6 | | | | — | | | | — | |
| | | | | | | | | | | | |
Total personnel in Chile | | | 87 | | | | — | | | | — | |
| | | | | | | | | | | | |
| | | |
Colombia | | | | | | | | | | | | |
Emgesa | | | 510 | | | | 589 | | | | 563 | |
Codensa | | | 1,034 | | | | 1,043 | | | | 1,036 | |
| | | | | | | | | | | | |
Total personnel in Colombia | | | 1,544 | | | | 1,632 | | | | 1,599 | |
| | | | | | | | | | | | |
| | | |
Peru | | | | | | | | | | | | |
Edegel | | | 260 | | | | 268 | | | | 260 | |
Edelnor | | | 610 | | | | 619 | | | | 616 | |
EEPSA | | | 56 | | | | 56 | | | | 56 | |
Generalima | | | 5 | | | | 8 | | | | 6 | |
| | | | | | | | | | | | |
Total personnel in Peru | | | 931 | | | | 951 | | | | 938 | |
| | | | | | | | | | | | |
| | | |
Total personnel | | | 10,015 | | | | 9,722 | | | | 9,162 | |
| | | | | | | | | | | | |
| (1) | As a result of the 2013 capital increase, we began accounting for Cemsa, Dock Sud, EEPSA and Generalima on a consolidated basis as of April 1, 2013. |
| (2) | Includes En-Brasil Comercio e Serviços S.A. |
The following table sets forth the total number of our temporary employees and the number of temporary employees of each of our consolidated subsidiaries as of December 31, 2015, 2014 and 2013 and the average during the most recent financial year, assuming that the Spin-Offs had been completed as of December 31, 2015:
| | | | | | | | | | | | | | | | |
Company | | Average 2015 | | | 2015 | | | 2014 | | | 2013 | |
Argentina | | | | | | | | | | | | | | | | |
Costanera | | | 1 | | | | 1 | | | | 18 | | | | 20 | |
El Chocón | | | 2 | | | | 2 | | | | 3 | | | | 3 | |
Edesur | | | 9 | | | | 15 | | | | 14 | | | | 8 | |
Cemsa(1) | | | 1 | | | | 1 | | | | 1 | | | | 3 | |
Dock Sud(1) | | | — | | | | — | | | | 6 | | | | 6 | |
CTM and TESA | | | — | | | | — | | | | — | | | | — | |
| | | | | | | | | | | | | | | | |
Total temporary personnel in Argentina | | | 13 | | | | 19 | | | | 42 | | | | 40 | |
| | | | | | | | | | | | | | | | |
| | | | |
Brazil | | | | | | | | | | | | | | | | |
Cachoeira Dourada | | | — | | | | — | | | | — | | | | — | |
Fortaleza | | | — | | | | — | | | | — | | | | — | |
CIEN | | | — | | | | — | | | | 1 | | | | 2 | |
Ampla(2) | | | — | | | | — | | | | — | | | | — | |
Coelce | | | — | | | | — | | | | — | | | | — | |
Enel Brasil | | | — | | | | — | | | | — | | | | — | |
| | | | | | | | | | | | | | | | |
Total temporary personnel in Brazil | | | — | | | | — | | | | 1 | | | | 2 | |
| | | | | | | | | | | | | | | | |
153
| | | | | | | | | | | | | | | | |
Company | | Average 2015 | | | 2015 | | | 2014 | | | 2013 | |
Colombia | | | | | | | | | | | | | | | | |
Emgesa | | | 56 | | | | 44 | | | | 92 | | | | 87 | |
Codensa | | | 143 | | | | 108 | | | | 40 | | | | 36 | |
| | | | | | | | | | | | | | | | |
Total temporary personnel in Colombia | | | 199 | | | | 152 | | | | 132 | | | | 123 | |
| | | | | | | | | | | | | | | | |
| | | | |
Peru | | | | | | | | | | | | | | | | |
Edegel | | | 28 | | | | 24 | | | | 26 | | | | 22 | |
Edelnor | | | 47 | | | | 42 | | | | 62 | | | | 63 | |
EEPSA(1) | | | 3 | | | | 3 | | | | 3 | | | | 2 | |
Generalima(1) | | | 4 | | | | 3 | | | | 4 | | | | 4 | |
| | | | | | | | | | | | | | | | |
Total temporary personnel in Peru | | | 82 | | | | 72 | | | | 95 | | | | 91 | |
| | | | | | | | | | | | | | | | |
| | | | |
Total temporary personnel | | | 294 | | | | 243 | | | | 270 | | | | 256 | |
| | | | | | | | | | | | | | | | |
| (1) | As a result of the 2013 capital increase, we began accounting for Cemsa, Dock Sud, EEPSA and Generalima on a consolidated basis as of April 1, 2013. |
| (2) | Includes En-Brasil Comercio e Serviços S.A. |
Chile
All Chilean employees who are dismissed for reasons other than misconduct are entitled by law to a severance payment. According to Chilean law, permanent employees are entitled to a basic payment of one-month’s salary for each year (or a six-month portion thereof) worked, subject to a limit of a total payment of no more than 11 months’ pay for employees hired after August 14, 1981. Severance payments to employees hired prior to that date consist of one-month’s salary for each full year worked, not subject to any limitation on the total amount payable. Under our collective bargaining agreements, we are obligated to make severance payments to all covered employees in cases of voluntary resignation or death in specified amounts that increase according to seniority and may exceed the amounts required under Chilean law.
We have two collective bargaining agreements. The first one was signed in July 2015 and it will be in force until July 2019. The second one was signed in January 2016 and will expire in December 2019.
Argentina
Edesur has two collective bargaining agreements, both of which expired in 2007 and are still in the renegotiation process. El Chocón has two collective bargaining agreements, one of which expires in December 2016, and the other has already expired and is in process of renegotiation. Costanera has two collective bargaining agreements, both of which expired in 2014 and are in process of renegotiation.
Under Argentine law, the working conditions under the expired agreements continue until the signing of a new agreement, under the principle of ultra-activity established by 14,250 Law (Art. 12).
The result of collective bargaining agreements is subject to the result of the negotiations between the government and trade union federations, with regards to wage increases and the incorporation of contracted workers into the workforce of the companies.
154
Brazil
Ampla has five collective bargaining agreements, four of which will expire in 2017 and one of which will expire in 2016. Coelce has two collective bargaining agreements, one of which will expire in October 2016 and the other in September 2017.
CIEN has two collective bargaining agreements, one of which will expire in March 2017 and the other in September 2017. Cachoeira Dourada has two collective bargaining agreements, one of which will expire in March 2016 and the other in September 2017.
Fortaleza has two collective bargaining agreements, one of which will expire in March 2016 and the other in September 2017.
Under Brazilian law, collective bargaining agreements cannot last for more than two years.
Colombia
Codensa has two collective agreements, one of which will expire on June 30, 2018 and the other on January 25, 2016 and is still being renegotiated. Emgesa has two collective agreements, one of which will expire on June 30, 2018 and the other in August, 2016.
Under Colombian labor law, pre-existing collective bargaining agreements are automatically renewed until a new agreement is in force.
Peru
Edelnor has two collective bargaining agreements, both of which will expire in December 2015 and are currently in the renegotiation process. Edegel has a collective bargaining agreement, which will expire in December 2016. EEPSA has a collective bargaining agreement, which will expire in December 2017.
To the best of our knowledge, none of our directors or officers owns more than 0.1% of our shares or owns any stock options. It is not possible to confirm whether any of our directors or officers has a beneficial, rather than direct, interest in our shares. To the best of our knowledge, any share ownership by all of our directors and officers, in the aggregate, amounts to significantly less than 10% of our outstanding shares.
| Item 7. | Major Shareholders and Related Party Transactions |
We have only one class of capital stock and Enel S.p.A., our ultimate controlling shareholder, has no different voting rights than our other shareholders. As of April 26, 2016, our 49,092,772,762 shares of common stock outstanding were held by 6,811 stockholders of record. There were seven record holders of our ADSs as of such date.
It is not practicable for us to determine the number of ADSs or common shares beneficially owned in the United States, as the depositary only has knowledge of the record holders, including the Depositary Trust Company and its nominees. As such, we are not able to ascertain the domicile of the final beneficial holders represented by the seven ADS record holders. Likewise, we cannot readily determine the domicile of any of our foreign stockholders who hold our common stock, either directly or indirectly.
On October 23, 2014, Endesa S.A., a Spanish subsidiary of Enel, sold its direct and indirect ownership interest in shares of Enersis Américas to Enel Iberoamérica, a wholly-owned Spanish subsidiary of Enel. As a result of this transaction, Enel owned 60.6% of Enersis Américas through Enel Latinoamérica (40.3%) and Enel Iberoamérica (20.3%).
As of April 26, 2016, Enel beneficially owned 60.6% of our shares. Chilean private pension funds (AFPs), owned 11.6% of our shares in the aggregate. Chilean stockbrokers, mutual funds, insurance companies, foreign equity funds, and other Chilean institutional investors collectively held 16% of our shares. ADS holders owned 9.7% of our shares, and the remaining 2.1% of our shares was held by 6,628 minority shareholders.
155
The following table sets forth certain information concerning ownership of the common stock as of April 26, 2016, with respect to each stockholder known by us to own more than 5% of the outstanding shares of common stock:
| | | | | | | | |
| | | Number of Shares
Owned | | | Percentage of Shares
Outstanding | |
Enel Latinoamérica(1) | | | 19,794,583,473 | | | | 40.3% | |
Enel Iberoamérica | | | 9,967,630,058 | | | | 20.3% | |
| (1) | Enel Latinoamérica is wholly-owned by Enel Iberoamérica, which in turn is wholly-owned by Enel. |
Enel publicly trades on the Milan Stock Exchange. It is headquartered in Italy and is primarily engaged in the energy sector, with a presence in 32 countries across five continents, mainly in Europe and Latin America, and generating electricity from power plants with over 89 GW of net installed capacity. Enel provides service to more than 61 million customers through its electricity and gas businesses through distribution networks of 1.9 million kilometers.
| B. | Related Party Transactions. |
Article 146 of Law No. 18,046 (the “Chilean Companies Act”) defines related-party transactions as all transactions involving a company and any entity belonging to the corporate group, its parent companies, controlling companies, subsidiaries or related companies, board members, managers, administrators, senior officers or company liquidators, including their spouses, some of their relatives and all entities controlled by them, in addition to individuals who may appoint at least one member of the company’s board of directors or who control 10% or more of voting capital, or companies in which a board member, manager, administrator, senior officer or company liquidator has been serving in the same position within the last 18 months. The law establishes that in the event that these persons fulfill the requirements established by Article 146, such persons must immediately inform the Board of Directors of their related-party nature or such other group as the Board may appoint for that purpose. As required by law, “related-party transactions” must comply with corporate interests, as well as prices, terms and conditions prevailing in the market at the time of their approval. They must also meet all legal requirements, including acknowledgement and approval of the transaction by the board (excluding the affected directors), by the ESM (in some cases, with requisite majority approval) and by any applicable regulatory procedures.
The aforementioned law, which also applies to our affiliates, also provides for some exceptions, stating that in certain cases, Board approval would suffice for “related-party transactions,” pursuant to certain related-party transaction thresholds and when such transactions are conducted in compliance with the related-party policies defined by the company’s board. At its meetings held on December 17, 2009 and April 23, 2010, our Board of Directors approved a related-party transaction policy (política de habitualidad) effective as of January 1, 2010. This policy is available on our website.
If a transaction is not in compliance with Article 146, this would not affect the transaction’s validity, but we or our shareholders may demand compensation from the individual associated with the infringement as provided under law, and reparation for damages. We believe that we have complied with the requirements of Article 146 in all transactions with related parties.
In the countries in which we operate, inter-company transactions are permitted, but they have adverse tax consequences. Accordingly, we do not manage the cash flows of our subsidiaries.
During 2015, we granted four structured loans to Endesa Chile, primarily to satisfy working capital needs. As of December 31, 2015, the account receivables were composed of a US$ 250 million loan with a fixed interest rate of 1.38% annually.
We have received short-term loans from our related parties in Chile, primarily to satisfy working capital needs. As of December 31, 2015, the outstanding balance was US$ 66 million from SIEI, a subsidiary of Enersis Chile.
During the three-year period ended December 31, 2015, Costanera received one loan from Endesa Chile at a spread of 6.0% over LIBOR. This loan matured in November 2013, because it was contributed to Costanera in connection with its capital increase.
Intercompany Arrangements Related to the Spin-Off
Enersis Chile does not own any of our common stock or ADSs and we do not own any Enersis Chile common stock or ADSs. Under Chilean law, we remain jointly and severally liable for some obligations assumed by Enersis Chile pursuant to the Spin-Off. Such liability, however, will not extend to any obligation to a person or entity that has given its express consent relieving us of such liability and approving the Spin-Off.
There are a variety of contractual relationships between Enersis Chile and us to provide for ongoing relationships. They fall into two broad categories:
Arrangements Related to the Spin-Off. The separation of the two companies and the transfer of certain assets and liabilities owned by us to Enersis Chile were effected by the action of our shareholders at our ESM held on December 18, 2015.
Post-Spin-OffIntercompany Services. Enersis Chile entered into new intercompany agreements under which Enersis Chile provides services directly and indirectly to us, Endesa Américas and Chilectra Américas following the Spin-Off. As a result of the Spin-Off, some of our existing intercompany agreements with Endesa Chile and Chilectra Chile were novated with Enersis Chile as the new counterparty. To a much lesser extent, Enersis Chile may require services from us and from SIEI. The services to be rendered by Enersis Chile include certain legal, finance, capital markets, financial compliance, accounting, investor relations, human resources, communications, security, training and development, relations with contractors, risk management, IT services, tax services and other corporate support and administrative services. These services are provided and charged at market prices if there is a comparable service. If there are no comparable services in the market, they will be provided at cost plus a specified percentage.
We may also enter into a tax indemnity agreement with Endesa Chile pursuant to which we will indemnify Endesa Chile for net tax costs paid by Endesa Chile in connection with Endesa Américas’ spin-off from Endesa Chile. This indemnification would be applicable only if the Merger is not approved before December 31, 2017 due to reasons not attributable to Endesa Américas or Endesa Chile or if an event of force majeure has occurred.
As of the date of this Report, the abovementioned transactions have not experienced material changes. For more information regarding transactions with related parties, refer to Note 11 of the Notes to our consolidated financial statements.
More recently, in March 2016, we also have guaranteed Ampla’s US$ 75 million three-year term loan with a third party. The financing was granted in Chile in U.S. dollars, and has a swap from U.S. dollars to Brazilian reais contracted in Brazil, which was also guaranteed by us.
| C. | Interests of Experts and Counsel. |
Not applicable.
156
| Item 8. | Financial Information |
| A. | Consolidated Statements and Other Financial Information. |
See “Item 18. Financial Statements.”
Legal Proceedings
We and our subsidiaries are parties to legal proceedings arising in the ordinary course of business. We believe it is unlikely that any loss associated with pending lawsuits will significantly affect the normal development of our business.
For detailed information as of December 31, 2015 on the status of the material pending lawsuits that have been filed against us and our subsidiaries, please refer to Note 36.3 of the Notes to our consolidated financial statements.
In relation to the legal proceedings reported in the Notes to our consolidated financial statements, we use the criteria of disclosing lawsuits above a minimum threshold of US$ 30 million of potential impact to us, and, in some cases, qualitative criteria according to the materiality of the impact in the conduct of our business. The lawsuit status includes a general description, the process status and the estimate of the amount involved in each lawsuit.
Dividend Policy
Our Board of Directors generally establishes a definitive dividend payable each year, accrued in the prior year, which cannot be less than the legal minimum of 30% of annual net income. In the meeting held on April 28, 2015, the OSM agreed to distribute a definitive dividend of Ch$ 305,078,934,500 equivalent to Ch$ 6.21433 per share of common stock accrued in fiscal year 2014. This corresponds to a payout ratio of 50%, based on annual net income before negative goodwill amortization. On January 30, 2015, an interim dividend of Ch$ 0.83148 per share of common stock was paid as part of the definitive dividend, with the remainder of Ch$ 264,259,128,599 equivalent to Ch$ 5.38285 per share of common stock paid on May 25, 2015. On November 24, 2015, the Board of Directors agreed to distribute an interim dividend of Ch$ 1.23875 per share of common stock on January 29, 2016, accrued in fiscal year 2015. The aforementioned interim dividend will be deducted from the definitive dividend to be paid in May 2016. The definitive dividend of Ch$ 269,980 million that has been agreed to be paid, corresponds to a payout ratio of 50%, based on annual net income before negative goodwill amortization. At the ESM held on December 18, 2015, shareholders agreed to consider a percentage of the 2015 annual net income as Enersis Chile’ 2015 annual net income. Therefore, the remainder of the definitive dividend will be divided in a determined proportion between our Company and Enersis Chile, which will correspond to Ch$ 3.40599 and Ch$ 2.09338 per share, respectively. The payment of dividends for fiscal year 2015 is based on the net income filed with the SVS. For further details, see “Item 3. Key Information — A. Selected Financial Data.”
In accordance with our current dividend policy, the interim dividend corresponds to 15% of consolidated net income as of September 30, 2015. Additionally, our Board of Directors will propose a definitive dividend payout equal to 50% of the annual net income for fiscal year 2016. Actual dividend payments will be subject to net profits obtained in each period, as well as to expectations of future profit levels and other conditions that may exist at the time of such dividend declaration. The fulfillment of the aforementioned dividend policy will depend on actual 2016 net income. The proposed dividend policy is subject to our Board of Director’s prerogative to change the amount and timing of the dividends under the circumstances at the time of the payment.
The payments of dividends are subject to legal restrictions, such as legal reserve requirements, capital and retained earnings criteria, and other contractual restrictions such as the non-default on credit agreements. For example, Costanera, El Chocón and Piura may not pay dividends unless they comply with certain financial covenants. However, these legal restrictions are not currently affecting our ability or any of our subsidiaries to pay dividends. (See “Item 5. Operating and Financial Review and Prospects — B. Liquidity and Capital Resources” for further detail on our debt instruments).
Stockholders set dividend policies at each subsidiary and affiliate. There are currently no material currency controls which prohibit us from repatriating the dividend payments from its non-Chilean principal subsidiaries and affiliates.
We pay dividends to shareholders of record as of midnight of the fifth business day prior to the payment date. Holders of ADS on the applicable record dates will be entitled to participate in dividends.
157
Dividends
The table below sets forth, for each of the years indicated, the per share dividend amounts distributed by us in Chilean pesos and the amount of dividends distributed per ADS (one ADS = 50 shares of common stock) in U.S. dollars. See “Item 10. Additional Information — D. Exchange Controls”.
| | | | | | | | |
Year | | Nominal
Ch$(1) | | | US$ per
ADS(2) | |
2015 | | | 6.21 | | | | 0.44 | |
2014 | | | 6.71 | | | | 0.55 | |
2013 | | | 4.25 | | | | 0.41 | |
2012 | | | 5.75 | | | | 0.60 | |
2011 | | | 7.45 | | | | 0.72 | |
| (1) | This chart details dividends actually paid in any given year, and not the dividends accrued in that year. These dividends may have been accrued during the prior year or the same year in which they were paid. These amounts do not reflect reduction for any applicable Chilean withholding tax. |
| (2) | The U.S. dollar per ADS amount has been calculated by applying the exchange rate as of December 31 of each year. One ADS = 50 shares of common stock. |
For a discussion of Chilean withholding taxes and access to the formal currency market in Chile in connection with the payment of dividends and sales of ADSs and the underlying common stock, see “Item 10. Additional Information — E. Taxation” and “Item 10. Additional Information — D. Exchange Controls.”
On April 21, 2016, we completed the final stage of the spin-off of Enersis Chile and since the conditions established under IFRS were met by December 31, 2015, the results of the Chilean businesses assigned to Enersis Chile were classified as discontinued operations. See “Introduction”, “Item 4. Information on the Company — A. History and Development of the Company — History” and Notes 5 and 41 of the Notes to our consolidated financial statements.
| Item 9. | The Offer and Listing |
| A. | Offer and Listing Details. |
Market Price Information
The shares of our common stock currently trade on United States, Chilean and Spanish exchanges.
The table below shows, for the periods indicated, high and low prices in Chilean pesos on the Santiago Stock Exchange, and high and low closing prices of the ADSs in U.S. dollars as reported by the NYSE (which include the value of Enersis Chile in the price of the common stock through April 21, 2016 and in the price of the ADSs through April 26, 2016).
| | | | | | | | | | | | | | | | |
| | | Santiago Stock
Exchange(1) | | | U.S. Stock
Exchanges(2) | |
| | | Ch$ per share | | | US$ per ADS | |
| | | High | | | Low | | | High | | | Low | |
| | | | |
2016 | | | | | | | | | | | | | | | | |
April (up to April 26, 2016) | | | 189.00 | | | | 93.50 | | | | 14.27 | | | | 13.10 | |
March | | | 188.00 | | | | 176.92 | | | | 13.93 | | | | 12.72 | |
February | | | 183.00 | | | | 167.80 | | | | 13.03 | | | | 11.72 | |
January | | | 171.00 | | | | 153.00 | | | | 11.96 | | | | 10.33 | |
| | | | |
2015 | | | | | | | | | | | | | | | | |
December | | | 180.30 | | | | 161.16 | | | | 13.99 | | | | 11.25 | |
November | | | 187.00 | | | | 169.00 | | | | 13.46 | | | | 12.05 | |
October | | | 200.00 | | | | 173.99 | | | | 13.99 | | | | 12.38 | |
September | | | 192.26 | | | | 174.02 | | | | 13.82 | | | | 12.34 | |
4th Quarter | | | 200.00 | | | | 161.16 | | | | 13.99 | | | | 11.25 | |
3rd Quarter | | | 208.33 | | | | 174.02 | | | | 16.10 | | | | 12.20 | |
2nd Quarter | | | 226.25 | | | | 196.00 | | | | 18.72 | | | | 15.38 | |
1st Quarter | | | 205.00 | | | | 191.98 | | | | 16.58 | | | | 15.15 | |
158
| | | | | | | | | | | | | | | | |
| | | Santiago Stock
Exchange(1) | | | U.S. Stock
Exchanges(2) | |
| | | Ch$ per share | | | US$ per ADS | |
| | | High | | | Low | | | High | | | Low | |
| | | | |
2014 | | | 210.75 | | | | 143.00 | | | | 17.59 | | | | 13.08 | |
4th Quarter | | | 204.89 | | | | 176.25 | | | | 15.98 | | | | 14.91 | |
3rd Quarter | | | 210.75 | | | | 184.00 | | | | 17.59 | | | | 15.69 | |
2nd Quarter | | | 187.85 | | | | 169.60 | | | | 17.00 | | | | 15.21 | |
1st Quarter | | | 171.85 | | | | 143.00 | | | | 15.55 | | | | 13.08 | |
| | | | |
2013 | | | 188.00 | | | | 148.00 | | | | 19.97 | | | | 14.39 | |
4th Quarter | | | 172.40 | | | | 153.00 | | | | 17.22 | | | | 14.57 | |
3rd Quarter | | | 173.77 | | | | 151.00 | | | | 17.66 | | | | 14.72 | |
2nd Quarter | | | 183.00 | | | | 148.00 | | | | 19.56 | | | | 14.39 | |
1st Quarter | | | 188.00 | | | | 173.00 | | | | 19.97 | | | | 18.25 | |
| | | | |
2012 | | | 203.50 | | | | 150.10 | | | | 20.87 | | | | 15.50 | |
| | | | |
2011 | | | 221.10 | | | | 169.00 | | | | 23.48 | | | | 15.81 | |
| (1) | Source: Santiago Stock Exchange. |
| (2) | Source: NYSENET. Our ADS composite figures include transactions in all U.S. stock exchanges. One ADS = 50 shares of common stock. |
On the last trading day in 2015, our common stock closed at Ch$ 171.07 per share on the Santiago Stock Exchange and our ADSs closed at US$ 12.15 on the NYSE.
On April 28, 2016, our common stock closed at Ch$ 108.83 per share on the Santiago Stock Exchange and our ADSs closed at US$ 7.60 on the NYSE after giving effect to the spin-off of Enersis Chile.
Not applicable.
Shares of our common stock have traded in the United States, our primary market, in the form of ADSs on the NYSE and Over the Counter (“OTC”) markets since October 1993, under the ticker symbol “ENI”. Since the completion of the spin-off of Enersis Chile in April 2016, our ADS, currently trade under the ticker symbol “ENIA”. Each ADS represents 50 shares of common stock, with the ADSs in turn evidenced by American Depositary Receipts (“ADRs”). The ADRs are outstanding under the Third Amended and Restated Deposit Agreement dated as of March 28, 2013 among us, Citibank, N.A. as Depositary (the “Depositary”), and the holders and beneficial owners from time to time of ADRs issued thereunder. Only persons in whose names ADRs are registered on the books of the Depositary are treated by the Depositary as owners of ADRs.
As of April 25, 2016, ADRs evidencing 95,676,953 ADSs (equivalent to 4,783,847,650 shares of common stock) were outstanding, representing 9.74% of the total number of outstanding shares. It is not practicable for us to determine the proportion of ADSs beneficially owned by U.S. final beneficial holders. Trading volume of our shares on the NYSE and other exchanges during 2015 amounted to approximately 190 million ADSs, which in turn was equivalent to US$ 2,817 million.
The NYSE is open for trading Monday through Friday from 9:30 am to 4:00 pm, with the exception of holidays declared by the NYSE in advance. On the trading floor, the NYSE trades in a continuous auction format, where traders can execute stock transactions on behalf of investors. Specialist brokers act as auctioneers in an open outcry auction market to bring buyers and sellers together and to manage the actual auction. Customers can also send orders for immediate electronic execution or route orders to the floor for trade in the auction market. The NYSE works with U.S. regulators like the Securities and Exchange Commission (“SEC”) and the Commodity Futures Trading Commission (“CFTC”) to coordinate risk management measures in the electronic trading environment through the implementation of mechanisms like circuit breakers and liquidity replenishment points.
In Chile, our common stock is traded on three stock exchanges: the Santiago Stock Exchange, the Electronic Stock Exchange and the Valparaíso Stock Exchange (collectively, the “Chilean Stock Exchanges”). The largest exchange in the country, the Santiago Stock Exchange, was established in 1893 as a private company. Its equity consists of 48 shares as of the date of this Report. As of December 31, 2015, 223 companies had shares listed on the Santiago Stock Exchange.
Equities, closed-end funds, fixed-income securities, short-term and money market securities, gold and U.S. dollars are traded on the Santiago Stock Exchange. The Santiago Stock Exchange also trades U.S. dollar futures and stock index futures. Securities are
159
traded primarily through an open voice auction system; a firm offers system or the daily auction. Trading through the open voice system occurs on each business day from 9:30 a.m. to 4:00 p.m., during local standard time, and from 9:30 a.m. to 5:00 p.m. during New York’s daylight savings time (usually from November to March), which differs from New York City time by up to two hours, depending on the season. The Santiago Stock Exchange has an electronic trading system calledTelepregón, which operates continuously from 9:30 a.m. to 4:00 p.m. during local standard time, and from 9:30 a.m. to 5:00 p.m. during New York’s daylight savings time, on each business day. During local standard time, electronic auctions may be conducted four times a day, at 10:30 a.m., 11:30 a.m., 1:30 p.m., and 3:30 p.m. During daylight savings time there is an additional electronic auction at 4:30 p.m. More than 99% of the auctions and transactions take place electronically.
There are two share price indexes on the Santiago Stock Exchange, the General Shares Price Index, or IGPA, and the Selected Shares Price Index, or IPSA. The IGPA is calculated using the prices of shares that are traded at least 5% of the trading days of a year, with a total annual transactions exceeding UF 10,000 (Ch$ 256 million as of December 31, 2015, equivalent to US$ 361 thousands) and a free float representing at least 5% of the capital. The IPSA is calculated using the prices of the 40 shares with highest amounts traded, on a quarterly basis, and with a market capitalization above US$ 200 million. The shares included in the IPSA and IGPA are weighted according to the weighted value of the shares traded. We have been included in the IPSA since 1988.
The following table contains information regarding the amount of total traded shares of common stock and the corresponding percentage traded per market during 2015:
| | | | | | | | |
| | | Number of shares of
common stock traded | | | Percentage | |
Market | | | | | | | | |
United States (One ADS = 50 shares of common stock)(1) | | | 9,538,445,850 | | | | 62.5% | |
Chile(2) | | | 5,719,729,239 | | | | 37.5% | |
Spain(3) | | | 4,320,783 | | | | 0.0% | |
| | | | | | | | |
Total | | | 15,262,495,872 | | | | 100% | |
| | | | | | | | |
| (1) | Includes the New York Stock Exchange and over-the-counter trading. |
| (2) | Includes Santiago Stock Exchange, Electronic Stock Exchange and Valparaíso Stock Exchange. |
| (3) | Latibex (Listed on Latibex until December 4, 2015) |
For further information see “Item 9. The Offer and Listing — A. Offer and Listing Details — Market Price Information.”
Not applicable.
Not applicable.
Not applicable.
| Item 10. | Additional Information |
Not applicable.
160
| B. | Memorandum and Articles of Association. |
Description of Share Capital
Set forth below is certain information concerning our share capital and a brief summary of certain significant provisions of Chilean law and our by-laws.
General
Shareholders’ rights in Chilean companies are governed by the company’s by-laws (Estatutos), which have the same purpose as the articles or the certificate of incorporation and the by-laws of a company incorporated in the United States, and by the Chilean Companies Act Law, No. 18,046. In addition, D.L. 3500, or the Pension Funds’ System Law, which permits the investment by Chilean pension funds in stock of qualified companies, indirectly affects corporate governance and prescribes certain rights of shareholders. In accordance with the Chilean Companies Act, legal actions by shareholders to enforce their rights as shareholders of the company must be brought in Chile in arbitration proceedings or, at the option of the plaintiff, before Chilean courts. Members of the Board of Directors, managers, officers and principal executives of the company, or shareholders that individually own shares with a book value or stock value higher that UF 5,000 (Ch$ 128 million as of December 31, 2015) do not have the option to bring the procedure to the courts.
The Chilean securities markets are principally regulated by the SVS under Securities Market Law (Law No.18,045) and the Chilean Companies Act. These two laws state the disclosure requirements, restrictions on insider trading and price manipulation, and provide protection to minority shareholders. The Securities Market Law sets forth requirements for public offerings, stock exchanges and brokers, and outlines disclosure requirements for companies that issue publicly offered securities. The Chilean Companies Act and the Securities Market Law, both as amended, state rules regarding takeovers, tender offers, transactions with related parties, qualified majorities, share repurchases, directors’ committee, independent directors, stock options and derivative actions.
Public Register
We are a publicly held stock corporation incorporated under the laws of Chile. We were constituted by public deed issued on June 19, 1981 by the Santiago Notary Public, Mr. Patricio Zaldívar M. Our existence was approved by SVS Resolution 409-S of July 17, 1981 and we were registered on July 21, 1981 in the Commercial Registrar (Registro de Comercio del Conservador de Bienes Raíces y Comercio de Santiago), on pages 13099 No. 7269. We are registered with the SVS under the entry number 0175. We also registered with the United States Securities and Exchange Commission under the commission file number 001-12440 on October 19, 1993.
Reporting Requirements Regarding Acquisition or Sale of Shares
Under Article 12 of the Securities Market Law and General Rule 269 of the SVS, certain information regarding transactions in shares of a publicly held stock corporation or in contracts or securities whose price or results depend on, or are conditioned in whole or in part on the price of such shares, must be reported to the SVS and the Chilean stock exchanges. Since ADSs are deemed to represent the shares of common stock underlying the ADRs, transactions in ADRs will be subject to these reporting requirements and those established in Circular 1375 of the SVS. Shareholders of publicly held stock corporations are required to report to the SVS and the Chilean stock exchanges:
| | • | | any direct or indirect acquisition or sale of shares made by a holder who owns, directly or indirectly, at least 10% of a publicly held stock corporation’s subscribed capital; |
| | • | | any direct or indirect acquisition or sale of contracts or securities whose price or results depend on or are conditioned in whole or in part on the price of shares made by a holder who owns, directly or indirectly, at least 10% of a publicly held stock corporation’s subscribed capital; |
| | • | | any direct or indirect acquisition or sale of shares made by a holder who, due to an acquisition of shares of such publicly held stock company, results in the holder acquiring, directly or indirectly, at least 10% of a publicly held stock company’s subscribed capital; and |
| | • | | any direct or indirect acquisition or sale of shares in any amount, made by a director, receiver, principal executive, general manager or manager of a publicly held stock company. |
161
In addition, majority shareholders of a publicly held stock corporation must inform the SVS and the Chilean stock exchanges if such transactions are entered into with the intention of acquiring control of the company or if they are making a passive financial investment instead.
Under Article 54 of the Securities Market Law and General Rule 104 enacted by the SVS, any person who directly or indirectly intends to take control of a publicly held stock corporation must disclose this intent to the market at least ten business days in advance of the proposed change of control and, in any event, as soon as the negotiations for the change of control have taken place or reserved information of the publicly held stock corporation has been provided.
Corporate Objectives and Purposes
Article 4 of our by-laws states that our corporate objectives and purposes are, among other things, to conduct the exploration, development, operation, generation, distribution, transmission, transformation, or sale of energy in any form, directly or through other companies, as well as to provide engineering consulting services related to these objectives, and to participate in the telecommunications business.
Board of Directors
Our Board of Directors consists of seven members who are appointed by shareholders at the OSM and are elected for a three-year term, at the end of which they will be re-elected or replaced.
The seven directors elected at the OSM are the seven individual nominees who receive the highest majority of the votes. Each shareholder may vote his shares in favor of one nominee or may apportion his shares among any number of nominees.
The effect of these voting provisions is to ensure that a shareholder owning more than 12.5% of our shares is able to elect a member of the Board.
The compensation of the directors is set annually at the OSM. See “Item 6. Directors, Senior Management and Employees — B. Compensation.”
Agreements entered into by us with related parties can only be executed when such agreements serve our interest, and their price, terms and conditions are consistent with prevailing market conditions at the time of their approval and comply with all the requirements and procedures indicated in Article 147 of the Chilean Companies Act.
Certain Powers of the Board of Directors
Our by-laws provide that every agreement or contract that we enter into with our controlling shareholder, our directors or executives, or with our related parties, must be previously approved by two-thirds of the Board of Directors and be included in the Board meetings, and must comply with the provisions of the Chilean Companies Act.
Our by-laws do not contain provisions relating to:
| | • | | the directors’ power, in the absence of an independent quorum, to vote on compensation for themselves or any members of their body; |
| | • | | borrowing powers exercisable by the directors and how such borrowing powers can be varied; |
| | • | | retirement or non-retirement of directors under an age limit requirement; or |
| | • | | number of shares, if any, required for directors’ qualification. |
Certain Provisions Regarding Shareholder Rights
As of the date of the filing of this Report, our capital is comprised of only one class of shares, all of which are ordinary shares and have the same rights.
Our by-laws do not contain any provisions relating to:
162
| | • | | liability for capital reductions by us. |
Under Chilean law, the rights of our stockholders may only be modified by an amendment to the by-laws that complies with the requirements explained below under “Item 10. Additional Information — B. Memorandum and Articles of Association. — Shareholders’ Meetings and Voting Rights.”
Capitalization
Under Chilean law, only the shareholders of a company acting at an ESM have the power to authorize a capital increase. When an investor subscribes for shares, these are officially issued and registered under his name, and the subscriber is treated as a shareholder for all purposes, except receipt of dividends and for return of capital in the event that the shares have been subscribed but not paid for. The subscriber becomes eligible to receive dividends only for the shares that he has actually paid for or, if the subscriber has paid for only a portion of such shares, the pro rata portion of the dividends declared with respect to such shares unless the company’s by-laws provide otherwise. If a subscriber does not fully pay for shares for which the subscriber has subscribed on or prior to the date agreed upon for payment, notwithstanding the actions intended by the company to collect payment, the company is entitled to auction the shares on the stock exchange where such shares are traded, for the account and risk of the debtor, the number of shares held by the debtor necessary for the company to pay the outstanding balances and disposal expenses. However, until such shares are sold at auction, the subscriber continues to hold all the rights of a shareholder, except the right to receive dividends and return of capital. The Chief Executive Officer or the person replacing him will reduce in the shareholders’ register the number of shares in the name of the debtor shareholder to the number of shares that remain, deducting the shares sold by the company and settling the debt in the amount necessary to cover the result of such disposal after the corresponding expenses. When there are authorized and issued shares for which full payment has not been made within the period fixed by shareholders at the same ESM at which the subscription was authorized (which in no case may exceed three years from the date of such meeting), these shall be reduced in the non-subscribed amount until that date. With respect to the shares subscribed and not paid following the term mentioned above, the Board must proceed to collect payment, unless the shareholders’ meeting authorizes (by two thirds of the voting shares) a reduction of the company’s capital to the amount effectively collected, in which case the capital shall be reduced by force of law to the amount effectively paid. Once collection actions have been exhausted, the Board should propose to the shareholders’ meeting the approval by simple majority of the write-off of the outstanding balance and the reduction of capital to the amount effectively recovered.
As of December 31, 2015, our subscribed and fully paid capital totaled Ch$ 3,575 billion and consisted of 49,092,772,762 shares.
Preemptive Rights and Increases of Share Capital
The Chilean Companies Act requires Chilean companies to grant shareholders preemptive rights to purchase a sufficient number of shares to maintain their existing ownership percentage of such company whenever such company issues new shares.
Under Chilean law, preemptive rights are exercisable or freely transferable by shareholders during a 30-day period. The options to subscribe for shares in capital increases of the company or of any other securities convertible into shares or that confer future rights over these shares, should be offered, at least once, to the shareholders pro rata to the shares held registered in their name at midnight on the fifth business day prior to the date of the start of the preemptive rights period. The preemptive rights offering and the start of the 30-day period for exercising them shall be communicated through the publication of a prominent notice, at least once, in the newspaper that should be used for notifications of shareholders’ meetings. During such 30-day period, and for an additional period of up to 30-days immediately following the initial 30-day period, publicly held stock corporations are not permitted to offer any unsubscribed shares to third parties on terms which are more favorable than those offered to their shareholders. At the end of the second 30-day period, a Chilean publicly held stock corporation is authorized to sell non-subscribed shares to third parties on any terms, provided they are sold on one of the Chilean stock exchanges.
Shareholders’ Meetings and Voting Rights
An OSM must be held within the first four months following the end of our fiscal year. The last OSM was held on April 28, 2016. An ESM may be called by the Board of Directors when deemed appropriate, or when requested by shareholders representing at least 10% of the issued shares with voting rights, or by the SVS. To convene an OSM or an ESM, notice must be given three times in a newspaper located in our corporate domicile. The newspaper designated by our shareholders isEl Mercurio de Santiago. The first notice must be published not less than 15-days and no more than 20-days in advance of the scheduled meeting. Notice must also be mailed to each shareholder, to the SVS and to the Chilean stock exchanges.
163
The OSM shall be held on the day stated in the notice and should remain in session until having exhausted all the matters stated in the notice. However, once constituted, upon the proposal of the chairman or shareholders representing at least 10% of the shares with voting rights, the majority of the shareholders present may agree to suspend it and to continue it within the same day and place, with no new constitution of the meeting or qualification of powers being necessary, recorded in one set of minutes. Only those shareholders who were present or represented may attend the recommencement of the meeting with voting rights.
Under Chilean law, a quorum for a shareholders’ meeting is established by the presence, in person or by proxy, of shareholders representing at least a majority of the issued shares with voting rights of a company. If a quorum is not present at the first meeting, a reconvened meeting can take place at which the shareholders present are deemed to constitute a quorum regardless of the percentage of the shares represented. This second meeting must take place within 45-days following the scheduled date for the first meeting. Shareholders’ meetings adopt resolutions by the affirmative vote of a majority of those shares present or represented at the meeting. An ESM must be called to take the following actions:
| | • | | a transformation of the company into a form other than a publicly held stock corporation under the Chilean Companies Act, a merger or split-up of the company; |
| | • | | an amendment to the term of duration or early dissolution of the company; |
| | • | | a change in the company’s domicile; |
| | • | | a decrease of corporate capital; |
| | • | | an approval of capital contributions in kind and non-monetary assessments; |
| | • | | a modification of the authority reserved to shareholders or limitations on the Board of Directors; |
| | • | �� | a reduction in the number of members of the Board of Directors; |
| | • | | a disposition of 50% or more of the assets of the company, whether it includes disposition of liabilities or not, as well as the approval or the amendment of the business plan which contemplates the disposition of assets in an amount greater that such percentage; |
| | • | | the disposition of 50% or more of the assets of a subsidiary, as long as such subsidiary represents at least 20% of the assets of the corporation, as well as any disposition of its shares that results in the parent company losing its position as controller; |
| | • | | the form of distributing corporate benefits; |
| | • | | issue of guarantees for third-party liabilities which exceed 50% of the assets, except when the third party is a subsidiary of the company, in which case approval of the Board of Directors is deemed sufficient; |
| | • | | the purchase of the company’s own shares; |
| | • | | other actions established by the by-laws or the laws; |
| | • | | certain remedies for the nullification of the company’s by-laws; |
| | • | | inclusion in the by-laws of the right to purchase shares from minority shareholders, when the controlling shareholders reaches 95% of the company’s shares by means of a tender offer for all of the company’s shares, where at least 15% of the shares have been acquired from unrelated shareholders; and |
| | • | | approval or ratification of acts or contracts with related parties. |
Regardless of the quorum present, the vote required for any of the actions above is at least two-thirds of the outstanding shares with voting rights.
By-law amendments for the creation of a new class of shares, or an amendment to or an elimination of those classes of shares that already exist, must be approved by at least two-thirds of the outstanding shares of the affected series.
Chilean law does not require a publicly held stock corporation to provide its shareholders the same level and type of information required by the U.S. securities laws regarding the solicitation of proxies. However, shareholders are entitled to examine the financial statements and corporate books of a publicly held stock corporation within the 15-day period before its scheduled OSM. Under Chilean law, a notice of a shareholders meeting listing matters to be addressed at the meeting must be mailed at least 15 days prior to
164
the date of such meeting, and, an indication of the way complete copies of the documents that support the matters submitted for voting can be obtained, which must also be made available to shareholders on our website. In the case of an OSM, our annual report of activities, which includes audited financial statements, must also be made available to shareholders and published on our website at: www.enersis.cl.
The Chilean Companies Act provides that, upon the request by the Directors’ Committee or by shareholders representing at least 10% of the issued shares with voting rights, a Chilean company’s annual report must include, in addition to the materials provided by the Board of Directors to shareholders, such shareholders’ comments and proposals in relation to the company’s affairs. In accordance with Article 136 of the Chilean Companies Regulation (“Reglamento de Sociedades Anónimas”), the shareholder(s) holding or representing 10% or more of the shares issued with voting rights, may:
| | • | | make comments and proposals relating to the progress of the corporate businesses in the corresponding year, no shareholder being able to make individually or jointly more than one presentation. These observations should be presented in writing to the company concisely, responsibly and respectfully, and the respective shareholder(s) should state their willingness for these to be included as an appendix to the annual report. The board shall include in an appendix to the annual report of the year a faithful summary of the pertinent comments and proposals the interested parties had made, provided they are presented during the year or within 30-days after its ending; or |
| | • | | make comments and proposals on matters that the board submits for the knowledge or voting of the shareholders. The board shall include a faithful summary of those comments and proposals in all information it sends to shareholders, provided the shareholders’ proposal is received at the offices of the company at least 10-days prior to the date of dispatch of the information by the company. The shareholders should present their comments and proposals to the company, expressing their willingness for these to be included in the appendix to the respective annual report or in information sent to shareholders, as the case may be. The observations referred to in this Article may be made separately by each shareholder holding 10% or more of the shares issued with voting rights or shareholders who together hold that percentage, who should act as one. |
Similarly, the Chilean Companies Act provides that whenever the Board of Directors of a publicly held stock corporation convenes an OSM and solicits proxies for the meeting, or circulates information supporting its decisions or other similar material, it is obligated to include the pertinent comments and proposals that may have been made by the Directors’ Committee or by shareholders owning 10% or more of the shares with voting rights who request that such comments and proposals be so included.
Only shareholders registered as such with us, as of midnight on the fifth business day prior to the date of a meeting, are entitled to attend and vote their shares. A shareholder may appoint another individual, who does not need to be a shareholder, as his proxy to attend the meeting and vote on his behalf. Proxies for such representation shall be given for all the shares held by the owner. The proxy may contain specific instructions to approve, reject, or abstain with respect to any of the matters submitted for voting at the meeting and which were included in the notice. Every shareholder entitled to attend and vote at a shareholders’ meeting shall have one vote for every share subscribed.
There are no limitations imposed by Chilean law or our by-laws on the right of nonresidents or foreigners to hold or vote shares of common stock. However, the registered holder of the shares of common stock represented by ADSs, and evidenced by outstanding ADSs, is the custodian of the Depositary, currently Banco Santander-Chile, or any successor thereto. Accordingly, holders of ADSs are not entitled to receive notice of meetings of shareholders directly or to vote the underlying shares of common stock represented by ADS directly. The Deposit Agreement contains provisions pursuant to which the Depositary has agreed to solicit instructions from registered holders of ADSs as to the exercise of the voting rights pertaining to the shares of common stock represented by the ADSs. Subject to compliance with the requirements of the Deposit Agreement and receipt of such instructions, the Depositary has agreed to endeavor, insofar as practicable and permitted under Chilean law and the provisions of the by-laws, to vote or cause to be voted (or grant a discretionary proxy to the Chairman of the Board of Directors or to a person designated by the Chairman of the Board of Directors to vote) the shares of common stock represented by the ADSs in accordance with any such instruction. The Depositary shall not itself exercise any voting discretion over any shares of common stock underlying ADSs. If no voting instructions are received by the Depositary from a holder of ADSs with respect to the shares of common stock represented by the ADSs, on or before the date established by the Depositary for such purpose, the shares of common stock represented by the ADS, may be voted in the manner directed by the Chairman of the Board, or by a person designated by the Chairman of the Board, subject to limitations set forth in the Deposit Agreement.
Dividends and Liquidation Rights
According to the Chilean Companies Act, unless otherwise decided by unanimous vote of its issued shares eligible to vote, all companies must distribute a cash dividend in an amount equal to at least 30% of their consolidated net income, before amortization and negative goodwill for each year (calculated according to the local accounting rules applicable to us when preparing financial statements to be submitted to the SVS), unless and except to the extent we have carried forward losses. The law provides that the Board of Directors must agree to the dividend policy and inform such policy to the shareholders at the OSM.
165
Any dividend in excess of 30% of net income may be paid, at the election of the shareholder, in cash, or in our shares, or in shares of publicly held corporations owned by us. Shareholders who do not expressly elect to receive a dividend other than in cash are legally presumed to have decided to receive the dividend in cash.
Dividends which are declared but not paid within the appropriate time period set forth in the Chilean Companies Act (as to minimum dividends, 30-days after declaration; as to additional dividends, the date set for payment at the time of declaration) are adjusted to reflect the change in the value of UF, from the date set for payment to the date such dividends are actually paid. Such dividends also accrue interest at the then-prevailing rate for UF-denominated deposits during such period. The right to receive a dividend lapses if it is not claimed within five years from the date such dividend is payable. Payments not collected in such period are transferred to the volunteer Fire Department.
In the event of our liquidation, the shareholders would participate in the assets available in proportion to the number of paid-in shares held by them, after payment to all creditors.
Approval of Financial Statements
The Board of Directors is required to submit our consolidated financial statements to the shareholders annually for their approval. If the shareholders by a vote of a majority of shares present (in person or by proxy) at the shareholders’ meeting reject the financial statements, the Board of Directors must submit new financial statements no later than 60-days from the date of such meeting. If the shareholders reject the new financial statements, the entire Board of Directors is deemed removed from office and a new board is elected at the same meeting. Directors who individually approved such financial statements are disqualified for reelection for the following period. Our shareholders have never rejected the financial statements presented by the Board of Directors.
Change of Control
The Capital Markets Law establishes a comprehensive regulation related to tender offers. The law defines a tender offer as the offer to purchase shares of companies which publicly offer their shares or securities convertibles into shares and which offer is made to shareholders to purchase their shares under conditions which allow the bidder to reach a certain percentage of ownership of the company within a fixed period of time. These provisions apply to both voluntary and hostile tender offers.
Acquisition of Shares
No provision in our by-laws discriminates against any existing or prospective holder of shares as a result of such shareholder owning a substantial number of shares. However, no person may directly or indirectly own more than 65% of the outstanding shares of our stock. The foregoing restriction does not apply to the depositary as record owner of shares represented by ADRs, but it does apply to each beneficial ADS holder. Additionally, our by-laws prohibit any shareholder from exercising voting power with respect to more than 65% of the common stock owned by such shareholder or on behalf of others representing more than 65% of the outstanding issued shares with voting rights.
Right of Dissenting Shareholders to Tender Their Shares
The Chilean Companies Act provides that upon the adoption of any of the resolutions enumerated below at a meeting of shareholders, dissenting shareholders acquire the right to withdraw from the company and to compel the company to repurchase their shares, subject to the fulfillment of certain terms and conditions. In order to exercise such withdrawal rights, holders of ADRs must first withdraw the shares represented by their ADRs pursuant to the terms of the deposit agreement.
“Dissenting” shareholders are defined as those who at a shareholders’ meeting vote against a resolution that results in the withdrawal right, or who if absent from such meeting, state in writing their opposition to the respective resolution, within the 30-days following the shareholders’ meeting. Shareholders present or represented at the meeting and who abstain in exercising their voting rights shall not be considered as dissenting. The right to withdraw should be exercised for all the shares that the dissenting shareholder had registered in their name on the date on which the right is determined to participate in the meeting at which the resolution is adopted that motivates the withdrawal and which remains on the date on which their intention to withdraw is communicated to the company. The price paid to a dissenting shareholder of a publicly held stock corporation whose shares are quoted and actively traded on one of the Chilean stock exchanges is the weighted average of the sales prices for the shares as reported on the Chilean stock exchanges on which the shares are quoted for the two-month period between the ninetieth and the thirtieth day before the shareholders’ meeting giving rise to the withdrawal right. If, because of the volume, frequency, number and diversity of the
166
buyers and sellers, the SVS determines that the shares are not actively traded on a stock exchange, the price paid to the dissenting shareholder shall be the book value. Book value for this purpose shall equal paid capital plus reserves and profits, less losses, divided by the total number of subscribed shares, whether entirely or partially paid. For the purpose of making this calculation, the last consolidated statements of financial position is used, as adjusted to reflect inflation up to the date of the shareholders’ meeting which gave rise to the withdrawal right.
Article 126 of the Chilean Companies Act Regulation establishes that in cases where the right to withdraw arises, the company shall be obliged to inform the shareholders of this situation, the value per share that will be paid to shareholders exercising their right to withdraw and the term for exercising it. Such information should be given to shareholders at the same meeting at which the resolutions are adopted giving rise to the right of withdrawal, prior to its voting. A special communication should be given to the shareholders with rights, within two days following the date on which the rights to withdraw are born. In the case of publicly held companies, such information shall be communicated by a prominent notice in a newspaper with a wide national circulation and on its website, plus a written communication addressed to the shareholders with rights at the address they have registered with the company. The notice of the shareholders meeting that should pronounce on a matter that could originate withdrawal rights should mention this circumstance.
The resolutions that result in a shareholder’s right to withdraw include, among others, the following:
| | • | | the transformation of the company into an entity which is not a publicly held stock corporation governed by Chilean Companies Act; |
| | • | | the merger of the company with another company; |
| | • | | disposition of 50% or more of the assets of the company, whether it includes disposition of liabilities or not, as well as the approval or the amendment of the business plan which contemplates the disposition of assets in an amount greater than such percentage; |
| | • | | the disposition of 50% or more of the assets of a subsidiary, as long as such subsidiary represents at least 20% of the assets of the company, as well as any disposition of its shares that results in the parent company losing its position of controller; |
| | • | | issue of guarantees for third parties’ liabilities which exceed 50% of the assets (if the third party is a subsidiary of the company, the approval of the Board of Directors is sufficient); |
| | • | | the creation of preferential rights for a class of shares or an amendment to the existing ones. In this case the right to withdraw only accrues to the dissenting shareholders of the class or classes of shares adversely affected; |
| | • | | certain remedies for the nullification of the corporate by-laws; and |
| | • | | such other causes as may be established by the law or by the company’s by-laws. |
Investments by AFPs
The Pension Funds’ System Law permits AFPs to invest their funds in companies that are subject to Title XII and, subject to greater restrictions than other companies. The determination of which stocks may be purchased by AFPs is made by the Risk Classification Committee. The Risk Classification Committee establishes investment guidelines and is empowered to approve or disapprove those companies that are eligible for AFP investments. Except for the period from March 2003 to March 2004, we have been a Title XII company since 1985 and we are approved by the Risk Classification Committee.
Title XII companies are required to have by-laws that: limit the ownership of any shareholder to a specified maximum percentage, require that certain actions be taken only at a meeting of the shareholders, and give the shareholders the right to approve certain investment and financing policies.
Registrations and Transfers
Shares issued by us are registered with an administrative agent namedDCV Registros S.A. This entity is also responsible for our shareholders registry. In case of jointly-owned shares, an attorney-in-fact must be appointed to represent the joint owners in dealing with us.
167
None.
The Central Bank of Chile is responsible for, among other things, monetary policies and exchange controls in Chile. Currently applicable foreign exchange regulations are set forth in the Compendium of Foreign Exchange Regulations (the “Compendium”) approved by the Central Bank of Chile in 2002. Appropriate registration of a foreign investment in Chile permits the investor access to the Formal Exchange Market. Foreign investments can be registered with the Foreign Investment Committee under D.L. 600 of 1974 or can be registered with the Central Bank of Chile under the Central Bank Act, Law 18840 of October 1989.
The following is a summary of certain provisions of Chapter XIV that are applicable to all existing shareholders (and ADS holders). This summary does not purport to be complete and is qualified in its entirety by reference to Chapter XIV. Chapter XIV regulates the following type of investments: credits, deposits, investments and equity contributions. A Chapter XIV investor may at any time repatriate an investment made in us upon sale of our shares, and the profits derived therefrom, with no monetary ceiling, subject to the then effective regulations, which must be reported to the Central Bank of Chile.
Except for compliance with tax regulations and some reporting requirements, currently there are no rules in Chile affecting repatriation rights, except that the remittance of foreign currency must be made through a Formal Exchange Market entity. However, the Central Bank of Chile has the authority to change such rules and impose exchange controls.
| b) | The Compendium and International Bond Issuances |
Chilean issuers may offer bonds issued by the Central Bank of Chile internationally under Chapter XIV, as amended, of the Compendium.
Chilean Tax Considerations
The following discussion summarizes material Chilean income and withholding tax consequences to foreign holders arising from the ownership and disposition of shares and ADSs and, to the extent any are issued, rights and ADS rights. The summary that follows does not purport to be a comprehensive description of all of the tax considerations that may be relevant to a decision to purchase, own or dispose of shares or ADSs and rights or ADS rights, if any, and does not purport to deal with the tax consequences applicable to all categories of investors, some of which may be subject to special rules. Holders of shares and ADSs are advised to consult their own tax advisors concerning the Chilean and other tax consequences of the ownership of shares or ADSs.
The summary that follows is based on Chilean law, in effect on the date hereof, and is subject to any changes in these or other laws occurring after such date, possibly with retroactive effect. Under Chilean law, provisions contained in statutes such as tax rates applicable to foreign investors, the computation of taxable income for Chilean purposes and the manner in which Chilean taxes are imposed and collected may be amended only by another law. In addition, the Chilean tax authorities enact rulings and regulations of either general or specific application and interpret the provisions of the Chilean Income Tax Law. Chilean tax may not be assessed retroactively against taxpayers who act in good faith relying on such rulings, regulations and interpretations, but Chilean tax authorities may change their rulings, regulations and interpretations in the future. The discussion that follows is also based, in part, on representations of the depositary, and assumes that each obligation in the Deposit Agreement and any related agreements will be performed in accordance with its terms. As of this date, there is currently no applicable income tax treaty in effect between the United States and Chile. However, in 2010 the United States and Chile signed an income tax treaty that will enter into force once the treaty is ratified by both countries. There can be no assurance that the treaty will be ratified by either country. The following summary assumes that there is no applicable income tax treaty in effect between the United States and Chile.
As used in this Report, the term “foreign holder” means either:
| | • | | in the case of an individual holder, a person who is not a resident of Chile; for purposes of Chilean taxation, an individual is resident of Chile if he or she has resided in Chile for more than six months in one calendar year, or a total of more than six months in two consecutive fiscal years; or |
| | • | | in the case of a legal entity holder, an entity that is not organized under the laws of Chile, unless the shares or ADSs are assigned to a branch, agent, representative or permanent establishment of such entity in Chile. |
168
Taxation of Shares and ADSs
Taxation of Cash Dividends and Property Distributions
General Rule: The following taxation of cash dividends and property distributions applies until 2016. Cash dividends paid with respect to the shares or ADSs held by a foreign holder will be subject to Chilean withholding tax, which is withheld and paid by the company. As described in the example below, the amount of the Chilean withholding tax is determined by applying a 35% rate to a “grossed-up” distribution amount (such amount equal to the sum of the actual distribution amount and the correlative Chilean corporate income tax paid by the issuer), and then subtracting as a credit such Chilean corporate income tax paid by the issuer. From 2004 through 2010, the Chilean corporate income tax rate was 17% and from 2011 until 2014, the rate was 20%.
In September 2014, a tax reform was enacted (Law 20,780) which, among other topics, progressively increased the corporate income tax (“CIT”). The CIT rate will be adjusted as follows: in 2014 it increased from 20% to 21%; in 2015 it increased to 22.5%; in 2016 it increases to 24%; in 2017, depending on which of the two new alternative systems enacted as part of the 2014 tax reform (discussed below) is chosen, the rate increases to 25% for companies electing the accrued income basis and 25.5% for companies electing the cash basis for shareholders. As of 2018, the CIT rate will remain at 25% for companies that elected the accrued income basis and will increase to 27% for companies that elected the cash basis for shareholders.
The example below illustrates the effective Chilean withholding tax burden on a cash dividend received by a foreign holder, assuming a Chilean withholding tax base rate of 35%, an effective Chilean corporate income tax rate of 22.5 % (CIT rate for 2015) and a distribution of 50% of the net income of the company distributable after payment of the Chilean corporate income tax:
| | | | | | |
Line | | Concept and calculation assumptions | | Amount | |
| 1 | | Company taxable income (based on Line 1 = 100) | | | 100.0 | |
| 2 | | Chilean corporate income tax : 22.5% x Line 1 | | | 22.5 | |
| 3 | | Net distributable income: Line 1 — Line 2 | | | 77.5 | |
| 4 | | Dividend distributed (50% of net distributable income): 50% of Line 3 | | | 38.75 | |
| 5 | | Withholding tax: (35% of (the sum of Line 4 and 50% of Line 2)) | | | (17.5) | |
| 6 | | Credit for 50% of Chilean corporate income tax : 50% of Line 2 | | | 11.25 | |
| 7 | | Net withholding tax : Line 5 + Line 6 | | | (6.25) | |
| 8 | | Net dividend received: Line 4 - Line 7 | | | 32.5 | |
| 9 | | Effective dividend withholding rate : Line 7 / Line 4 | | | 16.13% | |
In general, the effective Chilean dividend withholding tax rate, after giving effect to the credit for the Chilean corporate income tax paid by the company, can be computed using the following formula:
| | | | | | |
| Effective Dividend | | = | | (Withholding tax rate) - (Chilean corporate income tax rate) | | |
| Withholding Tax Rate | | | | 1 - (Chilean corporate income tax rate) | | |
Using the rates prevailing until 2015, the Effective Dividend Withholding Rate is
(35%-22.5%) / (100%-22.5%) = 16.13%
Dividends are generally assumed to have been paid out of our oldest retained profits for purposes of determining the level of Chilean corporate income tax that was paid by us. For information as to our retained earnings for tax purposes and the tax credit available on the distribution of such retained earnings, see Note 13 of the Notes to our consolidated financial statements.
Under Chilean Income Tax Law, dividend distributions made in property are subject to the same Chilean tax rules as cash dividends. Stock dividends that represent free shares distributed to foreign shareholders as a consequence of a capitalization made on the same corporation are not subject to Chilean taxation.
169
Exceptions: Despite the aforementioned general rule, there are special circumstances under which a different tax treatment would apply depending on the source of the income or due to special circumstances existing at the date of the dividend distribution. The most common special cases are briefly described below:
1) Circumstances where there is no CIT credit against the Chilean withholding tax: These cases are when: (i) profits paid as dividends (following the seniority rule indicated above) exceed a company’s taxable income (such dividend distributions in excess of a company’s taxable income determined as of December 31 of the distribution’s year will be subject to the Chilean withholding tax rate of 35%, without the CIT credit; in relation to the provisional withholding rule applicable on the date of the dividend payment, please see number 3 below); or (ii) the income was not subject to CIT due to an exemption of the Chilean corporate income tax, in which case the foreign holder will be also subject to the Chilean withholding tax rate of 35% without the CIT credit.
2) Circumstances where dividends have been attributed to income exempted from all the Chilean income taxes: In these cases, dividends distributed by a company to the foreign holder will not be subject to Chilean withholding tax. Income exempted from Chilean income tax is expressly listed in the Chilean Income Tax Law.
3) Circumstances where dividends are subject to a provisional withholding tax: In the event that on the date of the dividend distribution there are no earnings on which income tax has been paid and there are no tax-exempt earnings, a 35% Chilean withholding tax with a provisional 22.5% Chilean CIT credit is applicable. This provisional 22.5% Chilean corporate income tax credit must be confirmed with the information of a company’s taxable income as of December 31 of the year in which the dividend was paid. A company can agree with the foreign holders to withhold a higher amount in order to avoid under withholding of the Chilean withholding tax.
4) Circumstances when it is possible to use certain credits in Chile against income taxes paid abroad, or “foreign tax credit”: This occurs when dividends distributed by the Chilean company have income generated by companies domiciled in third countries as their source. If that income was subject to withholding tax or corporate income tax in those third countries, such income will have a credit or “foreign tax credit” against corresponding Chilean taxes, which can be proportionally transferred to the shareholders of a Chilean company.
New System in effect starting in 2017
The tax reform released in September 2014 created two alternative mechanisms of shareholder-level income taxation beginning on January 1, 2017: a) accrued income basis (known as attributed-income system in Chile) shareholder taxation and b) cash basis (known as partially-integrated system in Chile and most similar to the current system) shareholder taxation. On February 8, 2016, Law 20,899 was enacted, which made adjustments to the tax reform released in September 2014. Among other adjustments, Law 20,899 established that taxpayers whose owners (partners or shareholders) are exclusively individual persons may choose to apply either of the aforementioned systems. The selection should be made before the end of 2016. Once the election is made, it will remain in effect for five years. If no regime is chosen by a taxpayer whose owners are individual persons, the law states that the default system will be the accrued income basis. For other taxpayers, whose owners are not exclusively individual persons, the cash basis system (partially-integrated system) must be used.
In addition, the aforementioned Law 20,899 expanded the 100% CIT credit against the Chilean shareholder tax to taxpayers who are residents in countries with which Chile has an effective or signed tax treaty to avoid international double taxation prior to January 1, 2017, even if not in force as of such date. This is currently the status of the treaty signed between Chile and United States. This temporary rule will be in force from January 1, 2017 through December 31, 2019.
a) Accrued income basis
Shareholders would be taxed in Chile on income attributed to them as of the end of the tax year in which the income is generated, eliminating the taxable profits fund ledger (“FUT” in its Spanish acronym). These profits would be taxed at the shareholder level whether or not they are distributed. The underlying CIT paid at the entity level may be used by shareholders as a credit to reduce the Chilean shareholder tax. Therefore, the total company and shareholder Chilean income tax burden remains at 35%. Future distributions are not subject to taxation.
Taxpayers will be taxed on the income of companies in which they have an interest in the year such income is recognized, regardless of whether actual distributions are made, with the corresponding credit.
170
Taxation in two stages
| | | | |
• | | Company: | | 25% of accrued profits (using the maximum CIT applicable as of 2018). |
| | |
• | | Shareholder: | | 35% of accrued profits (whether or not distributions are received, with 100% credit of the CIT paid, resulting in an effective tax rate to the shareholder of 10%). |
Total Tax Burden: 35%
Progressive CIT tax rate increase: 21% in 2014, 22.5% in 2015, 24% in 2016 and 25% as of 2017.
Advantages to accrued income tax basis:
| | • | | CIT Rate of 25% vs. 27% for the cash basis. |
| | • | | Shareholders are granted 100% credit of taxes paid by a company. |
Disadvantages to accrued income tax basis:
| | • | | Shareholders are taxed on undistributed profits. |
| | • | | Shareholders of record must pay tax by December 31st (regardless of having received dividends). |
| | • | | Complex management for companies. |
b) Cash basis
A company pays CIT on its annual result. Foreign and local individual shareholders will only pay in Chile the relevant tax on effective profit distributions and will be allowed to use the tax paid by the distributing company as credit, with certain limitations. Only 65% of the CIT is creditable against the 35% shareholder-level tax (as opposed to 100% under the current FUT regime and under the accrued income basis). However, if there is an effective or signed tax treaty with Chile before January 1, 2017 (even if not yet in effect), the CIT is fully creditable against the 35% shareholder tax.
Taxation in two stages
| | | | |
• | | Company: | | 27% of accrued profits (using the maximum CIT applicable from 2018 and forward). |
| | |
• | | Shareholder: | | 35% of cash disbursement (65% of CIT tax is creditable against the shareholder level tax, resulting in an effective tax rate to the shareholder of 17.5%. However, if the shareholder is a resident of a country with an effective or signed tax treaty with Chile before January 1, 2017 (even if not yet in effect), CIT tax is fully creditable, resulting in an effective tax rate to the shareholder of 8%). |
Total Tax Burden: 44.45% (35% for residents of countries with tax treaties)
Advantages to cash basis:
| | • | | Shareholders are only taxed on actual distributions. |
| | • | | Shareholders must pay taxes only if they hold the share on the dividend distribution date. |
Disadvantages to cash basis:
| | • | | CIT Rate of 27% versus 25% for the accrued income basis. |
| | • | | Only shareholders residing in countries with an effective or signed tax treaty with Chile before January 1, 2017 (even if not yet in effect), are granted full CIT credit (others 65%). |
Taxation on sale or exchange of ADSs, outside of Chile
Gains obtained by a foreign holder from the sale or exchange of ADSs outside Chile will not be subject to Chilean taxation.
Taxation on sale or exchange of Shares
The Chilean Income Tax Law includes a tax exemption on capital gains arising from the sale of shares of listed companies traded in the stock markets. Although there are certain restrictions, in general terms, the amendment provides that in order to qualify
171
for the capital gain exemption: (i) the shares must be of a publicly held stock corporation with a certain minimum level of trading on a stock exchange; (ii) the sale must be carried out in a Chilean stock exchange, or in a tender offer subject to Chapter XXV of the Chilean Securities Market Law; (iii) the shares which are being sold must have been acquired on a Chilean stock exchange, or in a tender offer subject to Chapter XXV of the Chilean Securities Market Law, or in an initial public offering (due to the creation of a company or to a capital increase), or due to the exchange of convertible bonds; and (iv) the shares must have been acquired after April 19, 2001.
If the shares do not qualify for the above exemption, capital gains on their sale or exchange of shares (as distinguished from sales or exchanges of ADSs representing such shares of common stock) could be subject to two alternative tax regimes: (a) the general tax regime, with a 22.5% Chilean corporate income tax and a 35% Chilean withholding tax, the former being creditable against the latter; or (b) a 22.5% Chilean corporate income tax as sole tax regime, when all the following circumstances are met: (i) the sale is made between unrelated parties, (ii) the sale of shares is not a recurrent or habitual activity for the seller and (iii) at least one year has elapsed between the acquisition and the sale of the shares.
The date of acquisition of the ADSs is considered to be the date of acquisition of the shares for which the ADSs are exchanged.
Taxation of Rights and ADS Rights
For Chilean tax purposes and to the extent we issue any rights or ADS rights, the receipt of rights or ADS rights by a foreign holder of shares or ADSs pursuant to a rights offering is a nontaxable event. In addition, there are no Chilean income tax consequences to foreign holders upon the exercise or the lapse of the rights or the ADS rights.
Any gain on the sale, exchange or transfer of any ADS rights by a foreign holder is not subject to taxes in Chile.
Any gain on the sale, exchange or transfer of the rights by a foreign holder is subject to a 35% Chilean withholding tax.
Currently, there are no rights that are outstanding.
Other Chilean Taxes
There is no gift, inheritance or succession tax applicable to the ownership, transfer or disposition of ADSs by foreign holders, but such taxes will generally apply to the transfer at death or by gift of the shares by a foreign holder. There is no Chilean stamp, issue, registration or similar taxes or duties payable by holders of shares or ADSs.
Material U.S. Income Tax Considerations
This discussion is based on the Internal Revenue Code of 1986, as amended (the “Code”), administrative pronouncements, judicial decisions and final, temporary and proposed Treasury regulations, all as of the date hereof. These authorities are subject to change, possibly with retroactive effect. This discussion assumes that the depositary’s activities are clearly and appropriately defined so as to ensure that the tax treatment of ADSs will be identical to the tax treatment of the underlying shares.
The following are the material U.S. federal income tax consequences to U.S. Holders (as defined herein) of receiving, owning, and disposing of shares or ADSs, but it does not purport to be a comprehensive description of all of the tax considerations that may be relevant to a particular person’s decision to hold such securities and is based on the assumption stated above under “Chilean Tax Considerations” that there is no applicable income tax treaty in effect between the United States and Chile. The discussion applies only if the beneficial owner holds shares or ADSs as capital assets for U.S. federal income tax purposes and it does not describe all of the tax consequences that may be relevant in light of the beneficial owner’s particular circumstances. For instance, it does not describe all the tax consequences that may be relevant to:
| | • | | certain financial institutions; |
| | • | | dealers and traders in securities who use a mark-to-market method of tax accounting; |
| | • | | persons holding shares or ADSs as part of a “straddle” integrated transaction or similar transaction; |
| | • | | persons whose functional currency for U.S. federal income tax purposes is not the U.S. dollar; |
| | • | | partnerships or other entities classified as partnerships for U.S. federal income tax purposes; |
| | • | | persons liable for the alternative minimum tax; |
172
| | • | | tax-exempt organizations; |
| | • | | persons holding shares or ADSs that own or are deemed to own ten percent or more of our stock; or |
| | • | | persons holding shares or ADSs in connection with a trade or business conducted outside of the United States. |
If an entity classified as a partnership for U.S. federal income tax purposes holds shares or ADSs, the U.S. federal income tax treatment of a partner will generally depend on the status of the partner and upon the activities of the partnership. Partnerships holding shares or ADSs and partners in such partnerships should consult their tax advisors as to the particular U.S. federal income tax consequences of holding and disposing of the shares or ADSs.
You will be a “U.S. Holder” for purposes of this discussion if you become a beneficial owner of our shares or ADSs and if you are, for U.S. federal income tax purposes:
| | • | | a citizen or individual resident of the United States; or |
| | • | | a corporation, or other entity taxable as a corporation, created or organized in or under the laws of the United States or any political subdivision thereof; or |
| | • | | an estate, the income of which is subject to U.S. federal income taxation regardless of its source; or |
| | • | | a trust (i) that validly elects to be treated as a U.S. person for U.S. federal income tax purposes or (ii) if (A) a court within the United States is able to exercise primary supervision over the administration of the trust and (B) one or more U.S. persons have the authority to control all substantial decisions of the trust. |
In general, if a beneficial owner owns ADSs, such owner will be treated as the owner of the shares represented by those ADSs for U.S. federal income tax purposes. Accordingly, no gain or loss will be recognized if a beneficial owner exchanges ADSs for the underlying shares represented by those ADSs.
The U.S. Treasury has expressed concerns that parties to whom ADSs are released before shares are delivered to the depositary (pre-release) or intermediaries in the chain of ownership between beneficial owners and the issuer of the security underlying the ADSs may be taking actions that are inconsistent with the claiming of foreign tax credits for beneficial owners of depositary shares. Such actions would also be inconsistent with the claiming of the reduced tax rate, described below, applicable to dividends received by certain non-corporate beneficial owners. Accordingly, the analysis of the creditability of Chilean taxes, and the availability of the reduced tax rate for dividends received by certain non-corporate holders, each described below, could be affected by actions taken by such parties or intermediaries.
This discussion assumes that we will not be a passive foreign investment company, as described below.
Beneficial owners should consult their tax advisors with respect to their particular tax consequences of owning or disposing of shares or ADSs, including the applicability and effect of state, local, non-U.S. and other tax laws and the possibility of changes in tax laws.
Taxation of Distributions
The following discussion is based on the current regime for taxation of cash dividends and distributions applicable in Chile until 2016. For 2017 and later, the U.S. federal income tax treatment will depend on which of the two regimes we elect to adopt. See “— Chilean Tax Considerations — Taxation of shares and ADSs — Taxation of Cash Dividends and Property Distributions” above.
Distributions paid on shares or ADSs other than certain pro rata distributions of shares of common stock will be treated as dividends taxable as ordinary income to the extent paid out of our current or accumulated earnings and profits (as determined under U.S. federal income tax principles). Because we do not maintain calculations of our earnings and profits under U.S. federal income tax principles, it is expected that distributions generally will be reported as dividends.
If a beneficial owner is a U.S. Holder, subject to applicable limitations and the discussion above regarding concerns expressed by the U.S. Treasury, dividends paid by qualified foreign corporations to the beneficial owner that is not a corporation are taxable at a maximum rate of 20%. A foreign company is treated as a qualified foreign corporation with respect to dividends paid on stock that is readily tradable on an established securities market in the United States, such as the New York Stock Exchange where our ADSs are traded. Beneficial owners should consult their tax advisors to determine whether the favorable rate will apply to dividends they receive and whether they are subject to any special rules that limit their ability to be taxed at this favorable rate.
173
The amount of a dividend will include the net amount withheld by us in respect of Chilean withholding taxes on the distribution. The amount of the dividend will be treated as foreign-source dividend income to a beneficial owner and will not be eligible for the dividends-received deduction generally allowed to U.S. corporations under the Code. Dividends will be included in a beneficial owner’s income on the date of the beneficial owner’s, or in the case of ADSs, the Depositary’s receipt of the dividend. The amount of any dividend paid in Chilean pesos will be a U.S. dollar amount calculated by reference to the exchange rate for converting Chilean pesos into U.S. dollars in effect on the date of such receipt regardless of whether the payment is in fact converted into U.S. dollars. If the dividend is converted into U.S. dollars on the date of receipt, a beneficial owner generally should not be required to recognize foreign currency gain or loss in respect of the dividend income. A beneficial owner may have foreign currency gain or loss if the dividend is converted into U.S. dollars on a date after the date of receipt.
Subject to applicable limitations that may vary depending upon a beneficial owner’s circumstances and subject to the discussion above regarding concerns expressed by the U.S. Treasury, the net amount of Chilean withholding tax (after reduction for the credit for Chilean corporate income tax, as discussed above under “— Chilean Tax Considerations — Taxation of Shares and ADSs — Taxation of Cash Dividends and Property Distributions” above) withheld from dividends on shares or ADSs will be creditable against a beneficial owner’s U.S. federal income tax liability. The rules governing foreign tax credits are complex and, therefore, a beneficial owner should consult the beneficial owner’s tax advisor regarding the availability of foreign tax credits in the beneficial owner’s particular circumstances. Instead of claiming a credit, a beneficial owner may, at the beneficial owner’s election, deduct such Chilean taxes in computing the beneficial owner’s taxable income, subject to generally applicable limitations under U.S. law. An election to deduct foreign taxes instead of claiming foreign tax credits applies to all taxes paid or accrued in the taxable year to foreign countries and possessions of the United States.
Sale or Other Disposition of Shares or ADSs
If a beneficial owner is a U.S. Holder, for U.S. federal income tax purposes, the gain or loss a beneficial owner realizes on the sale or other disposition of shares or ADSs will be a capital gain or loss, and will be a long-term capital gain or loss if the beneficial holder has held the shares or ADSs for more than one year. The amount of a beneficial owner’s gain or loss will equal the difference between the beneficial owner’s tax basis in the shares or ADSs disposed of and the amount realized on the disposition, in each case as determined in U.S. dollars. Such gain or loss will generally be U.S.-source gain or loss for foreign tax credit purposes. In addition, certain limitations exist on the deductibility of capital losses by both corporate and individual taxpayers.
In certain circumstances, Chilean taxes may be imposed upon the sale of shares. See “— Chilean Tax Considerations — Taxation of Shares and ADSs.” If a Chilean tax is imposed on the sale or disposition of shares, and a beneficial owner that is a U.S. Holder does not receive significant foreign source income from other sources, such beneficial owner may not be able to credit such Chilean tax against the beneficial owner’s U.S. federal income tax liability.
Passive Foreign Investment Company Rules
We believe that we will not be a “passive foreign investment company” (“PFIC”) for U.S. federal income tax purposes for our 2016 taxable year or for the foreseeable future. However, because PFIC status depends upon the composition of a company’s income and assets and the market value of its assets from time to time, and because it is unclear whether certain types of our income constitute passive income for PFIC purposes, there can be no assurance that we will not be considered a PFIC for any taxable year. If we were to become a PFIC for any taxable year during which a beneficial owner held shares or ADSs, certain adverse consequences could apply to the beneficial owner, including the imposition of higher amounts of tax than would otherwise apply, and additional filing requirements. Beneficial owners should consult their tax advisors regarding the consequences to them if we were a PFIC, as well as the availability and advisability of making any election that might mitigate the adverse consequences of PFIC status.
Information Reporting and Backup Withholding
Payments of dividends and sales proceeds that are made within the United States or through certain U.S.-related financial intermediaries generally are subject to information reporting and to backup withholding unless (i) the beneficial owner is an exempt recipient or (ii) in the case of backup withholding, the beneficial owner provides a correct taxpayer identification number and certifies that the beneficial owner is not subject to backup withholding.
The amount of any backup withholding from a payment to a beneficial owner will be allowed as a credit against the beneficial owner’s U.S. federal income tax liability and may entitle the beneficial owner to a refund, provided that the required information is furnished in a timely fashion to the Internal Revenue Service.
174
Medicare Contribution Tax
Legislation enacted in 2010 generally imposes a tax of 3.8% on the “net investment income” of certain individuals, trusts and estates. Among other items, net investment income generally includes gross income from dividends and net gain attributable to the disposition of certain property, like the shares or ADSs, less certain deductions. A beneficial owner should consult the beneficial owner’s tax advisor regarding the possible application of this legislation in the beneficial owner’s particular circumstances.
Beneficial owners should consult their tax advisors with respect to the particular consequences to them of receiving, owning or disposing of shares or ADSs.
| F. | Dividends and Paying Agents. |
Not applicable.
Not applicable.
We are subject to the information requirements of the Exchange Act, except that as a foreign issuer, we are not subject to the SEC proxy rules (other than general anti-fraud rules) or the short-swing profit disclosure rules of the Exchange Act. In accordance with these statutory requirements, we file or furnish reports and other information with the SEC. Reports and other information filed or furnished with the SEC may be inspected and copied at the public reference facilities maintained by the SEC at Room 1024, 100 F Street, N.E., Washington, D.C. 20549. Copies of such material may also be inspected at the offices of the New York Stock Exchange, at 11 Wall Street, New York, New York 10005, on which our ADSs are listed. In addition, the SEC maintains a website that contains electronically filed information, which can be accessed at http://www.sec.gov.
| I. | Subsidiary information. |
Not applicable.
| Item 11. | Quantitative and Qualitative Disclosures About Market Risk |
We are exposed to risks arising from changes in commodity prices, interest rates and foreign exchange rates that affect the generation and distribution business in the countries where we operate. Our Board of Directors approves risk management policies at all levels.
Commodity Price Risk
In our electricity generation business, we are exposed to market risks arising from the price volatility of electricity, natural gas, diesel oil, and coal. We seek to ensure our fuel supply by securing long-term contracts with our suppliers for periods that are expected to match the lifetime of our generation assets. As of December 31, 2015 and 2014, we did not hold contracts classified as derivative financial instruments or financial instruments related to natural gas.
In the countries where we operate using coal and diesel oil, the dispatch or bidding mechanism allows the thermal power plants to cover their operational costs. However, under certain circumstances, fuel price fluctuations might affect marginal costs. As of December 31, 2015 and 2014, we did not hold any contracts classified as either derivative financial instruments or financial instruments related either to coal or petroleum-based liquid fuels.
Additionally, through adequate commercial risk mitigation policies, and a hydro-thermal power plant mix, we seek to protect our operating income from electricity price volatility. As of December 31, 2015 and 2014 we did not hold electricity price-sensitive instruments.
We are continually analyzing ways to hedge commodity price risk, like transferring commodity price variations to the customers’ contract prices and/or permanently adjusting the commodity indexed price formulas for new Power Purchase Agreements (“PPAs”) according to our exposure and/or analyzing ways to mitigate risk through hydrological insurance in dry years. In the future we may use price-sensitive instruments.
175
Interest Rate and Foreign Currency Risk
The recorded values of our debt as of December 31, 2015, are detailed below, according to maturity. Total values do not include the effect of derivatives.
| | | | | | | | | | | | | | | | | | | | | | | | | | | | | | | | |
| | | Expected maturity date | |
For the year ended December 31, | | 2016 | | | 2017 | | | 2018 | | | 2019 | | | 2020 | | | Thereafter | | | Total | | | Fair
Value(2) | |
| | | (in millions of Ch$)(1) | |
Fixed Rate | | | | | | | | | | | | | | | | | | | | | | | | | | | | | | | | |
Ch$/UF | | | 0.06 | | | | — | | | | — | | | | — | | | | — | | | | — | | | | 0.06 | | | | 0.06 | |
Weighted average interest rate | | | 6.7% | | | | — | | | | — | | | | — | | | | — | | | | — | | | | 6.7% | | | | — | |
US$ | | | 200,507 | | | | 12,413 | | | | 15,499 | | | | 13,397 | | | | 23,248 | | | | 31,006 | | | | 296,069 | | | | 314,917 | |
Weighted average interest rate | | | 6.6% | | | | 2.8% | | | | 5.0% | | | | 5.6% | | | | 5.0% | | | | 2.4% | | | | 5.7% | | | | — | |
Other currencies(3) | | | 94,032 | | | | 65,649 | | | | 34,309 | | | | 53,084 | | | | 37,152 | | | | 296,933 | | | | 581,159 | | | | 599,493 | |
Weighted average interest rate | | | 6.9% | | | | 7.0% | | | | 5.6% | | | | 6.1% | | | | 6.5% | | | | 8.4% | | | | 7.5% | | | | — | |
| | | | | | | | | | | | | | | | | | | | | | | | | | | | | | | | |
Total fixed rate | | | 294,539 | | | | 78,061 | | | | 49,809 | | | | 66,482 | | | | 60,400 | | | | 327,938 | | | | 877,228 | | | | 914,410 | |
Weighted average interest rate | | | 6.7% | | | | 6.4% | | | | 5.4% | | | | 6.0% | | | | 5.9% | | | | 7.8% | | | | 6.9% | | | | — | |
Variable Rate | | | | | | | | | | | | | | | | | | | | | | | | | | | | | | | | |
Ch$/UF | | | 3,354 | | | | 3,547 | | | | 3,750 | | | | 3,966 | | | | 4,194 | | | | 6,748 | | | | 25,559 | | | | 29,494 | |
Weighted average interest rate | | | 10.2% | | | | 10.2% | | | | 10.2% | | | | 10.2% | | | | 10.2% | | | | 10.2% | | | | 10.2% | | | | — | |
US$ | | | 41,995 | | | | 18,154 | | | | 18,024 | | | | — | | | | — | | | | 810 | | | | 78,984 | | | | 78,984 | |
Weighted average interest rate | | | 2.6% | | | | 2.0% | | | | 2.0% | | | | — | | | | — | | | | 1.5% | | | | 2,3% | | | | — | |
Other currencies(3) | | | 227,250 | | | | 286,590 | | | | 252,238 | | | | 182,614 | | | | 76,134 | | | | 424,389 | | | | 1,449,214 | | | | 1,450,013 | |
Weighted average interest rate | | | 12.0% | | | | 12.6% | | | | 12.3% | | | | 11.8% | | | | 8.9% | | | | 9.2% | | | | 11.2% | | | | — | |
| | | | | | | | | | | | | | | | | | | | | | | | | | | | | | | | |
Total variable rate | | | 272,599 | | | | 308,291 | | | | 274,012 | | | | 186,580 | | | | 80,328 | | | | 431,947 | | | | 1,553,757 | | | | 1,558,490 | |
Weighted average interest rate | | | 10.5% | | | | 12.0% | | | | 11.6% | | | | 11.8% | | | | 9.0% | | | | 9.2% | | | | 10.7% | | | | — | |
| | | | | | | | | | | | | | | | | | | | | | | | | | | | | | | | |
Total | | | 567,138 | | | | 386,352 | | | | 323,821 | | | | 253,061 | | | | 140,728 | | | | 759,885 | | | | 2,430,985 | | | | 2,472,900 | |
| | | | | | | | | | | | | | | | | | | | | | | | | | | | | | | | |
| (1) | Calculated based on the Observed Exchange Rate as of December 31, 2015, which was Ch$ 710.16 per US$ 1.00. |
| (2) | As of December 31, 2015, fair value was calculated based on the discounted value of future cash flows expected to be paid (or received), considering current discount rates that reflect the different risks involved. |
| (3) | “Other currencies” include the Brazilian real, Colombian peso, Argentine peso and Peruvian Nuevo Sol. |
176
The recorded values of our debt as of December 31, 2014, are detailed below, according to maturity. Total values do not include the effect of derivatives.
| | | | | | | | | | | | | | | | | | | | | | | | | | | | | | | | |
| | | Expected maturity date | |
For the year ended December 31, | | 2015 | | | 2016 | | | 2017 | | | 2018 | | | 2019 | | | Thereafter | | | Total | | | Fair
Value(2) | |
| | | (in millions of Ch$)(1) | |
Fixed Rate | | | | | | | | | | | | | | | | | | | | | | | | | | | | | | | | |
Ch$/UF | | | 0 | | | | — | | | | — | | | | — | | | | — | | | | — | | | | 0 | | | | 0 | |
Weighted average interest rate | | | 6.7% | | | | — | | | | — | | | | — | | | | — | | | | — | | | | 6.7% | | | | — | |
US$ | | | 13,262 | | | | 171,881 | | | | 8,220 | | | | 14,287 | | | | 12,548 | | | | 54,110 | | | | 274,308 | | | | 307,274 | |
Weighted average interest rate | | | 5.0% | | | | 7.2% | | | | 4.9% | | | | 5.4% | | | | 5.9% | | | | 3.3% | | | | 6.1% | | | | — | |
Other currencies(3) | | | 46,632 | | | | 52,257 | | | | 52,745 | | | | 52,314 | | | | 55,154 | | | | 350,684 | | | | 609,788 | | | | 642,422 | |
Weighted average interest rate | | | 9.1% | | | | 10.0% | | | | 8.0% | | | | 7.6% | | | | 7.7% | | | | 8.3% | | | | 8.4% | | | | — | |
| | | | | | | | | | | | | | | | | | | | | | | | | | | | | | | | |
Total fixed rate | | | 59,894 | | | | 224,138 | | | | 60,965 | | | | 66,601 | | | | 67,703 | | | | 404,794 | | | | 884,095 | | | | 949,697 | |
Weighted average interest rate | | | 8.2% | | | | 7.9% | | | | 7.5% | | | | 7.1% | | | | 7.4% | | | | 7.7% | | | | 7.7% | | | | — | |
Variable Rate | | | | | | | | | | | | | | | | | | | | | | | | | | | | | | | | |
Ch$/UF | | | 3,047 | | | | 3,223 | | | | 3,408 | | | | 3,604 | | | | 3,811 | | | | 10,514 | | | | 27,607 | | | | 29,964 | |
Weighted average interest rate | | | 11.4% | | | | 11.4% | | | | 11.4% | | | | 11.4% | | | | 11.4% | | | | 11.4% | | | | 11.4% | | | | — | |
US$ | | | 31,510 | | | | 47,041 | | | | 30,140 | | | | 15,235 | | | | — | | | | 692 | | | | 124,620 | | | | 124,620 | |
Weighted average interest rate | | | 8.6% | | | | 2.2% | | | | 2.7% | | | | 3.8% | | | | — | | | | 1.4% | | | | 4.1% | | | | — | |
Other currencies(3) | | | 128,218 | | | | 159,819 | | | | 306,858 | | | | 268,434 | | | | 189,948 | | | | 551,050 | | | | 1,604,326 | | | | 1,701,026 | |
Weighted average interest rate | | | 11.4% | | | | 10.6% | | | | 10.2% | | | | 10.1% | | | | 9.5% | | | | 7.3% | | | | 9.2% | | | | — | |
| | | | | | | | | | | | | | | | | | | | | | | | | | | | | | | | |
Total variable rate | | | 162,775 | | | | 210,083 | | | | 340,406 | | | | 287,273 | | | | 193,759 | | | | 562,256 | | | | 1,756,554 | | | | 1,855,613 | |
Weighted average interest rate | | | 10.9% | | | | 8.8% | | | | 9.6% | | | | 9.7% | | | | 9.5% | | | | 7.3% | | | | 8.9% | | | | — | |
| | | | | | | | | | | | | | | | | | | | | | | | | | | | | | | | |
Total | | | 222,669 | | | | 434,221 | | | | 401,372 | | | | 353,875 | | | | 261,462 | | | | 967,050 | | | | 2,640,649 | | | | 2,805,310 | |
| | | | | | | | | | | | | | | | | | | | | | | | | | | | | | | | |
| (1) | Calculated based on the Observed Exchange Rate as of December 31, 2014, which was Ch$ 606.75 per US$ 1.00. |
| (2) | As of December 31, 2014, fair value was calculated based on the discounted value of future cash flows expected to be paid (or received), considering current discount rates that reflect the different risks involved. |
| (3) | “Other currencies” include the Euro, Brazilian real, Colombian peso, Argentine peso and Peruvian Nuevo Sol. |
Interest Rate Risk
At December 31, 2015 and 2014, 70% and 69%, respectively, of our outstanding debt obligations were subject to variable interest rates.
We manage interest rate risk by maintaining a mixture of both variable and fixed rate debt, according to the policy approved by the Board of Directors. Additionally, we manage interest rate risk through the use of interest rate derivatives. The above percentages include the effect of interest rate derivatives (swaps or collars) that hedge part of our debt.
As of December 31, 2015, the recorded values for financial reporting purposes and the corresponding fair value of the instruments that hedge for our interest rate risk exposure were as follows:
| | | | | | | | | | | | | | | | | | | | | | | | | | | | | | | | |
| | | Expected Maturity Date | |
For the year ended December 31, | | 2016 | | | 2017 | | | 2018 | | | 2019 | | | 2020 | | | Thereafter | | | Total | | | Fair
Value(2) | |
| | | (in millions of Ch$)(1) | |
Variable to fixed rates | | | 20,096 | | | | 40,423 | | | | — | | | | — | | | | — | | | | — | | | | 60,520 | | | | 1,603 | |
Fixed to variable rates | | | — | | | | — | | | | — | | | | — | | | | — | | | | — | | | | — | | | | — | |
| | | | | | | | | | | | | | | | | | | | | | | | | | | | | | | | |
Total | | | 20,096 | | | | 40,423 | | | | — | | | | — | | | | — | | | | — | | | | 60,520 | | | | 1,603 | |
| | | | | | | | | | | | | | | | | | | | | | | | | | | | | | | | |
| (1) | Calculated based on the Observed Exchange Rate as of December 31, 2015, which was Ch$ 710.16 per US$ 1.00. |
| (2) | Fair values were calculated based on the discounted value of future cash flows expected to be paid (or received), considering current discount rates that reflect the different risks involved. |
177
By comparison, as of December 31, 2014, the recorded values for financial reporting purposes and the corresponding fair value of the instruments that hedge for our interest rate risk exposure were as follows:
| | | | | | | | | | | | | | | | | | | | | | | | | | | | | | | | |
| | | Expected Maturity Date | |
For the year ended December 31, | | 2015 | | | 2016 | | | 2017 | | | 2018 | | | 2019 | | | Thereafter | | | Total | | | Fair
Value(2) | |
| | | (in millions of Ch$)(1) | |
Variable to fixed rates | | | — | | | | 50,483 | | | | 49,543 | | | | — | | | | — | | | | — | | | | 100,026 | | | | 3,121 | |
Fixed to variable rates | | | — | | | | — | | | | — | | | | — | | | | — | | | | — | | | | — | | | | — | |
| | | | | | | | | | | | | | | | | | | | | | | | | | | | | | | | |
Total | | | — | | | | 50,483 | | | | 49,543 | | | | — | | | | — | | | | — | | | | 100,026 | | | | 3,121 | |
| | | | | | | | | | | | | | | | | | | | | | | | | | | | | | | | |
| (1) | Calculated based on the Observed Exchange Rate as of December 31, 2014, which was Ch$ 606.75 per US$1.00. |
| (2) | Fair values were calculated based on the discounted value of future cash flows expected to be paid (or received), considering current discount rates that reflect the different risks involved. |
Foreign Currency Risk
Our policy seeks to maintain a balance between the currency in which cash flows are indexed and the currency of the principal debt of each company. Most of our subsidiaries have access to funding in the same currency as their revenues, therefore reducing the exchange rate volatility impact. In some cases, we cannot fully benefit from this, and therefore, we try to manage the exposure with financial derivatives such as cross currency swaps or currency forwards, among others. However, this may not always be possible due to market conditions. It is the case, for example, of Costanera in Argentina which has its revenues linked to the Argentine peso, and a substantial part of its debt is denominated in U.S. dollars, with no possibility of hedging this debt under reasonable conditions. Our Argentine subsidiaries’ debt denominated in U.S. dollars amounted to Ch$ 39.4 billion as of December 31, 2015.
As of December 31, 2015, the recorded values for financial accounting purposes and the corresponding fair value of the instruments that hedge our foreign exchange risk were as follows:
| | | | | | | | | | | | | | | | | | | | | | | | | | | | | | | | |
| | | Expected Maturity Date | |
For the year ended December 31, | | 2016 | | | 2017 | | | 2018 | | | 2019 | | | 2020 | | | Thereafter | | | Total | | | Fair
Value(2) | |
| | | (in millions of Ch$)(1) | |
UF to US$ | | | — | | | | — | | | | — | | | | — | | | | — | | | | — | | | | — | | | | — | |
US$ to Ch$/UF | | | 242,753 | | | | — | | | | — | | | | — | | | | — | | | | — | | | | 242,753 | | | | (67,966) | |
Pen$ to Cop$ | | | 45,243 | | | | — | | | | — | | | | — | | | | — | | | | — | | | | 45,243 | | | | (311) | |
US$ to other currencies(3) | | | — | | | | — | | | | — | | | | — | | | | — | | | | — | | | | — | | | | — | |
Other currencies to US$ | | | — | | | | — | | | | — | | | | — | | | | — | | | | — | | | | — | | | | — | |
| | | | | | | | | | | | | | | | | | | | | | | | | | | | | | | | |
Total | | | 287,996 | | | | — | | | | — | | | | — | | | | — | | | | — | | | | 287,996 | | | | (68,277) | |
| | | | | | | | | | | | | | | | | | | | | | | | | | | | | | | | |
| (1) | Calculated based on the Observed Exchange Rate as of December 31, 2015, which was Ch$ 710.16 per US$ 1.00. |
| (2) | Fair values were calculated based on the discounted value of future cash flows expected to be paid (or received), considering current discount rates that reflect the different risks involved. |
(3) “Other currencies” include the Euro, Brazilian real, Colombian peso, Argentine peso and Peruvian Nuevo Sol.
By comparison, as of December 31, 2014 the recorded values for financial accounting purposes and the corresponding fair value of the instruments that hedge for our interest rate risk were as follows:
| | | | | | | | | | | | | | | | | | | | | | | | | | | | | | | | |
| | | Expected Maturity Date | |
For the year ended December 31, | | 2015 | | | 2016 | | | 2017 | | | 2018 | | | 2019 | | | Thereafter | | | Total | | | Fair
Value(2) | |
| | | (in millions of Ch$)(1) | |
UF to US$ | | | — | | | | — | | | | — | | | | — | | | | | | | | — | | | | | | | | | |
US$ to Ch$/UF | | | — | | | | 233,262 | | | | — | | | | — | | | | — | | | | — | | | | 233,262 | | | | (86,416) | |
Ch$ to US$ | | | — | | | | — | | | | — | | | | — | | | | — | | | | — | | | | — | | | | — | |
US$ to other currencies(3) | | | — | | | | — | | | | — | | | | — | | | | — | | | | — | | | | — | | | | — | |
Other currencies to US$ | | | — | | | | — | | | | — | | | | — | | | | — | | | | — | | | | — | | | | — | |
| | | | | | | | | | | | | | | | | | | | | | | | | | | | | | | | |
Total | | | — | | | | 233,262 | | | | — | | | | — | | | | | | | | — | | | | 233,262 | | | | (86,416) | |
| | | | | | | | | | | | | | | | | | | | | | | | | | | | | | | | |
| (1) | Calculated based on the Observed Exchange Rate as of December 31, 2014, which was Ch$ 606.75 per US$ 1.00. |
| (2) | Fair values were calculated based on the discounted value of future cash flows expected to be paid (or received), considering current discount rates that reflect the different risks involved. |
| (3) | For further detail please refer to Note 21.6 of the Notes to our consolidated financial statements. “Other currencies” include the Euro, Brazilian real, Colombian peso, Argentine peso and Peruvian Nuevo Sol. |
178
(d) Safe Harbor
The information in this “Item 11. Quantitative and Qualitative Disclosures About Market Risk,” contains information that may constitute forward-looking statements. See “Forward-Looking Statements” in the Introduction of this Report for safe harbor provisions.
| Item 12. | Description of Securities Other Than Equity Securities |
Not applicable.
Not applicable.
Not applicable.
| D. | American Depositary Shares. |
Depositary Fees and Charges
Our ADS program’s depositary is Citibank, N.A. The Depositary collects fees for delivery and surrender of ADSs directly from investors depositing shares or surrendering ADSs for the purpose of withdrawal or from intermediaries acting for them. The Depositary fees payable for cash distributions are deducted from the cash being distributed. In the case of distributions other than cash, the Depositary will invoice the applicable ADS record date holders. The Depositary may generally refuse to provide the requested services until its fees for those services are paid. Under the terms of the Deposit Agreement, an ADS holder may have to pay the following service fees to the Depositary:
| | |
Service Fees | | Fees |
| (1) Issuance of ADS upon deposit of shares | | Up to US$ 5.00 per 100 ADS (or fraction thereof) issued |
| |
| (2) Delivery of deposited securities against surrender of ADS | | Up to US$ 5.00 per 100 ADS (or fraction thereof) surrendered |
| |
| (3) Distribution of cash dividends or other cash distributions (i.e., sale of rights and other entitlements) | | Up to US$ 5.00 per 100 ADS (or fraction thereof) held |
| |
| (4) Distribution of ADS pursuant to (i) stock dividends or other free stock distributions, or (ii) exercise of rights to purchase additional ADS | | Up to US$ 5.00 per 100 ADS (or fraction thereof) held |
| |
| (5) Distribution of securities other than ADS or rights to purchase additional ADS (i.e., spin—off of shares) | | Up to US$ 5.00 per 100 ADS (or fraction thereof) held |
| |
| (6) Depositary services | | Up to US$ 5.00 per 100 ADS (or fraction thereof) held on the applicable record date(s) established by the Depositary |
The Depositary collects fees for delivery and surrender of ADSs directly from investors depositing shares or surrendering ADSs for the purpose of withdrawal or from intermediaries acting for them. The Depositary fees payable for cash distributions are deducted from the cash being distributed. In the case of distributions other than cash, the Depositary will invoice the applicable ADS record date holders. The Depositary may generally refuse to provide the requested services until its fees for those services are paid.
Depositary Payments for Fiscal Year 2015
The Depositary has agreed to reimburse certain expenses incurred by us in connection with our ADS program. In 2015, the depositary reimbursed expenses related primarily to investor relations’ activities for a total amount of approximately US$ 900,000 (after applicable U.S. taxes).
179
PART II
| Item 13. | Defaults, Dividend Arrearages and Delinquencies |
None.
| Item 14. | Material Modifications to the Rights of Security Holders and Use of Proceeds |
None.
| Item 15. | Controls and Procedures |
(a) Disclosure Controls and Procedures
We carried out an evaluation under the supervision and with the participation of our senior management, including the Chief Executive Officer and Chief Financial Officer, of the effectiveness of the design and operation of our “disclosure controls and procedures” (as defined in Rules 13a-15(e) and 15d-15(e) under the Exchange Act) for the year ended December 31, 2015.
There are inherent limitations to the effectiveness of any system of disclosure controls and procedures, including the possibility of human error, and the circumvention or overriding of the controls and procedures. Accordingly, our disclosure controls and procedures are designed to provide reasonable assurance of achieving their control objectives.
Based upon our evaluation, the Chief Executive Officer and the Chief Financial Officer concluded that the disclosure controls and procedures are effective in providing reasonable assurance that information required to be disclosed in the reports we file and submit under the Exchange Act is recorded, processed, summarized and reported, within the time periods specified in the applicable rules and forms, and that it is gathered and communicated to our management, including the Chief Executive Officer and Chief Financial Officer, as appropriate, to allow timely decisions regarding required disclosure.
Our disclosure controls and procedures are designed to provide reasonable assurance of achieving their objectives, and our principal executive officer and principal financial officer have concluded that our disclosure controls and procedures are effective at that reasonable assurance level.
(b) Management’s Annual Report on Internal Control Over Financial Reporting
As required by Section 404 of the Sarbanes-Oxley Act of 2002, our management is responsible for establishing and maintaining “adequate internal control over financial reporting” (as defined in Rule 13a-15(f) under the Exchange Act). Our internal control over financial reporting is designed to provide reasonable assurance regarding the reliability of financial reporting and the preparation of the financial statements for external purposes in accordance with IFRS, as issued by the IASB.
Because of its inherent limitations, internal control over financial reporting may not necessarily prevent or detect some misstatements. It can only provide reasonable assurance regarding financial statement preparation and presentation. Also, projections of any evaluation of effectiveness for future periods are subject to the risk that controls may become inadequate because of changes in conditions or because the degree of compliance with the policies or procedures may deteriorate over time.
Management assessed the effectiveness of its internal control over financial reporting for the year ended December 31, 2015. The assessment was based on criteria established in “Internal Control – Integrated Framework” issued by the Committee of Sponsoring Organizations of the Treadway Commission (“COSO 2013 framework”). Based on the assessment, our management has concluded that as of December 31, 2015, our internal control over financial reporting was effective.
(c) Attestation Report
Our independent registered public accounting firm has audited the effectiveness of our internal control over financial reporting as of December 31, 2015. Their attestation report appears on page F-3.
(d) Changes in internal control
During our first half of 2015, we finalized the implementation in our Argentine, Chilean and Peruvian operations of the new “Internal Control Over Financial reporting Model”, which applies an end-to-end approach in order to enhance the design and documentation of the internal control over financial reporting processes and their related monitoring to maintain suitable oversight over our financial reporting. We implemented the new model in our Brazilian companies and processes during the fourth quarter of 2015, and we expect to implement the new model in our Colombian companies and processes during the first half of 2016.
180
With the exception of the implementation described in previous paragraph, there are no additional changes in our internal control over financial reporting identified in connection with the evaluation required by Rule 13a-15(d) or 15d-15(d) under the Exchange Act that occurred during 2015 that have materially affected, or are reasonably likely to materially affect, our internal control over financial reporting model.
| Item 16A. | Audit Committee Financial Expert |
As of December 31, 2015, the Directors’ Committee (which performs the functions of the Audit Committee) financial expert was Mr. Hernán Somerville, as determined by the Board of Directors. Mr. Somerville is an independent member of the Directors’ Committee pursuant to the requirement of both Chilean law and NYSE corporate governance rules.
Our standards of ethical conduct are governed by means of the following six corporate rulings or policies: the Charter Governing Executives (“Estatuto del Directivo”), the Employee Code of Conduct, the Code of Ethics, the Zero Tolerance Anti-Corruption Plan (the “ZTAC Plan”), the Human Rights Policyand the Manual for the Management of Information of Interest to the Market (the “Manual”).
The Charter Governing Executives was adopted by the Board of Directors in May 2003 and is applicable to all executives contractually related to us or our controlled subsidiaries in which we are the majority shareholder, including the Chief Executive Officer, the Chief Financial Officer and other senior officers of the Company. The objective of this set of rules is to establish standards for the governance of our management’s actions, the behavior of management with respect to the principles governing their actions and the limitations and incompatibilities involved, all within our vision, mission and values. Likewise, the Employee Code of Conduct explains our principles and ethical values, establishes the rules governing our contact with customers and suppliers, and establishes the principles that should be followed by employees, including ethical conduct, professionalism and confidentiality. Both documents also impose limitations on the activities that our executives and other employees may undertake outside the scope of their employment with us.
The Manual, adopted by our Board of Directors in May 2008 and amended in February 2010, addresses the following issues: applicable standards and blackout periods regarding the information in connectionwith transactions of our securities or those of our affiliates, entered into by directors, management, principal executives, employees and other related parties; the existence of mechanisms for the continuous disclosure of information that is of interest to the market; and mechanisms that provide protection for confidential information.
In addition to the corporate governance rules described above, our Board approved the Code of Ethics and the ZTAC Plan in its meeting held on June 24, 2010. The Code of Ethics is based on general principles such as impartiality, honesty, integrity and other values of similar importance, which are translated into detailed behavioral criteria. The ZTAC Plan reinforces the principles included in the Code of Ethics, but with a special emphasis in avoiding corruption in the form of bribes, preferential treatment, and other similar matters.
On October 30, 2013, the Board approved the Human Rights Policy, which incorporates and adapts the general principles acknowledged by the United Nations in matters of human rights into the corporate reality.
A copy of these documents is available upon request, free of charge, by writing or calling us at:
Investor Relations Department
Enersis Américas S.A.
Santa Rosa 76, Piso15
Santiago, Chile
(56-2) 2353-4682
During fiscal year 2015, there have been no amendments to any provisions of the documents described above. No waivers from any provisions of the Charter Governing Executives, the Employee Code of Conduct, the Code of Ethics, the ZTAC Plan or the Manual, were expressly or implicitly granted to the Chief Executive Officer, the Chief Financial Officer or any other senior financial officer of the Company in fiscal year 2015.
181
| Item 16C. | Principal Accountant Fees and Services |
The following table provides information on the aggregate fees for approved services billed by our independent registered accounting firm, as well as the other members firms and their respective affiliates, by type of services for the periods indicated.
| | | | | | | | |
Services Rendered | | 2015 | | | 2014 | |
| | | (in million of Ch$) | |
Audit fees(1) | | | 5,359 | | | | 1,872 | |
Audit-related fees | | | 353 | | | | 321 | |
Tax fees | | | — | | | | — | |
All other fees(2) | | | 663 | | | | — | |
| | | | | | | | |
Total | | | 6,375 | | | | 2,193 | |
| (1) | The increase in audit fees was due to approval of audit services related to the group’s reorganization in the amount of Ch$ 3,487 million. |
| (2) | The increase in all other fees was due mainly to audit services related to a project related to the research and development of energy efficiency in Brazil for an amount of Ch$ 604 million. |
All of the fees disclosed under audit-related fees and all other fees were pre-approved by the Directors’ Committee pre-approval policies and procedures.
The amounts included in the table above and the related footnotes have been classified in accordance with SEC guidance.
Directors’ Committee Pre-Approval Policies and Procedures
Our external auditors are appointed by our shareholders at the OSM. Similarly, the shareholders of our subsidiaries, which are located in countries where applicable law and regulation so establishes, appoint their own external auditors.
The Directors’ Committee (which performs the functions of the Audit Committee), acting through the CFO, manages appointment proposals, reviews engagement letters, negotiates fees, ensures quality control in respect of the services provided, reviews and controls independence issues, and other related matters.
The Directors’ Committee has a pre-approval policy regarding the contracting of our external auditor, or any affiliate of the external auditor, for professional services. The professional services covered by such policy include audit and non-audit services provided to us.
Fees payable in connection with recurring audit services are pre-approved as part of our annual budget. Fees payable in connection with non-recurring audit services, once they have been analyzed by the CFO, are submitted to the Directors’ Committee for approval or rejection.
The pre-approval policy established by the Directors’ Committee for non-audit services and audit-related fees is as follows:
| | • | | The business unit that has requested the service and the audit firm expected to perform the service must request that the CFO review the nature of the service to be provided. |
| | • | | The CFO then analyzes the request and requires the selected audit firm to issue a certificate signed by the partner responsible for the audit of our consolidated financial statements confirming such audit firm’s independence. |
| | • | | Finally, the proposal is submitted to the Directors’ Committee for approval or denial. |
The Directors’ Committee has designed, approved, and implemented the necessary procedures to fulfill the new requirements described in SEC release number 34-53677, File No. PCAOB-2006-01 (Audit Committee Pre-Approval of Certain Tax Services).
182
| Item 16D. | Exemptions from the Listing Standards for Audit Committees |
Not applicable.
| Item 16E. | Purchases of Equity Securities by the Issuer and Affiliated Purchasers |
None.
| Item 16F. | Change in Registrant’s Certifying Accountant |
None.
| Item 16G. | Corporate Governance |
For a summary of the significant differences between our corporate governance practices and those applicable to domestic issuers under the corporate governance rules of the NYSE, see “Item 6. Directors, Senior Management and Employees — C. Board Practices.”
| Item 16H. | Mine Safety Disclosure |
Not applicable.
183
PART III
| Item 17. | Financial Statements |
We have responded to Item 18 in lieu of responding to this Item.
| Item 18. | Financial Statements |
ENERSIS S.A. and Subsidiaries
Index to the Consolidated Financial Statements
Reports of Independent Registered Public Accounting Firms:
| | | | |
Report of Ernst & Young Servicios Profesionales de Auditoría y Asesorías Limitada — Enersis S.A. 2015, 2014 and 2013 | | | F-1 | |
Report of Ernst & Young Servicios Profesionales de Auditoría y Asesorías Limitada — Enersis S.A. —
Internal Control over Financial Reporting 2015 | | | F-3 | |
Report of KPMG Auditores Consultores Ltda. — Empresa Nacional de Electricidad S.A. 2015, 2014, and 2013 | | | F-5 | |
Report of KPMG Auditores Consultores Ltda. — Empresa Nacional de Electricidad S.A. —
Internal Control over Financial Reporting 2015 | | | F-6 | |
| |
Consolidated Financial Statements: | | | | |
| |
Consolidated Statements of Financial Position as of December 31, 2015 and December 31, 2014 | | | F-8 | |
Consolidated Statements of Comprehensive Income for the years ended December 31, 2015, 2014 and 2013 | | | F-10 | |
Consolidated Statements of Changes in Equity for the years ended December 31, 2015, 2014, and 2013 | | | F-12 | |
Consolidated Statements of Direct Cash Flows for the years ended December 31, 2015, 2014, and 2013 | | | F-14 | |
Notes to the Consolidated Financial Statements | | | F-15 | |
| | |
| Ch$ | | Chilean pesos |
| US$ | | U.S. dollars |
| UF | | The UF is a Chilean inflation-indexed, peso-denominated monetary unit that is set daily in advance based on the previous month’s inflation rate. |
| ThCh$ | | Thousands of Chilean pesos |
| ThUS$ | | Thousands of U.S. dollars |
| | |
Exhibit | | Description |
| 1.1 | | By-laws (Estatutos) of Enersis Américas S.A., as amended. |
| 8.1 | | List of Principal Subsidiaries as of December 31, 2015 |
| 12.1 | | Certification of Chief Executive Officer pursuant to Section 302 of the Sarbanes-Oxley Act |
| 12.2 | | Certification of Chief Financial Officer pursuant to Section 302 of the Sarbanes-Oxley Act |
| 13.1 | | Certification of Chief Executive Officer and Chief Financial Officer pursuant to Section 906 of the Sarbanes-Oxley Act |
We will furnish to the Securities and Exchange Commission, upon request, copies of any not filed instruments that define the rights of stakeholders of Enersis Américas.
184
SIGNATURES
The registrant hereby certifies that it meets all of the requirements for filing on Form 20-F and that it has duly caused and authorized the undersigned to sign this annual report on its behalf.
| | |
| ENERSIS AMÉRICAS S.A. |
| |
| By: | | /s/ Luca D’Agnese |
| Name: | | Luca D’Agnese |
| Title: | | Chief Executive Officer |
Date: April 29, 2016
Enersis Américas S.A. (Former Enersis S.A.) and its Subsidiaries
Consolidated Financial Statements as of December 31, 2015 and 2014
Index to the Consolidated Financial Statements
| | |
| Report of Independent Registered Public Accounting Firm | | |
| |
| Report of Ernst & Young Servicios Profesionales de Auditoría y Asesorías Limitada (EY Ltda.) — Enersis Américas S.A. 2015, 2014 and 2013 | | F-1 |
| Report of Ernst & Young Servicios Profesionales de Auditoría y Asesorías Limitada — Enersis Américas S.A. — Internal Control over Financial Reporting 2015 | | F-3 |
| Report of KPMG Auditores Consultores Ltda. — Empresa Nacional de Electricidad S.A. (Endesa Chile) 2015, 2014 and 2013 | | F-5 |
| Report of KPMG Auditores Consultores Ltda. — Empresa Nacional de Electricidad S.A. (Endesa Chile) — Internal Control over Financial Reporting 2015 | | F-6 |
| |
| Combined Financial Statements: | | |
| |
Consolidated Statements of Financial Position as of December 31, 2015 and December 31, 2014 | | F-8 |
Consolidated Statements of Comprehensive Income for the years ended December 31, 2015, 2014 and 2013 | | F-10 |
Consolidated Statements of Changes in Equity for the years ended December 31, 2015, 2014 and 2013 | | F-12 |
Consolidated Statements of Direct Cash Flows for the years ended December 30, 2015, 2014 and 2013 | | F-14 |
Notes to the Consolidated Financial Statements | | F-15 |
| | |
| Ch$ | | Chilean pesos |
| US$ | | U. S. dollars |
| UF | | The UF is a Chilean inflation-indexed, peso-denominated monetary unit that is set daily in advance based on the previous month’s inflation rate. |
| ThCh$ | | Thousands of Chilean pesos |
| ThUS$ | | Thousands of U.S. dollars |
| | | | | | |
 | | | | | | |
| | EY Chile Avda. Presidente Riesco 5435, piso 4, Santiago | | Tel: +56 (2) 2676 1000 www.eychile.cl | | |
Report of Independent Registered Public Accounting Firm
To Shareholders and Directors of
Enersis Américas S.A.
We have audited the accompanying consolidated statements of financial position of Enersis Américas S.A. (formerly Enersis S.A.) and subsidiaries (the “Company”) as of December 31, 2015 and 2014, and the related consolidated statements of comprehensive income, changes in shareholders’ equity, and cash flows for each of the three years in the period ended December 31, 2015. These consolidated financial statements are the responsibility of the Company’s management. Our responsibility is to express an opinion on these financial statements based on our audits.
The consolidated financial statements of the Company include the consolidated financial statements of its subsidiary, Empresa Nacional de Electridad S.A (“Endesa-Chile”). The consolidated financial statements of Endesa-Chile include the financial statements of the following entities, each having been prepared in conformity with its respective local statutory accounting basis: Emgesa S.A. E.S.P (“Emgesa”) and Endesa Argentina S.A. (“Endesa-Argentina”) (both subsidiaries of Endesa-Chile), and of Enel Brasil S.A. (“Enel-Brasil”) (a consolidated subsidiary of the Company that is also a 38.64% percent owned investee of Endesa-Chile accounted for using the equity method). Except for the amounts included in Endesa-Chile’s consolidated financial statements relating to Emgesa, Endesa-Argentina and Enel-Brasil, which we subjected to our audit procedures in the context of the consolidated financial statements of Enersis Americas, taken as a whole, we did not audit the consolidated financial statements of Endesa-Chile. The consolidated financial statements of Endesa-Chile, exclusive of the amounts relating to Emgesa, Endesa-Argentina and Enel-Brasil, reflect total assets constituting 28.3% in 2015 and 32.0% in 2014, total revenues and other operating income constituting 5.5% in 2015, 5.4 % in 2014 and 4.4% in 2013 and income (loss) after tax from discontinued operations constituting (17.5)% in 2015, (94.5)% in 2014 and 5.9% in 2013 of the related consolidated totals. Endesa-Chile’s consolidated financial statements were audited by other auditors whose report has been furnished to us, and our opinion on the Company’s consolidated financial statements, insofar as it relates to the amounts included for Endesa-Chile (but exclusive of the amounts for Emgesa, Endesa-Argentina and Enel-Brasil), is based solely on the report of the other auditors.
We conducted our audits in accordance with the standards of the Public Company Accounting Oversight Board (United States). Those standards require that we plan and perform the audit to obtain reasonable assurance about whether the financial statements are free of material misstatement. An audit includes examining, on a test basis, evidence supporting the amounts and disclosures in the financial statements. An audit also includes assessing the accounting principles used and significant estimates made by management, as well as evaluating the overall financial statement presentation. We believe that our audits and the report of other auditors provide a reasonable basis for our opinion.
F-1
A member firm of Ernst & Young Global Limited
| | | | | | |
| | | | | | |
| | EY Chile Avda. Presidente Riesco 5435, piso 4, Santiago | | Tel: +56 (2) 2676 1000 www.eychile.cl | | |
In our opinion, based on our audits and the report of other auditors (see second paragraph above), the financial statements referred to above present fairly, in all material respects, the consolidated financial position of Enersis Américas S.A. and subsidiaries at December 31, 2015 and 2014, and the consolidated results of their operations and their cash flows for each of the three years in the period ended December 31, 2015, in conformity with International Financial Reporting Standards (IFRS), as issued by the International Accounting Standards Board.
We also have audited, in accordance with the standards of the Public Company Accounting Oversight Board (United States), Enersis Americas S.A.’s internal control over financial reporting as of December 31, 2015, based on criteria established in Internal Control-Integrated Framework issued by the Committee of Sponsoring Organizations of the Treadway Commission (2013 framework) and our report dated April 29, 2016 expressed an unqualified opinion thereon based on our audit and the report on internal controls of other auditors.
|
| /s/ EY Ltda. |
| EY Ltda. |
|
| Santiago, Chile |
| April 29, 2016 |
F-2
A member firm of Ernst & Young Global Limited
| | | | | | |
| | | | | | |
| | EY Chile Avda. Presidente Riesco 5435, piso 4, Santiago | | Tel: +56 (2) 2676 1000 www.eychile.cl | | |
Report of Independent Registered Public Accounting Firm On Internal Control Over Financial Reporting
The Board of Directors and Shareholders of
Enersis Américas S.A.
We have audited the internal control over financial reporting of Enersis Américas S.A. (formerly Enersis S.A.) and subsidiaries (the “Company”) as of December 31, 2015, based on criteria established in Internal Control—Integrated Framework issued by the Committee of Sponsoring Organizations of the Treadway Commission (2013 framework) (the COSO criteria). The Company’s management is responsible for maintaining effective internal control over financial reporting, and for its assessment of the effectiveness of internal control over financial reporting included in the accompanying Management’s Annual Report on Internal Control Over Financial Reporting. Our responsibility is to express an opinion on the company’s internal control over financial reporting based on our audit. We did not examine the effectiveness of internal control over financial reporting of Empresa Nacional De Electricidad S.A. (a subsidiary) and certain of its subsidiaries, associates and jointly controlled entities (hereinafter collectively referred to as “Endesa-Chile”) which statements reflect total assets, total revenues and other operating income, and total income (losses) after tax from discontinued operations constituting 44%, 15% and (17)%, respectively, of the related consolidated totals. The effectiveness of Endesa-Chile’s internal control over financial reporting was audited by other auditors whose report has been furnished to us, and our opinion, insofar as it relates to the effectiveness of Endesa-Chile’s internal control over financial reporting, is based solely on the report of the other auditors.
We conducted our audit in accordance with the standards of the Public Company Accounting Oversight Board (United States). Those standards require that we plan and perform the audit to obtain reasonable assurance about whether effective internal control over financial reporting was maintained in all material respects. Our audit included obtaining an understanding of internal control over financial reporting, assessing the risk that a material weakness exists, testing and evaluating the design and operating effectiveness of internal control based on the assessed risk, and performing such other procedures as we considered necessary in the circumstances. We believe that our audit provides a reasonable basis for our opinion.
A company’s internal control over financial reporting is a process designed to provide reasonable assurance regarding the reliability of financial reporting and the preparation of financial statements for external purposes in accordance with generally accepted accounting principles. A company’s internal control over financial reporting includes those policies and procedures that (1) pertain to the maintenance of records that, in reasonable detail, accurately and fairly reflect the transactions and dispositions of the assets of the company; (2) provide reasonable assurance that transactions are recorded as necessary to permit preparation of financial statements in accordance with generally accepted accounting principles, and that receipts and expenditures of the company are being made only in accordance with authorizations of management and directors of the company; and (3) provide reasonable assurance regarding prevention or timely detection of unauthorized acquisition, use, or disposition of the company’s assets that could have a material effect on the financial statements.
F-3
A member firm of Ernst & Young Global Limited
| | | | | | |
| | | | | | |
| | EY Chile Avda. Presidente Riesco 5435, piso 4, Santiago | | Tel: +56 (2) 2676 1000 www.eychile.cl | | |
Because of its inherent limitations, internal control over financial reporting may not prevent or detect misstatements. Also, projections of any evaluation of effectiveness to future periods are subject to the risk that controls may become inadequate because of changes in conditions, or that the degree of compliance with the policies or procedures may deteriorate.
In our opinion, based on our audit and the report of other auditors, Enersis Américas S.A. and subsidiaries maintained, in all material respects, effective internal control over financial reporting as of December 31, 2015, based on the COSO criteria.
We also have audited, in accordance with the standards of the Public Company Accounting Oversight Board (United States), the consolidated statements of financial position of Enersis Américas S.A. and subsidiaries as of December 31, 2015 and 2014 and the related consolidated statements of comprehensive income, changes in equity, and cash flows for each of the three years in the period ended December 31, 2015 of Enersis Américas S.A. and subsidiaries, and our report dated April 29, 2016 expressed an unqualified opinion thereon based on our audits and the report of other auditors.
|
| /s/ EY Ltda. |
| EY Ltda. |
|
| Santiago, Chile |
| April 29, 2016 |
F-4
A member firm of Ernst & Young Global Limited
| | | | |
 | | KPMG Auditores Consultores Ltda. Av. Isidora Goyenechea 3520, Piso 2 Las Condes, Santiago, Chile | | Teléfono +56 (2) 2798 1000 Fax +56 (2) 2798 1001 www.kpmg.cl |
Report of Independent Registered Public Accounting Firm
The Board of Directors and Shareholders of
Empresa Nacional de Electricidad S.A. (Endesa–Chile):
We have audited the consolidated statements of financial position of Endesa-Chile and subsidiaries (the Company) as of December 31, 2015 and 2014, and the related consolidated statements of comprehensive income, changes in equity, and cash flows for each of the years in the three-year period ended December 31, 2015. These consolidated financial statements are the responsibility of the Company’s management. Our responsibility is to express an opinion on these consolidated financial statements based on our audits. We did not audit the financial statements of certain subsidiaries which statements reflect total assets constituting 33.52 percent and 34.13 percent of the Company’s consolidated total assets as of December 31, 2015 and 2014, respectively, and ThCh$ 321,253,877, ThCh$ 345,341,681 and ThCh$ 220,964,452 of the Company’s consolidated profit from discontinued operations for the years ended December 31, 2015, 2014 and 2013, respectively. In addition, we did not audit the financial statements of Enel Brasil S.A. (a 38.64 percent owner investee company). The Company’s investment in Enel Brasil S.A. as of December 31, 2015 and 2014 was ThCh$ 444,182,602 and ThCh$ 538,876,929, respectively, and its equity in earnings was ThCh$36,473,505, ThCh$62,181,301 and ThCh$94,402,624 for the years ended December 31, 2015, 2014 and 2013, respectively. Those consolidated financial statements prepared in accordance with the local statutory accounting basis were audited by other auditors whose reports have been furnished to us and our opinion, insofar as it relates to the amounts included for those entities on such basis of accounting, is based solely on the reports of the other auditors. Accordingly, we have audited the conversion adjustments to the financial statements of these subsidiaries and nonsubsidiary investees prepared in accordance with the local statutory accounting basis to conform them to the Company’s accounting basis referred to below.
We conducted our audits in accordance with the standards of the Public Company Accounting Oversight Board (United States). Those standards require that we plan and perform the audit to obtain reasonable assurance about whether the consolidated financial statements are free of material misstatement. An audit includes examining, on a test basis, evidence supporting the amounts and disclosures in the consolidated financial statements. An audit also includes assessing the accounting principles used and significant estimates made by management, as well as evaluating the overall financial statement presentation. We believe that our audits and the reports of the other auditors provide a reasonable basis for our opinion.
In our opinion, based on our audits and the reports of the other auditors, the consolidated financial statements referred to above present fairly, in all material respects, the financial position of Endesa-Chile and subsidiaries as of December 31, 2015 and 2014, and the results of their operations and their cash flows for each of the years in the three-year period ended December 31, 2015, in conformity with International Financial Reporting Standards as issued by the International Accounting Standards Board.
We also have audited, in accordance with the standards of the Public Company Accounting Oversight Board (United States), Endesa-Chile’s internal control over financial reporting as of December 31, 2015, based on the criteria established in Internal Control — Integrated Framework (2013) issued by the Committee of Sponsoring Organizations of the Treadway Commission (COSO), and our report dated April 29, 2016, expressed an unqualified opinion on the effectiveness of the Company’s internal control over financial reporting.
|
/s/ KPMG |
| KPMG Auditores Consultores Ltda. |
| Santiago, Chile |
| April 29, 2016 |
F-5
| | | | |
| | KPMG Auditores Consultores Ltda. Av. Isidora Goyenechea 3520, Piso 2 Las Condes, Santiago, Chile | | Teléfono +56 (2) 2798 1000 Fax +56 (2) 2798 1001 www.kpmg.cl |
Report of Independent Registered Public Accounting Firm
The Board of Directors and Shareholders of
Empresa Nacional de Electricidad S.A. (Endesa–Chile):
We have audited the internal control over financial reporting of Endesa-Chile as of December 31, 2015, based on criteria established in Internal Control – Integrated Framework (2013) issued by the Committee of Sponsoring Organizations of the Treadway Commission (COSO). Endesa-Chile’s management is responsible for maintaining effective internal control over financial reporting and for its assessment of the effectiveness of internal control over financial reporting, included in the accompanyingManagement’s Annual Report on Internal Control over Financial Reporting. Our responsibility is to express an opinion on the Endesa-Chile’s internal control over financial reporting based on our audit.
We conducted our audit in accordance with the standards of the Public Company Accounting Oversight Board (United States). Those standards require that we plan and perform the audit to obtain reasonable assurance about whether effective internal control over financial reporting was maintained in all material respects. Our audit included obtaining an understanding of internal control over financial reporting, assessing the risk that a material weakness exists, and testing and evaluating the design and operating effectiveness of internal control based on the assessed risk. Our audit also included performing such other procedures as we considered necessary in the circumstances. We believe that our audit provides a reasonable basis for our opinion.
A company’s internal control over financial reporting is a process designed to provide reasonable assurance regarding the reliability of financial reporting and the preparation of financial statements for external purposes in accordance with generally accepted accounting principles. A company’s internal control over financial reporting includes those policies and procedures that (1) pertain to the maintenance of records that, in reasonable detail, accurately and fairly reflect the transactions and dispositions of the assets of the company; (2) provide reasonable assurance that transactions are recorded as necessary to permit preparation of financial statements in accordance with generally accepted accounting principles, and that receipts and expenditures of the company are being made only in accordance with authorizations of management and directors of the company; and (3) provide reasonable assurance regarding prevention or timely detection of unauthorized acquisition, use, or disposition of the company’s assets that could have a material effect on the financial statements.
Because of its inherent limitations, internal control over financial reporting may not prevent or detect misstatements. Also, projections of any evaluation of effectiveness to future periods are subject to the risk that controls may become inadequate because of changes in conditions, or that the degree of compliance with the policies or procedures may deteriorate.
In our opinion, Endesa-Chile maintained, in all material respects, effective internal control over financial reporting as of December 31, 2015, based on criteria established inInternal Control – Integrated Framework (2013) issued by the Committee of Sponsoring Organizations of the Treadway Commission (COSO).
F-6
| | | | |
| | KPMG Auditores Consultores Ltda. Av. Isidora Goyenechea 3520, Piso 2 Las Condes, Santiago, Chile | | Teléfono +56 (2) 2798 1000 Fax +56 (2) 2798 1001 www.kpmg.cl |
We also have audited, in accordance with the standards of the Public Company Accounting Oversight Board (United States), the consolidated the statements of financial position of Endesa-Chile and subsidiaries as of December 31, 2015 and 2014, and the related consolidated statements of comprehensive income, changes in equity, and cash flows for each of the years in the three-year period ended December 31, 2015, and our report dated April 29, 2016 expressed an unqualified opinion on those consolidated financial statements.
|
/s/ KPMG |
| KPMG Auditores Consultores Ltda. |
| Santiago, Chile |
April 29, 2016 |
F-7
ENERSIS AMÉRICAS S.A. (FORMER ENERSIS S.A.) AND SUBSIDIARIES
Consolidated Statements of Financial Position
As of December 31, 2015 and 2014
(In thousands of Chilean pesos)
| | | | | | | | | | |
| | | | | 12-31-2015 | | | 12-31-2014 | |
| ASSETS | | Note | | | | | | |
| | | | | ThCh$ | | | ThCh$ | |
| | | | | | | | | | |
| | | |
| CURRENT ASSETS | | | | | | | | | | |
Cash and cash equivalents | | 8 | | | 1,185,163,344 | | | | 1,704,745,491 | |
Other current financial assets | | 9 | | | 68,262,446 | | | | 99,455,403 | |
Other current non-financial assets | | | | | 101,989,057 | | | | 175,098,112 | |
Trade and other current receivables | | 10 | | | 1,088,131,567 | | | | 1,681,686,903 | |
Current accounts receivable from related parties | | 11 | | | 3,566,930 | | | | 18,441,340 | |
Inventories | | 12 | | | 95,057,897 | | | | 133,520,154 | |
Current tax assets | | 13 | | | 47,454,588 | | | | 110,572,522 | |
| Total current assets other than assets or groups of assets for disposal classified as held for sale or as held for distribution to owners | | | 2,589,625,829 | | | | 3,923,519,925 | |
| | | | | | | | | | |
| Non-current assets or disposal groups held for sale or for distribution to owners | | 5 | | | 5,323,935,881 | | | | 7,978,963 | |
| | | | | | | | | | |
| TOTAL CURRENT ASSETS | | | 7,913,561,710 | | | | 3,931,498,888 | |
| | | | | | | | | | |
| | | |
NON-CURRENT ASSETS | | | | | | | | | | |
Other non-current financial assets | | 9 | | | 489,528,204 | | | | 530,821,520 | |
Other non-current non-financial assets | | | | | 77,562,708 | | | | 77,806,180 | |
Trade and other non-current receivables | | 10 | | | 398,695,864 | | | | 291,641,675 | |
Non-current accounts receivable from related parties | | 11 | | | 355,485 | | | | 486,605 | |
Investments accounted for using the equity method | | 14 | | | 30,960,445 | | | | 73,633,610 | |
Intangible assets other than goodwill | | 15 | | | 981,399,272 | | | | 1,168,212,056 | |
Goodwill | | 16 | | | 444,199,047 | | | | 1,410,853,627 | |
Property, plant and equipment | | 17 | | | 5,003,566,633 | | | | 8,234,215,719 | |
Investment property | | 18 | | | - | | | | 8,514,562 | |
Deferred tax assets | | 19 | | | 109,325,023 | | | | 193,637,874 | |
| | | | | | | | | | |
| TOTAL NON-CURRENT ASSETS | | | | | 7,535,592,681 | | | | 11,989,823,428 | |
| | | | | | | | | | |
| TOTAL ASSETS | | | | | 15,449,154,391 | | | | 15,921,322,316 | |
| | |
| The accompanying notes are an integral part of these consolidated financial statements | | |
|
| F-8 |
ENERSIS AMÉRICAS S.A. (FORMER ENERSIS S.A.) AND SUBSIDIARIES
Consolidated Statements of Financial Position
As of December 31, 2015 and 2014
(In thousands of Chilean pesos)
| | | | | | | | | | |
LIABILITIES AND EQUITY | | | | 12-31-2015 | | | 12-31-2014 | |
| | Note | | | | | | |
| | | | | ThCh$ | | | ThCh$ | |
CURRENT LIABILITIES | | | | | | | | | | |
Other current financial liabilities | | 20 | | | 687,873,508 | | | | 421,805,679 | |
Trade and other current payables | | 23 | | | 1,452,824,207 | | | | 2,288,876,950 | |
Current accounts payable to related parties | | 11 | | | 109,897,508 | | | | 143,680,622 | |
Other current provisions | | 24 | | | 127,299,176 | | | | 90,222,684 | |
Current tax liabilities | | 13 | | | 142,607,960 | | | | 115,472,313 | |
Other current non-financial liabilities | | | | | 39,226,339 | | | | 129,275,589 | |
| Total current liabilities other than those associated with groups of assets for disposal classified as held for sale | | | 2,559,728,698 | | | | 3,189,333,837 | |
| Liabilities associated with disposal groups held for sale or for distribution to owners | | 5 | | | 1,945,652,102 | | | | 5,488,147 | |
TOTAL CURRENT LIABILITIES | | | | | 4,505,380,800 | | | | 3,194,821,984 | |
NON-CURRENT LIABILITIES | | | | | | | | | | |
Other non-current financial liabilities | | 20 | | | 1,847,296,592 | | | | 3,289,097,528 | |
Trade and other non-current payables | | 23 | | | 283,544,254 | | | | 159,385,521 | |
Other long-term provisions | | 24 | | | 183,848,284 | | | | 197,243,841 | |
Deferred tax liabilities | | 19 | | | 231,904,615 | | | | 478,361,484 | |
Non-current provisions for employee benefits | | 25 | | | 187,270,474 | | | | 269,930,412 | |
Other non-current non-financial liabilities | | | | | 20,100,992 | | | | 53,262,800 | |
TOTAL NON-CURRENT LIABILITIES | | | 2,753,965,211 | | | | 4,447,281,586 | |
| TOTAL LIABILITIES | | | 7,259,346,011 | | | | 7,642,103,570 | |
EQUITY | | | | | | | | | | |
Issued capital | | 26.1 | | | 5,804,447,986 | | | | 5,804,447,986 | |
Retained earnings | | | | | 3,380,661,523 | | | | 3,051,734,445 | |
Other reserves | | 26.5 | | | (3,158,960,224) | | | | (2,654,206,384) | |
Equity attributable to shareholders of Enersis Américas | | | 6,026,149,285 | | | | 6,201,976,047 | |
Non-controlling interests | | 26.6 | | | 2,163,659,095 | | | | 2,077,242,699 | |
| TOTAL EQUITY | | | | | 8,189,808,380 | | | | 8,279,218,746 | |
| TOTAL LIABILITIES AND EQUITY | | | | | 15,449,154,391 | | | | 15,921,322,316 | |
| | |
| The accompanying notes are an integral part of these consolidated financial statements | | |
|
| F-9 |
ENERSIS AMÉRICAS S.A. (FORMER ENERSIS S.A.) AND SUBSIDIARIES
Consolidated Statements of Comprehensive Income, by Nature
For the years ended December 31, 2015, 2014 and 2013
(In thousands of Chilean pesos)
| | | | | | | | | | | | | | |
| STATEMENTS OF PROFIT (LOSS) | | Note | | 2015 | | | 2014 (As adjusted)(*) | | | 2013 (As adjusted)(*) | |
| | | | ThCh$ | | | ThCh$ | | | ThCh$ | |
Revenues | | 27 | | | 4,667,645,310 | | | | 4,806,455,737 | | | | 3,978,995,352 | |
Other operating income | | 27 | | | 633,794,268 | | | | 399,914,051 | | | | 549,152,517 | |
Revenues and Other Operating Income | | | | | 5,301,439,578 | | | | 5,206,369,788 | | | | 4,528,147,869 | |
| | | | | | | | | | | | | | |
Raw materials and consumables used | | 28 | | | (2,777,201,512) | | | | (2,631,669,436) | | | | (2,090,267,302) | |
Contribution Margin | | | | | (2,524,238,066) | | | | (2,574,700,352) | | | | (2,437,880,567) | |
| | | | | | | | | | | | | | |
Other work performed by the entity and capitalized | | | | | 67,101,269 | | | | 55,770,418 | | | | 47,134,470 | |
Employee benefits expenses | | 29 | | | (487,698,147) | | | | (389,668,473) | | | | (345,568,196) | |
Depreciation and amortization expense | | 30 | | | (320,542,197) | | | | (350,742,750) | | | | (315,966,141) | |
Impairment loss recognized in the period’s profit or loss | | 30 | | | (39,811,756) | | | | (38,329,942) | | | | (66,664,976) | |
Other expenses | | 31 | | | (488,528,749) | | | | (463,729,264) | | | | (405,747,911) | |
Operating Income | | | | | 1,254,758,486 | | | | 1,388,000,341 | | | | 1,351,067,813 | |
| | | | | | | | | | | | | | |
Other gains (losses) | | 32 | | | (6,566,225) | | | | 876,554 | | | | 4,642,268 | |
Financial income | | 33 | | | 294,770,272 | | | | 251,121,762 | | | | 246,615,814 | |
Financial costs | | 33 | | | (385,455,340) | | | | (432,314,329) | | | | (325,972,302) | |
Share of profit (loss) of associates and joint ventures accounted for using the equity method | | 14 | | | 3,332,971 | | | | 2,560,023 | | | | 979,875 | |
Foreign currency exchange differences | | 33 | | | 128,238,047 | | | | (18,493,594) | | | | (28,534,786) | |
Profit (losses) from indexed assets and liabilities | | 33 | | | (9,266,040) | | | | (13,630,068) | | | | (11,007,801) | |
| | | | | | | | | | | | | | |
Income from continuing operations, before taxes | | | | | 1,279,812,171 | | | | 1,178,120,689 | | | | 1,237,790,881 | |
Income tax expenses, continuing operations | | 34 | | | (523,663,212) | | | | (425,957,462) | | | | (442,455,343) | |
INCOME AFTER TAX FROM CONTINUING OPERATIONS | | | | | 756,148,959 | | | | 752,163,227 | | | | 795,335,538 | |
Income after tax from discontinued operations | | 5.1 | | | 388,320,526 | | | | 215,331,981 | | | | 318,065,208 | |
NET INCOME | | | | | 1,144,469,485 | | | | 967,495,208 | | | | 1,113,400,746 | |
| | | | | | | | | | | | | | |
Net income attributable to: | | | | | | | | | | | | | | |
Shareholders of Enersis Américas | | | | | 661,586,917 | | | | 571,873,342 | | | | 658,514,150 | |
Non-controlling interests | | 26.6 | | | 482,882,568 | | | | 395,621,866 | | | | 454,886,596 | |
NET INCOME | | | | | 1,144,469,485 | | | | 967,495,208 | | | | 1,113,400,746 | |
| | | | | | | | | | | | | | |
Basic earnings per share | | | | | | | | | | | | | | |
Basic earnings per share from continuing operations | | Ch$/Share | | | 8.35 | | | | 8.34 | | | | 9.49 | |
Basic earnings per share from discontinued operations | | Ch$/Share | | | 5.13 | | | | 3.31 | | | | 5.08 | |
Basic earnings per share | | Ch$/Share | | | 13.48 | | | | 11.65 | | | | 14.56 | |
Weighted average number of shares of common stock | | Thousands | | | 49,092,772.76 | | | | 49,092,772.76 | | | | 45,218,860.05 | |
| | | | | | | | | | | | | | |
Diluted earnings per share | | | | | | | | | | | | | | |
Diluted earnings per share from continuing operations | | Ch$/Share | | | 8.35 | | | | 8.34 | | | | 9.49 | |
Diluted earnings per share from discontinued operations | | Ch$/Share | | | 5.13 | | | | 3.31 | | | | 5.08 | |
Diluted earnings per share | | Ch$/Share | | | 13.48 | | | | 11.65 | | | | 14.56 | |
Weighted average number of shares of common stock | | Thousands | | | 49,092,772.76 | | | | 49,092,772.76 | | | | 45,218,860.05 | |
(*) Prior period amounts were adjusted to conform with current period classification of discontinued operations. See Note 5.1.II.iii
| | |
| The accompanying notes are an integral part of these consolidated financial statements | | |
|
| F-10 |
ENERSIS AMÉRICAS S.A. (FORMER ENERSIS S.A.) AND SUBSIDIARIES
Consolidated Statements of Comprehensive Income, by Nature (continued)
For the years ended December 31, 2015, 2014 and 2013
(In thousands of Chilean pesos)
| | | | | | | | | | | | | | |
| | | | | 2015 | | | 2014 | | | 2013 | |
| STATEMENTS OF COMPREHENSIVE INCOME | | Note | | ThCh$ | | | (As adjusted)(*) ThCh$ | | | (As adjusted)(*) ThCh$ | |
| | | | | | | | | | | | | | |
| Net Income | | | 1,144,469,485 | | | | 967,495,208 | | | | 1,113,400,746 | |
| | | | | | | | | | | | | | |
| Components of other comprehensive income that will not be reclassified subsequently to profit or loss, before taxes | | | | | | | | | | | | | | |
Gain (loss) from defined benefit plans | | 25.2b | | | (19,027,368) | | | | (36,681,734) | | | | 6,351,518 | |
| | | | | | | | | | | | | | |
| Other comprehensive income that will not be reclassified subsequently to profit or loss | | | (19,027,368) | | | | (36,681,734) | | | | 6,351,518 | |
| | | | | | | | | | | | | | | |
| Components of other comprehensive income that will be reclassified subsequently to profit or loss, before taxes | | | | | | | | | | | | | | |
Foreign currency translation gains (losses) | | | | | (644,537,672) | | | | 4,370,648 | | | | (76,723,893) | |
Gains (losses) from available-for-sale financial assets | | | | | (442,864) | | | | 1,849 | | | | (2,273) | |
Share of other comprehensive income from associates and joint ventures accounted for using the equity method | | 14.1 | | | (552,420) | | | | 13,476,871 | | | | 8,367,223 | |
Gains (losses) from cash flow hedge | | | | | (155,456,845) | | | | (138,993,868) | | | | (76,144,260) | |
Adjustments from reclassification of cash flow hedges, transferred to profit or loss | | | | | 17,215,453 | | | | (6,898,502) | | | | 55,283 | |
| | | | | | | | | | | | | | |
| Other comprehensive income that will be reclassified subsequently to profit or loss | | | (783,774,348) | | | | (128,043,002) | | | | (144,447,920) | |
| | | | | | | | | | | | | | |
| Components of other comprehensive income, before taxes | | | (802,801,716) | | | | (164,724,736) | | | | (138,096,402) | |
| | | | | | | | | | | | | | |
| Income tax related to components of other comprehensive income that will not be reclassified subsequently to profit or loss | | | | | | | | | | | | | | |
Income tax related to defined benefit plans | | | | | 6,018,363 | | | | 12,694,514 | | | | (2,603,231) | |
| | | | | | | | | | | | | | |
| Income tax related to components of other comprehensive income that will not be reclassified subsequently to profit or loss | | | | | 6,018,363 | | | | 12,694,514 | | | | (2,603,231) | |
| | | | | | | | | | | | | | |
| Income tax related to components of other comprehensive income that will be reclassified subsequently to profit or loss | | | | | | | | | | | | | | |
Income tax related to cash flow hedge | | | | | 36,399,000 | | | | 35,887,996 | | | | 12,332,516 | |
Income tax related to available-for-sale financial assets | | | | | (291) | | | | (1,462) | | | | 455 | |
| | | | | | | | | | | | | | |
| Income tax related to components of other comprehensive income that will be reclassified subsequently to profit or loss | | | | | 36,398,709 | | | | 35,886,534 | | | | 12,332,971 | |
| | | | | | | | | | | | | | |
| Total Other Comprehensive Income | | | | | (760,384,644) | | | | (116,143,688) | | | | (128,366,662) | |
| | | | | | | | | | | | | | |
| TOTAL COMPREHENSIVE INCOME | | | | | 384,084,841 | | | | 851,351,520 | | | | 985,034,084 | |
| | | | | | | | | | | | | | |
| Comprehensive income attributable to: | | | | | | | | | | | | | | |
Shareholders of Enersis Américas | | | | | 145,175,235 | | | | 524,282,247 | | | | 577,348,684 | |
Non-controlling interests | | | | | 238,909,606 | | | | 327,069,273 | | | | 407,685,400 | |
TOTAL COMPREHENSIVE INCOME | | | | | 384,084,841 | | | | 851,351,520 | | | | 985,034,084 | |
(*) Prior period amounts were adjusted to conform with current period classification of discontinued operations. See Note 5.1.II.iii
| | |
| The accompanying notes are an integral part of these consolidated financial statements | | |
|
| F-11 |
ENERSIS AMÉRICAS S.A. (FORMER ENERSIS S.A.) AND SUBSIDIARIES
Consolidated Statements of Changes in Equity
For the years ended December 31, 2015, 2014 and 2013
(In thousands of Chilean pesos)
| | | | | | | | | | | | | | | | | | | | | | | | | | | | | | | | | | | | | | | | | | | | | | | | | | | | |
| Statements of Changes in Equity | | Issued Capital | | | Share Premium | | | Changes in Other Reserves | | | Retained Earnings | | | Equity Attributable to Shareholders of Enersis
Américas | | | Non-controlling Interests | | | Total Equity | |
| | | | Reserve for Exchange Differences in Translation | | | Reserve for Cash Flow Hedges | | | Reserve for Gains and Losses for Defined Benefit Plans | | | Reserve for Gains and Losses on Remeasuring Available- for-Sale Financial Assets | | | Other Miscellaneous Reserves | | | Amounts recognized
in other
comprehensive
income and
accumulated in equity
related to non-current
assets or groups of
assets for disposal
classified as held for
sale | | | Other Reserves | | | | | |
| Equity at beginning of period 1/1/2015 | | | 5,804,447,986 | | | | - | | | | 35,154,874 | | | | (69,404,677) | | | | - | | | | 14,046 | | | | (2,619,970,627) | | | | - | | | | (2,654,206,384) | | | | 3,051,734,445 | | | | 6,201,976,047 | | | | 2,077,242,699 | | | | 8,279,218,746 | |
| Changes in equity | | | | | | | | | | | | | | | | | | | | | | | | | | | | | | | | | | | | | | | | | | | | | | | | | | | | |
Comprehensive income: | | | | | | | | | | | | | | | | | | | | | | | | | | | | | | | | | | | | | | | | | | | | | | | | | | | | |
Profit (loss) | | | | | | | | | | | | | | | | | | | | | | | | | | | | | | | | | | | | | | | 661,586,917 | | | | 661,586,917 | | | | 482,882,568 | | | | 1,144,469,485 | |
Other comprehensive income | | | | | | | | | | | (442,819,275) | | | | (60,939,077) | | | | (12,152,091) | | | | (166,950) | | | | (334,289) | | | | - | | | | (516,411,682) | | | | | | | | (516,411,682) | | | | (243,972,962) | | | | (760,384,644) | |
Comprehensive income | | | | | | | | | | | | | | | | | | | | | | | | | | | | | | | | | | | | | | | | | | | 145,175,235 | | | | 238,909,606 | | | | 384,084,841 | |
Dividends | | | | | | | | | | | | | | | | | | | | | | | | | | | | | | | | | | | | | | | (320,507,748) | | | | (320,507,748) | | | | (151,308,255) | | | | (471,816,003) | |
Increase (decrease) from other changes | | | | | | | | | | | (12,423,692) | | | | 121,503,052 | | | | 12,152,091 | | | | (14,835) | | | | (8,231,102) | | | | (101,327,672) | | | | 11,657,842 | | | | (12,152,091) | | | | (494,249) | | | | (1,184,955) | | | | (1,679,204) | |
Total changes in equity | | | | | | | | | | | (455,242,967) | | | | 60,563,975 | | | | - | | | | (181,785) | | | | (8,565,391) | | | | (101,327,672) | | | | (504,753,840) | | | | 328,927,078 | | | | (175,826,762) | | | | 86,416,396 | | | | (89,410,366) | |
| Equity at end of period 12/31/2015 | | | 5,804,447,986 | | | | - | | | | (420,088,093) | | | | (8,840,702) | | | | - | | | | (167,739) | | | | (2,628,536,018) | | | | (101,327,672) | | | | (3,158,960,224) | | | | 3,380,661,523 | | | | 6,026,149,285 | | | | 2,163,659,095 | | | | 8,189,808,380 | |
| | | | | | | | | | | | | | | | | | | | | | | | | | | | | | | | | | | | | | | | | | | | | | | | | | | | |
| Statement of Changes in Equity | | | Issued Capital | | |
| Share
Premium |
| | | Changes in Other Reserves | | |
| Retained
Earnings |
| |
| Equity
Attributable
to
Shareholders
of Enersis
Américas |
| |
| Non-controlling
Interests |
| | | Total Equity | |
| | | |
| Reserve for
Exchange
Differences
in
Translation |
| |
| Reserve for
Cash Flow
Hedges |
| |
| Reserve for
Gains and
Losses for
Defined
Benefit
Plans |
| |
| Reserve for
Gains and
Losses on
Remeasuring
Available-
for-Sale
Financial
Assets |
| |
| Other
Miscellaneous
Reserves |
| |
| Amounts recognized
in other
comprehensive
income and
accumulated in equity
related to non-current
assets or groups of
assets for disposal
classiried as held for
sale |
| | | Other Reserves | | | | | |
| Equity at beginning of period 1/1/2014 | | | 5,669,280,725 | | | | 158,759,648 | | | | (56,022,016) | | | | (3,086,726) | | | | - | | | | 11,811 | | | | (2,414,023,486) | | | | - | | | | (2,473,120,417) | | | | 2,813,634,297 | | | | 6,168,554,253 | | | | 2,338,910,608 | | | | 8,507,464,861 | |
| Changes in equity | | | | | | | | | | | | | | | | | | | | | | | | | | | | | | | | | | | | | | | | | | | | | | | | | | | | |
Comprehensive income: | | | | | | | | | | | | | | | | | | | | | | | | | | | | | | | | | | | | | | | | | | | | | | | | | | | | |
Profit (loss) | | | | | | | | | | | | | | | | | | | | | | | | | | | | | | | | | | | | | | | 571,873,342 | | | | 571,873,342 | | | | 395,621,866 | | | | 967,495,208 | |
Other comprehensive income | | | | | | | | | | | 29,929,142 | | | | (66,317,951) | | | | (19,023,003) | | | | 2,235 | | | | 7,818,482 | | | | - | | | | (47,591,095) | | | | | | | | (47,591,095) | | | | (68,552,593) | | | | (116,143,688) | |
Comprehensive income | | | | | | | | | | | | | | | | | | | | | | | | | | | | | | | | | | | | | | | | | | | 524,282,247 | | | | 327,069,273 | | | | 851,351,520 | |
Dividends | | | | | | | | | | | | | | | | | | | | | | | | | | | | | | | | | | | | | | | (314,750,191) | | | | (314,750,191) | | | | (459,728,319) | | | | (774,478,510) | |
Increase (decrease) from other changes | | | 135,167,261 | | | | (158,759,648) | | | | - | | | | - | | | | 19,023,003 | | | | - | | | | 25,112,860 | | | | - | | | | 44,135,863 | | | | (19,023,003) | | | | 1,520,473 | | | | - | | | | 1,520,473 | |
Increase (decrease) from changes in ownership interests in subsidiaries that do not result in loss of control | | | | | | | | | | | 61,247,748 | | | | | | | | | | | | | | | | (238,878,483) | | | | - | | | | (177,630,735) | | | | - | | | | (177,630,735) | | | | (129,008,863) | | | | (306,639,598) | |
Total changes in equity | | | 135,167,261 | | | | (158,759,648) | | | | 91,176,890 | | | | (66,317,951) | | | | - | | | | 2,235 | | | | (205,947,141) | | | | - | | | | (181,085,967) | | | | 238,100,148 | | | | 33,421,794 | | | | (261,667,909) | | | | (228,246,115) | |
| Equity at end of period 12/31/2014 | | | 5,804,447,986 | | | | - | | | | 35,154,874 | | | | (69,404,677) | | | | - | | | | 14,046 | | | | (2,619,970,627) | | | | - | | | | (2,654,206,384) | | | | 3,051,734,445 | | | | 6,201,976,047 | | | | 2,077,242,699 | | | | 8,279,218,746 | |
| | |
| The accompanying notes are an integral part of these consolidated financial statements | | |
|
| F-12 |
| | | | | | | | | | | | | | | | | | | | | | | | | | | | | | | | | | | | | | | | | | | | | | | | | | | | |
| Statement of Changes in Equity | | Issued Capital | | | Share
Premium | | | Changes in Other Reserves | | | Retained
Earnings | | | Equity
Attributable
to
Shareholders
of Enersis
Américas | | | Non- controlling
Interests | | | Total Equity | |
| | | | Reserve for
Exchange
Differences
in Translation | | | Reserve for
Cash Flow
Hedges | | | Reserve for
Gains and
Losses for
Defined
Benefit
Plans | | | Reserve for
Gains and
Losses on
Remeasuring
Available-
for-Sale
Financial
Assets | | | Other
Miscellaneous
Reserves | | | Amounts recognized
in other
comprehensive
income and
accumulated in
equity related to
non-current assets
or groups of assets
for disposal
classified as held for
sale | | | Other Reserves | | | | | |
| Equity at beginning of period 1/1/2013 | | | 2,824,882,835 | | | | 158,759,648 | | | | (40,720,059) | | | | 27,594,028 | | | | - | | | | 13,647 | | | | (1,498,010,369) | | | | - | | | | (1,511,122,753) | | | | 2,421,278,841 | | | | 3,893,798,571 | | | | 3,064,408,474 | | | | 6,958,207,045 | |
| Changes in equity | | | | | | | | | | | | | | | | | | | | | | | | | | | | | | | | | | | | | | | | | | | | | | | | | | | | |
Comprehensive income: | | | | | | | | | | | | | | | | | | | | | | | | | | | | | | | | | | | | | | | | | | | | | | | | | | | | |
Profit (loss) | | | | | | | | | | | | | | | | | | | | | | | | | | | | | | | | | | | | | | | 658,514,150 | | | | 658,514,150 | | | | 454,886,596 | | | | 1,113,400,746 | |
Other comprehensive income | | | | | | | | | | | (57,187,681) | | | | (30,680,754) | | | | 6,865,655 | | | | (1,836) | | | | (160,850) | | | | - | | | | (81,165,466) | | | | | | | | (81,165,466) | | | | (47,201,196) | | | | (128,366,662) | |
Comprehensive income | | | | | | | | | | | | | | | | | | | | | | | | | | | | | | | | | | | | | | | | | | | 577,348,684 | | | | 407,685,400 | | | | 985,034,084 | |
Issue of equity | | | 2,844,397,890 | | | | 1,460,503 | | | | | | | | | | | | | | | | | | | | | | | | | | | | | | | | - | | | | 2,845,858,393 | | | | | | | | 2,845,858,393 | |
Dividends | | | | | | | | | | | | | | | | | | | | | | | | | | | | | | | | | | | | | | | (273,024,349) | | | | (273,024,349) | | | | (387,641,111) | | | | (660,665,460) | |
Increase (decrease) from other changes | | | - | | | | (1,460,503) | | | | - | | | | - | | | | (6,865,655) | | | | - | | | | 74,015,741 | | | | - | | | | 67,150,086 | | | | 6,865,655 | | | | 72,555,238 | | | | (910,579) | | | | 71,644,659 | |
Increase (decrease) from changes in ownership interests in subsidiaries that do not result in loss of control | | | | | | | | | | | 41,885,724 | | | | | | | | | | | | | | | | (989,868,008) | | | | - | | | | (947,982,284) | | | | - | | | | (947,982,284) | | | | (744,631,576) | | | | (1,692,613,860) | |
Total changes in equity | | | 2,844,397,890 | | | | - | | | | (15,301,957) | | | | (30,680,754) | | | | - | | | | (1,836) | | | | (916,013,117) | | | | - | | | | (961,997,664) | | | | 392,355,456 | | | | 2,274,755,682 | | | | (725,497,866) | | | | 1,549,257,816 | |
| Equity at end of period 12/31/2013 | | | 5,669,280,725 | | | | 158,759,648 | | | | (56,022,016) | | | | (3,086,726) | | | | - | | | | 11,811 | | | | (2,414,023,486) | | | | - | | | | (2,473,120,417) | | | | 2,813,634,297 | | | | 6,168,554,253 | | | | 2,338,910,608 | | | | 8,507,464,861 | |
| | |
| The accompanying notes are an integral part of these consolidated financial statements | | |
|
| F-13 |
ENERSIS AMÉRICAS S.A. (FORMER ENERSIS S.A.) AND SUBSIDIARIES
Consolidated Statements of Cash Flows, Direct
For the years ended December 31, 2015, 2014 and 2013
(In thousands of Chilean pesos)
| | | | | | | | | | | | | | | | |
| | | | | | 2015 | | | 2014 | | | 2013 | |
| Statements of Direct Cash Flows | | Note | | | ThCh$ | | | ThCh$ | | |
ThCh$
| |
| | | | | | | | | | | | | | | | |
| Cash flows from (used in) operating activities | | | | | | | | | | | | | | | | |
| | | | | | | | | | | | | | | | |
Types of collection from operating activities | | | | | | | | | | | | | | | | |
Collections from the sale of goods and services | | | | | | | 8,983,646,820 | | | | 7,786,425,908 | | | | 6,946,352,718 | |
Collections from royalties, payments, commissions, and other income from ordinary activities | | | | | | | 40,395,210 | | | | 53,736,441 | | | | 92,757,838 | |
Collections from premiums and services, annual payments, and other benefits from policies held | | | | | | | 24,800,978 | | | | 20,348,278 | | | | 74,183,266 | |
Other collections from operating activities | | | | | | | 593,726,467 | | | | 793,806,980 | | | | 503,343,750 | |
Types of payment in cash from operating activities | | | | | | | | | | | | | | | | |
Payments to suppliers for goods and services | | | | | | | (4,875,217,622) | | | | (4,395,777,186) | | | | (3,690,576,400) | |
Payments to and on behalf of employees | | | | | | | (554,559,784) | | | | (482,784,407) | | | | (448,354,032) | |
Payments on premiums and services, annual payments, and other obligations from policies held | | | | | | | (14,484,698) | | | | (15,147,534) | | | | (5,782,311) | |
Other payments for operating activities | | | | | | | (1,572,807,177) | | | | (1,418,097,022) | | | | (1,176,355,154) | |
Cash flows from operating activities | | | | | | | | | | | | | | | | |
Income taxes paid | | | | | | | (451,694,741) | | | | (428,343,722) | | | | (381,648,502) | |
Other outflows of cash | | | | | | | (250,354,851) | | | | (216,129,742) | | | | (212,945,529) | |
| | | | | | | | | | | | | | | | |
| Net cash flows from operating activities | | | | | | | 1,923,450,602 | | | | 1,698,037,994 | | | | 1,700,975,644 | |
| | | | | | | | | | | | | | | | |
| Cash flows from (used in) investing activities | | | | | | | | | | | | | | | | |
Cash flows from the loss of control of subsidiaries or other businesses | | | 8.e | | | | 6,639,653 | | | | 40,861,571 | | | | - | |
Cash flows used to obtain control of subsidiaries or other businesses | | | 8.c | | | | - | | | | (37,654,762) | | | | - | |
Other collections from the sale of equity or debt instruments belonging to other entities | | | | | | | 395,810,811 | | | | 1,126,402,278 | | | | 871,863,989 | |
Other payments to acquire equity or debt instruments belonging to other entities | | | | | | | (353,112,647) | | | | (480,297,836) | | | | (1,433,536,193) | |
Other payments to acquire stakes in joint ventures | | | | | | | (2,550,000) | | | | (3,315,000) | | | | (5,084,700) | |
Loans to related companies | | | | | | | - | | | | - | | | | (4,844,706) | |
Proceeds from the sale of property, plant and equipment | | | | | | | 49,916 | | | | 167,486 | | | | 5,462,527 | |
Purchases of property, plant and equipment | | | | | | | (1,090,624,099) | | | | (825,909,425) | | | | (603,413,832) | |
Purchases of intangible assets | | | | | | | (271,937,266) | | | | (260,500,759) | | | | (169,371,666) | |
Proceeds from the sale of other long-term assets | | | | | | | 1,729,727 | | | | 2,037,930 | | | | 1,987,002 | |
Purchases of other long-term assets | | | | | | | - | | | | (2,952,035) | | | | (2,034,104) | |
Payments from future, forward, option and swap contracts | | | | | | | (6,888,344) | | | | (26,683,724) | | | | (3,485,915) | |
Collections from future, forward, option and swap contracts | | | | | | | 17,266,466 | | | | 16,957,654 | | | | 14,308,008 | |
Collections from related companies | | | | | | | - | | | | - | | | | 4,895,411 | |
Dividends received | | | | | | | 11,313,451 | | | | 13,567,998 | | | | 9,081,705 | |
Interest received | | | | | | | 58,724,646 | | | | 93,410,873 | | | | 92,176,821 | |
Other inflows (outflows) of cash | | | | | | | 18,278,638 | | | | 44,220,761 | | | | (1,891,436) | |
| | | | | | | | | | | | | | | | |
| Net cash flows used in investing activities | | | | | | | (1,215,299,048) | | | | (299,686,990) | | | | (1,223,887,089) | |
| | | | | | | | | | | | | | | | |
| Cash flows from (used in) financing activities | | | | | | | | | | | | | | | | |
Proceeds from issuing shares | | | | | | | - | | | | 8,783,766 | | | | 1,130,817,519 | |
Payments from changes in ownership interests in subsidiaries that do not result in loss of control | | | | | | | (2,374,346) | | | | (385,132,160) | | | | - | |
Total proceeds from loans | | | | | | | 475,558,223 | | | | 774,199,941 | | | | 530,735,256 | |
Proceeds from long-term loans | | | | | | | 105,645,839 | | | | 740,518,825 | | | | 487,162,501 | |
Proceeds from short-term loans | | | | | | | 369,912,384 | | | | 33,681,116 | | | | 43,572,755 | |
Loans from related companies | | | | | | | - | | | | - | | | | 693,084 | |
Payment on borrowings | | | | | | | (614,937,402) | | | | (622,496,486) | | | | (563,049,681) | |
Payments on financial lease liabilities | | | | | | | (19,737,180) | | | | (16,559,995) | | | | (9,388,183) | |
Payments on loans to related companies | | | | | | | - | | | | (17,236,440) | | | | - | |
Dividends paid | | | | | | | (612,045,894) | | | | (632,808,121) | | | | (482,046,152) | |
Interest paid | | | | | | | (266,756,065) | | | | (246,769,836) | | | | (230,584,133) | |
Other outflows of cash | | | | | | | (19,921,715) | | | | (145,440,332) | | | | (40,412,354) | |
| | | | | | | | | | | | | | | | |
| Net cash flows from (used in) financing activities | | | | | | | (1,060,214,379) | | | | (1,283,459,663) | | | | 336,765,356 | |
| | | | | | | | | | | | | | | | |
| Net increase (decrease) in cash and cash equivalents before effect of exchange rate changes | | | | | | | (352,062,825) | | | | 114,891,341 | | | | 813,853,911 | |
| | | | | | | | | | | | | | | | |
| Effect of exchange rate changes on cash and cash equivalents | | | | | | | | | | | | | | | | |
Effect of exchange rate changes on cash and cash equivalents | | | | | | | (23,287,179) | | | | (16,503,717) | | | | (23,298,403) | |
| Net increase (decrease) in cash and cash equivalents | | | | | | | (375,350,004) | | | | 98,387,624 | | | | 790,555,508 | |
Cash and cash equivalents at beginning of period | | | 8 | | | | 1,704,775,193 | | | | 1,606,387,569 | | | | 815,832,061 | |
| Cash and cash equivalents at end of period | | | 8.d | | | | 1,329,425,189 | | | | 1,704,775,193 | | | | 1,606,387,569 | |
| | |
| The accompanying notes are an integral part of these consolidated financial statements | | |
|
| F-14 |
ENERSIS AMÉRICAS S.A. (FORMER ENERSIS S.A.) AND SUBSIDIARIES
NOTES TO THE CONSOLIDATED FINANCIAL STATEMENTS
| | |
| The accompanying notes are an integral part of these consolidated financial statements | | |
|
| F-15 |
| | |
| The accompanying notes are an integral part of these consolidated financial statements | | |
|
| F-16 |
| | |
| The accompanying notes are an integral part of these consolidated financial statements | | |
|
| F-17 |
ENERSIS AMÉRICAS S.A. (FORMER ENERSIS S.A.) AND SUBSIDIARIES
CONSOLIDATED FINANCIAL STATEMENTS FOR THE YEAR ENDED DECEMBER 31, 2015 AND 2014
(In thousands of Chilean pesos)
| | 1. | THE GROUP’S ACTIVITIES AND FINANCIAL STATEMENTS. |
Enersis Américas S.A. (former Enersis S.A.) (hereinafter “the Parent Company” or “the Company”) and its subsidiaries comprise the Enersis Américas Group (hereinafter “Enersis Américas Group” or “the Group”).
Enersis Américas S.A. is a publicly traded corporation with registered address and head office located at Avenida Santa Rosa, No. 76, in Santiago, Chile. The Company is registered in the securities register of the Superintendency of Securities and Insurance of Chile (Superintendencia de Valores y Seguros or SVS) under number 175. In addition, the Company is registered with the Securities and Exchange Commission of the United States of America (hereinafter U.S. SEC) and with Spain’sComisión Nacional del Mercado de Valores. The Company’s shares have been listed on the New York Stock Exchange since 1993. On April 13, 2016, the Superintendency of Securities and Insurance has registered Enersis Chile and its shares in its Securities Registry, and has made the respective listings in the Santiago Stock Exchange, the Valparaíso Stock Exchange, the Chile Electronic Stock Exchange and the New York Stock Exchange of United States of America, all in accordance with the decision made at the Extraordinary Shareholders’ Meeting of Enersis Américas S.A. held on December 18, 2015. Therefore, the issued shares of Enersis Chile were distributed free of any payment to the entitled shareholders of Enersis Américas S.A. on April 21, 2016, and began to be traded on that date.
Enersis Américas S.A. is a subsidiary of Enel Iberoamérica S.R.L., a company controlled by Enel S.p.A. (hereinafter Enel).
The Company was initially created in 1981 under the corporate name of Compañía Chilena Metropolitana de Distribución Eléctrica S.A. Later on, the Company changed its by-laws and its name to Enersis S.A. effective August 1, 1988. On February 1, 2016, as part of the reorganization process carried out by the Group (See Notes 5.1 and 41), the Company by amending its by-laws, has changed its corporate name to Enersis Américas S.A.
For tax purposes, the Company operates under Chilean tax identification number 94,271,000-3.
As of December 31, 2015, the Group had 12,202 employees. During the 2015 fiscal year, the Group averaged a total of 12,348 employees. See Note 37 for additional information regarding employee distribution by category and geographic location.
Enersis Américas’s corporate purpose consists of exploring for, developing, operating, generating, distributing, transmitting, transforming, and/or selling energy of any kind or form, whether in Chile or abroad, either directly or through other companies. It is also engaged in telecommunications activities, and it provides engineering consultation services in Chile and abroad. The Company’s corporate purpose also includes investing in, and managing, its investments in subsidiaries and associates which generate, transmit, distribute, or sell electricity, or whose corporate purpose includes any of the following:
| | (i) | Energy of any kind or form, |
| | (ii) | Supplying public services, or services whose main component is energy, |
| | (iii) | Telecommunications and information technology services, and |
| | (iv) | Internet-based intermediation business. |
Enersis Américas’s 2014 consolidated financial statements were approved by the Board of Directors at meeting held on April 29, 2015. The consolidated financial statements were then submitted to the consideration of a General Shareholders´ Meeting held on April 28, 2015, which finally approved the consolidated financial statements.
These consolidated financial statements are presented in thousands of Chilean pesos (unless otherwise stated), as the Chilean peso is the functional currency of the Company. Foreign operations are incorporated in accordance with the accounting policies stated in Notes 2.6 and 3.n.
| | |
| The accompanying notes are an integral part of these consolidated financial statements | | |
|
| F-18 |
| | 2. | BASIS OF PRESENTATION OF THE CONSOLIDATED FINANCIAL STATEMENTS. |
2.1 Accounting principles
The December 31, 2015 consolidated financial statements of Enersis Américas, approved by the Company’s Board of Directors at its meeting held on February 26, 2016, have been prepared in accordance with International Financial Reporting Standards (IFRS) as issued by the International Accounting Standards Board (IASB).
These consolidated financial statements present fairly the financial position of Enersis Américas and its subsidiaries as of December 31, 2015 and 2014, as well as the results of operations, the changes in equity, and the cash flows for the years ended December 31, 2015, 2014 and 2013.
These consolidated financial statements have been prepared under going concern assumptions on a historical cost basis except for, in accordance with IFRS, those assets and liabilities that are measured at fair value and those non-current assets and disposal groups held for sale, which are recognized at their carrying amount or fair value less cost of disposal, whichever is lower (see Note 3).
These consolidated financial statements have been prepared from accounting records maintained by the Company and its subsidiaries. Each entity prepares its financial statements according to the accounting principles and standards in force in each country, so the necessary adjustments and reclassifications have been made in the consolidation process in order to present the consolidated financial statements in accordance with IFRS.
| | 2.2 | New accounting pronouncements |
| | a) | Accounting pronouncements effective from January 1, 2015: |
| | | | |
Standards, Interpretations and Amendments | | | | Mandatory Application for: |
Amendment to IAS 19: Employee Benefits The purpose of this amendment is to simplify the accounting for contributions from employees or third parties that are not determined on the basis of an employee’s years of service, such as employee contributions calculated according to a fixed percentage of salary. | | | | Annual periods beginning on or after July 1, 2014. |
Improvements to IFRS (Cycles 2010-2012 and 2011-2013) These are a set of improvements that were necessary, but not urgent, and that amend the following standards: IFRS 2, IFRS 3, IFRS 8, IFRS 13, IAS 16, IAS 24, IAS 38 and IAS 40. | | | | Annual periods beginning on or after July 1, 2014. |
The amendments and improvements to standards, which came into effect on January 1, 2015, had no effect on the consolidated financial statements of Enersis Américas and its subsidiaries.
| | |
| The accompanying notes are an integral part of these consolidated financial statements | | |
|
| F-19 |
| | b) | Accounting pronouncements in effect from January 1, 2016, and subsequent periods: |
As of the date of issue of these consolidated financial statements, the following accounting pronouncements had been issued by the IASB, but their application was not yet mandatory:
| | | | |
Standards, Interpretations and Amendments | | | | Mandatory Application for: |
Amendment to IFRS 11: Joint Arrangements This amendment states that the accounting standards contained in IFRS 3 and other standards that are pertinent to business combinations accounting must be applied to the accounting for acquiring an interest in a joint operation in which the activities constitutes a business. | | | | Annual periods beginning on or after January 1, 2016. |
Amendment to IAS 16 and IAS 38: Clarification of Acceptable Methods of Depreciation and Amortization The amendment to IAS 16 explicitly forbids the use of revenue-based depreciation for property, plant and equipment. The amendment to IAS 38 introduces the rebuttable presumption that, for intangible assets, the revenue-based amortization method is inappropriate and establishes two limited exceptions. | | | | Annual periods beginning on or after January 1, 2016. |
Improvements to IFRS (Cycles 2012-2014) These are a set of improvements that were necessary, but not urgent, and that amend the following standards IFRS 5, IFRS7, IAS19 and IAS 34. | | | | Annual periods beginning on or after January 1, 2016. |
Amendment to IFRS 10 and IAS 28: Sale or Contribution of Assets The amendment corrects an inconsistency between IFRS 10 and IAS 28 relating to the accounting treatment of the sale or contributions of assets between an Investor and its Associate or Joint Venture. | | | | Annual periods beginning on or after January 1, 2016. |
Amendment to IAS 27: Equity Method in Separate Financial Statements This amendment allows entities to use the equity method to account for investments in subsidiaries, joint ventures and associates in their separate financial statements. The objective of the amendment is to minimize the costs associated with complying with the IFRS, particularly for those entities applying IFRS for the first time, without reducing the information available to investors. | | | | Annual periods beginning on or after January 1, 2016. |
Amendment to IAS 1: Disclosure Initiative The IASB has issued amendments to IAS 1 as part of its principal initiative to improve the presentation and disclosure of information in financial statements. These improvements are designed to assist companies in applying professional judgment to determine what type of information to disclose in their financial statements. | | | | Annual periods beginning on or after January 1, 2016. |
| | |
| The accompanying notes are an integral part of these consolidated financial statements | | |
|
| F-20 |
| | | | |
Standards, Interpretations and Amendments | | | | Mandatory application for: |
Amendment to IFRS 10, IFRS 12 and IAS 28: Investment Entities, Application of the Consolidation Exception The modifications, which have a restricted scope, introduce clarifications to the requirements for the accounting of investment entities. The modifications also provide relief in some circumstances, which will reduce the costs of applying the Standards. | | | | Annual periods beginning on or after January 1, 2016. |
IFRS 9: Financial Instruments This is the final version of the standard issued in July 2014 and which completes the IASB project to replace IAS 39 “Financial Instruments: Recognition and Measurement.” This project was divided into 3 phases: Phase 1 – Classification and measurement of financial assets and financial liabilities. This introduces a logical focus for the classification of financial assets driven by cash flow characteristics and the business model. This new model also results in a single impairment model being applied to all financial instruments. Phase 2 – Impairment methodology. The objective is a more timely recognition of expected credit losses. The standard requires entities to account for expected credit losses from the time when financial instruments are first recognized in the financial statements. Phase 3 – Hedge accounting. This establishes a new model aimed at reflecting better alignment between hedge accounting and risk management activity. Also included are enhancements to required disclosures. This final version of IFRS 9 replaces the previous versions of the Standard. | | | | Annual periods beginning on or after January 1, 2018. |
IFRS 15: Revenue from Contracts with Customers | | | | |
This new standard applies to all contracts with customers except leases, financial instruments and insurance contracts. Its purpose is to make financial information more comparable, and it provides a new model for revenue recognition and more detailed requirements for contracts with multiple obligations. It also requires more itemized information. This standard will replace IAS 11 and IAS 18 as well as their interpretations (IFRIC 13, IFRIC 15, IFRIC 18 and SIC 31). | | | | Annual periods beginning on or after January 1, 2018. |
IFRS 16: Leases | | | | |
This new standard provides a definition of a lease contract and specifies the accounting treatment for the assets and liabilities originated under those contracts from both lessor and lessee perspective. Lessor accounting remains largely unchanged from its predecessor IAS 17, Leases. However, for lessee accounting, the new standard requires recognition of a right of use assets and a corresponding liability, similar to finance lease accounting under IAS 17, for most lease contracts. | | | | Annual periods beginning on or after January 1, 2019. |
The Group is assessing the impact of applying IFRS 9, IFRS 15 and IFRS 16 upon effective application. In Management’s opinion, the future application of the other standards and amendments is not expected to have a significant effect on the consolidated financial statements of Enersis Américas and its subsidiaries.
2.3 Responsibility for the information, judgments and estimates provided
The Company’s Board of Directors is responsible for the information contained in these consolidated financial statements and expressly states that all IFRS principles and standards have been fully implemented.
In preparing the consolidated financial statements, certain judgments and estimates made by the Company’s Management have been used to quantify some of the assets, liabilities, income, expenses and commitments recognized in these consolidated financial statements.
| | |
| The accompanying notes are an integral part of these consolidated financial statements | | |
|
| F-21 |
The most important areas were critical judgment was required are:
| | - | In a service concession agreement, the decision as to whether a grantor controls or regulates which services the operator should provide, to whom and at what price. These are essential factors when applying IFRIC 12 (see Note 3.d.1). |
| | - | The identification of Cash Generating Units (CGU) for impairment testing (see Note 3.e). |
| | - | The hierarchy of inputs used to measure assets and liabilities at fair value (see Note 3.h) |
The estimates refer basically to:
| | - | The valuations performed to determine the existence of impairment losses among assets and goodwill (see Note 3.e). |
| | - | The assumptions used to calculate the actuarial liabilities and obligations to employees, such as discount rates, mortality tables, salary increases, etc. (see Notes 3.m.1 and 25). |
| | - | The useful life of property, plant and equipment, and intangible assets (see Notes 3.a and 3.d). |
| | - | The assumptions used to calculate the fair value of financial instruments (see Notes 3.g.5 and 22). |
| | - | Energy supplied to customers whose meter readings are pending. |
| | - | Certain assumptions inherent in the electricity system affecting transactions with other companies, such as production, customer billings, energy consumption, etc. that allow for estimating electricity system settlements that must occur on the corresponding final settlement dates, but that are pending as of the date of issuance of the consolidated financial statements and could affect the balances of assets, liabilities, income and expenses recognized in the financial statements (see Appendix 7.2). |
| | - | The probability that uncertain or contingent liabilities will be incurred and their related amounts (see Note 3.m). |
| | - | Future disbursements for the closure of facilities and restoration of land, as well as the discount rates to be used (see Note 3.a). |
| | - | The tax results of the various subsidiaries of the Group that will be reported to the respective tax authorities in the future, and that have served as the basis for recording different balances related to income taxes in these consolidated financial statements (see Note 3.p). |
| | - | The fair values of assets acquired and liabilities assumed, and any pre-existing interest in an entity acquired in a business combination. |
Although these judgments and estimates have been based on the best information available on the issuance date of these consolidated financial statements, future events may occur that would require a change (increase or decrease) to these estimates in subsequent periods. This change would be made prospectively, recognizing the effects of such judgment or estimation change in the corresponding future consolidated financial statements.
2.4 Subsidiaries
Subsidiaries are defined as those entities controlled either, directly or indirectly, by Enersis Américas. Control is exercised if, and only if, the following conditions are met: Enersis Américas has i) power over the subsidiary; ii) exposure or rights to variable returns from these entities; and iii) the ability to use its power to influence the amount of these returns.
Enersis Américas has power over its subsidiaries when it holds the majority of the substantive voting rights or, should that not be the case, when it has rights granting the practical ability to direct the entities’ relevant activities, that is, the activities that significantly affect the subsidiary’s results.
The Group will reassess whether or not it controls a subsidiary if the facts and circumstances indicate that there are changes to one or more of the three elements of control listed above.
Appendix 1. “Enersis Américas Group Entities” to these consolidated financial statements describes the relationship of Enersis Américas with each of its subsidiaries.
| | |
| The accompanying notes are an integral part of these consolidated financial statements | | |
|
| F-22 |
2.4.1 Changes in the scope of consolidation
On January 9, 2015, our subsidiary Empresa Nacional de Electricidad S.A. (Endesa Chile S.A.), sold all the shares owned in Sociedad Concesionaria Túnel El Melón S.A. for ThCh$25,000,000.
The elimination of Sociedad Concesionaria Túnel El Melón S.A. from Enersis Américas Group’s scope of consolidation caused a decrease in the consolidated statement of financial position of ThCh$871,022 in current assets, ThCh$7,107,941 in non-current assets, ThCh$3,698,444 in current liabilities and ThCh$1,789,703 in non-current liabilities.
On December 30, 2014, Inmobiliaria Manso de Velasco Ltda, a subsidiary of Enersis Américas, completed the sale of all of its direct and indirect ownership interest in the companies Construcciones y Proyectos Los Maitenes S.A. and Aguas Santiago Poniente S.A. The selling price of these shares was ThCh$57,173,143, which was received in cash on the same date.
The elimination of Maitenes S.A. and Aguas Santiago Poniente S.A. from the Enersis Américas Group’s scope of consolidation caused a decrease in the consolidated statement of financial position of ThCh$54,845,853 in current assets, ThCh$12,822,077 in non-current assets, and ThCh$1,393,348 in current liabilities; there was no effect on non-current liabilities.
During the first half of 2014, the company Inversiones GasAtacama Holding Limitada entered the Enersis Américas Group’s scope of consolidation as a result of Endesa Chile S.A.’s acquisition of a 50% stake in that company on April 22, 2014 (see Note 6).
Pursuant to this operation, the following companies became subsidiaries of the Group: Inversiones GasAtacama Holding Limitada, GasAtacama S.A., GasAtacama Chile S.A., Gasoducto TalTal S.A., Progas S.A., Gasoducto Atacama Argentina S.A., Atacama Finance Co., GNL Norte S.A. and Energex Co.
The incorporation of GasAtacama Holding Limitada into the Enersis Américas Group’s scope of consolidation caused an increase in the consolidated statement of financial position of ThCh$198,924,289 in current assets, ThCh$221,471,415 in non-current assets, ThCh$69,989,919 in current liabilities, and ThCh$35,672,488 in non-current liabilities.
As of December 31, 2015, GasAtacama’s assets and liabilities have been reclassified as assets held for distribution to owners. Likewise, its results of operations for the years 2015, 2014 and 2013 have been classified as discontinued operations (See note 3.k and 5.1).
2.4.2 Consolidated companies with an ownership interest of less than 50%
Although the Group holds, directly or indirectly, 48.48% equity interest in the companies Comercializadora de Energía S.A. (Codensa) and Empresa Generadora de Energía Eléctrica S.A. (Emgesa), they are considered as subsidiaries since Enersis Américas exercises control over the entities through contracts or agreements with shareholders, or as a consequence of their structure, composition and shareholder classes. The Group holds 57.15% and 56.43% of the voting shares of Codensa and Emgesa, respectively.
2.4.3 Unconsolidated companies with an ownership interest of more than 50%
Although the Enersis Américas Group holds more than a 50% equity interest in Centrales Hidroeléctricas de Aysén S.A. (Aysén), it is considered a “joint venture” since the Group, through contracts or agreements with shareholders, exercises joint control of the company.
As of December 31, 2015, Aysén’s assets and liabilities have been reclassified as assets held for distribution to owners. Likewise, its results of operations for the years 2015, 2014 and 2013 have been reclassified as discontinued operations (See note 3.k and 5.1).
2.5 Investments in associates and joint arrangements
Associates are those in which Enersis Américas, either directly or indirectly, exercises significant influence.
Significant influence is the power to participate in the financial and operational policy decisions of the associate but is not control or joint control over those policies. In general, significant influence is presumed to be those cases in which the Group has an ownership interest of more than 20% (see Note 3.i).
| | |
| The accompanying notes are an integral part of these consolidated financial statements | | |
|
| F-23 |
Joint arrangements are defined as those entities in which the Group exercises control under an agreement with other shareholders and jointly with them, in other words, when decisions on the entities’ relevant activities require the unanimous consent of the parties sharing control. Joint arrangements are classified as:
| | - | Joint ventures: an agreement whereby the parties exercising joint control have rights to the entity’s net assets. |
| | - | Joint operation: an agreement whereby the parties exercising joint control have rights to the assets and obligations with respect to the liabilities relating to the arrangement. Currently, Enersis Américas does not have any joint arrangements that qualify as joint operations. |
Appendix 3. “Associated Companies and Joint Ventures” to these consolidated financial statements describes the relationship of Enersis Américas with each of these companies.
2.6 Basis of consolidation and business combinations
The subsidiaries are consolidated and all their assets, liabilities, income, expenses, and cash flows are included in the consolidated financial statements once the adjustments and eliminations from intragroup transactions have been made.
The comprehensive income of subsidiaries is included in the consolidated comprehensive income statement from the date when the parent company obtains control of the subsidiary and until the date on which it loses control of the subsidiary.
The operations of the parent company and its subsidiaries have been consolidated under the following basic principles:
| | 1. | At the date the parent obtains control, the subsidiary’s assets acquired and its liabilities assumed are recorded at fair value, except for certain assets and liabilities that are recorded using valuation principles established in other IFRS standards. If the fair value of the consideration transferred plus the fair value of any non-controlling interests exceeds the fair value of the net assets acquired, this difference is recorded as goodwill. In the case of a bargain purchase, the resulting gain is recognized in profit or loss for the period after reassessing whether all of the assets acquired and the liabilities assumed have been properly identified and following a review of the procedures used to measure the fair value of these amounts. |
| | | For each business combination, the Group chooses whether to measure the non-controlling interests in an acquired company at fair value or at the proportional share of the net identifiable assets acquired. |
| | | If the fair value of all assets acquired and liabilities assumed at the acquisition date has not been completed, the Group reports the provisional values recorded. During the measurement period, which shall not exceed one year from the acquisition date, the provisional values recognized will be adjusted retrospectively and additional assets or liabilities will be recognized to reflect new information obtained on events and circumstances that existed on the acquisition date, but which were unknown to the management at that time. |
| | | For business combinations achieved in stages, the fair value of the equity interest previously held in the acquired company’s equity is measured on the date of acquisition and any gain or loss is recognized in the results for that fiscal year. |
| | 2. | Non-controlling interests in equity and in the comprehensive income of the consolidated subsidiaries are presented, respectively, under the line items “Total Equity: Non-controlling interests” in the consolidated statement of financial position and “Net Income attributable to non-controlling interests” and “Comprehensive income attributable to non-controlling interests” in the consolidated statement of comprehensive income. |
| | 3. | The financial statements of foreign companies with functional currencies other than the Chilean peso are translated as follows: |
| | a. | For assets and liabilities, the prevailing exchange rate on the closing date of the financial statements is used. |
| | b. | For items in the comprehensive income statement, the average exchange rate for the period is used (unless this average is not a reasonable approximation of the cumulative effect of the exchange rates in effect on the dates of the transactions, in which case the exchange rate in effect on the date of each transaction is used). |
| | |
| The accompanying notes are an integral part of these consolidated financial statements | | |
|
| F-24 |
| | c. | Equity remains at the historical exchange rate from the date of acquisition or contribution, and retained earnings at the average exchange rate at the date of origination. |
| | d. | Exchange differences arising in translation of financial statements are recognized in the item “Foreign currency translation gains (losses)” within the consolidated statement of comprehensive income: Other comprehensive income (see Note 26.2). |
| | |
| The accompanying notes are an integral part of these consolidated financial statements | | |
|
| F-25 |
| | 4. | Balances and transactions between consolidated companies were fully eliminated in the consolidation process. |
| | 5. | Changes in interests in subsidiaries that do not result in obtaining or losing control are recognized as equity transactions, and the carrying amount of the controlling and non-controlling interests is adjusted to reflect the change in relative interest in the subsidiary. Any difference that may exist, between the value for which a non-controlling interest is adjusted and the fair value of a compensation paid or received, is recognized directly in Equity attributable to the shareholders of Enersis Américas. |
| | 6. | Business combinations under common control are recorded using, as a reference, the ‘pooling of interest’ method. Under this method, the assets and liabilities involved in the transaction remain reflected at the same carrying amount at which they were recorded in the ultimate controlling company, although subsequent accounting adjustments may need to be made to align the accounting policies of the companies involved. |
| | | Any difference between the assets and liabilities contributed to the consolidation and the compensation given is recorded directly in Net equity as a debit or credit to other reserves. The Group does not apply retrospective accounting records of business combinations under common control. |
| | |
| The accompanying notes are an integral part of these consolidated financial statements | | |
|
| F-26 |
| | 3. | ACCOUNTING POLICIES APPLIED. |
The main accounting policies used in preparing the accompanying consolidated financial statements were the following:
| | a) | Property, plant and equipment |
Property, plant and equipment are measured at acquisition cost, net of accumulated depreciation and any impairment losses they may have experienced. In addition to the price paid to acquire each item, the cost also includes, where applicable, the following concepts:
| | - | Financing expenses accrued during the construction period that are directly attributable to the acquisition, construction, or production of qualified assets, which require a substantial period of time before being ready for use such as, for example, electricity generation or distribution facilities. The Group defines “substantial period” as one that exceeds twelve months. The interest rate used is that of the specific financing or, if none exists, the weighted average financing rate of the company carrying out the investment. (See Note 17.b.1) |
| | - | Employee expenses directly related to construction in progress. (See Note 17.b.2) |
| | - | Future disbursements that the Group will have to incur to close its facilities are added to the value of the asset at fair value, recognizing the corresponding provision for dismantling or restoration. The Group reviews its estimate of these future disbursements on an annual basis, increasing or decreasing the value of the asset based on the results of this estimate (see Note 24). |
Items for construction work in progress are transferred to operating assets once the testing period has been completed and they are available for use, at which time depreciation begins.
Expansion, modernization or improvement costs that represent an increase in productivity, capacity or efficiency, or a longer useful life are capitalized as increasing the cost of the corresponding assets.
The replacement or overhaul of entire components that increase the asset’s useful life or economic capacity are recognized as an increase in the carrying amount of the respective assets, derecognizing the replaced or overhauled components.
Expenditures for periodic maintenance, conservation and repair are recognized directly as an expense for the period in which they are incurred.
The Company, based on the outcome of impairment testing performed as explained in Note 3.e), considers that the carrying amount of the assets does not exceed their recoverable value.
Property, plant and equipment, net of its residual value, is depreciated by distributing the cost of the different items that comprise it on a straight-line basis over its estimated useful life, which is the period where the companies expect to use the assets. Useful life estimates and residual values are reviewed on an annual basis and if appropriate adjusted prospectively.
The following table sets forth the main categories of property, plant and equipment with their respective estimated useful lives for entities within continuing operations:
| | |
| Categories of Property, plant and equipment | | Years of estimated useful life |
| Buildings | | 10 - 80 |
| Plant and equipment | | 3 - 75 |
| IT equipment | | 3 - 25 |
| Fixtures and fittings | | 5 - 15 |
| Motor vehicles | | 5 - 20 |
| Other | | 1 - 20 |
| | |
| The accompanying notes are an integral part of these consolidated financial statements | | |
|
| F-27 |
Additionally, the following table sets for more details on the useful lives of plant and equipment items:
| | |
| Categories of Property, plant and equipment | | Years of estimated useful life |
Generating facilities: | | |
Hydroelectric plants | | |
Civil engineering works | | 20-75 |
Electromechanical equipment | | 24-33 |
Thermal power plants | | 11-40 |
Renewable energy power plants | | 10-25 |
Transmission lines | | 21-39 |
Distribution facilities: | | |
High-voltage network | | 35-40 |
Low- and medium-voltage network | | 30-50 |
Measuring and remote control equipment | | 10-35 |
Primary substations | | 15-40 |
Land is not depreciated since it has an indefinite useful life.
Regarding the administrative concessions held by the Group’s electric companies, the following table lists the remaining periods until expiration of the concessions that do not have an indefinite term:
| | | | | | | | |
| Concession holder and operator | | Country | | Year
concession
started | | Concession
term | | Remaining
period to expiration |
| | | | | |
| Empresa Distribuidora Sur S.A. - Edesur (Distribution) | | Argentina | | 1992 | | 95 years | | 72 years |
| | | | | |
| Hidroeléctrica El Chocón S.A. (Generation) | | Argentina | | 1993 | | 30 years | | 8 years |
| | | | | |
| Transportadora de Energía S.A. (Transmission) | | Argentina | | 2002 | | 85 years | | 72 years |
| | | | | |
| Compañía de Transmisión del Mercosur S.A. (Transmission) | | Argentina | | 2000 | | 87 years | | 72 years |
| | | | | |
| Central Eléctrica Cachoeira Dourada S.A. (Generation) | | Brazil | | 1997 | | 30 years | | 12 years |
| | | | | |
| Central Generadora Termoeléctrica Fortaleza S.A (Generation) | | Brazil | | 2001 | | 30 years | | 16 years |
| | | | | |
| Compañía de Interconexión Energética S.A. (CIEN - Line 1) | | Brazil | | 2000 | | 20 years | | 5 years |
| | | | | |
| Compañía de Interconexión Energética S.A (CIEN - Line 2) | | Brazil | | 2002 | | 20 years | | 7 years |
To the extent that the Group recognizes the assets as Property, plant and equipment, they are amortized over their economic life or the concession term, whichever is shorter, when the economic benefit from the asset is limited to its use during the concession term. Any required investment, improvement or replacement made by the Group is considered in the impairment test to Property, plant, and equipment as a future contractual cash outflow that is necessary to obtain future cash inflow.
The Group’s management analyzed the specific contract terms of each of the aforementioned concessions, which vary by country, business activity and jurisdiction, and concluded that, with the exception of CIEN, there are no determining factors indicating that the grantor, which in every case is a government entity, controls the infrastructure and, at the same time, can continuously set the price to be charged for the services. These requirements are essential for applying IFRIC 12, an interpretation that establishes how to recognize and measure certain types of concessions (see Note 3.d.1 for concession agreements within the scope of IFRIC 12).
On April 19, 2011, the subsidiary CIEN successfully completed its change in business model. Under the new agreement, the Government continues to control the infrastructure, but CIEN receives fixed payments, which puts it on an equal footing with a public transmission concession (with regulated prices).
Under this business model, its concessions fall within the scope of IFRIC 12; however, the infrastructure has not been derecognized due to the fact that CIEN has not substantially transferred the significant risks and benefits to the Brazilian Government. Gains or losses that arise from the sale or disposal of items of Property, plant and equipment are recognized as other gains (losses) in the comprehensive income statement and are calculated by deducting the net carrying amount of the asset and any sales costs from the consideration received in the sale.
| | |
| The accompanying notes are an integral part of these consolidated financial statements | | |
|
| F-28 |
Investment property includes primarily land and buildings held for the purpose of earning rental income and/or for capital appreciation.
Investment property is measured at acquisition cost less any accumulated depreciation and impairment losses that have been incurred. Investment property, excluding land, is depreciated on a straight-line basis over the useful lives of the related assets.
An investment property is derecognized upon disposal or when no future economic benefits are expected from its use or disposal.
Gains or losses on derecognition of the investment property is calculated as the difference between the net disposal proceeds and the carrying amount of the asset.
The breakdown of the fair value of investment property is detailed in Note 18.
Goodwill arising from business combinations, and reflected upon consolidation, represents the excess value of the consideration paid plus the amount of any non-controlling interests over the Group’s share of the net value of the assets acquired and liabilities assumed, measured at fair value at the acquisition date. If the accounting for a business combination is completed within the following year after the acquisition date, and so is the goodwill determination, the entity recognizes the corresponding adjustments to the provisional amounts as if the accounting for the business combination had been completed at the acquisition date. Thus, comparative information for prior periods presented in financial statements is revised as needed, including making any change in depreciation, amortisation or other income effects recognised in completing the initial accounting.
Goodwill arising from acquisition of companies with functional currencies other than the Chilean peso is measured in the functional currency of the acquired company and translated to Chilean pesos using the exchange rate effective as of the date of the statement of financial position.
Goodwill is not amortized; instead, at the end of each reporting period or when there are indicators, the Company estimates whether any impairment has reduced its recoverable amount to an amount less than carrying amount and, if so, it is immediately adjusted for impairment (see Note 3.e).
| | d) | Intangible assets other than goodwill |
Intangible assets are initially recognized at their acquisition cost or production cost, and are subsequently measured at their cost, net of accumulated amortization and impairment losses they may have experienced.
Intangible assets are amortized on a straight line basis during their useful lives, starting from the date when they are ready for use, except for those with an indefinite useful life, which are not amortized. As of December 31, 2015 and 2014, there were no significant amounts in intangible assets with an indefinite useful life.
The criteria for recognizing these assets’ impairment losses and, if applicable, recovery of impairment losses recorded in previous fiscal years are explained in letter e) of this Note.
An intangible asset is derecognized on disposal, or when no future economic benefits are expected from use or disposal.
Gains or losses arising from derecognition of an intangible asset, measured as the difference between the net disposal proceeds and the carrying amount of the asset are recognized in profit or loss when the asset is derecognized.
d.1) Concessions
Public-to-private service concession agreements are recognized according to IFRIC 12, “Service Concession Agreements.” This accounting interpretation applies if:
| | a) | The grantor controls or regulates which services the operator should provide with the infrastructure, to whom it must provide them, and at what price; and |
| | b) | The grantor controls – through ownership, beneficial entitlement, or otherwise – any significant residual interest in the infrastructure at the end of the term of the agreement. |
| | |
| The accompanying notes are an integral part of these consolidated financial statements | | |
|
| F-29 |
If both of the above conditions are met simultaneously, the consideration received by the Group for the constructed infrastructure is recognized at its fair value, as either an intangible asset when the Group receives the right to charge users of the public service, as long as these charges are conditional on the degree to which the service is used; or as a financial asset when the Group has an unconditional contractual right to receive cash or another financial asset directly from the grantor or from a third party. The Group recognizes the contractual obligations assumed for maintenance of the infrastructure during its use, or for its return to the grantor at the end of the concession agreement within the conditions specified in the agreement, as long as it does not involve an activity that generates income, in accordance with the Group’s provision accounting policy (see Note 3.m).
Finance expenses attributable to the concession agreements are capitalized based on criteria established in Note 3 a) above, provided that the Group has a contractual right to receive an intangible asset. No finance expenses were capitalized during the years ended December 31, 2015, 2014 and 2013.
The Enersis Américas subsidiaries that have recognized an intangible asset from their service concession agreements are the following:
| | | | | | | | |
| Concession holder and operator | | Country | | Year
concession
started | | Concession
term | | Period remaining
to expiration |
| | | | | |
| Ampla Energía e Serviços S.A. (*) (Distribution) | | Brazil | | 1996 | | 30 years | | 11 years |
| | | | | |
| Companhia Energética do Ceará S.A. (*) (Distribution) | | Brazil | | 1997 | | 30 years | | 12 years |
(*) Considering that part of the rights acquired by our subsidiaries are unconditional, an available-for-sale financial asset has been recognized (see Notes 3.g.1 and 9). At the end of each concession period it can be renewed at the discretion of the granting authority, otherwise all assets and facilities will be returned to the Government or its designee, upon reimbursement for investments made and not yet amortized.
d.2) Research and development expenses
The Group recognizes in the statement of financial position the costs incurred in a project’s development phase as intangible assets as long as the project’s technical feasibility and economic returns are reasonably assured.
d.3) Other intangible assets
These intangible assets correspond primarily to computer software, water rights, and easements. They are initially recognized at acquisition or production cost and are subsequently measured at cost less accumulated amortization and impairment losses, if any.
Computer software programs are amortized, on average, over five years. Certain easements and water rights have indefinite useful lives and are therefore not amortized, while others have useful lives ranging from 40 to 60 years, depending on their characteristics, and they are amortized over that term.
| | e) | Impairment of non-financial assets |
During the year, and principally at the end of each reporting period, the Company evaluates whether there is any indication that an asset has been impaired. If any such indication exists, the company estimates the recoverable amount of that asset to determine the amount of the impairment loss. In the case of identifiable assets that do not generate cash flows independently, the Company estimates the recoverable amount of the Cash Generating Unit (CGU) to which the asset belongs, which is understood to be the smallest identifiable group of assets that generates independent cash inflows.
Notwithstanding the preceding paragraph, in the case of CGUs to which goodwill or intangible assets with an indefinite useful life have been allocated, a recoverability analysis is performed routinely at each year end.
| | |
| The accompanying notes are an integral part of these consolidated financial statements | | |
|
| F-30 |
Recoverable amount is the higher of fair value less the cost of disposal and value in use, which is defined as the present value of the estimated future cash flows. In order to calculate the recoverable amount of Property, plant, and equipment, as well as of goodwill, and intangible assets, the Group uses value in use criteria in practically all cases.
To estimate the value in use, the Group prepares future pre-tax cash flow projections based on the most recent budgets available. These budgets incorporate management’s best estimates of CGUs’ revenue and costs using sector projections, past experience and future expectations.
In general, these projections cover the next five years, estimating cash flows for subsequent years by applying reasonable growth rates which, in no case, are increasing rates nor exceed the average long-term growth rates for the particular sector and country in which the Company operates. As of December 31, 2105 and 2014, projections were extrapolated from the following rates:
| | | | | | |
| Country | | Currency | | Growth rates (g) |
| | | 12-31-2015 | | 12-31-2014 |
| | | | |
Chile | | Chilean peso | | 4.5% - 5.1% | | 2.2% - 5.0% |
| | | | |
Argentina | | Argentine peso | | 11.1% | | 6.9% - 7.7% |
| | | | |
Brazil | | Real | | 4.1% - 5.6% | | 5.0% - 5.9% |
| | | | |
Peru | | Peruvian nuevo sol | | 3.1% - 4.8% | | 3.4% - 4.4% |
| | | | |
Colombia | | Colombian peso | | 3.5% - 5.2% | | 4.3% - 5.3% |
These flows are discounted to calculate their present value at a pre-tax rate that covers the cost of capital for the business activity and the geographic area in which it is being carried out. The time value of money and the risk premiums generally used among analysts for the business activity and the geographic zone are taken into account to calculate the pre-tax rate.
The following are the pre-tax discount rates applied in 2015 and 2014 expressed in nominal terms:
| | | | | | | | | | |
| Country | | Currency | | December 2015 | | December 2014 |
| | | Minimum | | Maximum | | Minimum | | Maximum |
Chile | | Chilean peso | | 8.1% | | 12.7% | | 7.9% | | 13.0% |
Argentina | | Argentine peso | | 32.7% | | 39.4% | | 23.3% | | 38.9% |
Brazil | | Real | | 11.1% | | 21.1% | | 9.7% | | 22.7% |
Peru | | Peruvian nuevo sol | | 7.3% | | 13.5% | | 7.3% | | 14.3% |
Colombia | | Colombian peso | | 8.5% | | 15.1% | | 8.0% | | 13.3% |
If the recoverable amount of the CGU is less than the net carrying amount of the asset, the corresponding impairment loss is recognized for the difference, and charged to “Reversal of impairment loss (impairment loss) recognized in profit or loss” in the consolidated statement of comprehensive income. The impairment is first allocated to the CGU’s goodwill carrying amount, if any, and then to the other assets comprising it, prorated on the basis of the carrying amount of each one, limited to its fair value less costs of disposal, or its value in use; a negative amount may not be obtained.
Impairment losses recognized for an asset in prior periods are reversed when there are indications that the impairment loss no longer exists or may have decreased, thus increasing the asset’s carrying amount with a credit to earnings, limited to the asset’s carrying amount if no impairment had occurred. In the case of goodwill, impairment losses are not reversed.
In order to determine whether an arrangement is, or contains, a lease, Enersis Américas assesses the economic substance of the agreement, to assess whether fulfillment of the arrangement depends on the use of a specific asset and whether the agreement conveys the right to the use of the asset. If both conditions are met, at the inception of the arrangement the Company separates the payments and other considerations relating to the lease, at their fair values, from those corresponding to the other components of the arrangement.
Leases that substantially transfer all of the risks and rewards of ownership to the Company are classified as finance leases. All other leases are classified as operating leases.
| | |
| The accompanying notes are an integral part of these consolidated financial statements | | |
|
| F-31 |
Finance leases in which the Group acts as a lessee are recognized at the inception of the arrangement. At that time, the Group records an asset based on the nature of the lease and a liability for the same amount, equal to the fair value of the leased asset or the present value of the minimum lease payments, if the latter is lower. Subsequently, the minimum lease payments are apportioned between finance expenses and reduction of the lease obligation. Finance expenses are recognized in the income statement and allocated over the lease term, so as to obtain a constant interest rate for each period over the remaining balance of the liability. Leased assets are depreciated on the same terms as other similar depreciable assets, as long as there is reasonable certainty that the lessee will acquire ownership of the asset at the end of the lease. If no such certainty exists, the leased asset is depreciated over the shorter term of the useful lives of the asset and the lease term.
In the case of operating leases, payments are recognized as an expense in the case of the lessee and as income in the case of the lessor, both on a straight-line basis, over the term of the lease unless another type of systematic basis of distribution is deemed more representative.
Financial instruments are contracts that give rise to both a financial asset in one entity and a financial liability or equity instrument in another entity.
| | | g.1) Financial assets other than derivatives |
The Group classifies its financial assets other than derivatives, whether permanent or temporary, except for investments accounted for using the equity method (see Note 14) and those held for sale, into four categories:
| | - | Loans and account receivables: Trade and other receivables and accounts receivable from related parties are recognized at amortized cost, which is the initial fair value less principal repayments made, plus accrued and uncollected interest, calculated using the effective interest method. |
| | | The effective interest method is used to calculate the amortized cost of a financial asset or liability (or group of financial assets or financial liabilities) and of allocating finance income or cost over the relevant period. The effective interest rate is the rate that exactly discounts estimated future cash flows to be received or paid through the expected life of the financial instrument (or, when appropriate, over a shorter period) to the net carrying amount of the financial asset or financial liability. |
| | - | Held-to-maturity investments: Investments that the Group intends to hold and is capable of holding until their maturity are accounted for at amortized cost as defined in the preceding paragraph. |
| | - | Financial assets at fair value through profit or loss: This includes the trading portfolio and those financial assets that have been designated as such upon initial recognition and that are managed and evaluated on a fair value basis. They are measured in the consolidated statement of financial position at fair value, with changes in value recognized directly in profit or loss when they occur. |
| | - | Available-for-sale financial assets: These are financial assets specifically designated as available-for-sale or that do not fit within any of the three preceding categories. They are mainly all financial investments in equity instruments and financial assets in accordance with IFRIC 12 “Service Concession Arrangements” (see Note 9). |
| | | These investments are recognized in the consolidated statement of financial position at fair value when it can be reliably determined. For equity interests in unlisted companies or companies with lower levels of liquidity, normally the fair value cannot be reliably determined. When this occurs, those equity interests are measured at acquisition cost or a lesser amount if evidence of impairment exists. |
| | | Changes in fair value, net of taxes, are recognized in the consolidated statement of comprehensive income: Other comprehensive income, until the investments are disposed of, at which date the amount accumulated in this account for that investment is reclassified to profit or loss. |
| | | If the fair value is lower than the acquisition cost, and if there is objective evidence that the asset has been more than temporarily impaired, the difference is recognized directly in profit or loss. |
Purchases and sales of financial assets are accounted for using their trade date.
| | |
| The accompanying notes are an integral part of these consolidated financial statements | | |
|
| F-32 |
| | | g.2) Cash and cash equivalents |
This item within the consolidated statement of financial position includes cash and bank balances, time deposits, and other highly liquid investments (with a maturity of 90 days or less from its acquisition date) that are readily convertible to cash and are subject to insignificant risk of changes in value.
| | | g.3) Impairment of financial assets |
The following criteria are used to determine if a financial asset has been impaired:
| | - | For trade receivables in the electricity generation, transmission and distribution segments, the Company’s policy is to recognized impairment losses when there is objective evidence that the balance will not be recoverable. In general terms, the Group’s entities has a defined policy to recognize an allowance for impairment losses based on aging of past-due balances, except in those cases where a specific collective basis analysis is recommended, such as in the case of receivables from government-owned companies (see Note 10). |
| | - | In the case of receivables of a financial nature, that are included in the “Loan and receivables” and “Investment held-to-maturity”, impairment is determined on case-by-case basis and is measured as the difference between the carrying amount and the present value of the future estimated cash flows discounted at the original effective interest rate (see Notes 9 and 22). |
| | - | For financial investments available-for-sale, the criteria for impairment applied are described in Note 3.g.1 |
| | | g.4) Financial liabilities other than derivatives |
Financial liabilities are recognized based on cash received, net of any costs incurred in the transaction. In subsequent periods, these obligations are measured at their amortized cost, using the effective interest method (see Note 3.g.1).
In the particular case that a liability is the hedged item in a fair value hedge, as an exception, such liability will be measured at its fair value for the portion of the hedged risk.
In order to calculate the fair value of debt, both when it is recorded in the statement of financial position and for fair value disclosure purposes as shown in Note 22, debt has been divided into fixed interest rate debt (hereinafter “fixed-rate debt”) and variable interest rate debt (hereinafter “floating-rate debt”). Fixed-rate debt is that on which fixed-interest coupons established at the beginning of the transaction are paid explicitly or implicitly over its term. Floating-rate debt is that issued at a variable interest rate, i.e., each coupon is established at the beginning of each period based on the reference interest rate. All debt has been measured by discounting expected future cash flows with a market interest rate curve based on the payment currency.
| | | g.5) Derivatives financial instruments and hedge accounting |
Derivatives held by the Group are primarily transactions entered into to hedge interest and/or exchange rate risk, intended to eliminate or significantly reduce these risks in the underlying transactions being hedged.
Derivatives are recognized at fair value as of the date of the statement of financial position as follows: if their fair value is positive, they are recognized within “Other financial assets”; and if their fair value is negative, they are recognized within “Other financial liabilities.” For derivatives on commodities, the positive value is recorded in “Trade and other receivables,” and negative fair values are recognized in “Trade and other liabilities.”
Changes in fair value are recognized directly in profit or loss except when the derivative has been designated for accounting purposes as a hedging instrument and all of the conditions established under IFRS for applying hedge accounting are met, including that the hedge be highly effective. In this case, changes are recognized as follows:
| | - | Fair value hedges: The underlying portion for which the risk is being hedged is measured at its fair value and the hedging instrument are measured at fair value, and any changes in the value of both items are recognized in the comprehensive income statement by offsetting the effects within the same comprehensive income statement account. |
| | - | Cash flow hedges: Changes in the fair value of the effective portion of derivatives are recorded in an equity reserve known as “Reserve for cash flow hedges.” The cumulative loss or gain in this reserve is reclassified to the comprehensive income statement to the extent that the underlying item impacts the comprehensive income statement offsetting the effect in the same comprehensive income statement account. Gains or losses from the ineffective portion of the hedge relationship are recognized directly in the comprehensive income statement. |
| | |
| The accompanying notes are an integral part of these consolidated financial statements | | |
|
| F-33 |
A hedge relationship is considered highly effective when changes in fair value or in cash flows of the underlying item directly attributable to the hedged risk are offset by changes in fair value or cash flows of the hedging instrument, with an effectiveness ranging from 80% to 125%.
The Company does not apply hedge accounting to its investments abroad.
As a general rule, long-term commodity purchase or sale agreements are recognized in the consolidated statement of financial position at their fair value at the end of each reporting period, recognizing any differences in value directly in profit or loss, except for, when all of the following conditions are met:
| | - | The sole purpose of the agreement is for the Group’s own use, which is understood, in the case of fuel purchase agreements its used to generate electricity; in the case of electrical energy purchased for sale, its sale to the end-customer; and in the case of electricity sales its sales to the end-customer. |
| | - | The Group’s future projections evidence the existence of these agreements for its own use. |
| | - | Past experience with agreements evidence that they have been utilized for the Group’s own use, except in certain isolated cases for exceptional reasons or reasons associated with logistical issues have been used beyond the control and projection of the Group. |
| | - | The agreement does not stipulate settlement by differences and the parties have not made it a practice to settle similar contracts by differences in the past. |
The long-term commodity purchase or sale agreements maintained by the Group, which are mainly for electricity, fuel, and other supplies, meet the conditions described above. Thus, the purpose of fuel purchase agreements is to use them to generate electricity, the electricity purchase contracts are used to sell to end-customers, and the electricity sale contracts are used to sell the Company’s own products.
The Company also evaluates the existence of derivatives embedded in contracts or financial instruments to determine if their characteristics and risk are closely related to the principal contract, provided that when taken as a whole they are not being accounted for at fair value. If they are not closely related, they are recorded separately and changes in value are accounted for directly in the comprehensive income statement.
| | | g.6) Derecognition of financial assets and liabilities |
Financial assets are derecognized when:
| | - | The contractual rights to receive cash flows from the financial asset expire or have been transferred or, if the contractual rights are retained, the Group has assumed a contractual obligation to pay these cash flows to one or more recipients. |
| | - | The Group has substantially transferred all the risks and rewards of ownership of the financial asset, or, if it has neither transferred nor retained substantially all the risks and rewards, when it does not retain control of the asset. |
Transactions in which the Group retains substantially all the inherent risks and rewards of ownership of the transferred asset, it continues recognizing the transferred asset in its entirety and recognizes a financial liability for the consideration received. Transactions costs are recognized in profit and loss by using the effective interest method (see Note 3.g.1).
Financial liabilities are derecognized when they are extinguished, that is, when the obligation arising from the liability has been paid or cancelled, or has expired.
| | |
| The accompanying notes are an integral part of these consolidated financial statements | | |
|
| F-34 |
| | | g.7) Offsetting financial assets and liabilities. |
The Group offsets financial assets and liabilities and the net amount is presented in the statement of financial position when and only when:
| | - | There is a legally enforceable right to set off the recognized amounts; and |
| | - | There is an intention to settle on a net basis, or to realize the asset and settle the liability simultaneously. |
| | | g.8) Financial guarantee contracts |
Financial guarantee contracts, such as guarantees given by the Group to third parties, are initially recognized at fair value, adjusting the transaction costs that are directly attributable to the issuance of the guarantee.
Subsequently to initial recognition, financial guarantee contracts are measured at the higher of:
| | - | the amount determined under accounting policy describe in Note 3.m; and |
| | - | the amount initially recognized less, if appropriate, any accumulated amortization. |
| | h) | Measurement of fair value |
The fair value of an asset or liability is defined as the price that would be received from the sale of an asset or paid to transfer a liability in an orderly transaction between market participants at the measurement date.
Fair value measurement assumes that the transaction to sell an asset or transfer a liability occurs in the principal market, namely, the market with the greatest volume and level of activity for that asset or liability. In the absence of a principal market, it is assumed that the transaction is carried out in the most advantageous market available to the entity, namely, the market that maximizes the amount that would be received on selling the asset or minimizes the amount that would be paid to transfer the liability.
In estimating fair value, the Group uses valuation techniques that are appropriate for the circumstances and for which there are sufficient data to conduct the measurement. The Group maximizes the use of relevant observable data and minimizes the use of unobservable data.
Considering the hierarchy of the data used in these valuation techniques, the assets and liabilities measured at fair value can be classified into the following levels:
| | Level 1: | Quoted price (unadjusted) in active markets for identical assets or liabilities; |
| | Level 2: | Inputs other than quoted prices included within Level 1 that are observable for the assets or liabilities, either directly (i.e. as prices) or indirectly (i.e. derived from prices). The methods and assumptions used to determine the fair values at Level 2 by type of financial asset or financial liability take into consideration estimated future cash flows discounted at zero coupon interest rate curves for each currency. All the valuations described are carried out using external tools such as “Bloomberg”. |
| | Level 3: | Inputs for assets or liabilities that are not based on observable market data (unobservable inputs). |
The Group takes into account the characteristics of the asset or liability when measuring fair value, in particular:
| | - | For non-financial assets, fair value measurement takes into account the ability of a market participant to generate economic benefits by using the asset in its highest and best use or by selling it to another market participant that would use the asset in its highest and best use; |
| | - | For liabilities and equity instruments, the fair value measurement assumes that the liability would not be settled and an equity instrument would not be cancelled, or otherwise extinguished on the measurement date. The fair value of the liability reflects the effect of non-performance risk, namely, the risk that an entity will not fulfill the obligation, which includes but is not limited to, the Company’s own credit risk; |
| | |
| The accompanying notes are an integral part of these consolidated financial statements | | |
|
| F-35 |
| | - | For derivatives non-quoted in an organized market, the Group uses the discounted cash flow method and generally accepted options valuation models, based on current and future market conditions as of year-end. It also adjusts the value according to its own credit risk (Debt Valuation Adjustment, DVA), and the counterparty risk (Credit Valuation Adjustment, CVA). These CVA and DVA adjustments are measured on the basis of the potential future exposure of the instrument (creditor or borrower position) and the risk profile of both the counterparties and the Group itself. |
| | - | In the case of financial assets and financial liabilities with offsetting positions in market risks or counterparty credit risks, it is permitted to measure the fair value on a net basis. However, this must be consistent with the manner in which market participants would price the net risk exposure at the measurement date. |
Assets and liabilities measured at fair value are shown in Note 22.3.
| | i) | Investments accounted for using the equity method |
The Group’s interests in joint ventures and associates are recognized using the equity method.
Under the equity method, an investment in an associate or joint venture is initially recognized at cost. As of the acquisition date, the investment is recognized in the statement of financial position based on the share of its equity that the Group’s interest represents in its capital, adjusted for, if appropriate, the effect of transactions with Group’s entities, plus any goodwill generated in acquiring the entity. If the resulting amount is negative, zero is recorded for that investment in the statement of financial position, unless the Group has a present obligation (either legal or constructive) to support the investee’s negative equity situation, in which case a provision is recognized.
Goodwill from associates or joint ventures is included in the carrying amount of the investment. It is not amortized but is subject to impairment testing as part of the overall investment carrying amount when impairment indicators exist.
Dividends received from these investments are deducted from the carrying amount of the investment, and any profit or loss obtained from them to which the Group is entitled based on its ownership interest is recognized under “Share of profit (loss) of associates accounted for using equity method.”
Appendix 3: “Associated Companies and Joint Ventures” to these consolidated financial statements, provides information about the relationship of Enersis Américas with each of these entities.
Inventories are measured at their weighted average acquisition price or the net realizable value, whichever is lower.
| | k) | Non-current assets (or disposal groups) classified as held for sale or as held for distribution to owners and discontinued operations |
The Group classifies as non-current assets (or disposal groups) held for sale or held for distribution to owners, the property, plant and equipment; intangible assets; investments accounted for using the equity method, joint ventures, and disposal groups (a group of assets to be disposed of and the liabilities directly associated with those assets), if, as of the date of the consolidated financial statements, the Group has taken active measures for their sale, or their distribution to owners, and estimates that such a sale is highly probable.
Non-current assets held-for-sale or disposal groups are measured at the lower of their carrying amount and fair value less costs to sell. Depreciation and amortization on these assets cease when they meet the criteria to be classified as non-current assets held for sale.
Non-current assets or disposal groups classified as held for distribution to owners are measured at the lower of their carrying amount and their fair value less costs to distribute.
| | |
| The accompanying notes are an integral part of these consolidated financial statements | | |
|
| F-36 |
Assets that are no longer classified as held for sale, or are no longer part of a disposal group, are measured at the lower of their carrying amounts before being classified as held for sale less any depreciations, amortizations or revaluations that would have been recognized if they had not been classified as held for sale and their recoverable amount at the date of subsequent decision where would be reclassified as non-current assets.
Non-current assets held for sale and the components of the disposal groups classified as held for sale or held for distribution to owners are presented in the consolidated statement of financial position as a single line item within assets called “Non-current assets or disposal groups held for sale or for distribution to owners,” and the respective liabilities are presented as a single line item within liabilities called “Liabilities included in disposal groups held for sale or for distribution to owners.”
The Group classifies as discontinued operations those components of the Group that either have been disposed of, or are classified as held for sale, and (i) represents a separate major lines of business or geographical area of operations; (ii) is a part of a single coordinated plan to dispose a separate major line of business or geographical area of operations; or (iii) is a subsidiary acquired exclusively with a view to resale.
The components of profit or loss after taxes from discontinued operations are presented as a single line item in the consolidated comprehensive income statement as “Income after tax from discontinued operations”, including incremental taxes related to the spin-off transaction, once it becomes effective.
Treasury shares are deducted from equity in the consolidated statement of financial position and measured at acquisition cost.
Gains and losses from the disposal of treasury shares are recognized directly in “Equity – Retained earnings”, without affecting profit or loss for the period. As of December 31, 2015 and 2014, there are no treasury shares, and no transactions with treasury shares were carried out during the years 2015 and 2014.
Provisions are recognized when the Group has a present obligation (legal or constructive) as a result of a past event, it is probable that an outflow of economic benefits will be required to settle the obligation, and a reliable estimate can be made of the amount of the obligation.
The amount recognized as a provision is the best estimate of the consideration required to settle the present obligation at the end of the reporting period, taking into account the risks and uncertainties surrounding the obligation. When a provision is measured using the cash flows estimated to settle the present obligation, its carrying amount is the present value of those cash flows (when the effect of the time value of money is material). The unwinding of the discount is recognized as finance cost. Incremental legal cost expected to be incurred in resolving a legal claim is included in measuring of the provision.
Provisions are reviewed at the end of each reporting period and adjusted to reflect the current best estimate. If it is no longer probable that an outflow of resources embodying economic benefits will be required to settle the obligation, the provision is reversed.
A contingent liability does not result in the recognition of a provision. Legal costs expected to be incurred in defending a legal claim are expensed as they are incurred. Significant contingent liabilities are disclosed unless the likelihood of an outflow of resources embodying economic benefits is remote.
| | | m.1) Provisions for post-employment benefits and similar obligations |
Some of the Group’s subsidiaries have pension and similar obligations to their employees. Such obligations, which combine defined benefits and defined contributions, are basically formalized through pension plans, except for certain non-monetary benefits, mainly electricity supply commitments, which, due to their nature, have not been externalized and are covered by the related in-house provisions.
For defined benefit plans, the cost of providing benefits is determined using the Projected Unit Credit Method, with actuarial valuations being carried out at the end of each reporting period. Past service costs relating to changes in benefits are recognized immediately.
| | |
| The accompanying notes are an integral part of these consolidated financial statements | | |
|
| F-37 |
The defined benefit plan obligations in the statement of financial position represent the present value of the accrued obligations, adjusted, once the fair value of the different plans’ assets has been deducted, if applicable.
For each of the defined benefit plans, any deficit between the actuarial liability for past services and the plan assets is recognized under line item “Provisions for employee benefits” within current and non-current liabilities in the consolidated statement of financial position, and any surplus is recognized under line item “Other financial assets” within non-current assets in the consolidated statement of financial position, provided that any surplus is recoverable by the Group, usually through a reduction in future contributions and taking into consideration the limit established in IFRIC 14, IAS 19 The limit on a defined benefit asset, minimum funding requirements, and their interaction.
Actuarial gains and losses arising in the measurement of both the plan liabilities and the plan assets, including the limit in IFRIC 14, are recognized directly as a component of other comprehensive income.
Contributions to defined contribution benefit plans are recognized as an expense when the employees have rendered their services.
| | n) | Translation of balances in foreign currency |
Transactions carried out by each company in a currency other than its functional currency are recognized using the exchange rates prevailing as of the date of each transaction. During the year, any differences that arise between the prevailing exchange at the date of the transaction and the exchange rate as of the date of collection or payment are recognized as “Foreign currency exchange differences” in the comprehensive income statement.
Likewise, at the end of each reporting period, receivable or payable balance denominated in a currency other than each company’s functional currency are translated using the closing exchange rate. Any differences are recognized as “Foreign currency exchange differences” in the comprehensive income statement.
The Group has established a policy to hedge the portion of revenue from its subsidiaries that is directly linked to variations in the U.S. dollar, through obtaining financing in such currency. Exchange differences related to this debt, as they are cash flow hedge transactions, are recognized, net of taxes, as a component of other comprehensive income in item “Gains (losses) from cash flow hedge” and reclassified to profit or loss when the hedged cash flows impact profit or loss. This term has been estimated at ten years.
| | o) | Current/non-current classification |
In these consolidated statements of financial position, assets and liabilities expected to be recovered or settled within twelve months are presented as current items, except for post-employment and other similar obligations; and those assets and liabilities expected to be recovered or settled in more than twelve months are presented as non-current items. Deferred income tax assets and liabilities are classified as non-current.
When the Company have any obligations that mature in less than twelve months but can be refinanced over the long term at the Company’s discretion, through unconditionally available credit agreements with long-term maturities, such obligations are classified as long-term liabilities.
Income tax expense for the year is determined as the sum of current taxes from each of the Group’s subsidiaries and results from applying the tax rate to the taxable income for the year, after permitted deductions have been made, plus any changes in deferred tax assets and liabilities and tax credits, both for tax losses and deductions. Differences between the carrying amount and tax basis of assets and liabilities originate deferred tax asset and liability balances, which are calculated using the tax rates expected to apply when the assets and liabilities are realized or settled, based on tax rates that have been enacted or substantively enacted by the end of the reporting period.
| | |
| The accompanying notes are an integral part of these consolidated financial statements | | |
|
| F-38 |
Deferred tax assets are recognized for all deductible temporary differences, tax losses and unused tax credits to the extent that it is probable that sufficient future taxable profits exist to recover the deductible temporary differences and make use of tax credits. Such deferred tax asset is not recognized if the deductible temporary difference arises from the initial recognition of an asset or liability that:
| | - | Did not arise from a business combination, and |
| | - | At initial recognition affected neither accounting profit nor taxable profit (loss). |
In respect of deductible temporary differences associated with investments in subsidiaries, associates and joint arrangements, deferred tax assets are recognized only to the extent that it is probable that the temporary differences will reverse in the foreseeable future and taxable profits will be available against which the temporary differences can be utilized.
Deferred tax liabilities are recognized for all temporary differences, except those derived from the initial recognition of goodwill and those that arose from measuring investments in subsidiaries, associates and joint ventures in which the Group can control their reversal and where it is probable that they will not be reversed in the foreseeable future.
Current tax and changes in deferred tax assets or liabilities are recorded in profit or loss or in equity within the statement of financial position, depending on where the gains or losses that triggered these tax entries have been recognized.
Any tax deductions that can be applied to current tax liabilities are credited to earnings within the line item “Income tax expenses”, except when doubts exist about their tax realization, in which case they are not recognized until they are effectively realized, or when they correspond to specific tax incentives, in which case they are recorded as government grants.
At the end of each reporting period, the Company reviews the deferred taxes assets and liabilities recognized, and makes any necessary corrections based on the results of this analysis.
Deferred tax assets and deferred tax liabilities are offset in the statement of financial position if it has a legally enforceable right to set off current tax assets against current tax liabilities, and only when the deferred taxes relate to income taxes levied by the same taxation authority.
| | q) | Revenues and expense recognition |
Revenue is recognized when the gross inflow of economic benefits arising in the course of the Group’s ordinary activities in the year occurs, provided that this inflow of economic benefits results in an increase in total equity other than increases relating to contributions from equity participants and such benefits can be measured reliably.
Revenues and expenses are recognized on an accrual basis and depending on the type of transaction; the following criteria for recognition are taken:
| | - | Generation and transmission of electricity: Revenue is recognized based on physical delivery of energy and power, at prices established in the respective contracts, at prices stipulated in the electricity market by applicable regulations or at marginal cost determined on the spot market, as the case. This revenue includes an estimate of the service provided and not billed until the closing date (see Note 2.3). |
| | - | Distribution of electricity: Revenue is recognized based on the amount of energy supplied to customers during the year, at prices established in the respective contracts or at prices stipulated in the electricity market by applicable regulations, as appropriate. This revenue includes an estimate of the energy supplied but not yet billed and for which customers’ meters have not been read yet (see Note 2.3). |
Revenue from rendering of services is only recognized when it can be estimated reliably, by reference to the stage of completion of the service rendered at the date of the statement of financial position. When the outcome of a transaction involving the rendering of services cannot be estimated reliably, revenue is recognized only to the extent of the expenses recognized that are recoverable.
| | |
| The accompanying notes are an integral part of these consolidated financial statements | | |
|
| F-39 |
Revenue from sales of goods is recognized based on the economic substance of the transaction and are recognized when all and each of the following conditions are met:
| | - | the entity has transferred to the buyer the significant risks and rewards of ownership of the goods; |
| | - | the entity retains neither continuing managerial involvement to the degree usually associated with ownership nor effective control over the goods sold; |
| | - | the amount of revenue can be measured reliably; |
| | - | it is probable that the economic benefits associated with the transaction will flow to the entity; and |
| | - | the costs incurred or to be incurred in respect of the transaction can be measured reliably. |
Revenue is measured at the fair value of the consideration received or receivable that gives rise to the revenue.
In arrangements under which the Group will perform multiple revenue-generating activities (multiple-element arrangement), the recognition criteria are applied to the separately identifiable components of the transaction in order to reflect the substance of the transaction or to two or more transactions together when they are linked in such a way that the commercial effect cannot be understood without reference to the series of transactions as a whole. The Group excludes from revenue those gross inflows of economic benefits it receives when it acts as an agent or commission agent on behalf of third parties, and only recognizes as revenue economic benefits received for its own activity.
When goods or services are exchanged or swapped for goods or services of a similar nature and value, the exchange is not regarded as a revenue-generating transaction.
The Group recognizes the net amount of non-financial asset purchase or sale contracts that are settled for a net amount of cash or through some other financial instruments. Contracts entered into and maintained for the purpose of receiving or delivering these non-financial assets are recognized on the basis of the contractual terms of the purchase, sale, or usage requirements expected by the entity.
Financial income (expense) is recognized using the effective interest rate applicable to the outstanding principal over the repayment period.
Expenses are recognized on an accruals basis, immediately in the event of expenditures that do not generate future economic benefits or when not meet the requirements for recording them as assets.
Basic earnings per share are calculated by dividing net income attributable to shareholders of the Parent Company (the numerator) by the weighted average number of ordinary shares outstanding (the denominator) during the year, excluding the average number of shares of the Parent Company held by other subsidiaries within the Group, if any.
Basic earnings per share for continuing and discontinued operations are calculated by dividing net income from continuing and discontinued operations attributable to shareholders of the Parent Company (the numerator) by the weighted average number of ordinary shares outstanding (the denominator) during the year, excluding the average number of shares of the Parent Company held by other subsidiaries within the Group, if any.
During the years 2015, 2014 and 2013, the Group did not engage in any transaction of any kind with potential dilutive effects leading to diluted earnings per share that could differ from basic earnings per share.
Article 79 of the Chilean Companies Act establishes that, unless unanimously agreed otherwise by the shareholders of all issued shares, listed corporations must distribute a cash dividend to shareholders on an annual basis, pro rata to the shares owned or the proportion established in the company’s by-laws if there are preferred shares, of at least 30% of net income for each period, except when accumulated losses from prior years must be absorbed.
| | |
| The accompanying notes are an integral part of these consolidated financial statements | | |
|
| F-40 |
As it is practically impossible to achieve a unanimous agreement given Enersis Américas’ highly fragmented share capital, at the end of each reporting period the amount of the minimum statutory dividend obligation to its shareholders is determined, net of interim dividends approved during the fiscal year, and then accounted for in “Trade and other current payables” and “Accounts payable to related companies”, as appropriate, and recognized in equity.
Interim and final dividends are deducted from equity as soon as they are approved by the competent body, which in the first case is normally the Company’s Board of Directors and in the second case is the Ordinary Shareholders’ Meeting.
Share issuance costs, only when they represent incremental expenses directly attributable to the transaction, are recognized directly in net equity as a deduction from “Share premiums,” net of any applicable taxes. If the share premium account has a zero balance or if the costs described exceed the balance, they are recognized in “Other reserves.”
The cash flow statement reflects changes in cash and cash equivalents that took place during the year, determined with the direct method. It uses the following expressions and corresponding meanings:
| | - | Cash flows: inflows and outflows of cash or cash equivalents, which are defined as highly liquid investments maturing in less than three months with a low risk of changes in value. |
| | - | Operating activities: the principal revenue-producing activities of the Group and other activities that cannot be considered investing or financing activities. |
| | - | Investing activities: the acquisition and disposal of long-term assets and other investments not included in cash and cash equivalents. |
| | - | Financing activities: activities that result in changes in the size and composition of the total equity and borrowings of the Group. |
| | |
| The accompanying notes are an integral part of these consolidated financial statements | | |
|
| F-41 |
| | 4. | SECTOR REGULATION AND ELECTRICITY SYSTEM OPERATIONS. |
4.1 Continuing operations:
Argentina
Argentina has shown signs of intervention in the electricity market since the crisis of 2002. Under the previous regulations, generators sold to distributors at prices obtained from centralized calculations of the average spot market price. The distributers’ purchase price was the average price forecast for the next six months, called the Seasonal Price (Precio Estacional). Any differences between the Seasonal Price (the purchase price) and the actual spot price (the selling price) was charged to the Seasonal Fund (Fondo Estacional) managed by the Electricity Wholesale Market Administration Company (CAMMESA - Compañía Administradora del Mercado Mayorista Eléctrico).
However, after the 2002 crisis, the authorities changed the price-setting criteria, bringing the marginal pricing system to an end. First, marginal prices were calculated without taking into consideration the natural gas shortages. In effect, despite the fact that generation is dispatched on the basis of the fuels actually used, Resolution SE 240/2003 establishes that the marginal price is to be calculated taking into consideration all of the generation units as if there were no restrictions in effect on natural gas supplies. In addition, the expense of water is not included in the calculations if its opportunity cost is higher than the cost of generating power with natural gas. Second, it established a spot price ceiling of Ar$120/MWh. However, CAMMESA pays the actual variable costs of the thermal plants that run on liquid fuels through the Temporary Dispatch Cost Overruns program.
In addition, as the dollarized economy was devalued and went back to the Argentine peso, payment for capacity fell from US$10 to Ar$10 per MWh. Capacity payments have subsequently risen slightly, to Ar$12 pesos.
Additionally, the freezing of prices paid by distributors caused a gap in relation to actual generation costs, resulting in various types of special agreements for recovering costs, in accordance with regulations in force.
It was in this context that the government announced in 2012 its plan to change the current regulatory framework for one based on an average cost scheme.
Resolution 95/2013 was published in March of 2013, significantly changing the system for generators’ remunerations and setting new prices for capacity depending on the type of technology used and availability. It also set new values for paying for non-fuel variable costs, as well as additional remuneration for energy generated.
In May 2013, the Group’s generating companies (Central Costanera, Hidroeléctrica El Chocón y Dock Sud) accepted the terms of Resolution SE 95/2013.
This resolution marked the end of marginal pricing as a payment system in the Argentine power generation market and established, instead, payment by type of technology and size of plant. For each case, it recognizes fixed costs (determined on the basis of fulfillment of availability) and variable costs, plus an additional remuneration (the two parts are determined on the basis of the energy generated). Part of the additional remuneration will be placed in a trust for future investments.
In principle, commercial management and fuel dispatch will be in the hands of CAMMESA; Terminal Market agreements cannot be extended or renewed, and large users, once their respective contracts are up, must purchase their supply from CAMMESA. However, the Energy Secretariat, in Note SE 1807/13, gave generators the opportunity to express their intention to continue handling collections for their entire contract portfolio, thus ensuring a certain amount of cash flow and a continuing relationship with the customer.
It is also important to mention that Central Costanera has availability contracts signed in 2012 that are still in effect, as well as combined cycle contracts (until 2015) and steam generation contracts (until 2019) that will enable the company to implement plan for investing in the Costanera plant generation units in order to optimize the reliability and availability of that plant. The contracts also include payment of the commitments under the Long-Term Service Agreement (LTSA) for the plant’s combined cycles.
| | |
| The accompanying notes are an integral part of these consolidated financial statements | | |
|
| F-42 |
Through Resolution 529/2014, the Energy Secretariat updated generators’ remuneration, which had been in effect since they were set in February 2013 under Resolution 95/2013. The new resolution increased recognition of fixed costs for combined cycle and large hydroelectric plants by 25% and adjusted variable costs by 41% for thermal plants and 25% for hydroelectric plants. A new variable remuneration was set for biodiesel-fired plants. The additional remuneration increased 25% for thermal plants, and a new charge of Ar$21/MWh was set for one-time maintenance for combined cycle and Ar$24/MWh for other thermal generation plants. The resolution is retroactive to February 2014.
Through Resolution 482/2015, the Energy Secretariat updated generators’ remuneration, which had been in effect since they were set in February 2014 under Resolution 529/2014. The new resolution increased recognition of fixed costs for combined cycle and large hydroelectric plants by 28%, and 64% for mid-size hydroelectric plants. The variable costs were adjusted by 23%, hydroelectric plants are exempted of variable electric transmission payments and has been implemented a new incentive scheme for generation and operative effectiveness for thermal plants. The additional remuneration increased by 26% for thermal plants and 10% for mid-size hydroelectric plants. The cost for non-recurrent maintenance was increased by 17% and the same concept is created for hydro electrical plants in Ar$8/MWh. Finally, a new charge of Ar$15.8/MWh for thermal plants and Ar$6.3/MWh for hydro electrical plants was set for investments funding, which will be effective from February 2015 to December 2018 only for those generators participating in the projects. The new generation will have an additional remuneration equivalent to 50% of the direct additional remuneration based on technology for a 10-year period. The resolution is retroactive to February 2015.
Brazil
Legislation in Brazil allows the participation of private capital in the electricity sector, upholds free competition among companies in electricity generation, and defines criteria to avoid certain levels of economic concentration and/or market practices that may cause a decline in free competition.
Based on the contract requirements as stated by distribution companies, the Ministry of Energy has been involved in planning the expansion of the electricity system, setting capacity quotas by technology on the one hand and, on the other, promoting separate tender processes for thermal, hydraulic or renewable energies, or directly holding tender processes for specific projects. The operation is being coordinated in a centralized fashion in which one independent operator coordinates centralized load dispatch based on variable production costs and seeks to guarantee to meet demand at the minimum cost for the system. The price at which transactions take place on the spot market is called the Difference Liquidation Price (Precio de Liquidación de las Diferencias, PLD), which takes into account the players’ aversion to risk.
Generation companies sell their energy on the regulated or unregulated market through contracts, and they trade their surpluses or deficits on the spot market. The free market is aimed at large users, with a limit of 3,000 kW or 500 kW if they purchase energy produced with renewable resources.
In the unregulated market, suppliers and their clients directly negotiate energy purchase conditions. In the regulated market, in contrast, where distribution companies operate, energy purchases must go through a tender process coordinated by the National Electricity Agency (ANEEL). In this way, the regulated purchase price used in the determination of tariffs to end users is based on average prices of open bids, and there are separate bidding processes for existing and new energy. Bidding processes for new energy contemplate long-term generation contracts in which new generation projects must cover the growth of demand foreseen by distributors. The open bids for existing energy consider shorter contractual terms and seek to cover the distributors’ contractual needs arising from the expiry of prior contracts. Each bidding process is coordinated centrally. Authorities set maximum prices and, as a result, contracts are signed where all distributors participating in the process buy pro rata from each offering generator.
On November 25, 2014, the ANEEL approved the new PLD limits for 2015. The maximum limits (decreased from R$823 to R$388/MWh) and the minimum (increased from R$16 to R$30/MWh). The decision was the result of extensive debate, which began with Public Consultation number 09/2014 and later with Public Hearing number 54/2014.
The main effect of the new limit is to reduce the financial impact for distributors of potential future risks when contracting energy on the spot market, as in 2014 the spot price was at its maximum for much of the year. The new maximum price also mitigates the risk of unrecoverable economic and financial losses for generators, when production is below contract values. However, the possibility of selling excess energy at higher prices decreases. Currently generators can divide their excess energy across the months of the year, to boost their revenues by allocating more energy to those months where higher prices are expected, as the ceiling is lower.
| | |
| The accompanying notes are an integral part of these consolidated financial statements | | |
|
| F-43 |
Annually, the ANEEL confirms through Resolutions the minimum and maximum values for the PLD limits. In 2016, the maximum and minimum PLD limits are R$422.56/MWH and R$30/MWh, respectively. Such PLD limits reflect the estimated costs of the Itaipú mega hydro power plant, which will have a tariff of 25.78 US$/kW in 2016.
These regulatory mechanisms ensure the creation of regulatory assets, whose rate adjustment for deficits in 2014 will take place in the tariff adjustments starting in 2015 (March for Ampla and April for Coelce). This mechanism has existed since 2001, and is called the Compensation Clearing Account - Part A (Cuenta de Compensación de Valores – Parte A, “CVA”). They aimed to maintain consistent operating margins for the dealer by allowing tariff revenue due to the costs of Parcel A.
Compensation Clearing Account (“CVA” for its acronym in Portuguese) helps maintain stability in the market and enables the creation of deferred costs, which is compensated through tariff adjustments based on the fees necessary to compensate for deficits the previous year.
On December 10, 2014, an addendum was signed to the concession contract for distributors in Brazil (Ampla and Coelce), which allows these regulatory assets (CVA’s and others) to be included in indemnitee assets at the end of the concession, and if this is not possible over time, it allows compensation through tariffs. Therefore, the recognition for these regulatory assets/liabilities is allowed under IFRS.
Brazil continued to experience drought conditions throughout 2014. In November the system reached the maximum risk of energy rationing. The average reservoir levels were 1% lower than at the last rationing. However, the Government has stated that there is no risk to supply.
The Government has created the ACR account to cover the additional energy costs through bank loans to be paid within two years through the tariff. Distributors had used approximately 18 billion reals from the ACR account by December 31, 2014. However, this was not enough to cover the shortfall. In March 2015, it was approved a new loan against the ACR account to cover the shortfall of November and December 2014. In addition, it was approved an extension in the payment period for all loans, which currently will have to be paid in 54 months from November 2015.
In January 2015, based on the mismatches between the costs recognized in tariffs and actual costs other than those related to operations of the distribution entities, and increased inherent drought conditions costs, ANEEL began the application of a system (known as Tariffs Flags) of monthly charges over the tariff to the customers, provided that the marginal cost of the system is higher than the regulatory standard. The purpose of the regulator is to indicate the customers the generating cost of the following month, and paying in advance to the distribution companies an amount that would only be available in the next tariff review process.
The system consists of three levels of colored flags: Green, Yellow and Red as follows:
| | | | | | |
| | |
Description | | To be applied when
CMO (R$/MWh) | | Additional Tariff
(R$/MWh) |
| Green | | Favorable generation of energy conditions | | <200 | | None |
| Yellow | | Less favorable generation of energy conditions | | >200<388.48 | | + 0.025 |
| Red | | Higher costs generation conditions | | >388.48 | | + 0.045 |
From January until reporting date, the values have been changing based on new expectations of future generation costs.
In summary, with this mechanism the generation cost that is currently transferred to the customer only once a year (when the annual tariff adjustment is performed) will generate a monthly variation and the customer can improve control over his/her electricity consumption. That is, the consumers will notice a lower tariff adjustment as they are paying a higher amount during the month.
Notwithstanding, the ANEEL, the agents and the community, discussed in a public hearing on December 15, 2015, improvements to the Tariff Flags system, where the main change proposed by ANEEL is to separate the Red Flag into two levels from February 2016.
| | |
| The accompanying notes are an integral part of these consolidated financial statements | | |
|
| F-44 |
In line with above, and looking for a solution to the effects of the drought conditions, the ANEEL approved in November 2015, the conditions to “renegotiate” the hydrological risk with the generation agents participating in the Electricity Reallocation Mechanism (“MRE”) which were pending until that date. However, the “Transitional Measure” is still pending of approval at the Senate. Currently, there is a major portion of generators with preliminary judicial decisions allowing limiting their risk and passing part of the cost through the customers.
In addition, for purposes of reestablish the energy supply, six electric power auctions have been called:
| | • | | 1 auction A-1: 1,954 MWavg, allocated to Hydro (94%), Biomass (4%) and Gas (2%); from 1 to 3 years of energy supply; |
| | • | | 97MWavg, allocated to Wind (30%) and Biomass (70%), at an average price of R$200/MWh |
| | • | | 233MWavg, allocated in 100% to Solar, at an average price of R$301.8/MWh |
| | • | | 314.3MWavg, allocated to Wind (72%), Hydro (15%), Gas (7%), and Biomass (6%), at an average price of R$189/MWh |
| | • | | 508MWavg, allocated to Wind (52%) and Solar (48%), at an average price of R$249/MWh. |
| | • | | 1 auction A-5: 1,160 MWavg, allocated to Gas (73%), Hydro (20%) and Biomass (7%), at an average price of R$259.2MWh. |
Also, it was carry out an Auction for Contracting Hydroelectrical Plants Concessions through the quota regime, in which the seller is granted energy (3,223 MWavg) and capacity (6,061 MW) for an Annual Revenue from Generation Operations.
Pro rata allocation of the Energy Development Account (CDE) due to judicial matters
The CDE, created under Law 10,438/2002, is a state-owned fund that provides energy development from alternative sources, promotes energy service globalization, and subsidizes the low income residential sub-class. The fund is financed through a charge in the tariff of customers and generators.
At the end of September 2015, ANEEL, based on certain judicial outcomes referring to suspend collection of CDE charges to certain industrial participants (Abrace’s members), had to recalculate the CDE pro rata allocation to the rest of the applicable participants, despite having transferred Parcel A costs. Subsequently, specific tariffs applicable to the members of Abrace will be published and the distribution companies will have to promote the new invoicing to those customers. The distribution companies will must maintain the payments of the CDE parts under actual amounts (published in the resolutions); and, finally the deficit originated for the revenue losses will be included in the tariff adjustments of the distribution companies.
On December 15, 2015, ANEEL organized a public hearing to discuss with agents and the community the 2016 economic budget for the CDE. The preliminary proposal of ANEEL is a 36% budget reduction for the charge “CCC” efficiency energy interruptions leading to a lower charge to the final tariff for the consumers. The deadline for the contributions is January 15, 2016.
Open discussions on Renewal of Distribution Concession Contract
From September 2012, distribution concessions under Article 22 of Law 9,074/1995 could be one-time renewed for a maximum 30-year period upon decision of the Grantor Power, in order to ensure the continuity, efficiency in rendering services, tariff model and acknowledging an operational and economic rationale.
The renewal of the concession for such distributions companies will be conditional to the render of quality services based on criteria relating to operational efficiency and economic/financial management.
On October 20, 2015, ANEEL approved the “draft version” of the amendment to the Concession Contract and recommended to the Ministry of Energy and Mining to extend the concessions. On December 28, 2015, the government extended the period to sign the contract for extending concessions due to complexity in the analysis of current grantors, and only approving the CELG’s concession.
| | |
| The accompanying notes are an integral part of these consolidated financial statements | | |
|
| F-45 |
Distributed Generation
On November 24, 2015, ANEEL approved the regulation on distributed micro- and mini-generation by using an energy compensation mechanism.
In May 2015, the regulator in a public hearing began the process to modify the regulations related to the distributed micro- and mini-generation aimed to making it more viable. The most important modification is to allow the installation of generation systems (of any renewable source, up to 3MW for hydro and 5MW for other sources) in locations other than where is located the load.
Colombia
The Public Utility Law (Ley de Servicios Públicos Domiciliarios, Law 142) and the Electricity Law (Ley Eléctrica, Law 143) were passed in 1994 establishing the new framework ordered by the Constitution. These laws set out the general criteria and policies that are to govern public utility service provision in the country, as well as the procedures and mechanisms for regulating, monitoring and overseeing them.
The Electricity Law puts the constitutional focus into practice, regulating the generation, transmission, distribution and sale of electricity, creating the market and competitive environment, strengthening the industry and setting the boundaries for government intervention. Taking into account the nature of each activity or business, general guidelines were established for developing the regulatory framework, creating and implementing the rules that would allow for free competition in the power generation and sales industries, while the directives for the transmission and distribution industries were geared toward treating these activities as monopolies while seeking out competitive conditions wherever possible.
The main institution in the electricity sector is the Mining and Energy Ministry, who’s Mining Energy Planning Unit, (Unidad de Planeación Minero Energética, UPME) draws up the national Energy Plan and the Generation and Transmission Expansion Plan. The Energy and Gas Regulatory Commission (Comisión de Regulación de Energía y Gas, CREG) and the Public Service Superintendency (Superintendencia de Servicios Públicos, SSPD) regulate and oversee, respectively, the companies in the industry, and the Superintendency of Industry and Commerce is the national authority for free trade protection issues.
The electricity industry operates on the basis of electricity-selling companies and the large consumers being able to buy and sell energy through bilateral contracts or on a short-term energy exchange market, called the energy exchange that operates freely according to supply and demand conditions. In addition, long-term auctions of Firm Energy within a Reliable Charge scheme are carried out to promote the expansion of the system. The market is operated and administered by XM, which is in charge of the National Dispatch Center (Centro Nacional de Despacho, CND), and the Commercial Interchange System Manager (Administrador del Sistema de Intercambios Comerciales, ASIC).
Peru
The Electricity Concessions Law and its regulations, the Law to Ensure Efficient Development of Electricity Generation (Law 28,832), the Electricity Industry Antimonopoly and Oligopoly Law, the Technical Standard for Electricity Service Quality, the Environmental Protection Regulations for Electricity Activities, the Law Creating the Energy and Mining Investment Supervisory Agency (OSINERGMIN) and its regulations, and the Regulations for Unregulated Electricity Users and Decree Law 1221 which improves the regulation of distribution of electricity to promote access to electricity in Peru all comprise the main legislation in the regulatory framework for doing business in the power industry in Peru.
Law 28,832, whose purpose is to ensure enough efficient power generation to reduce the risk of price volatility and rationing, promotes the establishment of market prices based on competition, planning and ensuring a mechanism that guarantees expansion of the transmission grid, and also allows Large Unregulated Users and Distributors to participate in the short-term market. Accordingly, the law promotes tender processes for long-term power supply contracts at firm prices in order to encourage investment in efficient generation and contracts with distribution companies. Distribution companies must begin the tender processes at least three years ahead of time in order to keep Regulated Users’ demand covered.
Expansion in transmission must be planned through a binding Transmission Plan drawn up by the COES SINAC and approved first by the OSINERGMIN and then by the Energy and Mining Ministry. There are two types of system: a) the Guaranteed Transmission System, which is paid for by the demand; and b) the Complementary Transmission System, which is financed jointly by the generation companies and by the demand.
| | |
| The accompanying notes are an integral part of these consolidated financial statements | | |
|
| F-46 |
The purpose of the COES SINAC is to coordinate operations at the lowest possible cost while ensuring a reliable system and the best use of energy resources, to plan transmission and to manage the short-term market. It is made up of generation, transmission and distribution companies and Large Unregulated Users (those with demand of 10 MW or higher) who belong to the National Interconnected Grid (Sistema Eléctrico Interconectado Nacional).
Generation companies may sell their power to: (i) Distribution companies through tender contracts or regulated bilateral contracts; (ii) Unregulated clients; and (iii) the spot market, where surplus energy is traded among generation companies. Generation companies are also paid for the firm capacity they contribute to the system regardless of their dispatch.
Peru’s spot price, given the definition of its ideal marginal cost, does not necessarily reflect the costs in the system, as it does not consider the current shortages in the natural gas and electricity transport system. Furthermore, it sets a ceiling price for the market. This was established in an emergency regulation in 2008 (Emergency Decree 049 of 2008) that will remain in effect at least until the end of 2016.
Decree Law 1221, published on September 24, 2015, amends certain aspects of the current framework, among others:
| | • | | In tariff distribution, VAD (Value Added Distribution) and Internal Rate of Return (IRR) calculation will be made individually for each distribution company with more than 50,000 customers. |
| | • | | The Energy and Mining Ministry will define a Technical Responsibility Zone (ZRT) for each distributor, taking into consideration the environment of the Regions where they operate (near to concession zones). The works conducted at the ZRT shall be approved by the Distributor, and it will have priority to conduct them or might be subsequently transferred to them. A VAD will be recognized for investment and audited actual costs (with an upper threshold). |
| | • | | Add to the VAD a charge for Technological Innovation and/or Energy Efficiency in Distribution. |
| | • | | Add an adjustment factor to the VAD that encourages service quality in Distribution. |
| | • | | Establish an obligation to the Distributors to assure their regulated demand for 24 months. |
| | • | | Establish an obligation to the Distributor of making urban electrification or return the contribution once 40% of habitability is reached. |
| | • | | Regarding the concessions, it limits to 30 years those granted through bidding processes, it establishes a requirement for a favorable report of basin management for hydro electrical generation, and the granting and expiration of concessions shall be ruled through Ministry Resolution. |
| | • | | Establish conditions for distributed generation of non-conventional renewable energy and co-generation that allows them to inject the surpluses to the distribution system without affecting the operational assurance. |
The description of the regulatory framework in the document does not include the Law Decree, since most of the amended aspects will be finally ruled by the end of 2015 or beginning of 2016, for its subsequent implementation.
Non-Conventional Renewable Energy
| | - | In Brazil, the ANEEL holds auctions by technology considering the expansion plan set by the EPE, the planning agency; so that the target amount set for non-conventional renewable energy capacity is met. |
| | - | In Colombia, Law 697 was issued in 2001 by the Program for the Rational and Efficient Use of Energy and Other Forms of Non-Conventional Energy (Programa de Uso Racional y Eficiente de la Energía y demás formas de Energías No Convencionales- PROURE). Subsequently, indicative targets were defined for non-conventional renewable energy of 3.5% for 2015 and 6.5% for 2020. Law 1715 was enacted in 2014, which created a legal framework for the development of non-conventional renewable energy, in which guidelines for declarations of public interest, as well as tax, tariff and accounting incentives were established. As part of the implementation, the Ministry of Mines and Energy enacted Decree 2469 in 2014 establishing guidelines for energy policy on supply of self-generation surpluses. Likewise, the Energy and Gas Regulatory Commission (“CREG”) issued resolution 24/2015 regulating high-scale self-generation activity, and the Mining Energy Planning Unit (“UPME”) issued resolution 281/2015 establishing the limit for low-scale (equal to 1MW) self-generation. Additionally, the CREG issued resolution 11/2015 encouraging demand response mechanisms. In 2015, the CREG issued Resolution 138 that amends the remuneration scheme for confidence charges for minor plants. This new regulation establishes that such plants will belong to the centralized scheme of the charge and will declare ENFICC in order to obtain OEF assignments. If the difference between actual and programmed generation in those plants is lower than +/-5%, they could keep the current remuneration scheme. The Ministry of Mines and Energy issued in 2015 Law Decree 1623 that establishes guidelines on zone expansion policies, and Law Decree 2143 that outlines the application of fiscal and tax incentives established in Law 1715. |
| | |
| The accompanying notes are an integral part of these consolidated financial statements | | |
|
| F-47 |
| | - | In Peru, a target of 5% has been set as the NCRE share in the country’s energy system. It is a nonbinding target and the regulatory agency, the OSINERGMIN, holds differential auctions by technology to help reach the goal. |
| �� | - | In Argentina, on October 21, 2015, it was published in the Official Bulleting the new Law 27, 191 for Renewable Energy, replacing the current Law 26,190. The new regulation postpones to December 31, 2017 the goal to reach 8% share in the national demand of energy with renewable sources for generation and establishes as a second stage goal to reach 20% share in 2025 establishing mid-objectives of 12%, 16% and 18% for the end of years 2019, 2021, and 2013. The enacted Law creates a Fiduciary Fund (“FODER”) to finance works, grants tax benefits to renewable energy projects and establishes exempts for specific taxes, national, provincial and municipality royalties until December 31, 2025. The customers categorized as Large Users (>300 Kw) shall comply on an individual basis with the renewable share goals, establishing that the price of the contracts shall not exceed 113 US$/MWh, and setting sanctions to those not fulfilling the goals. |
Limits on integration and concentration
In general, all of the countries have legislation in effect that defends free competition and, together with specific regulations that apply to the electricity market, defines criteria to avoid certain levels of economic concentration and/or abusive market practices.
In principle, the regulators allow the participation of companies in different activities (e.g. generation, distribution, and commercialization) as long as there is an adequate separation of each activity, for both accounting and company purposes. Nevertheless, most of the restrictions imposed involve the transmission sector mainly due to its nature and to the need to guarantee adequate access to all agents. In Argentina and Colombia there are specific restrictions if generation or distribution companies want to become majority shareholders in transmission companies.
Regarding concentration in a specific sector, in Argentina, there are no specific limits that affect the vertical or horizontal integration of a company. In Peru, integration is subject to authorization. In Colombia, no company may have a direct or indirect market share of over 25% in electricity sale activities, although two criteria have been established for generating activity. One of these relates to participation limits depending on market concentration (HHI) and the size of the players according to their Firm Energy, and the other relates to pivotally conditions in the market depending on the availability of resources to meet system demand. In addition, Colombian companies created after the Public Service Law was enacted in 1994 can only engage in activities that complement generation/sales and distribution/sales. Finally, in Brazil, with the changes taking place in the power industry under Law 10,848/2004 and Decree 5,163/2004, the ANEEL gradually perfected regulations, eliminating concentration limits as no longer compatible with the prevailing regulatory environment. However, regulatory approval is required for consolidations or mergers to take place between players operating within the same business segment.
Market for unregulated customers
In all of the countries where the Group operates, distributing companies can supply their customers under regulated or freely-agreed conditions. The supply limitations imposed on the unregulated market are as follows:
| | |
| Country | | kW threshold |
| Argentina | | > 30 kW |
| Brazil | | > 3,000 kW or > 500 kW (1) |
| Colombia | | > 100 kW or 55 MWh-month |
| Peru | | > 200 kW (2) |
(1) The >500 kW limit applies if energy is purchased from renewable sources, for which the government provides incentives through a discount on tolls.
(2) In April 2009, it was established that clients between 200 kW and 2,500 kW could choose between the regulated and unregulated markets. Those using over 2,500 kW are required to be unregulated customers.
General Aspects
In the countries where the Group operates, selling prices charged to clients are based on the purchase price paid to generators plus a component associated with the value added in distribution. Regulators set this value periodically through reviews of distribution tariffs. As a result, distribution is essentially a regulated activity.
| | |
| The accompanying notes are an integral part of these consolidated financial statements | | |
|
| F-48 |
Argentina
In Argentina, the first review of Edesur’s tariffs scheduled for 2001 was cancelled by the authorities due to the country’s economic and financial crisis, and tariffs were frozen starting with that year. Edesur’s tariff restructuring started in 2007 with the enforcement of the “Acta Acuerdo,” or Agreement Act. The last tariff adjustment made to date went into effect in 2008 (with a positive effect on the added value distribution, or VAD), when tariffs were adjusted for inflation (applying the cost monitoring mechanism, or MMC, provided for in the Agreement Act).
In November 2012, the ENRE passed Resolution 347 authorizing a fixed charge to be added on invoices which differs for various categories of customers. This charge will finance infrastructure works and corrective maintenance through a trust (FOCEDE). Additionally, in July 2012, the ENRE appointed an observer in Edesur; the appointment is still in effect, although this does not imply loss of control of the company.
Resolution SE No. 250/13 was published in May 2013 authorizing compensation for Edesur’s debt corresponding to revenues originating from the application of the Program for the Rational Use of Electricity (PUREE) until February 2013, with a credit in its favor from recognition of the MMC for the six-month periods between May 2007 and February 2013. In addition, the Resolution instructed CAMMESA to issue in Edesur’s favor what are termed as Sales Settlements with Unspecified Due Dates for values exceeding the compensation mentioned above, and authorized CAMMESA to receive these settlements as partial payment of Edesur’s debt.
Subsequently, Resolution SE 250/13 was supplemented and extended to December 2014 under Secretary of Energy Note SE 6852/2013, No. 4012, No.486 and No.1136. The financial effects of this compensation positively affected net income for the company. However, the Comprehensive Tariff Review (RTI) to adjust Edesur’s revenues to its costs and obligations, as provided for in the Renegotiation Agreement Act, is still pending at this time.
In March 2015, the Secretary of Energy issued Resolution SE No. 32/2015 establishing beginning on February 1, 2015, a NEW THEORETICAL TARIFF TABLE without passing it to the tariffs to the customers. The difference between the theoretical table and that applied to customers represent temporary additional revenue to the distribution Company, being the difference determined by the ENRE and CAMMESA responsible for transfer those funds. The resolution states that those additional revenues will be considered in the future RTI. Also, ENRE was instructed to apply the initial actions to implement it.
Likewise, and as of the same date, the resolution states that the funds originated in the PUREE will become actual revenue of the distribution company for recognizing higher costs. Additionally, it maintains the funding of the investments through the ENRE 347/12 charge and loans scoped in Resolution SE 10/2014.
In regards with the situation before January 31, 2015, the resolution extended the compensation MMC – PUREE to that date, allowing the payment between the loan to the distributor company and the Energy Invoice with CAMMESA. The remaining balance will be paid using a payment plan to be defined. In terms of the definition of the debt between EDESUR and CAMMESA, the Energy Secretary defined to be determined using the active rate of Banco de la Nación Argentina as well for the loans as for the debt of Edesur, without considering interest from CAMMESA as stated in the procedures.
The resolution requested the Company to present an Investment Plan for its approval and execution during the year 2015. Also, it requested to abandon the judicial actions that would have been initiated and the Commitment of Use of the additional revenues received (among them, not paying dividends).
Subsequently, the Secretary of Energy through Resolution SE No. 1208, instructed CAMMESA on the methodology to calculate the debt, as of January 31, 2015, that EDESUR owed to the MEM, and its compensation with the credits from the application of the Cost Monitoring Mechanism (MMC). As a result, during the first semester of 2015, EDESUR recognized net financial income for AR$628.6 million.
Although Resolution SE No. 32/2015 represents the first step towards an improvement in the economic situation of the Company, it expects that investments be still financed with mutual loans with CAMMESA. It is still pending to establish mechanisms to allow payment of remaining balances in favor of MEM, as well as, the revenue updates from the increases in operational costs. On the other side, tariffs remain frozen since 2008.
Additionally, the ENRE informed to the Secretary of Energy the variations to the Cost Monitoring Mechanism (MMC) for the November 2014 – April 2015 (6.85%) and May 2015 – October 2015 (8.92%) periods as required by Article 2 of Resolution SE 32/15. Based on such variations, the Secretary of Energy updated the Transitional Revenues established in Article 5 of Resolution SE 32/15. The updates were informed through Notes SE 2097 and 2157. On the other hand, the issuance of Resolution SE 2158 resulted in the recognition of additional salary expense for the year 2014 that were applied to employees in year 2015. (See Note 36.5)
| | |
| The accompanying notes are an integral part of these consolidated financial statements | | |
|
| F-49 |
Brazil
In Brazil, there are three types of tariff adjustments: i) Ordinary Tariff Reviews (RTO) which are conducted periodically in accordance with the provisions in the concession contracts (in Coelce every 4 years and in Ampla every 5 years); (ii) Annual Adjustments (IRT) since Brazil, unlike other countries, does not automatically index its tariffs to inflation; and (iii) Extraordinary Reviews (RTE) when important events have occurred that may affect the financial situation of the distributors.
In September 2012, the government approved Temporary Measure 579, one purpose of which was to reduce certain electricity tariff taxes and special charges paid by the final user, which will be paid in the future with the state budget. In January 2013, the Temporary Measure became Law 12,783, giving rise to Extraordinary Tariff Reviews that resulted in tariffs dropping an average of 18% throughout the country. This reduction affected Ampla and Coelce from the end of January to April 2013 (when the respective annual readjustments went into effect).
In April 2014, ANEEL finalized its periodic tariff review of Ampla for the 2014-2019 period with retrospective effect at March 15, 2014.
On March 1, 2015, through Resolution No. 1858/2015, Coelce had an extraordinary review when its rate increased by 10.28% for purposes of face the increases in charges (Energy Development Account - CDE) and the costs of energy purchase.
The last periodic tariff review of Coelce was made in 2015 (the first of our distribution companies using the new fourth tariff cycle technology) for the 2015 – 2019 period, effective beginning on April 22, 2015. Such review was provisional as the methodologies of tariff review were not approved in time. The additional average increase in tariffs was 11.69% as approved under Resolution No. 1882/2015. In 2016, the final review will be calculated and the positive/negative differences from the application of the new methodology will be included in the 2016 adjustments.
Ampla will begin to use the fourth tariff cycle methodology in its tariff review in March 2019; however, in March 2015 it has a final average increase of 37.3% (Resolution 1869/2015) essentially due to increases in Section A.
Finally, still in the scope of the fourth tariff cycle, on November 17, 2015, Chapter 2.3 of the Tariff Review Procedures related to the determination of the Basis for Remuneration was approved, under which a Database of Referential Prices was created to value certain variables of the basis for remuneration in the upcoming tariff reviews.
ANEEL approved the results of the first periodic review of CIEN. Beginning on July 1, 2015, the rates were adjusted in minus 7.49%, as approved in Resolution No. 1902/2015.
Colombia
The Energy and Gas Regulatory Commission (Comisión de Regulación de Energía y Gas - CREG) is the entity that defines the method by which distribution networks are paid. Distribution charges are reviewed every five years and updated monthly according to the Producer Price Index (PPI). Currently, these charges include the new replacement value of all operational assets, the Administration, Operation and Maintenance (AOM) and non-electrical assets used in the distribution business.
In Colombia, the current distribution charges for Codensa were published by the CREG in October 2009. Meanwhile, marketing charges were established in 1998.
The review of regulated distribution charges began in 2013 with the publication of the assumptions for the remuneration methodology proposed by the CREG in Resolution 043 dated 2013. These assumptions were complemented by the development of the Purposes and Guidelines for Compensation of the Distribution Activity for the period 2015-2019 in resolution CREG 079 dated 2014. This resolution stems from the policies defined by the Ministry of Mines and Energy that seek to ensure timely expansion and adequacy of assets, and to this end to incorporate replacement incentives and a comprehensive Investment Plan that will incorporate technology, improve service quality and control energy losses. In February 2015, the CREG issued a proposal of Resolution 179 of 2014, which propose the methodology for remunerating the distribution activity. The methodology is based on a Regulated Revenue scheme. Annual revenues will be determined using a
| | |
| The accompanying notes are an integral part of these consolidated financial statements | | |
|
| F-50 |
Regulated of Assets Net Basis (BRA) and a rate of return (to be defined in separate resolution) plus the Recovery of Invested Capital. Also, it is included an annual revenue for incentives to investments and expenditures efficiency and quality improvements.
Additionally, the Regulatory Commission issued resolution CREG 095 dated 2014, where is defined the method for calculating the regulated remuneration tariff (WACC) for Electricity Transmission and Distribution, as well as for Natural Gas Transportation and Distribution.
In relation to the regulated selling charge, in January 2015, the CREG issued Resolution 180 of 2014, where the methodology for calculating regulated selling charges was defined. The approval of a new basis selling cost for Codensa is still pending.
The Commission published resolution CREG 135 dated 2014 with regard to the pricing formula. This resolution establishes the assumptions on which studies were carried out to determine the unit cost formula for providing the service during the next tariff period.
Peru
As in Chile, a process takes place in Peru every four years to determine the VAD, also using a “model company” methodology for a typical area. In October 2013, the OSINERGMIN published Resolution 203/2013 setting Edelnor’s distribution tariffs from November 2013 to October 2017.
4.2 Discontinued operations
Chile
The electricity sector is regulated by the General Law of Electrical Services (Chilean Electricity Law), also known as DFL No. 1 of 1982, of the Ministry of Mining, whose compiled and coordinated text was established in DFL No. 4 issued in 2006 by the Ministry of Economy (the Electricity Law), as well as by an associated Regulation (D.S. No. 327 issued in 1998). Three government bodies are primarily responsible for enforcing this law: the National Energy Commission (CNE), which has the authority to propose regulated tariffs (node prices) and to draw up indicative plans for the construction of new generating units; the Superintendency of Electricity and Fuels (SEF), which supervises and oversees compliance with the laws, regulations, and technical standards that govern the generation, transmission, and distribution of electricity, as well as liquid fuels, and gas; and the Ministry of Energy, which is responsible for proposing and guiding public policies on energy matters. It also oversees the SEF, the CNE, and the Chilean Commission for Nuclear Energy (ChCNE), thus strengthening coordination and allowing for an integrated view of the energy sector. The Ministry of Energy also includes the Agency for Energy Efficiency and the Center for Renewable Energy, (Centro de Energías Renovables -CER), which in November 2014 was replaced by the National Center for Innovation and Development of Sustainable Energy (Centro Nacional para la Innovación y Fomento de las Energías Sustentables -CIFES). The Chilean Electricity Law has also established a Panel of Experts whose main task is to resolve potential discrepancies among the players in the electricity market, including electricity companies, system operators, regulators, etc.
From a physical viewpoint, the Chilean electrical sector is divided into four electrical grids: theSistema Interconectado Central (SIC), theSistema Interconectado del Norte Grande (SING), and two separate medium-size grids located in southern Chile, one in Aysén and the other in Magallanes. The SIC, the main electrical grid, runs 2,400 km longitudinally and connects the country from Taltal in the north to Quellon, on the island of Chiloe in the south. The SING covers the northern part of the country, from Arica down to Coloso, covering a length of some 700 km. A law was passed on January 8, 2014, which will allow the SIC to be connected to the SING.
The electricity industry is organized into three business segments: generation, transmission, and distribution, all operating in an interconnected and coordinated manner, and whose main purpose is to supply electrical energy to the market at minimum cost while maintaining the quality and safety service standards required by the electrical regulations. As essential services, the power transmission and distribution businesses are natural monopolies; these segments are regulated as such by the electricity law, which requires free access to networks and regulates rates.
Under the Chilean Electricity Law, companies engaged in generation and transmission on an interconnected electrical grid must coordinate their operations through a centralizing operating agent, the Centro de Despacho Económico de Carga (CDEC), in order to operate the system at minimum cost while maintaining a reliable service. For this reason, the CDEC plans and operates the system, including the calculation of the so-called “marginal cost,” which is the price assigned to energy transfers among power generating companies.
| | |
| The accompanying notes are an integral part of these consolidated financial statements | | |
|
| F-51 |
Therefore, a company’s decision to generate electricity is subject to the CDEC’s operation plan. On the other hand, each company is free to decide whether to sell its energy to regulated or unregulated customers. Any surplus or deficit between a company’s sales to its customers and its energy supply is sold to, or purchased from, other generators at the spot market price.
A power generating company may have the following types of customers:
(i)Distribution companies that supply power to regulated customers: This distribution is to residential and commercial consumers and small and medium-size businesses with a connected capacity equal to or less than 500 kW located in the concession area of a distribution company. Until January 2015, customers consuming between 500kW and 2,000 kW may choose to be regulated or unregulated customers. On January 29, 2015, an amendment to the law was published in the Official Gazette increasing the upper threshold from 2,000kW to 5,000kW. A summarized description of the scope of the amendments to the law are described below.
Until 2009, the transfer prices between generators and distribution companies for supplying power to regulated customers were capped at a maximum value called the node price, which is regulated by the Ministry of Energy. Node prices are set every six months, in April and October, based on a report prepared by the CNE that takes into account projections of expected marginal costs in the system over the next 48 months for the SIC and 24 months for the SING. Beginning in 2010, and as the node price contracts begin to expire, the transfer prices between generators and distributors is being replaced by the results of regulated bidding processes, with a price cap set by the authority every six months.
(ii)Unregulated customers: Those customers, mainly industrial and mining companies, with a connected capacity of over 5,000 kW. These consumers can freely negotiate prices for electrical supply with generators and/or distributors. Customers with capacity between 500 and 5,000 kW have the option to contract energy at prices agreed upon with their suppliers or be subject to regulated prices, with a minimum stay of at least four years under each pricing system. As previously discussed, the 5,000 kW threshold became effective beginning on January 30, 2015.
(iii)Spot market: This represents energy and capacity transactions among generating companies that result from the CDEC’s coordination to keep the system running as economically as possible, where the surpluses (deficits) between a generator’s energy supply and the energy it needs to comply with business commitments are transferred through sales (purchases) to (from) other generators in the CDEC. In the case of energy, transfers are valued at the marginal cost, while node prices for capacity are set every semester by the regulators.
In Chile, the capacity that must be paid to each generator depends on an annual calculation performed by the CDEC to determine the firm capacity of each power plant, which is not the same as the dispatched capacity.
Beginning in 2010 with the enactment of Law 20,018, distribution companies must have enough supply permanently available to cover their entire demand projected for a period of three years; to do so, they must carry out long-term public bidding processes. This period of three years has been changed to five years, following the legislative amendment published in January 2015.
On May 15, 2014, the Minister of Energy presented the “Energy Agenda,” a document outlining general guidelines for the energy policy of the new government.
On September 29, 2014, a Tax Reform was published in the Official Gazette, which emphasizes the creation of so-called green tax to be levied on air emissions of particulate matter (PM), nitrogen oxides (NOx), sulfur dioxide (SO2) and carbon dioxide (CO2). The tax will be US$5/ton for CO2 emissions.
On January 29, 2015, Law 20,805 was published in the Official Gazette, incorporating a legal amendment to the energy bidding processes for consumption of regulated customers. Among the main changes incorporated through this amendment are the increased participation of the CNE in the bidding processes; the increase from three to five years for the anticipated bidding announcements; the incorporation of a reserved price as a limit price for each bid; the chance for a bidder to delay the energy supply in case of force majeure; the increase of the duration of the supply contract up to 20 years; the incorporation of short-term biddings; the treatment for energy without contract; and the increase in the upper threshold to qualify as regulated customer from 2,000 to 5,000 kW.
| | |
| The accompanying notes are an integral part of these consolidated financial statements | | |
|
| F-52 |
Non-Conventional Renewable Energy
| | - | In Chile,Law 20,257 was enacted in April of 2008 to encourage the use of Non-Conventional Renewable Energy (NCRE). The principal aspect of this law is that at least 5% of the energy sold by generation companies to their customers must come from renewable sources between years 2010 and 2014. This requirement progressively increases by 0.5% from year 2015 until 2024, when a 10% renewable energy requirement will be reached. This law was amended in 2013 by Law 20,698, dubbed the “20/25 law,” as it establishes that by 2025, 20% of power supplied will be generated by NCRE. It does not change the previous law’s plan for supplying power under agreements in effect in July 2013. |
Limits on integration and concentration
Chile has legislation in effect that defends free competition and, together with specific regulations that apply to the electricity market, defines criteria to avoid certain levels of economic concentration and/or abusive market practices.
In principle, the regulators allow the participation of companies in different activities (e.g. generation, distribution, and commercialization) as long as there is an adequate separation of each activity, for both accounting and company purposes. Nevertheless, most of the restrictions imposed involve the transmission sector mainly due to its nature and to the need to guarantee adequate access to all agents. In Chile there are specific restrictions if generation or distribution companies want to become majority shareholders in transmission companies.
Regarding concentration in a specific sector, there are no specific quantitative limits on vertical or horizontal integration. However, the General Law on Electrical Services provides that companies that operate on or have ownership in the Trunk Transmission Systems cannot engage in, either directly or indirectly, activities that are in any way involved in the business of power generation or distribution.
Unregulated Customers Market
In Chile, distribution companies provide supply to regulated and unregulated customers. Customers with capacity between 500 and 5,000 kW have the option to contract energy at prices agreed upon with their suppliers or be subject to regulated prices. Customers with capacity exceeding 5,000 kW by default unregulated customers. The 5,000 kW threshold became effective beginning on January 30, 2015.
In Chile, the Distribution Value Added (VAD) is established every four years. For this, the local regulator, (the CNE) classifies companies by typical areas that group together companies with similar distribution costs. A distribution company’s return on investment depends on the company’s performance compared to model company standards defined by the regulator. On April 2, 2013, the Energy Ministry published Tariff Decree No. 1T in the Official Gazette. This was made retroactive to November 4, 2012, and will remain in effect until November 3, 2016. The next tariff-setting process will take place in 2016 and will cover the period November 2016 to November 2020.
On January 27, 2015, the Ministry of Energy published in the Official Gazette, Decree No.��9T, which established the node prices for energy supply that will be applied retrospectively, beginning on May 1, 2014.
On May 12, 2015, the Ministry of Energy published in the Official Gazette, Decrees No.2T and 3T, which established the node prices for energy supply that will be applied retrospectively, beginning on September 1 and October 1, 2014, respectively.
On May 22, 2015, the Ministry of Energy published in the Official Gazette, Decree No. 9T, which established the node prices for energy supply that will be applied retrospectively, beginning on October 1, 2014.
On June 23, 2015, the Ministry of Energy published in the Official Gazette, Decree No.12T, which established the node prices for energy supply that will be applied retrospectively, beginning on January 1, 2015.
On August 4, 2015, the Ministry of Energy published in the Official Gazette, Decree No.15T, which established the node prices for energy supply that will be applied retrospectively, beginning on February 1, 2015.
On November 4, 2015, the Ministry of Energy published in the Official Gazette, Decree No.16T, which established the node prices for energy supply that will be applied retrospectively, beginning on April 1, 2015.
| | |
| The accompanying notes are an integral part of these consolidated financial statements | | |
|
| F-53 |
On December 26, 2015, the Ministry of Energy published in the Official Gazette, Decree No.21T, which established the node prices for energy supply that will be applied retrospectively, beginning on May 1, 2015.
As a result of the above, our subsidiary Chilectra at December 31, 2015, recognized unbilled revenue and trade and other accounts receivable for the difference between current and effective Average Node Prices for ThCh$33,649,923 (ThCh$98,064,320 at December 31, 2014) to be billed and charge to regulated end-customers. In addition, at December 31, 2015, Chilectra recognized costs and trade and other payables for the difference between current and effective Short Term Node Prices for ThCh$31,959,398 (ThCh$22,750,995 at December 31, 2014) to be paid to generation companies.
| | |
| The accompanying notes are an integral part of these consolidated financial statements | | |
|
| F-54 |
| | 5. | NON-CURRENT ASSETS OR DISPOSAL GROUPS HELD FOR SALE OR HELD FOR DISTRIBUTION TO OWNERS AND DISCONTINUED OPERATIONS. |
5.1 Corporate Reorganization
I. Background
On April 28, 2015, the Company informed the Superintendency of Securities and Insurance (hereinafter “SVS”) through a significant event, that the Board of Directors of the Company decided by unanimous vote to initiate an analysis of a corporate reorganization (the “reorganization”) aimed at the separation of the activities of generation and distribution of electricity in Chile from activities outside of Chile. The objective of this would be to resolve certain duplications and redundancies that arise from Enersis’ complex corporate structure today and generate value for all its shareholders, maintaining its inclusion in the Enel S.p.A. group.
Steps to carry out the reorganization:
| | - | The spin-off of Enersis, and its subsidiaries Empresa Nacional de Electricidad S.A. (“Endesa Chile”) and Chilectra S.A. (“Chilectra”) by separating, on one side their generation and distribution businesses in Chile and for other side the businesses outside of Chile; and |
| | - | The subsequent merger of the entities having ownership interests in businesses outside of Chile namely Enersis Américas S.A., Endesa Américas S.A. and Chilectra Américas S.A. Enersis Américas would absorb by merger the other two entities. |
On December 18, 2015, at Enersis S.A.’s Extraordinary Shareholders Meeting the spin-off of the Company was approved, which was conditioned on the approval of the spin-offs at each of the Extraordinary Shareholders Meetings of Endesa Chile and Chilectra, and also on the necessary legal formalities and other related matters. In addition, it was approved that the spin-off will be effective in the first business day of the following month that the public deed of compliance with the spin-off conditions is granted.
As a result of Enersis’s spin-off a new public entity was created namely Enersis Chile S.A., to which was assigned the equity interests, assets and associated liabilities of Enersis’s businesses in Chile, including the equity interests in each of Endesa Chile and Chilectra Chile.
On March 1, 2016, upon meeting all conditions including the capital decrease and modifications to the by-laws, the spin-off of Enersis became effective and Enersis S.A.’s corporate name was changed to Enersis Américas S.A. The new entity Enersis Chile was also incorporated on that date (See Note 41).
II. Accounting Aspects
As of December 31, 2015, upon compliance with the criteria in IFRS 5 – Non-Current Assets Held for Sale and Discontinued Operations, the following accounting treatment has been applied:
| | | i. Assets and liabilities |
As of December 31, 2015, all assets and liabilities related to the distribution and generation businesses in Chile have been classified as Non-current assets or disposal groups held for distribution to owners and as Liabilities associated with disposal groups held for distribution to owners, in accordance with the criteria described in Note 3.k.
| | |
| The accompanying notes are an integral part of these consolidated financial statements | | |
|
| F-55 |
As of December 31, 2015, the assets and liabilities related to the operations in Chile that have been classified as held for distribution to owners are as follows:
| | | | |
| | | 12-31-2015 | |
| | | ThCh$ | |
ASSETS | | | | |
| | | | |
CURRENT ASSETS | | | | |
| | | | |
Cash and cash equivalents | | | 144,261,845 | |
Other current financial assets | | | 16,313,194 | |
Other current non-financial assets | | | 3,984,943 | |
Trade and other current receivables | | | 596,364,468 | |
Current accounts receivable from related companies | | | 23,611,569 | |
Inventories | | | 42,616,615 | |
Current tax assets | | | 20,306,212 | |
| | | | |
TOTAL CURRENT ASSETS | | | 847,458,846 | |
| | | | |
NON-CURRENT ASSETS | | | | |
| | | | |
Other non-current financial assets | | | 21,750,452 | |
Other non-current non-financial assets | | | 4,769,885 | |
Trade and other non-current receivables | | | 14,392,223 | |
Investments accounted for using the equity method | | | 45,716,371 | |
Intangible assets other than goodwill | | | 42,879,326 | |
Goodwill | | | 887,257,655 | |
Property, plant and equipment | | | 3,429,167,797 | |
Investment property | | | 8,150,987 | |
Deferred tax assets | | | 22,392,339 | |
| | | | |
TOTAL NON-CURRENT ASSETS | | | 4,476,477,035 | |
| | | | |
TOTAL ASSETS (*) | | | 5,323,935,881 | |
| | | | |
CURRENT LIABILITIES | | | | |
| | | | |
Other current financial liabilities | | | 27,921,725 | |
Trade and other current payables | | | 554,915,972 | |
Current accounts payable to related companies | | | 55,238,930 | |
Other current provisions | | | 16,329,195 | |
Current tax liabilities | | | 15,119,789 | |
Other current non-financial liabilities | | | 6,120,658 | |
| | | | |
TOTAL CURRENT LIABILITIES | | | 675,646,269 | |
| | | | |
NON-CURRENT LIABILITIES | | | | |
| | | | |
Other non-current financial liabilities | | | 917,197,790 | |
Other non-current payables | | | 6,034,216 | |
Non-current accounts payable to related companies | | | 97,186 | |
Other non-current provisions | | | 56,116,140 | |
Deferred tax liabilities | | | 235,101,356 | |
Non-current provisions for employee benefits | | | 55,023,456 | |
Other non-current non-financial liabilities | | | 435,689 | |
| | | | |
TOTAL NON-CURRENT LIABILITIES | | | 1,270,005,833 | |
| | | | |
TOTAL LIABILITIES (*) | | | 1,945,652,102 | |
| | (*) | It does not include balances from intercompany loan and other arrangements between Enersis and Enersis Chile which were eliminated in the consolidation |
| | |
| The accompanying notes are an integral part of these consolidated financial statements | | |
|
| F-56 |
| | | ii. Accumulated Other Comprehensive Income in Net Equity |
The accumulated other comprehensive income balance related to assets and liabilities held for distribution to owners are the following:
| | | | |
| Reserves originated from | | 12-31-2015 | |
| | | ThCh$ | |
| | | | |
Exchange differences on translation | | | 12,423,692 | |
| | | | |
Cash flow hedges | | | (121,503,052 | ) |
| | | | |
Gains and losses on remeasuring available-for-sale financial instruments | | | 14,835 | |
| | | | |
Other miscellaneous reserves | | | 7,736,853 | |
| | | | |
Total | | | (101,327,672 | ) |
| | | iii. Revenue and expenses |
All revenues and expenses related to the distribution and generation businesses in Chile were classified as discontinued operations and presented under the caption “Income after tax from discontinued operations” in the consolidated statement of comprehensive income.
The consolidated statement of comprehensive income presented for comparison purposes in these consolidated financial statements differ from those approved in years 2014 and 2013 due to the classification of revenues and expenses on those years as discontinued operation.
The following table sets forth the breakdown by nature of the line item “Income after tax from discontinued operations” for the years ended December 31, 2015, 2014 and 2013:
| | | | | | | | | | | | |
| Statement of Income | | 12-31-2015 ThCh$ | | | 12-31-2014 ThCh$ | | | 12-31-2013 ThCh$ | |
| | | | | | | | | | | | |
Revenue | | | 2,382,671,016 | | | | 2,013,305,145 | | | | 1,717,781,888 | |
Other income | | | 14,735,951 | | | | 34,201,387 | | | | 18,516,145 | |
Total Revenue | | | 2,397,406,967 | | | | 2,047,506,532 | | | | 1,736,298,033 | |
| | | | | | | | | | | | |
Raw materials and consumables used | | | (1,481,985,559 | ) | | | (1,309,402,283 | ) | | | (998,873,893 | ) |
Contribution Margin | | | 915,421,408 | | | | 738,104,249 | | | | 737,424,140 | |
| | | | | | | | | | | | |
Other work performed by the entity and capitalized | | | 21,004,053 | | | | 21,505,568 | | | | 14,831,058 | |
Employee benefits expense | | | (136,554,721 | ) | | | (126,341,363 | ) | | | (120,113,902 | ) |
Depreciation and amortization expense | | | (153,201,662 | ) | | | (128,437,154 | ) | | | (119,507,118 | ) |
Reversal of impairment loss (impairment losses) recognized in profit or loss | | | 3,054,903 | | | | (13,185,420 | ) | | | (8,212,948 | ) |
Other expenses | | | (125,849,781 | ) | | | (110,321,349 | ) | | | (114,350,778 | ) |
Operating income | | | 523,874,200 | | | | 381,324,531 | | | | 390,070,452 | |
| | | | | | | | | | | | |
Other gains | | | 20,055,745 | | | | 70,893,263 | | | | 14,527,737 | |
Financial income | | | 15,270,169 | | | | 14,762,515 | | | | 13,510,732 | |
Financial costs | | | (61,616,349 | ) | | | (59,543,956 | ) | | | (62,395,332 | ) |
Share of profit (loss) of associates and joint ventures accounted for using the equity method | | | 8,905,045 | | | | (54,352,582 | ) | | | 24,309,344 | |
Foreign currency exchange differences | | | (13,394,762 | ) | | | (20,328,278 | ) | | | (1,838,329 | ) |
Profit from indexed assets and liabilities | | | 4,839,077 | | | | 15,263,623 | | | | 1,593,046 | |
| | | | | | | | | | | | |
Income before taxes | | | 497,933,125 | | | | 348,019,116 | | | | 379,777,650 | |
Income tax expense, discontinued operations | | | (109,612,599 | ) | | | (132,687,135 | ) | | | (61,712,442 | ) |
NET INCOME FROM DISCONTINUED OPERATIONS | | | 388,320,526 | | | | 215,331,981 | | | | 318,065,208 | |
| | | | | | | | | | | | |
| | |
| The accompanying notes are an integral part of these consolidated financial statements | | |
|
| F-57 |
| | | | | | | | | | | | |
| Statement of Income | | 12-31-2015 ThCh$ | | | 12-31-2014 ThCh$ | | | 12-31-2013 ThCh$ | |
Net income from discontinued operations | | | 388,320,526 | | | | 215,331,981 | | | | 318,065,208 | |
| | | | | | | | | | | | |
Components of other comprehensive that will not be reclassified subsequently to profit or loss, net of taxes | | | | | | | | | | | | |
(Gain (loss) from defined benefit plans | | | (4,320,290 | ) | | | (8,165,647 | ) | | | (2,608,902 | ) |
Components of other comprehensive that will be reclassified subsequently to
profit or loss, net of taxes | | | | | | | | | | | | |
Foreign currency translation gains (losses), net of tax | | | 162,373 | | | | 12,473,950 | | | | 12,286,748 | |
Gains (losses) from available-for-sale financial assets, net of tax | | | - | | | | - | | | | - | |
Share of other comprehensive income from associates and joint venture accounted for using the equity method, net of taxes | | | 25,442 | | | | 13,746,871 | | | | 8,699,592 | |
Gains (losses) from cash flow hedge, net of taxes | | | (90,724,491 | ) | | | (99,770,340 | ) | | | (59,974,545 | ) |
| | | | | | | | | | | | | |
Total Other Comprehensive Income from Discontinued Operations | | | (95,460,270 | ) | | | (81,985,166 | ) | | | (41,596,400 | ) |
| | | | | | | | | | | | | |
TOTAL COMPREHENSIVE INCOME FROM DISCONTINUED
OPERATIONS | | | 292,860,254 | | | | 133,346,815 | | | | 276,468,807 | |
| | | | | | | | | | | | |
Comprehensive income attributable to: | | | | | | | | | | | | |
Shareholders of Enersis Américas | | | 235,061,432 | | | | 126,239,319 | | | | 208,787,095 | |
Non-controlling interests | | | 57,798,822 | | | | 7,107,496 | | | | 67,681,712 | |
TOTAL COMPREHENSIVE INCOME FROM DISCONTINUED
OPERATIONS | | | 292,860,254 | | | | 133,346,815 | | | | 276,468,807 | |
Due to classification of generation and distribution of energy activities in Chile as discontinued operations, those lines of business are not included in Note 35. Information by segment.
The following table sets for the net cash flows from operating, investing and financing activities attributable to discontinued operations for the years ended December 31, 2015, 2014 and 2013:
| | | | | | | | | | | | |
| Statement of cash flows | | 12-31-2015 M$ | | | 12-31-2014 M$ | | | 12-31-2013 M$ | |
| | | | | | | | | | | | |
Net cash flows from (used in) operating activities | | | 576,531,527 | | | | 264,946,881 | | | | 442,960,531 | |
Net cash flows from (used in) investing activities | | | (296,741,342 | ) | | | (188,738,471 | ) | | | (106,125,058 | ) |
Net cash flows from (used in) financing activities | | | (273,442,450 | ) | | | (159,144,481 | ) | | | (216,411,065 | ) |
Net increase (decrease) in cash and cash equivalents before effect of Exchange rate changes | | | 6,347,735 | | | | (82,936,071 | ) | | | 120,424,408 | |
Effect of exchange rate changes on cash and cash equivalents | | | 4,898,483 | | | | 1,044,602 | | | | 388,929 | |
Net increase (decrease) in cash and cash equivalents | | | 11,246,218 | | | | (81,891,469 | ) | | | 120,813,337 | |
Cash and cash equivalents at beginning of period | | | 133,015,627 | | | | 214,907,097 | | | | 94,093,760 | |
Cash and cash equivalents at end of period | | | 144,261,845 | | | | 133,015,628 | | | | 214,907,097 | |
Appendix 4 to these consolidated financial statements shows supplementary information related to assets and liabilities held for distribution to owners, as well as the results from discontinued operations.
| | |
| The accompanying notes are an integral part of these consolidated financial statements | | |
|
| F-58 |
| | 5.2 | Sale of Concesionaria Túnel El Melón S.A. |
In December 2014, Empresa Nacional de Electricidad S.A. and its subsidiary Compañía Eléctrica de Tarapacá S.A. signed a contract to sell all their shares in Sociedad Concesionaria Túnel El Melón S.A. to Temsa Private Investment Fund. Such contract established a number of conditions, which were not fulfilled at the end of 2014, preventing the closure of the sale. The sale was finalized on January 9, 2015 (See Note 31).
Túnel El Melón S.A is a private corporation whose purpose is the construction, maintenance and operation of the public work called the El Melón Tunnel and the provision of ancillary services authorized by the Ministry of Public Works (MOP).
El Melón Tunnel is an alternative route to the road that climbs the El Melon pass, which is located between 126 and 132 kilometers north of Santiago on Route 5. This is the main highway linking the country from Arica to Puerto Montt.
As described in Note 3.k), non-current assets and groups of assets held for sale have been recorded at the lower of their carrying amount and fair value less costs of disposal.
The main items of assets, liabilities and cash flow held for sale as of December 31, 2014, for the aforementioned entity are as follows:
| | | | |
| ASSETS | | Balance 12/31/2014 | |
CURRENT ASSETS | | | | |
Cash and cash equivalents | | | 29,701 | |
Other current non-financial assets | | | 81,275 | |
Trade and other current receivables | | | 758,645 | |
Current tax assets | | | 1,401 | |
| | | | |
| TOTAL CURRENT ASSETS | | | 871,022 | |
| |
NON-CURRENT ASSETS | | | | |
Intangible assets other than goodwill | | | 4,404,615 | |
Property, plant and equipment | | | 81,432 | |
Deferred tax assets | | | 2,621,894 | |
| | | | |
| TOTAL NON-CURRENT ASSETS | | | 7,107,941 | |
| | | | |
| TOTAL ASSETS | | | 7,978,963 | |
| | | | |
| |
| LIABILITIES | | | | |
| |
CURRENT LIABILITIES | | | | |
Other current financial liabilities | | | 3,072,179 | |
Trade and other current payables | | | 495,235 | |
Other current non-financial liabilities | | | 131,030 | |
| | | | |
| TOTAL CURRENT LIABILITIES | | | 3,698,444 | |
| NON-CURRENT LIABILITIES | | | | |
Other non-current financial liabilities | | | 1,660,254 | |
Non-current provisions for employee benefits | | | 102,423 | |
Other non-current non-financial liabilities | | | 27,026 | |
| | | | |
| TOTAL NON-CURRENT LIABILITIES | | | 1,789,703 | |
| | | | |
| TOTAL LIABILITIES | | | 5,488,147 | |
| | | | |
| | | | |
| |
| For the year ended
12/31/2014 |
|
Summary of net cash flows | | | | |
Net cash flows from (used in) operating activities | | | 9,045,775 | |
Net cash flows from (used in) investment activities | | | (5,604,740 | ) |
Net cash flows from (used in) financing activities | | | (3,450,774 | ) |
Net increase (decrease) in cash and cash equivalents before effect of exchange rate changes | | | (9,739 | ) |
Effect of exchange rate changes on cash and cash equivalents | | | - | |
Net increase (decrease) in cash and cash equivalents | | | (9,739 | ) |
Cash and cash equivalents at beginning of period | | | 39,440 | |
Cash and cash equivalents at end of period | | | 29,701 | |
| | |
| The accompanying notes are an integral part of these consolidated financial statements | | |
|
| F-59 |
| | 6. | BUSINESS COMBINATION – ACQUISITION OF GASATACAMA. |
On April 22, 2014, Endesa Chile acquired the remaining 50% ownership interest in Inversiones GasAtacama Holding Limitada (hereinafter “GasAtacama”) that was owned by Southern Cross Latin America Private Equity Fund III L.P. (hereinafter “Southern Cross”) at that time.
Consequently, the Group now holds 100% of control over GasAtacama, which at the same time is the owner of (i) the Atacama Plant, a 780 MW capacity combined cycle thermal power plant fired by natural gas or diesel oil located in the north of Chile; (ii) the 940 km Atacama Pipeline that runs between Coronel Cornejo in Argentina and Mejillones in Chile; and (iii) the 223 km Taltal Pipeline between Mejillones and Paposo.
Upon obtaining control of GasAtacama, the Group’s total generation capacity in Chile’s northern grid (theSistema Interconectado del Norte Grande, or SING) reached 1,000 MW, and it is expected to enable us to satisfy greater industrial, residential and mining demand through a competitively priced energy supply with a low environmental impact.
GasAtacama acquisition was recognized using the accounting criteria for business combinations achieved in stages as detailed in Note 2.6.1.
Since the date of acquisition, GasAtacama has contributed ThCh$113,074,006 in revenues and ThCh$33,443,547 in income before tax to the Group’s results. Had the acquisition taken place on January 1, 2014, it is estimated that these amounts would have been ThCh$179,474,707 in revenues and ThCh$41,772,291 in consolidated income before taxes for the year ended December 31, 2014.
| | a) | Consideration transferred |
The following table summarizes the fair value of each type of consideration transferred in connection with the GasAtacama acquisition:
| | | | |
| | | ThCh$ | |
Total price paid | | | 174,028,622 | |
Transaction recorded separately from the assets acquired and liabilities assumed (i) | | | (16,070,521) | |
Total consideration paid in cash | | | 157,958,101 | |
| | (i) | The total consideration transferred was ThCh$174,028,622 and included the assignment of rights to collect on an outstanding loan of ThCh$16,070,521 owed by Pacific Energy Sub Co. (a subsidiary of Southern Cross) to Atacama Finance Co. (a subsidiary of GasAtacama). |
| | b) | Acquisition-related costs |
Endesa Chile incurred costs for ThCh$23,543 in financial advisory fees related to the acquisition of Inversiones GasAtacama Holding Limitada. These costs were recognized in 2014 under Income after tax from discontinued operations line in the consolidated statements of comprehensive income.
| | |
| The accompanying notes are an integral part of these consolidated financial statements | | |
|
| F-60 |
| | c) | Identifiable assets acquired and identifiable liabilities assumed |
The following table summarizes the fair values recognized for assets acquired and liabilities assumed in connection with the acquisition:
| | | | |
| | | Fair Value | |
| Identifiable assets acquired, net | | ThCh$ | |
| | | | |
Cash and cash equivalents | | | 120,303,339 | |
Trade and other current receivables | | | 34,465,552 | |
Current accounts receivable from related companies | | | 5,692,257 | |
Inventories | | | 15,009,265 | |
Property, plant and equipment | | | 199,660,391 | |
Deferred tax assets | | | 2,392,531 | |
Other assets | | | 23,906,126 | |
Trade and other current payables | | | (30,818,836) | |
Current accounts payable to related companies | | | (34,445,277) | |
Deferred tax liabilities | | | (28,923,167) | |
Other liabilities | | | (10,874,817) | |
| | | | |
Total | | | 296,367,364 | |
No risk of default is expected for the gross amount of trade and other receivables.
Given the nature of GasAtacama’s business and assets, the fair value of the assets acquired and the liabilities assumed was measured using the following valuation approaches:
i. The market approach using the comparison method, based on quoted market prices for identical or comparable items when available.
ii. The cost approach or depreciated replacement cost, which reflects adjustments for physical deterioration and functional and economic obsolescence.
iii. The income approach, which uses valuation techniques that convert future amounts (such as cash flows or income and expenses) into a single current amount (that is, discounted). The fair value measurement reflects current market expectations for those future amounts.
Reconciliation of values
Finally, the fair values were determined from an assessment and reconciliation of the results obtained from the methods selected, based on the nature of each asset acquired and liability assumed.
| | | | |
| | | ThCh$ | |
Total consideration paid | | | 157,958,101 | |
Fair value of pre-existing interest in the acquiree | | | 157,147,000 | |
Fair value of identifiable net assets acquired | | | (296,367,364 | ) |
| | | | | |
Goodwill (See Note 16) | | | 18,737,737 | |
The goodwill is attributable primarily to the value of the synergies expected to be obtained by integrating GasAtacama into the Group. These synergies include reduced administrative, research and structure costs, which could be absorbed by Endesa Chile.
| | |
| The accompanying notes are an integral part of these consolidated financial statements | | |
|
| F-61 |
| | e) | Remeasurement of pre-existing interest and currency translation differences |
The remeasurement of the fair value of Endesa Chile’s pre-existing 50% equity interest in GasAtacama resulted in a gain of ThCh$21,546,320. The gain recognized was the positive difference between the acquisition-date fair value of the pre-existing equity interest of ThCh$157,147,000, and the carrying amount of the investment accounted for using the equity method at the acquisition date of ThCh$135,600,682.
In addition, the exchange differences on translation of the pre-existing equity interest accumulated in the equity of Endesa Chile/Enersis Américas at the acquisition date, were reclassified to profit or loss, resulting in a gain of ThCh$21,006,456.
Both amounts were recognized in year 2014, under Income after tax from discontinued operations line in the consolidated statement of comprehensive income.
As of December 31, 2015, the assets and liabilities of GasAtacama have been classified as held for distribution to owners. Likewise, the results of its operations for the years 2015, 2014 and 2013 have been classified as discontinued operations. (See Note 3.k and 5.1)
| | |
| The accompanying notes are an integral part of these consolidated financial statements | | |
|
| F-62 |
The Enersis Américas capital increase approved by the Extraordinary Shareholders’ Meeting on December 20, 2012 was completed in the first quarter of 2013; all of the allocated shares were subscribed (see Note 26.1.1).
This capital increase amounted to ThCh$2,845,858,393. Of this, 60.62% of the shares were subscribed by Endesa, S.A. (Enersis’ parent located in Spain) and were paid for with its investments in Latin America valued at ThCh$1,724,400,000. The remaining shares were subscribed and paid with non-controlling interests of Enersis Américas via cash payments of ThCh$1,121,458,393, which included an Allocated capital of ThCh$1,460,503.
Endesa’s contribution was made by transferring all of its shares in Cono Sur Participaciones, S.L., so that all of that corporation’s assets and liabilities, representing holdings in Chile, Argentina, Brazil, Colombia and Peru, were incorporated into Enersis Américas.
The following table summarizes the ownership interests contributed by Endesa, S.A.:
i) Contributions in companies that Enersis Américas controlled before the transaction:
| | | | |
| | |
Company | | | | Percentage contributed |
| | | | |
| | | | |
| | |
Empresa Distribuidora Sur S.A. | | | | 6.23% |
Enel Brasil S.A. | | | | 28.48% |
Ampla Energía y Servicos S.A. | | | | 7.70% |
Ampla Investimentos y Servicos S.A. | | | | 7.70% |
Compañía Eléctrica San Isidro S.A. | | | | 4.38% |
Emgesa S.A. E.S.P. | | | | 21.60% |
Codensa S.A. E.S.P. | | | | 26.66% |
Inversiones Distrilima S.A. | | | | 34.83% |
These contributions were recorded using the accounting criteria established in Note 2.6.6, and resulted in a charge of ThCh$947,982,284 to other miscellaneous reserves in Enersis Américas’ Net equity. This amount is the difference between the economic and accounting values of the ownership interests transferred by Endesa, S.A. on the date of the transaction.
Components of other comprehensive income have also been redistributed as needed, with an additional ThCh$41,885,724 charged to other miscellaneous reserves and credited to Reserve for exchange differences on translation. This redistribution, based on the prorated ownership interests contributed by Endesa, S.A., has assigned to the Enersis Américas shareholders their share of Reserve for differences in translation that, prior to the transaction, was assigned to non-controlling interests.
ii) Contributions in companies that Enersis Américas did not control or in which it did not hold an ownership interest prior to the transaction:
| | | | |
Company | | | | Percentage contributed
(directly and indirectly) |
| | | | |
| | | | |
| | |
Eléctrica Cabo Blanco S.A.C | | | | 100.00% |
Endesa Cemsa S.A. | | | | 55.00% |
Generalima S.A.C. | | | | 100.00% |
Empresa Eléctrica de Piura S.A. | | | | 96.50% |
Inversora Dock Sud S.A. | | | | 57.14% |
Central Dock Sud S.A. | | | | 39.99% |
Yacylec S.A. | | | | 22.22% |
These contributions were recorded using the accounting criteria established in Note 2.6.6 and resulted in a ThCh$92,011,899 credit to other miscellaneous reserves in Enersis Américas’ Net equity. The amount is the difference between the economic and accounting values of the ownership interests transferred by Endesa, S.A. on the date of the transaction.
| | |
| The accompanying notes are an integral part of these consolidated financial statements | | |
|
| F-63 |
The following table summarizes the effects of the capital increase on the Enersis Américas’ Consolidated Statement of Financial Position on the date of the transaction:
| | | | | | | | | | | | | | | | |
| | | Cash Contribution | | | Contribution in
companies
previously
controlled | | | Contribution in companies not
previously controlled or in which a stake was not
held | | | Total as of March 31, 2013 | |
ASSETS | | | ThCh$ | | | | ThCh$ | | | | ThCh$ | | | | ThCh$ | |
Current assets | | | 1,121,458,393 | | | | - | | | | 189,506,588 | | | | 1,310,964,981 | |
Non-current assets | | | - | | | | - | | | | 161,105,666 | | | | 161,105,666 | |
| | | | | | | | | | | | | | | | |
TOTAL ASSETS | | | 1,121,458,393 | | | | - | | | | 350,612,254 | | | | 1,472,070,647 | |
| | | | |
LIABILITIES | | | | | | | | | | | | | | | | |
Current liabilities | | | - | | | | - | | | | 180,637,894 | | | | 180,637,894 | |
Non-current liabilities | | | - | | | | - | | | | 54,241,781 | | | | 54,241,781 | |
| | | | | | | | | | | | | | | | |
TOTAL LIABILITIES | | | - | | | | - | | | | 234,879,675 | | | | 234,879,675 | |
| | | | |
EQUITY | | | | | | | | | | | | | | | | |
Capital increase | | | 1,119,997,890 | | | | 1,692,613,860 | | | | 31,786,140 | | | | 2,844,397,890 | |
Share premium for capital increase (other Reserves) | | | 1,460,503 | | | | - | | | | - | | | | 1,460,503 | |
Other miscellaneous reserves | | | - | | | | (989,868,008 | ) | | | 92,011,899 | | | | (897,856,109 | ) |
Foreign currency translation differences | | | - | | | | 41,885,724 | | | | - | | | | 41,885,724 | |
| | | | | | | | | | | | | | | | | |
Equity attributable to shareholders of Enersis Américas | | | 1,121,458,393 | | | | 744,631,576 | | | | 123,798,039 | | | | 1,989,888,008 | |
| | | | | | | | | | | | | | | | | |
Non-controlling interests | | | - | | | | (744,631,576 | ) | | | (8,065,460 | ) | | | (752,697,036 | ) |
| | | | | | | | | | | | | | | | | |
TOTAL EQUITY | | | 1,121,458,393 | | | | - | | | | 115,732,579 | | | | 1,237,190,972 | |
| | | | | | | | | | | | | | | | | |
TOTAL LIABILITIES AND EQUITY | | | 1,121,458,393 | | | | - | | | | 350,612,254 | | | | 1,472,070,647 | |
| | | | | | | | | | | | | | | | |
Share issuance costs as of December 31, 2013, amounted to ThCh$23,592,387 and, as indicated in Note 3.t), were recorded in “Other miscellaneous reserves” (see Note 26.5.c.2).
During the 2013 fiscal year the amount of net income attributable to shareholders of Enersis Américas from the ownership interest acquired was ThCh$126,280,714.
| | |
| The accompanying notes are an integral part of these consolidated financial statements | | |
|
| F-64 |
| | 8. | CASH AND CASH EQUIVALENTS. |
| | a) | The detail of cash and cash equivalents as of December 31, 2015 and 2014, is as follows: |
| | | | | | | | |
| Cash and Cash Equivalents | | Balance as of | |
| | 12-31-2015 | | | 12-31-2014 | |
| | | ThCh$ | | | ThCh$ | |
| | | | | | | | |
Cash balances | | | 7,718,308 | | | | 1,264,361 | |
Bank balances | | | 194,453,214 | | | | 283,305,826 | |
Time deposits | | | 573,985,007 | | | | 922,909,741 | |
Other fixed-income instruments | | | 409,006,815 | | | | 497,265,563 | |
| | | | | | | | |
Total | | | 1,185,163,344 | | | | 1,704,745,491 | |
Time deposits have a maturity of three months or less from their date of acquisition and accrue the market interest for this type of short-term investment. Other fixed-income investments are mainly comprised of resale agreements maturing in 90 days or less from the date of investment. There are no restrictions for significant amounts of cash availability.
| | b) | The detail of cash and cash equivalents by currency is as follows: |
| | | | | | | | |
| Currency | | 12-31-2015 | | | 12-31-2014 | |
| | ThCh$ | | | ThCh$ | |
Chilean peso | | | 835,468,993 | | | | 687,912,363 | |
Argentine peso | | | 44,883,600 | | | | 29,065,256 | |
Colombian peso | | | 156,731,922 | | | | 357,337,537 | |
Brazilian real | | | 91,204,686 | | | | 197,723,752 | |
Peruvian nuevo sol | | | 34,749,661 | | | | 105,282,911 | |
U.S. dollar | | | 22,124,482 | | | | 327,423,672 | |
Total | | | 1,185,163,344 | | | | 1,704,745,491 | |
| | c) | The following table shows the amounts paid to obtain control of subsidiaries as of December 31, 2015 and 2014: |
| | | | | | | | |
| Acquisition of Subsidiaries | | 12-31-2015 | | | 12-31-2014 | |
| | ThCh$ | | | ThCh$ | |
Acquisitions paid in cash and cash equivalents | | | - | | | | (157,958,101 | ) |
Cash and cash equivalents in entities acquired | | | - | | | | 120,303,339 | |
Total, net (*) | | | - | | | | (37,654,762 | ) |
| | d) | The following table shows a reconciliation of cash and cash equivalents presented in the statement of financial position with cash and cash equivalents in the cash flow statement as of December 31, 2015 and 2014: |
| | | | | | | | |
| | | Balance as of | |
| | 12-31-2015 | | | 12-31-2014 | |
| | | ThCh$ | | | ThCh$ | |
Cash and cash equivalents (statement of financial position) | | | 1,185,163,344 | | | | 1,704,745,491 | |
Cash and cash equivalents attributable to assets held for sale (*) | | | - | | | | 29,702 | |
Cash and cash equivalents attributable to assets held for distribution to owners (*) | | | 144,261,845 | | | | - | |
Cash and cash equivalents (statement of cash flows) | | | 1,329,425,189 | | | | 1,704,775,193 | |
| | (*) | See Note 5.1.d) and 5.2. |
| | |
| The accompanying notes are an integral part of these consolidated financial statements | | |
|
| F-65 |
| | e) | The following amounts have been received from the sale of shares in subsidiaries: |
| | | | | | | | |
| Loss of control at Subsidiaries | | 12-31-2015 | | | 12-31-2014 | |
| | ThCh$ | | | ThCh$ | |
Amounts received for the sale of subsidiaries(*) | | | 25,000,000 | | | | 57,173,142 | |
Amounts in cash and cash equivalents in entities sold | | | (18,360,347 | ) | | | (16,311,571 | ) |
Total net | | | 6,639,653 | | | | 40,861,571 | |
(*) See Note 2.4.1 and 5.1 iv).
| | 9. | OTHER FINANCIAL ASSETS. |
The detail of other financial assets as of December 31, 2015 and 2014, is as follows:
| | | | | | | | | | | | | | | | |
| Other Financial Assets | | Balance as of | |
| | Current | | | Non-current | |
| | 12-31-2015 | | | 12-31-2014 | | | 12-31-2015 | | | 12-31-2014 | |
| | ThCh$ | | | ThCh$ | | | ThCh$ | | | ThCh$ | |
| | | | | | | | | | | | | | | | |
Available-for-sale financial investments - unquoted equity securities or with limited liquidity | | | - | | | | - | | | | 616,296 | | | | 4,275,183 | |
Available-for-sale financial investments - quoted equity securities | | | - | | | | - | | | | - | | | | 31,044 | |
Available-for-sale financial investments IFRIC 12 (*)(**) | | | - | | | | - | | | | 487,893,679 | | | | 492,923,605 | |
Financial assets held to maturity (*) | | | 27,195,496 | | | | 38,301,763 | | | | 39,673 | | | | 26,340,396 | |
Hedging derivatives (*) | | | 1,172,125 | | | | 1,414,588 | | | | 978,556 | | | | 7,229,290 | |
Financial assets at fair value through profit or loss (*) | | | 35,467,539 | | | | 52,677,337 | | | | - | | | | - | |
Non-hedging derivatives (*) | | | 4,427,286 | | | | 7,061,715 | | | | - | | | | 22,002 | |
| | | | | | | | | | | | | | | | |
Total | | | 68,262,446 | | | | 99,455,403 | | | | 489,528,204 | | | | 530,821,520 | |
(*) See Note 22.1.a
The amounts included in “financial assets held to maturity” and “financial assets at fair value through profit or loss” correspond mainly to time deposits and other highly liquid investments that are readily convertible to cash and subject to a low risk of changes in value, but that do not fulfill the definition of cash equivalent as defined in Note 3.g.2 (e.g. with maturity over 90 days from time of investment).
(**) On September 11, 2012, the Brazilian government issued Temporary Law 579, which became permanent on January 13, 2013 and directly affects companies holding electric power generation, transmission, and distribution concessions, including Ampla and Coelce. Among its provisions, this legislation establishes that the government, as concession grantor, will use theValor Nuevo de Reemplazo (VNR, New Replacement Value) to make the corresponding indemnity payments to the concessionaires for those assets that have not been amortized at the end of the concession period. Every month the distributors adjust the book value of the financial asset, by calculating the present value of estimated cash flows, using the effective interest rate on the corresponding payment at the end of the concession.
As a result of this new development, the subsidiaries have changed how they measure and classify the amounts they expect to recover in compensation when the concession period ends. The previous approach was based on the historic cost of the investments, and the rights to compensation were recorded as an account receivable. Currently, they are measured on the basis of the VNR, and the compensation rights are classified as financial assets available for sale (see Note 3.g).
| | |
| The accompanying notes are an integral part of these consolidated financial statements | | |
|
| F-66 |
| | 10. | TRADE AND OTHER RECEIVABLES. |
a) The detail of trade and other receivables as of December 31, 2015 and 2014, is as follows:
| | | | | | | | | | | | | | | | |
| Trade and Other Receivables, Gross | | Balance as of | |
| | 12-31-2015 | | | 12-31-2014 | |
| | Current
ThCh$ | | | Non-current
ThCh$ | | | Current
ThCh$ | | | Non-current
ThCh$ | |
| | | | | | | | | | | | | | | | |
Trade and other receivables, gross | | | 1,389,215,812 | | | | 398,695,864 | | | | 1,844,027,889 | | | | 291,641,675 | |
Trade receivables, gross | | | 1,054,529,912 | | | | 257,022,423 | | | | 1,275,999,654 | | | | 202,932,480 | |
Other receivables, gross (1) | | | 334,685,900 | | | | 141,673,441 | | | | 568,028,235 | | | | 88,709,195 | |
| | | | |
| | | | | | | | | | | | | | | | |
| Trade and Other Receivables, Net | | Balance as of | |
| | 12-31-2015 | | | 12-31-2014 | |
| | Current
ThCh$ | | | Non-current
ThCh$ | | | Current
ThCh$ | | | Non-current
ThCh$ | |
| | | | | | | | | | | | | | | | |
Trade and other receivables, net | | | 1,088,131,567 | | | | 398,695,864 | | | | 1,681,686,903 | | | | 291,641,675 | |
Trade and other receivables, net | | | 754,571,268 | | | | 257,022,423 | | | | 1,120,897,826 | | | | 202,932,480 | |
Other receivables, net (1) | | | 333,560,299 | | | | 141,673,441 | | | | 560,789,077 | | | | 88,709,195 | |
(1) Includes as of December 31, 2015, mainly accounts receivable related to loans and advances to employees for ThCh$14,081,204 (ThCh$31,042,105 as of December 31, 2014); Resolution 250/13 (applicable in Argentina) on the Cost Monitoring Mechanism (MMC) adjustment for ThCh$0 (ThCh$253,484,218 as of December 31, 2014); Resolution SE 32/2015 (applicable in Argentina) for ThCh$28,174,339 (ThCh$0 as of December 31, 2014)(See Note 4.2); Recoverable taxes (VAT) of ThCh$80,412,497 (ThCh$157,439,993 as of December 31, 2014); and Accounts receivable at our Brazilian subsidiaries Ampla and Coelce, following the signing of the addendum to the concession contracts where the outstanding assets are recoverable and/or can be offset in subsequent tariff periods for ThCh$150,798,761 (ThCh$150,387,462 as of December 31, 2014), which are guaranteed by the Brazilian government.
There are no significant trade and other receivables balances held by the Group that are not available for its use.
The Group does not have customers to which it has sales representing 10% or more of its operating income for the years ended December 31, 2015, 2014 and 2013.
Refer to Note 11.1 for detailed information on amounts, terms and conditions associated with accounts receivable from related companies.
b) As of December 31, 2015 and 2014, the balance of past due but not impaired trade receivables is as follows:
| | | | | | |
| Trade Receivables Past Due But Not Impaired | | Balance as of |
| | 12-31-2015 | | | 12-31-2014 |
| | ThCh$ | | | ThCh$ |
Less than three months | | | 117,895,535 | | | 152,844,247 |
Between three and six months | | | 25,783,187 | | | 14,297,179 |
Between six and twelve months | | | 28,220,570 | | | 63,606,398 |
More than twelve months | | | 7,034,592 | | | 51,972,887 |
Total | | | 178,933,884 | | | 282,720,711 |
| | |
| The accompanying notes are an integral part of these consolidated financial statements | | |
|
| F-67 |
c) The reconciliation of changes in the allowance for impairment of trade receivables is as follows:
| | | | |
| Trade Receivables Past Due and Impaired | | Current and Non-current ThCh$ | |
Balance as of January 1, 2013 | | | 157,841,770 | |
Increases (decreases) for the year (*) | | | 33,554,637 | |
Amounts written off | | | (18,827,998 | ) |
Foreign currency translation differences | | | (15,700,141 | ) |
Balance as of Decemer 31, 2013 | | | 156,868,268 | |
Increases (decreases) for the year (*) | | | 22,848,140 | |
Amounts written off | | | (19,013,041 | ) |
Foreign currency translation differences | | | 1,637,619 | |
Balance as of December 31, 2014 | | | 162,340,986 | |
Increases (decreases) for the year (*) | | | 46,890,017 | |
Amounts written off | | | 23,480,578 | |
Foreign currency translation differences | | | (43,623,000 | ) |
Other | | | 147,873,154 | |
Transfer to assets held for distribution to owners | | | (35,877,490 | ) |
Balance as of December 31, 2015 | | | 301,084,245 | |
(*) See Note 30 for impairment losses of financial assets. | | | | |
The increase in the allowance for impairment of trade receivables, related to continuing operations of Enersis Américas, was ThCh$39,779,710 during the year 2015.
Write-offs for bad debt
Past-due debt is written off once all collection measures and legal proceedings have been exhausted and the debtors’ insolvency has been demonstrated. In our power generation business, this process normally takes at least one year of procedures for the few cases that arise in each country. In our distribution business, considering the differences in each country, the process takes at least six months in Argentina and Brazil, 12 months in Colombia and Peru, and 24 months in Chile. Overall, the risk of bad debt, and therefore the risk of writing off our trade receivables, is limited (see Notes 3.g.3 and 21.5).
d) Additional information:
| | - | Additional statistical information required under Official Bulletin 715 of theSuperintendencia de Valores y Seguros de Chile (Chilean Superintendency of Securities and Insurance), of February 3, 2012 (XBRL Taxonomy). See Appendix 7. |
| | - | Supplementary information on Trade Receivables, see Appendix 7.1. |
| | |
| The accompanying notes are an integral part of these consolidated financial statements | | |
|
| F-68 |
| | 11. | BALANCES AND TRANSACTIONS WITH RELATED PARTIES |
Related party transactions are performed at current market conditions.
Transactions between the Company and its subsidiaries and joint ventures have been eliminated on consolidation and are not itemized in this note.
As of the date of these financial statements, no guarantees have been given or received nor has any allowance for bad or doubtful accounts been recorded with respect to receivable balances for related party transactions.
The controlling shareholder of Enersis Américas is the Italian corporation Enel S.p.A.
11.1 Balances and transactions with related parties
The balances of accounts receivable and payable between the Company and its non-consolidated related companies are as follows:
| | a) | Receivables from related companies |
| | | | | | | | | | | | | | | | | | | | | | | | | | | | |
| | | | | | | | | | | | | | | Balance as of | |
| | | | | | | | | | | | | | | Current | | | Non-current | |
Taxpayer ID No. (RUT) | | Company | | Country | | Relationship | | Currency | | Description of Transaction | | Term of
Transaction | | 12-31-2015
ThCh$ | | | 12-31-2014
ThCh$ | | | 12-31-2015
ThCh$ | | | 12-31-2014
ThCh$ | |
| | | | | | | | | | | | | | | | | | | | | | | | | | | | |
Foreign | | Enel Latinoamérica S.A | | Spain | | Common Immediate Parent | | CH$ | | Other services | | Less than 90 days | | | - | | | | 108,438 | | | | - | | | | - | |
Foreign | | Enel Latinoamérica S.A | | Spain | | Common Immediate Parent | | Ar$ | | Dividends | | Less than 90 days | | | - | | | | 15,713 | | | | - | | | | - | |
Foreign | | Endesa, S.A. | | Spain | | Common Immediate Parent | | CH$ | | Other services | | More than 90 days | | | 13,077 | | | | 61,852 | | | | - | | | | - | |
Foreign | | Endesa, S.A. | | Spain | | Common Immediate Parent | | CP | | Other services | | More than 90 days | | | 28,628 | | | | - | | | | - | | | | - | |
Foreign | | Endesa, S.A. | | Spain | | Common Immediate Parent | | Euros | | Other services | | More than 90 days | | | 5,833 | | | | - | | | | - | | | | - | |
96.524.140-K | | Empresa Eléctrica Panguipulli S.A.(*) | | Chile | | Common Immediate Parent | | CH$ | | Energy sales | | Less than 90 days | | | - | | | | 273,705 | | | | - | | | | - | |
96.880.800-1 | | Empresa Eléctrica Puyehue S.A. (*) | | Chile | | Common Immediate Parent | | CH$ | | Energy sales | | Less than 90 days | | | - | | | | 64 | | | | - | | | | - | |
Foreign | | Endesa Energía S.A. | | Spain | | Common Immediate Parent | | CP | | Other services | | Less than 90 days | | | 30,373 | | | | 26,514 | | | | - | | | | - | |
Foreign | | Endesa Operaciones y Servicios Comerciales | | Spain | | Common Immediate Parent | | CP | | Other services | | Less than 90 days | | | 114,758 | | | | 78,172 | | | | - | | | | - | |
Foreign | | SACME | | Argentina | | Associate | | Ar$ | | Other services | | Less than 90 days | | | 42,003 | | | | 47,811 | | | | 355,485 | | | | 486,605 | |
Foreign | | Enel Iberoamérica S.R.L | | Spain | | Parent | | CH$ | | Other services | | Less than 90 days | | | - | | | | 846,807 | | | | - | | | | - | |
Foreign | | Enel Iberoamérica S.R.L. | | Spain | | Parent | | CP | | Other services | | Less than 90 days | | | 3,276 | | | | - | | | | - | | | | - | |
Foreign | | Enel Iberoamérica S.R.L. | | Spain | | Parent | | Euros | | Other services | | Less than 90 days | | | 931,267 | | | | - | | | | - | | | | - | |
96.806.130-5 | | Electrogas S.A.(*) | | Chile | | Associate | | CH$ | | Dividends | | Less than 90 days | | | - | | | | 1,477,177 | | | | - | | | | - | |
76.788.080-4 | | GNL Quintero S.A. (*) | | Chile | | Associate | | CH$ | | Energy sales | | Less than 90 days | | | - | | | | 649,986 | | | | - | | | | - | |
76.418.940-k | | GNL Chile S.A. (*) | | Chile | | Associate | | US$ | | Advance natural gas purchases | | Less than 90 days | | | - | | | | 11,845,926 | | | | - | | | | - | |
76.418.940-k | | GNL Chile S.A. (*) | | Chile | | Associate | | US$ | | Other services | | Less than 90 days | | | - | | | | 1,644,650 | | | | - | | | | - | |
76.418.940-k | | GNL Chile S.A. (*) | | Chile | | Associate | | US$ | | Loans | | Less than 90 days | | | - | | | | 549,359 | | | | - | | | | - | |
Foreign | | Empresa de Energía de Cundinamarca S.A. | | Colombia | | Joint Venture | | CP | | Energy sales | | Less than 90 days | | | 553,472 | | | | 513,804 | | | | - | | | | - | |
Foreign | | Empresa de Energía de Cundinamarca S.A. | | Colombia | | Joint Venture | | CP | | Other services | | Less than 90 days | | | 216,682 | | | | 130,431 | | | | - | | | | - | |
Foreign | | Endesa Generación | | Spain | | Common Immediate Parent | | CH$ | | Other services | | Less than 90 days | | | 36,067 | | | | 36,067 | | | | - | | | | - | |
Foreign | | Endesa Generación | | Spain | | Common Immediate Parent | | CH$ | | Commodity derivatives | | Less than 90 days | | | - | | | | 99,662 | | | | - | | | | - | |
Foreign | | Enel Ingegneria e Ricerca | | Italy | | Common Immediate Parent | | CH$ | | Other services | | Less than 90 days | | | - | | | | 10,299 | | | | - | | | | - | |
Foreign | | Enel Trade S.p.A. | | Italy | | Common Immediate Parent | | CH$ | | Other services | | Less than 90 days | | | - | | | | 3,256 | | | | - | | | | - | |
76.126.507-5 | | Parque Eolico Talinay Oriente SA(*) | | Chile | | Common Immediate Parent | | CH$ | | Energy sales | | Less than 90 days | | | - | | | | 21,647 | | | | - | | | | - | |
Foreign | | Enel S.p.A. | | Italy | | Parent | | CH$ | | Other services | | Less than 90 days | | | 99,972 | | | | - | | | | - | | | | - | |
Foreign | | Enel S.p.A. | | Italy | | Parent | | Euros | | Other services | | Less than 90 days | | | 145,858 | | | | - | | | | - | | | | - | |
Foreign | | Enel S.p.A. | | Italy | | Parent | | CP | | Other services | | Less than 90 days | | | 116,940 | | | | - | | | | - | | | | - | |
Foreign | | Enel Green Power Cristal Eolica | | Brazil | | Common Immediate Parent | | Real | | Tolls | | Less than 90 days | | | 343 | | | | - | | | | - | | | | - | |
Foreign | | Enel Green Power Emiliana Eolica Sa | | Brazil | | Common Immediate Parent | | Real | | Tolls | | Less than 90 days | | | 460 | | | | - | | | | - | | | | - | |
Foreign | | Enel Green Power Joana Eolica Sa | | Brazil | | Common Immediate Parent | | Real | | Tolls | | Less than 90 days | | | 460 | | | | - | | | | - | | | | - | |
Foreign | | Enel Green Power Modelo I Eolica SA | | Brazil | | Common Immediate Parent | | Real | | Tolls | | Less than 90 days | | | 538 | | | | - | | | | - | | | | - | |
Foreign | | Enel Green Power Modelo II Eolica SA | | Brazil | | Common Immediate Parent | | Real | | Tolls | | Less than 90 days | | | 469 | | | | - | | | | - | | | | - | |
Foreign | | Enel Green Power Primavera Eolica | | Brazil | | Common Immediate Parent | | Real | | Tolls | | Less than 90 days | | | 344 | | | | - | | | | - | | | | - | |
Foreign | | Enel Green Power SAO Judas Eolica | | Brazil | | Common Immediate Parent | | Real | | Tolls | | Less than 90 days | | | 341 | | | | - | | | | - | | | | - | |
Foreign | | Enel Green Power Tacaicó Eólica Sa | | Brazil | | Common Immediate Parent | | Real | | Tolls | | Less than 90 days | | | 263 | | | | - | | | | - | | | | - | |
Foreign | | Enel Green Power Pedra Do Gerônimo Eólic | | Brazil | | Common Immediate Parent | | Real | | Tolls | | Less than 90 days | | | 429 | | | | - | | | | - | | | | - | |
Foreign | | Enel Green Power Pau Ferro Eólica Sa | | Brazil | | Common Immediate Parent | | Real | | Tolls | | Less than 90 days | | | 429 | | | | - | | | | - | | | | - | |
Foreign | | Energía Nueva Energía Limpia Mexico S.R.L | | Mexico | | Common Immediate Parent | | CH$ | | Other services | | Less than 90 days | | | 15,306 | | | | - | | | | - | | | | - | |
Foreign | | Enel Green Power Colombia | | Colombia | | Common Immediate Parent | | CP | | Other services | | Less than 90 days | | | 978,185 | | | | - | | | | - | | | | - | |
Foreign | | Enel Green Power Participaçôes Ltda. | | Brazil | | Common Immediate Parent | | US$ | | Other services | | Less than 90 days | | | 21,454 | | | | - | | | | - | | | | - | |
Foreign | | Enel Soluçôes Energeticas | | Brazil | | Common Immediate Parent | | Real | | Other services | | Less than 90 days | | | 54 | | | | - | | | | - | | | | - | |
Foreign | | Enel Green Power Mani��oba | | Brazil | | Common Immediate Parent | | Real | | Other services | | Less than 90 days | | | 626 | | | | - | | | | - | | | | - | |
Foreign | | Enel Green Power Esperanca | | Brazil | | Common Immediate Parent | | Real | | Other services | | Less than 90 days | | | 585 | | | | - | | | | - | | | | - | |
Foreign | | Enel Green Power Damascena | | Brazil | | Common Immediate Parent | | Real | | Other services | | Less than 90 days | | | 624 | | | | - | | | | - | | | | - | |
Foreign | | Enel Italia Servizi SRL | | Italy | | Common Immediate Parent | | CP | | Other services | | Less than 90 days | | | 207,814 | | | | - | | | | - | | | | - | |
| | | | | | | | | | | | | | | | | | | | | | | | | | | | |
| | | | Total | | | 3,566,930 | | | | 18,441,340 | | | | 355,485 | | | | 486,605 | |
| | (*) | As of December 31, 2015, the receivable balances have been classified in the statement of financial position as non-current assets or disposal groups held for sale or held for distribution to owners. |
| | |
| The accompanying notes are an integral part of these consolidated financial statements | | |
|
| F-69 |
| | b) | Accounts payable to related companies |
| | | | | | | | | | | | | | | | | | | | | | | | | | | | |
| | | | | | | | | | | | | | | Balance as of | |
| | | | | | | | | | | | | | | Current | | | Non-current | |
Taxpayer ID
No. (RUT) | | Company | | Country | | Relationship | | Currency | | Description of Transaction | | Term of Transaction | | 12-31-2015
ThCh$ | | | 12-31-2014 ThCh$ | | | 12-31-2015 ThCh$ | | | 12-31-2014 ThCh$ | |
| | | | | | | | | | |
| | | | | | | | | | | | | | | | | | | | | | | | | | | | |
Foreign | | Enel Latinoamérica S.A | | Spain | | Common Immediate Parent | | Ar$ | | Dividends | | Less than 90 days | | | 59,416 | | | | 77,779 | | | | - | | | | - | |
Foreign | | Enel Latinoamérica S.A | | Spain | | Common Immediate Parent | | CH$ | | Dividends | | Less than 90 days | | | 58,897,984 | | | | 73,806,006 | | | | - | | | | - | |
Foreign | | Enel Latinoamérica S.A. | | Spain | | Common Immediate Parent | | CP | | Other services | | Less than 90 days | | | 40,920 | | | | - | | | | - | | | | - | |
96.524.140-K | | Empresa Electrica Panguipulli S.A. (*) | | Chile | | Common Immediate Parent | | CH$ | | Energy purchases | | Less than 90 days | | | - | | | | 1,708,804 | | | | - | | | | - | |
Foreign | | SACME | | Argentina | | Associate | | Ar$ | | Other services | | Less than 90 days | | | 161,015 | | | | 163,661 | | | | - | | | | - | |
96.806.130-5 | | Electrogas S.A.(*) | | Chile | | Associate | | CH$ | | Other services | | Less than 90 days | | | - | | | | 335,962 | | | | - | | | | - | |
76.418.940-k | | GNL Chile S.A. (*) | | Chile | | Associate | | US$ | | Natural gas purchases | | Less than 90 days | | | - | | | | 19,808,375 | | | | - | | | | - | |
Foreign | | Endesa Generación | | Spain | | Common Immediate Parent | | CH$ | | Fuel purchases | | Less than 90 days | | | - | | | | 2,881,032 | | | | - | | | | - | |
Foreign | | Endesa Generación | | Spain | | Common Immediate Parent | | CH$ | | Other services | | Less than 90 days | | | 28,617 | | | | - | | | | - | | | | - | |
Foreign | | Endesa Generación | | Spain | | Common Immediate Parent | | CH$ | | Commodity derivatives | | Less than 90 days | | | - | | | | 1,102,253 | | | | - | | | | - | |
Foreign | | Enel Iberoamérica SRL | | Spain | | Parent | | CH$ | | Dividends | | Less than 90 days | | | 29,658,243 | | | | 37,165,229 | | | | - | | | | - | |
Foreign | | Enel Iberoamérica SRL | | Spain | | Parent | | CP | | Other services | | Less than 90 days | | | 302,025 | | | | 25,746 | | | | - | | | | - | |
Foreign | | Enel Iberoamérica SRL | | Spain | | Parent | | CH$ | | Other services | | Less than 90 days | | | - | | | | 296,242 | | | | - | | | | - | |
Foreign | | Enel Iberoamérica SRL | | Spain | | Parent | | Euros | | Other services | | Less than 90 days | | | 414,397 | | | | 305,654 | | | | - | | | | - | |
Foreign | | Enel Iberoamérica SRL | | Spain | | Parent | | Real | | Other services | | Less than 90 days | | | 384,082 | | | | 41,136 | | | | - | | | | - | |
Foreign | | Enel Iberoamérica SRL | | Spain | | Parent | | Sol | | Other services | | Less than 90 days | | | - | | | | 9,900 | | | | - | | | | - | |
Foreign | | Enel Iberoamérica SRL | | Spain | | Parent | | Ar$ | | Other services | | Less than 90 days | | | 173,687 | | | | 68,371 | | | | - | | | | - | |
Foreign | | Enel Iberoamérica SRL | | Spain | | Parent | | US$ | | Other services | | Less than 90 days | | | - | | | | 767,673 | | | | - | | | | - | |
Foreign | | Enel Distribuzione | | Italy | | Common Immediate Parent | | CH$ | | Other services | | Less than 90 days | | | - | | | | 73,730 | | | | - | | | | - | |
Foreign | | Enel Distribuzione | | Italy | | Common Immediate Parent | | CP | | Other services | | Less than 90 days | | | 194,151 | | | | 415,824 | | | | - | | | | - | |
Foreign | | Enel Produzione | | Italy | | Common Immediate Parent | | CH$ | | Other services | | Less than 90 days | | | - | | | | 99,837 | | | | - | | | | - | |
Foreign | | Enel Produzione | | Italy | | Common Immediate Parent | | CP | | Other services | | Less than 90 days | | | 184,373 | | | | - | | | | - | | | | - | |
Foreign | | Enel Ingegneria e Ricerca | | Italy | | Common Immediate Parent | | CH$ | | Other services | | Less than 90 days | | | 1,513,001 | | | | 2,024,190 | | | | - | | | | - | |
Foreign | | Enel Ingegneria e Ricerca | | Italy | | Common Immediate Parent | | CP | | Other services | | Less than 90 days | | | 192,920 | | | | 243,076 | | | | - | | | | - | |
Foreign | | Enel Ingegneria e Ricerca | | Italy | | Common Immediate Parent | | Real | | Other services | | Less than 90 days | | | - | | | | 553,346 | | | | - | | | | - | |
77.017.930-0 | | Transmisora Eléctrica de Quillota Ltda. (*) | | Chile | | Joint Venture | | CH$ | | Other services | | Less than 90 days | | | - | | | | 157,762 | | | | - | | | | - | |
Foreign | | Empresa de Energía de Cundinamarca S.A. | | Colombia | | Joint Venture | | CP | | Energy purchases | | Less than 90 days | | | 1,121,851 | | | | 1,029,940 | | | | - | | | | - | |
Foreign | | Enel Green Power Spain SL | | Spain | | Common Immediate Parent | | CH$ | | Other services | | Less than 90 days | | | - | | | | 23,982 | | | | - | | | | - | |
Foreign | | Endesa, S.A. | | Spain | | Common Immediate Parent | | CH$ | | Other services | | Less than 90 days | | | - | | | | 129,492 | | | | - | | | | - | |
Foreign | | Endesa, S.A. | | Spain | | Common Immediate Parent | | Euros | | Other services | | Less than 90 days | | | 74,089 | | | | - | | | | - | | | | - | |
Foreign | | Parque Eolico Cristal | | Brazil | | Common Immediate Parent | | CH$ | | Energy purchases | | Less than 90 days | | | - | | | | 365,620 | | | | - | | | | - | |
Foreign | | Enel S.p.A. | | Italy | | Parent | | Real | | Other services | | Less than 90 days | | | 12,027,207 | | | | - | | | | - | | | | - | |
Foreign | | Enel S.p.A. | | Italy | | Parent | | Euros | | Other services | | Less than 90 days | | | 2,841,305 | | | | - | | | | - | | | | - | |
Foreign | | Enel S.p.A. | | Italy | | Parent | | Euros | | Other services | | Less than 90 days | | | 9,039 | | | | - | | | | - | | | | - | |
Foreign | | Enel S.p.A. | | Italy | | Parent | | CP | | Other services | | Less than 90 days | | | 59,242 | | | | - | | | | - | | | | - | |
Foreign | | Enel Green Power Emiliana Eolica Sa | | Brazil | | Common Immediate Parent | | Real | | Energy purchases | | Less than 90 days | | | 152,859 | | | | - | | | | - | | | | - | |
Foreign | | Enel Green Power Joana Eolica Sa | | Brazil | | Common Immediate Parent | | Real | | Energy purchases | | Less than 90 days | | | 110,781 | | | | - | | | | - | | | | - | |
Foreign | | Enel Green Power Modelo I Eolica SA | | Brazil | | Common Immediate Parent | | Real | | Energy purchases | | Less than 90 days | | | 234,876 | | | | - | | | | - | | | | - | |
Foreign | | Enel Green Power Modelo II Eolica SA | | Brazil | | Common Immediate Parent | | Real | | Energy purchases | | Less than 90 days | | | 157,329 | | | | - | | | | - | | | | - | |
Foreign | | Enel Green Power Tacaicó | | Brazil | | Common Immediate Parent | | Real | | Energy purchases | | Less than 90 days | | | 72,411 | | | | - | | | | - | | | | - | |
Foreign | | Enel Green Power Pedra Do Gerônimo Eólic | | Brazil | | Common Immediate Parent | | Real | | Energy purchases | | Less than 90 days | | | 183,859 | | | | - | | | | - | | | | - | |
Foreign | | Enel Green Power Pau Ferro Eólica Sa | | Brazil | | Common Immediate Parent | | Real | | Energy purchases | | Less than 90 days | | | 195,699 | | | | - | | | | - | | | | - | |
Foreign | | Enel Italia Servizi SRL | | Italy | | Common Immediate Parent | | CH$ | | Other services | | Less than 90 days | | | - | | | | - | | | | - | | | | - | |
Foreign | | Enel Italia Servizi SRL | | Italy | | Common Immediate Parent | | Euros | | Other services | | Less than 90 days | | | 82,220 | | | | - | | | | - | | | | - | |
Foreign | | Enel Green Power Desenvolvimiento Ltda | | Brazil | | Common Immediate Parent | | Real | | Other services | | Less than 90 days | | | 286,224 | | | | - | | | | - | | | | - | |
Foreign | | Enel Green Power Brasil | | Brazil | | Common Immediate Parent | | Real | | Other services | | Less than 90 days | | | 19,140 | | | | - | | | | - | | | | - | |
Foreign | | Enel Green Power Italia | | Italy | | Common Immediate Parent | | CP | | Other services | | Less than 90 days | | | 64,546 | | | | - | | | | - | | | | - | |
| | | | | | | | | | |
| | | | | | | | | | | | | | | | | | | | | | | | | | | | |
| | | | Total | | | 109,897,508 | | | | 143,680,622 | | | | - | | | | - | |
| | (*) | As of December 31, 2015, the payable balances have been classified in the statement of financial position as non-current assets or disposal groups held for sale or held for distribution to owners. |
| | |
| The accompanying notes are an integral part of these consolidated financial statements | | |
|
| F-70 |
| | c) | Significant transactions and effects on income/expenses: |
Transactions with related companies that are not consolidated and their effects on profit or loss are as follows:
| | | | | | | | | | | | | | | | | | | | |
Taxpayer ID No. (RUT) | | Company | | Country | | Relationship | | Description of Transaction | | 12-31-2015 Total ThCh$ | | | 12-31-2014 Total ThCh$ | | | 12-31-2013 Total ThCh$ | |
| | |
Foreign | | Endesa Energía S.A. | | Spain | | Common Immediate Parent | | Other operating income | | | 275,290 | | | | 55,980 | | | | 99,654 | |
Foreign | | Endesa Energía S.A. | | Spain | | Common Immediate Parent | | Natural gas sales | | | 14,604,841 | | | | - | | | | 21,397,171 | |
Foreign | | Enel Latinoamérica S.A | | Spain | | Common Immediate Parent | | Interest on financial debt | | | - | | | | - | | | | (1,654,945 | ) |
Foreign | | Enel Latinoamérica S.A | | Spain | | Common Immediate Parent | | Other fixed operating expenses | | | (107,759 | ) | | | (35,921 | ) | | | (314,422 | ) |
Foreign | | Endesa Generación | | Spain | | Common Immediate Parent | | Fuel consumption | | | (15,030,911 | ) | | | (30,318,202 | ) | | | (47,540,061 | ) |
Foreign | | Endesa Generación | | Spain | | Common Immediate Parent | | Other fixed operating expenses | | | (120,896 | ) | | | - | | | | - | |
Foreign | | Endesa Generación | | Spain | | Common Immediate Parent | | Other operating income | | | - | | | | 17,157 | | | | - | |
Foreign | | Endesa Generación | | Spain | | Common Immediate Parent | | Commodity derivatives | | | (2,144,063 | ) | | | (2,521,138 | ) | | | - | |
76.418.940-k | | GNL Chile S.A. (*) | | Chile | | Associate | | Natural gas consumption | | | (123,964,573 | ) | | | (114,115,041 | ) | | | (60,095,868 | ) |
76.418.940-k | | GNL Chile S.A. (*) | | Chile | | Associate | | Natural gas transportation | | | (52,195,582 | ) | | | (39,638,398 | ) | | | (34,796,720 | ) |
76.418.940-k | | GNL Chile S.A. (*) | | Chile | | Associate | | Other services rendered | | | 54,377 | | | | 56,042 | | | | 769,402 | |
76.418.940-k | | GNL Chile S.A. (*) | | Chile | | Associate | | Other financial income | | | 81,749 | | | | 58,169 | | | | 40,124 | |
76.788.080-4 | | GNL Quintero S.A. (*) | | Chile | | Associate | | Energy sales | | | 3,260,734 | | | | 2,671,120 | | | | 2,808,698 | |
76.788.080-4 | | GNL Quintero S.A. (*) | | Chile | | Associate | | Electricity tolls | | | 151,088 | | | | 47,263 | | | | - | |
76.788.080-4 | | GNL Quintero S.A. (*) | | Chile | | Associate | | Other services rendered | | | 650,390 | | | | 956,854 | | | | 835,543 | |
Foreign | | SACME | | Argentina | | Associate | | Outsourced services | | | (1,969,563 | ) | | | (1,407,349 | ) | | | (1,317,402 | ) |
96.880.800-1 | | Empresa Eléctrica Puyehue S.A. (*) | | Chile | | Common Immediate Parent | | Energy purchases | | | - | | | | (3,805 | ) | | | (109,699 | ) |
96.880.800-1 | | Empresa Eléctrica Puyehue S.A. (*) | | Chile | | Common Immediate Parent | | Electricity tolls | | | - | | | | (12,399 | ) | | | - | |
96.880.800-1 | | Empresa Eléctrica Puyehue S.A. (*) | | Chile | | Common Immediate Parent | | Energy sales | | | - | | | | 34,253 | | | | 227,765 | |
96.524.140-K | | Empresa Eléctrica Panguipulli S.A. (*) | | Chile | | Common Immediate Parent | | Energy purchases | | | (10,600,564 | ) | | | (10,113,496 | ) | | | (6,118,816 | ) |
96.524.140-K | | Empresa Eléctrica Panguipulli S.A. (*) | | Chile | | Common Immediate Parent | | Electricity tolls | | | (292,198 | ) | | | (260,495 | ) | | | - | |
96.524.140-K | | Empresa Eléctrica Panguipulli S.A. (*) | | Chile | | Common Immediate Parent | | Other services rendered | | | 392,312 | | | | 197,812 | | | | - | |
96.524.140-K | | Empresa Eléctrica Panguipulli S.A. (*) | | Chile | | Common Immediate Parent | | Energy sales | | | 286,833 | | | | 942,615 | | | | 356,056 | |
Foreign | | Enel Iberoamérica S.R.L. | | Spain | | Parent | | Other fixed operating expenses | | | (1,175,297 | ) | | | (2,860,930 | ) | | | (2,010,628 | ) |
Foreign | | Enel Iberoamérica S.R.L. | | Spain | | Parent | | Other operating income | | | 3,491 | | | | - | | | | - | |
96.806.130-5 | | Electrogas S.A. (*) | | Chile | | Associate | | Gas tolls | | | (3,296,956 | ) | | | (3,409,581 | ) | | | (2,734,877 | ) |
96.806.130-5 | | Electrogas S.A. (*) | | Chile | | Associate | | Fuel consumption | | | (952,044 | ) | | | (434,289 | ) | | | (428,555 | ) |
Foreign | | Endesa Operaciones y Servicios | | Spain | | Common Immediate Parent | | Other operating income | | | 172,728 | | | | 163,226 | | | | 134,775 | |
Foreign | | PH Chucas Costa Rica | | Costa Rica | | Common Immediate Parent | | Other services rendered | | | 1,188,564 | | | | - | | | | 236,173 | |
Foreign | | Enel Ingegneria Ricerca | | Italy | | Common Immediate Parent | | Other services rendered | | | 35,773 | | | | 33,970 | | | | 32,569 | |
Foreign | | Enel Ingegneria Ricerca | | Italy | | Common Immediate Parent | | Other fixed operating expenses | | | (2,241,294 | ) | | | (708,903 | ) | | | (1,196,294 | ) |
Foreign | | Empresa de Energía de Cundinamarca S.A. | | Colombia | | Joint Venture | | Energy sales | | | 4,263,174 | | | | 3,250,149 | | | | 9,146,049 | |
Foreign | | Empresa de Energía de Cundinamarca S.A. | | Colombia | | Joint Venture | | Other operating income | | | - | | | | - | | | | 186,496 | |
Foreign | | Empresa de Energía de Cundinamarca S.A. | | Colombia | | Joint Venture | | Other services rendered | | | 2,951,317 | | | | 3,142,758 | | | | 2,624,191 | |
Foreign | | Empresa de Energía de Cundinamarca S.A. | | Colombia | | Joint Venture | | Other financial income | | | - | | | | - | | | | 868,710 | |
Foreign | | Empresa de Energía de Cundinamarca S.A. | | Colombia | | Joint Venture | | Electricity tolls | | | (1,725,582 | ) | | | (1,731,368 | ) | | | (1,367,029 | ) |
76.652.400-1 | | Centrales Hidroeléctricas de Aysen S.A. (*) | | Chile | | Joint Venture | | Other financial income | | | - | | | | 23,891 | | | | 46,444 | |
76.652.400-1 | | Centrales Hidroeléctricas de Aysen S.A. (*) | | Chile | | Joint Venture | | Other services rendered | | | (9,322 | ) | | | - | | | | 10,281 | |
76.014.570-K | | Inversiones GasAtacama Holding Ltda. (1) (*) | | Chile | | Joint Venture | | Energy purchases | | | - | | | | (3,322,616 | ) | | | (9,295,172 | ) |
76.014.570-K | | Inversiones GasAtacama Holding Ltda. (1) (*) | | Chile | | Joint Venture | | Natural gas transportation | | | - | | | | (7,764,442 | ) | | | (20,937,075 | ) |
76.014.570-K | | Inversiones GasAtacama Holding Ltda. (1) (*) | | Chile | | Joint Venture | | Energy sales | | | - | | | | 1,858,318 | | | | 95,845 | |
76.014.570-K | | Inversiones GasAtacama Holding Ltda. (1) (*) | | Chile | | Joint Venture | | Other financial income | | | - | | | | 229,609 | | | | 489,864 | |
76.014.570-K | | Inversiones GasAtacama Holding Ltda. (1) (*) | | Chile | | Joint Venture | | Other fixed operating expenses | | | - | | | | (5,487 | ) | | | (219,671 | ) |
77.017.930-0 | | Transmisora Eléctrica de Quillota Ltda. (*) | | Chile | | Joint Venture | | Electricity tolls | | | (1,473,974 | ) | | | (1,378,743 | ) | | | (1,243,417 | ) |
Foreign | | Endesa, S.A. | | Spain | | Common Immediate Parent | | Other operating income | | | 36,266 | | | | 57,623 | | | | - | |
Foreign | | Endesa, S.A. | | Spain | | Common Immediate Parent | | Other fixed operating expenses | | | (174,638 | ) | | | - | | | | - | |
Foreign | | Compañía Energética Veracruz S.A.C. | | Peru | | Common Immediate Parent | | Other services rendered | | | - | | | | 3,022 | | | | - | |
Foreign | | Enel Trade SpA | | Italy | | Common Immediate Parent | | Other operating income | | | - | | | | 3,222 | | | | - | |
Foreign | | Enel Trade SpA | | Italy | | Common Immediate Parent | | Other fixed operating expense | | | (216,437 | ) | | | - | | | | - | |
Foreign | | Enel Trade SpA | | Italy | | Common Immediate Parent | | Commodity derivatives | | | (833,366 | ) | | | - | | | | - | |
76.321.458-3 | | Sociedad Almeyda Solar SpA(*) | | Chile | | Common Immediate Parent | | Energy purchases | | | (3,264,764 | ) | | | - | | | | - | |
76.321.458-3 | | Sociedad Almeyda Solar SpA(*) | | Chile | | Common Immediate Parent | | Electricity tolls | | | (153,929 | ) | | | - | | | | - | |
76.321.458-3 | | Sociedad Almeyda Solar SpA(*) | | Chile | | Common Immediate Parent | | Other services rendered | | | 109,891 | | | | - | | | | - | |
76.321.458-3 | | Sociedad Almeyda Solar SpA(*) | | Chile | | Common Immediate Parent | | Energy sales | | | 87,062 | | | | - | | | | - | |
76.052.206-6 | | Parque Eolico Valle de los Vientos S.A. (*) | | Chile | | Common Immediate Parent | | Energy purchases | | | (14,929,463 | ) | | | - | | | | - | |
76.052.206-6 | | Parque Eolico Valle de los Vientos S.A. (*) | | Chile | | Common Immediate Parent | | Energy sales | | | 670,035 | | | | - | | | | - | |
Foreign | | Enel SpA | | Italy | | Parent | | Other fixed operating expense | | | (13,567,378 | ) | | | - | | | | - | |
Foreign | | Enel SpA | | Italy | | Parent | | Other fixed operating expense | | | (72,057 | ) | | | - | | | | - | |
Foreign | | Enel SpA | | Italy | | Parent | | Other operating income | | | 124,626 | | | | - | | | | - | |
Foreign | | Enel Italia | | Italy | | Common Immediate Parent | | Other fixed operating expense | | | (168,463 | ) | | | - | | | | - | |
76.179.024-2 | | Parque Eolico Tal Tal S.A. (*) | | Chile | | Common Immediate Parent | | Energy purchases | | | (26,456,188 | ) | | | - | | | | - | |
76.179.024-2 | | Parque Eolico Tal Tal S.A. (*) | | Chile | | Common Immediate Parent | | Energy sales | | | 217,448 | | | | - | | | | - | |
Foreign | | Quatiara Energía S.A. | | Brazil | | Common Immediate Parent | | Energy purchases | | | (65,275 | ) | | | - | | | | - | |
Foreign | | Enel Green Power Cristal Eolica | | Brazil | | Common Immediate Parent | | Other services rendered | | | 5,404 | | | | - | | | | - | |
Foreign | | Enel Green Power SAO Judas Eolica | | Brazil | | Common Immediate Parent | | Other services rendered | | | 5,380 | | | | - | | | | - | |
Foreign | | Enel Green Power Primavera Eolica | | Brazil | | Common Immediate Parent | | Other services rendered | | | 5,430 | | | | - | | | | - | |
Foreign | | Enel Green Power Emiliana Sa | | Brazil | | Common Immediate Parent | | Energy purchases | | | (1,982,654 | ) | | | - | | | | - | |
Foreign | | Enel Green Power Emiliana Sa | | Brazil | | Common Immediate Parent | | Other services rendered | | | 7,802 | | | | - | | | | - | |
Foreign | | Enel Green Power Joana Sa | | Brazil | | Common Immediate Parent | | Energy purchases | | | (1,463,855 | ) | | | - | | | | - | |
Foreign | | Enel Green Power Joana Sa | | Brazil | | Common Immediate Parent | | Other services rendered | | | 7,208 | | | | - | | | | - | |
Foreign | | Enel Green Power Pau Ferro Eólica Sa | | Brazil | | Common Immediate Parent | | Energy purchases | | | (2,397,927 | ) | | | - | | | | - | |
Foreign | | Enel Green Power Pau Ferro Eólica Sa | | Brazil | | Common Immediate Parent | | Other services rendered | | | 3,523 | | | | - | | | | - | |
Foreign | | Enel Green Power Pedra Do Gerônimo Eólic | | Brazil | | Common Immediate Parent | | Energy purchases | | | (2,313,314 | ) | | | - | | | | - | |
Foreign | | Enel Green Power Pedra Do Gerônimo Eólic | | Brazil | | Common Immediate Parent | | Other services rendered | | | 3,461 | | | | - | | | | - | |
Foreign | | Enel Green Power Tacaicó Eólica Sa | | Brazil | | Common Immediate Parent | | Energy purchases | | | (910,249 | ) | | | - | | | | - | |
Foreign | | Enel Green Power Tacaicó Eólica Sa | | Brazil | | Common Immediate Parent | | Other services rendered | | | 2,124 | | | | - | | | | - | |
Foreign | | Enel Green Power Modelo I Eolica SA | | Brazil | | Common Immediate Parent | | Energy purchases | | | (2,978,980 | ) | | | - | | | | - | |
Foreign | | Enel Green Power Modelo I Eolica SA | | Brazil | | Common Immediate Parent | | Other services rendered | | | 7,114 | | | | - | | | | - | |
Foreign | | Enel Green Power Modelo II Eolica SA | | Brazil | | Common Immediate Parent | | Energy purchases | | | (1,997,894 | ) | | | - | | | | - | |
Foreign | | Enel Green Power Modelo II Eolica SA | | Brazil | | Common Immediate Parent | | Other services rendered | | | 6,218 | | | | - | | | | - | |
Foreign | | Enel Produzione | | Italy | | Common Immediate Parent | | Other fixed operating expense | | | (403,404 | ) | | | - | | | | - | |
Foreign | | Energía Nueva Energía Limpia Mexico S.R.L | | Mexico | | Common Immediate Parent | | Other services rendered | | | 16,312 | | | | - | | | | - | |
Foreign | | Enel Green Power Italia | | Italy | | Common Immediate Parent | | Other fixed operating expense | | | (68,787 | ) | | | - | | | | - | |
Foreign | | Enel Green Power Damascena S.A. | | Brazil | | Common Immediate Parent | | Other services rendered | | | 2,723 | | | | - | | | | - | |
Foreign | | Enel Green Power Esperança S.A. | | Brazil | | Common Immediate Parent | | Other services rendered | | | 2,545 | | | | - | | | | - | |
Foreign | | Enel Green Power Maniçoba S.A. | | Brazil | | Common Immediate Parent | | Other services rendered | | | 2,723 | | | | - | | | | - | |
Foreign | | Enel Solucoes Energeticas Ltda | | Brazil | | Common Immediate Parent | | Other services rendered | | | 298 | | | | - | | | | - | |
Foreign | | Yacylec | | Argentina | | Associate | | Other services rendered | | | 12,886 | | | | - | | | | - | |
Foreign | | Yacylec | | Argentina | | Associate | | Other services rendered | | | (122,237 | ) | | | - | | | | - | |
76.126.507-5 | | Parque Eolico Talinay Oriente SA (*) | | Chile | | Common Immediate Parent | | Energy sales | | | 153,158 | | | | - | | | | - | |
76.126.507-5 | | Parque Eolico Talinay Oriente SA (*) | | Chile | | Common Immediate Parent | | Energy purchases | | | (505,404 | ) | | | (5,141,912 | ) | | | (1,148,277 | ) |
| | | | | | | | | | | | | | | | | | | | |
| | | | | | | | Total | | | (262,484,943 | ) | | | (211,381,462 | ) | | | (152,123,118 | ) |
| | (*) | For the year ended December 31, 2015, 2014 and 2013, the effects on profit or loss of the transactions with related companies in Chile have been classified as discontinued operations in the consolidated statement of comprehensive income. |
| | (1) | See Notes 2.4.1, 6 and 14. |
| | |
| The accompanying notes are an integral part of these consolidated financial statements | | |
|
| F-71 |
Transfers of short-term funds between related companies are treated as current accounts changes, with variable interest rates based on market conditions used for the monthly balance. The resulting amounts receivable or payable are usually at 30 days term, with automatic rollover for the same periods and amortization in line with cash flows.
| | 11.2 | Board of directors and key management personnel |
Enersis Américas is managed by Board of Directors which consists of seven members. Each director serves for a three-year term after which they can be reelected.
The Board of Directors as of December 31, 2015, was elected at the Ordinary Shareholders Meeting held on April 28, 2015. The current Chairman of the Board was designated at a Board meeting held on June 30, 2015, and new directors were appointed to replace those who resigned during the period. The Vice Chairman and Secretary were designated at the Board meeting held on April 28, 2015.
| | a) | Accounts receivable and payable and other transactions |
| | • | | Accounts receivable and payable |
There are no outstanding amounts receivable or payable between the Company and the members of the Board of Directors and key management personnel.
No transactions other than the payment of remuneration have taken place between the Company and the members of the Board of Directors and key management personnel and other than transactions in the normal course of business-electricity supply.
| | b) | Compensation for directors |
In accordance with Article 33 of Law No. 18,046 governing stock corporations, the compensation of Directors is established each year at the Ordinary Shareholders Meeting of Enersis Américas S.A.
The remuneration consists of paying a variable annual compensation equal to one one-thousandth of the profit for the year (attributable to Shareholders of Enersis Américas). Also, each member of the Board will be paid a monthly compensation, one part a fixed monthly fee and another part dependent on meetings attended. The breakdown of this compensation is as follows:
| | - | 180 UF as a fixed monthly fee, and |
| | - | 66 UF as per diem for each Board meeting attended. |
The amounts paid for the monthly fee will be treated as payment in advance of the variable annual compensation described above. As stated in the by-laws, the remuneration for the Chairman of the Board will be twice that of a Director, and the compensation of the Vice Chairman will be 50% higher than that of a Director.
Any advance payments received will be deducted from the annual variable compensation, with no reimbursement if the annual variable compensation is lower than the total amount paid in advances. The variable compensation will be paid, when appropriate, after the Ordinary Shareholders’ Meeting approves the Annual Report, Balance Sheet and Financial Statements, and the Independent Auditors’ Reports and Account Inspectors’ Reports for the year ended December 31, 2015.
If any Director of Enersis Américas S.A. is a member of more than one Board in any Chilean or foreign subsidiaries and/or associates, or holds the position of director or advisor in other Chilean or foreign companies or legal entities in which Enersis Américas S.A. has a direct or indirect ownership interest, that Director can be compensated for his/her participation in only one of those Boards or Management Committees.
| | |
| The accompanying notes are an integral part of these consolidated financial statements | | |
|
| F-72 |
The Executive Officers of Enersis Américas S.A. and/or any of its Chilean or foreign subsidiaries or associates will not receive any compensation or per diem if they hold the position of director in any of the Chilean or foreign subsidiaries or associates of Enersis Américas S.A. Nevertheless, the executives may receive such compensation or per diem, provided there is prior express authorization, as a payment in advance of the variable portion of their remuneration received from the respective companies through which they are employed.
| | |
| The accompanying notes are an integral part of these consolidated financial statements | | |
|
| F-73 |
Directors’ Committee:
Each member of the Directors’ Committee will receive a variable remuneration equal to 0.11765 thousandth of the profit for the year (attributable to shareholders of Enersis Américas). Also each member will be paid a monthly compensation, one part in a fixed monthly fee and another part dependent on meetings attended.
This remuneration is broken down as follows:
-60.00 UF as a fixed monthly fee, and
-22.00 UF as per diem for each Board meeting attended.
The amounts paid for the monthly fee will be treated as payment in advance of the variable annual compensation described above.
Any advance payments received will be deducted from the annual variable compensation, with no reimbursement if the annual variable compensation is lower than the total amount paid in advances. The variable compensation will be paid, when appropriate, after the Ordinary Shareholders’ Meeting approves the Annual Report, Balance Sheet and Financial Statements, and the Independent Auditors’ Reports and Account Inspectors’ Reports for the year ended December 31, 2015.
The following tables show details of the compensation paid to the members of the Board of Directors of Enersis Américas for the years ended December 31, 2015, 2014 and 2013:
| | | | | | | | | | | | | | | | | | |
Taxpayer ID No. (RUT) | | Name | | Position | | 12-31-2015 | |
| | | | Period in position | | Enersis
Américas Board
ThCh$ | | | Board of
Subsidiaries
ThCh$ | | | Directors’
Committee
ThCh$ | |
Foreigner | | Francisco de Borja Acha Besga (1) | | Chairman | | June - December 2015 | | | - | | | | - | | | | - | |
5.710.967-K | | Pablo Yrarrázaval Valdés (1) | | Chairman | | Year 2014 | | | 20,184 | | | | - | | | | - | |
6.243.657-3 | | Jorge Rosenblut Ratinoff (1) | | Chairman | | January - June 2015 | | | 77,861 | | | | - | | | | - | |
Foreigner | | Francesco Starace (2) | | Vice Chairman | | June - December 2015 | | | - | | | | - | | | | - | |
Foreigner | | Borja Prado Eulate | | Vice Chairman | | January - April 2015 | | | 45,292 | | | | - | | | | - | |
7.052.890-8 | | Carolina Schmidt Zaldivar (3) | | Director | | January - June 2015 | | | 33,532 | | | | - | | | | 8,745 | |
4.975.992-4 | | Herman Chadwick Piñera (3) | | Director | | June - December 2015 | | | 53,679 | | | | - | | | | 21,428 | |
6.429.250-1 | | Rafael Fernández Morandé | | Director | | January - December 2015 | | | 97,303 | | | | - | | | | 36,914 | |
4.132.185-7 | | Hernán Somerville Senn | | Director | | January - December 2015 | | | 95,613 | | | | - | | | | 36,914 | |
Foreigner | | Andrea Brentan | | Director | | January - April 2015 | | | 22,743 | | | | - | | | | - | |
5.719.922-9 | | Leonidas Vial Echeverría (3) | | Director | | Year 2014 | | | 14,785 | | | | - | | | | - | |
Foreigner | | Alberto de Paoli (4) | | Director | | January - December 2015 | | | - | | | | - | | | | - | |
Foreigner | | Francesca Di Carlo (5) | | Director | | April - December 2015 | | | - | | | | - | | | | - | |
| | | |
| | | | | | | |
| | TOTAL | | | 460,992 | | | | - | | | | 104,001 | |
| | | | | | | | | | | | | | | | | | |
Taxpayer ID No. (RUT) | | Name | | Position | | 12-31-2014 | |
| | | | Period in position | | Enersis
Américas Board
ThCh$ | | | Board of
Subsidiaries
ThCh$ | | | Directors’
Committee
ThCh$ | |
5.710.967-K | | Pablo Yrarrázaval Valdés (1) | | Chairman | | January - October 2014 | | | 98,698 | | | | - | | | | - | |
6.243.657-3 | | Jorge Rosenblut Ratinoff | | Chairman | | November - December 2014 | | | 25,414 | | | | - | | | | - | |
Foreigner | | Borja Prado Eulate | | Vice Chairman | | January - December 2014 | | | 86,425 | | | | - | | | | - | |
7.052.890-8 | | Carolina Schmidt Zaldivar | | Director | | November - December 2014 | | | 13,038 | | | | - | | | | 3,192 | |
5.719.922-9 | | Leonidas Vial Echeverría | | Director | | January - October 2014 | | | 47,758 | | | | - | | | | 14,236 | |
6.429.250-1 | | Rafael Fernández Morandé | | Director | | January - December 2014 | | | 60,779 | | | | - | | | | 18,731 | |
4.132.185-7 | | Hernán Somerville Senn | | Director | | January - December 2014 | | | 62,387 | | | | - | | | | 18,731 | |
Foreigner | | Andrea Brentan | | Director | | January - December 2014 | | | 19,738 | | | | - | | | | - | |
| | | |
| | | | | | | |
| | TOTAL | | | 414,237 | | | | - | | | | 54,890 | |
| | |
| The accompanying notes are an integral part of these consolidated financial statements | | |
|
| F-74 |
| | | | | | | | | | | | | | | | | | |
Taxpayer ID No. (RUT) | | Name | | Position | | 12-31-2013 | |
| | | | Period in position | | Enersis
Américas Board
ThCh$ | | | Board of
Subsidiaries
ThCh$ | | | Directors’
Committee
ThCh$ | |
5.710.967-K | | Pablo Yrarrázaval Valdés | | Chairman | | January - December 2013 | | | 110,323 | | | | - | | | | - | |
Foreigner | | Borja Prado Eulate | | Vice Chairman | | April - September 2013 | | | 52,523 | | | | - | | | | - | |
48.070.966-7 | | Rafael Miranda Robredo | | Director | | January - December 2013 | | | 18,639 | | | | - | | | | - | |
5.719.922-9 | | Leonidas Vial Echeverría | | Director | | January - December 2013 | | | 50,598 | | | | - | | | | 15,859 | |
6.429.250-1 | | Rafael Fernández Morandé | | Director | | January - December 2013 | | | 55,162 | | | | - | | | | 16,691 | |
4.132.185-7 | | Hernán Somerville Senn | | Director | | January - December 2013 | | | 53,638 | | | | - | | | | 16,276 | |
5.715.860-3 | | Eugenio Tironi Barrios | | Director | | January - April 2013 | | | 20,146 | | | | - | | | | - | |
| | | |
| | | | | | | |
| | TOTAL | | | 361,029 | | | | - | | | | 48,826 | |
(1) Mr. Jorge Rosenblut became Chairman on November 4, 2014, replacing Pablo Yrarrázaval, who served until October 28, 2014. On June 30, 2015, Mr. Jorge Rosenblut resigned to his position and Mr. Francisco de Borja Acha Besga was appointed as Chairman.
(2) Mr. Francesco Starace became Vice Chairman on April 28, 2015. He is not remunerated
(3) Ms. Carolina Schmidt became a Director on November 4, 2014, replacing Leonidas Vial, who served until October 30, 2014. On June 26, 2015, Ms. Carolina Schmidt resigned to her position and Mr. Herman Chadwick Piñera replaced her as Director on June 30, 2015.
(4) Mr. Alberto de Paoli was appointed to the Board of Directors member in November 2014. He is not remunerated
(5) Ms. Francesca Di Carlo was appointed to the Board of Directors member on April 28, 2015. He is not remunerated.
For additional information see Note 41.
| | c) | Guarantees established by the Company in favor of the directors |
No guarantees have been given to the directors.
11.3 Compensation for key management personnel
| | a) | Remunerations received by key management personnel |
| | | | |
| Key Management Personnel |
Taxpayer ID No. (RUT) | | Name | | Position |
Foreigner | | Luca D’Agnese (1) | | Chief Executive Officer |
7.750.368-4 | | Daniel Fernandez Koprich (2) | | Deputy Chief Executive Officer |
24.852.381-6 | | Francisco Galán Allue (5) | | Administration, Finance and Control Officer |
Foreigner | | Marco Fadda | | Planning and Control Officer |
Foreigner | | Alain Rosolino | | Internal Audit Officer |
24.852.388-3 | | Francesco Giogianni (6) | | Institutional Relations Manager |
15.307.846-7 | | José Miranda Montecinos (3) | | Communications Officer |
10.664.744-5 | | Paola Visintini Vaccarezza (4) | | Human Resources and Organization Officer |
7.625.745-0 | | Antonio Barreda Toledo (7) | | Procurement Officer |
6.973.465-0 | | Domingo Valdés Prieto | | General Counsel and Secretary to the Board |
(1) On January 29, 2015, Mr. Luca D’Agnese became CEO replacing Mr. Luigi Ferraris who submitted his voluntarily resignation from Enersis Américas, and served until that date. Mr. Luigi Ferraris had become CEO replacing Mr. Ignacio Antoñanzas on November 12, 2014.
(2) On November 12, 2014, Mr. Daniel Fernandez Koprich became Deputy CEO replacing Mr. Massimo Tambosco.
(3) On December 1, 2014, Mr. José Miranda Montecinos became Communications Manager replacing Mr. Daniel Horacio Martini, who submitted his voluntarily resignation from Enersis Américas, and served until December 1, 2014.
(4) On December 12, 2014, Ms. Paola Visintini Vaccarezza became of Human Resources and Organizational Manager replacing Mr. Carlos Niño, who submitted his voluntarily resignation from Enersis Américas, and served until November 25, 2014.
(5) On December 15, 2014, Mr. Francisco Galán Allue became Administration, Finance and Control Manager replacing Mr. Eduardo Escaffi.
(6) On December 15, 2014, Mr. Francesco Giogianni became Institutional Relations Manager.
(7) On January 29, 2015, Mr. Antonio Barreda Toledo became Procurement Officer replacing Mr. Eduardo López Miller.
| | |
| The accompanying notes are an integral part of these consolidated financial statements | | |
|
| F-75 |
Incentive plans for key management personnel
Enersis Américas has implemented an annual bonus plan for its executives based on meeting company-wide objectives and on the level of their individual contribution in achieving the overall goals of the Group. The plan provides for a range of bonus amounts according to seniority level. The bonuses paid to the executives consist of a certain number of monthly gross remunerations.
Compensation received by key management personnel is the following:
| | | | | | | | | | | | |
| | | Balance as of | |
| | | 12-31-2015 ThCh$ | | | 12-31-2014 ThCh$ | | | 12-31-2013 ThCh$ | |
| | | | | | | | | | | | |
Cash compensation | | | 3,308,345 | | | | 3,028,193 | | | | 2,522,068 | |
Short-term benefits for employees | | | 352,329 | | | | 830,052 | | | | 514,139 | |
Other long-term benefits | | | 449,243 | | | | 562,074 | | | | 612,627 | |
|
| |
Total | | | 4,109,917 | | | | 4,420,319 | | | | 3,648,834 | |
| | b) | Guarantees established by the Company in favor of key management personnel |
No guarantees have been given to key management personnel.
11.4 Compensation plans linked to share price
There are no payment plans granted to the Directors or key management personnel based on the price of Enersis Américas stock.
| | |
| The accompanying notes are an integral part of these consolidated financial statements | | |
|
| F-76 |
The detail of inventories as of December 31, 2015 and 2014 is as follows:
| | | | | | | | |
| Classes of Inventories | | Balance as of | |
| | 12-31-2015 | | | 12-31-2014 | |
| | ThCh$ | | | ThCh$ | |
| | | | | | | | |
| Goods | | 872,084 | | | 1,270,326 | |
Supplies for Production | | | 16,060,887 | | | | 43,547,980 | |
Gas | | | - | | | | 1,407,285 | |
Oil | | | 13,602,708 | | | | 20,642,086 | |
Coal | | | 2,458,179 | | | | 21,498,609 | |
Other inventories (*) | | | 78,124,926 | | | | 88,701,848 | |
| | | | | | | | | |
Total | | | 95,057,897 | | | | 133,520,154 | |
Detail of other inventories | | | | | | | | |
(*) Other inventories | | | 78,124,926 | | | | 88,701,848 | |
Supplies for projects and spare parts | | | 22,871,137 | | | | 71,641,346 | |
Electrical materials | | | 55,253,789 | | | | 17,060,502 | |
There are no inventories pledged as security for liabilities.
For the year ended December 31, 2015, raw materials and consumables used recognized as fuel expenses were ThCh$585,616,918, out of which ThCh$258,113,922 corresponds to continuing operations (ThCh$511,014,654 and ThCh$386,116,195 for the years ended December 31, 2014 and 2013, respectively, out of which ThCh$205,534,394 and ThCh$174,504,021 correspond to continuing operations, respectively). See Note 28.
As of December 31, 2015 and 2014, no inventories have been written down.
| | |
| The accompanying notes are an integral part of these consolidated financial statements | | |
|
| F-77 |
| | 13. | CURRENT TAX ASSETS AND LIABILITIES. |
The detail of current tax receivables as of December 31, 2015 and 2014 is as follows:
| | | | | | | | |
| Tax Receivables | | Balance as of | |
| | 12-31-2015 | | | 12-31-2014 | |
| | ThCh$ | | | ThCh$ | |
| | | | | | | | |
Monthly provisional tax payments | | | 45,274,710 | | | | 59,831,897 | |
Tax credit for absorbed profits | | | 47,244 | | | | 20,104,186 | |
Tax credit for training expenses | | | 80,000 | | | | 301,800 | |
Tax credits from dividends received abroad | | | - | | | | 28,047,776 | |
Other | | | 2,052,634 | | | | 2,286,863 | |
| | | | | | | | |
Total | | | 47,454,588 | | | | 110,572,522 | |
The detail of current tax payables as of December 31, 2015 and 2014 is as follows:
| | | | | | | | |
| Tax Payables | | Balance as of | |
| | 12-31-2015 | | | 12-31-2014 | |
| | ThCh$ | | | ThCh$ | |
| | | | | | | | |
Income tax | | | 142,607,960 | | | | 115,472,313 | |
| | | | | | | | |
Total | | | 142,607,960 | | | | 115,472,313 | |
| | |
| The accompanying notes are an integral part of these consolidated financial statements | | |
|
| F-78 |
14. INVESTMENTS ACCOUNTED FOR USING THE EQUITY METHOD.
14.1. Investments accounted for using the equity method
| | a. | The following tables present the changes in shareholders’ equity of the Group’s equity method investments during the years 2015 and year 2014: |
| | | | | | | | | | | | | | | | | | | | | | | | | | | | | | | | | | | | | | | | | | | | | | | | | | | | |
| Taxpayer ID No. | | Changes in Investments in Associates | | Relationship | | Country | | Currency | | Ownership
Interest | | | Balance as of 01/01/2015 ThCh$ | | | Additions ThCh$ | | | Share of Profit (Loss) ThCh$ | | | Dividends declared ThCh$ | | | Foreign Currency Translation ThCh$ | | | Other Comprehensive Income ThCh$ | | | Other Increases (Decreases) ThCh$ | | | Balance as of 12/31/2015 ThCh$ | | | Transfer to
assets held for
distribution to
owners ThCh$ | | | Balance as of
12/31/2015 ThCh$ | |
| | | | | | | | | | | | | | | | | | | | | | | | | | | | | | | | | | | | | | | | | | | | | | | | | | | | |
Foreign | | Yacylec S.A. | | Associate | | Argentina | | Argentine peso | | | 22.22% | | | | 453,015 | | | | - | | | | (132,598 | ) | | | - | | | | (77,008 | ) | | | - | | | | - | | | | 243,409 | | | | - | | | | 243,409 | |
Foreign | | Sacme S.A. | | Associate | | Argentina | | Argentine peso | | | 50.00% | | | | 19,657 | | | | - | | | | 34,434 | | | | - | | | | (39,064 | ) | | | - | | | | - | | | | 15,027 | | | | - | | �� | | 15,027 | |
Foreign | | Distribuidora Eléctrica de Cundinamarca S.A. | | Joint Venture | | Colombia | | Colombian peso | | | 49.00% | | | | 32,795,615 | | | | - | | | | 752,621 | | | | - | | | | (4,079,210) | | | | 25,442 | | | | - | | | | 29,494,468 | | | | - | | | | 29,494,468 | |
Foreign | | Central Termica Manuel Belgrano | | Associate | | Argentina | | Argentine peso | | | 25.60% | | | | - | | | | 9,127 | | | | 1,415,471 | | | | (619,792 | ) | | | (181,731 | ) | | | - | | | | - | | | | 623,075 | | | | - | | | | 623,075 | |
Foreign | | Central Termica San Martin | | Associate | | Argentina | | Argentine peso | | | 25.60% | | | | - | | | | 9,127 | | | | 1,263,043 | | | | (531,712 | ) | | | (167,201 | ) | | | - | | | | - | | | | 573,257 | | | | - | | | | 573,257 | |
Foreign | | Central Vuelta Obligado S.A. | | Associate | | Argentina | | Argentine peso | | | 40.90% | | | | - | | | | 14,509 | | | | - | | | | - | | | | (3,300) | | | | - | | | | - | | | | 11,209 | | | | - | | | | 11,209 | |
96.806.130-5 | | Electrogas S.A. (4) | | Associate | | Chile | | U.S. dollar | | | 42.50% | | | | 10,777,659 | | | | - | | | | 5,121,427 | | | | (4,398,423 | ) | | | 1,120,075 | | | | (577,862 | ) | | | - | | | | 12,042,876 | | | | (12,042,876 | ) | | | - | |
76.788.080-4 | | GNL Quintero S.A. (4) | | Associate | | Chile | | U.S. dollar | | | 20.00% | | | | 15,198,935 | | | | - | | | | 4,534,344 | | | | (4,449,179 | ) | | | 1,852,923 | | | | - | | | | - | | | | 17,137,023 | | | | (17,137,023 | ) | | | - | |
76.418.940-K | | GNL Chile S.A. (4) | | Associate | | Chile | | U.S. dollar | | | 33.33% | | | | 1,818,168 | | | | - | | | | 495,389 | | | | - | | | | 348,472 | | | | - | | | | - | | | | 2,662,029 | | | | (2,662,029) | | | | - | |
76.652.400-1 | | Centrales Hidroeléctricas De Aysén S.A. (4) | | Joint Venture | | Chile | | Chilean peso | | | 51.00% | | | | 6,144,557 | | | | 2,550,000 | | | | (2,414,264) | | | | - | | | | - | | | | - | | | | - | | | | 6,280,293 | | | | (6,280,293) | | | | - | |
77.017.930-0 | | Transmisora Eléctrica de Quillota Ltda. (4) | | Joint Venture | | Chile | | Chilean peso | | | 50.00% | | | | 6,426,004 | | | | - | | | | 1,168,149 | | | | - | | | | - | | | | - | | | | - | | | | 7,594,153 | | | | (7,594,153) | | | | - | |
| | | | | | | | | | | | | | | | | | | | | | | | | | | | | | | | | | | | | | | | | | | | | | | | | | | | |
| | | | | | | | | | | TOTALES | | | | 73,633,610 | | | | 2,582,763 | | | | 12,238,016 | | | | (9,999,106 | ) | | | (1,226,044 | ) | | | (552,420 | ) | | | - | | | | 76,676,819 | | | | (45,716,374 | ) | | | 30,960,445 | |
| | | | | | | | | | | | | | | | | | | | | | | | | | | | | | | | | | | | | | | | | | | | | | | | | | | | |
| | | | | | | | | | | | | | | | | | | | | | | | | | | | | | | | | | | | | | | | | | | | | | | | | | | | |
Taxpayer ID No.
| | Changes in Investments in Associates | | Relationship | | Country | | Currency | | Ownership Interest | | | Balance as of
01/01/2014 ThCh$ | | | Additions ThCh$ | | | Share of Profit (Loss)
ThCh$ | | | Dividends declared
ThCh$ | | | Foreign Currency Translation
ThCh$ | | | Other Comprehensive Income ThCh$ | | | Other Increases (Decreases)
ThCh$ | | | Balance as of 12/31/2014 ThCh$ | | | Transfer to
assets held for
distribution to
owners
ThCh$ | | | Balance as of 12/31/2014 ThCh$ | |
| | | | | | | | | | | | | | | | | | | | | | | | | | | | | | | | | | | | | | | | | | | | | | | | | | | | |
| | | | | | | | | | | | | | | | | | | | | | | | | | | | | | | | | | | | | | | | | | | | | | | | | | | | |
Foreign | | Yacylec S.A. | | Associate | | Argentina | | Argentine peso | | | 22.22% | | | | 550,047 | | | | - | | | | (35,735 | ) | | | - | | | | (61,297 | ) | | | - | | | | - | | | | 453,015 | | | | - | | | | 453,015 | |
Foreign | | Sacme S.A. | | Associate | | Argentina | | Argentine peso | | | 50.00% | | | | 21,641 | | | | - | | | | 34,719 | | | | - | | | | (36,703 | ) | | | - | | | | - | | | | 19,657 | | | | - | | | | 19,657 | |
Foreign | | Distribuidora Eléctrica de Cundinamarca S.A. | | Joint Venture | | Colombia | | Colombian peso | | | 49.00% | | | | 33,083,016 | | | | - | | | | 2,561,039 | | | | - | | | | (2,293,359 | ) | | | - | | | | (555,081 | ) | | | 32,795,615 | | | | - | | | | 32,795,615 | |
96.806.130-5 | | Electrogas S.A. | | Associate | | Chile | | U.S. dollar | | | 42.50% | | | | 9,682,324 | | | | - | | | | 4,566,154 | | | | (4,239,280 | ) | | | 847,016 | | | | 31,475 | | | | (110,030 | ) | | | 10,777,659 | | | | - | | | | 10,777,659 | |
76.788.080-4 | | GNL Quintero S.A. | | Associate | | Chile | | U.S. dollar | | | 20.00% | | | | 4,797,508 | | | | - | | | | 5,808,748 | | | | (6,897,599 | ) | | | 311,747 | | | | 13,445,396 | | | | (2,266,865 | ) | | | 15,198,935 | | | | - | | | | 15,198,935 | |
76.418.940-K | | GNL Chile S.A. | | Associate | | Chile | | U.S. dollar | | | 33.33% | | | | 559,615 | | | | - | | | | 1,099,143 | | | | - | | | | 159,410 | | | | - | | | | - | | | | 1,818,168 | | | | - | | | | 1,818,168 | |
76.652.400-1 | | Centrales Hidroeléctricas De Aysén S.A. (2) | | Joint Venture | | Chile | | Chilean peso | | | 51.00% | | | | 69,684,864 | | | | 3,315,000 | | | | (69,525,874 | ) | | | - | | | | - | | | | - | | | | 2,670,567 | | | | 6,144,557 | | | | - | | | | 6,144,557 | |
77.017.930-0 | | Transmisora Eléctrica de Quillota Ltda. | | Joint Venture | | Chile | | Chilean peso | | | 50.00% | | | | 6,073,897 | | | | - | | | | 585,051 | | | | - | | | | - | | | | - | | | | (232,944 | ) | | | 6,426,004 | | | | - | | | | 6,426,004 | |
76.014.570-K | | Inversiones GasAtacama Holding Ltda. (1) | | Joint Venture | | Chile | | U.S. dollar | | | 50.00% | | | | 123,627,968 | | | | - | | | | 3,053,468 | | | | - | | | | 8,919,246 | | | | - | | | | (135,600,682 | ) | | | - | | | | - | | | | - | |
| | | | | | | | | | | | | | | | | | | | | | | | | | | | | | | | | | | | | | | | | | | | | | | | | | | | |
| | | | | | | | | | | TOTALES | | | | 248,080,880 | | | | 3,315,000 | | | | (51,853,287 | ) | | | (11,136,879 | ) | | | 7,846,060 | | | | 13,476,871 | | | | (136,095,035 | ) | | | 73,633,610 | | | | - | | | | 73,633,610 | |
| (1) | In April 2014, the company Inversiones GasAtacama Holding Ltda. became a subsidiary and since then it is included in the consolidation (see Notes 2.4.1 and 6). |
| (2) | The loss recognized in 2014 includes an impairment of ThCh$69,066,857 as a result of the uncertainty about the recoverability of this investment (see Note 36.5). |
| (3) | The share of profit (loss) from continuing operations is ThCh$3,332,971 and ThCh$2,560,023 for the years ended December 31, 2015 and 2014. |
| (4) | As of December 31, 2015, these equity method investments have been classified as non-current assets held for distribution to owners. |
| | |
| The accompanying notes are an integral part of these consolidated financial statements | | |
|
| F-79 |
| | b. | Additional financial information on investments in associated companies and joint ventures |
| | - | Investments with significant influence |
The following tables set forth financial information as of December 31, 2015 and 2014, from the Financial Statements of the investments in associates where the Group has significant influence:
| | | | | | | | | | | | | | | | | | | | | | | | | | | | | | | | | | | | | | |
Investments with
Significant Influence | | 12-31-2015 | |
| | %
Ownership
Interest
Direct /
Indirect | | Current
Assets | | | Non-current
Assets | | | Current
Liabilities | | | Non-current
Liabilities | | | Revenues | | | Expenses | | | Profit
(Loss) | | | Other
Comprehensive
Income | | | Comprehensive
Income | |
| | | ThCh$ | | | ThCh$ | | | ThCh$ | | | ThCh$ | | | ThCh$ | | | ThCh$ | | | ThCh$ | | | ThCh$ | | | ThCh$ | |
GNL Chile S.A (*) | | 33.33% | | | 73,289,529 | | | | 19,843,392 | | | | 59,207,958 | | | | 25,938,077 | | | | 655,759,390 | | | | (654,273,074 | ) | | | 1,486,316 | | | | 1,045,519 | | | | 2,531,835 | |
GNL Quintero S.A. (*) | | 20.00% | | | 154,169,202 | | | | 679,246,875 | | | | 22,104,679 | | | | 725,626,283 | | | | 130,540,774 | | | | (107,869,054 | ) | | | 22,671,720 | | | | 9,264,617 | | | | 31,936,337 | |
Electrogas S.A. (*) | | 42.50% | | | 9,800,478 | | | | 46,815,192 | | | | 12,191,561 | | | | 16,087,931 | | | | 23,546,048 | | | | (10,624,229 | ) | | | 12,921,819 | | | | 1,275,795 | | | | 14,197,614 | |
Yacylec S.A. | | 22.22% | | | 1,810,275 | | | | 193,569 | | | | 868,193 | | | | 40,198 | | | | 1,377,810 | | | | (1,974,559 | ) | | | (596,749 | ) | | | (346,568 | ) | | | (943,317 | ) |
| | | | | | | | | | | | | | | | | | | | | | | | | | | | | | | | | | | | | | |
Investments with
Significant Influence | | 12-31-2014 | |
| | %
Ownership
Interest
Direct /
Indirect | | Current
Assets
ThCh$ | | | Non-current
assets
ThCh$ | | | Current
Liabilities
ThCh$ | | | Non-current
Liabilities
ThCh$ | | | Revenues
ThCh$ | | | Expenses
ThCh$ | | | Profit
(Loss)
ThCh$ | | | Other
Comprehensive
Income ThCh$ | | | Comprehensive
Income ThCh$ | |
GNL Chile S.A | | 33.33% | | | 73,425,419 | | | | 81,983 | | | | 64,329,604 | | | | 3,723,224 | | | | 732,138,386 | | | | (728,840,589 | ) | | | 3,297,797 | | | | 478,277 | | | | 3,776,074 | |
GNL Quintero S.A | | 20.00% | | | 98,325,654 | | | | 597,812,711 | | | | 20,036,542 | | | | 600,107,009 | | | | 117,435,890 | | | | (99,726,467 | ) | | | 17,709,423 | | | | 68,785,714 | | | | 86,495,137 | |
Electrogas S.A. | | 42.50% | | | 6,085,889 | | | | 43,289,210 | | | | 10,076,915 | | | | 13,938,983 | | | | 19,635,597 | | | | (9,150,599 | ) | | | 10,484,998 | | | | 2,067,038 | | | | 12,552,036 | |
Yacylec S.A. | | 22.22% | | | 2,027,688 | | | | 774,429 | | | | 717,301 | | | | 46,046 | | | | 1,348,659 | | | | (1,509,482 | ) | | | (160,823 | ) | | | (275,865 | ) | | | (436,688 | ) |
| | (*) | As of December 31, 2015, these investments in associates have been classified as non-current assets held for distribution to owners. |
Appendix 3 to these consolidated financial statements provides information on the main activities of our associated companies and the ownership interest the Group holds in them.
None of our associates have published price quotations.
The following tables present information from the financial statements as of December 31, 2015 and 2014, on the main joint ventures:
| | | | | | | | | | | | | | | | | | | | | | | | |
| | | Centrales Hidroeléctricas de
Aysén S.A. (*) | | | Transmisora Eléctrica de
Quillota Ltda. (*) | | | Distribuidora Eléctrica de
Cundinamarca S.A. | |
| % Ownership | | 51.0%
12/31/2015
ThCh$ | | | 51.0%
12/31/2014
ThCh$ | | | 50.0%
12/31/2015
ThCh$ | | | 50.0%
12/31/2014
ThCh$ | | | 48.997%
12/31/2015
ThCh$ | | | 48.997%
12/31/2014
ThCh$ | |
| | | | | | | | | | | | | | | | | | | | | | | | |
Total current assets | | | 502,938 | | | | 485,966 | | | | 5,336,516 | | | | 4,426,445 | | | | 14,988,328 | | | | 13,918,600 | |
Total non-current assets | | | 15,159,321 | | | | 15,026,706 | | | | 12,148,544 | | | | 11,420,593 | | | | 127,123,136 | | | | 140,233,080 | |
Total current liabilities | | | 3,290,947 | | | | 3,419,214 | | | | 466,485 | | | | 1,159,095 | | | | 16,616,178 | | | | 16,252,424 | |
Total non-current liabilities | | | 56,685 | | | | 45,348 | | | | 1,830,272 | | | | 1,835,937 | | | | 55,374,521 | | | | 60,107,487 | |
Cash and cash equivalents | | | 428,440 | | | | 319,670 | | | | 4,884,645 | | | | 3,930,814 | | | | 2,789,518 | | | | 3,750,964 | |
Other current financial liabilities | | | - | | | | - | | | | - | | | | - | | | | 1,081,545 | | | | 116,008 | |
Other non-current financial liabilities | | | - | | | | - | | | | - | | | | - | | | | 23,230,972 | | | | 22,738,158 | |
| | | | | | | | | | | | | | | | | | | | | | | | |
Revenues | | | - | | | | - | | | | 2,852,803 | | | | 2,672,950 | | | | 86,666,633 | | | | 89,367,706 | |
Depreciation and amortization expense | | | - | | | | (52,978 | ) | | | (748,171 | ) | | | (738,927 | ) | | | (8,773,063 | ) | | | (7,400,833 | ) |
Impairment losses | | | - | | | | (131,894,113 | ) | | | - | | | | - | | | | - | | | | - | |
Interest income | | | 20,009 | | | | 479,518 | | | | 1,678,801 | | | | 88,597 | | | | 633,204 | | | | 642,775 | |
Interest expense | | | - | | | | - | | | | - | | | | - | | | | (3,100,381 | ) | | | (3,017,696 | ) |
Income tax expense | | | (8,586 | ) | | | - | | | | (679,715 | ) | | | (205,839 | ) | | | (5,237,742 | ) | | | (4,702,120 | ) |
Profit (loss) | | | (4,733,482 | ) | | | (136,325,281 | ) | | | 2,336,297 | | | | 1,170,102 | | | | 1,926,420 | | | | 6,820,089 | |
Other comprehensive income | | | - | | | | - | | | | - | | | | - | | | | (8,273,502 | ) | | | (4,680,612 | ) |
Comprehensive income | | | (4,733,482 | ) | | | (136,325,281 | ) | | | 2,336,297 | | | | 1,170,102 | | | | (6,347,082 | ) | | | 2,139,477 | |
(*) As of December 31, 2015, these investments in joint ventures have been classified as non-current assets held for distribution to owners.
See Appendix 3
| | c. | There are no significant commitments and contingencies, or restrictions on funds transfers to its owners in associated companies and joint ventures. |
| | |
| The accompanying notes are an integral part of these consolidated financial statements | | |
|
| F-80 |
| | 15. | INTANGIBLE ASSETS OTHER THAN GOODWILL. |
The following table presents intangible assets as of December 31, 2015 and 2014:
| | | | | | | | |
| Intangible Assets, Net | | 12-31-2015
ThCh$ | | | 12-31-2014
ThCh$ | |
| | | | | | | | |
Intangible Assets, Net | | | 981,399,272 | | | | 1,168,212,056 | |
Easements and water rights | | | 27,572,798 | | | | 44,841,692 | |
Concessions, Net (1) (*) | | | 905,374,088 | | | | 1,055,986,162 | |
Development costs | | | 17,805,648 | | | | 14,833,312 | |
Patents, registered trademarks and other rights | | | 2,431,516 | | | | 2,206,341 | |
Computer software | | | 28,105,416 | | | | 49,549,321 | |
Other identifiable intangible assets | | | 109,806 | | | | 795,228 | |
| | | | | | | | |
| Intangible Assets, Gross | | 12-31-2015 ThCh$ | | | 12-31-2014 ThCh$ | |
| | | | | | | | |
Intangible Assets, Gross | | | 1,943,902,048 | | | | 2,376,332,904 | |
Easements and water rights | | | 36,770,284 | | | | 54,963,685 | |
Concessions | | | 1,788,421,395 | | | | 2,135,095,221 | |
Development costs | | | 26,126,552 | | | | 24,281,499 | |
Patents, registered trademarks and other rights | | | 11,285,432 | | | | 11,465,938 | |
Computer software | | | 79,169,384 | | | | 140,953,212 | |
Other identifiable intangible assets | | | 2,129,001 | | | | 9,573,349 | |
| | | | | | | | |
| Intangible Assets, Amortization and Impairment | | 12-31-2015 ThCh$ | | | 12-31-2014 ThCh$ | |
| | | | | | | | |
Accumulated Amortization and Impairment, Total | | | (962,502,776 | ) | | | (1,208,120,848 | ) |
Identifiable intangible assets | | | (962,502,776 | ) | | | (1,208,120,848 | ) |
Easements and water rights | | | (9,197,486 | ) | | | (10,121,993 | ) |
Concessions | | | (883,047,307 | ) | | | (1,079,109,059 | ) |
Development costs | | | (8,320,904 | ) | | | (9,448,187 | ) |
Patents, registered trademarks and other rights | | | (8,853,916 | ) | | | (9,259,597 | ) |
Computer software | | | (51,063,968 | ) | | | (91,403,891 | ) |
Other identifiable intangible assets | | | (2,019,195 | ) | | | (8,778,121 | ) |
(1) The detail of concessions is the following:
| | | | | | | | |
| Concession Holder | | 12-31-2015
ThCh$ | | | 12-31-2014
ThCh$ | |
| | | | | | | | |
Ampla Energia e Servicios S.A. (Distribution) | | | 543,414,668 | | | | 637,287,020 | |
Compañía Energetica do Ceara S.A. (Distribution) | | | 361,959,420 | | | | 418,699,142 | |
| | | | | | | | |
TOTAL | | | 905,374,088 | | | | 1,055,986,162 | |
(*) See Note 3d.1)
| | |
| The accompanying notes are an integral part of these consolidated financial statements | | |
|
| F-81 |
The reconciliations of the carrying amounts of intangible assets during the period 2015 and year 2014 are as follows:
2015
| | | | | | | | | | | | | | | | | | | | | | | | | | | | |
| Changes in Intangible Assets | | Development Costs | | | Easements | | | Concessions | | | Patents, Registered Trademarks and Other Rights | | | Computer Software | | | Other Identifiable Intangible Assets, Net | | | Intangible Assets, Net | |
| | ThCh$ | | | ThCh$ | | | ThCh$ | | | ThCh$ | | | ThCh$ | | | ThCh$ | | | ThCh$ | |
| | | | | | | | | | | | | | | | | | | | | | | | | | | | |
Opening balance as of 1/1/2015 | | | 14,833,312 | | | | 44,841,692 | | | | 1,055,986,162 | | | | 2,206,341 | | | | 49,549,321 | | | | 795,228 | | | | 1,168,212,056 | |
Changes in identifiable intangible assets | | | | | | | | | | | | | | | | | | | | | | | | | | | | |
Increases other than from business combinations | | | 5,588,626 | | | | 317,865 | | | | 230,687,290 | | | | 1,208,396 | | | | 19,091,097 | | | | - | | | | 256,893,274 | |
Increase (decrease) from exchange differences, net | | | (540,471) | | | | (2,335,864) | | | | (236,814,024) | | | | (303,835) | | | | (3,107,703) | | | | 15,908 | | | | (243,085,989) | |
Amortization (1) | | | (36,351) | | | | (1,152,144) | | | | (74,777,866) | | | | (780,678) | | | | (9,285,111) | | | | (20,145) | | | | (86,052,295) | |
Impairment losses recognized in profit or loss (2) | | | - | | | | - | | | | - | | | | - | | | | - | | | | - | | | | - | |
Increases (decreases) from transfers and other changes | | | (1,090,419) | | | | 556,721 | | | | (62,920,004) | | | | 101,292 | | | | (264,122) | | | | (201,424) | | | | (63,817,956) | |
Increases (decreases) from transfers | | | 38,538 | | | | 556,721 | | | | - | | | | 101,292 | | | | (139,831) | | | | (556,720) | | | | - | |
Increases (decreases) from other changes | | | (1,128,957) | | | | - | | | | (62,920,004) | | | | - | | | | (124,291) | | | | 355,296 | | | | (63,817,956) | |
Disposals and removals from service | | | (949,049) | | | | (80,001) | | | | (6,787,470) | | | | - | | | | (53,972) | | | | - | | | | (7,870,492) | |
Disposals | | | - | | | | - | | | | - | | | | - | | | | - | | | | - | | | | - | |
Removals from service | | | (949,049) | | | | (80,001) | | | | (6,787,470) | | | | - | | | | (53,972) | | | | - | | | | (7,870,492) | |
Decreases through classified as held for distribution to owners(3) | | | - | | | | (14,575,471) | | | | - | | | | - | | | | (27,824,094) | | | | (479,761) | | | | (42,879,326) | |
Total changes in identifiable intangible assets | | | 2,972,336 | | | | (17,268,894) | | | | (150,612,074) | | | | 225,175 | | | | (21,443,905) | | | | (685,422) | | | | (186,812,784) | |
| | | | | | | | | | | | | | | | | | | | | | | | | | | | |
Closing balance of intangible assets as of 12/31/2015 | | | 17,805,648 | | | | 27,572,798 | | | | 905,374,088 | | | | 2,431,516 | | | | 28,105,416 | | | | 109,806 | | | | 981,399,272 | |
2014
| | | | | | | | | | | | | | | | | | | | | | | | | | | | |
| Changes in Intangible Assets | | Development Costs | | | Easements | | | Concessions | | | Patents, Registered Trademarks and Other Rights | | | Computer Software | | | Other Identifiable Intangible Assets, Net | | | Intangible Assets, Net | |
| | ThCh$ | | | ThCh$ | | | ThCh$ | | | ThCh$ | | | ThCh$ | | | ThCh$ | | | ThCh$ | |
| | | | | | | | | | | | | | | | | | | | | | | | | | | | |
Opening balance as of 1/1/2014 | | | 26,530,426 | | | | 42,779,382 | | | | 1,060,466,808 | | | | 2,205,245 | | | | 38,718,081 | | | | 2,860,419 | | | | 1,173,560,361 | |
Changes in identifiable intangible assets | | | | | | | | | | | | | | | | | | | | | | | | | | | | |
Increases other than from business combinations | | | 3,546,359 | | | | 1,901,989 | | | | 184,993,319 | | | | 1,053,177 | | | | 17,060,992 | | | | - | | | | 208,555,836 | |
Increase (decrease) from exchange differences, net | | | 980,172 | | | | (856,524) | | | | 32,102,724 | | | | (155,290) | | | | (506,857) | | | | 124,597 | | | | 31,688,822 | |
Amortization | | | (3,182,841) | | | | (1,604,192) | | | | (98,940,029) | | | | (992,288) | | | | (7,501,894) | | | | (7,207) | | | | (112,228,451) | |
Impairment losses recognized in profit or loss | | | - | | | | - | | | | (14,948,785) | | | | - | | | | - | | | | - | | | | (14,948,785) | |
Increases (decreases) from transfers and other changes | | | (12,927,088) | | | | 2,621,037 | | | | (103,283,260) | | | | 95,497 | | | | 2,152,373 | | | | (2,182,581) | | | | (113,524,022) | |
Increases (decreases) from transfers | | | 7,870 | | | | (433,818) | | | | (556,720) | | | | (23,947) | | | | 449,895 | | | | 556,720 | | | | - | |
Increases (decreases) from other changes | | | (12,934,958) | | | | 3,054,855 | | | | (102,726,540) | | | | 119,444 | | | | 1,702,478 | | | | (2,739,301) | | | | (113,524,022) | |
Disposals and removals from service | | | (113,716) | | | | - | | | | - | | | | - | | | | (373,374) | | | | - | | | | (487,090) | |
Disposals | | | - | | | | - | | | | - | | | | - | | | | - | | | | - | | | | - | |
Removals from service | | | (113,716) | | | | - | | | | - | | | | - | | | | (373,374) | | | | - | | | | (487,090) | |
Decreases classified as held for sale (3) | | | - | | | | - | | | | (4,404,615) | | | | - | | | | - | | | | - | | | | (4,404,615) | |
Total changes in identifiable intangible assets | | | (11,697,114) | | | | 2,062,310 | | | | (4,480,646) | | | | 1,096 | | | | 10,831,240 | | | | (2,065,191) | | | | (5,348,305) | |
| | | | | | | | | | | | | | | | | | | | | | | | | | | | |
Closing balance in identifiable intangible assets as of 12/31/2014 | | | 14,833,312 | | | | 44,841,692 | | | | 1,055,986,162 | | | | 2,206,341 | | | | 49,549,321 | | | | 795,228 | | | | 1,168,212,056 | |
(1)(2) See Note 30.
| | (3) | See Note 5.1 a) and 5.2 |
The main additions to intangible assets recognized within item Concessions in accordance with IFRIC 12 (See Note 3.d.1) are from Ampla and Coelce and are related to investments in network and extensions to optimize functionality and to improve efficiency and quality levels of service.
The additions in 2015 related to continuing operations were ThCh$246,286,301. The amortization expense of intangible assets related to continuing operations were ThCh$74,944,152, ThCh$106,274,341 and ThCh$90,481,347 for the years ended December 31, 2015, 2014 and 2013. (See Note 5.1)
The employee expenses capitalized as part of projects under development were ThCh$10,165,042, ThCh$12,046,728 and ThCh$13,877,942 for the years ended December 31, 2015, 2014 and 2013, respectively. All employee expenses capitalized are related to continuing operations.
According to the Group management’s estimates and projections, the expected future cash flows attributable to intangible assets allow recovery of the carrying amount of these assets recorded as of December 31, 2015 (See Note 3.e).
As of December 31, 2015 and 2014, the Company does not have significant intangible assets with an indefinite useful life.
| | |
| The accompanying notes are an integral part of these consolidated financial statements | | |
|
| F-82 |
The following table sets forth goodwill by the Cash-Generating Unit or group of Cash-Generating Units to which it belongs and changes for the years ended December 31, 2015 and 2014:
| | | | | | | | | | | | | | | | | | | | | | | | | | | | | | | | |
| Company | | Cash Generating Unit | | | | Opening
Balance
1/1/2014
ThCh$ | | | Increase/
(Decrease)
ThCh$ | | | Foreign
Currency
Translation
ThCh$ | | | Closing
Balance
12/31/2014
ThCh$ | | | Foreign
Currency
Translation
ThCh$ | | | Transfer to
assets held
for
distribution
to owners (2)
ThCh$ | | | Closing
Balance
12/31/2015
ThCh$ | |
| Ampla Energia e Serviços S.A. | | Ampla Energia e Serviços S.A. | | | | | 189,172,295 | | | | - | | | | 5,474,748 | | | | 194,647,043 | | | | (42,267,975) | | | | - | | | | 152,379,068 | |
| Empresa Eléctrica de Colina Ltda. | | Empresa Eléctrica de Colina Ltda. | | | | | 2,240,478 | | | | - | | | | - | | | | 2,240,478 | | | | - | | | | (2,240,478) | | | | - | |
| Compañía Distribuidora y Comercializadora de energía S.A. | | Compañía Distribuidora y Comercializadora de energía S.A. | | | | | 11,786,531 | | | | - | | | | (740,800) | | | | 11,045,731 | | | | (1,357,767) | | | | - | | | | 9,687,964 | |
| Hidroeléctrica el Chocón S.A. | | Hidroeléctrica el Chocón S.A. | | | | | 8,565,202 | | | | - | | | | (942,764) | | | | 7,622,438 | | | | (1,799,525) | | | | - | | | | 5,822,913 | |
| Compañía Eléctrica Tarapaca S.A.(3)(*) | | Generación Chile | | | | | 4,656,105 | | | | - | | | | - | | | | 4,656,105 | | | | - | | | | (4,656,105) | | | | - | |
| Empresa de Distribución Eléctrica de Lima Norte S.A.A | | Empresa de Distribución Eléctrica de Lima Norte S.A.A | | | | | 43,385,791 | | | | - | | | | 3,495,841 | | | | 46,881,632 | | | | 1,249,194 | | | | - | | | | 48,130,826 | |
| Cachoeira Dourada S.A. | | Cachoeira Dourada S.A. | | | | | 69,364,835 | | | | - | | | | 2,007,456 | | | | 71,372,291 | | | | (15,498,627) | | | | - | | | | 55,873,664 | |
| Edegel S.A.A | | Edegel S.A.A | | | | | 81,661,135 | | | | - | | | | 6,579,904 | | | | 88,241,039 | | | | 2,351,245 | | | | - | | | | 90,592,284 | |
| Emgesa S.A. E.S.P. | | Emgesa S.A. E.S.P. | | | | | 5,213,757 | | | | - | | | | (327,692) | | | | 4,886,065 | | | | (600,606) | | | | - | | | | 4,285,459 | |
| Chilectra S.A.(*) | | Chilectra S.A. | | | | | 128,374,362 | | | | - | | | | - | | | | 128,374,362 | | | | - | | | | (128,374,362) | | | | - | |
| Empresa Nacional de Electricidad S.A (*) (3) | | Generación Chile | | | | | 731,782,459 | | | | - | | | | - | | | | 731,782,459 | | | | - | | | | (731,782,459) | | | | - | |
| Inversiones Distrilima S.A. | | Empresa de Distribución Eléctrica de Lima Norte S.A.A | | | | | 12,904 | | | | - | | | | 1,040 | | | | 13,944 | | | | 372 | | | | - | | | | 14,316 | |
| Enel Brasil S.A. | | Enel Brasil S.A. | | | | | 880,679 | | | | - | | | | 25,487 | | | | 906,166 | | | | (196,776) | | | | - | | | | 709,390 | |
| Compañía Energética Do Ceará S.A. | | Compañía Energética Do Ceará S.A. | | | | | 95,223,795 | | | | - | | | | 2,755,828 | | | | 97,979,623 | | | | (21,276,460) | | | | - | | | | 76,703,163 | |
Inversiones GasAtacama Holding
Ltda. (1)(*) (3) | | Inversiones GasAtacama Holding | | | | | - | | | | 18,737,737 | | | | 1,466,514 | | | | 20,204,251 | | | | - | | | | (20,204,251) | | | | - | |
|
| |
| Total | | | | | | | 1,372,320,328 | | | | 18,737,737 | | | | 19,795,562 | | | | 1,410,853,627 | | | | (79,396,925) | | | | (887,257,655) | | | | 444,199,047 | |
(*) Discontinued operations
(1) See Notes 2.4.1 and 6.
(2) See Note 5.1 a)
(3) See Note 17.f) iii)
According to the Group management’s estimates and projections, the expected future cash flows projections attributable to the Cash-Generating Units or groups of Cash-Generating Units, to which the acquired goodwill has been allocated, allow the recovery of its carrying amount as of December 31, 2015 (See Note 3.e).
The origin of the goodwill is detailed below:
a) Continuing operations
1. Ampla Energia e Serviços S.A.
On November 20, 1996, Enersis Américas S.A. and Chilectra S.A., together with Endesa S.A. and Electricidad de Portugal, acquired a controlling equity interest in Cerj S.A. (now Ampla de Energía) of Rio de Janeiro in Brazil. Enersis Américas S.A. and Chilectra S.A. together acquired 42% of the total shares in an international public bidding process held by the Brazilian government.
Enersis Américas S.A. and Chilectra S.A. also acquired an additional 18.5% on December 31, 2000, as such, holding a total 60.5% ownership interest, directly and indirectly.
2. Compañía Energética Do Ceará S.A. (Coelce)
Between 1998 and 1999, Enersis Américas S.A. and Chilectra S.A., together with Endesa S.A., acquired Compañía de Distribución Eléctrica del Estado de Ceará (Coelce) in northeast Brazil in an international public bidding process held by the Brazilian government.
3. Compañía Distribuidora y Comercializadora de Energía S.A. (Codensa S.A.)
On October 23, 1997, Enersis Américas S.A. and Chilectra S.A., together with Endesa S.A., acquired 48.5% equity interest of Colombiana Codensa S.A., a company that distributes electricity in Santa Fé de Bogotá in Colombia. The acquisition took place through an international public bidding process held by the Colombian government.
4. Hidroeléctrica el Chocón S.A.
On August 31, 1993, Endesa Chile acquired 59% equity interest of Hidroeléctrica El Chocón in an international public bidding process held by the Argentine government.
| | |
| The accompanying notes are an integral part of these consolidated financial statements | | |
|
| F-83 |
5. Empresa de Distribución Eléctrica de Lima Norte S.A.A.
On October 15, 2009 in a transaction on the Lima Stock Exchange, Enersis Américas S.A. acquired an additional 24% interest in Empresa de Distribución Eléctrica de Lima Norte S.A. (Edelnor).
6. Cachoeira Dourada S.A.
On September 5, 1997, our subsidiary Endesa Chile acquired 79% of the company Cachoeira Dourada S.A. in the state of Goias in a public bidding process held by the Brazilian government.
7. Edegel S.A.A.
On October 9, 2009, in a transaction on the Lima Stock Exchange in Peru, our subsidiary Endesa Chile acquired an additional 29.3974% equity interest in Edegel S.A.
8. Emgesa S.A. E.S.P.
On October 23, 1997, our subsidiary Endesa Chile, together with Endesa S.A., acquired 48.5% equity interest of Emgesa S.A.E.S.P. in Colombia. The acquisition was made in an international public bidding process held by the Colombian government.
b) Discontinued operations
1. Empresa Eléctrica de Colina Ltda.
On September 30, 1996, Chilectra S.A. acquired 100% interest of Empresa Eléctrica de Colina Ltda. from the investment company Saint Thomas S.A., which was neither directly nor indirectly related to Chilectra S.A.
2. Empresa Eléctrica Pangue S.A.
On July 12, 2002, Endesa Chile acquired 2.51% of the shares of Empresa Eléctrica Pangue S.A. through a put option held by the minority shareholder Internacional Finance Corporation (IFC).
On May 2, 2012, Empresa Eléctrica Pangue S.A. was merged with Compañía Eléctrica San Isidro S.A.; with the latter being the surviving entity.
3. Compañía Eléctrica San Isidro S.A.
On August 11, 2005, Endesa Chile acquired the shares of the company Inversiones Lo Venecia Ltda., whose only asset was a 25% interest in the company San Isidro S.A. (acquisition of non-controlling interests).
On September 1, 2013, Compañía Eléctrica San Isidro S.A. was merged with Endesa Eco S.A., being the latter the surviving entity.
Subsequently, on November 1, 2013, Endesa Eco S.A. was merged with Compañía Eléctrica Tarapacá, being the latter the surviving entity.
4. Chilectra S.A.
In November 2000, Enersis Américas S.A. acquired an additional 25.4% equity interest in the subsidiary Chilectra S.A. through a purchasing power of attorney in a public bidding process, obtaining a 99.99% equity interest in the company.
5. Empresa Nacional de Electricidad S.A. (Endesa Chile S.A.)
On May 11, 1999, Enersis Américas S.A. acquired an additional 35% equity interest in Endesa Chile in a public bidding process on the Santiago Stock Exchange and through the acquisition of shares in the United States of America (30% and 5%, respectively), obtaining a 60% equity interest in the generation company.
6. Inversiones GasAtacama Holding Limitada.
On April 22, 2014, Endesa Chile acquired the remaining 50% equity interest in Inversiones GasAtacama Holding Limitada from Southern Cross Latin America Private Equity Fund III L.P (see Notes 2.4.1 and 6).
| | |
| The accompanying notes are an integral part of these consolidated financial statements | | |
|
| F-84 |
| | 17. | PROPERTY, PLANT AND EQUIPMENT. |
The following table shows property, plant and equipment as of December 31, 2015 and 2014:
| | | | | | | | | | |
| Classes of Property, Plant and Equipment, Net | | | | 12-31-2015 ThCh$ | | | 12-31-2014 ThCh$ | |
| | | | | | | | | | |
| | | | | | | | | | |
| | | | | | | | | | |
| Property, Plant and Equipment, Net | | | | | 5,003,566,633 | | | | 8,234,215,719 | |
| Construction in progress | | | | | 607,250,238 | | | | 1,735,117,241 | |
| Land | | | | | 100,503,005 | | | | 106,233,186 | |
| Buildings | | | | | 71,001,964 | | | | 81,981,704 | |
| Plant and equipment | | | | | 4,055,483,055 | | | | 6,097,991,766 | |
| Fixtures and fittings | | | | | 75,919,162 | | | | 96,320,714 | |
| Other property, plant and equipment under financial lease | | | | | 93,409,209 | | | | 116,571,108 | |
| | | |
| | | | | | | | | | |
| Classes of Property, Plant and Equipment, Gross | | | | 12-31-2015 ThCh$ | | | 12-31-2014 ThCh$ | |
| | | | | | | | | | |
| | | | | | | | | | |
| | | | | | | | | | |
| Property, Plant and Equipment, Gross | | | | | 8,112,003,524 | | | | 14,301,161,988 | |
| Construction in progress | | | | | 607,250,238 | | | | 1,735,117,241 | |
| Land | | | | | 100,503,005 | | | | 106,233,186 | |
| Buildings | | | | | 124,231,301 | | | | 154,431,222 | |
| Plant and equipment | | | | | 6,986,028,809 | | | | 11,912,075,769 | |
| Fixtures and fittings | | | | | 174,119,689 | | | | 248,884,529 | |
| Other property, plant and equipment under financial lease | | | | | 119,870,482 | | | | 144,420,041 | |
| | | |
| | | | | | | | | | |
| Classes of Accumulated Depreciation and Impairment in Property, Plant and Equipment | | | | 12-31-2015 ThCh$ | | | 12-31-2014 ThCh$ | |
| | | | | | | | | | |
| | | | | | | | | | |
| | | | | | | | | | |
| Total Accumulated Depreciation and Impairment in Property, Plant and Equipment | | | | | (3,108,436,891) | | | | (6,066,946,269) | |
| Buildings | | | | | (53,229,337) | | | | (72,449,518) | |
| Plant and equipment | | | | | (2,930,545,754) | | | | (5,814,084,003) | |
| Fixtures and fittings | | | | | (98,200,527) | | | | (152,563,815) | |
| Other property, plant and equipment under financial lease | | | | | (26,461,273) | | | | (27,848,933) | |
| | |
| The accompanying notes are an integral part of these consolidated financial statements | | |
|
| F-85 |
The detail and changes in property, plant, and equipment during the years 2015 and 2014 are as follows:
| | | | | | | | | | | | | | | | | | | | | | | | | | | | |
| Changes in 2015 | | Construction in
Progress | | | Land | | | Buildings, Net | | | Plant and
Equipment, Net | | | Fixtures and
Fittings, Net | | | Other Property,
Plant and
Equipment under
Financial Lease,
Net | | | Property, Plant
and Equipment,
Net |
| | ThCh$ | | | ThCh$ | | | ThCh$ | | | ThCh$ | | | ThCh$ | | | ThCh$ | | | ThCh$ |
Opening balance as of January 1, 2015 | | | 1,735,117,241 | | | | 106,233,186 | | | | 81,981,704 | | | | 6,097,991,766 | | | | 96,320,714 | | | | 116,571,108 | | | 8,234,215,719 |
Changes | | Increases (decreases) other than from business combinations | | | 1,068,754,499 | | | | 48,234,359 | | | | (702,915) | | | | 3,400,169 | | | | 11,053,860 | | | | 1,108,095 | | | 1,131,848,067 |
| | Increase (decrease) from exchange differences, net | | | (156,856,597) | | | | (7,426,335) | | | | (11,054,890) | | | | (391,213,355) | | | | (11,521,067) | | | | 2,429,439 | | | (575,642,805) |
| | Depreciation (2) | | | - | | | | - | | | | (4,818,708) | | | | (364,968,158) | | | | (16,893,517) | | | | (6,749,401) | | | (393,429,784) |
| | Impairment (losses) reversals recognized in profit or loss | | | (2,522,445) | | | | - | | | | - | | | | 12,655,608 | | | | - | | | | - | | | 10,133,163 |
| | Increases (decreases) from transfers and other changes | | | (1,412,625,340) | | | | 21,088,932 | | | | 19,204,944 | | | | 1,367,821,944 | | | | 35,491,552 | | | | 278,467 | | | 31,260,499 |
| | Increases (decreases) from transfers | | | (1,412,281,354) | | | | 11,060,086 | | | | 14,938,905 | | | | 1,377,186,537 | | | | 12,022,038 | | | | (2,926,212) | | | - |
| | Increases (decreases) from transfers from construction in progress | | | (1,412,281,354) | | | | 11,060,086 | | | | 14,938,905 | | | | 1,377,186,537 | | | | 12,022,038 | | | | (2,926,212) | | | - |
| | Increases (decreases) from other changes | | | (343,986) | | | | 10,028,846 | | | | 4,266,039 | | | | (9,364,593) | | | | 23,469,514 | | | | 3,204,679 | | | 31,260,499 |
| | Disposals and removals from service | | | (3,410,468) | | | | (713,987) | | | | (679) | | | | (1,235,840) | | | | (278,404) | | | | (11,051) | | | (5,650,429) |
| | Disposals | | | - | | | | - | | | | - | | | | - | | | | - | | | | - | | | - |
| | Removals | | | (3,410,468) | | | | (713,987) | | | | (679) | | | | (1,235,840) | | | | (278,404) | | | | (11,051) | | | (5,650,429) |
| | Decreases to classify as held for distribution to owners (3) | | | (621,206,652) | | | | (66,913,150) | | | | (13,607,492) | | | | (2,668,969,079) | | | | (38,253,976) | | | | (20,217,448) | | | (3,429,167,797) |
| | Total changes | | | (1,127,867,003) | | | | (5,730,181) | | | | (10,979,740) | | | | (2,042,508,711) | | | | (20,401,552) | | | | (23,161,899) | | | (3,230,649,086) |
Closing balance as of December 31,2015 | | | 607,250,238 | | | | 100,503,005 | | | | 71,001,964 | | | | 4,055,483,055 | | | | 75,919,162 | | | | 93,409,209 | | | 5,003,566,633 |
|
|
| Changes in 2014 | | Construction in
Progress | | | Land | | | Buildings, Net | | | Plant and
Equipment, Net | | | Fixtures and
Fittings, Net | | | Other Property,
Plant and
Equipment under
Financial Lease,
Net | | | Property, Plant
and Equipment,
Net |
| | | | | ThCh$ | | | ThCh$ | | | ThCh$ | | | ThCh$ | | | ThCh$ | | | ThCh$ | | | ThCh$ |
Opening balance as of January 1, 2014 | | | 1,218,316,396 | | | | 99,869,574 | | | | 92,820,775 | | | | 5,834,476,720 | | | | 72,898,921 | | | | 115,416,339 | | | 7,433,798,725 |
Changes | | Increases (decreases) other than from business combinations | | | 1,026,011,114 | | | | 3,081,951 | | | | 725,802 | | | | 12,239,464 | | | | 11,023,265 | | | | - | | | 1,053,081,596 |
| | Acquisitions through business combinations (1) | | | 10,802,165 | | | | 3,216,432 | | | | - | | | | 171,934,310 | | | | 13,707,484 | | | | - | | | 199,660,391 |
| | Increase (decrease) from exchange differences, net | | | (63,451,758) | | | | (844,515) | | | | (1,120,737) | | | | (39,565,485) | | | | 981,409 | | | | 7,316,269 | | | (96,684,817) |
| | Depreciation (2) | | | - | | | | - | | | | (4,983,828) | | | | (341,810,698) | | | | (13,886,933) | | | | (6,269,994) | | | (366,951,453) |
| | Impairment (losses) reversals recognized in profit or loss | | | - | | | | - | | | | - | | | | (13,770,564) | | | | - | | | | - | | | (13,770,564) |
| | Increases (decreases) from transfers and other changes | | | (452,716,350) | | | | 1,211,017 | | | | (4,294,709) | | | | 475,028,160 | | | | 14,203,069 | | | | 108,494 | | | 33,539,681 |
| | Increases (decreases) from transfers | | | (474,284,985) | | | | 1,249,969 | | | | 4,152,489 | | | | 460,761,588 | | | | 8,816,027 | | | | (695,088) | | | - |
| | Increases (decreases) from transfers from construction in progress | | | (474,284,985) | | | | 1,249,969 | | | | 4,152,489 | | | | 460,761,588 | | | | 8,816,027 | | | | (695,088) | | | - |
| | Increases (decreases) from other changes | | | 21,568,635 | | | | (38,952) | | | | (8,447,198) | | | | 14,266,572 | | | | 5,387,042 | | | | 803,582 | | | 33,539,681 |
| | Disposals and removals from service | | | (3,844,326) | | | | (301,273) | | | | (1,165,599) | | | | (540,141) | | | | (2,606,501) | | | | - | | | (8,457,840) |
| | Disposals | | | (1,566,349) | | | | (238,120) | | | | (1,165,495) | | | | - | | | | (2,511,470) | | | | - | | | (5,481,434) |
| | Removals | | | (2,277,977) | | | | (63,153) | | | | (104) | | | | (540,141) | | | | (95,031) | | | | - | | | (2,976,406) |
| | Total changes | | | 516,800,845 | | | | 6,363,612 | | | | (10,839,071) | | | | 263,515,046 | | | | 23,421,793 | | | | 1,154,769 | | | 800,416,994 |
Closing balance as of December 31, 2014 | | | 1,735,117,241 | | | | 106,233,186 | | | | 81,981,704 | | | | 6,097,991,766 | | | | 96,320,714 | | | | 116,571,108 | | | 8,234,215,719 |
(1) See Note 2.4.1 and 6.
(2) See Note 30.
(3) See Note 5.1 a).
Additional information on property, plant and equipment, net
Major additions to property, plant and equipment are investments in operating plants and new projects amounting to ThCh$1,131,848,067 for the year ended December 31, 2015 (ThCh$1,053,081,596 for the year ended December 31, 2014). In the generation business the main investments include the construction in progress of El Quimbo hydraulic power plant in Colombia (400 MW), involving additions of ThCh$287,285,701 for the year ended December 31, 2015 (ThCh$175,419,903 as of December 31, 2014) and increased maintenance to plants of ThCh$255,844,322 (ThCh$282,263,008 for the year ended December 31, 2014). In the distribution business the major investments are in network and extensions to optimize their operation and to improve efficiency and quality levels of service, amounting to ThCh$437,227,477 for the year December 31, 2015 (ThCh$393,818,587 for the year ended December 31, 2014).
During December 31, 2015, the additions to property, plant and equipment related to continuing operations were ThCh$864,703,125. The depreciation expense of property, plant and equipment related to continuing operations were ThCh$245,598,045, ThCh$244,468,409 and ThCh$225,484,794 for the years ended December 31, 2015, 2014 and 2013, respectively. (See Note 5.1)
Capitalized borrowing costs were ThCh$75,229,894, ThCh$56,918,667, and ThCh$30,325,539 for the years ended December 31, 2015, 2014 and 2013, respectively. Of which, ThCh$73,008,564, ThCh$55,101,384, and ThCh$29,326,555 corresponds to continuing operations, respectively (See Note 33). The weighted average borrowing rate depends mainly on the geographical location and varies in a range of 9.0% to 10.8% as of December 31, 2015 (7.5% and 10.8% as of December 31, 2014).
| | |
| The accompanying notes are an integral part of these consolidated financial statements | | |
|
| F-86 |
| | b.2) | Employee expenses capitalized |
Employee expenses capitalized that are directly attibutable to constructions in progress were ThCh$77,940,280, ThCh$65,229,258 and ThCh$48,087,586 during the years ended December 31, 2015, 2014, and 2013, respectively. Of which, ThCh$56,936,227, ThCh$43,723,690 and ThCh$33,256,528 corresponds to continuing operations, respectively.
As of December 31, 2015 and 2014, property, plant and equipment includes ThCh$113,626,656, of ThCh$93,409,209 corresponding to continuing operations, in leased assets classified as finance leases (ThCh$116,571,108 as of December 31, 2014).
The present value of future lease payments derived from these finance leases is as follows:
| | | | | | | | | | | | | | | | | | | | | | | | |
| | | 12-31-2015 | | | 12-31-2014 | |
| | Gross ThCh$ | | | Interest ThCh$ | | | Present Value ThCh$ | | | Gross ThCh$ | | | Interest ThCh$ | | | Present Value ThCh$ | |
| Less than one year | | | 23,011,723 | | | | 3,343,287 | | | | 19,668,436 | | | | 19,830,764 | | | | 1,707,340 | | | | 18,123,424 | |
| From one to five years | | | 44,954,548 | | | | 5,582,380 | | | | 39,372,168 | | | | 78,271,598 | | | | 11,421,552 | | | | 66,850,046 | |
| More than five years | | | 19,822,444 | | | | 524,712 | | | | 19,297,732 | | | | 17,270,183 | | | | 459,055 | | | | 16,811,128 | |
Total | | | 87,788,715 | | | | 9,450,379 | | | | 78,338,336 | | | | 115,372,545 | | | | 13,587,947 | | | | 101,784,598 | |
Leased assets from continuing operations primarily relate to:
1. Edegel S.A.: Lease agreements to finance the project of converting the Ventanilla thermoelectric plant to a combined cycle plant. The agreements were signed between Edegel S.A.A. and financial institutions BBVA - Banco Continental, Banco de Crédito del Peru, Citibank del Peru and Banco Internacional del Peru - Interbank. These agreements have an average term of 8 years and bear interest at an annual rate of Libor + 1.75% as of December 31, 2105. The company also has an agreement with Scotiabank, which financed the construction of a new open cycle plant at the Santa Rosa Plant. This agreement has a 9-year term and bears interest an annual rate of Libor + 1.75%. The carrying amount of leased assets was ThCh$33,533,825 as of December 31, 2015 (ThCh$35,641,611 as of December 31, 2014).
Leased assets from discontinued operations primary relate to:
1. Endesa Chile S.A.: Lease agreement for Electric Transmission Lines and Installations (Ralco-Charrúa 2X220 KV) entered into with Abengoa Chile S.A. The lease agreement has a 20-year maturity and bears interest at an annual rate of 6.5%. The carrying amount of leased assets was ThCh$20,217,448 as of December 31, 2015 (ThCh$21,071,706 as of December 31, 2014)
The consolidated statements of income for the years ended December 31, 2015, 2014 and 2013 include ThCh$15,872,516, ThCh$21,087,207 and ThCh$18,878,285, respectively; of which ThCh$12,449,187, ThCh$14,352,431 and ThCh$10,835,191 correspond to continuing operations, respectively; related to the accrual during these periods of operating lease contracts for material assets in operation.
| | |
| The accompanying notes are an integral part of these consolidated financial statements | | |
|
| F-87 |
As of December 31, 2015 and 2014, the total future lease payments under those contracts are as follows:
| | | | |
| | | 12-31-2015 ThCh$ | | 12-31-2014 ThCh$ |
Less than one year | | 15,050,043 | | 13,540,619 |
From one to five years | | 21,988,822 | | 34,389,527 |
More than five years | | 8,565,963 | | 46,504,376 |
Total | | 45,604,828 | | 94,434,522 |
| | e) | Other information related to continuing operations |
i) As of December 31, 2015, the Group had contractual commitments for the acquisition of property, plant and equipment amounting to ThCh$462,845,826, of which ThCh$164,998,373 corresponds to continued operations (ThCh$468,173,548 as of December 31, 2014).
ii) As of December 31, 2015 and 2014, the Group had property, plant and equipment pledged as security for liabilities in the amount of ThCh$13,903,028 and ThCh$21,952,283, respectively, of which the entire amount corresponds to continuing operations (see Note 36).
iii) The Company and its foreign subsidiaries have insurance policies for all risks, earthquake and machinery breakdown and damages for business interruption with a €1,000 million (ThCh$774,610,000) limit in the case of generating companies and a €50 million (ThCh$38,730,500) limit for distribution companies, including business interruption coverage. Additionally, the Company has Civil Liability insurance to meet claims from third parties with a €500 million (ThCh$387,305,000) limit. The premiums associated with these policies are presented proportionally for each company under the line item “Prepaid expenses”.
iv) Our Argentine subsidiary, Empresa Distribuidora Sur S.A., has its financial equilibrium seriously affected by the delay in the compliance with certain points of the Acta de Acuerdo agreement signed with the Argentine Government, particularly the twice-yearly rate adjustments recognized through the cost-monitoring mechanism (MMC) and the establishment of an Integral Rate Review (IRT) as provided for in this agreement.
At the end of 2011, Enersis Américas recognized an impairment loss in property, plant and equipment from Empresa Distribuidora Sur S.A. As of December 31, 2015, the amount recognized is ThCh$49,848,116 (see Note 3.e).
v) In November 2010, our subsidiary Emgesa signed the contract CEQ-21 with Consortium Impregilo-Obrascon Huarte Lain (“OHL”) for construction of the principal public works of the hydroelectric project El Quimbo. As of December 31, 2015, most of the relevant works of the contract are completed, and commenced the process of analysis, review and verification of all the terms inherent in the contract, especially with regard to the final acceptance of the works, required for the initiation of the final settlement process.
As part of the referred review and analysis process, and under the general framework of the contract, the Company is also verifying compliance with a series of contractual milestones (binding on the contractor of the Consortium Impregilo - OHL), whose violation leads to the application of fines or constraints, besides the additional future issues that may arise during the final settlement of the contract.
Within these milestones under analysis, paragraph 15 of the contract section “works completion” was identified. This paragraph sets a deadline for the completion as October 15, 2015. Taking into account that as of December 31, 2015, this milestone has not been reached, this led to a delay of 77 days and to a possible discount to be applied to the contractor amounting to ThCP$ 83,849,329 (ThCh$18,906,813).
On the other hand, the contract also establishes a variation margin to the agreed amounts, so that, if the actual executed amounts are below the 85% of the estimated contract value, the Contractor will receive for administration and incidentals, the missing amount to reach the floor of 85% of the contract value. Conversely, if the actual executed amounts exceed 115% of the estimated contract value, it will be reduced by the administration and contingency by the amount exceeding this ceiling of 115% of the contract value.
| | |
| The accompanying notes are an integral part of these consolidated financial statements | | |
|
| F-88 |
Consistent with the above, the Company is analyzing the activities related to the contract, identifying significant variations in quantity of work performed (VICO in its Spanish acronym) that according to the agreement would generate a discount to be applied to the contractor amounted to ThCP$8,455,079 (ThCh$1,906,498).
Meanwhile, the Consortium Impregilo OHL presented to the Company eight claims for ThCP$147,685,420 (ThCh$33,300,929). This amount includes financial costs and estimated overruns generated by issues such as stripping, changes of materials used to fill dam and auxiliary dam, archaeological findings, achievement of skilled personnel and differences for volatility of the exchange rate. The Company, based on the technical and legal analysis performed on each of the claims considers that they are not applicable because these conditions are not specified in the scope of the contract.
Additionally, the contractor submitted notifications of the change of the orders (“NOC” in its Spanish acronym) for ThCP$ 28,522,475 (ThCh$6,431,406). As a result of the preliminary analysis of these notifications, the Company recognized ThCP$ 8,425,765 (ThCh$1,899,888) in the financial statements. The remained amounts for ThCP$11,945,357 (ThCh$2,693,505) were rejected for the reason that they correspond to costs that are not the responsibility of the Company.
| | f) | Other information related to discontinued operations |
i) The condition of certain assets of our subsidiary Endesa Chile changed, primarily works and infrastructure for facilities built to support power generation in the SIC grid in 1998, due primarily to the installation in the SIC of new thermoelectric plants, the arrival of LNG, and new other projects. As such, a new supply configuration for the upcoming years, in which it is expected that these facilities will not be used. Therefore, in 2009, the Company recognized an impairment loss of ThCh$43,999,600 for these assets, which is still has not reversed.
ii) On October 16, 2012, Endesa Chile began the collection process on all of the bank performance bonds guaranteeing compliance with the works and correct, timely execution of these works as specified in the agreement “Bocamina Thermal Plant Expansion Project”, contract ACP-003.06. This is a turnkey project for a 350 MW coal-fired thermal generation plant (“the contract”) signed on July 25, 2007 between Empresa Nacional de Electricidad S.A. (“the owner”) and the consortium consisting of (i) the Chilean company Ingeniería y Construcción Tecnimont Chile y Compañía Limitada; (ii) the Italian company Tecnimont SpA; (iii) the Brazilian company Tecnimont do Brasil Construcao e Administracao de Projetos Ltda; (iv) the Slovakian company Slovenske Energeticke Strojarne a.s. (“SES”); and (v) the Chilean company Ingeniería y Construcción SES Chile Limitada; (all referred to collectively as “the Contractor” or “the Consortium”).
These performance bonds amounted to US$74,795,164.44 (ThCh$53,116,534) and UF 796,594.29 (approximately US$38,200,000, ThCh$27,128,112). As of December 31, 2012, it was collected US$93,992,554 (ThCh$66,749,752) of these bonds. Collection made on these bank performance bonds reduced the capitalized cost overruns incurred by the company due to breach of contract.
On October 17, 2012, Endesa Chile filed an arbitration request with the International Chamber of Arbitration of Paris in order to enforce the rights conferred upon it under the Contract. On December 29, 2014, Endesa’s Board of Directors accepted and approved an agreement with the Consortium that finalizes the arbitration process and grants full reciprocal settlement of the obligations. Consequently, as a result of final agreement reached at the end of 2014, Endesa Chile’s acquisition costs of the plant increased by US$125 million (ThCh$75,843,750 approximately) which were recognized as part of the acquisition cost of property, plant and equipment. The payment of these costs was made on April 6, 2015.
iii) At the end of 2012, our subsidiary Compañía Eléctrica Tarapacá S.A., whose assets and liabilities as of December 31, 2015, have been classified as disposal group held for distribution to owners, recognized an impairment loss of ThCh$12,578,098, to adjust the carrying amount of certain specific assets operating in the SING grid to its recoverable amount.
At the closing of 2015, certain regulatory developments to the Chilean energy industry were approved, which after being evaluated by the Company, resulted in the identification of a new single CGU for all generation assets in Chile. The analysis takes into account the fact that Endesa Chile, a discontinued operation as of December 31, 2015, performs an optimization and management of all its assets related to its generation business, it has a centralized trade policy, with sales contracts agreed at company level and not assigned to power plants. Therefore, generation of cash flows depends on all the assets as a whole.
| | |
| The accompanying notes are an integral part of these consolidated financial statements | | |
|
| F-89 |
Previously, the company identified a CGU for the assets operating in the SIC grid and another one for the assets operating in the SING, under the consideration that there were two separate markets. The new scheme, approved in 2015, posed by the interconnection of SIC and SING, unifies markets and considers a single determination of prices, which was illustrated by latest bids for energy supply to regulated customers.
Therefore, these new conditions indicated that the recognized impairment loss mentioned above has been reversed. This was based, inter alia, on the generation of additional value by the interconnection project between the SIC and SING which is expected to be operational in 2019, by improved utilization of reserves, by expanding the potential market for specific impaired assets and decreasing overall risk of the portfolio. The effects of the interconnection are considered in the five-year projections used by the company to perform impairment tests (see Note 3.e).
| | |
| The accompanying notes are an integral part of these consolidated financial statements | | |
|
| F-90 |
iv) At the end of 2014, our subsidiary Endesa Chile S.A. recognized an impairment loss of ThCh$12,581,947 related to the Punta Alcalde project. This impairment loss was triggered because the current definition of the project is not fully aligned with the strategy that the Company is reformulating, particularly, with regard to technological leadership, and to community and environmental sustainability. Endesa Chile has decided to suspend the project pending clarification of its profitability (see Note 3.e).
v) In line with its sustainability strategy and in order to develop community relationships, Endesa Chile has decided to research new design alternatives for the Neltume project, in particular regarding the issue of the discharge of Lake Neltume, which has been raised by the communities in the various instances of dialogue.
To start a new phase of research of an alternative project, which includes the discharge of water on the Fuy River in late December 2015, the Company withdrew the Environmental Impact Study. This decision applies only to the portion of the Neltume project related to the power plant and not to portion related to the transmission project, which continues its course on handling in the Environmental Assessment Service.
As a result of the above, as of December 31, 2015, Endesa Chile recognized a loss of ThCh$2,706,830, associated with the write down of certain assets related to Environmental Impact Study, which has been withdrawn and to other studies directly linked to the old design of assets.
vi) As of December 31, 2015, Endesa Chile recognized an impairment loss of ThCh$2,522,445 related to the wind project Waiwen. This loss was a result of the new assessment of the feasibility of the project performed by the Company and a conclusion that, under existing conditions to date, its profitability is uncertain.
| | |
| The accompanying notes are an integral part of these consolidated financial statements | | |
|
| F-91 |
The detail and changes in investment property during the years 2015 and 2014 are as follows:
| | | | | | | | | | | | |
| | | | | Investment Properties,
Gross | | | Accumulated
Depreciation,
Amortization and
Impairment | | | Investment
Properties, Net |
| Investment Properties | | | | ThCh$ | | | ThCh$ | | | ThCh$ |
| | | | | | | | | | | | |
| | | | | | | | | | | | |
| | | | | | | | | | | | |
Balance as of January 1, 2014 | | | | | 47,047,605 | | | | (2,170,556) | | | 44,877,049 |
Additions | | | | | 1,463,242 | | | | - | | | 1,463,242 |
Disposals of land | | | | | (1,806,675) | | | | - | | | (1,806,675) |
Disposals related to the sale of subsidiaries (1) | | | | | (36,040,698) | | | | - | | | (36,040,698) |
Depreciation expense | | | | | - | | | | (30,483) | | | (30,483) |
Impairment losses recognized in income statement | | | | | - | | | | 52,127 | | | 52,127 |
Balance as of December 31, 2014 | | | | | 10,663,474 | | | | (2,148,912) | | | 8,514,562 |
Disposals | | | | | (1,724,811) | | | | 1,387,042 | | | (337,769) |
Depreciation expense | | | | | - | | | | (25,806) | | | (25,806) |
Transfer to assets held for distribution to owners (2) | | | | | (8,938,663) | | | | 787,676 | | | (8,150,987) |
Balance as of December 31, 2015 | | | | | - | | | | - | | | - |
The selling prices of investment properties disposed of during the years ended December 31, 2015, 2014 and 2013 were ThCh$1,800,933, ThCh$9,363,249, and ThCh$16,510,931, respectively.
-Fair value measurement and hierarchy
The fair value of the Group’s investment properties as of December 31, 2015 was ThCh$11,113,107, which was determined using independent appraisals.
As of December 31, 2015, the fair value of these properties has not changed significantly.
The hierarchy of these investment properties’ fair value is as follows:
| | | | | | | | | | | | |
| | | Fair value measured at the end of the reporting period using: | |
| | | Level 1 ThCh$ | | | Level 2 ThCh$ | | | Level 3 ThCh$ | |
Investment Properties | | | - | | | | - | | | | 11,113,107 | |
| | | |
See Note 3.h. | | | | | | | | | | | | |
For the years ended December 31, 2015, 2014 and 2013, the detail of income and expenses from investment properties classified as discontinued operations is as follows:
| | | | | | | | |
| | | Balance at |
| | | 12-31-2015 | | | 12-31-2014 | | 12-31-2013 |
| Income and expense from investment properties | | ThCh$ | | | ThCh$ | | ThCh$ |
Rental income from investment properties | | | 163,660 | | | 263,643 | | 341,494 |
Revenue from the sale of investment properties | | | 1,800,933 | | | 9,363,249 | | 16,510,931 |
Direct operating expense from investment properties generating rental income | | | (163,767) | | | (328,590) | | (192,963) |
Direct operating expense from investment properties not generating rental income | | | (337,770) | | | (1,806,675) | | (4,315,400) |
Total (*) | | | 1,463,056 | | | 7,491,627 | | 12,344,062 |
The Company has not entered into any repair, maintenance, acquisition, construction or development agreements that might represent future obligations as of December 31, 2015 and 2014.
| | |
| The accompanying notes are an integral part of these consolidated financial statements | | |
|
| F-92 |
The Group has insurance policies to cover operational risks of its investment properties, as well as to cover legal claims against the Group that could potentially arise from exercising its business activity. The Group’s management considers that the insurance policy coverage is sufficient against the risks involved.
| | |
| The accompanying notes are an integral part of these consolidated financial statements | | |
|
| F-93 |
19. DEFERRED TAXES.
a. The origin and changes in deferred tax assets and liabilities as of December 31, 2015 and 2014, are as follows:
| | | | | | | | | | | | | | | | | | | | | | | | | | | | | | | | |
| Deferred Tax Assets | | Deferred Tax Assets Relating to | | | Deferred
Tax Assets |
| | Accumulated Depreciation | | | Amortization | | | Provisions | | | Post- Employment Benefit Obligations | | | Revaluation of Financial Instruments | | | Tax Loss Carry forwards | | | Other | | |
Balance as of January 1, 2015 | | | 63,763,279 | | | | 1,506,979 | | | | 86,266,322 | | | | 3,103,317 | | | | 21,132,561 | | | | 4,851,839 | | | | 13,013,577 | | | 193,637,874 |
Changes | | Increase (decrease) in profit or loss | | | (1,969,882) | | | | (620,212) | | | | 25,701,841 | | | | 33,790,833 | | | | (4,316,990) | | | | 7,868,629 | | | | (42,100,049) | | | 18,354,170 |
| | Increase (decrease) in other comprehensive income | | | - | | | | - | | | | - | | | | 6,338,161 | | | | 806,915 | | | | - | | | | - | | | 7,145,076 |
| | Foreign currency translation | | | (7,116,721) | | | | (1,860,738) | | | | (5,404,662) | | | | (9,206,928) | | | | (339,940) | | | | - | | | | (863,778) | | | (24,792,767) |
| | Transfers to (from) non-current assets and disposal groups held for distribution to owners (2) | | | (4,982,473) | | | | - | | | | (2,687,490) | | | | (422,929) | | | | - | | | | (12,720,468) | | | | (1,503,949) | | | (22,317,309) |
| | Other increases (decreases) | | | (24,516,409) | | | | 6,607,405 | | | | (76,462,306) | | | | 401,995 | | | | (1,547,792) | | | | - | | | | 32,815,086 | | | (62,702,021) |
Balance as of December 31, 2015 | | | 25,177,794 | | | | 5,633,434 | | | | 27,413,705 | | | | 34,004,449 | | | | 15,734,754 | | | | - | | | | 1,360,887 | | | 109,325,023 |
| | | | | | | | | | | | | | | | | | | | | | | | | | | | | | |
|
| Deferred Tax Assets | | Deferred Tax Assets Relating to | | | Deferred
Tax Assets |
| | Accumulated Depreciation | | | Amortization | | | Provisions | | | Post-
Employment
Benefit
Obligations | | | Revaluation
of Financial
Instruments | | | Tax Loss Carry forwards | | | Other | | |
Balance as of January 1, 2014 | | | 69,331,028 | | | | - | | | | 72,196,398 | | | | 721,942 | | | | 43,659,516 | | | | 1,710,288 | | | | 22,518,595 | | | 210,137,767 |
Changes | | Increase (decrease) in profit or loss | | | (1,087,397) | | | | (367,726) | | | | 9,701,687 | | | | (11,108,544) | | | | (23,596,596) | | | | 6,297,437 | | | | 13,170,614 | | | (6,990,525) |
| | Increase (decrease) in other comprehensive income | | | - | | | | - | | | | - | | | | 10,357,383 | | | | 1,074,342 | | | | - | | | | (1,084) | | | 11,430,641 |
| | Acquisitions through business combinations under common control (1) | | | - | | | | - | | | | 879,716 | | | | - | | | | - | | | | 537,932 | | | | 974,883 | | | 2,392,531 |
| | Disinvestment through selling businesses | | | (107,241) | | | | - | | | | (34,403) | | | | - | | | | - | | | | (329,845) | | | | (5,816,292) | | | (6,287,781) |
| | Foreign currency translation | | | (1,847,234) | | | | (551,562) | | | | 1,904,394 | | | | (1,086,184) | | | | (110,140) | | | | - | | | | (2,055,603) | | | (3,746,329) |
| | Transfers to (from) non-current assets and disposal groups held for sale | | | - | | | | - | | | | (29,583) | | | | (1,761) | | | | - | | | | (1,448,281) | | | | (1,142,270) | | | (2,621,895) |
| | Other increases (decreases) | | | (2,525,877) | | | | 2,426,267 | | | | 1,648,113 | | | | 4,220,481 | | | | 105,439 | | | | (1,915,692) | | | | (14,635,266) | | | (10,676,535) |
Balance as of December 31, 2014 | | | 63,763,279 | | | | 1,506,979 | | | | 86,266,322 | | | | 3,103,317 | | | | 21,132,561 | | | | 4,851,839 | | | | 13,013,577 | | | 193,637,874 |
| | | | | | | | | | | | | | | | | | | | | | | | | | | | | | | | |
| Deferred Tax Liabilities | | Deferred Tax Liabilities Relating to | | | Deferred
Tax
Liabilities |
| | Accumulated Depreciation | | | Amortization | | | Provisions | | | Foreign
Currency
Contracts | | | Post-
Employment
Benefit
Obligations | | | Revaluation
of Financial
Instruments | | | Other | | |
Balance as of January 1, 2015 | | | 427,881,352 | | | | - | | | | 41,553 | | | | - | | | | 16,499 | | | | 163,063 | | | | 50,259,017 | | | 478,361,484 |
Changes | | Increase (decrease) in profit or loss | | | 26,238,797 | | | | (712,025) | | | | 13,122,113 | | | | - | | | | 488,257 | | | | - | | | | 37,625,257 | | | 76,762,399 |
| | Increase (decrease) in other comprehensive income | | | - | | | | - | | | | - | | | | - | | | | (64,398) | | | | 147,605 | | | | (200,133) | | | (116,926) |
| | Foreign currency translation | | | 4,395,448 | | | | - | | | | (1) | | | | - | | | | 65,061 | | | | 5,424 | | | | (18,128,150) | | | (13,662,218) |
| | Transfers to (from) non-current assets and disposal groups held for distribution to owners (2) | | | (233,948,342) | | | | - | | | | (285,255) | | | | - | | | | (679) | | | | - | | | | (792,049) | | | (235,026,325) |
| | Other increases (decreases) | | | (53,222,278) | | | | 712,025 | | | | (12,861,646) | | | | - | | | | (504,503) | | | | (66,322) | | | | (8,471,075) | | | (74,413,799) |
Balance as of December 31, 2015 | | | 171,344,977 | | | | - | | | | 16,764 | | | | - | | | | 237 | | | | 249,770 | | | | 60,292,867 | | | 231,904,615 |
| | | | | | | | | | | | | | | | | | | | | | | | | | | | | | |
| | | | | | | | | | | | | | | | | | | | | | | | | | | | | | |
| Deferred Tax Liabilities | | Deferred Tax Liabilities Relating to | | | Deferred
Tax
Liabilities |
| | Accumulated Depreciation | | | Amortization | | | Provisions | | | Foreign
Currency
Contracts | | | Post-
Employment
Benefit
Obligations | | | Revaluation
of Financial
Instruments | | | Other | | |
Balance as of January 1, 2014 | | | 357,404,910 | | | | 21,169,697 | | | | 20,220 | | | | - | | | | 20,818 | | | | 5,792,725 | | | | 11,078,520 | | | 395,486,890 |
Changes | | Increase (decrease) in profit or loss | | | 38,692,347 | | | | (1,281,408) | | | | (24,553,240) | | | | - | | | | (457,558) | | | | (4,490,773) | | | | 39,378,605 | | | 47,287,973 |
| | Increase (decrease) in other comprehensive income | | | - | | | | - | | | | - | | | | - | | | | (20,511) | | | | 401,237 | | | | 378 | | | 381,104 |
| | Acquisitions through business combinations (1) | | | 27,088,856 | | | | - | | | | - | | | | - | | | | - | | | | - | | | | 1,834,311 | | | 28,923,167 |
| | Disinvestment through selling businesses | | | - | | | | - | | | | - | | | | - | | | | - | | | | - | | | | - | | | - |
| | Foreign currency translation | | | 18,935,850 | | | | 1,906,194 | | | | (307,279) | | | | - | | | | - | | | | 141,446 | | | | (2,472,330) | | | 18,203,881 |
| | Transfers to (from) non-current assets and disposal groups held for sale | | | - | | | | - | | | | - | | | | - | | | | - | | | | - | | | | - | | | - |
| | Other increases (decreases) | | | (14,240,611) | | | | (21,794,483) | | | | 24,881,852 | | | | - | | | | 473,750 | | | | (1,681,572) | | | | 439,533 | | | (11,921,531) |
Balance as of December 31, 2014 | | | 427,881,352 | | | | - | | | | 41,553 | | | | - | | | | 16,499 | | | | 163,063 | | | | 50,259,017 | | | 478,361,484 |
| | (1) | | See Note 2.4.1 and 6. |
Recovery of deferred tax assets will depend on whether sufficient tax profits are obtained in the future. The Company’s management believes that the future profit projections for its subsidiaries will allow these assets to be recovered.
b. As of December 31, 2015, the Group has not recognized deferred tax assets related to tax losses carry forward for ThCh$20,342,024 (ThCh$42,776,327 as of December 31, 2014). See Note 3.p.
The Group has not recognized deferred tax liabilities for taxable temporary differences relating to investment in subsidiaries and joint ventures, as it is able to control the timing of the reversal of the temporary differences and considers that it is probable that such temporary differences will not reverse in the foreseeable future. As of December 31, 2015, the aggregate amount of taxable temporary differences relating to investments in subsidiaries and joint ventures for which deferred tax
| | |
| The accompanying notes are an integral part of these consolidated financial statements | | |
|
| F-94 |
liabilities have not been recognized were ThCh$1,835,600,705, of which ThCh$979,972,151 corresponds to continuing operations (ThCh$1,940,029,172 as of December 31, 2014). On the other hand, the total amount of deductible temporary differences relating to investments in subsidiaries and joint ventures for which as of December 31, 2015 it is probable that will not reverse in the foreseeable future or there will be not sufficient taxable profits in the future to recover such temporary differences were ThCh$3,162,552,465, of which ThCh$2,700,619,169 corresponds to continuing operations (ThCh$3,451,816,581 as of December 31, 2014).
Additionally, the Group has not recognized deferred tax assets for deductible temporary differences which as of December 31, 2015 totaled ThCh$57,311,886 (ThCh$79,702,961 as of December 31, 2014), as it is not probable that sufficient future taxable profits exist to recover such temporary differences.
The Group companies are potentially subject to income tax audits by the tax authorities of each country in which the Group operates. Such tax audits are limited to a number of annual tax periods and once these have expired audits of these periods can no longer be performed. Tax audits by nature are often complex and can require several years to complete. The following table presents a summary of tax years potentially subject to examination:
| | |
| Country | | Period |
| Chile | | 2012-2014 |
| Argentina | | 2008-2014 |
| Brazil | | 2009-2014 |
| Colombia | | 2013-2014 |
| Peru | | 2010-2014 |
Given the range of possible interpretations of tax standards, the results of any future inspections carried out by tax authorities for the years subject to audit can give rise to tax liabilities that cannot currently be quantified objectively. Nevertheless, Enersis Américas Management estimates that the liabilities, if any, that may arise from such audits, would not significantly impact the Group companies’ future results.
The effects of deferred taxes on the components of other comprehensive income attributable to both controlling and non-controlling interests for the years ended December 31, 2015, 2014 and 2013, are as follows:
| | | | | | | | | | | | | | | | | | | | | | | | | | | | |
Effects of Deferred Tax on the Components of Other Comprehensive Income | | 12-31-2015 (*) | | | 12-31-2014 | | 12-31-2013 |
| | Amount Before Tax ThCh$ | | | Income Tax Expense (Benefit) ThCh$ | | | Amount After Tax ThCh$ | | | Amount Before Tax ThCh$ | | | Income Tax Expense (Benefit) ThCh$ | | | Amount After Tax ThCh$ | | Amount Before Tax ThCh$ | | Income Tax Expense (Benefit) ThCh$ | | Amount After Tax ThCh$ |
| | | | | | | | | | | | | | | | | | | | | | | | | | | | |
| | | | | | | | | | | | | | | | | | | | | | | | | | | | |
| | | | | | | | | | | | | | | | | | | | | | | | | | | | |
| Available-for-sale financial assets | | | (442,864 | ) | | | (291 | ) | | | (443,155 | ) | | | 1,849 | | | | (1,462 | ) | | 387 | | (2,273) | | 455 | | (1,818) |
| Cash flow hedge | | | (138,241,392 | ) | | | 36,399,000 | | | | (101,842,392 | ) | | | (145,892,370 | ) | | | 35,887,996 | | | (110,004,374) | | (76,088,977) | | 12,332,516 | | (63,756,461) |
| Share of other comprehensive income in associates and joint ventures accounted for using the equity method | | | (552,420 | ) | | | - | | | | (552,420 | ) | | | 13,476,871 | | | | - | | | 13,476,871 | | 8,367,223 | | - | | 8,367,223 |
| Foreign currency translation | | | (644,537,672 | ) | | | - | | | | (644,537,672 | ) | | | 4,370,648 | | | | - | | | 4,370,648 | | (76,723,893) | | - | | (76,723,893) |
| Gains (losses) from defined benefit pension plans | | | (19,027,368 | ) | | | 6,018,363 | | | | (13,009,005 | ) | | | (36,681,734 | ) | | | 12,694,514 | | | (23,987,220) | | 6,351,518 | | (2,603,231) | | 3,748,287 |
| | | | | | | | | | | | | | | | | | | | | | | | | | | | |
| | | | | | | | | | | | | | | | | | | | | | | | | | | | |
| | | | | | | | | | | | | | | | | | | | | | | | | | | | |
| Components of other comprehensive income | | | (802,801,716 | ) | | | 42,417,072 | | | | (760,384,644 | ) | | | (164,724,736 | ) | | | 48,581,048 | | | (116,143,688) | | (138,096,402) | | 9,729,740 | | (128,366,662 |
(*) See Note 5.1.II.iii for information of components of other comprehensive income related to discontinued operations.
c. In Chile, Law No. 20,780 was published in the Official Gazette on September 29, 2014. It changes the income tax system and other taxes, by replacing the current tax system in 2017 with two alternative tax systems: the attributed income system and partially integrated system.
This Law gradually increases the rate of income tax on corporate income. Thus, it will increase to 21% in 2014, to 22.5% in 2015 and to 24% in 2016. As from 2017 taxpayers choosing the attributed income system will be subject to a rate of 25%, while companies choosing the partially integrated system will be subject to a rate of 25.5% in 2017 and 27% in 2018.
Furthermore, this Law establishes that the partially integrated system will apply by default to open stock companies, unless a future Extraordinary Shareholders’ Meeting agrees to adopt the attributed income system.
As discussed in Note 3.p), and as Enersis Américas assumed that, since an Extraordinary Shareholders’ Meeting had not agreed to adopt the alternative system, the partially integrated system applies by default. The changes in deferred tax assets and liabilities as a direct effect of the increase in the corporate income tax rate were recognized directly in net income. Particularly, for the year ended December 31, 2014, the net charge against net income was ThCh$62,035,245, decreasing net income attributable to shareholders of Enersis Américas in ThCh$38,284,524.
| | |
| The accompanying notes are an integral part of these consolidated financial statements | | |
|
| F-95 |
d. In Colombia, Law 1,739 enacted in 2014, increased from 8% to 9% indefinitely the rate for the specific income tax for financing social programs known as CREE, levied on taxable profits earned each year for the tax year 2016 onwards.
Additionally, this Law established the CREE surcharge of 5%, 6%, 8% and 9% for 2015, 2016, 2017 and 2018, respectively.
The effect of temporary differences involving the payment of less or more income tax in the current year is recognized as a deferred tax credit or debit, as appropriate, at the applicable tax rates in effect when the differences are reversed (39% in 2015, 40% in 2016, 42% in 2017, 43% in 2018 and 34% from 2019), provided there is a reasonable expectation that such differences will reverse in the future and that the asset will generate sufficient taxable income.
As part of this increase in tax rates, the Colombian subsidiaries have recognized changes in deferred tax assets and liabilities as of December 31, 2014. The net effect was the recognition of a gain for ThCh$3,943,235.
e. In Peru, the corporate income tax rate is 30% on taxable income, after deducting the employees profit share of 5% of taxable income, as of December 31, 2015 and 2014.
Law No. 30296 established that the applicable corporate income tax rate on taxable income, after deducting the employees profit share will be: 28% in 2015 and 2016, 27% in 2017 and 2018, and 26% from 2019 onwards.
As part of this increase in tax rates, the Peruvian subsidiaries have recognized changes in deferred tax assets and liabilities as of December 31, 2014. The net effect was the recognition of a gain for ThCh$24,818,773.
| | |
| The accompanying notes are an integral part of these consolidated financial statements | | |
|
| F-96 |
20. OTHER FINANCIAL LIABILITIES.
The balance of other financial liabilities as of December 31, 2015 and 2014, is as follows:
| | | | | | | | | | | | | | | | | | | | |
| Other Financial Liabilities | | 12-31-2015 | | | 12-31-2014 | |
| | Current ThCh$ | | | Non-current
ThCh$ | | | Current
ThCh$ | | | Non-current
ThCh$ | |
| | | | | | | | | | | | | | | | | | | | |
Interest-bearing borrowings | | | | | | | 617,276,453 | | | | 1,846,995,721 | | | | 418,266,381 | | | | 3,167,948,954 | |
Hedging derivatives (*) | | | | | | | 69,545,029 | | | | 300,871 | | | | 995,059 | | | | 114,861,592 | |
Non-hedging derivatives (**) | | | | | | | 1,052,026 | | | | - | | | | 2,544,239 | | | | 6,286,982 | |
| | | | | | | | | | | | | | | | | | | | |
| | | | Total | | | 687,873,508 | | | | 1,847,296,592 | | | | 421,805,679 | | | | 3,289,097,528 | |
20.1 Interest-bearing borrowings
The detail of current and non-current interest-bearing borrowings as of December 31, 2015 and 2014, is as follows:
| | | | | | | | | | | | | | | | | | | | |
| Classes of Interest-bearing borrowings | | 12-31-2015 | | | 12-31-2014 | |
| | Current ThCh$ | | | Non-current ThCh$ | | | Current ThCh$ | | | Non-current ThCh$ | |
| | | | | | | | | | | | | | | | | | | | |
Bank loans | | | | | | | 188,121,545 | | | | 232,626,020 | | | | 42,325,846 | | | | 247,216,989 | |
Unsecured obligations | | | | | | | 356,221,587 | | | | 1,391,715,407 | | | | 308,925,119 | | | | 2,565,417,993 | |
Financial leases | | | | | | | 19,668,436 | | | | 58,669,900 | | | | 18,123,424 | | | | 83,661,174 | |
Other obligations | | | | | | | 53,264,885 | | | | 163,984,394 | | | | 48,891,992 | | | | 271,652,798 | |
| | | | | | | | | | | | | | | | | | | | |
| | | | Total | | | 617,276,453 | | | | 1,846,995,721 | | | | 418,266,381 | | | | 3,167,948,954 | |
Bank loans by currency and contractual maturity as of December 31, 2015 and 2014, are as follows:
- Summary of bank loans by currency and maturity
| | | | | | | | | | | | | | | | | | | | | | | | | | | | | | | | | | | | | | | | | | | | |
Country | | | | Currency | | Nominal
Interest
Rate | | | Secured/ Unsecured | | Current | | | Non-current |
| | | | | | | Maturity | | | Total Current at
12/31/2015 ThCh$ | | | Maturity | | | Total Non-
current at
12/31/2015 |
| | | | | | | One to three
months ThCh$ | | | Three to
twelve
months ThCh$ | | | | One to two
years ThCh$ | | | Two to
three years ThCh$ | | | Three to
four years ThCh$ | | | Four to five
years ThCh$ | | | Over five
years ThCh$ | | |
| | | | | | | | | | | | | | | | | | | ThCh$ |
| | | | | | | | | | | | | | | | | | | | | | | | | | | | | | | | | | | | | | | | | | | | | |
| Peru | | | | US$ | | | 2.40% | | | Unsecured | | | 26,650,675 | | | | 2,833,429 | | | | 29,484,104 | | | | 3,777,906 | | | | 19,247,361 | | | | 299,442 | | | | - | | | | - | | | 23,324,709 |
| Peru | | | | Peruvian nuevo sol | | | 5.20% | | | Unsecured | | | 12,712,792 | | | | - | | | | 12,712,792 | | | | 2,083,721 | | | | 22,920,929 | | | | - | | | | - | | | | - | | | 25,004,650 |
| Argentina | | | | US$ | | | 13.13% | | | Unsecured | | | 3,899,595 | | | | - | | | | 3,899,595 | | | | - | | | | - | | | | - | | | | - | | | | - | | | - |
| Argentina | | | | Ar$ | | | 37.06% | | | Unsecured | | | 2,693,226 | | | | 4,809,318 | | | | 7,502,544 | | | | 1,080,762 | | | | - | | | | - | | | | - | | | | - | | | 1,080,762 |
| Colombia | | | | CP | | | 6.46% | | | Unsecured | | | 32,928,994 | | | | 76,448,340 | | | | 109,377,334 | | | | 29,066,078 | | | | - | | | | - | | | | - | | | | 63,647,258 | | | 92,713,336 |
| Brazil | | | | Real | | | 14.53% | | | Unsecured | | | 9,045,598 | | | | 16,099,578 | | | | 25,145,176 | | | | 30,167,521 | | | | 30,167,521 | | | | 30,167,521 | | | | - | | | | - | | | 90,502,563 |
| | | | | | | | | | | | | | | | | | | | | | | | | | | | | | | | | | | | | | | | | | | | |
| | | | | | | | | | Total | | | 87,930,880 | | | | 100,190,665 | | | | 188,121,545 | | | | 66,175,988 | | | | 72,335,811 | | | | 30,466,963 | | | | - | | | | 63,647,258 | | | 232,626,020 |
| | | | | | | | | | | | | | | | | | | | | | | | | | | | | | | | | | | | | | | | | | | | |
Country | | | | Currency | | Nominal
Interest Rate | | | Secured/
Unsecured | | Current | | | Non-current |
| | | | | | | Maturity | | | Total
Current at
12/31/2014 | | | Maturity | | | Total Non-
current at
12/31/2014 |
| | | | | | | One to three
months | | | Three to
twelve
months | | | | One to two
years | | | Two to
three years | | | Three to
four years | | | Four to five
years | | | Over five
years | | |
| | | | | | | | | | | ThCh$ | | | ThCh$ | | | ThCh$ | | | ThCh$ | | | ThCh$ | | | ThCh$ | | | ThCh$ | | | ThCh$ | | | ThCh$ |
| | | | | | | | | | | | | | | | | | | | | | | | | | | | | | | | | | | | | | | | | | | | |
| Chile | | | | US$ | | | 5.98% | | | Unsecured | | | - | | | | 1,007,362 | | | | 1,007,362 | | | | - | | | | - | | | | - | | | | - | | | | - | | | - |
| Chile | | | | Ch$ | | | 5.47% | | | Unsecured | | | 1,594 | | | | - | | | | 1,594 | | | | - | | | | - | | | | - | | | | - | | | | - | | | - |
| Peru | | | | US$ | | | 2.93% | | | Unsecured | | | 2,472,247 | | | | 8,382,913 | | | | 10,855,160 | | | | 38,628,554 | | | | 17,850,471 | | | | 16,254,959 | | | | 255,432 | | | | - | | | 72,989,416 |
| Peru | | | | Peruvian nuevo sol | | | 5.41% | | | Unsecured | | | 175,487 | | | | - | | | | 175,487 | | | | - | | | | 2,029,640 | | | | 22,326,036 | | | | - | | | | - | | | 24,355,676 |
| Argentina | | | | US$ | | | 13.03% | | | Unsecured | | | 11,451,387 | | | | 2,126,669 | | | | 13,578,056 | | | | 1,022,595 | | | | - | | | | - | | | | - | | | | - | | | 1,022,595 |
| Argentina | | | | Ar$ | | | 33.25% | | | Unsecured | | | 4,304,802 | | | | 11,794,567 | | | | 16,099,369 | | | | 6,999,683 | | | | - | | | | - | | | | - | | | | - | | | 6,999,683 |
| Colombia | | | | CP | | | 8.13% | | | Unsecured | | | - | | | | 209,395 | | | | 209,395 | | | | - | | | | - | | | | - | | | | - | | | | 77,750,800 | | | 77,750,800 |
| Brazil | | | | Real | | | 10.30% | | | Unsecured | | | 9,358 | | | | 390,065 | | | | 399,423 | | | | - | | | | 21,366,273 | | | | 21,366,273 | | | | 21,366,273 | | | | - | | | 64,098,819 |
| | | | | | | | | | | | | | | | | | | | | | | | | | | | | | | | | | | | | | | | | | | | |
| | | | | | | | | | Total | | | 18,414,875 | | | | 23,910,971 | | | | 42,325,846 | | | | 46,650,832 | | | | 41,246,384 | | | | 59,947,268 | | | | 21,621,705 | | | | 77,750,800 | | | 247,216,989 |
-Fair value measurement and hierarchy
The fair value of current and non-current bank borrowings as of December 31, 2015 was ThCh$423,123,934 (ThCh$378,488,796 as of December 31, 2014). The borrowings have been classified as Level 2 fair value measurement based on the entry data used in the valuation techniques used (see Note 3.h).
| | |
| The accompanying notes are an integral part of these consolidated financial statements | | |
|
| F-97 |
- Identification of bank borrowings by company
| | | | | | | | | | | | | | | | | | | | | | | | | | | | | | | | | | | | | | | | | | | | | | | | | | | | | | | | | | | | | | | | | | | | | | | | | | | | | | | | | | | | | | | | | | |
Taxpayer ID No. (RUT) | | Company | | Country | | Taxpayer ID No. (RUT) | | Financial Institution | | Country | | | Currency | | Effective Interest Rate | | Nominal Interest Rate | | Amortization | | December 31, 2015 | | December 31, 2014 | |
| | | | | | | | | | | Current ThCh$ | | | Non-current ThCh$ | | Current ThCh$ | | | Non-current ThCh$ | | | | |
| | | | | | | | | | | Less than 90 days | | | More than 90 days | | | Total Current | | | One to two years | | | Two to three years | | | Three to four years | | | Four to five years | | | Over five years | | | Total Non- current | | Less than 90 days | | | More than 90 days | | | Total Current | | | One to two years | | | Two to three years | | | Three to four years | | | Four to five years | | | Over five years | | | Total Non- current | |
| Foreign | | Ampla Energía S.A. | | Brazil | | Foreign | | Banco do Brasil | | | Brazil | | | Real | | 13.58% | | 13.71% | | At maturity | | | - | | | | 400,960 | | | | 400,960 | | | | 7,765,896 | | | | 7,765,896 | | | | 7,765,896 | | | | - | | | | - | | | 23,297,688 | | | - | | | | 390,065 | | | | 390,065 | | | | - | | | | 9,920,055 | | | | 9,920,055 | | | | 9,920,055 | | | | - | | | | 29,760,165 | |
| 96.800.570-7 | | Chilectra S.A. | | Chile | | 97.004.000-5 | | Líneas de crédito | | | Chile | | | Ch$ | | 6.00% | | 6.00% | | Other | | | - | | | | - | | | | - | | | | - | | | | - | | | | - | | | | - | | | | - | | | - | | | 133 | | | | - | | | | 133 | | | | - | | | | - | | | | - | | | | - | | | | - | | | | - | |
| Foreign | | Chinango S.A.C. | | Peru | | Foreign | | Banco Scotiabank | | | Peru | | | US$ | | 3.98% | | 3.96% | | Quarterly | | | - | | | | - | | | | - | | | | - | | | | - | | | | - | | | | - | | | | - | | | - | | | 260,672 | | | | 564,193 | | | | 824,865 | | | | 752,258 | | | | 752,258 | | | | 15,233,217 | | | | - | | | | - | | | | 16,737,733 | |
| Foreign | | Chinango S.A.C. | | Peru | | Foreign | | Banco de Credito del Peru | | | Peru | | | US$ | | 2.17% | | 2.06% | | Quarterly | | | 244,599 | | | | 601,653 | | | | 846,252 | | | | 802,204 | | | | 18,049,594 | | | | - | | | | - | | | | - | | | 18,851,798 | | | - | | | | - | | | | - | | | | - | | | | - | | | | - | | | | - | | | | - | | | | - | |
| Foreign | | Chinango S.A.C. | | Peru | | Foreign | | Bank Of Nova Scotia | | | Peru | | | US$ | | 3.25% | | 3.07% | | Quarterly | | | 458,314 | | | | 1,333,451 | | | | 1,791,765 | | | | 1,777,935 | | | | - | | | | - | | | | - | | | | - | | | 1,777,935 | | | 395,746 | | | | 1,137,486 | | | | 1,533,232 | | | | 1,516,648 | | | | 1,516,648 | | | | - | | | | - | | | | - | | | | 3,033,296 | |
| Foreign | | Chinango S.A.C. | | Peru | | Foreign | | Bank Of Nova Scotia | | | Peru | | | US$ | | 3.48% | | 3.40% | | Quarterly | | | 328,118 | | | | 898,325 | | | | 1,226,443 | | | | 1,197,767 | | | | 1,197,767 | | | | 299,442 | | | | - | | | | - | | | 2,694,976 | | | 287,425 | | | | 766,306 | | | | 1,053,731 | | | | 1,021,742 | | | | 1,021,742 | | | | 1,021,742 | | | | 255,432 | | | | - | | | | 3,320,658 | |
| Foreign | | Cien S.A. | | Brazil | | Foreign | | Bndes | | | Brazil | | | Real | | 3.49% | | 3.51% | | Monthly | | | - | | | | - | | | | - | | | | - | | | | - | | | | - | | | | - | | | | - | | | - | | | 9,358 | | | | - | | | | 9,358 | | | | - | | | | - | | | | - | | | | - | | | | - | | | | - | |
| Foreign | | Coelce S.A. | | Brazil | | Foreign | | Banco Itaú Brasil | | | Brazil | | | Real | | 14.39% | | 14.68% | | Semi-annually | | | - | | | | 1,128,884 | | | | 1,128,884 | | | | 8,960,650 | | | | 8,960,650 | | | | 8,960,650 | | | | - | | | | - | | | 26,881,950 | | | - | | | | - | | | | - | | | | - | | | | 11,446,218 | | | | 11,446,218 | | | | 11,446,218 | | | | - | | | | 34,338,654 | |
| Foreign | | Coelce S.A. | | Brazil | | Foreign | | Banco do Brasil | | | Brazil | | | Real | | 13.72% | | 13.97% | | Yearly | | | - | | | | 14,569,734 | | | | 14,569,734 | | | | 13,440,975 | | | | 13,440,975 | | | | 13,440,975 | | | | - | | | | - | | | 40,322,925 | | | - | | | | - | | | | - | | | | - | | | | - | | | | - | | | | - | | | | - | | | | - | |
| Foreign | | Coelce S.A. | | Brazil | | Foreign | | Banco Santander | | | Brazil | | | Real | | 13.80% | | 15.76% | | Other | | | 9,045,598 | | | | - | | | | 9,045,598 | | | | - | | | | - | | | | - | | | | - | | | | - | | | - | | | - | | | | - | | | | - | | | | - | | | | - | | | | - | | | | - | | | | - | | | | - | |
| Foreign | | Edegel S.A.A | | Peru | | Foreign | | Banco Continental | | | Peru | | | US$ | | 3.44% | | 3.36% | | Quarterly | | | - | | | | - | | | | - | | | | - | | | | - | | | | - | | | | - | | | | - | | | - | | | 1,516,649 | | | | 5,914,928 | | | | 7,431,577 | | | | 13,498,170 | | | | 14,559,823 | | | | - | | | | - | | | | - | | | | 28,057,993 | |
| Foreign | | Edegel S.A.A | | Peru | | Foreign | | Bank Nova Scotia | | | Peru | | | US$ | | 1.08% | | 1.06% | | At maturity | | | 25,619,644 | | | | - | | | | 25,619,644 | | | | - | | | | - | | | | - | | | | - | | | | - | | | - | | | 11,755 | | | | - | | | | 11,755 | | | | 21,839,736 | | | | - | | | | - | | | | - | | | | - | | | | 21,839,736 | |
| Foreign | | Edelnor S.A.A. | | Peru | | Foreign | | Banco de Interbank | | | Peru | | | Peruvian nuevo sol | | 6.90% | | 6.73% | | Quarterly | | | 28,776 | | | | - | | | | 28,776 | | | | 2,083,721 | | | | - | | | | - | | | | - | | | | - | | | 2,083,721 | | | 28,029 | | | | - | | | | 28,029 | | | | - | | | | 2,029,640 | | | | - | | | | - | | | | - | | | | 2,029,640 | |
| Foreign | | Edelnor S.A.A. | | Peru | | Foreign | | Banco de Interbank | | | Peru | | | Peruvian nuevo sol | | 5.83% | | 5.71% | | Quarterly | | | 95,383 | | | | - | | | | 95,383 | | | | - | | | | 4,375,814 | | | | - | | | | - | | | | - | | | 4,375,814 | | | 92,908 | | | | - | | | | 92,908 | | | | - | | | | - | | | | 4,262,243 | | | | - | | | | - | | | | 4,262,243 | |
| Foreign | | Edelnor S.A.A. | | Peru | | Foreign | | Banco Continental | | | Peru | | | Peruvian nuevo sol | | 5.10% | | 5.01% | | Quarterly | | | 14,718 | | | | - | | | | 14,718 | | | | - | | | | 3,125,581 | | | | - | | | | - | | | | - | | | 3,125,581 | | | 12,224 | | | | - | | | | 12,224 | | | | - | | | | - | | | | 3,044,460 | | | | - | | | | - | | | | 3,044,460 | |
| Foreign | | Edelnor S.A.A. | | Peru | | Foreign | | Banco Continental | | | Peru | | | Peruvian nuevo sol | | 5.10% | | 5.01% | | Quarterly | | | 23,807 | | | | - | | | | 23,807 | | | | - | | | | 5,209,302 | | | | - | | | | - | | | | - | | | 5,209,302 | | | 19,669 | | | | - | | | | 19,669 | | | | - | | | | - | | | | 5,074,099 | | | | - | | | | - | | | | 5,074,099 | |
| Foreign | | Edelnor S.A.A. | | Peru | | Foreign | | Banco Continental | | | Peru | | | Peruvian nuevo sol | | 5.10% | | 5.01% | | Quarterly | | | 15,918 | | | | - | | | | 15,918 | | | | - | | | | 5,000,930 | | | | - | | | | - | | | | - | | | 5,000,930 | | | 12,130 | | | | - | | | | 12,130 | | | | - | | | | - | | | | 4,871,135 | | | | - | | | | - | | | | 4,871,135 | |
| Foreign | | Edelnor S.A.A. | | Peru | | Foreign | | Banco Continental | | | Peru | | | Peruvian nuevo sol | | 5.10% | | 5.01% | | Quarterly | | | 14,416 | | | | - | | | | 14,416 | | | | - | | | | 5,209,302 | | | | - | | | | - | | | | - | | | 5,209,302 | | | 10,527 | | | | - | | | | 10,527 | | | | - | | | | - | | | | 5,074,099 | | | | - | | | | - | | | | 5,074,099 | |
| Foreign | | Edelnor S.A.A. | | Peru | | Foreign | | Banco de Interbank | | | Peru | | | Peruvian nuevo sol | | 4.67% | | 4.59% | | Quarterly | | | 12,519,774 | | | | - | | | | 12,519,774 | | | | - | | | | - | | | | - | | | | - | | | | - | | | - | | | - | | | | - | | | | - | | | | - | | | | - | | | | - | | | | - | | | | - | | | | - | |
| Foreign | | Edesur S.A. | | Argentina | | Foreign | | Banco Ciudad de Buenos Aires | | | Argentina | | | $ Arg | | 34.64% | | 30.07% | | Monthly | | | - | | | | - | | | | - | | | | - | | | | - | | | | - | | | | - | | | | - | | | - | | | 86,295 | | | | 3,157,116 | | | | 3,243,411 | | | | - | | | | - | | | | - | | | | - | | | | - | | | | - | |
| Foreign | | Edesur S.A. | | Argentina | | Foreign | | Banco Itaú Argentina | | | Argentina | | | $ Arg | | 38.20% | | 32.79% | | Monthly | | | - | | | | - | | | | - | | | | - | | | | - | | | | - | | | | - | | | | - | | | - | | | 20,520 | | | | 807,217 | | | | 827,737 | | | | - | | | | - | | | | - | | | | - | | | | - | | | | - | |
| Foreign | | Edesur S.A. | | Argentina | | Foreign | | Banco Provincia de Buenos Aires | | | Argentina | | | $ Arg | | 35.36% | | 30.67% | | Monthly | | | 83,049 | | | | - | | | | 83,049 | | | | - | | | | - | | | | - | | | | - | | | | - | | | - | | | 434,480 | | | | - | | | | 434,480 | | | | - | | | | - | | | | - | | | | - | | | | - | | | | - | |
| Foreign | | Edesur S.A. | | Argentina | | Foreign | | Banco Santander Río | | | Argentina | | | $ Arg | | 29.74% | | 26.91% | | Quarterly | | | - | | | | - | | | | - | | | | - | | | | - | | | | - | | | | - | | | | - | | | - | | | 47,485 | | | | 1,435,053 | | | | 1,482,538 | | | | - | | | | - | | | | - | | | | - | | | | - | | | | - | |
| Foreign | | Edesur S.A. | | Argentina | | Foreign | | Banco Santander Río | | | Argentina | | | $ Arg | | 45.20% | | 37.88% | | Quarterly | | | 169,444 | | | | 274,065 | | | | 443,509 | | | | - | | | | - | | | | - | | | | - | | | | - | | | - | | | 566,446 | | | | - | | | | 566,446 | | | | - | | | | - | | | | - | | | | - | | | | - | | | | - | |
| Foreign | | Edesur S.A. | | Argentina | | Foreign | | ICB Argentina | | | Argentina | | | $ Arg | | 34.06% | | 29.50% | | Quarterly | | | - | | | | - | | | | - | | | | - | | | | - | | | | - | | | | - | | | | - | | | - | | | 287,700 | | | | - | | | | 287,700 | | | | - | | | | - | | | | - | | | | - | | | | - | | | | - | |
| Foreign | | Emgesa S.A. E.S.P. | | Colombia | | Foreign | | Banco Corpbanca | | | Colombia | | | $ Col | | 8.39% | | 8.22% | | At maturity | | | - | | | | - | | | | - | | | | - | | | | - | | | | - | | | | - | | | | - | | | - | | | - | | | | 55,892 | | | | 55,892 | | | | - | | | | - | | | | - | | | | - | | | | 20,393,652 | | | | 20,393,652 | |
| Foreign | | Emgesa S.A. E.S.P. | | Colombia | | Foreign | | BBVA Colombia | | | Colombia | | | $ Col | | 8.27% | | 8.11% | | At maturity | | | 135,920 | | | | 3,353,778 | | | | 3,489,698 | | | | - | | | | - | | | | - | | | | - | | | | 46,952,895 | | | 46,952,895 | | | - | | | | 153,503 | | | | 153,503 | | | | - | | | | - | | | | - | | | | - | | | | 57,357,148 | | | | 57,357,148 | |
| Foreign | | Emgesa S.A. E.S.P. | | Colombia | | Foreign | | Banco de Bogota | | | Colombia | | | $ Col | | 8.30% | | 8.14% | | At maturity | | | 48,510 | | | | 1,192,454 | | | | 1,240,964 | | | | - | | | | - | | | | - | | | | - | | | | 16,694,363 | | | 16,694,363 | | | - | | | | - | | | | - | | | | - | | | | - | | | | - | | | | - | | | | - | | | | - | |
| Foreign | | Emgesa S.A. E.S.P. | | Colombia | | Foreign | | AV VILLAS | | | Colombia | | | $ Col | | 6.06% | | 5.93% | | At maturity | | | 11,038,653 | | | | - | | | | 11,038,653 | | | | - | | | | - | | | | - | | | | - | | | | - | | | - | | | - | | | | - | | | | - | | | | - | | | | - | | | | - | | | | - | | | | - | | | | - | |
| Foreign | | Emgesa S.A. E.S.P. | | Colombia | | Foreign | | Citibank Colombia | | | Colombia | | | $ Col | | 5.57% | | 6.01% | | At maturity | | | 5,169,932 | | | | - | | | | 5,169,932 | | | | - | | | | - | | | | - | | | | - | | | | - | | | - | | | - | | | | - | | | | - | | | | - | | | | - | | | | - | | | | - | | | | - | | | | - | |
| Foreign | | Emgesa S.A. E.S.P. | | Colombia | | Foreign | | BBVA Colombia | | | Colombia | | | $ Col | | 6.30% | | 6.16% | | At maturity | | | 361,969 | | | | 27,472,753 | | | | 27,834,722 | | | | - | | | | - | | | | - | | | | - | | | | - | | | - | | | - | | | | - | | | | - | | | | - | | | | - | | | | - | | | | - | | | | - | | | | - | |
| Foreign | | Emgesa S.A. E.S.P. | | Colombia | | Foreign | | Banco de Bogota | | | Colombia | | | $ Col | | 6.84% | | 6.66% | | At maturity | | | 13,251,721 | | | | - | | | | 13,251,721 | | | | - | | | | - | | | | - | | | | - | | | | - | | | - | | | - | | | | - | | | | - | | | | - | | | | - | | | | - | | | | - | | | | - | | | | - | |
| Foreign | | Emgesa S.A. E.S.P. | | Colombia | | Foreign | | Banco de Crédito del Peru | | | Colombia | | | $ Col | | 5.87% | | 5.70% | | At maturity | | | - | | | | 20,318,330 | | | | 20,318,330 | | | | - | | | | - | | | | - | | | | - | | | | - | | | - | | | - | | | | - | | | | - | | | | - | | | | - | | | | - | | | | - | | | | - | | | | - | |
| Foreign | | Emgesa S.A. E.S.P. | | Colombia | | Foreign | | Banco de Crédito del Peru | | | Colombia | | | $ Col | | 5.93% | | 5.76% | | At maturity | | | - | | | | 13,509,598 | | | | 13,509,598 | | | | - | | | | - | | | | - | | | | - | | | | - | | | - | | | - | | | | - | | | | - | | | | - | | | | - | | | | - | | | | - | | | | - | | | | - | |
| Foreign | | Emgesa S.A. E.S.P. | | Colombia | | Foreign | | Banco de Crédito del Peru | | | Colombia | | | $ Col | | 5.65% | | 5.50% | | At maturity | | | - | | | | 10,462,152 | | | | 10,462,152 | | | | - | | | | - | | | | - | | | | - | | | | - | | | - | | | - | | | | - | | | | - | | | | - | | | | - | | | | - | | | | - | | | | - | | | | - | |
| Foreign | | Emgesa S.A. E.S.P. | | Colombia | | Foreign | | The Bank Of Tokyo | | | Colombia | | | $ Col | | 7.02% | | 6.90% | | At maturity | | | - | | | | 139,275 | | | | 139,275 | | | | 29,066,078 | | | | - | | | | - | | | | - | | | | - | | | 29,066,078 | | | - | | | | - | | | | - | | | | - | | | | - | | | | - | | | | - | | | | - | | | | - | |
| Foreign | | Emgesa S.A. E.S.P. | | Colombia | | Foreign | | Banco Davivienda | | | Colombia | | | $ Col | | 6.30% | | 6.15% | | At maturity | | | 2,922,289 | | | | - | | | | 2,922,289 | | | | - | | | | - | | | | - | | | | - | | | | - | | | - | | | - | | | | - | | | | - | | | | - | | | | - | | | | - | | | | - | | | | - | | | | - | |
| Foreign | | Endesa Argentina S.A. | | Argentina | | Foreign | | Citibank | | | Argentina | | | $ Arg | | 34.23% | | 32.75% | | At maturity | | | 438,505 | | | | - | | | | 438,505 | | | | - | | | | - | | | | - | | | | - | | | | - | | | - | | | 710,351 | | | | - | | | | 710,351 | | | | - | | | | - | | | | - | | | | - | | | | - | | | | - | |
| 91.081.000-6 | | Endesa Chile S.A. | | Chile | | Foreign | | B.N.P. Paribas | | | U.S.A | | | US$ | | 6.32% | | 5.98% | | Semi-annually | | | - | | | | - | | | | - | | | | - | | | | - | | | | - | | | | - | | | | - | | | - | | | - | | | | 1,007,362 | | | | 1,007,362 | | | | - | | | | - | | | | - | | | | - | | | | - | | | | - | |
| 91.081.000-6 | | Endesa Chile S.A. | | Chile | | 97.004.000-5 | | Banco Santander | | | Chile | | | Ch$ | | 6.00% | | 6.00% | | Monthly | | | - | | | | - | | | | - | | | | - | | | | - | | | | - | | | | - | | | | - | | | - | | | 1,338 | | | | - | | | | 1,338 | | | | - | | | | - | | | | - | | | | - | | | | - | | | | - | |
| Foreign | | Central Costanera S.A. | | Argentina | | Foreign | | Banco Galicia | | | Argentina | | | $ Arg | | 51.46% | | 42.24% | | At maturity | | | - | | | | 714,607 | | | | 714,607 | | | | 259,978 | | | | - | | | | - | | | | - | | | | - | | | 259,978 | | | - | | | | 800,033 | | | | 800,033 | | | | 853,856 | | | | - | | | | - | | | | - | | | | - | | | | 853,856 | |
| Foreign | | Central Costanera S.A. | | Argentina | | Foreign | | Banco Itaú Argentina | | | Argentina | | | $ Arg | | 55.07% | | 44.68% | | At maturity | | | - | | | | 271,439 | | | | 271,439 | | | | 120,187 | | | | - | | | | - | | | | - | | | | - | | | 120,187 | | | - | | | | 302,809 | | | | 302,809 | | | | 350,571 | | | | - | | | | - | | | | - | | | | - | | | | 350,571 | |
| Foreign | | Central Costanera S.A. | | Argentina | | Foreign | | Banco Santander Río | | | Argentina | | | $ Arg | | 44.16% | | 37.14% | | At maturity | | | - | | | | 181,232 | | | | 181,232 | | | | 73,961 | | | | - | | | | - | | | | - | | | | - | | | 73,961 | | | - | | | | 185,138 | | | | 185,138 | | | | 215,736 | | | | - | | | | - | | | | - | | | | - | | | | 215,736 | |
| Foreign | | Central Costanera S.A. | | Argentina | | Foreign | | Banco Supervielle | | | Argentina | | | $ Arg | | 49.96% | | 41.21% | | At maturity | | | - | | | | 259,139 | | | | 259,139 | | | | 115,564 | | | | - | | | | - | | | | - | | | | - | | | 115,564 | | | - | | | | 289,401 | | | | 289,401 | | | | 337,088 | | | | - | | | | - | | | | - | | | | - | | | | 337,088 | |
| Foreign | | Central Costanera S.A. | | Argentina | | Foreign | | Citibank | | | Argentina | | | $ Arg | | 45.10% | | 37.81% | | At maturity | | | - | | | | 852,379 | | | | 852,379 | | | | 381,640 | | | | - | | | | - | | | | - | | | | - | | | 381,640 | | | - | | | | 955,718 | | | | 955,718 | | | | 1,113,199 | | | | - | | | | - | | | | - | | | | - | | | | 1,113,199 | |
| Foreign | | Central Costanera S.A. | | Argentina | | Foreign | | Credit Suisse International | | | Argentina | | | US$ | | 14.84% | | 13.92% | | Quarterly | | | 1,216,306 | | | | - | | | | 1,216,306 | | | | - | | | | - | | | | - | | | | - | | | | - | | | - | | | - | | | | 2,126,669 | | | | 2,126,669 | | | | 1,022,595 | | | | - | | | | - | | | | - | | | | - | | | | 1,022,595 | |
| Foreign | | Central Costanera S.A. | | Argentina | | Foreign | | ICBC Argentina | | | Argentina | | | $ Arg | | 51.97% | | 42.59% | | At maturity | | | - | | | | 291,321 | | | | 291,321 | | | | 129,432 | | | | - | | | | - | | | | - | | | | - | | | 129,432 | | | - | | | | 324,772 | | | | 324,772 | | | | 377,538 | | | | - | | | | - | | | | - | | | | - | | | | 377,538 | |
| 94.271.00-3 | | Enersis S.A. | | Chile | | 97.004.000-5 | | Banco Santander Chile | | | Chile | | | Ch$ | | 4.50% | | 4.50% | | At maturity | | | - | | | | - | | | | - | | | | - | | | | - | | | | - | | | | - | | | | - | | | - | | | 123 | | | | - | | | | 123 | | | | - | | | | - | | | | - | | | | - | | | | - | | | | - | |
| Foreign | | H. El Chocón S.A. | | Argentina | | Foreign | | Banco Macro | | | Argentina | | | $ Arg | | 34.46% | | 31.10% | | At maturity | | | 1,119,924 | | | | - | | | | 1,119,924 | | | | - | | | | - | | | | - | | | | - | | | | - | | | - | | | 1,461,573 | | | | - | | | | 1,461,573 | | | | - | | | | - | | | | - | | | | - | | | | - | | | | - | |
| Foreign | | H. El Chocón S.A. | | Argentina | | Foreign | | Deutsche Bank | | | Argentina | | | US$ | | 13.50% | | 12.86% | | Quarterly | | | 1,341,641 | | | | - | | | | 1,341,641 | | | | - | | | | - | | | | - | | | | - | | | | - | | | - | | | 5,725,691 | | | | - | | | | 5,725,691 | | | | - | | | | - | | | | - | | | | - | | | | - | | | | - | |
| Foreign | | H. El Chocón S.A. | | Argentina | | Foreign | | Standard Bank | | | Argentina | | | US$ | | 13.50% | | 12.86% | | Quarterly | | | 670,824 | | | | - | | | | 670,824 | | | | - | | | | - | | | | - | | | | - | | | | - | | | - | | | 2,862,848 | | | | - | | | | 2,862,848 | | | | - | | | | - | | | | - | | | | - | | | | - | | | | - | |
| Foreign | | H. El Chocón S.A. | | Argentina | | Foreign | | Banco Itau | | | Argentina | | | US$ | | 13.50% | | 12.86% | | Quarterly | | | 670,824 | | | | - | | | | 670,824 | | | | - | | | | - | | | | - | | | | - | | | | - | | | - | | | 2,862,848 | | | | - | | | | 2,862,848 | | | | - | | | | - | | | | - | | | | - | | | | - | | | | - | |
| Foreign | | H. El Chocón S.A. | | Argentina | | Foreign | | Banco Santander - Sindicado IV | | | Argentina | | | $ Arg | | 40.59% | | 35.54% | | Quarterly | | | 202,930 | | | | 451,981 | | | | 654,911 | | | | - | | | | - | | | | - | | | | - | | | | - | | | - | | | 158,689 | | | | 813,581 | | | | 972,270 | | | | 862,890 | | | | - | | | | - | | | | - | | | | - | | | | 862,890 | |
| Foreign | | H. El Chocón S.A. | | Argentina | | Foreign | | Banco Itau- Sindicado IV | | | Argentina | | | $ Arg | | 40.59% | | 35.54% | | Quarterly | | | 185,284 | | | | 412,679 | | | | 597,963 | | | | - | | | | - | | | | - | | | | - | | | | - | | | - | | | 144,890 | | | | 742,835 | | | | 887,725 | | | | 787,856 | | | | - | | | | - | | | | - | | | | - | | | | 787,856 | |
| Foreign | | H. El Chocón S.A. | | Argentina | | Foreign | | Banco Galicia - Sindicado IV | | | Argentina | | | $ Arg | | 40.59% | | 35.54% | | Quarterly | | | 176,461 | | | | 393,027 | | | | 569,488 | | | | - | | | | - | | | | - | | | | - | | | | - | | | - | | | 137,990 | | | | 707,462 | | | | 845,452 | | | | 750,339 | | | | - | | | | - | | | | - | | | | - | | | | 750,339 | |
| Foreign | | H. El Chocón S.A. | | Argentina | | Foreign | | Banco Hipotecario - Sindicado IV | | | Argentina | | | $ Arg | | 40.59% | | 35.54% | | Quarterly | | | 61,761 | | | | 137,560 | | | | 199,321 | | | | - | | | | - | | | | - | | | | - | | | | - | | | - | | | 48,297 | | | | 247,612 | | | | 295,909 | | | | 262,618 | | | | - | | | | - | | | | - | | | | - | | | | 262,618 | |
| Foreign | | H. El Chocón S.A. | | Argentina | | Foreign | | Banco Ciudad -Sindicado IV | | | Argentina | | | $ Arg | | 40.59% | | 35.54% | | Quarterly | | | 26,469 | | | | 58,954 | | | | 85,423 | | | | - | | | | - | | | | - | | | | - | | | | - | | | - | | | 20,699 | | | | 106,119 | | | | 126,818 | | | | 112,552 | | | | - | | | | - | | | | - | | | | - | | | | 112,552 | |
| Foreign | | H. El Chocón S.A. | | Argentina | | Foreign | | ICBC Argentina | | | Argentina | | | $ Arg | | 40.59% | | 35.54% | | Quarterly | | | 229,399 | | | | 510,935 | | | | 740,334 | | | | - | | | | - | | | | - | | | | - | | | | - | | | - | | | 179,387 | | | | 919,701 | | | | 1,099,088 | | | | 975,440 | | | | - | | | | - | | | | - | | | | - | | | | 975,440 | |
| | | | | | | | | | | | | | | | | | | | | | | | | | | | | | | | | | | | | | | | | | | | | | | | | | | | | | | | | | | | | | | | | | | | | | | | | | | | | | | | | | | | | | | | | | |
| | | | | | | | | | | Total | | | | | | | | | | | | 87,930,880 | | | | 100,190,665 | | | | 188,121,545 | | | | 66,175,988 | | | | 72,335,811 | | | | 30,466,963 | | | | - | | | | 63,647,258 | | | 232,626,020 | | | 18,414,875 | | | | 23,910,971 | | | | 42,325,846 | | | | 46,650,832 | | | | 41,246,384 | | | | 59,947,268 | | | | 21,621,705 | | | | 77,750,800 | | | | 247,216,989 | |
In Appendix 5, letter a), are shown the estimated future cash flows (undiscounted) that the Group will have to disburse to settle the bank loans detailed above.
| | |
| The accompanying notes are an integral part of these consolidated financial statements | | |
|
| F-98 |
20.2 Unsecured liabilities
The detail of Unsecured Liabilities by currency and maturity as of December 31, 2015 and 2014, is as follows:
- Summary of unsecured liabilities by currency and maturity
| | | | | | | | | | | | | | | | | | | | | | | | | | | | | | | | | | | | | | | | |
| Country | | Currency | | Annual
Nominal
Rate | | Secured/
Unsecured | | Current | | | Non-current |
| | | | | Maturity | | | Total Current
at 12/31/2015 | | | Maturity | | | Total
Non- current at
12/31/2015 |
| | | | | One to three months | | | Three to twelve months | | | | One to
two years | | | Two to three years | | | Three to four years | | | Four to five years | | | Over five years | | |
| | | | | ThCh$ | | | ThCh$ | | | ThCh$ | | | ThCh$ | | | ThCh$ | | | ThCh$ | | | ThCh$ | | | ThCh$ | | | ThCh$ |
| | | | | | | | | | | | | | | | | | | | | | | | | | | | | | | | | | | | | | | | | |
Chile | | US$ | | 7.00% | | Unsecured | | | - | | | | 179,552,878 | | | | 179,552,878 | | | | - | | | | - | | | | - | | | | - | | | | 609,317 | | | 609,317 |
Chile | | U.F. | | 5.75% | | Unsecured | | | - | | | | 3,417,313 | | | | 3,417,313 | | | | 3,546,564 | | | | 3,750,488 | | | | 3,966,142 | | | | 4,194,193 | | | | 6,097,254 | | | 21,554,641 |
Peru | | US$ | | 6.50% | | Unsecured | | | 1,025,402 | | | | 14,223,478 | | | | 15,248,880 | | | | - | | | | 7,111,739 | | | | 5,807,446 | | | | 7,111,739 | | | | 7,111,739 | | | 27,142,663 |
Peru | | Peruvian nuevo sol | | 6.44% | | Unsecured | | | 11,874,390 | | | | 9,345,624 | | | | 21,220,014 | | | | 20,628,837 | | | | - | | | | 44,799,999 | | | | 27,088,371 | | | | 123,043,719 | | | 215,560,926 |
Colombia | | CP | | 10.81% | | Unsecured | | | 60,132,757 | | | | - | | | | 60,132,757 | | | | 125,441,571 | | | | 107,284,492 | | | | 80,913,285 | | | | 53,852,881 | | | | 551,735,058 | | | 919,227,287 |
Brazil | | Real | | 15.64% | | Unsecured | | | - | | | | 76,649,745 | | | | 76,649,745 | | | | 87,811,094 | | | | 79,034,498 | | | | 40,774,981 | | | | - | | | | - | | | 207,620,573 |
| | | | | | | | | | | | | | | | | | | | | | | | | | | | | | | | | | | | | | | | |
| | | | | | Total | | | 73,032,549 | | | | 283,189,038 | | | | 356,221,587 | | | | 237,428,066 | | | | 197,181,217 | | | | 176,261,853 | | | | 92,247,184 | | | | 688,597,087 | | | 1,391,715,407 |
| | | | | | | | | | | | | | | | | | | | | | | | | | | | | | | | | | | | | | | | |
| Country | | Currency | | Annual
Nominal
Rate | | Secured/
Unsecured | | Current | | | Non-current |
| | | | | Maturity | | | Total Current
at 12/31/2014 | | | Maturity | | | Total
Non- current at
12/31/2014 |
| | | | | One to three
months | | | Three to twelve months | | | | One to
two
years | | | Two to three
years | | | Three to four
years | | | Four to five
years | | | Over five years | | |
| | | | | ThCh$ | | | ThCh$ | | | ThCh$ | | | ThCh$ | | | ThCh$ | | | ThCh$ | | | ThCh$ | | | ThCh$ | | | ThCh$ |
| | | | | | | | | | | | | | | | | | | | | | | | | | | | | | | | | | | | | | | | | |
| | | US$ | | 7.17% | | Unsecured | | | 10,600,825 | | | | 124,464,832 | | | | 135,065,657 | | | | 153,936,502 | | | | - | | | | - | | | | - | | | | 420,471,172 | | | 574,407,674 |
Chile | | U.F. | | 5.57% | | Unsecured | | | 1,523,693 | | | | 8,154,883 | | | | 9,678,576 | | | | 8,345,041 | | | | 8,530,345 | | | | 8,726,297 | | | | 31,321,793 | | | | 272,880,640 | | | 329,804,116 |
Peru | | US$ | | 6.59% | | Unsecured | | | 4,852,113 | | | | - | | | | 4,852,113 | | | | 12,133,186 | | | | - | | | | 6,066,593 | | | | 4,953,980 | | | | 12,133,186 | | | 35,286,945 |
Peru | | Peruvian nuevo sol | | 6.57% | | Unsecured | | | 7,369,056 | | | | 23,437,141 | | | | 30,806,197 | | | | 17,292,530 | | | | 20,093,432 | | | | - | | | | 29,429,775 | | | | 146,235,538 | | | 213,051,275 |
Colombia | | CP | | 8.16% | | Unsecured | | | 92,570,006 | | | | - | | | | 92,570,006 | | | | 36,963,495 | | | | 142,924,458 | | | | 122,313,646 | | | | 92,241,270 | | | | 690,301,242 | | | 1,084,744,111 |
Brazil | | Real | | 12.55% | | Unsecured | | | - | | | | 35,952,570 | | | | 35,952,570 | | | | 80,341,173 | | | | 104,952,742 | | | | 93,563,508 | | | | 49,266,449 | | | | - | | | 328,123,872 |
| | | | | | | | | | | | | | | | | | | | | | | | | | | | | | | | | | | | | | | | |
| | | | | | Total | | | 116,915,693 | | | | 192,009,426 | | | | 308,925,119 | | | | 309,011,927 | | | | 276,500,977 | | | | 230,670,044 | | | | 207,213,267 | | | | 1,542,021,778 | | | 2,565,417,993 |
20.3 Secured liabilities
As of December 31, 2015 and 2014 there are no secured liabilities.
- Fair value measurement and hierarchy
The fair value of current and non-current secured and unsecured liabilities as of December 31, 2015 totaled ThCh$1,768,663,119 (ThCh$3,207,640,549 as of December 31, 2014). These liabilities have been classified as Level 2 fair value measurement based on the entry data used in the valuation techniques used (see Note 3.h). It is important to note that these financial liabilities are measured at amortized cost (see Note 3 g.4).
| | |
| The accompanying notes are an integral part of these consolidated financial statements | | |
|
| F-99 |
- Secured and unsecured liabilities by company
| | | | | | | | | | | | | | | | | | | | | | | | | | | | | | | | | | | | | | | | | | | | | | | | | | | | | | | | | | | | | | | | | | | | | | | | | | | | | | | | | | | | | | | | | | | | |
Tax ID
Number | | Company | | Country | | Tax
ID Number
Financial
Institution | | Financial Institution | | Country | | Currency | | Effective interest rate | | | Nominal interest rate | | | Secured | | December 31, 2015 | | | December 31, 2014 |
| | | | | | | | | | | Current ThCh$ | | | Non-current ThCh$ | | | Current ThCh$ | | | Non-current ThCh$ |
| | | | | | | | | | | Less than 90 days | | | More than 90 days | | | Total Current | | | One to two years | | | Two to three years | | | Three to four years | | | Four to five years | | | More than
5 years | | | Total Non- current | | | Less than 90 days | | | More than 90 days | | | Total Current | | | One to two years | | | Two to three years | | | Three to four years | | | Four to five years | | | More than 5 years | | | Total Non- current |
Foreign | | Ampla Energía S.A. | | Brazil | | Foreign | | Bonos 1ª Serie 16 | | Brazil | | Real | | | 13.66 | % | | | 13.75 | % | | No | | | - | | | | 10,550,152 | | | | 10,550,152 | | | | - | | | | - | | | | - | | | | - | | | | - | | | | - | | | | - | | | | 13,508,284 | | | | 13,508,284 | | | | 13,392,075 | | | | - | | | | - | | | | - | | | | - | | | 13,392,075 |
Foreign | | Ampla Energía S.A. | | Brazil | | Foreign | | Bonos 1ª Serie 17 | | Brazil | | Real | | | 13.71 | % | | | 13.89 | % | | No | | | - | | | | 9,072,396 | | | | 9,072,396 | | | | 8,960,650 | | | | - | | | | - | | | | - | | | | - | | | | 8,960,650 | | | | - | | | | 97,895 | | | | 97,895 | | | | 11,183,110 | | | | 11,446,218 | | | | - | | | | - | | | | - | | | 22,629,328 |
Foreign | | Ampla Energía S.A. | | Brazil | | Foreign | | Bonos 1ª Serie 18 | | Brazil | | Real | | | 14.69 | % | | | 14.91 | % | | No | | | - | | | | 1,980,285 | | | | 1,980,285 | | | | 8,960,650 | | | | 8,960,650 | | | | 8,960,650 | | | | - | | | | - | | | | 26,881,950 | | | | - | | | | 3,842,192 | | | | 3,842,192 | | | | - | | | | 22,666,150 | | | | 22,706,738 | | | | 22,651,006 | | | | - | | | 68,023,894 |
Foreign | | Ampla Energía S.A. | | Brazil | | Foreign | | Bonos 2ª Serie 26 | | Brazil | | Real | | | 13.55 | % | | | 18.97 | % | | No | | | - | | | | 16,645,720 | | | | 16,645,720 | | | | 14,750,376 | | | | 14,750,376 | | | | - | | | | - | | | | - | | | | 29,500,752 | | | | - | | | | 2,206,338 | | | | 2,206,338 | | | | 16,792,364 | | | | 17,045,383 | | | | 17,045,383 | | | | - | | | | - | | | 50,883,130 |
Foreign | | Ampla Energía S.A. | | Brazil | | Foreign | | Bonos 2ª Serie 27 | | Brazil | | Real | | | 15.35 | % | | | 16.89 | % | | No | | | - | | | | 2,256,837 | | | | 2,256,837 | | | | 22,653,731 | | | | 22,888,844 | | | | 22,853,681 | | | | - | | | | - | | | | 68,396,256 | | | | - | | | | 2,627,046 | | | | 2,627,046 | | | | - | | | | 26,615,437 | | | | 26,615,443 | | | | 26,615,443 | | | | - | | | 79,846,323 |
Foreign | | Ampla Energía S.A. | | Brazil | | Foreign | | Bonos 2ª Serie 28 | | Brazil | | Real | | | 14.69 | % | | | 14.91 | % | | No | | | - | | | | 1,980,285 | | | | 1,980,285 | | | | 8,960,650 | | | | 8,960,650 | | | | 8,960,650 | | | | - | | | | - | | | | 26,881,950 | | | | - | | | | - | | | | - | | | | - | | | | - | | | | - | | | | - | | | | - | | | - |
Foreign | | Codensa | | Colombia | | Foreign | | B102 | | Colombia | | CP | | | 12.03 | % | | | 11.52 | % | | No | | | 480,031 | | | | - | | | | 480,031 | | | | 87,436,064 | | | | - | | | | - | | | | - | | | | - | | | | 87,436,064 | | | | 419,979 | | | | - | | | | 419,979 | | | | - | | | | 99,597,748 | | | | - | | | | - | | | | - | | | 99,597,748 |
Foreign | | Codensa | | Colombia | | Foreign | | B103 | | Colombia | | CP | | | 12.29 | % | | | 11.76 | % | | No | | | 121,021 | | | | - | | | | 121,021 | | | | - | | | | 17,886,817 | | | | - | | | | - | | | | - | | | | 17,886,817 | | | | 106,657 | | | | - | | | | 106,657 | | | | - | | | | - | | | | 20,393,652 | | | | - | | | | - | | | 20,393,652 |
Foreign | | Codensa | | Colombia | | Foreign | | B604 | | Colombia | | CP | | | 10.56 | % | | | 10.17 | % | | No | | | 32,826,348 | | | | - | | | | 32,826,348 | | | | - | | | | - | | | | - | | | | - | | | | - | | | | - | | | | 341,784 | | | | - | | | | 341,784 | | | | 36,963,495 | | | | - | | | | - | | | | - | | | | - | | | 36,963,495 |
Foreign | | Codensa | | Colombia | | Foreign | | Bonos B12-13 | | Colombia | | CP | | | 11.50 | % | | | 11.03 | % | | No | | | 613,975 | | | | - | | | | 613,975 | | | | - | | | | - | | | | - | | | | - | | | | 43,227,965 | | | | 43,227,965 | | | | 530,570 | | | | - | | | | 530,570 | | | | - | | | | - | | | | - | | | | - | | | | 49,286,360 | | | 49,286,360 |
Foreign | | Codensa | | Colombia | | Foreign | | Bonos B5-13 | | Colombia | | CP | | | 10.56 | % | | | 10.17 | % | | No | | | 531,899 | | | | - | | | | 531,899 | | | | - | | | | 40,616,490 | | | | - | | | | - | | | | - | | | | 40,616,490 | | | | 447,227 | | | | - | | | | 447,227 | | | | - | | | | - | | | | 46,308,886 | | | | - | | | | - | | | 46,308,886 |
Foreign | | Codensa | | Colombia | | Foreign | | Bonos B7-14 | | Colombia | | CP | | | 10.15 | % | | | 9.78 | % | | No | | | 77,582 | | | | - | | | | 77,582 | | | | - | | | | - | | | | - | | | | - | | | | 41,363,265 | | | | 41,363,265 | | | | 64,396 | | | | - | | | | 64,396 | | | | - | | | | - | | | | - | | | | - | | | | 47,160,321 | | | 47,160,321 |
Foreign | | Coelce S.A. | | Brazil | | Foreign | | Itaú 1 | | Brazil | | Real | | | 13.77 | % | | | 13.99 | % | | No | | | - | | | | 9,601,388 | | | | 9,601,388 | | | | - | | | | - | | | | - | | | | - | | | | - | | | | - | | | | - | | | | 12,502,318 | | | | 12,502,318 | | | | 11,904,066 | | | | - | | | | - | | | | - | | | | - | | | 11,904,066 |
Foreign | | Coelce S.A. | | Brazil | | Foreign | | Itaú 2 | | Brazil | | Real | | | 17.07 | % | | | 17.79 | % | | No | | | - | | | | 24,562,682 | | | | 24,562,682 | | | | 23,525,037 | | | | 23,473,978 | | | | - | | | | - | | | | - | | | | 46,999,015 | | | | - | | | | 1,168,497 | | | | 1,168,497 | | | | 27,069,558 | | | | 27,179,554 | | | | 27,195,944 | | | | - | | | | - | | | 81,445,056 |
Foreign | | Edegel S.A.A | | Peru | | Foreign | | Banco Continental | | Peru | | Peruvian nuevo sol | | | 6.41 | % | | | 6.31 | % | | No | | | - | | | | 8,221 | | | | 8,221 | | | | - | | | | - | | | | - | | | | - | | | | 5,209,304 | | | | 5,209,304 | | | | - | | | | 8,008 | | | | 8,008 | | | | - | | | | - | | | | - | | | | - | | | | 5,074,099 | | | 5,074,099 |
Foreign | | Edegel S.A.A | | Peru | | Foreign | | Banco Continental | | Peru | | Peruvian nuevo sol | | | 6.38 | % | | | 6.28 | % | | No | | | - | | | | - | | | | - | | | | - | | | | - | | | | 5,209,302 | | | | - | | | | - | | | | 5,209,302 | | | | 156,702 | | | | - | | | | 156,702 | | | | - | | | | - | | | | - | | | | 5,074,099 | | | | - | | | 5,074,099 |
Foreign | | Edegel S.A.A | | Peru | | Foreign | | Banco Continental | | Peru | | US$ | | | 6.44 | % | | | 6.34 | % | | No | | | 194,246 | | | | - | | | | 194,246 | | | | - | | | | - | | | | - | | | | - | | | | 7,111,739 | | | | 7,111,739 | | | | 165,699 | | | | - | | | | 165,699 | | | | - | | | | - | | | | - | | | | - | | | | 6,066,593 | | | 6,066,593 |
Foreign | | Edegel S.A.A | | Peru | | Foreign | | Banco Continental | | Peru | | US$ | | | 7.93 | % | | | 7.78 | % | | No | | | 200,841 | | | | - | | | | 200,841 | | | | - | | | | - | | | | 5,807,446 | | | | - | | | | - | | | | 5,807,446 | | | | 171,325 | | | | - | | | | 171,325 | | | | - | | | | - | | | | - | | | | 4,953,980 | | | | - | | | 4,953,980 |
Foreign | | Edegel S.A.A | | Peru | | Foreign | | Banco Continental | | Peru | | US$ | | | 7.25 | % | | | 7.13 | % | | No | | | - | | | | - | | | | - | | | | - | | | | - | | | | - | | | | - | | | | - | | | | - | | | | 3,977,405 | | | | - | | | | 3,977,405 | | | | - | | | | - | | | | - | | | | - | | | | - | | | - |
Foreign | | Edegel S.A.A | | Peru | | Foreign | | Banco Scotiabank | | Peru | | US$ | | | 6.73 | % | | | 6.63 | % | | No | | | 215,945 | | | | 7,111,739 | | | | 7,327,684 | | | | - | | | | - | | | | - | | | | - | | | | - | | | | - | | | | 184,210 | | | | - | | | | 184,210 | | | | 6,066,593 | | | | - | | | | - | | | | - | | | | - | | | 6,066,593 |
Foreign | | Edegel S.A.A | | Peru | | Foreign | | Banco Scotiabank | | Peru | | US$ | | | 6.09 | % | | | 6.00 | % | | No | | | 117,344 | | | | 7,111,739 | | | | 7,229,083 | | | | - | | | | - | | | | - | | | | - | | | | - | | | | - | | | | 100,099 | | | | - | | | | 100,099 | | | | 6,066,593 | | | | - | | | | - | | | | - | | | | - | | | 6,066,593 |
Foreign | | Edegel S.A.A | | Peru | | Foreign | | Banco Scotiabank | | Peru | | US$ | | | 5.86 | % | | | 5.78 | % | | No | | | 102,787 | | | | - | | | | 102,787 | | | | - | | | | - | | | | - | | | | 7,111,739 | | | | - | | | | 7,111,739 | | | | 87,681 | | | | - | | | | 87,681 | | | | - | | | | - | | | | - | | | | - | | | | 6,066,593 | | | 6,066,593 |
Foreign | | Edegel S.A.A | | Peru | | Foreign | | Banco Scotiabank | | Peru | | US$ | | | 6.57 | % | | | 6.47 | % | | No | | | 194,239 | | | | - | | | | 194,239 | | | | - | | | | 7,111,739 | | | | - | | | | - | | | | - | | | | 7,111,739 | | | | 165,694 | | | | - | | | | 165,694 | | | | - | | | | - | | | | 6,066,593 | | | | - | | | | - | | | 6,066,593 |
Foreign | | Edelnor S.A.A. | | Peru | | Foreign | | AFP Horizonte | | Peru | | Peruvian nuevo sol | | | 7.22 | % | | | 7.09 | % | | No | | | 75,209 | | | | 3,125,581 | | | | 3,200,790 | | | | - | | | | - | | | | - | | | | - | | | | - | | | | - | | | | 73,257 | | | | - | | | | 73,257 | | | | 3,044,460 | | | | - | | | | - | | | | - | | | | - | | | 3,044,460 |
Foreign | | Edelnor S.A.A. | | Peru | | Foreign | | AFP Integra | | Peru | | Peruvian nuevo sol | | | 8.16 | % | | | 8.00 | % | | No | | | 3,899,407 | | | | - | | | | 3,899,407 | | | | - | | | | - | | | | - | | | | - | | | | - | | | | - | | | | - | | | | - | | | | - | | | | 3,653,351 | | | | - | | | | - | | | | - | | | | - | | | 3,653,351 |
Foreign | | Edelnor S.A.A. | | Peru | | Foreign | | AFP Integra | | Peru | | Peruvian nuevo sol | | | 8.00 | % | | | 7.85 | % | | No | | | 5,855,385 | | | | - | | | | 5,855,385 | | | | - | | | | - | | | | - | | | | - | | | | - | | | | - | | | | 182,794 | | | | - | | | | 182,794 | | | | 5,520,620 | | | | - | | | | - | | | | - | | | | - | | | 5,520,620 |
Foreign | | Edelnor S.A.A. | | Peru | | Foreign | | AFP Integra | | Peru | | Peruvian nuevo sol | | | 5.91 | % | | | 5.82 | % | | No | | | - | | | | - | | | | - | | | | - | | | | - | | | | - | | | | - | | | | - | | | | - | | | | - | | | | 4,106,563 | | | | 4,106,563 | | | | - | | | | - | | | | - | | | | - | | | | - | | | - |
Foreign | | Edelnor S.A.A. | | Peru | | Foreign | | AFP Prima | | Peru | | Peruvian nuevo sol | | | 6.63 | % | | | 6.52 | % | | No | | | - | | | | - | | | | - | | | | - | | | | - | | | | - | | | | - | | | | - | | | | - | | | | - | | | | 4,104,101 | | | | 4,104,101 | | | | - | | | | - | | | | - | | | | - | | | | - | | | - |
Foreign | | Edelnor S.A.A. | | Peru | | Foreign | | AFP Prima | | Peru | | Peruvian nuevo sol | | | 6.94 | % | | | 6.82 | % | | No | | | - | | | | - | | | | - | | | | - | | | | - | | | | - | | | | - | | | | - | | | | - | | | | 189,306 | | | | 8,118,559 | | | | 8,307,865 | | | | - | | | | - | | | | - | | | | - | | | | - | | | - |
Foreign | | Edelnor S.A.A. | | Peru | | Foreign | | AFP Prima | | Peru | | Peruvian nuevo sol | | | 7.13 | % | | | 7.00 | % | | No | | | - | | | | 5,226,830 | | | | 5,226,830 | | | | - | | | | - | | | | - | | | | - | | | | - | | | | - | | | | - | | | | 17,072 | | | | 17,072 | | | | 5,074,099 | | | | - | | | | - | | | | - | | | | - | | | 5,074,099 |
Foreign | | Edelnor S.A.A. | | Peru | | Foreign | | AFP Prima | | Peru | | Peruvian nuevo sol | | | 7.44 | % | | | 7.30 | % | | No | | | 185,972 | | | | - | | | | 185,972 | | | | - | | | | - | | | | - | | | | 6,251,163 | | | | - | | | | 6,251,163 | | | | 181,145 | | | | - | | | | 181,145 | | | | - | | | | - | | | | - | | | | - | | | | 6,088,919 | | | 6,088,919 |
Foreign | | Edelnor S.A.A. | | Peru | | Foreign | | AFP Profuturo | | Peru | | Peruvian nuevo sol | | | 8.06 | % | | | 7.91 | % | | No | | | - | | | | - | | | | - | | | | - | | | | - | | | | - | | | | - | | | | - | | | | - | | | | 5,176,988 | | | | - | | | | 5,176,988 | | | | - | | | | - | | | | - | | | | - | | | | - | | | - |
Foreign | | Edelnor S.A.A. | | Peru | | Foreign | | FCR - Macrofondo | | Peru | | Peruvian nuevo sol | | | 5.56 | % | | | 5.49 | % | | No | | | 204,447 | | | | - | | | | 204,447 | | | | - | | | | - | | | | - | | | | - | | | | 10,418,604 | | | | 10,418,604 | | | | 199,141 | | | | - | | | | 199,141 | | | | - | | | | - | | | | - | | | | - | | | | 10,148,198 | | | 10,148,198 |
Foreign | | Edelnor S.A.A. | | Peru | | Foreign | | FCR - Macrofondo | | Peru | | Peruvian nuevo sol | | | 7.03 | % | | | 6.91 | % | | No | | | 135,116 | | | | - | | | | 135,116 | | | | - | | | | - | | | | 4,167,442 | | | | - | | | | - | | | | 4,167,442 | | | | 131,609 | | | | - | | | | 131,609 | | | | - | | | | - | | | | - | | | | 4,059,279 | | | | - | | | 4,059,279 |
Foreign | | Edelnor S.A.A. | | Peru | | Foreign | | Fondo -Fosersoe | | Peru | | Peruvian nuevo sol | | | 8.75 | % | | | 8.57 | % | | No | | | - | | | | - | | | | - | | | | - | | | | - | | | | - | | | | - | | | | - | | | | - | | | | - | | | | 6,118,518 | | | | 6,118,518 | | | | - | | | | - | | | | - | | | | - | | | | - | | | - |
Foreign | | Edelnor S.A.A. | | Peru | | Foreign | | Interseguro Cia de Seguros | | Peru | | Peruvian nuevo sol | | | 6.28 | % | | | 6.19 | % | | No | | | - | | | | 111,978 | | | | 111,978 | | | | - | | | | - | | | | - | | | | - | | | | 8,334,884 | | | | 8,334,884 | | | | - | | | | 109,072 | | | | 109,072 | | | | - | | | | - | | | | - | | | | - | | | | 8,118,559 | | | 8,118,559 |
Foreign | | Edelnor S.A.A. | | Peru | | Foreign | | Rimac Internacional | | Peru | | Peruvian nuevo sol | | | 6.06 | % | | | 5.97 | % | | No | | | - | | | | 87,726 | | | | 87,726 | | | | - | | | | - | | | | - | | | | - | | | | 10,418,604 | | | | 10,418,604 | | | | - | | | | 85,449 | | | | 85,449 | | | | - | | | | - | | | | - | | | | - | | | | 10,148,198 | | | 10,148,198 |
Foreign | | Edelnor S.A.A. | | Peru | | Foreign | | Rimac Internacional | | Peru | | Peruvian nuevo sol | | | 6.50 | % | | | 6.40 | % | | No | | | - | | | | 43,642 | | | | 43,642 | | | | 4,167,442 | | | | - | | | | - | | | | - | | | | - | | | | 4,167,442 | | | | - | | | | 42,509 | | | | 42,509 | | | | - | | | | 4,059,279 | | | | - | | | | - | | | | - | | | 4,059,279 |
Foreign | | Edelnor S.A.A. | | Peru | | Foreign | | Rimac Internacional | | Peru | | Peruvian nuevo sol | | | 7.06 | % | | | 6.94 | % | | No | | | - | | | | 91,977 | | | | 91,977 | | | | 6,251,163 | | | | - | | | | - | | | | - | | | | - | | | | 6,251,163 | | | | - | | | | 89,590 | | | | 89,590 | | | | - | | | | 6,088,919 | | | | - | | | | - | | | | - | | | 6,088,919 |
Foreign | | Edelnor S.A.A. | | Peru | | Foreign | | Rimac Internacional | | Peru | | Peruvian nuevo sol | | | 5.00 | % | | | 4.94 | % | | No | | | - | | | | 61,354 | | | | 61,354 | | | | - | | | | - | | | | - | | | | - | | | | 8,334,884 | | | | 8,334,884 | | | | - | | | | 59,762 | | | | 59,762 | | | | - | | | | - | | | | - | | | | - | | | | 8,118,559 | | | 8,118,559 |
Foreign | | Edelnor S.A.A. | | Peru | | Foreign | | Rimac Internacional | | Peru | | Peruvian nuevo sol | | | 5.13 | % | | | 5.06 | % | | No | | | 229,897 | | | | - | | | | 229,897 | | | | - | | | | - | | | | - | | | | - | | | | 10,418,604 | | | | 10,418,604 | | | | 223,930 | | | | - | | | | 223,930 | | | | - | | | | - | | | | - | | | | - | | | | 10,148,198 | | | 10,148,198 |
Foreign | | Edelnor S.A.A. | | Peru | | Foreign | | Rimac Internacional | | Peru | | Peruvian nuevo sol | | | 6.75 | % | | | 6.64 | % | | No | | | 248,093 | | | | - | | | | 248,093 | | | | - | | | | - | | | | - | | | | 10,418,604 | | | | - | | | | 10,418,604 | | | | 241,654 | | | | - | | | | 241,654 | | | | - | | | | - | | | | - | | | | - | | | | 10,148,198 | | | 10,148,198 |
Foreign | | Edelnor S.A.A. | | Peru | | Foreign | | Rimac Internacional | | Peru | | Peruvian nuevo sol | | | 7.28 | % | | | 7.15 | % | | No | | | 190,009 | | | | - | | | | 190,009 | | | | - | | | | - | | | | - | | | | - | | | | 7,397,209 | | | | 7,397,209 | | | | 185,078 | | | | - | | | | 185,078 | | | | - | | | | - | | | | - | | | | - | | | | 7,205,221 | | | 7,205,221 |
Foreign | | Edelnor S.A.A. | | Peru | | Foreign | | Rimac Internacional | | Peru | | Peruvian nuevo sol | | | 6.50 | % | | | 6.40 | % | | No | | | - | | | | 75,245 | | | | 75,245 | | | | - | | | | - | | | | - | | | | 10,418,604 | | | | - | | | | 10,418,604 | | | | - | | | | 73,293 | | | | 73,293 | | | | - | | | | - | | | | - | | | | - | | | | 10,148,198 | | | 10,148,198 |
Foreign | | Edelnor S.A.A. | | Peru | | Foreign | | Rimac Internacional | | Peru | | Peruvian nuevo sol | | | 7.38 | % | | | 7.24 | % | | No | | | - | | | | 102,450 | | | | 102,450 | | | | - | | | | - | | | | - | | | | - | | | | 12,502,325 | | | | 12,502,325 | | | | - | | | | 99,791 | | | | 99,791 | | | | - | | | | - | | | | - | | | | - | | | | 12,177,838 | | | 12,177,838 |
Foreign | | Edelnor S.A.A. | | Peru | | Foreign | | Rimac Internacional | | Peru | | Peruvian nuevo sol | | | 6.78 | % | | | 6.67 | % | | No | | | - | | | | 310,080 | | | | 310,080 | | | | - | | | | - | | | | - | | | | - | | | | 20,837,209 | | | | 20,837,209 | | | | - | | | | 306,923 | | | | 306,923 | | | | - | | | | - | | | | - | | | | - | | | | 20,296,397 | | | 20,296,397 |
Foreign | | Edelnor S.A.A. | | Peru | | Foreign | | Rimac Internacional | | Peru | | Peruvian nuevo sol | | | 6.34 | % | | | 6.25 | % | | No | | | - | | | | 39,656 | | | | 39,656 | | | | - | | | | - | | | | - | | | | - | | | | 12,502,325 | | | | 12,502,325 | | | | - | | | | 38,627 | | | | 38,627 | | | | - | | | | - | | | | - | | | | - | | | | 12,177,838 | | | 12,177,838 |
Foreign | | Edelnor S.A.A. | | Peru | | Foreign | | Rimac Internacional | | Peru | | Peruvian nuevo sol | | | 5.84 | % | | | 5.76 | % | | No | | | - | | | | 60,884 | | | | 60,884 | | | | - | | | | - | | | | 20,837,209 | | | | - | | | | - | | | | 20,837,209 | | | | - | | | | 59,304 | | | | 59,304 | | | | - | | | | - | | | | - | | | | 20,296,397 | | | | - | | | 20,296,397 |
Foreign | | Edelnor S.A.A. | | Peru | | Foreign | | Rimac Internacional | | Peru | | Peruvian nuevo sol | | | 6.34 | % | | | 6.25 | % | | No | | | 304,643 | | | | - | | | | 304,643 | | | | - | | | | - | | | | - | | | | - | | | | 16,669,767 | | | | 16,669,767 | | | | 291,845 | | | | - | | | | 291,845 | | | | - | | | | - | | | | - | | | | - | | | | 16,237,118 | | | 16,237,118 |
Foreign | | Edelnor S.A.A. | | Peru | | Foreign | | Rimac Internacional | | Peru | | Peruvian nuevo sol | | | 4.81 | % | | | 4.76 | % | | No | | | 139,221 | | | | - | | | | 139,221 | | | | 10,210,232 | | | | - | | | | - | | | | - | | | | - | | | | 10,210,232 | | | | 135,607 | | | | - | | | | 135,607 | | | | - | | | | 9,945,234 | | | | - | | | | - | | | | - | | | 9,945,234 |
Foreign | | Edelnor S.A.A. | | Peru | | Foreign | | Rimac Internacional | | Peru | | Peruvian nuevo sol | | | 6.13 | % | | | 6.03 | % | | No | | | 406,991 | | | | - | | | | 406,991 | | | | - | | | | - | | | | 14,586,046 | | | | - | | | | - | | | | 14,586,046 | | | | - | | | | - | | | | - | | | | - | | | | - | | | | - | | | | - | | | | - | | | - |
Foreign | | Emgesa S.A. E.S.P. | | Colombia | | Foreign | | Bonos A-10 | | Colombia | | CP | | | 8.87 | % | | | 8.59 | % | | No | | | - | | | | - | | | | - | | | | - | | | | - | | | | - | | | | - | | | | - | | | | - | | | | 54,029,298 | | | | - | | | | 54,029,298 | | | | - | | | | - | | | | - | | | | - | | | | - | | | - |
Foreign | | Emgesa S.A. E.S.P. | | Colombia | | Foreign | | Bonos A102 | | Colombia | | CP | | | 8.87 | % | | | 8.59 | % | | No | | | - | | | | - | | | | - | | | | - | | | | - | | | | - | | | | - | | | | - | | | | - | | | | 10,288,151 | | | | - | | | | 10,288,151 | | | | - | | | | - | | | | - | | | | - | | | | - | | | - |
Foreign | | Emgesa S.A. E.S.P. | | Colombia | | Foreign | | Bonos B09-09 | | Colombia | | CP | | | 12.67 | % | | | 12.11 | % | | No | | | 1,472,677 | | | | - | | | | 1,472,677 | | | | - | | | | 48,781,185 | | | | - | | | | - | | | | - | | | | 48,781,185 | | | | 1,307,418 | | | | - | | | | 1,307,418 | | | | - | | | | - | | | | 55,611,108 | | | | - | | | | - | | | 55,611,108 |
Foreign | | Emgesa S.A. E.S.P. | | Colombia | | Foreign | | Bonos B10 | | Colombia | | CP | | | 12.54 | % | | | 11.99 | % | | No | | | 599,598 | | | | - | | | | 599,598 | | | | - | | | | - | | | | 35,783,303 | | | | - | | | | - | | | | 35,783,303 | | | | 530,887 | | | | - | | | | 530,887 | | | | - | | | | - | | | | - | | | | 40,793,373 | | | | - | | | 40,793,373 |
Foreign | | Emgesa S.A. E.S.P. | | Colombia | | Foreign | | Bonos B-103 | | Colombia | | CP | | | 11.87 | % | | | 11.87 | % | | No | | | 3,893,386 | | | | - | | | | 3,893,386 | | | | 38,005,507 | | | | - | | | | - | | | | - | | | | - | | | | 38,005,507 | | | | 3,361,512 | | | | - | | | | 3,361,512 | | | | - | | | | 43,326,710 | | | | - | | | | - | | | | - | | | 43,326,710 |
Foreign | | Emgesa S.A. E.S.P. | | Colombia | | Foreign | | Bonos B12 | | Colombia | | CP | | | 12.88 | % | | | 12.30 | % | | No | | | 614,301 | | | | - | | | | 614,301 | | | | - | | | | - | | | | - | | | | - | | | | 20,026,666 | | | | 20,026,666 | | | | 547,749 | | | | - | | | | 547,749 | | | | - | | | | - | | | | - | | | | - | | | | 22,830,628 | | | 22,830,628 |
Foreign | | Emgesa S.A. E.S.P. | | Colombia | | Foreign | | Bonos B15 | | Colombia | | CP | | | 12.87 | % | | | 12.29 | % | | No | | | 213,136 | | | | - | | | | 213,136 | | | | - | | | | - | | | | - | | | | - | | | | 12,407,680 | | | | 12,407,680 | | | | 190,004 | | | | - | | | | 190,004 | | | | - | | | | - | | | | - | | | | - | | | | 14,144,897 | | | 14,144,897 |
Foreign | | Emgesa S.A. E.S.P. | | Colombia | | Foreign | | Bonos B6-13 | | Colombia | | CP | | | 10.91 | % | | | 10.49 | % | | No | | | 66,722 | | | | - | | | | 66,722 | | | | - | | | | - | | | | 11,047,324 | | | | - | | | | - | | | | 11,047,324 | | | | 56,716 | | | | - | | | | 56,716 | | | | - | | | | - | | | | - | | | | 12,593,838 | | | | - | | | 12,593,838 |
Foreign | | Emgesa S.A. E.S.P. | | Colombia | | Foreign | | Bonos B6-14 | | Colombia | | CP | | | 10.03 | % | | | 8.67 | % | | No | | | 299,818 | | | | - | | | | 299,818 | | | | - | | | | - | | | | - | | | | 24,573,172 | | | | - | | | | 24,573,172 | | | | 247,702 | | | | - | | | | 247,702 | | | | - | | | | - | | | | - | | | | - | | | | 28,012,654 | | | 28,012,654 |
Foreign | | Emgesa S.A. E.S.P. | | Colombia | | Foreign | | Bonos exterior | | Colombia | | CP | | | 10.17 | % | | | 10.17 | % | | No | | | 13,745,374 | | | | - | | | | 13,745,374 | | | | - | | | | - | | | | - | | | | - | | | | 19,368,586 | | | | 19,368,586 | | | | 2,180,810 | | | | - | | | | 2,180,810 | | | | - | | | | - | | | | - | | | | - | | | | 22,942,859 | | | 22,942,859 |
Foreign | | Emgesa S.A. E.S.P. | | Colombia | | Foreign | | Bonos quimbo | | Colombia | | CP | | | 10.17 | % | | | 10.17 | % | | No | | | 1,912,740 | | | | - | | | | 1,912,740 | | | | - | | | | - | | | | - | | | | - | | | | 144,605,973 | | | | 144,605,973 | | | | 15,671,786 | | | | - | | | | 15,671,786 | | | | - | | | | - | | | | - | | | | - | | | | 163,885,784 | | | 163,885,784 |
Foreign | | Emgesa S.A. E.S.P. | | Colombia | | Foreign | | Bonos Quimbo B10 | | Colombia | | CP | | | 10.13 | % | | | 9.77 | % | | No | | | 341,157 | | | | - | | | | 341,157 | | | | - | | | | - | | | | - | | | | - | | | | 67,020,604 | | | | 67,020,604 | | | | 282,892 | | | | - | | | | 282,892 | | | | - | | | | - | | | | - | | | | - | | | | 76,406,981 | | | 76,406,981 |
Foreign | | Emgesa S.A. E.S.P. | | Colombia | | Foreign | | Bonos Quimbo B10-14 | | Colombia | | CP | | | 10.46 | % | | | 10.08 | % | | No | | | 529,437 | | | | - | | | | 529,437 | | | | - | | | | - | | | | - | | | | - | | | | 41,638,617 | | | | 41,638,617 | | | | 443,930 | | | | - | | | | 443,930 | | | | - | | | | - | | | | - | | | | - | | | | 47,472,761 | | | 47,472,761 |
Foreign | | Emgesa S.A. E.S.P. | | Colombia | | Foreign | | Bonos Quimbo B12-13 | | Colombia | | CP | | | 11.71 | % | | | 11.23 | % | | No | | | 524,321 | | | | - | | | | 524,321 | | | | - | | | | - | | | | - | | | | - | | | | 81,102,939 | | | | 81,102,939 | | | | 455,387 | | | | - | | | | 455,387 | | | | - | | | | - | | | | - | | | | - | | | | 92,464,960 | | | 92,464,960 |
Foreign | | Emgesa S.A. E.S.P. | | Colombia | | Foreign | | Bonos Quimbo B15 | | Colombia | | CP | | | 10.26 | % | | | 9.89 | % | | No | | | 230,201 | | | | - | | | | 230,201 | | | | - | | | | - | | | | - | | | | - | | | | 44,675,420 | | | | 44,675,420 | | | | 191,716 | | | | - | | | | 191,716 | | | | - | | | | - | | | | - | | | | - | | | | 50,934,262 | | | 50,934,262 |
Foreign | | Emgesa S.A. E.S.P. | | Colombia | | Foreign | | Bonos Quimbo B16-14 | | Colombia | | CP | | | 10.81 | % | | | 10.39 | % | | No | | | 475,939 | | | | - | | | | 475,939 | | | | - | | | | - | | | | - | | | | - | | | | 36,297,343 | | | | 36,297,343 | | | | 403,310 | | | | - | | | | 403,310 | | | | - | | | | - | | | | - | | | | - | | | | 41,380,613 | | | 41,380,613 |
Foreign | | Emgesa S.A. E.S.P. | | Colombia | | Foreign | | Bonos Quimbo B6-13 | | Colombia | | CP | | | 10.91 | % | | | 10.49 | % | | No | | | 205,848 | | | | - | | | | 205,848 | | | | - | | | | - | | | | 34,082,658 | | | | - | | | | - | | | | 34,082,658 | | | | 174,976 | | | | - | | | | 174,976 | | | | - | | | | - | | | | - | | | | 38,854,059 | | | | - | | | 38,854,059 |
Foreign | | Emgesa S.A. E.S.P. | | Colombia | | Foreign | | Bonos Quimbo B6-14 | | Colombia | | CP | | | 10.03 | % | | | 9.67 | % | | No | | | 357,246 | | | | - | | | | 357,246 | | | | - | | | | - | | | | - | | | | 29,279,709 | | | | - | | | | 29,279,709 | | | | 295,149 | | | | - | | | | 295,149 | | | | - | | | | - | | | | - | | | | - | | | | 33,378,162 | | | 33,378,162 |
91.081.000-6 | | Endesa Chile S.A. | | Chile | | 97.004.000-5 | | Banco Santander 522 Serie-M | | Chile | | U.F. | | | 4.82 | % | | | 4.75 | % | | No | | | - | | | | - | | | | - | | | | - | | | | - | | | | - | | | | - | | | | - | | | | - | | | | - | | | | 508,451 | | | | 508,451 | | | | - | | | | - | | | | - | | | | 22,388,273 | | | | 220,251,255 | | | 242,639,528 |
91.081.000-6 | | Endesa Chile S.A. | | Chile | | 97.004.000-5 | | Banco Santander -317 Serie-H | | Chile | | U.F. | | | 7.17 | % | | | 6.20 | % | | No | | | - | | | | - | | �� | | - | | | | - | | | | - | | | | - | | | | - | | | | - | | | | - | | | | - | | | | 6,054,055 | | | | 6,054,055 | | | | 5,122,437 | | | | 5,122,437 | | | | 5,122,437 | | | | 5,122,437 | | | | 42,939,415 | | | 63,429,163 |
91.081.000-6 | | Endesa Chile S.A. | | Chile | | Foreign | | BNY Mellon - 144 - A | | U.S.A. | | US$ | | | 8.83 | % | | | 8.63 | % | | No | | | - | | | | - | | | | - | | | | - | | | | - | | | | - | | | | - | | | | - | | | | - | | | | 4,361,016 | | | | 121,350,000 | | | | 125,711,016 | | | | - | | | | - | | | | - | | | | - | | | | - | | | - |
91.081.000-6 | | Endesa Chile S.A. | | Chile | | Foreign | | BNY Mellon - Primera Emisión S-2 | | U.S.A. | | US$ | | | 7.40 | % | | | 7.33 | % | | No | | | - | | | | - | | | | - | | | | - | | | | - | | | | - | | | | - | | | | - | | | | - | | | | 1,310,741 | | | | - | | | | 1,310,741 | | | | - | | | | - | | | | - | | | | - | | | | 42,390,409 | | | 42,390,409 |
91.081.000-6 | | Endesa Chile S.A. | | Chile | | Foreign | | BNY Mellon - Primera Emisión S-3 | | U.S.A. | | US$ | | | 8.26 | % | | | 8.13 | % | | No | | | - | | | | - | | | | - | | | | - | | | | - | | | | - | | | | - | | | | - | | | | - | | | | 830,186 | | | | - | | | | 830,186 | | | | - | | | | - | | | | - | | | | - | | | | 18,905,448 | | | 18,905,448 |
91.081.000-6 | | Endesa Chile S.A. | | Chile | | Foreign | | BNY Mellon - Unica 24296 | | U.S.A. | | US$ | | | 4.32 | % | | | 4.25 | % | | No | | | - | | | | - | | | | - | | | | - | | | | - | | | | - | | | | - | | | | - | | | | - | | | | - | | | | 2,177,558 | | | | 2,177,558 | | | | - | | | | - | | | | - | | | | - | | | | 234,941,377 | | | 234,941,377 |
91.081.000-6 | | Endesa Chile S.A. | | Chile | | Foreign | | BNY Mellon - Primera Emisión S-1 | | U.S.A. | | US$ | | | 7.96 | % | | | 7.88 | % | | No | | | - | | | | - | | | | - | | | | - | | | | - | | | | - | | | | - | | | | - | | | | - | | | | 4,098,882 | | | | - | | | | 4,098,882 | | | | - | | | | - | | | | - | | | | - | | | | 123,713,346 | | | 123,713,346 |
94.271.000-3 | | Enersis Américas S.A. | | Chile | | 97.004.000-5 | | Bonos UF 269 | | Chile | | U.F. | | | 7.02 | % | | | 5.75 | % | | No | | | - | | | | 3,417,313 | | | | 3,417,313 | | | | 3,546,564 | | | | 3,750,488 | | | | 3,966,142 | | | | 4,194,193 | | | | 6,097,254 | | | | 21,554,641 | | | | 1,523,693 | | | | 1,592,377 | | | | 3,116,070 | | | | 3,222,604 | | | | 3,407,908 | | | | 3,603,860 | | | | 3,811,083 | | | | 9,689,970 | | | 23,735,425 |
94.271.000-3 | | Enersis Américas S.A. | | Chile | | Foreign | | Yankee bonos 2016 | | U.S.A. | | US$ | | | 7.76 | % | | | 7.40 | % | | No | | | - | | | | 179,549,527 | | | | 179,549,527 | | | | - | | | | - | | | | - | | | | - | | | | - | | | | - | | | | - | | | | 934,411 | | | | 934,411 | | | | 153,936,502 | | | | - | | | | - | | | | - | | | | - | | | 153,936,502 |
94.271.000-3 | | Enersis Américas S.A. | | Chile | | Foreign | | Yankee bonos 2026 | | U.S.A. | | US$ | | | 7.76 | % | | | 6.60 | % | | No | | | - | | | | 3,351 | | | | 3,351 | | | | - | | | | - | | | | - | | | | - | | | | 609,317 | | | | 609,317 | | | | - | | | | 2,863 | | | | 2,863 | | | | - | | | | - | | | | - | | | | - | | | | 520,592 | | | 520,592 |
| | | | | | | | | | | | | | | | | | | | | | | | | | | | | | | | | | | | | | | | | | | | | | | | | | | | | | | | | | | | | | | | | | | | | | | | | | | | | | | | | | | | | | | | | | | | | |
| | | | | | | | | | Total unsecured bonds | | | 73,032,549 | | | | 283,189,038 | | | | 356,221,587 | | | | 237,428,066 | | | | 197,181,217 | | | | 176,261,853 | | | | 92,247,184 | | | | 688,597,087 | | | | 1,391,715,407 | | | | 116,915,693 | | | | 192,009,426 | | | | 308,925,119 | | | | 309,011,927 | | | | 276,500,977 | | | | 230,670,044 | | | | 207,213,267 | | | | 1,542,021,778 | | | 2,565,417,993 |
In Appendix 5, letter b), are shown the estimated future cash flows (undiscounted) that the Group will have to disburse to settle the secured and unsecured liabilities detailed above.
| | |
| The accompanying notes are an integral part of these consolidated financial statements | | |
|
| F-100 |
- Detail of finance lease obligations
| | | | | | | | | | | | | | | | | | | | | | | | | | | | | | | | | | | | | | | | | | | | | | | | | | | | | | | | | | | | | | | | | | | | | | | | | | | | | | | | | | | | |
Tax ID
Number | | Company | | Country | | Tax ID
Number
Financial
Institution | | Financial institution | | Country | | Currency | | Nominal
interest
rate | | December 31, 2015 | | | December 31, 2014 |
| | | | | | | | | Current | | | Non-current | | | Current | | | Non-current |
| | | | | | | | | Less than 90
days | | | More than 90
days | | | Total Current | | | One to
two years | | | Two to three
years | | | Three to four
years | | | Four to five
years | | | More than five
years | | | Total Non-
Current | | | Less than 90
days | | | More than 90
days | | | Total Current | | | One to two
years | | | Two to three
years | | | Three to four
years | | | Four to five
years | | | More than five years | | | Total Non-
Current |
Foreign | | Codensa | | Colombia | | Foreign | | Union Temporal Rentacol | | Colombia | | CP | | 10.80% | | | 62,967 | | | | 199,380 | | | | 262,347 | | | | 266,565 | | | | - | | | | - | | | | - | | | | - | | | | 266,565 | | | | - | | | | - | | | | - | | | | - | | | | - | | | | - | | | | - | | | | - | | | - |
Foreign | | Codensa | | Colombia | | Foreign | | Mareauto Colombia SAS | | Colombia | | CP | | 10.08% | | | 2,598 | | | | 8,198 | | | | 10,796 | | | | 11,936 | | | | 6,433 | | | | - | | | | - | | | | - | | | | 18,369 | | | | - | | | | - | | | | - | | | | - | | | | - | | | | - | | | | - | | | | - | | | - |
Foreign | | Codensa | | Colombia | | Foreign | | Banco Corpbanca | | Colombia | | CP | | 7.27% | | | 19,831 | | | | 31,119 | | | | 50,950 | | | | 22,853 | | | | 13,512 | | | | - | | | | - | | | | - | | | | 36,365 | | | | - | | | | - | | | | - | | | | - | | | | - | | | | - | | | | - | | | | - | | | - |
Foreign | | Edelnor S.A.A. | | Peru | | Foreign | | Banco de Interbank | | Peru | | Peruvian nuevo sol | | 6.13% | | | - | | | | - | | | | - | | | | - | | | | - | | | | - | | | | - | | | | - | | | | - | | | | 43,995 | | | | - | | | | 43,995 | | | | - | | | | - | | | | - | | | | - | | | | - | | | - |
Foreign | | Edelnor S.A.A. | | Peru | | Foreign | | Banco Santander Peru | | Peru | | Peruvian nuevo sol | | 5.79% | | | - | | | | - | | | | - | | | | - | | | | - | | | | - | | | | - | | | | - | | | | - | | | | 16,223 | | | | - | | | | 16,223 | | | | - | | | | - | | | | - | | | | - | | | | - | | | - |
Foreign | | Edelnor S.A.A. | | Peru | | Foreign | | Banco de Crédito | | Peru | | Peruvian nuevo sol | | 5.65% | | | - | | | | - | | | | - | | | | - | | | | - | | | | - | | | | - | | | | - | | | | - | | | | 29,007 | | | | 19,417 | | | | 48,424 | | | | - | | | | - | | | | - | | | | - | | | | - | | | - |
Foreign | | Edelnor S.A.A. | | Peru | | Foreign | | Banco de Interbank | | Peru | | Peruvian nuevo sol | | 5.29% | | | 110,707 | | | | - | | | | 110,707 | | | | - | | | | - | | | | - | | | | - | | | | - | | | | - | | | | 102,834 | | | | 314,402 | | | | 417,236 | | | | 107,597 | | | | - | | | | - | | | | - | | | | - | | | 107,597 |
Foreign | | Edelnor S.A.A. | | Peru | | Foreign | | Banco Continental | | Peru | | Peruvian nuevo sol | | 5.95% | | | 85,240 | | | | 178,308 | | | | 263,548 | | | | - | | | | - | | | | - | | | | - | | | | - | | | | - | | | | 83,365 | | | | 236,019 | | | | 319,384 | | | | 256,430 | | | | - | | | | - | | | | - | | | | - | | | 256,430 |
Foreign | | Edelnor S.A.A. | | Peru | | Foreign | | Banco Continental | | Peru | | Peruvian nuevo sol | | 6.00% | | | 77,976 | | | | 239,624 | | | | 317,600 | | | | - | | | | - | | | | - | | | | - | | | | - | | | | - | | | | 73,417 | | | | 218,216 | | | | 291,633 | | | | 308,894 | | | | - | | | | - | | | | - | | | | - | | | 308,894 |
Foreign | | Edelnor S.A.A. | | Peru | | Foreign | | Banco Continental | | Peru | | Peruvian nuevo sol | | 5.99% | | | 73,719 | | | | 225,872 | | | | 299,591 | | | | 12,084 | | | | - | | | | - | | | | - | | | | - | | | | 12,084 | | | | 68,973 | | | | 206,240 | | | | 275,213 | | | | 291,802 | | | | - | | | | - | | | | - | | | | - | | | 291,802 |
Foreign | | Edelnor S.A.A. | | Peru | | Foreign | | Banco Continental | | Peru | | Peruvian nuevo sol | | 5.98% | | | 65,285 | | | | 199,365 | | | | 264,650 | | | | 89,743 | | | | - | | | | - | | | | - | | | | - | | | | 89,743 | | | | 58,734 | | | | 184,498 | | | | 243,232 | | | | 258,191 | | | | - | | | | - | | | | - | | | | - | | | 258,191 |
Foreign | | Edelnor S.A.A. | | Peru | | Foreign | | Banco Santander Peru | | Peru | | Peruvian nuevo sol | | 5.13% | | | 153,549 | | | | 472,612 | | | | 626,161 | | | | 659,036 | | | | - | | | | - | | | | - | | | | - | | | | 659,036 | | | | - | | | | - | | | | - | | | | - | | | | - | | | | - | | | | - | | | | - | | | - |
Foreign | | EE Piura | | Peru | | Foreign | | Banco de Crédito | | Peru | | US$ | | 5.80% | | | 1,408,471 | | | | 4,225,412 | | | | 5,633,883 | | | | 5,633,883 | | | | 5,633,883 | | | | 5,633,883 | | | | 14,432,002 | | | | - | | | | 31,333,651 | | | | 1,640,658 | | | | 4,921,975 | | | | 6,562,633 | | | | 6,562,631 | | | | 6,562,633 | | | | 6,562,633 | | | | 6,562,633 | | | | 16,811,128 | | | 43,061,658 |
Foreign | | EE Piura | | Peru | | Foreign | | Banco de Crédito | | Peru | | Peruvian nuevo sol | | 5.70% | | | 474,864 | | | | 1,424,592 | | | | 1,899,456 | | | | 1,899,456 | | | | 1,899,456 | | | | 1,899,456 | | | | 4,865,731 | | | | - | | | | 10,564,099 | | | | - | | | | - | | | | - | | | | - | | | | - | | | | - | | | | - | | | | - | | | - |
91.081.000-6 | | Endesa Chile S.A. | | Chile | | 87.509.100-K | | Abengoa Chile | | Chile | | US$ | | 6.50% | | | - | | | | - | | | | - | | | | - | | | | - | | | | - | | | | - | | | | - | | | | - | | | | - | | | | 1,470,563 | | | | 1,470,563 | | | | 2,427,000 | | | | 1,566,150 | | | | 1,667,950 | | | | 1,776,367 | | | | 10,215,436 | | | 17,652,903 |
Foreign | | Edegel S.A.A. | | Peru | | Foreign | | Banco Scotiabank | | Peru | | US$ | | 2.02% | | | 2,484,674 | | | | 7,399,875 | | | | 9,884,549 | | | | 15,599,736 | | | | - | | | | - | | | | - | | | | - | | | | 15,599,736 | | | | 2,122,504 | | | | 6,312,384 | | | | 8,434,888 | | | | 8,416,512 | | | | 13,307,187 | | | | - | | | | - | | | | - | | | 21,723,699 |
Foreign | | Emgesa S.A. E.S.P. | | Colombia | | Foreign | | Banco Corpbanca | | Colombia | | CP | | 10.80% | | | 4,579 | | | | 14,234 | | | | 18,813 | | | | 20,200 | | | | 19,819 | | | | - | | | | - | | | | - | | | | 40,019 | | | | - | | | | - | | | | - | | | | - | | | | - | | | | - | | | | - | | | | - | | | - |
Foreign | | Emgesa S.A. E.S.P. | | Colombia | | Foreign | | Equirent S.A. | | Colombia | | CP | | 6.55% | | | 5,424 | | | | 16,795 | | | | 22,219 | | | | 23,718 | | | | 19,648 | | | | - | | | | - | | | | - | | | | 43,366 | | | | - | | | | - | | | | - | | | | - | | | | - | | | | - | | | | - | | | | - | | | - |
Foreign | | Emgesa S.A. E.S.P. | | Colombia | | Foreign | | Mareauto Colombia SAS | | Colombia | | CP | | 10.08% | | | 795 | | | | 2,372 | | | | 3,167 | | | | 3,650 | | | | 3,217 | | | | - | | | | - | | | | - | | | | 6,867 | | | | - | | | | - | | | | - | | | | - | | | | - | | | | - | | | | - | | | | - | | | - |
| | | | | | | | | | | | | | | | | | | | | | | | | | | | | | | | | | | | | | | | | | | | | | | | | | | | | | | | | | | | | | | | | | | | | | | | | | | | | | | | | | | | | |
| | | | | | Total Leasing | | | 5,030,679 | | | | 14,637,758 | | | | 19,668,437 | | | | 24,242,860 | | | | 7,595,968 | | | | 7,533,339 | | | | 19,297,733 | | | | - | | | | 58,669,900 | | | | 4,239,710 | | | | 13,883,714 | | | | 18,123,424 | | | | 18,629,057 | | | | 21,435,970 | | | | 8,230,583 | | | | 8,339,000 | | | | 27,026,564 | | | 83,661,174 |
In Appendix 5.c), are shown the estimated future cash flows (undiscounted) that the Group will have to disburse to settle the finance lease obligations detailed above.
- Detail of other obligations
| | | | | | | | | | | | | | | | | | | | | | | | | | | | | | | | | | | | | | | | | | | | | | | | | | | | | | | | | | | | | | | | | | | | | | | | | | | | | | | | | | | | |
Tax ID
Number | | Company | | Country | | Tax ID
Number
Financial
Institution | | Financial institution | | Country | | Currency | | Nominal
interest
rate | | December 31, 2015 | | | December 31, 2014 |
| | | | | | | | | Current | | | Non-current | | | Current | | | Non-Current |
| | | | | | | | | Less than 90
days | | | More than 90
days | | | Total Current | | | One to two
years | | | Two to three
years | | | Three to four
years | | | Four to five
years | | | More than five
years | | | Total Non-
Current | | | Less than
90 days | | | More than 90
days | | | Total Current | | | One to two
years | | | Two to three
years | | | Three to four
years | | | Four to
five years | | | More than five
years | | | Total Non-
Current |
Foreign | | Ampla Energía S.A. | | Brazil | | Foreign | | Eletrobras | | Brazil | | Real | | 6.57% | | | - | | | | - | | | | - | | | | - | | | | - | | | | - | | | | - | | | | - | | | | - | | | | 320,904 | | | | 960,799 | | | | 1,281,703 | | | | 1,250,075 | | | | 1,161,274 | | | | 845,534 | | | | 363,042 | | | | 544,563 | | | 4,164,488 |
Foreign | | Ampla Energía S.A. | | Brazil | | Foreign | | Bndes | | Brazil | | Real | | 9.17% | | | 4,668,542 | | | | 16,155,634 | | | | 20,824,176 | | | | 22,376,436 | | | | 18,904,213 | | | | 15,431,989 | | | | 11,215,453 | | | | 8,186,564 | | | | 76,114,655 | | | | 6,342,861 | | | | 17,834,053 | | | | 24,176,914 | | | | 23,778,737 | | | | 23,778,737 | | | | 19,359,315 | | | | 14,939,893 | | | | 15,331,146 | | | 97,187,828 |
Foreign | | Cien S.A. | | Brazil | | Foreign | | Bndes | | Brazil | | Real | | 7.78% | | | 215,214 | | | | 659,135 | | | | 874,349 | | | | 860,857 | | | | 860,857 | | | | 860,857 | | | | 430,428 | | | | - | | | | 3,012,999 | | | | - | | | | 538,196 | | | | 538,196 | | | | 538,196 | | | | 538,196 | | | | 538,196 | | | | 538,196 | | | | 269,098 | | | 2,421,882 |
Foreign | | Coelce S.A. | | Brazil | | Foreign | | Banco do Nordeste | | Brazil | | Real | | 7.85% | | | 951,507 | | | | 2,896,151 | | | | 3,847,658 | | | | 3,806,030 | | | | 3,806,030 | | | | 951,507 | | | | - | | | | - | | | | 8,563,567 | | | | 1,284,981 | | | | 3,646,330 | | | | 4,931,311 | | | | 4,861,773 | | | | 4,861,773 | | | | 4,861,773 | | | | 1,215,443 | | | | - | | | 15,800,762 |
Foreign | | Coelce S.A. | | Brazil | | Foreign | | Eletrobras | | Brazil | | Real | | 6.09% | | | 559,718 | | | | 1,259,783 | | | | 1,819,501 | | | | 1,489,541 | | | | 1,383,305 | | | | 1,269,785 | | | | 1,081,597 | | | | 1,488,913 | | | | 6,713,141 | | | | 588,874 | | | | 1,752,419 | | | | 2,341,293 | | | | 2,278,359 | | | | 2,091,086 | | | | 1,955,381 | | | | 1,810,372 | | | | 3,770,223 | | | 11,905,421 |
Foreign | | Coelce S.A. | | Brazil | | Foreign | | Banco do Brasil | | Brazil | | US$ | | 42.15% | | | - | | | | 17,520 | | | | 17,520 | | | | - | | | | - | | | | - | | | | - | | | | 1,942,995 | | | | 1,942,995 | | | | 14,875 | | | | - | | | | 14,875 | | | | - | | | | - | | | | - | | | | - | | | | 1,688,327 | | | 1,688,327 |
Foreign | | Coelce S.A. | | Brazil | | Foreign | | BNDES | | Brazil | | Real | | 7.98% | | | 1,350,117 | | | | 5,050,186 | | | | 6,400,303 | | | | 7,193,099 | | | | 7,193,099 | | | | 7,193,099 | | | | 4,862,156 | | | | 3,639,085 | | | | 30,080,538 | | | | 1,845,632 | | | | 5,157,750 | | | | 7,003,382 | | | | 6,877,000 | | | | 6,877,000 | | | | 6,877,000 | | | | 6,877,000 | | | | 6,268,860 | | | 33,776,860 |
Foreign | | Coelce S.A. | | Brazil | | Foreign | | Banco Itau | | Brazil | | Real | | 13.27% | | | - | | | | - | | | | - | | | | - | | | | - | | | | - | | | | - | | | | - | | | | - | | | | - | | | | 1,160,712 | | | | 1,160,712 | | | | - | | | | - | | | | - | | | | - | | | | - | | | - |
Foreign | | Coelce S.A. | | Brazil | | Foreign | | Banco do Brasil | | Brazil | | Real | | 12.63% | | | - | | | | - | | | | - | | | | - | | | | - | | | | - | | | | - | | | | - | | | | - | | | | - | | | | 1,074,175 | | | | 1,074,175 | | | | 17,169,326 | | | | 17,169,326 | | | | 17,169,326 | | | | 17,169,326 | | | | - | | | 68,677,304 |
Foreign | | Central Costanera S.A. | | Argentina | | Foreign | | Mitsubishi (secured debt) | | Argentina | | US$ | | 0.25% | | | - | | | | 2,153,867 | | | | 2,153,867 | | | | 2,144,288 | | | | 2,144,288 | | | | 2,144,288 | | | | 2,144,288 | | | | 24,342,682 | | | | 32,919,834 | | | | - | | | | 2,391,399 | | | | 2,391,399 | | | | 7,362,677 | | | | 7,362,678 | | | | 7,362,678 | | | | 4,532,769 | | | | - | | | 26,620,802 |
Foreign | | Central Costanera S.A. | | Argentina | | Foreign | | Otros | | Argentina | | Ar$ | | 17.29% | | | - | | | | - | | | | - | | | | - | | | | - | | | | - | | | | - | | | | - | | | | - | | | | - | | | | 3,099,889 | | | | 3,099,889 | | | | - | | | | - | | | | - | | | | - | | | | - | | | - |
Foreign | | Hidroinvest S.A. | | Argentina | | Foreign | | Otros | | Argentina | | US$ | | 2.33% | | | - | | | | 391,530 | | | | 391,530 | | | | - | | | | - | | | | - | | | | - | | | | - | | | | - | | | | - | | | | 331,928 | | | | 331,928 | | | | - | | | | - | | | | - | | | | - | | | | - | | | - |
Foreign | | Endesa Argentina S.A. | | Argentina | | Foreign | | Otros | | Argentina | | Ar$ | | 30.00% | | | 23,515 | | | | - | | | | 23,515 | | | | - | | | | - | | | | - | | | | - | | | | - | | | | - | | | | 32,719 | | | | - | | | | 32,719 | | | | - | | | | - | | | | - | | | | - | | | | - | | | - |
Foreign | | H. El Chocón S.A. | | Argentina | | Foreign | | Otros | | Argentina | | Ar$ | | 23.54% | | | 16,912,466 | | | | - | | | | 16,912,466 | | | | 4,636,665 | | | | - | | | | - | | | | - | | | | - | | | | 4,636,665 | | | | 513,496 | | | | - | | | | 513,496 | | | | 9,409,124 | | | | - | | | | - | | | | - | | | | - | | | 9,409,124 |
| | | | | | | | | | | | | | | | | | | | | | | | | | | | | | | | | | | | | | | | | | | | | | | | | | | | | | | | | | | | | | | | | | | | | | | | | | | | | | | | | | | | | |
| | | | | | Total other obligations | | | 24,681,079 | | | | 28,583,806 | | | | 53,264,885 | | | | 42,506,916 | | | | 34,291,792 | | | | 27,851,525 | | | | 19,733,922 | | | | 39,600,239 | | | | 163,984,394 | | | | 10,944,342 | | | | 37,947,650 | | | | 48,891,992 | | | | 73,525,267 | | | | 63,840,070 | | | | 58,969,203 | | | | 47,446,041 | | | | 27,872,217 | | | 271,652,798 |
In Appendix 5.d), are shown the estimated future cash flows (undiscounted) that the Group will have to disburse to settle these Other Obligations.
| | |
| The accompanying notes are an integral part of these consolidated financial statements | | |
|
| F-101 |
20.4 Hedged debt
The debt denominated in U.S. dollar for ThCh$933,447,012 held by Enersis Américas as of December 31, 2015, is related to future cash flow hedges for the Group’s U.S. dollar-linked operating income, of which ThCh$119,366,828 corresponds to continuing operations (ThCh$761,130,114 as of December 31, 2014) (See Note 3.n).
The following table details changes in “Reserve for cash flow hedges” for the years ended December 31, 2015, 2014 and 2013 due to exchange differences from this debt:
| | | | | | | | | | | | |
| | | 12-31-2015
ThCh$ | | | 12-31-2014
ThCh$ | | | 12-31-2013
ThCh$ | |
| Balance in hedging reserves (hedging income) at the beginning of the year, net | | | (38,783,599 | ) | | | 2,415,439 | | | | 37,372,801 | |
Foreign currency exchange differences recorded in equity, net | | | (44,992,798) | | | | (31,401,584) | | | | (24,792,601) | |
Recognition of foreign currency exchange differences revenue, net | | | 3,172,291 | | | | (10,086,797) | | | | (10,087,806) | |
Foreign currency translation differences | | | (81,479) | | | | 289,343 | | | | (76,955) | |
Transfer to assets held for distribution to owners | | | 74,953,393 | | | | - | | | | - | |
| Balance in hedging reserves (hedging income) at the end of the year, net | | | (5,732,192 | ) | | | (38,783,599 | ) | | | 2,415,439 | |
20.5 Other information
As of December 31, 2015, the Enersis Américas Group has long-term lines of credit available for use amounting to ThCh$34,332,376 (ThCh$173,337,192 as of December 31, 2014)
| | |
| The accompanying notes are an integral part of these consolidated financial statements | | |
|
| F-102 |
21. RISK MANAGEMENT POLICY.
The Group’s companies are exposed to certain risks that are managed by systems that identify, measure, limit concentration of, and monitor these risks.
The main principles in the Group’s risk management policy include the following:
- Compliance with proper corporate governance standards.
- Strict compliance with all of Group’s internal policies.
- Each business and corporate area determines:
| | I. | The markets in which it can operate based on its knowledge and ability to ensure effective risk management; |
| | II. | Criteria regarding counterparts; |
| | III. | Authorized operators. |
| | - | Business and corporate areas establish their risk tolerance in a manner consistent with the defined strategy for each market in which they operate. |
| | - | All of the operations of the businesses and corporate areas are conducted within the limits approved for each case. |
| | - | Businesses, corporate areas, lines of business and companies design the risk management controls necessary to ensure that transactions in the markets are conducted in accordance with the Enersis Américas policies, standards, and procedures. |
21.1 Interest rate risk
Changes in interest rates affect the fair value of assets and liabilities bearing fixed interest rates, as well as, the expected future cash flows of assets and liabilities subject to floating interest rates.
The objective of managing interest rate risk exposure is to achieve a balance in the debt structure to minimize the cost of debt with reduced volatility in profit or loss.
In compliance with the current interest rate hedging policy, the proportion of fixed debt and/or hedged debt over the net total debt was 58% as of December 31, 2015.
Depending on the Group’s estimates and the objectives of the debt structure, hedging transactions are performed by entering into derivatives contracts that mitigate interest rate risk. Derivative instruments currently used to comply with the risk management policy are interest rate swaps to set floating rate to a fixed rate.
The financial debt structure of the Group detailed by the mostly strongly hedged fixed and floating interest rates on total net debt, net of hedging derivative instruments, is as follows:
Net position:
| | | | | | | | |
| | | 12-31-2015 | | | 12-31-2014 | |
| | | % | | | % | |
Fixed interest rate | | | 58 | % | | | 72 | % |
Floating interest rate | | | 42 | % | | | 28 | % |
Total | | | 100 | % | | | 100 | % |
| | |
| The accompanying notes are an integral part of these consolidated financial statements | | |
|
| F-103 |
21.2 Exchange rate risk
Exchange rate risks involve basically the following transactions:
| | - | Debt taken on by the Group’s companies that is denominated in a currency other than the currency in which its cash flows are indexed. |
| | - | Payments to be made for the acquisition of project-related materials and for corporate insurance policies in a currency other than that in which its cash flows are indexed. |
| | - | Income in Group companies directly linked to changes in currencies other than the currency of its cash flows. |
| | - | Cash flows from foreign subsidiaries to the Chilean parent company which are exposed to exchange rate fluctuations. |
In order to mitigate foreign currency risk, the Group’s foreign currency risk management policy is based on cash flows and includes maintaining a balance between U.S. dollar flows and the levels of assets and liabilities denominated in this currency. The objective is to minimize the exposure to variability in cash flows that are attributable to foreign exchange risk.
The hedging instruments currently being used to comply with the policy are currency swaps and forward exchange contracts. In addition, the policy pursues to refinance debt in the functional currency of each of the Group’s companies.
21.3 Commodities risk
The Group has a risk exposure to price fluctuations in certain commodities, basically due to:
| | - | Purchases of fuel used to generate electricity. |
| | - | Energy purchase/sale transactions that take place in local markets. |
In order to reduce the risk in situations of extreme drought, the Group has designed a commercial policy that defines the levels of sales commitments in line with the capacity of its generating power plants in a dry year. It also includes risk mitigation terms in certain contracts with unregulated customers and with regulated customers subject to long-term tender processes, establishing indexation polynomials that allow for reducing commodities exposure risk.
Considering the operating conditions faced by the power generation market in Chile, with drought and highly volatile commodity prices on international markets, the Company is constantly evaluating the use of hedging to minimize the impacts that these price fluctuations have on its results. As of December 31, 2015 and 2014, there are no commodity derivatives transactions.
21.4 Liquidity risk
The Group maintains a liquidity risk management policy that consists of entering into long-term committed banking facilities and temporary financial investments for amounts that cover the projected needs over a period of time that is determined based on the situation and expectations for debt and capital markets.
The projected needs mentioned above include maturities of financial debt net of financial derivatives. For further details regarding the features and conditions of financial obligations and financial derivatives (See Notes 19, 21, and Appendix 5).
As of December 31, 2015, the Enersis Américas’ Group has cash and cash equivalents for ThCh$1,185,163,344 and unconditionally available lines of long-term credit for ThCh$34,332,376. As of December 31, 2014, the Group had cash and cash equivalents for ThCh$1,704,745,491 and unconditionally available lines of long-term credit for ThCh$173,337,192.
| | |
| The accompanying notes are an integral part of these consolidated financial statements | | |
|
| F-104 |
21.5 Credit risk
The Enersis Américas Group closely monitors its credit risk.
Trade receivables:
The credit risk for receivables from the Group’s commercial activity has historically been very low, due to the short term period of collections from customers, resulting in non-significant cumulative receivables amounts. This situation applies to the electricity generating and distribution lines of business.
In our electricity generating business, some countries’ regulations allow suspending the energy service to customers with outstanding payments, and most contracts have termination clauses for payment default. The Company monitors its credit risk on an ongoing basis and measures quantitatively its maximum exposure to payment default risk, which, as stated above, is very low.
In our electricity distribution companies, the suspension of energy service to customers in payment default is permitted in all cases, in accordance with current regulations in each country. This facilitates our credit risk management, which is also low in this line of business.
Financial assets:
Cash surpluses are invested in the highest-rated local and foreign financial entities (with risk rating equivalent to investment grade where possible) with thresholds established for each entity.
Banks that have received investment grade ratings from the three major international rating agencies (Moody’s, S&P, and Fitch) are selected for making investments.
Investments may be backed with treasury bonds from the countries in which the company operates and/or with commercial papers issued by the highest rated banks; the latter are preferable as they offer higher returns (always in line with current investment policies).
Derivative instruments are entered into with entities with solid creditworthiness; all derivative transactions are performed with entities with investment grade ratings.
21.6 Risk measurement
The Enersis Américas Group measures the Value at Risk (VaR) of its debt positions and financial derivatives in order to monitor the risk assumed by the Company, thereby reducing volatility in the income statement.
The portfolio of positions included for purposes of calculating the present Value at Risk include:
| | - | Hedge derivatives for debt, dividends, and projects. |
The VaR determined represents the potential variation in value of the portfolio of positions described above in a quarter with a 95% confidence level. To determine the VaR, we take into account the volatility of the risk variables affecting the value of the portfolio of positions, with respect to the U.S. dollar, including:
| | - | U.S. dollar Libor interest rate. |
| | |
| The accompanying notes are an integral part of these consolidated financial statements | | |
|
| F-105 |
| | - | The different currencies with which our companies operate and the customary local indices used in the banking industry. |
| | - | The exchange rates of the various currencies used in the calculation. |
The calculation of VaR is based on generating possible future scenarios (at one quarter) of market values (both spot and term) for the risk variables, using Bootstrapping simulations.
The quarter 95%-confidence VaR number is calculated as the 5% percentile most adverse of the quarterly possible fluctuations.
Taking into consideration the assumptions previously described, the quarter VaR of the previously discussed positions was ThCh$84,347,418.
This value represents the potential increase of the Debt and Derivatives’ Portfolio, thus these Values at Risk are inherently related, among other factors, to the Portfolio’s value at each quarter end.
| | |
| The accompanying notes are an integral part of these consolidated financial statements | | |
|
| F-106 |
22. FINANCIAL INSTRUMENTS.
22.1 Financial instruments, classified by type and category
a) The detail of financial assets, classified by type and category, as of December 31, 2015 and 2014, is as follows:
| | | | | | | | | | | | | | | | | | | | | | | | |
| | | 12-31-2015 | |
| | | Financial assets held for trading | | | Financial assets at fair
value through profit or loss | | | Held-to-maturity
investments | | | Loans and
receivables | | | Available-for-sale
financial assets | | | Financial
derivatives for
hedging | |
| | | ThCh$ | | | ThCh$ | | | ThCh$ | | | ThCh$ | | | ThCh$ | | | ThCh$ | |
| | | | | | | | | | | | | | | | | | | | | | | | |
Derivative instruments | | | 4,427,286 | | | | - | | | | - | | | | - | | | | - | | | | 1,172,125 | |
Other financial assets | | | - | | | | 35,467,539 | | | | 27,195,496 | | | | 1,045,820,479 | | | | - | | | | - | |
Total Current | | | 4,427,286 | | | | 35,467,539 | | | | 27,195,496 | | | | 1,045,820,479 | | | | - | | | | 1,172,125 | |
| | | | | | | | | | | | | | | | | | | | | | | | |
Equity instruments | | | - | | | | - | | | | - | | | | - | | | | 616,296 | | | | - | |
Derivative instruments | | | - | | | | - | | | | - | | | | - | | | | - | | | | 978,556 | |
Other financial assets | | | - | | | | - | | | | 39,673 | | | | 364,516,870 | | | | 487,893,679 | | | | - | |
Total Non-current | | | - | | | | - | | | | 39,673 | | | | 364,516,870 | | | | 488,509,975 | | | | 978,556 | |
| | | | | | | | | | | | | | | | | | | | | | | | |
Total | | | 4,427,286 | | | | 35,467,539 | | | | 27,235,169 | | | | 1,410,337,349 | | | | 488,509,975 | | | | 2,150,681 | |
| | | | | | |
| | | | | | | | | | | | | | | | | | | | | | | | |
| | | 12-31-2014 | |
| | | Financial assets held
for trading | | | Financial assets at fair
value through
profit or loss | | | Held-to-maturity
investments | | | Loans and
receivables | | | Available-for-sale
financial assets | | | Financial derivatives for hedging | |
| | | ThCh$ | | | ThCh$ | | | ThCh$ | | | ThCh$ | | | ThCh$ | | | ThCh$ | |
| | | | | | | | | | | | | | | | | | | | | | | | |
Derivative instruments | | | 7,061,715 | | | | - | | | | - | | | | - | | | | - | | | | 1,414,588 | |
Other financial assets | | | - | | | | 52,677,337 | | | | 38,301,763 | | | | 1,700,128,243 | | | | - | | | | - | |
Total Current | | | 7,061,715 | | | | 52,677,337 | | | | 38,301,763 | | | | 1,700,128,243 | | | | - | | | | 1,414,588 | |
| | | | | | | | | | | | | | | | | | | | | | | | |
Equity instruments | | | - | | | | - | | | | - | | | | - | | | | 4,306,227 | | | | - | |
Derivative instruments | | | 22,002 | | | | - | | | | - | | | | - | | | | - | | | | 7,229,290 | |
Other financial assets | | | - | | | | - | | | | 26,340,396 | | | | 292,128,280 | | | | 492,923,605 | | | | - | |
Total Non-current | | | 22,002 | | | | - | | | | 26,340,396 | | | | 292,128,280 | | | | 497,229,832 | | | | 7,229,290 | |
| | | | | | | | | | | | | | | | | | | | | | | | |
Total | | | 7,083,717 | | | | 52,677,337 | | | | 64,642,159 | | | | 1,992,256,523 | | | | 497,229,832 | | | | 8,643,878 | |
| | |
| The accompanying notes are an integral part of these consolidated financial statements | | |
|
| F-107 |
b)The detail of financial liabilities, classified by type and category, as of December 31, 2015 and 2014, is as follows:
| | | | | | | | | | | | |
| | | December 31, 2015 | |
| | | Financial liabilities held for trading ThCh$ | | | Loans and payables ThCh$ | | | Financial derivatives for hedging ThCh$ | |
| | | | | | | | | | | | |
Interest-bearing loans | | | - | | | | 617,276,453 | | | | - | |
Derivative instruments | | | 1,052,026 | | | | - | | | | 69,545,029 | |
Other financial liabilities | | | - | | | | 1,447,306,354 | | | | - | |
Total Current | | | 1,052,026 | | | | 2,064,582,807 | | | | 69,545,029 | |
| | | | | | | | | | | | |
Interest-bearing loans | | | - | | | | 1,846,995,721 | | | | - | |
Derivative instruments | | | - | | | | - | | | | 300,871 | |
Other financial liabilities | | | - | | | | 244,079,004 | | | | - | |
Total Non-current | | | - | | | | 2,091,074,725 | | | | 300,871 | |
| | | | | | | | | | | | |
Total | | | 1,052,026 | | | | 4,155,657,532 | | | | 69,845,900 | |
| | | | | | | | | | | | |
| | | | | | | | | | | | |
| | | December 31, 2014 | |
| | | Financial liabilities held for trading ThCh$ | | | Loans and payables ThCh$ | | | Financial derivatives for hedging ThCh$ | |
Interest-bearing loans | | | - | | | | 418,266,381 | | | | - | |
Derivative instruments | | | 2,544,239 | | | | - | | | | 995,059 | |
Other financial liabilities | | | - | | | | 2,432,557,572 | | | | - | |
Total Current | | | 2,544,239 | | | | 2,850,823,953 | | | | 995,059 | |
| | | | | | | | | | | | |
Interest-bearing loans | | | - | | | | 3,167,948,954 | | | | - | |
Derivative instruments | | | 6,286,982 | | | | - | | | | 114,861,592 | |
Other financial liabilities | | | - | | | | 159,385,521 | | | | - | |
Total Non-current | | | 6,286,982 | | | | 3,327,334,475 | | | | 114,861,592 | |
| | | | | | | | | | | | |
Total | | | 8,831,221 | | | | 6,178,158,428 | | | | 115,856,651 | |
| | |
| The accompanying notes are an integral part of these consolidated financial statements | | |
|
| F-108 |
22.2 Derivative instruments
The risk management policy of the Group uses primarily interest rate and foreign exchange rate derivatives to hedge its exposure to interest rate and foreign currency risks.
The Company classifies its hedges as follows:
| | - | Cash flow hedges: Those that hedge the cash flows of the underlying hedged item. |
| | - | Fair value hedges: Those that hedge the fair value of the underlying hedged item. |
- Non-hedge derivatives: Financial derivatives that do not meet the requirements established by IFRS to be designated as hedging instruments are recognized at fair value through profit or loss (financial assets held for trading).
| | a) | Assets and liabilities for hedge derivative instruments |
As of December 31, 2015 and 2014, financial derivative qualifying as hedging instruments resulted in recognition of the following assets and liabilities in the statement of financial position:
| | | | | | | | | | | | | | | | | | | | | | | | | | | | | | | | |
| | | 12-31-2015 | | | 12-31-2014 | |
| | | Assets | | | Liabilities | | | Assets | | | Liabilities | |
| | | Current
ThCh$ | | | Non-current
ThCh$ | | | Current
ThCh$ | | | Non-current
ThCh$ | | | Current
ThCh$ | | | Non-current
ThCh$ | | | Current
ThCh$ | | | Non-current
ThCh$ | |
Interest rate hedge: | | | 908,115 | | | | 978,556 | | | | 11,177 | | | | 300,871 | | | | 193,246 | | | | 3,533,655 | | | | 14,637 | | | | 582,788 | |
Cash flow hedge | | | 908,115 | | | | 978,556 | | | | 11,177 | | | | 300,871 | | | | 193,246 | | | | 3,533,655 | | | | 14,637 | | | | 582,788 | |
Exchange rate hedge: | | | 264,010 | | | | - | | | | 69,533,852 | | | | - | | | | 1,221,342 | | | | 3,695,636 | | | | 980,421 | | | | 114,278,805 | |
Cash flow hedge | | | 264,010 | | | | - | | | | 69,533,852 | | | | - | | | | 1,221,342 | | | | 3,695,636 | | | | 980,421 | | | | 114,278,805 | |
TOTAL | | | 1,172,125 | | | | 978,556 | | | | 69,545,029 | | | | 300,871 | | | | 1,414,588 | | | | 7,229,291 | | | | 995,058 | | | | 114,861,593 | |
- General information on hedge derivative instruments
Hedging derivative instruments and their corresponding hedged instruments are shown in the following table:
| | | | | | | | |
Detail of Hedge
Instruments | | Description of Hedge
Instrument | | Description of Hedged Instrument | | Fair Value of Hedged
Instruments
12/31/2015 ThCh$ | | Fair Value of Hedged
Instruments
12/31/2014 ThCh$ |
SWAP | | Interest rate | | Bank loans | | 1,574,623 | | 3,129,476 |
SWAP | | Exchange rate | | Unsecured obligations (bonds) | | (69,269,842) | | (110,342,248) |
As of December 31, 2015 and 2014, the Group has not recognized significant gains or losses for ineffective cash flow hedges.
For fair value hedges the gain or losses recognized on the hedging instrument and on the underlying hedged item is detailed in the following table:
| | | | | | | | | | | | | | | | | | | | | | | | |
| | | 12-31-2015 | | | 12-31-2014 | | | 12-31-2013 | |
| | Gains
ThCh$ | | | Losses
ThCh$ | | | Gains
ThCh$ | | | Losses
ThCh$ | | | Gains
ThCh$ | | | Losses
ThCh$ | |
Hedging instrument | | | - | | | | - | | | | 610,861 | | | | - | | | | 697,443 | | | | - | |
Hedged item | | | - | | | | - | | | | - | | | | 1,090,341 | | | | - | | | | 1,556,853 | |
TOTAL | | | - | | | | - | | | | 610,861 | | | | 1,090,341 | | | | 697,443 | | | | 1,556,853 | |
| | |
| The accompanying notes are an integral part of these consolidated financial statements | | |
|
| F-109 |
| | b) | Financial derivative instruments assets and liabilities at fair value through profit or loss |
As of December 31, 2015 and 2014, financial derivative transactions recognized at fair value through profit or loss, resulted in the recognition of the following assets and liabilities in the statement of financial position:
| | | | | | | | | | | | | | | | | | | | | | | | | | | | | | | | |
| | | 12-31-2015 | | | 12-31-2014 | |
| | | Assets | | | Liabilities | | | Assets | | | Liabilities | | | Assets | | | Liabilities | | | Assets | | | Liabilities | |
| | | Current
ThCh$ | | | Current
ThCh$ | | | Non-current
ThCh$ | | | Non-current
ThCh$ | | | Current
ThCh$ | | | Current
ThCh$ | | | Non-current
ThCh$ | | | Non-current
ThCh$ | |
| | | | | | | | | | | | | | | | | | | | | | | | | | | | | | | | |
| Non-hedging derivative instrument | | | 4,427,286 | | | | 1,052,026 | | | | - | | | | - | | | | 7,061,715 | | | | 2,544,239 | | | | 22,002 | | | | 6,286,982 | |
c) Other information on derivatives:
The following table sets forth the fair value of hedging and non-hedging derivatives entered into by the Group as well as the remaining contractual maturities as of December 31, 2015 and 2014:
| | | | | | | | | | | | | | | | | | | | | | | | | | |
| Financial derivatives | | December 31, 2015 |
| | Fair value | | | Notional Amount |
| | | Less than 1 year | | | 1-2 years | | | 2-3 years | | | 3-4 years | | | 4-5 years | | | Total |
| | | ThCh$ | | | ThCh$ | | | ThCh$ | | | ThCh$ | | | ThCh$ | | | ThCh$ | | | ThCh$ |
| Interest rate hedge: | | | 1,574,623 | | | | 38,204,658 | | | | 22,314,853 | | | | - | | | | - | | | | - | | | 60,519,511 |
Cash flow hedge | | | 1,574,623 | | | | 38,204,658 | | | | 22,314,853 | | | | - | | | | - | | | | - | | | 60,519,511 |
| Exchange rate hedge: | | | (69,269,842) | | | | 308,412,252 | | | | - | | | | - | | | | - | | | | - | | | 308,412,252 |
Cash flow hedge | | | (69,269,842) | | | | 308,412,252 | | | | - | | | | - | | | | - | | | | - | | | 308,412,252 |
| Derivatives not designated for hedge accounting | | | 3,375,260 | | | | 44,663,462 | | | | - | | | | - | | | | - | | | | - | | | 44,663,462 |
Total | | | (64,319,959) | | | | 391,280,372 | | | | 22,314,853 | | | | - | | | | - | | | | - | | | 413,595,225 |
| | | | | | | |
| | | | | | | | | | | | | | | | | | | | | | | | | | |
| Financial derivatives | | December 31, 2014 |
| | Fair value | | | Notional Amount |
| | | Less than 1 year | | | 1-2 years | | | 2-3 years | | | 3-4 years | | | 4-5 years | | | Total |
| | | ThCh$ | | | ThCh$ | | | ThCh$ | | | ThCh$ | | | ThCh$ | | | ThCh$ | | | ThCh$ |
| Interest rate hedge: | | | 3,129,476 | | | | 19,580,330 | | | | 46,306,386 | | | | 34,138,973 | | | | - | | | | - | | | 100,025,689 |
Cash flow hedge | | | 3,129,476 | | | | 19,580,330 | | | | 46,306,386 | | | | 34,138,973 | | | | - | | | | - | | | 100,025,689 |
| Exchange rate hedge: | | | (110,342,248) | | | | 7,029,775 | | | | 233,262,249 | | | | - | | | | - | | | | 260,451,370 | | | 500,743,394 |
Cash flow hedge | | | (110,342,248) | | | | 7,029,775 | | | | 233,262,249 | | | | - | | | | - | | | | 260,451,370 | | | 500,743,394 |
| Derivatives not designated for hedge accounting | | | (1,747,504) | | | | 133,409,820 | | | | 46,908,791 | | | | 45,078,924 | | | | 19,426,499 | | | | - | | | 244,824,034 |
Total | | | (108,960,276) | | | | 160,019,925 | | | | 326,477,426 | | | | 79,217,897 | | | | 19,426,499 | | | | 260,451,370 | | | 845,593,117 |
The hedging and non-hedging derivatives contractual maturities do not represent the Group’s total risk exposure, as the amounts presented in the above tables have been drawn up based on undiscounted contractual cash inflows and outflows for their settlement.
| | |
| The accompanying notes are an integral part of these consolidated financial statements | | |
|
| F-110 |
22.3 Fair value hierarchies
Financial instruments recognized at fair value in the consolidated statement of financial position are classified based on the hierarchies described in Note 3.h.
The following table presents financial assets and liabilities measured at fair value as of December 31, 2015 and 2014:
| | | | | | | | | | | | | | | | |
Financial Instruments Measured at Fair Value | | | Fair Value Measured at End of Reporting Period
Using: | |
| | | | | | | | | | | | | | | | |
| | | 12-31-2015 ThCh$ | | | Level 1 ThCh$ | | | Level 2 ThCh$ | | | Level 3 ThCh$ | |
Financial Assets | | | | | | | | | | | | | | | | |
| Financial derivatives designated as cash flow hedge | | | 2,150,681 | | | | - | | | | 2,150,681 | | | | - | |
| Financial derivatives not designated for hedge accounting | | | 4,427,286 | | | | - | | | | 4,427,286 | | | | - | |
| Financial assets at fair value through profit or loss | | | 35,467,539 | | | | 35,467,539 | | | | - | | | | - | |
| Available-for-sale financial assets, non-current | | | 487,893,679 | | | | - | | | | 487,893,679 | | | | - | |
| Total | | | 529,939,185 | | | | 35,467,539 | | | | 494,471,646 | | | | - | |
| Financial Liabilities | | | | | | | | | | | | | | | | |
| Financial derivatives designated as cash flow hedge | | | 69,845,900 | | | | - | | | | 69,845,900 | | | | - | |
| Financial derivatives not designated for hedge accounting | | | 1,052,026 | | | | - | | | | 1,052,026 | | | | - | |
Total | | | 70,897,926 | | | | - | | | | 70,897,926 | | | | - | |
| | |
Financial Instruments Measured at Fair Value | | | Fair Value Measured at End of Reporting Period
Using: | |
| | | | | | | | | | | | | | | | |
| | | 12-31-2014 | | | Level 1 | | | Level 2 | | | Level 3 | |
| | | ThCh$ | | | ThCh$ | | | ThCh$ | | | ThCh$ | |
Financial Assets | | | | | | | | | | | | | | | | |
| Financial derivatives designated as cash flow hedge | | | 8,643,878 | | | | - | | | | 8,643,878 | | | | - | |
| Financial derivatives not designated for hedge accounting | | | 7,083,717 | | | | - | | | | 7,083,717 | | | | - | |
| Financial assets at fair value through profit or loss | | | 52,677,337 | | | | 52,677,337 | | | | - | | | | - | |
| Available-for-sale financial assets, non-current | | | 492,954,649 | | | | 31,044 | | | | 492,923,605 | | | | - | |
| Total | | | 561,359,581 | | | | 52,708,381 | | | | 508,651,200 | | | | - | |
| Financial Liabilities | | | | | | | | | | | | | | | | |
| Financial derivatives designated as cash flow hedge | | | 115,856,651 | | | | - | | | | 115,856,651 | | | | - | |
| Financial derivatives not designated for hedge accounting | | | 8,831,221 | | | | - | | | | 8,831,221 | | | | - | |
Total | | | 124,687,872 | | | | - | | | | 124,687,872 | | | | - | |
22.3.1 Financial instruments whose fair value measurement is classified as Level 3:
The Company entered into certain transaction that resulted in the recognition of a financial liability measured at fair value. The Level 3 fair value is calculated by applying a traditional discounted cash flow method. These projected cash flows include assumptions internally developed by the Company that are primarily based on estimates for prices and levels of energy production and firm capacity, as well as the costs of operating and maintaining some of our power plants.
None of the possible reasonable scenarios foreseeable in the assumptions mentioned in the above paragraph would result in a significant change in the fair value of the financial instruments included at this level. The fair value of the financial liability mentioned above was nil as of December 31, 2015, 2014 and 2013.
| | |
| The accompanying notes are an integral part of these consolidated financial statements | | |
|
| F-111 |
23. TRADE AND OTHER CURRENT PAYABLES.
The detail of Trade and Other Payables as of December 31, 2015 and 2014, is as follows:
| | | | | | | | | | | | | | | | |
| | | Current | | | Non-current | |
| | | | | |
| Trade and other payables | | 12-31-2015 ThCh$ | | | 12-31-2014 ThCh$ | | | 12-31-2015 ThCh$ | | | 12-31-2014 ThCh$ | |
Trade payables | | | 459,144,350 | | | | 822,851,379 | | | | 2,247,156 | | | | 7,147,088 | |
Other payables | | | 993,679,857 | | | | 1,466,025,571 | | | | 281,297,098 | | | | 152,238,433 | |
Total | | | 1,452,824,207 | | | | 2,288,876,950 | | | | 283,544,254 | | | | 159,385,521 | |
The detail of Trade and Other Current Payables as of December 31, 2015 and 2014, is as follows:
| | | | | | | | | | | | | | | | |
| | | Current | | | Non-current | |
| | | | One to five years | |
| Trade and other payables | | 12-31-2015
ThCh$ | | | 12-31-2014
ThCh$ | | | 12-31-2015
ThCh$ | | | 12-31-2014
ThCh$ | |
Energy suppliers (1) | | | 420,027,375 | | | | 762,931,782 | | | | 2,247,156 | | | | 7,147,088 | |
Fuel and gas suppliers | | | 39,116,975 | | | | 59,919,597 | | | | - | | | | - | |
Payables for goods and services | | | 570,627,472 | | | | 792,235,405 | | | | 208,653,963 | | | | 111,531,445 | |
Dividends payable to non-controlling interests | | | 106,531,865 | | | | 327,360,126 | | | | - | | | | - | |
Fines and complaints (2) | | | 94,165,502 | | | | 98,470,156 | | | | - | | | | - | |
Research and development | | | 12,867,918 | | | | 18,071,828 | | | | 17,940,704 | | | | 24,157,710 | |
Taxes payables other than income tax | | | 41,337,748 | | | | 66,919,568 | | | | 2,648,714 | | | | 7,304,354 | |
VAT debit | | | 43,676,292 | | | | 30,612,286 | | | | 39,465,249 | | | | - | |
Mitsubishi contract (LTSA) | | | 15,390,966 | | | | 34,214,611 | | | | - | | | | - | |
Obligations for social programs | | | 18,768,357 | | | | 12,869,529 | | | | - | | | | - | |
Interest payments on trade payables | | | 66,768,001 | | | | 44,497,783 | | | | - | | | | - | |
Other payables | | | 23,545,736 | | | | 40,774,279 | | | | 12,588,468 | | | | 9,244,924 | |
Total | | | 1,452,824,207 | | | | 2,288,876,950 | | | | 283,544,254 | | | | 159,385,521 | |
See Note 21.4 for the description of the liquidity risk management policy.
(1) Includes M$114,103,977 in liabilities owed to CAMMESA by our subsidiary Argentine Edesur S.A. These liabilities are greater than the account receivable recognized by Edesur as part of the implementation of Resolution N°250/13 - Cost Monitoring Mechanism (“MMC”). This resolution instructed CAMMESA to issue Sales Liquidation with Expiration Dates to Define (“LVFVD”) in favor of Edesur for accounts receivables, and accept these LVFVD as part payment of the debts of Edesur.
(2) Corresponds mainly to fines and complaints that our Argentine subsidiary Edesur S.A. has received during the current period and prior years from the regulatory agency due to business service quality, technical product quality, and public safety. These fines have not been paid, as some were suspended under the Agreement Act signed in 2007 with the Argentine government, and others are pending until the Integral Tariff Review (“ITR”) takes place (see Note 4.2).
The detail of trade payables, both up to date and past due as of December 31, 2015 and 2014, are presented in Appendix 8.
| | |
| The accompanying notes are an integral part of these consolidated financial statements | | |
|
| F-112 |
24. PROVISIONS.
| | a) | The detail of provisions as of December 31, 2015 and 2014, is as follows: |
| | | | | | | | | | | | | | | | |
| Provisions | | Current | | | Non-current | |
| | 12-31-2015
ThCh$ | | | 12-31-2014
ThCh$ | | | 12-31-2015
ThCh$ | | | 12-31-2014
ThCh$ | |
Provision for legal proceedings | | | 42,090,525 | | | | 58,620,425 | | | | 144,855,586 | | | | 165,347,715 | |
Decommissioning or restoration (1) | | | 750,345 | | | | 568,465 | | | | 6,328,957 | | | | 31,647,729 | |
Provision for environmental issues | | | 73,381,544 | | | | 9,675,454 | | | | 31,880,082 | | | | 248,397 | |
Other provisions | | | 11,076,762 | | | | 21,358,340 | | | | 783,659 | | | | - | |
Total | | | 127,299,176 | | | | 90,222,684 | | | | 183,848,284 | | | | 197,243,841 | |
(1) See Note 3a
The expected timing and amount of any cash outflows related to the above provisions is uncertain and depends on the final resolution of the related matters.
| | b) | Changes in provisions as of December 31, 2015 and 2014, are as follows: |
| | | | | | | | | | | | | | | | |
| Provisions | | Legal Proceedings ThCh$ | | | Decommissioning or
Restoration ThCh$ | | | Environmental and Other
Provisions (3)
ThCh$ | | | Total ThCh$ | |
Changes in Provisions | | | | | | | | | | | | | | | | |
Balance as of January 1, 2015 | | | 223,968,140 | | | | 32,216,194 | | | | 31,282,191 | | | | 287,466,525 | |
Additional provisions | | | - | | | | - | | | | - | | | | - | |
Increase (decrease) in existing provisions | | | 22,857,949 | | | | 24,158,277 | | | | 106,100,964 | | | | 153,117,190 | |
Provisions used | | | (25,239,603) | | | | (7,275) | | | | (12,262,416) | | | | (37,509,294) | |
Increase from adjustment to time value of money | | | 31,412,199 | | | | 2,031,788 | | | | 23,054,386 | | | | 56,498,373 | |
Foreign currency translation | | | (32,537,015) | | | | (234,141) | | | | (24,082,348) | | | | (56,853,504) | |
Transfer to non-current assets held for distribution to owners (2) | | | (14,829,363) | | | | (51,085,541) | | | | (6,530,431) | | | | (72,445,335) | |
Other increase (decrease) | | | (18,686,196) | | | | - | | | | (440,299) | | | | (19,126,495) | |
Total changes in provisions | | | (37,022,029) | | | | (25,136,892) | | | | 85,839,856 | | | | 23,680,935 | |
Balance as of December 31, 2015 | | | 186,946,111 | | | | 7,079,302 | | | | 117,122,047 | | | | 311,147,460 | |
| | | | | | | | | | | | | | | | |
| Provisions | | Legal Proceedings ThCh$ | | | Decommissioning or Restoration ThCh$ | | | Environmental and
Other
Provisions
ThCh$ | | | Total ThCh$ | |
Changes in Provisions | | | | | | | | | | | | | | | | |
Balance as of January 1, 2014 | | | 221,031,705 | | | | 24,109,594 | | | | 36,135,417 | | | | 281,276,716 | |
Additional provisions | | | - | | | | 6,857,384 | | | | - | | | | 6,857,384 | |
Increase (decrease) in existing provisions | | | 46,561,327 | | | | 15,850 | | | | 25,802,254 | | | | 72,379,431 | |
Provisions used | | | (41,501,294) | | | | - | | | | (9,941,920) | | | | (51,443,214) | |
Increase from adjustment to time value of money | | | 13,396,466 | | | | 1,135,525 | | | | 33,735,093 | | | | 48,267,084 | |
Foreign currency translation | | | 2,742,310 | | | | 97,841 | | | | (8,494,789) | | | | (5,654,638) | |
Other increase (decrease) | | | (18,262,374) | | | | - | | | | (45,953,864) | | | | (64,216,238) | |
Total changes in provisions | | | 2,936,435 | | | | 8,106,600 | | | | (4,853,226) | | | | 6,189,809 | |
Balance as of December 31, 2014 | | | 223,968,140 | | | | 32,216,194 | | | | 31,282,191 | | | | 287,466,525 | |
(2) See Note 5.1.a)
(3) Mainly corresponds to environmental provisions related to El Quimbo project in Colombia (400 MW) for ThCh$103,841,534.
| | |
| The accompanying notes are an integral part of these consolidated financial statements | | |
|
| F-113 |
25. EMPLOYEE BENEFIT OBLIGATIONS.
25.1 General information
Enersis Américas and certain of its subsidiaries in Chile, Brazil, Colombia, Peru and Argentina granted various post-employment benefits for all or certain of their active or retired employees. These benefits are calculated and recognized in the financial statements according to the policy described in Note 3.m.1, and include primarily the following:
a) Defined benefit plans:
| | • | | Complementary pension: The beneficiary is entitled to receive a monthly amount that supplements the pension obtained from the respective social security system. |
| | • | | Employee severance indemnities: The beneficiary receives a certain number of contractual salaries upon retirement. Such benefit is subject to a vesting minimum service requirement period, which depending on the company, varies within a range from 5 to 15 years. |
| | • | | Electricity: The beneficiary receives a monthly bonus to cover a portion of his/her billed residential electricity consumption. |
| | • | | Health benefit: The beneficiary receives health coverage in addition to that s/he is entitled under applicable social security regime. |
b) Other benefits
Five-year benefit: A benefit certain employees receive after 5 years and which begin to accrue from the second year onwards.
Unemployment: A benefit paid regardless of whether the employee is fired or leaves voluntarily. This benefit accrues on a daily basis and is paid at the time of contract termination (although the law allows for partial withdrawals for housing and education).
Seniority bonuses: There is an agreement to give workers (“subject to the collective agreement”) an extraordinary bonus for years of service upon completion of the equivalent of five years of actual work.
c) Defined contribution benefits:
The Group makes contributions to a retirement benefit plan where the beneficiary receives additional pension supplements upon his/her retirement, disability or death.
25.2 Details, changes and presentation in financial statements
| | a) | The post-employment obligations associated with defined benefits plans and the related plan assets as of December 31, 2015 and 2014, are detailed as follows: |
General ledger accounts:
| | | | | | | | |
| | | Balance as of | |
| | | 12-31-2015
ThCh$ | | | 12-31-2014
ThCh$ | |
| | | | | | | | |
Post-employment obligations, non-current | | | 187,270,474 | | | | 269,930,412 | |
| | | | | | | | |
Total Liabilities | | | 187,270,474 | | | | 269,930,412 | |
| | | | | | | | | |
Total post-employment obligations, net | | | 187,270,474 | | | | 269,930,412 | |
| | |
| The accompanying notes are an integral part of these consolidated financial statements | | |
|
| F-114 |
Reconciliation with general ledger accounts:
| | | | | | | | |
| | | Balance as of | |
| | 12-31-2015 ThCh$ | | | 12-31-2014 ThCh$ | |
| | | | | | | | |
Post-employment obligations | | | 428,066,630 | | | | 588,148,279 | |
(-) Fair value of asset plan (*) | | | (284,231,299) | | | | (368,008,708) | |
| | | | | | | | | |
Total | | | 143,835,331 | | | | 220,139,571 | |
| | | | | | | | | |
| Amount not recognized due to limit on Benefit Plan Assets (**) | | | 22,057,178 | | | | 33,710,733 | |
| Minimum financing required (IFRIC 14) (***) | | | 21,377,965 | | | | 16,080,108 | |
| | | | | | | | | |
Total post-employment obligations, net | | | 187,270,474 | | | | 269,930,412 | |
(*) Plan assets to fund defined benefit plans only in our Brazilian subsidiaries (Ampla and Coelce); the remaining defined benefit plans in our other subsidiaries are unfunded.
(**) In Coelce, certain pension plans currently have an actuarial surplus amounting to ThCh$22,057,178 as of December 31, 2015 (ThCh$33,710,733 in 2014). This actuarial surplus was not recognized as an asset in accordance with IFRIC 14 -The Limit on a Defined Benefit Asset, Minimum Funding Requirements and their Interaction, because the Complementary Social Security (SPC) regulations - CGPC Resolution 26/2008 states that the surplus can only be used by the sponsor if the contingency reserve on the balance sheet of the Foundation is at the maximum percentage (25% of reserves). This ensures the financial stability of the plan based on the volatility of these obligations. If the surplus exceeds this limit, it may be used by the sponsor to reduce future contributions or be reimbursed to the sponsor. At Coelce, this proportion is less than 5% as of December 31, 2015.
(***) In Ampla has been recognized in accordance with the provisions of IFRIC 14 -The Limit on a Defined Benefit Asset, Minimum Funding Requirements and their Interaction an asset as of December 31, 2015 for ThCh$21,377,965 (ThCh$16,080,108 as of December 31, 2014). This corresponds to actuarial debt contracts that the company signed with Brasiletros (an institution providing pension funds exclusively to employees and retired employees of Ampla). This was done to equalize deficits on certain pension plans, since the sponsor assumes responsibility for these plans, in accordance with current legislation.
The following table presents the balance recorded in the consolidated statement of financial position as a result of the difference between the actuarial liability from defined benefit plans and the fair value of the plan assets affected as of December 31, 2015, and at the end of each of the four prior years:
| | | | | | | | | | | | | | | | | | | | |
| | | 12-31-2015 | | | 12-31-2014 | | | 12-31-2013 | | | 12-31-2012 | | | 12-31-2011 | |
| | | ThCh$ | | | ThCh$ | | | ThCh$ | | | ThCh$ | | | ThCh$ | |
Actuarial liability | | | 428,066,630 | | | | 588,148,279 | | | | 521,850,486 | | | | 628,823,491 | | | | 592,212,012 | |
Assets affected | | | (284,231,299) | | | | (368,008,708) | | | | (322,830,274) | | | | (393,880,165) | | | | (366,137,888) | |
Difference | | | 143,835,331 | | | | 220,139,571 | | | | 199,020,212 | | | | 234,943,326 | | | | 226,074,124 | |
Limitation not recognized due to limit on Benefit Plan Assets | | | 22,057,178 | | | | 33,710,733 | | | | 39,494,779 | | | | 21,218,042 | | | | 43,278,951 | |
Minimum financing required (IFRIC 14) | | | 21,377,965 | | | | 16,080,108 | | | | - | | | | - | | | | - | |
Accounting balance of actuarial liability deficit | | | 187,270,474 | | | | 269,930,412 | | | | 238,514,991 | | | | 256,161,368 | | | | 269,353,075 | |
| | b) | The following amounts were recognized in the consolidated statement of comprehensive income for the years ended December 31, 2015, 2014 and 2013: |
| | | | | | | | | | | | |
| Expense Recognized in Profit or Loss | | 12-31-2015 | | | 12-31-2014 | | | 12-31-2013 | |
| | ThCh$ | | | ThCh$ | | | ThCh$ | |
Current service cost for defined benefits plan | | | 7,092,780 | | | | 4,513,850 | | | | 4,462,712 | |
Interest cost for defined benefits plan | | | 56,568,888 | | | | 59,981,707 | | | | 54,773,138 | |
Interest income from the plan assets | | | (38,428,236) | | | | (42,145,223) | | | | (37,219,214) | |
Past service cost | | | (523) | | | | 667,153 | | | | - | |
Interest cost on asset ceiling components | | | 3,619,155 | | | | 5,348,952 | | | | 2,422,955 | |
| | | | | | | | | | | | | |
Expenses recognized in Profit or Loss | | | 28,852,064 | | | | 28,366,439 | | | | 24,439,591 | |
(Gains) losses from new measurements of defined benefit plans | | | 19,027,368 | | | | 36,681,734 | | | | (6,351,518) | |
Total expense recognized in Comprehensive Income | | | 47,879,432 | | | | 65,048,173 | | | | 18,088,073 | |
| | |
| The accompanying notes are an integral part of these consolidated financial statements | | |
|
| F-115 |
| | c) | The presentation of net actuarial liabilities as of December 31, 2015 and 2014, are as follows |
| | | | |
| Net Actuarial Liabilities | | ThCh$ | |
Balance as of January 1, 2014 | | | 238,514,991 | |
Net interest cost | | | 23,185,436 | |
Service cost during the period | | | 5,181,003 | |
Benefits paid during the period | | | (15,957,887) | |
Contributions during the period | | | (17,998,323) | |
Actuarial (gains) losses from changes in financial assumptions | | | 26,435,894 | |
Actuarial (gains) losses from changes in experience adjustments | | | 22,302,042 | |
Performance of plan assets, excluding interest | | | (13,293,908) | |
Changes in the asset limit | | | (12,687,133) | |
Minimum financing required (IFRIC 14) | | | 16,080,108 | |
Transfer to liabilities classified as held for sale | | | (102,423) | |
Defined benefit plan obligations from business combinations | | | 1,297,048 | |
Foreign currency translation differences | | | (3,026,436) | |
Balance as of December 31, 2014 | | | 269,930,412 | |
Net interest cost | | | 21,759,807 | |
Service cost during the period | | | 7,092,780 | |
Benefits paid during the period | | | (19,628,639) | |
Contributions during the period | | | (15,322,998) | |
Actuarial (gains) losses from changes in financial assumptions | | | (41,003,639) | |
Actuarial (gains) losses from changes in experience adjustments | | | 33,191,124 | |
Performance of plan assets, excluding interest | | | 25,577,816 | |
Changes in the asset limit | | | (8,365,724) | |
Minimum financing required (IFRIC 14) | | | 9,627,791 | |
Transfer to liabilities classified as held for distribution to owners (*) | | | (55,023,456) | |
Past service cost | | | (523) | |
Foreign currency translation differences | | | (40,564,277) | |
Net actuarial liabilities as of December 31, 2015 | | | 187,270,474 | |
(*) See Note 5.1.a)
| | d) | The balance and changes in post-employment defined benefit obligations as of December 31, 2015 and 2014, are as follows: |
| | | | |
| Actuarial Value of Post-employment Obligations | | ThCh$ | |
Balance as of January 1, 2014 | | | 521,850,486 | |
Current service cost | | | 4,513,850 | |
Interest cost | | | 59,981,707 | |
Contributions from plan participants | | | 513,813 | |
Actuarial (gains) losses from changes in financial assumptions | | | 26,435,894 | |
Actuarial (gains) losses from changes in experience adjustments | | | 22,302,042 | |
Foreign currency translation | | | 2,634,240 | |
Benefits paid | | | (51,945,531) | |
Past service cost | | | 667,153 | |
Defined benefit plan obligations from business combinations | | | 1,297,048 | |
Transfer to assets classified as held for sale | | | (102,423) | |
Balance as of December 31, 2014 | | | 588,148,279 | |
Current service cost (*) | | | 7,092,780 | |
Interest cost (*) | | | 56,568,888 | |
Contributions from plan participants | | | 453,243 | |
Actuarial (gains) losses from changes in financial assumptions (*) | | | (41,003,639) | |
Actuarial (gains) losses from changes in experience adjustments (*) | | | 33,191,124 | |
Foreign currency translation differences | | | (108,872,703) | |
Benefits paid | | | (52,487,363) | |
Past service cost | | | (523) | |
Transfer to liabilities classified as held for distribution to owners | | | (55,023,456) | |
| | | | |
Balance as of December 31, 2015 | | | 428,066,630 | |
(*) Current service cost related continuing operations for the year ended December 31, 2015, was ThCh$9,609,364 (ThCh$7,571,331 for the year ended December 31, 2014). Interest cost related to continuing operations for the year ended December 31, 2015 was ThCh$19,459,863 (ThCh$21,046,393 for the year ended December 31, 2014). Actuarial gains (losses) for defined benefit plans related to continuing operations were ThCh$13,381,836 for the year ended December 31, 2015 (ThCh$23,988,874 for the year ended December 31, 2014).
| | |
| The accompanying notes are an integral part of these consolidated financial statements | | |
|
| F-116 |
As of December 31, 2015, out of the total amount of post-employment benefit obligations, 0.72% is from defined benefit plans in Chilean companies (9.58% as of December 31, 2014); 80.5% is from defined benefit plans in Brazilian companies (74.97% as of December 31, 2014); 15.01% is from defined benefit plans in Colombian companies (12.81% as of December 31, 2014); 3.16% is from defined benefit plans in Argentine subsidiaries (2.18% as of December 31, 2014); and the remaining 0.61% is from defined benefit plans in Peruvian companies (0.46% as of December 31, 2014).
| | e) | Changes in the fair value of the benefit plan assets are as follows: |
| | | | |
| Fair Value of Benefit Plan Assets | | ThCh$ | |
Balance as of January 1, 2014 | | | (322,830,274) | |
Interest income | | | (42,145,223) | |
Performance of plan assets, excluding interest | | | (13,293,908) | |
Foreign currency translation differences | | | (7,214,811) | |
Employer contributions | | | (17,998,323) | |
Contributions paid | | | (513,813) | |
Benefits paid | | | 35,987,644 | |
Balance as of December 31, 2014 | | | (368,008,708) | |
Interest income | | | (38,428,236) | |
Performance of plan assets, excluding interest | | | 25,577,816 | |
Foreign currency translation differences | | | 79,545,346 | |
Employer contributions | | | (15,322,998) | |
Contributions paid | | | (453,243) | |
Benefits paid | | | 32,858,724 | |
| | | | |
Balance as of December 31, 2015 | | | (284,231,299) | |
| | f) | The main categories of benefit plan assets are as follows: |
| | | | | | | | | | | | |
| Category of Benefit Plan Assets | | 12-31-2015 | | 12-31-2014 |
| | ThCh$ | | | % | | ThCh$ | | | % |
Equity instruments (variable income) | | | 35,173,904 | | | 12% | | | 46,892,034 | | | 13% |
Fixed-income assets | | | 210,347,356 | | | 74% | | | 270,067,933 | | | 73% |
Real Estate investments | | | 33,391,752 | | | 12% | | | 41,758,489 | | | 11% |
Other | | | 5,318,287 | | | 2% | | | 9,290,252 | | | 3% |
Total | | | 284,231,299 | | | 100% | | | 368,008,708 | | | 100% |
The plans for retirement benefits and pension funds held by our Brazilian subsidiaries, Ampla and Coelce, maintain investments as determined by the resolutions of the National Monetary Council, ranked in fixed income, equities and real estate. Fixed income investments are predominantly invested in federal securities. Regarding equities, Faelce (an institution providing pension funds exclusively to employees and retired employees of Coelce) holds common shares of Coelce, while Brasiletros (a similar institution for employees of Ampla) holds shares in investment funds with a portfolio traded on Bovespa (the São Paulo Stock Exchange). Finally, with regards to real estate, both foundations have properties that are currently leased to Ampla and Coelce.
The following table sets forth the assets affected by the plans and invested in shares, leases and real estate owned by the Group:
| | | | | | | | |
| | | 12-31-2015 | | | 12-31-2014 | |
| | | ThCh$ | | | ThCh$ | |
| | | | | | | | |
Equity instruments | | | 1 | | | | 2 | |
Real Estate | | | 16,535,844 | | | | 24,699,453 | |
| | | | | | | | |
Total | | | 16,535,845 | | | | 24,699,455 | |
| | |
| The accompanying notes are an integral part of these consolidated financial statements | | |
|
| F-117 |
| | g) | Reconciliation of asset ceiling: |
| | | | |
| Reconciliation of Asset Ceiling | | ThCh$ | |
Balance as of January 1, 2014 | | | 39,494,779 | |
Interest on assets not recognized | | | 5,348,952 | |
Other changes in assets not recognized due to asset limit | | | (12,687,133) | |
Foreign currency exchange translation differences | | | 1,554,135 | |
Balance as of December 31, 2014 | | | 33,710,733 | |
Interest on assets not recognized | | | 3,619,155 | |
Other changes in assets not recognized due to asset limit | | | (8,365,724) | |
Foreign currency exchange differences | | | (6,906,986) | |
Total asset ceiling as of December 31, 2015 | | | 22,057,178 | |
Other disclosures:
As of December 31, 2015 and 2014, the following assumptions were used in the actuarial calculation of defined benefit plans:
| | | | | | | | | | | | | | | | | | | | |
| | | Chile | | Brazil | | Colombia | | Argentina | | Peru |
| | | 12-31-2015 | | 12-31-2014 | | 12-31-2015 | | 12-31-2014 | | 12-31-2015 | | 12-31-2014 | | 12-31-2015 | | 12-31-2014 | | 12-31-2015 | | 12-31-2014 |
| | | | | | | | | | | | | | | | | | | | | |
Discount rates used | | 5.00% | | 4.60% | | 14.02% - 14.21% | | 12.52% | | 7.25% | | 7.04% | | 5.50% | | 5.50% | | 7.60% | | 6.35% |
Expected rate of salary increases | | 4.00% | | 4.00% | | 9.69% | | 9.18% | | 4.20% | | 4.00% | | 0.00% | | 0.00% | | 3.00% | | 3.00% |
Mortality tables | | RV -2009 | | RV -2009 | | AT 2000 | | AT 2000 | | RV 2008 | | RV 2008 | | RV 2004 | | RV 2004 | | RV 2009 | | RV 2009 |
As of December 31, 2015, the sensitivity of the value of the actuarial liability for post-employment benefits to variations of 100 basis points in the discount rate assumes a decrease of ThCh$32,618,877 (ThCh$46,833,941 as of December 31, 2014) if the rate rises and an increase of ThCh$38,040,654 (ThCh$56,665,239 as of December 31, 2014) if the rate falls in those 100 basis points.
The estimates available indicate that ThCh$40,598,743 will be disbursed for defined benefit plans next year.
The Group’s obligations have a weighted average length of 8.98 years, and the outflows of benefits for the next 5 years and more is expected to be as follows:
| | | | | | |
| | | Years | | ThCh$ | | |
| | 1 | | 40,598,743 | | |
| | 2 | | 35,861,547 | | |
| | 3 | | 36,618,624 | | |
| | 4 | | 36,802,319 | | |
| | 5 | | 36,713,859 | | |
| | Over 5 | | 187,371,678 | | |
The total expense recognized in the consolidated statement of comprehensive income within line item “Employee expenses” represents contributions payable to the defined contribution plans by the Group. For the year ended December 31, 2015, the amounts recognized as expenses were ThCh$4,799,333 (ThCh$4,700,327 for the year ended December 31, 2014). These amounts correspond in its entirety to continuing operations.
| | |
| The accompanying notes are an integral part of these consolidated financial statements | | |
|
| F-118 |
26. EQUITY.
26.1 Equity attributable to the shareholders of Enersis Américas
| | 26.1.1 | Subscribed and paid capital and number of shares |
The Enersis Américas Extraordinary Shareholders’ Meeting held on December 20, 2012 approved a capital increase of ThCh$2,844,397,890 divided into 16,441,606,297 shares of single series nominative common stock, non-preference and with no par value.
The shares were paid for as follows:
| | a) | Endesa S.A. made a non-monetary payment for a total amount of ThCh$1,724,400,000 corresponding to 9,967,630,058 shares of Enersis Américas stock at a price of Ch$173 per share. |
For more information on the shares contributed by Endesa S.A., see Note 7.
| | b) | Cash contribution from non-controlling interests at a price of Ch$173 per share. |
During the preemptive right period for the subscription of shares which was from February 25 to March 26, 2013, a total of 16,284,562,981 shares were subscribed and paid, equivalent to 99.04% of the total authorized shares, remaining a total of 157,043,316 unsubscribed shares. Of the subscribed and paid-up shares, 9,967,630,058 shares corresponded to Endesa S.A. and 6,316,932,923 shares to non-controlling interests, of which 1,675,441,700 were subscribed in the U.S. (33,508,834 in ADRs).
On March 28, 2013, the 157,043,316 unsubscribed shares were auctioned at Ch$182.3 per share. The total amount collected through the auction was ThCh$28,628,996, which includes a share issuance premium of ThCh$1,460,503.
At the Enersis Américas Extraordinary Shareholders Meeting held on November 25, 2014, an amendment to the Company by-laws was approved, whereby the issued capital was increased by ThCh$135,167,261. This amount corresponded to the “Share Premium” balance, after deducting the “Share issuance costs” that it was included in Other Reserves, without any distribution to shareholders as a dividend.
The share premium corresponds to the share issuance premium from the capital increases that took place in 2003 and 1995. In the former increase, the premium was ThCh$125,881,577, and in the latter it was ThCh$32,878,071.
The share issuance premium generated during the capital increase in 2013, amounting to ThCh$1,460,503 as indicated above, absorbed a portion of the share issuance costs incurred in the process (see Note 26.5.c).
The Company’s issued capital following the by-law amendment indicated above amounted to ThCh$5,804,447,986, divided into the same number of shares as previously, that is, 49,092,772,762 shares of single series nominative common stock, non-preference and with no par value. This change in the Company’s by-laws complies with Article 26 of the Chilean Companies Act (Ley de Sociedades Anónimas) and Circular No. 1,370 issued by the SVS, as amended by Circular No. 1,736, for the recognition of changes in equity as a result of recent increases in the Company’s issued capital.
The issued capital of Enersis Américas as of December 31, 2015 and 2014 was ThCh$5,804,447,986, divided into 49,092,772,762 shares.
As of December 31, 2015 and 2014, all of the shares issued by Enersis Américas are subscribed and paid, and they are listed for trade on the Bolsa de Comercio de Santiago de Chile, the Bolsa Electrónica de Chile, the Bolsa de Valores de Valparaiso, and the New York Stock Exchange (NYSE).). The situation was similar at December 31, 2014.
| | |
| The accompanying notes are an integral part of these consolidated financial statements | | |
|
| F-119 |
At the Ordinary Shareholders Meeting held on April 16, 2013, it was agreed to distribute a minimum mandatory dividend (partially consisting of interim dividend No. 86) and an additional dividend, which together amounted to a total of Ch$4.25027 per share. Since interim dividend No. 86 had already been paid, the remainder was distributed and paid in final dividend No. 87 at Ch$3.03489 per share.
On November 26, 2013, the Directors present at the meeting of the Board voted unanimously to distribute interim dividend N° 88 of Ch$1.42964 per share on January 31, 2014, against 2013 statutory net income. This was 15% of the Company’s net income calculated on September 30, 2013, in accordance with the Company’s current dividend policy.
At the Ordinary Shareholders’ Meeting held on April 23, 2014, it was agreed to distribute a minimum mandatory dividend (partially consisting of interim dividend No. 88 of Ch$1.42964 per share) and an additional dividend, which in aggregate amounted to Ch$329,257,075,000, at Ch$6.70683 per share. Since interim dividend No. 88 had already been paid, the remainder was distributed and paid in final dividend No. 89, which totaled Ch$259,071,983,050 equivalent to Ch$5.27719 per share.
On November 25, 2014, the Board unanimously agreed to distribute interim dividend No. 90 of Ch$0.83148 per share on January 30, 2015 against fiscal year 2014 statutory net income; this corresponded to 15% of net income calculated at September 30, 2014, in accordance with the current Company’s dividend policy.
At the Ordinary Shareholders’ Meeting held on April 28, 2015, it was agreed to distribute a minimum mandatory dividend (partially consisting of interim dividend No. 90 of Ch$0.83148 per share) and an additional dividend, which in aggregate amounted to Ch$305,078,934,556 at Ch$6.21433 per share.
Since interim dividend No. 90 had already been paid, the remainder was distributed and paid in final dividend No. 91, which totaled Ch$264,259,128,599 equivalent to Ch$5.38285 per share.
On November 24, 2015, the Board unanimously agreed to distribute interim dividend No. 92 of $1.23875 per share on January 29, 2016 against fiscal year 2015 statutory net income. This corresponded to 15% of net income calculated at September 30, 2015, in accordance with the current Company’s dividend policy.
The following table sets forth the dividends paid in recent years:
| | | | | | | | |
| Dividend No. | | Type of
Dividend | | Payment Date | | Pesos per Share | | Charged to |
| 82 | | Interim | | 1-27-2011 | | 1.57180 | | 2010 |
| 83 | | Final | | 5-12-2011 | | 5.87398 | | 2010 |
| 84 | | Interim | | 1-27-2012 | | 1.46560 | | 2011 |
| 85 | | Final | | 5-09-2012 | | 4.28410 | | 2011 |
| 86 | | Interim | | 1-25-2013 | | 1.21538 | | 2012 |
| 87 | | Final | | 5-10-2013 | | 3.03489 | | 2012 |
| 88 | | Interim | | 1-31-2014 | | 1.42964 | | 2013 |
| 89 | | Final | | 5-16-2014 | | 5.27719 | | 2013 |
| 90 | | Interim | | 1-30-2015 | | 0.83148 | | 2014 |
| 91 | | Final | | 5-25-2015 | | 5.38285 | | 2014 |
| 92 | | Interim | | 1-29-2016 | | 1.23875 | | 2015 |
| | |
| The accompanying notes are an integral part of these consolidated financial statements | | |
|
| F-120 |
| | 26.2 | Foreign currency translation reserves |
The following table sets forth foreign currency translation differences attributable to the shareholders of Enersis Américas for the years ended December 31, 2015, 2014 and 2013:
| | | | | | |
Reserves for Accumulated
Currency Translation Differences | | 12-31-2015 (*)
ThCh$ | | 12-31-2014
ThCh$ | | 12-31-2013
ThCh$ |
Empresa Distribuidora Sur S.A. | | (81,730,224) | | (76,439,681) | | (72,729,629) |
Compañía Distribuidora y Comercializadora de energía S.A. | | 97,135,435 | | 130,582,841 | | 154,005,545 |
Edelnor | | 44,016,474 | | 36,743,627 | | 16,231,253 |
Dock Sud | | (6,090,959) | | 3,671,460 | | 1,498,217 |
Enel Brasil S.A. | | (518,430,268) | | (164,554,392) | | (234,432,842) |
Central Costanera S.A. | | 139,888 | | 2,335,611 | | 578,662 |
Inversiones GasAtacama Holding Ltda. (1) | | - | | 11,500,876 | | 5,020,651 |
Emgesa S.A. E.S.P. | | 9,032,752 | | 46,718,154 | | 76,006,120 |
Hidroelectrica El Chocon S.A. | | (48,704,485) | | (30,145,604) | | (26,372,986) |
Generandes Peru S.A. | | 80,370,339 | | 71,188,012 | | 24,832,786 |
Emp. Eléctrica de Piura | | 8,753,615 | | 7,321,905 | | 3,379,674 |
Other | | (4,580,660) | | (3,767,935) | | (4,039,467) |
TOTAL | | (420,088,093) | | 35,154,874 | | (56,022,016) |
(*) See Note 5.1.II.ii.
(1) Beginning on January 1, 2015, the company changed its functional currency from U.S. dollar to Chilean pesos.
The Company’s objective is to maintain an adequate level of capitalization in order to be able to secure its access to the financial markets, so as to fulfill its medium- and long-term goals while maximizing the return to its shareholders and maintaining a robust financial position.
| | 26.4 | Restrictions on subsidiaries transferring funds to the parent |
Certain of the Group’s subsidiaries must comply with financial ratio covenants which require them to have a minimum level of equity or other requirements that restrict the transferring of assets to Enersis Américas. The Group’s restricted net assets as of December 31, 2015 from its subsidiaries Enel Brazil, Ampla, Coelce, Edelnor, and Piura were ThCh$1,855,727, ThCh$434,529,111, ThCh$52,144,627, ThCh$184,778,375, and ThCh$34,378,002, respectively; which in their entirety corresponds to continuing operations.
The participation of the Company in the restricted net assets of its subsidiary Endesa Chile was ThCh$1,117,699,084, all of which is related to assets and liabilities classified as held for distribution to owners.
| | |
| The accompanying notes are an integral part of these consolidated financial statements | | |
|
| F-121 |
Other reserves within Equity attributable to shareholders of Enersis Américas for the years ended December 31, 2015, 2014 and 2013 are as follows:
| | | | | | | | | | | | |
| | | Balance as of January 1, 2015 ThCh$ | | | 2015 Changes ThCh$ | | | Balance as of
December 31, 2015 ThCh$ | |
| | | | | | | | | | |
Exchange differences on translation | | | 35,154,874 | | | | (455,242,967 | ) | | | (420,088,093 | ) |
Cash flow hedges | | | (69,404,677 | ) | | | 60,563,975 | | | | (8,840,702 | ) |
Available-for-sale financial assets | | | 14,046 | | | | (181,785 | ) | | | (167,739 | ) |
Other comprehensive income from non-current assets held for distribution to owners | | | - | | | | (101,327,672 | ) | | | (101,327,672 | ) |
Other miscellaneous reserves | | | (2,619,970,627 | ) | | | (8,565,391 | ) | | | (2,628,536,018 | ) |
Total | | | (2,654,206,384 | ) | | | (504,753,840 | ) | | | (3,158,960,224 | ) |
| | | |
| | | | | | | | | | | | |
| | | Balance as of January 1, 2014 ThCh$ | | | 2014 Changes ThCh$ | | | Balance as of
December 31, 2014 ThCh$ | |
| | | | | | | | | | |
Exchange differences on translation | | | (56,022,016 | ) | | | 91,176,890 | | | | 35,154,874 | |
Cash flow hedges | | | (3,086,726 | ) | | | (66,317,951 | ) | | | (69,404,677 | ) |
Available-for-sale financial assets | | | 11,811 | | | | 2,235 | | | | 14,046 | |
Other miscellaneous reserves | | | (2,414,023,486 | ) | | | (205,947,141 | ) | | | (2,619,970,627 | ) |
Total | | | (2,473,120,417 | ) | | | (181,085,967 | ) | | | (2,654,206,384 | ) |
| | | |
| | | | | | | | | | | | |
| | | Balance as of January 1, 2013 ThCh$ | | | 2013 Changes ThCh$ | | | Balance as of December 31, 2013 ThCh$ | |
| | | | | | | | | | |
Exchange differences on translation | | | (40,720,059 | ) | | | (15,301,957 | ) | | | (56,022,016 | ) |
Cash flow hedges | | | 27,594,028 | | | | (30,680,754 | ) | | | (3,086,726 | ) |
Available-for-sale financial assets | | | 13,647 | | | | (1,836 | ) | | | 11,811 | |
Other miscellaneous reserves | | | (1,498,010,369 | ) | | | (916,013,117 | ) | | | (2,414,023,486 | ) |
Total | | | (1,511,122,753 | ) | | | (961,997,664 | ) | | | (2,473,120,417 | ) |
| | a) | Reserves for exchange differences on translation:These reserves arise primarily from exchange differences relating to: |
| | - | Translation of the financial statements of our subsidiaries with functional currencies other than the Chilean peso (see Note 2.6.3); and |
| | - | Translation of goodwill arising from the acquisition of companies with functional currencies other than the Chilean peso (see Note 3.c). |
| | b) | Cash flow hedging reserves:These reserve represent the cumulative effective portion of gains and losses on cash flow hedges (see Note 3.g.5. and 3.n). |
| | c) | Other miscellaneous reserves. |
During the year ended December 31, 2015, there have been no changes in other reserves.
During the year ended December 31, 2014, the changes in other reserves were originated primarily from the Public Stock Offering of our subsidiary Coelce (see Note 26.6.1).
During the year ended December 31, 2013, the changes in other reserves were originated primarily from the capital increase carried out by Enersis Américas. (See Note 26.1.1).
The main items and their effects are the following:
| | 1) | A charge of ThCh$897,856,109 resulting from the Enersis Américas capital increase that took place in the first quarter of 2013 (see Note 7). |
| | |
| The accompanying notes are an integral part of these consolidated financial statements | | |
|
| F-122 |
| | 2) | A charge of ThCh$18,581,809 corresponding to share issuance costs recognized as described in Note 3.t). The detail of these expenses is as follows: |
| | | | | | | | | | | | |
Description of Expense (*) | | Gross Amount
ThCh$ | | | Tax Effect
ThCh$ | | | Net Amount
ThCh$ | |
Legal advising services | | | 1,154,819 | | | | (230,964) | | | | 923,855 | |
Financial advising services and placement fees | | | 22,436,327 | | | | (4,487,265) | | | | 17,949,062 | |
Audits | | | 1,113,980 | | | | (222,796) | | | | 891,184 | |
Other expenses | | | 347,764 | | | | (69,553) | | | | 278,211 | |
| | | | | | | | | | | | |
Sub Total | | | 25,052,890 | | | | (5,010,578) | | | | 20,042,312 | |
| | | | | | | | | | | | |
Less | | | | | | | | | | | | |
Share placement surcharge | | | 1,460,503 | | | | - | | | | 1,460,503 | |
| | | | | | | | | | | | |
Total | | | 23,592,387 | | | | (5,010,578) | | | | 18,581,809 | |
| | | | | | | | | | | | |
(*) See Note 26.1.1. (By-law amendments).
The other items included in “Other miscellaneous reserves” balance as of December 31, 2015 and 2014 are explained as follows:
i) In accordance with Official Bulletin No. 456 from the SVS (Superintendencia de Valores y Seguros de Chile), included in this line item is the price-level restatement of paid-in capital from the date of transition to IFRS, January 1, 2004, to December 31, 2008.
It is important to note that, while the Company adopted IFRS as its statutory accounting standards beginning on January 1, 2009, the date of transition to IFRS was the same as that used by its parent company, Endesa S.A., January 1, 2004, as an exemption permitted in IFRS 1 -First Time Adoption of IFRS.
ii) Foreign currency translation differences existing at the time of transition to IFRS (IFRS 1 exemption).
iii) The effects of business combinations under common control, arising primarily from the incorporation of the holding company Enel Brasil in 2005 and the merger of our Colombian subsidiaries, Emgesa and Betania, in 2007.
| | |
| The accompanying notes are an integral part of these consolidated financial statements | | |
|
| F-123 |
26.6 Non-controlling Interests
| | 26.6.1 | COELCE Public Stock Offering |
On January 14, 2014, the Enersis Américas Board of Directors voted to hold a voluntary public offering of shares in its subsidiary Companhia Energética do Ceará’s (Coelce) as part of the process to make use of the funds raised in the Enersis Américas 2013 capital increase (see Notes 7 and 26.1.1).
In the Public Stock Offering auction held on February 17, 2014, Enersis Américas acquired 2,964,650 shares of Coelce common stock at a price of R$49 per share, 8,818,006 shares of Class A preferred stock and 424 shares of Class B preferred stock, at a cost of ThCh$134,017,691.
Having exceeded two-thirds of the total number of Coelce common stock shares in circulation, Enersis Américas extended the effective date of the offer for an additional three months from the date of the auction. The process concluded on May 16, 2014, during which time Enersis Américas acquired an additional 38,162 shares of common stock at a total price of ThCh$464,883.
In summary, Enersis Américas increased its equity interest in Coelce by 15.18% to control, directly and indirectly, 74.05% of that company’s equity interest.
The purchase of these non-controlling interests was recorded using the accounting policy described in Note 2.6.5. The difference between the carrying amount of the non-controlling interests acquired and the consideration paid resulted in a charge of ThCh$75,700,937 recorded directly in “Other reserves” in “Equity attributable to equity owners of Enersis Américas”.
In addition, the components of “Other comprehensive income” were allocated accordingly, with an additional charge to “Other miscellaneous reserves” and a credit to “Reserves for exchange differences on translation” amounting to ThCh$28,385,172.
| | 26.6.2 | Acquisition of Inkia Holdings (Acter) Limited (Generandes Peru) |
On April 29, 2014, the Board of Enersis Américas authorized the signing of a purchase agreement for the acquisition of all the shares that Inkia Americas Holdings Limited held indirectly in Generandes Peru (39.01% of that company), which is the holding company for Edegel S.A.A. This purchase formed part of the process to use funds that had been raised in the Enersis Américas capital increase in 2013 (See Notes 7 and 26.1.1).
On September 3, 2014, Enersis Américas confirmed and paid ThCh$253,015,133 to Inkia, and consolidated the companies Inkia Holdings (Acter) Limited, Southern Cone Power Ltd., Latin American Holding I Ltd., Latin American holding II Ltd. and Southern Cone Power Peru S.A.A.
This transaction increased Enersis Américas’s indirect ownership interest in Edegel S.A.A by 21.14%, leaving Enersis Américas with direct and indirect control of 58.60% of the shares in this company.
The acquisition of non-controlling interests was recorded according to the accounting policy described in Note 2.6.6. The difference between the carrying amount of non-controlling interests acquired and the consideration paid, resulted in a charge of ThCh$137,644,766 which was directly recognized in “Other reserves” within equity attributable to the shareholders of Enersis Américas.
Additionally, the corresponding components of “Other comprehensive income” have been redistributed. Accordingly, there has been an additional charge to “Other miscellaneous reserves” and a credit to “Reserve for Exchange Differences on Translation” of ThCh$32,862,564.
| | |
| The accompanying notes are an integral part of these consolidated financial statements | | |
|
| F-124 |
| | 26.6.3 | Capitalization of Central Dock Sud |
During 2014, Enersis Américas and the rest of Central Dock Sud’s (CDS) shareholders worked to find a solution to the statutory negative equity situation that CDS was facing since December 2013. If the negative worth situation was not corrected, the company would have to be dissolved according to Argentine regulation.
On December 1, 2014, Enersis Américas S.A. acquired from Endesa Latinoamérica S.A. certain loans granted to Central Dock Sud S.A. (CDS), with a nominal amount of US$ 106 million. The amount paid was US$29 million. These loans were then re-denominated to Argentine pesos and interests were condoned. The remaining portion of these loans was contributed by Enersis Américas S.A. to the share capital of Inversora Dock Sud (IDS) and subsequently to CDS, at nominal amount. Similar contribution was made by each of the other shareholders, capitalizing their credits granted to CDS. In exchange, shares were issued by IDS and CDS, respectively, in proportion to the loans contributed or cash capitalized, and in the case of Enersis Américas, these loans were partially repaid in cash. All of these movements constitute a related party transaction (the “Transaction”), approved in the case of Enersis Américas, at an Extraordinary Shareholders Meeting.
The Transaction restored the equity of CDS, whilst maintaining substantially the same proportion of ownership in this company as held prior to the Transaction: Enersis Américas (40%), YPF (40%) and Pan American Energy (20%).
This Transaction was recognized under the accounting policy described in Note 2.6.6 and resulted in an additional credit to “Other miscellaneous reserves” for ThCh$35,149,573.
| | 26.6.4 | The detail of non-controlling interests is as follows: |
| | | | | | | | | | | | | | | | | | | | | | |
| | | Non-controlling interests | |
| | | 12-31-2015 | | Equity | | | Profit (Loss) | |
| Companies | | | 12-31-2015 | | | 12-31-2014 | | | 12-31-2015 | | | 12-31-2014 | | | 12-31-2013 | |
| | % | | ThCh$ | | | ThCh$ | | | ThCh$ | | | ThCh$ | | | ThCh$ | |
Ampla Energía e Serviços S.A. | | 0.36% | | | 1,670,381 | | | | 2,255,335 | | | | (39,491) | | | | 183,454 | | | | 3,034,036 | |
Compañía Energética Do Ceará S.A. | | 26.00% | | | 102,309,115 | | | | 111,448,154 | | | | 18,722,431 | | | | 14,883,752 | | | | 17,016,391 | |
Enel Brasil | | 0.00% | | | - | | | | - | | | | - | | | | - | | | | 16,428,497 | |
Compañía Distribuidora y Comercializadora de energía S.A. | | 51.52% | | | 270,808,395 | | | | 250,654,641 | | | | 63,817,434 | | | | 80,226,416 | | | | 82,283,946 | |
Emgesa S.A. E.S.P. | | 51.53% | | | 412,145,236 | | | | 377,921,404 | | | | 109,187,510 | | | | 148,822,948 | | | | 130,147,172 | |
Empresa de Distribución Eléctrica de Lima Norte S.A.A | | 24.32% | | | 75,852,375 | | | | 67,927,394 | | | | 15,467,507 | | | | 14,524,832 | | | | 12,282,813 | |
Generandes Peru S.A. | | 0.00% | | | - | | | | - | | | | - | | | | 12,672,210 | | | | 17,074,639 | |
Edegel S.A.A | | 16.40% | | | 91,467,160 | | | | 90,506,207 | | | | 15,078,085 | | | | 17,790,998 | | | | 13,299,054 | |
Chinango S.A.C. | | 20.00% | | | 14,268,911 | | | | 14,707,216 | | | | 3,042,018 | | | | 3,002,284 | | | | 2,033,307 | |
Empresa Distribuidora Sur S.A. | | 27.87% | | | 7,873,277 | | | | (17,558,352) | | | | 27,738,670 | | | | (23,918,192) | | | | 25,129,551 | |
Central Costanera S.A. | | 24.32% | | | 3,759,405 | | | | 5,197,207 | | | | (242,897) | | | | 11,072,950 | | | | (7,067,970) | |
Hidroelectrica El Chocón S.A. | | 32.33% | | | 48,208,347 | | | | 26,841,549 | | | | 35,783,793 | | | | 3,538,006 | | | | 3,811,615 | |
Inversora Dock Sud S.A. | | 42.86% | | | 24,059,619 | | | | 20,265,854 | | | | 11,745,296 | | | | (6,544,116) | | | | (8,111,021) | |
Central Dock Sud S.A. | | 29.76% | | | 23,536,086 | | | | 17,613,948 | | | | 11,624,813 | | | | (8,857,902) | | | | (12,361,345) | |
Chilectra S.A. (*). | | 0.91% | | | 10,118,233 | | | | 11,127,491 | | | | 1,743,825 | | | | 1,264,684 | | | | 2,056,796 | |
Empresa Nacional de Electricidad S.A (*) | | 40.02% | | | 1,059,805,601 | | | | 1,080,652,251 | | | | 157,225,820 | | | | 110,198,149 | | | | 142,871,823 | |
Empresa Eléctrica Pehuenche S.A. (*) | | 7.35% | | | 10,900,863 | | | | 12,597,077 | | | | 8,674,207 | | | | 9,526,575 | | | | 8,415,147 | |
Empresa Electrica de Piura | | 5.00% | | | - | | | | 2,118,220 | | | | - | | | | 3,948,804 | | | | 3,543,412 | |
Others | | | | | 6,876,091 | | | | 2,967,103 | | | | 3,313,547 | | | | 3,286,013 | | | | 2,998,733 | |
Total | | | | | 2,163,659,095 | | | | 2,077,242,699 | | | | 482,882,568 | | | | 395,621,865 | | | | 454,886,596 | |
| | (*) | Disposal groups held for distribution to owners |
| | |
| The accompanying notes are an integral part of these consolidated financial statements | | |
|
| F-125 |
27. REVENUE AND OTHER INCOME.
The detail of revenue presented in the statement of comprehensive income for the years ended December 31, 2015, 2014 and 2013 is as follows:
| | | | | | | | | | | | |
| Revenues | | For the years ended | |
| | 12-31-2015 ThCh$ | | | 12-31-2014 (As adjusted)(*) ThCh$ | | | 12-31-2013 (As adjusted)(*) ThCh$ | |
| | | | | | | | | | | | |
Energy sales (2) | | | 4,224,381,699 | | | | 4,349,833,962 | | | | 3,651,343,245 | |
| | | | | | | | | | | | |
Generation | | | 1,202,615,603 | | | | 1,192,444,520 | | | | 941,860,009 | |
Regulated customers | | | 141,728,020 | | | | 137,536,698 | | | | 84,590,770 | |
Non-regulated customers | | | 664,527,858 | | | | 676,023,056 | | | | 575,318,424 | |
Spot market sales | | | 338,995,080 | | | | 338,908,636 | | | | 249,598,348 | |
Other customers | | | 57,364,645 | | | | 39,976,130 | | | | 32,352,467 | |
Distribution | | | 3,021,766,096 | | | | 3,157,389,442 | | | | 2,709,483,236 | |
Residential | | | 1,485,240,702 | | | | 1,583,857,094 | | | | 1,298,051,111 | |
Business | | | 722,634,924 | | | | 737,471,663 | | | | 666,523,624 | |
Industrial | | | 299,722,654 | | | | 309,822,204 | | | | 324,807,780 | |
Other consumers | | | 514,167,816 | | | | 526,238,481 | | | | 420,100,721 | |
| | | | | | | | | | | | |
Other sales | | | 40,648,051 | | | | 34,220,939 | | | | 19,035,917 | |
Gas sales | | | 16,779,246 | | | | 8,154,469 | | | | 8,817,669 | |
Sales of products and services | | | 23,868,805 | | | | 26,066,470 | | | | 10,218,248 | |
| | | | | | | | | | | | |
Revenue from other services | | | 402,615,560 | | | | 422,400,836 | | | | 308,616,190 | |
Tolls and transmission | | | 248,565,422 | | | | 251,366,453 | | | | 212,027,293 | |
Metering equipment leases | | | 70,485 | | | | 82,069 | | | | 399,082 | |
Public lighting | | | 23,162,879 | | | | 28,050,833 | | | | 24,865,721 | |
Verifications and connections | | | 4,580,679 | | | | 4,200,004 | | | | 15,560,660 | |
Engineering and consulting services | | | 1,404,449 | | | | 12,826,190 | | | | 8,791,981 | |
Other services | | | 124,831,646 | | | | 125,875,287 | | | | 46,971,453 | |
| | | | | | | | | | | | |
Total operating revenue | | | 4,667,645,310 | | | | 4,806,455,737 | | | | 3,978,995,352 | |
| | | | | |
| Other Operating Income | | For the years ended | |
| | 12-31-2015 ThCh$ | | | 12-31-2014 (As adjusted)(*) ThCh$ | | | 12-31-2013 (As adjusted)(*) ThCh$ | |
| | | | | | | | | | | | |
Revenue from construction contracts | | | 230,687,290 | | | | 186,078,925 | | | | 159,283,676 | |
Other income (1) | | | 403,106,978 | | | | 213,835,126 | | | | 389,868,841 | |
| | | | | | | | | | | | |
Total other income | | | 633,794,268 | | | | 399,914,051 | | | | 549,152,517 | |
(*) See Note 5.1.II.iii
(1) It includes ThCh$52,400,888 for the year ended December 31, 2015 (ThCh$39,282,571 and ThCh$31,262,764 for the years ended December 31, 2014 and 2013, respectively) from new availability contracts signed in December 2012 between our subsidiary Central Costanera S.A. and CAMMESA.
As part of application of Resolution SE No. 32/2015 issued on March 11, 2015, which for purposes of funding the expenditures and investments used for in the normal operations to render distribution of electricity public services approved a temporary increase for TCh$264,987,134 in our subsidiary Edesur beginning on February 1, 2015 without any increase in tariffs. In addition, ThCh$52,504,644 for the year ended December 31, 2015 were recognized as revenue as part of the Cost Monitoring Mechanism (MMC) adjustment for recognizing costs that are not passed on to electricity tariffs related to January 2015 period, and(2) additionally ThCh$33,972,330 for the year ended December 31, 2015 (ThCh$132,373,799 for the year ended December 31, 2014) were recognized as revenue from energy sales as the Resolution also states that beginning on February 1, 2015, the funds from the program PUREE become revenue for the distribution company, due to increased costs incurred.
| | |
| The accompanying notes are an integral part of these consolidated financial statements | | |
|
| F-126 |
28. RAW MATERIALS AND CONSUMABLES USED.
The detail of raw materials and consumables used presented in profit or loss for the years ended December 31, 2015, 2014 and 2013 is as follows:
| | | | | | | | | | | | |
| Raw Materials and Consumables Used | | For the years ended | |
| | 12-31-2015 ThCh$ | | | 12-31-2014 (As adjusted)(*) ThCh$ | | | 12-31-2013 (As adjusted)(*) ThCh$ | |
| | | | | | | | | | | | |
Energy purchases | | | (1,885,916,426) | | | | (1,824,002,786) | | | | (1,252,146,609) | |
Fuel consumption | | | (258,113,922) | | | | (205,534,394) | | | | (174,504,021) | |
Transportation costs | | | (245,813,374) | | | | (265,185,382) | | | | (216,858,693) | |
Costs from construction contracts | | | (230,687,290) | | | | (186,078,925) | | | | (159,283,676) | |
Other raw materials and consumables | | | (156,670,500) | | | | (150,867,949) | | | | (287,474,303) | |
| | | | | | | | | | | | |
Total | | | (2,777,201,512) | | | | (2,631,669,436) | | | | (2,090,267,302) | |
(*) See Note 5.1.II.iii
29. EMPLOYEE BENEFITS EXPENSE.
Employee expenses for the years ended December 31, 2015, 2014 and 2013 are as follows:
| | | | | | | | | | | | |
| Employee Benefits Expense | | For the years ended | |
| | 12-31-2015 ThCh$ | | | 12-31-2014 (As adjusted)(*) ThCh$ | | | 12-31-2013 (As adjusted)(*) ThCh$ | |
| | | | | | | | | | | | |
Wages and salaries | | | (309,761,095) | | | | (266,240,462) | | | | (222,075,924) | |
Post-employment benefit obligations expense | | | (9,609,364) | | | | (7,571,331) | | | | (6,127,265) | |
Social security and other contributions | | | (159,641,192) | | | | (110,493,404) | | | | (111,537,633) | |
Other employee expenses | | | (8,686,496) | | | | (5,363,276) | | | | (5,827,374) | |
| | | | | | | | | | | | |
Total | | | (487,698,147) | | | | (389,668,473) | | | | (345,568,196) | |
(*) See Note 5.1.II.iii
30. DEPRECIATION, AMORTIZATION AND IMPAIRMENT LOSSES.
The detail of depreciation, amortization and impairment losses for the years ended December 31, 2015, 2014 and 2013 are as follows:
| | | | | | | | | | | | |
| | | For the years ended | |
| | 12-31-2015 ThCh$ | | | 12-31-2014 (As adjusted)(*) ThCh$ | | | 12-31-2013 (As adjusted)(*) ThCh$ | |
| | | | | | | | | | | | |
Depreciation | | | (245,598,045) | | | | (244,376,550) | | | | (225,418,868) | |
Amortization | | | (74,944,152) | | | | (106,366,200) | | | | (90,547,273) | |
| | | | | | | | | | | | |
Subtotal | | | (320,542,197) | | | | (350,742,750) | | | | (315,966,141) | |
Impairment (losses) reversals (**) | | | (39,811,756) | | | | (38,329,942) | | | | (66,664,976) | |
| | | | | | | | | | | | |
Total | | | (360,353,953) | | | | (389,072,692) | | | | (382,631,117) | |
(*) See Note 5.1.II.iii
| | | | | | | | | | | | | | | | | | | | | | | | | | | | | | | | | | | | | | | | | | | | | | | | |
(**) Information on Impairment Losses by Business
Segment | | Generation | | | Distribution | | | Other | | | For the years ended | |
| | 12-31-2015 ThCh$ | | | 12-31-2014 (As adjusted)(*) ThCh$ | | | 12-31-2013 (As adjusted)(*) ThCh$ | | | 12-31-2015 ThCh$ | | | 12-31-2014 (As adjusted)(*) ThCh$ | | | 12-31-2013 (As adjusted)(*) ThCh$ | | | 12-31-2015 ThCh$ | | | 12-31-2014 (As adjusted)(*) ThCh$ | | | 12-31-2013 (As adjusted)(*) ThCh$ | | | 12-31-2015 ThCh$ | | | 12-31-2014 (As adjusted)(*) ThCh$ | | | 12-31-2013 (As adjusted)(*) ThCh$ | |
| | | | | | | | | | | | | | | | | | | | | | | | | | | | | | | | | | | | | | | | | | | | | | | | |
| Financial assets (see Note 10c) | | | (4,794,591 | ) | | | (2,024,186 | ) | | | (718,835 | ) | | | (34,909,411 | ) | | | (20,090,180 | ) | | | (24,895,035 | ) | | | (75,708 | ) | | | (78,174 | ) | | | - | | | | (39,779,710 | ) | | | (22,192,540 | ) | | | (25,613,870 | ) |
| Intangible assets other than goodwill (see Note 15) | | | - | | | | - | | | | - | | | | - | | | | (14,948,785 | ) | | | (28,662,952 | ) | | | - | | | | - | | | | - | | | | - | | | | (14,948,785 | ) | | | (28,662,952 | ) |
| Property, plant and equipment (see note 17) | | | (32,046 | ) | | | (1,188,617 | ) | | | (12,388,154 | ) | | | - | | | | - | | | | - | | | | - | | | | - | | | | - | | | | (32,046 | ) | | | (1,188,617 | ) | | | (12,388,154 | ) |
| | | | | | | | | | | | | | | | | | | | | | | | | | | | | | | | | | | | | | | | | | | | | | | | |
| Total | | | (4,826,637 | ) | | | (3,212,803 | ) | | | (13,106,989 | ) | | | (34,909,411 | ) | | | (35,038,965 | ) | | | (53,557,987 | ) | | | (75,708 | ) | | | (78,174 | ) | | | - | | | | (39,811,756 | ) | | | (38,329,942 | ) | | | (66,664,976 | ) |
(*) See Note 5.1.II.iii
As of December 31, 2015, the assets related to Chilean operations that are subject to impairment test have been classified as non-current assets held for distribution to owners. (See Notes 3.k and 5.1)
| | |
| The accompanying notes are an integral part of these consolidated financial statements | | |
|
| F-127 |
31. OTHER EXPENSES.
Other miscellaneous operating expenses for the years ended December 31, 2015, 2014 and 2013 are as follows:
| | | | | | | | | | | | |
| Other Expenses | | For the years ended | |
| | 12-31-2015 ThCh$ | | | 12-31-2014 (As adjusted)(*) ThCh$ | | | 12-31-2013 (As adjusted)(*) ThCh$ | |
| | | | | | | | | | | | |
Other supplies and services | | | (58,304,067) | | | | (53,366,436) | | | | (47,840,403) | |
Professional, outsourced and other services | | | (162,323,852) | | | | (168,177,580) | | | | (166,380,283) | |
Repairs and maintenance | | | (107,991,590) | | | | (112,073,249) | | | | (97,452,388) | |
Indemnities and fines | | | (12,912,842) | | | | (16,742,020) | | | | (14,889,784) | |
Taxes and charges | | | (32,252,186) | | | | (13,489,033) | | | | (18,666,007) | |
Insurance premiums | | | (28,245,178) | | | | (23,656,637) | | | | (17,668,508) | |
Leases and rental costs | | | (12,449,187) | | | | (14,352,431) | | | | (10,835,191) | |
Marketing, public relations and advertising | | | (5,270,796) | | | | (4,700,359) | | | | (4,363,014) | |
Other supplies | | | (53,888,664) | | | | (41,535,780) | | | | (24,450,757) | |
Travel expenses | | | (13,769,681) | | | | (13,814,472) | | | | (2,783,610) | |
Environmental expenses (1) | | | (1,120,706) | | | | (1,821,267) | | | | (417,966) | |
| | | | | | | | | | | | |
Total | | | (488,528,749) | | | | (463,729,264) | | | | (405,747,911) | |
(*) See Note 5.1.II.iii
(1) It includes research costs recognized as expenses during the years ended December 31, 2015, 2014 and 2013 for ThCh$237,085, ThCh$403,574, and ThCh$1,996,818, respectively.
32. OTHER GAINS (LOSSES).
Other gains (losses) for the years ended December 31, 2015, 2014 and 2013 are as follows:
| | | | | | | | | | | | |
| Other Gains (Losses) | | For the years ended | |
| | 12-31-2015 ThCh$ | | | 12-31-2014 (As adjusted)(*) ThCh$ | | | 12-31-2013 (As adjusted)(*) ThCh$ | |
| | | | | | | | | | | | |
| Gain on sale of land | | | (6,758,695) | | | | - | | | | 3,429,125 | |
| Other | | | 192,470 | | | | 876,554 | | | | 1,213,143 | |
| | | | | | | | | | | | |
Total | | | (6,566,225) | | | | 876,554 | | | | 4,642,268 | |
(*) See Note 5.1.II.iii
| | |
| The accompanying notes are an integral part of these consolidated financial statements | | |
|
| F-128 |
33. FINANCIAL RESULTS.
Financial income and costs for the years ended December 31, 2015, 2014 and 2013 are as follows:
| | | | | | | | | | | | |
| Financial Income | | For the years ended | |
| | 12-31-2015 ThCh$ | | | 12-31-2014 (As adjusted)(*) ThCh$ | | | 12-31-2013 (As adjusted)(*) ThCh$ | |
| | | | | | | | | | | | |
Income from deposits and other financial instruments | | | 124,314,454 | | | | 86,576,973 | | | | 98,281,675 | |
Financial income on plan assets (Brazil) (3) | | | 135,153 | | | | 224,310 | | | | 200,526 | |
Other financial income (1) (2) (4) | | | 170,320,665 | | | | 164,320,479 | | | | 148,133,613 | |
| | | | | | | | | | | | |
Total | | | 294,770,272 | | | | 251,121,762 | | | | 246,615,814 | |
| | | | | | | | | | |
| Financial Costs | | For the years ended | |
| | 12-31-2015 ThCh$ | | | 12-31-2014 (As adjusted)(*) ThCh$ | | | 12-31-2013 (As adjusted)(*) ThCh$ | |
| | | | | | | | | | | | |
Financial costs | | | (385,455,340) | | | | (432,314,329) | | | | (325,972,302) | |
| | | | | | | | | | | | |
Bank loans | | | (38,921,033) | | | | (33,061,726) | | | | (30,027,336) | |
Secured and unsecured obligations | | | (179,258,559) | | | | (172,288,757) | | | | (149,082,277) | |
Financial leasing | | | (1,414,900) | | | | (817,985) | | | | (1,892,614) | |
Valuation of financial derivatives | | | (656,450) | | | | (124,470) | | | | (14,246,840) | |
Financial provisions | | | (54,616,547) | | | | (46,354,184) | | | | (37,415,815) | |
Post-employment benefit obligations | | | (19,595,016) | | | | (21,270,704) | | | | (17,979,936) | |
Capitalized borrowing costs | | | 73,008,564 | | | | 55,101,384 | | | | 29,326,555 | |
Other financial costs (1) | | | (164,001,399) | | | | (213,497,887) | | | | (104,654,039) | |
| | | | | | | | | | | | |
Gain (loss) from indexed assets and liabilities (**) | | | (9,266,040) | | | | (13,630,068) | | | | (11,007,801) | |
| | | | | | | | | | | | |
Foreign currency exchange differences (***) (4) | | | 128,238,047 | | | | (18,493,594) | | | | (28,534,786) | |
| | | | | | | | | | | | |
Total financial costs | | | (266,483,333) | | | | (464,437,991) | | | | (365,514,889) | |
| | | | | | | | | | | | |
Total financial results | | | 28,286,939 | | | | (213,316,229) | | | | (118,899,075) | |
(*) See Note 5.1.II.iii
(1) For the year ended December 31, 2015, this item includes a net financial income of ThCh$37,618,478 from the financial updating of non-amortized assets at their new replacement value at the end of the concession in the distribution companies Ampla and Coelce. For the year ended December 31, 2014, this financial updating generated a net financial cost of ThCh$68,728,638 as part of the revised tariff in 2014 in our Brazilian subsidiary Ampla and for the year ended December 31, 2013 a net financial income of ThCh$54,591,750 (See Note 9).
(2) On December 31, 2014 our subsidiary Central Costanera was forgiven interest owed to Mitsubishi and the present value of the Mitsubishi debt amounting to ThCh$84,534,955, under a restructuring agreement for this debt. The main conditions of the restructuring agreement include: the forgiveness of interest due and accrued as of September 30, 2014; the rescheduling of capital repayments over a period of 18 years, with a 12 month grace period so that obligations must be fully repaid before December 15, 2032; a minimum annual payment of US$3,000,000 (ThCh$2,130,480) in principal in quarterly installments at an annual interest rate of 0.25%; the maintenance of a pledge over assets and establishing restrictions on the payment of dividends.
(3) See Note 25.2.b).
(4) For the year ended December 31, 2015, our Argentine subsidiaries, Central Costanera, Chocón and Dock Sud recognized a gain for foreign currency exchange differences for ThCh$141,559,960 as a result of the dollarization of the receivables related to Central Vuelta de Obligado project (“VOSA”) and financial income of ThCh$57,079,871 for the interest accrued between the maturity date of each sale settlement contributed to the project and the receivables dollarized. (See Note 36.5)
In addition, our Argentine subsidiary Edesur recognized a financial income for ThCh$27,215,856 for compensations arising from the application of the Cost Monitoring Mechanism (MMC). (See Note 36.5)
| | |
| The accompanying notes are an integral part of these consolidated financial statements | | |
|
| F-129 |
The effects on financial results from exchange differences and the application of indexed assets and liabilities are originated from the following:
| | | | | | | | | | | | |
| Results from Indexed Assets and Liabilities (**) | | For the years ended | |
| | 12-31-2015 ThCh$ | | | 12-31-2014 (As adjusted)(*) ThCh$ | | | 12-31-2013 (As adjusted)(*) ThCh$ | |
| | | | | | | | | | | | |
Other financial assets | | | - | | | | - | | | | 57,533 | |
Current tax assets and liabilities | | | 1,240 | | | | 21,157 | | | | - | |
Other financial liabilities (financial debt and derivative instruments) | | | (9,267,280) | | | | (13,651,225) | | | | (11,065,334) | |
| | | | | | | | | | | | |
Total | | | (9,266,040) | | | | (13,630,068) | | | | (11,007,801) | |
| | | | | | | | | | | | |
| Exchange Differences (***) | | For the years ended | |
| | 12-31-2015 ThCh$ | | | 12-31-2014 (As adjusted)(*) ThCh$ | | | 12-31-2013 (As adjusted)(*) ThCh$ | |
| | | | | | | | | | | | |
Cash and cash equivalents | | | 7,304,624 | | | | 22,199,061 | | | | 4,314,865 | |
Other financial assets | | | 170,679,018 | | | | 34,690,822 | | | | 36,371,996 | |
Other non-financial assets | | | 4,995,376 | | | | 93,239 | | | | 2,598,929 | |
Trade and other receivables | | | 51,506,895 | | | | 12,791,191 | | | | 21,298,397 | |
Current tax assets and liabilities | | | - | | | | 24,876 | | | | (15,094) | |
Other financial liabilities (financial debt and derivative instruments) | | | (44,858,948) | | | | (74,345,529) | | | | (74,877,013) | |
Trade and other payables | | | (37,360,135) | | | | (10,195,770) | | | | (15,455,737) | |
Other non-financial liabilities | | | (24,028,783) | | | | (3,751,484) | | | | (2,771,129) | |
| | | | | | | | | | | | |
Total | | | 128,238,047 | | | | (18,493,594) | | | | (28,534,786) | |
(*) See Note 5.1.II.iii
| | |
| The accompanying notes are an integral part of these consolidated financial statements | | |
|
| F-130 |
34. INCOME TAXES.
The following table presents the components of the income tax expense/(benefit) recorded in the consolidated statement of comprehensive income for the years ended December 31, 2015, 2014 and 2013:
| | | | | | | | | | | | |
Current Income Tax and Adjustments
to Current Income Tax for Previous Periods | | For the years ended | |
| | 12-31-2015 ThCh$ | | | 12-31-2014 (As adjusted)(*) ThCh$ | | | 12-31-2013 (As adjusted)(*) ThCh$ | |
| | | | | | | | | | | | |
Current income tax | | | (469,517,752) | | | | (450,655,418) | | | | (457,664,808) | |
| Tax benefit from tax losses, tax credits or temporary differences not previously recognized for the current period (current tax credits and/or benefits) | | | 29,215,046 | | | | 34,026,202 | | | | 23,234,522 | |
Adjustments to current tax from the previous period | | | (5,195,560) | | | | 2,871,018 | | | | (1,810,633) | |
Benefit / (expense) for current income tax due to changes in tax rates or the introduction of new taxes | | | - | | | | - | | | | - | |
Other current tax benefit / (expense) | | | (3,063,579) | | | | (97,812) | | | | (4,099,916) | |
| | | | | | | | | | | | |
Current tax expense, net | | | (448,561,845) | | | | (413,856,010) | | | | (440,340,835) | |
| | | | | | | | | | | | |
Benefit / (expense) from deferred taxes for origination and reversal of temporary differences | | | (72,465,637) | | | | (45,506,055) | | | | 2,369,050 | |
| Benefit / (expense) from deferred taxes due to changes in tax rates or the introduction of new taxes | | | - | | | | 33,404,603 | | | | (1,238,888) | |
Other components of deferred tax (benefit) /expense | | | - | | | | - | | | | (3,244,670) | |
Adjustments for prior periods deferred taxes | | | (2,635,730) | | | | - | | | | - | |
| | | | | | | | | | | | |
Total deferred tax benefit / (expense) | | | (75,101,367) | | | | (12,101,452) | | | | (2,114,508) | |
| | | | | | | | | | | | |
Income tax expense, continuing operations | | | (523,663,212) | | | | (425,957,462) | | | | (442,455,343) | |
(*) See Note 5.1.II.iii
The following table reconciles income taxes resulting from applying the local current tax rate to “Net income before taxes” and the actual income tax expense recognized in the consolidated statement of comprehensive income for the years ended December 31, 2015, 2014 and 2013:
| | | | | | | | | | | | | | | | | | | | | | | | |
| Reconciliation of Tax Expense | | Rate | | | 12-31-2015 ThCh$ | | | Rate | | | 12-31-2014 (As adjusted)(*) ThCh$ | | | Rate | | | 12-31-2013 (As adjusted)(*) ThCh$ | |
| | | | | | | | | | | | | | | | | | | | | | | | |
ACCOUNTING INCOME BEFORE TAX | | | | | | | 1,279,812,171 | | | | | | | | 1,178,120,689 | | | | | | | | 1,237,790,881 | |
| | | | | | | | | | | | | | | | | | | | | | | | |
Total tax income (expense) using statutory rate | | | (22.50%) | | | | (287,957,738) | | | | (21.00%) | | | | (247,405,345) | | | | (20.00%) | | | | (247,558,175) | |
Tax effect of rates applied in other countries | | | (12.88%) | | | | (164,815,692) | | | | (11.89%) | | | | (140,032,350) | | | | (13.99%) | | | | (173,156,559) | |
Tax effect of non-taxable revenues and benefits from tax losses and tax credits | | | 4.93% | | | | 63,075,794 | | | | 8.36% | | | | 98,468,095 | | | | 9.95% | | | | 123,130,008 | |
Tax effect of non-tax-deductible expenses | | | (4.39%) | | | | (56,128,320) | | | | (13.63%) | | | | (160,565,951) | | | | (5.62%) | | | | (69,552,897) | |
Tax effect of changes in income tax rates | | | | | | | - | | | | 2.84% | | | | 33,404,603 | | | | (0.10%) | | | | (1,238,888) | |
Tax effect of adjustments to taxes in previous periods | | | (0.41%) | | | | (5,195,560) | | | | 0.24% | | | | 2,871,018 | | | | (0.15%) | | | | (1,810,633) | |
Adjustments for prior periods deferred taxes | | | (0.21%) | | | | (2,635,730) | | | | - | | | | - | | | | - | | | | - | |
Price level restatement for tax purposes (investments in subsidiaries, associates and joint ventures and equity) | | | (5.47%) | | | | (70,005,966) | | | | (1.08%) | | | | (12,697,532) | | | | (5.84%) | | | | (72,268,199) | |
Total adjustments to tax expense using statutory rate | | | (18.43%) | | | | (235,705,474) | | | | (15.16%) | | | | (178,552,117) | | | | (15.75%) | | | | (194,897,168) | |
| | | | | | | | | | | | | | | | | | | | | | | | |
Income tax benefit (expense), continuing operations | | | (40.93%) | | | | (523,663,212) | | | | (36.16%) | | | | (425,957,462) | | | | (35.75%) | | | | (442,455,343) | |
(*) See Note 5.1.II.iii
| | |
| The accompanying notes are an integral part of these consolidated financial statements | | |
|
| F-131 |
35. INFORMATION BY SEGMENT.
35.1 Basis of segmentation
The Group’s activities are organized primarily around its core businesses: electric energy generation, transmission and distribution. On that basis, the Group has established two major business lines.
Considering presents the differentiated information that is analyzed by the Company’s chief operating decision maker, segment information has been organized by the geographical areas in which the Group operates:
● Chile (Discontinued operations)
● Argentina
● Brazil
● Peru
● Colombia
Given that the Group’s corporate organization basically matches its business organization and, therefore, the segments, the following information is based on the financial information of the companies forming each segment. The accounting policies used to determine the segment information are the same as those used in the preparation of the Group’s consolidated financial statements. Based on this context and taking into consideration the corporate reorganization as discussed in Notes 5.1 and 41, the financial information related to the Chilean operations is presented, in the case of assets and liabilities, as held for distribution to owners, and in the case of income statement accounts, as discontinued operations.
The following tables present details of this information by segment:
| | |
| The accompanying notes are an integral part of these consolidated financial statements | | |
|
| F-132 |
35.2 Generation and transmission, distribution and others
| | | | | | | | | | | | | | | | | | | | | | | | | | | | | | |
| Line of Business | | Generation and Transmission | | | Distribution | | | Eliminations and others | | | Total |
| ASSETS | | 12-31-2015 ThCh$ | | | 12-31-2014 ThCh$ | | | 12-31-2015 ThCh$ | | | 12-31-2014 ThCh$ | | | 12-31-2015 ThCh$ | | | 12-31-2014 ThCh$ | | | 12-31-2015 ThCh$ | | | 12-31-2014 ThCh$ |
CURRENT ASSETS | | | 3,974,309,548 | | | | 1,258,524,552 | | | | 2,233,248,507 | | | | 1,682,754,340 | | | | 1,706,003,655 | | | | 990,219,996 | | | | 7,913,561,710 | | | 3,931,498,888 |
Cash and cash equivalents | | | 158,234,836 | | | | 444,764,922 | | | | 174,458,784 | | | | 274,881,316 | | | | 852,469,724 | | | | 985,099,253 | | | | 1,185,163,344 | | | 1,704,745,491 |
Other current financial assets | | | 11,466,253 | | | | 50,850,528 | | | | 34,171,369 | | | | 25,046,824 | | | | 22,624,824 | | | | 23,558,051 | | | | 68,262,446 | | | 99,455,403 |
Other current non-financial assets | | | 26,895,066 | | | | 61,264,981 | | | | 72,076,278 | | | | 109,728,709 | | | | 3,017,713 | | | | 4,104,422 | | | | 101,989,057 | | | 175,098,112 |
Trade and other current receivables | | | 281,533,993 | | | | 498,363,943 | | | | 802,286,571 | | | | 1,178,238,427 | | | | 4,311,003 | | | | 5,084,533 | | | | 1,088,131,567 | | | 1,681,686,903 |
Current accounts receivable from related companies | | | 69,698,172 | | | | 77,105,049 | | | | 27,676,364 | | | | 29,295,267 | | | | (93,807,606) | | | | (87,958,976) | | | | 3,566,930 | | | 18,441,340 |
Inventories | | | 33,665,661 | | | | 73,796,781 | | | | 61,185,174 | | | | 56,267,388 | | | | 207,062 | | | | 3,455,985 | | | | 95,057,897 | | | 133,520,154 |
Current tax assets | | | 3,751,263 | | | | 52,378,348 | | | | 11,961,862 | | | | 9,296,409 | | | | 31,741,463 | | | | 48,897,765 | | | | 47,454,588 | | | 110,572,522 |
| | | | | | | | | | | | | | | | | | | | | | | | | | | | | | |
Non-current assets or disposal groups held for sale or held for distribution to owners | | | 3,389,064,304 | | | | - | | | | 1,049,432,105 | | | | - | | | | 885,439,472 | | | | 7,978,963 | | | | 5,323,935,881 | | | 7,978,963 |
| | | | | | | | | | | | | | | | | | | | | | | | | | | | | | |
NON-CURRENT ASSETS | | | 4,070,922,143 | | | | 6,814,137,154 | | | | 4,091,696,107 | | | | 5,034,348,611 | | | | (627,025,569) | | | | 141,337,663 | | | | 7,535,592,681 | | | 11,989,823,428 |
Other non-current financial assets | | | 625,982 | | | | 7,937,828 | | | | 488,884,301 | | | | 496,520,403 | | | | 17,921 | | | | 26,363,289 | | | | 489,528,204 | | | 530,821,520 |
Other non-current non-financial assets | | | 9,847,779 | | | | 12,590,288 | | | | 54,741,348 | | | | 61,369,954 | | | | 12,973,581 | | | | 3,845,938 | | | | 77,562,708 | | | 77,806,180 |
Trade and other non-current receivables | | | 310,451,501 | | | | 185,266,255 | | | | 88,178,936 | | | | 106,105,806 | | | | 65,427 | | | | 269,614 | | | | 398,695,864 | | | 291,641,675 |
Non-current accounts receivable from related companies | | | - | | | | - | | | | 355,485 | | | | 486,605 | | | | - | | | | - | | | | 355,485 | | | 486,605 |
Investments accounted for using the equity method | | | 478,361,882 | | | | 609,409,322 | | | | 491,519,716 | | | | 574,400,438 | | | | (938,921,153) | | | | (1,110,176,150) | | | | 30,960,445 | | | 73,633,610 |
Intangible assets other than goodwill | | | 33,665,518 | | | | 55,498,838 | | | | 933,484,014 | | | | 1,097,100,837 | | | | 14,249,740 | | | | 15,612,381 | | | | 981,399,272 | | | 1,168,212,056 |
Goodwill | | | 100,700,655 | | | | 125,609,898 | | | | 76,703,162 | | | | 100,220,100 | | | | 266,795,230 | | | | 1,185,023,629 | | | | 444,199,047 | | | 1,410,853,627 |
Property, plant and equipment | | | 3,097,266,606 | | | | 5,723,349,345 | | | | 1,905,927,300 | | | | 2,522,222,675 | | | | 372,727 | | | | (11,356,301) | | | | 5,003,566,633 | | | 8,234,215,719 |
Investment property | | | - | | | | - | | | | - | | | | - | | | | - | | | | 8,514,562 | | | | - | | | 8,514,562 |
Deferred tax assets | | | 40,002,220 | | | | 94,475,380 | | | | 51,901,845 | | | | 75,921,793 | | | | 17,420,958 | | | | 23,240,701 | | | | 109,325,023 | | | 193,637,874 |
| | | | | | | | | | | | | | | | | | | | | | | | | | | | | | |
TOTAL ASSETS | | | 8,045,231,691 | | | | 8,072,661,706 | | | | 6,324,944,614 | | | | 6,717,102,951 | | | | 1,078,978,086 | | | | 1,131,557,659 | | | | 15,449,154,391 | | | 15,921,322,316 |
| | | | | | | | | | | | | | | | | | | | | | | | | | | | | | |
| Line of Business | | Generation and Transmission | | | Distribution | | | Eliminations and others | | | Total |
| LIABILITIES AND EQUITY | | 12-31-2015 ThCh$ | | | 12-31-2014 ThCh$ | | | 12-31-2015 ThCh$ | | | 12-31-2014 ThCh$ | | | 12-31-2015 ThCh$ | | | 12-31-2014 ThCh$ | | | 12-31-2015 ThCh$ | | | 12-31-2014 ThCh$ |
CURRENT LIABILITIES | | | 2,735,116,868 | | | | 1,622,353,344 | | | | 1,838,355,464 | | | | 1,856,594,893 | | | | (68,091,532) | | | | (284,126,253) | | | | 4,505,380,800 | | | 3,194,821,984 |
Other current financial liabilities | | | 230,270,298 | | | | 297,869,150 | | | | 206,125,030 | | | | 119,552,373 | | | | 251,478,180 | | | | 4,384,156 | | | | 687,873,508 | | | 421,805,679 |
Trade and other current payables | | | 342,712,347 | | | | 777,931,218 | | | | 1,037,064,551 | | | | 1,403,375,115 | | | | 73,047,309 | | | | 107,570,617 | | | | 1,452,824,207 | | | 2,288,876,950 |
Current accounts payable to related companies | | | 104,568,189 | | | | 371,111,287 | | | | 72,131,804 | | | | 189,021,282 | | | | (66,802,485) | | | | (416,451,947) | | | | 109,897,508 | | | 143,680,622 |
Other current provisions | | | 81,419,354 | | | | 38,351,988 | | | | 45,879,822 | | | | 51,247,787 | | | | - | | | | 622,909 | | | | 127,299,176 | | | 90,222,684 |
Current tax liabilities | | | 91,117,121 | | | | 96,623,249 | | | | 24,166,415 | | | | 16,472,461 | | | | 27,324,424 | | | | 2,376,603 | | | | 142,607,960 | | | 115,472,313 |
Current provisions for employee benefits | | | - | | | | - | | | | - | | | | - | | | | - | | | | - | | | | - | | | - |
Other current non-financial liabilities | | | 1,951,295 | | | | 40,466,452 | | | | 35,966,491 | | | | 76,925,875 | | | | 1,308,553 | | | | 11,883,262 | | | | 39,226,339 | | | 129,275,589 |
| | | | | | | | | | | | | | | | | | | | | | | | | | | | | | | |
Liabilities associated with groups of assets or disposal groups held for sale or distribution to owners | | | 1,883,078,264 | | | | - | | | | 417,021,351 | | | | - | | | | (354,447,513) | | | | 5,488,147 | | | | 1,945,652,102 | | | 5,488,147 |
| | | | | | | | | | | | | | | | | | | | | | | | | | | | | | |
NON-CURRENT LIABILITIES | | | 1,313,277,539 | | | | 2,398,122,150 | | | | 1,559,780,584 | | | | 1,770,828,652 | | | | (119,092,912) | | | | 278,330,784 | | | | 2,753,965,211 | | | 4,447,281,586 |
Other non-current financial liabilities | | | 941,834,867 | | | | 1,871,186,406 | | | | 883,297,767 | | | | 1,153,615,811 | | | | 22,163,958 | | | | 264,295,311 | | | | 1,847,296,592 | | | 3,289,097,528 |
Trade and other non-current payables | | | 97,364,873 | | | | 3,858,836 | | | | 178,027,558 | | | | 155,526,685 | | | | 8,151,823 | | | | - | | | | 283,544,254 | | | 159,385,521 |
Non-current accounts payable to related companies | | | 10,685,702 | | | | 4,908,454 | | | | 157,179,286 | | | | - | | | | (167,864,988) | | | | (4,908,454) | | | | - | | | - |
Other long-term provisions | | | 41,883,233 | | | | 34,859,087 | | | | 141,808,620 | | | | 162,308,328 | | | | 156,431 | | | | 76,426 | | | | 183,848,284 | | | 197,243,841 |
Deferred tax liabilities | | | 181,262,110 | | | | 397,978,536 | | | | 34,940,876 | | | | 61,859,841 | | | | 15,701,629 | | | | 18,523,107 | | | | 231,904,615 | | | 478,361,484 |
Non-current provisions for employee benefits | | | 21,548,342 | | | | 43,461,827 | | | | 163,123,897 | | | | 213,666,598 | | | | 2,598,235 | | | | 12,801,987 | | | | 187,270,474 | | | 269,930,412 |
Other non-current non-financial liabilities | | | 18,698,412 | | | | 41,869,004 | | | | 1,402,580 | | | | 23,851,389 | | | | - | | | | (12,457,593) | | | | 20,100,992 | | | 53,262,800 |
| | | | | | | | | | | | | | | | | | | | | | | | | | | | | | |
EQUITY | | | 3,996,837,284 | | | | 4,052,186,212 | | | | 2,926,808,566 | | | | 3,089,679,406 | | | | 1,266,162,530 | | | | 1,137,353,128 | | | | 8,189,808,380 | | | 8,279,218,746 |
Equity attributable to shareholders of Enersis Américas | | | 3,996,837,284 | | | | 4,052,186,212 | | | | 2,926,808,566 | | | | 3,089,679,406 | | | | 1,266,162,530 | | | | 1,137,353,128 | | | | 6,026,149,285 | | | 6,201,976,047 |
Issued capital | | | 1,476,722,861 | | | | 1,512,762,830 | | | | 860,651,565 | | | | 872,231,352 | | | | 3,467,073,560 | | | | 3,419,453,804 | | | | 5,804,447,986 | | | 5,804,447,986 |
Retained earnings | | | 2,358,601,470 | | | | 2,172,639,133 | | | | 1,414,711,314 | | | | 1,384,094,891 | | | | (392,651,261) | | | | (504,999,579) | | | | 3,380,661,523 | | | 3,051,734,445 |
Share premium | | | 206,058,198 | | | | 206,599,062 | | | | 3,547,484 | | | | 3,965,297 | | | | (209,605,682) | | | | (210,564,359) | | | | - | | | - |
Other reserves | | | (44,545,245) | | | | 160,185,187 | | | | 647,898,203 | | | | 829,387,866 | | | | (1,598,654,087) | | | | (1,566,536,738) | | | | (3,158,960,224) | | | (2,654,206,384) |
| | | | | | | | | | | | | | | | | | | | | | | | | | | | | | |
Non-controlling interests | | | - | | | | - | | | | - | | | | - | | | | - | | | | - | | | | 2,163,659,095 | | | 2,077,242,699 |
| | | | | | | | | | | | | | | | | | | | | | | | | | | | | | |
Total Liabilities and Equity | | | 8,045,231,691 | | | | 8,072,661,706 | | | | 6,324,944,614 | | | | 6,717,102,951 | | | | 1,078,978,086 | | | | 1,131,557,659 | | | | 15,449,154,391 | | | 15,921,322,316 |
The eliminations column corresponds to transactions between companies in different lines of business and country, primarily purchases and sales of energy and services.
| | |
| The accompanying notes are an integral part of these consolidated financial statements | | |
|
| F-133 |
| | | | | | | | | | | | | | | | | | | | | | | | | | | | | | | | | | | | | | | | | | | | | | | | |
| Line of Business | | Generation and Transmission | | | Distribution | | | Eliminations and others | | | Total | |
| STATEMENT OF COMPREHENSIVE INCOME | | 12-31-2015 ThCh$ | | | 12-31-2014 ThCh$ | | | 12-31-2013 ThCh$ | | | 12-31-2015 ThCh$ | | | 12-31-2014 ThCh$ | | | 12-31-2013 ThCh$ | | | 12-31-2015 ThCh$ | | | 12-31-2014 ThCh$ | | | 12-31-2013 ThCh$ | | | 12-31-2015 ThCh$ | | | 12-31-2014 ThCh$ | | | 12-31-2013 ThCh$ | |
| REVENUES AND OTHER OPERATING INCOME | | | 1,734,761,772 | | | | 1,762,869,133 | | | | 1,481,343,900 | | | | 3,890,722,930 | | | | 3,802,108,560 | | | | 3,429,456,365 | | | | (324,045,124) | | | | (358,607,905) | | | | (382,652,396) | | | | 5,301,439,578 | | | | 5,206,369,788 | | | | 4,528,147,869 | |
Revenues | | | 1,668,272,704 | | | | 1,701,051,112 | | | | 1,419,296,486 | | | | 3,321,156,669 | | | | 3,463,626,805 | | | | 2,941,988,973 | | | | (321,784,063) | | | | (358,222,180) | | | | (382,290,107) | | | | 4,667,645,310 | | | | 4,806,455,737 | | | | 3,978,995,352 | |
Energy sales | | | 1,486,031,970 | | | | 1,514,124,760 | | | | 1,305,087,063 | | | | 3,022,021,032 | | | | 3,157,667,595 | | | | 2,709,628,604 | | | | (283,671,303) | | | | (321,958,393) | | | | (363,372,422) | | | | 4,224,381,699 | | | | 4,349,833,962 | | | | 3,651,343,245 | |
Other sales | | | 21,124,909 | | | | 13,080,015 | | | | 8,817,669 | | | | 19,523,142 | | | | 21,140,924 | | | | 3,648,462 | | | | - | | | | - | | | | 6,569,786 | | | | 40,648,051 | | | | 34,220,939 | | | | 19,035,917 | |
Other services rendered | | | 161,115,825 | | | | 173,846,337 | | | | 105,391,754 | | | | 279,612,495 | | | | 284,818,286 | | | | 228,711,907 | | | | (38,112,760) | | | | (36,263,787) | | | | (25,487,471) | | | | 402,615,560 | | | | 422,400,836 | | | | 308,616,190 | |
Other operating income | | | 66,489,068 | | | | 61,818,021 | | | | 62,047,414 | | | | 569,566,261 | | | | 338,481,755 | | | | 487,467,392 | | | | (2,261,061) | | | | (385,725) | | | | (362,289) | | | | 633,794,268 | | | | 399,914,051 | | | | 549,152,517 | |
| | | | | | | | | | | | | | | | | | | | | | | | | | | | | | | | | | | | | | | | | | | | | | | | |
RAW MATERIALS AND CONSUMABLES USED | | | (677,940,967) | | | | (653,688,007) | | | | (514,810,596) | | | | (2,423,363,923) | | | | (2,338,428,095) | | | | (1,960,921,763) | | | | 324,103,378 | | | | 360,446,666 | | | | 385,465,057 | | | | (2,777,201,512) | | | | (2,631,669,436) | | | | (2,090,267,302) | |
Energy purchases | | | (235,046,359) | | | | (258,676,854) | | | | (168,445,337) | | | | (1,951,642,845) | | | | (1,900,048,593) | | | | (1,446,778,480) | | | | 300,772,778 | | | | 334,722,661 | | | | 363,077,208 | | | | (1,885,916,426) | | | | (1,824,002,786) | | | | (1,252,146,609) | |
Fuel consumption | | | (258,113,922) | | | | (205,534,394) | | | | (174,504,021) | | | | - | | | | - | | | | - | | | | - | | | | - | | | | - | | | | (258,113,922) | | | | (205,534,394) | | | | (174,504,021) | |
Transportation expenses | | | (124,612,122) | | | | (124,900,859) | | | | (97,694,362) | | | | (147,073,303) | | | | (168,191,394) | | | | (144,200,252) | | | | 25,872,051 | | | | 27,906,871 | | | | 25,035,921 | | | | (245,813,374) | | | | (265,185,382) | | | | (216,858,693) | |
Other miscellaneous supplies and services | | | (60,168,564) | | | | (64,575,900) | | | | (74,166,876) | | | | (324,647,775) | | | | (270,188,108) | | | | (369,943,031) | | | | (2,541,451) | | | | (2,182,866) | | | | (2,648,072) | | | | (387,357,790) | | | | (336,946,874) | | | | (446,757,979) | |
| | | | | | | | | | | | | | | | | | | | | | | | | | | | | | | | | | | | | | | | | | | | | | | | |
CONTRIBUTION MARGIN | | | 1,056,820,805 | | | | 1,109,181,126 | | | | 966,533,304 | | | | 1,467,359,007 | | | | 1,463,680,465 | | | | 1,468,534,602 | | | | 58,254 | | | | 1,838,761 | | | | 2,812,661 | | | | 2,524,238,066 | | | | 2,574,700,352 | | | | 2,437,880,567 | |
| | | | | | | | | | | | | | | | | | | | | | | | | | | | | | | | | | | | | | | | | | | | | | | | |
Other work performed by the entity and capitalized | | | 14,387,605 | | | | 13,548,280 | | | | 9,255,740 | | | | 52,567,319 | | | | 42,103,255 | | | | 37,795,406 | | | | 146,345 | | | | 118,883 | | | | 83,324 | | | | 67,101,269 | | | | 55,770,418 | | | | 47,134,470 | |
Employee benefits expense | | | (107,850,396) | | | | (92,178,851) | | | | (78,825,827) | | | | (365,683,363) | | | | (283,638,620) | | | | (256,035,562) | | | | (14,164,388) | | | | (13,851,002) | | | | (10,706,807) | | | | (487,698,147) | | | | (389,668,473) | | | | (345,568,196) | |
Other expenses | | | (96,544,274) | | | | (84,426,859) | | | | (71,568,476) | | | | (372,678,643) | | | | (376,865,536) | | | | (331,687,784) | | | | (19,305,832) | | | | (2,436,869) | | | | (2,491,651) | | | | (488,528,749) | | | | (463,729,264) | | | | (405,747,911) | |
| | | | | | | | | | | | | | | | | | | | | | | | | | | | | | | | | | | | | | | | | | | | | | | | |
GROSS OPERATING RESULT | | | 866,813,740 | | | | 946,123,696 | | | | 825,394,741 | | | | 781,564,320 | | | | 845,279,564 | | | | 918,606,662 | | | | (33,265,621) | | | | (14,330,227) | | | | (10,302,473) | | | | 1,615,112,439 | | | | 1,777,073,033 | | | | 1,733,698,930 | |
| | | | | | | | | | | | | | | | | | | | | | | | | | | | | | | | | | | | | | | | | | | | | | | | |
Depreciation and amortization expense | | | (147,291,267) | | | | (142,609,270) | | | | (130,646,915) | | | | (173,636,385) | | | | (208,532,299) | | | | (185,622,948) | | | | 385,455 | | | | 398,819 | | | | 303,722 | | | | (320,542,197) | | | | (350,742,750) | | | | (315,966,141) | |
Impairment losses (reversal of impairment losses) recognized in profit or loss | | | (4,826,638) | | | | (3,212,803) | | | | (13,106,989) | | | | (34,909,411) | | | | (35,038,965) | | | | (53,557,987) | | | | (75,707) | | | | (78,174) | | | | - | | | | (39,811,756) | | | | (38,329,942) | | | | (66,664,976) | |
| | | | | | | | | | | | | | | | | | | | | | | | | | | | | | | | | | | | | | | | | | | | | | | | |
OPERATING INCOME | | | 714,695,835 | | | | 800,301,623 | | | | 681,640,837 | | | | 573,018,524 | | | | 601,708,300 | | | | 679,425,727 | | | | (32,955,873) | | | | (14,009,582) | | | | (9,998,751) | | | | 1,254,758,486 | | | | 1,388,000,341 | | | | 1,351,067,813 | |
| | | | | | | | | | | | | | | | | | | | | | | | | | | | | | | | | | | | | | | | | | | | | | | | |
FINANCIAL RESULT | | | 99,864,652 | | | | (22,550,175) | | | | (94,072,305) | | | | (97,880,409) | | | | (252,708,515) | | | | (54,492,019) | | | | 26,302,696 | | | | 61,942,461 | | | | 29,665,249 | | | | 28,286,939 | | | | (213,316,229) | | | | (118,899,075) | |
Financial income | | | 88,032,028 | | | | 111,084,259 | | | | 34,749,918 | | | | 177,432,364 | | | | 84,910,412 | | | | 152,859,615 | | | | 29,305,880 | | | | 55,127,091 | | | | 59,006,281 | | | | 294,770,272 | | | | 251,121,762 | | | | 246,615,814 | |
Cash and cash equivalents | | | 86,308,158 | | | | 26,728,453 | | | | 24,151,441 | | | | 8,809,058 | | | | 14,617,999 | | | | 15,448,973 | | | | 29,197,237 | | | | 45,230,521 | | | | 58,681,261 | | | | 124,314,453 | | | | 86,576,973 | | | | 98,281,675 | |
Financial income | | | 1,723,870 | | | | 84,355,806 | | | | 10,598,477 | | | | 168,623,306 | | | | 70,292,413 | | | | 137,410,642 | | | | 108,643 | | | | 9,896,570 | | | | 325,020 | | | | 170,455,819 | | | | 164,544,789 | | | | 148,334,139 | |
Financial costs | | | (109,517,207) | | | | (85,935,531) | | | | (91,401,647) | | | | (275,453,176) | | | | (335,813,681) | | | | (206,291,506) | | | | (484,957) | | | | (10,565,117) | | | | (28,279,149) | | | | (385,455,340) | | | | (432,314,329) | | | | (325,972,302) | |
Bank borrowings | | | (18,475,838) | | | | (21,393,127) | | | | (21,454,758) | | | | (21,914,438) | | | | (11,665,822) | | | | (8,572,508) | | | | 1,469,244 | | | | (2,777) | | | | (70) | | | | (38,921,032) | | | | (33,061,726) | | | | (30,027,336) | |
Secured and unsecured obligations | | | (74,589,458) | | | | (78,729,951) | | | | (55,830,044) | | | | (76,174,292) | | | | (80,574,024) | | | | (68,810,393) | | | | (28,494,810) | | | | (12,984,782) | | | | (24,441,840) | | | | (179,258,560) | | | | (172,288,757) | | | | (149,082,277) | |
Other | | | (16,451,911) | | | | 14,187,547 | | | | (14,116,845) | | | | (177,364,446) | | | | (243,573,835) | | | | (128,908,605) | | | | 26,540,609 | | | | 2,422,442 | | | | (3,837,239) | | | | (167,275,748) | | | | (226,963,846) | | | | (146,862,689) | |
Profits (losses) from indexed assets and liabilities | | | - | | | | - | | | | - | | | | 1,240 | | | | 1,579 | | | | - | | | | (9,267,280) | | | | (13,631,647) | | | | (11,007,801) | | | | (9,266,040) | | | | (13,630,068) | | | | (11,007,801) | |
Foreign currency exchange differences | | | 121,349,831 | | | | (47,698,903) | | | | (37,420,576) | | | | 139,163 | | | | (1,806,825) | | | | (1,060,128) | | | | 6,749,053 | | | | 31,012,134 | | | | 9,945,918 | | | | 128,238,047 | | | | (18,493,594) | | | | (28,534,786) | |
Positive | | | 219,603,572 | | | | 39,651,691 | | | | 46,792,154 | | | | 9,537,474 | | | | 4,303,366 | | | | 3,380,853 | | | | 45,868,225 | | | | 57,413,955 | | | | 36,265,682 | | | | 275,009,271 | | | | 101,369,012 | | | | 86,438,689 | |
Negative | | | (98,253,741) | | | | (87,350,594) | | | | (84,212,730) | | | | (9,398,311) | | | | (6,110,191) | | | | (4,440,981) | | | | (39,119,172) | | | | (26,401,821) | | | | (26,319,764) | | | | (146,771,224) | | | | (119,862,606) | | | | (114,973,475) | |
Share of profit of associates accounted for using the equity method | | | 2,678,513 | | | | - | | | | - | | | | 787,056 | | | | 2,595,760 | | | | 975,149 | | | | (132,598) | | | | (35,737) | | | | 4,726 | | | | 3,332,971 | | | | 2,560,023 | | | | 979,875 | |
Other gains (losses) | | | (394,854) | | | | 798,130 | | | | 904,474 | | | | (6,171,371) | | | | 78,424 | | | | 3,737,794 | | | | - | | | | - | | | | - | | | | (6,566,225) | | | | 876,554 | | | | 4,642,268 | |
Gain (loss) from other investments | | | - | | | | 707,468 | | | | 768,433 | | | | - | | | | - | | | | - | | | | - | | | | - | | | | - | | | | - | | | | 707,468 | | | | 768,433 | |
Gain (loss) from the sale of property, plant and equipment | | | (394,854) | | | | 90,662 | | | | 136,041 | | | | (6,171,371) | | | | 78,424 | | | | 3,737,794 | | | | - | | | | - | | | | - | | | | (6,566,225) | | | | 169,086 | | | | 3,873,835 | |
| | | | | | | | | | | | | | | | | | | | | | | | | | | | | | | | | | | | | | | | | | | | | | | | |
Income before tax | | | 816,844,146 | | | | 778,549,578 | | | | 588,473,006 | | | | 469,753,800 | | | | 351,673,969 | | | | 629,646,651 | | | | (6,785,775) | | | | 47,897,142 | | | | 19,671,224 | | | | 1,279,812,171 | | | | 1,178,120,689 | | | | 1,237,790,881 | |
| | | | | | | | | | | | | | | | | | | | | | | | | | | | | | | | | | | | | | | | | | | | | | | | |
Income tax | | | (335,604,989) | | | | (254,393,601) | | | | (192,628,860) | | | | (135,349,415) | | | | (124,465,813) | | | | (176,573,448) | | | | (52,708,808) | | | | (47,098,048) | | | | (73,253,035) | | | | (523,663,212) | | | | (425,957,462) | | | | (442,455,343) | |
| | | | | | | | | | | | | | | | | | | | | | | | | | | | | | | | | | | | | | | | | | | | | | | | |
Net income from continuing operations | | | 481,239,157 | | | | 524,155,977 | | | | 395,844,146 | | | | 334,404,385 | | | | 227,208,156 | | | | 453,073,203 | | | | (59,494,583) | | | | 799,094 | | | | (53,581,811) | | | | 756,148,959 | | | | 752,163,227 | | | | 795,335,538 | |
Income from discontinued operations | | | 223,831,259 | | | | 63,327,692 | | | | 179,048,751 | | | | 139,672,809 | | | | 125,385,213 | | | | 114,054,872 | | | | 24,816,458 | | | | 26,619,076 | | | | 24,961,585 | | | | 388,320,526 | | | | 215,331,981 | | | | 318,065,208 | |
| | | | | | | | | | | | | | | | | | | | | | | | | | | | | | | | | | | | | | | | | | | | | | | | |
NET INCOME | | | 705,070,416 | | | | 587,483,669 | | | | 574,892,897 | | | | 474,077,194 | | | | 352,593,369 | | | | 567,128,075 | | | | (34,678,125) | | | | 27,418,170 | | | | (28,620,226) | | | | 1,144,469,485 | | | | 967,495,208 | | | | 1,113,400,746 | |
| | | | | | | | | | | | | | | | | | | | | | | | | | | | | | | | | | | | | | | | | | | | | | | | |
Net income attributable to: | | | 705,070,416 | | | | 587,483,669 | | | | 574,892,897 | | | | 474,077,194 | | | | 352,593,369 | | | | 567,128,075 | | | | (34,678,125) | | | | 27,418,170 | | | | (28,620,226) | | | | 1,144,469,485 | | | | 967,495,208 | | | | 1,113,400,746 | |
Shareholders of Enersis Américas | | | - | | | | - | | | | - | | | | - | | | | - | | | | - | | | | - | | | | - | | | | - | | | | 661,586,917 | | | | 571,873,342 | | | | 658,514,150 | |
Non-controlling interests | | | - | | | | - | | | | - | | | | - | | | | - | | | | - | | | | - | | | | - | | | | - | | | | 482,882,568 | | | | 395,621,866 | | | | 454,886,596 | |
| | | | | | | | | | | | | | | | | | | | | | | | | | | | | | | | | | | | | | | | | | | | | | | | |
| Line of Business | | Generation and transmission | | | Distribution | | | Eliminations and others | | | Total (*) | |
| STATEMENT OF CASH FLOW | | 12-31-2015 ThCh$ | | | 12-31-2014 ThCh$ | | | 12-31-2013 ThCh$ | | | 12-31-2015 ThCh$ | | | 12-31-2014 ThCh$ | | | 12-31-2013 ThCh$ | | | 12-31-2015 ThCh$ | | | 12-31-2014 ThCh$ | | | 12-31-2013 ThCh$ | | | 12-31-2015 ThCh$ | | | 12-31-2014 ThCh$ | | | 12-31-2013 ThCh$ | |
| | | | | | | | | | | | | | | | | | | | | | | | | | | | | | | | | | | | | | | | | | | | | | | | |
Cash flow from (used in) operating activities | | | 1,098,739,134 | | | | 1,026,718,651 | | | | 874,169,034 | | | | 945,599,327 | | | | 769,341,885 | | | | 855,536,268 | | | | (120,887,859) | | | | (98,022,542) | | | | (28,729,658) | | | | 1,923,450,602 | | | | 1,698,037,994 | | | | 1,700,975,644 | |
Cash flow from (used in) investment activities | | | (545,677,324) | | | | (357,107,188) | | | | (194,635,422) | | | | (787,409,305) | | | | (513,969,018) | | | | (488,352,158) | | | | 117,787,581 | | | | 571,389,216 | | | | (540,899,509) | | | | (1,215,299,048) | | | | (299,686,990) | | | | (1,223,887,089) | |
Cash flows from (used in) financing activities | | | (797,630,653) | | | | (575,096,742) | | | | (628,577,198) | | | | (225,244,202) | | | | (220,294,230) | | | | (327,075,688) | | | | (37,339,524) | | | | (488,068,691) | | | | 1,292,418,242 | | | | (1,060,214,379) | | | | (1,283,459,663) | | | | 336,765,356 | |
(*) See Note 5.1.II.iv for cash flows related to discontinued operations.
The eliminations column corresponds to transactions between companies in different lines of business and country, primarily purchases and sales of energy and services.
| | |
| The accompanying notes are an integral part of these consolidated financial statements | | |
|
| F-134 |
35.3 Segment information by country.
| | | | | | | | | | | | | | | | | | | | | | | | | | | | | | | | | | | | | | | | | | | | | | | | | | | | | | | | |
| Country | | Chile | | | Argentina | | | Brazil | | | Colombia | | | Peru | | | Eliminations | | | Total | |
| ASSETS | | 12-31-2015 ThCh$ | | | 12-31-2014 ThCh$ | | | 12-31-2015 ThCh$ | | | 12-31-2014 ThCh$ | | | 12-31-2015 ThCh$ | | | 12-31-2014 ThCh$ | | | 12-31-2015
ThCh$ | | | 12-31-2014
ThCh$ | | | 12-31-2015 ThCh$ | | | 12-31-2014 ThCh$ | | | 12-31-2015 ThCh$ | | | 12-31-2014 ThCh$ | | | 12-31-2015 ThCh$ | | | 12-31-2014 ThCh$ | |
CURRENT ASSETS | | | 7,206,153,017 | | | | 1,878,994,993 | | | | 335,086,963 | | | | 520,217,733 | | | | 790,909,682 | | | | 848,758,549 | | | | 372,444,839 | | | | 574,295,812 | | | | 246,261,307 | | | | 287,163,111 | | | | (1,037,294,098 | ) | | | (177,931,310 | ) | | | 7,913,561,710 | | | | 3,931,498,888 | |
Cash and cash equivalents | | | 842,075,831 | | | | 989,320,583 | | | | 46,181,049 | | | | 25,917,276 | | | | 91,204,686 | | | | 197,723,645 | | | | 156,927,518 | | | | 357,750,546 | | | | 48,774,260 | | | | 134,033,441 | | | | - | | | | - | | | | 1,185,163,344 | | | | 1,704,745,491 | |
Other current financial assets | | | 16,360,472 | | | | 8,518,962 | | | | 694,177 | | | | - | | | | 48,170,095 | | | | 52,870,583 | | | | 3,037,702 | | | | 38,065,858 | | | | - | | | | - | | | | - | | | | - | | | | 68,262,446 | | | | 99,455,403 | |
Other current non-financial assets | | | 41,022 | | | | 16,052,871 | | | | 2,763,894 | | | | 4,151,319 | | | | 80,268,243 | | | | 115,566,129 | | | | 9,724,564 | | | | 12,267,413 | | | | 9,191,334 | | | | 27,060,380 | | | | - | | | | - | | | | 101,989,057 | | | | 175,098,112 | |
Trade and other current receivables | | | 729,821 | | | | 578,408,890 | | | | 216,550,824 | | | | 416,026,626 | | | | 536,725,492 | | | | 446,392,339 | | | | 179,304,792 | | | | 147,531,981 | | | | 154,034,146 | | | | 93,735,123 | | | | 786,492 | | | | (408,056 | ) | | | 1,088,131,567 | | | | 1,681,686,903 | |
Current accounts receivable from related companies | | | 72,105,375 | | | | 134,750,382 | | | | 24,224,813 | | | | 28,097,713 | | | | 19,580,577 | | | | 22,359,268 | | | | 2,063,025 | | | | 748,922 | | | | 1,292,410 | | | | 3,256 | | | | (115,699,270 | ) | | | (167,518,201 | ) | | | 3,566,930 | | | | 18,441,340 | |
Inventories | | | - | | | | 43,677,878 | | | | 40,147,347 | | | | 41,937,394 | | | | 900,446 | | | | 934,466 | | | | 21,381,902 | | | | 16,506,890 | | | | 32,628,202 | | | | 30,463,526 | | | | - | | | | - | | | | 95,057,897 | | | | 133,520,154 | |
Current tax assets | | | 28,523,295 | | | | 90,281,411 | | | | 4,524,859 | | | | 4,087,405 | | | | 14,060,143 | | | | 12,912,119 | | | | 5,336 | | | | 1,424,202 | | | | 340,955 | | | | 1,867,385 | | | | - | | | | - | | | | 47,454,588 | | | | 110,572,522 | |
| | | | | | | | | | | | | | | | | | | | | | | | | | | | | | | | | | | | | | | | | | | |
Non-current assets or disposal groups held-for-sale or held for distribution to owners | | | 6,246,317,201 | | | | 17,984,016 | | | | - | | | | - | | | | - | | | | - | | | | - | | | | - | | | | - | | | | - | | | | (922,381,320 | ) | | | (10,005,053 | ) | | | 5,323,935,881 | | | | 7,978,963 | |
| | | | | | | | | | | | | | | | | | | | | | | | | | | | | | | | | | | | | | | | | | | |
NON-CURRENT ASSETS | | | 4,419,757,344 | | | | 9,730,558,674 | | | | 989,117,985 | | | | 822,281,224 | | | | 2,026,630,282 | | | | 2,333,408,466 | | | | 2,655,603,106 | | | | 2,716,160,481 | | | | 1,626,705,797 | | | | 1,550,114,522 | | | | (4,182,221,833 | ) | | | (5,162,699,939 | ) | | | 7,535,592,681 | | | | 11,989,823,428 | |
Other non-current financial assets | | | - | | | | 33,090,868 | | | | 21,751 | | | | 72,882 | | | | 488,876,852 | | | | 496,463,986 | | | | 616,296 | | | | 1,177,618 | | | | 13,305 | | | | 16,166 | | | | - | | | | - | | | | 489,528,204 | | | | 530,821,520 | |
Other non-current non-financial assets | | | 9,809,121 | | | | 236,772 | | | | 3,927,495 | | | | 4,232,688 | | | | 60,707,204 | | | | 69,746,584 | | | | 3,380,076 | | | | 3,644,175 | | | | - | | | | - | | | | (261,188 | ) | | | (54,039 | ) | | | 77,562,708 | | | | 77,806,180 | |
Trade and other non-current receivables | | | - | | | | 7,496,412 | | | | 307,327,055 | | | | 175,753,071 | | | | 81,551,731 | | | | 97,082,421 | | | | 9,817,078 | | | | 11,309,771 | | | | - | | | | - | | | | - | | | | - | | | | 398,695,864 | | | | 291,641,675 | |
Non-current accounts receivable from related companies | | | - | | | | - | | | | 355,485 | | | | 486,605 | | | | 34,884,531 | | | | 36,267,177 | | | | - | | | | - | | | | - | | | | - | | | | (34,884,531 | ) | | | (36,267,177 | ) | | | 355,485 | | | | 486,605 | |
Investments accounted for using the equity method | | | 4,392,452,234 | | | | 6,324,305,426 | | | | 33,278,110 | | | | 42,815,909 | | | | - | | | | - | | | | 29,497,710 | | | | 32,798,603 | | | | 78,272,852 | | | | 95,911,225 | | | | (4,502,540,461 | ) | | | (6,422,197,553 | ) | | | 30,960,445 | | | | 73,633,610 | |
Intangible assets other than goodwill | | | - | | | | 36,525,521 | | | | 1,901,334 | | | | 2,533,936 | | | | 910,420,453 | | | | 1,062,638,430 | | | | 36,607,957 | | | | 40,612,537 | | | | 32,469,528 | | | | 25,901,632 | | | | - | | | | - | | | | 981,399,272 | | | | 1,168,212,056 | |
Goodwill | | | - | | | | 2,240,478 | | | | 1,070,609 | | | | 1,401,472 | | | | 76,703,162 | | | | 97,979,622 | | | | 4,285,457 | | | | 4,886,064 | | | | 6,675,472 | | | | 8,527,161 | | | | 355,464,347 | | | | 1,295,818,830 | | | | 444,199,047 | | | | 1,410,853,627 | |
Property, plant and equipment | | | - | | | | 3,283,760,775 | | | | 640,616,088 | | | | 591,453,902 | | | | 307,829,742 | | | | 389,577,389 | | | | 2,545,846,163 | | | | 2,549,665,315 | | | | 1,509,274,640 | | | | 1,419,758,338 | | | | - | | | | - | | | | 5,003,566,633 | | | | 8,234,215,719 | |
Investment property | | | - | | | | 8,514,562 | | | | - | | | | - | | | | - | | | | - | | | | - | | | | - | | | | - | | | | - | | | | - | | | | - | | | | - | | | | 8,514,562 | |
Deferred tax assets | | | 17,495,989 | | | | 34,387,860 | | | | 620,058 | | | | 3,530,759 | | | | 65,656,607 | | | | 83,652,857 | | | | 25,552,369 | | | | 72,066,398 | | | | - | | | | - | | | | - | | | | - | | | | 109,325,023 | | | | 193,637,874 | |
| | | | | | | | | | | | | | | | | | | | | | | | | | | | | | | | | | | | | | | | | | | |
TOTAL ASSETS | | | 11,625,910,361 | | | | 11,609,553,667 | | | | 1,324,204,948 | | | | 1,342,498,957 | | | | 2,817,539,964 | | | | 3,182,167,015 | | | | 3,028,047,945 | | | | 3,290,456,293 | | | | 1,872,967,104 | | | | 1,837,277,633 | | | | (5,219,515,931 | ) | | | (5,340,631,249 | ) | | | 15,449,154,391 | | | | 15,921,322,316 | |
| | | | | | | | | | | | | | | | | | | | | | | | | | | | | | | | | | | | | | | | | | | |
| | | | Chile | | | | Argentina | | | | Brazil | | | | Colombia | | | | Peru | | | | Eliminations | | | | Total | |
| LIABILITIES AND EQUITY | | 12-31-2015 ThCh$ | | | 12-31-2014 ThCh$ | | | 12-31-2015
ThCh$ | | | 12-31-2014 ThCh$ | | | 12-31-2015
ThCh$ | | | 12-31-2014 ThCh$ | | | 12-31-2015
ThCh$ | | | 12-31-2014
ThCh$ | | | 12-31-2015 ThCh$ | | | 12-31-2014 ThCh$ | | | 12-31-2015 ThCh$ | | | 12-31-2014 ThCh$ | | | 12-31-2015 ThCh$ | | | 12-31-2014 ThCh$ | |
CURRENT LIABILITIES | | | 2,214,708,056 | | | | 744,843,606 | | | | 650,930,971 | | | | 919,270,662 | | | | 649,275,989 | | | | 479,284,646 | | | | 589,400,597 | | | | 828,561,609 | | | | 313,823,925 | | | | 269,583,701 | | | | 87,241,262 | | | | (46,722,240 | ) | | | 4,505,380,800 | | | | 3,194,821,984 | |
Other current financial liabilities | | | 251,988,261 | | | | 150,748,390 | | | | 30,883,517 | | | | 36,046,855 | | | | 136,422,798 | | | | 78,874,557 | | | | 170,601,821 | | | | 92,779,423 | | | | 97,977,111 | | | | 63,356,454 | | | | - | | | | - | | | | 687,873,508 | | | | 421,805,679 | |
Trade and other current payables | | | 30,630,264 | | | | 490,927,954 | | | | 524,765,510 | | | | 775,438,014 | | | | 438,614,827 | | | | 340,379,343 | | | | 258,880,100 | | | | 428,369,239 | | | | 149,516,849 | | | | 167,957,943 | | | | 50,416,657 | | | | 85,804,457 | | | | 1,452,824,207 | | | | 2,288,876,950 | |
Current accounts payable to related companies | | | 37,738,690 | | | | 10,417,853 | | | | 23,671,742 | | | | 28,081,812 | | | | 50,826,174 | | | | 30,274,223 | | | | 30,878,126 | | | | 198,528,161 | | | | 8,587,452 | | | | 8,905,270 | | | | (41,804,676 | ) | | | (132,526,697 | ) | | | 109,897,508 | | | | 143,680,622 | |
Other current provisions | | | 3,595 | | | | 11,627,110 | | | | 30,169,043 | | | | 33,345,118 | | | | 2,144,014 | | | | 3,335,096 | | | | 77,759,932 | | | | 31,449,522 | | | | 17,222,592 | | | | 10,465,838 | | | | - | | | | - | | | | 127,299,176 | | | | 90,222,684 | |
Current tax liabilities | | | 27,324,425 | | | | 38,357,866 | | | | 41,441,159 | | | | 6,836,964 | | | | 19,959,622 | | | | 2,213,038 | | | | 49,992,270 | | | | 64,747,073 | | | | 3,890,484 | | | | 3,317,372 | | | | - | | | | - | | | | 142,607,960 | | | | 115,472,313 | |
Current provisions for employee benefits | | | - | | | | - | | | | - | | | | - | | | | - | | | | - | | | | - | | | | - | | | | - | | | | - | | | | - | | | | - | | | | - | | | | - | |
Other non-current non-financial liabilities | | | - | | | | 37,276,286 | | | | - | | | | 39,521,899 | | | | 1,308,554 | | | | 24,208,389 | | | | 1,288,348 | | | | 12,688,191 | | | | 36,629,437 | | | | 15,580,824 | | | | - | | | | - | | | | 39,226,339 | | | | 129,275,589 | |
Liabilities associated with groups of assets or disposal groups held for sale or distribution to owners | | | 1,867,022,821 | | | | 5,488,147 | | | | - | | | | - | | | | - | | | | - | | | | - | | | | - | | | | - | | | | - | | | | 78,629,281 | | | | - | | | | 1,945,652,102 | | | | 5,488,147 | |
| | | | | | | | | | | | | | | | | | | | | | | | | | | | | | | | | | | | | | | | | | | | | | | | | | | | | | | | |
NON-CURRENT LIABITIES | | | 25,261,654 | | | | 1,410,672,019 | | | | 393,937,987 | | | | 291,965,068 | | | | 725,609,705 | | | | 959,581,284 | | | | 1,113,128,603 | | | | 1,241,915,054 | | | | 555,256,672 | | | | 601,204,740 | | | | (59,229,410 | ) | | | (58,056,579 | ) | | | 2,753,965,211 | | | | 4,447,281,586 | |
| | | | | | | | | | | | | | | | | | | | | | | | | | | | | | | | | | | | | | | | | | | |
Other non-current financial liabilities | | | 22,163,958 | | | | 1,042,430,478 | | | | 38,637,260 | | | | 44,052,205 | | | | 424,551,031 | | | | 627,845,559 | | | | 1,012,352,174 | | | | 1,162,494,911 | | | | 349,592,169 | | | | 412,274,375 | | | | - | | | | - | | | | 1,847,296,592 | | | | 3,289,097,528 | |
Trade and other non-current payables | | | - | | | | 3,711,078 | | | | 249,256,884 | | | | 120,587,518 | | | | 25,765,233 | | | | 35,086,925 | | | | - | | | | - | | | | 8,522,137 | | | | - | | | | - | | | | - | | | | 283,544,254 | | | | 159,385,521 | |
Non-current account payables to related companies | | | - | | | | - | | | | 35,630,861 | | | | 36,594,486 | | | | 23,598,549 | | | | - | | | | - | | | | - | | | | - | | | | - | | | | (59,229,410 | ) | | | (36,594,486 | ) | | | - | | | | - | |
Other long-current provisions | | | - | | | | 27,969,934 | | | | 10,544,604 | | | | 8,468,074 | | | | 132,216,036 | | | | 152,802,156 | | | | 36,538,802 | | | | 4,100,860 | | | | 4,548,842 | | | | 3,902,817 | | | | - | | | | - | | | | 183,848,284 | | | | 197,243,841 | |
Deferred tax liabilities | | | - | | | | 255,156,048 | | | | 46,358,947 | | | | 31,236,466 | | | | 15,701,628 | | | | 18,454,634 | | | | - | | | | - | | | | 169,844,040 | | | | 173,514,336 | | | | - | | | | - | | | | 231,904,615 | | | | 478,361,484 | |
Non-current provisions for employee benefits | | | 3,097,696 | | | | 56,333,817 | | | | 13,509,431 | | | | 12,825,808 | | | | 103,777,228 | | | | 122,729,879 | | | | 64,237,627 | | | | 75,319,283 | | | | 2,648,492 | | | | 2,721,625 | | | | - | | | | - | | | | 187,270,474 | | | | 269,930,412 | |
Other non-current non-financial liabilities | | | - | | | | 25,070,664 | | | | - | | | | 38,200,511 | | | | - | | | | 2,662,131 | | | | - | | | | - | | | | 20,100,992 | | | | 8,791,587 | | | | - | | | | (21,462,093 | ) | | | 20,100,992 | | | | 53,262,800 | |
| | | | | | | | | | | | | | | | | | | | | | | | | | | | | | | | | | | | | | | | | | | |
EQUITY | | | 9,385,940,651 | | | | 9,454,038,042 | | | | 279,335,990 | | | | 131,263,227 | | | | 1,442,654,270 | | | | 1,743,301,085 | | | | 1,325,518,745 | | | | 1,219,979,630 | | | | 1,003,886,507 | | | | 966,489,192 | | | | (5,247,527,783 | ) | | | (5,235,852,430 | ) | | | 8,189,808,380 | | | | 8,279,218,746 | |
Equity attributable to shareholders of Enersis Américas | | | 9,385,940,651 | | | | 9,454,038,042 | | | | 279,335,990 | | | | 131,263,227 | | | | 1,442,654,270 | | | | 1,743,301,085 | | | | 1,325,518,745 | | | | 1,219,979,630 | | | | 1,003,886,507 | | | | 966,489,192 | | | | (5,247,527,783 | ) | | | (5,235,852,430 | ) | | | 6,026,149,285 | | | | 6,201,976,047 | |
Issued capital | | | 8,275,947,660 | | | | 8,284,164,467 | | | | 157,658,399 | | | | 206,381,462 | | | | 216,661,867 | | | | 216,324,676 | | | | 149,451,431 | | | | 170,397,032 | | | | 484,427,384 | | | | 298,376,352 | | | | (3,479,698,755 | ) | | | (3,371,196,003 | ) | | | 5,804,447,986 | | | | 5,804,447,986 | |
Retained earnings | | | 3,903,767,587 | | | | 3,545,928,591 | | | | 24,530,244 | | | | (151,386,397 | ) | | | 144,278,288 | | | | 206,870,339 | | | | 322,708,452 | | | | 145,279,263 | | | | 66,656,282 | | | | 278,207,618 | | | | (1,081,279,330 | ) | | | (973,164,969 | ) | | | 3,380,661,523 | | | | 3,051,734,445 | |
Share premium | | | 206,574,859 | | | | 206,574,859 | | | | - | | | | - | | | | 535,555,881 | | | | 684,112,119 | | | | 2,981,182 | | | | 3,398,995 | | | | 49,641 | | | | 590,505 | | | | (745,161,563 | ) | | | (894,676,478 | ) | | | - | | | | - | |
Other reserves | | | (3,000,349,455 | ) | | | (2,582,629,875 | ) | | | 97,147,347 | | | | 76,268,162 | | | | 546,158,234 | | | | 635,993,951 | | | | 850,377,680 | | | | 900,904,340 | | | | 452,753,200 | | | | 389,314,717 | | | | 58,611,865 | | | | 3,185,020 | | | | (3,158,960,224 | ) | | | (2,654,206,384 | ) |
| | | | | | | | | | | | | | | | | | | | | | | | | | | | | | | | | | | | | | | | | | | |
Non-controlling interests | | | - | | | | - | | | | - | | | | - | | | | - | | | | - | | | | - | | | | - | | | | - | | | | - | | | | - | | | | - | | | | 2,163,659,095 | | | | 2,077,242,699 | |
| | | | | | | | | | | | | | | | | | | | | | | | | | | | | | | | | | | | | | | | | | | |
Total Liabilities and Equity | | | 11,625,910,361 | | | | 11,609,553,667 | | | | 1,324,204,948 | | | | 1,342,498,957 | | | | 2,817,539,964 | | | | 3,182,167,015 | | | | 3,028,047,945 | | | | 3,290,456,293 | | | | 1,872,967,104 | | | | 1,837,277,633 | | | | (5,219,515,931 | ) | | | (5,340,631,249 | ) | | | 15,449,154,391 | | | | 15,921,322,316 | |
The eliminations column corresponds to transactions between companies in different lines of business and country, primarily purchases and sales of energy and services.
| | |
| The accompanying notes are an integral part of these consolidated financial statements | | |
|
| F-135 |
| | | | | | | | | | | | | | | | | | | | | | | | | | | | | | | | | | | | | | | | | | | | | | | | | | | | | | | | | | | | | | | | | | | | | | | | | | | | | | | | | | | | |
| Country | | Chile | | | Argentina | | | Brazil | | | Colombia | | | Peru | | | Eliminations | | | Total | |
STATEMENT OF COMPREHENSIVE INCOME | | 12-31-2015
ThCh$ | | | 12-31-2014
ThCh$ | | | 12-31-2013
ThCh$ | | | 12-31-2015
ThCh$ | | | 12-31-2014
ThCh$ | | | 12-31-2013
ThCh$ | | | 12-31-2015
ThCh$ | | | 12-31-2014
ThCh$ | | | 12-31-2013
ThCh$ | | | 12-31-2015
ThCh$ | | | 12-31-2014
ThCh$ | | | 12-31-2013
ThCh$ | | | 12-31-2015
ThCh$ | | | 12-31-2014
ThCh$ | | | 12-31-2013
ThCh$ | | | 12-31-2015
ThCh$ | | | 12-31-2014
ThCh$ | | | 12-31-2013
ThCh$ | | | 12-31-2015
ThCh$ | | | 12-31-2014
ThCh$ | | | 12-31-2013
ThCh$ | |
| REVENUE | | | 4,346,811 | | | | 5,160,988 | | | | 2,900,505 | | | | 817,366,617 | | | | 538,871,174 | | | | 702,356,329 | | | | 2,013,355,544 | | | | 2,266,459,965 | | | | 1,867,480,092 | | | | 1,568,088,010 | | | | 1,601,692,843 | | | | 1,312,563,123 | | | | 902,656,878 | | | | 796,341,810 | | | | 643,503,677 | | | | (4,374,282) | | | | (2,156,992) | | | | (655,857) | | | | 5,301,439,578 | | | | 5,206,369,788 | | | | 4,528,147,869 | |
Revenue | | | 4,342,565 | | | | 5,160,988 | | | | 2,900,505 | | | | 435,789,546 | | | | 346,911,584 | | | | 406,515,531 | | | | 1,782,667,222 | | | | 2,081,466,805 | | | | 1,695,610,134 | | | | 1,551,589,289 | | | | 1,590,209,560 | | | | 1,270,600,838 | | | | 897,613,346 | | | | 784,863,792 | | | | 604,015,741 | | | | (4,356,658) | | | | (2,156,992) | | | | (647,397) | | | | 4,667,645,310 | | | | 4,806,455,737 | | | | 3,978,995,352 | |
Energy sales | | | - | | | | - | | | | - | | | | 379,092,257 | | | | 280,176,215 | | | | 361,705,469 | | | | 1,626,946,066 | | | | 1,923,078,033 | | | | 1,553,473,683 | | | | 1,415,825,122 | | | | 1,445,643,276 | | | | 1,176,055,779 | | | | 802,518,254 | | | | 701,058,885 | | | | 560,310,262 | | | | - | | | | (122,447) | | | | (201,948) | | | | 4,224,381,699 | | | | 4,349,833,962 | | | | 3,651,343,245 | |
Other sales | | | - | | | | - | | | | - | | | | 460,133 | | | | 523,507 | | | | 361,681 | | | | 16,073,260 | | | | 16,820,481 | | | | 6,569,786 | | | | 7,508,473 | | | | 492,002 | | | | 3,280,645 | | | | 16,606,185 | | | | 16,384,949 | | | | 8,823,805 | | | | - | | | | - | | | | - | | | | 40,648,051 | | | | 34,220,939 | | | | 19,035,917 | |
Other services rendered | | | 4,342,565 | | | | 5,160,988 | | | | 2,900,505 | | | | 56,237,156 | | | | 66,211,862 | | | | 44,448,381 | | | | 139,647,896 | | | | 141,568,291 | | | | 135,566,665 | | | | 128,255,694 | | | | 144,074,282 | | | | 91,264,414 | | | | 78,488,907 | | | | 67,419,958 | | | | 34,881,674 | | | | (4,356,658) | | | | (2,034,545) | | | | (445,449) | | | | 402,615,560 | | | | 422,400,836 | | | | 308,616,190 | |
Other operating income | | | 4,246 | | | | - | | | | - | | | | 381,577,071 | | | | 191,959,590 | | | | 295,840,798 | | | | 230,688,322 | | | | 184,993,160 | | | | 171,869,958 | | | | 16,498,721 | | | | 11,483,283 | | | | 41,962,285 | | | | 5,043,532 | | | | 11,478,018 | | | | 39,487,936 | | | | (17,624) | | | | - | | | | (8,460) | | | | 633,794,268 | | | | 399,914,051 | | | | 549,152,517 | |
| | | | | | | | | | | | | | | | | | | | | | | | | | | | | | | | | | | | | | | | | | | | | | | | | | | | | | | | | | | | | | | | | | | | | | | | | | | | | | | | | | | | | |
| RAW MATERIALS AND CONSUMABLES USED | | | - | | | | - | | | | - | | | | (207,711,417) | | | | (209,270,232) | | | | (225,811,105) | | | | (1,385,921,253) | | | | (1,405,383,543) | | | | (1,082,324,727) | | | | (727,204,325) | | | | (634,092,249) | | | | (489,477,523) | | | | (456,364,517) | | | | (382,923,412) | | | | (292,653,947) | | | | - | | | | - | | | | - | | | | (2,777,201,512) | | | | (2,631,669,436) | | | | (2,090,267,302) | |
Energy purchases | | | - | | | | - | | | | - | | | | (157,071,520) | | | | (165,988,305) | | | | (186,778,094) | | | | (992,325,912) | | | | (1,041,607,105) | | | | (616,825,105) | | | | (467,945,400) | | | | (389,379,482) | | | | (282,064,565) | | | | (271,677,147) | | | | (230,083,919) | | | | (170,440,992) | | | | 3,103,553 | | | | 3,056,025 | | | | 3,962,147 | | | | (1,885,916,426) | | | | (1,824,002,786) | | | | (1,252,146,609) | |
Fuel consumption | | | - | | | | - | | | | - | | | | (39,487,378) | | | | (31,350,429) | | | | (25,889,830) | | | | (61,626,347) | | | | (58,409,123) | | | | (51,277,737) | | | | (62,987,536) | | | | (33,015,871) | | | | (34,870,502) | | | | (94,012,661) | | | | (82,758,971) | | | | (62,465,952) | | | | - | | | | - | | | | - | | | | (258,113,922) | | | | (205,534,394) | | | | (174,504,021) | |
Transportation expense | | | - | | | | - | | | | - | | | | (1,603,737) | | | | (2,887,611) | | | | (3,021,027) | | | | (74,851,323) | | | | (93,644,111) | | | | (72,787,402) | | | | (122,810,084) | | | | (130,555,197) | | | | (114,719,080) | | | | (43,444,677) | | | | (35,042,438) | | | | (22,369,037) | | | | (3,103,553) | | | | (3,056,025) | | | | (3,962,147) | | | | (245,813,374) | | | | (265,185,382) | | | | (216,858,693) | |
Other miscellaneous supplies and services | | | - | | | | - | | | | - | | | | (9,548,782) | | | | (9,043,887) | | | | (10,122,154) | | | | (257,117,671) | | | | (211,723,204) | | | | (341,434,483) | | | | (73,461,305) | | | | (81,141,699) | | | | (57,823,376) | | | | (47,230,032) | | | | (35,038,084) | | | | (37,377,966) | | | | - | | | | - | | | | - | | | | (387,357,790) | | | | (336,946,874) | | | | (446,757,979) | |
| | | | | | | | | | | | | | | | | | | | | | | | | | | | | | | | | | | | | | | | | | | | | | | | | | | | | | | | | | | | | | | | | | | | | | | | | | | | | | | | | | | | |
| CONTRIBUTION MARGIN | | | 4,346,811 | | | | 5,160,988 | | | | 2,900,505 | | | | 609,655,200 | | | | 329,600,942 | | | | 476,545,224 | | | | 627,434,291 | | | | 861,076,422 | | | | 785,155,365 | | | | 840,883,685 | | | | 967,600,594 | | | | 823,085,600 | | | | 446,292,361 | | | | 413,418,398 | | | | 350,849,730 | | | | (4,374,282) | | | | (2,156,992) | | | | (655,857) | | | | 2,524,238,066 | | | | 2,574,700,352 | | | | 2,437,880,567 | |
| | | | | | | | | | | | | | | | | | | | | | | | | | | | | | | | | | | | | | | | | | | | | | | | | | | | | | | | | | | | | | | | | | | | | | | | | | | | | | | | | | | | |
Other works performed by the entity and capitalized | | | - | | | | - | | | | - | | | | 38,651,134 | | | | 27,871,088 | | | | 21,102,202 | | | | 10,165,042 | | | | 12,046,728 | | | | 13,877,942 | | | | 9,792,909 | | | | 10,209,703 | | | | 8,810,875 | | | | 4,859,848 | | | | 3,969,512 | | | | 3,343,451 | | | | 3,632,336 | | | | 1,673,387 | | | | - | | | | 67,101,269 | | | | 55,770,418 | | | | 47,134,470 | |
Employee benefits expense | | | (6,198,154) | | | | (4,663,987) | | | | (3,678,384) | | | | (282,962,098) | | | | (182,617,639) | | | | (154,686,547) | | | | (99,652,482) | | | | (107,989,443) | | | | (100,646,528) | | | | (57,583,893) | | | | (55,772,427) | | | | (51,593,413) | | | | (41,301,520) | | | | (38,624,977) | | | | (34,963,324) | | | | - | | | | - | | | | - | | | | (487,698,147) | | | | (389,668,473) | | | | (345,568,196) | |
Other expenses | | | (8,580,775) | | | | (904,591) | | | | (1,203,116) | | | | (160,072,998) | | | | (150,390,844) | | | | (138,909,307) | | | | (176,649,576) | | | | (169,097,432) | | | | (147,251,809) | | | | (85,846,339) | | | | (91,510,241) | | | | (75,777,792) | | | | (58,121,007) | | | | (52,309,761) | | | | (43,261,744) | | | | 741,946 | | | | 483,605 | | | | 655,857 | | | | (488,528,749) | | | | (463,729,264) | | | | (405,747,911) | |
| | | | | | | | | | | | | | | | | | | | | | | | | | | | | | | | | | | | | | | | | | | | | | | | | | | | | | | | | | | | | | | | | | | | | | | | | | | | | | | | | | | | |
| GROSS OPERATING RESULTS | | | (10,432,118) | | | | (407,590) | | | | (1,980,995) | | | | 205,271,238 | | | | 24,463,547 | | | | 204,051,572 | | | | 361,297,275 | | | | 596,036,275 | | | | 551,134,970 | | | | 707,246,362 | | | | 830,527,629 | | | | 704,525,270 | | | | 351,729,682 | | | | 326,453,172 | | | | 275,968,113 | | | | - | | | | - | | | | - | | | | 1,615,112,439 | | | | 1,777,073,033 | | | | 1,733,698,930 | |
| | | | | | | | | | | | | | | | | | | | | | | | | | | | | | | | | | | | | | | | | | | | | | | | | | | | | | | | | | | | | | | | | | | | | | | | | | | | | | | | | | | | |
Depreciation and amortization expense | | | - | | | | - | | | | - | | | | (48,164,380) | | | | (34,457,311) | | | | (39,649,323) | | | | (93,577,654) | | | | (126,219,710) | | | | (111,980,732) | | | | (98,604,705) | | | | (115,830,740) | | | | (99,481,692) | | | | (80,195,458) | | | | (74,234,989) | | | | (64,854,394) | | | | - | | | | - | | | | - | | | | (320,542,197) | | | | (350,742,750) | | | | (315,966,141) | |
Impairment losses (reversal of impairment losses) recognized in profit or loss | | | - | | | | - | | | | - | | | | (2,289,187) | | | | (2,641,255) | | | | (7,740,546) | | | | (31,029,774) | | | | (29,563,651) | | | | (51,248,898) | | | | (189,779) | | | | (3,189,097) | | | | (160,633) | | | | (6,303,016) | | | | (2,935,939) | | | | (7,514,899) | | | | - | | | | - | | | | - | | | | (39,811,756) | | | | (38,329,942) | | | | (66,664,976) | |
| | | | | | | | | | | | | | | | | | | | | | | | | | | | | | | | | | | | | | | | | | | | | | | | | | | | | | | | | | | | | | | | | | | | | | | | | | | | | | | | | | | | |
| OPERATING INCOME | | | (10,432,118) | | | | (407,590) | | | | (1,980,995) | | | | 154,817,671 | | | | (12,635,019) | | | | 156,661,703 | | | | 236,689,847 | | | | 440,252,914 | | | | 387,905,340 | | | | 608,451,878 | | | | 711,507,792 | | | | 604,882,945 | | | | 265,231,208 | | | | 249,282,244 | | | | 203,598,820 | | | | - | | | | - | | | | - | | | | 1,254,758,486 | | | | 1,388,000,341 | | | | 1,351,067,813 | |
| | | | | | | | | | | | | | | | | | | | | | | | | | | | | | | | | | | | | | | | | | | | | | | | | | | | | | | | | | | | | | | | | | | | | | | | | | | | | | | | | | | | |
| FINANCIAL RESULTS | | | (1,613,675) | | | | 2,287,603 | | | | 6,103,492 | | | | 130,614,694 | | | | (39,636,349) | | | | (94,354,565) | | | | 708,538 | | | | (127,456,000) | | | | 34,677,521 | | | | (67,348,700) | | | | (61,236,977) | | | | (50,091,563) | | | | (34,073,918) | | | | (23,920,963) | | | | (26,555,488) | | | | - | | | | 36,646,457 | | | | 11,321,528 | | | | 28,286,939 | | | | (213,316,229) | | | | (118,899,075) | |
Financial income | | | 23,085,427 | | | | 37,359,473 | | | | 43,272,796 | | | | 141,071,582 | | | | 112,698,022 | | | | 37,262,480 | | | | 118,746,948 | | | | 88,275,167 | | | | 146,393,325 | | | | 10,037,527 | | | | 18,603,031 | | | | 18,522,711 | | | | 4,305,859 | | | | 3,921,832 | | | | 3,522,291 | | | | (2,477,071) | | | | (9,735,763) | | | | (2,357,789) | | | | 294,770,272 | | | | 251,121,762 | | | | 246,615,814 | |
Cash and cash equivalents | | | 23,058,503 | | | | 27,551,155 | | | | 42,998,291 | | | | 76,904,478 | | | | 4,063,184 | | | | 4,491,672 | | | | 15,980,631 | | | | 39,601,245 | | | | 37,422,561 | | | | 6,394,711 | | | | 13,228,981 | | | | 11,698,193 | | | | 1,976,131 | | | | 2,132,408 | | | | 1,670,958 | | | | - | | | | - | | | | - | | | | 124,314,454 | | | | 86,576,973 | | | | 98,281,675 | |
Other Financial income | | | 26,924 | | | | 9,808,318 | | | | 274,505 | | | | 64,167,104 | | | | 108,634,838 | | | | 32,770,808 | | | | 102,766,317 | | | | 48,673,922 | | | | 108,970,764 | | | | 3,642,816 | | | | 5,374,050 | | | | 6,824,518 | | | | 2,329,728 | | | | 1,789,424 | | | | 1,851,333 | | | | (2,477,071) | | | | (9,735,763) | | | | (2,357,789) | | | | 170,455,818 | | | | 164,544,789 | | | | 148,334,139 | |
Financial costs | | | (23,676,545) | | | | (22,139,600) | | | | (39,818,432) | | | | (111,418,295) | | | | (90,124,247) | | | | (73,869,756) | | | | (142,493,697) | | | | (227,554,883) | | | | (120,173,373) | | | | (78,846,539) | | | | (78,795,617) | | | | (68,989,288) | | | | (31,497,335) | | | | (23,435,746) | | | | (25,479,239) | | | | 2,477,071 | | | | 9,735,764 | | | | 2,357,786 | | | | (385,455,340) | | | | (432,314,329) | | | | (325,972,302) | |
Bank borrowings | | | (974) | | | | - | | | | - | | | | (6,430,781) | | | | (11,090,608) | | | | (13,824,240) | | | | (17,755,433) | | | | (8,986,098) | | | | (3,970,589) | | | | (8,596,624) | | | | (6,395,703) | | | | (6,801,893) | | | | (6,137,221) | | | | (6,589,317) | | | | (5,430,614) | | | | - | | | | - | | | | - | | | | (38,921,033) | | | | (33,061,726) | | | | (30,027,336) | |
Secured and unsecured obligations | | | (14,045,548) | | | | (12,984,782) | | | | (24,441,840) | | | | | | | | - | | | | - | | | | (49,470,132) | | | | (43,100,513) | | | | (38,857,338) | | | | (98,156,546) | | | | (99,009,223) | | | | (71,666,970) | | | | (17,586,333) | | | | (17,194,239) | | | | (14,116,129) | | | | - | | | | - | | | | - | | | | (179,258,559) | | | | (172,288,757) | | | | (149,082,277) | |
Other | | | (9,630,023) | | | | (9,154,818) | | | | (15,376,592) | | | | (104,987,514) | | | | (79,033,639) | | | | (60,045,516) | | | | (75,268,132) | | | | (175,468,272) | | | | (77,345,446) | | | | 27,906,631 | | | | 26,609,309 | | | | 9,479,575 | | | | (7,773,781) | | | | 347,810 | | | | (5,932,496) | | | | 2,477,071 | | | | 9,735,764 | | | | 2,357,786 | | | | (167,275,748) | | | | (226,963,846) | | | | (146,862,689) | |
Profits (losses) from indexed assets and liabilities | | | (9,266,040) | | | | (13,630,068) | | | | (11,007,801) | | | | - | | | | - | | | | - | | | | - | | | | - | | | | | | | | - | | | | - | | | | - | | | | - | | | | - | | | | - | | | | - | | | | - | | | | - | | | | (9,266,040) | | | | (13,630,068) | | | | (11,007,801) | |
Foreign currency exchange differences | | | 8,243,483 | | | | 697,798 | | | | 13,656,929 | | | | 100,961,407 | | | | (62,210,124) | | | | (57,747,289) | | | | 24,455,287 | | | | 11,823,716 | | | | 8,457,569 | | | | 1,460,312 | | | | (1,044,391) | | | | 375,014 | | | | (6,882,442) | | | | (4,407,049) | | | | (4,598,540) | | | | - | | | | 36,646,456 | | | | 11,321,531 | | | | 128,238,047 | | | | (18,493,594) | | | | (28,534,786) | |
Positive | | | 61,064,473 | | | | 73,497,873 | | | | 61,012,638 | | | | 193,605,073 | | | | 17,360,161 | | | | 19,539,712 | | | | 51,717,523 | | | | 16,882,667 | | | | 14,637,824 | | | | 3,433,799 | | | | 1,520,289 | | | | 843,353 | | | | 3,435,721 | | | | 3,950,172 | | | | 4,238,355 | | | | (38,247,318) | | | | (11,842,150) | | | | (13,833,193) | | | | 275,009,271 | | | | 101,369,012 | | | | 86,438,689 | |
Negative | | | (52,820,990) | | | | (72,800,075) | | | | (47,355,709) | | | | (92,643,666) | | | | (79,570,285) | | | | (77,287,001) | | | | (27,262,236) | | | | (5,058,951) | | | | (6,180,255) | | | | (1,973,487) | | | | (2,564,680) | | | | (468,339) | | | | (10,318,163) | | | | (8,357,221) | | | | (8,836,895) | | | | 38,247,318 | | | | 48,488,606 | | | | 25,154,724 | | | | (146,771,224) | | | | (119,862,606) | | | | (114,973,475) | |
| | | | | | | | | | | | | | | | | | | | | | | | | | | | | | | | | | | | | | | | | | | | | | | | | | | | | | | | | | | | | | | | | | | | | | | | | | | | | | | | | | | | |
Share of profit of associates accounted for using the equity method | | | (132,598) | | | | (35,735) | | | | 4,725 | | | | 2,712,948 | | | | 34,720 | | | | 42,233 | | | | - | | | | - | | | | - | | | | 752,621 | | | | 2,561,038 | | | | 932,917 | | | | - | | | | - | | | | - | | | | - | | | | - | | | | - | | | | 3,332,971 | | | | 2,560,023 | | | | 979,875 | |
Other gains (losses) | | | - | | | | - | | | | 42,761 | | | | (315,656) | | | | 662,310 | | | | 733,526 | | | | (6,758,695) | | | | - | | | | 2,761,811 | | | | (238,818) | | | | 120,697 | | | | 381,011 | | | | 746,944 | | | | 93,547 | | | | 723,159 | | | | - | | | | - | | | | - | | | | (6,566,225) | | | | 876,554 | | | | 4,642,268 | |
Gain (loss) from other investments | | | - | | | | - | | | | 42,761 | | | | - | | | | 707,468 | | | | 725,672 | | | | - | | | | - | | | | - | | | | - | | | | - | | | | - | | | | - | | | | - | | | | - | | | | - | | | | - | | | | - | | | | - | | | | 707,468 | | | | 768,433 | |
Gain (loss) from the sale of property, plant and equipment | | | - | | | | - | | | | - | | | | (315,656) | | | | (45,158) | | | | 7,854 | | | | (6,758,695) | | | | - | | | | 2,761,811 | | | | (238,818) | | | | 120,697 | | | | 381,011 | | | | 746,944 | | | | 93,547 | | | | 723,159 | | | | - | | | | - | | | | - | | | | (6,566,225) | | | | 169,086 | | | | 3,873,835 | |
| | | | | | | | | | | | | | | | | | | | | | | | | | | | | | | | | | | | | | | | | | | | | | | | | | | | | | | | | | | | | | | | | | | | | | | | | | | | | | | | | | | | |
| Income before tax | | | (12,178,391) | | | | 1,844,278 | | | | 4,169,983 | | | | 287,829,657 | | | | (51,574,338) | | | | 63,082,897 | | | | 230,639,690 | | | | 312,796,914 | | | | 425,344,672 | | | | 541,616,981 | | | | 652,952,550 | | | | 556,105,310 | | | | 231,904,234 | | | | 225,454,828 | | | | 177,766,491 | | | | - | | | | 36,646,457 | | | | 11,321,528 | | | | 1,279,812,171 | | | | 1,178,120,689 | | | | 1,237,790,881 | |
| | | | | | | | | | | | | | | | | | | | | | | | | | | | | | | | | | | | | | | | | | | | | | | | | | | | | | | | | | | | | | | | | | | | | | | | | | | | | | | | | | | | |
| Income tax | | | (93,756,951) | | | | (56,501,196) | | | | (91,027,164) | | | | (79,403,591) | | | | (25,322,535) | | | | (19,375,904) | | | | (73,751,149) | | | | (83,386,302) | | | | (98,554,883) | | | | (205,841,587) | | | | (208,404,127) | | | | (181,812,587) | | | | (70,909,934) | | | | (52,343,302) | | | | (51,684,805) | | | | - | | | | - | | | | - | | | | (523,663,212) | | | | (425,957,462) | | | | (442,455,343) | |
| | | | | | | | | | | | | | | | | | | | | | | | | | | | | | | | | | | | | | | | | | | | | | | | | | | | | | | | | | | | | | | | | | | | | | | | | | | | | | | | | | | | |
Net income from continuing operations | | | (105,935,342) | | | | (54,656,918) | | | | (86,857,181) | | | | 208,426,066 | | | | (76,896,873) | | | | 43,706,993 | | | | 156,888,541 | | | | 229,410,612 | | | | 326,789,789 | | | | 335,775,394 | | | | 444,548,423 | | | | 374,292,723 | | | | 160,994,300 | | | | 173,111,526 | | | | 126,081,686 | | | | - | | | | 36,646,457 | | | | 11,321,528 | | | | 756,148,959 | | | | 752,163,227 | | | | 795,335,538 | |
Net income from discontinued operations | | | 388,320,526 | | | | 215,331,981 | | | | 318,065,208 | | | | - | | | | - | | | | - | | | | - | | | | - | | | | - | | | | - | | | | - | | | | - | | | | - | | | | - | | | | - | | | | - | | | | - | | | | - | | | | 388,320,526 | | | | 215,331,981 | | | | 318,065,208 | |
Net Income | | | 282,385,184 | | | | 160,675,063 | | | | 231,208,027 | | | | 208,426,066 | | | | (76,896,873) | | | | 43,706,993 | | | | 156,888,541 | | | | 229,410,612 | | | | 326,789,789 | | | | 335,775,394 | | | | 444,548,423 | | | | 374,292,723 | | | | 160,994,300 | | | | 173,111,526 | | | | 126,081,686 | | | | - | | | | 36,646,457 | | | | 11,321,528 | | | | 1,144,469,485 | | | | 967,495,208 | | | | 1,113,400,746 | |
| | | | | | | | | | | | | | | | | | | | | | | | | | | | | | | | | | | | | | | | | | | | | | | | | | | | | | | | | | | | | | | | | | | | | | | | | | | | | | | | | | | | |
| Country | | Chile | | | Argentina | | | Brazil | | | Colombia | | | Peru | | | Eliminations | | | Total (*) | |
STATEMENT OF CASH FLOWS | | 12-31-2015
ThCh$ | | | 12-31-2014
ThCh$ | | | 12-31-2013
ThCh$ | | | 12-31-2015
ThCh$ | | | 12-31-2014
ThCh$ | | | 12-31-2013
ThCh$ | | | 12-31-2015
ThCh$ | | | 12-31-2014
ThCh$ | | | 12-31-2013
ThCh$ | | | 12-31-2015
ThCh$ | | | 12-31-2014
ThCh$ | | | 12-31-2013
ThCh$ | | | 12-31-2015
ThCh$ | | | 12-31-2014
ThCh$ | | | 12-31-2013
ThCh$ | | | 12-31-2015
ThCh$ | | | 12-31-2014
ThCh$ | | | 12-31-2013
ThCh$ | | | 12-31-2015
ThCh$ | | | 12-31-2014
ThCh$ | | | 12-31-2013
ThCh$ | |
| | | | | | | | | | | | | | | | | | | | | | | | | | | | | | | | | | | | | | | | | | | | | | | | | | | | | | | | | | | | | | | | | | | | | | | | | | | | | | | | | | | | |
Net cash flows from (used in) operating activities | | | 549,960,852 | | | | 203,323,918 | | | | 430,172,279 | | | | 349,787,261 | | | | 267,157,901 | | | | 171,169,106 | | | | 266,234,483 | | | | 412,841,873 | | | | 448,374,315 | | | | 489,849,453 | | | | 582,492,679 | | | | 478,582,963 | | | | 276,916,200 | | | | 239,070,342 | | | | 175,327,834 | | | | (9,297,647) | | | | (6,848,719) | | | | (2,650,853) | | | | 1,923,450,602 | | | | 1,698,037,994 | | | | 1,700,975,644 | |
Net cash flows from (used in) investing activities | | | 40,279,970 | | | | 956,586,408 | | | | (283,356,920) | | | | (287,437,006) | | | | (236,905,557) | | | | (164,720,608) | | | | (266,497,586) | | | | (142,166,536) | | | | (185,875,967) | | | | (271,946,454) | | | | (202,123,930) | | | | (229,211,864) | | | | (156,966,672) | | | | (75,195,327) | | | | (63,697,550) | | | | (272,731,300) | | | | (599,882,048) | | | | (297,024,180) | | | | (1,215,299,048) | | | | (299,686,990) | | | | (1,223,887,089) | |
Net cash flows from (used in) financing activities | | | (603,778,788) | | | | (1,096,385,941) | | | | 565,999,553 | | | | (28,362,528) | | | | (28,140,190) | | | | (4,113,277) | | | | (78,409,908) | | | | (326,502,619) | | | | (199,139,356) | | | | (425,470,875) | | | | (320,548,584) | | | | (220,291,845) | | | | (206,144,926) | | | | (118,613,377) | | | | (105,415,120) | | | | 281,952,646 | | | | 606,731,048 | | | | 299,725,401 | | | | (1,060,214,379) | | | | (1,283,459,663) | | | | 336,765,356 | |
(*) See Note 5.1.II.iv for cash flows related to discontinued operations
The eliminations column corresponds to transactions between companies in different lines of business and country, primarily purchases and sales of energy and services.
| | |
| The accompanying notes are an integral part of these consolidated financial statements | | |
|
| F-136 |
| | 35.4 | Generation and Transmission, and Distribution by Country |
| | a) | Generation and transmission |
| | | | | | | | | | | | | | | | | | | | | | | | | | | | | | | | | | | | | | | | | | | | | | | | | | | | | | | | |
| Line of business | | Generation and Transmission | |
| Country | | Chile | | | Argentina | | | Brazil | | | Colombia | | | Peru | | | Eliminations | | | Total | |
| ASSETS | | 12-31-2015 ThCh$ | | | 12-31-2014 ThCh$ | | | 12-31-2015 ThCh$ | | | 12-31-2014 ThCh$ | | | 12-31-2015
ThCh$ | | | 12-31-2014
ThCh$ | | | 12-31-2015
ThCh$ | | | 12-31-2014
ThCh$ | | | 12-31-2015
ThCh$ | | | 12-31-2014
ThCh$ | | | 12-31-2015
ThCh$ | | | 12-31-2014
ThCh$ | | | 12-31-2015
ThCh$ | | | 12-31-2014
ThCh$ | |
| CURRENT ASSETS | | | 5,216,028,617 | | | | 587,911,081 | | | | 143,791,564 | | | | 111,345,580 | | | | 109,584,185 | | | | 179,310,128 | | | | 172,957,080 | | | | 329,704,908 | | | | 172,786,358 | | | | 164,347,787 | | | | (1,840,838,256) | | | | (114,094,932) | | | | 3,974,309,548 | | | | 1,258,524,552 | |
Cash and cash equivalents | | | 13,726,062 | | | | 50,627,592 | | | | 21,513,878 | | | | 20,268,881 | | | | 22,236,032 | | | | 76,039,740 | | | | 66,939,946 | | | | 224,564,345 | | | | 33,818,918 | | | | 73,264,364 | | | | - | | | | - | | | | 158,234,836 | | | | 444,764,922 | |
Other current financial assets | | | 2,649,187 | | | | 4,389,709 | | | | - | | | | - | | | | 5,824,350 | | | | 26,000,508 | | | | 2,992,716 | | | | 20,460,311 | | | | - | | | | - | | | | - | | | | - | | | | 11,466,253 | | | | 50,850,528 | |
Other current non-financial assets | | | 47 | | | | 10,766,653 | | | | 1,458,900 | | | | 2,909,678 | | | | 11,386,388 | | | | 15,508,149 | | | | 7,812,064 | | | | 9,272,519 | | | | 6,237,667 | | | | 22,807,982 | | | | - | | | | - | | | | 26,895,066 | | | | 61,264,981 | |
Trade and other current receivables | | | 15,361 | | | | 317,283,266 | | | | 91,879,708 | | | | 55,648,584 | | | | 27,816,899 | | | | 35,732,810 | | | | 80,179,914 | | | | 53,822,823 | | | | 81,432,845 | | | | 35,628,118 | | | | 209,266 | | | | 248,342 | | | | 281,533,993 | | | | 498,363,943 | |
Current accounts receivable from related companies | | | 28,482,912 | | | | 113,265,863 | | | | 24,188,529 | | | | 28,040,438 | | | | 40,682,826 | | | | 23,607,823 | | | | 7,299,356 | | | | 7,818,044 | | | | 28,001,327 | | | | 8,711,102 | | | | (58,956,778) | | | | (104,338,221) | | | | 69,698,172 | | | | 77,105,049 | |
Inventories | | | - | | | | 36,871,184 | | | | 2,707,246 | | | | 2,268,098 | | | | 19,388 | | | | 24,762 | | | | 7,727,748 | | | | 12,342,664 | | | | 23,211,279 | | | | 22,290,073 | | | | - | | | | - | | | | 33,665,661 | | | | 73,796,781 | |
Current tax assets | | | - | | | | 44,701,761 | | | | 2,043,303 | | | | 2,209,901 | | | | 1,618,302 | | | | 2,396,336 | | | | 5,336 | | | | 1,424,202 | | | | 84,322 | | | | 1,646,148 | | | | - | | | | - | | | | 3,751,263 | | | | 52,378,348 | |
| | | | | | | | | | | | | | | | | | | | | | | | | | | | | | | | | | | | | | | | | | | | | | | | | | | | | | | | |
Non-current assets or disposal groups held for sale or held for distribution to owners | | | 5,171,155,048 | | | | 10,005,053 | | | | - | | | | - | | | | - | | | | - | | | | - | | | | - | | | | - | | | | - | | | | (1,782,090,744) | | | | (10,005,053) | | | | 3,389,064,304 | | | | - | |
| | | | | | | | | | | | | | | | | | | | | | | | | | | | | | | | | | | | | | | | | | | | | | | | | | | | | | | | |
| NON-CURRENT ASSETS | | | 34,135 | | | | 4,509,737,795 | | | | 514,526,563 | | | | 376,359,459 | | | | 377,376,503 | | | | 465,167,544 | | | | 1,807,828,818 | | | | 1,787,224,362 | | | | 903,328,613 | | | | 918,279,644 | | | | 467,827,511 | | | | (1,242,631,650) | | | | 4,070,922,143 | | | | 6,814,137,154 | |
Other non-current financial assets | | | - | | | | 6,719,853 | | | | - | | | | 30,877 | | | | 1 | | | | 1 | | | | 612,676 | | | | 1,170,931 | | | | 13,305 | | | | 16,166 | | | | - | | | | - | | | | 625,982 | | | | 7,937,828 | |
Other non-current non-financial assets | | | - | | | | 42,847 | | | | 3,600,646 | | | | 3,804,828 | | | | 5,159,456 | | | | 7,666,802 | | | | 1,087,677 | | | | 1,075,811 | | | | - | | | | - | | | | - | | | | - | | | | 9,847,779 | | | | 12,590,288 | |
Trade and other non-current receivables | | | - | | | | - | | | | 301,118,584 | | | | 174,458,331 | | | | 7,390,854 | | | | 8,630,215 | | | | 1,942,063 | | | | 2,177,709 | | | | - | | | | - | | | | - | | | | - | | | | 310,451,501 | | | | 185,266,255 | |
Non-current accounts receivable from related companies | | | - | | | | - | | | | - | | | | - | | | | 24,422,654 | | | | 31,402,626 | | | | - | | | | - | | | | - | | | | - | | | | (24,422,654) | | | | (31,402,626) | | | | - | | | | - | |
Investments accounted for using the equity method | | | - | | | | 1,852,154,229 | | | | 2,083,893 | | | | 1,981,428 | | | | 32,530,127 | | | | 19,298,297 | | | | - | | | | - | | | | 40,166,814 | | | | 57,999,593 | | | | 403,581,048 | | | | (1,322,024,225) | | | | 478,361,882 | | | | 609,409,322 | |
Intangible assets other than goodwill | | | - | | | | 18,851,913 | | | | 44,948 | | | | 70,302 | | | | 2,367,312 | | | | 2,847,709 | | | | 20,180,823 | | | | 22,960,562 | | | | 11,072,435 | | | | 10,768,352 | | | | - | | | | - | | | | 33,665,518 | | | | 55,498,838 | |
Goodwill | | | - | | | | - | | | | 1,070,608 | | | | 1,401,472 | | | | - | | | | - | | | | 4,285,458 | | | | 4,886,064 | | | | 6,675,472 | | | | 8,527,161 | | | | 88,669,117 | | | | 110,795,201 | | | | 100,700,655 | | | | 125,609,898 | |
Property, plant and equipment | | | - | | | | 2,621,113,891 | | | | 205,987,826 | | | | 191,081,462 | | | | 284,339,062 | | | | 362,640,263 | | | | 1,761,539,131 | | | | 1,707,545,357 | | | | 845,400,587 | | | | 840,968,372 | | | | - | | | | - | | | | 3,097,266,606 | | | | 5,723,349,345 | |
Investment property | | | - | | | | - | | | | - | | | | - | | | | - | | | | - | | | | - | | | | - | | | | - | | | | - | | | | - | | | | - | | | | - | | | | - | |
Deferred tax assets | | | 34,135 | | | | 10,855,062 | | | | 620,058 | | | | 3,530,759 | | | | 21,167,037 | | | | 32,681,631 | | | | 18,180,990 | | | | 47,407,928 | | | | - | | | | - | | | | - | | | | - | | | | 40,002,220 | | | | 94,475,380 | |
| | | | | | | | | | | | | | | | | | | | | | | | | | | | | | | | | | | | | | | | | | | | | | | | | | | | | | | | |
TOTAL ASSETS | | | 5,216,062,752 | | | | 5,097,648,876 | | | | 658,318,127 | | | | 487,705,039 | | | | 486,960,688 | | | | 644,477,672 | | | | 1,980,785,898 | | | | 2,116,929,270 | | | | 1,076,114,971 | | | | 1,082,627,431 | | | | (1,373,010,745) | | | | (1,356,726,582) | | | | 8,045,231,691 | | | | 8,072,661,706 | |
| | | | | | | | | | | | | | | | | | | | | | | | | | | | | | | | | | | | | | | | | | | | | | | | | | | | | | | | |
| | | Generation and Transmission | |
| Country | | Chile | | | Argentina | | | Brazil | | | Colombia | | | Peru | | | Eliminations | | | Total | |
| LIABILITIES AND EQUITY | | 12-31-2015
ThCh$ | | | 12-31-2014
ThCh$ | | | 12-31-2015
ThCh$ | | | 12-31-2014
ThCh$ | | | 12-31-2015
ThCh$ | | | 12-31-2014
ThCh$ | | | 12-31-2015
ThCh$ | | | 12-31-2014
ThCh$ | | | 12-31-2015
ThCh$ | | | 12-31-2014
ThCh$ | | | 12-31-2015
ThCh$ | | | 12-31-2014
ThCh$ | | | 12-31-2015
ThCh$ | | | 12-31-2014
ThCh$ | |
| CURRENT LIABILITIES | | | 1,828,533,074 | | | | 674,505,169 | | | | 219,381,678 | | | | 180,031,592 | | | | 126,744,267 | | | | 209,741,472 | | | | 349,716,663 | | | | 500,427,459 | | | | 149,548,832 | | | | 111,916,694 | | | | 61,192,354 | | | | (54,269,042) | | | | 2,735,116,868 | | | | 1,622,353,344 | |
Other current financial liabilities | | | 417,400 | | | | 146,364,103 | | | | 30,356,957 | | | | 29,204,543 | | | | 1,718,719 | | | | 547,554 | | | | 135,606,953 | | | | 90,868,809 | | | | 62,170,269 | | | | 30,884,141 | | | | - | | | | - | | | | 230,270,298 | | | | 297,869,150 | |
Trade and other current payables | | | 158,892 | | | | 330,234,621 | | | | 121,997,587 | | | | 104,631,867 | | | | 47,259,646 | | | | 55,829,739 | | | | 89,385,378 | | | | 194,459,885 | | | | 67,063,567 | | | | 63,043,076 | | | | 16,847,277 | | | | 29,732,030 | | | | 342,712,347 | | | | 777,931,218 | |
Current accounts payable to related companies | | | 2,336 | | | | 139,180,109 | | | | 22,841,700 | | | | 27,161,544 | | | | 57,806,281 | | | | 147,681,040 | | | | 22,926,498 | | | | 131,257,351 | | | | 11,770,115 | | | | 9,832,315 | | | | (10,778,741) | | | | (84,001,072) | | | | 104,568,189 | | | | 371,111,287 | |
Other current provisions | | | - | | | | 10,932,577 | | | | 2,744,275 | | | | 666,299 | | | | - | | | | - | | | | 72,379,364 | | | | 24,071,622 | | | | 6,295,715 | | | | 2,681,490 | | | | - | | | | - | | | | 81,419,354 | | | | 38,351,988 | |
Current tax liabilities | | | - | | | | 31,480,257 | | | | 41,441,159 | | | | 6,836,964 | | | | 19,959,621 | | | | 2,213,037 | | | | 28,563,318 | | | | 55,331,792 | | | | 1,153,023 | | | | 761,199 | | | | - | | | | - | | | | 91,117,121 | | | | 96,623,249 | |
Current provisions for employee benefits | | | - | | | | - | | | | - | | | | - | | | | - | | | | - | | | | - | | | | - | | | | - | | | | - | | | | - | | | | - | | | | - | | | | - | |
Other non-current non-financial liabilities | | | - | | | | 16,313,502 | | | | - | | | | 11,530,375 | | | | - | | | | 3,470,102 | | | | 855,152 | | | | 4,438,000 | | | | 1,096,143 | | | | 4,714,473 | | | | - | | | | - | | | | 1,951,295 | | | | 40,466,452 | |
| | | | | | | | | | | | | | | | | | | | | | | | | | | | | | | | | | | | | | | | | | | | | | | | | | | | | | | | |
Liabilities associated with groups of assets or disposal groups held for sale or distribution to owners | | | 1,827,954,446 | | | | - | | | | - | | | | - | | | | - | | | | - | | | | - | | | | - | | | | - | | | | - | | | | 55,123,818 | | | | - | | | | 1,883,078,264 | | | | - | |
| | | | | | | | | | | | | | | | | | | | | | | | | | | | | | | | | | | | | | | | | | | | | | | | | | | | | | | | |
| NON-CURRENT LIABILITIES | | | 199,807 | | | | 1,060,892,738 | | | | 218,971,414 | | | | 154,168,284 | | | | 34,180,263 | | | | 8,446,341 | | | | 831,187,905 | | | | 883,041,284 | | | | 277,281,858 | | | | 322,944,470 | | | | (48,543,708) | | | | (31,370,967) | | | | 1,313,277,539 | | | | 2,398,122,150 | |
Other non-current financial liabilities | | | - | | | | 778,135,168 | | | | 38,637,260 | | | | 44,052,205 | | | | 3,012,998 | | | | 2,421,880 | | | | 781,500,274 | | | | 862,784,448 | | | | 118,684,335 | | | | 183,792,705 | | | | - | | | | - | | | | 941,834,867 | | | | 1,871,186,406 | |
Trade and other non-current payables | | | - | | | | 3,711,078 | | | | 94,453,409 | | | | 89,968 | | | | 2,911,464 | | | | 57,790 | | | | - | | | | - | | | | - | | | | - | | | | - | | | | - | | | | 97,364,873 | | | | 3,858,836 | |
Non-current account payables to related companies | | | - | | | | - | | | | 35,630,861 | | | | 36,594,486 | | | | 23,598,549 | | | | - | | | | - | | | | - | | | | - | | | | - | | | | (48,543,708) | | | | (31,686,032) | | | | 10,685,702 | | | | 4,908,454 | |
Other long-term provisions | | | - | | | | 25,161,118 | | | | - | | | | - | | | | 4,657,252 | | | | 5,571,273 | | | | 32,991,300 | | | | 465,509 | | | | 4,234,681 | | | | 3,661,187 | | | | - | | | | - | | | | 41,883,233 | | | | 34,859,087 | |
Deferred tax liabilities | | | - | | | | 232,045,128 | | | | 46,358,947 | | | | 31,236,466 | | | | - | | | | - | | | | - | | | | - | | | | 134,903,163 | | | | 134,696,942 | | | | - | | | | - | | | | 181,262,110 | | | | 397,978,536 | |
Non-current provisions for employee benefits | | | 199,807 | | | | 18,882,217 | | | | 3,890,937 | | | | 3,994,647 | | | | - | | | | - | | | | 16,696,331 | | | | 19,791,327 | | | | 761,267 | | | | 793,636 | | | | - | | | | - | | | | 21,548,342 | | | | 43,461,827 | |
Other non-current non-financial liabilities | | | - | | | | 2,958,029 | | | | - | | | | 38,200,512 | | | | - | | | | 395,398 | | | | - | | | | - | | | | 18,698,412 | | | | - | | | | - | | | | 315,065 | | | | 18,698,412 | | | | 41,869,004 | |
| | | | | | | | | | | | | | | | | | | | | | | | | | | | | | | | | | | | | | | | | | | | | | | | | | | | | | | | |
| EQUITY | | | 3,387,329,871 | | | | 3,362,250,969 | | | | 219,965,035 | | | | 153,505,163 | | | | 326,036,158 | | | | 426,289,859 | | | | 799,881,330 | | | | 733,460,527 | | | | 649,284,281 | | | | 647,766,267 | | | | (1,385,659,391) | | | | (1,271,086,573) | | | | 3,996,837,284 | | | | 4,052,186,212 | |
| Equity attributable to shareholders of Enersis Américas | | | 3,387,329,871 | | | | 3,362,250,969 | | | | 219,965,035 | | | | 153,505,163 | | | | 326,036,158 | | | | 426,289,859 | | | | 799,881,330 | | | | 733,460,527 | | | | 649,284,281 | | | | 647,766,267 | | | | (1,385,659,391) | | | | (1,271,086,573) | | | | 3,996,837,284 | | | | 4,052,186,212 | |
Issued capital | | | 2,041,622,319 | | | | 2,066,342,520 | | | | 82,865,510 | | | | 108,474,430 | | | | 90,172,688 | | | | 115,185,419 | | | | 146,498,021 | | | | 167,029,702 | | | | 323,227,193 | | | | 227,902,984 | | | | (1,207,662,870) | | | | (1,172,172,225) | | | | 1,476,722,861 | | | | 1,512,762,830 | |
Retained earnings | | | 1,726,639,410 | | | | 1,401,123,725 | | | | 49,183,508 | | | | (19,153,229) | | | | 134,179,155 | | | | 159,510,944 | | | | 217,958,120 | | | | 110,289,985 | | | | 48,944,655 | | | | 170,891,294 | | | | 181,696,622 | | | | 349,976,414 | | | | 2,358,601,470 | | | | 2,172,639,133 | |
Share premium | | | 206,008,557 | | | | 206,008,557 | | | | - | | | | - | | | | - | | | | - | | | | - | | | | - | | | | 49,641 | | | | 590,505 | | | | - | | | | - | | | | 206,058,198 | | | | 206,599,062 | |
Other reserves | | | (586,940,415) | | | | (311,223,833) | | | | 87,916,017 | | | | 64,183,962 | | | | 101,684,315 | | | | 151,593,496 | | | | 435,425,189 | | | | 456,140,840 | | | | 277,062,792 | | | | 248,381,484 | | | | (359,693,143) | | | | (448,890,762) | | | | (44,545,245) | | | | 160,185,187 | |
| | | | | | | | | | | | | | | | | | | | | | | | | | | | | | | | | | | | | | | | | | | | | | | | | | | | | | | | |
| Total Liabilities and Equity | | | 5,216,062,752 | | | | 5,097,648,876 | | | | 658,318,127 | | | | 487,705,039 | | | | 486,960,688 | | | | 644,477,672 | | | | 1,980,785,898 | | | | 2,116,929,270 | | | | 1,076,114,971 | | | | 1,082,627,431 | | | | (1,373,010,745) | | | | (1,356,726,582) | | | | 8,045,231,691 | | | | 8,072,661,706 | |
The eliminations column corresponds to transactions between companies in different lines of business and country, primarily purchases and sales of energy and services.
| | |
| The accompanying notes are an integral part of these consolidated financial statements | | |
|
| F-137 |
| | | | | | | | | | | | | | | | | | | | | | | | | | | | | | | | | | | | | | | | | | | | | | | | | | | | | | | | | | | | | | | | | | | | | | | | | | | | | | | | | | |
| | | Generación y Transmisión |
| Country | | Chile | | | Argentina | | | Brazil | | | Colombia | | | Peru | | | Eliminations | | | Total |
| STATEMENT OF COMPREHENSIVE INCOME | | 12-31-2015 | | | 12-31-2014 | | | 12-31-2013 | | | 12-31-2015 | | | 12-31-2014 | | | 12-31-2013 | | | 12-31-2015 | | | 12-31-2014 | | | 12-31-2013 | | | 12-31-2015 | | | 12-31-2014 | | | 12-31-2013 | | | 12-31-2015 | | | 12-31-2014 | | | 12-31-2013 | | | 12-31-2015 | | | 12-31-2014 | | | 12-31-2013 | | | 12-31-2015 | | | 12-31-2014 | | | 12-31-2013 |
| | | ThCh$ | | | ThCh$ | | | ThCh$ | | | ThCh$ | | | ThCh$ | | | ThCh$ | | | ThCh$ | | | ThCh$ | | | ThCh$ | | | ThCh$ | | | ThCh$ | | | ThCh$ | | | ThCh$ | | | ThCh$ | | | ThCh$ | | | ThCh$ | | | ThCh$ | | | ThCh$ | | | ThCh$ | | | ThCh$ | | | ThCh$ |
| REVENUE | | | 4,082,290 | | | | 5,160,988 | | | | 3,102,453 | | | | 212,136,445 | | | | 167,629,542 | | | | 173,767,878 | | | | 305,829,811 | | | | 437,032,601 | | | | 349,612,268 | | | | 778,768,427 | | | | 753,385,349 | | | | 639,460,200 | | | | 437,887,044 | | | | 401,695,198 | | | | 315,886,096 | | | | (3,942,245) | | | | (2,034,545) | | | | (484,995) | | | | 1,734,761,772 | | | | 1,762,869,133 | | | 1,481,343,900 |
Revenue | | | 4,082,290 | | | | 5,160,988 | | | | 3,102,453 | | | | 157,348,898 | | | | 124,403,558 | | | | 138,071,697 | | | | 305,829,811 | | | | 437,032,601 | | | | 349,355,959 | | | | 769,665,035 | | | | 744,236,226 | | | | 634,800,723 | | | | 435,277,054 | | | | 392,252,284 | | | | 294,442,189 | | | | (3,930,384) | | | | (2,034,545) | | | | (476,535) | | | | 1,668,272,704 | | | | 1,701,051,112 | | | 1,419,296,486 |
Energy sales | | | - | | | | - | | | | - | | | | 118,064,590 | | | | 75,488,280 | | | | 109,113,647 | | | | 250,599,834 | | | | 369,739,130 | | | | 286,300,194 | | | | 762,280,521 | | | | 743,649,328 | | | | 634,181,459 | | | | 355,087,025 | | | | 325,248,022 | | | | 275,491,763 | | | | - | | | | - | | | | - | | | | 1,486,031,970 | | | | 1,514,124,760 | | | 1,305,087,063 |
Other sales | | | - | | | | - | | | | - | | | | - | | | | - | | | | - | | | | - | | | | - | | | | - | | | | 7,290,919 | | | | 476,853 | | | | - | | | | 13,833,990 | | | | 12,603,162 | | | | 8,817,669 | | | | - | | | | - | | | | - | | | | 21,124,909 | | | | 13,080,015 | | | 8,817,669 |
Other services rendered | | | 4,082,290 | | | | 5,160,988 | | | | 3,102,453 | | | | 39,284,308 | | | | 48,915,278 | | | | 28,958,050 | | | | 55,229,977 | | | | 67,293,471 | | | | 63,055,765 | | | | 93,595 | | | | 110,045 | | | | 619,264 | | | | 66,356,039 | | | | 54,401,100 | | | | 10,132,757 | | | | (3,930,384) | | | | (2,034,545) | | | | (476,535) | | | | 161,115,825 | | | | 173,846,337 | | | 105,391,754 |
Other operating income | | | - | | | | - | | | | - | | | | 54,787,547 | | | | 43,225,984 | | | | 35,696,181 | | | | - | | | | - | | | | 256,309 | | | | 9,103,392 | | | | 9,149,123 | | | | 4,659,477 | | | | 2,609,990 | | | | 9,442,914 | | | | 21,443,907 | | | | (11,861) | | | | - | | | | (8,460) | | | | 66,489,068 | | | | 61,818,021 | | | 62,047,414 |
| | | | | | | | | | | | | | | | | | | | | | | | | | | | | | | | | | | | | | | | | | | | | | | | | | | | | | | | | | | | | | | | | | | | | | | | | | | | | | | | | | |
| RAW MATERIALS AND CONSUMABLES USED | | | - | | | | - | | | | - | | | | (50,332,370) | | | | (47,296,150) | | | | (56,031,616) | | | | (131,431,046) | | | | (234,224,494) | | | | (141,838,915) | | | | (321,664,855) | | | | (220,460,069) | | | | (204,521,337) | | | | (174,512,696) | | | | (151,707,294) | | | | (112,418,728) | | | | - | | | | - | | | | - | | | | (677,940,967) | | | | (653,688,007) | | | (514,810,596) |
Energy purchases | | | - | | | | - | | | | - | | | | (1,479,711) | | | | (5,069,376) | | | | (18,314,110) | | | | (57,315,995) | | | | (155,266,089) | | | | (51,759,989) | | | | (162,261,692) | | | | (80,294,031) | | | | (87,695,910) | | | | (17,092,514) | | | | (21,103,383) | | | | (14,637,475) | | | | 3,103,553 | | | | 3,056,025 | | | | 3,962,147 | | | | (235,046,359) | | | | (258,676,854) | | | (168,445,337) |
Fuel consumption | | | - | | | | - | | | | - | | | | (39,487,378) | | | | (31,350,429) | | | | (25,889,830) | | | | (61,626,347) | | | | (58,409,123) | | | | (51,277,737) | | | | (62,987,536) | | | | (33,015,871) | | | | (34,870,502) | | | | (94,012,661) | | | | (82,758,971) | | | | (62,465,952) | | | | - | | | | - | | | | - | | | | (258,113,922) | | | | (205,534,394) | | | (174,504,021) |
Transportation expense | | | - | | | | - | | | | - | | | | (883,161) | | | | (1,832,459) | | | | (1,826,163) | | | | (12,466,467) | | | | (16,037,191) | | | | (9,695,879) | | | | (64,562,969) | | | | (68,739,282) | | | | (59,719,073) | | | | (43,595,972) | | | | (35,235,902) | | | | (22,491,100) | | | | (3,103,553) | | | | (3,056,025) | | | | (3,962,147) | | | | (124,612,122) | | | | (124,900,859) | | | (97,694,362) |
Other miscellaneous supplies and services | | | - | | | | - | | | | - | | | | (8,482,120) | | | | (9,043,886) | | | | (10,001,513) | | | | (22,237) | | | | (4,512,091) | | | | (29,105,310) | | | | (31,852,658) | | | | (38,410,885) | | | | (22,235,852) | | | | (19,811,549) | | | | (12,609,038) | | | | (12,824,201) | | | | - | | | | - | | | | - | | | | (60,168,564) | | | | (64,575,900) | | | (74,166,876) |
| | | | | | | | | | | | | | | | | | | | | | | | | | | | | | | | | | | | | | | | | | | | | | | | | | | | | | | | | | | | | | | | | | | | | | | | | | | | | | | | | | |
| CONTRIBUTION MARGIN | | | 4,082,290 | | | | 5,160,988 | | | | 3,102,453 | | | | 161,804,075 | | | | 120,333,392 | | | | 117,736,262 | | | | 174,398,765 | | | | 202,808,107 | | | | 207,773,353 | | | | 457,103,572 | | | | 532,925,280 | | | | 434,938,863 | | | | 263,374,348 | | | | 249,987,904 | | | | 203,467,368 | | | | (3,942,245) | | | | (2,034,545) | | | | (484,995) | | | | 1,056,820,805 | | | | 1,109,181,126 | | | 966,533,304 |
| | | | | | | | | | | | | | | | | | | | | | | | | | | | | | | | | | | | | | | | | | | | | | | | | | | | | | | | | | | | | | | | | | | | | | | | | | | | | | | | | | |
Other works performed by the entity and capitalized | | | - | | | | - | | | | - | | | | 3,949,935 | | | | 4,717,343 | | | | 2,994,025 | | | | 1,029,091 | | | | 843,966 | | | | 798,621 | | | | 5,344,745 | | | | 5,763,278 | | | | 5,001,430 | | | | 431,498 | | | | 550,306 | | | | 461,664 | | | | 3,632,336 | | | | 1,673,387 | | | | - | | | | 14,387,605 | | | | 13,548,280 | | | 9,255,740 |
Employee benefits expense | | | (407,906) | | | | (398,886) | | | | (395,543) | | | | (56,220,837) | | | | (40,274,266) | | | | (33,097,900) | | | | (11,749,621) | | | | (14,797,349) | | | | (12,441,385) | | | | (20,843,530) | | | | (20,155,909) | | | | (18,284,458) | | | | (18,628,502) | | | | (16,552,441) | | | | (14,606,541) | | | | - | | | | - | | | | - | | | | (107,850,396) | | | | (92,178,851) | | | (78,825,827) |
Other expenses | | | (1,898,316) | | | | (349,920) | | | | (303,250) | | | | (23,389,085) | | | | (22,301,843) | | | | (19,974,007) | | | | (10,599,409) | | | | (12,075,955) | | | | (9,947,279) | | | | (29,558,639) | | | | (24,447,808) | | | | (20,175,229) | | | | (31,408,734) | | | | (25,612,491) | | | | (21,653,706) | | | | 309,909 | | | | 361,158 | | | | 484,995 | | | | (96,544,274) | | | | (84,426,859) | | | (71,568,476) |
| | | | | | | | | | | | | | | | | | | | | | | | | | | | | | | | | | | | | | | | | | | | | | | | | | | | | | | | | | | | | | | | | | | | | | | | | | | | | | | | | | |
| GROSS OPERATING RESULTS | | | 1,776,068 | | | | 4,412,182 | | | | 2,403,660 | | | | 86,144,088 | | | | 62,474,626 | | | | 67,658,380 | | | | 153,078,826 | | | | 176,778,769 | | | | 186,183,310 | | | | 412,046,148 | | | | 494,084,841 | | | | 401,480,606 | | | | 213,768,610 | | | | 208,373,278 | | | | 167,668,785 | | | | - | | | | - | | | | - | | | | 866,813,740 | | | | 946,123,696 | | | 825,394,741 |
| | | | | | | | | | | | | | | | | | | | | | | | | | | | | | | | | | | | | | | | | | | | | | | | | | | | | | | | | | | | | | | | | | | | | | | | | | | | | | | | | | |
Depreciation and amortization expense | | | - | | | | - | | | | - | | | | (34,934,726) | | | | (23,684,899) | | | | (26,740,217) | | | | (21,509,767) | | | | (26,790,105) | | | | (24,882,875) | | | | (39,108,707) | | | | (43,806,832) | | | | (37,628,154) | | | | (51,738,067) | | | | (48,327,434) | | | | (41,395,669) | | | | - | | | | - | | | | - | | | | (147,291,267) | | | | (142,609,270) | | | (130,646,915) |
Impairment losses (reversal of impairment losses) recognized in profit or loss | | | - | | | | - | | | | - | | | | - | | | | (81,595) | | | | (5,788,836) | | | | (13,312) | | | | (1,154,946) | | | | (695,613) | | | | (109,012) | | | | (787,645) | | | | 76,227 | | | | (4,704,314) | | | | (1,188,617) | | | | (6,698,767) | | | | - | | | | - | | | | - | | | | (4,826,638) | | | | (3,212,803) | | | (13,106,989) |
| | | | | | | | | | | | | | | | | | | | | | | | | | | | | | | | | | | | | | | | | | | | | | | | | | | | | | | | | | | | | | | | | | | | | | | | | | | | | | | | | | |
| OPERATING INCOME | | | 1,776,068 | | | | 4,412,182 | | | | 2,403,660 | | | | 51,209,362 | | | | 38,708,132 | | | | 35,129,327 | | | | 131,555,747 | | | | 148,833,718 | | | | 160,604,822 | | | | 372,828,429 | | | | 449,490,364 | | | | 363,928,679 | | | | 157,326,229 | | | | 158,857,227 | | | | 119,574,349 | | | | - | | | | - | | | | - | | | | 714,695,835 | | | | 800,301,623 | | | 681,640,837 |
| | | | | | | | | | | | | | | | | | | | | | | | | | | | | | | | | | | | | | | | | | | | | | | | | | | | | | | | | | | | | | | | | | | | | | | | | | | | | | | | | | |
| FINANCIAL RESULTS | | | 530,715 | | | | (4,284,233) | | | | 11,086,035 | | | | 133,277,754 | | | | (1,703,723) | | | | (85,446,575) | | | | 22,320,357 | | | | 19,658,005 | | | | 15,184,608 | | | | (39,872,136) | | | | (34,591,411) | | | | (26,946,483) | | | | (16,392,038) | | | | (12,653,612) | | | | (12,096,778) | | | | - | | | | 11,024,799 | | | | 4,146,888 | | | | 99,864,652 | | | | (22,550,175) | | | (94,072,305) |
Financial income | | | 78,056 | | | | 443,158 | | | | 389,747 | | | | 75,454,262 | | | | 83,671,357 | | | | 4,244,643 | | | | 10,178,944 | | | | 23,653,993 | | | | 19,932,499 | | | | 3,321,340 | | | | 11,379,616 | | | | 11,265,048 | | | | 970,851 | | | | 1,062,402 | | | | 1,144,181 | | | | (1,971,425) | | | | (9,126,267) | | | | (2,226,200) | | | | 88,032,028 | | | | 111,084,259 | | | 34,749,918 |
Cash and cash equivalents | | | 78,056 | | | | 443,158 | | | | 159,945 | | | | 75,357,320 | | | | 3,480,928 | | | | 3,943,498 | | | | 7,132,537 | | | | 12,088,079 | | | | 11,073,482 | | | | 2,942,242 | | | | 9,848,063 | | | | 7,992,710 | | | | 798,003 | | | | 868,225 | | | | 981,806 | | | | - | | | | - | | | | - | | | | 86,308,158 | | | | 26,728,453 | | | 24,151,441 |
Other Financial income | | | - | | | | - | | | | 229,802 | | | | 96,942 | | | | 80,190,429 | | | | 301,145 | | | | 3,046,407 | | | | 11,565,914 | | | | 8,859,017 | | | | 379,098 | | | | 1,531,553 | | | | 3,272,338 | | | | 172,848 | | | | 194,177 | | | | 162,375 | | | | (1,971,425) | | | | (9,126,267) | | | | (2,226,200) | | | | 1,723,870 | | | | 84,355,806 | | | 10,598,477 |
Financial costs | | | (3,126,870) | | | | (2,261,919) | | | | (1,551,540) | | | | (40,380,160) | | | | (23,365,735) | | | | (31,560,337) | | | | (11,661,217) | | | | (14,528,800) | | | | (12,677,600) | | | | (44,085,917) | | | | (44,880,587) | | | | (38,653,714) | | | | (12,234,468) | | | | (10,024,755) | | | | (9,184,654) | | | | 1,971,425 | | | | 9,126,265 | | | | 2,226,198 | | | | (109,517,207) | | | | (85,935,531) | | | (91,401,647) |
Bank borrowings | | | 3,126,870 | | | | - | | | | - | | | | (5,338,424) | | | | (8,088,985) | | | | (8,966,137) | | | | (288,377) | | | | (1,846,966) | | | | (1,838,781) | | | | (8,596,486) | | | | (6,301,664) | | | | (6,801,800) | | | | (4,252,551) | | | | (5,155,512) | | | | (3,848,040) | | | | - | | | | - | | | | - | | | | (15,348,968) | | | | (21,393,127) | | | (21,454,758) |
Secured and unsecured obligations | | | (6,253,740) | | | | - | | | | - | | | | - | | | | - | | | | - | | | | - | | | | - | | | | - | | | | (71,452,386) | | | | (74,994,653) | | | | (51,294,445) | | | | (3,137,072) | | | | (3,735,298) | | | | (4,535,599) | | | | - | | | | - | | | | - | | | | (80,843,198) | | | | (78,729,951) | | | (55,830,044) |
Other | | | - | | | | (2,261,919) | | | | (1,551,540) | | | | (35,041,736) | | | | (15,276,750) | | | | (22,594,200) | | | | (11,372,840) | | | | (12,681,834) | | | | (10,838,819) | | | | 35,962,955 | | | | 36,415,730 | | | | 19,442,531 | | | | (4,844,845) | | | | (1,133,945) | | | | (801,015) | | | | 1,971,425 | | | | 9,126,265 | | | | 2,226,198 | | | | (13,325,041) | | | | 14,187,547 | | | (14,116,845) |
Profits (losses) from indexed assets and liabilities | | | - | | | | - | | | | - | | | | - | | | | - | | | | - | | | | - | | | | - | | | | - | | | | - | | | | - | | | | - | | | | - | | | | - | | | | - | | | | - | | | | - | | | | - | | | | - | | | | - | | | - |
Foreign currency exchange differences | | | 3,579,529 | | | | (2,465,472) | | | | 12,247,828 | | | | 98,203,652 | | | | (62,009,345) | | | | (58,130,881) | | | | 23,802,630 | | | | 10,532,812 | | | | 7,929,709 | | | | 892,441 | | | | (1,090,440) | | | | 442,183 | | | | (5,128,421) | | | | (3,691,259) | | | | (4,056,305) | | | | - | | | | 11,024,801 | | | | 4,146,890 | | | | 121,349,831 | | | | (47,698,903) | | | (37,420,576) |
Positive | | | 15,185,792 | | | | 13,428,723 | | | | 20,015,266 | | | | 188,314,172 | | | | 15,924,492 | | | | 18,008,939 | | | | 44,422,294 | | | | 15,287,550 | | | | 13,724,429 | | | | 1,875,433 | | | | 1,172,568 | | | | 740,084 | | | | 2,210,164 | | | | 2,845,603 | | | | 3,279,188 | | | | (32,404,283) | | | | (9,007,245) | | | | (8,975,752) | | | | 219,603,572 | | | | 39,651,691 | | | 46,792,154 |
Negative | | | (11,606,263) | | | | (15,894,195) | | | | (7,767,438) | | | | (90,110,520) | | | | (77,933,837) | | | | (76,139,820) | | | | (20,619,664) | | | | (4,754,738) | | | | (5,794,720) | | | | (982,992) | | | | (2,263,008) | | | | (297,901) | | | | (7,338,585) | | | | (6,536,862) | | | | (7,335,493) | | | | 32,404,283 | | | | 20,032,046 | | | | 13,122,642 | | | | (98,253,741) | | | | (87,350,594) | | | (84,212,730) |
| | | | | | | | | | | | | | | | | | | | | | | | | | | | | | | | | | | | | | | | | | | | | | | | | | | | | | | | | | | | | | | | | | | | | | | | | | | | | | | | | | | |
Share of profit of associates accounted for using the equity method | | | - | | | | - | | | | - | | | | 2,678,513 | | | | - | | | | - | | | | - | | | | - | | | | - | | | | - | | | | - | | | | - | | | | - | | | | - | | | | - | | | | - | | | | - | | | | - | | | | 2,678,513 | | | | - | | | - |
Other gains (losses) | | | - | | | | - | | | | 42,761 | | | | (428,872) | | | | 662,310 | | | | 733,526 | | | | - | | | | - | | | | - | | | | (110,332) | | | | 74,183 | | | | 310,238 | | | | 144,350 | | | | 61,637 | | | | (182,051) | | | | - | | | | - | | | | - | | | | (394,854) | | | | 798,130 | | | 904,474 |
Gain (loss) from other investments | | | - | | | | - | | | | 42,761 | | | | - | | | | 707,468 | | | | 725,672 | | | | - | | | | - | | | | - | | | | - | | | | - | | | | - | | | | - | | | | - | | | | - | | | | - | | | | - | | | | - | | | | - | | | | 707,468 | | | 768,433 |
Gain (loss) from the sale of property, plant and equipment | | | - | | | | - | | | | - | | | | (428,872) | | | | (45,158) | | | | 7,854 | | | | - | | | | - | | | | - | | | | (110,332) | | | | 74,183 | | | | 310,238 | | | | 144,350 | | | | 61,637 | | | | (182,051) | | | | - | | | | - | | | | - | | | | (394,854) | | | | 90,662 | | | 136,041 |
| | | | | | | | | | | | | | | | | | | | | | | | | | | | | | | | | | | | | | | | | | | | | | | | | | | | | | | | | | | | | | | | | | | | | | | | | | | | | | | | | | |
| Income before tax | | | 2,306,783 | | | | 127,949 | | | | 13,532,456 | | | | 186,736,757 | | | | 37,666,719 | | | | (49,583,722) | | | | 153,876,104 | | | | 168,491,723 | | | | 175,789,430 | | | | 332,845,961 | | | | 414,973,136 | | | | 337,292,434 | | | | 141,078,541 | | | | 146,265,252 | | | | 107,295,520 | | | | - | | | | 11,024,799 | | | | 4,146,888 | | | | 816,844,146 | | | | 778,549,578 | | | 588,473,006 |
| | | | | | | | | | | | | | | | | | | | | | | | | | | | | | | | | | | | | | | | | | | | | | | | | | | | | | | | | | | | | | | | | | | | | | | | | | | | | | | | | | |
Income tax | | | (40,617,049) | | | | (27,760,379) | | | | (21,650,895) | | | | (78,511,077) | | | | (28,903,711) | | | | (7,294,916) | | | | (53,206,799) | | | | (39,386,507) | | | | (25,337,026) | | | | (120,949,697) | | | | (126,151,738) | | | | (106,503,562) | | | | (42,320,367) | | | | (32,191,266) | | | | (31,842,461) | | | | - | | | | - | | | | - | | | | (335,604,989) | | | | (254,393,601) | | | (192,628,860) |
| | | | | | | | | | | | | | | | | | | | | | | | | | | | | | | | | | | | | | | | | | | | | | | | | | | | | | | | | | | | | | | | | | | | | | | | | | | | | | | | | | |
| Net income from continuing operations | | | (38,310,266) | | | | (27,632,430) | | | | (8,118,439) | | | | 108,225,680 | | | | 8,763,008 | | | | (56,878,638) | | | | 100,669,305 | | | | 129,105,216 | | | | 150,452,404 | | | | 211,896,264 | | | | 288,821,398 | | | | 230,788,872 | | | | 98,758,174 | | | | 114,073,986 | | | | 75,453,059 | | | | - | | | | 11,024,799 | | | | 4,146,888 | | | | 481,239,157 | | | | 524,155,977 | | | 395,844,146 |
Net income from discontinued operations | | | 223,831,259 | | | | 63,327,692 | | | | 179,048,751 | | | | - | | | | - | | | | | | | | - | | | | - | | | | | | | | - | | | | - | | | | - | | | | - | | | | - | | | | - | | | | - | | | | - | | | | - | | | | 223,831,259 | | | | 63,327,692 | | | 179,048,751 |
| Net Income | | | 185,520,993 | | | | 35,695,262 | | | | 170,930,312 | | | | 108,225,680 | | | | 8,763,008 | | | | (56,878,638) | | | | 100,669,305 | | | | 129,105,216 | | | | 150,452,404 | | | | 211,896,264 | | | | 288,821,398 | | | | 230,788,872 | | | | 98,758,174 | | | | 114,073,986 | | | | 75,453,059 | | | | - | | | | 11,024,799 | | | | 4,146,888 | | | | 705,070,416 | | | | 587,483,669 | | | 574,892,897 |
| | | | | | | | | | | | | | | | | | | | | | | | | | | | | | | | | | | | | | | | | | | | | | | | | | | | | | | | | | | | | | | | | | | | | | | | | | | | | | | | | | | |
| Country | | Chile | | | Argentina | | | Brazil | | | Colombia | | | Peru | | | Eliminations | | | Total (*) |
| STATEMENT OF CASH FLOWS | | 12-31-2015 | | | 12-31-2014 | | | 12-31-2013 | | | 12-31-2015 | | | 12-31-2014 | | | 12-31-2013 | | | 12-31-2015 | | | 12-31-2014 | | | 12-31-2013 | | | 12-31-2015 | | | 12-31-2014 | | | 12-31-2013 | | | 12-31-2015 | | | 12-31-2014 | | | 12-31-2013 | | | 12-31-2015 | | | 12-31-2014 | | | 12-31-2013 | | | 12-31-2015 | | | 12-31-2014 | | | 12-31-2013 |
| | | ThCh$ | | | ThCh$ | | | ThCh$ | | | ThCh$ | | | ThCh$ | | | ThCh$ | | | ThCh$ | | | ThCh$ | | | ThCh$ | | | ThCh$ | | | ThCh$ | | | ThCh$ | | | ThCh$ | | | ThCh$ | | | ThCh$ | | | ThCh$ | | | ThCh$ | | | ThCh$ | | | ThCh$ | | | ThCh$ | | | ThCh$ |
| | | | | | | | | | | | | | | | | | | | | | | | | | | | | | | | | | | | | | | | | | | | | | | | | | | | | | | | | | | | | | | | | | | | | | | | | | | | | | | | | | | |
Net cash flows from (used in) operating activities | | | 451,437,274 | | | | 239,014,894 | | | | 304,511,164 | | | | 106,129,177 | | | | 79,108,857 | | | | 23,434,990 | | | | 118,976,796 | | | | 187,589,266 | | | | 172,240,644 | | | | 254,539,609 | | | | 364,425,930 | | | | 273,903,244 | | | | 170,273,397 | | | | 156,986,993 | | | | 100,608,823 | | | | (2,617,119) | | | | (407,289) | | | | (529,831) | | | | 1,098,739,134 | | | | 1,026,718,651 | | | 874,169,034 |
Net cash flows from (used in) investing activities | | | (132,211,583) | | | | 34,558,119 | | | | 65,544,539 | | | | (78,645,571) | | | | (56,312,879) | | | | (38,876,836) | | | | (4,610,998) | | | | (24,096,560) | | | | (6,217,205) | | | | (159,371,575) | | | | (185,214,366) | | | | (125,834,718) | | | | (56,503,902) | | | | (18,336,629) | | | | (8,773,627) | | | | (114,333,695) | | | | (107,704,873) | | | | (80,477,575) | | | | (545,677,324) | | | | (357,107,188) | | | (194,635,422) |
Net cash flows from (used in) financing activities | | | (320,808,291) | | | | (281,839,416) | | | | (319,365,277) | | | | (20,192,869) | | | | (18,507,611) | | | | 14,391,257 | | | | (159,800,756) | | | | (122,230,027) | | | | (203,692,092) | | | | (259,847,758) | | | | (151,340,517) | | | | (104,425,180) | | | | (153,855,492) | | | | (109,291,615) | | | | (96,493,312) | | | | 116,874,513 | | | | 108,112,444 | | | | 81,007,406 | | | | (797,630,653) | | | | (575,096,742) | | | (628,577,198) |
(*) See Note 5.1.II.iv for cash flows related to discontinued operations
The eliminations column corresponds to transactions between companies in different lines of business and country, primarily purchases and sales of energy and services.
| | |
| The accompanying notes are an integral part of these consolidated financial statements | | |
|
| F-138 |
| | | | | | | | | | | | | | | | | | | | | | | | | | | | | | | | | | | | | | | | | | | | | | | | | | | | | | | | |
| Line of Business | | Distribution | |
| Country | | Chile | | | Argentina | | | Brazil | | | Colombia | | | Peru | | | Eliminations | | | Total | |
| ASSETS | | 12-31-2015 | | | 12-31-2014 | | | 12-31-2015 | | | 12-31-2014 | | | 12-31-2015 | | | 12-31-2014 | | | 12-31-2015 | | | 12-31-2014 | | | 12-31-2015 | | | 12-31-2014 | | | 12-31-2015 | | | 12-31-2014 | | | 12-31-2015 | | | 12-31-2014 | |
| | | ThCh$ | | | ThCh$ | | | ThCh$ | | | ThCh$ | | | ThCh$ | | | ThCh$ | | | ThCh$ | | | ThCh$ | | | ThCh$ | | | ThCh$ | | | ThCh$ | | | ThCh$ | | | ThCh$ | | | ThCh$ | |
CURRENT ASSETS | | | 1,068,956,933 | | | | 300,765,617 | | | | 191,441,460 | | | | 409,109,176 | | | | 653,342,371 | | | | 589,020,643 | | | | 207,553,675 | | | | 254,296,273 | | | | 116,371,663 | | | | 142,931,833 | | | | (4,417,595) | | | | (13,369,202) | | | | 2,233,248,507 | | | | 1,682,754,340 | |
Cash and cash equivalents | | | 10,694,452 | | | | 7,716,593 | | | | 24,665,201 | | | | 5,646,882 | | | | 34,293,476 | | | | 67,580,309 | | | | 89,987,572 | | | | 133,186,201 | | | | 14,818,083 | | | | 60,751,331 | | | | - | | | | - | | | | 174,458,784 | | | | 274,881,316 | |
Other current financial assets | | | 188,143 | | | | 470,266 | | | | 694,177 | | | | - | | | | 33,244,064 | | | | 6,971,011 | | | | 44,985 | | | | 17,605,547 | | | | - | | | | - | | | | - | | | | - | | | | 34,171,369 | | | | 25,046,824 | |
Other current non-financial assets | | | - | | | | 4,837,555 | | | | 1,261,261 | | | | 1,192,805 | | | | 65,958,327 | | | | 96,485,884 | | | | 1,912,501 | | | | 2,994,894 | | | | 2,944,189 | | | | 4,217,571 | | | | - | | | | - | | | | 72,076,278 | | | | 109,728,709 | |
Trade and other current receivables | | | 105 | | | | 257,568,198 | | | | 124,663,167 | | | | 360,374,168 | | | | 508,562,286 | | | | 410,307,454 | | | | 99,124,879 | | | | 93,709,158 | | | | 69,883,209 | | | | 56,349,775 | | | | 52,925 | | | | (70,326) | | | | 802,286,571 | | | | 1,178,238,427 | |
Current accounts receivable from related companies | | | 8,208,642 | | | | 26,178,562 | | | | 239,991 | | | | 353,432 | | | | 1,564,236 | | | | 23,473 | | | | 2,829,584 | | | | 2,636,246 | | | | 19,302,467 | | | | 13,402,430 | | | | (4,468,556) | | | | (13,298,876) | | | | 27,676,364 | | | | 29,295,267 | |
Inventories | | | - | | | | 3,542,452 | | | | 37,440,101 | | | | 39,669,296 | | | | 673,996 | | | | 717,960 | | | | 13,654,154 | | | | 4,164,227 | | | | 9,416,923 | | | | 8,173,453 | | | | - | | | | - | | | | 61,185,174 | | | | 56,267,388 | |
Current tax assets | | | 431,522 | | | | 451,991 | | | | 2,477,562 | | | | 1,872,593 | | | | 9,045,986 | | | | 6,934,552 | | | | - | | | | - | | | | 6,792 | | | | 37,273 | | | | - | | | | - | | | | 11,961,862 | | | | 9,296,409 | |
| | | | | | | | | | | | | | | | | | | | | | | | | | | | | | | | | | | | | | | | | | | | | | | | | | | | | | | | |
Non-current assets or disposal groups held for sale or held for distribution to owners | | | 1,049,434,069 | | | | - | | | | - | | | | - | | | | - | | | | - | | | | - | | | | - | | | | - | | | | - | | | | (1,964) | | | | - | | | | 1,049,432,105 | | | | - | |
| | | | | | | | | | | | | | | | | | | | | | | | | | | | | | | | | | | | | | | | | | | | | | | | | | | | | | | | |
NON-CURRENT ASSETS | | | 462,047,875 | | | | 1,240,468,968 | | | | 443,412,233 | | | | 405,106,897 | | | | 1,662,603,605 | | | | 1,871,949,977 | | | | 847,774,289 | | | | 928,936,117 | | | | 675,858,105 | | | | 587,886,652 | | | | - | | | | - | | | | 4,091,696,107 | | | | 5,034,348,611 | |
Other non-current financial assets | | | - | | | | 30,619 | | | | 21,751 | | | | 42,005 | | | | 488,858,930 | | | | 496,441,092 | | | | 3,620 | | | | 6,687 | | | | - | | | | - | | | | - | | | | - | | | | 488,884,301 | | | | 496,520,403 | |
Other non-current non-financial assets | | | - | | | | 188,157 | | | | 326,850 | | | | 427,860 | | | | 52,122,099 | | | | 58,185,573 | | | | 2,292,399 | | | | 2,568,364 | | | | - | | | | - | | | | - | | | | - | | | | 54,741,348 | | | | 61,369,954 | |
Trade and other non-current receivables | | | - | | | | 7,364,933 | | | | 6,208,472 | | | | 1,294,740 | | | | 74,095,449 | | | | 88,314,071 | | | | 7,875,015 | | | | 9,132,062 | | | | - | | | | - | | | | - | | | | - | | | | 88,178,936 | | | | 106,105,806 | |
Non-current accounts receivable from related companies | | | - | | | | - | | | | 355,485 | | | | 486,605 | | | | - | | | | - | | | | - | | | | - | | | | - | | | | - | | | | - | | | | - | | | | 355,485 | | | | 486,605 | |
Investments accounted for using the equity method | | | 462,006,979 | | | | 541,582,223 | | | | 15,027 | | | | 19,612 | | | | - | | | | - | | | | 29,497,710 | | | | 32,798,603 | | | | - | | | | - | | | | - | | | | - | | | | 491,519,716 | | | | 574,400,438 | |
Intangible assets other than goodwill | | | - | | | | 14,613,951 | | | | 1,856,386 | | | | 2,463,635 | | | | 905,374,088 | | | | 1,055,986,162 | | | | 16,427,134 | | | | 17,651,975 | | | | 9,826,406 | | | | 6,385,114 | | | | - | | | | - | | | | 933,484,014 | | | | 1,097,100,837 | |
Goodwill | | | - | | | | 2,240,478 | | | | - | | | | - | | | | 76,703,162 | | | | 97,979,622 | | | | - | | | | - | | | | - | | | | - | | | | - | | | | - | | | | 76,703,162 | | | | 100,220,100 | |
Property, plant and equipment | | | - | | | | 674,156,509 | | | | 434,628,262 | | | | 400,372,440 | | | | 20,960,307 | | | | 24,072,231 | | | | 784,307,032 | | | | 842,119,957 | | | | 666,031,699 | | | | 581,501,538 | | | | - | | | | - | | | | 1,905,927,300 | | | | 2,522,222,675 | |
Investment property | | | - | | | | - | | | | - | | | | - | | | | - | | | | - | | | | - | | | | - | | | | - | | | | - | | | | - | | | | - | | | | - | | | | - | |
Deferred tax assets | | | 40,896 | | | | 292,098 | | | | - | | | | - | | | | 44,489,570 | | | | 50,971,226 | | | | 7,371,379 | | | | 24,658,469 | | | | - | | | | - | | | | - | | | | - | | | | 51,901,845 | | | | 75,921,793 | |
| | | | | | | | | | | | | | | | | | | | | | | | | | | | | | | | | | | | | | | | | | | | | | | | | | | | | | | | |
TOTAL ASSETS | | | 1,531,004,808 | | | | 1,541,234,585 | | | | 634,853,693 | | | | 814,216,073 | | | | 2,315,945,976 | | | | 2,460,970,620 | | | | 1,055,327,964 | | | | 1,183,232,390 | | | | 792,229,768 | | | | 730,818,485 | | | | (4,417,595) | | | | (13,369,202) | | | | 6,324,944,614 | | | | 6,717,102,951 | |
| | | | | | | | | | | | | | | | | | | | | | | | | | | | | | | | | | | | | | | | | | | | | | | | | | | | | | | | |
| | | Distribution | |
| Country | | Chile | | | Argentina | | | Brazil | | | Colombia | | | Peru | | | Eliminations | | | Total | |
| LIABILITIES AND EQUITY | | 12-31-2015 | | | 12-31-2014 | | | 12-31-2015 | | | 12-31-2014 | | | 12-31-2015 | | | 12-31-2014 | | | 12-31-2015 | | | 12-31-2014 | | | 12-31-2015 | | | 12-31-2014 | | | 12-31-2015 | | | 12-31-2014 | | | 12-31-2015 | | | 12-31-2014 | |
| | | ThCh$ | | | ThCh$ | | | ThCh$ | | | ThCh$ | | | ThCh$ | | | ThCh$ | | | ThCh$ | | | ThCh$ | | | ThCh$ | | | ThCh$ | | | ThCh$ | | | ThCh$ | | | ThCh$ | | | ThCh$ | |
| CURRENT LIABILITIES | | | 418,047,564 | | | | 244,981,388 | | | | 431,630,046 | | | | 739,412,769 | | | | 552,804,640 | | | | 382,669,070 | | | | 247,749,856 | | | | 337,839,518 | | | | 192,540,953 | | | | 165,061,350 | | | | (4,417,595) | | | | (13,369,202) | | | | 1,838,355,464 | | | | 1,856,594,893 | |
Other current financial liabilities | | | 92,682 | | | | 133 | | | | 526,559 | | | | 6,842,312 | | | | 134,704,079 | | | | 78,327,002 | | | | 34,994,868 | | | | 1,910,613 | | | | 35,806,842 | | | | 32,472,313 | | | | - | | | | - | | | | 206,125,030 | | | | 119,552,373 | |
Trade and other current payables | | | 293,820 | | | | 117,620,794 | | | | 402,486,702 | | | | 670,451,782 | | | | 383,345,351 | | | | 278,869,512 | | | | 169,494,726 | | | | 233,909,354 | | | | 81,443,952 | | | | 102,523,673 | | | | - | | | | - | | | | 1,037,064,551 | | | | 1,403,375,115 | |
Current accounts payable to related companies | | | 636,116 | | | | 111,172,127 | | | | 1,192,017 | | | | 1,448,331 | | | | 32,611,195 | | | | 3,897,216 | | | | 16,017,544 | | | | 76,976,179 | | | | 26,092,527 | | | | 8,896,631 | | | | (4,417,595) | | | | (13,369,202) | | | | 72,131,804 | | | | 189,021,282 | |
Other current provisions | | | 3,595 | | | | 71,623 | | | | 27,424,768 | | | | 32,678,820 | | | | 2,144,014 | | | | 3,335,096 | | | | 5,380,567 | | | | 7,377,900 | | | | 10,926,878 | | | | 7,784,348 | | | | - | | | | - | | | | 45,879,822 | | | | 51,247,787 | |
Current tax liabilities | | | - | | | | 4,501,006 | | | | - | | | | - | | | | 1 | | | | 1 | | | | 21,428,954 | | | | 9,415,281 | | | | 2,737,460 | | | | 2,556,173 | | | | - | | | | - | | | | 24,166,415 | | | | 16,472,461 | |
Current provisions for employee benefits | | | - | | | | - | | | | - | | | | - | | | | - | | | | - | | | | - | | | | - | | | | - | | | | - | | | | - | | | | - | | | | - | | | | - | |
Other current non-financial liabilities | | | - | | | | 11,615,705 | | | | - | | | | 27,991,524 | | | | - | | | | 18,240,243 | | | | 433,197 | | | | 8,250,191 | | | | 35,533,294 | | | | 10,828,212 | | | | - | | | | - | | | | 35,966,491 | | | | 76,925,875 | |
| | | | | | | | | | | | | | | | | | | | | | | | | | | | | | | | | | | | | | | | | | | | | | | | | | | | | | | | |
Liabilities associated with groups of assets or disposal groups held for sale or distribution to owners | | | 417,021,351 | | | | - | | | | - | | | | - | | | | - | | | | - | | | | - | | | | - | | | | - | | | | - | | | | - | | | | - | | | | 417,021,351 | | | | - | |
| | | | | | | | | | | | | | | | | | | | | | | | | | | | | | | | | | | | | | | | | | | | | | | | | | | | | | | | |
| NON-CURRENT LIABILITIES | | | 299,654 | | | | 72,612,722 | | | | 174,966,573 | | | | 137,796,785 | | | | 832,749,665 | | | | 930,337,149 | | | | 281,940,695 | | | | 358,873,770 | | | | 269,823,997 | | | | 271,208,226 | | | | - | | | | - | | | | 1,559,780,584 | | | | 1,770,828,652 | |
Other non-current financial liabilities | | | - | | | | - | | | | - | | | | - | | | | 421,538,033 | | | | 625,423,679 | | | | 230,851,899 | | | | 299,710,462 | | | | 230,907,835 | | | | 228,481,670 | | | | - | | | | - | | | | 883,297,767 | | | | 1,153,615,811 | |
Trade and other non-current payables | | | - | | | | - | | | | 154,803,475 | | | | 120,497,550 | | | | 22,852,766 | | | | 35,029,135 | | | | - | | | | - | | | | 371,317 | | | | - | | | | - | | | | - | | | | 178,027,558 | | | | 155,526,685 | |
Non-current accounts payable to related companies | | | - | | | | - | | | | - | | | | - | | | | 157,179,286 | | | | - | | | | - | | | | - | | | | - | | | | - | | | | - | | | | - | | | | 157,179,286 | | | | - | |
Other long-term provisions | | | - | | | | 2,808,816 | | | | 10,544,604 | | | | 8,468,074 | | | | 127,402,352 | | | | 147,154,456 | | | | 3,547,501 | | | | 3,635,352 | | | | 314,163 | | | | 241,630 | | | | - | | | | - | | | | 141,808,620 | | | | 162,308,328 | |
Deferred tax liabilities | | | - | | | | 23,042,447 | | | | - | | | | - | | | | - | | | | - | | | | - | | | | - | | | | 34,940,876 | | | | 38,817,394 | | | | - | | | | - | | | | 34,940,876 | | | | 61,859,841 | |
Non-current provisions for employee benefits | | | 299,654 | | | | 24,649,613 | | | | 9,618,494 | | | | 8,831,161 | | | | 103,777,228 | | | | 122,729,879 | | | | 47,541,295 | | | | 55,527,956 | | | | 1,887,226 | | | | 1,927,989 | | | | - | | | | - | | | | 163,123,897 | | | | 213,666,598 | |
Other non-current non-financial liabilities | | | - | | | | 22,111,846 | | | | - | | | | - | | | | - | | | | - | | | | - | | | | - | | | | 1,402,580 | | | | 1,739,543 | | | | - | | | | - | | | | 1,402,580 | | | | 23,851,389 | |
| | | | | | | | | | | | | | | | | | | | | | | | | | | | | | | | | | | | | | | | | | | | | | | | | | | | | | | | |
| EQUITY | | | 1,112,657,590 | | | | 1,223,640,475 | | | | 28,257,074 | | | | (62,993,481) | | | | 930,391,671 | | | | 1,147,964,401 | | | | 525,637,413 | | | | 486,519,102 | | | | 329,864,818 | | | | 294,548,909 | | | | - | | | | - | | | | 2,926,808,566 | | | | 3,089,679,406 | |
| Equity attributable to shareholders of Enersis Américas | | | 1,112,657,590 | | | | 1,223,640,475 | | | | 28,257,074 | | | | (62,993,481) | | | | 930,391,671 | | | | 1,147,964,401 | | | | 525,637,413 | | | | 486,519,102 | | | | 329,864,818 | | | | 294,548,909 | | | | - | | | | - | | | | 2,926,808,566 | | | | 3,089,679,406 | |
Issued capital | | | 367,928,682 | | | | 367,928,682 | | | | 47,061,353 | | | | 61,605,286 | | | | 312,041,595 | | | | 398,597,876 | | | | 2,953,410 | | | | 3,367,331 | | | | 130,666,525 | | | | 40,732,177 | | | | - | | | | - | | | | 860,651,565 | | | | 872,231,352 | |
Retained earnings | | | 1,225,045,537 | | | | 1,227,190,356 | | | | (20,697,376) | | | | (127,076,910) | | | | 82,104,937 | | | | 135,984,405 | | | | 104,750,330 | | | | 34,989,277 | | | | 23,507,886 | | | | 113,007,763 | | | | - | | | | - | | | | 1,414,711,314 | | | | 1,384,094,891 | |
Share premium | | | 566,302 | | | | 566,302 | | | | - | | | | - | | | | - | | | | - | | | | 2,981,182 | | | | 3,398,995 | | | | - | | | | - | | | | - | | | | - | | | | 3,547,484 | | | | 3,965,297 | |
Other reserves | | | (480,882,931) | | | | (372,044,865) | | | | 1,893,097 | | | | 2,478,143 | | | | 536,245,139 | | | | 613,382,120 | | | | 414,952,491 | | | | 444,763,499 | | | | 175,690,407 | | | | 140,808,969 | | | | - | | | | - | | | | 647,898,203 | | | | 829,387,866 | |
| | | | | | | | | | | | | | | | | | | | | | | | | | | | | | | | | | | | | | | | | | | | | | | | | | | | | | | | |
| Total Liabilities and Equity | | | 1,531,004,808 | | | | 1,541,234,585 | | | | 634,853,693 | | | | 814,216,073 | | | | 2,315,945,976 | | | | 2,460,970,620 | | | | 1,055,327,964 | | | | 1,183,232,390 | | | | 792,229,768 | | | | 730,818,485 | | | | (4,417,595) | | | | (13,369,202) | | | | 6,324,944,614 | | | | 6,717,102,951 | |
The eliminations column corresponds to transactions between companies in different lines of business and country, primarily purchases and sales of energy and services.
| | |
| The accompanying notes are an integral part of these consolidated financial statements | | |
|
| F-139 |
| | | | | | | | | | | | | | | | | | | | | | | | | | | | | | | | | | | | | | | | | | | | | | | | | | | | | | | | | | | | | | | | | | | | | | | | | | | | | | | | | | | | |
| Line of Business | | Distribución | | | | |
| Country | | Chile | | | Argentina | | | Brazil | | | Colombia | | | | | | Peru | | | | | | Eliminations | | | Total | |
| STATEMENT OF COMPREHENSIVE INCOME | | 12-31-2015 ThCh$ | | | 12-31-2014 ThCh$ | | | 12-31-2013 ThCh$ | | | 12-31-2015 ThCh$ | | | 12-31-2014 ThCh$ | | | 12-31-2013 ThCh$ | | | 12-31-2015 ThCh$ | | | 12-31-2014 ThCh$ | | | 12-31-2013 ThCh$ | | | 12-31-2015 ThCh$ | | | 12-31-2014 ThCh$ | | | 12-31-2013 ThCh$ | | | 12-31-2015 ThCh$ | | | 12-31-2014 ThCh$ | | | 12-31-2013 ThCh$ | | | 12-31-2015 ThCh$ | | | 12-31-2014 ThCh$ | | | 12-31-2013 ThCh$ | | | 12-31-2015 ThCh$ | | | 12-31-2014 ThCh$ | | | 12-31-2013 ThCh$ | |
| REVENUES AND OTHER OPERATING INCOME | | | - | | | | - | | | | - | | | | 607,344,916 | | | | 371,411,786 | | | | 528,653,053 | | | | 1,836,864,322 | | | | 1,969,226,185 | | | | 1,634,111,790 | | | | 884,467,266 | | | | 982,770,698 | | | | 852,780,069 | | | | 562,046,426 | | | | 478,699,891 | | | | 413,911,453 | | | | - | | | | - | | | | - | | | | 3,890,722,930 | | | | 3,802,108,560 | | | | 3,429,456,365 | |
Revenues | | | - | | | | - | | | | - | | | | 278,475,279 | | | | 222,534,863 | | | | 268,473,425 | | | | 1,606,176,000 | | | | 1,784,233,025 | | | | 1,462,498,140 | | | | 876,948,863 | | | | 980,294,259 | | | | 815,252,120 | | | | 559,556,527 | | | | 476,564,658 | | | | 395,765,288 | | | | - | | | | - | | | | - | | | | 3,321,156,669 | | | | 3,463,626,805 | | | | 2,941,988,973 | |
Energy sales | | | - | | | | - | | | | - | | | | 261,053,382 | | | | 204,714,773 | | | | 252,621,412 | | | | 1,509,823,358 | | | | 1,696,855,326 | | | | 1,388,685,125 | | | | 723,092,894 | | | | 808,454,612 | | | | 697,374,115 | | | | 528,051,398 | | | | 447,642,884 | | | | 370,947,952 | | | | - | | | | - | | | | - | | | | 3,022,021,032 | | | | 3,157,667,595 | | | | 2,709,628,604 | |
Other sales | | | - | | | | - | | | | - | | | | 460,133 | | | | 523,507 | | | | 361,681 | | | | 16,073,260 | | | | 16,820,481 | | | | - | | | | 217,554 | | | | 15,149 | | | | 3,280,645 | | | | 2,772,195 | | | | 3,781,787 | | | | 6,136 | | | | - | | | | - | | | | - | | | | 19,523,142 | | | | 21,140,924 | | | | 3,648,462 | |
Other services rendered | | | - | | | | - | | | | - | | | | 16,961,764 | | | | 17,296,583 | | | | 15,490,332 | | | | 80,279,382 | | | | 70,557,218 | | | | 73,813,015 | | | | 153,638,415 | | | | 171,824,498 | | | | 114,597,360 | | | | 28,732,934 | | | | 25,139,987 | | | | 24,811,200 | | | | - | | | | - | | | | - | | | | 279,612,495 | | | | 284,818,286 | | | | 228,711,907 | |
Other operating income | | | - | | | | - | | | | - | | | | 328,869,637 | | | | 148,876,923 | | | | 260,179,628 | | | | 230,688,322 | | | | 184,993,160 | | | | 171,613,650 | | | | 7,518,403 | | | | 2,476,439 | | | | 37,527,949 | | | | 2,489,899 | | | | 2,135,233 | | | | 18,146,165 | | | | - | | | | - | | | | - | | | | 569,566,261 | | | | 338,481,755 | | | | 487,467,392 | |
| | | | | | | | | | | | | | | | | | | | | | | | | | | | | | | | | | | | | | | | | | | | | | | | | | | | | | | | | | | | | | | | | | | | | | | | | | | | | | | | | | | | | |
| RAW MATERIALS AND CONSUMABLES USED | | | - | | | | - | | | | - | | | | (157,387,237) | | | | (161,995,240) | | | | (169,802,328) | | | | (1,386,390,872) | | | | (1,313,723,580) | | | | (1,060,194,360) | | | | (500,570,712) | | | | (547,593,754) | | | | (464,474,672) | | | | (379,015,102) | | | | (315,115,521) | | | | (266,450,403) | | | | - | | | | - | | | | - | | | | (2,423,363,923) | | | | (2,338,428,095) | | | | (1,960,921,763) | |
Energy purchases | | | - | | | | - | | | | - | | | | (155,612,243) | | | | (160,940,088) | | | | (168,486,826) | | | | (1,068,487,043) | | | | (1,029,857,439) | | | | (686,576,752) | | | | (375,946,940) | | | | (416,564,592) | | | | (349,818,265) | | | | (351,596,619) | | | | (292,686,474) | | | | (241,896,637) | | | | - | | | | - | | | | - | | | | (1,951,642,845) | | | | (1,900,048,593) | | | | (1,446,778,480) | |
Fuel consumption | | | - | | | | - | | | | - | | | | - | | | | - | | | | - | | | | - | | | | - | | | | - | | | | - | | | | - | | | | - | | | | - | | | | - | | | | - | | | | - | | | | - | | | | - | | | | - | | | | - | | | | - | |
Transportation expenses | | | - | | | | - | | | | - | | | | (720,575) | | | | (1,055,152) | | | | (1,194,862) | | | | (63,516,659) | | | | (78,999,828) | | | | (64,041,259) | | | | (82,836,069) | | | | (88,136,414) | | | | (78,964,131) | | | | - | | | | - | | | | - | | | | - | | | | - | | | | - | | | | (147,073,303) | | | | (168,191,394) | | | | (144,200,252) | |
Other miscellaneous supplies and services | | | - | | | | - | | | | - | | | | (1,054,419) | | | | - | | | | (120,640) | | | | (254,387,170) | | | | (204,866,313) | | | | (309,576,349) | | | | (41,787,703) | | | | (42,892,748) | | | | (35,692,276) | | | | (27,418,483) | | | | (22,429,047) | | | | (24,553,766) | | | | - | | | | - | | | | - | | | | (324,647,775) | | | | (270,188,108) | | | | (369,943,031) | |
| | | | | | | | | | | | | | | | | | | | | | | | | | | | | | | | | | | | | | | | | | | | | | | | | | | | | | | | | | | | | | | | | | | | | | | | | | | | | | | | | | | | | |
| CONTRIBUTION MARGIN | | | - | | | | - | | | | - | | | | 449,957,679 | | | | 209,416,546 | | | | 358,850,725 | | | | 450,473,450 | | | | 655,502,605 | | | | 573,917,430 | | | | 383,896,554 | | | | 435,176,944 | | | | 388,305,397 | | | | 183,031,324 | | | | 163,584,370 | | | | 147,461,050 | | | | - | | | | - | | | | - | | | | 1,467,359,007 | | | | 1,463,680,465 | | | | 1,468,534,602 | |
| | | | | | | | | | | | | | | | | | | | | | | | | | | | | | | | | | | | | | | | | | | | | | | | | | | | | | | | | | | | | | | | | | | | | | | | | | | | | | | | | | | | |
Other work performed by the entity and capitalized | | | - | | | | - | | | | - | | | | 34,701,198 | | | | 23,153,744 | | | | 18,108,177 | | | | 9,135,951 | | | | 11,202,763 | | | | 13,079,321 | | | | 4,448,164 | | | | 4,446,424 | | | | 3,809,445 | | | | 4,282,006 | | | | 3,300,324 | | | | 2,798,463 | | | | - | | | | - | | | | - | | | | 52,567,319 | | | | 42,103,255 | | | | 37,795,406 | |
Employee benefits expense | | | (371,072) | | | | (254,169) | | | | (233,845) | | | | (226,741,261) | | | | (142,343,373) | | | | (121,588,649) | | | | (79,431,903) | | | | (83,882,323) | | | | (80,791,303) | | | | (36,740,363) | | | | (35,616,518) | | | | (33,308,955) | | | | (22,398,764) | | | | (21,542,237) | | | | (20,112,810) | | | | - | | | | - | | | | - | | | | (365,683,363) | | | | (283,638,620) | | | | (256,035,562) | |
Other expenses | | | (1,012,453) | | | | (995,041) | | | | (947,801) | | | | (138,623,389) | | | | (128,124,044) | | | | (118,511,278) | | | | (150,045,257) | | | | (154,016,112) | | | | (135,153,017) | | | | (56,460,916) | | | | (67,631,351) | | | | (55,855,565) | | | | (26,536,628) | | | | (26,098,988) | | | | (21,220,123) | | | | - | | | | - | | | | - | | | | (372,678,643) | | | | (376,865,536) | | | | (331,687,784) | |
| | | | | | | | | | | | | | | | | | | | | | | | | | | | | | | | | | | | | | | | | | | | | | | | | | | | | | | | | | | | | | | | | | | | | | | | | | | | | | | | | | | | | |
| GROSS OPERATING RESULT | | | (1,383,525) | | | | (1,249,210) | | | | (1,181,646) | | | | 119,294,227 | | | | (37,897,127) | | | | 136,858,975 | | | | 230,132,241 | | | | 428,806,933 | | | | 371,052,431 | | | | 295,143,439 | | | | 336,375,499 | | | | 302,950,322 | | | | 138,377,938 | | | | 119,243,469 | | | | 108,926,580 | | | | - | | | | - | | | | - | | | | 781,564,320 | | | | 845,279,564 | | | | 918,606,662 | |
| | | | | | | | | | | | | | | | | | | | | | | | | | | | | | | | | | | | | | | | | | | | | | | | | | | | | | | | | | | | | | | | | | | | | | | | | | | | | | | | | | | | | |
Depreciation and amortization expense | | | - | | | | - | | | | - | | | | (13,229,654) | | | | (10,772,411) | | | | (12,909,107) | | | | (71,857,411) | | | | (99,250,848) | | | | (86,883,098) | | | | (59,475,177) | | | | (71,998,972) | | | | (61,825,005) | | | | (29,074,143) | | | | (26,510,068) | | | | (24,005,738) | | | | - | | | | - | | | | - | | | | (173,636,385) | | | | (208,532,299) | | | | (185,622,948) | |
Impairment losses (reversal of impairment losses) recognized in profit or loss | | | - | | | | - | | | | - | | | | (2,289,187) | | | | (2,559,659) | | | | (1,951,710) | | | | (30,940,802) | | | | (28,330,530) | | | | (50,553,285) | | | | (80,720) | | | | (2,401,454) | | | | (236,860) | | | | (1,598,702) | | | | (1,747,322) | | | | (816,132) | | | | - | | | | - | | | | - | | | | (34,909,411) | | | | (35,038,965) | | | | (53,557,987) | |
| | | | | | | | | | | | | | | | | | | | | | | | | | | | | | | | | | | | | | | | | | | | | | | | | | | | | | | | | | | | | | | | | | | | | | | | | | | | | | | | | | | | | |
| OPERATING INCOME | | | (1,383,525) | | | | (1,249,210) | | | | (1,181,646) | | | | 103,775,386 | | | | (51,229,197) | | | | 121,998,158 | | | | 127,334,028 | | | | 301,225,555 | | | | 233,616,048 | | | | 235,587,542 | | | | 261,975,073 | | | | 240,888,457 | | | | 107,705,093 | | | | 90,986,079 | | | | 84,104,710 | | | | - | | | | - | | | | - | | | | 573,018,524 | | | | 601,708,300 | | | | 679,425,727 | |
| | | | | | | | | | | | | | | | | | | | | | | | | | | | | | | | | | | | | | | | | | | | | | | | | | | | | | | | | | | | | | | | | | | | | | | | | | | | | | | | | | | | | |
| FINANCIAL RESULT | | | (1,116,601) | | | | (3,304,228) | | | | (577,524) | | | | (3,942,519) | | | | (38,408,032) | | | | (13,178,990) | | | | (48,588,988) | | | | (174,878,226) | | | | (2,582,536) | | | | (27,459,741) | | | | (26,624,088) | | | | (23,123,001) | | | | (16,772,560) | | | | (11,494,113) | | | | (14,976,086) | | | | - | | | | 2,000,172 | | | | (53,882) | | | | (97,880,409) | | | | (252,708,515) | | | | (54,492,019) | |
Financial income | | | 236,600 | | | | 2,780 | | | | 9,491 | | | | 65,153,401 | | | | 28,970,378 | | | | 32,944,854 | | | | 102,075,187 | | | | 45,864,512 | | | | 110,285,525 | | | | 6,745,819 | | | | 7,242,116 | | | | 7,279,595 | | | | 3,221,357 | | | | 2,830,626 | | | | 2,340,150 | | | | - | | | | - | | | | - | | | | 177,432,364 | | | | 84,910,412 | | | | 152,859,615 | |
Cash and cash equivalents | | | 236,600 | | | | 2,780 | | | | 9,491 | | | | 1,303,146 | | | | 532,645 | | | | 493,354 | | | | 2,924,921 | | | | 9,641,862 | | | | 10,746,703 | | | | 3,452,375 | | | | 3,377,089 | | | | 3,705,481 | | | | 892,016 | | | | 1,063,623 | | | | 493,944 | | | | - | | | | - | | | | - | | | | 8,809,058 | | | | 14,617,999 | | | | 15,448,973 | |
Other Financial income | | | - | | | | - | | | | - | | | | 63,850,255 | | | | 28,437,733 | | | | 32,451,500 | | | | 99,150,266 | | | | 36,222,650 | | | | 99,538,822 | | | | 3,293,444 | | | | 3,865,027 | | | | 3,574,114 | | | | 2,329,341 | | | | 1,767,003 | | | | 1,846,206 | | | | - | | | | - | | | | - | | | | 168,623,306 | | | | 70,292,413 | | | | 137,410,642 | |
Financial costs | | | (475,563) | | | | (16,277) | | | | (17,365) | | | | (70,851,224) | | | | (66,547,390) | | | | (45,795,956) | | | | (150,058,877) | | | | (221,272,601) | | | | (113,177,408) | | | | (34,773,430) | | | | (33,912,253) | | | | (30,335,481) | | | | (19,294,082) | | | | (14,065,160) | | | | (16,965,296) | | | | - | | | | - | | | | - | | | | (275,453,176) | | | | (335,813,681) | | | | (206,291,506) | |
Bank borrowings | | | (974) | | | | - | | | | - | | | | (5,338,424) | | | | (3,001,623) | | | | (4,858,103) | | | | (17,467,056) | | | | (7,139,131) | | | | (2,131,807) | | | | - | | | | (91,262) | | | | - | | | | 892,016 | | | | (1,433,806) | | | | (1,582,598) | | | | - | | | | - | | | | - | | | | (21,914,438) | | | | (11,665,822) | | | | (8,572,508) | |
Secured and unsecured obligations | | | - | | | | - | | | | - | | | | - | | | | - | | | | - | | | | (49,470,132) | | | | (43,100,513) | | | | (38,857,338) | | | | (26,704,160) | | | | (24,014,571) | | | | (20,372,526) | | | | - | | | | (13,458,940) | | | | (9,580,529) | | | | - | | | | - | | | | - | | | | (76,174,292) | | | | (80,574,024) | | | | (68,810,393) | |
Other | | | (474,589) | | | | (16,277) | | | | (17,365) | | | | (65,512,800) | | | | (63,545,767) | | | | (40,937,853) | | | | (83,121,689) | | | | (171,032,957) | | | | (72,188,263) | | | | (8,069,270) | | | | (9,806,420) | | | | (9,962,955) | | | | (20,186,098) | | | | 827,586 | | | | (5,802,169) | | | | - | | | | - | | | | - | | | | (177,364,446) | | | | (243,573,835) | | | | (128,908,605) | |
Results from indexed assets and liabilities | | | 1,240 | | | | 1,579 | | | | - | | | | - | | | | - | | | | - | | | | - | | | | - | | | | - | | | | - | | | | - | | | | - | | | | - | | | | - | | | | - | | | | - | | | | - | | | | - | | | | 1,240 | | | | 1,579 | | | | - | |
Foreign currency exchange differences | | | (878,878) | | | | (3,292,310) | | | | (569,650) | | | | 1,755,304 | | | | (831,020) | | | | (327,888) | | | | (605,298) | | | | 529,863 | | | | 309,347 | | | | 567,870 | | | | 46,049 | | | | (67,115) | | | | (699,835) | | | | (259,579) | | | | (350,940) | | | | - | | | | 2,000,172 | | | | (53,882) | | | | 139,163 | | | | (1,806,825) | | | | (1,060,128) | |
Positive | | | 1,475,580 | | | | 2,252,973 | | | | 1,908,006 | | | | 4,114,836 | | | | 728,964 | | | | 742,128 | | | | 1,794,515 | | | | 833,954 | | | | 422,873 | | | | 1,558,367 | | | | 347,721 | | | | 103,323 | | | | 976,614 | | | | 775,194 | | | | 804,523 | | | | (382,438) | | | | (635,440) | | | | (600,000) | | | | 9,537,474 | | | | 4,303,366 | | | | 3,380,853 | |
Negative | | | (2,354,458) | | | | (5,545,283) | | | | (2,477,656) | | | | (2,359,532) | | | | (1,559,984) | | | | (1,070,016) | | | | (2,399,813) | | | | (304,091) | | | | (113,526) | | | | (990,497) | | | | (301,672) | | | | (170,438) | | | | (1,676,449) | | | | (1,034,773) | | | | (1,155,463) | | | | 382,438 | | | | 2,635,612 | | | | 546,118 | | | | (9,398,311) | | | | (6,110,191) | | | | (4,440,981) | |
| | | | | | | | | | | | | | | | | | | | | | | | | | | | | | | | | | | | | | | | | | | | | | | | | | | | | | | | | | | | | | | | | | | | | | | | | | | | | | | | | | | | | |
Share of profit of associates accounted for using the equity method | | | - | | | | - | | | | - | | | | 34,434 | | | | 34,721 | | | | 42,232 | | | | - | | | | - | | | | - | | | | 752,622 | | | | 2,561,039 | | | | 932,917 | | | | - | | | | - | | | | - | | | | - | | | | - | | | | - | | | | 787,056 | | | | 2,595,760 | | | | 975,149 | |
Other gains (losses) | | | - | | | | - | | | | - | | | | 113,216 | | | | - | | | | - | | | | (6,758,695) | | | | - | | | | 2,761,811 | | | | (128,486) | | | | 46,514 | | | | 70,773 | | | | 602,594 | | | | 31,910 | | | | 905,210 | | | | - | | | | - | | | | - | | | | (6,171,371) | | | | 78,424 | | | | 3,737,794 | |
Gain (loss) from other investments | | | - | | | | - | | | | - | | | | - | | | | - | | | | - | | | | - | | | | - | | | | - | | | | - | | | | - | | | | - | | | | - | | | | - | | | | - | | | | - | | | | - | | | | - | | | | - | | | | - | | | | - | |
Gain (loss) from the sale of property, plant and equipment | | | - | | | | - | | | | - | | | | 113,216 | | | | - | | | | - | | | | (6,758,695) | | | | - | | | | 2,761,811 | | | | (128,486) | | | | 46,514 | | | | 70,773 | | | | 602,594 | | | | 31,910 | | | | 905,210 | | | | - | | | | - | | | | - | | | | (6,171,371) | | | | 78,424 | | | | 3,737,794 | |
| | | | | | | | | | | | | | | | | | | | | | | | | | | | | | | | | | | | | | | | | | | | | | | | | | | | | | | | | | | | | | | | | | | | | | | | | | | | | | | | | | | | | |
| Income before tax | | | (2,500,126) | | | | (4,553,438) | | | | (1,759,170) | | | | 99,980,517 | | | | (89,602,508) | | | | 108,861,400 | | | | 71,986,345 | | | | 126,347,329 | | | | 233,795,323 | | | | 208,751,937 | | | | 237,958,538 | | | | 218,769,146 | | | | 91,535,127 | | | | 79,523,876 | | | | 70,033,834 | | | | - | | | | 2,000,172 | | | | (53,882) | | | | 469,753,800 | | | | 351,673,969 | | | | 629,646,651 | |
| | | | | | | | | | | | | | | | | | | | | | | | | | | | | | | | | | | | | | | | | | | | | | | | | | | | | | | | | | | | | | | | | | | | | | | | | | | | | | | | | | | | | |
Income tax | | | (11,228,559) | | | | (7,668,386) | | | | (4,503,199) | | | | (463,471) | | | | 3,792,056 | | | | (10,685,347) | | | | (10,849,463) | | | | (18,559,097) | | | | (66,562,048) | | | | (84,883,204) | | | | (82,240,147) | | | | (75,302,320) | | | | (27,924,718) | | | | (19,790,239) | | | | (19,520,534) | | | | - | | | | - | | | | - | | | | (135,349,415) | | | | (124,465,813) | | | | (176,573,448) | |
| | | | | | | | | | | | | | | | | | | | | | | | | | | | | | | | | | | | | | | | | | | | | | | | | | | | | | | | | | | | | | | | | | | | | | | | | | | | | | | | | | | | | |
Net income attributable to: | | | (13,728,685) | | | | (12,221,824) | | | | (6,262,369) | | | | 99,517,046 | | | | (85,810,452) | | | | 98,176,053 | | | | 61,136,882 | | | | 107,788,232 | | | | 167,233,275 | | | | 123,868,733 | | | | 155,718,391 | | | | 143,466,826 | | | | 63,610,409 | | | | 59,733,637 | | | | 50,513,300 | | | | - | | | | 2,000,172 | | | | (53,882) | | | | 334,404,385 | | | | 227,208,156 | | | | 453,073,203 | |
Shareholders of Enersis Américas | | | 139,672,809 | | | | 125,385,213 | | | | 114,054,872 | | | | - | | | | - | | | | | | | | - | | | | - | | | | | | | | - | | | | - | | | | | | | | - | | | | | | | | | | | | - | | | | - | | | | | | | | 139,672,809 | | | | 125,385,213 | | | | 114,054,872 | |
Non-controlling interests | | | 125,944,124 | | | | 113,163,389 | | | | 107,792,503 | | | | 99,517,046 | | | | (85,810,452) | | | | 98,176,053 | | | | 61,136,882 | | | | 107,788,232 | | | | 167,233,275 | | | | 123,868,733 | | | | 155,718,391 | | | | 143,466,826 | | | | 63,610,409 | | | | 59,733,637 | | | | 50,513,300 | | | | - | | | | 2,000,172 | | | | (53,882) | | | | 474,077,194 | | | | 352,593,369 | | | | 567,128,075 | |
| | | | | | | | | | | | | | | | | | | | | | | | | | | | | | | | | | | | | | | | | | | | | | | | | | | | | | | | | | | | | | | | | | | | | | | | | | | | | | | | | | | | | |
| Country | | Chile | | | Argentina | | | Brazil | | | Colombia | | | | | | Peru | | | | | | Eliminations | | | Total (*) | |
| STATEMENT OF CASH FLOW | | 12-31-2015 ThCh$ | | | 12-31-2014 ThCh$ | | | 12-31-2013 ThCh$ | | | 12-31-2015 ThCh$ | | | 12-31-2014 ThCh$ | | | 12-31-2013 ThCh$ | | | 12-31-2015 ThCh$ | | | 12-31-2014 ThCh$ | | | 12-31-2013 ThCh$ | | | 12-31-2015 ThCh$ | | | 12-31-2014 ThCh$ | | | 12-31-2013 ThCh$ | | | 12-31-2015 ThCh$ | | | 12-31-2014 ThCh$ | | | 12-31-2013 ThCh$ | | | 12-31-2015 ThCh$ | | | 12-31-2014 ThCh$ | | | 12-31-2013 ThCh$ | | | 12-31-2015 ThCh$ | | | 12-31-2014 ThCh$ | | | 12-31-2013 ThCh$ | |
| | | | | | | | | | | | | | | | | | | | | | | | | | | | | | | | | | | | | | | | | | | | | | | | | | | | | | | | | | | | | | | | | | | | | | | | | | | | | | | | | | | | | |
Cash flow from (used in) operating activities | | | 192,068,742 | | | | 36,094,225 | | | | 136,491,828 | | | | 243,657,253 | | | | 188,056,795 | | | | 148,438,912 | | | | 165,632,490 | | | | 243,585,176 | | | | 286,604,054 | | | | 235,309,844 | | | | 218,066,750 | | | | 204,679,719 | | | | 109,115,394 | | | | 83,447,069 | | | | 79,288,813 | | | | (184,396) | | | | 91,870 | | | | 32,942 | | | | 945,599,327 | | | | 769,341,885 | | | | 855,536,268 | |
Cash flow from (used in) investment activities | | | (64,199,658) | | | | 13,004,063 | | | | (25,261,494) | | | | (208,791,432) | | | | (180,592,386) | | | | (126,534,530) | | | | (269,722,111) | | | | (239,357,913) | | | | (152,257,499) | | | | (112,561,292) | | | | (16,909,564) | | | | (103,377,146) | | | | (114,212,151) | | | | (57,451,165) | | | | (60,260,217) | | | | (17,922,661) | | | | (32,662,053) | | | | (20,661,272) | | | | (787,409,305) | | | | (513,969,018) | | | | (488,352,158) | |
Cash flows from (used in) financing activities | | | (106,554,830) | | | | (64,578,477) | | | | (95,280,198) | | | | (8,169,660) | | | | (9,632,579) | | | | (18,504,534) | | | | 78,329,447 | | | | 623,587 | | | | (112,549,985) | | | | (165,636,704) | | | | (169,208,067) | | | | (115,866,665) | | | | (41,319,512) | | | | (10,068,877) | | | | (5,502,637) | | | | 18,107,057 | | | | 32,570,183 | | | | 20,628,331 | | | | (225,244,202) | | | | (220,294,230) | | | | (327,075,688) | |
(*) See Note 5.1.II.iv for cash flows related to discontinued operations
The eliminations column corresponds to transactions between companies in different lines of business and country, primarily purchases and sales of energy and services.
| | |
| The accompanying notes are an integral part of these consolidated financial statements | | |
|
| F-140 |
| 36. | THIRD PARTY GUARANTEES, OTHER CONTINGENT ASSETS AND LIABILITIES, AND OTHER COMMITMENTS. |
| | | | | | | | | | | | | | | | | | | | | | | | | | | | | | | | | | | | | | | | | | | | | | | | | | |
| Creditor | | Debtor | | Type | | Assets Committed | | | Balance Outstanding as of | | | Guarantees Released | |
| of | | | of | | Type | | Currency | | Carrying | | | |
| Guarantee | | Company | | Relationship | | Guarantee | | | | amount | | | Currency | | | 12-31-2015 | | | 12-31-2014 | | | 2015 | | | Assets | | | 2016 | | | Assets | | | 2017 | | | Assets | |
Mitsubishi | | Central Costanera | | Creditor | | Pledge | | Combined cycle plant | | ThCh$ | | | 10,804,894 | | | ThCh$ | | | | | 35,254,202 | | | | 73,177,119 | | | | - | | | | - | | | | - | | | | - | | | | - | | | | - | |
Credit Suisse First Boston | | Central Costanera | | Creditor | | Pledge | | Combined cycle plant | | ThCh$ | | | 3,098,134 | | | ThCh$ | | | | | 1,183,600 | | | | 3,033,750 | | | | - | | | | - | | | | - | | | | - | | | | - | | | | - | |
Citibank N.A. | | Endesa Argentina | | Creditor | | Pledge | | Cash deposit | | ThCh$ | | | 435,681 | | | ThCh$ | | | | | 435,681 | | | | 702,470 | | | | - | | | | - | | | | - | | | | - | | | | - | | | | - | |
Citibank N.A./Santander Rio | | Edesur | | Creditor | | Pledge | | Cash deposit | | ThCh$ | | | - | | | ThCh$ | | | | | - | | | | - | | | | - | | | | - | | | | - | | | | - | | | | - | | | | - | |
Deutsche Bank / Santander Benelux | | Enersis Américas S.A. | | Creditor | | Deposit account | | Deposit account | | ThCh$ | | | 11,930,477 | | | ThCh$ | | | | | 40,354,434 | | | | 50,509,024 | | | | - | | | | - | | | | - | | | | - | | | | - | | | | - | |
Various creditors | | Ampla S.A. | | Creditor | | Pledge on collection and
others | | Collection accounts | | ThCh$ | | | 13,927,500 | | | ThCh$ | | | | | 158,335,127 | | | | 161,031,458 | | | | - | | | | - | | | | - | | | | - | | | | - | | | | - | |
Various creditors | | Coelce S.A. | | Creditor | | Pledge on collection and
others | | Collection accounts | | ThCh$ | | | 8,536,202 | | | ThCh$ | | | | | 60,265,158 | | | | 77,294,260 | | | | - | | | | - | | | | - | | | | - | | | | - | | | | - | |
Banco Nacional de Desarrollo Económico y Social | | Cien | | Creditor | | Mortgage, pledge and
others | | Collection accounts | | ThCh$ | | | 130,927 | | | ThCh$ | | | | | 3,944,953 | | | | - | | | | - | | | | - | | | | - | | | | - | | | | - | | | | - | |
As of December 31, 2015, Enersis Américas S.A. had future energy purchase commitments amounting to ThCh$35,079,484,027, of which ThCh$24,532,787,202 corresponds to continuing operations (ThCh$33,344,231,316 as of December 31, 2014).
As of December 31, 2015 and 2014, there are no indirect guarantees.
| | |
| The accompanying notes are an integral part of these consolidated financial statements | | |
|
| F-141 |
36.3 Lawsuits and Arbitrations Proceedings
As of the date of these Consolidated Financial Statements, the most relevant litigation involving Enersis Américas and its subsidiaries are as follows:
a) Continuing Operations
1. Law 25,561 on Public Emergency and Reform to the Currency System, enacted on January 6, 2002 by the Argentine authorities, voided certain provisions of the concession agreement of Enersis Américas’ combined entity Edesur. Law 25,561 also required that utility concession agreements be renegotiated within a reasonable timeframe to adjust them to the new conditions. However, the failure to renegotiate Edesur’s concession agreement prompted Enersis Américas S.A. (former Enersis S.A.), Chilectra S.A. (now Chilectra Chile S.A.), Endesa Chile and Elesur S.A. (now part of Chilectra S.A.) (collectively, the “Claimants”) to file an arbitration petition in 2003 under the Treaty for the Promotion and Protection of Chilean-Argentine Investments before the International Center for Settlement of Investment Disputes (ICSID). The statement of claim principally requested that the ICSID declare the investment expropriated for an amount of US$1,306,875,960 (approximately ThCh$928,091,032), and sought compensation for the damages caused to the investment due to lack of fair and equitable treatment, in the amount of US$318,780,600 (approximately ThCh$226,385,231). The Claimants also seek, with respect to both claims, compounded annual interest of 6.9% per annum. The Claimants also claimed the sums resulting from the damages caused from July 1, 2004. Finally, the Claimants also demanded US$ 102,164,683 (approximately ThCh$72,553,271) for Elesur S.A. (now part of Chilectra S.A.) due to a lower price received on the sale of its shares. In 2005, the Argentine authorities and Edesur signed a Letter of Understanding, in which the terms and conditions are established for amendments and supplements to the concession agreement, forecasting tariff modifications, first during a transitional period and then under an Integral Tariff Review, in which the conditions for an ordinary tariff period of 5 years will be set. The arbitration has been suspended since March 2006 in accordance with the terms of the Letter of Understanding, and the appointment of one of the arbitrators, to replace an arbitrator who resigned in 2010 has been suspended. As of December 31, 2015, the parties informed ICSID of their agreement to extend the suspension of the arbitration procedure for 12 months starting on the same date, informing also that any of the parties can request the renewal of the arbitration procedure with 30 calendar days prior notice.
2. In Brazil, Basilus S/A Serviços, Empreendimentos e Participações (successor to Meridional S/A Serviços, Empreendimentos e Participações from 2008) is the holder of the litigation rights that it acquired from the construction companies Mistral and CIVEL, which had a civil works contract with Centrais Elétricas Fluminense S.A. (CELF). This contract was terminated before CELF’s privatization process. Since CELF’s assets were transferred to Ampla during the privatization process, Basilus (previously Meridional) sued Ampla in 1998, arguing that the transfer of the referred assets was done in detriment of its rights. Ampla only acquired assets from CELF, but is not its legal successor since CELF, a state-owned company, still exists and maintains its legal personality. Basilus demanded payment of pending invoices and contractual penalties for termination of the civil works contract. In March 2009, the court decided in favor of Basilus, and Ampla and the State of Río de Janeiro filed the corresponding appeals. On December 15, 2009, the State Court accepted the appeal and overturned the lower court’s decision obtained by Basilus, in Ampla’s favor. Basilus filed an appeal against the resolution, which was denied. In July 2010, Basilus filed an Appeal under Specific Court Regulations (Agravo Regimental) before the Superior Court of Justice of Brazil, which also rejected the appeal in August 2010. Seeking to overturn such decision, Basilus filed a Petition for Writ of Mandamus (Mandado de Seguranca), which was also rejected. In June 2011, Basilus filed an Appeal to Amendment of Judgment (Embargos de Declaração) in order to clarify a supposed omission by the Superior Court of Justice in the decision on the Petition for Writ of Mandamus, which was not accepted by the court. Against this decision, Basilus filed an Ordinary Appeal (Recurso Ordinario) before the Superior Court of Justice (in Brasilia). On March 28, 2012 the Reporting Justice decided the Ordinary Appeal in favor of Basilus. Ampla and the State of Río de Janeiro filed an Appeal under Specific Court Regulations against the Reporting Justice’s decision, which was accepted by the First Court Room of the Superior Court of Justice on August 28, 2012, determining that the Ordinary Appeal of the Petition for Writ of Mandamus must be submitted to the decision by an en banc session and not by a single Reporting Justice. Basilus challenged the decision. The decision of August 28, 2012 was published on December 10, 2012, and the Appeal to Amendment of Judgment had been filed by Ampla and the State of Río de Janeiro to remedy the existing error in its publication, in order to avoid future divergence. Basilus filed its arguments and on May 27, 2013, the Appeal to Amendment of Judgment filed by Ampla and the State of Río de Janeiro were accepted and the error corrected. On August 25, 2015, the appeal filed by Basilus was rejected. The decision was published on December 10, 2015, and Basilus filed an appeal to Amendment of Judgment, which is pending resolution. The amount involved in this proceeding is estimated to be approximately R$1,344 million (approximately ThCh$244,430,592).
| | |
| The accompanying notes are an integral part of these consolidated financial statements | | |
|
| F-142 |
3. The Trade Union of Niterói, representing 2,841 employees, filed a labor claim against Ampla, requesting the payment of salary differences of 26.05% retroactive to February 1989, pursuant to the Economic Plan instituted by Law Decree No. 2,335/87. In the court of first instance, the decision was partially unfavorable for Ampla. The court ordered payment of the salary differences requested retroactive to February 1, 1989, and legal fees of 15% of such amount. Ampla filed several appeals, among them an Extraordinary Appeal which is currently pending. A mandatory mediation was unsuccessful. In parallel, Ampla has filed a motion for Advanced Dismissal of Enforcement (Exceção de Pré-Executividade) based on the jurisprudence of the Federal Supreme Court, which has previously declared the non-existence of a right acquired on the URP readjustment of Law Decree No. 2,335/87. In addition, Ampla alleged the exception of the payment for these readjustments and, alternatively, requested the limitation of this readjustment using October 1989 salaries as a baseline. In the court of first instance, Ampla obtained the declaration of unenforceability of legal title, against which the applicant filed an appeal (Agravo de Petição). The decision was partly favorable regarding the exception of payment, but not regarding the limitation of the salary differences, using October 1989 salaries as a baseline. On September 10, 2014, the court rejected the Special Appeals (Agravo de Instrumento) presented by both parties, who filed a Petition for Clarification of the Decision (Embargos de Aclaración) against this judgment. In June 2015, Ampla presented its arguments to the Court regarding the Extraordinary Appeal filed by the Union, which were rejected by the Court. On December 16, 2015, the Extraordinary Appeal was submitted to the Federal Superior Court of Law for its judgment. The amount involved in this proceeding is estimated to be approximately R$63,678,286 (approximately ThCh$11,581,042).
4. Companhia Brasileira de Antibióticos (Cibran) filed suit against Ampla in order to receive compensation for the loss of products and raw materials, machinery breakdown, among other things that occurred as a consequence of poor service provided by Ampla between 1987 and May 1994 and compensation for moral damages. This litigation is related to other five actions filed by Cibran against Ampla based on power outages allegedly caused by Ampla in the period from 1987 to 1994, 1994 to 1999 and part of 2002. The judge decided to conduct a single expert assessment for these various claims, which was in part adverse to Ampla. Ampla challenged such assessment and requested a new expert assessment. On September 5, 2013, the judge rejected the prior petition, whereupon Ampla filed a Petition for Clarification of the Decision (Embargo de Aclaración) and subsequently a Special Appeal (Agravo de Instrumento), both of which were rejected by the court. Against the latter, Ampla filed a Special Appeal before the Superior Court of Justice, which is pending review. In September 2014, a first instance judgment in one of these proceedings ordered Ampla to pay compensation of R$ 200,000 (approximately ThCh$ 36,373) for moral damages, in addition to the payment of material damages caused due to failures in supply of service, which have to be assessed by an expert in the sentence execution stage. Ampla filed a Clarification Attachment against this ruling that was rejected. In December 2014, Ampla filed an appeal, currently pending decision. On June 1, 2015, a judgement in another of the proceedings ordered Ampla to pay moral damages of R$ 80,000 (approximately ThCh$14,534), in addition to material damages for Ampla’s failures in supply of service of R$ 95,465,103 (approximately ThCh$ 17,362,047) (plus price-level restatement and interest). Ampla filed a Petition for Clarification of the Decision (Embargo de Aclaración) against this judgement, which was rejected by the court. Ampla has filed an appeal. In the remaining proceedings, a first instance court ruling is pending. The amount involved for all these cases is estimated to be approximately R$374 million (approximately ThCh$ 68,021,285).
5. In December 2001, the Brazilian Federal Constitution was amended to apply the CONFINS tax (Contribuicao para o Financiamento da Seguridade Social), a tax levied on revenues, to electricity energy sales. The Constitution states that the changes on social contributions are effective 90 days after their publication. Ampla started to pay this COFINS tax in April 2002. However, the Brazilian Internal Revenue Service notified Ampla that the 90-day delay of entry into force is applied to statutory amendments, but are not applicable to constitutional amendments, which are effective immediately. In November 2007, the appeal filed before the Taxpayers Council (Consejo de Contribuyentes), the administrative appeals level, ruled against Ampla. In October 2008, Ampla filed a special appeal that was rejected. On December 30, 2013, Ampla was notified of the decision to reject its position that the COFINS tax payments were not due for the period from December 2001 to March 2002 based on the Constitution providing that legislative changes are effective 90 days after their publication. Ampla filed a judicial proceeding to obtain a certification of fiscal good standing in order to continue receiving public funds and was required to post a bond for the tax debt. Under the new standard on surety bonds published in March 2014, the bond amount must be 20% rather than the previous 30%, of the tax debt and the bond was reduced to € 44 million. Ampla submitted the new surety bond, complying with the new requirements. The Brazilian Treasury accepted the surety bond and granted the certification of fiscal good standing. The Brazilian Treasury submitted the fiscal execution and Ampla opposed its defense in July 2014. It is not necessary to submit a new surety bond since the bond posted to obtain the certification of fiscal good standing can be used for this proceeding. The amount involved in this case is estimated to be approximately R$149 million (approximately ThCh$ 27,098,332).
| | |
| The accompanying notes are an integral part of these consolidated financial statements | | |
|
| F-143 |
6. In August 1996, Ampla obtained a favorable ruling granting it an exemption from paying the COFINS tax for the period prior to the 2001 amendment of the Brazilian Federal Constitution which expressly made electric power operations subject to the COFINS tax. Following the definite decision in favor of Ampla issued in 2010, the Brazilian Treasury attempted to overturn the 1996 decision favorable to Ampla through a recission action. Ampla refiled a suit originally filed in 1996 seeking a refund of its COFINS tax payments from April 1992 to June 1996, based on the favorable ruling in the first lawsuit described above. The suit seeking a refund of the COFINS tax had been suspended pending the resolution of the first lawsuit above. In June 2013, Ampla received a favorable decision entitling it to a refund of its COFINS tax payments for the periods requested. The Brazilian Treasury appealed the decision. In October 2014, the Court of the State of Río de Janeiro ordered a new trial since it considered that the Brazilian Treasury did not have the opportunity to appear in the prior decision judgment. In May 2015, the Brazilian Treasury presented its final plea and in July 2015 a new favorable first instance ruling entitling Ampla to a refund of its COFINS tax payments made from 1992 to 1996 was issued. In August 2015, the tax authorities filed an appeal with the Court of the State of Río de Janeiro. The sum Ampla has requested as a tax refund amounts to R$167 million (approximately ThCh$30,371,956).
7. In order to fund the purchase of Coelce in 1998, Ampla issued long-term debt abroad through securities called Fixed Rate Notes (FRNs) which were governed by a special tax regime whereby interest payments received by non-resident holders were exempt from taxation in Brazil, as long as the debt was issued with a minimum maturity of 8 years. In 2005, the Brazilian Internal Revenue Service (responsible for tax collection and compliance with tax laws) IRS notified Ampla the special tax regime did not apply based on its understanding that prepayments were made before the stated maturity, due to the fact that Ampla had received financing in Brazil which was allocated to repay the FRN holders. Ampla argues that these two transactions are independent and legally valid. The non-application of the special tax regime means that Ampla would have failed to comply with its obligation to retain the tax and to record it as interest payments made to non-resident holders. The tax resolution was appealed and in 2007 the Taxpayers Council (Consejo de Contribuyentes), the administrative appeals level, annulled it. However, the Brazilian IRS contested this decision before the Superior Chamber of Fiscal Resources (Cámara Superior de Recursos Fiscales), the final administrative appeals level, and on November 6, 2012, it ruled against Ampla. The decision was notified to Ampla on December 21, 2012. On December 28, 2012, Ampla filed a Petition for Clarification of the Decision (Embargo de Aclaración) before the Superior Chamber of Fiscal Resources in order to obtain a final resolution regarding contradictory points of the decision and to incorporate in it the relevant defense arguments that were omitted. The petition was denied. As a consequence, Ampla filed a judicial proceeding to obtain a certification of fiscal good standing in order to continue receiving public funds. Ampla was required to post a bond for the tax debt. Under the new standard on surety bonds published in March 2014, the bond amount must be 20%, rather than the previous 30%, of the tax debt and the bond was reduced to € 331 million. Ampla submitted the new surety bond, complying with the new requirements. The Brazilian Treasury accepted the surety bond and granted the certification of fiscal good standing. The Brazilian Treasury submitted the fiscal execution and Ampla opposed its defense on June 27, 2014. It is not necessary to submit a new surety bond since the bond posted to obtain the certification of fiscal good standing can be used for this proceeding. A final unfavorable decision of the Superior Chamber of Fiscal Resources could lead to a possible criminal proceeding against some employees and managers of Ampla. The amount involved in this case is estimated to be approximately R$ 1,128 million (approximately ThCh$ 205,147,104).
8. Coelce bills the “low income” consumer with a social discount that determines a final rate called “baja renta” (low income). The State compensates Coelce for this discount as a state subsidy. The ICMS (a tax similar to the Chilean Value Added Tax) is transferred (deducted) by Coelce over the amount of the normal rate (without the discount). On the other hand, the State of Ceará establishes that the ICMS does not apply to billings that fluctuate between 0 and 140 kW/h. Also, Coelce, in order to calculate the ICMS deductible amount in reference to the total ICMS supported in energy purchases must apply the “pro rata” rule, which uses the percentage that represents revenues subject to ICMS over the total income (whether or not subject to ICMS). Coelce considers, for the purpose of its inclusion in the pro rata denominator, that the revenue not subject to ICM is the result of applying the end sales price of energy (price after the subsidy is discounted) and the Brazilian IRS holds that the income not subject to ICMS is the price of the normal rate (without discounting the subsidy). The Brazilian IRS’s position implies a lower ICMS deduction percentage. The Brazilian Treasury view is that the “ICMS pro rata” calculation should be based on the normal rate value in “low income” energy sales cases, instead of the reduced rate that Coelce uses. The Brazilian Treasury criteria results in a greater ICMS non-recoverable percentage, which results in a higher ICMS payable. Coelce argues that its calculation is correct, since it must be used in the “ICMS pro rata” calculation, reducing the value of the ICMS rate since that is the accurate value of the energy sales transaction (the ICMS’s base is the transaction value of the merchandise sold). In reference to the 2005 and 2006 litigation, after the unfavorable decision in the administrative process, Coelce is waiting for the filing of the State’s judicial execution. However, Coelce has already presented the banking guarantee in order to assure its right to obtain the Regular Tax Certification. In reference to the 2007, 2008 and 2009 litigation, Coelce filed the administration defense, and the decision is pending. In reference to 2010, the proceeding was received in January 2015 and Coelce filed its first instance administrative defense. The next step is to continue with the defense of the judicial and administrative processes. The amount of these claims is R$ 123 million (approximately ThCh$ 22,369,764).
| | |
| The accompanying notes are an integral part of these consolidated financial statements | | |
|
| F-144 |
9.- In 2002, the State of Rio de Janeiro issued a decree stating that the ICMS (a tax similar to the Chilean Value Added Tax) should be paid and filed on the 10th, 20th and 30th days of the same month of the tax accrual. Ampla continued paying ICMS in accordance with the previous system (filing within five days after the end of the month of its accrual) and did not adopt the new system between September 2002 and February 2005 due to cash flow issues. Additionally, Ampla filed a lawsuit to dispute the constitutionality of the new filing requirement. These lawsuits were unsuccessful, and Ampla has filed suit alleging constitutional violations before the Brazilian Supreme Federal Tribune. Since March 2005, Ampla has been paying the ICMS according to the new system. In September 2005, the IRF imposed on Ampla a penalty fee and interests due to the delay in filling the ICMS as set forth in the aforementioned decree of 2002. Ampla appealed the resolution before the Administrative Courts, based on the fiscal Amnesty Laws of the State of Río de Janeiro published in 2004 and 2005 (forgiving interest and penalties if the taxpayer paid the taxes due). Ampla alleges that if the aforementioned tax amnesties are found to be inapplicable to it, the law would punish taxpayers that are delayed only a few days in their tax payments (as in the case of Ampla) more harshly than those who failed to pay their taxes and later formally adopted the various tax amnesties and thus, regulate their tax situation through the filing of overdue unpaid taxes.
On May 9, 2012, the “En Banc Council” (a special body within the Taxpayers Council, representing the last administrative instance) issued a judgment against Ampla. The decision was notified on August 29, 2012. Ampla appealed to the State Public Treasury (Hacienda Pública Estadual) using a special review procedure based on the equity principle, before the Governor of the State of Río de Janeiro. The appeal has not been resolved and, therefore, the tax should be suspended. However, the State of Río de Janeiro recorded the tax due in the Public Register as if demandable and, therefore, on November 12, 2012, Ampla was obliged to post a surety bond in the amount of € 101 million (R$ 293 million) in order to receive a certification of fiscal good standing to continue receiving public funds. On June 4, 2013, in a decision of second instance, the State Public Treasury obtained a ruling against Ampla’s surety bond. In September 2013, Ampla filed a letter of guarantee to substitute for the surety bond rejected by the court. However, Ampla reiterated to the attorney of the State, the petition of review, which is still pending decision. Despite this, the State Public Treasury submitted the fiscal execution and Ampla opposed its defense. It is not necessary to submit a new surety bond since the bond posted to obtain the certification of fiscal good standing can be used for this proceeding. In June 2015, the Supreme Court of Brasilia issued a favorable ruling for Ampla for a lawsuit filed in 2002 to dispute the constitutionality of the new filing requirements. This resolution will lead to the suspension of the collection procedures of penalties and interests, since the tax is already paid. Also, the final decision will mean the release of the guarantee. The decision was published on October 2, 2015 and the Brazilian Treasury has 10 days to appeal. Once the appeal period has elapsed, the letter of resolution becomes final, and at that time the resolution will be presented to the administrative collection body (process). The State Public Treasury did not file an appeal and on October 25, 2015, Ampla presented to the special collection body the favorable resolution issued by the Supreme Court of Brasilia. The amount involved in this proceeding is R$ 285 million (approximately ThCh$ 51,832,380).
10.- In 1982 under the framework of an electricity supply network expansion in Brazilian rural areas, which was financed principally by international development banks (IDBs), the then-state-owned Companhia Energética do Ceará S.A. (Coelce) signed contracts with 13 cooperatives at the request of the Brazilian government and the IDBs to implement this project. Under the contracts, Coelce operated and maintained the assets and paid a monthly fee, which was price-level restated for inflation. These contracts were of indefinite length and failed to clearly identify the networks that were under their scope due the public nature of Coelce and the fact that they were often repaired, creating confusion between the assets that were operated and maintained by Coelce, and the assets that were owned by it. From 1982 until June 1995 Coelce regularly paid rent for the use of the electric system to cooperatives, adjusted monthly by the relevant rate of inflation. However, from June 1995, Coelce, while it was still state-owned, decided not to continue adjusting the payments for inflation. In 1998 Coelce was privatized and acquired by the Enersis Group, and continued to pay the rent to the network cooperatives in the same manner as before its privatization, that is, without adjusting the rent for inflation. As a consequence, some of these cooperatives have brought legal action against Coelce, including the two actions initiated by Cooperativa de Eletrificacao Rural do V do Acarau Ltda (Coperca), for the payment of the adjustment for inflation as described below. Coelce’s defense is basically grounded on the argument that the adjustment is not applicable, since the assets lacked value due to their much extended useful lives, taking into consideration their depreciation; or, alternatively, if the assets were deemed to have any value, it would be very low since Coelce performed their replacement, extension and maintenance. The amount involved in this litigation is approximately R$ 180 million (approximately ThCh$ 32,660,102).
One of the plaintiffs in this litigation, Coperva, filed a review action requesting expert evaluation of the issue. Once the expert report was delivered, Coelce claimed there were technical inconsistencies therein and requested a new evaluation to be conducted, but the court denied the claim and ruled the “anticipated execution of the decision”, which entails the preliminary determination of the adjusted monthly payments Coelce should have made and ordering the immediate payment of the difference between such adjusted values and the values Coelce actually paid. An appeal has been filed and a precautionary measure has been obtained in favor of Coelce, staying the anticipated execution of the decision. On April 7, 2014 a court of first instance denied Coperva’s claims. Coperva has appealed and the decision is pending. Another plaintiff in the ligation filed a review action in 2007, through which Coperva is attempting to readjust the lease value of its distribution lines (in the central region of the State of Ceará), to be
| | |
| The accompanying notes are an integral part of these consolidated financial statements | | |
|
| F-145 |
calculated at 1% of the value of the asset leased, estimated by Coperva to be at R$ 15.6 million (approximately ThCh$ 2,837,140). This proceeding is in a first instance and has not yet started the evidence presenting stage. The amount involved in this proceeding is estimated to be approximately R$ 94 million (approximately ThCh$ 17,160,998). In Coelce’s case, the review action was filed in 2006 and Coelce is attempting to readjust the lease value of its distribution lines (in the central region of the State of Ceará), to be calculated at 2% of the value of the asset leased. The amount involved in this proceeding is approximately R$ 109 million (approximately ThCh$ 19,756,118). This proceeding, as well as the one for Coperva, has not been advanced by the plaintiff and both are in their first instance.
11.- In October 2009, Tractebel Energía S.A. sued CIEN claiming an alleged breach of the contract “Purchase & Sale Agreement for 300 MW of Firm Capacity and associated Energy originating from Argentina” signed in 1999 between CIEN and Centrais Geradoras do Sul do Brasil S.A (which is now known as Tractebel Energía). Tractebel Energía asked the court to order CIEN to pay a rescission penalty of R$ 117,666,976 (approximately ThCh$ 21,399,857) plus other fines due to the unavailability of energy. The breach allegedly occurred due to a failure by CIEN to ensure sufficient capacity as contracted with Tractebel Energía during the 20-year period, which allegedly took place beginning in March 2005. In May 2010, Tractebel Energía notified CIEN via a written statement, but not judicially, its intention to exercise step-in rights of Line I (30%). The proceeding is currently at the first instance. CIEN petitioned to join this proceeding with the lawsuit filed by it against Tractebel Energía in 2001, which involves a dispute relative to exchange rates and taxing issues. The petition to join both proceedings was rejected by the court. Subsequently, CIEN filed a request to suspend the proceeding for 180 days in order to avoid potentially divergent decisions. The court ordered the suspension of proceedings for one year pending the outcome of the other lawsuit of CIEN against Tractebel Energía. The court issued a resolution extending this suspension until July 9, 2015. This proceeding has not had any changes to date.
12.- In 2010, Furnas Centrais Eletricas S.A. filed a suit against CIEN, based on CIEN’s alleged breach of the contract “Firm Capacity Purchase with associated Energy for the purchase of 700 MW of firm capacity with related energy originating from Argentina”, which was signed in 1998 with a term of 20 years beginning in June 2000. In its lawsuit, Furnas requested a compensation of R$ 520,800,659 (approximately ThCh$ 94,716,974) corresponding to a rescission penalty included in the contract, plus adjustments and default interests, from the date of filing of the claim until actual payment. Furnas also requested for additional penalties based on the lack of availability of the “firm power and related energy” and for other damages to be determined upon the final decision. The first trial judgment denied the claims of Furnas for CIEN’s responsibility for breach of its contractual obligations. The Court recognized the existence of force majeure because of the energy crisis in Argentina. The claimant filed an appeal against this sentence. In July 2015, CIEN presented its arguments to the Court regarding the appeal filed by Furnas. Moreover, regarding the foreign language documents presented by CIEN, the judge of first instance determined that those documents would be excluded from the lawsuit, which decision was confirmed by the 12th Civil Section of the State Court. CIEN has filed a Special Appeal (Recurso Especial) against this decision, which will be decided by the Superior Court of Justice. In addition to the foregoing, CIEN received a notice from Furnas, not at the judicial headquarters, indicating that in case of rescission due to CIEN’s breach, Furnas would have the right to acquire 70% of Line I.
13.- In February 2004, two Brazilian taxes, COFINS and PIS were amended from an accrued regime (rate of 3.65% without credit deduction) to a non-accrued regime (9.25% with credit). According to legislation, long-term assets and service supply agreements performed before October 31, 2003 under “predetermined price” could remain in the accrued regime. Endesa Fortaleza had entered into energy purchase agreements that complied with the requirements, and as a result, the revenues for such agreements were initially taxed under the accrued regime, which is more advantageous. In November 2004, an administrative order was released which defines the concept of “predetermined price”. According to it, CGTF agreements (Endesa Fortaleza) must be subject to the non-accrued regime. In November 2005, a new Law clarified the “predetermined price” concept. On the basis of the 2005 legislation, the regime that should be applied to the agreements was the accrued regimen (more advantageous). The ANEEL issued a (Administrative Law) Technical Note indicating that the agreements entered into by virtue of its standards and with its approval comply with the legislative requirement. PIS and COFINS tax paid in excess under the non-accrued regime by CGTF and CIEN between November 2004 and November 2005 generate tax credits which were used to pay other taxes due. Nevertheless, in 2009 the tax authorities rejected the compensation procedures. In February 2007, the Brazilian tax authorities audited Endesa Fortaleza regarding the payment of PIS/COFINS tax during December 2003 and from February 2004 to November 2004. The audit resulted in a claim alleging differences between the amounts stated in Endesa Fortaleza’s annual tax return (where the PIS/COFINS tax amounts were reported under the new non-accrued regime) and the amounts stated in monthly tax returns (where the amounts due were reported under an older accrual system). On appeal, the Taxpayer’s Council confirmed the validity of the compensations of credits resulting from the regime change of PIS/COFINS. The Brazilian Treasury can file a Special Appeal before the Superior Chamber of Fiscal Resources(Cámara Superior de Recursos Fiscales). The amount involved in this proceeding is R$ 75 million (approximately ThCh$ 13,640,100).
14.- The Brazilian IRS claims an alleged underreporting of dividends by Enel Brasil than it reported. The Brazilian IRS claims that the total amortization of goodwill (greater value) recorded by Enel Brasil in 2009 in the equity accounts, should have been recorded in the comprehensive income accounts. As a result, the procedure performed was inadequate and a greater profit would have been generated and consequently, a higher amount of dividends distributed. The alleged surplus in dividends was interpreted
| | |
| The accompanying notes are an integral part of these consolidated financial statements | | |
|
| F-146 |
by the Brazilian IRS as payments to non-residents, which would be subject to a 15% income tax retained at the source. Enel Brasil responded that all the procedures adopted by Enel Brasil were based on the company’s interpretation and in accordance with Brazilian accounting standards (Brazilian GAAP), and confirmed by the external auditor and by a legal opinion from Souza Leão Advogados. Enel Brasil has filed its defence in the administrative first instance and is waiting for an administrative first instance ruling. The amount involved in this proceeding is R$233 million (approximately ThCh$42,375,244).
15.- In 2001, a lawsuit was filed against Emgesa, as well as the non-related companies, Empresa de Energía de Bogotá S.A. E.S.P. (EEB) and Corporación Autónoma Regional de Cundinamarca (CAR in its Spanish acronym), by the residents of Sibaté, in the Colombian Department of Cundinamarca. This lawsuit seeks to hold the defendants jointly liable for the damages and prejudices derived from the pollution to the El Muñá dam reservoir, resulting from the pumping of polluted waters from the Bogotá River by Emgesa. Emgesa has denied these allegations arguing, among others, that it does not have any responsibility since it receives the waters already contaminated. The plaintiffs’ initial demand was for approximately CPs 3,000 billion (approximately ThCh$ 675,000,000). Emgesa filed a motion for the joinder of numerous public and private entities that dump into the waters of the Bogotá River or that in any way are responsible for the environmental stewardship of the river basin. The Third Section of the State Council has received the petition and ordered certain companies joined as defendants. In January 2013, several of the defendants filed responses to the complaint. In June 2013, a motion to annul the proceedings was denied. The resolving preliminary objections and the summons to a conciliation hearing are currently pending. In June 2015 a resolution was enacted instructing the dismissal of EEB by reason of a nullity defect, as well as the exclusion of those entities that had been identified by the Cundinamarca Administrative Court as defendants for having polluted the waters of Bogotá River, which had been confirmed by the State Council. A motion for reversal was filed against this decision, or an appeal. The resolution of such actions is pending.
16.- CAR, through Resolution 506, enacted on March 28, 2005 and Resolution 1189, enacted on July 8, 2005, imposed on Emgesa, EEB and Empresa de Acueducto y Alcantarillado de Bogotá (EAAB) the execution of construction work on the El Muña dam reservoir, whose effectiveness, among others things, depends on maintaining Emgesa’s water concession. Emgesa filed an action for annulment and reestablishment of Law against these resolutions before the Administrative Court of Law of Cundinamarca, Section One. The first instance court denied the nullity of these resolutions. Appeals were filed by Emgesa, EEB and EAAB, which are pending a decision.
Emgesa filed another action for annulment and reestablishment against CAR for annulment of Article 2 of Resolution 1318 of 2007 and Article 2 of Resolution 2000 of 2009, both of which required Emgesa to implement a Contingency Plan and to carry out study on “Air Quality” for the potential suspension of water pumping in the dam reservoir. This action seeks to annul the administrative acts imposed due to impracticability of anticipating the “Air Quality” and implementing the Contingency Plan. In this action a favorable accountant expert report was presented, for which it was requested clarification to Emgesa. Clarification of previous expert report and a second expert report to value the works anticipated by the company is still pending. The amount at issue is undetermined.
17.- A class action lawsuit has been filed by residents of the Colombian Municipality of Garzón, alleging that the construction of the El Quimbo hydroelectric project has caused the plaintiffs’ income from handicrafts or entrepreneurial activities to decrease by an average of 30%. The lawsuit claims the decrease was not considered when the project’s social-economic impact report was drafted. Emgesa has denied these allegations on the basis that (i) the social-economic impact report complied with all methodological criteria, including giving all interested parties the opportunity to be registered in the report, (ii) the plaintiffs are not residents and therefore, compensation is allowed only for those whose revenues are, in their majority, coming from of their activity in the direct area of influence of the El Quimbo hydroelectric project and (iii) compensation must not go beyond the “first link” of the production chain and must be based on the status of the income indicators of each affected person. A proceeding was filed in parallel by 38 inhabitants of the Municipality of Garzón, who are claiming compensation for being affected by the El Quimbo hydroelectric project since they were not included in the social-economic impact report. A mandatory settlement hearing was unsuccessful. The court ordered a test, which is currently in the preliminary phase. In the parallel proceeding, an exception previous of pending lawsuit was filed, based on the existence of the principal proceeding. The proposed exception is pending ruling. The amount involved in this proceeding is estimated to be approximately CPs 93 billion (approximately ThCh$20,925,000).
18.- In February 2015, Emgesa was notified of a Popular Action filed by Comepez S.A. and other fish farming companies located near the Betania dam, on the grounds of protection of the right to a healthy environment, public health and food safety in order to prevent, in the opinion of the plaintiffs, the danger of a massive fish mortality among other damages from the filling of the reservoir for the El Quimbo hydroelectric project dam, also located at the basin of the Magdalena River. Regarding the status of the proceeding, the Huila administrative court issued in February 2015 a preliminary injunction that prevents the filling of the El Quimbo dam reservoir until the river has reached the optimal flow, among other requirements. Emgesa filed a motion for reversal against this decision requesting a probation order and the release of such measure, which motion was denied by the court. The appeal filed by Emgesa was granted only in the remand effect. The preliminary injunction was amended, allowing Emgesa to start filling the dam reservoir. Nevertheless the Regional Environmental Authority (CAM) in Resolution No. 1503 issued on July 3, 2015 directed Emgesa to temporarily stop filling the El Quimbo dam reservoir. The legal actions to be adopted are under analysis
| | |
| The accompanying notes are an integral part of these consolidated financial statements | | |
|
| F-147 |
by Emgesa, notwithstanding the filling procedure continues normally. The appeal is pending. The Colombian government, through Decree 1979 has requested the lifting of the generation suspension and reported that Emgesa must abide by such Decree. On December 15, 2015, the Constitutional Court decided that Decree 1979 was unenforceable, and as a result, Emgesa suspended at midnight of that date the generation of energy at El Quimbo. Emgesa presented the corresponding arguments.
On December 24, 2015, the Colombian Ministry of Energy and Mining and the National Authority of Aquaculture and Fishing (“AUNAP”) filed a writ of protection of constitutional rights to the Civil Courts of Circuito de Neiva as a transitional mechanism to avoid irreparable damage, while the Huila administrative court decides on releasing the precautionary measure, and requested that the generation of energy at El Quimbo be permitted. They have requested such generation to be authorized as an interim measure until a ruling on the writ of protection is made. On January 8, 2016, Emgesa was notified of the decision of the Civil Court of Circuito de Neiva which authorized Emgesa to immediately restore the generation of energy as a transitional measure until the Huila administrative court decides on releasing the precautionary measure. The amount involved on this proceeding is undetermined.
19.- In Colombia, upon creating an electrical distribution subsidiary, Codensa, in 1997, EEB contributed all public lighting infrastructures and other sale and distribution assets to Codensa in exchange for 51.5% of Codensa’s shares. However, there was no certainty regarding the inventory of lights in Bogotá and this generated subsequently differences regarding invoicing and settlement of the energy value that Codensa supplied to the municipality. In 2005, a geo-reference inventory of the lights was performed, which resulted in 8,661 fewer lights than those that Codensa considered in its billing and settlement to the Federal District of Bogotá (the District). In order to solve the conflict, the parties carried out round-table discussion to come to an agreement. However, in 2009 a private citizen filed a derivative action in which he requests that the court of law: (i) declare the rights of the administrative morality and public property violated; (ii) order Codensa to carry out the settlement that includes delinquent interest due to the higher values paid between 1998 and 2004; and (iii) recognize the incentive due to administrative morality for the claimant (15% of the amount the District recovered). The first instance judgment, confirmed by the second instance judgment, ordered the Administrative Special Public Utilities Unit (the UAESP) and Codensa to, within a time period of two months starting from the date of issuance of the judgment, carry out all necessary negotiations to establish in a definitive manner the balances either in favor or against Codensa, duly adjusted, plus additional interest. If no agreement is reached, the UAESP itself may make a unilateral judgment within two months and deliver it to Codensa for its consideration. Codensa may also exercise remedies through the relevant government channels and, in the event of non-payment, must proceed to execute the judgment. On September 6, 2013, the Comptroller sent a communication to Codensa announcing future control actions against the company and the UAESP for an alleged detriment to the District of CPs 95,142,786,544 (approximately ThCh$ 21,407,126), due to payments owed to the District for public lighting between 1998 and 2004. On September 20, 2013, Codensa responded, disagreeing with the amount and proposing a technical group to resolve the issue. This resulted in several meetings being held. Based on Codensa’s documents and the declarations presented, the Comptroller issued a new report that supports the figure obtained by common accord by UAESP and Codensa of CPs 14,432,754,679 (approximately ThCh$ 3,247,369). The Comptroller recommended in its report that UAESP send the agreement for judicial review in order to resolve the lawsuit with Codensa, which occurred on December 13, 2013. Subsequently, the Comptroller, in Bogotá, issued a report questioning the agreement with the UAESP; such report was presented at Court. It is pending resolution from the Tenth Administrative Court of Bogotá, either for notifying the report or issuing final decision on the agreement subscribed between Codensa and the UAESP.
20.- A class action was filed in Colombia against Codensa in which plaintiffs seek reimbursement for excess charges for not applying the tariff benefit that according to them would have applied to them as users of the Voltage One Level and owners of the infrastructure, as established by Resolution No. 082 of 2002, amended by Resolution No. 097 of 2008. Regarding the proceeding status, Codensa filed a plea against the lawsuit rejecting it entirely. A conciliation hearing was effected between the parties, without success. The writ of proof is pending. The estimated amount is approximately CPs 337,626,840,000 (approximately ThCh$75,966,039).
21.- To counter the impact in prices as a result of the climate phenomena “El Niño”, the Colombian Energy and Gas Regulatory Commission (CREG), through Resolution CREG No. 168 of 2008 establishes the Optional Tariff, which allows deferral of the increase in the electrical energy tariff for up to two years, mitigating the impact of the increase to end users. Codensa voluntarily ended the Optional Tariff it was applying and must determine the difference between the actual values of the tariff and the invoiced valued from the Optional Tariff, based on the balances and the historical values transferred to the tariff for end users, in compliance with Resolution CREG No. 168 of 2008. The resulting difference of comparing tariffs must be returned to the end users since the Optional Tariff values, as accumulated balances, are always higher than the values that would have been invoiced had Codensa not opted for that alternative. In terms of process status, it was notified the demand on October 1, 2015 which was answered on November 23, 2015. The conciliation hearing date has not yet been fixed. National regulations do not establish the mechanism to return the money from the Optional Tariff to end users; however, Codensa has previously decided to return it. There is a difference between the amounts that Codensa expects to return and the amount that the CREG expects. The estimated amount is approximately CPs 163,000,000,000 (ThCh$36,675,000).
| | |
| The accompanying notes are an integral part of these consolidated financial statements | | |
|
| F-148 |
22.- The fiscal authority in Peru, the Superintendencia Nacional de Administración Tributaria (SUNAT), questioned Edegel in 2001 regarding the manner in which it was accounting for the valuation of its depreciating assets. Edegel had conducted a voluntary reevaluation for the 1996 fiscal year, and as a result of such reevaluation it recorded a reduction of goodwill with respect to assets. This depreciation was recorded as an expense. The amount rejected by SUNAT is related to financial interest paid during the construction phase of the power plants. SUNAT claims (i) that Edegel has not demonstrated that it was necessary to obtain financing to build the power plants and (ii) that such financing was actually incurred. Edegel has responded that SUNAT cannot request such evidence because the reevaluation assigns the assets a market value when the reevaluation was performed, instead of the historical value of the assets. In this case, the methodology considered that the power plants of such scale were built with financings. In addition, Edegel claimed that if SUNAT disagreed with the valuation, it should have conducted its own appraisal, which it failed to do. On February 2, 2012, the Tax Court (TF) issued a ruling for the 1999 fiscal year in favor of two of Edegel’s power plants, and against four power plants, based on the fact that a verified financing was only evidenced for the first two power plants. Consequently, the TF ordered SUNAT to recalculate the taxes payable by Edegel, which amounted to ThCh$8,474,708 (€11 million) that were paid by Edegel in June 2012. This amount will be recovered if Edegel obtains favorable rulings in the following claims it has subsequently filed:
| | i) | an administrative contentious claim before the Judicial System against the TF’s ruling, filed in May 2012 (which would result in a complete recovery of the taxes).; and |
| | ii) | a partial appeal against the recalculation that SUNAT performed according to TF’s ruling, on the basis that the recalculation was incorrect, filed in July 2012 (which would result in a partial recovery of the taxes). |
In August 2013, Edegel received notice of an unfavorable ruling with respect to claim i). Edegel filed an annulment appeal against the ruling, since the resolution violates its motivation right and it is untimely. In May 2015, Edegel received notice of the resolution of the Court of Appeal which: (i) annulled the resolution from the Justice Department (“JD”) which rejected the petitions of the demand of the company; (ii) declared admitted the claims previously rejected; and (iii) ordered the JD to return to the stage of determination of the controversy points. In June 2015, Edegel received notice from the JD that it declared admitted the claims previously rejected and it had submitted to the attorney general’s office a request for issuance of a new pronouncement (in Peru when the Government is engaged as a party in a judicial process an attorney general designated by the Public Ministry must be involved, in order for him to be informed and to opine regarding the controversy, which opinion is not binding on the judge or the Court that must resolve the litigation).
For the 2000 to 2001 fiscal years, Edegel paid the equivalent of ThCh$3,852,140 and made a provision of ThCh$770,428.
In November 2015, Edegel was notified of Resolution No. 15281-8-2014, stating that the TF had ruled with respect to the indicated appeal by which was declared annulled the Resolution which the SUNAT objected the loss deductions related to the financial derivative instruments. The TF ruling also revoked the objections related to the non-deductibility of depreciation of the non-accredited technical assistance services rendered to Generandes and the financial interests accrued on the loans for the acquisition of treasury shares. It is important to note that, although the TF’s resolution revoked the objections related to the excess in depreciation of the revalued assets; however, stated that the SUNAT shall apply what is resolved in the company’s appeal of Income Taxes filed for the fiscal year 1999 (Exp. No. 10099 to 2012), which is still pending resolution.
In December 2015, the TF’s submission of the case to the SUNAT in order for it to recalculate the debt based on the established criteria was still pending.
For the 1999 fiscal year it is expected that the Judicial System will enact a new resolution on the Edegel lawsuit and that the TF will decide on the partial appeal filed by Edegel. For the 2000 and 2001 fiscal years, Edegel filed new evidence in order to reduce amount that could be paid from ThCh$4,622,568 to ThCh$1,001,556; however, the TF could determine that the evidence is inadmissible as untimely. In December 2014, the TF enacted a resolution on the appeal filed by Edegel.
The amount involved in these proceedings is S/.63,944,287 (approximately ThCh$ 13,305,207), which is divided between the assets amount of S/.59,819,819 (approximately ThCh$ 12,447,008) and the liabilities amount of S/. 4,124,468 (approximately ThCh$ 858,198).
23.- In September 2012, Enersis Américas received notice from the Chilean Internal Revenue Service (SII in its Spanish acronym) on a settlement and resolution related to withholding taxes on dividends paid in fiscal years 2008 and 2009 (tax years 2009 and 2010) to non-Chilean resident or domiciled shareholders of Enersis Américas. Despite the fact that there is no differences in owed taxes, and no fines have been applied, the SII is requesting Enersis Américas to correct the calculation methodology used for its tax return. In addition, the SII notified Enersis Américas on settlements and resolutions for the same concept for fiscal years 2010 and 2011 (tax
| | |
| The accompanying notes are an integral part of these consolidated financial statements | | |
|
| F-149 |
years 2011 and 2012). The position of the tax authority is that the methodology used by the company to determine the difference between the final tax credit and the provisional tax credit was incorrect, because Enersis Américas should pay the total amount of the tax credit used in the calculation of the provisional withholding and only the shareholders may request refunds from the amount paid in excess by the Chilean company. The position of Enersis Américas is that the interpretation of the SII is based on the wording of an article in the tax law that seems to require the “payment of credits in excess”, but it did not consider the existence of a Resolution issued by the SII indicating the description of this process with which Enersis Américas has complied. Moreover, if the methodology of the SII is used, the amount to be paid on behalf of the shareholders would be the same as the amount that the shareholders would request to the SII for refund. The difference is that the amounts paid to the SII are price-level restated by CPI and interests (1.5%), while the amounts that the SII will reimburse are only price-level restated by CPI. On March 13, 2014, the Company filed a tax claim with the Tax and Customs Court (“TTA” in its Spanish acronym) in first instance for fiscal years 2008 and 2009. On August 18, 2014, a tax claim was filed for fiscal year 2010 (tax year 2011), and lastly, on August 29, 2014, a tax claim was filed for fiscal year 2011 (tax year 2012). The three tax claims are pending of response from the SII, and on October 10, 2014, Enersis Américas requested their consolidation, which was granted by the Court on October 16, 2014. On September 21, 2015, the TTA open the evidence period. On October 15, 2015, Enersis Américas presented its evidence. On December 31, 2015, the TTA issued an unfavorable ruling against Enersis Américas. On January 4, 2016, Enersis Américas received notice of the resolution. Enersis Américas filed an appeal to the Appeal Court of Santiago. The amount involved in this proceeding is ThCh$45,566,682.
b) Discontinued Operations
1.- In 2005, three lawsuits were filed against Endesa Chile, the Chilean Treasury and the Chilean Water Authority (DGA, in its Spanish acronym), which are currently being treated as a single proceeding, requesting that DGA Resolution No. 134, which established non-consumptive water rights in favor of Endesa Chile to build the Neltume hydroelectric power plant project be declared null as a matter of public policy, with compensation for damages. Alternatively, the lawsuits request the compensation for damages for the losses allegedly sustained by the plaintiffs due to the loss of their status as riparian owners along Pirihueico Lake, as well as due to the devaluation of their properties. The defendants have rejected these allegations, contending that the DGA Resolution complies with all legal requirements, and that the exercise of this right does not cause any detriment to the plaintiffs, among other arguments. The sums involved in these suits are undetermined. This case was joined with two other cases: the first one is captioned “Arrieta v. the State and Others” in the 9th Civil Court, docket 15279-2005 and the second is captioned “Jordán v. the State and Others,” in the 10th Civil Court, docket 1608-2005. With regard to these cases, an injunction has been ordered against entering into any acts and contracts concerning Endesa Chile’s water rights related to the Neltume project. On September 25, 2014, the Court of Law issued an unfavorable ruling against Endesa Chile that in essence declared the right to use water established by DGA Resolution No. 134 illegal and orders its cancellation in the corresponding Water Rights Register of the correspondent Real Estate Registrar. Endesa Chile filed an appeal and cassation resources with the Santiago Court of Appeals, which are still pending.
2.- On May 24, 2011, Endesa Chile was served with a lawsuit filed by 19 riparian owners along the Pirihueico Lake, seeking to nullify DGA Resolution No. 732, which authorized the relocation of water rights collection for the Neltume power plant, from the Pirihueico Lake drainage 900 meters downstream along the Fui River. The plaintiffs seek to have this annulment annotated at the margin of the notarized instrument that memorialized DGA Resolution No. 732, which approved the transfer of the collection. The plaintiffs also seek to have the recording of the deed struck from the Water Rights Register, if entered, and to require the Chilean Treasury, the DGA and Endesa Chile to pay damages to the plaintiffs as a result of the challenged DGA Resolution. The plaintiffs seek to reserve their right to indicate the type and amount of damages in a subsequent legal proceeding. The claim is for an undetermined amount because the plaintiffs have requested that damages be determined in another suit, once the DGA Resolution is nullified. The discussion period has ended and the evidence action has been determined, which after notification was subject to a motion of reversal filed by the plaintiff, and to a nullity incidental plea filed by Endesa Chile, which were both rejected. The proceeding was suspended by mutual agreement until March 9, 2013, after which it was immediately restarted. On August 20, 2013 the pending conciliation hearing took place without success. After the end of the ordinary, extraordinary and special periods of evidence on January 22, 2015, the parties were summoned to acknowledge the ruling, and on April 23, 2015, the Court issued a ruling accepting the complaint, declaring DGA Resolution No. 732 null as public legislation. Endesa Chile, in turn, filed a writ of appeal and reversal in the form before the Santiago Court of Appeals, which are still pending of resolution.
3.- In August 2013, the Chilean Superintendency of the Environment (SMA) filed charges against Endesa Chile alleging several violations of Exempt Resolution No. 206, dated August 2, 2007 and its supplementary and explanatory resolutions that environmentally certified the Bocamina Thermal Power Plant Extension Project. These alleged violations are related to the cooling system discharge channel, an inoperative Bocamina I desulphurizer, non-compliance with information delivery obligations, surpassing CO limits, failures in the acoustic perimeter fence of Bocamina I, excessive noise levels and having no technological barriers that prevent the massive entry of biomass in the intake of the central power plant. Endesa Chile submitted a compliance program that was not approved. On November 27, 2013, SMA added two additional violations to its charges. Endesa Chile presented its defense in December 2013, partially recognizing some of these violations (which could reduce the fine by 25% in case of recognition) and contesting the remainder. On August 11, 2014, the SMA passed Resolution No. 421 that fined Endesa Chile
| | |
| The accompanying notes are an integral part of these consolidated financial statements | | |
|
| F-150 |
8,640.4 UTA for environmental non-compliances that are the subject matter of the sanction proceeding. Endesa Chile filed an illegality claim against the SMA before the Third Environmental Court of Valdivia, which on March 27, 2015 issued a ruling that partially annulled the sanctions imposed by the SMA, instructing it to consider aggravating circumstances evidenced in connection with the calculation of the fine imposed. The company filed a writ of reversal in substance before the Chilean Supreme Court, which was rejected, and the sanction imposed was confirmed. As of December 31, 2015, the amount has been paid.
4.- On May 12, 2014, Compañía Eléctrica Tarapacá S.A., (Celta) formally filed an arbitration claim against Compañía Minera Doña Inés de Collahuasi, requesting that the Arbitration Court of Law declare that through the contracts entered into in 1995 and 2001, the parties have established a long-term contractual relation, characterized by the economic balance that there must be in their reciprocal services supplied and that, due to the above, greater costs corresponding to the investment that must be made to comply with the emission standard contained in DS (Supreme Decree) (MMA) No. 13, 2011 must be shared by the parties. Based on this, the defendant should start paying up to the maturity of the contract, a fixed monthly charge that through March 31, 2020 would amount to US$72,275,000 (approximately ThCh$51,326,814) in the aggregate for the proportional part of the investments that the defendant must pay due to the Supreme Decree mentioned above.
The claim was notified on July 3, 2014. On August 8, 2014 Collahuasi contested Celta’s claim and filed a counterclaim against Celta requesting that the Court declare that Celta has violated the prohibition to call on as precedent what was agreed to in the modifications of the 2009 supply contracts, reserving the right to discuss and prove the amount of damages. On August 26, 2014, Celta filed its response to the main claim and contested the counterclaim. On September 11, 2014, Collahuasi filed its rejoinder to the main claim and its response to the counterclaim. On October 1, 2014, Celta filed its response to the counterclaim. Additionally, the Arbitration Judge formulated a questionnaire with questions separately to each of the parties and also with common questions for both.
Once the parties responded to the questions, the arbitrator gave the parties a deadline of January 16, 2015 to contest or observe the answers provided and the documents attached specifying the contrary. The arbitrator gave the parties for their study a base for an agreement.
The management of Enersis Américas S.A. considers that the provisions recorded in the Consolidated Financial Statements are adequate to cover the risks resulting from litigation described in this Note. It does not consider there to be any additional liabilities other than those specified.
Given the characteristics of the risks covered by these provisions, it is not possible to determine a reasonable schedule of payment dates if there are any.
| | |
| The accompanying notes are an integral part of these consolidated financial statements | | |
|
| F-151 |
36.4 Financial restrictions
A number of the company’s loan agreements, and those of some of its subsidiaries, include the obligation to comply with certain financial ratios, which is normal in contracts of this nature. There are also affirmative and negative covenants requiring the monitoring of these commitments. In addition, there are restrictions in the events-of-default clauses of the agreements which require compliance.
Some of the financial debt contracts of Enersis Américas and of Endesa Chile contain cross default clauses. The credit line agreements governed by Chilean law, which Endesa Chile signed in February 2013 and Enersis Américas in April 2013, stipulate that cross default arises only in the event of non-compliance by the borrower itself, with no reference made to its subsidiaries, i.e. Enersis Américas or Endesa Chile, respectively. In order to accelerate payment of the debt in these credit lines due to cross default originating from other debt, the amount overdue of a debt must exceed US$50 million, or the equivalent in other currencies, and other additional conditions must be met such as the expiry of grace periods. Since being signed, these credit lines have not been disbursed. They mature in February 2016 and April 2016, respectively. Endesa Chile’s international credit line governed by New York State law, which was signed in July 2014 and expires in July 2019, also makes no reference to its subsidiaries, so cross default arises only in the event of non-compliance by the borrower itself. For the repayment of debt to be accelerated under this facility due to cross default on another debt, the amount in default should exceed US$50 million or its equivalent in other currencies. It must also meet other conditions, including the expiration of any grace periods, and a formal notice of intent to accelerate the debt repayment must have been served by creditors representing more than 50% of the amount owed or committed in the contract. This line of credit has not currently been used.
Regarding the bond issues of Enersis Américas and Endesa Chile registered with the United States Securities and Exchange Commission (the SEC), commonly called “Yankee bonds”, a cross default can be triggered by another debt of the same company or of any of their Chilean subsidiaries, for any amount overdue provided that the principal of the debt giving rise to the cross default exceeds US$30 million or its equivalent in other currencies. Debt acceleration due to cross default does not occur automatically but has to be demanded by the holders of at least 25% of the bonds of a certain series of Yankee bonds. In addition, events of bankruptcy or insolvency of foreign subsidiaries have no contractual effects on the Yankee bonds of Enersis Américas or Endesa Chile. The Enersis Américas Yankee bonds mature in 2016 and 2026, and those of Endesa Chile do so in 2024, 2027, 2037 and 2097. For the specific Yankee Bond that was issued in April 2014 and matures in 2024, the threshold for triggering cross default increased to US$50 million or its equivalent in other currencies.
The Enersis Américas and Endesa Chile bonds issued in Chile state that cross default can be triggered only by the default of the issuer when the amount in default exceeds 3% of total consolidated assets in the case of Enersis Américas, and US$50 million or its equivalent in other currencies in the case of Endesa Chile. Debt acceleration requires the agreement of at least 50% of the holders of the bonds of a certain series.
Financial covenants are contractual commitments with respect to minimum or maximum financial ratios that the company is obliged to meet at certain periods of time (quarterly, annually, etc.). Most of the financial covenants of the Group limit the level of indebtedness and evaluate the ability to generate cash flows in order to service the companies’ debts. Various companies are also required to certify these covenants periodically. The types of covenants and their respective limits vary according to the type of debt.
The Series B2 domestic bonds of Enersis Américas includes the following financial covenants, whose definitions and calculation formulas are set out in the respective contract:
| | - | Consolidated Equity: Minimum Equity must be maintained of Ch$628,570 million, a limit adjusted at the end of each year as established in the indenture. Equity is the sum of Equity attributable to the shareholders of Enersis Américas and minority interests. As of December 31, 2015, Enersis Américas equity was Ch$8,189,808 million. |
| | - | Debt Ratio: A debt ratio, defined as Total liabilities to Equity, should be no more than 2.24. Total liabilities are the sum of Total current liabilities and Total non-current liabilities, while Equity is the sum of Equity attributable to the shareholders of Enersis Américas and non-controlling interests. As of December 31, 2015, the Debt Ratio was 0.89. |
| | - | Unsecured Assets: The ratio of Unsecured assets to Unsecured total liabilities must be at least 1. Total Unsecured or free assets is the difference between Total assets and Total secured assets. Total unsecured or free assets consists of Total assets less the |
| | |
| The accompanying notes are an integral part of these consolidated financial statements | | |
|
| F-152 |
| | sum of Cash, Bank balances, Accounts receivable from related entities, current, Payments made in advance, current, Non-current accounts receivable from related entities, and Identifiable intangible assets, gross, while Total secured assets relates to assets pledged in guarantee. On the other hand, Total unsecured liabilities consist of the sum of Total current liabilities and Total non-current liabilities, less liabilities secured by collateral. As of December 31, 2015, this ratio was 1.88. |
It is important to note that the undisbursed credit line in Chile includes other covenants such as leverage and debt repayment capacity ratios (Debt/EBITDA), while the Yankee bonds are not subject to financial covenants.
As of December 31, 2015, the most restrictive financial covenant for Enersis Américas was the Debt/EBITDA ratio with respect to local credit lines early closed on January 18, 2016.
The Endesa Chile bonds issued in Chile include the following financial covenants whose definitions and calculation formulas are established in the respective indentures:
Series H
| | - | Consolidated Debt Ratio: The consolidated debt ratio, which is Financial debt to Capitalization, must be no more than 0.64. Financial debt is the sum of interest-bearing loans, current; Interest-bearing loans, non-current; Other financial liabilities, current; Other financial liabilities, non-current; and Other obligations guaranteed by the issuer or its subsidiaries; while Capitalization is the sum of Financial liabilities, Equity attributable to the shareholders of Enersis Américas and Non-controlling interests. As of December 31, 2015, the ratio was 0.19. |
| | - | Consolidated Equity: A minimum Equity of Ch$761,661 million must be maintained; this limit is adjusted at the end of each year as established in the indenture. Equity corresponds to Equity attributable to the shareholders of Enersis Américas. As of December 31, 2015, the equity of Endesa Chile was Ch$2,648,190 million. |
| | - | Financial Expense Coverage: A financial expense coverage ratio of at least 1.85 must be maintained. Financial expense coverage is the quotient between i) the gross margin plus Financial income and dividends received from associated companies, and ii) Financial expenses; both items refer to the period of four consecutive quarters ending on the quarter being reported. For the year ended December 31, 2015, this ratio was 8.21. |
| | - | Net Asset Position with Related Companies: A Net asset position must be maintained with related companies of no more than a hundred million dollars. The Net asset position with related companies is the difference between i) the sum of Accounts receivable from related entities, current, Accounts receivable from related entities, non-current, less transactions in the ordinary course of business at less than 180 days term, short-term transactions of associates of Endesa Chile in which Enersis Américas has no participation, and long-term transactions of associates of Endesa Chile in which Enersis Américas has no participation; and ii) the sum of Accounts payable to related entities, current; Accounts payable to related entities, non-current, less transactions in the ordinary course of business at less than 180 days term; short-term transactions of associates of Endesa Chile in which Enersis Américas has no participation; and long-term transactions of associates of Endesa Chile in which Enersis Américas has no participation. As of December 31, 2015, using the exchange rate prevailing on that date, the Net asset position with related companies was a negative US$341.86 million, indicating that Enersis Américas is a net creditor of Endesa Chile rather than a net debtor. |
Series M
| | - | Consolidated Debt Ratio: The consolidated debt ratio, which is Financial debt to Capitalization, must be no more than 0.64. Financial debt is the sum of Interest-bearing loans, current; Interest-bearing loans, non-current; Other financial liabilities, current; and Other financial liabilities, non-current; while Capitalization is the sum of Financial liabilities, Equity attributable to the shareholders of Enersis Américas and Non-controlling interests. As of December 31, 2015, the debt ratio was 0.19. |
| | - | Consolidated Equity: Same as for Series H. |
| | - | Financial Expense Coverage Ratio: Same as for Series H. |
The rest of Endesa Chile’s debt and the undisbursed credit lines include other covenants such as leverage and debt coverage ratios (debt/EBITDA ratio), while the Yankee bonds are not subject to financial covenants.
In the case of Endesa Chile, the most restrictive financial covenant as of December 31, 2015 was the Debt Ratio requirement for the credit line under Chilean law, which was early closed on January 18, 2016.
| | |
| The accompanying notes are an integral part of these consolidated financial statements | | |
|
| F-153 |
In Peru, the debt of Edelnor only has one covenant, a Debt Ratio with respect to the local bonds whose final maturity is in January 2033. On the other hand, the debt of Edegel includes the following covenants: Debt Ratio and Debt Coverage (Debt/EBITDA). As of December 31, 2015, the most restrictive financial covenant for Edegel was the Debt/EBITDA ratio corresponding to the financial leasing agreement with Banco Scotiabank that expires in March 2017. Piura’s debt includes the following covenants: Debt Coverage and Level of Indebtedness. As of December 31, 2015, the most restrictive covenant on Piura debt was the indebtedness covenant from the Reserva Fría plant construction leasing agreement with Banco de Crédito del Peru which expires in June 2020.
In Brazil, the debt of Coelce includes compliance with the following covenants: Debt Coverage (Debt/EBITDA), Level of Indebtedness, and the Interest Coverage ratio (EBITDA/financial expenses). As of December 31, 2015, Coelce’s most restrictive financial covenant was the Debt/EBITDA ratio for the 3rd local bond issue with a final maturity in October 2018. The debt corresponding to Ampla includes the following covenants: Debt Coverage (the Debt/EBITDA ratio), the Indebtedness ratio and the Interest Coverage Ratio (EBITDA/financial expenses). As of December 31, 2015, the most restrictive financial covenant for Ampla was the Debt/EBITDA ratio on the loan with the Banco Nacional do Desenvolvimiento Economico e Social (“BNDES”), whose final maturity is June 2021. Cien’s debt includes covenants on Debt Coverage (Debt/EBITDA) and the Debt Ratio on a loan with BNDES maturing in June 2020. As of December 31, 2015, its most restrictive covenant was the Debt ratio.
In Argentina, Costanera has just one covenant, the maximum debt, corresponding to a loan from Credit Suisse First Boston International which matures in February 2016. The debt of El Chocón includes covenants related to Maximum Debt, Net consolidated equity, Interest Coverage, Debt Coverage (debt/EBITDA) and the leverage ratio. As of December 31, 2015, the most restrictive covenant was the leverage ratio for the syndicated loan maturing in September 2016.
In Colombia, the debt of Emgesa has only one convenant, Net Debt/EBITDA, for the loan with the Bank of Tokyo with a final maturity in June 2017. However, the obligation to comply with this covenant is subject to a downgrade in the credit rating of Emgesa that could result in losing is Investment Grade quality, as stated in the debt agreement. As of December 31, 2015, the covenant was not triggered. On the other hand, the debt of Codensa is not subject to compliance with financial covenants, a situation that also applies to the debt of the rest of the companies not mentioned in this note.
Lastly, in most of the contracts, debt acceleration for non-compliance with these covenants does not occur automatically but is subject to certain conditions, such as a cure period.
As of December 31, 2015 and 2014, neither Enersis Américas nor any of its subsidiaries were in default under their financial obligations summarized here or other financial obligations whose defaults might trigger the acceleration of their financial commitments, with the exception of our Argentine generation subsidiaries Hidroeléctrica El Chocón at the close of December 2014.
This situation does not represent a risk of cross default or a breach for Enersis Américas.
As of December 31, 2015, all assets and liabilities related to the distribution and generation businesses in Chile has been classified as non-current assets held for distribution to owners (See Note 5.1).
36.5 Other Information
Central Costanera S.A.
- On July 17, 2015, and in force as of the economic transactions corresponding to February 2015, Resolution S.E. Nº 482/2015 was enacted which, among other aspects updated the remuneration of the MEM’s generating agents of thermal conventional type or hydraulic national (with the exception of the hydraulic bi-national), replacing to this end Schedules I, II, III, IV and V of Resolution S.E. Nº 529/14, and including a new remuneration concept that is the Investment Writ FONINVEMEM 2015-2018, which application is from February 2015 until December 2018, for those generating companies participating in investment projects approved or to be approved by the Secretary of Energy. In this sense, each generation unit built within the framework of the FONINVEMEM 2015-2018 investments is granted a Direct FONINVEMEM 2015-2018 Remuneration equal to 50% the Direct Additional Remuneration for a period of up to 10 years from its commercial implementation.
On June 5, 2015, our generating subsidiaries in Argentina entered into the “Agreement of Management and Operation of Projects to Increase the Availability of Thermal Generation and Adjustment of the Generation Remuneration 2015-2018”, hereinafter FONINVEMEM 2015-2018, and adhered to all the terms established in such agreement on July 2, 2015. Adhering includes the irrevocable commitment to participate in the formation of FONINVEMEM 2015-2018, undertaking according to point 3.2.v of the Agreement to contribute with the Sales Statements with a Maturity to be defined (LVFVD) and/or Collectibles accrued or to be accrued during the entire period between February 2015 and December 2018 not previously committed to similar programs, together with all unused Collectibles. Both the Secretary of Energy and the generating agents that adhered to the Agreement maintain the right to consider this Agreement lawfully terminated if during the 90 days indicated in point 9 of the Agreement the corresponding supplementary agreements are not entered into.
| | |
| The accompanying notes are an integral part of these consolidated financial statements | | |
|
| F-154 |
By adhering to such Agreement generating companies will participate, together with other Generating Agents, in the construction of a Combined Cycle of about 800 MW +/- 15%, which shall generate both with natural gas and with gasoil and biodiesel. The new combined cycle will be subject to a bidding in order to be implemented no longer than 34 months after the work is granted.
Notwithstanding the above, our subsidiary in Argentina Central Costanera still shows a deficit in its working capital, causing difficulties to its financial balance in the short term which compromise its future capability to continue operating as a company and to recover assets. Central Costanera expects to revert the current situation provided that there is a favorable resolution on the requests made to the National Government of Argentina.
- On March 18, 2015, the Undersecretary of Electric Energy issued its Note SS.EE. 476/2015, which establishes the procedure to coordinate the remuneration according to Resolution SE Nº 95/2013 and the Availability Agreements for Combined Cycles and Turbosteam entered into between Central Costanera and CAMMESA, as from February 2014. As established in the above, Central Costanera shall temporarily relinquish to receive the Additional Remuneration Trust established Res. SE. Nº 95/2013, its amendments and supplements which were already undertaken, as well as the Remuneration for Non Recurrent Maintenance as established in Res. SE Nº 529/2014, its amendments and supplements.
The procedure implies the reversal of the deductions made and applied to the Company as established in notes S.E. Nº 7594/2013 and Nº 8376/2013, as from the validity of this standard. Since the economic transaction in the month of January, 2015, the concepts relinquished by the Company shall be applied to the compensation funds transferred by CAMMESA to the Company as of that date to perform the tasks provided for in the agreements. In case the amount accrued for this concept it not enough to offset the total funds transferred by CAMMESA to the Company, they shall be accrued in a special account “Available Agreements Account”. In order to materialize the conditions established above, the Company and CAMMESA should enter into the corresponding addendum to the agreements.
On July 3, 2015, the Company entered into the addendum with CAMMESA to the Availability Agreements for Combined Cycles and Turbosteam. These Agreements regulations plus the amendments introduced by the addendum regulate the agreement between the parties and they shall be understood as entirely valid until the validity term established in such agreements expires.
As a consequence of the above, during the fiscal year 2015 a decrease of Ch$1,021 million was recognized in the revenues for sales and other operational income / expense of Ch$4,193 million.
- In December 2014, the Vuelta de Obligado (“VOSA”) thermal plant started to operate it open cycle with two gas turbines of 270 MW each, it is expected the closing as combined cycle of high efficiency in October 2016.
In accordance with a technical report issued by VOSA’s authorities, the gas turbines have passed all operational tests and have functioned properly. There is still pending to nationalize very few components to complete stage two, and there is certainty that the works will be completed and implemented in 2016.
Based on above, in December 2015, were accounted for the effects of the dollarization of the receivables, resulting in the recognition of the following income:
- Exchange difference for dollarization of the receivables at an exchange rate lower than the closing exchange rate of 2015 for $1,323,430,283 Argentine pesos (ThCh$93,699,288) in Chocón; $129,092,580 Argentine pesos (ThCh$9,139,796) in Costanera; and $546,902,547 Argentine pesos (ThCh$38,720,876) in Dock Sud.
- Interest accrued between the maturity date of each sale settlement contributed to the VOSA project and the sign-off date of the Agreement, at the interest rate that CAMMESSA obtain for its financial deposits, capitalized and dollarized in accordance with above, for a total of $49,797,906 Argentine pesos (ThCh$3,525,708) in Chocón.
- Interest accrued on dollarized receivables, once included the interests mentioned in previous paragraph, at an interest rate LIBOR 30 days + 5%, for a total of $493,816,698 Argentine pesos (ThCh$34,962,380) in Chocón; $43,989,703 (ThCh$3,114,485) in Costanera; and $218,604,914 (ThCh$15,477,298) in Dock Sud.
- On July 25, 1990, the Italian Government authorized MedioCredito Centrale to grant a financial loan to the Government of the Republic of Argentina of up to US$ 93,995,562 aimed to finance the acquisition of assets and the delivery of services of Italian origin, used in the restoration of four groups at the thermal station owned by Servicios Eléctricos del Gran Buenos Aires (“SEGBA”)(Electric Services for Great Buenos Aires). This credit financed the acquisition of assets and services included in the Work Order Nº 4322 (the “Order”) issued by SEGBA in favor of a consortium headed by Ansaldo S.p.A. from Italy.
| | |
| The accompanying notes are an integral part of these consolidated financial statements | | |
|
| F-155 |
According to the terms of the “Contract related to the Work Order Nº 4322”: (i) SEGBA granted to Central Costanera S.A. a power to manage the execution of the services contained in the Order, and it performed the works and services that according to the Order corresponded to SEGBA; and (ii) Central Costanera S.A. undertook to pay to the Secretary of Energy of the Nation (the “Secretary of Energy”) the capital instalments plus interests originated by the loan granted by MedioCredito Centrale, at an annual rate of 1.75% (the “Contract”).
As a collateral for the compliance with the economic obligations undertaken by Central Costanera S.A., the buyers set up a pledge over the total shares owned by them. In the event of non-compliance which provokes the execution of the collateral, the Secretary of Energy will be entitled to immediately proceed with the sale of the pledged shares through a public bid, and it could exercise the political rights corresponding to the pledged shares.
By reason of application of Law Nº 25.561, Decree Nº 214/02 and its regulatory stipulations, the payment obligation by Central Costanera S.A. resulting from the Contract and subject to the Argentinian legislation was mandatorily converted into pesos, at a ratio of one peso equivalent to one dollar of the United States, plus the application of the stabilization reference coefficient (“CER”), maintaining the original interest rate of the obligation.
On January 10, 2003, the National Executive Power enacted Decree Nº 53/03 which amended Decree Nº 410/02 by incorporating a paragraph j) in its first article. By means of this standard, the obligation to deliver funds in foreign currency to the province states, municipalities, companies of the public and private sector and the National Government originated by subsidiary or other nature loans and guarantors originally financed by multilateral credit organizations, or originated by liabilities assumed by the National Treasury and refinanced with external creditors is exempt from the mandatory conversion into pesos.
Central Costanera S.A. considers that the loan resulting from the Contract does not match with any of the assumptions provided for in Decree Nº 53/03, and even if it did, there are solid grounds to consider Decree Nº 53/03 unconstitutional since it evidently violates the principle of equality and the right of property as established in the National Constitution.
On May 30, 2011, the Company repaid the last instalment of the loan’s capital and notified this fact to the Secretary of Energy and to the Secretary of Finance and, even if as of the date of these financial statements the Secretary of Energy has not made any claim for the payments effected by Central Costanera S.A., on October 22, 2015 we received a letter from the Secretary of Finance – Directorate for the Administration of the Public Debt, which indicates that the Ministry of Economy and Public Finance included the balance of the debt for the financial credit with MedioCredito Centrale in the agreement entered into with the Club of Paris creditors on April 30, 2014. According to the letter, the Secretary also claims from Costanera the reimbursement of US$5,472,703.76 without providing grounds for such request.
As a result, Costanera rejected the indicated requirement indicating, among other, that (i) it does not have a debt related to the Contract since on May 30, 2011, the Company repaid the last instalment of it and notified such circumstance to the Secretary of Energy and to the Secretary of Finance, (ii) the creditor has not expressed any caution to the Contract payments derived from the mandatory conversion into pesos imposed by the Argentinian legislation, and (iii) notwithstanding the fact that the Company does not acknowledge the terms of the agreement entered into with the Club of Paris creditors, the decisions of the Argentinian Government regarding the debt with such organization are unrelated to the Company.
The Secretary of Finance, due to the rejection from Costanera, submitted the DADP Note No. 2127/2015 attaching Resolution DGAJ No. 257501 from the Ministry of Economy and Public Finance, insisting in the existence of the debt and requesting the Company to pay the claimed amounts. The Company filed a hierarchy appeal so as to the Minister of Economy and Public Finance revoke the petition of the note due to lack of legitimacy.
Edesur S.A.
- On March 11, 2015, the Secretary of Energy issued Resolution No. 32/2015, which establishes the following among the most important points: (i) it approves a transitory increase for Edesur with validity as from February 1st, 2015 aimed exclusively to pay the energy acquired from the electric market, salaries and assets and services supply; such increase, on account of the Integral Tariff Review (RTI) which date has not been defined, arises from the difference between a theoretical tariff framework and the tariff framework in force for each category of user, according to the calculations of the Ente Nacional Regulador de la Electricidad (E.N.R.E.)(National Regulatory Entity of Electricity), which shall not be converted into tariff but it will be covered by means of transfers from CAMMESA with funds of the National Government; (ii) as from February 1st , 2015 the funds of the Program for Rational Use of Electric Energy (PUREE) shall be considered as a part of Edesur revenues, also on account of the RTI; (iii) it confirms the procedure of the Cost Monitoring Mechanism (MMC) until January 31, 2015; and (iv) it instructs CAMMESA to issue LVFVD in the amounts determined by the E.N.R.E. by virtue of the higher salary costs of the Company originated by the application of Resolution N° 836/2014 of the Secretary of Labor. In addition, it allows for payment of remaining balances in favor of the Electric Wholesales Market (MEM) by means of a payment plan to be defined. Also, it instructs E.N.R.E. to initiate actions
| | |
| The accompanying notes are an integral part of these consolidated financial statements | | |
|
| F-156 |
prior to the RTI processing. As a consequence of the above, during the year ended December 31, 2015 were recognized revenues for Ch$352,108 million, which are presented in the statement of comprehensive income as follows: for point (i), Ch$264,987 million in the line item “Other income Res. SE N° 32/2015” and Ch$644 million in the line “Financial income”; for point (ii), Ch$33,972 million within “Revenues from Services” (sales of energy); and for points (iii) and (iv), Ch$52,505 million in “Other net operating income”. Although Resolution SE N° 32/2015 represents a first step towards the improvement of the Company’s economic situation, investments will continue being financed through mutual agreements with CAMMESA, as it remains pending to find mechanisms allowing for repayment of the remaining balances in favor of the MEM, as well as the updating of revenues that contemplate future increases in the operational costs.
On the other hand and regarding the above, on June 29, 2015 the SE released its Note N° 1,208 by which it instructs CAMMESA on the method to calculate the debts maintained by Edesur with the MEM for the economic transaction of energy accrued as of January 31, 2015 and their offsetting with the credits arising from the application of the MMC. As a result, during the year ended December 31, 2015 net financial income was recognized amounting to Ch$27,216 million. As of the date of these financial statements the indicated instructions is being implemented.
In accordance with Article 5 of Resolution No. 32/2015, the transitory increase approved was subsequently updated through Notes SE No. 2097 and 2157, on November 12 and 16 of 2015, respectively, as a result of the periodic monitoring performed by the ENRE over the operational cost trends of the Company.
Likewise, Edesur requested to the ENRE, the modification of the tariff table in the terms established in Articles No. 46 and 47 of Law 24,065 in order to reflect the amounts imposed of by Resolution of the Secretary of Labor (ST) No. 1906/2012 and the minute of meeting subscribed on February 26, 2013 with the national authorities and the Ministry of Labor, which defined the increases in the remuneration requested by the “Luz y Fuerza” Union for its own employees and those of the subcontractors. The ENRE rejected both requests; however, stated to intervene with the SE in the terms established in Resolution MPFIPyS No. 2000/2006, which is still pending of notice.
Lastly, on December 16, 2015, the new national authorities declared through Decree 134/2015, the emergency at the National Electrical Sector effective until December 31, 2017. The Decree instructed to the Ministry of Energy and Mining to elaborate and implement an action plan with the necessary activities for the generation, transmission and distribution segments within national jurisdiction, aimed to adapt the quality and safety of the energy supply and to ensure the rendering of electrical public services under appropriate technical and economic conditions.
The delay in compliance with certain milestones established in the Agreement Act had an impact in the liquidity ratio. The Company believes that the adverse effects as a result of the lack in timely application of the rights for adjustment in its revenues will be reversed with the tariffs resetting.
- On July 12, 2012, the E.N.R.E. through Resolution N° 183/2012 appointed Luis Miguel Barletta as observer in Edesur, in charge of overseeing and controlling the current administrative actions and delivery related to the normal service rendering by the Company. The appointed observer would be in office for a 45-day renewable term. On July 20, 2012 the Company filed a writ of reconsideration with appeal against Resolution E.N.R.E. Nº 183/2012. The same has rejected the grounds of the Resolution, stating and showing the financial and economic constraints to which Edesur has been subject for years by the E.N.R.E. and other authorities due to their denial to reflect in tariffs the greater costs or the values that must derive from an integral tariff review, or to offer other revenues for the service. The observer function was extended by means of Resolutions E.N.R.E. Nº 246/2012, N° 337/2012 and N° 34/2013, the Decision E.N.R.E. N° 25/2013, Resolution E.N.R.E. N° 243/13 and the Decision E.N.R.E. N° 2/2014 dated January 9, 2014, that extends such appointment for another 90 administrative working days, extendable. On January 30, 2014 the E.N.R.E. issues Resolution N° 31/2014 which given the new Board of Directors at the entity that appointed the engineer Ricardo Alejandro Martínez Leone as Chairman, also appoints the latter as observer at Edesur, in replacement of engineer Luis Miguel Barletta, for a 90 administrative working day term, extendable. The Decision E.N.R.E. N° 36/2014, dated June 17, 2014, extends for another 90 administrative working day term, extendable the appointment of engineer Martínez Leone as observer at Edesur. Decision E.N.R.E. N° 244/2014, dated September 3, 2014 appoints the accountant Rubén Emilio Segura to replace the engineer Martínez Leone as observer at Edesur, for a 90 administrative working day term, extendable. On April 22, 2015 the E.N.R.E. released Resolution N° 128/2015 extending such appointment for 90 administrative working day term. The writ of reconsideration and appeal filed against the mentioned resolution is maintained and extends to the resolutions by which the effects of the observer were extended.
On January 25, 2016, the Ministry of Energy and Mining (“MEyM” in its Spanish acronym) issued Resolution No. 6/2016 which approved the Summer Quarterly Re-scheduling (“Reprogramación Trimestral de Verano”) applicable to the Wholesale Electricity Market (“MEM” in its Spanish acronym) and established the seasonal reference prices for energy and capacity for theFebruary-April 2016 period.
| | |
| The accompanying notes are an integral part of these consolidated financial statements | | |
|
| F-157 |
Additionally, in order to move towards proper management of demand through incentives for saving and rational use of electricity of residential end users (“Plan Estímulo”), implemented through the MEM, an incentive system that will result in a mechanism of decreasing energy prices as counterpart of the effort of each residential user to reduce unnecessary consumption, which will be determined by comparing the monthly energy consumption with the one recorded in the same month of 2015.
Moreover, given the social significance of the electricity service, the previously mentioned Resolution defines an energy volume at a price named Social Tariff (“Tarifa Social”), to be transferred at a minimum price to those included in the population of end users who, based on the criteria of classification communicated by the Ministry of Social Development of the Nation (“Ministerio de Desarrollo Social de la Nación”), lacks sufficient payment capacity to afford the general established prices.
Access to reduced wholesale prices for Social Tariff and incentive for saving are subject to the compliance with, in the case of distribution companies, the payment obligations in the MEM due from the effective date of this Resolution. Likewise, those distribution companies with outstanding debts with CAMMESA as of issuance date of the Resolution, as in the case of Edesur, shall agree to, in no less than 30 business days, a payment plan for the past due debt and, also, to ensure payment of its purchases in the MEM through transferring its accounts receivables or other equivalent alternative mechanism at CAMMESA’s satisfaction, so as to ensure both the collection on current billing and the payment of the installments in the agreement to sign related to the past due debt.
As of the date of issuance of these financial statements, the Company is assessing the effects of Resolution MEyM No. 6/2016.
Subsequently, on January 27, 2016, it was issued Resolution MEyM No. 7/2016 instruction E.N.R.E. to:
i. Adjust the VAD in the tariff tables of the Company, on account of the RTI within the framework of the Transitional Tariff Regime established in the Agreement Act (“Acta Acuerdo”).
ii. Apply a Social Tariff to the population of end users resulting from the application of certain eligibility criteria, namely: be a retiree or pensioner for an amount equivalent to twice minimum salary; employed persons in a dependency relationship earning a gross remuneration lower or equal to two minimum salaries; be beneficiary in social programs; be enrolled in the Social Monotributo Regime; be incorporated in the Social Security Special Regime for domestic service workers; receiving unemployment insurance; or have a disability certificate, being excluded from the benefit those owners of more than real estate, motor vehicles whose models are up to 15 years old, or luxury aircrafts and boats.
iii. Include in the tariff tables the saving of electrical energy plan as stated in Resolution MEyM No. 6/2016.
iv. Carry out all necessary activities to proceed to the RTI, which must be effective before December 31, 2016.
In order for users to improve their household finances, the ENRE shall have the necessary means in terms of implementing the monthly payments for the distribution public service rendered by the Company.
Furthermore, Resolution MEyM N° 7/2016 annulled the Energy Efficiency Program (“PUREE” in its Spanish acronym) from the effective date of the new tariff values and will cease the application of the planned projects financing mechanism by mutual loans with CAMMESSA.
Finally, the Resolution established that the dividend distribution must agree the Agreement Act, which subordinate to verification from the ENRE of compliance with the investment plan.
Centrales Hidroeléctricas de Aysén, S.A.
In May, 2014, the Committee of Ministers revoked the Environmental Qualification Resolution (RCA) of Hidroaysén project in which our subsidiary, Endesa Chile, participates by accepting some of the claims filed against this project. It is of public knowledge that this decision was resorted before the environmental courts of Valdivia and Santiago. On January 28, 2015, it was made public that the water rights request made by Centrales Hidroeléctricas de Aysén S.A. (hereinafter “Hidroaysén”) had been partially denied in 2008. Endesa Chile has expressed its intention to thrive at Hidroaysén the defense for water rights and the environmental qualification granted to the project in the corresponding instances, continuing with the judicial actions already started or implementing new administrative or judicial actions that are necessary to this end, and it maintains the belief that hydric resources of Aysén region are important for the energy development of the country. Nevertheless, given the current situation, there is uncertainty on the recovery of the investment made so far at Hidroaysén, since it depends both from judicial decisions and from definitions in the energy agenda which cannot be foreseen at present, consequently the investment is not included in the portfolio of
| | |
| The accompanying notes are an integral part of these consolidated financial statements | | |
|
| F-158 |
Endesa Chile’s immediate projects. Consequently, at closing of Fiscal Year 2014, Endesa Chile recorded a provision for impairment of its participation in Hidroaysén S.A. amounting to Ch$ 69,066 million (approximately US$ 121 million). See note 14.1.a). The financial and accounting effects for Enersis Américas of the impairment provision at Endesa Chile for its ownership interest in Hidroaysén resulted into a charge against net income from discontinued operations of Ch$ 41,426 million (approximately US$ 73 million).
37. PERSONNEL FIGURES.
Enersis Américas personnel, including that of subsidiaries and jointly-controlled companies in the five Latin American countries where the Group is present, is distributed as follows as of December 31, 2015 and 2014:
| | | | | | | | | | | | | | | | | | | | |
| Country | | 12-31-2015 | | | | | |
| | Managers
and Main
Executives | | | Professionals
and
Technicians | | | Workers
and
Others | | | Total | | | | | Average for
the Period |
Chile | | | 68 | | | | 1,911 | | | | 266 | | | | 2,245 | | | | | 2,364 |
Argentina | | | 46 | | | | 3,609 | | | | 1,168 | | | | 4,823 | | | | | 4,724 |
Brazil | | | 26 | | | | 2,174 | | | | 459 | | | | 2,659 | | | | | 2,686 |
Peru | | | 42 | | | | 889 | | | | - | | | | 931 | | | | | 941 |
Colombia | | | 36 | | | | 1,480 | | | | 28 | | | | 1,544 | | | | | 1,633 |
Total | | | 218 | | | | 10,063 | | | | 1,921 | | | | 12,202 | | | | | 12,348 |
| | | | | | | | | | | | | | | | | | | | |
| Country | | 12-31-2014 | | | | | |
| | Managers
and Main
Executives | | | Professionals
and
Technicians | | | Workers
and
Others | | | Total | | | | | Average for
the Period |
Chile | | | 101 | | | | 2,113 | | | | 310 | | | | 2,524 | | | | | 2,503 |
Argentina | | | 29 | | | | 3,335 | | | | 1,109 | | | | 4,473 | | | | | 4,223 |
Brazil | | | 28 | | | | 2,395 | | | | 272 | | | | 2,695 | | | | | 2,648 |
Peru | | | 18 | | | | 792 | | | | 141 | | | | 951 | | | | | 944 |
Colombia | | | 34 | | | | 1,568 | | | | 30 | | | | 1,632 | | | | | 1,613 |
Total | | | 210 | | | | 10,203 | | | | 1,862 | | | | 12,275 | | | | | 11,931 |
It is important to note that Enersis Américas’ operations in Chile, beginning on February 1, 2016, are part of the new company named Enersis Chile (See Note 3.k, 5.1 and 41), which is being held for distribution to owners.
| | |
| The accompanying notes are an integral part of these consolidated financial statements | | |
|
| F-159 |
38. SANCTIONS.
The following companies belonging to the Group have received sanctions from the administrative authorities:
1. Edesur S.A.
| | - | From January 1, 2013 to June 30, 2013, Edesur S.A. received 150 fines from the Energy Regulatory Body (Ente Nacional Regulador de la Electricidador ENRE) totaling $23,640,000 Argentine pesos (approximately ThCh$1,287,437) for failure to comply with regulations on technical and commercial quality and on road and highway safety. Appeals against the fines have been filed. |
| | - | From July 1, 2013 to September 30, 2013, Edesur S.A. received 111 fines from the Electricity Regulatory Body (ENRE) amounting to $28,270,000 Argentine pesos (approximately ThCh$1,539,588) for failure to comply with technical and commercial quality regulations, and $1,536,000 Argentine pesos (approximately ThCh$83,651) for failure to comply with road and highway safety regulations. Appeals against the fines have been filed. |
| | - | From October 1, 2013 to December 31, 2013, Edesur S.A. received 8 fines from the Electricity Regulatory Body (ENRE) amounting to $2,766,029 Argentine pesos (approximately ThCh$150,638) for failure to comply with technical and commercial quality regulations, and $4,973,300 Argentine pesos (approximately ThCh$270,846) for failure to comply with road and highway safety regulations. Appeals against the fines have been filed. |
| | - | From January 1, 2014 to June 30, 2014, Edesur S.A. received 13 fines from the Electricity Regulatory Body (ENRE) amounting to $10,685,000 Argentine pesos (approximately ThCh$581,906) for failure to comply with technical and commercial quality regulations, and 20 fines totaling $26,975,000 Argentine pesos (approximately ThCh$1,469,062) for failure to comply with road and highway safety regulations. In addition, the company has been ordered to pay $389,000,000 Argentine pesos (approximately ThCh$21,184,988) in compensation to users. |
| | - | From July 1, 2014 to September 30, 2014, Edesur SA received 3 fines from the Electricity Regulatory Body (ENRE) amounting to $114,627 Argentine pesos (approximately ThCh$6,243) for failure to comply with technical and commercial quality regulations, and 12 fines totaling $13,112,132 Argentine pesos (approximately ThCh$714,088) for failure to comply with road and highway safety regulations. |
| | - | From October 1, 2014 to December 31, 2014, Edesur SA received 4 fines from the Electricity Regulatory Body (ENRE) amounting to $35,914,427 Argentine pesos (approximately ThCh$1,955,904) for failure to comply with technical and commercial quality regulations, and 11 fines totaling $19,853,878 Argentine pesos (approximately ThCh$1,081,245) for failure to comply with road and highway safety regulations. |
| | - | From January 1, 2015 to March 31, 2015, Edesur S.A. received 3 fines from the Electricity Regulatory Body (ENRE) amounting to $10,532,955.18 Argentine pesos (approximately ThCh$573,626) for failure to comply with technical and commercial quality regulations, and 7 fines totaling $3,524,428 Argentine pesos (approximately ThCh$191,941) for failure to comply with road and highway safety regulations. |
| | - | From April 1, 2015 to June 30, 2015, Edesur S.A. received 8 fines from the Electricity Regulatory Body (ENRE) amounting to $36,646,432.59 Argentine pesos (approximately ThCh$1,955,769) for failure to comply with technical and commercial quality regulations. |
| | - | From July 1, 2015 to September 30, 2015, Edesur S.A. received 2 fines from the Electricity Regulatory Body (ENRE) amounting to $11,989,572.66 Argentine pesos (approximately ThCh$652,954) for failure to comply with technical and commercial quality regulations, and 5 fines totaling $7,093,752 Argentine pesos (approximately ThCh$386,327) for failure to comply with road and highway safety regulations. |
| | - | From October 1, 2015 to December 31, 2015, Edesur S.A. received 6 sanctions from the Electricity Regulatory Body (ENRE) amounting to $31,081,214 Argentine pesos (approximately ThCh$1,692,687) for failure to comply with technical and commercial quality regulations, and one fine totaling $21,840,000 Argentine pesos (approximately ThCh$1,189,409) for failure to comply with road and highway safety regulations. |
| | |
| The accompanying notes are an integral part of these consolidated financial statements | | |
|
| F-160 |
2. Hidroeléctrica El Chocón S.A.
| | - | During 2013, the Electricity Regulatory Body (ENRE) imposed a fine of Th$20 Argentine pesos (approximately ThCh$1,089) on the company. HECSA has filed an appeal. |
| | - | From January 1, 2014 to March 31, 2014 the Electricity Regulatory Body (ENRE) imposed a fine of Th$11 Argentine pesos (approximately ThCh$599). The company has filed an appeal. |
| | - | Finally, from April 1, 2014 to June 30, 2014 the Electricity Regulatory Body (ENRE) imposed two fines amounting to Th$3 Argentine pesos (approximately ThCh$163). |
| | - | During the year ended December 31, 2015, no fines have been imposed by the ENRE. |
3. Central Costanera S.A.
| | - | During the 2012 fiscal year and through to June 30, 2013, the company received two fines for a total amount of Th$47 Argentine pesos (approximately ThCh$2,560) from the General Customs Authority (Dirección General de Aduanas). Possible liability on the part of a supplier, Mitsubishi; is being assessed, in which case that amount could be claimed from this supplier. The ENRE also imposed two fines totaling Th$51 Argentine pesos (approximately ThCh$2,777). The company has filed an appeal. |
| | - | From April 1, 2014 to June 30, 2014 the Electricity Regulatory Body (ENRE) imposed a fine of Th$40 Argentine pesos (approximately ThCh$2,178), which was paid on June 30, 2014. |
| | - | Finally, from July 1, 2014 to December 31, 2014 the Electricity Regulatory Body (ENRE) imposed a fine of Th$102 Argentine pesos (approximately ThCh$5,555), which was paid on November 20, 2014. |
| | - | During the year ended December 31, 2015, the Federal Administration of Public Revenue imposed of a fine of Th$59 Argentine pesos (approximately ThCh$3,185) and the payment of difference in taxes of Th$10 Argentine pesos (ThCh$1) for violation of Article 970 of the Customs Code (i.e., for not having re-imported to the Country within the time period granted, goods temporarily exported). The company appealed to the sanction because it duly complied, in time and substance, with re-entering the re-importing of the goods temporarily exported, which was evidenced with the corresponding supporting documentation. |
4. Central Dock Sud S.A.
| | - | During 2013, Central Dock Sud S.A. (CDS) was fined $794.11 Argentine pesos (approximately ThCh$43) by the Electricity Regulatory Body (ENRE) as a generating company on the Argentine wholesale electricity market (Mercado Eléctrico Mayoristaor MEM), for failure to comply with Appendix 24 of The Procedures (Resolution ex-S.E. 61/92 and its amendments and additions) due to unavailability of Data Links on the Real-time Operating System (SOTR, its acronym in Spanish), during the period January to June 2012. |
| | - | On July 30, 2013 Central Dock Sud S.A. (CDS) was fined $3,202.66 Argentine pesos (approximately ThCh$174) by the Electricity Regulatory Body (ENRE), for failure to comply with Appendix 24 of The Procedures (Resolution ex-S.E. 61/92 and its amendments and additions) due to unavailability of Data Links on the Real-time Operating System (SOTR, its acronym in Spanish), during the period January to June 2013. The company paid the fine. |
| | - | From January 1, 2014 to June 30, 2014 Central Dock Sud S.A. (CDS) was fined $5,516.57 Argentine pesos (approximately ThCh$300) by the Electricity Regulatory Body (ENRE), for failure to comply with Appendix 24 of The Procedures (Resolution ex-S.E. 61/92 and its amendments and additions) due to unavailability of Data Links on the Real-time Operating System (SOTR, its acronym in Spanish), during the period July to December 2012. The company paid the fine. |
| | - | During the year ended December 31, 2015, no fines have been imposed by the ENRE. |
5. Yacylec S.A.
| | - | During 2013, the Electricity Regulatory Body (ENRE) issued a penalty for transmission line down-time for a transmission line that was operated by Yacylec S.A. for $53,585 Argentine pesos (approximately ThCh$2,918). Yacylec S.A. made a partial payment of $1,668 Argentine pesos (approximately ThCh$91). |
| | |
| The accompanying notes are an integral part of these consolidated financial statements | | |
|
| F-161 |
| | - | During 2014, the Electricity Regulatory Body (ENRE) issued a penalty for transmission line down-time for Th$231,925 Argentine pesos (approximately ThCh$12,631). To date fines plus interests amounting to $321,254 Argentine pesos (approximately ThCh$17,496) were transferred by Transener S.A. to Yacylec S.A. for collection, which are pending payment to the Argentine regulatory bodies as they have not yet adjusted the remuneration applicable to Yacylec S.A. |
| | - | During 2015, the Electricity Regulatory Body (ENRE) issued a penalty for transmission line down-time for $26,130 Argentine pesos (approximately ThCh$1,423). To date fines plus interests amounting to $17,313 Argentine pesos (approximately ThCh$943) were transferred by Transener S.A. to Yacylec S.A. for collection, of which $5,078 Argentine pesos (approximately ThCh$277) and $12,235 Argentine pesos (approximately ThCh$666) were deducted from CAMMESA from the payments of the monthly remuneration during the year 2015. The remaining balance is pending payment to the Argentine regulatory bodies as they have not yet adjusted the remuneration applicable to Yacylec S.A. |
6. Transportadora de Energía S.A.
| | - | During 2013, the Electricity Regulatory Body (ENRE) issued penalties for programmed maintenance related matters in the Rincón Santa Maria transformer station and transmission line down-time for $38,487.65 Argentine pesos (approximately ThCh$2,096). Transportadora de Energía S.A. made in 2014 a partial payment, including interest, of $46,072.38 Argentine pesos (approximately ThCh$2,509). |
| | - | During 2014, the Electricity Regulatory Body (ENRE) issued penalties for programmed maintenance related matters at the Rincón Santa Maria transformer station and transmission line down-time for $15,820 Argentine pesos (approximately ThCh$862). In 2014, Transportadora de Energía S.A. made a partial payment, including interest, of $17,951 Argentine pesos (approximately ThCh$978). |
| | - | During 2015, the Electricity Regulatory Body (ENRE) issued penalties for programmed maintenance related matters in the Rincón Santa Maria transformer station and transmission line down-time for $17,104 Argentine pesos (approximately ThCh$931). To date, Trasportadora de Energía S.A. made a partial payment, including interest, of $21,087 Argentine pesos (approximately ThCh$1,148). |
7. Compañía de Transmisión del Mercosur S.A.
| | - | During 2013, the Electricity Regulatory Body (ENRE) issued five penalties for programmed maintenance related matters in the Rincón Santa Maria transformer station and transmission line down-time for $7,896.95 Argentine pesos (approximately ThCh$430). Compañía de Transmisión del Mercosur S.A. in 2013 and 2014 made a payment of $11,337.32 Argentine pesos (approximately ThCh$617) including interest. |
| | - | During 2014, the Electricity Regulatory Body (ENRE) issued three penalties for programmed maintenance related matters at the Rincón Santa Maria transformer station for $5,728 Argentine pesos (approximately ThCh$312). Compañía de Transmisión del Mercosur S.A. in 2014 made a payment of $8,181 Argentine pesos (approximately ThCh$446) including interest. |
| | - | During 2015, the Electricity Regulatory Body (ENRE) issued two penalties for programmed maintenance related matters in the Rincón Santa Maria transformer station and transmission line down-time for $34,618 Argentine pesos (approximately ThCh$1,885). Compañía de Transmisión del Mercosur S.A. made a partial payment, including interest, of $44,749 Argentine pesos (approximately ThCh$2,437). |
8. Ampla Energía S.A.
| | - | The company received seven fines in 2013 totaling $29,810,687 Brazilian reals (approximately ThCh$5,421,624) from the National Electrical Energy Agency (Agencia Nacional de Energía Eléctricaor ANEEL) due to problems with technical quality, erroneous evidence presented in inspections and for other reasons. The company appealed, and four fines are still awaiting final rulings. The other fines were either revoked or paid, for a total of $143,601 Brazilian reals (approximately ThCh$26,116). |
| | - | In 2013, the company received 19 fines totaling $120,204 Brazilian reals* (approximately ThCh$21,861) from the environmental agencies (IBAMA - Instituto Brasileiro do Meio Ambiente e dos Recursos Naturais Renováveis, ICMBio - Instituto Chico Mendes de Conservação da Biodiversidade, INEA – Instituto Estadual de Ambiente and others) for unauthorized removal of vegetation, the death of animals through contact with the energy network, and construction in prohibited areas or without permission. The company filed appeals against almost all of the fines assessed, but no ruling has yet been given. Ampla has paid $66,310 Brazilian reals in fines (approximately ThCh$12,060). |
(*) Clarification: The amount of some of the fines has not yet been determined; the amounts will be set after Ampla submits certain data.
| | |
| The accompanying notes are an integral part of these consolidated financial statements | | |
|
| F-162 |
| | - | In 2013, the company received four fines totaling $24,234 Brazilian reals (approximately ThCh$4,407) from the Consumer Defense and Protection Agency (Autarquía de Defensa a Protección del Consumidor,PROCON/RJ) due to problems in reimbursing improper charges and other irregularities. The company has filed appeals against all of the fines, and rulings are pending. |
| | - | The company received one fine in 2013 from the employee defense agencies (SRTE) due to problems with formalities. The company filed an appeal, and the ruling is pending. The labor agencies have not specified the amount of the fine, which it does only after analyzing the appeal. |
| | - | In 2014, the company received two fines from the National Electrical Energy Agency (ANEEL) for technical quality, totaling €6,759,518 (approximately ThCh$5,223,165). The company has appealed, and one was rejected, while the other is still pending resolution. Ampla has paid €1,202,986 (approximately ThCh$929,563). In 2013, Ampla was fined 7 times for service quality totaling €9,368,747 (approximately ThCh$7,239,350), and has paid €843,869 (approximately ThCh$652,068). There are two appeals pending, which were filed by Ampla against the 2013 fines. |
| | - | The company received 15 fines in 2014 totaling €80,263* (approximately ThCh$62,020) from the environmental agencies (ICMBio,Instituto Chico Mendes de Conservação da Biodiversidade and the INEA,Instituto Estadual de Medioambiente yórgano municipal del medioambiente) for unauthorized removal of vegetation, the death of animals that have come in contact with the power network, waste dumping and power network construction in prohibited or unauthorized areas. The company has appealed almost all of the fines assessed, but no rulings have been handed down as yet. Ampla has paid €460 (approximately ThCh$355) in fines. The company received 19 fines in 2013 totaling €35,940* (approximately ThCh$27,771) from the environmental agencies for the same violations as in 2014. The company filed appeals against almost all of the fines received, but no rulings have been handed down as yet. Ampla paid three fines totaling €19,826 (approximately ThCh$15,320) in 2013. |
(*) Clarification: The amount of some of the fines has not yet been determined; the amounts will be set after Ampla submits certain data.
| | - | Ampla has received 14 fines in 2014 totaling €665,565 (approximately ThCh$514,291) from the Brazilian Consumer Defense and Protection Agency (PROCON/RJ) for problems with the quality of its power supply. It has appealed the fines, only one appeal has been resolved, and Ampla has paid €1,958 (approximately ThCh$1,513). It received four fines totaling €7,616 (approximately ThCh$5,885) in 2013, for which appeals filed by Ampla also remain pending. |
| | - | In 2014, the company received four fines from the employee defense agencies (SRTE) against which it has filed administrative appeals. An appeal was rejected and Ampla has paid the amount of €61.74 (approximately ThCh$48); the others have not yet received rulings. In 2013, Ampla received one fine for €641 (approximately ThCh$495) which has already been paid. |
| | - | In 2015, the company received 2 fines totaling €126,434 (approximately ThCh$97,689) the National Electrical Energy Agency (ANEEL) for “lower income” tariff matters. The appeals presented from Ampla were partially accepted and the amount of the fines was reduced to €101,173 (approximately ThCh$78,178). Ampla paid the fines. In 2014, Ampla received 2 fines totaling €6,743,609 (approximately ThCh$5,210,872) for quality of service, of which Ampla has paid €974,291 (approximately ThCh$752,847). There is pending of analysis one appeal filed by Ampla against a fine from 2014. |
| | - | The company received 36 fines in 2015 totaling €197,563 (approximately ThCh$152,659) from the environmental agencies (ICMBio,Instituto Chico Mendes de Conservação da Biodiversidade and the INEA,Instituto Estadual de Medioambiente yórgano municipal del medioambiente) being 8 warnings and 28 fines for power network construction in prohibited or unauthorized areas, the death of animals at a substation and unauthorized removal of vegetation and others (notification non-compliance). The company has appealed almost all of the fines assessed, but no rulings have been handed down as yet. Ampla has paid €540 in fines in 2015. In 2014, the company received 15 fines totaling €80,263* (approximately ThCh$62,020) from the environmental agencies (ICMBio,Instituto Chico Mendes de Conservação da Biodiversidade and the INEA,Instituto Estadual de Medioambiente yórgano municipal del medioambiente) for unauthorized suppression of vegetation, the death of animals that have come in contact with the power network, waste dumping and power network construction in prohibited or unauthorized areas. The company has appealed almost all of the fines received, but no rulings have been handed down as yet. Ampla has paid €460 (approximately ThCh$355) in fines. |
(*) Clarification: The amount of some of the fines has not yet been determined; the amounts will be set after Ampla submits certain data.
| | |
| The accompanying notes are an integral part of these consolidated financial statements | | |
|
| F-163 |
| | - | In 2015, Ampla has received 11 fines totaling €1,768,001 (approximately ThCh$1,366,157) from the Brazilian Consumer Defense and Protection Agency (PROCON/RJ) for problems with the quality of its power supply. Ampla has filed 5 appeals against the fines and there are 6 administrative appeals pending of judgment from the agency. In 2014, Ampla received 14 fines totaling €663,530 (approximately ThCh$512,718). Ampla appealed against all of the fines, which remain pending. Ampla has filed 4 appeals against the fines and there are 8 administrative appeals pending of judgment form the agency. Ampla has paid 2 fines for €2,343 (approximately ThCh$1,810). |
| | - | In 2015, Ampla has not receive any fines from the employee defense agencies (SRTE). In 2014, the company received four fines from the employee defense agencies (SRTE) against which it has filed administrative appeals. An appeal was rejected and Ampla has paid the amount of €62 (approximately ThCh$48); the others have not yet received rulings. |
9. Companhia Energética do Ceará (Coelce)
| | - | In 2013, the company received 32 fines totaling $34,877,282 Brazilian reals (approximately ThCh$6,343,078) from the National Electrical Energy Agency (ANEEL) or its local representative (ARCE) for accidents with third parties (there were seven), problems with technical quality, erroneous evidence submitted in inspections, irregularities with the Coelce Plus Project, and other reasons. The company has filed appeals, and final decisions are pending on 26 sanctions. The other fines were either revoked or paid, for a total of $395,125 Brazilian reals (approximately ThCh$71,861). |
| | - | The company was not fined by the environmental agencies in 2014 and 2013 (IBAMA,Instituto Brasileiro do Meio Ambiente e dos Recursos Naturals Renováveis, and ICMBio,Instituto Chico Mendes de Conservação da Biodiversidade). |
| | - | Coelce received four fines in 2013 totaling $21,837 Brazilian reals (approximately ThCh$3,971) from the Consumer Defense and Protection Agency (PROCON/CE) for alleged violations of consumer rights. The company filed appeals against the fines, and one has yet to be resolved. The other appeals were rejected, and Coelce paid $15,901 Brazilian reals (approximately ThCh$2,892) in fines. |
| | - | The company received two fines in 2013 from the employee defense agencies (SRTE) due to problems with formalities. The appeal filed by the company was unsuccessful, and the amount of $9,694 Brazilian reals (approximately ThCh$1,763) was paid. |
| | - | The company has received eight fines in 2014 totaling €8,702,775 (approximately ThCh$6,724,745) from the National Electrical Energy Agency (ANEEL) or its local representative (ARCE) for accidents with third parties among the population, technical quality and errors in the asset base. Coelce has paid €16,319 (approximately ThCh$12,610) for one of the fines, and has appealed the remainders. The company received 32 fines from ANEEL or ARCE in 2013 totaling €10,938,249 (approximately ThCh$8,452,124) for accidents with third parties among the population (there were seven), problems with technical quality, erroneous evidence presented during inspections, irregularities with the Coelce Plus Project and other reasons. The company filed appeals, of which 17 are still pending the final ruling. The other fines were either revoked or paid, for a total of €1,418,561 (approximately ThCh$1,096,140). |
| | - | The company was not fined by the environmental agencies in 2014 and 2013 (IBAMA,Instituto Brasileiro do Meio Ambiente e dos Recursos Naturals Renováveis, and ICMBio,Instituto Chico Mendes de Conservação da Biodiversidade). |
| | - | In 2014, the company received four fines in 2014 from the Brazilian Consumer Defense and Protection Agency (PROCON/CE), amounting to €24,743 (approximately ThCh$19,119), for alleged missed deadlines and damage to equipment. Coelce has filed three administrative appeals and paid one fine for €933 (approximately ThCh$721). The company received four fines in 2013 from PROCON/CE totaling €7,220 (approximately ThCh$5,579) for allegedly violating consumers’ rights. The company filed appeals against the fines without success and Coelce has paid the fines. |
| | - | In 2014, the company received six violation notifications from the employee defense agencies (SRTE), for accidents suffered by workers. It received two fines in 2013 from the SRTE for failure to comply with formalities. Coelce paid €3,206 (approximately ThCh$2,477) for the 2013 fines. |
| | - | In 2015, the company has received 4 fines totaling €2,517,677 (approximately ThCh$1,945,441) from the National Electrical Energy Agency (ANEEL) or its local representative (ARCE) for technical quality problems, the company filed appeals against these fines. Coelce has paid €85,593 (approximately ThCh$66,139) for two of the fines. The two remaining two appeals are pending. In 2014, the company received 8 fines totaling €8,676,161 (approximately ThCh$6,704,180) for accidents with third parties among the population, technical quality and errors in the asset base. Coelce has paid €16,270 (approximately ThCh$12,572) for two of the fines, and has appealed against the rest. |
| | |
| The accompanying notes are an integral part of these consolidated financial statements | | |
|
| F-164 |
| | - | In 2015, the company has received 1 fine totaling €5,406 (approximately ThCh$4,177) for unauthorized suppression of vegetation and other (notification noncompliance). The company has filed appeals against the fine received, but has yet to be resolved. In 2014, the company was not fined by the environmental agencies (IBAMA,Instituto Brasileiro do Meio Ambiente e dos Recursos Naturals Renováveis, and ICMBio,Instituto Chico Mendes de Conservação da Biodiversidade). |
| | - | In 2015, the company has received 3 fines from the Brazilian Consumer Defense and Protection Agency (PROCON/CE) amounting to €1,649,834 (approximately ThCh$1,274,848) for alleged missed deadlines in rendering services. Coelce has paid €7,407 (approximately ThCh$5,723) for one of the fines and filed appeals against two fines, but has yet to be resolved. In 2014, the company received 4 fines totaling €26,492 (approximately ThCh$20,471) for alleged missed deadlines and damage to equipment. Coelce has filed 3 administrative appeals, of which one remain pending. Coelce has paid €6,874 (approximately ThCh$5,312) for these fines. |
| | - | In 2015, the company has received 14 violation notifications from the employee defense agencies (SRTE) for failure to comply with formalities and social contributions. In 2014, the company received six violation notifications from the employee defense agencies (SRTE), also for failure to comply with formalities and social contributions. |
10. CIEN (Companhia de Interconexión Energética S.A.)
| | - | The company received one fine in 2013 for $32,136 Brazilian reals (approximately ThCh$5,845) from the National Electrical Energy Agency (ANEEL) for a formality (a failure to submit documentation). The company appealed, and the decision is pending. |
| | - | The company has not been fined for other matters in 2012 and 2013 (environmental, consumer or labor). |
| | - | CIEN has not been fined by the National Electrical Energy Agency (ANEEL) or by any other supervisory agency in 2014. In 2013, the company received one fine from the National Electrical Energy Agency (ANEEL) for €10,100 (approximately ThCh$7,804) for a formality (a failure to present documentation). CIEN filed an appeal, which was accepted, and the fine was cancelled by the judicial body. |
| | - | In 2014, the company received two fines from the employee defense agencies (SRTE) and the company has filed appeals against them. CIEN has paid a fine of €61.74 (approximately ThCh$48) and the appeal against the other fine has not yet been tried. In 2013, the company was not fined. |
| | - | In 2014 and 2015, CIEN has not been fined by the National Electrical Energy Agency (ANEEL) or any other regulatory body. |
| | - | In 2015, the company was not fined. In 2014, the company received two fines from the employee defense agencies (SRTE) and the company has filed appeals against them. CIEN has paid a fine of €61.74 (approximately ThCh$48) and the appeal against the other fine has not yet been tried. |
| | - | The company has not been fined for other matters in 2014 and 2015 (environmental). |
11. Edelnor S.A.A.
| | - | In February 2013, Edelnor S.A.A. paid a fine of S/1,861.63 (approximately ThCh$387) to SUNAT for failure to pay IGV (Peru’s value added tax) on time. |
| | - | During the 2013 fiscal year, the Supervisory Agency for Investments in Energy and Mines (OSINERGMIN) imposed 23 fines totaling S/2,544,177.91 (approximately ThCh$529,380) on Edelnor S.A.A. for alleged failure to comply with technical and commercial standards. |
| | - | In October 2013, Edelnor SAA was fined by the SUNAT for 2009 income tax assessments. On appeal, a partially favorable result was obtained, so the updated value of the fine became S/4,150,479 (approximately ThCh$863,611), which was paid by Edelnor SAA on September 8, 2014, after applying a rebate. Nonetheless, Edelnor SAA filed an appeal, which as of December 31, 2015, is pending of resolution. |
| | - | During 2014, OSINERGMIN imposed 22 fines on Edelnor S.A.A. totaling S/2,015,383 (approximately ThCh$419,351) for failure to comply with technical and commercial regulations. |
| | |
| The accompanying notes are an integral part of these consolidated financial statements | | |
|
| F-165 |
| | - | Edelnor S.A.A. was fined in June 2014 by the Municipality of Huaral for an alleged omission in the calculation of property tax (impuesto predial) for the years 2010 to 2014. The amount of the fine, restated at March 31, 2015, was S/61,123 (approximately ThCh$12,718). Edelnor S.A.A. appealed against the fine, and it was notified of a resolution annulling the fine. The proceeding resolved in favor of Edelnor. |
| | - | During 2015, OSINERGMIN imposed 10 fines totaling S/1,481,359.57 (approximately ThCh$ 308,234) on Edelnor S.A.A. for failure to comply with technical and commercial standards. |
| | - | In June 2015, Edelnor S.A.A. was fined by the SUNAT for 2010 income tax assessments. In July 2015, Edelnor paid the fine for S/1,612,507 (approximately ThCh$335,522) adopting a current gradually regime. Nonetheless, Edelnor has filed an appeal which as of December 31, 2015, is pending resolution from the SUNAT. |
| | - | In June 2015, OSINERGMIN imposed fines totaling S/23,642 (approximately ThCh$4,919) on Edelnor S.A.A. for alleged omission to declare the Regulation Contribution (Aporte por Regulación) for several months during the year 2014. The fines were not challenged and have already been paid. |
12. Edegel S.A.A.
| | - | In April 2013, Edegel S.A.A. received the following fines by the OSINERGMIN: (i) S/.7,604.57 (approximately ThCh$1,582) for failure to perform maintenance in a timely fashion on its thermal generation units for the last quarter of 2008; (ii) S/.200,941.48 (approximately ThCh$41,811) for failure to perform maintenance in a timely fashion on its hydraulic generation units for the last quarter of 2008; (iii) S/40,700 (approximately ThCh$8,469) (11 Tax Units, UIT) for failure to submit technical justification in a timely fashion for the second quarter of 2008; and (iv) S/.106,073.17 (approximately ThCh$22,071) for failure to have its generation unit available after having been notified that it was required by the SEIN for the fourth quarter of 2008. |
Edegel SAA has not challenged the fines (i) and (iv), and on May 2, 2013, paid them to obtain prompt payment benefits. However, by appeal, Edegel S.A.A. has challenged the fines (ii) and (iii). The Court of Appeals for Energy and Mining Sanctions for OSINERGMIN, notified Edegel S.A.A. on April 15, 2014, that the General Management Resolution imposing the fine was invalid, because the appropriate body was Electrical Oversight Division at OSINERGMIN.
Therefore, on September 1, 2014, Edegel S.A.A. was notified by Resolution No. 1380-2014 of the Electrical Oversight Division at OSINERGMIN, of the same fines contained in the General Management Resolution. In response, Edegel S.A.A. has resubmitted the appeal, noting that sanctions (i) and (iv) were already paid. On September 17, 2014, Edegel S.A.A. filed an appeal with the OSINERGMIN requesting to (1) to file the appeal with the second instance body, (2) to declare valid the petition and (3) to proceed with the determination of the applicable fines.
| | - | In May 2013, Edegel S.A.A. was fined by the SUNAT for issues with its 2007 tax assessment. The amount of the fine, restated at December 31, 2015, was S/.9,755,900 (approximately ThCh$2,029,959). An appeal filed with the Tax Court is pending. |
| | - | In June 2013, Edegel S.A.A. was notified by ElectroPeru S.A. of a penalty applied under contract no. 132991, “Additional Generation Capacity Service through Conversion of Equipment to the Dual Generation System.” The penalty, amounting to S/.481,104.53 (approximately ThCh$100,106), was applied for breach of the conditions for executing the service offered under that contract. |
| | - | In July 2013, Edegel S.A.A. was fined by the OSINERGMIN for S/. 453.86 (approximately ThCh$ 94) for exceeding the deadline to perform maintenance activities to the hydro generation units in accordance with number 6 of the Procedure for the Supevision of the Availability and Operative State of the Generation Units of the SEIN. The fine was paid before the 15 days mandatory requirement for S/. 340.40 (approximately ThCh$ 71). |
| | - | In July 2013, Edegel S.A.A. was fined by the OSINERGMIN for S/. 4,070 (approximately ThCh$ 847) for failure to provide technical justification within the deadline established in number 6 of the Procedure for the Supevision of the Availability and Operative State of the Generation Units of the SEIN. The fine was paid before the 15 days mandatory requirement for S/. 3,052.50 (approximately ThCh$ 635). |
| | - | In November 2013, Edegel S.A.A. was fined S/37,000 (approximately ThCh$7,699 or 10 Tax Units – UIT) by the Callahuanca District Municipality (MDC) in Municipal Resolution 060-2013. The MDC imposed the fine for failure to submit the technical inspection report on multidisciplinary civil defense safety as required under Law 29664 and its regulations. |
| | |
| The accompanying notes are an integral part of these consolidated financial statements | | |
|
| F-166 |
| | - | In November 2013, Edegel S.A.A. was fined by the SUNAT for issues with its 2008 tax assessment. The amount of the fine, restated at December 31, 2015, was S/1,759,227 (approximately ThCh$366,051). The appeal filed is pending resolution by the SUNAT. |
| | - | In December 2013, Scotiabank Peru S.A.A., with whom Edegel S.A.A. has signed a lease agreement for the Santa Rosa Project, was fined by the SUNAT for duties allegedly unpaid in an import operation. The amount of the fine, restated at December 31, 2015, was S/15,721.523 (approximately ThCh$3,271). Scotiabank Peru S.A.A. filed the respective appeal in January 2014 and is yet pending of resolution. |
| | - | On December 23, 2013, the OSINERGMIN filed an administrative proceeding against Edegel S.A.A. for outdated payment of the regulation contribution. Finally, on June 5, 2015, the OSINERGMIN archived the mentioned proceeding. |
| | - | On January 28, 2014, the National Authority of Water (ANA) filed an administrative proceeding against Edegel S.A.A. for reuse of industrial sewage water treated for garden irrigation. Subsequent to Edegel S.A.A presenting its case, on June 5, 2015, ANA archived the proceeding. |
| | - | On March 20, 2014, the OSINERGMIN filed an administrative proceeding against Edegel S.A.A. for non-compliance of current regulations on implementation and execution of theFondo de Inclusión Social Energético (FISE). On June 12, 2015, the proceeding was archived. |
| | - | In May 2014, Electrical Oversight Division Resolution No. 743-2014 issued by the OSINERGMIN on May 27, 2014, notified Edegel S.A. of a fine of 0.50 tax units (UIT) for having violated the CCIT indicator, regarding compliance with the correct calculation of indicators and compensation amounts for voltage quality, in the second half of 2012. The fine was imposed in accordance with number 5.1.2, section B) of the Procedures for Supervising the Technical Standards for Electricity Service Quality and their Methodology Base. The fine for S/. 1,425. (approximately ThCh$297) has been paid. |
| | - | In June 2014, Edegel S.A.A corrected an omission in its 2009 Income Tax following an assessment and paid the associated fine of S/.2,070 (approximately ThCh$431). |
| | - | In September 2014, Edegel S.A.A was fined by the SUNAT for issues with its 2009 tax assessment for an amount updated at September 30, 2014 of S/.315,230 (approximately ThCh$65,591). The fine has been accepted and paid by Edegel. |
| | - | On December 4, 2014, the OSINERGMIN notified Edegel S.A.A. to the filing of an administrative proceeding for non-compliance of the procedures to verify availability and the operative status of the generation units of SEIN. On April 24, 2015, Edegel S.A.A. paid the fine for S/2,928.42 (approximately ThCh$609) imposed by Directorial Resolution 691-2015. |
| | - | On March 11, 2015, the Environmental Assessment and Supervisory Agency (OEFA) filed an administrative proceeding against Edegel S.A.A. for noise contamination caused for failing to install noise mitigation panels at the Santa Rosa de Ventanilla Thermal Plan. Through Directorial Resolution No. 388-2015-OEFA-DSAI issued on April 30, 2015, Edegel S.A.A. received a fine of 1 to 100 UIT. On June 16, 2015, Edegel S.A.A filed an appeal against such Resolution, which was accepted on June 19, 2015. On September 18, 2015, Edegel S.A.A. received notice of Resolution No. 039-2015-OEFA/TFA-SEE which annulled Directorial Resolution No. 388-2015-OEFA/DFSAI and consequently to apply retrospectively the administrative process to the date when the violation occurred; and re-submit the case to the Directorate of Oversight, Sanction and Application of Incentives for resolution. |
| | - | On May 13, 2015, the OSINERGMIN started an administrative proceeding against Edegel S.A.A. for non-compliance with the Electric Concessions Law and the Transmission of Electricity Final Concession Contract related to transmission line 220kV Callahuanca-Chavarria, since it does not comply with formalities of the goods affected to such concession as stated in term No.9 of such contract. Edegel S.A.A. has presented its corresponding case. On December 15, 2015, it was received notice of Resolution No. 2916 – 2015, which fined Edegel S.A.A S/. 986,710 (approximately ThCh$205,310) for non-compliance with term No. 9.4 of the Transmission of Electricity Final Concession Contract related to transmission line 220kV Callahuanca-Chavarria. On January 6, 2016, Edegel S.A.A filed an appeal against such Resolution. |
| | - | In June 2015, Edegel S.A.A. received a fine by the OSINERGMIN for an alleged omission in the declaration of the Regulation Contribution declaration for several months during the years 2011 to 2014. The fine, as updated to December 31, 2015, amounts to S/85,695 (approximately ThCh$17,831). Edegel S.A.A. accepted the fines and paid them without filing any appeal. |
| | |
| The accompanying notes are an integral part of these consolidated financial statements | | |
|
| F-167 |
| | - | On October 13, 2015, Edegel S.A.A. received notice of Resolution No. 2391-2015 issued on September 29, 2015, by which the OSINERGMIN resolved to: (1) fine Edegel S.A.A. S/.237.96 (approximately ThCh$50) for exceeding the deadline to perform maintenance activities to generation unit G1 at Matucana power plant during the first quarter of 2014; (2) fine Edegel S.A.A. S/. 8,927.03 (approximately ThCh$1,857) for exceeding the deadline to perform maintenance activities on the generation unit TG8 at Santa Rosa power plant during the first quarter of 2014 and on the generation unit TV at Ventanilla power plant during the second quarter of 2014; (3) fine Edegel S.A.A. 1.99 UIT for failure to submit within the mandatory deadline the technical justification for the first quarter of 2014 for generation unit G1 at Matucana power plant, generation unit G8 at Santa Rosa power plant and generation unit TV at Ventanilla power plant. On November 3, 2015, Edegel S.A.A. filed an appeal against articles 2 and 3 of Resolution No. 2391-2015, and on the same date, Edegel S.A.A. paid the fine related to Article 1 of Resolution No. 2391-2015. |
| | - | In December 2015, Edegel S.A.A. was fined by the SUNAT for the determination of the payments on account of March, April and June of 2010 for an updated amount as of November 30, 2015 of S/. 14,211 (approximately ThCh$2,957); and for the lower determination of balance in favor of the Income Tax for the year 2010 for an updated amount as of December 31, 2015 of S/. 17,103,702 (approximately ThCh$3,558,853). The appeal has already been filed and is pending resolution from the SUNAT. |
13. Empresa Eléctrica de Piura S.A.
| | - | In February 2013, Empresa Eléctrica de Piura S.A. was fined for an amount of S/. 7,005 (approximately ThCh$1,458) for the payment of regulation contributions for the years 2004 and 2005. The fine was already paid. |
| | - | In August 2013, Empresa Eléctrica de Piura S.A. was fined S/. 15,873 (approximately ThCh$3,303 or 5.72 Tax Units – UIT) by the OSINERGMIN for the following violations of the Procedure for Overseeing Technical Quality Standards for Electrical Services and its Base Methodology (“NTCSE”): (i) having violated the CMRT indicator regarding compliance with measurements required under the NTCSE based on voltage measurements reported for the second half of 2011; and (ii) having violated the CCII indicator regarding correctly calculating indicators and compensation amounts from service interruptions in the second half of 2011. The fine was paid in September 2013. |
| | - | In August 2013, Empresa Eléctrica de Piura S.A. was notified by the Ministry of Energy and Mines of a penalty of S/. 691,500 (approximately ThCh$143,884) imposed of under the “Talara Plant Cold Reserve Contract (CT Malacas3)” due to delays in the commercial startup of the Talara Cold Reserve Generation Plant. |
| | - | In September 2013, Empresa Eléctrica de Piura S.A. learned of Resolution No. 1 issued by Coactive Executor OSINERGMIN applying a penalty of 42.17 UIT, equivalent to S/. 156,029 (approximately ThCh$32,466) for failure to hold average stocks of LPG during the months of January to June 2004. On October 21, 2013 the Coactive Executor suspended the proceedings for collection on the fine. |
| | - | On September 24, 2013, Empresa Eléctrica de Piura S.A. was fined S/3,700 (approximately ThCh$770 or 1 Tax Unit – UIT) by the OSINERGMIN for a violation of the Procedure for Overseeing Implementation and Operation of the Systems for Automatic Rejection of Generation Loads. As the fine was paid within fifteen (15) days of notification, it was reduced by 25% to S/2,775 (approximately ThCh$577). |
| | - | On April 10, 2014, through Resolution No. 233-2013-OEFA/DFSAI/SDI, the Environmental Assessment and Supervisory Agency (OEFA) started an administrative proceeding against Empresa Eléctrica de Piura S.A. for omission of information in its reports presented related to gas emissions in its 2011 Annual Report. On May 8, 2015, Directorial Resolution No. 438-2015-OEFA/DFSAI declared the factual administrative responsibility of Empresa Eléctrica de Piura S.A. in the violation mentioned. Neither fine nor corrective measures were imposed as the violation was remediated. On June 22, 2015, Empresa Eléctrica de Piura S.A. was notified that Directorial Resolution No. 438-2015-OEFA/DFSAI was consented. |
| | - | In November 2014, Banco de Credito del Peru SA signed a lease with Empresa Electrica de Piura S.A. which referred to the Expansion Project at Thermal Electric Plant Malacas - TG5. The Bank was fined in November 2014 by the SUNAT for allegedly unpaid taxes on imports for an amount updated on December 31, 2015 of S/. 9,988,586 (approximately ThCh$2,078,375). Banco de Credito del Peru SA filed an appeal in December 2014, which is still pending of resolution. |
| | |
| The accompanying notes are an integral part of these consolidated financial statements | | |
|
| F-168 |
| | - | On March 5, 2015, Empresa Eléctrica de Piura S.A. was notified through Resolution No. 3 of the Proceeding No. 0395-2011-OS-EC-Cob. Mul. issued on February 25, 2015, which ordered: (i) the release of the suspension of the coactive execution procedure and to proceed with it; (ii) the continuation of the collection of the obligation until its extinguishment; and (iii) Empresa Eléctrica de Piura S.A., within a period of seven (7) business days, to comply with the payment of the debt amounting to S/. 599,062 (approximately ThCh$124,650) under penalty of issuing precautionary actions in accordance with the law. |
| | - | In July 2015, Empresa Eléctrica de Piura S.A. was notified through Resolutions of a fine for omissions in the payments of Income Taxes of year 2010. Such fine was paid for a total amount of S/. 30,383 (approximately ThCh$6) in August 2015. |
14. Chinango S.A.C.
| | - | In January 2013, Chinango S.A.C. received a fine totaling S/. 367,915 (approximately ThCh$76,554) from the SUNAT for issues with the determination of its 2010 income tax. The company challenged the measure despite paying a reduced fine in February 2013. The appeal filed is pending resolution by the Tax Court. |
| | - | In June 2013, Chinango S.A.C. was notified through Coactive Execution Resolution 0398-2012 of a fine of S/. 3,800 (approximately ThCh$791) imposed by OSINERGMIN for the following infractions: (i) failure to comply with the CCII indicator in the first half of 2010 as required under paragraph A of number 5.2.2 of the “Procedure for Overseeing the Technical Quality Standard for Electrical Services and its Base Methodology”; (ii) failure to comply with the CPCI indicator in the first half of 2010 as required under paragraph C of number 5.2.2 of the “Procedure for Overseeing the Technical Quality Standard for Electrical Services and its Base Methodology”; and (iii) submitting service interruption reports (RIN and RDI files) for the first half of 2010 despite the interruptions affecting its customers, as required under Article 31 of the Electricity Concession Law. |
| | - | In September 2013, Chinango S.A.C. was notified through Electrical Oversight Division Resolution No. 19693 issued by OSINERGMIN of a fine of S./ 1,850 (approximately ThCh$385 or 0.50 Tax Units – UIT) for: (i) failure to submit voltage quality information in a timely fashion in the first half of 2012. As the fine was paid within fifteen (15) days of notification, it was reduced by 25%. |
| | - | In March 2014, Chinango S.A.C. was notified through Coactive Execution Resolution No. 0350-2014 that it must pay a balance of S/. 12,100 (approximately ThCh$2,518) on a fine imposed by OSINERGMIN. The total amount of the fine, imposed through sanction No. 014799-2012-OS/CG, was 11 tax units (UIT) or S/48,800 (approximately ThCh$10,154). |
| | - | In January 2014, Chinango S.A.C. was fined by the SUNAT for issues with its 2011 income tax assessment in the amount of S/.613.390 (approximately ThCh$127,631), that was paid in February 2014 using a rebate system and without prejudice to the respective appeal. The filed appeal was resolved against Chinango SAC by the SUNAT resolution notified in December 2014, against which Chinango SAC lodged an appeal, which as of December 31, 2015 is still pending resolution. |
| | - | On May 19, 2015, the Environmental Assessment and Supervisory Agency (OEFA) filed an administrative proceeding against Chinango S.A.C. for allegedly presenting an incomplete third quarterly report of environmental monitoring for the year 2013. On June 16, 2015, Chinango S.A.C. presented its corresponding case. On October 27, 2015, it notice of Resolution No. 616-2015-OEFA/DFSAI issued on June 30, 2015, which declared the administrative responsibility of Chinango S.A.C. and stated that it is not relevant to dictate corrective measures, and informed Chinango S.A.C. that it is possible to file a reconsideration claim and an appeal against the resolution within 15 business days and to register this Resolution to the Register of Administrative Acts. On December 3, 2015, through Resolution 1078-2015 DFSAI-OEFA it was declared accepted the resolution finding Chinango S.A.C. administratively responsible. |
| | - | In June 2015, Chinango S.A.C. was fined by the OSINERGMIN for an alleged omission in presenting the Regulation Contribution declaration in several months during the year 2014. The contingency updated to September 30, 2015 is for S/79,857 (approximately ThCh$16,616). Chinango S.A.C. accepted the fines imposed and paid them without filing any appeal. |
| | - | In September 2015, Chinango S.A.C. was notified through several Resolutions of fines for S/.1,424.122 (approximately ThCh$296) related to the determination of the Income Tax for year 2012 and the corresponding payment in such year. In October 2015, Chinango paid the aforementioned fine using the current gradual regime, irrespective of filing the corresponding appeal. |
| | |
| The accompanying notes are an integral part of these consolidated financial statements | | |
|
| F-169 |
15. Generalima S.A.C.
| | - | In December 2015, before receiving notice from the SUNAT on the corresponding resolutions, Generalima S.A.C. paid voluntarily certain fines for an updated amount as of December 22, 2015 of S/ 15,179 (approximately ThCh$3,158) for keeping delayed accounting records which was identified with occasion of the procedures for and linked to the lower determination of the balance in favor for Income Taxes in year 2009, which updated as of December 31, 2015 amounts to S/66,911 (approximately ThCh$13,923). |
16. Emgesa
| | - | On July 30, 2013, through Resolution 20138100353652, the Superintendency of Public Household Services (SPPD) imposed of a fine of warning (without value) on Emgesa S.A. ESP, for failure to assist a non-regulated user (SUNCHINE BOUQUET LTDA). Through resolution 20148150176905 issued on October 28, 2014, the SPPD confirmed the fine.Closed. |
17. Codensa
| | - | In 2013, as a result of a claim filed by the company Tubotec S.A.S., the Superintendency of Public Household Services applied a penalty of CPs 167,743,200 (approximately ThCh$40,801) on Codensa for failure to comply with capacity quality indicators.Closed and paid. |
| | - | In November 2013, Codensa paid a fine of CPs 22,668,000 (approximately ThCh$5,514) imposed by the Consumer Protection Investigation Bureau of the Industry and Commerce Superintendency in accordance with Resolution 57393 of September 30, 2013. The penalty was due to an error made by the company’s invoicing service for having erroneously collected on a loan from a claimant who reported the mistake on several occasions.Closed and paid. |
| | - | In March 2014, the Superintendency of Public Household Services (SSPD) fined Codensa CPs 77,814,500 (approximately ThCh$30,539) for failure to comply with operating regulations regarding TAPS maneuver time. The SSPD confirmed the sanction in Resolution 2014240005655 of March 7, 2014, stating that Codensa S.A. E.S.P. violated the operating regulation by exceeding the maximum time permitted.Closed and paid. |
| | - | In March 2014, the Superintendency of Public Household Services (SSPD) fined Codensa CPs 127,332,000 (approximately US$49,973) for a failure in the DES service-non-compliance indicator. The fine was imposed through Resolution 2014240005125 of March 5, 2014 after the company failed to provide continuous public electricity service when it exceeded the maximum DES limits as established in Article 136 of Law 142 of 1994 and number 6.3.4 of CREG Resolution 070 of 1998. Having exhausted the appeals before the SSPD, a further appeal has been filed before the Administrative Courts.Closed and paid. |
| | - | On July 16, 2014, through Resolution No. 20142400025295, the Superintendency of Public Household Services (SPPD) confirmed the fine for CPs 13,558,500 (approximately U.S. $5,321) to Codensa for non-compliance with CREG Resolution No. 097 of 2008, since it failed to confirm within the deadline (April 6, 2010) the compliance with the requirements to initiate the application of the quality of service scheme.Closed and paid. |
| | - | On November 17, 2015 through Resolution No. 20152400051515, the Superintendency of Public Household Services (SPPD) imposed a penalty on Codensa of CPs 20,619,200 for a matter of recognition of asset ownership of the gym named “Hard Body”. Codensa filed a claim which is pending of resolution. |
18. Sociedad Portuaria Central Cartagena (SPCC)
| | - | The Port and Transportation Superintendency, through Resolution 1312 of January 30, 2014, fined SPCC CPs 2,142,400 (approximately ThCh$521) for reporting accounting and financial information for the 2010 year at the improper time. Resolutions 6051 of 2007 and 759 of 2010 required that this information be provided in February of 2011. The fine was paid on February 14, 2014.Closed and paid. |
| | |
| The accompanying notes are an integral part of these consolidated financial statements | | |
|
| F-170 |
| | b) | Discontinued Operations |
1. Endesa Chile
| | - | In January 2013, Endesa Chile was notified of SEF Exempt Resolution 2496 fining the Company 10 UTA, equivalent to ThCh$4,952 for violating Article 123 of Decree Law (DFL) 4/20,018 of 2006 due to its failure to report to the SEF the commissioning of its electricity facilities by the deadline provided for in that law. To clear the charges, Endesa Chile paid the fine in full. |
Closed and paid.
| | - | In the first quarter of 2013, Endesa Chile was notified of three resolutions issued by the Health SEREMI (Regional Ministerial Office) of the Maule Region, Resolutions 1057, 085, and 970, which ruled on health summary proceedings RIT Nos. 355/2011, 354/2011, and 256/2011, respectively, imposing a 20 UTM fine for each of the proceedings. The fines were imposed for the following violations: Resolution 1057 penalizes Endesa Chile for a health violation of Decree 594 of 1999, Regulations on Basic Health and Environmental Conditions in the Workplace, specifically, at the Cipreses Plant facilities; this fine has been paid in full. Resolution 085 penalizes a violation of Executive Decree 90/2011, which requires a statement of the emissions made in 2009 and 2010 by a 20.8-kW-capacity Siemens-Schukertwerke A6 power generator located at theBocatoma Isla de Maule facility. This resolution is currently being challenged. Resolution 970 penalizes Endesa Chile for a violation of Executive Decree 90/2011, which requires a statement of the emissions made in 2009 and 2010 by a 34 kW Conex generator located at theBocatoma Isla de Maule facility. This resolution is currently being challenged. Total: 60 UTM, equivalent to ThCh$2,626. |
| | - | Endesa Chile received notification in September 2013 of ORD No. 603 issued by the Superintendency of the Environment (SMA) initiating sanction proceedings and filing charges against Endesa Chile as Holder of the Expansion Project for Unit Two of the Bocamina Plant for a number of violations against environmental regulations and the RCA environmental regulation instrument. The sanction proceedings are the result of inspections conducted by SMA personnel on February 13 and 14 and on March 19, 26, and 27, 2013, at the Bocamina thermoelectric facilities. The inspections found a number of violations of Exempt Resolution 206 of August 2, 2007 (RCA 206/2007), which was clarified by Exempt Resolutions 229 of August 21, 2007 (RCA 229/2007) and 285 of October 8, 2007 (RCA 285/2007) giving environmental approval to this expansion project. The infractions consist primarily of (i) not having a discharge channel for the cooling system that extends 30 meters into the ocean from the edge of the beach; (ii) not having the Bocamina I Desulfurization unit in operation; (iii) not submitting the information requested by the Superintendence’s official on past records of on-line emissions reports (CEM reports) from the startup of operations until the present time; (iv) exceeding the CO limit for Bocamina I set in the RCA for Bocamina II in January 2013; (v) defects and gaps between panels in the Bocamina I perimeter acoustic enclosure; (vi) noise emissions that exceed regulatory limits; and (vii) not having technological barriers that prevent biomass from pouring into the plant’s intake. |
Endesa Chile submitted a compliance schedule within the time frame allotted, that was rejected. On November 27, 2013, the SMA reformulated the charges filed, adding two new charges (failure to comply with RCA 206/2007, which is considered a grave violation, and failure to comply with the information requirement issued in Ord UIPS 603, which is also considered a grave violation).
On August 11, 2014, the SMA issued Resolution No. 421 which penalized Endesa Chile for these environmental breaches and imposed a fine of 8,640.4 UTA (approximately ThCh$4,537,247). Endesa Chile filed a counter-claim of illegality before the Third Environmental Court of Valdivia, which on March 27, 2015, resolved to partially annul the sanction imposed by the SMA and order it to consider the aggravated circumstances in relation to the calculation of the fine. The parties, against such resolution, filed an appeal with the Supreme Court, which finally rejected Endesa Chile’s appeal, and confirmed the fine imposed of by the SMA.Closed and paid.
| | - | The Labor Directorate (Inspección del Trabajo) of the Bío Bío Region fined Endesa Chile ThCh$2,523 for failure to fulfill its duties as the operating company after confirming, on June 12, 2014, an accident suffered by a worker employed by the contractor Metalcav at the Bocamina II worksite.Closed and paid. |
| | - | On May 20, 2014, the Valparaiso Court of Appeals confirmed the fine of ThCh$2,646 imposed by the Quintero Local Police Court (Juzgado de Policía Local) upholding CONAF’s claim that Endesa Chile cut trees without first having a forestry management plan approved by CONAF. The trees were cut in the Valle Alegre area in lot 22, site 3 in the municipality of Quintero in order to clear trees from the high voltage wires. The fine was paid through the appropriate court. |
Closed and paid.
| | - | On June 23, 2014, the SISS (Sanitary Services Superintendency) fined Endesa Chile 13 UTA (approximately ThCh$6,599) for discharging liquid waste from the San Isidro II thermal plant during the cooling process in excess of the amount permitted under D.S. 90 on sulfate concentration. |
Closed and paid.
| | |
| The accompanying notes are an integral part of these consolidated financial statements | | |
|
| F-171 |
| | - | In July 2014 the Coronel Labor Directorate fined Endesa Chile for labor legislation violations relating to staff serving at the Bocamina plant. The infringements are: i) exceeding the maximum of two hours overtime per day; ii) not allowing staff to rest on Sundays; iii) incorrectly recording attendance; iv) exceeding the maximum 10-hour working day. The fine imposed for these offenses totaled Ch$10,122,720, which the company has paid in full. |
Closed and paid.
| | - | The Labor Directorate, through resolution No.1209/15/16, fined Endesa Chile Ch$2,594,400 for failure to fulfill labor resolutions authorizing an exceptional distribution of the working day.The fine was paid. |
| | - | On September 25, 2015, the Health SEREMI of the Bio Bío Region, through Resolution No. 158s3890 fined Endesa Chile 500 UTM (approximately ThCh$22,122) for failure in supervising the personal delivery of safety materials for asbestos management to each worker and instead doing it through group discussion. The claim it is not supported by any legal regulation. As such Endesa Chile filed an administrative proceeding, which is currently pending. |
2. Empresa Eléctrica Pehuenche S.A.
| | - | On October 2, 2013, the Superintendency of Securities and Insurance (SVS) fined Empresa Eléctrica Pehuenche S.A. and its CEO for alleged violations of Article 54 of Law 18,046 “over the right of all shareholders to examine the annual report, balance sheet, inventory, minutes, ledgers, and external auditors’ reports during the 15 days prior to a company’s ordinary shareholders’ meeting.” It resolved the following: |
“To impose on Empresa Eléctrica Pehuenche S.A. and its General Manager, Lucio Castro Márqez, a fine of 150 UF each for violation of Article 54 of Law 18,046 and Article 61 of the Regulations on Corporations in effect at the time the events penalized occurred.”
The fine was applied as a result of a claim made by Tricahue Inversiones S.A. against Empresa Eléctrica Pehuenche S.A. based on the fact that, on April 24, 2012, the Tricahue General Manager went to Pehuenche’s offices to examine the minutes books of the company’s Board of Directors and stated that he was first required to sign a statement of confidentiality and indemnity in Pehuenche’s favor, which he considered illegal and arbitrary.
On August 24, 2012, Tricahue withdrew its complaint filed against Empresa Eléctrica Pehuenche S.A.
The company and its General Manager, respectively, exercised the action provided for under Article 30 of Decree Law 3,538, within the conditions and time frame required, to file a claim against the SVS resolution with the ordinary courts of law to have the resolution revoked.
Finally, on May 20, 2014, the Court recognized the claim filed and revoked the sanction applied as groundless.
Closed.
3. Chilectra S.A.
| | - | During the fiscal year 2013, Chilectra S.A. was sanctioned by the Superintendency of Electricity and Fuels with 7 fines amounting to ThCh$227,507. |
| | - | During the fiscal year 2014, Chilectra S.A. was sanctioned by the Superintendency of Electricity and Fuels with 8 fines amounting to ThCh$459,453. |
| | - | During the fiscal year 2015, Chilectra S.A. was sanctioned by the Superintendency of Electricity and Fuels with 5 fines amounting to (i) ThCh$778,320; (ii) ThCh$1,327; (iii) ThCh$1,769,720; (iv) ThCh$797,007; and (v) ThCh$1,600,893. All sanctions have been appeal to the authorities and the courts of justice. |
The Company and its Board of Directors have not received other fines from the SVS nor from other administrative authorities.
| | |
| The accompanying notes are an integral part of these consolidated financial statements | | |
|
| F-172 |
39. ENVIRONMENT.
Environmental expenses for the years ended December 31, 2015, 2014 and 2013, are as follows:
| | | | | | | | | | | | | | | | | | | | | | | | | | | | | | | | | | |
Company Incurring the Cost | | Project | | Description | | Project
Status | | 12-31-2015 ThCh$ | | | 12-31-2014 (As
adjusted)(*) ThCh$ | |
| | | | | Costs
incurred | | | Capitalized
Cost | | | Expense
amount | | | Costs to be
incurred in
the future | | | Estimate
date of
incurring
cost | | | Total
Expenditures | | | Costs
incurred
prior period | |
| EMGESA | | El Quimbo hydro electrical plant project | | Environmental management - El Quimbo plant construction | | In progress | | | 135,659 | | | | 135,659 | | | | - | | | | - | | | | - | | | | 135,659 | | | | - | |
| | Environmental resource management HIDRA | | Plants environmental resource management | | In progress | | | 45,987,062 | | | | 45,987,062 | | | | - | | | | 72,259,750 | | | | 12-31-2020 | | | | 118,246,812 | | | | 45,490,454 | |
| EDEGEL | | Preventing activities | | Biodiversity protection, sewage water treatment | | Finalized | | | 100,570 | | | | - | | | | 100,570 | | | | - | | | | 12-31-2015 | | | | 100,570 | | | | 76,405 | |
| | Environmental monitoring | | Air and climate protection, noise reduction, protection from radiation | | Finalized | | | 205,882 | | | | - | | | | 205,882 | | | | - | | | | 12-31-2015 | | | | 205,882 | | | | 156,570 | |
| | Waste management | | Hazardous waste management | | Finalized | | | 189,528 | | | | - | | | | 189,528 | | | | - | | | | 12-31-2015 | | | | 189,528 | | | | 206,909 | |
| | Environmental studies | | Enviromental studies | | Finalized | | | 21,373 | | | | - | | | | 21,373 | | | | - | | | | 12-31-2015 | | | | 21,373 | | | | 16,722 | |
| | Mitigation and restoration | | Soil and water protection and recovery | | Finalized | | | 2,549 | | | | - | | | | 2,549 | | | | - | | | | 12-31-2015 | | | | 2,549 | | | | 8,045 | |
| | Impact compensations | | Compensations, increasing gardens | | Finalized | | | 144,590 | | | | - | | | | 144,590 | | | | - | | | | 12-31-2015 | | | | 144,590 | | | | 6,823 | |
| CHINANGO | | Preventing activities | | Biodiversity protection, sewage water treatment | | Finalized | | | 71,560 | | | | - | | | | 71,560 | | | | - | | | | 12-31-2015 | | | | 71,560 | | | | 5,974 | |
| | Landscaping and gardens | | Gardens, landscaping and fauna maintenance | | Finalized | | | 8,487 | | | | - | | | | 8,487 | | | | - | | | | 12-31-2015 | | | | 8,487 | | | | 5,935 | |
| | Environmental monitoring | | Air and climate protection, noise reduction, protection from radiation | | Finalized | | | 277,223 | | | | - | | | | 277,223 | | | | - | | | | 12-31-2015 | | | | 277,223 | | | | 239,904 | |
| | Waste management | | Hazardous waste management | | Finalized | | | 34,960 | | | | - | | | | 34,960 | | | | - | | | | 12-31-2015 | | | | 34,960 | | | | 31,460 | |
| | Environmental studies | | Enviromental studies | | Finalized | | | 19,703 | | | | - | | | | 19,703 | | | | - | | | | 12-31-2015 | | | | 19,703 | | | | 5,229 | |
| EDESUR | | Contaminating material | | Contaminating material management | | In progress | | | 44,281 | | | | - | | | | 44,281 | | | | - | | | | - | | | | 44,281 | | | | 18,018 | |
| | Transformers recovery | | Project to invest in environment | | In progress | | | 30,005 | | | | 30,005 | | | | - | | | | - | | | | - | | | | 30,005 | | | | - | |
| CODENSA | | PCBS dismantling | | Dismantling transformers with PCb residues | | In progress | | | 489,659 | | | | 489,659 | | | | - | | | | - | | | | - | | | | 489,659 | | | | 811,655 | |
| | Nueva Esperanza archaeological rescue | | Environmental compensation for construction of Nueva Esperanza substation | | Finalized | | | 458,328 | | | | 458,328 | | | | - | | | | - | | | | 12-31-2015 | | | | 458,328 | | | | 1,933,259 | |
| | Nueva esperanza environmental compensation | | Rescue of archaeological B.C. remains of culture Herrera at substation Nueva Esperanza construction site. | | In progress | | | 432,514 | | | | 432,514 | | | | - | | | | - | | | | - | | | | 432,514 | | | | - | |
| | | | | | | | | | | | | | | | | | | | | | | | | | | | | | | | | | |
| Total | | | | | | | | | 48,653,933 | | | | 47,533,227 | | | | 1,120,706 | | | | 72,259,750 | | | | | | | | 120,913,683 | | | | 49,013,362 | |
(*) See Note 5.1.II.iii
| | | | | | | | | | | | | | | | | | | | | | | | | | | | | | | | | | |
Company Incurring the Cost | | Project | | Description | | Project
Status | | 12-31-2014 (As adjusted)(*) ThCh$ | | | 12-31-2013 (As
adjusted)(*) ThCh$ | |
| | | | | Costs
incurred | | | Capitalized
Cost | | | Expense
amount | | | Costs to be
incurred in
the future | | | Estimate
date of
incurring
cost | | | Total
Expenditures | | | Costs
incurred
prior period | |
| EMGESA | | El Quimbo hydro electrical plant project | | Environmental management - El Quimbo plant construction | | In progress | | | 38,445,602 | | | | 38,445,602 | | | | - | | | | 7,044,852 | | | | 31-12-2015 | | | | 45,490,454 | | | | - | |
| | Environmental resource management HIDRA | | Plants environmental resource management | | In progress | | | 389,008 | | | | 389,008 | | | | - | | | | - | | | | - | | | | 389,008 | | | | - | |
| EDEGEL | | Environmental monitoring | | Biodiversity protection, sewage water treatment | | Finalized | | | 156,570 | | | | - | | | | 156,570 | | | | - | | | | 31-12-2014 | | | | 156,570 | | | | 74,967 | |
| | Waste management | | Hazardous waste management | | Finalized | | | 206,909 | | | | - | | | | 206,909 | | | | - | | | | 31-12-2014 | | | | 206,909 | | | | 160,183 | |
| | Environmental studies | | Environmental studies | | Finalized | | | 16,722 | | | | - | | | | 16,722 | | | | - | | | | 31-12-2014 | | | | 16,722 | | | | 56,975 | |
| | Mitigation and restoration | | Soil and water protection and restoration | | Finalized | | | 8,045 | | | | - | | | | 8,045 | | | | - | | | | 31-12-2014 | | | | 8,045 | | | | - | |
| | Impact compensations | | Compensations, increasing gardens | | Finalized | | | 6,823 | | | | - | | | | 6,823 | | | | - | | | | 31-12-2014 | | | | 6,823 | | | | - | |
| | Landscaping and gardens | | Gardens, landscaping and fauna maintenance | | Finalized | | | 177,830 | | | | - | | | | 177,830 | | | | - | | | | 31-12-2014 | | | | 177,830 | | | | - | |
| | Preventing activities | | Biodiversity protection, sewage water treatment | | Finalized | | | 76,405 | | | | - | | | | 76,405 | | | | - | | | | 31-12-2014 | | | | 76,405 | | | | 125,841 | |
| CHINANGO | | Preventing activities | | Biodiversity protection, sewage water treatment | | Finalized | | | 5,974 | | | | - | | | | 5,974 | | | | - | | | | 31-12-2014 | | | | 5,974 | | | | - | |
| | Landscaping and gardens | | Gardens, landscaping and fauna maintenance | | Finalized | | | 5,935 | | | | - | | | | 5,935 | | | | - | | | | 31-12-2014 | | | | 5,935 | | | | - | |
| | Environmental monitoring | | Air and climate protection, noise reduction, protection from radiation | | Finalized | | | 239,904 | | | | - | | | | 239,904 | | | | - | | | | 31-12-2014 | | | | 239,904 | | | | - | |
| | Waste management | | Hazardous waste management | | Finalized | | | 31,460 | | | | - | | | | 31,460 | | | | - | | | | 31-12-2014 | | | | 31,460 | | | | - | |
| | Environmental studies | | Enviromental studies | | Finalized | | | 5,229 | | | | - | | | | 5,229 | | | | - | | | | 31-12-2014 | | | | 5,229 | | | | - | |
| | Mitigation and restoration | | Soil and water protection and recovery | | Finalized | | | 4,398 | | | | - | | | | 4,398 | | | | - | | | | 31-12-2014 | | | | 4,398 | | | | - | |
| | Impact compensations | | Compensations, increasing gardens | | Finalized | | | 49,390 | | | | - | | | | 49,390 | | | | - | | | | 31-12-2014 | | | | 49,390 | | | | - | |
| EDESUR | | Contaminating material management | | Contaminating material management | | In progress | | | 18,018 | | | | - | | | | 18,018 | | | | - | | | | - | | | | 18,018 | | | | - | |
| CODENSA | | PCBS dismantling | | Dismantling transformers with PCb residues | | In progress | | | 811,655 | | | | - | | | | 811,655 | | | | - | | | | - | | | | 811,655 | | | | - | |
| | Nueva Esperanza archaeological rescue | | Rescue of archaeological B.C. remains of culture Herrera at substation Nueva Esperanza construction site. | | In progress | | | 1,933,259 | | | | 1,933,259 | | | | - | | | | - | | | | - | | | | 1,933,259 | | | | - | |
| | | | | | | | | | | | | | | | | | | | | | | | | | | | | | | | | | |
| Total | | | | | | | | | 42,589,136 | | | | 40,767,869 | | | | 1,821,267 | | | | 7,044,852 | | | | | | | | 49,633,988 | | | | 417,966 | |
(*) See Note 5.1.II.iii
| | |
| The accompanying notes are an integral part of these consolidated financial statements | | |
|
| F-173 |
40. FINANCIAL INFORMATION ON SUBSIDIARIES, SUMMARIZED.
As of December 31, 2015 and 2014, summarized financial information of our principal subsidiaries prepared under IFRS is as follows:
| | | | | | | | | | | | | | | | | | | | | | | | | | | | | | | | | | | | | | | | | | | | | | | | | | | | | | | | | | | | | | | | | | | | | | | | | | |
| | | 12-31-2015 | |
| | | Type of
Financial
Statements | | Current
Assets ThCh$ | | | Non-current
assets ThCh$ | | | Total Assets
ThCh$ | | | Current
Liabilities ThCh$ | | | Non-current
liabilities ThCh$ | | | Equity ThCh$ | | | Total
Liabilities
and Equity
ThCh$ | | | Revenue ThCh$ | | | Raw materials
and
consumables
used ThCh$ | | | Contribution
Margin ThCh$ | | | Gross
operating
income
ThCh$ | | | Operating
income ThCh$ | | | Financial
results ThCh$ | | | Income before
taxes ThCh$ | | | Income taxes ThCh$ | | | Gain (loss) ThCh$ | | | Other
comprehensive
income
ThCh$ | | | Total
Comprehensive
Income
ThCh$ | |
Continuing Operations: | | | | | | | | | | | | | | | | | | | | | | | | | | | | | | | | | | | | | | | | | | | | | | | | | | | | | | | | | | | | | | | | | | | | | | | | | | |
Inversiones Distrilima S.A. | | Separate | | | 18,246,316 | | | | 50,156,404 | | | | 68,402,720 | | | | 325,792 | | | | - | | | | 68,076,928 | | | | 68,402,720 | | | | - | | | | - | | | | - | | | | (5,028 | ) | | | (5,028 | ) | | | 959,095 | | | | 21,003,199 | | | | (266,930 | ) | | | 20,736,269 | | | | 1,311,144 | | | | 22,047,413 | |
Empresa de Distribución Eléctrica de Lima Norte S.A.A. | | Separate | | | 98,125,347 | | | | 675,858,105 | | | | 773,983,452 | | | | 192,215,161 | | | | 269,823,997 | | | | 311,944,294 | | | | 773,983,452 | | | | 562,046,426 | | | | (379,015,102 | ) | | | 183,031,324 | | | | 138,377,938 | | | | 107,705,092 | | | | (16,772,560 | ) | | | 91,535,126 | | | | (27,924,718 | ) | | | 63,610,408 | | | | 6,877,338 | | | | 70,487,746 | |
Endesa Argentina S.A. | | Separate | | | 1,814,204 | | | | 32,328,045 | | | | 34,142,249 | | | | 616,318 | | | | - | | | | 33,525,931 | | | | 34,142,249 | | | | - | | | | - | | | | - | | | | (64,074 | ) | | | (64,074 | ) | | | 1,023,419 | | | | 959,344 | | | | (336,372 | ) | | | 622,972 | | | | (10,352,540 | ) | | | (9,729,568 | ) |
Central Costanera S.A. | | Separate | | | 27,559,412 | | | | 142,918,106 | | | | 170,477,518 | | | | 102,001,988 | | | | 53,611,202 | | | | 14,864,328 | | | | 170,477,518 | | | | 100,856,664 | | | | (4,598,130 | ) | | | 96,258,534 | | | | 41,604,328 | | | | 20,372,179 | | | | (24,944,190 | ) | | | (4,012,455 | ) | | | 3,013,645 | | | | (998,809 | ) | | | (4,729,767 | ) | | | (5,728,576 | ) |
Hidroeléctrica El Chocón S.A. | | Separate | | | 44,240,854 | | | | 240,460,115 | | | | 284,700,969 | | | | 71,433,902 | | | | 63,908,193 | | | | 149,358,874 | | | | 284,700,969 | | | | 40,004,655 | | | | (4,574,336 | ) | | | 35,430,319 | | | | 28,820,101 | | | | 27,009,175 | | | | 141,308,348 | | | | 169,850,815 | | | | (59,047,935 | ) | | | 110,802,880 | | | | (44,667,506 | ) | | | 66,135,374 | |
Emgesa S.A. E.S.P. | | Separate | | | 172,918,511 | | | | 1,803,546,987 | | | | 1,976,465,498 | | | | 349,736,334 | | | | 831,187,906 | | | | 795,541,258 | | | | 1,976,465,498 | | | | 778,768,426 | | | | (321,664,855 | ) | | | 457,103,571 | | | | 412,046,148 | | | | 372,828,429 | | | | (39,872,136 | ) | | | 332,845,961 | | | | (120,949,697 | ) | | | 211,896,264 | | | | (91,252,276 | ) | | | 120,643,988 | |
Generandes Peru S.A. | | Separate | | | 1,945,582 | | | | 225,170,087 | | | | 227,115,669 | | | | 1,364,513 | | | | - | | | | 225,751,156 | | | | 227,115,669 | | | | - | | | | - | | | | - | | | | (32,396 | ) | | | (32,396 | ) | | | 172,406 | | | | 42,094,142 | | | | (50,002 | ) | | | 42,044,140 | | | | 4,890,902 | | | | 46,935,042 | |
Edegel S.A.A. | | Separate | | | 111,421,412 | | | | 723,995,979 | | | | 835,417,391 | | | | 117,775,269 | | | | 188,814,672 | | | | 528,827,450 | | | | 835,417,391 | | | | 343,761,564 | | | | (143,234,611 | ) | | | 200,526,953 | | | | 164,344,988 | | | | 116,593,374 | | | | (9,260,148 | ) | | | 122,550,483 | | | | (31,389,446 | ) | | | 91,161,037 | | | | 4,059,334 | | | | 95,220,371 | |
Chinango S.A.C. | | Separate | | | 7,647,526 | | | | 112,688,111 | | | | 120,335,637 | | | | 8,369,365 | | | | 40,621,719 | | | | 71,344,553 | | | | 120,335,637 | | | | 39,114,967 | | | | (8,235,270 | ) | | | 30,879,697 | | | | 26,280,972 | | | | 23,095,212 | | | | (1,057,861 | ) | | | 22,037,351 | | | | (6,827,262 | ) | | | 15,210,089 | | | | (708,295 | ) | | | 14,501,794 | |
Enel Brasil S.A. | | Separate | | | 110,127,302 | | | | 736,398,772 | | | | 846,526,074 | | | | 51,310,987 | | | | 15,859,063 | | | | 779,356,024 | | | | 846,526,074 | | | | - | | | | - | | | | - | | | | (21,299,668 | ) | | | (21,417,232 | ) | | | 26,840,323 | | | | 122,982,000 | | | | (8,959,080 | ) | | | 114,022,920 | | | | (194,845,796 | ) | | | (80,822,876 | ) |
Central Generadora Termoeléctrica Fortaleza S.A. | | Separate | | | 36,820,903 | | | | 114,401,115 | | | | 151,222,018 | | | | 35,746,585 | | | | 638,562 | | | | 114,836,871 | | | | 151,222,018 | | | | 159,051,928 | | | | (111,228,593 | ) | | | 47,823,335 | | | | 40,544,633 | | | | 34,866,986 | | | | 3,245,644 | | | | 38,112,630 | | | | (13,299,903 | ) | | | 24,812,727 | | | | (26,130,490 | ) | | | (1,317,763 | ) |
Centrais Elétricas Cachoeira Dourada S.A. | | Separate | | | 43,483,356 | | | | 77,906,552 | | | | 121,389,908 | | | | 33,306,336 | | | | 3,370,881 | | | | 84,712,691 | | | | 121,389,908 | | | | 91,563,206 | | | | (17,395,858 | ) | | | 74,167,348 | | | | 66,975,312 | | | | 61,972,753 | | | | 3,514,857 | | | | 65,487,610 | | | | (22,519,731 | ) | | | 42,967,879 | | | | (13,348,590 | ) | | | 29,619,289 | |
Compañía de Interconexión Energética S.A. | | Separate | | | 29,310,056 | | | | 185,030,817 | | | | 214,340,873 | | | | 57,239,098 | | | | 30,170,820 | | | | 126,930,955 | | | | 214,340,873 | | | | 55,533,872 | | | | (3,125,790 | ) | | | 52,408,082 | | | | 45,152,292 | | | | 34,319,511 | | | | 15,559,865 | | | | 49,879,377 | | | | (17,387,165 | ) | | | 32,492,212 | | | | (27,600,284 | ) | | | 4,891,928 | |
Compañía de Transmisión del Mercosur S.A. | | Separate | | | 13,944,906 | | | | 934,689 | | | | 14,879,595 | | | | 10,880,864 | | | | 17,896,009 | | | | (13,897,278 | ) | | | 14,879,595 | | | | 1,644,146 | | | | - | | | | 1,644,146 | | | | 922,095 | | | | 770,315 | | | | (17,579,292 | ) | | | (16,801,955 | ) | | | (998,283 | ) | | | (17,800,238 | ) | | | 4,199,017 | | | | (13,601,221 | ) |
Compañía Energética Do Ceará S.A. | | Separate | | | 267,538,669 | | | | 569,364,164 | | | | 836,902,833 | | | | 219,528,371 | | | | 223,842,286 | | | | 393,532,176 | | | | 836,902,833 | | | | 810,184,252 | | | | (581,689,470 | ) | | | 228,494,782 | | | | 136,443,771 | | | | 100,911,453 | | | | (12,650,857 | ) | | | 85,012,938 | | | | (12,997,078 | ) | | | 72,015,860 | | | | (97,029,555 | ) | | | (25,013,695 | ) |
EN-Brasil Comercio e Servicios S.A. | | Separate | | | 2,673,792 | | | | 1,448,487 | | | | 4,122,279 | | | | 3,234,058 | | | | - | | | | 888,221 | | | | 4,122,279 | | | | 5,603,633 | | | | (3,041,559 | ) | | | 2,562,074 | | | | (614,126 | ) | | | (782,696 | ) | | | 136,846 | | | | (645,849 | ) | | | (735,808 | ) | | | (1,381,657 | ) | | | (163,062 | ) | | | (1,544,719 | ) |
Ampla Energía E Servicios S.A. | | Separate | | | 385,803,702 | | | | 1,016,536,280 | | | | 1,402,339,982 | | | | 333,276,269 | | | | 608,907,379 | | | | 460,156,334 | | | | 1,402,339,982 | | | | 1,026,680,070 | | | | (804,701,402 | ) | | | 221,978,668 | | | | 93,688,470 | | | | 26,422,575 | | | | (35,938,130 | ) | | | (13,026,593 | ) | | | 2,147,615 | | | | (10,878,978 | ) | | | (139,016,506 | ) | | | (149,895,484 | ) |
Compañía Distribuidora y Comercializadora de Energía S.A. | | Separate | | | 207,553,184 | | | | 841,585,897 | | | | 1,049,139,081 | | | | 247,749,853 | | | | 281,940,697 | | | | 519,448,531 | | | | 1,049,139,081 | | | | 884,467,266 | | | | (500,570,712 | ) | | | 383,896,554 | | | | 295,143,439 | | | | 235,587,544 | | | | (27,459,741 | ) | | | 207,999,316 | | | | (84,883,205 | ) | | | 123,116,111 | | | | (61,679,252 | ) | | | 61,436,859 | |
Inversora Codensa S.A. | | Separate | | | 491 | | | | 63 | | | | 554 | | | | 3 | | | | - | | | | 551 | | | | 554 | | | | - | | | | - | | | | - | | | | (189 | ) | | | (189 | ) | | | - | | | | (189 | ) | | | (9 | ) | | | (198 | ) | | | (91 | ) | | | (289 | ) |
Empresa Distribuidora Sur S.A. | | Separate | | | 191,441,460 | | | | 443,412,232 | | | | 634,853,692 | | | | 431,630,045 | | | | 174,966,573 | | | | 28,257,074 | | | | 634,853,692 | | | | 607,344,916 | | | | (157,387,237 | ) | | | 449,957,679 | | | | 119,294,227 | | | | 103,775,386 | | | | (3,942,519 | ) | | | 99,980,518 | | | | (463,471 | ) | | | 99,517,047 | | | | (8,266,492 | ) | | | 91,250,555 | |
Generalima, S.A.C. | | Separate | | | 5,697,317 | | | | 50,472,490 | | | | 56,169,807 | | | | 20,328,170 | | | | 8,150,819 | | | | 27,690,818 | | | | 56,169,807 | | | | - | | | | - | | | | - | | | | (375,459 | ) | | | (376,682 | ) | | | (2,233,357 | ) | | | (412,472 | ) | | | (285,187 | ) | | | (697,659 | ) | | | 727,779 | | | | 30,120 | |
Endesa Cemsa, S.A. | | Separate | | | 22,954,619 | | | | 91,195 | | | | 23,045,814 | | | | 21,098,368 | | | | - | | | | 1,947,446 | | | | 23,045,814 | | | | 2,269,586 | | | | (1,017,940 | ) | | | 1,251,646 | | | | (1,206,493 | ) | | | (1,255,814 | ) | | | 897,816 | | | | (357,998 | ) | | | (1,466,245 | ) | | | (1,824,243 | ) | | | (626,380 | ) | | | (2,450,623 | ) |
Grupo Dock Sud, S.A. | | Consolidated | | | 46,722,732 | | | | 126,188,103 | | | | 172,910,835 | | | | 25,736,485 | | | | 67,304,445 | | | | 79,869,905 | | | | 172,910,835 | | | | 69,962,810 | | | | (43,265,695 | ) | | | 26,697,115 | | | | 14,806,741 | | | | 3,309,477 | | | | 53,770,197 | | | | 57,229,446 | | | | (18,102,752 | ) | | | 39,126,694 | | | | (24,156,874 | ) | | | 14,969,820 | |
Eléctrica Cabo Blanco, S.A.C. | | Consolidated | | | 54,357,844 | | | | 81,815,037 | | | | 136,172,881 | | | | 19,831,659 | | | | 47,845,465 | | | | 68,495,757 | | | | 136,172,881 | | | | 58,092,640 | | | | (26,124,119 | ) | | | 31,968,521 | | | | 23,168,206 | | | | 17,663,200 | | | | (5,755,667 | ) | | | 12,013,783 | | | | (4,166,389 | ) | | | 7,847,394 | | | | 720,031 | | | | 8,567,425 | |
Grupo Distrilima | | Consolidated | | | 116,371,663 | | | | 675,858,105 | | | | 792,229,768 | | | | 192,540,953 | | | | 269,823,997 | | | | 329,864,818 | | | | 792,229,768 | | | | 562,046,426 | | | | (379,015,102 | ) | | | 183,031,324 | | | | 138,372,910 | | | | 107,700,064 | | | | (15,813,466 | ) | | | 92,489,193 | | | | (28,191,648 | ) | | | 64,297,545 | | | | 7,349,620 | | | | 71,647,165 | |
Grupo Enel Brasil | | Consolidated | | | 796,102,019 | | | | 1,994,170,372 | | | | 2,790,272,391 | | | | 653,756,270 | | | | 725,006,817 | | | | 1,411,509,304 | | | | 2,790,272,391 | | | | 2,016,488,833 | | | | (1,385,921,254 | ) | | | 630,567,579 | | | | 363,360,618 | | | | 238,408,123 | | | | (36,592,248 | ) | | | 195,064,201 | | | | (76,715,148 | ) | | | 118,349,053 | | | | (370,529,946 | ) | | | (252,180,893 | ) |
Grupo Generandes Peru | | Consolidated | | | 120,047,319 | | | | 808,405,916 | | | | 928,453,235 | | | | 126,541,945 | | | | 229,436,392 | | | | 572,474,898 | | | | 928,453,235 | | | | 382,452,709 | | | | (151,046,058 | ) | | | 231,406,651 | | | | 190,593,564 | | | | 139,656,190 | | | | (10,145,603 | ) | | | 133,321,519 | | | | (38,266,710 | ) | | | 95,054,809 | | | | (9,131,696 | ) | | | 85,923,113 | |
Grupo Endesa Argentina | | Consolidated | | | 73,348,681 | | | | 385,562,798 | | | | 458,911,479 | | | | 173,663,474 | | | | 115,955,351 | | | | 169,292,654 | | | | 458,911,479 | | | | 140,398,933 | | | | (9,172,466 | ) | | | 131,226,467 | | | | 70,334,513 | | | | 47,291,438 | | | | 117,190,764 | | | | 165,754,140 | | | | (56,407,124 | ) | | | 109,347,016 | | | | (50,970,094 | ) | | | 58,376,922 | |
Discontinued Operations: | | | | | | | | | | | | | | | | | | | | | | | | | | | | | | | | | | | | | | | | | | | | | | | | | | | | | | | | | | | | | | | | | | | | | | | | | | |
Chilectra S.A. | | Consolidated | | | 764,264,413 | | | | 766,740,395 | | | | 1,531,004,808 | | | | 363,516,173 | | | | 54,831,044 | | | | 1,112,657,591 | | | | 1,531,004,808 | | | | 1,257,732,164 | | | | (983,732,902 | ) | | | 273,999,262 | | | | 185,114,892 | | | | 149,293,693 | | | | 12,669,568 | | | | 176,628,861 | | | | (36,956,051 | ) | | | 188,750,734 | | | | (111,222,756 | ) | | | 77,527,978 | |
Grupo Servicios Informaticos e Inmobiliarios Ltda. | | Consolidated | | | 54,816,036 | | | | 11,561,339 | | | | 66,377,375 | | | | 5,586,878 | | | | 1,305,133 | | | | 59,485,364 | | | | 66,377,375 | | | | 8,660,778 | | | | - | | | | 8,660,778 | | | | (397,888 | ) | | | (511,775 | ) | | | 2,260,216 | | | | 6,041,979 | | | | (765,180 | ) | | | 5,276,799 | | | | (76,578 | ) | | | 5,200,221 | |
Empresa Nacional de Electricidad S.A. | | Separate | | | 563,422,232 | | | | 3,601,559,005 | | | | 4,164,981,237 | | | | 807,918,132 | | | | 1,027,287,096 | | | | 2,329,776,009 | | | | 4,164,981,237 | | | | 1,407,824,978 | | | | (1,061,507,980 | ) | | | 346,316,998 | | | | 225,230,207 | | | | 143,639,730 | | | | (126,334,330 | ) | | | 246,255,964 | | | | (32,834,204 | ) | | | 213,421,760 | | | | (92,076,119 | ) | | | 121,345,641 | |
Empresa Eléctrica Pehuenche S.A. | | Separate | | | 63,745,589 | | | | 201,366,300 | | | | 265,111,889 | | | | 64,820,897 | | | | 51,972,920 | | | | 148,318,072 | | | | 265,111,889 | | | | 193,189,705 | | | | (28,569,912 | ) | | | 164,619,793 | | | | 159,244,283 | | | | 150,615,199 | | | | 2,049,116 | | | | 152,664,316 | | | | (34,647,895 | ) | | | 118,016,421 | | | | 33,526 | | | | 118,049,947 | |
Compañía Eléctrica Tarapacá S.A. | | Separate | | | 82,875,363 | | | | 509,275,829 | | | | 592,151,192 | | | | 115,138,485 | | | | 44,379,433 | | | | 432,633,274 | | | | 592,151,192 | | | | 230,852,534 | | | | (139,555,849 | ) | | | 91,296,685 | | | | 73,665,446 | | | | 64,306,244 | | | | 24,323,943 | | | | 88,341,669 | | | | (18,079,279 | ) | | | 70,262,390 | | | | (624 | ) | | | 70,261,766 | |
Grupo Endesa Chile | | Consolidated | | | 4,412,561,440 | | | | 2,866,208,895 | | | | 7,278,770,335 | | | | 2,527,875,495 | | | | 1,207,004,760 | | | | 3,543,890,080 | | | | 7,278,770,335 | | | | 1,543,810,316 | | | | (880,891,223 | ) | | | 662,919,093 | | | | 516,860,724 | | | | 401,818,817 | | | | (114,252,182 | ) | | | 300,487,081 | | | | (76,655,819 | ) | | | 635,020,813 | | | | (347,578,686 | ) | | | 287,442,127 | |
Grupo Inversiones GasAtacama Holding Ltda. | | Consolidated | | | 245,456,212 | | | | 207,236,190 | | | | 452,692,402 | | | | 24,048,629 | | | | 49,959,438 | | | | 378,684,335 | | | | 452,692,402 | | | | 183,015,183 | | | | (110,330,364 | ) | | | 72,684,819 | | | | 57,943,644 | | | | 46,360,426 | | | | 10,304,578 | | | | 56,660,371 | | | | (10,444,811 | ) | | | 46,215,560 | | | | (3,059,806 | ) | | | 43,155,754 | |
| | |
| The accompanying notes are an integral part of these consolidated financial statements | | |
|
| F-174 |
| | | | | | | | | | | | | | | | | | | | | | | | | | | | | | | | | | | | | | | | | | | | | | | | | | | | | | | | | | | | | | | | | | | | | | | | | | |
| | | 12-31-2014 | |
| | | Type of
Financial
Statements | | Current
Assets ThCh$ | | | Non-current
assets ThCh$ | | | Total Assets ThCh$ | | | Current
Liabilities ThCh$ | | | Non-current
liabilities ThCh$ | | | Equity ThCh$ | | | Total
Liabilities
and
EquityThCh$ | | | Revenue ThCh$ | | | Raw materials
and
consumables
used ThCh$ | | | Contribution
Margin ThCh$ | | | Gross
operating
income ThCh$ | | | Operating
income ThCh$ | | | Financial
results ThCh$ | | | Income before
taxes ThCh$ | | | Income taxes ThCh$ | | | Gain (loss) ThCh$ | | | Other
comprehensive
income
ThCh$ | | | Total
Comprehensive
Income
ThCh$ | |
Continuing Operations: | | | | | | | | | | | | | | | | | | | | | | | | | | | | | | | | | | | | | | | | | | | | | | | | | | | | | | | | | | | | | | | | | | | | | | | | | | |
Inversiones Distrilima S.A. | | Separate | | | 15,272,519 | | | | 48,854,638 | | | | 64,127,157 | | | | 76,273 | | | | - | | | | 64,050,884 | | | | 64,127,157 | | | | - | | | | - | | | | - | | | | (12,705 | ) | | | (12,705 | ) | | | 1,212,945 | | | | 18,308,552 | | | | (361,797 | ) | | | 17,946,755 | | | | 2,959,092 | | | | 20,905,847 | |
Empresa de Distribución Eléctrica de Lima Norte S.A.A. | | Separate | | | 127,665,327 | | | | 587,886,652 | | | | 715,551,979 | | | | 164,991,090 | | | | 271,208,225 | | | | 279,352,664 | | | | 715,551,979 | | | | 478,699,891 | | | | (315,115,521 | ) | | | 163,584,370 | | | | 119,243,469 | | | | 90,986,079 | | | | (11,494,112 | ) | | | 79,523,877 | | | | (19,790,239 | ) | | | 59,733,638 | | | | 13,438,385 | | | | 73,172,024 | |
Endesa Argentina S.A. | | Separate | | | 1,924,047 | | | | 42,081,267 | | | | 44,005,314 | | | | 749,815 | | | | - | | | | 43,255,499 | | | | 44,005,314 | | | | - | | | | - | | | | - | | | | (57,903 | ) | | | (57,903 | ) | | | 588,091 | | | | 530,188 | | | | (189,589 | ) | | | 340,599 | | | | (5,299,756 | ) | | | (4,959,157 | ) |
Central Costanera S.A. | | Separate | | | 31,868,372 | | | | 154,649,134 | | | | 186,517,506 | | | | 108,956,607 | | | | 56,967,994 | | | | 20,592,905 | | | | 186,517,506 | | | | 75,193,639 | | | | (6,777,139 | ) | | | 68,416,500 | | | | 29,619,143 | | | | 13,701,504 | | | | 46,699,311 | | | | 60,497,602 | | | | (14,964,948 | ) | | | 45,532,654 | | | | 3,989,198 | | | | 49,521,852 | |
Hidroeléctrica El Chocón S.A. | | Separate | | | 22,930,536 | | | | 137,891,546 | | | | 160,822,082 | | | | 31,540,350 | | | | 46,058,232 | | | | 83,223,500 | | | | 160,822,082 | | | | 30,173,576 | | | | (8,427,057 | ) | | | 21,746,519 | | | | 16,090,917 | | | | 14,338,493 | | | | 2,101,221 | | | | 16,965,869 | | | | (5,929,047 | ) | | | 11,036,822 | | | | (8,763,212 | ) | | | 2,273,610 | |
Emgesa S.A. E.S.P. | | Separate | | | 329,672,209 | | | | 1,782,307,979 | | | | 2,111,980,188 | | | | 500,414,812 | | | | 883,041,284 | | | | 728,524,092 | | | | 2,111,980,188 | | | | 753,385,348 | | | | (220,460,069 | ) | | | 532,925,279 | | | | 494,084,840 | | | | 449,490,365 | | | | (34,591,411 | ) | | | 414,973,137 | | | | (126,151,739 | ) | | | 288,821,398 | | | | (73,145,883 | ) | | | 215,675,515 | |
Generandes Peru S.A. | | Separate | | | 3,473,185 | | | | 219,325,990 | | | | 222,799,175 | | | | 3,148,425 | | | | - | | | | 219,650,750 | | | | 222,799,175 | | | | - | | | | - | | | | - | | | | (116,329 | ) | | | (116,329 | ) | | | 2,240 | | | | 46,503,610 | | | | - | | | | 46,503,610 | | | | 12,303,680 | | | | 58,807,290 | |
Edegel S.A.A. | | Separate | | | 110,164,628 | | | | 720,449,664 | | | | 830,614,292 | | | | 85,724,692 | | | | 235,667,176 | | | | 509,222,424 | | | | 830,614,292 | | | | 319,346,826 | | | | (127,881,082 | ) | | | 191,465,744 | | | | 161,105,457 | | | | 121,654,584 | | | | (6,281,794 | ) | | | 131,544,215 | | | | (25,404,816 | ) | | | 106,139,399 | | | | 23,688,400 | | | | 129,827,799 | |
Chinango S.A.C. | | Separate | | | 8,439,096 | | | | 111,912,667 | | | | 120,351,763 | | | | 7,433,439 | | | | 39,382,244 | | | | 73,536,080 | | | | 120,351,763 | | | | 34,656,130 | | | | (6,061,046 | ) | | | 28,595,084 | | | | 23,773,307 | | | | 19,619,464 | | | | (987,683 | ) | | | 18,631,781 | | | | (3,620,360 | ) | | | 15,011,421 | | | | 3,041,428 | | | | 18,052,849 | |
Enel Brasil S.A. | | Separate | | | 198,803,856 | | | | 728,752,116 | | | | 927,555,972 | | | | 6,224,235 | | | | 18,531,060 | | | | 902,800,677 | | | | 927,555,972 | | | | - | | | | - | | | | - | | | | (10,160,775 | ) | | | (10,314,474 | ) | | | 27,502,175 | | | | 188,852,384 | | | | (24,686,207 | ) | | | 164,166,177 | | | | 17,806,175 | | | | 181,972,351 | |
Central Generadora Termoeléctrica Fortaleza S.A. | | Separate | | | 87,327,393 | | | | 134,284,880 | | | | 221,612,273 | | | | 63,772,100 | | | | 746,476 | | | | 157,093,697 | | | | 221,612,273 | | | | 210,793,165 | | | | (158,318,428 | ) | | | 52,474,737 | | | | 43,685,496 | | | | 36,994,098 | | | | (427,163 | ) | | | 36,566,936 | | | | (12,676,193 | ) | | | 23,890,743 | | | | 3,336,545 | | | | 27,227,288 | |
Centrais Elétricas Cachoeira Dourada S.A. | | Separate | | | 47,664,376 | | | | 100,003,024 | | | | 147,667,400 | | | | 37,718,853 | | | | 1,171,987 | | | | 108,776,560 | | | | 147,667,400 | | | | 158,965,069 | | | | (72,988,916 | ) | | | 85,976,153 | | | | 78,633,209 | | | | 71,852,510 | | | | 6,953,799 | | | | 78,806,309 | | | | (7,617,686 | ) | | | 71,188,623 | | | | (212,540 | ) | | | 70,976,083 | |
Compañía de Interconexión Energética S.A. | | Separate | | | 44,361,955 | | | | 230,817,235 | | | | 275,179,190 | | | | 107,201,716 | | | | 6,527,878 | | | | 161,449,596 | | | | 275,179,190 | | | | 67,700,328 | | | | (3,343,111 | ) | | | 64,357,217 | | | | 54,518,387 | | | | 40,083,633 | | | | 13,131,369 | | | | 53,215,002 | | | | (19,092,627 | ) | | | 34,122,375 | | | | 2,426,463 | | | | 36,548,837 | |
Compañía de Transmisión del Mercosur S.A. | | Separate | | | 15,584,323 | | | | 2,421,427 | | | | 18,005,750 | | | | 10,519,818 | | | | 18,458,001 | | | | (10,972,069 | ) | | | 18,005,750 | | | | 1,622,003 | | | | - | | | | 1,622,003 | | | | 1,169,376 | | | | 1,017,867 | | | | (10,464,633 | ) | | | (9,446,765 | ) | | | (718,950 | ) | | | (10,165,715 | ) | | | 238,183 | | | | (9,927,532 | ) |
Compañía Energética Do Ceará S.A. | | Separate | | | 268,129,640 | | | | 669,313,258 | | | | 937,442,898 | | | | 167,577,487 | | | | 341,179,908 | | | | 428,685,503 | | | | 937,442,898 | | | | 876,944,301 | | | | (606,422,198 | ) | | | 270,522,103 | | | | 171,230,201 | | | | 117,379,884 | | | | (68,220,958 | ) | | | 49,158,926 | | | | 8,091,449 | | | | 57,250,375 | | | | 6,084,384 | | | | 63,334,759 | |
EN-Brasil Comercio e Servicios S.A. | | Separate | | | 6,136,466 | | | | 1,893,079 | | | | 8,029,545 | | | | 5,162,409 | | | | 2,266,733 | | | | 600,403 | | | | 8,029,545 | | | | 5,537,295 | | | | (2,649,496 | ) | | | 2,887,799 | | | | 611,350 | | | | 508,118 | | | | 262,046 | | | | 770,164 | | | | (754,491 | ) | | | 15,673 | | | | 56,856 | | | | 72,529 | |
Ampla Energía E Servicios S.A. | | Separate | | | 320,891,004 | | | | 1,104,657,097 | | | | 1,425,548,101 | | | | 215,091,583 | | | | 589,157,241 | | | | 621,299,277 | | | | 1,425,548,101 | | | | 1,092,281,884 | | | | (707,301,383 | ) | | | 384,980,501 | | | | 257,576,731 | | | | 183,845,670 | | | | (106,657,268 | ) | | | 77,188,402 | | | | (26,650,546 | ) | | | 50,537,856 | | | | 6,281,883 | | | | 56,819,739 | |
Compañía Distribuidora y Comercializadora de Energía S.A. | | Separate | | | 254,295,501 | | | | 922,713,629 | | | | 1,177,009,130 | | | | 337,839,513 | | | | 358,873,769 | | | | 480,295,848 | | | | 1,177,009,130 | | | | 982,770,698 | | | | (547,593,754 | ) | | | 435,176,944 | | | | 336,375,500 | | | | 261,975,074 | | | | (26,624,088 | ) | | | 235,397,500 | | | | (82,240,147 | ) | | | 153,157,353 | | | | (49,593,528 | ) | | | 103,563,825 | |
Inversora Codensa S.A. | | Separate | | | 853 | | | | 72 | | | | 925 | | | | 86 | | | | - | | | | 839 | | | | 925 | | | | - | | | | - | | | | - | | | | (49 | ) | | | (49 | ) | | | - | | | | (49 | ) | | | (8 | ) | | | (57 | ) | | | (54 | ) | | | (111 | ) |
Empresa Distribuidora Sur S.A. | | Separate | | | 409,109,176 | | | | 405,106,897 | | | | 814,216,073 | | | | 739,412,769 | | | | 137,796,785 | | | | (62,993,481 | ) | | | 814,216,073 | | | | 371,411,786 | | | | (161,995,239 | ) | | | 209,416,547 | | | | (37,897,127 | ) | | | (51,229,198 | ) | | | (38,408,033 | ) | | | (89,602,510 | ) | | | 3,792,056 | | | | (85,810,454 | ) | | | (5,608,787 | ) | | | (91,419,240 | ) |
Generalima, S.A.C. | | Separate | | | 5,388,518 | | | | 47,434,910 | | | | 52,823,428 | | | | 18,110,685 | | | | 7,052,044 | | | | 27,660,699 | | | | 52,823,428 | | | | - | | | | - | | | | - | | | | (1,029,910 | ) | | | (1,031,105 | ) | | | (1,029,672 | ) | | | (1,157,449 | ) | | | - | | | | (1,157,449 | ) | | | 2,137,860 | | | | 980,411 | |
Endesa Cemsa, S.A. | | Separate | | | 28,225,495 | | | | 873,712 | | | | 29,099,207 | | | | 24,701,137 | | | | - | | | | 4,398,070 | | | | 29,099,207 | | | | 1,280,939 | | | | (203,349 | ) | | | 1,077,590 | | | | (803,614 | ) | | | (834,067 | ) | | | 456,221 | | | | (377,846 | ) | | | 36,614 | | | | (341,232 | ) | | | (594,259 | ) | | | (935,491 | ) |
Inversora Dock Sud, S.A. | | Separate | | | 27,292,922 | | | | 72,509,102 | | | | 99,802,024 | | | | 19,318,481 | | | | 15,583,458 | | | | 64,900,085 | | | | 99,802,024 | | | | 61,606,091 | | | | (34,976,794 | ) | | | 26,629,297 | | | | 15,187,192 | | | | 9,464,772 | | | | (27,337,694 | ) | | | (17,833,553 | ) | | | (6,292,935 | ) | | | (24,126,488 | ) | | | 6,343,207 | | | | (17,783,281 | ) |
Eléctrica Cabo Blanco, S.A.C. | | Consolidated | | | 43,338,830 | | | | 80,059,964 | | | | 123,398,794 | | | | 13,222,522 | | | | 47,895,051 | | | | 62,281,221 | | | | 123,398,794 | | | | 50,848,925 | | | | (20,916,046 | ) | | | 29,932,879 | | | | 23,494,631 | | | | 17,583,296 | | | | (5,339,890 | ) | | | 12,252,291 | | | | (3,166,090 | ) | | | 9,086,201 | | | | 4,030,841 | | | | 13,117,042 | |
Grupo Distrilima | | Consolidated | | | 142,931,833 | | | | 587,886,652 | | | | 730,818,485 | | | | 165,061,351 | | | | 271,208,225 | | | | 294,548,909 | | | | 730,818,485 | | | | 478,694,847 | | | | (315,115,521 | ) | | | 163,579,326 | | | | 119,230,764 | | | | 90,973,374 | | | | (10,281,167 | ) | | | 80,724,117 | | | | (20,152,036 | ) | | | 60,572,081 | | | | 14,254,102 | | | | 74,826,183 | |
Grupo Enel Brasil | | Consolidated | | | 854,733,662 | | | | 2,303,015,000 | | | | 3,157,748,662 | | | | 481,334,130 | | | | 959,822,163 | | | | 1,716,592,369 | | | | 3,157,748,662 | | | | 2,269,559,959 | | | | (1,405,383,543 | ) | | | 864,176,416 | | | | 598,417,264 | | | | 442,290,345 | | | | (145,647,045 | ) | | | 296,643,299 | | | | (85,139,697 | ) | | | 211,503,602 | | | | 23,085,739 | | | | 234,589,342 | |
Grupo Generandes Peru | | Consolidated | | | 121,446,538 | | | | 816,077,565 | | | | 937,524,103 | | | | 95,676,185 | | | | 275,049,420 | | | | 566,798,498 | | | | 937,524,103 | | | | 353,794,700 | | | | (133,734,610 | ) | | | 220,060,090 | | | | 184,762,435 | | | | 141,157,719 | | | | (7,267,237 | ) | | | 140,375,290 | | | | (29,025,176 | ) | | | 111,350,114 | | | | 23,873,097 | | | | 135,223,211 | |
Grupo Endesa Argentina | | Consolidated | | | 56,074,841 | | | | 297,050,238 | | | | 353,125,079 | | | | 140,459,888 | | | | 101,749,459 | | | | 110,915,732 | | | | 353,125,079 | | | | 105,265,323 | | | | (15,204,196 | ) | | | 90,061,127 | | | | 45,630,444 | | | | 27,960,381 | | | | 49,186,700 | | | | 77,616,469 | | | | (21,104,876 | ) | | | 56,511,593 | | | | (5,660,609 | ) | | | 50,850,984 | |
Discontinued Operations: | | | | | | | | | | | | | | | | | | | | | | | | | | | | | | | | | | | | | | | | | | | | | | | | | | | | | | | | | | | | | | | | | | | | | | | | | | |
Chilectra S.A. | | Consolidated | | | 300,765,618 | | | | 1,240,468,967 | | | | 1,541,234,585 | | | | 244,981,389 | | | | 72,612,724 | | | | 1,223,640,472 | | | | 1,541,234,585 | | | | 1,127,892,544 | | | | (855,757,751 | ) | | | 272,134,793 | | | | 181,011,575 | | | | 152,857,560 | | | | 5,623,543 | | | | 186,967,506 | | | | (36,244,349 | ) | | | 150,723,157 | | | | (3,602,592 | ) | | | 147,120,565 | |
Inmobiliaria Manso de Velasco Ltda. | | Consolidated | | | 47,631,734 | | | | 12,103,210 | | | | 59,734,944 | | | | 3,605,662 | | | | 526,608 | | | | 55,602,674 | | | | 59,734,944 | | | | 12,596,339 | | | | (2,146,800 | ) | | | 10,449,539 | | | | 5,567,964 | | | | 5,359,685 | | | | 587,792 | | | | 27,044,615 | | | | (1,232,550 | ) | | | 25,810,957 | | | | (39,600 | ) | | | 25,771,357 | |
ICT Servicios Informáticos Ltda. | | Separate | | | 2,214,084 | | | | 555,542 | | | | 2,769,626 | | | | 3,005,476 | | | | 1,069,158 | | | | (1,305,008 | ) | | | 2,769,626 | | | | 4,978,226 | | | | - | | | | 4,978,226 | | | | (1,498,309 | ) | | | (1,541,569 | ) | | | 68,519 | | | | (1,473,050 | ) | | | 229,202 | | | | (1,243,848 | ) | | | (162,551 | ) | | | (1,406,399 | ) |
Empresa Nacional de Electricidad S.A. | | Separate | | | 560,876,230 | | | | 3,507,579,867 | | | | 4,068,456,097 | | | | 773,846,300 | | | | 917,950,372 | | | | 2,376,659,425 | | | | 4,068,456,097 | | | | 1,180,478,031 | | | | (1,062,428,719 | ) | | | 118,049,312 | | | | 17,064,677 | | | | (135,048,532 | ) | | | (83,048,732 | ) | | | 164,538,279 | | | | 5,198,626 | | | | 169,736,905 | | | | (101,261,071 | ) | | | 68,475,835 | |
Empresa Eléctrica Pehuenche S.A. | | Separate | | | 75,414,557 | | | | 209,069,274 | | | | 284,483,831 | | | | 59,142,217 | | | | 53,952,811 | | | | 171,388,803 | | | | 284,483,831 | | | | 227,886,302 | | | | (34,362,209 | ) | | | 193,524,093 | | | | 188,824,599 | | | | 180,521,784 | | | | 955,150 | | | | 181,476,935 | | | | (51,863,681 | ) | | | 129,613,254 | | | | (51,043 | ) | | | 129,562,210 | |
Compañía Eléctrica Tarapacá S.A. | | Separate | | | 77,067,775 | | | | 450,573,978 | | | | 527,641,753 | | | | 110,849,007 | | | | 30,918,614 | | | | 385,874,132 | | | | 527,641,753 | | | | 318,959,142 | | | | (196,105,061 | ) | | | 122,854,081 | | | | 107,687,954 | | | | 91,702,959 | | | | 18,891,133 | | | | 110,594,093 | | | | (27,733,975 | ) | | | 82,860,118 | | | | (604 | ) | | | 82,859,513 | |
Soc. Concesionaria Túnel El Melón S.A. | | Separate | | | 19,183,735 | | | | 7,107,942 | | | | 26,291,677 | | | | 3,709,123 | | | | 1,789,703 | | | | 20,792,851 | | | | 26,291,677 | | | | 10,484,435 | | | | (3,751 | ) | | | 10,480,684 | | | | 9,152,206 | | | | 6,547,832 | | | | 82,925 | | | | 6,630,757 | | | | (298,947 | ) | | | 6,331,810 | | | | (12,156 | ) | | | 6,319,654 | |
Grupo Endesa Chile | | Consolidated | | | 1,038,057,559 | | | | 6,199,614,342 | | | | 7,237,671,901 | | | | 1,392,737,593 | | | | 2,321,047,965 | | | | 3,523,886,343 | | | | 7,237,671,901 | | | | 2,446,534,314 | | | | (1,119,458,198 | ) | | | 1,327,076,116 | | | | 1,094,981,140 | | | | 875,320,583 | | | | (68,781,874 | ) | | | 857,125,255 | | | | (238,152,509 | ) | | | 618,972,747 | | | | (103,941,898 | ) | | | 515,030,849 | |
Grupo Inversiones GasAtacama Holding Ltda. | | Consolidated | | | 197,276,197 | | | | 216,893,717 | | | | 414,169,914 | | | | 29,892,670 | | | | 48,748,663 | | | | 335,528,581 | | | | 414,169,914 | | | | 179,474,707 | | | | (99,313,387 | ) | | | 80,161,320 | | | | 59,020,205 | | | | 46,178,851 | | | | (4,406,559 | ) | | | 41,772,291 | | | | (21,542,230 | ) | | | 20,230,061 | | | | 51,288,697 | | | | 71,518,759 | |
| | |
| The accompanying notes are an integral part of these consolidated financial statements | | |
|
| F-175 |
41. SUBSEQUENT EVENTS.
ENERSIS AMÉRICAS
- On January 29, 2016, pursuant to the agreements approved at the Extraordinary Shareholders’ Meeting (“ESM”) of Enersis S.A. (“the Company” or “Enersis”) held on December 18, 2015, the Board of Directors of Enersis S.A. was informed that the condition precedent for the spin-off of Enersis to be effective was met and, consequently, the public deed entitled “Public Deed of Compliance of the Condition of the Spin-Off of Enersis” was issued which established that the condition precedent has been met on January 29, 2016.
Accordingly, and pursuant to what was approved at the ESM, the spin-off of Enersis S.A. became effective on Tuesday, March 1, 2016, a date as of which the new company Enersis Chile S.A. (“Enersis Chile”) began to exist and the reduction of capital and other statutory reforms of the current Company was verified, and the continuing company changed its name to “Enersis Américas S.A.”
Also, as agreed by the aforementioned ESM, the Board of Directors of Enersis Chile requested the registration of Enersis Chile and its respective shares in the Securities Registry of the Superintendency of Securities and Insurance and the Stock Exchanges where the shares of Enersis are currently traded. The physical distribution and delivery of shares issued by Enersis Chile shall be carried out on the date established by Enersis Chile’s Board of Directors, once the registration thereof is completed and its shares registered in the Securities Registry of the Superintendency of Securities and Insurance and Chilean Stock Markets and when legal and regulatory requirements are met.
At the OSM held on April 28, 2016, our new Board of Directors was elected for a term of three years starting from the date of the meeting. At the Board of Directors meeting held on April 29, 2016, the directors agreed to appoint Mr. Domingo Cruzat A., Mr. Patricio Gómez S. and Mr. Hernán Somerville S. as members of the Directors’ Committee. Additionally, Mr. Somerville was appointed as Financial Expert of the Directors’ Committee.
The members of our new Board of Directors are as follows:
| | • | | Mr. Francisco de Borja Acha B. (Chairman) |
| | • | | Mr. José Antonio Vargas L. (Vice Chairman) |
| | • | | Mr. Hernán Somerville S. |
ENERSIS CHILE
At the Board of Directors Meeting held on April 14, 2016 has agreed the following:
1. To announce that, on April 13, 2016, the Superintendence of Securities and Insurance (Superintendencia de Valores y Seguros, “SVS”) proceeded to record Enersis Chile and its shares in the Securities Registry, according to a certificate issued by this entity, and that it has made the respective listings in the Santiago Stock Exchange, the Valparaíso Stock Exchange, the Chile Electronic Stock Exchange and the New York Stock Exchange of United States of America, all in accordance with the decision made at the Extraordinary Shareholders’ Meeting of Enersis Américas S.A. (formerly Enersis S.A.) held on December 18, 2015. Therefore, the shares of the divided equity of Enersis Chile should be distributed free of any payment to the shareholders of Enersis Américas S.A. entitled to receive them.
2. The Board of Directors of Enersis Chile agreed to carry out the distribution and delivery of a total of 49,092,772,762 shares issued by Enersis Chile, all nominative, of a unique and single series and without nominal value, on April 21, 2016, to the shareholders of Enersis Américas that were listed in its shareholders’ registry at the midnight of the day before April 21, 2016.
3. This distribution to the shareholders of Enersis Américas S.A. will be carried out by delivering one (1) share of Enersis Chile for each share of Enersis Américas S.A. that will be registered under its name in the registry at the midnight of the day before April 21, 2016. From April 21, 2016 onwards, the shares issued by Enersis Chile may be officially quoted in the stock markets aforementioned.
4. Representative titles of the shares in Enersis Chile will be available for shareholders of Enersis Américas S.A. to be withdrawn on April 21, 2016 at DCV Registros S.A. offices, located in Huérfanos 770, 22nd floor, Santiago, Monday to Thursday from 9:00 am to 5:00 pm, and Friday from 9:00 am to 4:00 pm.
At the OSM held on April 28, 2016, our new Board of Directors was elected for a term of three years starting from the date of the meeting. At the Board of Directors meeting held on April 29, 2016, the directors agreed to appoint Mr. Pablo Cabrera G., Mr. Fernán Gazmuri P. and Mr. Gerardo Jofré M. as members of the Directors’ Committee. Additionally, Mr. Gazmuri was appointed as Financial Expert of the Directors’ Committee.
The members of our new Board of Directors are as follows:
| | • | | Mr. Herman Chadwick P. (Chairman) |
| | • | | Mr. Giulio Fazio (Vice Chairman) |
ENDESA
- On January 8, 2016, Endesa Chile informed as a Significant Event that it has resolved the illegal occupation perpetrated by three people on the first high-tension pylon which supports the 154 kV and 220 kV circuits owned by Transelec S.A. and serve the Company’s Bocamina power plant. Consequently, the Bocamina power plant resumed its operations. The financial effects due to the illegal occupation that Endesa Chile assumed during the interruption of the transmission of electrical energy were ThCh$2,698,608 (U.S. $3.8 million) decrease in the contribution margin between November 23, 2015 and January 7, 2016.
At the electrical system level, this situation increased the global costs of supplying demand, increasing spot prices and the anticipated use of hydroelectric reserves, which in the coming months will not be available.
- On January 29, 2016, Endesa Chile informed as a Significant Event that on January 28, 2016, pursuant to the agreements approved at the Extraordinary Shareholders’ Meeting (“ESM”) of Endesa Chile held on December 18, 2015, the Board of
| | |
| The accompanying notes are an integral part of these consolidated financial statements | | |
|
| F-176 |
Directors of Endesa Chile was informed that the condition precedent for the spin-off Enersis to be effective was met and, consequently, it was issued the public deed entitled “Public Deed of Compliance of the Condition of the Spin-Off of Empresa Nacional de Electricidad S.A.” which established that the condition precedent has been met on January 29, 2016.
Accordingly, and pursuant to what was approved at the ESM, the spin-off of Endesa Chile became effective on Tuesday, March 1, 2016, a date as of which the new company Endesa Américas S.A. began to exist and the reduction of capital and other statutory reforms of Endesa Chile.
Additionally, as a result of formalization of Endesa Chile’s spin-off, it was triggered on that date the obligation for Endesa Chile was triggered to pay taxes in Peru for a total amount of $558.2 million of nuevos soles (ThCh$112,187,442 approximately). This tax, that will be paid during March 2016, is applicable under the Peruvian Income Tax Law to the transfer of the ownership interests that Endesa Chile held in that country that were transfered to Endesa Américas S.A. The tax is calculated as the difference between the disposal value and the acquisition cost of the ownership interests previously mentioned.
Also, as agreed by the aforementioned ESM, the Board of Directors of Endesa Américas requested the registration of Endesa Américas and its respective shares in the Securities Registry of the Superintendency of Securities and Insurance and the Stock Exchanges where the shares of Endesa Chile are currently traded. The physical distribution and delivery of shares issued by Endesa Américas S.A. shall be carried out on the date established by Endesa Américas S.A.’s Board of Directors, once the registration thereof is completed and its shares registered in the Securities Registry of the Superintendency of Securities and Insurance and Chilean Stock Markets and when legal and regulatory requirements are met. The amount of issued capital allocated to Endesa Américas was ThCh$778,936,764.
At the OSM held on April 27, 2016, our new Board of Directors was elected for a term of three years starting from the date of the meeting. At the Board of Directors meeting held on April 28, 2016, the directors agreed to appoint Mr. Jorge Atton P., Mr. Enrique Cibié B. and Mr. Julio Pellegrini V. as members of the Directors’ Committee. Additionally, Mr. Cibié was appointed as Financial Expert of the Directors’ Committee.
The members of our new Board of Directors are as follows:
| | • | | Mr. Giuseppe Conti (Chairman) |
| | • | | Mr. Francesco Giorgianni (Vice Chairman) |
| | • | | Mr. Julio Pellegrini V. |
- On January 29, 2016 Empresa Nacional de Electricidad S.A. reported through the significant event that in compliance with the agreement reached at the Extraordinary Shareholders’ Meeting of Endesa held on December 18, 2015 (hereinafter “Meeting”), the Board of Directors of Endesa acknowledges that the condition precedent regarding the spin-off of Endesa has been met as of January 28, 2016, and accordingly has also arranged to grant the public deed that declares the completion of the condition precedent, entitled “Public Deed of Compliance of the Condition of the Spin-Off of Empresa Nacional de Electricidad S.A.”, effective on the same date.
Consequently, and pursuant to what was approved at the Meeting, the Endesa’s Spin-Off became effective on Tuesday, March 1, 2016, whereupon the new corporation, Endesa Américas S.A. (“Endesa Américas”), began to exist, and verifies the capital decrease and the other amendments to the by-laws of Endesa Chile that have been approved.
It is noted that, as agreed to at the Meeting, the Board of Directors of Endesa Américas, proceeds in due time to request the registration of Endesa Américas S.A. and its respective shares in the Securities Registry of the Superintendence of Securities and Insurance and in the Stock Exchanges where the shares of Endesa Chile are currently traded. The distribution, and the material delivery of the shares issued by Endesa Américas S.A. will take place at a date established by the Board of Directors of Endesa Américas S.A., once the shares registration in the Securities Registry of the Superintendence of Securities and Insurance and Chilean Stock Exchanges are complete, and when the legal and regulatory requirements have been fulfilled. The paid-in capital allocated to Endesa Américas S.A. amounted to ThCh$ 778,936,764.
- As of April 13, 2016, the Superintendence of Securities and Insurance (Superintendencia de Valores y Seguros, “SVS”) proceeded to record Endesa Américas and its shares in the Securities Registry, according to a certificate issued by this entity, and that it has made the respective listings in the Santiago Stock Exchange, the Valparaĺso Stock Exchange, the Chile Electronic Stock Exchange and the New York Stock Exchange of United States of America, all in accordance with the decision made at the Extraordinary Shareholders’ Meeting of Empresa Nacional de Electricidad S.A. held on December 18, 2015. Therefore, the shares of the divided equity of Endesa Américas were distributed free of any payment to the shareholders of Endesa Chile entitled to receive them as of April 21, 2016 and began to be traded.
- At the OSM held on April 27, 2016, our new Board of Directors was elected for a term of three years starting from the date of the meeting. At the Board of Directors meeting held on April 28, 2016, the directors agreed to appoint Mr. Hernán Cheyre V., Mr. Eduardo Novoa C. and Ms. Marĺa Loreto Silva R. as members of the Directors’ Committee. Additionally, Mr. Cheyre was appointed as Financial Expert of the Directors’ Committee.
The members of our new Board of Directors are as follows:
| | • | | Mr. Rafael Fauquié Bernal (Chairman) |
| | • | | Mr. Vittorio Vagliasindi (Vice Chairman) |
| | • | | Ms. Marĺa Loreto Silva R. |
CHILECTRA
- On January 29, 2016, the public deed entitled “Public Deed of Compliance of the Condition of the Spin-Off of Chilectra” was issued, pursuant to which the complete fulfillment was declared of the condition precedent for the spin-off of Chilectra S.A. as agreed to at the Extraordinary Shareholders’ Meeting (“ESM”) of Chilectra S.A. held on December 18, 2015, which required to the minutes of each the shareholders’ meetings where the spin-offs were approved of Empresa Nacional de Electricidad S.A and Enersis S.A. were duly registered as public deeds, and their corresponding extracts were, duly and timely, registered and published in accordance with the law.
In accordance with the ESM, the spin-off of Chilectra, and as a result of the incorporation of a new entity named Chilectra Américas S.A. (“Chilectra Américas”), will be effective for all legal, operational, accounting and tax purposes beginning on February 1, 2016. Consequently, from that date on, the allocated assets and liabilities pursuant to the spin-off, were transferred to Chilectra Américas without any necessary declaration or additional formality, notwithstanding the necessary or convenient activities needed to register before the corresponding legal bodies about the allocation of all assets that are being transferred and the final novation of the liabilities transferred pursuant to the Company’s spin-off.
Additionally, as a result of formalization of Chilectra’s spin-off, on that date the obligation was triggered for Chilectra to pay taxes in Peru for a total amount of $81.6 million of soles (ThCh$16,235,406 approximately). This tax, that will be paid during March 2016, is applicable under the Peruvian Income Tax Law to the transfer of the ownership interests that Chilectra held in that country that were transfered to Chilectra Américas S.A.. The tax is calculated as the difference between the disposal value and the acquisition cost of the ownership interests previously mentioned.
Also, as agreed by the aforementioned ESM, the Board of Directors of Chilectra Américas requested the registration of Chilectra Américas and its respective shares in the Securities Registry of the Superintendency of Securities and Insurance and the Stock Exchanges. The physical distribution and delivery of shares issued by Chilectra Américas S.A. shall be carried out on the date established by Chilectra Américas S.A.’s Board of Directors, once the registration thereof is completed and its shares registered in the Securities Registry of the Superintendency of Securities and Insurance and Chilean Stock Markets and when legal and regulatory requirements are met.
At the OSM held on April 27, 2016, a new Board of Directors was elected for a period of three years starting from the date of the meeting. At the Board of Directors meeting held on the same date, Mr. Gianluca Caccialupi was appointed as Chairman of the Board and Mrs. Francesca Romana Napolitano was appointed as Vice Chairman.
The members of our new Board of Directors are:
| | • | | Gianluca Caccialupi (Chairman) |
| | • | | Francesca Romana Napolitano (Vice Chairman) |
| | • | | Iris Boeninger von Kretschmann |
| | • | | Hernán Felipe Errázuriz Correa |
CHILECTRA AMÉRICAS
On February 15, 2016, at the Extraordinary Board of Directors’ Session No. 1, Mr. Livio Gallo was appointed as Chairman of the Board, and Mr. Gianluca Caccialupi as Vice-Chairman. Also, at the same session, Mr. Andreas Gebhardt Strobel was appointed as Chief Executive Officer of Chilectra Américas.
At the same Board of Directors’ Session, it was agreed to stablish the customary transactions general policy in accordance with Article 147 paragraph b) of Law 18,046.
| | |
| The accompanying notes are an integral part of these consolidated financial statements | | |
|
| F-177 |
The Board of Directors unanimously agreed to establish the customary transactions general policy, as it relates to those ordinary transactions in terms of the business purpose and that entails to the principal activity of the company. For that purpose, it must be taken in to consideration that Chilectra Américas S.A. is a holding company with few employees, and as such, in order to operate it has to sign a number of service contracts that would allow it to perform its corporate purpose activities. Consequently, the following transactions are related to the ordinary and customary corporate purpose activities of Chilectra Américas S.A.:
1. Commercial current account between Chilectra Américas S.A. and its related parties, by which one of the parties shall remit to the other or receive from it amounts of money or other securities, without application to a particular use or obligation to have an amount of equivalent value, but to accredit to the remitter for its remittances, to settle them within the conveyed dates, to compensate them at once until concurrence of debit and credit and to pay the balance.
2. Contract to render Legal Services and Board of Directors (“the Board”) Secretariat, which includes, inter alia, to legally assist the Board of Chilectra Américas S.A., its Chief Executive Officer and the other key executives, to prepare and manage in legal related-matters the Board meetings, to assits the Company for compliance with regulations related to corporations, stock markets, free competition, environmental, commercial, labor and other applicable regulations and to manage litigations affecting the Company.
3. Contract to render the following services: i) Network commercial operations; ii) Network developments; iii) Network Technology; iv) Health, Safety, Quality and Environment; and v) Operation and Maintenance.
4. Contract to render the following services: i) Human Resources and Organization; ii) Communications; iii) Taxes; iv) Finance and Accounting; v) Internal Audit; vi) Insurance, y vii) Treasury.
5. Contracts related to services of agency communications, infrastructure, innovation, administration and finance, legal and other related services aimed to fulfill the corporate purpose of the Company.
Finally, it is important to note that the entire text of the customary general policy will be available to the shareholders at the corporate offices and in the website of the Company.
At the OSM held on April 27, 2016, a new Board of Directors was elected for a period of three years starting from the date of the meeting. At the Board of Directors meeting held on the same date, Mr. Gianluca Caccialupi was appointed as Chairman of the Board and Mrs. Francesca Romana Napolitano was appointed as Vice Chairman.
The members of our new Board of Directors are:
| | • | | Gianluca Caccialupi (Chairman) |
| | • | | Francesca Romana Napolitano (Vice Chairman) |
| | • | | Iris Boeninger von Kretschmann |
| | • | | Hernán Felipe Errázuriz Correa |
EDESUR
On January 25, 2016, the Ministry of Energy and Mining (“MEyM” in its Spanish acronym) issued Resolution No. 6/2016 which approved the Summer Quarterly Re-scheduling (“Reprogramación Trimestral de Verano”) applicable to the Wholesale Electricity Market (“MEM” in its Spanish acronym) and established the seasonal reference prices for energy and capacity for the February-April 2016 period.
Additionally, in order to move towards proper management of demand through incentives for saving and rational use of electricity of residential end users (“Plan Estímulo”), implemented through the MEM, an incentive system that will result in a mechanism of decreasing energy prices as counterpart of the effort of each residential user to reduce unnecessary consumption, which will be determined by comparing the monthly energy consumption with the one recorded in the same month of 2015.
Moreover, given the social significance of the electricity service, the previously mentioned Resolution defines an energy volume at a price named Social Tariff (“Tarifa Social”), to be transferred at a minimum price to those included in the population of end users who, based on the criteria of classification communicated by the Ministry of Social Development of the Nation (“Ministerio de Desarrollo Social de la Nación”), lacks sufficient payment capacity to afford the general established prices.
Access to reduced wholesale prices for Social Tariff and incentive for saving are subject to the compliance with, in the case of distribution companies, the payment obligations in the MEM due from the effective date of this Resolution. Likewise, those distribution companies with outstanding debts with CAMMESA as of issuance date of the Resolution, as in the case of Edesur, shall agree to, in no less than 30 business days, a payment plan for the past due debt and, also, to ensure payment of its purchases in the MEM through transferring its accounts receivables or other equivalent alternative mechanism at CAMMESA’s satisfaction, so as to ensure both the collection on current billing and the payment of the installments in the agreement to sign related to the past due debt.
Subsequently, on January 27, 2016, it was issued Resolution MEyM No. 7/2016 instruction E.N.R.E. to:
i. Adjust the VAD in the tariff tables of the Company, on account of the RTI within the framework of the Transitional Tariff Regime established in the Agreement Act (“Acta Acuerdo”).
| | |
| The accompanying notes are an integral part of these consolidated financial statements | | |
|
| F-178 |
ii. Apply a Social Tariff to the population of end users resulting from the application of certain eligibility criteria, namely: be a retiree or pensioner for an amount equivalent to twice minimum salary; employed persons in a dependency relationship earning a gross remuneration lower or equal to two minimum salaries; be beneficiary in social programs; be enrolled in the Social Monotributo Regime; be incorporated in the Social Security Special Regime for domestic service workers; receiving unemployment insurance; or have a disability certificate, being excluded from the benefit those owners of more than real estate, motor vehicles whose models are up to 15 years old, or luxury aircrafts and boats.
iii. Include in the tariff tables the saving of electrical energy plan as stated in Resolution MEyM No. 6/2016.
iv. Carry out all necessary activities to proceed to the RTI, which must be effective before December 31, 2016.
In order for users to improve their household finances, the ENRE shall have the necessary means in terms of implementing the monthly payments for the distribution public service rendered by the Company.
Furthermore, Resolution MEyM N° 7/2016 annulled the Energy Efficiency Program (“PUREE” in its Spanish acronym) from the effective date of the new tariff values and will cease the application of the planned projects financing mechanism by mutual loans with CAMMESSA.
Finally, the Resolution established that the dividend distribution must agree the Agreement Act, which subordinate to verification from the ENRE of compliance with the investment plan.
In line with above, on January 29, 2016, the ENRE issued Resolutions No. 1/2016 y No. 2/2016. The former approves the values of the tariff table of the Company to be effective upon invoicing the corresponding meter readings after midnight of February 1, 2016, while the latter terminates, effective on January 31, 2016, the actual trust scheme (“FOCEDE” in its Spanish acronym) for managing the funds from the application of Resolution ENRE N° 347/2012.
The resolutions indicated above assumed significant effects throughout the businesses activities of the Company. In addition to a potential increase in invoicing amounts and potential increase in past due receivables ratios, etc., it also leads to a significant effect in the value updates of the fines, which the Company is currently quantifying and in discussions with the ENRE to agree the next steps.
There are no other subsequent events that have occurred between January 1, 2016 and the issuance date of these financial statements.
| | |
| The accompanying notes are an integral part of these consolidated financial statements | | |
|
| F-179 |
APPENDIX 1 ENERSIS AMÉRICAS GROUP ENTITIES:
This appendix is part of Note 2.4, “Subsidiaries.”
It presents the Group’s percentage of control in each company.
| | | | | | | | | | | | | | | | | | | | | | |
Taxpayer ID
No. (RUT) | | Company | | Currency | | Percentage of control as of 12/31/2015 | | Percentage of control as of 12/31/2014 | | Type of Relationship | | Country | | Activity |
| | ( in alphabetical order) | | | Direct | | Indirect | | Total | | Direct | | Indirect | | Total | | | |
| | | | | | | | | | | | | | | | | | | | | | |
96.773.290-7 | | Aguas Santiago Poniente S.A. (5) | | Chilean peso | | 0.00% | | 0.00% | | 0.00% | | 0.00% | | 0.00% | | 0.00% | | Subsidiary | | Chile | | Sanitation services |
Foreign | | Ampla Energía E Serviços S.A. | | Brazilian real | | 13.68% | | 85.95% | | 99.63% | | 13.68% | | 85.95% | | 99.63% | | Subsidiary | | Brazil | | Electric energy production, transportation and distribution |
Foreign | | Atacama Finance Co (3) | | U.S. dollar | | 0.00% | | 0.00% | | 0.00% | | 0.00% | | 0.00% | | 0.00% | | Subsidiary | | Cayman Islands | | Finance company |
Foreign | | Centrais Elétricas Cachoeira Dourada S.A. | | Brazilian real | | 0.00% | | 99.61% | | 99.61% | | 0.00% | | 99.61% | | 99.61% | | Subsidiary | | Brazil | | Generation and sale of electricity |
Foreign | | Central Dock Sud, S.A. | | Argentine peso | | 0.00% | | 69.99% | | 69.99% | | 0.00% | | 69.99% | | 69.99% | | Subsidiary | | Argentina | | Electric energy generation, transmission and distribution |
76.003.204-2 | | Central Eólica Canela S.A. | | Chilean peso | | 0.00% | | 75.00% | | 75.00% | | 0.00% | | 75.00% | | 75.00% | | Subsidiary | | Chile | | Promotion and development of renewable energy projects |
Foreign | | Central Generadora Termoeléctrica Fortaleza S.A. | | Brazilian real | | 0.00% | | 100.00% | | 100.00% | | 0.00% | | 100.00% | | 100.00% | | Subsidiary | | Brazil | | Development of a thermoelectric project |
99.573.910-0 | | Chilectra Inversud S.A. | | Chilean peso | | 0.00% | | 100.00% | | 100.00% | | 0.00% | | 100.00% | | 100.00% | | Subsidiary | | Chile | | Portfolio company |
96.800.570-7 | | Chilectra S.A. | | Chilean peso | | 99.08% | | 0.01% | | 99.09% | | 99.08% | | 0.01% | | 99.09% | | Subsidiary | | Chile | | Ownership interest in companies of any nature |
Foreign | | Chinango S.A.C. | | Peruvian nuevo sol | | 0.00% | | 80.00% | | 80.00% | | 0.00% | | 80.00% | | 80.00% | | Subsidiary | | Peru | | Electric energy generation, sales and distribution |
Foreign | | Compañía de Interconexión Energética S.A. | | Brazilian real | | 0.00% | | 100.00% | | 100.00% | | 0.00% | | 100.00% | | 100.00% | | Subsidiary | | Brazil | | Electric energy production, transportation and distribution |
Foreign | | Compañía de Transmisión del Mercosur S.A. | | Argentine peso | | 0.00% | | 99.99% | | 99.99% | | 0.00% | | 99.99% | | 99.99% | | Subsidiary | | Argentina | | Electric energy production, transportation and distribution |
Foreign | | Compañía Distribuidora y Comercializadora de energía S.A. (7) | | Colombian peso | | 21.14% | | 36.01% | | 57.15% | | 21.14% | | 36.01% | | 57.15% | | Subsidiary | | Colombia | | Electric energy distribution and sales |
96.770.940-9 | | Compañía Eléctrica Tarapacá S.A. | | Chilean peso | | 3.78% | | 96.21% | | 99.99% | | 3.78% | | 96.21% | | 99.99% | | Subsidiary | | Chile | | Complete electric energy cycle |
Foreign | | Compañía Energética Do Ceará S.A. | | Brazilian real | | 15.18% | | 58.87% | | 74.05% | | 15.18% | | 58.87% | | 74.05% | | Subsidiary | | Brazil | | Complete electric energy cycle |
96.764.840-K | | Constructora y Proyectos Los Maitenes S.A. (5) | | Chilean peso | | 0.00% | | 0.00% | | 0.00% | | 0.00% | | 0.00% | | 0.00% | | Subsidiary | | Chile | | Construction and facilities |
Foreign | | Distrilec Inversora S.A. | | Argentine peso | | 27.19% | | 24.31% | | 51.50% | | 27.19% | | 24.31% | | 51.50% | | Subsidiary | | Argentina | | Portfolio company |
Foreign | | Edegel S.A.A | | Peruvian nuevo sol | | 0.00% | | 83.60% | | 83.60% | | 0.00% | | 83.60% | | 83.60% | | Subsidiary | | Peru | | Electric energy generation, sales and distribution |
Foreign | | Electrica Cabo Blanco, S.A.C. | | Peruvian nuevo sol | | 80.00% | | 20.00% | | 100.00% | | 80.00% | | 20.00% | | 100.00% | | Subsidiary | | Peru | | Portfolio company |
Foreign | | Emgesa S.A. E.S.P. (7) | | Colombian peso | | 21.60% | | 34.83% | | 56.43% | | 21.60% | | 34.83% | | 56.43% | | Subsidiary | | Colombia | | Electric energy generation |
Foreign | | Emgesa Panama S.A. (7) | | U.S. dollar | | 0.00% | | 56.43% | | 56.43% | | 0.00% | | 56.43% | | 56.43% | | Subsidiary | | Panama | | Purchase/sale of electric energy |
Foreign | | Empresa de Distribución Eléctrica de Lima Norte S.A.A | | Peruvian nuevo sol | | 24.00% | | 51.68% | | 75.68% | | 24.00% | | 51.68% | | 75.68% | | Subsidiary | | Peru | | Electric energy distribution and sales |
Foreign | | Empresa Distribuidora Sur S.A. | | Argentine peso | | 16.02% | | 83.43% | | 99.45% | | 16.02% | | 83.43% | | 99.45% | | Subsidiary | | Argentina | | Electric energy distribution and sales |
96.783.910-8 | | Empresa Eléctrica de Colina Ltda. | | Chilean peso | | 0.00% | | 100.00% | | 100.00% | | 0.00% | | 100.00% | | 100.00% | | Subsidiary | | Chile | | Complete energy cycle and related supplies |
Foreign | | Empresa Eléctrica de Piura, S.A. | | Peruvian nuevo sol | | 0.00% | | 96.50% | | 96.50% | | 0.00% | | 96.50% | | 96.50% | | Subsidiary | | Peru | | Electric energy production (thermal and natural gas) |
96.504.980-0 | | Empresa Eléctrica Pehuenche S.A. | | Chilean peso | | 0.00% | | 92.65% | | 92.65% | | 0.00% | | 92.65% | | 92.65% | | Subsidiary | | Chile | | Complete electric energy cycle |
91.081.000-6 | | Empresa Nacional de Electricidad S.A | | Chilean peso | | 59.98% | | 0.00% | | 59.98% | | 59.98% | | 0.00% | | 59.98% | | Subsidiary | | Chile | | Complete electric energy cycle |
Foreign | | Endesa Argentina S.A. | | Argentine peso | | 0.00% | | 100.00% | | 100.00% | | 0.00% | | 100.00% | | 100.00% | | Subsidiary | | Argentina | | Portfolio company |
Foreign | | Enel Brasil S.A. | | Brazilian real | | 50.09% | | 49.91% | | 100.00% | | 50.09% | | 49.91% | | 100.00% | | Subsidiary | | Brazil | | Portfolio company |
Foreign | | Endesa Cemsa S.A. | | Argentine peso | | 55.00% | | 45.00% | | 100.00% | | 55.00% | | 45.00% | | 100.00% | | Subsidiary | | Argentina | | Wholesale purchase and sale of electric energy |
| | |
| The accompanying notes are an integral part of these consolidated financial statements | | |
|
| F-180 |
| | | | | | | | | | | | | | | | | | | | | | |
Taxpayer ID
No. (RUT) | | Company | | Currency | | Ownership Interest as of 12/31/2015 | | Ownership Interest as of 12/31/2014 | | Type of Relationship | | Country | | Activity |
| | ( in alphabetical order) | | | Direct | | Indirect | | Total | | Direct | | Indirect | | Total | | | |
Foreign | | Central Costanera S.A. | | Argentine peso | | 0.00% | | 75.68% | | 75.68% | | 0.00% | | 75.68% | | 75.68% | | Subsidiary | | Argentina | | Electric energy generation and sales |
Foreign | | En-Brazil Comercio e Servicios S.A. | | Brazilian real | | 0.00% | | 100.00% | | 100.00% | | 0.00% | | 100.00% | | 100.00% | | Subsidiary | | Brazil | | Services in general for the electricity and other sectors |
Foreign | | Eólica Fazenda Nova-Geracao e Comercializacao de Energia S.A. | | Brazilian real | | 0.00% | | 99.95% | | 99.95% | | 0.00% | | 99.95% | | 99.95% | | Subsidiary | | Brazil | | Energy generation, transmission, distribution and sales |
Foreign | | Energex Co (3) | | U.S. dollar | | 0.00% | | 0.00% | | 0.00% | | 0.00% | | 0.00% | | 0.00% | | Subsidiary | | Cayman Islands | | Portfolio company |
76.014.570-K | | Inversiones GasAtacama Holding Ltda. (1) | | U.S. dollar | | 0.00% | | 100.00% | | 100.00% | | 0.00% | | 100.00% | | 100.00% | | Subsidiary | | Chile | | Natural gas transportation |
9.830.980-3 | | GasAtacama S.A. | | U.S. dollar | | 0.00% | | 100.00% | | 100.00% | | 0.00% | | 100.00% | | 100.00% | | Subsidiary | | Chile | | Exploitation, generation, transmission and distribution of electric energy and natural gas |
78.932.860-9 | | GasAtacama Chile S.A. | | U.S. dollar | | 0.00% | | 100.00% | | 100.00% | | 0.00% | | 100.00% | | 100.00% | | Subsidiary | | Chile | | Company management |
77.032.280-4 | | Gasoducto TalTal S.A. | | Chilean peso | | 0.00% | | 100.00% | | 100.00% | | 0.00% | | 100.00% | | 100.00% | | Subsidiary | | Chile | | Natural gas transportation, sale and distribution |
78.952.420-3 | | Gasoducto Atacama Argentina S.A. | | U.S. dollar | | 0.00% | | 100.00% | | 100.00% | | 0.00% | | 100.00% | | 100.00% | | Subsidiary | | Chile | | Natural gas exploitation and transportation |
Foreign | | Generalima, S.A.C. | | Peruvian nuevo sol | | 100.00% | | 0.00% | | 100.00% | | 100.00% | | 0.00% | | 100.00% | | Subsidiary | | Peru | | Portfolio company |
Foreign | | Generandes Peru S.A. (2) | | Peruvian nuevo sol | | 39.00% | | 61.00% | | 100.00% | | 39.00% | | 61.00% | | 100.00% | | Subsidiary | | Peru | | Portfolio company |
76.676.750-8 | | GNL Norte S.A. | | Chilean peso | | 0.00% | | 100.00% | | 100.00% | | 0.00% | | 100.00% | | 100.00% | | Subsidiary | | Chile | | Energy and fuel production, transportation and distribution |
Foreign | | Hidroeléctrica El Chocón S.A. | | Argentine peso | | 0.00% | | 67.67% | | 67.67% | | 0.00% | | 67.67% | | 67.67% | | Subsidiary | | Argentina | | Electric energy production and sales |
Foreign | | Hidroinvest S.A. | | Argentine peso | | 0.00% | | 96.09% | | 96.09% | | 0.00% | | 96.09% | | 96.09% | | Subsidiary | | Argentina | | Portfolio company |
76.107.186-6 | | Servicios Informáticos e Inmobiliarios Ltda. (4) | | Chilean peso | | 99.00% | | 1.00% | | 100.00% | | 99.00% | | 1.00% | | 100.00% | | Subsidiary | | Chile | | Information Technology services |
Foreign | | Ingendesa do Brazil Ltda. | | Brazilian real | | 0.00% | | 100.00% | | 100.00% | | 0.00% | | 100.00% | | 100.00% | | Subsidiary | | Brazil | | Project engineering consulting |
79.913.810-7 | | Inmobiliaria Manso de Velasco Ltda. (4) | | Chilean peso | | 99.99% | | 0.00% | | 99.99% | | 99.99% | | 0.00% | | 99.99% | | Subsidiary | | Chile | | Construction and works |
Foreign | | Inversiones Distrilima S.A. | | Peruvian nuevo sol | | 34.99% | | 50.21% | | 85.20% | | 34.99% | | 50.21% | | 85.20% | | Subsidiary | | Peru | | Portfolio company |
Foreign | | Inversora Dock Sud, S.A. | | Argentine peso | | 57.14% | | 0.00% | | 57.14% | | 57.14% | | 0.00% | | 57.14% | | Subsidiary | | Argentina | | Portfolio company |
Foreign | | Inversora Codensa S.A.S. | | Colombian peso | | 0.00% | | 100.00% | | 100.00% | | 0.00% | | 100.00% | | 100.00% | | Subsidiary | | Colombia | | Investment in domestic public energy services |
96.800.460-3 | | Luz Andes Ltda. | | Chilean peso | | 0.00% | | 100.00% | | 100.00% | | 0.00% | | 100.00% | | 100.00% | | Subsidiary | | Chile | | Energy and fuel transportation, distribution and sales |
96.905.700-K | | Progas S.A. | | Chilean peso | | 0.00% | | 100.00% | | 100.00% | | 0.00% | | 100.00% | | 100.00% | | Subsidiary | | Chile | | Purchase, production, transportation and commercial distribution of natural gas |
77.047.280-6 | | Sociedad Agrícola de Cameros Ltda. | | Chilean peso | | 0.00% | | 57.50% | | 57.50% | | 0.00% | | 57.50% | | 57.50% | | Subsidiary | | Chile | | Financial investments |
96.671.,360-7 | | Sociedad Concesionaria Túnel El Melón S.A. (6) | | Chilean peso | | 0.00% | | 0.00% | | 0.00% | | 0.00% | | 100.00% | | 100.00% | | Subsidiary | | Chile | | Execution, construction and operation of the El Melón tunnel |
Foreign | | Sociedad Portuaria Central Cartagena S.A. | | Colombian peso | | 0.00% | | 100.00% | | 100.00% | | 0.00% | | 100.00% | | 100.00% | | Subsidiary | | Colombia | | Investment, construction and maintenance of public or private wharves and ports |
Foreign | | Southern Cone Power Argentina S.A. | | Argentine peso | | 0.00% | | 100.00% | | 100.00% | | 0.00% | | 100.00% | | 100.00% | | Subsidiary | | Argentina | | Portfolio company |
Foreign | | Transportadora de Energía S.A. | | Argentine peso | | 0.00% | | 100.00% | | 100.00% | | 0.00% | | 100.00% | | 100.00% | | Subsidiary | | Argentina | | Electric energy production, transportation and distribution |
| | (1) | On April 22, 2014, Endesa Chile acquired the remaining 50% equity interest in Inversiones GasAtacama Holding Limitada, (See Note 6). |
| | (2) | On September 3, 2014, Enersis Américas acquired 100% ownership interest of Inkia Holdings (Acter) Limited, Southern Cone Power Ltd., Latin American Holding I Ltd., Latin American Holding II Ltd. and Southern Cone Power Peru S.A.A.. On December 31, 2014, Inkia Holdings was merged with Generandes Peru S.A., with the latter absorbing entities of Inkia Group. |
| | (3) | On September 17, 2014, Atacama Finance Co and Energex Co were dissolved. |
| | (4) | On December 31, 2014, Inmobiliaria Manso de Velasco was merged with ICT, the latter being the legal successor company under the name of Servicios Informáticos e Inmobiliarios Ltda. |
| | (5) | On 30 December 2014, the companies Aguas Santiago Poniente SA and Constructora y Proyectos los Maitenes SA were sold. |
| | (6) | On January 9, 2015, Sociedad Concesionaria Túnel el Melón S.A. was sold (See Note 2.4.1) |
| | |
| The accompanying notes are an integral part of these consolidated financial statements | | |
|
| F-181 |
APPENDIX 2 CHANGES IN THE SCOPE OF CONSOLIDATION:
This appendix is part of Note 2.4.1 “Changes in the scope of consolidation”.
Incorporation into the scope of consolidation:
| | | | | | | | | | | | | | | | | | |
| Company | | Ownership Interest | | Ownership Interest | |
| | December 31, 2015 | | December 31, 2014 | |
| | Direct | | Indirect | | Total | | Consolidation Method | | Direct | | Indirect | | Total | | Consolidation Method | |
| | | | | | | | | | | | | | | | | | |
| Inversiones GasAtacama Holding Ltda. | | - | | - | | - | | - | | - | | 100.00% | | 100.00% | | | Full integration | |
| Atacama Finance Co. (1) | | - | | - | | - | | - | | - | | - | | - | | | Full integration | |
| Energex Co. (1) | | - | | - | | - | | - | | - | | - | | - | | | Full integration | |
| GasAtacama S.A. | | - | | - | | - | | - | | - | | 100.00% | | 100.00% | | | Full integration | |
| GasAtacama Chile S.A. | | - | | - | | - | | - | | - | | 100.00% | | 100.00% | | | Full integration | |
| Gasoducto TalTal S.A. | | - | | - | | - | | - | | - | | 100.00% | | 100.00% | | | Full integration | |
| Gasoducto Atacama Argentina S.A. | | - | | - | | - | | - | | - | | 100.00% | | 100.00% | | | Full integration | |
| GNL Norte S.A. | | - | | - | | - | | - | | - | | 100.00% | | 100.00% | | | Full integration | |
| Progas S.A. | | - | | - | | - | | - | | - | | 100.00% | | 100.00% | | | Full integration | |
See Note 2.4.1.
(1) On 17 September 2014, Atacama Finance Co and Energex Co were dissolved.
Companies eliminated from the scope of consolidation:
| | | | | | | | | | | | | | | | |
| Company | | Ownership Interest | | Ownership Interest |
| | December 31, 2015 | | December 31, 2014 |
| | Direct | | Indirect | | Total | | Consolidation Method | | Direct | | Indirect | | Total | | Consolidation Method |
| | | | | | | | | | | | | | | | |
| Aguas Santiago Poniente S.A. | | - | | - | | - | | - | | - | | 78.88% | | 78.88% | | Full integration |
| Constructora y Proyectos Los Maitenes S.A. | | - | | - | | - | | - | | - | | 55.00% | | 55.00% | | Full integration |
| Sociedad Concesionaria Túnel El Melón S.A. | | - | | 100.00% | | 100.00% | | Full integration | | - | | - | | - | | - |
| | |
| The accompanying notes are an integral part of these consolidated financial statements | | |
|
| F-182 |
APPENDIX 3 ASSOCIATED COMPANIES AND JOINT VENTURES:
This appendix is part of Note 3.i, “Investments accounted for using the equity method”.
| | | | | | | | | | | | | | | | | | | | | | |
Taxpayer ID
No. (RUT) | | Company | | Currency | | Ownership Interest as of
12/31/2015 | | Ownership Interest as of
12/31/2014 | | Type of Relationship | | Country | | Activity |
| | ( in alphabetical order) | | | Direct | | Indirect | | Total | | Direct | | Indirect | | Total | | | |
| | | | | | | | | | | | | | | | | | | | | | |
96.806.130-5 | | Electrogas S.A. | | U.S. dollar | | 0.00% | | 42.50% | | 42.50% | | 0.00% | | 42.50% | | 42.50% | | Associate | | Chile | | Portfolio company |
76.418.940-K | | GNL Chile S.A. | | Chilean peso | | 0.00% | | 33.33% | | 33.33% | | 0.00% | | 33.33% | | 33.33% | | Associate | | Chile | | Promotion of liquefied natural gas supply project |
76.788.080-4 | | GNL Quintero S.A. | | U.S. dollar | | 0.00% | | 20.00% | | 20.00% | | 0.00% | | 20.00% | | 20.00% | | Associate | | Chile | | Development, design and supply of liquid natural gas regasifying terminal |
Foreign | | Sacme S.A. | | U.S. dollar | | 0.00% | | 50.00% | | 50.00% | | 0.00% | | 50.00% | | 50.00% | | Associate | | Argentina | | Monitoring and Control of an Electric System |
Foreign | | Yacylec S.A. | | Argentine peso | | 22.22% | | 0.00% | | 22.22% | | 22.22% | | 0.00% | | 22.22% | | Associate | | Argentina | | Electric energy transportation |
76.652.400-1 | | Centrales Hidroeléctricas De Aysén S.A. | | Chilean peso | | 0.00% | | 51.00% | | 51.00% | | 0.00% | | 51.00% | | 51.00% | | Joint venture | | Chile | | Development and operation of a hydroelectric plant |
76.041.891-9 | | Aysén Transmisión S.A. | | Chilean peso | | 0.00% | | 51.00% | | 51.00% | | 0.00% | | 51.00% | | 51.00% | | Joint venture | | Chile | | Development and operation of a hydroelectric plant |
76.091.595-5 | | Aysén Energía S.A. | | Chilean peso | | 0.00% | | 51.00% | | 51.00% | | 0.00% | | 51.00% | | 51.00% | | Joint venture | | Chile | | Development and operation of a hydroelectric plant |
Foreign | | Distribuidora Eléctrica de Cundinamarca S.A. | | Colombian peso | | 0.00% | | 49.00% | | 49.00% | | 0.00% | | 49.00% | | 49.00% | | Joint venture | | Colombia | | Electric energy distribution and sales |
Foreign | | Empresa de Energía de Cundinamarca S.A. | | Colombian peso | | 0.00% | | 49.00% | | 49.00% | | 0.00% | | 49.00% | | 49.00% | | Joint venture | | Colombia | | Electric energy distribution and sales |
77.017.930-0 | | Transmisora Eléctrica de Quillota Ltda. | | Chilean peso | | 0.00% | | 50.00% | | 50.00% | | 0.00% | | 50.00% | | 50.00% | | Joint venture | | Chile | | Electric energy transportation and distribution |
Foreign | | Central Termica Manuel Belgrano | | Argentine peso | | 0.00% | | 25.60% | | 25.60% | | 0.00% | | 25.60% | | 25.60% | | Associate | | Argentina | | Electric energy generation and sales |
Foreign | | Central Térmica San Martin | | Argentine peso | | 0.00% | | 25.60% | | 25.60% | | 0.00% | | 25.60% | | 25.60% | | Associate | | Argentina | | Electric energy generation and sales |
Foreign | | Central Vuelta Obligada S.A. | | Argentine peso | | 0.00% | | 40.90% | | 40.90% | | 0.00% | | 40.90% | | 40.90% | | Associate | | Argentina | | Electric energy generation and sales |
| | |
| The accompanying notes are an integral part of these consolidated financial statements | | |
|
| F-183 |
APPENDIX 4 SUPPLEMENTARY INFORMATION RELATED TO ASSETS AND LIABILITIES HELD FOR DISTRIBUTION TO OWNERS AND RESULTS FROM DISCONTINUED OPERATIONS:
Consolidated Statement of Financial Position
as of December 31, 2015
(In thousands of Chilean pesos)
| | | | | | | | | | | | | | | | | | | | | | | | | | |
| ASSETS | | | | Enersis Historical | | | Discontinued Operations (IFRS 5) | | | Intercompany
eliminations and
other adjustments | | | Enersis Historical (Combined) | | | Enersis América | | | Enersis Chile | |
| | | | | | ThCh$ | | | | ThCh$ | | | | ThCh$ | | | | ThCh$ | | | | ThCh$ | | | | ThCh$ | |
| | | | | | | | | | | | | | | | | | | | | | | | | | |
| | | | | | | |
| CURRENT ASSETS | | | | | | | | | | | | | | | | | | | | | | | | | | |
| | | | | | | | | | | | | | | | | | | | | | | | | | |
Cash and cash equivalents | | | | | 1,329,425,189 | | | | (144,261,845) | | | | - | | | | 1,329,425,189 | | | | 1,185,163,344 | | | | 144,261,845 | |
Other current financial assets | | | | | 84,575,640 | | | | (16,313,194) | | | | - | | | | 84,575,640 | | | | 68,262,446 | | | | 16,313,194 | |
Other current non-financial assets | | | | | 105,974,000 | | | | (3,984,943) | | | | - | | | | 105,974,000 | | | | 101,989,057 | | | | 3,984,943 | |
Trade and other current receivables | | | | | 1,684,496,034 | | | | (596,364,467) | | | | - | | | | 1,684,496,034 | | | | 1,088,131,567 | | | | 596,364,467 | |
Current accounts receivable from related companies | | | | | 27,178,499 | | | | (25,144,559) | | | | 179,448,975 | | | | 206,627,474 | | | | 181,482,915 | | | | 25,144,559 | |
Inventories | | | | | 137,674,512 | | | | (42,616,615) | | | | - | | | | 137,674,512 | | | | 95,057,897 | | | | 42,616,615 | |
Current tax assets | | | | | 67,760,800 | | | | (20,306,212) | | | | - | | | | 67,760,800 | | | | 47,454,588 | | | | 20,306,212 | |
| Total current assets other than assets or groups of assets for disposal classified as held for sale or as held for distribution to owners | | | | | 3,437,084,674 | | | | (848,991,835) | | | | 179,448,975 | | | | 3,616,533,649 | | | | 2,767,541,814 | | | | 848,991,835 | |
| | | | | | | | | | | | | | | | | | | | | | | | | | |
TOTAL CURRENT ASSETS | | | | | 3,437,084,674 | | | | (848,991,835) | | | | 179,448,975 | | | | 3,616,533,649 | | | | 2,767,541,814 | | | | 848,991,835 | |
| | | | | | | | | | | | | | | | | | | | | | | | | | |
NON-CURRENT ASSETS | | | | | | | | | | | | | | | | | | | | | | | | | | |
| | | | | | | | | | | | | | | | | | | | | | | | | | |
Other non-current financial assets | | | | | 511,278,656 | | | | (21,750,452) | | | | - | | | | 511,278,656 | | | | 489,528,204 | | | | 21,750,452 | |
Other non-current non-financial assets | | | | | 82,332,593 | | | | (4,769,885) | | | | - | | | | 82,332,593 | | | | 77,562,708 | | | | 4,769,885 | |
Trade and other non-current receivables | | | | | 413,088,087 | | | | (14,392,223) | | | | - | | | | 413,088,087 | | | | 398,695,864 | | | | 14,392,223 | |
Non-current accounts receivable from related companies | | | | | 355,485 | | | | - | | | | - | | | | 355,485 | | | | 355,485 | | | | - | |
Investments accounted for using the equity method | | | | | 76,676,816 | | | | (45,716,371) | | | | - | | | | 76,676,816 | | | | 30,960,445 | | | | 45,716,371 | |
Intangible assets other than goodwill | | | | | 1,024,278,598 | | | | (42,879,326) | | | | - | | | | 1,024,278,598 | | | | 981,399,272 | | | | 42,879,326 | |
Goodwill | | | | | 1,331,456,702 | | | | (887,257,655) | | | | - | | | | 1,331,456,702 | | | | 444,199,047 | | | | 887,257,655 | |
Property, plant and equipment | | | | | 8,432,734,430 | | | | (3,429,167,797) | | | | - | | | | 8,432,734,430 | | | | 5,003,566,633 | | | | 3,429,167,797 | |
Investment property | | | | | 8,150,987 | | | | (8,150,987) | | | | - | | | | 8,150,987 | | | | - | | | | 8,150,987 | |
Deferred tax assets | | | | | 131,642,331 | | | | (22,392,339) | | | | 75,031 | | | | 131,717,362 | | | | 109,325,023 | | | | 22,392,339 | |
| | | | | | | | | | | | | | | | | | | | | | | | | | |
TOTAL NON-CURRENT ASSETS | | | | | 12,011,994,685 | | | | (4,476,477,035) | | | | 75,031 | | | | 12,012,069,716 | | | | 7,535,592,681 | | | | 4,476,477,035 | |
| | | | | | | | | | | | | | | | | | | | | | | | | | |
TOTAL ASSETS | | | | | 15,449,079,359 | | | | (5,325,468,870) | | | | 179,524,006 | | | | 15,628,603,365 | | | | 10,303,134,495 | | | | 5,325,468,870 | |
| | |
| The accompanying notes are an integral part of these consolidated financial statements | | |
|
| F-184 |
Consolidated Statement of Financial Position
as of December 31, 2015
(In thousands of Chilean pesos)
| | | | | | | | | | | | | | | | | | | | | | | | | | |
| LIABILITIES AND EQUITY | | | | Enersis Historical ThCh$ | | | Discontinued Operations
(IFRS 5) ThCh$ | | | Intercompany
eliminations and
other adjustments
ThCh$ | | | Enersis Historical
(Combined)
ThCh$ | | | Enersis América ThCh$ | | | Enersis Chile ThCh$ | |
| | | | | | | |
CURRENT LIABILITIES | | | | | | | | | | | | | | | | | | | | | | | | | | |
| | | | | | | | | | | | | | | | | | | | | | | | | | |
Other current financial liabilities | | | | | 715,795,233 | | | | (27,921,725) | | | | - | | | | 715,795,233 | | | | 687,873,508 | | | | 27,921,725 | |
Trade and other current payables | | | | | 2,007,740,178 | | | | (554,915,971) | | | | - | | | | 2,007,740,178 | | | | 1,452,824,207 | | | | 554,915,971 | |
Current accounts payable to related companies | | | | | 165,136,438 | | | | (233,154,916) | | | | 179,448,975 | | | | 344,585,413 | | | | 111,430,497 | | | | 233,154,916 | |
Other current provisions | | | | | 143,628,371 | | | | (16,329,195) | | | | - | | | | 143,628,371 | | | | 127,299,176 | | | | 16,329,195 | |
Current tax liabilities | | | | | 157,727,749 | | | | (15,119,789) | | | | - | | | | 157,727,749 | | | | 142,607,960 | | | | 15,119,789 | |
Other current non-financial liabilities | | | | | 45,346,997 | | | | (6,120,658) | | | | - | | | | 45,346,997 | | | | 39,226,339 | | | | 6,120,658 | |
Liabilities associated with groups of assets for disposal classified as held for sale | | | | | 3,235,374,966 | | | | (853,562,254) | | | | 179,448,975 | | | | 3,414,823,941 | | | | 2,561,261,687 | | | | 853,562,254 | |
| | | | | | | | | | | | | | | | | | | | | | | | | | |
TOTAL CURRENT LIABILITIES | | | | | 3,235,374,966 | | | | (853,562,254) | | | | 179,448,975 | | | | 3,414,823,941 | | | | 2,561,261,687 | | | | 853,562,254 | |
| | | | | | | | | | | | | | | | | | | | | | | | | | |
NON-CURRENT LIABILITIES | | | | | | | | | | | | | | | | | | | | | | | | | | |
| | | | | | | | | | | | | | | | | | | | | | | | | | |
Other non-current financial liabilities | | | | | 2,764,494,382 | | | | (917,197,790) | | | | - | | | | 2,764,494,382 | | | | 1,847,296,592 | | | | 917,197,790 | |
Trade and other non-current payables | | | | | 289,578,470 | | | | (6,034,216) | | | | - | | | | 289,578,470 | | | | 283,544,254 | | | | 6,034,216 | |
Non-current accounts payable to related companies | | | | | 97,186 | | | | (97,186) | | | | - | | | | 97,186 | | | | - | | | | 97,186 | |
Other long-term provisions | | | | | 239,964,424 | | | | (56,116,140) | | | | - | | | | 239,964,424 | | | | 183,848,284 | | | | 56,116,140 | |
Deferred tax liabilities | | | | | 466,930,940 | | | | (235,101,356) | | | | 75,031 | | | | 467,005,971 | | | | 231,904,615 | | | | 235,101,356 | |
Non-current provisions for employee benefits | | | | | 242,293,930 | | | | (55,023,456) | | | | - | | | | 242,293,930 | | | | 187,270,474 | | | | 55,023,456 | |
Other non-current non-financial liabilities | | | | | 20,536,681 | | | | (435,689) | | | | - | | | | 20,536,681 | | | | 20,100,992 | | | | 435,689 | |
| | | | | | | | | | | | | | | | | | | | | | | | | | |
TOTAL NON-CURRENT LIABILITIES | | | | | 4,023,896,013 | | | | (1,270,005,833) | | | | 75,031 | | | | 4,023,971,044 | | | | 2,753,965,211 | | | | 1,270,005,833 | |
| | | | | | | | | | | | | | | | | | | | | | | | | | |
TOTAL LIABILITIES | | | | | 7,259,270,979 | | | | (2,123,568,087) | | | | 179,524,006 | | | | 7,438,794,985 | | | | 5,315,226,898 | | | | 2,123,568,087 | |
| | | | | | | |
EQUITY | | | | | | | | | | | | | | | | | | | | | | | | | | |
Issued capital | | | | | 5,804,447,986 | | | | (2,229,108,975) | | | | - | | | | 5,804,447,986 | | | | 3,575,339,011 | | | | 2,229,108,975 | |
Retained earnings | | | | | 3,380,661,523 | | | | (1,322,162,479) | | | | - | | | | 3,380,661,523 | | | | 2,058,499,044 | | | | 1,322,162,479 | |
Other reserves | | | | | (3,158,960,224) | | | | 958,589,952 | | | | - | | | | (3,158,960,224) | | | | (2,200,370,272) | | | | (958,589,952) | |
| Equity attributable to owners of parent | | | | | 6,026,149,285 | | | | (2,592,681,502) | | | | - | | | | 6,026,149,285 | | | | 3,433,467,783 | | | | 2,592,681,502 | |
| | | | | | | | | | | | | | | | | | | | | | | | | | |
Non-controlling interests | | | | | 2,163,659,095 | | | | (609,219,281) | | | | - | | | | 2,163,659,095 | | | | 1,554,439,814 | | | | 609,219,281 | |
| | | | | | | | | | | | | | | | | | | | | | | | | | |
TOTAL EQUITY | | | | | 8,189,808,380 | | | | (3,201,900,783) | | | | - | | | | 8,189,808,380 | | | | 4,987,907,597 | | | | 3,201,900,783 | |
| | | | | | | | | | | | | | | | | | | | | | | | | | |
TOTAL LIABILITIES AND EQUITY | | | | | 15,449,079,359 | | | | (5,325,468,870) | | | | 179,524,006 | | | | 15,628,603,365 | | | | 10,303,134,495 | | | | 5,325,468,870 | |
| | |
| The accompanying notes are an integral part of these consolidated financial statements | | |
|
| F-185 |
Consolidated Statement of Income, by Nature
For the year ended December 31, 2015
(In thousands of Chilean pesos)
| | | | | | | | | | | | | | | | | | | | | | | | |
| | | January - December | |
CONSOLIDATED STATEMENT OF INCOME
Profit (loss) | | Enersis
Historical | | | Discontinued
Operations
(IFRS 5) | | | Intercompany
eliminations and
other adjustments | | | Enersis
Historical
(Combined) | | | Enersis América | | | Enersis Chile | |
| | ThCh$ | | | ThCh$ | | | ThCh$ | | | ThCh$ | | | ThCh$ | | | ThCh$ | |
Revenues | | | 7,050,316,326 | | | | (2,382,671,016) | | | | 1,622,173 | | | | 7,051,938,499 | | | | 4,667,645,310 | | | | 2,384,293,189 | |
Other income | | | 648,530,219 | | | | (14,735,951) | | | | 7,616 | | | | 648,537,835 | | | | 633,801,884 | | | | 14,735,951 | |
Revenues and other operating income | | | 7,698,846,545 | | | | (2,397,406,967) | | | | 1,629,789 | | | | 7,700,476,334 | | | | 5,301,447,194 | | | | 2,399,029,140 | |
| | | | | | | | | | | | | | | | | | | | | | | | |
Raw materials and consumables used | | | (4,259,187,071) | | | | 1,481,985,559 | | | | - | | | | (4,259,187,071) | | | | (2,777,201,512) | | | | (1,481,985,559) | |
Contribution Margin | | | 3,439,659,474 | | | | (915,421,408) | | | | 1,629,789 | | | | 3,441,289,263 | | | | 2,524,245,682 | | | | 917,043,581 | |
| | | | | | | | | | | | | | | | | | | | | | | | |
Other work performed by the entity and capitalized | | | 88,105,322 | | | | (21,004,053) | | | | - | | | | 88,105,322 | | | | 67,101,269 | | | | 21,004,053 | |
Employee benefits expense | | | (624,252,868) | | | | 136,554,721 | | | | - | | | | (624,252,868) | | | | (487,698,147) | | | | (136,554,721) | |
Depreciation and amortization expense | | | (473,743,859) | | | | 153,201,662 | | | | - | | | | (473,743,859) | | | | (320,542,197) | | | | (153,201,662) | |
Impairment loss recognized in the period’s profit or loss | | | (36,756,853) | | | | (3,054,903) | | | | - | | | | (36,756,853) | | | | (39,811,756) | | | | 3,054,903 | |
Other expenses | | | (614,378,530) | | | | 125,849,781 | | | | (1,629,789) | | | | (616,008,319) | | | | (490,150,922) | | | | (125,857,397) | |
Operating income | | | 1,778,632,686 | | | | (523,874,200) | | | | - | | | | 1,778,632,686 | | | | 1,253,143,929 | | | | 525,488,757 | |
| | | | | | | | | | | | | | | | | | | | | | | | |
Other gains (losses) | | | 13,489,520 | | | | (20,055,745) | | | | - | | | | 13,489,520 | | | | (6,566,225) | | | | 20,055,745 | |
Financial income | | | 310,040,441 | | | | (15,270,169) | | | | 5,084,349 | | | | 315,124,790 | | | | 299,854,621 | | | | 15,270,169 | |
Financial costs | | | (447,071,689) | | | | 61,616,349 | | | | (5,084,349) | | | | (452,156,038) | | | | (385,455,340) | | | | (66,700,698) | |
Share of profit (loss) of associates and joint ventures accounted for using the equity method | | | 12,238,016 | | | | (8,905,045) | | | | - | | | | 12,238,016 | | | | 3,332,971 | | | | 8,905,045 | |
Foreign currency exchange differences | | | 114,843,285 | | | | 13,394,762 | | | | - | | | | 114,843,285 | | | | 166,120,617 | | | | (51,277,332) | |
Profit (loss) from indexed assets and liabilities | | | (4,426,963) | | | | (4,839,077) | | | | - | | | | (4,426,963) | | | | (9,266,040) | | | | 4,839,077 | |
| | | | | | | | | | | | | | | | | | | | | | | | |
Income before taxes | | | 1,777,745,296 | | | | (497,933,125) | | | | - | | | | 1,777,745,296 | | | | 1,321,164,533 | | | | 456,580,763 | |
Income tax expense | | | (633,275,811) | | | | 109,612,599 | | | | - | | | | (633,275,811) | | | | (523,663,212) | | | | (109,612,599) | |
Net income from continuing operations | | | 1,144,469,485 | | | | (388,320,526) | | | | - | | | | 1,144,469,485 | | | | 797,501,321 | | | | 346,968,164 | |
Profit (loss) from discontinued operations | | | - | | | | - | | | | - | | | | - | | | | - | | | | - | |
NET INCOME | | | 1,144,469,485 | | | | (388,320,526) | | | | - | | | | 1,144,469,485 | | | | 797,501,321 | | | | 346,968,164 | |
Net income attributable to: | | | | | | | | | | | | | | | | | | | | | | | | |
Equity owners of parent | | | 661,586,917 | | | | (293,190,772) | | | | - | | | | 661,586,917 | | | | 409,748,507 | | | | 251,838,410 | |
Non-controlling interests | | | 482,882,568 | | | | (95,129,754) | | | | - | | | | 482,882,568 | | | | 387,752,814 | | | | 95,129,754 | |
NET INCOME | | | 1,144,469,485 | | | | (388,320,526) | | | | - | | | | 1,144,469,485 | | | | 797,501,321 | | | | 346,968,164 | |
| | | | | | |
Basic earnings per share | | | | | | | | | | | | | | | | | | | | | | | | |
Basic earnings per share from continuing operations | | | 13.48 | | | | (5.97) | | | | - | | | | 13.48 | | | | 8.35 | | | | 5.13 | |
Basic earnings per share | | | 13.48 | | | | (5.97) | | | | - | | | | 13.48 | | | | 8.35 | | | | 5.13 | |
Weighted average number of shares of common stock | | | 49,092,772.76 | | | | 49,092,772.76 | | | | - | | | | - | | | | 49,092,772.76 | | | | 49,092,772.76 | |
| | | | | | |
Diluted earnings per share | | | | | | | | | | | | | | | | | | | | | | | | |
Diluted earnings per share from continuing operations | | | 13.48 | | | | (5.97) | | | | - | | | | 13.48 | | | | 8.35 | | | | 5.13 | |
Diluted earnings per share | | | 13.48 | | | | (5.97) | | | | - | | | | 13.48 | | | | 8.35 | | | | 5.13 | |
Weighted average number of shares of common stock | | | 49,092,772.76 | | | | 49,092,772.76 | | | | - | | | | - | | | | 49,092,772.76 | | | | 49,092,772.76 | |
| | |
| The accompanying notes are an integral part of these consolidated financial statements | | |
|
| F-186 |
Consolidated Statement of Financial Position
as of December 31, 2014
(In thousands of Chilean pesos)
| | | | | | | | | | | | | | | | | | | | | | | | |
| ASSETS | | | | Enersis
Historical | | | Discontinued
Operations
(IFRS 5) | | Intercompany
eliminations and
other adjustments | | | Enersis
Historical
(Combined) | | | Enersis Américas | | | Enersis Chile | |
| | | | ThCh$ | | | ThCh$ | | ThCh$ | | | ThCh$ | | | ThCh$ | | | ThCh$ | |
| | | | | | | |
CURRENT ASSETS | | | | | | | | | | | | | | | | | | | | | | | | |
| | | | | | | | | | | | | | | | | | | | | | | | |
Cash and cash equivalents | | | | | 1,704,745,491 | | | | | | - | | | | 1,704,745,491 | | | | 1,571,759,564 | | | | 132,985,927 | |
Other current financial assets | | | | | 99,455,403 | | | | | | - | | | | 99,455,403 | | | | 97,964,274 | | | | 1,491,129 | |
Other current non-financial assets | | | | | 175,098,112 | | | | | | - | | | | 175,098,112 | | | | 159,050,505 | | | | 16,047,607 | |
Trade and other current receivables | | | | | 1,681,686,903 | | | | | | - | | | | 1,681,686,903 | | | | 1,103,605,698 | | | | 578,081,205 | |
Current accounts receivable from related companies | | | | | 18,441,340 | | | | | | 121,396,548 | | | | 139,837,888 | | | | 122,885,238 | | | | 16,952,650 | |
Inventories | | | | | 133,520,154 | | | | | | - | | | | 133,520,154 | | | | 89,842,276 | | | | 43,677,878 | |
Current tax assets | | | | | 110,572,522 | | | | | | - | | | | 110,572,522 | | | | 64,924,383 | | | | 45,648,139 | |
| Total current assets other than assets or groups of assets for disposal classified as held for sale or as held for distribution to owners | | | | | 3,923,519,925 | | | | | | 121,396,548 | | | | 4,044,916,473 | | | | 3,210,031,938 | | | | 834,884,535 | |
| | | | | | | | | | | | | | | | | | | | | | | | |
Non-current current assets or groups of assets for disposal classified as held for sale or as held for distribution to owners | | | | | 7,978,963 | | | | | | - | | | | 7,978,963 | | | | - | | | | 7,978,963 | |
| Non-current current assets or groups of assets for disposal classified as held for sale or as held for distribution to owners | | | | | 7,978,963 | | | | | | - | | | | 7,978,963 | | | | - | | | | 7,978,963 | |
| | | | | | | | | | | | | | | | | | | | | | | | |
TOTAL CURRENT ASSETS | | | | | 3,931,498,888 | | | | | | 121,396,548 | | | | 4,052,895,436 | | | | 3,210,031,938 | | | | 842,863,498 | |
| | | | | | | |
NON-CURRENT ASSETS | | | | | | | | | | | | | | | | | | | | | | | | |
| | | | | | | | | | | | | | | | | | | | | | | | |
Other non-current financial assets | | | | | 530,821,520 | | | | | | - | | | | 530,821,520 | | | | 524,071,048 | | | | 6,750,472 | |
Other non-current non-financial assets | | | | | 77,806,180 | | | | | | - | | | | 77,806,180 | | | | 77,570,750 | | | | 235,430 | |
Trade and other non-current receivables | | | | | 291,641,675 | | | | | | - | | | | 291,641,675 | | | | 284,145,263 | | | | 7,496,412 | |
Non-current accounts receivable from related companies | | | | | 486,605 | | | | | | - | | | | 486,605 | | | | 486,605 | | | | - | |
Investments accounted for using the equity method | | | | | 73,633,610 | | | | | | - | | | | 73,633,610 | | | | 33,268,287 | | | | 40,365,323 | |
Intangible assets other than goodwill | | | | | 1,168,212,056 | | | | | | - | | | | 1,168,212,056 | | | | 1,131,686,534 | | | | 36,525,522 | |
Goodwill | | | | | 1,410,853,627 | | | | | | - | | | | 1,410,853,627 | | | | 523,595,972 | | | | 887,257,655 | |
Property, plant and equipment | | | | | 8,234,215,719 | | | | | | - | | | | 8,234,215,719 | | | | 4,950,454,943 | | | | 3,283,760,776 | |
Investment property | | | | | 8,514,562 | | | | | | - | | | | 8,514,562 | | | | - | | | | 8,514,562 | |
Deferred tax assets | | | | | 193,637,874 | | | | | | 66,618 | | | | 193,704,492 | | | | 180,739,397 | | | | 12,965,095 | |
| | | | | | | | | | | | | | | | | | | | | | | | |
TOTAL NON-CURRENT ASSETS | | | | | 11,989,823,428 | | | | | | 66,618 | | | | 11,989,890,046 | | | | 7,706,018,799 | | | | 4,283,871,247 | |
| | | | | | | | | | | | | | | | | | | | | | | | |
TOTAL ASSETS | | | | | 15,921,322,316 | | | | | | 121,463,166 | | | | 16,042,785,482 | | | | 10,916,050,737 | | | | 5,126,734,745 | |
| | |
| The accompanying notes are an integral part of these consolidated financial statements | | |
|
| F-187 |
Consolidated Statement of Financial Position
as of December 31, 2014
(In thousands of Chilean pesos)
| | | | | | | | | | | | | | | | | | | | | | | | |
| LIABILITIES AND EQUITY | | | | Enersis
Historical | | | Discontinued
Operations (IFRS 5) | | Intercompany
eliminations and other
adjustments | | | Enersis Historical
(Combined) | | | Enersis Américas | | | Enersis Chile | |
| | | | | ThCh$ | | | ThCh$ | | ThCh$ | | | ThCh$ | | | ThCh$ | | | ThCh$ | |
| | | | | | | |
CURRENT LIABILITIES | | | | | | | | | | | | | | | | | | | | | | | | |
| | | | | | | | | | | | | | | | | | | | | | | | |
Other current financial liabilities | | | | | 421,805,679 | | | | | | - | | | | 421,805,679 | | | | 275,441,320 | | | | 146,364,359 | |
Trade and other current payables | | | | | 2,288,876,950 | | | | | | - | | | | 2,288,876,950 | | | | 1,793,515,595 | | | | 495,361,355 | |
Current accounts payable to related companies | | | | | 143,680,622 | | | | | | 121,396,548 | | | | 265,077,170 | | | | 77,891,977 | | | | 187,185,193 | |
Other current provisions | | | | | 90,222,684 | | | | | | - | | | | 90,222,684 | | | | 78,599,170 | | | | 11,623,514 | |
Current tax liabilities | | | | | 115,472,313 | | | | | | - | | | | 115,472,313 | | | | 77,114,447 | | | | 38,357,866 | |
Other current non-financial liabilities | | | | | 129,275,589 | | | | | | - | | | | 129,275,589 | | | | 93,572,328 | | | | 35,703,261 | |
| Total current liabilities other than those associated with groups of assets for disposal classified as held for sale | | | | | 3,189,333,837 | | | | | | 121,396,548 | | | | 3,310,730,385 | | | | 2,396,134,837 | | | | 914,595,548 | |
| | | | | | | | | | | | | | | | | | | | | | | | |
Liabilities associated with groups of assets for disposal classified as held for sale | | | | | 5,488,147 | | | | | | - | | | | 5,488,147 | | | | - | | | | 5,488,147 | |
| | | | | | | | | | | | | | | | | | | | | | | | |
TOTAL CURRENT LIABILITIES | | | | | 3,194,821,984 | | | | | | 121,396,548 | | | | 3,316,218,532 | | | | 2,396,134,837 | | | | 920,083,695 | |
| | | | | | | | | | | | | | | | | | | | | | | | |
NON-CURRENT LIABILITIES | | | | | | | | | | | | | | | | | | | | | | | | |
| | | | | | | | | | | | | | | | | | | | | | | | |
Other non-current financial liabilities | | | | | 3,289,097,528 | | | | | | - | | | | 3,289,097,528 | | | | 2,510,962,361 | | | | 778,135,167 | |
Trade and other non-current payables | | | | | 159,385,521 | | | | | | - | | | | 159,385,521 | | | | 155,674,443 | | | | 3,711,078 | |
Non-current accounts payable to related companies | | | | | - | | | | | | - | | | | - | | | | - | | | | - | |
Other long-term provisions | | | | | 197,243,841 | | | | | | - | | | | 197,243,841 | | | | 169,273,906 | | | | 27,969,935 | |
Deferred tax liabilities | | | | | 478,361,484 | | | | | | 66,618 | | | | 478,428,102 | | | | 223,205,436 | | | | 255,222,666 | |
Non-current provisions for employee benefits | | | | | 269,930,412 | | | | | | - | | | | 269,930,412 | | | | 215,992,570 | | | | 53,937,842 | |
Other non-current non-financial liabilities | | | | | 53,262,800 | | | | | | - | | | | 53,262,800 | | | | 49,654,229 | | | | 3,608,571 | |
| | | | | | | | | | | | | | | | | | | | | | | | |
TOTAL NON-CURRENT LIABILITIES | | | | | 4,447,281,586 | | | | | | 66,618 | | | | 4,447,348,204 | | | | 3,324,762,945 | | | | 1,122,585,259 | |
| | | | | | | | | | | | | | | | | | | | | | | | |
TOTAL LIABILITIES | | | | | 7,642,103,570 | | | | | | 121,463,166 | | | | 7,763,566,736 | | | | 5,720,897,782 | | | | 2,042,668,954 | |
| | | | | | | |
EQUITY | | | | | | | | | | | | | | | | | | | | | | | | |
Issued capital | | | | | 5,804,447,986 | | | | | | - | | | | 5,804,447,986 | | | | 3,575,339,011 | | | | 2,229,108,975 | |
Retained earnings | | | | | 3,051,734,445 | | | | | | - | | | | 3,051,734,445 | | | | 1,879,762,768 | | | | 1,171,971,677 | |
Other reserves | | | | | (2,654,206,384) | | | | | | - | | | | (2,654,206,384) | | | | (1,725,327,166) | | | | (928,879,218) | |
| Equity attributable to owners of parent | | | | | 6,201,976,047 | | | | | | - | | | | 6,201,976,047 | | | | 3,729,774,613 | | | | 2,472,201,434 | |
| | | | | | | | | | | | | | | | | | | | | | | | |
| Non-controlling interests | | | | | 2,077,242,699 | | | | | | - | | | | 2,077,242,699 | | | | 1,465,378,342 | | | | 611,864,357 | |
| | | | | | | | | | | | | | | | | | | | | | | | |
TOTAL EQUITY | | | | | 8,279,218,746 | | | | | | - | | | | 8,279,218,746 | | | | 5,195,152,955 | | | | 3,084,065,791 | |
| | | | | | | | | | | | | | | | | | | | | | | | |
TOTAL LIABILITIES AND EQUITY | | | | | 15,921,322,316 | | | | | | 121,463,166 | | | | 16,042,785,482 | | | | 10,916,050,737 | | | | 5,126,734,745 | |
| | |
| The accompanying notes are an integral part of these consolidated financial statements | | |
|
| F-188 |
Consolidated Statement of Income, by Nature
For the year ended December 31, 2014
(In thousands of Chilean pesos)
| | | | | | | | | | | | | | | | | | | | | | | | |
| | | January - December | |
CONSOLIDATED STATEMENT OF INCOME
Profit (loss) | | Enersis
Historical | | | Discontinued
Operations
(IFRS 5) | | | Intercompany
eliminations
and other
adjustments | | | Enersis
Historical
(Combined) | | | Enersis
Américas | | | Enersis Chile | |
| | | ThCh$ | | | ThCh$ | | | ThCh$ | | | ThCh$ | | | ThCh$ | | | ThCh$ | |
Revenues | | | 6,819,760,882 | | | | (2,013,305,145) | | | | 1,681,200 | | | | 6,821,442,082 | | | | 4,806,578,184 | | | | 2,014,863,898 | |
Other income | | | 434,115,438 | | | | (34,201,387) | | | | 10,419 | | | | 434,125,857 | | | | 399,924,470 | | | | 34,201,387 | |
Revenues and other operating income | | | 7,253,876,320 | | | | (2,047,506,532) | | | | 1,691,619 | | | | 7,255,567,939 | | | | 5,206,502,654 | | | | 2,049,065,285 | |
| | | | | | | | | | | | | | | | | | | | | | | | |
Raw materials and consumables used | | | (3,941,071,719) | | | | 1,309,402,283 | | | | - | | | | (3,941,071,719) | | | | (2,631,669,436) | | | | (1,309,402,283) | |
Contribution Margin | | | 3,312,804,601 | | | | (738,104,249) | | | | 1,691,619 | | | | 3,314,496,220 | | | | 2,574,833,218 | | | | 739,663,002 | |
| | | | | | | | | | | | | | | | | | | | | | | | |
Other work performed by the entity and capitalized | | | 77,275,986 | | | | (21,505,568) | | | | - | | | | 77,275,986 | | | | 55,770,418 | | | | 21,505,568 | |
Employee benefits expense | | | (516,009,836) | | | | 126,341,363 | | | | - | | | | (516,009,836) | | | | (389,668,473) | | | | (126,341,363) | |
Depreciation and amortization expense | | | (479,179,904) | | | | 128,437,154 | | | | - | | | | (479,179,904) | | | | (350,742,750) | | | | (128,437,154) | |
Impairment loss recognized in the period’s profit or loss | | | (51,515,362) | | | | 13,185,420 | | | | - | | | | (51,515,362) | | | | (38,329,942) | | | | (13,185,420) | |
Other expenses | | | (574,050,613) | | | | 110,321,349 | | | | (1,691,619) | | | | (575,742,232) | | | | (465,288,017) | | | | (110,454,215) | |
Operating income | | | 1,769,324,872 | | | | (381,324,531) | | | | - | | | | 1,769,324,872 | | | | 1,386,574,454 | | | | 382,750,418 | |
| | | | | | | | | | | | | | | | | | | | | | | | |
Other gains (losses) | | | 71,769,817 | | | | (70,893,263) | | | | - | | | | 71,769,817 | | | | 876,554 | | | | 70,893,263 | |
Financial income | | | 265,884,277 | | | | (14,762,515) | | | | 16,082,533 | | | | 281,966,810 | | | | 267,204,295 | | | | 14,762,515 | |
Financial costs | | | (491,858,285) | | | | 59,543,956 | | | | (16,082,533) | | | | (507,940,818) | | | | (432,314,329) | | | | (75,626,489) | |
Share of profit (loss) of associates and joint ventures accounted for using the equity method | | | (51.792.559) | | | | 54,352,582 | | | | - | | | | (51,792,559) | | | | 2,560,023 | | | | (54,352,582) | |
Foreign currency exchange differences | | | (38,821,872) | | | | 20,328,278 | | | | - | | | | (38,821,872) | | | | (17,377,674) | | | | (21,444,198) | |
Profit (loss) from indexed assets and liabilities | | | 1,633,555 | | | | (15,263,623) | | | | - | | | | 1,633,555 | | | | (13,630,068) | | | | 15,263,623 | |
| | | | | | | | | | | | | | | | | | | | | | | | |
Income before taxes | | | 1.526.139.805 | | | | (348,019,116) | | | | - | | | | 1,526,139,805 | | | | 1,193,893,255 | | | | 332,246,550 | |
Income tax expense | | | (558.644.595) | | | | 132,687,135 | | | | - | | | | (558,644,595) | | | | (425,957,462) | | | | (132,687,133) | |
Net income from continuing operations | | | 967.495.210 | | | | (215,331,981) | | | | - | | | | 967.495.210 | | | | 767,935,793 | | | | 199,559,417 | |
Profit (loss) from discontinued operations | | | - | | | | - | | | | - | | | | - | | | | - | | | | - | |
NET INCOME | | | 967.495.210 | | | | (215,331,981) | | | | - | | | | 967.495.210 | | | | 767,935,793 | | | | 199,559,417 | |
Net income attributable to: | | | | | | | | | | | | | | | | | | | | | | | | |
Equity owners of parent | | | 571.873.345 | | | | (221,149,361) | | | | - | | | | 571.873.345 | | | | 409,414,306 | | | | 162,459,039 | |
Non-controlling interests | | | 395.621.865 | | | | (37,100,378) | | | | - | | | | 395.621.865 | | | | 358,521,487 | | | | 37,100,378 | |
NET INCOME | | | 967.495.210 | | | | (215,331,981) | | | | - | | | | 967.495.210 | | | | 767,935,793 | | | | 199,559,417 | |
| | | | | | | | | | | | | | | | | | | | | | | | |
Basic earnings per share | | | | | | | | | | | | | | | | | | | | | | | | |
Basic earnings per share from continuing operations | | | 11.65 | | | | (4.50) | | | | - | | | | 11.65 | | | | 8.34 | | | | 3.31 | |
Basic earnings per share | | | 11.65 | | | | (4.50) | | | | - | | | | 11.65 | | | | 8.34 | | | | 3.31 | |
Weighted average number of shares of common stock | | | 49,092,772.76 | | | | 49,092,772.76 | | | | - | | | | - | | | | 49,092,772.76 | | | | 49,092,772.76 | |
| | | | | | | | | | | | | | | | | | | | | | | | |
Diluted earnings per share | | | | | | | | | | | | | | | | | | | | | | | | |
Diluted earnings per share from continuing operations | | | 11.65 | | | | (4.50) | | | | - | | | | 11.65 | | | | 8.34 | | | | 3.31 | |
Diluted earnings per share | | | 11.65 | | | | (4.50) | | | | - | | | | 11.65 | | | | 8.34 | | | | 3.31 | |
Weighted average number of shares of common stock | | | 49,092,772.76 | | | | 49,092,772.76 | | | | - | | | | - | | | | 49,092,772.76 | | | | 49,092,772.76 | |
| | |
| The accompanying notes are an integral part of these consolidated financial statements | | |
|
| F-189 |
APPENDIX 5 ADDITIONAL INFORMATION ON FINANCIAL DEBT:
This appendix is part of Note 20, “Other financial liabilities.” The following tables present the contractual undiscounted cash flows by type of financial debt:
a) Bank borrowings
Summary of bank borrowings by currency and maturity
| | | | | | | | | | | | | | | | | | | | | | | | | | | | | | | | | | | | | | | | | | | | | | | | | | | | | | | | | | | | | | | | | | | | | | | | | | | | |
| Country | | Currency | | Nominal
Interest Rate | | Current | | | Non-current | | | Current | | | Non-current | |
| | | | Maturity | | | Total Current as of 12/31/2015 | | | Maturity | | | Total Non- current as of 12/31/2015 | | | Maturity | | | Total Current as of 12/31/2014 | | | | | | | | | Maturity | | | | | | Total Non- current as of at 12/31/2014 | |
| | | | One to three months | | | Three to twelve months | | | | One to two years | | | Two to three years | | | Three to four years | | | Four to five years | | | More than five years | | | | One to three months | | | Three to twelve months | | | | One to two years | | | Two to three years | | | Three to four years | | | Four to five years | | | More than five years | | |
| | | | | | | ThCh$ | | | ThCh$ | | | ThCh$ | | | ThCh$ | | | ThCh$ | | | ThCh$ | | | ThCh$ | | | ThCh$ | | | ThCh$ | | | ThCh$ | | | ThCh$ | | | ThCh$ | | | ThCh$ | | | ThCh$ | | | ThCh$ | | | ThCh$ | | | ThCh$ | | | ThCh$ | |
| | | | | | | | | | | | | | | | | | | | | | | | | | | | | | | | | | | | | | | | | | | | | | | | | | | | | | | | | | | | | | | | | | | | | | | | | | | | | |
Chile | | US$ | | 5.98% | | | - | | | | - | | | | - | | | | - | | | | - | | | | - | | | | - | | | | - | | | | - | | | | 20,269 | | | | 1,020,576 | | | | 1,040,845 | | | | - | | | | - | | | | - | | | | - | | | | - | | | | - | |
Chile | | Ch$ | | 0.00% | | | - | | | | - | | | | - | | | | - | | | | - | | | | - | | | | - | | | | - | | | | - | | | | 714 | | | | - | | | | 714 | | | | - | | | | - | | | | - | | | | - | | | | - | | | | - | |
Peru | | US$ | | 2.40% | | | 26,707,131 | | | | 3,241,137 | | | | 29,948,268 | | | | 4,229,306 | | | | 19,295,795 | | | | 299,648 | | | | - | | | | - | | | | 23,824,749 | | | | 2,914,574 | | | | 9,996,364 | | | | 12,910,938 | | | | 40,274,383 | | | | 18,781,256 | | | | 16,391,794 | | | | 256,394 | | | | - | | | | 75,703,827 | |
Peru | | Peruvian nuevo sol | | 5.20% | | | 12,864,568 | | | | 1,001,767 | | | | 13,866,335 | | | | 3,285,202 | | | | 23,309,058 | | | | - | | | | - | | | | - | | | | 26,594,260 | | | | 326,274 | | | | 978,819 | | | | 1,305,093 | | | | 1,305,094 | | | | 3,209,741 | | | | 22,772,683 | | | | - | | | | - | | | | 27,287,518 | |
Argentina | | US$ | | 13.13% | | | 3,901,216 | | | | - | | | | 3,901,216 | | | | - | | | | - | | | | - | | | | - | | | | - | | | | - | | | | 2,808,939 | | | | 12,054,341 | | | | 14,863,280 | | | | 1,039,398 | | | | - | | | | - | | | | - | | | | - | | | | 1,039,398 | |
Argentina | | Ar$ | | 37.06% | | | 2,290,653 | | | | 6,194,569 | | | | 8,485,222 | | | | 1,162,844 | | | | - | | | | - | | | | - | | | | - | | | | 1,162,844 | | | | 8,287,625 | | | | 12,035,817 | | | | 20,323,442 | | | | 7,968,912 | | | | 188,784 | | | | - | | | | - | | | | - | | | | 8,157,696 | |
Colombia | | CP | | 14.53% | | | 35,832,030 | | | | 84,128,905 | | | | 119,960,935 | | | | 43,831,876 | | | | 12,832,869 | | | | 12,194,900 | | | | 11,556,930 | | | | 30,842,974 | | | | 111,259,549 | | | | 1,401,291 | | | | 4,203,875 | | | | 5,605,166 | | | | 10,766,379 | | | | 15,367,075 | | | | 14,619,719 | | | | 13,872,363 | | | | 48,015,897 | | | | 102,641,433 | |
Brazil | | Real | | 6.46% | | | 12,842,515 | | | | 24,480,763 | | | | 37,323,278 | | | | 42,171,314 | | | | 37,904,161 | | | | 33,637,009 | | | | - | | | | - | | | | 113,712,484 | | | | 1,856,705 | | | | 5,570,115 | | | | 7,426,820 | | | | 7,426,820 | | | | 27,647,361 | | | | 25,171,755 | | | | 22,696,148 | | | | - | | | | 82,942,084 | |
| | | | | | | | | | | | | | | | | | | | | | | | | | | | | | | | | | | | | | | | | | | | | | | | | | | | | | | | | | | | | | | | | | | | | | | | | | | | | |
| | | | | | | 94,438,113 | | | | 119,047,141 | | | | 213,485,254 | | | | 94,680,542 | | | | 93,341,883 | | | | 46,131,557 | | | | 11,556,930 | | | | 30,842,974 | | | | 276,553,886 | | | | 17,616,391 | | | | 45,859,907 | | | | 63,476,298 | | | | 68,780,986 | | | | 65,194,217 | | | | 78,955,951 | | | | 36,824,905 | | | | 48,015,897 | | | | 297,771,956 | |
| | |
| The accompanying notes are an integral part of these consolidated financial statements | | |
|
| F-190 |
Identification of bank borrowings by company
| | | | | | | | | | | | | | | | | | | | | | | | | | | | | | | | | | | | | | | | | | | | | | | | | | | | | | | | | | | | | | | | | | | | | | | | | | | | | | | | | | | | |
Tax ID Number | | Company | | Country | | Financial Institution | | Currency | | Effective
interest
rate | | Nominal
interest
rate | | December 31, 2015 | | | December 31, 2014 | |
| | | | | | | | | Current | | | | Non-current | | | | Current | | | | Non-current | |
| | | | | | | |
| Less than
90 days |
| |
| More than
90 days |
| |
| Total
Current |
| |
| One to
two years |
| |
| Two to
three years |
| |
| Three to
four years |
| |
| Four to
five years |
| |
| More than
five years |
| |
| Total Non-
current |
| |
| Less than
90 days |
| |
| More than
90 days |
| |
| Total
Current |
| |
| One to
two years |
| |
| Two to
three years |
| |
| Three to
four years |
| |
| Four to
five years |
| |
| More
than five years |
| |
| Total
Non-
current |
|
| Foreign | | Ampla Energía S.A. | | Brazil | | Banco do Brasil | | Real | | 13.58% | | 13.71% | | | 816,511 | | | | 2,449,533 | | | | 3,266,044 | | | | 11,051,818 | | | | 9,963,136 | | | | 8,874,455 | | | | - | | | | - | | | | 29,889,409 | | | | 831,094 | | | | 2,493,282 | | | | 3,324,376 | | | | 3,324,376 | | | | 13,139,191 | | | | 12,031,066 | | | | 10,922,940 | | | | - | | | | 39,417,573 | |
| Foreign | | CGTF S.A. | | Brazil | | IFC - C | | US$ | | 12.18% | | 12.32% | | | - | | | | - | | | | - | | | | - | | | | - | | | | - | | | | - | | | | - | | | | - | | | | 132 | | | | - | | | | 132 | | | | - | | | | - | | | | - | | | | - | | | | - | | | | - | |
| Foreign | | Chinango S.A.C. | | Peru | | Banco Scotiabank | | US$ | | 3.98% | | 3.96% | | | - | | | | - | | | | - | | | | - | | | | - | | | | - | | | | - | | | | - | | | | - | | | | 353,913 | | | | 1,051,014 | | | | 1,404,927 | | | | 1,376,324 | | | | 1,347,722 | | | | 15,345,293 | | | | - | | | | - | | | | 18,069,339 | |
| Foreign | | Chinango S.A.C. | | Peru | | Banco de Credito del Peru | | US$ | | 2.17% | | 2.06% | | | 296,974 | | | | 884,973 | | | | 1,181,947 | | | | 1,166,085 | | | | 18,073,119 | | | | - | | | | - | | | | - | | | | 19,239,204 | | | | - | | | | - | | | | - | | | | - | | | | - | | | | - | | | | - | | | | - | | | | - | |
| Foreign | | Chinango S.A.C. | | Peru | | Bank Of Nova Scotia | | US$ | | 3.25% | | 3.07% | | | 468,030 | | | | 1,384,969 | | | | 1,852,999 | | | | 1,802,011 | | | | - | | | | - | | | | - | | | | - | | | | 1,802,011 | | | | 411,404 | | | | 1,217,828 | | | | 1,629,232 | | | | 1,585,546 | | | | 1,541,859 | | | | - | | | | - | | | | - | | | | 3,127,405 | |
| Foreign | | Chinango S.A.C. | | Peru | | Bank Of Nova Scotia | | US$ | | 3.48% | | 3.40% | | | 328,549 | | | | 971,195 | | | | 1,299,744 | | | | 1,261,210 | | | | 1,222,676 | | | | 299,648 | | | | - | | | | - | | | | 2,783,534 | | | | 289,876 | | | | 857,071 | | | | 1,146,947 | | | | 1,113,465 | | | | 1,079,983 | | | | 1,046,501 | | | | 256,394 | | | | - | | | | 3,496,343 | |
| Foreign | | Codensa | | Colombia | | Citibank Colombia | | $ Col | | 4.40% | | 4.32% | | | - | | | | - | | | | - | | | | - | | | | - | | | | - | | | | - | | | | - | | | | - | | | | 1,025,611 | | | | 3,076,833 | | | | 4,102,444 | | | | 4,102,444 | | | | 14,508,170 | | | | 13,140,689 | | | | 11,773,208 | | | | - | | | | 43,524,511 | |
| Foreign | | Coelce S.A. | | Brazil | | Banco Itaú Brasil | | Real | | 14.39% | | 14.68% | | | 980,672 | | | | 2,942,017 | | | | 3,922,689 | | | | 12,030,283 | | | | 10,722,720 | | | | 9,415,157 | | | | - | | | | - | | | | 32,168,160 | | | | - | | | | - | | | | - | | | | - | | | | - | | | | - | | | | - | | | | - | | | | - | |
| Foreign | | Coelce S.A. | | Brazil | | Banco do Brasil | | Real | | 13.72% | | 13.97% | | | 1,870,908 | | | | 19,089,213 | | | | 20,960,121 | | | | 19,089,213 | | | | 17,218,305 | | | | 15,347,397 | | | | - | | | | - | | | | 51,654,915 | | | | - | | | | - | | | | - | | | | - | | | | - | | | | - | | | | - | | | | - | | | | - | |
| Foreign | | Coelce S.A. | | Brazil | | Banco Santander | | Real | | 13.80% | | 15.76% | | | 9,174,424 | | | | - | | | | 9,174,424 | | | | - | | | | - | | | | - | | | | - | | | | - | | | | - | | | | - | | | | - | | | | - | | | | - | | | | - | | | | - | | | | - | | | | - | | | | - | |
| Foreign | | Edegel S.A.A | | Peru | | Banco Continental | | US$ | | 3.44% | | 3.36% | | | - | | | | - | | | | - | | | | - | | | | - | | | | - | | | | - | | | | - | | | | - | | | | 1,807,054 | | | | 6,713,471 | | | | 8,520,525 | | | | 14,284,700 | | | | 14,811,692 | | | | - | | | | - | | | | - | | | | 29,096,392 | |
| Foreign | | Edegel S.A.A | | Peru | | Bank Nova Scotia | | US$ | | 1.08% | | 1.06% | | | 25,613,578 | | | | - | | | | 25,613,578 | | | | - | | | | - | | | | - | | | | - | | | | - | | | | - | | | | 52,327 | | | | 156,980 | | | | 209,307 | | | | 21,914,348 | | | | - | | | | - | | | | - | | | | - | | | | 21,914,348 | |
| Foreign | | Edelnor S.A.A. | | Peru | | Banco de Interbank | | Peruvian nuevo sol | | 6.90% | | 6.73% | | | 35,470 | | | | 106,410 | | | | 141,880 | | | | 2,091,393 | | | | - | | | | - | | | | - | | | | - | | | | 2,091,393 | | | | 34,654 | | | | 103,961 | | | | 138,615 | | | | 138,615 | | | | 2,043,262 | | | | - | | | | - | | | | - | | | | 2,181,877 | |
| Foreign | | Edelnor S.A.A. | | Peru | | Banco de Interbank | | Peruvian nuevo sol | | 5.83% | | 5.71% | | | 63,633 | | | | 190,899 | | | | 254,532 | | | | 254,532 | | | | 4,409,519 | | | | - | | | | - | | | | - | | | | 4,664,051 | | | | 62,168 | | | | 186,505 | | | | 248,673 | | | | 248,674 | | | | 248,674 | | | | 4,308,038 | | | | - | | | | - | | | | 4,805,386 | |
| Foreign | | Edelnor S.A.A. | | Peru | | Banco Continental | | Peruvian nuevo sol | | 5.10% | | 5.01% | | | 39,574 | | | | 118,722 | | | | 158,296 | | | | 158,296 | | | | 3,185,312 | | | | - | | | | - | | | | - | | | | 3,343,608 | | | | 38,673 | | | | 116,018 | | | | 154,691 | | | | 154,691 | | | | 154,691 | | | | 3,112,021 | | | | - | | | | - | | | | 3,421,403 | |
| Foreign | | Edelnor S.A.A. | | Peru | | Banco Continental | | Peruvian nuevo sol | | 5.10% | | 5.01% | | | 65,973 | | | | 197,919 | | | | 263,892 | | | | 263,892 | | | | 5,308,880 | | | | - | | | | - | | | | - | | | | 5,572,772 | | | | 64,454 | | | | 193,361 | | | | 257,815 | | | | 257,815 | | | | 257,815 | | | | 5,186,700 | | | | - | | | | - | | | | 5,702,330 | |
| Foreign | | Edelnor S.A.A. | | Peru | | Banco Continental | | Peruvian nuevo sol | | 5.10% | | 5.01% | | | 63,317 | | | | 189,952 | | | | 253,269 | | | | 253,269 | | | | 5,096,497 | | | | - | | | | - | | | | - | | | | 5,349,766 | | | | 61,860 | | | | 185,579 | | | | 247,439 | | | | 247,438 | | | | 247,438 | | | | 4,979,205 | | | | - | | | | - | | | | 5,474,081 | |
| Foreign | | Edelnor S.A.A. | | Peru | | Banco Continental | | Peruvian nuevo sol | | 5.10% | | 5.01% | | | 65,955 | | | | 197,865 | | | | 263,820 | | | | 263,820 | | | | 5,308,850 | | | | - | | | | - | | | | - | | | | 5,572,670 | | | | 64,465 | | | | 193,395 | | | | 257,860 | | | | 257,861 | | | | 257,861 | | | | 5,186,719 | | | | - | | | | - | | | | 5,702,441 | |
| Foreign | | Edelnor S.A.A. | | Peru | | Banco de Interbank | | Peruvian nuevo sol | | 4.67% | | 4.59% | | | 12,530,646 | | | | - | | | | 12,530,646 | | | | - | | | | - | | | | - | | | | - | | | | - | | | | - | | | | - | | | | - | | | | - | | | | - | | | | - | | | | - | | | | - | | | | - | | | | - | |
| Foreign | | Edesur S.A. | | Argentina | | Banco Ciudad de Buenos Aires | | $ Arg | | 34.64% | | 30.07% | | | - | | | | - | | | | - | | | | - | | | | - | | | | - | | | | - | | | | - | | | | - | | | | 1,216,089 | | | | 2,519,698 | | | | 3,735,787 | | | | - | | | | - | | | | - | | | | - | | | | - | | | | - | |
| Foreign | | Edesur S.A. | | Argentina | | Banco Provincia de Buenos Aires | | $ Arg | | 35.36% | | 30.67% | | | 85,423 | | | | - | | | | 85,423 | | | | - | | | | - | | | | - | | | | - | | | | - | | | | - | | | | 457,020 | | | | - | | | | 457,020 | | | | - | | | | - | | | | - | | | | - | | | | - | | | | - | |
| Foreign | | Edesur S.A. | | Argentina | | Banco Itaú Argentina | | $ Arg | | 38.20% | | 32.79% | | | - | | | | - | | | | - | | | | - | | | | - | | | | - | | | | - | | | | - | | | | - | | | | 249,211 | | | | 658,584 | | | | 907,795 | | | | - | | | | - | | | | - | | | | - | | | | - | | | | - | |
| Foreign | | Edesur S.A. | | Argentina | | Banco Santander Río | | $ Arg | | 29.74% | | 26.91% | | | - | | | | - | | | | - | | | | - | | | | - | | | | - | | | | - | | | | - | | | | - | | | | 810,407 | | | | 750,273 | | | | 1,560,680 | | | | - | | | | - | | | | - | | | | - | | | | - | | | | - | |
| Foreign | | Edesur S.A. | | Argentina | | Banco Santander Río | | $ Arg | | 45.20% | | 37.88% | | | 184,364 | | | | 277,164 | | | | 461,528 | | | | - | | | | - | | | | - | | | | - | | | | - | | | | - | | | | 576,612 | | | | - | | | | 576,612 | | | | - | | | | - | | | | - | | | | - | | | | - | | | | - | |
| Foreign | | Edesur S.A. | | Argentina | | ICBC Argentina | | $ Arg | | 34.06% | | 29.50% | | | - | | | | - | | | | - | | | | - | | | | - | | | | - | | | | - | | | | - | | | | - | | | | 310,712 | | | | - | | | | 310,712 | | | | - | | | | - | | | | - | | | | - | | | | - | | | | - | |
| Foreign | | Emgesa S.A. E.S.P. | | Colombia | | Banco Corpbanca | | $ Col | | 8.39% | | 8.22% | | | - | | | | - | | | | - | | | | - | | | | - | | | | - | | | | - | | | | - | | | | - | | | | 373,517 | | | | 1,120,552 | | | | 1,494,069 | | | | 2,847,830 | | | | 4,052,184 | | | | 3,852,974 | | | | 3,653,765 | | | | 12,622,968 | | | | 27,029,721 | |
| Foreign | | Emgesa S.A. E.S.P. | | Colombia | | BBVA Colombia | | $ Col | | 8.27% | | 8.11% | | | 894,845 | | | | 6,064,899 | | | | 6,959,744 | | | | 9,982,170 | | | | 9,504,920 | | | | 9,027,670 | | | | 8,550,419 | | | | 22,787,755 | | | | 59,852,934 | | | | 1,027,774 | | | | 3,083,323 | | | | 4,111,097 | | | | 7,918,549 | | | | 11,314,891 | | | | 10,766,745 | | | | 10,218,598 | | | | 35,392,929 | | | | 75,611,712 | |
| Foreign | | Emgesa S.A. E.S.P. | | Colombia | | Banco de Bogota | | $ Col | | 8.30% | | 8.14% | | | 301,348 | | | | 2,105,951 | | | | 2,407,299 | | | | 3,488,668 | | | | 3,327,949 | | | | 3,167,230 | | | | 3,006,511 | | | | 8,055,219 | | | | 21,045,577 | | | | - | | | | - | | | | - | | | | - | | | | - | | | | - | | | | - | | | | - | | | | - | |
| Foreign | | Emgesa S.A. E.S.P. | | Colombia | | AV VILLAS | | $ Col | | 6.06% | | 5.93% | | | 11,145,579 | | | | - | | | | 11,145,579 | | | | - | | | | - | | | | - | | | | - | | | | - | | | | - | | | | - | | | | - | | | | - | | | | - | | | | - | | | | - | | | | - | | | | - | | | | - | |
| Foreign | | Emgesa S.A. E.S.P. | | Colombia | | Citibank Colombia | | $ Col | | 5.57% | | 6.01% | | | 5,233,163 | | | | - | | | | 5,233,163 | | | | - | | | | - | | | | - | | | | - | | | | - | | | | - | | | | - | | | | - | | | | - | | | | - | | | | - | | | | - | | | | - | | | | - | | | | - | |
| Foreign | | Emgesa S.A. E.S.P. | | Colombia | | BBVA Colombia | | $ Col | | 6.30% | | 6.16% | | | 438,046 | | | | 28,712,649 | | | | 29,150,695 | | | | - | | | | - | | | | - | | | | - | | | | - | | | | - | | | | - | | | | - | | | | - | | | | - | | | | - | | | | - | | | | - | | | | - | | | | - | |
| Foreign | | Emgesa S.A. E.S.P. | | Colombia | | Banco de Bogota | | $ Col | | 6.84% | | 6.66% | | | 13,683,505 | | | | - | | | | 13,683,505 | | | | - | | | | - | | | | - | | | | - | | | | - | | | | - | | | | - | | | | - | | | | - | | | | - | | | | - | | | | - | | | | - | | | | - | | | | - | |
| Foreign | | Emgesa S.A. E.S.P. | | Colombia | | Banco de Crédito del Peru | | $ Col | | 5.87% | | 5.70% | | | 295,055 | | | | 20,873,617 | | | | 21,168,672 | | | | - | | | | - | | | | - | | | | - | | | | - | | | | - | | | | - | | | | - | | | | - | | | | - | | | | - | | | | - | | | | - | | | | - | | | | - | |
| Foreign | | Emgesa S.A. E.S.P. | | Colombia | | Banco de Crédito del Peru | | $ Col | | 5.93% | | 5.76% | | | 198,385 | | | | 13,892,621 | | | | 14,091,006 | | | | - | | | | - | | | | - | | | | - | | | | - | | | | - | | | | - | | | | - | | | | - | | | | - | | | | - | | | | - | | | | - | | | | - | | | | - | |
| Foreign | | Emgesa S.A. E.S.P. | | Colombia | | Banco de Crédito del Peru | | $ Col | | 5.65% | | 5.50% | | | 149,881 | | | | 10,882,356 | | | | 11,032,237 | | | | - | | | | - | | | | - | | | | - | | | | - | | | | - | | | | - | | | | - | | | | - | | | | - | | | | - | | | | - | | | | - | | | | - | | | | - | |
| Foreign | | Emgesa S.A. E.S.P. | | Colombia | | The Bank Of Tokyo | | $ Col | | 7.02% | | 6.90% | | | 532,271 | | | | 1,596,812 | | | | 2,129,083 | | | | 30,361,038 | | | | - | | | | - | | | | - | | | | - | | | | 30,361,038 | | | | - | | | | - | | | | - | | | | - | | | | - | | | | - | | | | - | | | | - | | | | - | |
| Foreign | | Emgesa S.A. E.S.P. | | Colombia | | Banco Davivienda | | $ Col | | 6.30% | | 6.15% | | | 2,959,952 | | | | - | | | | 2,959,952 | | | | - | | | | - | | | | - | | | | - | | | | - | | | | - | | | | - | | | | - | | | | - | | | | - | | | | - | | | | - | | | | - | | | | - | | | | - | |
| Foreign | | Endesa Argentina S.A. | | Argentina | | Citibank | | $ Arg | | 34.23% | | 32.75% | | | 29,771 | | | | 445,358 | | | | 475,129 | | | | - | | | | - | | | | - | | | | - | | | | - | | | | - | | | | 749,636 | | | | - | | | | 749,636 | | | | - | | | | - | | | | - | | | | - | | | | - | | | | - | |
| 91.081.000-6 | | Endesa Chile S.A. | | Chile | | B.N.P. Paribas | | US$ | | 6.32% | | 5.98% | | | - | | | | - | | | | - | | | | - | | | | - | | | | - | | | | - | | | | - | | | | - | | | | 20,269 | | | | 1,020,576 | | | | 1,040,845 | | | | - | | | | - | | | | - | | | | - | | | | - | | | | - | |
| 91.081.000-6 | | Endesa Chile S.A. | | Chile | | Banco Santander | | Ch$ | | 6.00% | | 6.00% | | | - | | | | - | | | | - | | | | - | | | | - | | | | - | | | | - | | | | - | | | | - | | | | 582 | | | | - | | | | 582 | | | | - | | | | - | | | | - | | | | - | | | | - | | | | - | |
| Foreign | | Central Costanera S.A. | | Argentina | | Banco Galicia | | $ Arg | | 51.46% | | 42.24% | | | 214,270 | | | | 583,114 | | | | 797,384 | | | | 276,664 | | | | - | | | | - | | | | - | | | | - | | | | 276,664 | | | | 308,554 | | | | 836,632 | | | | 1,145,186 | | | | 990,314 | | | | - | | | | - | | | | - | | | | - | | | | 990,314 | |
| Foreign | | Central Costanera S.A. | | Argentina | | Banco Itaú Argentina | | $ Arg | | 55.07% | | 44.68% | | | 80,256 | | | | 225,731 | | | | 305,987 | | | | 128,627 | | | | - | | | | - | | | | - | | | | - | | | | 128,627 | | | | 119,500 | | | | 337,442 | | | | 456,942 | | | | 390,884 | | | | 27,716 | | | | - | | | | - | | | | - | | | | 418,600 | |
| Foreign | | Central Costanera S.A. | | Argentina | | Banco Santander Río | | $ Arg | | 44.16% | | 37.14% | | | 50,253 | | | | 140,581 | | | | 190,834 | | | | 79,542 | | | | - | | | | - | | | | - | | | | - | | | | 79,542 | | | | 70,593 | | | | 200,874 | | | | 271,467 | | | | 236,632 | | | | 17,012 | | | | - | | | | - | | | | - | | | | 253,644 | |
| Foreign | | Central Costanera S.A. | | Argentina | | Banco Supervielle | | $ Arg | | 49.96% | | 41.21% | | | 81,254 | | | | 224,941 | | | | 306,195 | | | | 125,511 | | | | - | | | | - | | | | - | | | | - | | | | 125,511 | | | | 112,554 | | | | 319,053 | | | | 431,607 | | | | 372,729 | | | | 26,615 | | | | - | | | | - | | | | - | | | | 399,344 | |
| Foreign | | Central Costanera S.A. | | Argentina | | Citibank | | $ Arg | | 45.10% | | 37.81% | | | 263,796 | | | | 734,081 | | | | 997,877 | | | | 412,453 | | | | - | | | | - | | | | - | | | | - | | | | 412,453 | | | | 347,807 | | | | 998,639 | | | | 1,346,446 | | | | 1,199,174 | | | | 87,541 | | | | - | | | | - | | | | - | | | | 1,286,715 | |
| Foreign | | Central Costanera S.A. | | Argentina | | Credit Suisse International | | US$ | | 14.84% | | 13.92% | | | 1,214,284 | | | | - | | | | 1,214,284 | | | | - | | | | - | | | | - | | | | - | | | | - | | | | - | | | | 122,704 | | | | 2,324,204 | | | | 2,446,908 | | | | 1,039,398 | | | | - | | | | - | | | | - | | | | - | | | | 1,039,398 | |
| Foreign | | Central Costanera S.A. | | Argentina | | ICBC Argentina | | $ Arg | | 51.97% | | 42.59% | | | 89,832 | | | | 249,669 | | | | 339,501 | | | | 140,047 | | | | - | | | | - | | | | - | | | | - | | | | 140,047 | | | | 132,215 | | | | 371,509 | | | | 503,724 | | | | 425,630 | | | | 29,900 | | | | - | | | | - | | | | - | | | | 455,530 | |
| Foreign | | H. El Chocón S.A. | | Argentina | | Deutsche Bank | | US$ | | 13.50% | | 12.86% | | | 1,339,210 | | | | - | | | | 1,339,210 | | | | - | | | | - | | | | - | | | | - | | | | - | | | | - | | | | 1,331,375 | | | | 4,844,938 | | | | 6,176,313 | | | | - | | | | - | | | | - | | | | - | | | | - | | | | - | |
| Foreign | | H. El Chocón S.A. | | Argentina | | Standard Bank | | US$ | | 13.50% | | 12.86% | | | 673,817 | | | | - | | | | 673,817 | | | | - | | | | - | | | | - | | | | - | | | | - | | | | - | | | | 667,376 | | | | 2,425,364 | | | | 3,092,740 | | | | - | | | | - | | | | - | | | | - | | | | - | | | | - | |
| Foreign | | H. El Chocón S.A. | | Argentina | | Banco Itau | | US$ | | 13.50% | | 12.86% | | | 673,905 | | | | - | | | | 673,905 | | | | - | | | | - | | | | - | | | | - | | | | - | | | | - | | | | 687,484 | | | | 2,459,835 | | | | 3,147,319 | | | | - | | | | - | | | | - | | | | - | | | | - | | | | - | |
| Foreign | | H. El Chocón S.A. | | Argentina | | Banco Macro | | $ Arg | | 34.46% | | 31.10% | | | 75,083 | | | | 1,113,612 | | | | 1,188,695 | | | | - | | | | - | | | | - | | | | - | | | | - | | | | - | | | | 1,522,852 | | | | - | | | | 1,522,852 | | | | - | | | | - | | | | - | | | | - | | | | - | | | | - | |
| Foreign | | H. El Chocón S.A. | | Argentina | | Banco Santander - Sindicado IV | | $ Arg | | 40.59% | | 35.54% | | | 266,203 | | | | 516,165 | | | | 782,368 | | | | - | | | | - | | | | - | | | | - | | | | - | | | | - | | | | 306,765 | | | | 1,185,867 | | | | 1,492,632 | | | | 1,023,289 | | | | - | | | | - | | | | - | | | | - | | | | 1,023,289 | |
| Foreign | | H. El Chocón S.A. | | Argentina | | Banco Itau- Sindicado IV | | $ Arg | | 40.59% | | 35.54% | | | 241,619 | | | | 464,727 | | | | 706,346 | | | | - | | | | - | | | | - | | | | - | | | | - | | | | - | | | | 273,493 | | | | 1,057,510 | | | | 1,331,003 | | | | 912,706 | | | | - | | | | - | | | | - | | | | - | | | | 912,706 | |
| Foreign | | H. El Chocón S.A. | | Argentina | | Banco Galicia - Sindicado IV | | $ Arg | | 40.59% | | 35.54% | | | 228,411 | | | | 442,424 | | | | 670,835 | | | | - | | | | - | | | | - | | | | - | | | | - | | | | - | | | | 262,403 | | | | 1,014,727 | | | | 1,277,130 | | | | 875,846 | | | | - | | | | - | | | | - | | | | - | | | | 875,846 | |
| Foreign | | H. El Chocón S.A. | | Argentina | | Banco Hipotecario - Sindicado IV | | $ Arg | | 40.59% | | 35.54% | | | 73,221 | | | | 144,361 | | | | 217,582 | | | | - | | | | - | | | | - | | | | - | | | | - | | | | - | | | | 86,271 | | | | 335,251 | | | | 421,522 | | | | 290,454 | | | | - | | | | - | | | | - | | | | - | | | | 290,454 | |
| Foreign | | H. El Chocón S.A. | | Argentina | | Banco Ciudad -Sindicado IV | | $ Arg | | 40.59% | | 35.54% | | | 30,708 | | | | 59,481 | | | | 90,189 | | | | - | | | | - | | | | - | | | | - | | | | - | | | | - | | | | 34,894 | | | | 135,536 | | | | 170,430 | | | | 117,383 | | | | - | | | | - | | | | - | | | | - | | | | 117,383 | |
| Foreign | | H. El Chocón S.A. | | Argentina | | ICBC Argentina | | $ Arg | | 40.59% | | 35.54% | | | 296,189 | | | | 573,160 | | | | 869,349 | | | | - | | | | - | | | | - | | | | - | | | | - | | | | - | | | | 340,037 | | | | 1,314,222 | | | | 1,654,259 | | | | 1,133,871 | | | | - | | | | - | | | | - | | | | - | | | | 1,133,871 | |
| | | | | | | | | | | | | | | | | | | | | | | | | | | | | | | | | | | | | | | | | | | | | | | | | | | | | | | | | | | | | | | | | | | | | | | | | | | | | | | | | | | | | |
| | | | | | Totales | | | 94,438,113 | | | | 119,047,141 | | | | 213,485,254 | | | | 94,680,542 | | | | 93,341,883 | | | | 46,131,557 | | | | 11,556,930 | | | | 30,842,974 | | | | 276,553,886 | | | | 17,616,391 | | | | 45,859,907 | | | | 63,476,298 | | | | 68,780,986 | | | | 65,194,217 | | | | 78,955,951 | | | | 36,824,905 | | | | 48,015,897 | | | | 297,771,956 | |
| | |
| The accompanying notes are an integral part of these consolidated financial statements | | |
|
| F-191 |
b) Secured and unsecured liabilities
d. Summary of secured and unsecured liabilities by currency and maturity
| | | | | | | | | | | | | | | | | | | | | | | | | | | | | | | | | | | | | | | | | | | | | | | | | | | | | | | | | | | | | | | | | | | | | | | | | | | | | | |
| Country | | Currency | | Nominal
Interest
Rate | | | Current | | | Non-current | | | Current | | | Non-current | |
| | | | Maturity | | | Total
Current as of
12/31/2015 | | | Maturity | | | Total Non-
current as of
12/31/2015 | | | Maturity | | | Total
Current as of
12/31/2014 | | | Maturity | | | Total Non-
current as of
12/31/2014 | |
| | | | One to
three
months | | | Three to
twelve
months | | | | One to
two years | | | Two to
three years | | | Three to
four years | | | Four to
five years | | | More than
five years | | | | One to
three
months | | | Three to
twelve
months | | | | One to
two years | | | Two to
three years | | | Three to
four years | | | Four to
five years | | | More than
five years | | |
| | | | ThCh$ | | | ThCh$ | | | ThCh$ | | | ThCh$ | | | ThCh$ | | | ThCh$ | | | ThCh$ | | | ThCh$ | | | ThCh$ | | | ThCh$ | | | ThCh$ | | | ThCh$ | | | ThCh$ | | | ThCh$ | | | ThCh$ | | | ThCh$ | | | ThCh$ | | | ThCh$ | |
| | | | | | | | | | | | | | | | | | | | | | | | | | | | | | | | | | | | | | | | | | | | | | | | | | | | | | | | | | | | | | | | | | | | | | | | | | | | | | | |
Chile | | US$ | | | 7.00 | % | | | 3,015,734 | | | | 186,297,709 | | | | 189,313,443 | | | | 39,170 | | | | 39,170 | | | | 39,170 | | | | 39,170 | | | | 843,993 | | | | 1,000,673 | | | | 11,857,865 | | | | 152,626,256 | | | | 164,484,121 | | | | 188,522,289 | | | | 25,581,811 | | | | 25,581,811 | | | | 25,581,811 | | | | 734,182,951 | | | | 999,450,673 | |
Chile | | U.F. | | | 5.75 | % | | | 654,291 | | | | 5,230,040 | | | | 5,884,331 | | | | 5,728,780 | | | | 5,564,286 | | | | 5,390,333 | | | | 5,206,378 | | | | 7,441,327 | | | | 29,331,104 | | | | 9,168,367 | | | | 35,341,359 | | | | 44,509,726 | | | | 43,719,963 | | | | 42,919,926 | | | | 42,109,023 | | | | 52,020,539 | | | | 441,830,545 | | | | 622,599,996 | |
Peru | | US$ | | | 6.50 | % | | | 624,775 | | | | 15,786,095 | | | | 16,410,870 | | | | 1,659,369 | | | | 8,362,538 | | | | 6,637,571 | | | | 7,807,914 | | | | 10,086,341 | | | | 34,553,733 | | | | 4,424,492 | | | | 1,630,232 | | | | 6,054,724 | | | | 14,072,738 | | | | 1,443,269 | | | | 7,173,013 | | | | 5,691,115 | | | | 15,362,941 | | | | 43,743,076 | |
Peru | | Peruvian nuevo sol | | | 6.44 | % | | | 13,029,793 | | | | 18,645,206 | | | | 31,674,999 | | | | 33,667,892 | | | | 12,316,415 | | | | 55,639,169 | | | | 36,169,256 | | | | 166,145,520 | | | | 303,938,252 | | | | 8,992,510 | | | | 33,040,637 | | | | 42,033,147 | | | | 30,115,012 | | | | 32,058,804 | | | | 11,190,625 | | | | 39,655,619 | | | | 189,474,327 | | | | 302,494,387 | |
Colombia | | $ Col | | | 15.64 | % | | | 55,700,572 | | | | 67,624,004 | | | | 123,324,576 | | | | 206,126,573 | | | | 182,198,785 | | | | 143,062,230 | | | | 109,340,794 | | | | 709,356,051 | | | | 1,350,084,433 | | | | 86,056,574 | | | | 65,385,741 | | | | 151,442,315 | | | | 121,885,126 | | | | 217,675,920 | | | | 191,934,482 | | | | 150,687,586 | | | | 877,507,340 | | | | 1,559,690,454 | |
Brazil | | Real | | | 10.81 | % | | | 10,784,409 | | | | 97,033,475 | | | | 107,817,884 | | | | 116,967,735 | | | | 94,643,824 | | | | 44,934,561 | | | | - | | | | - | | | | 256,546,120 | | | | 11,340,152 | | | | 58,273,250 | | | | 69,613,402 | | | | 119,821,286 | | | | 131,772,248 | | | | 107,403,868 | | | | 52,740,514 | | | | - | | | | 411,737,916 | |
| | | | | | | | | | | | | | | | | | | | | | | | | | | | | | | | | | | | | | | | | | | | | | | | | | | | | | | | | | | | | | | | | | | | | | | | | | | | | | | |
| | | | | | | | | 83,809,574 | | | | 390,616,529 | | | | 474,426,103 | | | | 364,189,519 | | | | 303,125,018 | | | | 255,703,034 | | | | 158,563,512 | | | | 893,873,232 | | | | 1,975,454,315 | | | | 131,839,960 | | | | 346,297,475 | | | | 478,137,435 | | | | 518,136,414 | | | | 451,451,978 | | | | 385,392,822 | | | | 326,377,184 | | | | 2,258,358,104 | | | | 3,939,716,502 | |
e. Secured and unsecured liabilities by company
| | | | | | | | | | | | | | | | | | | | | | | | | | | | | | | | | | | | | | | | | | | | | | | | | | | | | | | | | | | | | | | | | | | | | | | | | | | | | | | | | | | | | | |
Tax ID
Number | | Company | | Country | | Financial Institution | | Country | | Currency | | Effective
interest
rate | | Nominal
interest
rate | | December 31, 2015 | | | December 31, 2014 | |
| | | | | | | | | | Current | | | | Non-current | | | | Current | | | | Non-current | |
| | | | | | | | |
| Less than
90 days |
| |
| More than
90 days |
| |
| Total
Current |
| |
| One to
two years |
| |
| Two to
three years |
| |
| Three to
four years |
| |
| Four to
five years |
| |
| More
than
five years |
| |
| Total Non-
current |
| |
| Less
than
90 days |
| |
| More than
90 days |
| |
| Total
Current |
| |
| One to
two years |
| |
| Two to
three years |
| |
| Three to
four years |
| |
| Three to
four years |
| |
| More than
five years |
| |
| Total Non-
current |
|
| Foreign | | Ampla Energía S.A. | | Brazil | | Bonos 1ª Serie 16 | | Brazil | | Real | | 13.66% | | 13.75% | | | 369,157 | | | | 11,002,428 | | | | 11,371,585 | | | | - | | | | - | | | | - | | | | - | | | | - | | | | - | | | | 781,789 | | | | 14,938,243 | | | | 15,720,032 | | | | 14,156,454 | | | | - | | | | - | | | | - | | | | - | | | | 14,156,454 | |
| Foreign | | Ampla Energía S.A. | | Brazil | | Bonos 1ª Serie 17 | | Brazil | | Real | | 13.71% | | 13.89% | | | 635,501 | | | | 10,359,267 | | | | 10,994,768 | | | | 9,723,766 | | | | - | | | | - | | | | - | | | | - | | | | 9,723,766 | | | | 657,480 | | | | 1,972,439 | | | | 2,629,919 | | | | 13,403,776 | | | | 12,088,817 | | | | - | | | | - | | | | - | | | | 25,492,593 | |
| Foreign | | Ampla Energía S.A. | | Brazil | | Bonos 1ª Serie 18 | | Brazil | | Real | | 14.69% | | 14.91% | | | 1,011,209 | | | | 3,033,627 | | | | 4,044,836 | | | | 12,571,319 | | | | 11,223,040 | | | | 9,874,762 | | | | - | | | | - | | | | 33,669,121 | | | | 2,077,536 | | | | 6,232,607 | | | | 8,310,143 | | | | 8,310,143 | | | | 30,018,631 | | | | 27,248,583 | | | | 24,478,536 | | | | - | | | | 90,055,893 | |
| Foreign | | Ampla Energía S.A. | | Brazil | | Bonos 2ª Serie 26 | | Brazil | | Real | | 13.55% | | 18.97% | | | 1,632,773 | | | | 18,770,248 | | | | 20,403,021 | | | | 18,225,996 | | | | 16,048,964 | | | | - | | | | - | | | | - | | | | 34,274,960 | | | | 1,867,488 | | | | 5,602,465 | | | | 7,469,953 | | | | 23,248,180 | | | | 20,758,200 | | | | 18,268,216 | | | | - | | | | - | | | | 62,274,596 | |
| Foreign | | Ampla Energía S.A. | | Brazil | | Bonos 2ª Serie 27 | | Brazil | | Real | | 15.35% | | 16.89% | | | 2,737,659 | | | | 8,212,977 | | | | 10,950,636 | | | | 32,485,454 | | | | 28,835,249 | | | | 25,185,037 | | | | - | | | | - | | | | 86,505,740 | | | | 2,521,703 | | | | 7,565,110 | | | | 10,086,813 | | | | 10,086,813 | | | | 34,986,514 | | | | 31,624,249 | | | | 28,261,978 | | | | - | | | | 104,959,554 | |
| Foreign | | Ampla Energía S.A. | | Brazil | | Bonos 2ª Serie 28 | | Brazil | | Real | | 14.69% | | 14.91% | | | 1,011,209 | | | | 3,033,627 | | | | 4,044,836 | | | | 12,571,319 | | | | 11,223,040 | | | | 9,874,762 | | | | - | | | | - | | | | 33,669,121 | | | | - | | | | - | | | | - | | | | - | | | | - | | | | - | | | | - | | | | - | | | | - | |
| Foreign | | Codensa | | Colombia | | B102 | | Colombia | | $ Col | | 12.03% | | 11.52% | | | 2,285,586 | | | | 6,856,759 | | | | 9,142,345 | | | | 90,513,112 | | | | - | | | | - | | | | - | | | | - | | | | 90,513,112 | | | | 2,078,386 | | | | 6,235,159 | | | | 8,313,545 | | | | 8,313,545 | | | | 101,452,870 | | | | - | | | | - | | | | - | | | | 109,766,415 | |
| Foreign | | Codensa | | Colombia | | B103 | | Colombia | | $ Col | | 12.29% | | 11.76% | | | 475,081 | | | | 1,425,243 | | | | 1,900,324 | | | | 1,900,324 | | | | 19,928,937 | | | | - | | | | - | | | | - | | | | 21,829,261 | | | | 433,414 | | | | 1,300,241 | | | | 1,733,655 | | | | 1,733,654 | | | | 1,733,654 | | | | 22,040,062 | | | | - | | | | - | | | | 25,507,370 | |
| Foreign | | Codensa | | Colombia | | B604 | | Colombia | | $ Col | | 10.56% | | 10.17% | | | 33,159,237 | | | | - | | | | 33,159,237 | | | | - | | | | - | | | | - | | | | - | | | | - | | | | - | | | | 630,368 | | | | 1,891,104 | | | | 2,521,472 | | | | 37,225,610 | | | | - | | | | - | | | | - | | | | - | | | | 37,225,610 | |
| Foreign | | Codensa | | Colombia | | Bonos B12-13 | | Colombia | | $ Col | | 11.50% | | 11.03% | | | 1,060,598 | | | | 3,181,795 | | | | 4,242,393 | | | | 4,242,394 | | | | 4,242,394 | | | | 4,242,394 | | | | 4,242,394 | | | | 64,429,087 | | | | 81,398,663 | | | | 946,989 | | | | 2,840,966 | | | | 3,787,955 | | | | 3,787,954 | | | | 3,787,954 | | | | 3,787,954 | | | | 3,787,954 | | | | 71,487,573 | | | | 86,639,389 | |
| Foreign | | Codensa | | Colombia | | Bonos B5-13 | | Colombia | | $ Col | | 10.56% | | 10.17% | | | 907,996 | | | | 2,723,989 | | | | 3,631,985 | | | | 3,631,986 | | | | 44,267,794 | | | | - | | | | - | | | | - | | | | 47,899,780 | | | | 790,923 | | | | 2,372,770 | | | | 3,163,693 | | | | 3,163,694 | | | | 3,163,694 | | | | 49,010,829 | | | | - | | | | - | | | | 55,338,217 | |
| Foreign | | Codensa | | Colombia | | Bonos B7-14 | | Colombia | | $ Col | | 10.15% | | 9.78% | | | 881,572 | | | | 2,644,715 | | | | 3,526,287 | | | | 3,526,287 | | | | 3,526,287 | | | | 3,526,287 | | | | 3,526,287 | | | | 44,335,883 | | | | 58,441,031 | | | | 834,666 | | | | 2,503,998 | | | | 3,338,664 | | | | 3,338,664 | | | | 3,338,664 | | | | 3,338,664 | | | | 3,338,664 | | | | 52,801,231 | | | | 66,155,887 | |
| Foreign | | Coelce S.A. | | Brazil | | Itaú 1 | | Brazil | | Real | | 13.77% | | 13.99% | | | 325,485 | | | | 10,211,261 | | | | 10,536,746 | | | | - | | | | - | | | | - | | | | - | | | | - | | | | - | | | | 686,017 | | | | 13,717,969 | | | | 14,403,986 | | | | 13,031,952 | | | | - | | | | - | | | | - | | | | - | | | | 13,031,952 | |
| Foreign | | Coelce S.A. | | Brazil | | Itaú 2 | | Brazil | | Real | | 17.07% | | 17.79% | | | 3,061,416 | | | | 32,410,040 | | | | 35,471,456 | | | | 31,389,881 | | | | 27,313,531 | | | | - | | | | - | | | | - | | | | 58,703,412 | | | | 2,748,139 | | | | 8,244,417 | | | | 10,992,556 | | | | 37,583,968 | | | | 33,920,086 | | | | 30,262,820 | | | | - | | | | - | | | | 101,766,874 | |
| Foreign | | Edegel S.A.A | | Peru | | Banco Continental | | Peru | | Peruvian nuevo sol | | 6.41% | | 6.31% | | | 82,046 | | | | 246,137 | | | | 328,183 | | | | 328,182 | | | | 328,182 | | | | 328,182 | | | | 328,182 | | | | 5,691,198 | | | | 7,003,926 | | | | 80,157 | | | | 240,472 | | | | 320,629 | | | | 320,629 | | | | 320,629 | | | | 320,629 | | | | 320,629 | | | | 5,880,850 | | | | 7,163,366 | |
| Foreign | | Edegel S.A.A | | Peru | | Banco Continental | | Peru | | Peruvian nuevo sol | | 6.38% | | 6.28% | | | 82,320 | | | | 246,959 | | | | 329,279 | | | | 329,279 | | | | 329,279 | | | | 5,391,004 | | | | - | | | | - | | | | 6,049,562 | | | | 79,761 | | | | 239,282 | | | | 319,043 | | | | 319,042 | | | | 319,042 | | | | 319,042 | | | | 5,265,385 | | | | - | | | | 6,222,511 | |
| Foreign | | Edegel S.A.A | | Peru | | Banco Continental | | Peru | | US$ | | 6.44% | | 6.34% | | | 105,486 | | | | 316,458 | | | | 421,944 | | | | 421,944 | | | | 421,944 | | | | 421,944 | | | | 421,944 | | | | 10,086,341 | | | | 11,774,117 | | | | 91,749 | | | | 275,246 | | | | 366,995 | | | | 366,994 | | | | 366,994 | | | | 366,994 | | | | 366,994 | | | | 9,039,318 | | | | 10,507,294 | |
| Foreign | | Edegel S.A.A | | Peru | | Banco Continental | | Peru | | US$ | | 7.93% | | 7.78% | | | 105,659 | | | | 316,978 | | | | 422,637 | | | | 422,637 | | | | 422,637 | | | | 5,831,097 | | | | - | | | | - | | | | 6,676,371 | | | | 91,899 | | | | 275,698 | | | | 367,597 | | | | 367,597 | | | | 367,597 | | | | 367,597 | | | | 4,989,668 | | | | - | | | | 6,092,459 | |
| Foreign | | Edegel S.A.A | | Peru | | Banco Continental | | Peru | | US$ | | 7.25% | | 7.13% | | | - | | | | - | | | | - | | | | - | | | | - | | | | - | | | | - | | | | - | | | | - | | | | 3,881,082 | | | | - | | | | 3,881,082 | | | | - | | | | - | | | | - | | | | - | | | | - | | | | - | |
| Foreign | | Edegel S.A.A | | Peru | | Banco Scotiabank | | Peru | | US$ | | 6.73% | | 6.63% | | | 110,163 | | | | 7,244,456 | | | | 7,354,619 | | | | - | | | | - | | | | - | | | | - | | | | - | | | | - | | | | 95,816 | | | | 287,449 | | | | 383,265 | | | | 6,296,355 | | | | - | | | | - | | | | - | | | | - | | | | 6,296,355 | |
| Foreign | | Edegel S.A.A | | Peru | | Banco Scotiabank | | Peru | | US$ | | 6.09% | | 6.00% | | | 99,770 | | | | 7,297,112 | | | | 7,396,882 | | | | - | | | | - | | | | - | | | | - | | | | - | | | | - | | | | 86,777 | | | | 260,331 | | | | 347,108 | | | | 6,333,114 | | | | - | | | | - | | | | - | | | | - | | | | 6,333,114 | |
| Foreign | | Edegel S.A.A | | Peru | | Banco Scotiabank | | Peru | | US$ | | 5.86% | | 5.78% | | | 96,133 | | | | 288,398 | | | | 384,531 | | | | 384,530 | | | | 384,530 | | | | 384,530 | | | | 7,385,970 | | | | - | | | | 8,539,560 | | | | 93,556 | | | | 280,669 | | | | 374,225 | | | | 374,225 | | | | 374,225 | | | | 6,103,969 | | | | - | | | | - | | | | 6,852,419 | |
| Foreign | | Edegel S.A.A | | Peru | | Banco Scotiabank | | Peru | | US$ | | 6.57% | | 6.47% | | | 107,564 | | | | 322,693 | | | | 430,257 | | | | 430,258 | | | | 7,133,427 | | | | - | | | | - | | | | - | | | | 7,563,685 | | | | 83,613 | | | | 250,839 | | | | 334,452 | | | | 334,453 | | | | 334,453 | | | | 334,453 | | | | 334,453 | | | | 6,323,623 | | | | 7,661,435 | |
| Foreign | | Edelnor S.A.A. | | Peru | | AFP Horizonte | | Peru | | Peruvian nuevo sol | | 7.22% | | 7.09% | | | 56,529 | | | | 3,213,571 | | | | 3,270,100 | | | | - | | | | - | | | | - | | | | - | | | | - | | | | - | | | | 55,213 | | | | 165,638 | | | | 220,851 | | | | 3,194,800 | | | | - | | | | - | | | | - | | | | - | | | | 3,194,800 | |
| Foreign | | Edelnor S.A.A. | | Peru | | AFP Integra | | Peru | | Peruvian nuevo sol | | 8.16% | | 8.00% | | | 3,768,393 | | | | - | | | | 3,768,393 | | | | - | | | | - | | | | - | | | | - | | | | - | | | | - | | | | 60,213 | | | | 4,083,492 | | | | 4,143,705 | | | | - | | | | - | | | | - | | | | - | | | | - | | | | - | |
| Foreign | | Edelnor S.A.A. | | Peru | | AFP Integra | | Peru | | Peruvian nuevo sol | | 8.00% | | 7.85% | | | 5,732,006 | | | | - | | | | 5,732,006 | | | | - | | | | - | | | | - | | | | - | | | | - | | | | - | | | | 75,819 | | | | 227,458 | | | | 303,277 | | | | 3,682,353 | | | | - | | | | - | | | | - | | | | - | | | | 3,682,353 | |
| Foreign | | Edelnor S.A.A. | | Peru | | AFP Integra | | Peru | | Peruvian nuevo sol | | 5.91% | | 5.82% | | | - | | | | - | | | | - | | | | - | | | | - | | | | - | | | | - | | | | - | | | | - | | | | 110,739 | | | | 332,216 | | | | 442,955 | | | | 5,600,079 | | | | - | | | | - | | | | - | | | | - | | | | 5,600,079 | |
| Foreign | | Edelnor S.A.A. | | Peru | | AFP Prima | | Peru | | Peruvian nuevo sol | | 6.63% | | 6.52% | | | - | | | | - | | | | - | | | | - | | | | - | | | | - | | | | - | | | | - | | | | - | | | | 141,246 | | | | 8,362,253 | | | | 8,503,499 | | | | - | | | | - | | | | - | | | | - | | | | - | | | | - | |
| Foreign | | Edelnor S.A.A. | | Peru | | AFP Prima | | Peru | | Peruvian nuevo sol | | 6.94% | | 6.82% | | | - | | | | - | | | | - | | | | - | | | | - | | | | - | | | | - | | | | - | | | | - | | | | 90,771 | | | | 272,312 | | | | 363,083 | | | | 5,260,818 | | | | - | | | | - | | | | - | | | | - | | | | 5,260,818 | |
| Foreign | | Edelnor S.A.A. | | Peru | | AFP Prima | | Peru | | Peruvian nuevo sol | | 7.13% | | 7.00% | | | 92,940 | | | | 5,291,865 | | | | 5,384,805 | | | | - | | | | - | | | | - | | | | - | | | | - | | | | - | | | | 67,470 | | | | 4,085,912 | | | | 4,153,382 | | | | - | | | | - | | | | - | | | | - | | | | - | | | | - | |
| Foreign | | Edelnor S.A.A. | | Peru | | AFP Prima | | Peru | | Peruvian nuevo sol | | 7.44% | | 7.30% | | | 116,196 | | | | 348,588 | | | | 464,784 | | | | 464,783 | | | | 464,783 | | | | 464,783 | | | | 6,548,565 | | | | - | | | | 7,942,914 | | | | 113,501 | | | | 340,502 | | | | 454,003 | | | | 454,003 | | | | 454,003 | | | | 454,003 | | | | 454,003 | | | | 6,397,801 | | | | 8,213,813 | |
| Foreign | | Edelnor S.A.A. | | Peru | | AFP Profuturo | | Peru | | Peruvian nuevo sol | | 8.06% | | 7.91% | | | - | | | | - | | | | - | | | | - | | | | - | | | | - | | | | - | | | | - | | | | - | | | | 5,163,298 | | | | - | | | | 5,163,298 | | | | - | | | | - | | | | - | | | | - | | | | - | | | | - | |
| Foreign | | Edelnor S.A.A. | | Peru | | FCR - Macrofondo | | Peru | | Peruvian nuevo sol | | 5.56% | | 5.49% | | | 145,245 | | | | 435,735 | | | | 580,980 | | | | 580,980 | | | | 580,980 | | | | 580,980 | | | | 580,980 | | | | 11,366,149 | | | | 13,690,069 | | | | 141,902 | | | | 425,707 | | | | 567,609 | | | | 567,609 | | | | 567,609 | | | | 567,609 | | | | 567,609 | | | | 11,672,179 | | | | 13,942,615 | |
| Foreign | | Edelnor S.A.A. | | Peru | | FCR - Macrofondo | | Peru | | Peruvian nuevo sol | | 7.03% | | 6.91% | | | 73,305 | | | | 219,914 | | | | 293,219 | | | | 293,219 | | | | 293,219 | | | | 4,183,575 | | | | - | | | | - | | | | 4,770,013 | | | | 71,597 | | | | 214,790 | | | | 286,387 | | | | 286,387 | | | | 286,387 | | | | 286,387 | | | | 4,087,287 | | | | - | | | | 4,946,448 | |
| Foreign | | Edelnor S.A.A. | | Peru | | Fondo -Fosersoe | | Peru | | Peruvian nuevo sol | | 8.75% | | 8.57% | | | - | | | | - | | | | - | | | | - | | | | - | | | | - | | | | - | | | | - | | | | - | | | | 133,501 | | | | 6,228,634 | | | | 6,362,135 | | | | - | | | | - | | | | - | | | | - | | | | - | | | | - | |
| Foreign | | Edelnor S.A.A. | | Peru | | Interseguro Cia de Seguros | | Peru | | Peruvian nuevo sol | | 6.28% | | 6.19% | | | 131,143 | | | | 393,429 | | | | 524,572 | | | | 524,572 | | | | 524,572 | | | | 524,572 | | | | 524,572 | | | | 9,017,708 | | | | 11,115,996 | | | | 128,125 | | | | 384,374 | | | | 512,499 | | | | 512,499 | | | | 512,499 | | | | 512,499 | | | | 512,499 | | | | 9,322,674 | | | | 11,372,670 | |
| Foreign | | Edelnor S.A.A. | | Peru | | Rimac Internacional | | Peru | | Peruvian nuevo sol | | 6.06% | | 5.97% | | | 158,242 | | | | 474,727 | | | | 632,969 | | | | 632,969 | | | | 632,969 | | | | 632,969 | | | | 632,969 | | | | 17,624,247 | | | | 20,156,123 | | | | 154,600 | | | | 463,801 | | | | 618,401 | | | | 618,402 | | | | 618,402 | | | | 618,402 | | | | 618,402 | | | | 14,100,867 | | | | 16,574,475 | |
| Foreign | | Edelnor S.A.A. | | Peru | | Rimac Internacional | | Peru | | Peruvian nuevo sol | | 6.50% | | 6.40% | | | 133,872 | | | | 401,617 | | | | 535,489 | | | | 535,489 | | | | 535,489 | | | | 535,489 | | | | 535,489 | | | | 16,868,345 | | | | 19,010,301 | | | | 130,791 | | | | 392,374 | | | | 523,165 | | | | 523,166 | | | | 523,166 | | | | 523,166 | | | | 523,166 | | | | 13,871,576 | | | | 15,964,240 | |
| Foreign | | Edelnor S.A.A. | | Peru | | Rimac Internacional | | Peru | | Peruvian nuevo sol | | 7.06% | | 6.94% | | | 104,498 | | | | 313,495 | | | | 417,993 | | | | 417,994 | | | | 417,994 | | | | 417,994 | | | | 417,994 | | | | 10,373,415 | | | | 12,045,391 | | | | 102,093 | | | | 306,280 | | | | 408,373 | | | | 408,374 | | | | 408,374 | | | | 408,374 | | | | 408,374 | | | | 10,543,055 | | | | 12,176,551 | |
| Foreign | | Edelnor S.A.A. | | Peru | | Rimac Internacional | | Peru | | Peruvian nuevo sol | | 5.00% | | 4.94% | | | 110,347 | | | | 331,041 | | | | 441,388 | | | | 6,385,839 | | | | - | | | | - | | | | - | | | | - | | | | 6,385,839 | | | | 107,787 | | | | 323,360 | | | | 431,147 | | | | 431,146 | | | | 6,238,848 | | | | - | | | | - | | | | - | | | | 6,669,994 | |
| Foreign | | Edelnor S.A.A. | | Peru | | Rimac Internacional | | Peru | | Peruvian nuevo sol | | 5.13% | | 5.06% | | | 67,781 | | | | 203,343 | | | | 271,124 | | | | 4,407,670 | | | | - | | | | - | | | | - | | | | - | | | | 4,407,670 | | | | 66,200 | | | | 198,600 | | | | 264,800 | | | | 264,800 | | | | 4,306,155 | | | | - | | | | - | | | | - | | | | 4,570,955 | |
| Foreign | | Edelnor S.A.A. | | Peru | | Rimac Internacional | | Peru | | Peruvian nuevo sol | | 6.75% | | 6.64% | | | 175,558 | | | | 526,675 | | | | 702,233 | | | | 702,233 | | | | 702,233 | | | | 702,233 | | | | 10,866,005 | | | | - | | | | 12,972,704 | | | | 171,606 | | | | 514,819 | | | | 686,425 | | | | 686,425 | | | | 686,425 | | | | 686,425 | | | | 686,425 | | | | 10,616,171 | | | | 13,361,871 | |
| Foreign | | Edelnor S.A.A. | | Peru | | Rimac Internacional | | Peru | | Peruvian nuevo sol | | 7.28% | | 7.15% | | | 134,479 | | | | 403,436 | | | | 537,915 | | | | 537,915 | | | | 537,915 | | | | 537,915 | | | | 537,915 | | | | 14,287,204 | | | | 16,438,864 | | | | 131,472 | | | | 394,416 | | | | 525,888 | | | | 525,889 | | | | 525,889 | | | | 525,889 | | | | 525,889 | | | | 13,962,937 | | | | 16,066,493 | |
| Foreign | | Edelnor S.A.A. | | Peru | | Rimac Internacional | | Peru | | Peruvian nuevo sol | | 6.50% | | 6.40% | | | 169,060 | | | | 507,179 | | | | 676,239 | | | | 676,238 | | | | 676,238 | | | | 676,238 | | | | 11,017,735 | | | | - | | | | 13,046,449 | | | | 165,257 | | | | 495,772 | | | | 661,029 | | | | 661,029 | | | | 661,029 | | | | 661,029 | | | | 661,029 | | | | 10,764,497 | | | | 13,408,613 | |
| Foreign | | Edelnor S.A.A. | | Peru | | Rimac Internacional | | Peru | | Peruvian nuevo sol | | 7.38% | | 7.24% | | | 230,147 | | | | 690,441 | | | | 920,588 | | | | 920,588 | | | | 920,588 | | | | 920,588 | | | | 920,588 | | | | 24,598,494 | | | | 28,280,846 | | | | 224,939 | | | | 674,816 | | | | 899,755 | | | | 899,755 | | | | 899,755 | | | | 899,755 | | | | 899,755 | | | | 24,037,040 | | | | 27,636,060 | |
| Foreign | | Edelnor S.A.A. | | Peru | | Rimac Internacional | | Peru | | Peruvian nuevo sol | | 6.78% | | 6.67% | | | 352,647 | | | | 1,057,940 | | | | 1,410,587 | | | | 1,410,587 | | | | 1,410,587 | | | | 1,410,587 | | | | 1,410,587 | | | | 21,265,895 | | | | 26,908,243 | | | | 345,808 | | | | 1,037,423 | | | | 1,383,231 | | | | 1,383,230 | | | | 1,383,230 | | | | 1,383,230 | | | | 1,383,230 | | | | 22,161,415 | | | | 27,694,335 | |
| Foreign | | Edelnor S.A.A. | | Peru | | Rimac Internacional | | Peru | | Peruvian nuevo sol | | 6.34% | | 6.25% | | | 197,979 | | | | 593,936 | | | | 791,915 | | | | 791,915 | | | | 791,915 | | | | 791,915 | | | | 791,915 | | | | 14,457,206 | | | | 17,624,866 | | | | 194,336 | | | | 583,009 | | | | 777,345 | | | | 777,345 | | | | 777,345 | | | | 777,345 | | | | 777,345 | | | | 14,910,973 | | | | 18,020,353 | |
| Foreign | | Edelnor S.A.A. | | Peru | | Rimac Internacional | | Peru | | Peruvian nuevo sol | | 5.84% | | 5.76% | | | 303,907 | | | | 911,720 | | | | 1,215,627 | | | | 1,215,627 | | | | 1,215,627 | | | | 21,403,513 | | | | - | | | | - | | | | 23,834,767 | | | | 299,678 | | | | 899,035 | | | | 1,198,713 | | | | 1,198,713 | | | | 1,198,713 | | | | 1,198,713 | | | | 20,916,464 | | | | - | | | | 24,512,603 | |
| Foreign | | Edelnor S.A.A. | | Peru | | Rimac Internacional | | Peru | | Peruvian nuevo sol | | 6.34% | | 6.25% | | | 263,940 | | | | 791,820 | | | | 1,055,760 | | | | 1,055,760 | | | | 1,055,760 | | | | 1,055,760 | | | | 1,055,760 | | | | 20,595,659 | | | | 24,818,699 | | | | 262,032 | | | | 786,096 | | | | 1,048,128 | | | | 1,048,128 | | | | 1,048,128 | | | | 1,048,128 | | | | 1,048,128 | | | | 21,232,292 | | | | 25,424,804 | |
| Foreign | | Edelnor S.A.A. | | Peru | | Rimac Internacional | | Peru | | Peruvian nuevo sol | | 4.81% | | 4.76% | | | 122,692 | | | | 368,075 | | | | 490,767 | | | | 10,557,968 | | | | - | | | | - | | | | - | | | | - | | | | 10,557,968 | | | | 122,598 | | | | 367,794 | | | | 490,392 | | | | 490,391 | | | | 10,323,176 | | | | - | | | | - | | | | - | | | | 10,813,567 | |
| Foreign | | Edelnor S.A.A. | | Peru | | Rimac Internacional | | Peru | | Peruvian nuevo sol | | 6.13% | | 6.03% | | | 224,521 | | | | 673,563 | | | | 898,084 | | | | 898,085 | | | | 898,085 | | | | 15,080,872 | | | | - | | | | - | | | | 16,877,042 | | | | - | | | | - | | | | - | | | | - | | | | - | | | | - | | | | - | | | | - | | | | - | |
| | |
| The accompanying notes are an integral part of these consolidated financial statements | | |
|
| F-192 |
e. Secured and unsecured liabilities by company
| | | | | | | | | | | | | | | | | | | | | | | | | | | | | | | | | | | | | | | | | | | | | | | | | | | | | | | | | | | | | | | | | | | | | | | | | | | | | | | | | | | | | | | | | | |
Tax ID
Number | | Company | | Country | | Financial Institution | | Country | | Currency | | Effective
interest
rate | | | Nominal
interest
rate | | | December 31, 2015 | | | December 31, 2014 | |
| | | | | | | | | | Current | | | | Non-current | | | | Current | | | | Non-current | |
| | | | | | | | |
| Less than
90 days |
| |
| More than
90 days |
| |
| Total
Current |
| |
| One to
two years |
| |
| Two to
three years |
| |
| Three to
four years |
| |
| Four to
five years |
| |
| More than
five years |
| |
| Total Non-
current |
| |
| Less than
90 days |
| |
| More than
90 days |
| |
| Total
Current |
| |
| One to
two years |
| |
| Two to
three years |
| |
| Three to
four years |
| |
| Three to
four years |
| |
| More than
five years |
| |
| Total Non-
current |
|
| Foreign | | Emgesa S.A. E.S.P. | | Colombia | | Bonos A-10 | | Colombia | | $ Col | | | 8.87 | % | | | 8.59 | % | | | - | | | | - | | | | - | | | | - | | | | - | | | | - | | | | - | | | | - | | | | - | | | | 53,979,516 | | | | - | | | | 53,979,516 | | | | - | | | | - | | | | - | | | | - | | | | - | | | | - | |
| Foreign | | Emgesa S.A. E.S.P. | | Colombia | | Bonos A102 | | Colombia | | $ Col | | | 8.87 | % | | | 8.59 | % | | | - | | | | - | | | | - | | | | - | | | | - | | | | - | | | | - | | | | - | | | | - | | | | 10,281,812 | | | | - | | | | 10,281,812 | | | | - | | | | - | | | | - | | | | - | | | | - | | | | - | |
| Foreign | | Emgesa S.A. E.S.P. | | Colombia | | Bonos B09-09 | | Colombia | | $ Col | | | 12.67 | % | | | 12.11 | % | | | 1,318,361 | | | | 3,955,083 | | | | 5,273,444 | | | | 5,273,444 | | | | 52,249,218 | | | | - | | | | - | | | | - | | | | 57,522,662 | | | | 1,213,148 | | | | 3,639,445 | | | | 4,852,593 | | | | 4,852,593 | | | | 4,852,593 | | | | 58,216,407 | | | | - | | | | - | | | | 67,921,593 | |
| Foreign | | Emgesa S.A. E.S.P. | | Colombia | | Bonos B10 | | Colombia | | $ Col | | | 12.54 | % | | | 11.99 | % | | | 966,592 | | | | 2,899,777 | | | | 3,866,369 | | | | 3,866,370 | | | | 3,866,370 | | | | 36,715,143 | | | | - | | | | - | | | | 44,447,883 | | | | 882,562 | | | | 2,647,687 | | | | 3,530,249 | | | | 3,530,250 | | | | 3,530,250 | | | | 3,530,250 | | | | 41,216,421 | | | | - | | | | 51,807,171 | |
| Foreign | | Emgesa S.A. E.S.P. | | Colombia | | Bonos B-103 | | Colombia | | $ Col | | | 11.87 | % | | | 11.87 | % | | | 1,116,102 | | | | 3,348,305 | | | | 4,464,407 | | | | 39,054,871 | | | | - | | | | - | | | | - | | | | - | | | | 39,054,871 | | | | 982,211 | | | | 2,946,634 | | | | 3,928,845 | | | | 3,928,846 | | | | 43,805,925 | | | | - | | | | - | | | | - | | | | 47,734,771 | |
| Foreign | | Emgesa S.A. E.S.P. | | Colombia | | Bonos B12 | | Colombia | | $ Col | | | 12.88 | % | | | 12.30 | % | | | 551,017 | | | | 1,653,050 | | | | 2,204,067 | | | | 2,204,066 | | | | 2,204,066 | | | | 2,204,066 | | | | 2,204,066 | | | | 21,473,245 | | | | 30,289,509 | | | | 509,006 | | | | 1,527,019 | | | | 2,036,025 | | | | 2,036,026 | | | | 2,036,026 | | | | 2,036,026 | | | | 2,036,026 | | | | 25,961,808 | | | | 34,105,912 | |
| Foreign | | Emgesa S.A. E.S.P. | | Colombia | | Bonos B15 | | Colombia | | $ Col | | | 12.87 | % | | | 12.29 | % | | | 344,557 | | | | 1,033,670 | | | | 1,378,227 | | | | 1,378,226 | | | | 1,378,226 | | | | 1,378,226 | | | | 1,378,226 | | | | 16,871,733 | | | | 22,384,637 | | | | 316,557 | | | | 949,671 | | | | 1,266,228 | | | | 1,266,228 | | | | 1,266,228 | | | | 1,266,228 | | | | 1,266,228 | | | | 19,363,519 | | | | 24,428,431 | |
| Foreign | | Emgesa S.A. E.S.P. | | Colombia | | Bonos B6-13 | | Colombia | | $ Col | | | 10.91 | % | | | 10.49 | % | | | 258,219 | | | | 774,658 | | | | 1,032,877 | | | | 1,032,878 | | | | 1,032,878 | | | | 11,916,341 | | | | - | | | | - | | | | 13,982,097 | | | | 228,103 | | | | 684,309 | | | | 912,412 | | | | 912,412 | | | | 912,412 | | | | 912,412 | | | | 13,233,669 | | | | - | | | | 15,970,905 | |
| Foreign | | Emgesa S.A. E.S.P. | | Colombia | | Bonos B6-14 | | Colombia | | $ Col | | | 10.03 | % | | | 9.67 | % | | | 518,847 | | | | 1,556,541 | | | | 2,075,388 | | | | 2,075,389 | | | | 2,075,389 | | | | 2,075,389 | | | | 25,654,089 | | | | - | | | | 31,880,256 | | | | 453,662 | | | | 1,360,986 | | | | 1,814,648 | | | | 1,814,647 | | | | 1,814,647 | | | | 1,814,647 | | | | 1,814,647 | | | | 28,677,414 | | | | 35,936,002 | |
| Foreign | | Emgesa S.A. E.S.P. | | Colombia | | Bonos exterior | | Colombia | | $ Col | | | 10.17 | % | | | 10.17 | % | | | 515,898 | | | | 1,547,693 | | | | 2,063,591 | | | | 2,063,591 | | | | 2,063,591 | | | | 2,063,591 | | | | 2,063,591 | | | | 20,454,156 | | | | 28,708,520 | | | | 581,078 | | | | 1,743,234 | | | | 2,324,312 | | | | 2,324,312 | | | | 2,324,312 | | | | 2,324,312 | | | | 2,324,312 | | | | 25,362,714 | | | | 34,659,962 | |
| Foreign | | Emgesa S.A. E.S.P. | | Colombia | | Bonos quimbo | | Colombia | | $ Col | | | 10.17 | % | | | 10.17 | % | | | 3,707,356 | | | | 11,122,068 | | | | 14,829,424 | | | | 14,829,424 | | | | 14,829,424 | | | | 14,829,424 | | | | 14,829,424 | | | | 146,988,109 | | | | 206,305,805 | | | | 4,175,756 | | | | 12,527,267 | | | | 16,703,023 | | | | 16,703,023 | | | | 16,703,023 | | | | 16,703,023 | | | | 16,703,023 | | | | 182,262,097 | | | | 249,074,189 | |
| Foreign | | Emgesa S.A. E.S.P. | | Colombia | | Bonos Quimbo B10 | | Colombia | | $ Col | | | 10.13 | % | | | 9.77 | % | | | 1,443,011 | | | | 4,329,034 | | | | 5,772,045 | | | | 5,772,045 | | | | 5,772,045 | | | | 5,772,045 | | | | 5,772,045 | | | | 79,151,390 | | | | 102,239,570 | | | | 1,246,095 | | | | 3,738,285 | | | | 4,984,380 | | | | 4,984,380 | | | | 4,984,380 | | | | 4,984,380 | | | | 4,984,380 | | | | 91,102,169 | | | | 111,039,689 | |
| Foreign | | Emgesa S.A. E.S.P. | | Colombia | | Bonos Quimbo B10-14 | | Colombia | | $ Col | | | 10.46 | % | | | 10.08 | % | | | 921,801 | | | | 2,765,403 | | | | 3,687,204 | | | | 3,687,204 | | | | 3,687,204 | | | | 3,687,204 | | | | 3,687,204 | | | | 54,611,375 | | | | 69,360,191 | | | | 816,008 | | | | 2,448,025 | | | | 3,264,033 | | | | 3,264,033 | | | | 3,264,033 | | | | 3,264,033 | | | | 3,264,033 | | | | 61,737,690 | | | | 74,793,822 | |
| Foreign | | Emgesa S.A. E.S.P. | | Colombia | | Bonos Quimbo B12-13 | | Colombia | | $ Col | | | 11.71 | % | | | 11.23 | % | | | 2,046,250 | | | | 6,138,749 | | | | 8,184,999 | | | | 8,184,998 | | | | 8,184,998 | | | | 8,184,998 | | | | 8,184,998 | | | | 120,690,336 | | | | 153,430,328 | | | | 1,843,223 | | | | 5,529,669 | | | | 7,372,892 | | | | 7,372,892 | | | | 7,372,892 | | | | 7,372,892 | | | | 7,372,892 | | | | 134,542,069 | | | | 164,033,637 | |
| Foreign | | Emgesa S.A. E.S.P. | | Colombia | | Bonos Quimbo B15 | | Colombia | | $ Col | | | 10.26 | % | | | 9.89 | % | | | 975,333 | | | | 2,925,998 | | | | 3,901,331 | | | | 3,901,331 | | | | 3,901,331 | | | | 3,901,331 | | | | 3,901,331 | | | | 72,380,849 | | | | 87,986,173 | | | | 845,671 | | | | 2,537,012 | | | | 3,382,683 | | | | 3,382,682 | | | | 3,382,682 | | | | 3,382,682 | | | | 3,382,682 | | | | 77,827,476 | | | | 91,358,204 | |
| Foreign | | Emgesa S.A. E.S.P. | | Colombia | | Bonos Quimbo B16-14 | | Colombia | | $ Col | | | 10.81 | % | | | 10.39 | % | | | 832,281 | | | | 2,496,844 | | | | 3,329,125 | | | | 3,329,126 | | | | 3,329,126 | | | | 3,329,126 | | | | 3,329,126 | | | | 67,969,888 | | | | 81,286,392 | | | | 743,130 | | | | 2,229,390 | | | | 2,972,520 | | | | 2,972,520 | | | | 2,972,520 | | | | 2,972,520 | | | | 2,972,520 | | | | 72,211,138 | | | | 84,101,218 | |
| Foreign | | Emgesa S.A. E.S.P. | | Colombia | | Bonos Quimbo B6-13 | | Colombia | | $ Col | | | 10.91 | % | | | 10.49 | % | | | 796,647 | | | | 2,389,940 | | | | 3,186,587 | | | | 3,186,587 | | | | 3,186,587 | | | | 36,763,745 | | | | - | | | | - | | | | 43,136,919 | | | | 703,731 | | | | 2,111,194 | | | | 2,814,925 | | | | 2,814,926 | | | | 2,814,926 | | | | 2,814,926 | | | | 40,827,900 | | | | - | | | | 49,272,678 | |
| Foreign | | Emgesa S.A. E.S.P. | | Colombia | | Bonos Quimbo B6-14 | | Colombia | | $ Col | | | 10.03 | % | | | 9.67 | % | | | 618,230 | | | | 1,854,690 | | | | 2,472,920 | | | | 2,472,920 | | | | 2,472,920 | | | | 2,472,920 | | | | 30,568,013 | | | | - | | | | 37,986,773 | | | | 540,559 | | | | 1,621,676 | | | | 2,162,235 | | | | 2,162,235 | | | | 2,162,235 | | | | 2,162,235 | | | | 2,162,235 | | | | 34,170,442 | | | | 42,819,382 | |
| 91.081.000-6 | | Endesa Chile S.A. | | Chile | | Banco Santander 522 Serie-M | | Chile | | U.F. | | | 4.82 | % | | | 4.75 | % | | | - | | | | - | | | | - | | | | - | | | | - | | | | - | | | | - | | | | - | | | | - | | | | 6,203,670 | | | | 18,611,010 | | | | 24,814,680 | | | | 24,814,680 | | | | 24,814,680 | | | | 24,814,680 | | | | 35,548,589 | | | | 355,689,165 | | | | 465,681,794 | |
| 91.081.000-6 | | Endesa Chile S.A. | | Chile | | Banco Santander -317 Serie-H | | Chile | | U.F. | | | 7.17 | % | | | 6.20 | % | | | - | | | | - | | | | - | | | | - | | | | - | | | | - | | | | - | | | | - | | | | - | | | | 2,174,007 | | | | 11,394,304 | | | | 13,568,311 | | | | 12,957,238 | | | | 12,346,166 | | | | 11,735,094 | | | | 11,124,022 | | | | 73,777,578 | | | | 121,940,098 | |
| 91.081.000-6 | | Endesa Chile S.A. | | Chile | | BNYMellon - 144 - A | | E.E.U.U. | | US$ | | | 8.83 | % | | | 8.63 | % | | | - | | | | - | | | | - | | | | - | | | | - | | | | - | | | | - | | | | - | | | | - | | | | 2,641,806 | | | | 124,978,079 | | | | 127,619,885 | | | | - | | | | - | | | | - | | | | - | | | | - | | | | - | |
| 91.081.000-6 | | Endesa Chile S.A. | | Chile | | BNY Mellon - Primera Emisión S-2 | | E.E.U.U. | | US$ | | | 7.40 | % | | | 7.33 | % | | | - | | | | - | | | | - | | | | - | | | | - | | | | - | | | | - | | | | - | | | | - | | | | 789,495 | | | | 2,368,484 | | | | 3,157,979 | | | | 3,157,979 | | | | 3,157,979 | | | | 3,157,979 | | | | 3,157,979 | | | | 77,747,246 | | | | 90,379,162 | |
| 91.081.000-6 | | Endesa Chile S.A. | | Chile | | BNY Mellon - Primera Emisión S-3 | | E.E.U.U. | | US$ | | | 8.26 | % | | | 8.13 | % | | | - | | | | - | | | | - | | | | - | | | | - | | | | - | | | | - | | | | - | | | | - | | | | 502,137 | | | | 1,506,412 | | | | 2,008,549 | | | | 2,008,549 | | | | 2,008,549 | | | | 2,008,549 | | | | 2,008,549 | | | | 168,757,572 | | | | 176,791,768 | |
| 91.081.000-6 | | Endesa Chile S.A. | | Chile | | BNY Mellon - Unica 24296 | | E.E.U.U. | | US$ | | | 4.32 | % | | | 4.25 | % | | | - | | | | - | | | | - | | | | - | | | | - | | | | - | | | | - | | | | - | | | | - | | | | 2,621,139 | | | | 7,863,416 | | | | 10,484,555 | | | | 10,484,554 | | | | 10,484,554 | | | | 10,484,554 | | | | 10,484,554 | | | | 290,965,550 | | | | 332,903,766 | |
| 91.081.000-6 | | Endesa Chile S.A. | | Chile | | BNY Mellon - Primera Emisión S-1 | | E.E.U.U. | | US$ | | | 7.96 | % | | | 7.88 | % | | | - | | | | - | | | | - | | | | - | | | | - | | | | - | | | | - | | | | - | | | | - | | | | 2,474,039 | | | | 7,422,118 | | | | 9,896,157 | | | | 9,896,157 | | | | 9,896,157 | | | | 9,896,157 | | | | 9,896,157 | | | | 195,949,534 | | | | 235,534,162 | |
| 94.271.000-3 | | Enersis S.A. | | Chile | | Bonos UF 269 | | Chile | | U.F. | | | 7.02 | % | | | 5.75 | % | | | 654,291 | | | | 5,230,040 | | | | 5,884,331 | | | | 5,728,780 | | | | 5,564,286 | | | | 5,390,333 | | | | 5,206,378 | | | | 7,441,327 | | | | 29,331,104 | | | | 790,690 | | | | 5,336,045 | | | | 6,126,735 | | | | 5,948,045 | | | | 5,759,080 | | | | 5,559,249 | | | | 5,347,928 | | | | 12,363,802 | | | | 34,978,104 | |
| 94.271.000-3 | | Enersis S.A. | | Chile | | Yankee bonos 2016 | | E.E.U.U. | | US$ | | | 7.76 | % | | | 7.40 | % | | | 3,005,941 | | | | 186,268,331 | | | | 189,274,272 | | | | - | | | | - | | | | - | | | | - | | | | - | | | | - | | | | 2,820,606 | | | | 8,461,818 | | | | 11,282,424 | | | | 162,940,478 | | | | - | | | | - | | | | - | | | | - | | | | 162,940,478 | |
| 94.271.000-3 | | Enersis S.A. | | Chile | | Yankee bonos 2026 | | E.E.U.U. | | US$ | | | 7.76 | % | | | 6.60 | % | | | 9,793 | | | | 29,378 | | | | 39,171 | | | | 39,170 | | | | 39,170 | | | | 39,170 | | | | 39,170 | | | | 843,993 | | | | 1,000,673 | | | | 8,643 | | | | 25,929 | | | | 34,572 | | | | 34,572 | | | | 34,572 | | | | 34,572 | | | | 34,572 | | | | 763,049 | | | | 901,337 | |
| | | | | | | | | | | | | | | | | | | | | | | | | | | | | | | | | | | | | | | | | | | | | | | | | | | | | | | | | | | | | | | | | | | | | | | | | | | | | | | | | | | | | | | | | | |
| | | | | | Total | | | | | | | | 83,809,574 | | | | 390,616,529 | | | | 474,426,103 | | | | 364,189,519 | | | | 303,125,018 | | | | 255,703,034 | | | | 158,563,512 | | | | 893,873,232 | | | | 1,975,454,315 | | | | 131,839,960 | | | | 346,297,475 | | | | 478,137,435 | | | | 518,136,414 | | | | 451,451,978 | | | | 385,392,822 | | | | 326,377,184 | | | | 2,258,358,104 | | | | 3,939,716,502 | |
| | |
| The accompanying notes are an integral part of these consolidated financial statements | | |
|
| F-193 |
c ) Financial lease obligations
Financial lease obligations by company
| | | | | | | | | | | | | | | | | | | | | | | | | | | | | | | | | | | | | | | | | | | | | | | | | | | | | | | | | | | | | | | | | | | | | | | | | | | | | | | | | | | | | | | | |
Tax ID
Number | | Company | | Country | | Tax ID Number
Creditor | | Financial Institution | | Country | | Currency | | Nominal
interest
rate | | | December 31, 2015 | | | December 31, 2014 | |
| | | | | | | | | Current | | | Non-current | | | Current | | | Non-current | |
| | | | | | | | | Less than 90 days | | | More than 90 days | | | Total Current | | | One to two years | | | Two to three years | | | Three to four years | | | Four to five years | | | More
than
five years | | | Total Non- current | | | Less than 90 days | | | More than 90 days | | | Total Current | | | One to two years | | | Two to three years | | | Three to four years | | | Four to five years | | | More than five years | | | Total Non- current | |
| Foreign | | Codensa | | Colombia | | Foreign | | Union Temporal Rentacol | | Colombia | | $ Col | | | 10.80 | % | | | 104,950 | | | | 284,704 | | | | 389,654 | | | | 309,519 | | | | - | | | | - | | | | - | | | | - | | | | 309,519 | | | | - | | | | - | | | | - | | | | - | | | | - | | | | - | | | | - | | | | - | | | | - | |
| Foreign | | Codensa | | Colombia | | Foreign | | Mareauto Colombia SAS | | Colombia | | $ Col | | | 10.08 | % | | | 3,894 | | | | 11,011 | | | | 14,905 | | | | 14,462 | | | | 6,468 | | | | - | | | | - | | | | - | | | | 20,930 | | | | - | | | | - | | | | - | | | | - | | | | - | | | | - | | | | - | | | | - | | | | - | |
| Foreign | | Codensa | | Colombia | | Foreign | | Banco Corpbanca | | Colombia | | $ Col | | | 7.27 | % | | | 24,433 | | | | 35,543 | | | | 59,976 | | | | 25,939 | | | | 13,636 | | | | - | | | | - | | | | - | | | | 39,575 | | | | - | | | | - | | | | - | | | | - | | | | - | | | | - | | | | - | | | | - | | | | - | |
| Foreign | | Edegel S.A.A. | | Peru | | Foreign | | Banco Scotiabank | | Peru | | US$ | | | 2.02 | % | | | - | | | | - | | | | - | | | | - | | | | - | | | | - | | | | - | | | | - | | | | - | | | | 2,250,920 | | | | 6,692,173 | | | | 8,943,093 | | | | 8,781,527 | | | | 13,384,629 | | | | - | | | | - | | | | - | | | | 22,166,156 | |
| Foreign | | Edelnor S.A.A. | | Peru | | Foreign | | Banco de Interbank | | Peru | | Peruvian nuevo sol | | | 6.13 | % | | | - | | | | - | | | | - | | | | - | | | | - | | | | - | | | | - | | | | - | | | | - | | | | 44,072 | | | | - | | | | 44,072 | | | | - | | | | - | | | | - | | | | - | | | | - | | | | - | |
| Foreign | | Edelnor S.A.A. | | Peru | | Foreign | | Banco Santander Peru | | Peru | | Peruvian nuevo sol | | | 5.79 | % | | | - | | | | - | | | | - | | | | - | | | | - | | | | - | | | | - | | | | - | | | | - | | | | 16,329 | | | | - | | | | 16,329 | | | | - | | | | - | | | | - | | | | - | | | | - | | | | - | |
| Foreign | | Edelnor S.A.A. | | Peru | | Foreign | | Banco de Crédito | | Peru | | Peruvian nuevo sol | | | 5.65 | % | | | - | | | | - | | | | - | | | | - | | | | - | | | | - | | | | - | | | | - | | | | - | | | | 29,359 | | | | 19,575 | | | | 48,934 | | | | - | | | | - | | | | - | | | | - | | | | - | | | | - | |
| Foreign | | Edelnor S.A.A. | | Peru | | Foreign | | Banco de Interbank | | Peru | | Peruvian nuevo sol | | | 5.29 | % | | | 111,240 | | | | - | | | | 111,240 | | | | - | | | | - | | | | - | | | | - | | | | - | | | | - | | | | 109,063 | | | | 326,675 | | | | 435,738 | | | | 108,717 | | | | - | | | | - | | | | - | | | | - | | | | 108,717 | |
| Foreign | | Edelnor S.A.A. | | Peru | | Foreign | | Banco Continental | | Peru | | Peruvian nuevo sol | | | 5.95 | % | | | 88,396 | | | | 181,920 | | | | 270,316 | | | | - | | | | - | | | | - | | | | - | | | | - | | | | - | | | | 87,951 | | | | 262,195 | | | | 350,146 | | | | 265,456 | | | | - | | | | - | | | | - | | | | - | | | | 265,456 | |
| Foreign | | Edelnor S.A.A. | | Peru | | Foreign | | Banco Continental | | Peru | | Peruvian nuevo sol | | | 6.00 | % | | | 81,772 | | | | 245,252 | | | | 327,024 | | | | - | | | | - | | | | - | | | | - | | | | - | | | | - | | | | 81,506 | | | | 243,250 | | | | 324,756 | | | | 321,384 | | | | - | | | | - | | | | - | | | | - | | | | 321,384 | |
| Foreign | | Edelnor S.A.A. | | Peru | | Foreign | | Banco Continental | | Peru | | Peruvian nuevo sol | | | 5.99 | % | | | 77,478 | | | | 232,058 | | | | 309,536 | | | | 12,127 | | | | - | | | | - | | | | - | | | | - | | | | 12,127 | | | | 76,296 | | | | 228,219 | | | | 304,515 | | | | 302,736 | | | | - | | | | - | | | | - | | | | - | | | | 302,736 | |
| Foreign | | Edelnor S.A.A. | | Peru | | Foreign | | Banco Continental | | Peru | | Peruvian nuevo sol | | | 5.98 | % | | | 68,777 | | | | 205,694 | | | | 274,471 | | | | 22,795 | | | | - | | | | - | | | | - | | | | - | | | | 22,795 | | | | 66,774 | | | | 200,287 | | | | 267,061 | | | | 266,963 | | | | - | | | | - | | | | - | | | | - | | | | 266,963 | |
| Foreign | | Edelnor S.A.A. | | Peru | | Foreign | | Banco Continental | | Peru | | Peruvian nuevo sol | | | 5.67 | % | | | 948 | | | | 2,845 | | | | 3,793 | | | | 70,687 | | | | - | | | | - | | | | - | | | | - | | | | 70,687 | | | | - | | | | - | | | | - | | | | - | | | | - | | | | - | | | | - | | | | - | | | | - | |
| Foreign | | Edelnor S.A.A. | | Peru | | Foreign | | Banco Santander Peru | | Peru | | Peruvian nuevo sol | | | 5.13 | % | | | 174,389 | | | | 519,118 | | | | 693,507 | | | | 682,380 | | | | - | | | | - | | | | - | | | | - | | | | 682,380 | | | | - | | | | - | | | | - | | | | - | | | | - | | | | - | | | | - | | | | - | | | | - | |
| Foreign | | EE Piura | | Peru | | Foreign | | Banco de Crédito | | Peru | | US$ | | | 5.80 | % | | | 1,905,026 | | | | 5,600,924 | | | | 7,505,950 | | | | 7,201,538 | | | | 6,897,126 | | | | 6,592,714 | | | | 14,774,124 | | | | - | | | | 35,465,502 | | | | 2,333,168 | | | | 6,862,462 | | | | 9,195,630 | | | | 8,830,188 | | | | 8,464,746 | | | | 8,099,305 | | | | 7,733,863 | | | | 17,273,508 | | | | 50,401,610 | |
| Foreign | | EE Piura | | Peru | | Foreign | | Banco de Crédito | | Peru | | Peruvian nuevo sol | | | 5.70 | % | | | 649,814 | | | | 1,909,231 | | | | 2,559,045 | | | | 2,451,818 | | | | 2,344,592 | | | | 2,237,365 | | | | 4,986,674 | | | | - | | | | 12,020,449 | | | | - | | | | - | | | | - | | | | - | | | | - | | | | - | | | | - | | | | - | | | | - | |
| Foreign | | Edegel S.A.A. | | Peru | | Foreign | | Banco Scotiabank | | Peru | | US$ | | | 2.10 | % | | | 2,584,782 | | | | 7,682,823 | | | | 10,267,605 | | | | 15,644,049 | | | | - | | | | - | | | | - | | | | - | | | | 15,644,049 | | | | - | | | | - | | | | - | | | | - | | | | - | | | | - | | | | - | | | | - | | | | - | |
| Foreign | | Emgesa S.A. E.S.P. | | Colombia | | Foreign | | Banco Corpbanca | | Colombia | | $ Col | | | 10.80 | % | | | 7,331 | | | | 21,099 | | | | 28,430 | | | | 27,912 | | | | 23,306 | | | | - | | | | - | | | | - | | | | 51,218 | | | | - | | | | - | | | | - | | | | - | | | | - | | | | - | | | | - | | | | - | | | | - | |
| Foreign | | Emgesa S.A. E.S.P. | | Colombia | | Foreign | | Equirent S.A. | | Colombia | | $ Col | | | 6.55 | % | | | 6,977 | | | | 20,183 | | | | 27,160 | | | | 27,731 | | | | 20,095 | | | | - | | | | - | | | | - | | | | 47,826 | | | | - | | | | - | | | | - | | | | - | | | | - | | | | - | | | | - | | | | - | | | | - | |
| 91.081.000-6 | | Endesa Chile S.A. | | Chile | | 87.509.100-K | | Abengoa Chile | | Chile | | US$ | | | 6.50 | % | | | - | | | | - | | | | - | | | | - | | | | - | | | | - | | | | - | | | | - | | | | - | | | | 652,199 | | | | 1,957,446 | | | | 2,609,645 | | | | 2,611,991 | | | | 2,614,490 | | | | 2,617,151 | | | | 2,619,984 | | | | 12,287,815 | | | | 22,751,431 | |
| | | | | | | | | | | | | | | | | | | | | | | | | | | | | | | | | | | | | | | | | | | | | | | | | | | | | | | | | | | | | | | | | | | | | | | | | | | | | | | | | | | | | | | | |
| | | | | | Totales | | | | 5,890,207 | | | | 16,952,405 | | | | 22,842,612 | | | | 26,490,957 | | | | 9,305,223 | | | | 8,830,079 | | | | 19,760,798 | | | | - | | | | 64,387,057 | | | | 5,747,637 | | | | 16,792,282 | | | | 22,539,919 | | | | 21,488,962 | | | | 24,463,865 | | | | 10,716,456 | | | | 10,353,847 | | | | 29,561,323 | | | | 96,584,453 | |
d ) Other liabilities
Other liabilities by company
| | | | | | | | | | | | | | | | | | | | | | | | | | | | | | | | | | | | | | | | | | | | | | | | | | | | | | | | | | | | | | | | | | | | | | | | | | | | | | | | | | | | | | | | |
Tax ID
Number | | Company | | Country | | Tax ID Number
Creditor | | Financial Institution | | Country | | Currency | | Nominal
interest
rate | | | December 31, 2015 | | | December 31, 2014 | |
| | | | | | | | | Current | | | Non-current | | | Current | | | Non-current | |
| | | | | | | | | Less than
90 days | | | More
than 90 days | | | Total
Current | | | One to
two years | | | Two to
three
years | | | Three to
four years | | | Four to
five years | | | More
than
five years | | | Total Non- current | | | Less than
90 days | | | More
than 90
days | | | Total
Current | | | One to
two years | | | Two to
three
years | | | Three to
four years | | | Four to
five years | | | More
than five years | | | Total Non- current | |
| Foreign | | Ampla Energía S.A. | | Brazil | | Foreign | | Eletrobrás | | Brazil | | Real | | | 6.57 | % | | | - | | | | - | | | | - | | | | - | | | | - | | | | - | | | | - | | | | - | | | | - | | | | 405,054 | | | | 1,185,145 | | | | 1,590,199 | | | | 1,476,915 | | | | 1,310,337 | | | | 923,887 | | | | 406,995 | | | | 569,694 | | | | 4,687,828 | |
| Foreign | | Ampla Energía S.A. | | Brazil | | Foreign | | BNDES | | Brazil | | Real | | | 9.17 | % | | | 7,170,765 | | | | 22,702,647 | | | | 29,873,412 | | | | 29,555,949 | | | | 23,816,520 | | | | 18,573,479 | | | | 12,754,861 | | | | 8,800,388 | | | | 93,501,197 | | | | 8,176,081 | | | | 23,832,151 | | | | 32,008,232 | | | | 30,151,983 | | | | 28,295,732 | | | | 22,101,795 | | | | 16,454,992 | | | | 16,008,608 | | | | 113,013,110 | |
| Foreign | | Cien S.A. | | Brazil | | Foreign | | Bndes | | Brazil | | Real | | | 8.33 | % | | | 298,586 | | | | 868,484 | | | | 1,167,070 | | | | 1,094,340 | | | | 1,021,609 | | | | 948,878 | | | | 447,165 | | | | - | | | | 3,511,992 | | | | 187,708 | | | | 548,354 | | | | 736,062 | | | | 696,676 | | | | 657,291 | | | | 617,907 | | | | 578,521 | | | | 274,492 | | | | 2,824,887 | |
| Foreign | | Coelce S.A. | | Brazil | | Foreign | | Banco do Nordeste | | Brazil | | Real | | | 7.85 | % | | | 1,200,204 | | | | 3,489,229 | | | | 4,689,433 | | | | 4,392,407 | | | | 4,095,381 | | | | 977,435 | | | | - | | | | - | | | | 9,465,223 | | | | 1,603,830 | | | | 4,671,101 | | | | 6,274,931 | | | | 5,900,564 | | | | 5,526,195 | | | | 5,151,828 | | | | 1,229,462 | | | | - | | | | 17,808,049 | |
| Foreign | | Coelce S.A. | | Brazil | | Foreign | | Eletrobras | | Brazil | | Real | | | 6.10 | % | | | 693,523 | | | | 1,569,329 | | | | 2,262,852 | | | | 1,878,520 | | | | 1,681,608 | | | | 1,485,719 | | | | 1,223,656 | | | | 1,609,492 | | | | 7,878,995 | | | | 795,871 | | | | 2,331,766 | | | | 3,127,637 | | | | 2,928,324 | | | | 2,610,994 | | | | 2,351,880 | | | | 2,094,052 | | | | 4,093,070 | | | | 14,078,320 | |
| Foreign | | Coelce S.A. | | Brazil | | Foreign | | BNDES | | Brazil | | Real | | | 10.43 | % | | | 2,314,061 | | | | 7,646,652 | | | | 9,960,713 | | | | 10,148,604 | | | | 9,382,994 | | | | 8,617,385 | | | | 5,533,315 | | | | 3,928,496 | | | | 37,610,794 | | | | 2,429,804 | | | | 7,097,903 | | | | 9,527,707 | | | | 9,017,025 | | | | 8,506,344 | | | | 7,995,663 | | | | 7,484,981 | | | | 6,508,647 | | | | 39,512,660 | |
| Foreign | | Coelce S.A. | | Brazil | | Foreign | | Banco do Brasil | | Brazil | | US$ | | | 52.56 | % | | | 20,770 | | | | 62,310 | | | | 83,080 | | | | 83,080 | | | | 83,079 | | | | 83,080 | | | | 83,080 | | | | 2,247,602 | | | | 2,579,921 | | | | 17,726 | | | | 53,177 | | | | 70,903 | | | | 70,902 | | | | 70,902 | | | | 70,902 | | | | 70,902 | | | | 1,993,373 | | | | 2,276,981 | |
| Foreign | | Coelce S.A. | | Brazil | | Foreign | | Banco do Brasil | | Brazil | | Real | | | 12.63 | % | | | - | | | | - | | | | - | | | | - | | | | - | | | | - | | | | - | | | | - | | | | - | | | | 1,963,184 | | | | 5,889,552 | | | | 7,852,736 | | | | 24,836,144 | | | | 22,872,959 | | | | 20,909,775 | | | | 18,946,591 | | | | - | | | | 87,565,469 | |
| Foreign | | Central Costanera S.A. | | Argentina | | Foreign | | Mitsubishi (deuda garantizada) | | Argentina | | US$ | | | 0.25 | % | | | 590,129 | | | | 1,768,176 | | | | 2,358,305 | | | | 5,810,613 | | | | 1,792,235 | | | | 1,883,493 | | | | 1,937,302 | | | | 23,273,695 | | | | 34,697,338 | | | | 9,523 | | | | 1,850,404 | | | | 1,859,927 | | | | 671,565 | | | | 670,617 | | | | 669,670 | | | | 808,784 | | | | 23,886,776 | | | | 26,707,412 | |
| Foreign | | Central Costanera S.A. | | Argentina | | Foreign | | Otros | | Argentina | | Ar$ | | | 17.29 | % | | | - | | | | - | | | | - | | | | - | | | | - | | | | - | | | | - | | | | - | | | | - | | | | 1,097,278 | | | | 1,294,252 | | | | 2,391,530 | | | | - | | | | - | | | | - | | | | - | | | | - | | | | - | |
| Foreign | | H. El Chocón S.A. | | Argentina | | Foreign | | Otros | | Argentina | | Ar$ | | | 23.59 | % | | | 2,347,678 | | | | 14,015,924 | | | | 16,363,602 | | | | 4,358,417 | | | | 681,224 | | | | - | | | | - | | | | - | | | | 5,039,641 | | | | 127,042 | | | | 381,125 | | | | 508,167 | | | | 7,769,157 | | | | 1,945,985 | | | | - | | | | - | | | | - | | | | 9,715,142 | |
| Foreign | | Hidroinvest S.A. | | Argentina | | Foreign | | Otros | | Argentina | | US$ | | | 2.53 | % | | | 898 | | | | 196,109 | | | | 197,007 | | | | - | | | | - | | | | - | | | | - | | | | - | | | | - | | | | 952 | | | | 168,039 | | | | 168,991 | | | | - | | | | - | | | | - | | | | - | | | | - | | | | - | |
| | | | | | | | | | | | | | | | | | | | | | | | | | | | | | | | | | | | | | | | | | | | | | | | | | | | | | | | | | | | | | | | | | | | | | | | | | | | | | | | | | | | | | | | |
| | | | | | Totales | | | | 14,636,614 | | | | 52,318,860 | | | | 66,955,474 | | | | 57,321,930 | | | | 42,554,650 | | | | 32,569,469 | | | | 21,979,379 | | | | 39,859,673 | | | | 194,285,101 | | | | 16,814,053 | | | | 49,302,969 | | | | 66,117,022 | | | | 83,519,255 | | | | 72,467,356 | | | | 60,793,307 | | | | 48,075,280 | | | | 53,334,660 | | | | 318,189,858 | |
| | |
| The accompanying notes are an integral part of these consolidated financial statements | | |
|
| F-194 |
APPENDIX 6 DETAILS OF ASSETS AND LIABILITIES IN FOREIGN CURRENCY:
This appendix forms an integral part of the Enersis Américas financial statements.
The detail of assets and liabilities denominated in foreign currencies is the following:
| | | | | | | | | | |
| ASSETS | | Foreign Currency | | Functional Currency | | 12-31-2015 ThCh$ | | | 12-31-2014 ThCh$ |
CURRENT ASSETS | | | | | | | | | | |
Cash and cash equivalents | | | | | | | 22,124,481 | | | 334,548,745 |
| | | U.S. dollar | | Chilean peso | | | 6,606,837 | | | 294,009,266 |
| | | U.S. dollar | | Colombian peso | | | 195,597 | | | 413,009 |
| | | U.S. dollar | | Peruvian nuevo sol | | | 14,024,599 | | | 28,750,530 |
| | | U.S. dollar | | Argentine peso | | | 1,297,448 | | | 1,058,646 |
| | | Argentine peso | | U.S. dollar | | | - | | | 4,206,734 |
| | | Chilean peso | | U.S. dollar | | | - | | | 6,110,560 |
| | | Argentine peso | | Chilean peso | | | - | | | - |
Current accounts receivable from related companies | | | | | | | - | | | 14,039,935 |
| | | U.S. dollar | | Chilean peso | | | - | | | 14,039,935 |
Total current assets other than assets classified as held for sale and discontinued operations | | | | | 22,124,481 | | | 348,588,680 |
| | | | | | | | | | |
TOTAL CURRENT ASSETS | | | | | 22,124,481 | | | 348,588,680 |
NON- CURRENT ASSETS | | | | | | | | | | |
Investments accounted for using the equity method | | | | | | | 29,737,877 | | | 61,063,049 |
| | | U.S. dollar | | Chilean peso | | | - | | | 27,794,762 |
| | | Colombian peso | | Chilean peso | | | 29,494,468 | | | 32,795,615 |
| | | Argentine peso | | Chilean peso | | | 243,409 | | | 472,672 |
Goodwill | | | | | | | 362,139,818 | | | 439,500,128 |
| | | Brazilian real | | Peruvian nuevo sol | | | 6,675,472 | | | 8,527,161 |
| | | Brazilian real | | Chilean peso | | | 202,286,652 | | | 258,398,340 |
| | | Colombian peso | | Chilean peso | | | 9,687,963 | | | 11,045,730 |
| | | Peruvian Nuevo
sol | | Chilean peso | | | 138,737,427 | | | 135,136,616 |
| | | Argentine peso | | Chilean peso | | | 4,752,304 | | | 6,220,966 |
| | | U.S. dollar | | Chilean peso | | | - | | | 20,171,315 |
| | | | | | | | | | |
TOTAL NON-CURRENT ASSETS | | | | | 391,877,695 | | | 500,563,177 |
| | | | | | | | | | |
TOTAL ASSETS | | | | | | | 414,002,176 | | | 849,151,857 |
| | | | | | | | | | | | | | | | | | | | | | | | | | | | | | | | | | | | | | | | | | | | | | | | | | | | | | | | | | | | | | | | | | | | | | | | | | |
| | | | | | | 12-31-2015 | | | 12-31-2014 |
| | | | | | | Current Liabilities | | | Non-current Liabilities | | | Current Liabilities | | | Non-current Liabilities |
| | | | | | | 90 days
or less | | | 91 days
to 1 year | | | Total Current | | | One to
two years | | | Two to
three years | | | Three to
four years | | | Four to
five years | | | More than
five years | | | Total Non-current | | | 90 days
or less | | | 91 days
to 1 year | | | Total | | | One to
two years | | | Two to
three years | | | Three to
four years | | | Four to
five years | | | More than
five years | | | Total Non- current |
| | | Foreign
Currency | | Functional
Currency | | ThCh$ | | | ThCh$ | | | | ThCh$ | | | ThCh$ | | | ThCh$ | | | ThCh$ | | | ThCh$ | | | | ThCh$ | | | ThCh$ | | | Current | | | ThCh$ | | | ThCh$ | | | ThCh$ | | | ThCh$ | | | ThCh$ | | |
LIABILITIES | | | | | | | | | | | | | | | | | | | | | | | | | | | | | | | | | | | | | | | | | | | | | | | | | | | | | |
Other current financial liabilities | | U.S. dollar | | | | | 39,350,461 | | | | 220,635,283 | | | | 259,985,744 | | | | 34,667,125 | | | | 36,469,943 | | | | 15,535,676 | | | | 24,641,590 | | | | 36,451,631 | | | | 147,765,965 | | | | 27,290,627 | | | | 194,911,470 | | | | 222,202,097 | | | | 264,874,981 | | | | 71,011,720 | | | | 60,603,646 | | | | 42,762,853 | | | | 804,987,364 | | | 1,244,240,564 |
| | | U.S. dollar | | Chilean peso | | | 3,015,734 | | | | 186,297,709 | | | | 189,313,443 | | | | 39,170 | | | | 39,170 | | | | 39,170 | | | | 39,170 | | | | 843,993 | | | | 1,000,673 | | | | 12,530,333 | | | | 155,604,278 | | | | 168,134,611 | | | | 191,134,280 | | | | 28,196,301 | | | | 28,198,962 | | | | 28,201,795 | | | | 746,470,766 | | | 1,022,202,104 |
| | | U.S. dollar | | Brazilian real | | | 20,770 | | | | 62,310 | | | | 83,080 | | | | 83,080 | | | | 83,079 | | | | 83,080 | | | | 83,080 | | | | 2,247,602 | | | | 2,579,921 | | | | 17,726 | | | | 53,177 | | | | 70,903 | | | | 70,902 | | | | 70,902 | | | | 70,902 | | | | 70,902 | | | | 1,993,373 | | | 2,276,981 |
| | | U.S. dollar | | Peruvian nuevo sol | | | 31,821,714 | | | | 32,310,979 | | | | 64,132,693 | | | | 28,734,262 | | | | 34,555,459 | | | | 13,529,933 | | | | 22,582,038 | | | | 10,086,341 | | | | 109,488,033 | | | | 11,923,154 | | | | 25,181,231 | | | | 37,104,385 | | | | 71,958,836 | | | | 42,073,900 | | | | 31,664,112 | | | | 13,681,372 | | | | 32,636,449 | | | 192,014,669 |
| | | U.S. dollar | | Argentine peso | | | 4,492,243 | | | | 1,964,285 | | | | 6,456,528 | | | | 5,810,613 | | | | 1,792,235 | | | | 1,883,493 | | | | 1,937,302 | | | | 23,273,695 | | | | 34,697,338 | | | | 2,819,414 | | | | 14,072,784 | | | | 16,892,198 | | | | 1,710,963 | | | | 670,617 | | | | 669,670 | | | | 808,784 | | | | 23,886,776 | | | 27,746,810 |
| | | | | | | | | | | | | | | | | | | | | | | | | | | | | | | | | | | | | | | | | | | | | | | | | | | | | | | | | | | | | | | | | | | | | | | | | | |
TOTAL LIABILITIES | | | 39,350,461 | | | | 220,635,283 | | | | 259,985,744 | | | | 34,667,125 | | | | 36,469,943 | | | | 15,535,676 | | | | 24,641,590 | | | | 36,451,631 | | | | 147,765,965 | | | | 27,290,627 | | | | 194,911,470 | | | | 222,202,097 | | | | 264,874,981 | | | | 71,011,720 | | | | 60,603,646 | | | | 42,762,853 | | | | 804,987,364 | | | 1,244,240,564 |
| | |
| The accompanying notes are an integral part of these consolidated financial statements | | |
|
| F-195 |
APPENDIX 7 ADDITIONAL INFORMATIONOFICIO CIRCULAR (OFFICIAL BULLETIN) No. 715 OF FEBRUARY 3, 2012:
This appendix forms an integral part of the Enersis Américas financial statements.
a) Portfolio stratification
| | - | | Trade and other receivables by time in arrears: |
| | | | | | | | | | | | | | | | | | | | | | | | | | | | | | | | | | | | | | | | | | | | | | | | |
| Trade and Other Current Receivables | | Balance as of | |
| | 12-31-2015 | |
| | Up-to-date Portfolio
ThCh$ | | | 1-30
days in
arrears
ThCh$ | | | 31-60
days in
arrears
ThCh$ | | | 61-90
days in
arrears
ThCh$ | | | 91-120
days in
arrears
ThCh$ | | | 121-150
days in
arrears
ThCh$ | | | 151-180
days in
arrears
ThCh$ | | | 181-210
days in
arrears
ThCh$ | | | 211-250
days in
arrears
ThCh$ | | | More than 251
days in arrears
ThCh$ | | | Total
Current
ThCh$ | | | Total
Non-current
ThCh$ | |
| | | | | | | | | | | | | | | | | | | | | | | | | | | | | | | | | | | | | | | | | | | | | | | | |
| Trade receivables, gross | | | 577,040,344 | | | | 89,749,887 | | | | 36,722,157 | | | | 15,687,116 | | | | 42,749,032 | | | | 32,624,597 | | | | 25,381,047 | | | | 20,410,324 | | | | 9,076,689 | | | | 205,088,719 | | | | 1,054,529,912 | | | | 257,022,423 | |
| Impairment provision | | | (1,402,962 | ) | | | (20,682,398 | ) | | | (1,571,631 | ) | | | (2,009,596 | ) | | | (27,939,987 | ) | | | (27,094,068 | ) | | | (19,937,434 | ) | | | (16,841,473 | ) | | | (7,231,279 | ) | | | (175,247,816 | ) | | | (299,958,644 | ) | | | - | |
| Other accounts receivable, gross | | | 334,685,900 | | | | - | | | | - | | | | - | | | | - | | | | - | | | | - | | | | - | | | | - | | | | - | | | | 334,685,900 | | | | 141,673,441 | |
| Impairment provision | | | (1,125,601 | ) | | | - | | | | - | | | | - | | | | - | | | | - | | | | - | | | | - | | | | - | | | | - | | | | (1,125,601 | ) | | | - | |
| | | | | | | | | | | | | | | | | | | | | | | | | | | | | | | | | | | | | | | | | | | | | | | | |
| Total | | | 909,197,681 | | | | 69,067,489 | | | | 35,150,526 | | | | 13,677,520 | | | | 14,809,045 | | | | 5,530,529 | | | | 5,443,613 | | | | 3,568,851 | | | | 1,845,410 | | | | 29,840,903 | | | | 1,088,131,567 | | | | 398,695,864 | |
| | | | | | | | | | | | |
| | | | | | | | | | | | | | | | | | | | | | | | | | | | | | | | | | | | | | | | | | | | | | | | |
| Trade and Other Current Receivables | | Balance as of | |
| | 12-31-2014 | |
| | Up-to-date Portfolio
ThCh$ | | | 1-30
days in
arrears
ThCh$ | | | 31-60
days in
arrears
ThCh$ | | | 61-90
days in
arrears
ThCh$ | | | 91-120
days in
arrears
ThCh$ | | | 121-150
days in
arrears
ThCh$ | | | 151-180
days in
arrears
ThCh$ | | | 181-210
days in
arrears
ThCh$ | | | 211-250
days in
arrears
ThCh$ | | | More than 251
days in arrears
ThCh$ | | | Total
Current
ThCh$ | | | Total
Non-current
ThCh$ | |
| | | | | | | | | | | | | | | | | | | | | | | | | | | | | | | | | | | | | | | | | | | | | | | | |
| Trade receivables, gross | | | 903,063,886 | | | | 106,894,634 | | | | 39,814,503 | | | | 20,741,774 | | | | 7,150,011 | | | | 7,174,098 | | | | 6,387,883 | | | | 4,538,112 | | | | 3,416,574 | | | | 176,818,179 | | | | 1,275,999,654 | | | | 202,932,480 | |
| Impairment provision | | | (1,280,373 | ) | | | (8,159,865 | ) | | | (2,408,150 | ) | | | (4,038,649 | ) | | | (2,288,401 | ) | | | (2,122,945 | ) | | | (2,003,467 | ) | | | (1,534,602 | ) | | | (1,360,517 | ) | | | (129,904,859 | ) | | | (155,101,828 | ) | | | - | |
| Other accounts receivable, gross | | | 568,028,235 | | | | - | | | | - | | | | - | | | | - | | | | - | | | | - | | | | - | | | | - | | | | - | | | | 568,028,235 | | | | 88,709,195 | |
| Impairment provision | | | (7,239,158 | ) | | | - | | | | - | | | | - | | | | - | | | | - | | | | - | | | | - | | | | - | | | | - | | | | (7,239,158 | ) | | | - | |
| | | | | | | | | | | | | | | | | | | | | | | | | | | | | | | | | | | | | | | | | | | | | | | | |
| Total | | | 1,462,572,590 | | | | 98,734,769 | | | | 37,406,353 | | | | 16,703,125 | | | | 4,861,610 | | | | 5,051,153 | | | | 4,384,416 | | | | 3,003,510 | | | | 2,056,057 | | | | 46,913,320 | | | | 1,681,686,903 | | | | 291,641,675 | |
| | | | | | | | | | | | | | | | | | | | | | | | | | | | | | | | | | | | | | | | | | | | | | | | |
| Time in Arrears | | Balance as of | | | Balance as of | |
| | 12-31-2015 | | | 12-31-2014 | |
| | Non-renegotiated Portfolio | | | Renegotiated Portfolio | | | Total Gross Portfolio | | | Non-renegotiated Portfolio | | | Renegotiated Portfolio | | | Total Gross Portfolio | |
| | Number of Clients | | | Gross
Amount
ThCh$ | | | Number of Clients | | | Gross
Amount
ThCh$ | | | Number of Clients | | | Gross
Amount
ThCh$ | | | Number of Clients | | | Gross
Amount
ThCh$ | | | Number of Clients | | | Gross
Amount
ThCh$ | | | Number of Clients | | | Gross
Amount
ThCh$ | |
| | | | | | | | | | | | | | | | | | | | | | | | | | | | | | | | | | | | | | | | | | | | | | | | | |
Up-to-date | | | 9,496,241 | | | | 804,676,526 | | | | 195,019 | | | | 29,386,241 | | | | 9,691,260 | | | | 834,062,767 | | | | 10,244,620 | | | | 1,091,588,812 | | | | 93,327 | | | | 14,407,554 | | | | 10,337,947 | | | | 1,105,996,366 | |
1 to 30 days | | | 2,104,270 | | | | 85,980,622 | | | | 80,275 | | | | 3,769,265 | | | | 2,184,545 | | | | 89,749,887 | | | | 2,101,665 | | | | 101,089,273 | | | | 85,662 | | | | 5,805,361 | | | | 2,187,327 | | | | 106,894,634 | |
31 to 60 days | | | 285,256 | | | | 34,798,871 | | | | 6,727 | | | | 1,923,286 | | | | 291,983 | | | | 36,722,157 | | | | 408,941 | | | | 36,225,884 | | | | 29,281 | | | | 3,588,619 | | | | 438,222 | | | | 39,814,503 | |
61 to 90 days | | | 77,855 | | | | 14,036,045 | | | | 7,552 | | | | 1,651,071 | | | | 85,407 | | | | 15,687,116 | | | | 87,712 | | | | 18,833,430 | | | | 23,566 | | | | 1,908,344 | | | | 111,278 | | | | 20,741,774 | |
91 to 120 days | | | 177,160 | | | | 41,282,854 | | | | 5,840 | | | | 1,466,178 | | | | 183,000 | | | | 42,749,032 | | | | 58,397 | | | | 5,580,951 | | | | 14,327 | | | | 1,569,060 | | | | 72,724 | | | | 7,150,011 | |
121 to 150 days | | | 172,778 | | | | 31,272,010 | | | | 6,289 | | | | 1,352,587 | | | | 179,067 | | | | 32,624,597 | | | | 52,163 | | | | 5,776,635 | | | | 14,132 | | | | 1,397,463 | | | | 66,295 | | | | 7,174,098 | |
151 to 180 days | | | 111,678 | | | | 24,222,662 | | | | 6,415 | | | | 1,158,385 | | | | 118,093 | | | | 25,381,047 | | | | 39,113 | | | | 5,103,607 | | | | 9,616 | | | | 1,284,276 | | | | 48,729 | | | | 6,387,883 | |
181 to 210 days | | | 94,221 | | | | 19,312,808 | | | | 4,390 | | | | 1,097,516 | | | | 98,611 | | | | 20,410,324 | | | | 24,086 | | | | 3,462,029 | | | | 15,507 | | | | 1,076,083 | | | | 39,593 | | | | 4,538,112 | |
211 to 250 days | | | 55,382 | | | | 8,049,056 | | | | 4,688 | | | | 1,027,633 | | | | 60,070 | | | | 9,076,689 | | | | 20,666 | | | | 2,455,802 | | | | 10,733 | | | | 960,772 | | | | 31,399 | | | | 3,416,574 | |
More than 251 days | | | 618,700 | | | | 201,615,991 | | | | 8,092 | | | | 3,472,728 | | | | 626,792 | | | | 205,088,719 | | | | 408,132 | | | | 148,793,724 | | | | 18,770 | | | | 28,024,455 | | | | 426,902 | | | | 176,818,179 | |
| | | | | | | | | | | | | | | | | | | | | | | | | | | | | | | | | | | | | | | | | | | | | | | | |
Total | | | 13,193,541 | | | | 1,265,247,445 | | | | 325,287 | | | | 46,304,890 | | | | 13,518,828 | | | | 1,311,552,335 | | | | 13,445,495 | | | | 1,418,910,147 | | | | 314,921 | | | | 60,021,987 | | | | 13,760,416 | | | | 1,478,932,134 | |
| | |
| The accompanying notes are an integral part of these consolidated financial statements | | |
|
| F-196 |
b) Portfolio in default and in legal collection process
| | | | | | | | | | | | | | | | |
| Portfolio in Default and in Legal Collection Process | | Balance as of | | | Balance as of | |
| | 12-31-2015 | | | 12-31-2014 | |
| | Number of Clients | | | Amount ThCh$ | | | Number of Clients | | | Amount ThCh$ | |
| | | | | | | | | | | | | | | | |
Notes receivable in default | | | 1,872,073 | | | | 23,354,556 | | | | 164,145 | | | | 15,922,688 | |
Notes receivable in legal collection process (*) | | | 4,219 | | | | 16,044,580 | | | | 9,983 | | | | 13,828,106 | |
| | | | | | | | | | | | | | | | |
Total | | | 1,876,292 | | | | 39,399,136 | | | | 174,128 | | | | 29,750,794 | |
(*) Legal collections are included in the portfolio in arrears.
c) Provisions and write-offs
| | | | | | | | |
| Provisions and Write-offs | | Balance as of | |
| | 12-31-2015 | | | 12-31-2014 | |
| | ThCh$ | | | ThCh$ | |
| | | | | | | | |
Provision for non-renegotiated portfolio | | | 25,846,624 | | | | 22,178,152 | |
Provision for renegotiated portfolio | | | (1,029,013 | ) | | | 669,988 | |
Write-offs during the period | | | 23,480,578 | | | | 19,013,041 | |
Recoveries during the period | | | 14,962,099 | | | | - | |
| | | | | | | | |
Total | | | 63,260,288 | | | | 41,861,181 | |
d) Number and amount of operations
| | | | | | | | | | | | | | | | |
| Number and Amount of Operations | | Balance as of | |
| | 12-31-2015 | | | 12-31-2014 | |
| | Total detail by type of operation Last Quarter | | | Total detail by type of operation Annual Accumulation | | | Total detail by type of operation Last Quarter | | | Total detail by type of operation Annual Accumulation | |
| | ThCh$ | | | ThCh$ | | | ThCh$ | | | ThCh$ | |
| | | | | | | | | | | | | | | | |
Impairment provision and recoveries | | | | | | | | | | | | | | | | |
Number of operations | | | 199,988 | | | | 557,363 | | | | 1,889,698 | | | | 1,889,698 | |
Value of operations, in ThCh$ | | | 11,043,157 | | | | 39,779,710 | | | | 22,848,140 | | | | 22,848,140 | |
| | |
| The accompanying notes are an integral part of these consolidated financial statements | | |
|
| F-197 |
APPENDIX 7.1 SUPPLEMENTARY INFORMATION ON TRADE RECEIVABLES:
This appendix forms an integral part of the Enersis Américas financial statements.
| a) | Portfolio stratification |
| | - | Trade receivables by time in arrears: |
| | | | | | | | | | | | | | | | | | | | | | | | | | | | | | | | | | | | | | | | | | | | | | | | |
| Trade Receivables | | Balance as of | |
| | 12-31-2015 | |
| | Up to date | | | 1-30 days
in arrears | | | 31-60 days
in arrears | | | 61-90 days
in arrears | | | 91-120 days
in arrears | | | 121-150 days in arrears | | | 151-180
days in
arrears | | | 181-210
days in
arrears | | | 211-250
days in
arrears | | | More than
251 days
in arrears | | | Total
Current | | | Total
Non-current | |
| | ThCh$ | | | ThCh$ | | | ThCh$ | | | ThCh$ | | | ThCh$ | | | ThCh$ | | | ThCh$ | | | ThCh$ | | | ThCh$ | | | ThCh$ | | | ThCh$ | | | ThCh$ | |
| | | | | | | | | | | | | | | | | | | | | | | | | | | | | | | | | | | | | | | | | | | | | | | | |
| Trade receivables, generation and transmission | | | 214,520,868 | | | | 10,315,795 | | | | 3,889,661 | | | | 3,959,399 | | | | 3,758,589 | | | | 3,671,364 | | | | 3,869,173 | | | | 5,219,854 | | | | 118,598 | | | | 47,438,345 | | | | 296,761,646 | | | | 230,330,033 | |
| -Large clients | | | 105,350,555 | | | | 9,422,903 | | | | 3,835,624 | | | | 3,804,996 | | | | 3,734,126 | | | | 3,641,098 | | | | 3,550,857 | | | | 5,192,924 | | | | 75,322 | | | | 4,367,646 | | | | 142,976,051 | | | | - | |
| -Institutional clients | | | 76,797,290 | | | | - | | | | - | | | | - | | | | - | | | | - | | | | - | | | | - | | | | - | | | | - | | | | 76,797,290 | | | | 227,118,907 | |
| -Others | | | 32,373,023 | | | | 892,892 | | | | 54,037 | | | | 154,403 | | | | 24,463 | | | | 30,266 | | | | 318,316 | | | | 26,930 | | | | 43,276 | | | | 43,070,699 | | | | 76,988,305 | | | | 3,211,126 | |
| Impairment provision | | | (212,623) | | | | - | | | | - | | | | (363,070) | | | | - | | | | - | | | | (415,609) | | | | (2,735,412) | | | | - | | | | (45,093,112) | | | | (48,819,826) | | | | - | |
| | | | | | | | | | | | | | | | | | | | | | | | | | | | | | | | | | | | | | | | | | | | | | | | |
| Non-invoiced services | | | 89,723,981 | | | | - | | | | - | | | | - | | | | - | | | | - | | | | - | | | | - | | | | - | | | | - | | | | 89,723,981 | | | | 32,993,708 | |
| Invoiced services | | | 124,796,887 | | | | 10,315,795 | | | | 3,889,661 | | | | 3,959,399 | | | | 3,758,589 | | | | 3,671,364 | | | | 3,869,173 | | | | 5,219,854 | | | | 118,598 | | | | 47,438,345 | | | | 207,037,665 | | | | 197,336,325 | |
| | | | | | | | | | | | | | | | | | | | | | | | | | | | | | | | | | | | | | | | | | | | | | | | |
| Trade receivables, distribution | | | 362,519,476 | | | | 79,434,092 | | | | 32,832,496 | | | | 11,727,717 | | | | 38,990,443 | | | | 28,953,233 | | | | 21,511,874 | | | | 15,190,470 | | | | 8,958,091 | | | | 157,650,374 | | | | 757,768,266 | | | | 26,692,390 | |
| -Mass-market clients | | | 217,119,041 | | | | 56,222,800 | | | | 21,046,214 | | | | 7,845,767 | | | | 27,350,487 | | | | 25,742,028 | | | | 18,419,905 | | | | 12,598,396 | | | | 6,157,123 | | | | 116,019,609 | | | | 508,521,370 | | | | 13,043,874 | |
| -Large clients | | | 99,833,365 | | | | 12,867,396 | | | | 6,598,117 | | | | 1,338,886 | | | | 1,095,541 | | | | 996,107 | | | | 1,253,697 | | | | 767,947 | | | | 850,748 | | | | 21,559,120 | | | | 147,160,924 | | | | 3,424,933 | |
| -Institutional clients | | | 45,567,070 | | | | 10,343,896 | | | | 5,188,165 | | | | 2,543,064 | | | | 10,544,415 | | | | 2,215,098 | | | | 1,838,272 | | | | 1,824,127 | | | | 1,950,220 | | | | 20,071,645 | | | | 102,085,972 | | | | 10,223,583 | |
| Impairment provision | | | (1,190,339) | | | | (20,682,398) | | | | (1,571,631) | | | | (1,646,526) | | | | (27,939,987) | | | | (27,094,068) | | | | (19,521,825) | | | | (14,106,061) | | | | (7,231,279) | | | | (130,154,704) | | | | (251,138,818) | | | | - | |
| | | | | | | | | | | | | | | | | | | | | | | | | | | | | | | | | | | | | | | | | | | | | | | | |
| Non-invoiced services | | | 173,794,483 | | | | - | | | | - | | | | - | | | | - | | | | - | | | | - | | | | - | | | | - | | | | - | | | | 173,794,483 | | | | - | |
| Invoiced services | | | 188,724,993 | | | | 79,434,092 | | | | 32,832,496 | | | | 11,727,717 | | | | 38,990,443 | | | | 28,953,233 | | | | 21,511,874 | | | | 15,190,470 | | | | 8,958,091 | | | | 157,650,374 | | | | 583,973,783 | | | | 26,692,390 | |
| | | | | | | | | | | | | | | | | | | | | | | | | | | | | | | | | | | | | | | | | | | | | | | | |
| Total Trade Receivables, Gross | | | 577,040,344 | | | | 89,749,887 | | | | 36,722,157 | | | | 15,687,116 | | | | 42,749,032 | | | | 32,624,597 | | | | 25,381,047 | | | | 20,410,324 | | | | 9,076,689 | | | | 205,088,719 | | | | 1,054,529,912 | | | | 257,022,423 | |
| Total Impairment Provision | | | (1,402,962) | | | | (20,682,398) | | | | (1,571,631) | | | | (2,009,596) | | | | (27,939,987) | | | | (27,094,068) | | | | (19,937,434) | | | | (16,841,473) | | | | (7,231,279) | | | | (175,247,816) | | | | (299,958,644) | | | | - | |
| Total Trade Receivables, Net | | | 575,637,382 | | | | 69,067,489 | | | | 35,150,526 | | | | 13,677,520 | | | | 14,809,045 | | | | 5,530,529 | | | | 5,443,613 | | | | 3,568,851 | | | | 1,845,410 | | | | 29,840,903 | | | | 754,571,268 | | | | 257,022,423 | |
Since not all of our commercial databases in our Group’s different subsidiaries distinguish whether the final electricity service consumer is a natural or legal person, the main management segmentation used by all the subsidiaries to monitor and follow up on trade receivables is the following:
| | |
| The accompanying notes are an integral part of these consolidated financial statements | | |
|
| F-198 |
| | | | | | | | | | | | | | | | | | | | | | | | | | | | | | | | | | | | | | | | | | | | | | | | |
| Trade Receivables | | Balance as of | |
| | 12-31-2014 | |
| | Up to date | | | 1-30 days in arrears | | | 31-60 days in arrears | | | 61-90 days in arrears | | | 91-120 days in arrears | | | 121-150 days in arrears | | | 151-180 days in arrears | | | 181-210 days in arrears | | | 211-250 days in arrears | | | More than 251 days in arrears | | | Total Current | | | Total Non-current | |
| | ThCh$ | | | ThCh$ | | | ThCh$ | | | ThCh$ | | | ThCh$ | | | ThCh$ | | | ThCh$ | | | ThCh$ | | | ThCh$ | | | ThCh$ | | | ThCh$ | | | ThCh$ | |
| | | | | | | | | | | | | | | | | | | | | | | | | | | | | | | | | | | | | | | | | | | | | | | | |
| Trade receivables, generation and transmission | | | 372,017,282 | | | | 14,185,584 | | | | 2,368,035 | | | | 826,795 | | | | 259,556 | | | | 101,591 | | | | 386,044 | | | | 69,185 | | | | 140,611 | | | | 58,775,408 | | | | 449,130,091 | | | | 180,858,354 | |
| -Large clients | | | 293,311,567 | | | | 6,649,258 | | | | 2,333,183 | | | | 563,008 | | | | 228,410 | | | | 77,466 | | | | 265,238 | | | | 65,525 | | | | 136,823 | | | | 3,653,609 | | | | 307,284,087 | | | | - | |
| -Institutional clients | | | 48,353,634 | | | | - | | | | - | | | | - | | | | - | | | | - | | | | - | | | | - | | | | - | | | | - | | | | 48,353,634 | | | | 172,090,003 | |
| -Others | | | 30,352,081 | | | | 7,536,326 | | | | 34,852 | | | | 263,787 | | | | 31,146 | | | | 24,125 | | | | 120,806 | | | | 3,660 | | | | 3,788 | | | | 55,121,799 | | | | 93,492,370 | | | | 8,768,351 | |
| Impairment provision | | | (388,459) | | | | - | | | | - | | | | (169,056) | | | | - | | | | - | | | | - | | | | - | | | | - | | | | (56,435,060) | | | | (56,992,575) | | | | - | |
| | | | | | | | | | | | | | | | | | | | | | | | | | | | | | | | | | | | | | | | | | | | | | | | |
| Non-invoiced services | | | 211,809,086 | | | | - | | | | - | | | | - | | | | - | | | | - | | | | - | | | | - | | | | - | | | | - | | | | 211,809,086 | | | | 1,045,832 | |
| Invoiced services | | | 160,208,196 | | | | 14,185,584 | | | | 2,368,035 | | | | 826,795 | | | | 259,556 | | | | 101,591 | | | | 386,044 | | | | 69,185 | | | | 140,611 | | | | 58,775,408 | | | | 237,321,005 | | | | 179,812,522 | |
| | | | | | | | | | | | | | | | | | | | | | | | | | | | | | | | | | | | | | | | | | | | | | | | |
| Trade receivables, distribution | | | 531,046,604 | | | | 92,709,050 | | | | 37,446,468 | | | | 19,914,979 | | | | 6,890,455 | | | | 7,072,507 | | | | 6,001,839 | | | | 4,468,927 | | | | 3,275,963 | | | | 118,042,771 | | | | 826,869,563 | | | | 22,074,126 | |
| -Mass-market clients | | | 363,514,047 | | | | 66,110,431 | | | | 24,474,607 | | | | 6,539,339 | | | | 4,783,444 | | | | 4,107,710 | | | | 3,337,309 | | | | 2,388,662 | | | | 1,846,646 | | | | 49,452,156 | | | | 526,554,351 | | | | 11,102,240 | |
| -Large clients | | | 122,493,330 | | | | 18,645,276 | | | | 6,038,961 | | | | 2,946,789 | | | | 713,261 | | | | 1,068,570 | | | | 1,460,736 | | | | 1,289,811 | | | | 664,518 | | | | 33,142,022 | | | | 188,463,274 | | | | 3,153,611 | |
| -Institutional clients | | | 45,039,227 | | | | 7,953,343 | | | | 6,932,900 | | | | 10,428,851 | | | | 1,393,750 | | | | 1,896,227 | | | | 1,203,794 | | | | 790,454 | | | | 764,799 | | | | 35,448,593 | | | | 111,851,938 | | | | 7,818,275 | |
| Impairment provision | | | (891,914) | | | | (8,159,865) | | | | (2,408,150) | | | | (3,869,593) | | | | (2,288,401) | | | | (2,122,945) | | | | (2,003,467) | | | | (1,534,602) | | | | (1,360,517) | | | | (73,469,799) | | | | (98,109,253) | | | | - | |
| | | | | | | | | | | | | | | | | | | | | | | | | | | | | | | | | | | | | | | | | | | | | | | | |
| Non-invoiced services | | | 317,688,170 | | | | - | | | | - | | | | - | | | | - | | | | - | | | | - | | | | - | | | | - | | | | - | | | | 317,688,170 | | | | - | |
| Invoiced services | | | 217,794,795 | | | | 92,709,050 | | | | 37,446,468 | | | | 19,914,979 | | | | 6,890,455 | | | | 7,072,507 | | | | 6,001,839 | | | | 4,468,927 | | | | 3,275,963 | | | | 118,042,771 | | | | 513,617,754 | | | | 22,074,126 | |
| | | | | | | | | | | | | | | | | | | | | | | | | | | | | | | | | | | | | | | | | | | | | | | | |
| Total Trade Receivables, Gross | | | 903,063,886 | | | | 106,894,634 | | | | 39,814,503 | | | | 20,741,774 | | | | 7,150,011 | | | | 7,174,098 | | | | 6,387,883 | | | | 4,538,112 | | | | 3,416,574 | | | | 176,818,179 | | | | 1,275,999,654 | | | | 202,932,480 | |
| Total Impairment Provision | | | (1,280,373) | | | | (8,159,865) | | | | (2,408,150) | | | | (4,038,649) | | | | (2,288,401) | | | | (2,122,945) | | | | (2,003,467) | | | | (1,534,602) | | | | (1,360,517) | | | | (129,904,859) | | | | (155,101,828) | | | | - | |
| Total Trade Receivables, Net | | | 901,783,513 | | | | 98,734,769 | | | | 37,406,353 | | | | 16,703,125 | | | | 4,861,610 | | | | 5,051,153 | | | | 4,384,416 | | | | 3,003,510 | | | | 2,056,057 | | | | 46,913,320 | | | | 1,120,897,826 | | | | 202,932,480 | |
| | |
| The accompanying notes are an integral part of these consolidated financial statements | | |
|
| F-199 |
- By type of portfolio:
| | | | | | | | | | | | | | | | | | | | | | | | | | | | | | | | | | | | | | | | | | | | |
| Type of Portfolio | | Balance as of | |
| | 12-31-2015 | |
| | Up to date | | | 1-30 days
in arrears | | | 31-60 days
in arrears | | | 61-90 days
in arrears | | | 91-120 days
in arrears | | | 121-150 days in
arrears | | | 151-180 days in
arrears | | | 181-210 days in
arrears | | | 211-250 days in
arrears | | | More than
251 days
in arrears | | | Total
Current | |
| | ThCh$ | | | ThCh$ | | | ThCh$ | | | ThCh$ | | | ThCh$ | | | ThCh$ | | | ThCh$ | | | ThCh$ | | | ThCh$ | | | ThCh$ | | | ThCh$ | |
| GENERATION AND TRANSMISSION | | | | | | | | | | | | | | | | | | | | | | | | | | | | | | | | | |
| Non-renegotiated portfolio | | | 209,710,717 | | | | 10,292,925 | | | | 3,835,624 | | | | 3,934,142 | | | | 3,734,126 | | | | 3,641,098 | | | | 3,839,625 | | | | 5,192,924 | | | | 75,322 | | | | 47,048,299 | | | | 291,304,802 | |
| -Large clients | | | 105,350,555 | | | | 9,422,903 | | | | 3,835,624 | | | | 3,804,997 | | | | 3,734,126 | | | | 3,641,098 | | | | 3,550,857 | | | | 5,192,924 | | | | 75,322 | | | | 4,367,645 | | | | 142,976,051 | |
| -Institutional clients | | | 76,797,290 | | | | - | | | | - | | | | - | | | | - | | | | - | | | | - | | | | - | | | | - | | | | - | | | | 76,797,290 | |
| -Others | | | 27,562,872 | | | | 870,022 | | | | - | | | | 129,145 | | | | - | | | | - | | | | 288,768 | | | | - | | | | - | | | | 42,680,654 | | | | 71,531,461 | |
| Renegotiated portfolio | | | 4,810,151 | | | | 22,870 | | | | 54,037 | | | | 25,257 | | | | 24,463 | | | | 30,266 | | | | 29,548 | | | | 26,930 | | | | 43,276 | | | | 390,045 | | | | 5,456,843 | |
| -Large clients | | | - | | | | - | | | | - | | | | - | | | | - | | | | - | | | | - | | | | - | | | | - | | | | - | | | | - | |
| -Institutional clients | | | - | | | | - | | | | - | | | | - | | | | - | | | | - | | | | - | | | | - | | | | - | | | | - | | | | - | |
| -Others | | | 4,810,151 | | | | 22,870 | | | | 54,037 | | | | 25,257 | | | | 24,463 | | | | 30,266 | | | | 29,548 | | | | 26,930 | | | | 43,276 | | | | 390,045 | | | | 5,456,843 | |
| DISTRIBUTION | | | | | | | | | | | | | | | | | | | | | | | | | | | | | |
| Non-renegotiated portfolio | | | 360,318,915 | | | | 75,687,697 | | | | 30,963,247 | | | | 10,101,903 | | | | 37,548,728 | | | | 27,630,912 | | | | 20,383,037 | | | | 14,119,884 | | | | 7,973,734 | | | | 154,567,692 | | | | 739,295,749 | |
| -Mass-market clients | | | 215,638,939 | | | | 54,316,549 | | | | 19,859,514 | | | | 6,818,125 | | | | 26,452,336 | | | | 24,953,953 | | | | 17,774,987 | | | | 12,008,723 | | | | 5,629,594 | | | | 114,472,369 | | | | 497,925,089 | |
| -Large clients | | | 99,340,127 | | | | 11,546,722 | | | | 6,337,137 | | | | 1,122,596 | | | | 936,511 | | | | 831,176 | | | | 1,130,633 | | | | 643,942 | | | | 736,404 | | | | 21,130,377 | | | | 143,755,625 | |
| -Institutional clients | | | 45,339,849 | | | | 9,824,426 | | | | 4,766,596 | | | | 2,161,182 | | | | 10,159,881 | | | | 1,845,783 | | | | 1,477,417 | | | | 1,467,219 | | | | 1,607,736 | | | | 18,964,946 | | | | 97,615,035 | |
| Renegotiated portfolio | | | 2,200,561 | | | | 3,746,395 | | | | 1,869,249 | | | | 1,625,814 | | | | 1,441,715 | | | | 1,322,321 | | | | 1,128,837 | | | | 1,070,586 | | | | 984,357 | | | | 3,082,683 | | | | 18,472,518 | |
| -Mass-market clients | | | 1,480,102 | | | | 1,906,252 | | | | 1,186,699 | | | | 1,027,641 | | | | 898,152 | | | | 788,075 | | | | 644,917 | | | | 589,672 | | | | 527,529 | | | | 1,547,241 | | | | 10,596,280 | |
| -Large clients | | | 493,237 | | | | 1,320,673 | | | | 260,980 | | | | 216,290 | | | | 159,030 | | | | 164,931 | | | | 123,064 | | | | 124,005 | | | | 114,344 | | | | 428,743 | | | | 3,405,297 | |
| -Institutional clients | | | 227,222 | | | | 519,470 | | | | 421,570 | | | | 381,883 | | | | 384,533 | | | | 369,315 | | | | 360,856 | | | | 356,909 | | | | 342,484 | | | | 1,106,699 | | | | 4,470,941 | |
| | | | | | | | | | | | | | | | | | | | | | | | | | | | | | | | | | | | | | | | | | | | |
| Total Portfolio, Gross | | | 577,040,344 | | | | 89,749,887 | | | | 36,722,157 | | | | 15,687,116 | | | | 42,749,032 | | | | 32,624,597 | | | | 25,381,047 | | | | 20,410,324 | | | | 9,076,689 | | | | 205,088,719 | | | | 1,054,529,912 | |
| | | | | | | | | | | | | | | | | | | | | | | | | | | | | | | | | | | | | | | | | | | | |
| Type of Portfolio | | Balance as of | |
| | 12-31-2014 | |
| | Up to date
ThCh$ | | | 1-30 days
in arrears
ThCh$ | | | 31-60 days
in arrears
ThCh$ | | | 61-90 days
in arrears
ThCh$ | | | 91-120 days
in arrears
ThCh$ | | | 121-150 days
in arrears
ThCh$ | | | 151-180 days
in arrears
ThCh$ | | | 181-210 days
in arrears
ThCh$ | | | 211-250 days
in arrears
ThCh$ | | | More than
251 days
in arrears
ThCh$ | | | Total
Current
ThCh$ | |
| GENERATION AND TRANSMISSION | | | | | | | | | | | | | | | | | | | | | | | | | | | | | | | | | | | | | | | | | | | | |
| Non-renegotiated portfolio | | | 363,410,191 | | | | 14,146,157 | | | | 2,333,183 | | | | 782,547 | | | | 228,410 | | | | 77,466 | | | | 265,238 | | | | 65,525 | | | | 136,823 | | | | 58,343,089 | | | | 439,788,629 | |
| -Large clients | | | 293,422,775 | | | | 6,649,258 | | | | 2,333,183 | | | | 563,008 | | | | 228,410 | | | | 77,466 | | | | 265,238 | | | | 65,525 | | | | 136,823 | | | | 3,653,609 | | | | 307,395,295 | |
| -Institutional clients | | | 48,353,634 | | | | - | | | | - | | | | - | | | | - | | | | - | | | | - | | | | - | | | | - | | | | - | | | | 48,353,634 | |
| -Others | | | 21,633,782 | | | | 7,496,899 | | | | - | | | | 219,539 | | | | - | | | | - | | | | - | | | | - | | | | - | | | | 54,689,480 | | | | 84,039,700 | |
| Renegotiated portfolio | | | 8,718,298 | | | | 39,427 | | | | 34,852 | | | | 44,248 | | | | 31,146 | | | | 24,125 | | | | 120,806 | | | | 3,660 | | | | 3,788 | | | | 432,319 | | | | 9,452,669 | |
| -Large clients | | | - | | | | - | | | | - | | | | - | | | | - | | | | - | | | | - | | | | - | | | | - | | | | - | | | | - | |
| -Institutional clients | | | - | | | | - | | | | - | | | | - | | | | - | | | | - | | | | - | | | | - | | | | - | | | | - | | | | - | |
| -Others | | | 8,718,298 | | | | 39,427 | | | | 34,852 | | | | 44,248 | | | | 31,146 | | | | 24,125 | | | | 120,806 | | | | 3,660 | | | | 3,788 | | | | 432,319 | | | | 9,452,669 | |
| DISTRIBUTION | | | | | | | | | | | | | | | | | | | | | | | | | | | | | | | | | | | | | | | | | | | | |
| Non-renegotiated portfolio | | | 525,246,141 | | | | 86,943,116 | | | | 33,892,701 | | | | 18,050,883 | | | | 5,352,541 | | | | 5,699,169 | | | | 4,838,369 | | | | 3,396,504 | | | | 2,318,979 | | | | 90,450,635 | | | | 776,189,038 | |
| -Mass-market clients | | | 359,557,387 | | | | 61,876,128 | | | | 22,363,672 | | | | 5,224,924 | | | | 3,690,220 | | | | 3,176,315 | | | | 2,587,866 | | | | 1,727,709 | | | | 1,291,303 | | | | 37,131,908 | | | | 498,627,432 | |
| -Large clients | | | 121,295,659 | | | | 17,592,569 | | | | 5,739,993 | | | | 2,818,594 | | | | 627,109 | | | | 977,296 | | | | 1,390,709 | | | | 1,219,723 | | | | 595,298 | | | | 32,199,320 | | | | 184,456,270 | |
| -Institutional clients | | | 44,393,095 | | | | 7,474,419 | | | | 5,789,036 | | | | 10,007,365 | | | | 1,035,212 | | | | 1,545,558 | | | | 859,794 | | | | 449,072 | | | | 432,378 | | | | 21,119,407 | | | | 93,105,336 | |
| Renegotiated portfolio | | | 5,689,256 | | | | 5,765,934 | | | | 3,553,767 | | | | 1,864,096 | | | | 1,537,914 | | | | 1,373,338 | | | | 1,163,470 | | | | 1,072,423 | | | | 956,984 | | | | 27,592,136 | | | | 50,569,318 | |
| -Mass-market clients | | | 3,845,451 | | | | 4,234,303 | | | | 2,110,934 | | | | 1,314,417 | | | | 1,093,224 | | | | 931,394 | | | | 749,443 | | | | 660,954 | | | | 555,345 | | | | 12,320,248 | | | | 27,815,713 | |
| -Large clients | | | 1,197,671 | | | | 1,052,707 | | | | 298,969 | | | | 128,194 | | | | 86,152 | | | | 91,274 | | | | 70,027 | | | | 70,088 | | | | 69,219 | | | | 942,702 | | | | 4,007,003 | |
| -Institutional clients | | | 646,134 | | | | 478,924 | | | | 1,143,864 | | | | 421,485 | | | | 358,538 | | | | 350,670 | | | | 344,000 | | | | 341,381 | | | | 332,420 | | | | 14,329,186 | | | | 18,746,602 | |
| | | | | | |
| Total Portfolio, Gross | | | 903,063,886 | | | | 106,894,634 | | | | 39,814,503 | | | | 20,741,774 | | | | 7,150,011 | | | | 7,174,098 | | | | 6,387,883 | | | | 4,538,112 | | | | 3,416,574 | | | | 176,818,179 | | | | 1,275,999,654 | |
| | |
| The accompanying notes are an integral part of these consolidated financial statements | | |
|
| F-200 |
APPENDIX 7.2 ESTIMATED SALES AND PURCHASES OF ENERGY AND CAPACITY:
This appendix forms an integral part of the Enersis Américas financial statements.
| | | | | | | | | | | | | | | | | | | | | | | | | | | | | | | | | | | | | | | | | | | | | | | | | | | | | | | | | | | | | | | | | | | | | | | | | | | | | | | | | | | | | | | | | | | | | | | | |
| Country | | COLOMBIA | | | PERU | | | ARGENTINA | | | BRAZIL | | | CHILE | | | TOTAL | |
| | 12-31-2015 | | | 12-31-2014 | | | 12-31-2015 | | | 12-31-2014 | | | 12-31-2015 | | | 12-31-2014 | | | 12-31-2015 | | | 12-31-2014 | | | 12-31-2015 | | | 12-31-2014 | | | 12-31-2015 | | | 12-31-2014 | |
| BALANCE | | Energy and
capacity | | | Tolls | | | Energy and
capacity | | | Tolls | | | Energy and
capacity | | | Tolls | | | Energy and
capacity | | | Tolls | | | Energy and
capacity | | | Tolls | | | Energy and
capacity | | | Tolls | | | Energy and
capacity | | | Tolls | | | Energy and
capacity | | | Tolls | | | Energy and
capacity | | | Tolls | | | Energy and
capacity | | | Tolls | | | Energy and
capacity | | | Tolls | | | Energy and
capacity | | | Tolls | |
| Current accounts receivable from related companies | | | 312,398 | | | | 231,744 | | | | 256,708 | | | | 85,174 | | | | - | | | | - | | | | - | | | | - | | | | - | | | | - | | | | - | | | | - | | | | - | | | | 5,967 | | | | - | | | | - | | | | - | | | | - | | | | 287,822 | | | | 33,396 | | | | 312,398 | | | | 237,711 | | | | 544,530 | | | | 118,940 | |
| Trade and other current receivables | | | 91,292,198 | | | | 3,767,410 | | | | 84,133,181 | | | | 3,619,524 | | | | 39,545,565 | | | | 5,091,255 | | | | 33,292,452 | | | | 4,920,460 | | | | 26,291,133 | | | | 114,662 | | | | 35,563,152 | | | | 2,247,911 | | | | 95,783,612 | | | | 4,867,959 | | | | 84,383,373 | | | | 5,916,811 | | | | - | | | | - | | | | 250,102,288 | | | | 10,403,137 | | | | 248,609,678 | | | | 13,841,286 | | | | 487,474,445 | | | | 27,107,843 | |
| Discontinued operations | | | - | | | | - | | | | - | | | | - | | | | - | | | | - | | | | - | | | | - | | | | - | | | | - | | | | - | | | | - | | | | - | | | | - | | | | - | | | | - | | | | 216,908,877 | | | | 28,418,337 | | | | - | | | | - | | | | 216,908,877 | | | | 28,418,337 | | | | - | | | | - | |
| Total Estimated Assets | | | 91,604,596 | | | | 3,999,154 | | | | 84,389,889 | | | | 3,704,698 | | | | 39,545,565 | | | | 5,091,255 | | | | 33,292,452 | | | | 4,920,460 | | | | 26,291,133 | | | | 114,662 | | | | 35,563,152 | | | | 2,247,911 | | | | 95,783,612 | | | | 4,873,926 | | | | 84,383,373 | | | | 5,916,811 | | | | 216,908,877 | | | | 28,418,337 | | | | 250,390,110 | | | | 10,436,533 | | | | 465,830,953 | | | | 42,497,334 | | | | 488,018,975 | | | | 27,226,783 | |
| Current accounts payable to related companies | | | 43,386 | | | | 85,780 | | | | - | | | | 52,558 | | | | - | | | | - | | | | - | | | | - | | | | - | | | | - | | | | - | | | | - | | | | 1,107,814 | | | | - | | | | - | | | | - | | | | - | | | | - | | | | 1,618,986 | | | | - | | | | 1,151,200 | | | | 85,780 | | | | 1,618,986 | | | | 52,558 | |
| Trade and other current payables | | | 21,741,708 | | | | 5,032,612 | | | | 28,040,330 | | | | 6,514,495 | | | | 25,029,210 | | | | 4,373,789 | | | | 20,163,194 | | | | 3,511,272 | | | | 8,559,240 | | | | - | | | | 14,539,649 | | | | 6,529 | | | | 167,569,844 | | | | 3,833,787 | | | | 169,491,822 | | | | 6,101,636 | | | | - | | | | - | | | | 92,863,118 | | | | 9,251,403 | | | | 222,500,751 | | | | 13,240,188 | | | | 325,098,113 | | | | 25,385,335 | |
| Discontinued operations | | | - | | | | - | | | | - | | | | - | | | | - | | | | - | | | | - | | | | - | | | | - | | | | - | | | | - | | | | - | | | | - | | | | - | | | | - | | | | - | | | | 101,922,626 | | | | 125,308,109 | | | | - | | | | - | | | | 101,922,626 | | | | 125,308,109 | | | | - | | | | - | |
| Total Estimated Liabilities | | | 21,785,094 | | | | 5,118,392 | | | | 28,040,330 | | | | 6,567,053 | | | | 25,029,210 | | | | 4,373,789 | | | | 20,163,194 | | | | 3,511,272 | | | | 8,559,240 | | | | - | | | | 14,539,659 | | | | 6,529 | | | | 168,677,658 | | | | 3,833,787 | | | | 169,491,822 | | | | 6,101,636 | | | | 101,922,626 | | | | 125,308,109 | | | | 94,482,104 | | | | 9,251,4303 | | | | 325,574,577 | | | | 138,634,077 | | | | 326,717,099 | | | | 25,437,893 | |
| | | | | | | | | | | | | | | | | | | | | | | | | | | | | | | | | | | | | | | | | | | | | | | | | | | | | | | | | | | | | | | | | | | | | | | | | | | | | | | | | | | | | | | | | | | | | | | | | | | | | | | | | | | | | | | | | | | | | | | | |
| | | COLOMBIA | | | PERU | | | ARGENTINA | | | BRAZIL | | | TOTAL | |
| | 12.31.2015 | | | 12.31.2014 | | | 12.31.2013 | | | 12.31.2015 | | | 12.31.2014 | | | 12.31.2013 | | | 12.31.2015 | | | 12.31.2014 | | | 12.31.2013 | | | 12.31.2015 | | | 12.31.2014 | | | 12.31.2013 | | | 12.31.2015 | | | 12.31.2014 | | | 12.31.2013 | |
| RESULTS | | Energy and
capacity | | | Tolls | | | Energy and
capacity | | | Tolls | | | Energy and
capacity | | | Tolls | | | Energy and
capacity | | | Tolls | | | Energy and
capacity | | | Tolls | | | Energy and
capacity | | | Tolls | | | Energy and
capacity | | | Tolls | | | Energy and
capacity | | | Tolls | | | Energy and
capacity | | | Tolls | | | Energy and
capacity | | | Tolls | | | Energy and
capacity | | | Tolls | | | Energy and
capacity | | | Tolls | | | Energy and
capacity | | | Tolls | | | Energy and
capacity | | | Tolls | | | Energy and
capacity | | | Tolls | |
| Energy sales | | | 91,614,430 | | | | 3,782,034 | | | | 94,439,616 | | | | 4,137,051 | | | | 79,365,812 | | | | 3,844,886 | | | | 39,027,533 | | | | 5,024,561 | | | | 34,481,991 | | | | 3,341,292 | | | | 31,384,194 | | | | 610,848 | | | | 24,469,681 | | | | 148,113 | | | | 37,120,676 | | | | 310,919 | | | | 58,105,467 | | | | 872,208 | | | | 104,917,610 | | | | 5,394,125 | | | | 89,394,426 | | | | 6,268,177 | | | | 74,614,703 | | | | 5,342,261 | | | | 260,029,254 | | | | 14,348,833 | | | | 255,436,709 | | | | 14,057,439 | | | | 243,470,176 | | | | 10,670,203 | |
| Purchase sales | | | 20,447,041 | | | | 5,223,843 | | | | 25,631,699 | | | | 9,889,413 | | | | 19,174,609 | | | | 7,671,493 | | | | 24,701,337 | | | | 4,316,494 | | | | 19,958,532 | | | | 3,478,388 | | | | 13,624,354 | | | | 3,051,373 | | | | 10,541,703 | | | | - | | | | 13,839,215 | | | | 441,931 | | | | 18,095,954 | | | | 921,658 | | | | 184,762,886 | | | | 4,199,379 | | | | 179,556,986 | | | | 6,463,979 | | | | 61,567,284 | | | | 2,966,183 | | | | 240,452,967 | | | | 13,739,716 | | | | 238,986,432 | | | | 20,273,711 | | | | 112,462,201 | | | | 14,610,707 | |
| | |
| The accompanying notes are an integral part of these consolidated financial statements | | |
|
| F-201 |
APPENDIX 8 DETAILS OF DUE DATES OF PAYMENTS TO SUPPLIERS:
This appendix forms an integral part of the Enersis Américas financial statements.
| | | | | | | | | | | | | | | | | | | | | | | | | | | | | | | | |
| Suppliers with Payments Up-to-Date | | Balance as of | | | Balance as of | |
| | 12-31-2015 | | | 12-31-2014 | |
| | Goods | | | Services | | | Other | | | Total | | | Goods | | | Services | | | Other | | | Total | |
| | ThCh$ | | | ThCh$ | | | ThCh$ | | | ThCh$ | | | ThCh$ | | | ThCh$ | | | ThCh$ | | | ThCh$ | |
| | | | | | | | | | | | | | | | | | | | | | | | | | | | | | | | |
Up to 30 days | | | - | | | | 107,441,015 | | | | 224,427,906 | | | | 331,868,921 | | | | 17,186,972 | | | | 157,069,570 | | | | 635,121,059 | | | | 809,377,601 | |
From 31 to 60 days | | | - | | | | 13,041,611 | | | | 16,446,525 | | | | 29,488,136 | | | | - | | | | 10,354,996 | | | | 2,848,853 | | | | 13,203,849 | |
From 61 to 90 days | | | - | | | | - | | | | - | | | | - | | | | - | | | | - | | | | 376,364 | | | | 376,364 | |
From 91 to 120 days | | | - | | | | - | | | | - | | | | - | | | | - | | | | - | | | | 376,364 | | | | 376,364 | |
From 121 to 365 days | | | - | | | | - | | | | - | | | | - | | | | - | | | | - | | | | 3,010,909 | | | | 3,010,909 | |
More than 365 days | | | - | | | | - | | | | 2,278,233 | | | | 2,278,233 | | | | - | | | | - | | | | 2,516,362 | | | | 2,516,362 | |
| | | | | | | | | | | | | | | | | | | | | | | | | | | | | | | | |
Total | | | - | | | | 120,482,626 | | | | 243,152,664 | | | | 363,635,290 | | | | 17,186,972 | | | | 167,424,566 | | | | 644,249,911 | | | | 828,861,449 | |
| | | | | | | | | | | | | | | | | | | | | | | | | | | | | | | | |
| | | | | | | | | | | | | | | | | | | | | | | | | | | | | | | | |
| Suppliers with Payments Overdue | | Balance as of | | | Balance as of | |
| | 12-31-2015 | | | 12-31-2014 | |
| | Goods | | | Services | | | Other | | | Total | | | Goods | | | Services | | | Other | | | Total | |
| | ThCh$ | | | ThCh$ | | | ThCh$ | | | ThCh$ | | | ThCh$ | | | ThCh$ | | | ThCh$ | | | ThCh$ | |
| | | | | | | | | | | | | | | | | | | | | | | | | | | | | | | | |
Up to 30 days | | | - | | | | - | | | | 10,249,865 | | | | 10,249,865 | | | | - | | | | - | | | | - | | | | - | |
From 31 to 60 days | | | - | | | | - | | | | - | | | | - | | | | - | | | | - | | | | - | | | | - | |
From 61 to 90 days | | | - | | | | - | | | | - | | | | - | | | | - | | | | - | | | | - | | | | - | |
From 91 to 120 days | | | - | | | | - | | | | - | | | | - | | | | - | | | | - | | | | - | | | | - | |
From 121 to 180 days | | | - | | | | - | | | | - | | | | - | | | | - | | | | - | | | | - | | | | - | |
More than 180 days | | | - | | | | - | | | | 87,506,351 | | | | 87,506,351 | | | | - | | | | 1,137,018 | | | | - | | | | 1,137,018 | |
| | | | | | | | | | | | | | | | | | | | | | | | | | | | | | | | |
Total | | | - | | | | - | | | | 97,756,216 | | | | 97,756,216 | | | | - | | | | 1,137,018 | | | | - | | | | 1,137,018 | |
| | |
| The accompanying notes are an integral part of these consolidated financial statements | | |
|
| F-202 |