FORM 6-K
Pursuant to Rule 13a-16 or 15d-16 of
the Securities Exchange Act of 1934
For the month of August, 2005
Commission File Number: 001-12440
ENERSIS S.A.
Santa Rosa 76
Santiago, Chile
Indicate by check mark whether the registrant files or will file
annual reports under cover of Form 20-F or Form 40-F:
Form 20-F [X] Form 40-F [ ]
Indicate by check mark if the registrant is submitting the Form 6-K
in paper as permitted by Regulation S-T Rule 101(b)(1):
Yes [ ] No [X]
Indicate by check mark if the registrant is submitting the Form 6-K
in paper as permitted by Regulation S-T Rule 101(b)(7):
Yes [ ] No [X]
Indicate by check mark whether by furnishing the information
contained in this Form, the Registrant is also thereby furnishing the
information to the Commission
pursuant to Rule 12g3-2(b) under the Securities Exchange Act of 1934:
Yes [ ] No [X]
If °;Yes” is marked, indicate below the file number assigned to the registrant
in connection with Rule 12g3-2(b): N/A
 | PRESS RELEASE | |
ENERSIS ANNOUNCES CONSOLIDATED RESULTS FOR
THE FIRST HALF ENDED JUNE 30, 2005
HIGHLIGHTS FOR THEPERIOD
[All figures in Chilean Pesos]
| • | Operating Revenues increased 9.8% to US$ 2,786 million mainly due to, | ||
| • | 11.8% increase in the Distribution Business | ||
| • | 3.3% increase in the Generation Business | ||
| • | Operating Income improved 5.8%, to US$ 624 million, basically as a consequence of higher Operating Income in distribution in Brazil and Colombia, and in generation in Brazil, Colombia and Chile | ||
| • | Non operating income decreased 29.5% mainly due to, | ||
| • | Higher non-cash losses related to Technical Bulletin 64 | ||
| • | Lower gain in foreign currency exchange | ||
| • | Lower net income from related companies | ||
| • | Physical sales confirmed the increasing trend exhibited since 2H03, related to a recovered economic situation with an increase of 4.9% in physical sales in distribution and 4.4% in generation | ||
| • | Our client base grew by more than 404,000 new customers. | ||
| • | Demand for electricity in GWh, continues its sustained growth in all our concession areas, as follows : | ||
| • | Santiago | 4.9% | |
| • | Buenos Aires | 2.9% | |
| • | Bogotá | 3.4% | |
| • | Rio de Janeiro y Fortaleza | 7.5% | |
| • | Lima | 6.8% | |
| • | Consolidated financial debt, was reduced by US$103 million. | ||
| • | Net income accounted for US$ 8 million. This implied a 65.8% reduction, mostly related to non-cash accounting effects. | ||
Pg. 1
| PRESS RELEASE | |
TABLE OF
CONTENTS
Pg. 2
| PRESS RELEASE | |
Pg. 3
| PRESS RELEASE | |
GENERALINFORMATION
(Santiago, Chile, July 27, 2005) Enersis S.A. (NYSE: ENI), announced today its consolidated financial results for the second quarter, ended June 30, 2005. All figures are in both US$ and Ch$, and in accordance with Chilean Generally Accepted Accounting Principles (Chilean GAAP) as shown in the standardized form required by Chilean authorities (FECU). Variations refer to the period between June 30, 2004 and June 30, 2005. Figures have been adjusted by the one-month lag CPI variation between both periods, equal to 2.7% .
For the purpose of converting Chilean pesos (Ch$) into US dollars (US$), we have used the exchange rate prevailing as of June 2005 for both periods under comparison, equal to US$1 = Ch$579.0. From an economic perspective, the Chilean peso appreciated by 8.2% against the US$ comparing June 30, 2005 to June 30, 2004.
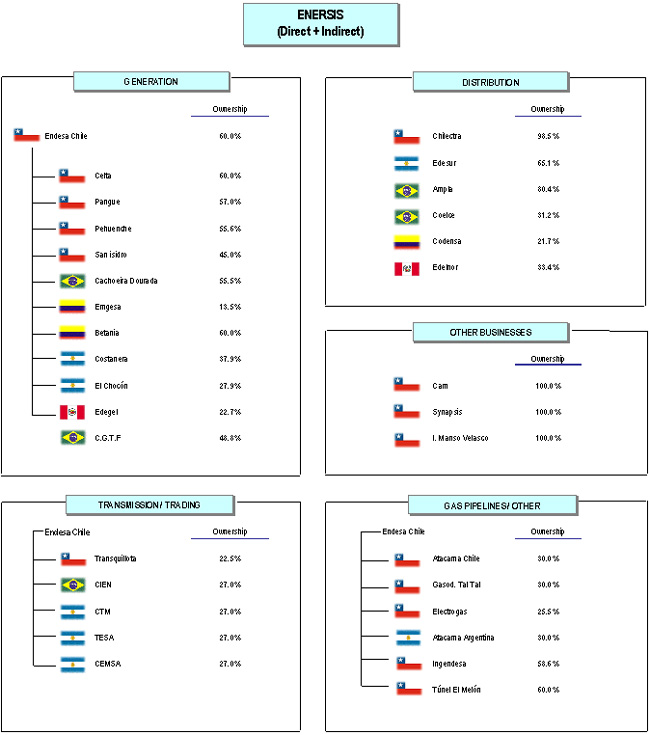
The consolidation includes the following investment vehicles and companies,
| a) | In Chile: Endesa Chile (NYSE: EOC), Chilectra, Synapsis, CAM and Inm. Manso de Velasco and Elesur. |
| b) | Outside Chile: Distrilima (Peru), Ampla and Investluz (Brazil), Edesur (Argentina), Codensa (Colombia) and Enersis Internacional. |
In the following pages you will find a detailed analysis of Financial Statements, a brief explanation for most of variations, and comments about the main items of Income and Cash Flow Statements compared to the information booked as of June 30, 2004.
Pg. 4
| PRESS RELEASE | |
SIMPLIFIEDORGANIZATIONALSTRUCTURE
Pg. 5
| PRESS RELEASE | |
MARKETINFORMATION
EQUITYMARKET
The last 12 months, market capitalization increased 77.7% from US$3,874 million to US$6,886 million. Additionally, the share price rose from Ch$75.5 to Ch$122.1.
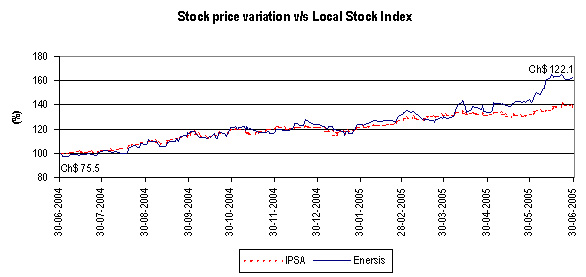
Source: Bloomberg
Pg. 6
| PRESS RELEASE | |
Over the last 12 months, the Enersis share price has increased 74.2%, from € 4.92 to € 8.57, which compares favorably with respect to the 65.3% variation of the Latibex Index.

Source: Bloomberg
Over the last 12 months, the ADR price rose by 75.2%, from US$5.96 to US$10.44, which compares very favorably with respect to the negative 1.53% variation of the Dow Jones Index for the same period.

Source: Bloomberg
Pg. 7
| PRESS RELEASE | |
MARKETPERCEPTION
The latest research published on Enersis shows the following target prices for the ADR.
| Table 1 | ||||||||
| Publication Date | Company | Main Analyst | Target Price | Recommendation | ||||
| US$ | ||||||||
| July 7, 2005 | Merrill Lynch | Frank McGann | 12.00 | Buy | ||||
| June 21, 2005 | Larraín Vial | Cristian Ramirez | 11.10 | Market weight | ||||
| June 16, 2005 | Raymond James | Ricardo Cavanagh | 10.58 | Buy | ||||
| June 15, 2005 | Bear Stearns | Rowe Michels | 11.00 | Peerperform | ||||
| June 14, 2005 | Alfa Corredores | Rodrigo Cristi | 11.05 | Underperform | ||||
| May 25, 2005 | Santander Invest. | Raimundo Valdés | 10.80 | Buy | ||||
| ADR average target price (US$) | 11.09 | |||||||
DEBTMARKET
The following chart shows the pricing of our Yankee Bonds during the last twelve months.

Source: Bloomberg
Pg. 8
| PRESS RELEASE | |
RISKRATINGCLASSIFICATION
Moody’s: Ba1 / Stable
Rationale (26/01/05)
“Moody’s Investors Service upgraded the senior unsecured debt ratings of Enersis and Endesa Chile to Ba1 from Ba2...... Key macroeconomic improvements and stronger financial performance at both Enersis and Endesa Chile support the rating upgrades.”
Rationale (28/01/05)
“S&P Rating Services affirmed its BBB- corporate credit rating on Chile-based electricity provider Enersis and revised the outlook to positive from stable, reflecting S&P’s expectations that Enersis financial profile will continue improving ”
Rationale (09/02/05)
“…Operating income continues to grow reflecting improved regional economic conditions, strong demand growth, and lower regulatory uncertainties. Further improvement along this trend may result in additional positive rating actions.”
| Feller Rate: | Bonds: A+ / Stable | ||||||||
| Shares: 1stClass Level 1 | |||||||||
| Fitch: | Bonds: A+ / Stable | ||||||||
| Shares: 1stClass Level 1 | |||||||||
Pg. 9
| PRESS RELEASE | |
CONSOLIDATEDINCOMESTATEMENT
UNDERCHILEANGAAP, MILLIONCH$
| Table 2 | ||||||||
| CONS. INCOME STATEMENT - (million Ch$) | 6M 04 | 6M 05 | Var 05-04 | Chg % | ||||
| Revenues from Generation | 551,490 | 569,713 | 18,223 | 3.3% | ||||
| Revenues from Distribution | 1,000,252 | 1,118,679 | 118,427 | 11.8% | ||||
| Revenues from Engineering and Real Estate | 13,576 | 13,065 | (511) | (3.8%) | ||||
| Revenues from Other Businesses | 67,006 | 73,790 | 6,784 | 10.1% | ||||
| Consolidation Adjustments | (162,282) | (161,791) | 491 | 0.3% | ||||
| Operating Revenues | 1,470,042 | 1,613,457 | 143,415 | 9.8% | ||||
| Costs from Generation | (333,902) | (368,919) | (35,017) | (10.5%) | ||||
| Costs from Distribution | (782,153) | (859,763) | (77,610) | (9.9%) | ||||
| Costs from Engineering and Real Estate | (11,581) | (11,478) | 103 | 0.9% | ||||
| Costs from Other Businesses | (52,211) | (58,980) | (6,769) | (13.0%) | ||||
| Consolidation Adjustments | 148,991 | 146,913 | (2,078) | (1.4%) | ||||
| Operating Costs | (1,030,855) | (1,152,228) | (121,373) | (11.8%) | ||||
| Operating Margin | 439,187 | 461,229 | 22,042 | 5.0% | ||||
| SG&A from Generation | (22,970) | (19,513) | 3,457 | 15.1% | ||||
| SG&A from Distribution | (73,438) | (79,731) | (6,293) | (8.6%) | ||||
| SG&A from Engineering and Real Estate | (1,493) | (1,424) | 69 | 4.6% | ||||
| SG&A from Other Businesses | (13,980) | (14,578) | (598) | (4.3%) | ||||
| Consolidation Adjustments | 14,433 | 15,502 | 1,069 | 7.4% | ||||
| Selling and Administrative Expenses | (97,447) | (99,744) | (2,297) | (2.4%) | ||||
| Operating Income | 341,740 | 361,485 | 19,745 | 5.8% | ||||
| Interest Income | 36,787 | 44,923 | 8,136 | 22.1% | ||||
| Interest Expense | (191,987) | (188,503) | 3,484 | 1.8% | ||||
| Net Financial Income (Expenses) | (155,200) | (143,580) | 11,620 | 7.5% | ||||
| Equity Gains from Related Companies | 16,532 | 6,915 | (9,617) | (58.2%) | ||||
| Equity Losses from Related Companies | (2) | (3,923) | (3,922) | - | ||||
| Net Income from Related Companies | 16,529 | 2,992 | (13,537) | (81.9%) | ||||
| Other Non Operating Income | 49,272 | 45,825 | (3,447) | (7.0%) | ||||
| Other Non Operating Expenses | (64,392) | (95,918) | (31,526) | (49.0%) | ||||
| Net other Non Operating Income (Expense) | (15,120) | (50,094) | (34,974) | - | ||||
| Price Level Restatement | 1,796 | (966) | (2,762) | (153.8%) | ||||
| Foreign Exchange Effect | 12,170 | 1,844 | (10,326) | (84.9%) | ||||
| Net of Monetary Exposure | 13,966 | 878 | (13,088) | (93.7%) | ||||
| Positive Goodwill Amortization | (27,655) | (27,061) | 594 | 2.2% | ||||
| Non Operating Income | (167,480) | (216,865) | (49,385) | (29.5%) | ||||
| Net Inc b. Taxes, Min Int and Neg Goodwill Amort. | 174,260 | 144,620 | (29,640) | (17.0%) | ||||
| Extraordinary Items | - | - | - | - | ||||
| Income Tax | (115,193) | (93,049) | 22,144 | 19.2% | ||||
| Minority Interest | (54,631) | (55,477) | (846) | (1.6%) | ||||
| Negative Goodwill Amortization | 9,710 | 8,740 | (970) | (10.0%) | ||||
| NET INCOME | 14,145 | 4,834 | (9,312) | (65.8%) | ||||
| EBITDA | 557,802 | 567,391 | 9,589 | 1.7% | ||||
Pg. 10
| PRESS RELEASE | |
UNDERCHILEANGAAP, THOUSANDUS$
| Table 2.1 | ||||||||
| CONS. INCOME STATEMENT - (thousand US$) | 6M 04 | 6M 05 | Var 05-04 | Chg % | ||||
| Revenues from Generation | 952,488 | 983,960 | 31,472 | 3.3% | ||||
| Revenues from Distribution | 1,727,551 | 1,932,089 | 204,538 | 11.8% | ||||
| Revenues from Engineering and Real Estate | 23,447 | 22,565 | (882) | (3.8%) | ||||
| Revenues from Other Businesses | 115,728 | 127,443 | 11,715 | 10.1% | ||||
| Consolidation Adjustments | (280,280) | (279,432) | 848 | 0.3% | ||||
| Operating Revenues | 2,538,933 | 2,786,627 | 247,694 | 9.8% | ||||
| Costs from Generation | (576,687) | (637,167) | (60,480) | (10.5%) | ||||
| Costs from Distribution | (1,350,870) | (1,484,910) | (134,040) | (9.9%) | ||||
| Costs from Engineering and Real Estate | (20,001) | (19,824) | 177 | 0.9% | ||||
| Costs from Other Businesses | (90,174) | (101,866) | (11,692) | (13.0%) | ||||
| Consolidation Adjustments | 257,325 | 253,736 | (3,589) | (1.4%) | ||||
| Operating Costs | (1,780,406) | (1,990,031) | (209,625) | (11.8%) | ||||
| Operating Margin | 758,527 | 796,596 | 38,069 | 5.0% | ||||
| SG&A from Generation | (39,673) | (33,702) | 5,971 | 15.1% | ||||
| SG&A from Distribution | (126,835) | (137,704) | (10,869) | (8.6%) | ||||
| SG&A from Engineering and Real Estate | (2,578) | (2,459) | 119 | 4.6% | ||||
| SG&A from Other Businesses | (24,145) | (25,179) | (1,034) | (4.3%) | ||||
| Consolidation Adjustments | 24,928 | 26,774 | 1,846 | 7.4% | ||||
| Selling and Administrative Expenses | (168,302) | (172,269) | (3,967) | (2.4%) | ||||
| Operating Income | 590,225 | 624,327 | 34,102 | 5.8% | ||||
| Interest Income | 63,536 | 77,588 | 14,052 | 22.1% | ||||
| Interest Expense | (331,583) | (325,566) | 6,017 | 1.8% | ||||
| Net Financial Income (Expenses) | (268,047) | (247,979) | 20,068 | 7.5% | ||||
| Equity Gains from Related Companies | 28,552 | 11,943 | (16,609) | (58.2%) | ||||
| Equity Losses from Related Companies | (3) | (6,776) | (6,773) | - | ||||
| Net Income from Related Companies | 28,549 | 5,167 | (23,382) | (81.9%) | ||||
| Other Non Operating Income | 85,098 | 79,144 | (5,954) | (7.0%) | ||||
| Other Non Operating Expenses | (111,212) | (165,662) | (54,450) | (49.0%) | ||||
| Net other Non Operating Income (Expense) | (26,115) | (86,517) | (60,402) | - | ||||
| Price Level Restatement | 3,102 | (1,669) | (4,771) | (153.8%) | ||||
| Foreign Exchange Effect | 21,019 | 3,185 | (17,834) | (84.9%) | ||||
| Net of Monetary Exposure | 24,121 | 1,517 | (22,604) | (93.7%) | ||||
| Positive Goodwill Amortization | (47,764) | (46,738) | 1,026 | 2.2% | ||||
| Non Operating Income | (289,257) | (374,550) | (85,293) | (29.5%) | ||||
| Net Inc b. Taxes, Min Int and Neg Goodwill Amort. | 300,968 | 249,776 | (51,192) | (17.0%) | ||||
| Extraordinary Items | - | - | - | - | ||||
| Income Tax | (198,951) | (160,706) | 38,245 | 19.2% | ||||
| Minority Interest | (94,354) | (95,816) | (1,462) | (1.6%) | ||||
| Negative Goodwill Amortization | 16,771 | 15,095 | (1,676) | (10.0%) | ||||
| NET INCOME | 24,432 | 8,349 | (16,083) | (65.8%) | ||||
| EBITDA | 963,388 | 979,949 | 16,561 | 1.7% | ||||
Pg. 11
| PRESS RELEASE | |
CONSOLIDATEDINCOMESTATEMENTANALYSIS
(Source in Ch$ FECU)
As of June 2005, the company registered profits of Ch$4,834 million that represent a decrease of Ch$9,312 million or 65.8% . The decrease in results is explained by higher non operating losses, despite a 5.8% increase in operating income
OPERATINGINCOMEActivities of Enersis are developed through subsidiaries in five different countries. The core businesses of the Company are generation and distribution of electricity.
| Table 3 | |||||||||||||||
| 6M 04 | 6M 05 | ||||||||||||||
| Operating | Operating | Operating | Operating | Operating | Operating | ||||||||||
| Million Ch$ | Revenues | Costs | SG & A | Income | Revenues | Costs | SG& A | Income | |||||||
| Endesa | 562,377 | (343,018) | (23,507) | 195,852 | 579,382 | (377,465) | (20,080) | 181,837 | |||||||
| Chilectra S.A. | 217,829 | (152,259) | (17,724) | 47,846 | 254,436 | (188,765) | (18,628) | 47,043 | |||||||
| Edesur S.A. | 120,217 | (102,516) | (15,549) | 2,152 | 129,888 | (112,059) | (15,894) | 1,935 | |||||||
| Distrilima (Edelnor) | 99,815 | (75,195) | (9,049) | 15,571 | 108,344 | (82,659) | (9,799) | 15,886 | |||||||
| Cerj | 210,761 | (173,857) | (9,004) | 27,900 | 257,328 | (205,715) | (10,699) | 40,914 | |||||||
| Investluz (Coelce) | 147,004 | (125,492) | (17,347) | 4,165 | 155,478 | (115,087) | (18,769) | 21,622 | |||||||
| Codensa S.A. | 204,628 | (152,834) | (4,764) | 47,030 | 213,205 | (155,478) | (5,941) | 51,786 | |||||||
| CAM Ltda. | 43,257 | (36,308) | (2,949) | 4,000 | 51,097 | (43,233) | (3,647) | 4,217 | |||||||
| Inmobiliaria Manso de Velasco Ltda. | 2,689 | (2,465) | (956) | (732) | 3,397 | (2,933) | (857) | (393) | |||||||
| Synapsis Soluciones y Servicios IT Ltda. | 21,503 | (15,327) | (3,454) | 2,722 | 20,440 | (15,209) | (3,458) | 1,773 | |||||||
| Enersis Holding and other investment vehicles | 2,246 | (576) | (7,578) | (5,908) | 2,252 | (538) | (7,474) | (5,760) | |||||||
| Consolidation Adjustments | (162,282) | 148,991 | 14,433 | 1,142 | (161,790) | 146,913 | 15,502 | 625 | |||||||
| Total Consolidation | 1,470,044 | (1,030,856) | (97,448) | 341,740 | 1,613,457 | (1,152,228) | (99,744) | 361,485 | |||||||
| Table 3.1 | |||||||||||||||
| 6M 04 | 6M 05 | ||||||||||||||
| Operating | Operating | Operating | Operating | Operating | Operating | ||||||||||
| Thousand US$ | Revenues | Costs | SG & A | Income | Revenues | Costs | SG& A | Income | |||||||
| Endesa | 971,290 | (592,432) | (40,600) | 338,259 | 1,000,660 | (651,925) | (34,680) | 314,055 | |||||||
| Chilectra S.A. | 376,216 | (262,969) | (30,612) | 82,635 | 439,441 | (326,019) | (32,173) | 81,249 | |||||||
| Edesur S.A. | 207,628 | (177,057) | (26,855) | 3,716 | 224,331 | (193,539) | (27,451) | 3,342 | |||||||
| Distrilima (Edelnor) | 172,392 | (129,869) | (15,628) | 26,895 | 187,123 | (142,761) | (16,924) | 27,438 | |||||||
| Cerj | 364,008 | (300,271) | (15,551) | 48,186 | 444,435 | (355,293) | (18,478) | 70,664 | |||||||
| Investluz (Coelce) | 253,893 | (216,739) | (29,960) | 7,193 | 268,528 | (198,768) | (32,416) | 37,344 | |||||||
| Codensa S.A. | 353,416 | (263,962) | (8,227) | 81,227 | 368,230 | (268,529) | (10,261) | 89,440 | |||||||
| CAM Ltda. | 74,709 | (62,708) | (5,094) | 6,907 | 88,251 | (74,668) | (6,299) | 7,284 | |||||||
| Inmobiliaria Manso de Velasco Ltda. | 4,644 | (4,257) | (1,651) | (1,264) | 5,866 | (5,067) | (1,480) | (680) | |||||||
| Synapsis Soluciones y Servicios IT Ltda. | 37,138 | (26,472) | (5,965) | 4,701 | 35,301 | (26,267) | (5,972) | 3,062 | |||||||
| Enersis Holding and other investment vehicles | 3,879 | (995) | (13,087) | (10,203) | 3,890 | (929) | (12,908) | (9,948) | |||||||
| Consolidation Adjustments | (280,281) | 257,326 | 24,927 | 1,973 | (279,431) | 253,735 | 26,774 | 1,078 | |||||||
| Total Consolidation | 2,538,933 | (1,780,406) | (168,302) | 590,225 | 2,786,627 | (1,990,031) | (172,269) | 624,327�� | |||||||
Operating income as of June 2005 amounted to Ch$361,485 million, reflecting a 5.8% increase or Ch$19,745 million. This increase is principally due to an important improvement in operating income in the distribution subsidiaries in Brazil and Colombia.
NONOPERATINGINCOMEThe company’s non-operating result decreased 29.5% or Ch$49,385 million from a loss of Ch$167,480 million to a loss of Ch$216,865 million. This is principally explained by the negative conversion effect as a
Pg. 12
| PRESS RELEASE | |
result of the application of the Technical Bulletin N°64 of Chilean GAAP, the negative exchange rate variations and lower income from related companies. This was partially compensated with lower net financial expenses.
Net Interest Expensedecreased by Ch$11,620 million or 7.5% from a net expense of Ch$155,200 million in 2004 to a net expense of Ch$143,580 million. This reduction in net interest expense is mainly due to lower fee expenses and higher interest income from the investment of cash surplus in Codensa and Ampla.
Income from investments in related companies shows an 81.9% decrease or Ch$13,537 million. This is mainly attributable to lower profits of Ch$13,056 million recognized from the Cia. de Interconexión Energética (CIEN) and Ch$4,001 million from Central Generadora de Fotaleza (CGTF). This was partially compensated by higher profits recognition of Ch$3,619 million from Gas Atacama Holding Ltda.
Net other non-operating expenses (income) reflect an increase of Ch$34,974 million. The principal reasons for this variation are,
- Higher losses of Ch$31,253 million as a result of the adjustment on the conversion to Chilean norms following the application of Technical Bulletin Nº 64, principally on our brazilian subsidiary Ampla.
- Non recurring indemnity of Ch$7,997 million received by Edesur in 2004 from Alstom-Pirelli in the case involving the Azopardo sub-station fire.
- Higher expenses of Ch$1,646 million on re-liquidation of firm capacity in the SIC.
- An increase of Ch$1,539 million in the equity tax of 1.2% on all companies established in Colombia.
- Higher net losses of Ch$1,477 million from the sale of assets and materials.
The above, was partially compensated by the following:
- Lower net losses amounting to Ch$4,284 million on derivative instrument contracts.
- Revenues from the sale of transmision lines rights of Ch$3,158 million.
- Price adjustment in the purchases of Elesur of Ch$4,479 million.
Price-level restatementdecreased by Ch$2,762 million, from a profit of Ch$1,796 million to a loss of Ch$967 million. This is principally due to the application of the monetary adjustment negative index of 1.0% in the first half, compared to the 0.8% in the previous period.
Pg. 13
| PRESS RELEASE | |
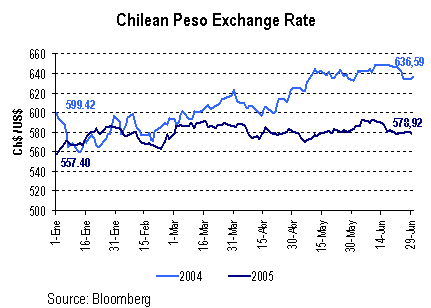
Foreign exchange differences decreased by Ch$10,326 million, from a profit of Ch$12,170 million to a profit of Ch$1,844 million. This is primarily due to the profit of liquidation of forwards contracts of Ch$3,975 and the exchange rates variations between the two periods over the mismatch netting US$ structure of the company. During this semester, the appreciation of the Chilean Peso against the US Dollar was 3.9% compared to 7.2% in the previous period.
Amortization on positive goodwill remains at the same levels with no significant variations. This amounted to Ch$27,061 million.
Income Tax and Deferred Taxes. decreased by Ch$22,144 million, from an expense of Ch$115,193 to an expense of Ch$93,048 million.
The decrease of Ch$7,965 million inincome tax is mainly explained by lower taxes in Chilectra and Enersis of Ch$10,877 million and Ch$9,693 million respectively. This was partially compensated by higher tax provisions of Ch$3,254 million in Ampla, of Ch$3,466 million in Edelnor, of Ch$3,733 million in Elesur and of Ch$1,660 million in Edesur.
With regard todeferred taxes, that do not represent cash flow, these show a positive variation of Ch$14,179 million, explained mainly by the decrease on deferred taxes in Edelnor for Ch$ 9,081 million, Edesur for Ch$5,869 million, Edegel for Ch$6,178 million, San Isidro for Ch$4,793 million and Central Costanera for Ch$4,384 million, partially compensated by higher deferred taxes in Chilectra for Ch$8,429 million, Coelce for Ch$3,375 million, Endesa Chile for Ch$2,995 million and Enersis for Ch$2,739 million.
Amortization on negative goodwill amounted to Ch$8,740 million which reflecting a reduction of Ch$970 million. The reduction in amortization is explained by the effect of exchange rate applied in foreign subsidiaries accounted for in dollars and that have a negative goodwill.
EVOLUTIONOFKEYFINANCIALRATIOSTable 4
Pg. 14
| PRESS RELEASE | |
| Indicator | Unit | 6M 04 | 6M 05 | Var 05-04 | Chg % | |||||
| Liquidity | Times | 1.27 | 1.31 | 0.04 | 3.1% | |||||
| Acid ratio test * | Times | 1.18 | 1.20 | 0.02 | 1.7% | |||||
| Working capital | million Ch$ | 309,814 | 336,500 | 26,686 | 8.6% | |||||
| Working capital | thousands US$ | 535,084 | 581,175 | 46,090 | 8.6% | |||||
| Leverage ** | Times | 0.82 | 0.88 | 0.06 | 7.3% | |||||
| Short-term debt | % | 0.22 | 0.22 | - | 0.0% | |||||
| Long-term debt | % | 0.78 | 0.78 | - | 0.0% | |||||
| Interest Coverage*** | Times | 3.26 | 3.27 | 0.01 | 0.3% | |||||
| EBITDA**** | th. US$ | 963,388 | 979,949 | 16,561 | 1.7% | |||||
| ROE | % | 0.52% | 0.19% | (0.33%) | (63.5%) | |||||
| ROA | % | 0.12% | 0.05% | (0.07%) | (58.3%) | |||||
* Current assets net of inventories and pre-paid expenses
** Using the ratio = Total debt / (equity + minority interest)
***EBITDAEI/Interest expenses = (Earnings before taxes+Fin exp+Net non operating income+depreciation+Positive Goodwill) /Interest expenses
****EBITDA: Operating Income+Depreciation+Amortization
Liquidity ratio as of June 2005 was 1.31, a 3.1% improvement. This reflects an improving financial situation of the company following the Capital Increase and the rescheduling of debts carried out in the last two years
Leverage as of June 2005 was 0.88, negatively compared with the 0.82 registered in 2004. This is mainly explained by the exchange rate effects in Chile.
ROE as of June was 0.19% compared with the 0.52%, mainly explained by the lower net income during 2005.
ROA decrease from 0.12% to 0.05% . This situation reflects the lower net income in the period, partially compensated by the decrease in total assets.
Interest Coverage improved 0.3%, from 3.26 to 3.27, mainly due to the reduction in interest expenses.
Pg. 15
| PRESS RELEASE | |
CONSOLIDATEDBALANCESHEET
ASSETSUNDERCHILEANGAAP,MILLIONCH$
| Table 5 | ||||||||
| ASSETS - (million Ch$) | 6M 04 | 6M 05 | Var 05-04 | Chg % | ||||
| CURRENT ASSETS | ||||||||
| Cash | 56,549 | 42,846 | (13,704) | (24.2%) | ||||
| Time deposits | 328,576 | 419,950 | 91,374 | 27.8% | ||||
| Marketable securities | 14,023 | 9,065 | (4,959) | (35.4%) | ||||
| Accounts receivable, net | 547,210 | 606,901 | 59,691 | 10.9% | ||||
| Notes receivable, net | 3,404 | 3,074 | (330) | (9.7%) | ||||
| Other accounts receivable, net | 46,679 | 75,032 | 28,353 | 60.7% | ||||
| Amounts due from related companies | 150,293 | 9,103 | (141,190) | (93.9%) | ||||
| Inventories | 76,260 | 70,245 | (6,015) | (7.9%) | ||||
| Income taxes recoverable | 95,218 | 81,477 | (13,741) | (14.4%) | ||||
| Prepaid expenses | 35,368 | 46,477 | 11,109 | 31.4% | ||||
| Deferred income taxes | 58,508 | 43,378 | (15,130) | (25.9%) | ||||
| Other current assets | 25,814 | 11,142 | (14,672) | (56.8%) | ||||
| Total currrent assets | 1,437,902 | 1,418,689 | (19,213) | (1.3%) | ||||
| PROPERTY, PLANT AND EQUIPMENT | ||||||||
| Land | 124,619 | 128,074 | 3,455 | 2.8% | ||||
| Buildings and infraestructure and works in progress | 10,959,956 | 10,261,576 | (698,380) | (6.4%) | ||||
| Machinery and equipment | 1,948,478 | 1,781,061 | (167,417) | (8.6%) | ||||
| Other plant and equipment | 344,810 | 388,130 | 43,320 | 12.6% | ||||
| Technical appraisal | 679,834 | 605,885 | (73,949) | (10.9%) | ||||
| Sub - Total | 14,057,698 | 13,164,728 | (892,970) | (6.4%) | ||||
| Accumulated depreciation | (5,392,783) | (5,326,630) | 66,153 | 1.2% | ||||
| Total property, plant and equipment | 8,664,915 | 7,838,097 | (826,818) | (9.5%) | ||||
| OTHER ASSETS | ||||||||
| Investments in related companies | 207,516 | 187,207 | (20,309) | (9.8%) | ||||
| Investments in other companies | 146,711 | 51,873 | (94,838) | (64.6%) | ||||
| Positive goodwill, net | 784,645 | 714,648 | (69,997) | (8.9%) | ||||
| Negative goodwill, net | (77,480) | (50,187) | 27,293 | 35.2% | ||||
| Long-term receivables | 114,888 | 110,499 | (4,389) | (3.8%) | ||||
| Amounts due from related companies | 736 | 110,475 | 109,738 | - | ||||
| Intangibles | 88,873 | 85,592 | (3,281) | (3.7%) | ||||
| Accumulated amortization | (45,964) | (48,714) | (2,750) | (6.0%) | ||||
| Others assets | 183,317 | 269,471 | 86,154 | 47.0% | ||||
| Total other assets | 1,403,242 | 1,430,864 | 27,622 | 2.0% | ||||
| TOTAL ASSETS | 11,506,059 | 10,687,650 | (818,409) | (7.1%) | ||||
Pg. 16
| PRESS RELEASE | |
ASSETSUNDERCHILEANGAAP,THOUSANDUS$
| Table 5.1 | ||||||||
| ASSETS - (thousand US$) | 6M 04 | 6M 05 | Var 05-04 | Chg % | ||||
| CURRENT ASSETS | ||||||||
| Cash | 97,667 | 73,999 | (23,668) | (24.2%) | ||||
| Time deposits | 567,489 | 725,303 | 157,814 | 27.8% | ||||
| Marketable securities | 24,220 | 15,656 | (8,564) | (35.4%) | ||||
| Accounts receivable, net | 945,095 | 1,048,189 | 103,094 | 10.9% | ||||
| Notes receivable, net | 5,879 | 5,309 | (570) | (9.7%). | ||||
| Other accounts receivable, net | 80,619 | 129,589 | 48,970 | 60.7% | ||||
| Amounts due from related companies | 259,574 | 15,722 | (243,852) | (93.9%) | ||||
| Inventories | 131,710 | 121,321 | (10,389) | (7.9%) | ||||
| Income taxes recoverable | 164,453 | 140,720 | (23,733) | (14.4%) | ||||
| Prepaid expenses | 61,085 | 80,271 | 19,186 | 31.4% | ||||
| Deferred income taxes | 101,050 | 74,918 | (26,132) | (25.9%) | ||||
| Other current assets | 44,584 | 19,243 | (25,341) | (56.8%) | ||||
| Total currrent assets | 2,483,423 | 2,450,240 | (33,183) | (1.3%) | ||||
| PROPERTY, PLANT AND EQUIPMENT | ||||||||
| Land | 215,231 | 221,199 | 5,968 | 2.8% | ||||
| Buildings and infraestructure and works in progres | 18,929,113 | 17,722,930 | (1,206,183) | (6.4%) | ||||
| Machinery and equipment | 3,365,248 | 3,076,099 | (289,149) | (8.6%) | ||||
| Other plant and equipment | 595,527 | 670,346 | 74,819 | 12.6% | ||||
| Technical appraisal | 1,174,152 | 1,046,434 | (127,718) | (10.9%) | ||||
| Sub - Total | 24,279,271 | 22,737,008 | (1,542,263) | (6.4%) | ||||
| Accumulated depreciation | (9,313,960) | (9,199,707) | 114,253 | 1.2% | ||||
| Total property, plant and equipment | 14,965,310 | 13,537,301 | (1,428,009) | (9.5%) | ||||
| OTHER ASSETS | ||||||||
| Investments in related companies | 358,404 | 323,328 | (35,076) | (9.8%) | ||||
| Investments in other companies | 253,387 | 89,590 | (163,797) | (64.6%) | ||||
| Positive goodwill, net | 1,355,173 | 1,234,280 | (120,893) | (8.9%) | ||||
| Negative goodwill, net | (133,817) | (86,679) | 47,138 | 35.2% | ||||
| Long-term receivables | 198,425 | 190,844 | (7,581) | (3.8%) | ||||
| Amounts due from related companies | 1,271 | 190,803 | 189,532 | - | ||||
| Intangibles | 153,494 | 147,828 | (5,666) | (3.7%) | ||||
| Accumulated amortization | (79,385) | (84,135) | (4,750) | (6.0%) | ||||
| Others assets | 316,610 | 465,408 | 148,798 | 47.0% | ||||
| Total other assets | 2,423,561 | 2,471,267 | 47,706 | 2.0% | ||||
| TOTAL ASSETS | 19,872,295 | 18,458,808 | (1,413,487) | (7.1%) | ||||
Pg. 17
| PRESS RELEASE | |
LIABILITIES ANDSHAREHOLDERSEQUITYUNDERCHILEANGAAP,MILLIONCH$
| Table 6 | ||||||||
| LIABILITIES AND SHAREHOLDER´S EQUITY - (million Ch$) | 6M 04 | 6M 05 | Var 05-04 | Chg % | ||||
| CURRENT LIABILITIES | ||||||||
| Short-term debt due to banks and financial institutions | 244,306 | 95,408 | (148,898) | 60.9% | ||||
| Current portion of long-term debt due to banks and financial institutions | 147,009 | 132,137 | (14,873) | 10.1% | ||||
| Promissory notes | - | - | - | |||||
| Current portion of bonds payable | 92,754 | 195,240 | 102,486 | (110.5%) | ||||
| Current portion of long-term notes payable | 25,091 | 20,970 | (4,121) | 16.4% | ||||
| Dividends payable | 23,527 | 50,343 | 26,816 | (114.0%) | ||||
| Accounts payable | 223,793 | 248,927 | 25,134 | (11.2%) | ||||
| Short-term notes payable | 23,024 | 15,610 | (7,414) | 32.2% | ||||
| Miscellaneous payables | 44,203 | 47,562 | 3,360 | (7.6%) | ||||
| Accounts payable to related companies | 94,122 | 54,809 | (39,313) | 41.8% | ||||
| Accrued expenses | 53,150 | 53,278 | 128 | (0.2%) | ||||
| Withholdings | 62,118 | 54,027 | (8,091) | 13.0% | ||||
| Income taxes payable | 33,454 | 52,772 | 19,318 | (57.7%) | ||||
| Anticipated income | 9,622 | 4,664 | (4,958) | 51.5% | ||||
| Deferred income taxes | - | - | - | - | ||||
| Reinbursable financial contribution | 1,949 | 2,189 | 240 | (12.3%) | ||||
| Other current liabilities | 49,966 | 54,254 | 4,288 | (8.6%) | ||||
| Total current liabilities | 1,128,088 | 1,082,189 | (45,899) | 4.1% | ||||
| LONG-TERM LIABILITIES | ||||||||
| Due to banks and financial institutions | 775,023 | 621,216 | (153,807) | 19.8% | ||||
| Bonds payable | 2,658,724 | 2,596,425 | (62,299) | 2.3% | ||||
| Long -term notes payable | 164,485 | 122,790 | (41,695) | 25.3% | ||||
| Accounts payables | 26,364 | 53,970 | 27,606 | (104.7%) | ||||
| Amounts payable to related companies | - | - | - | - | ||||
| Accrued expenses | 329,715 | 352,140 | 22,425 | (6.8%) | ||||
| Deferred income taxes | 58,291 | 67,195 | 8,904 | (15.3%) | ||||
| Reinbursable financial contribution | 7,739 | 5,780 | (1,958) | 25.3% | ||||
| Other long-term liabilities | 36,563 | 96,856 | 60,293 | (164.9%) | ||||
| Total long-term liabilities | 4,056,903 | 3,916,372 | (140,531) | 3.5% | ||||
| Minority interest | 3,612,186 | 3,085,559 | (526,627) | (14.6%) | ||||
| SHAREHOLDERS´ EQUITY | ||||||||
| Paid-in capital, no par value | 2,287,860 | 2,283,404 | (4,455) | (0.2%) | ||||
| Additional paid-in capital | 18,303 | 22,834 | 4,531 | 24.8% | ||||
| Additional paid-in capital (share premium) | 164,348 | 164,353 | 5 | 0.0% | ||||
| Other reserves | 30,800 | (96,504) | (127,304) | (413.3%) | ||||
| Total capital and reserves | 2,501,310 | 2,374,088 | (127,223) | (5.1%) | ||||
| Retained earnings | 196,126 | 224,609 | 28,483 | 14.5% | ||||
| Net income for the period | 14,146 | 4,834 | (9,313) | (65.8%) | ||||
| Deficits of subsidaries in development stage | (2,700) | - | 2,700 | (100.0%) | ||||
| Total retained earnings | 207,572 | 229,443 | 21,871 | 10.5% | ||||
| Total shareholder´s equity | 2,708,882 | 2,603,530 | (105,352) | (3.9%) | ||||
| TOTAL LIABILITIES AND SHAREHOLDER´S EQUITY | 11,506,059 | 10,687,650 | (818,409) | (7.1%) | ||||
Pg. 18
| PRESS RELEASE | |
LIABILITIES ANDSHAREHOLDERSEQUITYUNDERCHILEANGAAP,THOUSANDUS$
| Table 6.1 | ||||||||
| LIABILITIES - (thousand US$) | 6M 04 | 6M 05 | Var 05-04 | Chg % | ||||
| CURRENT LIABILITIES | ||||||||
| Short-term debt due to banks and financial institutions | 421,945 | 164,780 | (257,165) | 60.9% | ||||
| Current portion of long-term debt due to banks and financial in | 253,902 | 228,215 | (25,687) | 10.1% | ||||
| Current portion of bonds payable | 160,197 | 337,202 | 177,005 | (110.5%) | ||||
| Current portion of long-term notes payable | 43,335 | 36,218 | (7,117) | 16.4% | ||||
| Dividends payable | 40,634 | 86,949 | 46,315 | (114.0%) | ||||
| Accounts payable | 386,517 | 429,926 | 43,409 | (11.2%) | ||||
| Short-term notes payable | 39,765 | 26,960 | (12,805) | 32.2% | ||||
| Miscellaneous payables | 76,344 | 82,146 | 5,802 | (7.6%) | ||||
| Accounts payable to related companies | 162,560 | 94,662 | (67,898) | 41.8% | ||||
| Accrued expenses | 91,795 | 92,017 | 222 | (0.2%) | ||||
| Withholdings | 107,285 | 93,310 | (13,975) | 13.0% | ||||
| Income taxes payable | 57,780 | 91,144 | 33,364 | (57.7%) | ||||
| Anticipated income | 16,618 | 8,054 | (8,564) | 51.5% | ||||
| Reinbursable financial contribution | 3,366 | 3,780 | 414 | (12.3%) | ||||
| Other current liabilities | 86,297 | 93,702 | 7,405 | (8.6%) | ||||
| Total current liabilities | 1,948,339 | 1,869,066 | (79,273) | 4.1% | ||||
| LONG-TERM LIABILITIES | ||||||||
| Due to banks and financial institutions | 1,338,554 | 1,072,912 | (265,642) | 19.8% | ||||
| Bonds payable | 4,591,924 | 4,484,326 | (107,598) | 2.3% | ||||
| Long -term notes payable | 284,084 | 212,072 | (72,012) | 25.3% | ||||
| Accounts payables | 45,533 | 93,212 | 47,679 | (104.7%) | ||||
| Amounts payable to related companies | - | - | - | - | ||||
| Accrued expenses | 569,456 | 608,186 | 38,730 | (6.8%) | ||||
| Deferred income taxes | 100,675 | 116,054 | 15,379 | (15.3%) | ||||
| Reinbursable financial contribution | 13,366 | 9,983 | (3,383) | 25.3% | ||||
| Other long-term liabilities | 63,148 | 167,282 | 104,134 | (164.9%) | ||||
| Total long-term liabilities | 7,006,741 | 6,764,028 | (242,713) | 3.5% | ||||
| Minority interest | 6,238,663 | 5,329,117 | (909,546) | (14.6%) | ||||
| SHAREHOLDERS´ EQUITY | ||||||||
| Paid-in capital, no par value | 3,951,398 | 3,943,703 | (7,695) | (0.2%) | ||||
| Additional paid-in capital | 31,611 | 39,437 | 7,826 | 24.8% | ||||
| Additional paid-in capital (share premium) | 283,847 | 283,857 | 10 | 0.0% | ||||
| Other reserves | 53,195 | (166,673) | (219,868) | (413.3%) | ||||
| Total capital and reserves | 4,320,052 | 4,100,324 | (219,728) | (5.1%) | ||||
| Retained earnings | 338,732 | 387,926 | 49,194 | 14.5% | ||||
| Net income for the period | 24,432 | 8,348 | (16,084) | (65.8%) | ||||
| Deficits of subsidaries in development stage | (4,664) | - | 4,664 | (100.0%) | ||||
| Total retained earnings | 358,500 | 396,274 | 37,774 | 10.5% | ||||
| Total shareholder´s equity | 4,678,552 | 4,496,598 | (181,954) | (3.9%) | ||||
| TOTAL LIABILITIES AND SHAREHOLDER´S EQUITY | 19,872,295 | 18,458,809 | (1,413,486) | (7.1%) | ||||
Pg. 19
| PRESS RELEASE | |
CONSOLIDATEDBALANCESHEETANALYSIS
The Company’sTotal Assets decreased by Ch$818,409 million. This was principally due to:
| • | A decrease of Ch$826,818 million, or 9.5% inFixed Assets.This because of the depreciation for the year of Ch$425,000 million and the effect of the exchange rate of Ch$555,000 million on the fixed assets of overseas companies. Thus, in acordance to the methodology of carrying the non-monetary assets in nominal Dollars, in accordance with Technical Bulletin Nº 64 in the subsidiaries located in unstable countries. This is partly compensated by new incorporations amounting to Ch$284,000 million. | |
| • | Current Assetsdecreased Ch$19,213 million, mainly due to: | |
| • | A decrease of Ch$141,190 million of amounts due from related companies explained by the over 1 year maturity refinancing of the Atacama Finance loan of Ch$110,167 million and payments of Ch$6,489 million. | |
| • | A decrease of Ch$14,672 million in other current assets, due to lower guarantee deposits of Ch$8,251 million, lower deferred losses of the valuation to a Fair Value of derivatives of Ch$4.126 million and lower forward contracts of Ch$1,341 million. | |
The above was partially compensated by:
- An increase of Ch$91,374 million in time deposits mainly explained by an increase in deposits in Codensa of Ch$116,986 million (for a coming capital reduction), Ch$19,693 million, Ch$18,736 million, Ch$9,154 million and Ch$8,442 million in Ampla, Edelnor, Betania and Coelce respectively.
- An increase of Ch$59,691 million in accounts receivables, mainly due to the increase in invoicing at the subsidiaries Coelce of Ch$22,271 million, Ampla of Ch$20,156 million, Codensa of Ch$16,904 million, Chilectra of Ch$13,766 million and Edesur of Ch$2,295, partially compensated by a reduction of Ch$16,626 million in Cachoeira Dourada due to the agreement with Celg.
| • | Other long term assetsshow an increase of Ch$27,622 million, explained mainly as follows: | |
| • | An increase of Ch$109,738 million in amounts due from related companies , basically explained by the over 1 year maturity refinancing of the Atacama Finance loan of Ch$110,167 million. | |
| • | An increase of Ch$86,154 million in other long term assets, mainly due to the investment in Empresa Eléctrica de Bogotá of Ch$44,120 million and higher regulatory assets in Brazil of Ch$27,981 million, higher wholesale market fund in Argentina of Ch$15,006 million and deferred expenses of Ch$6,613 million. This was partially compensated by lower effects of the valuation to a Fair Value of the derivatives of Ch$10,253 million and deferred commissions and expenses of on loans of Ch$10,072 million. | |
- Decrease of positive goodwill of Ch$69,997. This corresponds to the annual average amortization by Ch$55,000 million, plus, the exchange rate effect on other several minor positive goodwill located in subsidiaries accounted in US Dollars.
- Decrease of Ch$94,838 million in Investments in Other Companies, basically the investment in Empresa Eléctrica de Bogotá, as a result of the liquidation of Luz de Bogotá.
Pg. 20
| PRESS RELEASE | |
Total Liabilities andShareholder´s Equity show a reduction of Ch$818,409 million, due principally to:
| • | Short-term liabilitiesshow a reduction of Ch$45,899 million or 4.1% as a result of: | |
| • | A decrease in the short term and the short-term porcion of the long-term obligation with banks of Ch$148,898 million and Ch$14,873 million respectively. This is due to payments in advance and refinancing in Ampla of Ch$64,853 million, Emgesa of Ch$38,652 million, Coelce of Ch$34,183 million and Edesur of Ch$25,122 million. | |
| • | A decrease of Ch$39,313 million in the accounts payable to related companies, basically from Enersis to Endesa Internacional of Ch$29,492 million due to the payment and price adjustment on the purchase of Elesur. | |
- Increase of Ch$102,486 million in short term bond obligations following the transfer to short term of the Endesa International bonds for Ch$86,850 million and Edegel of Ch$29,175 million, partially compensated by payments in Edegel of Ch$18,897 million.
| • | Long term liabilitiesreduction of Ch$140,531 million or 3.5 % due basically to the following: | |
| • | Decrease of Ch$153,807 million due to banks, mainly explained by prepayments with excess flow or through bond refinancing. | |
| • | Decrease of Ch$62,299 million in bonds payable, due to the transfer to short term of the Endesa International bonds for Ch$86,850 million and Edegel of Ch$29,175 million, partially compensated by new issuances in Ampla by Ch$98,947 million, Betania by Ch$74,491 million, Edegel by Ch$26,799 million, Coelce by Ch$16,355 million, Edesur by Ch$16,028 million and Edelnor by Ch$10,679 million, to prepay bank debt. | |
- An increase of Ch$60,293 million in other long term liabilities, due to the accounting to a Fair Value of the swaps suscribed by Enersis and Endesa.
Minority interestdecreased by Ch$526,627 million or 14.6%, mainly explained by the effect of Luz de Bogotá liquidation, capital reduction in Emgesa, added to the effect of the reduction in the investments in the foreign subsidiaries controlled in US Dollars in accordance with bulletin N°64.
Equity decreased by Ch$105,352 million. This variation is explained principally by the reduction of Ch$127,304 in other reserves, due to the revaluation of the Chilean Peso and its effect on the equity given the diference in conversion adjustment on the investments controlled in US Dollars, partially compensated by the increase of Ch$31,183 million in retained earnings.
Pg. 21
| PRESS RELEASE | |
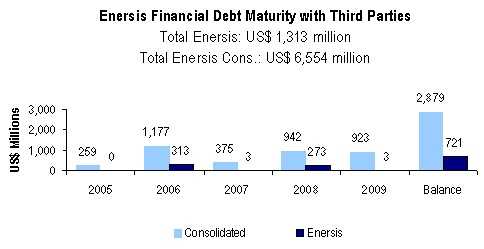
DEBTMATURITY WITHTHIRDPARTIES,MILLIONCH$(*)
| Table 7 | ||||||||||||||
| TOTAL | ||||||||||||||
| Million Ch$ | 2005 | 2006 | 2007 | 2008 | 2009 | Balance | ||||||||
| Chile | 28,145 | 396,128 | 28,917 | 398,926 | 366,784 | 1,248,651 | 2,467,552 | |||||||
| Enersis | 74 | 181,480 | 1,546 | 157,964 | 1,636 | 417,625 | 760,325 | |||||||
| Chilectra | 10 | - | - | - | - | - | 10 | |||||||
| Other (*) | 3,249 | 593 | - | - | - | - | 3,842 | |||||||
| Endesa Chile (**) | 24,812 | 214,055 | 27,372 | 240,963 | 365,148 | 831,026 | 1,703,375 | |||||||
| Argentina | 33,362 | 84,610 | 44,023 | 12,706 | 12,355 | 20,162 | 207,218 | |||||||
| Edesur | 6,459 | 48,703 | 22,732 | 351 | - | - | 78,245 | |||||||
| Costanera | 21,346 | 35,908 | 21,291 | 12,355 | 12,355 | 20,162 | 123,416 | |||||||
| Hidroinvest | 5,558 | - | - | - | - | - | 5,558 | |||||||
| Perú | 35,948 | 100,496 | 45,445 | 22,789 | 31,152 | 31,163 | 266,994 | |||||||
| Edelnor | 1,512 | 56,428 | 10,705 | 5,338 | 7,117 | 26,068 | 107,169 | |||||||
| Edegel | 34,436 | 44,068 | 34,740 | 17,451 | 24,034 | 5,095 | 159,824 | |||||||
| Brasil | 33,424 | 43,526 | 84,306 | 110,824 | 33,483 | 128,494 | 434,057 | |||||||
| Coelce | 9,987 | 23,307 | 24,531 | 25,943 | 14,731 | 62,965 | 161,463 | |||||||
| Ampla | 22,518 | 17,961 | 56,811 | 83,761 | 18,752 | 65,530 | 265,332 | |||||||
| Cachoeira | 919 | 2,259 | 2,964 | 1,120 | - | - | 7,262 | |||||||
| Colombia | 18,810 | 56,572 | 14,484 | - | 90,469 | 238,373 | 418,708 | |||||||
| Codensa | 10,126 | - | - | - | 12,415 | 111,737 | 134,279 | |||||||
| Emgesa | 1,441 | 42,088 | - | - | 78,054 | 52,144 | 173,727 | |||||||
| Betania | 7,242 | 14,484 | 14,484 | - | - | 74,491 | 110,703 | |||||||
| TOTAL | 149,689 | 681,333 | 217,176 | 545,246 | 534,243 | 1,666,843 | 3,794,530 | |||||||
DEBTMATURITY WITHTHIRDPARTIES,THOUSANDUS$
| Table 7.1 | ||||||||||||||
| TOTAL | ||||||||||||||
| Thousand US$ | 2005 | 2006 | 2007 | 2008 | 2009 | Balance | ||||||||
| Chile | 48,610 | 684,159 | 49,944 | 688,992 | 633,478 | 2,156,565 | 4,261,748 | |||||||
| Enersis | 127 | 313,438 | 2,669 | 272,822 | 2,826 | 721,287 | 1,313,169 | |||||||
| Chilectra | 17 | - | - | - | - | - | 17 | |||||||
| Other (*) | 5,612 | 1,024 | - | - | - | - | 6,636 | |||||||
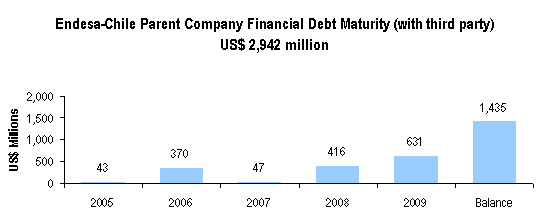
| Endesa Chile (**) | 42,853 | 369,698 | 47,274 | 416,170 | 630,652 | 1,435,278 | 2,941,926 | |||||||
| Argentina | 57,620 | 146,132 | 76,032 | 21,945 | 21,338 | 34,822 | 357,890 | |||||||
| Edesur | 11,155 | 84,115 | 39,261 | 607 | - | - | 135,138 | |||||||
| Costanera | 36,867 | 62,017 | 36,771 | 21,338 | 21,338 | 34,822 | 213,153 | |||||||
| Hidroinvest | 9,599 | - | - | - | - | - | 9,599 | |||||||
| Perú | 62,087 | 173,568 | 78,489 | 39,359 | 53,803 | 53,822 | 461,129 | |||||||
| Edelnor | 2,612 | 97,458 | 18,489 | 9,219 | 12,293 | 45,022 | 185,094 | |||||||
| Edegel | 59,475 | 76,110 | 60,000 | 30,140 | 41,510 | 8,800 | 276,035 | |||||||
| Brasil | 57,727 | 75,174 | 145,606 | 191,406 | 57,829 | 221,925 | 749,667 | |||||||
| Coelce | 17,249 | 40,253 | 42,367 | 44,806 | 25,442 | 108,747 | 278,865 | |||||||
| Ampla | 38,891 | 31,020 | 98,118 | 144,666 | 32,387 | 113,177 | 458,260 | |||||||
| Cachoeira | 1,587 | 3,901 | 5,120 | 1,934 | - | - | 12,542 | |||||||
| Colombia | 32,487 | 97,707 | 25,016 | - | 156,251 | 411,697 | 723,158 | |||||||
| Codensa | 17,489 | - | - | - | 21,443 | 192,983 | 231,915 | |||||||
| Emgesa | 2,490 | 72,690 | - | - | 134,808 | 90,059 | 300,047 | |||||||
| Betania | 12,508 | 25,016 | 25,016 | - | - | 128,655 | 191,196 | |||||||
| TOTAL | 258,531 | 1,176,740 | 375,087 | 941,703 | 922,699 | 2,878,831 | 6,553,592 | |||||||
| (*) Includes: CAM |
| (**) Includes: Endesa Chile Internacional, Pangue, Pehuenche, San Isidro, Celta and Tunel El Melon |
| Source: Internal financial report |
Pg. 22
| PRESS RELEASE | |
CONSOLIDATEDCASHFLOW
UNDERCHILEANGAAP, MILLIONCH$
| Table 8 | ||||||||
| Million Ch$ | 6M 04 | 6M 05 | Var 05-04 | Chg % | ||||
| CASH FLOWS PROVIDED BY OPERATING ACTIVITIES | ||||||||
| Net income (loss) for the year | 14,146 | 4,834 | (9,312) | (65.8%) | ||||
| Gain (losses) from sales of assets: | ||||||||
| Losses (gain) on sale of property, plant and equipment | (251) | 1,579 | 1,830 | - | ||||
| Charges (credits) to income which do not represent cash flows: | ||||||||
| Depreciation | 212,611 | 201,680 | (10,931) | (5.1%) | ||||
| Amortization of intangibles | 3,451 | 4,226 | 775 | 22.4% | ||||
| Write-offs and accrued expenses | 43,221 | 25,892 | (17,329) | (40.1%) | ||||
| Equity in income of related companies | (16,532) | (6,915) | 9,617 | 58.2% | ||||
| Equity in losses of related companies | 2 | 3,923 | 3,921 | - | ||||
| Amortization of positive goodwill | 27,655 | 27,061 | (594) | (2.1%) | ||||
| Amortization of negative goodwill | (9,710) | (8,740) | 970 | 10.0% | ||||
| Price-level restatement, net | (1,796) | 967 | 2,763 | 153.8% | ||||
| Exchange difference, net | (12,170) | (1,844) | 10,326 | 84.8% | ||||
| Other credits to income which do not represent cash flows | (17,149) | (12,819) | 4,330 | 25.2% | ||||
| Other charges to income which do not represent cash flows | 35,193 | 46,864 | 11,671 | 33.2% | ||||
| Changes in assets which affect cash flows: | - | |||||||
| Decrease (increase) in trade receivables | 15,013 | (25,083) | (40,096) | - | ||||
| Decrease (increase) in inventory | (5,712) | (12,996) | (7,284) | (127.5%) | ||||
| Decrease (increase) in other assets | (4,884) | 6,997 | 11,881 | - | ||||
| Changes in liabilities which affect cash flow: | - | |||||||
| Decreased (increase) in payable accounts associated with operating results | (29,382) | (48,847) | (19,465) | (66.2%) | ||||
| Decreased (increase) of payable interest | 13,554 | 22,520 | 8,966 | 66.2% | ||||
| Decreased (increase) in income tax payable | 3,346 | 16,403 | 13,057 | - | ||||
| Decreased (increase) in other accounts payable associated with non-operating results | (37,786) | 38,393 | 76,179 | 201.6% | ||||
| Decreased (increase) in value added tax and other similar taxes payable, net | (12,246) | (21,306) | (9,060) | (74.0%) | ||||
| Income (loss) attributable to minority interest | 54,632 | 55,477 | 845 | 1.5% | ||||
| NET CASH FLOW PROVIDED BY OPERATING ACTIVITIES | 275,206 | 318,266 | 43,060 | 15.6% | ||||
Pg. 23
| PRESS RELEASE | |
| Cont. Table 8 | ||||||||
| Million Ch$ | 6M 04 | 6M 05 | Var 05-04 | Chg % | ||||
| CASH FLOWS FROM FINANCING ACTIVITIES | ||||||||
| Proceeds from issuance of shares issued to minorities | - | - | - | - | ||||
| Proceeds from debt issuance | 514,374 | 201,835 | (312,539) | (60.8%) | ||||
| Proceeds from bond issuance | 167,754 | 169,860 | 2,106 | 1.3% | ||||
| Proceeds from loans obtained from related companies | - | - | - | - | ||||
| Proceeds from other loans obtained from related companies | - | - | - | - | ||||
| Other sources of financing | 20,404 | 1,533 | (18,871) | (92.5%) | ||||
| Capital paid | (4,156) | (81,739) | (77,583) | - | ||||
| Dividends paid | (60,313) | (71,795) | (11,482) | (19.0%) | ||||
| Payment of debt | (763,242) | (376,873) | 386,369 | 50.6% | ||||
| Payment of bonds | (18,121) | (102,470) | (84,349) | - | ||||
| Payments of loans obtained from related companies | - | - | - | - | ||||
| Payments of other loans obtained from related companies | - | - | - | - | ||||
| Payments of shares issuance costs | - | - | - | - | ||||
| Payments of bonds issuance costs | (1,348) | (982) | 366 | 27.1% | ||||
| Other disbursements for financing | (7,744) | (4,705) | 3,039 | 39.2% | ||||
| NET CASH FLOW FROM FINANCING ACTIVITIES | (152,393) | (265,336) | (112,943) | (74.1%) | ||||
| CASH FLOWS FROM INVESTING ACTIVITIES | ||||||||
| Proceeds from sale of property, plant and equipment | 1,309 | 1,278 | (31) | (2.3%) | ||||
| Sale of investment | 2,658 | - | (2,658) | (100.0%) | ||||
| Other loans received from related companies | 6,368 | 27 | (6,341) | (99.6%) | ||||
| Other receipts from investments | 39,119 | 2,011 | (37,108) | (94.9%) | ||||
| Additions to property, plant and equipment | (130,854) | (142,125) | (11,271) | (8.6%) | ||||
| Long-term investments | - | (23,684) | (23,684) | - | ||||
| Investment in financing instruments | (242) | - | 242 | - | ||||
| Other loans granted to related companies | - | - | - | - | ||||
| Other investment disbursements | (1,717) | (719) | 998 | 58.1% | ||||
| NET CASH FLOW FROM INVESTMENT ACTIVITIES | (83,358) | (163,211) | (79,853) | (95.8%) | ||||
| NET CASH FLOW FOR THE PERIOD | 39,455 | (110,281) | (149,736) | - | ||||
| EFFECT OF PRICE-LEVEL RESTATEMENT ON CASH AND CASH EQUIVALENT | 18,779 | 33,741 | 14,962 | 79.7% | ||||
| NET VARIATION ON CASH AND CASH EQUIVALENT | 58,234 | (76,541) | (134,775) | - | ||||
| CASH AND CASH EQUIVALENT AT THE BEGINNING OF THE YEAR | 342,835 | 552,710 | 209,875 | 61.2% | ||||
| CASH AND CASH EQUIVALENT AT THE END OF THE YEAR | 401,069 | 476,169 | 75,100 | 18.7% | ||||
Pg. 24
| PRESS RELEASE | |
UNDERCHILEANGAAP,THOUSANDUS$
| Table 8.1 | ||||||||
| Thousand US$ | 6M 04 | 6M 05 | Var 05-04 | Chg % | ||||
| CASH FLOWS PROVIDED BY OPERATING ACTIVITIES | ||||||||
| Net income (loss) for the year | 24,430 | 8,349 | (16,081) | (65.8%) | ||||
| Gain (losses) from sales of assets: | ||||||||
| Losses (gain) on sale of property, plant and equipment | (434) | 2,727 | 3,161 | - | ||||
| Charges (credits) to income which do not represent cash flows: | ||||||||
| Depreciation | 367,204 | 348,325 | (18,879) | (5.1%) | ||||
| Amortization of intangibles | 5,960 | 7,298 | 1,338 | 22.4% | ||||
| Write-offs and accrued expenses | 74,648 | 44,719 | (29,929) | (40.1%) | ||||
| Equity in income of related companies | (28,553) | (11,943) | 16,610 | 58.2% | ||||
| Equity in losses of related companies | 3 | 6,776 | 6,773 | - | ||||
| Amortization of positive goodwill | 47,763 | 46,738 | (1,025) | (2.1%) | ||||
| Amortization of negative goodwill | (16,770) | (15,095) | 1,675 | 10.0% | ||||
| Price-level restatement, net | (3,102) | 1,669 | 4,771 | 153.8% | ||||
| Exchange difference, net | (21,019) | (3,185) | 17,834 | 84.8% | ||||
| Other credits to income which do not represent cash flows | (29,618) | (22,140) | 7,478 | 25.2% | ||||
| Other charges to income which do not represent cash flows | 60,782 | 80,940 | 20,158 | 33.2% | ||||
| Changes in assets which affect cash flows: | ||||||||
| Decrease (increase) in trade receivables | 25,929 | (43,322) | (69,251) | - | ||||
| Decrease (increase) in inventory | (9,865) | (22,446) | (12,581) | (127.5%) | ||||
| Decrease (increase) in other assets | (8,435) | 12,085 | 20,520 | - | ||||
| Changes in liabilities which affect cash flow: | ||||||||
| Decreased (increase) in payable accounts associated with operating results | (50,746) | (84,364) | (33,618) | (66.2%) | ||||
| Decreased (increase) of payable interest | 23,409 | 38,895 | 15,486 | 66.2% | ||||
| Decreased (increase) in income tax payable | 5,779 | 28,329 | 22,550 | - | ||||
| Decreased (increase) in other accounts payable associated with non-operating results | (65,261) | 66,308 | 131,569 | 201.6% | ||||
| Decreased (increase) in value added tax and other similar taxes payable, net | (21,150) | (36,798) | (15,648) | (74.0%) | ||||
| Income (loss) attributable to minority interest | 94,356 | 95,816 | 1,460 | 1.5% | ||||
| NET CASH FLOW PROVIDED BY OPERATING ACTIVITIES | 475,312 | 549,682 | 74,370 | 15.6% | ||||
Pg. 25
| PRESS RELEASE | |
| Cont. Table 8.1 | ||||||||
| Thousand US$ | 6M 04 | 6M 05 | Var 05-04 | Chg % | ||||
| CASH FLOWS FROM FINANCING ACTIVITIES | ||||||||
| Proceeds from issuance of shares issued to minorities | - | - | - | - | ||||
| Proceeds from debt issuance | 888,383 | 348,593 | (539,790) | (60.8%) | ||||
| Proceeds from bond issuance | 289,731 | 293,368 | 3,637 | 1.3% | ||||
| Proceeds from loans obtained from related companies | - | - | - | - | ||||
| Proceeds from other loans obtained from related companies | - | - | - | - | ||||
| Other sources of financing | 35,240 | 2,648 | (32,592) | (92.5%) | ||||
| Capital paid | (7,178) | (141,173) | (133,995) | - | ||||
| Dividends paid | (104,168) | (123,998) | (19,830) | (19.0%) | ||||
| Payment of debt | (1,318,208) | (650,904) | 667,304 | 50.6% | ||||
| Payment of bonds | (31,297) | (176,977) | (145,680) | - | ||||
| Payments of loans obtained from related companies | - | - | - | - | ||||
| Payments of other loans obtained from related companies | - | - | - | - | ||||
| Payments of shares issuance costs | - | - | - | - | ||||
| Payments of bonds issuance costs | (2,328) | (1,696) | 632 | 27.1% | ||||
| Other disbursements for financing | (13,375) | (8,126) | 5,249 | 39.2% | ||||
| NET CASH FLOW FROM FINANCING ACTIVITIES | (263,200) | (458,266) | (195,066) | (74.1%) | ||||
| CASH FLOWS FROM INVESTING ACTIVITIES | ||||||||
| Proceeds from sale of property, plant and equipment | 2,261 | 2,208 | (53) | (2.3%) | ||||
| Sale of investment | 4,591 | - | (4,591) | (100.0%) | ||||
| Other loans received from related companies | 10,998 | 47 | (10,951) | (99.6%) | ||||
| Other receipts from investments | 67,564 | 3,474 | (64,090) | (94.9%) | ||||
| Additions to property, plant and equipment | (226,000) | (245,466) | (19,466) | (8.6%) | ||||
| Long-term investments | - | (40,905) | (40,905) | - | ||||
| Investment in financing instruments | (418) | - | 418 | - | ||||
| Other loans granted to related companies | - | - | - | - | ||||
| Other investment disbursements | (2,964) | (1,242) | 1,722 | 58.1% | ||||
| NET CASH FLOW FROM INVESTMENT ACTIVITIES | (143,969) | (281,884) | (137,915) | (95.8%) | ||||
| NET CASH FLOW FOR THE PERIOD | 68,143 | (190,469) | (258,612) | - | ||||
| EFFECT OF PRICE-LEVEL RESTATEMENT ON CASH AND CASH EQUIVALENT | 32,434 | 58,274 | 25,840 | 79.7% | ||||
| NET VARIATION ON CASH AND CASH EQUIVALENT | 100,577 | (132,195) | (232,772) | - | ||||
| CASH AND CASH EQUIVALENT AT THE BEGINNING OF THE YEAR | 592,116 | 954,594 | 362,478 | 61.2% | ||||
| CASH AND CASH EQUIVALENT AT THE END OF THE YEAR | 692,693 | 822,399 | 129,706 | 18.7% | ||||
Pg. 26
| PRESS RELEASE | |
CONSOLIDATEDCASHFLOWANALYSIS
During the period, the Company generated a negative net cash flow of Ch$110,281 million, comprised of the following activities:
| Table 9 | ||||||||
| Effective Cash Flow (million Ch$) | 6M 04 | 6M 05 | Var 05-04 | Chg % | ||||
| Operating | 275,206 | 318,266 | 43,060 | 15.6% | ||||
| Financing | (152,393) | (265,336) | (112,943) | (74.1%) | ||||
| Investment | (83,358) | (163,211) | (79,853) | 95.8% | ||||
| Net cash flow of the period | 39,455 | (110,281) | (149,736) | (379.5%) | ||||
| Table 9.1 | ||||||||
| Effective Cash Flow (thousand US$) | 6M 04 | 6M 05 | Var 05-04 | Chg % | ||||
| Operating | 475,312 | 549,682 | 74,370 | 15.6% | ||||
| Financing | (263,200) | (458,266) | (195,066) | (74.1%) | ||||
| Investment | (143,969) | (281,884) | (137,915) | 95.8% | ||||
| Net cash flow of the period | 68,143 | (190,469) | (258,612) | (379.5%) | ||||
Operating activities generated a net positive cash flow of Ch$318,266 million, an increase of Ch$43,060 million. As of June 2005, the operating cash flow is comprised mainly of:
| • | Profit for the period amounting to Ch$4,834 million, plus: | |
| • | Charges of Ch$309,647 million to the income statement that do not represent cash flow and correspond mainly to the Depreciation of the period for Ch$201,680 million, write-offs and provisions for Ch$25,892 million, amortizations of positive goodwill of Ch$27,061 million, amortization of intangibles of Ch$4,225 million, losses in investments of Ch$3,923 million, and other charges that do not represent cash flow for Ch$46,864 million. | |
| • | The variation of net liabilities that affect cash flow of Ch$7,164 million. | |
| • | The above was partly compensated by: | |
| • | Increase in net assets which affect operating cash flow of Ch$31,082 million. | |
| • | Credits for Ch$12,819 million that do not represent cash flows, of which Ch$7,992 million correspond to the positive effect of the conversion of the overseas branches. | |
| • | Profit on sales of assets of Ch$1,579. | |
Financingactivities produced a negative cash flow of Ch$265,336 million mainly due to the payment of loans for a value of Ch$376,873 million, payments to the public for Ch$102,470 million, capital paid of Ch$81,739 million and third parties dividend payments of Ch$71,795 million. The above is partly compensated by the receipt of loans for Ch$201,835 million, bond issues for Ch$169,860 million and other sources of financing for Ch$1,533 million.
Investment activitiesgenerated a net negative cash flow of Ch$163,211 million that correspond mainly to the incorporation of fixed assets for Ch$142,125 million and other long term investments for Ch$23,684 million, partially compensated by the sale of fiexed assets of Ch$1,278 million.
Pg. 27
| PRESS RELEASE | |
CASHFLOWRECEIVEDFROMFOREIGNSUBSIDIARIES BYENERSIS,CHILECTRA ANDENDESACHILE(*)
| Table 10 | ||||||||||||||||||||
| Millions Ch$ | Interest Received | Dividends Received | Management Fee | Prepayment intercompany | Others | |||||||||||||||
| 6M 04 | 6M 05 | 6M 04 | 6M 05 | 6M 04 | 6M 05 | 6M 04 | 6M 05 | 6M 04 | 6M 05 | |||||||||||
| Argentina | 3,373 | 3,113 | - | - | 1,441 | 973 | 11,613 | - | - | - | ||||||||||
| Peru | - | - | 5,800 | 5,000 | - | - | - | - | 2,242 | 4,041 | ||||||||||
| Brazil | 1,874 | 1,935 | 4,401 | 20,672 | - | - | - | - | - | - | ||||||||||
| Colombia | 8,778 | - | 6,598 | 5,949 | - | - | - | 24,672 | - | - | ||||||||||
| Total | 14,025 | 5,048 | 16,799 | 31,621 | 1,441 | 973 | 11,613 | 24,672 | 2,242 | 4,041 | ||||||||||
| Millions Ch$ | Total Cash Received | |||||||||||||||||||
| 6M 04 | 6M 05 | |||||||||||||||||||
| Argentina | 16,427 | 4,087 | ||||||||||||||||||
| Peru | 8,042 | 9,041 | ||||||||||||||||||
| Brazil | 6,275 | 22,607 | ||||||||||||||||||
| Colombia | 15,376 | 30,620 | ||||||||||||||||||
| Total | 46,121 | 66,355 | ||||||||||||||||||
| Table 10.1 | ||||||||||||||||||||
| Thousand US$ | Interest Received | Dividends Received | Management Fee | Prepayment Intercompany | Others | |||||||||||||||
| 6M 04 | 6M 05 | 6M 04 | 6M 05 | 6M 04 | 6M 05 | 6M 04 | 6M 05 | 6M 04 | 6M 05 | |||||||||||
| Argentina | 5,825 | 5,377 | - | - | 2,489 | 1,681 | 20,057 | - | - | - | ||||||||||
| Peru | - | - | 10,017 | 8,636 | - | - | - | - | 3,873 | 6,980 | ||||||||||
| Brazil | 3,237 | 3,342 | 7,601 | 35,703 | - | - | - | - | - | - | ||||||||||
| Colombia | 15,161 | - | 11,395 | 10,274 | - | - | - | 42,611 | - | - | ||||||||||
| Total | 24,222 | 8,719 | 29,014 | 54,613 | 2,489 | 1,681 | 20,057 | 42,611 | 3,873 | 6,980 | ||||||||||
| Thousand US$ | Total Cash Received | |||||||||||||||||||
| 6M 04 | 6M 05 | |||||||||||||||||||
| Argentina | 28,371 | 7,058 | ||||||||||||||||||
| Peru | 13,890 | 15,616 | ||||||||||||||||||
| Brazil | 10,838 | 39,045 | ||||||||||||||||||
| Colombia | 26,556 | 52,885 | ||||||||||||||||||
| Total | 79,656 | 114,603 | ||||||||||||||||||
(*) Source: Internal financial report
Pg. 28
| PRESS RELEASE | |
CAPEX ANDDEPRECIATION
| Table 11 | ||||||||
| Payments for Additions of | Depreciation | |||||||
| Fixed assets | ||||||||
| Million Ch$ | 6M 04 | 6M 05 | 6M 04 | 6M 05 | ||||
| Endesa | 57,577 | 27,684 | 91,985 | 92,937 | ||||
| Chilectra S.A. | 6,926 | 18,495 | 7,085 | 7,611 | ||||
| Edesur S.A. | 15,136 | 15,023 | 28,332 | 24,151 | ||||
| Edelnor S.A. | 5,210 | 5,934 | 9,229 | 8,819 | ||||
| Cerj | 26,898 | 36,970 | 24,891 | 22,003 | ||||
| Coelce | 14,229 | 24,969 | 20,793 | 18,657 | ||||
| Codensa S.A. | 2,355 | 10,623 | 28,472 | 25,603 | ||||
| Cam Ltda. | 890 | 1,132 | 578 | 501 | ||||
| Inmobiliaria Manso de Velasco Ltda. | 16 | 96 | 146 | 179 | ||||
| Synapsis Soluciones y Servicios Ltda. | 1,597 | 1,152 | 545 | 703 | ||||
| Holding Enersis | 18 | 47 | 555 | 516 | ||||
| Total | 130,853 | 142,125 | 212,611 | 201,680 | ||||
| Table 11.1 | ||||||||
| Payments for Additions of | Depreciation | |||||||
| Fixed assets | ||||||||
| Thousand US$ | 6M 04 | 6M 05 | 6M 04 | 6M 05 | ||||
| Endesa | 99,443 | 47,813 | 158,869 | 160,513 | ||||
| Chilectra S.A. | 11,962 | 31,942 | 12,237 | 13,145 | ||||
| Edesur S.A. | 26,141 | 25,947 | 48,933 | 41,712 | ||||
| Edelnor S.A. | 8,999 | 10,248 | 15,940 | 15,231 | ||||
| Cerj | 46,455 | 63,851 | 42,990 | 38,002 | ||||
| Coelce | 24,575 | 43,124 | 35,912 | 32,223 | ||||
| Codensa S.A. | 4,068 | 18,347 | 49,174 | 44,219 | ||||
| Cam Ltda. | 1,538 | 1,956 | 998 | 865 | ||||
| Inmobiliaria Manso de Velasco Ltda. | 28 | 166 | 252 | 309 | ||||
| Synapsis Soluciones y Servicios Ltda. | 2,759 | 1,990 | 941 | 1,214 | ||||
| Holding Enersis | 32 | 81 | 959 | 891 | ||||
| Total | 226,000 | 245,466 | 367,204 | 348,325 | ||||
Pg. 29
| PRESS RELEASE | |
ANALYSISOFTHEEXCHANGERISKANDTHEINTERESTRATE
The company has a high percentage of its loans in US Dollars as a great part of its sales in the different markets where it operates are mainly indexed to that currency. Nevertheless, the Brazilian and Colombian markets are less indexed to the US Dollar and, therefore, subsidiaries in those markets have most of their liabilities in local currency.
In a scenario of a high exchange risk, the company has continued with its policy of partly covering its liabilities in Dollars in order to mitigate the effects of the fluctuations in the exchange rate on the results. Considering the important reduction in the accounting mismatch in recent years, the company has modified its policy on Dollar-Peso hedging in order to establish a policy of covering cash flows, together with a maximum permissible accounting mismatch, on which hedging operations will be performed.
As of June 2005, on a consolidated basis, the company has hedged in Chile, by means of USD/UF Swap operations, an amount of US$700 million and by means of forwards contracts US$125 million, due primarily to the modification of the hedging policy. A year ago, the company had already contracted US$650 million of the total Swap Dollar-UF as part of the establishment of the new hedging policy and US$10 million in forwards.
With regard to interest rate risk, the company has, on a consolidated basis, a proportion of its indebtedness at a fixed rate/variable rate ratio of approximately 83.4% / 16.6% fixed / variable as of June, 2005. The percentage of its indebtedness at a fixed rate has remained fairly constant if compared with the 82.6% / 17.4% ratio as of the same date of the previous year. This is due to the fact that the risk levels have also remained in the hedging levels determined by the company’s new policy.
Pg. 30
| PRESS RELEASE | |
GENERATIONBUSINESS
| Table 12 | |||||||||
| Million US$ | Million Ch$ | ||||||||
| 6M 04 | 6M 05 | 6M 04 | 6M 05 | Chg % | |||||
| Operating Revenues | 971 | 1,001 | 562,377 | 579,382 | 3.0% | ||||
| Operating Costs | (592) | (652) | (343,018) | (377,465) | (10.0%) | ||||
| Selling and Administrative Expenses | (41) | (35) | (23,507) | (20,080) | 14.6% | ||||
| Operating Income | 338 | 314 | 195,852 | 181,837 | (7.2%) | ||||
| Interest Income | 14 | 17 | 7,902 | 9,673 | 22.4% | ||||
| Interest Expenses | (181) | (171) | (104,772) | (99,210) | 5.3% | ||||
| Net Financial Income (Expenses) | (167) | (155) | (96,871) | (89,536) | 7.6% | ||||
| Equity Gains from Related Company | 19 | 9 | 10,815 | 5,183 | (52.1%) | ||||
| Equity Losses from Related Company | (0) | (7) | (44) | (3,982) | - | ||||
| Net Income from Related Companies | 19 | 2 | 10,771 | 1,201 | (88.9%) | ||||
| Other Non Operating Income | 15 | 37 | 8,572 | 21,487 | 150.7% | ||||
| Other Non Operating Expenses | (35) | (45) | (20,363) | (26,226) | (28.8%) | ||||
| Net other Non Operating Income (Expenses) | (20) | (8) | (11,791) | (4,739) | 59.8% | ||||
| Price Level Restatement | 2 | 2 | 1,309 | 1,390 | 6.2% | ||||
| Foreign Exchange Effect | 6 | (0) | 3,610 | (151) | (104.2%) | ||||
| Net of Monetary Exposure | 8 | 2 | 4,919 | 1,239 | (74.8%) | ||||
| Positive Goodwill Amortization | (1) | (1) | (843) | (759) | 10.0% | ||||
| Non Operating Income | (162) | (160) | (93,814) | (92,594) | 1.3% | ||||
| Net Income b. Taxes, Min Int and Neg Goodwill Amort. | 176 | 154 | 102,038 | 89,243 | (12.5%) | ||||
| Extraordinary Items | - | - | - | - | - | ||||
| Income Tax | (94) | (76) | (54,468) | (43,950) | 19.3% | ||||
| Minority Interest | (39) | (39) | (22,851) | (22,838) | 0.1% | ||||
| Negative Goodwill Amortization | 16 | 15 | 9,122 | 8,636 | (5.3%) | ||||
| NET INCOME | 58 | 54 | 33,841 | 31,091 | (8.1%) | ||||
NETINCOME
Endesa Chile recorded a Net Income of Ch$31,091 million which is Ch$2,750 million lower than the previous year. This is mainly explained by:
OPERATINGINCOMEEndesa Chile’s operating income reached Ch$181,837 million, a decrease of 7.2% mainly due to the lower results in our subsidiaries in Argentina product of our energy export business to Brazil and, to a lesser degree, the reduction of the results of our operations in Peru, which were partially compensated by the increase in the operating income in Chile, Brazil and Colombia.
In Argentina, the operating income in Costanera reported a loss of Ch$ 2,139 million, mainly explained by the diminished revenues and higher costs as a result of summoning from Brazil of energy from Costanera in agreement with our current export contract, being forced to generate using liquid fuel (fuel oil) that has reached high international prices due to the current contingency that affect and influence the international oil market.
On the other hand our hydroelectric subsidiary El Chocón increased its operating income by 87.4 % reaching Ch$ 5,173 million, due to the increase of the prices obtained for the sales of energy.
Pg. 31
| PRESS RELEASE | |
In Chile, the operating income increased by 2.6% reaching Ch$ 70,070 million. This operating income is outstanding when considering that the thermal generation plant San Isidro saw a decreased operational income due to higher amounts of thermal energy generated from liquid fuels as the result of the high demand. The energy production rose by 649 GWh due to a greater hydraulic dispatch by the addition of Ralco in 2005.
It is important to mention that the present state of rainfalls and snow levels show a favorable scenario for the rest of the year, together with the new node price recently set by authorities which came into effect in June 13.
In Brazil, the operating income reached Ch$ 10,670 million, Ch$ 2,679 million higher than the first semester of the previous year. Cachoeira’s physical sales increased by 3.3% and the cost of sales decreased by 5.7% .
In Colombia, operating income reached Ch$ 67,435 million or 1.6% increase. The operating revenues of business in Colombia during these first six months was slightly inferior to that of the last year’s first semester, due to lower sales in the spot market and electric distribution to companies and the impact of the revaluing of the Colombian peso versus the dollar. This decrease in our operating revenues in Colombia was compensated by the lower cost of sales, partially as a result of the reduction of energy purchases, revealing the efficiency of the Company’s commercial policy.
In Perú, the operating income reached Ch$ 30,628 million, an 8.8% decrease. This result is explained by the diminished sale prices caused by the improved hydrology, even though physical sales have increased. The higher hydraulic level allowed the company to lower their thermal generation reducing the cost of fuel purchases, thus reducing the cost of sales in 22%.
NONOPERATINGINCOMEThe non-operating income decreased from Ch$ 93,814 million to Ch$ 92,594 million. This variation had a positive effect in the net income of the company.
Pg. 32
| PRESS RELEASE | |
| Table 13 | ||||||||||||||
| Country | Market | GWh Sold | Var 05-04 | Chg % | Market Share (*) | |||||||||
| 6M 04 | 6M 05 | 6M 04 | 6M 05 | |||||||||||
| Chile | SIC & SING | 8,516 | 9,171 | 655 | 7.7% | 37.8% | 37.6% | |||||||
| SIC | 8,047 | 8,690 | 643 | 8.0% | 47.0% | 47.1% | ||||||||
| SING | 469 | 481 | 12 | 2.5% | 8.7% | 8.1% | ||||||||
| Argentina | SIN | 5,890 | 6,478 | 587 | 10.0% | 14.2% | 15.0% | |||||||
| Chocón | 1,731 | 1,646 | (85) | (4.9%) | 4.2% | 3.8% | ||||||||
| Costanera | 4,159 | 4,831 | 672 | 16.2% | 10.0% | 11.2% | ||||||||
| Perú | SICN | 2,239 | 2,379 | 140 | 6.3% | 24.4% | 24.9% | |||||||
| Edegel | 2,239 | 2,379 | 140 | 6.3% | ||||||||||
| Colombia | SIN | 7,743 | 7,464 | (279) | (3.6%) | 24.2% | 22.1% | |||||||
| Betania | 1,151 | 1,278 | 127 | 11.0% | 3.6% | 3.8% | ||||||||
| Emgesa | 6,592 | 6,186 | (406) | (6.2%) | 20.6% | 18.3% | ||||||||
| Brazil | SICN | 1,835 | 1,895 | 60 | 3.3% | 1.2% | 1.1% | |||||||
| Cachoeira | 1,835 | 1,895 | 60 | 3.3% | ||||||||||
| Total | 26,223 | 27,387 | 1,164 | 4.4% | ||||||||||
| (*) | Respect to GWh sold |
| Table 14 | ||||||||
| Company | GWh Produced | Var 05-04 | Chg % | |||||
| 6M 04 | 6M 05 | |||||||
| Chilean Companies | 7,788 | 8,437 | 649 | 8.3% | ||||
| Chocón | 1,663 | 1,530 | (133) | (8.0%) | ||||
| Costanera | 4,123 | 4,818 | 695 | 16.9% | ||||
| Edegel | 2,164 | 2,266 | 102 | 4.7% | ||||
| Betania | 870 | 1,029 | 160 | 18.3% | ||||
| Emgesa | 5,218 | 4,914 | (304) | (5.8%) | ||||
| Cachoeira | 1,575 | 1,809 | 234 | 14.9% | ||||
| TOTAL | 23,401 | 24,805 | 1,403 | 6.0% | ||||
Pg. 33
| PRESS RELEASE | |
DISTRIBUTIONBUSINESS
| Table 15 | ||||||||
| Distribution Business | 6M 04 | 6M 05 | Var 05-04 | Chg % | ||||
| Customers (Th) | 10,634 | 11,038 | 404 | 3.8% | ||||
| GWh Sold | 25,827 | 27,100 | 1,273 | 4.9% | ||||
| Clients/Employe | 1,498 | 1,540 | 43 | 2.8% | ||||
| Energy Losses % (TTM) | 12.0% | 12.0% | 0.0% | 0.3% | ||||
HIGHLIGHTS
InChile, physical sales in our concession area increased by 4.9%, the energy losses are stabilized in 5.3% and clients increased by 2.5% .
InBrazil, Ampla’s physicals sales increased by 6.5%, energy losses decreased from 23.1% to 22.9%, the biilling increased to 99.0%, both due mainly to theDAT network and clients increased by 5.0% . On the other hand, Coelce’s physicals sales increased by 8.8%, energy losses reached 14.2% and the billing 100%, while clients increased by 8.3% .
The April tariff revision was of 23.59% in Coelce, but this revision is currently in a hold status and the increase limited to 11.13% due to judicial actions; Coelce and the Brazilian regulation entity (ANEEL) appealed to this lawsuit.
InColombia, the energy demand in our concession area increased by 3.4%, energy losses decreased from 9.9% to 9.8% and clients increased by 2.4% .
InPeru, physical sales in our concession area increased by 6.8% and energy losses remained stable at 8.5% .
Tariffs in Peru must be reviewed in November. In this respect, we expect a similar outcome to the ones obtained in past tariff revisions.
InArgentina, physical sales in our concession area increased by 2.9% and energy losses remained stable at 11.7% .
In relation to distribution tariffs, Edesur has been authorized to increase tariffs, since November, 2005, by 15% except to residential clients.
Pg. 34
| PRESS RELEASE | |
CHILECTRA(UNDERCHILEANGAAP)
INCOMESTATEMENT
| Table 16 | ||||||||||
| Million US$ | Million Ch$ | |||||||||
| 6M 04 | 6M 05 | 6M 04 | 6M 05 | Chg % | ||||||
| Revenues from Sales | 357 | 418 | 206,427 | 241,820 | 17.1% | |||||
| Other Operating Revenues | 20 | 22 | 11,402 | 12,617 | 10.7% | |||||
| Operating Revenues | 376 | 439 | 217,829 | 254,436 | 16.8% | |||||
| Energy Purchases | (225) | (284) | (130,016) | (164,516) | (26.5%) | |||||
| Other Operating Cost | (38) | (42) | (22,243) | (24,249) | (9.0%) | |||||
| Operating Costs | (263) | (326) | (152,259) | (188,765) | (24.0%) | |||||
| Selling and Administrative Expenses | (31) | (32) | (17,724) | (18,628) | (5.1%) | |||||
| Operating Income | 83 | 81 | 47,846 | 47,043 | (1.7%) | |||||
| Interest Income | 2 | 1 | 1,118 | 744 | (33.4%) | |||||
| Interest Expenses | (32) | (27) | (18,401) | (15,733) | 14.5% | |||||
| Net Financial Income (Expenses) | (30) | (26) | (17,283) | (14,989) | 13.3% | |||||
| Equity Gains from Related Company | 6 | 8 | 3,277 | 4,711 | 43.8% | |||||
| Equity Losses from Related Company | (5) | (27) | (3,052) | (15,558) | - | |||||
| Net Income from Related Companies | 0 | (19) | 225 | (10,847) | - | |||||
| Other Non Operating Income | 20 | 19 | 11,548 | 11,062 | (4.2%) | |||||
| Other Non Operating Expenses | (8) | (6) | (4,748) | (3,602) | 24.1% | |||||
| Conversion Effect (BT 64) | - | - | - | - | ||||||
| Net other Non Operating Income (Expenses) | 12 | 13 | 6,800 | 7,460 | 9.7% | |||||
| Price Level Restatement | (6) | (5) | (3,371) | (3,074) | 8.8% | |||||
| Foreign Exchange Effect | - | - | - | - | ||||||
| Net of Monetary Exposure | (6) | (5) | (3,371) | (3,074) | 8.8% | |||||
| Positive Goodwill Amortization | (0) | (1) | (180) | (310) | (72.1%) | |||||
| Non Operating Income | (24) | (38) | (13,809) | (21,760) | (57.6%) | |||||
| Net Income b. Taxes, Min Int and Neg Goodwill Amort. | 59 | 44 | 34,037 | 25,284 | (25.7%) | |||||
| Extraordinary Items | - | - | - | - | ||||||
| Income Tax | (20) | (16) | (11,468) | (9,020) | 21.4% | |||||
| Minority Interest | 3 | 2 | 1,577 | 1,186 | (24.8%) | |||||
| Negative Goodwill Amortization | - | - | - | - | ||||||
| NET INCOME | 42 | 30 | 24,146 | 17,450 | (27.7%) | |||||
ADDITIONALINFORMATION
| Table 17 | ||||||
| Chilectra | 6M 04 | 6M 05 | Chg % | |||
| Customers (Th) | 1,354 | 1,388 | 2.5% | |||
| GWh Sold | 5,539 | 5,809 | 4.9% | |||
| Clients/Employee | 1,974 | 1,989 | 0.7% | |||
| Energy Losses % (TTM) | 5.1% | 5.3% | (0.3%) | |||
Pg. 35
| PRESS RELEASE | |
AMPLA(UNDERCHILEANGAAP*)
OPERATINGINCOME
| Table 18 | ||||||||||
| Million US$ | Million Ch$ | |||||||||
| 6M 04 | 6M 05 | 6M 04 | 6M 05 | Chg % | ||||||
| Revenues from Sales | 346 | 423 | 200,607 | 244,805 | 22.0% | |||||
| Other Operating Revenues | 18 | 22 | 10,154 | 12,523 | 23.3% | |||||
| Operating Revenues | 364 | 444 | 210,761 | 257,328 | 22.1% | |||||
| Energy Purchases | (192) | (219) | (110,892) | (126,658) | (14.2%) | |||||
| Other Operating Cost | (109) | (137) | (62,965) | (79,057) | (25.6%) | |||||
| Operating Costs | (300) | (355) | (173,857) | (205,715) | (18.3%) | |||||
| Selling and Administrative Expenses | (16) | (18) | (9,004) | (10,699) | (18.8%) | |||||
| Operating Income | 48 | 71 | 27,900 | 40,914 | 46.6% | |||||
* Please take note that these figures could differed from those accounted under Brazilian GAAP.
ADDITIONALINFORMATION
| Table 19 | ||||||
| Ampla | 6M 04 | 6M 05 | Chg % | |||
| Customers (Th) | 2,061 | 2,163 | 5.0% | |||
| GWh Sold | 3,791 | 4,039 | 6.5% | |||
| Clients/Employee | 1,482 | 1,486 | 0.2% | |||
| Energy Losses % (TTM) | 23.1% | 22.9% | 0.2% | |||
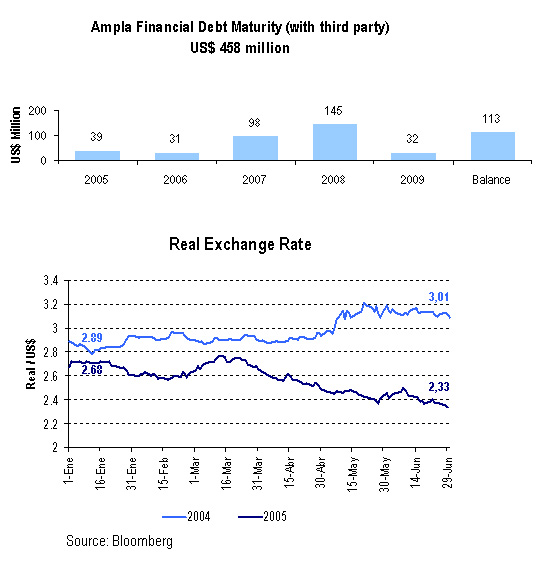
Pg. 36
| PRESS RELEASE | |
COELCE(UNDERCHILEANGAAP*)
OPERATINGINCOME
| Table 20 | ||||||||||
| Million US$ | Million Ch$ | |||||||||
| 6M 04 | 6M 05 | 6M 04 | 6M 05 | Chg % | ||||||
| Revenues from Sales | 250 | 263 | 144,906 | 152,077 | 4.9% | |||||
| Other Operating Revenues | 4 | 6 | 2,098 | 3,401 | 62.1% | |||||
| Operating Revenues | 254 | 269 | 147,004 | 155,478 | 5.8% | |||||
| Energy Purchases | (151) | (129) | (87,214) | (74,733) | 14.3% | |||||
| Other Operating Cost | (66) | (70) | (38,279) | (40,354) | (5.4%) | |||||
| Operating Costs | (217) | (199) | (125,492) | (115,087) | 8.3% | |||||
| Selling and Administrative Expenses | (30) | (32) | (17,347) | (18,769) | (8.2%) | |||||
| Operating Income | 7 | 37 | 4,165 | 21,622 | - | |||||
* Please take note that these figures could differed from those accounted under Brazilian GAAP.
ADDITIONALINFORMATION
| Table 21 | ||||||
| Coelce | 6M 04 | 6M 05 | Chg % | |||
| Customers (Th) | 2,195 | 2,378 | 8.3% | |||
| GWh Sold | 2,920 | 3,177 | 8.8% | |||
| Clients/Employee | 1,609 | 1,772 | 10.1% | |||
| Energy Losses % (TTM) | 13.8% | 14.2% | (0.4%) | |||
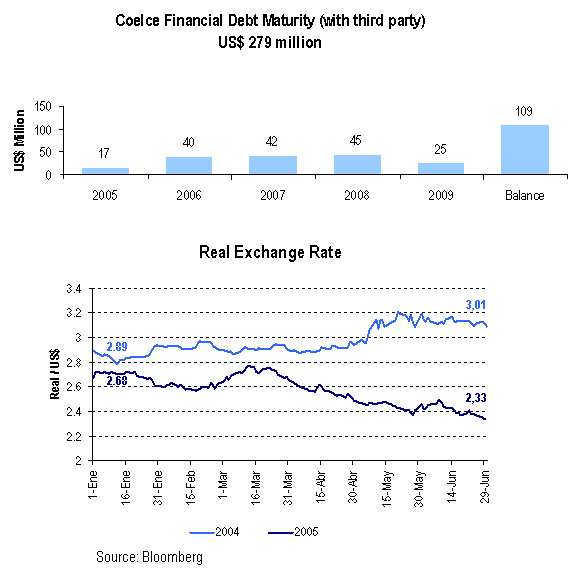
Pg. 37
| PRESS RELEASE | |
CODENSA(UNDERCHILEANGAAP*)
OPERATINGINCOME
| Table 22 | ||||||||||
| Million US$ | Million Ch$ | |||||||||
| 6M 04 | 6M 05 | 6M 04 | 6M 05 | Chg % | ||||||
| Revenues from Sales | 272 | 290 | 157,249 | 168,158 | 6.9% | |||||
| Other Operating Revenues | 82 | 78 | 47,379 | 45,047 | (4.9%) | |||||
| Operating Revenues | 353 | 368 | 204,628 | 213,205 | 4.2% | |||||
| Energy Purchases | (166) | (167) | (96,112) | (96,760) | (0.7%) | |||||
| Other Operating Cost | (98) | (101) | (56,722) | (58,718) | (3.5%) | |||||
| Operating Costs | (264) | (269) | (152,834) | (155,478) | (1.7%) | |||||
| Selling and Administrative Expenses | (8) | (10) | (4,764) | (5,941) | (24.7%) | |||||
| Operating Income | 81 | 89 | 47,030 | 51,786 | 10.1% | |||||
| * | Please take note that these figures could differed from those accounted under Colombian GAAP. |
ADDITIONALINFORMATION
| Table 23 | ||||||
| Codensa | 6M 04 | 6M 05 | Chg % | |||
| Customers (Th) | 1,993 | 2,042 | 2.4% | |||
| GWh Sold | 4,754 | 4,914 | 3.4% | |||
| Clients/Employee | 2,350 | 2,363 | 0.6% | |||
| Energy Losses % (TTM) | 9.9% | 9.8% | 0.2% | |||

Pg. 38
| PRESS RELEASE | |
EDELNOR(UNDERCHILEANGAAP*)
OPERATINGINCOME
| Table 24 | ||||||||||
| Million US$ | Million Ch$ | |||||||||
| 6M 04 | 6M 05 | 6M 04 | 6M 05 | Chg % | ||||||
| Revenues from Sales | 167 | 183 | 96,677 | 106,010 | 9.7% | |||||
| Other Operating Revenues | 5 | 4 | 3,138 | 2,334 | (25.6%) | |||||
| Operating Revenues | 172 | 187 | 99,815 | 108,344 | 8.5% | |||||
| Energy Purchases | (109) | (121) | (62,927) | (70,146) | (11.5%) | |||||
| Other Operating Cost | (21) | (22) | (12,269) | (12,513) | (2.0%) | |||||
| Operating Costs | (130) | (143) | (75,195) | (82,659) | (9.9%) | |||||
| Selling and Administrative Expenses | (16) | (17) | (9,049) | (9,799) | (8.3%) | |||||
| Operating Income | 27 | 27 | 15,571 | 15,886 | 2.0% | |||||
| * | Please take note that these figures could differed from those accounted under Peruvian GAAP. |
ADDITIONALINFORMATION
| Table 25 | ||||||
| Edelnor | 6M 04 | 6M 05 | Chg % | |||
| Customers (Th) | 903 | 915 | 1.3% | |||
| GWh Sold | 2,097 | 2,240 | 6.8% | |||
| Clients/Employee | 1,654 | 1,713 | 3.6% | |||
| Energy Losses % (TTM) | 8.4% | 8.5% | (0.1%) | |||

Pg. 39
| PRESS RELEASE | |
EDESUR(UNDERCHILEANGAAP*)
OPERATINGINCOME
| Table 26 | ||||||||||
| Million US$ | Million Ch$ | |||||||||
| 6M 04 | 6M 05 | 6M 04 | 6M 05 | Chg % | ||||||
| Revenues from Sales | 194 | 207 | 112,371 | 120,018 | 6.8% | |||||
| Other Operating Revenues | 14 | 17 | 7,845 | 9,870 | 25.8% | |||||
| Operating Revenues | 208 | 224 | 120,217 | 129,888 | 8.0% | |||||
| Energy Purchases | (100) | (124) | (57,801) | (72,085) | (24.7%) | |||||
| Other Operating Cost | (77) | (69) | (44,715) | (39,974) | 10.6% | |||||
| Operating Costs | (177) | (194) | (102,516) | (112,059) | (9.3%) | |||||
| Selling and Administrative Expenses | (27) | (27) | (15,549) | (15,894) | (2.2%) | |||||
| Operating Income | 4 | 3 | 2,152 | 1,935 | (10.1%) | |||||
| * | Please take note that these figures could differed from those accounted under Argentinean GAAP. |
ADDITIONALINFORMATION
| Table 27 | ||||||
| Edesur | 6M 04 | 6M 05 | Chg % | |||
| Customers (Th) | 2,128 | 2,152 | 1.1% | |||
| GWh Sold | 6,726 | 6,921 | 2.9% | |||
| Clients/Employee | 939 | 947 | 0.8% | |||
| Energy Losses % (TTM) | 11.8% | 11.7% | 0.1% | |||
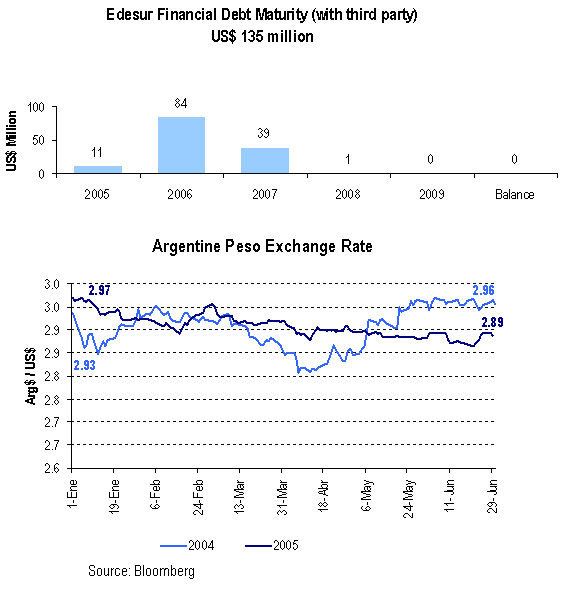
Pg. 40
| PRESS RELEASE | |
PARTIALLYCONSOLIDATEDINCOMESTATEMENT
Parent Company Consolidated with Enersis Internacional First Half 2005 Earnings Report
UNDERCHILEANGAAP,MILLIONCH$
Table 29 | ||||||||||||
| 2Q 04 | 2Q 05 | Var % | (in million Ch$ of 1H05) | 6M 04 | 6M 05 | Var % | ||||||
| 852 | 838 | (1.6%) | Gross Operating Margin | 1,666 | 1,702 | 2.2% | ||||||
| (3,987) | (4,077) | (2.2%) | S&A Expenses | (7,519) | (7,315) | 2.7% | ||||||
| (3,135) | (3,239) | (3.3%) | Operating Income | (5,854) | (5,612) | 4.1% | ||||||
| 15,417 | 8,747 | (43.3%) | Endesa | 20,298 | 18,649 | (8.1%) | ||||||
| 11,113 | 18,391 | 65.5% | Chilectra | 23,500 | 27,798 | 18.3% | ||||||
| (3,751) | (5,264) | (40.3%) | Edesur | (5,446) | (8,492) | (55.9%) | ||||||
| 870 | 1,502 | 72.6% | Edelnor | 1,482 | 2,625 | 77.1% | ||||||
| 4,174 | (16,425) | - | Ampla | 373 | (18,031) | - | ||||||
| (222) | (197) | (11.1%) | Coelce | (473) | 244 | 151.6% | ||||||
| 2,187 | 4,048 | (85.1%) | Codensa | 5,119 | 7,251 | (41.6%) | ||||||
| 1,123 | 442 | (60.7%) | CAM LTDA | 1,662 | 1,834 | 10.3% | ||||||
| 11 | 637 | - | Inm Manso de Velasco | 1,576 | 913 | (42.1%) | ||||||
| 923 | 1,025 | 11.0% | Synapsis | 1,977 | 1,848 | (6.5%) | ||||||
| 3,236 | (478) | (114.8%) | CGTF | 5,713 | 1,712 | (70.0%) | ||||||
| (215) | (4,493) | - | Other | (215) | (4,183) | - | ||||||
| 34,866 | 7,935 | (77.2%) | Net Income from Related Companies | 55,567 | 32,166 | (42.1%) | ||||||
| 12,620 | 12,730 | 0.9% | Interest Income | 26,070 | 25,627 | (1.7%) | ||||||
| (20,161) | (15,662) | 22.3% | Interest Expense | (41,803) | (33,876) | 19.0% | ||||||
| (7,541) | (2,932) | 61.1% | Net Financial Income (Expenses) | (15,733) | (8,249) | 47.6% | ||||||
| 2,349 | 5,733 | 144.1% | Other Non Operating Income | 4,531 | 7,945 | 75.4% | ||||||
| (7,362) | 7,006 | 195.2% | Other Non Operating Expenses | (9,213) | (3,283) | 64.4% | ||||||
| (5,013) | 12,739 | - | Net other Non Operating Income (Expenses) | (4,682) | 4,662 | (199.6%) | ||||||
| (605) | (497) | 17.8% | Price Level Restatement | 4 | (676) | - | ||||||
| 3,099 | (5,882) | (289.8%) | Foreign Exchange Effect | 12,588 | 3,843 | (69.5%) | ||||||
| 2,494 | (6,379) | - | Net Monetary Exposure | 12,592 | 3,167 | 74.8% | ||||||
| (13,249) | (12,878) | 2.8% | Positive Goodwill Amortization | (25,816) | (25,990) | (0.7%) | ||||||
| 11,557 | (1,515) | (113.1%) | Non Operating Income | 21,927 | 5,756 | (73.7%) | ||||||
| 8,421 | (4,754) | (156.5%) | Net Income before (1), (2) & (3) | 16,074 | 144 | (99.1%) | ||||||
| (4,286) | 1,653 | 138.6% | Income Tax (1) | (2,285) | 4,669 | 304.3% | ||||||
| 267 | 10 | (96.2%) | Negative Goodwill Amortization (2) | 358 | 21 | (94.2%) | ||||||
| - | - | NA | Minority Interest (3) | - | - | NA | ||||||
| 4,403 | (3,091) | (170.2%) | NET INCOME | 14,146 | 4,834 | (65.8%) | ||||||
| 0.13 | (0.09) | EPS (Ch$) | 0.43 | 0.15 | ||||||||
| 0.01 | (0.01) | EPADS (US$) | 0.04 | 0.01 | ||||||||
| 32,651,166 | 32,651,166 | Common Shares Outstanding (Th) | 32,651,166 | 32,651,166 | ||||||||
Pg. 41
| PRESS RELEASE | |
UNDERCHILEANGAAP,THOUSANDUS$
Table 29.1 | ||||||||||||
| 2Q 04 | 2Q 05 | Var % | (in thousand US$ of 1H05) | 6M 04 | 6M 05 | Var % | ||||||
| 1,472 | 1,448 | (1.6%) | Gross Operating Margin | 2,877 | 2,940 | 2.2% | ||||||
| (6,887) | (7,041) | (2.2%) | S&A Expenses | (12,987) | (12,633) | 2.7% | ||||||
| (5,415) | (5,594) | (3.3%) | Operating Income | (10,110) | (9,693) | 4.1% | ||||||
| 26,627 | 15,108 | (43.3%) | Endesa | 35,057 | 32,208 | (8.1%) | ||||||
| 19,194 | 31,764 | 65.5% | Chilectra | 40,587 | 48,011 | 18.3% | ||||||
| (6,479) | (9,092) | (40.3%) | Edesur | (9,406) | (14,667) | (55.9%) | ||||||
| 1,503 | 2,594 | 72.6% | Edelnor | 2,560 | 4,533 | 77.1% | ||||||
| 7,209 | (28,368) | - | Ampla | 645 | (31,141) | - | ||||||
| (383) | (341) | (11.1%) | Coelce | (816) | 421 | 151.6% | ||||||
| 3,777 | 6,992 | (85.1%) | Codensa | 8,842 | 12,523 | (41.6%) | ||||||
| 1,940 | 763 | (60.7%) | CAM LTDA | 2,871 | 3,167 | 10.3% | ||||||
| 19 | 1,101 | - | Inm Manso de Velasco | 2,721 | 1,576 | (42.1%) | ||||||
| 1,594 | 1,770 | 11.0% | Synapsis | 3,414 | 3,191 | (6.5%) | ||||||
| 5,588 | (826) | (114.8%) | CGTF | 9,867 | 2,957 | (70.0%) | ||||||
| (372) | (7,760) | - | Others | (371) | (7,224) | - | ||||||
| 60,218 | 13,706 | (77.2%) | Net Income from Related Companies | 95,970 | 55,555 | (42.1%) | ||||||
| 21,796 | 21,986 | 0.9% | Interest Income | 45,025 | 44,261 | (1.7%) | ||||||
| (34,821) | (27,051) | 22.3% | Interest Expense | (72,198) | (58,508) | 19.0% | ||||||
| (13,024) | (5,065) | 61.1% | Net Financial Income (Expenses) | (27,173) | (14,248) | 47.6% | ||||||
| 4,056 | 9,902 | 144.1% | Other Non Operating Income | 7,825 | 13,722 | 75.4% | ||||||
| (12,715) | 12,100 | 195.2% | Other Non Operating Expenses | (15,912) | (5,670) | 64.4% | ||||||
| (8,659) | 22,001 | - | Net other Non Operating Income (Expenses) | (8,086) | 8,052 | (199.6%) | ||||||
| (1,045) | (859) | 17.8% | Price Level Restatement | 6 | (1,168) | - | ||||||
| 5,353 | (10,159) | (289.8%) | Foreign Exchange Effect | 21,741 | 6,638 | (69.5%) | ||||||
| 4,308 | (11,018) | - | Net Monetary Exposure | 21,748 | 5,470 | 74.8% | ||||||
| (22,883) | (22,241) | 2.8% | Positive Goodwill Amortization | (44,588) | (44,888) | (0.7%) | ||||||
| 19,960 | (2,617) | (113.1%) | Non Operating Income | 37,871 | 9,942 | (73.7%) | ||||||
| 14,545 | (8,211) | (156.5%) | Net Income before (1), (2) & (3) | 27,761 | 249 | (99.1%) | ||||||
| (7,402) | 2,855 | 138.6% | Income Tax (1) | (3,947) | 8,064 | 304.3% | ||||||
| 461 | 17 | (96.2%) | Negative Goodwill Amortization (2) | 618 | 36 | (94.2%) | ||||||
| - | - | NA | Minority Interest (3) | - | - | NA | ||||||
| 7,604 | (5,339) | (170.2%) | NET INCOME | 24,430 | 8,348 | (65.8%) | ||||||
| 0.13 | (0.09) | EPS (Ch$) | 0.43 | 0.15 | ||||||||
| 0.01 | (0.01) | EPADS (US$) | 0.04 | 0.01 | ||||||||
| 32,651,166 | 32,651,166 | Common Shares Outstanding (Th) | 32,651,166 | 32,651,166 | ||||||||
Pg. 42
| PRESS RELEASE | |
OWNERSHIP OF THECOMPANY AS OFJUNE30,2005

CONFERENCECALLINVITATION
Enersis is pleased to inform you that it will hold a conference call to review its results for the period, on Thursday, July 28th, 2005, at 12:00 PM (New York time). To participate, please dial +1 (617) 786-4513 or +1 (800) 901-5226 (toll free USA), approximately 10 minutes prior to the scheduled start time, Passcode ID: 32939871
The phone replay will be available since July 29th, 2005, until August 5th, 2005, dialing +1 (617) 801-6888 or 1+ (888) 286-8010 (toll free USA) Passcode ID: 24130812
To access the call online, or to access the replay, go to:http://www.enersis.com Investor Relations, the conference will be complemented by a Power Point “slides show”.
Pg. 43
| PRESS RELEASE | |
CONTACTINFORMATION
For further information, please contact us:
| Susana Rey | ||||||
| Head of Investor Relations | ||||||
| srm@e.enersis.cl | ||||||
| 56 (2) 353 4554 | ||||||
| Cristian Palacios | Marcela Muñoz | Ignacio Gonzalez | Carmen Poblete | |||
| Investor Relations | Investor Relations | Investor Relations | Investor Relations | |||
| Representative | Representative | Representative | Representative | |||
| cpg1@e.enersis.cl | mml1@e.enersis.cl | ijgr@e.enersis.cl | cpt@e.enersis.cl | |||
| 56 (2) 353 4492 | 56 (2) 353 4555 | 56 (2) 353 4552 | 56 (2) 353 4447 | |||
| Mariluz Muñoz | ||||||
| Investor Relations | ||||||
| Assistant | ||||||
| mlmr@e.enersis.cl | ||||||
| 56 (2) 353 4682 | ||||||
DISCLAIMER
This Press Release contains statements that could constitute forward-looking statements within the meaning of the Private Securities Litigation Reform Act of 1995. These statements appear in a number of places in this announcement and include statements regarding the intent, belief or current expectations of Enersis and its management with respect to, among other things: (1) Enersis’ business plans; (2) Enersis’ cost-reduction plans; (3) trends affecting Enersis’ financial condition or results of operations, including market trends in the electricity sector in Chile or elsewhere; (4) supervision and regulation of the electricity sector in Chile or elsewhere; and (5) the future effect of any changes in the laws and regulations applicable to Enersis’ or its affiliates. Such forward-looking statements are not guarantees of future performance and involve risks and uncertainties. Actual results may differ materially from those in the forward-looking statements as a result of various factors. These factors include a decline in the equity capital markets of the United States or Chile, an increase in the market rates of interest in the United States or elsewhere, adverse decisions by government regulators in Chile or elsewhere and other factors described in Enersis’ Annual Report on Form 20-F. Readers are cautioned not to place undue reliance on those forward-looking statements, which state only as of their dates. Enersis undertakes no obligation to release publicly the result of any revisions to these forward-looking statements.
Pg. 44
SIGNATURES
Pursuant to the requirements of the Securities Exchange Act of 1934, as amended, the Registrant has duly caused this report to be signed on its behalf by the undersigned, thereunto duly authorized.
| ENERSIS S.A. | |||||||
| Date: August 2, 2005 | By: | /s/ Mario Valcarce | |||||
| Name: Mario Valcarce | |||||||
| Title: Chief Executive Officer | |||||||