FORM 6-K
Pursuant to Rule 13a-16 or 15d-16 of
the Securities Exchange Act of 1934
For the month of November, 2005
Commission File Number: 001-12440
ENERSIS S.A.
Santa Rosa 76
Santiago, Chile
Indicate by check mark whether the registrant files or will file
annual reports under cover of Form 20-F or Form 40-F:
Form 20-F [X] Form 40-F [ ]
Indicate by check mark if the registrant is submitting the Form 6-K
in paper as permitted by Regulation S-T Rule 101(b)(1):
Yes [ ] No [X]
Indicate by check mark if the registrant is submitting the Form 6-K
in paper as permitted by Regulation S-T Rule 101(b)(7):
Yes [ ] No [X]
Indicate by check mark whether by furnishing the information
contained in this Form, the Registrant is also thereby furnishing the
information to the Commission
pursuant to Rule 12g3-2(b) under the Securities Exchange Act of 1934:
Yes [ ] No [X]
If °;Yes” is marked, indicate below the file number assigned to the registrant
in connection with Rule 12g3-2(b): N/A
 | PRESS RELEASE | |
ENERSIS ANNOUNCES CONSOLIDATED RESULTS FOR
NINE MONTHS ENDED SEPTEMBER 30, 2005
HIGHLIGHTS FOR THE PERIOD
[All figures in Chilean Pesos]
| • | Operating Revenues increased 8.6% to Ch$ 2,374,072 million mainly due to, | |||
| • | 8.9% higher revenues in the Distribution Business | |||
| • | 4.9% higher revenues in the Generation Business | |||
| • | Physical sales confirmed the sustained increase exhibited since 2H03, related to a recovered economic situation with an increase of 5.5% in physical sales in distribution and 7.1% in generation | |||
| • | Electricity sales in GWh, continue growing in all our concession areas, as follows : | |||
| • | Santiago | 4.7% | ||
| • | Buenos Aires | 4.8% | ||
| • | Bogotá | 4.3% | ||
| • | Rio de Janeiro & Fortaleza | 7.3% | ||
| • | Lima | 6.5% | ||
| • | Our client base in distribution grew more than 300 thousand new customers. | |||
| • | Operating Income improved 12.8%, to Ch$ 576,730 million, basically as a consequence of higher Operating Income in the distribution business in Brazil and Colombia, and in the generation business in Brazil and Chile | |||
| • | Non operating income decreased 11.1% mainly due to, | |||
| • | Lower net income from related companies | |||
| • | Higher losses in foreign currencies exchange variation | |||
| • | Higher non-cash losses related to Technical Bulletin 64 | |||
| • | Net income accounted for Ch$ 37,251 million. This implied a 2.3% increase. | |||
| • | The Rating Agency Moody’s improved the rating of Enersis, updating the outlook to positive from stable. Likewise, Standard & Poor´s raised Enersis senior unsecured debt to BBB-. | |||
Pg. 1
| PRESS RELEASE | |
TABLE OF
CONTENTS
Pg. 2
| PRESS RELEASE | |
Pg. 3
| PRESS RELEASE | |
GENERAL INFORMATION
(Santiago, Chile, October 27, 2005) Enersis S.A. (NYSE: ENI), announced today its consolidated financial results for the third quarter, ended September 30, 2005. All figures are in both US$ and Ch$, and in accordance with Chilean Generally Accepted Accounting Principles (Chilean GAAP) as shown in the standarized form required by Chilean authorities (FECU). Variations refer to the period between September 30, 2004 and September 30, 2005. Figures have been adjusted by the one-month lag CPI variation between both periods, equal to 3.0% .
For the purpose of converting Chilean pesos (Ch$) into US dollars (US$), we have used the exchange rate prevailing as of September 2005 for both periods under comparison, equal to US$1 = Ch$529.2. The Chilean peso appreciated by 13.1% against the US$ comparing September 30, 2005 to September 30, 2004.
The consolidation includes the following investment vehicles and companies,
| a) | In Chile: Endesa Chile (NYSE: EOC), Chilectra, Synapsis, CAM and Inm. Manso de Velasco and Elesur. | |
| b) | Outside Chile: Distrilima (Peru), Ampla and Investluz (Brazil), Edesur (Argentina), Codensa (Colombia) and Enersis Internacional. |
In the following pages you will find a detailed analysis of financial statements, a brief explanation for most of variations, and comments on the main items of Income and Cash Flow Statements compared to the information booked as of September 30, 2004.
Pg. 4
| PRESS RELEASE | |
SIMPLIFIEDORGANIZATIONALSTRUCTURE

Pg. 5
| PRESS RELEASE | |
MARKET INFORMATION
EQUITYMARKET
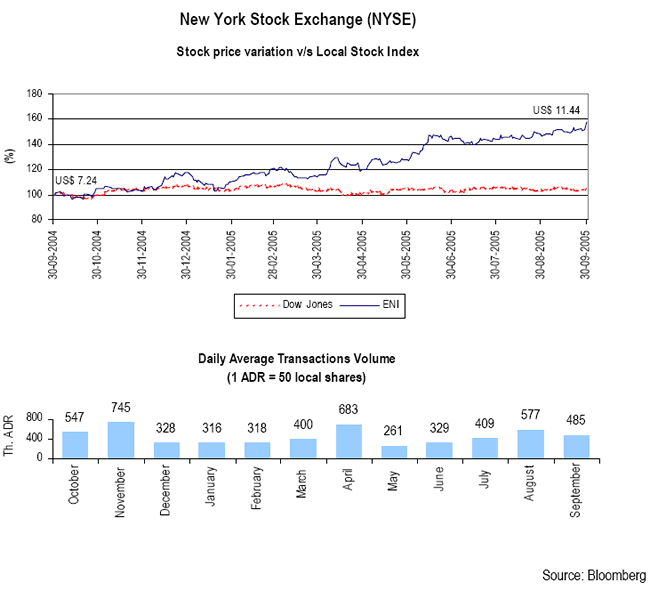
The last 12 months, market capitalization increased 58.01% from US$4,728 million to US$7,471 million; Enersis' ADR changed from US$7.24 to US$11.44. This variation is compared very favorably with respect to the 4.84% variation of the Dow Jones Index for the same period.
Pg. 6
| PRESS RELEASE | |
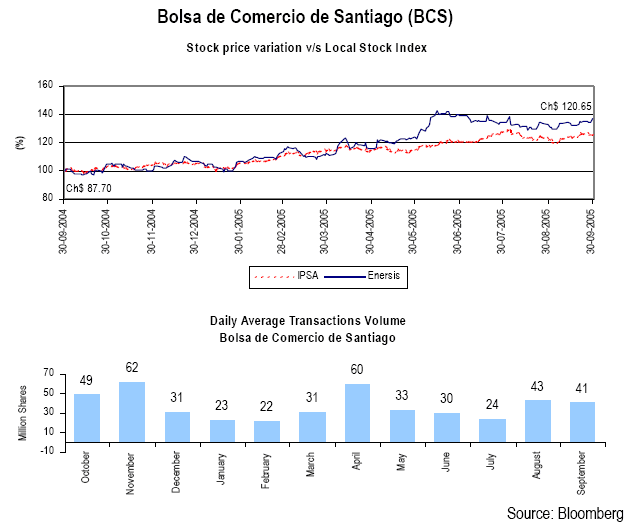
Over the last 12 months, the share price increased 37.57%, from Ch$87.70 to Ch$120.65. This is favorably compared with the 26.11% increase of the IPSA Index.
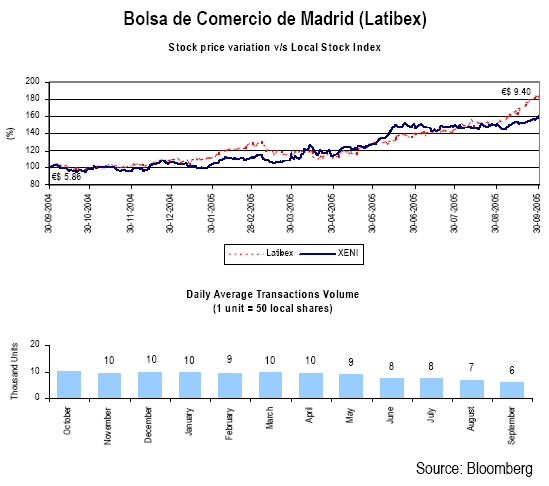
Over the last 12 months, the Enersis share price has increased 60.40%, from € 5.86 to € 9.40, compared to the 84.43% variation of the Latibex Index.
Pg. 7
| PRESS RELEASE | |
MARKETPERCEPTION
The research released during the period on Enersis shows the following target prices for the ADR.
| Table 1 | ||||||||
Publication Date | Company | Main Analyst | Target Price | Recommendation | ||||
| US$ | ||||||||
| August 29, 2005 | Raymond James | Ricardo Cavanagh | 12.50 | Buy | ||||
| August 23, 2005 | Santander Invest. | Raimundo Valdés | 11.70 | Buy | ||||
| ADR average target price (US$) | 12.10 | |||||||
DEBTMARKET
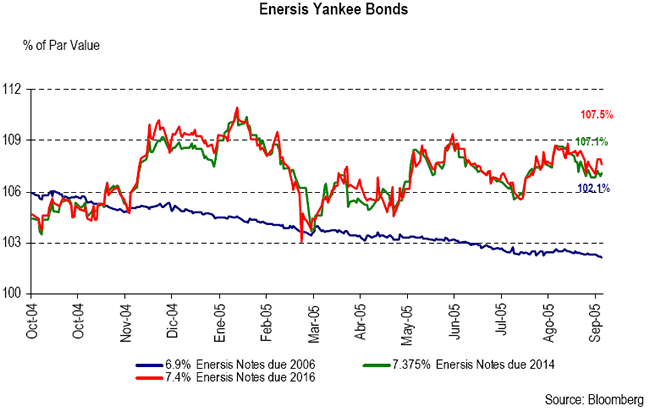
The following chart shows the pricing of our Yankee Bonds during the last twelve months.
Pg. 8
| PRESS RELEASE | |
RISK RATING CLASSIFICATION
CORPORATE RISK RATING CLASSIFICATION:
| Moody’s: | Ba1 / Positive |
Rationale (14/10/05)
“Moody’s Investors Service affirmed the rating of Enersis”… “and revised the rating outlook”… “to positive from stable”... “The change in outlook reflects improving financial performance, changes in the regulatory framework in Chile that are favorable for the company, and stronger demand growth for electricity in several countries in which Enersis and Endesa have operations.”
| Standard & Poor’s: | BBB- / Positive |
Rationale (26/10/05)
“Standard & Poor’s raised Enersis’ senior unsecured debt to BBB- from BB+, eliminating the one-notch difference between Enersis’s corporate credit rating and the rating of its senior secured debt”.
“The BBB- corporate credit rating on Enersis is based on its good business profile, which reflects the strong creditworthiness of its Chilean investments, the strong competitive position in the countries where it operates (Argentina, Brazil, Chile, Colombia, and Peru), and the growing demand for power in the region.”
| Fitch: | BBB- / Positive |
Rationale (09/02/05)
“…Operating income continues to grow reflecting improved regional economic conditions, strong demand growth, and lower regulatory uncertainties. Further improvement along this trend may result in additional positive rating actions.”
DOMESTIC RISK RATING CLASSIFICATION:
| Feller Rate: | Bonds: | A+ / Stable | |||||||
| Shares: | 1stClass Level 1 | ||||||||
| Fitch: | Bonds: | A+ / Stable | |||||||
| Shares: | 1stClass Level 1 | ||||||||
Pg. 9
| PRESS RELEASE | |
CONSOLIDATED INCOME STATEMENT
UNDERCHILEANGAAP, MILLIONCH$
| Table 2 | ||||||||
| CONS. INCOME STATEMENT - (million Ch$) | 9M 04 | 9M 05 | Var 05-04 | Chg % | ||||
| Revenues from Generation | 812,560 | 852,593 | 40,033 | 4.9% | ||||
| Revenues from Distribution | 1,504,518 | 1,638,936 | 134,418 | 8.9% | ||||
| Revenues from Engineering and Real Estate | 21,015 | 20,937 | (78) | (0.4%) | ||||
| Revenues from Other Businesses | 109,587 | 115,625 | 6,038 | 5.5% | ||||
| Consolidation Adjustments | (260,910) | (254,019) | 6,891 | 2.6% | ||||
| Operating Revenues | 2,186,770 | 2,374,072 | 187,302 | 8.6% | ||||
| Costs from Generation | (503,966) | (535,719) | (31,753) | (6.3%) | ||||
| Costs from Distribution | (1,172,054) | (1,243,642) | (71,588) | (6.1%) | ||||
| Costs from Engineering and Real Estate | (18,368) | (17,157) | 1,211 | 6.6% | ||||
| Costs from Other Businesses | (87,459) | (93,198) | (5,739) | (6.6%) | ||||
| Consolidation Adjustments | 242,959 | 234,527 | (8,432) | (3.5%) | ||||
| Operating Costs | (1,538,888) | (1,655,189) | (116,301) | (7.6%) | ||||
| Operating Margin | 647,882 | 718,883 | 71,001 | 11.0% | ||||
| SG&A from Generation | (24,591) | (27,556) | (2,965) | (12.1%) | ||||
| SG&A from Distribution | (109,121) | (112,203) | (3,082) | (2.8%) | ||||
| SG&A from Engineering and Real Estate | (2,392) | (2,301) | 91 | 3.8% | ||||
| SG&A from Other Businesses | (22,468) | (23,102) | (634) | (2.8%) | ||||
| Consolidation Adjustments | 21,888 | 23,009 | 1,121 | 5.1% | ||||
| Selling and Administrative Expenses | (136,684) | (142,153) | (5,469) | (4.0%) | ||||
| Operating Income | 511,198 | 576,730 | 65,532 | 12.8% | ||||
| Interest Income | 56,158 | 64,118 | 7,960 | 14.2% | ||||
| Interest Expense | (279,647) | (265,163) | 14,484 | 5.2% | ||||
| Net Financial Income (Expenses) | (223,488) | (201,045) | 22,443 | 10.0% | ||||
| Equity Gains from Related Companies | 29,216 | 13,443 | (15,773) | (54.0%) | ||||
| Equity Losses from Related Companies | (0) | (8,516) | (8,515) | - | ||||
| Net Income from Related Companies | 29,216 | 4,927 | (24,289) | (83.1%) | ||||
| Other Non Operating Income | 41,829 | 62,652 | 20,823 | 49.8% | ||||
| Other Non Operating Expenses | (99,238) | (129,945) | (30,707) | (30.9%) | ||||
| Net other Non Operating Income (Expense) | (57,410) | (67,293) | (9,883) | (17.2%) | ||||
| Price Level Restatement | (925) | (1,521) | (596) | (64.5%) | ||||
| Foreign Exchange Effect | 13,038 | (5,720) | (18,758) | (143.9%) | ||||
| Net of Monetary Exposure | 12,113 | (7,241) | (19,354) | (159.8%) | ||||
| Positive Goodwill Amortization | (40,917) | (40,980) | (63) | (0.2%) | ||||
| Non Operating Income | (280,486) | (311,632) | (31,146) | (11.1%) | ||||
| Net Inc b. Taxes, Min Int and Neg Goodwill Amort. | 230,712 | 265,098 | 34,386 | 14.9% | ||||
| Extraordinary Items | - | - | - | - | ||||
| Income Tax | (130,343) | (134,580) | (4,237) | (3.3%) | ||||
| Minority Interest | (77,950) | (105,257) | (27,307) | (35.0%) | ||||
| Negative Goodwill Amortization | 13,996 | 11,990 | (2,006) | (14.3%) | ||||
| NET INCOME | 36,415 | 37,251 | 836 | 2.3% | ||||
| EBITDA | 827,120 | 866,386 | 39,266 | 4.7% | ||||
Pg. 10
| PRESS RELEASE | |
UNDERCHILEANGAAP, THOUSANDUS$
| Table 2.1 | ||||||||
| CONS. INCOME STATEMENT - (thousand US$) | 9M 04 | 9M 05 | Var 05-04 | Chg % | ||||
| Revenues from Generation | 1,535,449 | 1,611,098 | 75,649 | 4.9% | ||||
| Revenues from Distribution | 2,843,004 | 3,097,007 | 254,003 | 8.9% | ||||
| Revenues from Engineering and Real Estate | 39,711 | 39,564 | (147) | (0.4%) | ||||
| Revenues from Other Businesses | 207,081 | 218,490 | 11,409 | 5.5% | ||||
| Consolidation Adjustments | (493,028) | (480,005) | 13,023 | 2.6% | ||||
| Operating Revenues | 4,132,218 | 4,486,152 | 353,934 | 8.6% | ||||
| Costs from Generation | (952,317) | (1,012,319) | (60,002) | (6.3%) | ||||
| Costs from Distribution | (2,214,765) | (2,350,041) | (135,276) | (6.1%) | ||||
| Costs from Engineering and Real Estate | (34,709) | (32,421) | 2,288 | 6.6% | ||||
| Costs from Other Businesses | (165,266) | (176,112) | (10,846) | (6.6%) | ||||
| Consolidation Adjustments | 459,106 | 443,174 | (15,932) | (3.5%) | ||||
| Operating Costs | (2,907,952) | (3,127,719) | (219,767) | (7.6%) | ||||
| Operating Margin | 1,224,267 | 1,358,433 | 134,166 | 11.0% | ||||
| SG&A from Generation | (46,468) | (52,071) | (5,603) | (12.1%) | ||||
| SG&A from Distribution | (206,200) | (212,024) | (5,824) | (2.8%) | ||||
| SG&A from Engineering and Real Estate | (4,519) | (4,347) | 172 | 3.8% | ||||
| SG&A from Other Businesses | (42,457) | (43,655) | (1,198) | (2.8%) | ||||
| Consolidation Adjustments | 41,360 | 43,478 | 2,118 | 5.1% | ||||
| Selling and Administrative Expenses | (258,284) | (268,619) | (10,335) | (4.0%) | ||||
| Operating Income | 965,983 | 1,089,814 | 123,831 | 12.8% | ||||
| Interest Income | 106,119 | 121,161 | 15,042 | 14.2% | ||||
| Interest Expense | (528,433) | (501,065) | 27,368 | 5.2% | ||||
| Net Financial Income (Expenses) | (422,313) | (379,904) | 42,409 | 10.0% | ||||
| Equity Gains from Related Companies | 55,208 | 25,402 | (29,806) | (54.0%) | ||||
| Equity Losses from Related Companies | (1) | (16,091) | (16,090) | - | ||||
| Net Income from Related Companies | 55,207 | 9,311 | (45,896) | (83.1%) | ||||
| Other Non Operating Income | 79,041 | 118,390 | 39,349 | 49.8% | ||||
| Other Non Operating Expenses | (187,525) | (245,549) | (58,024) | (30.9%) | ||||
| Net other Non Operating Income (Expense) | (108,484) | (127,159) | (18,675) | (17.2%) | ||||
| Price Level Restatement | (1,748) | (2,874) | (1,126) | (64.5%) | ||||
| Foreign Exchange Effect | 24,637 | (10,809) | (35,446) | (143.9%) | ||||
| Net of Monetary Exposure | 22,890 | (13,683) | (36,573) | (159.8%) | ||||
| Positive Goodwill Amortization | (77,319) | (77,438) | (119) | (0.2%) | ||||
| Non Operating Income | (530,019) | (588,873) | (58,854) | (11.1%) | ||||
| Net Inc b. Taxes, Min Int and Neg Goodwill Amort. | 435,964 | 500,941 | 64,977 | 14.9% | ||||
| Extraordinary Items | - | - | - | - | ||||
| Income Tax | (246,301) | (254,307) | (8,006) | (3.3%) | ||||
| Minority Interest | (147,297) | (198,899) | (51,602) | (35.0%) | ||||
| Negative Goodwill Amortization | 26,448 | 22,658 | (3,790) | (14.3%) | ||||
| NET INCOME | 68,813 | 70,392 | 1,579 | 2.3% | ||||
| EBITDA | 1,562,964 | 1,637,161 | 74,197 | 4.7% | ||||
Pg. 11
| PRESS RELEASE | |
CONSOLIDATED INCOME STATEMENT ANALYSIS
(Source in Ch$ FECU)
NETINCOME
As of September 2005, the company registered profits of Ch$37,251 million that represent an increase of Ch$836 million or 2.3% . The increase in results is explained by a 12.8% increase in operating income, partially offset by a 11.1% increase in non operating losses and a 35% increase in minority interest expense.
OPERATINGINCOME
Activities of Enersis are developed through subsidiaries in five different countries. The core businesses of the Company are generation and distribution of electricity.
| Table 3 | ||||||||||||||||
9M 04 | 9M 05 | |||||||||||||||
Million Ch$ | Operating Revenues | Operating Costs | SG & A | Operating Income | Operating Revenues | Operating Costs | SG& A | Operating Income | ||||||||
| Endesa | 828,590 | (517,699) | (25,487) | 285,404 | 867,839 | (549,035) | (28,460) | 290,344 | ||||||||
| Chilectra S.A. | 373,692 | (256,317) | (29,826) | 87,549 | 428,547 | (311,743) | (29,010) | 87,794 | ||||||||
| Edesur S.A. | 171,893 | (147,979) | (22,670) | 1,244 | 177,642 | (158,099) | (21,906) | (2,363) | ||||||||
| Distrilima (Edelnor) | 147,132 | (111,547) | (13,439) | 22,146 | 148,716 | (113,155) | (13,409) | 22,152 | ||||||||
| Ampla | 298,478 | (245,550) | (11,911) | 41,017 | 355,315 | (279,907) | (13,603) | 61,805 | ||||||||
| Investluz (Coelce) | 213,311 | (186,557) | (24,857) | 1,897 | 230,548 | (165,173) | (26,255) | 39,120 | ||||||||
| Codensa S.A. | 300,011 | (224,104) | (6,417) | 69,490 | 298,168 | (215,565) | (8,021) | 74,582 | ||||||||
| CAM Ltda. | 72,339 | (61,244) | (5,252) | 5,843 | 81,088 | (68,588) | (5,959) | 6,541 | ||||||||
| Inmobiliaria Manso de Velasco Ltda. | 4,986 | (4,636) | (1,496) | (1,146) | 5,691 | (3,842) | (1,397) | 452 | ||||||||
| Synapsis Soluciones y Servicios IT Ltda. | 33,838 | (25,340) | (4,326) | 4,172 | 31,118 | (23,793) | (5,210) | 2,115 | ||||||||
| Enersis Holding and other investment vehicles | 3,410 | (874) | (12,891) | (10,355) | 3,419 | (816) | (11,932) | (9,329) | ||||||||
| Consolidation Adjustments | (260,910) | 242,959 | 21,888 | 3,937 | (254,019) | 234,527 | 23,009 | 3,517 | ||||||||
| Total Consolidation | 2,186,770 | (1,538,888) | (136,684) | 511,198 | 2,374,072 | (1,655,189) | (142,153) | 576,730 | ||||||||
| Table 3.1 | ||||||||||||||||
9M 04 | 9M 05 | |||||||||||||||
Thousand US$ | Operating Revenues | Operating Costs | SG & A | Operating Income | Operating Revenues | Operating Costs | SG& A | Operating Income | ||||||||
| Endesa | 1,565,740 | (978,268) | (48,162) | 539,310 | 1,639,908 | (1,037,480) | (53,779) | 548,648 | ||||||||
| Chilectra S.A. | 706,145 | (484,348) | (56,360) | 165,437 | 809,802 | (589,084) | (54,819) | 165,899 | ||||||||
| Edesur S.A. | 324,817 | (279,628) | (42,838) | 2,351 | 335,681 | (298,751) | (41,395) | (4,464) | ||||||||
| Distrilima (Edelnor) | 278,027 | (210,784) | (25,396) | 41,847 | 281,021 | (213,823) | (25,338) | 41,860 | ||||||||
| Ampla | 564,017 | (464,002) | (22,507) | 77,508 | 671,420 | (528,925) | (25,705) | 116,790 | ||||||||
| Investluz (Coelce) | 403,082 | (352,526) | (46,970) | 3,585 | 435,654 | (312,118) | (49,613) | 73,924 | ||||||||
| Codensa S.A. | 566,914 | (423,477) | (12,125) | 131,312 | 563,431 | (407,341) | (15,157) | 140,933 | ||||||||
| CAM Ltda. | 136,695 | (115,729) | (9,925) | 11,041 | 153,228 | (129,607) | (11,260) | 12,361 | ||||||||
| Inmobiliaria Manso de Velasco Ltda. | 9,422 | (8,760) | (2,827) | (2,166) | 10,754 | (7,260) | (2,640) | 855 | ||||||||
| Synapsis Soluciones y Servicios IT Ltda. | 63,942 | (47,884) | (8,174) | 7,884 | 58,802 | (44,960) | (9,845) | 3,996 | ||||||||
| Enersis Holding and other investment vehicles | 6,444 | (1,652) | (24,360) | (19,568) | 6,461 | (1,542) | (22,547) | (17,629) | ||||||||
| Consolidation Adjustments | (493,027) | 459,106 | 41,360 | 7,439 | (480,005) | 443,174 | 43,479 | 6,647 | ||||||||
| Total Consolidation | 4,132,218 | (2,907,953) | (258,283) | 965,982 | 4,486,156 | (3,127,717) | (268,619) | 1,089,820 | ||||||||
Operating income as of September 2005 amounted to Ch$576,730 million, reflecting a 12.8% increase or Ch$65,532 million. This increase is principally due to an important improvement in operating income in the distribution subsidiaries in Brazil and Colombia.
NONOPERATINGINCOME
The company’s non-operating result decreased 11.1% or Ch$31,146 million from a loss of Ch$280,486 million to a loss of Ch$311,632 million. This is principally explained by the negative conversion effect as a result of the application of the Technical Bulletin N°64 of Chilean GAAP, the negative exchange rate
Pg. 12
| PRESS RELEASE | |
variations and lower income from related companies. This was partially compensated with lower net interest expenses.
Net Interest Expensedecreased by Ch$22,443 million or 10.0% from a net expense of Ch$223,488 million in 2004 to a net expense of Ch$201,045 million. This reduction in net interest expense is mainly due to lower fee expenses and higher interest income from the investment of cash surplus in Codensa and Ampla.
Income from investments in related companies shows an 83.1% decrease or Ch$24,289 million. This is mainly attributable to lower profits of Ch$20,086 million recognized from Cia. de Interconexión Energética (CIEN), Ch$4,150 million from Central Generadora de Fotaleza (CGTF) and Ch$1,640 million from Inversiones Eléctricas Quillota. This was partially compensated by higher profits recognition of Ch$1,557 million from Gas Atacama Holding Ltda.
Amortization on positive goodwill remains at the same levels with no significant variations. This amounted to Ch$40,980 million.
Net other non-operating expenses reflect an increase of Ch$9,883 million. The principal reasons for this variation are,
| • | Higher losses of Ch$8,120 million as a result of the adjustment on the conversion to Chilean GAAP following the application of Technical Bulletin Nº 64, principally on our Brazilian subsidiary Ampla. | |
| • | Non recurring indemnity of Ch$8,021 million received by Edesur in 2004 from Alstom-Pirelli in the case involving the Azopardo sub-station fire. | |
| • | An increase of $5,201 million in provisions on contingencies and lawsuits. | |
| • | Lower net income amounting to Ch$4,247 million on derivative instrument contracts. | |
| • | Higher losses due to adjustments to investments in related companies of Ch$2,207 million. | |
| • | An increase of Ch$1,148 million in the equity tax of 1.2% on all companies established in Colombia. | |
| • | Higher net losses of Ch$1,477 million from the sale of assets and materials. |
This items were partially compensated by the following:
| • | Lower losses related to taxable fines and other expenses of Ch$6,445 million. | |
| • | Price adjustment in the purchase of Elesur of Ch$4,538 million. | |
| • | Higher revenues related to gas transport services of Ch$4,520 million. | |
| • | Revenues from the sale of transmission lines rights of Ch$3,899 million. |
Price-level restatementlosses increased by Ch$596 million. This is principally due to adjustments effects related to financial contributions in Chilectra for Ch$1,058 million.
Foreign exchange differences decreased by Ch$18,758 million.This is primarily due to the profit of liquidation of forwards contracts of Ch$3,986 and the exchange rate variations between the two periods over the mismatch netting US$ structure of the company. During this semester, the appreciation of the Chilean Peso against the US Dollar was 5.1% compared to 2.5% devaluation in the previous period.
Pg. 13
| PRESS RELEASE | |
Income Tax and Deferred Taxes. increased by Ch$4,237 million, from an expense of Ch$130,343 to an expense of Ch$134,580 million.
The increase of Ch$12,373 million inincome tax is mainly explained by lower taxes in Edelnor, Investluz, Elesur, Ampla an Edegel of Ch$5,296 million, Ch$4,019, Ch$3,734 million, Ch$2,422 million and Ch$1,238 million respectively. This was partially compensated by lower tax provisions of Ch$5,851 million in Chilectra and Ch$1,473 million in Codensa.
With regard todeferred taxes, that do not represent cash flow, these show a positive variation of Ch$8,136 million, explained mainly by the decrease on deferred taxes in Edelnor for Ch$ 10,603 million, Edegel for Ch$10,191 million, Edesur for Ch$6,286 million, Endesa Costanera for Ch$4,318 million, San Isidro for Ch$4,065 million and Enersis for Ch$3,209 million, partially compensated by higher deferred taxes in Chilectra for Ch$9,341 million, Coelce for Ch$7,023 million, Endesa Chile for Ch$6,034 million, Pehuenche for Ch$4,030 million, Chocón for Ch$2,172 million and Ampla for Ch$2,087 million.
Amortization on negative goodwill amounted to Ch$11,990 million which reflects a reduction of Ch$2,006 million, explained by the effect of exchange rate applied in foreign subsidiaries accounted in dollars and that have a negative goodwill.
Pg. 14
| PRESS RELEASE | |
EVOLUTIONOFKEYFINANCIALRATIOS
| Table 4 | ||||||||||
Indicator | Unit | 9M 04 | 9M 05 | Var 05-04 | Chg % | |||||
| Liquidity | Times | 1.42 | 1.10 | (0.32) | (22.5%) | |||||
| Acid ratio test * | Times | 1.30 | 1.00 | (0.30) | (23.1%) | |||||
| Working capital | million Ch$ | 449,163 | 117,032 | (332,131) | (73.9%) | |||||
| Working capital | th. US$ | 848,758 | 221,149 | (627,609) | (73.9%) | |||||
| Leverage ** | Times | 0.83 | 0.88 | 0.05 | 6.0% | |||||
| Short-term debt | % | 0.21 | 0.24 | 0.03 | 14.3% | |||||
| Long-term debt | % | 0.79 | 0.76 | (0.03) | (3.8%) | |||||
| Interest Coverage*** | Times | 3.31 | 3.50 | 0.19 | 5.7% | |||||
| EBITDA**** | th. US$ | 1,562,964 | 1,637,161 | 74,197 | 4.7% | |||||
| ROE | % | 1.34% | 1.44% | 0.10% | 7.5% | |||||
| ROA | % | 0.32% | 0.37% | 0.05% | 15.6% | |||||
| * Current assets net of inventories and pre-paid expenses | ||||||||||
| ** Using the ratio = Total debt / (equity + minority interest) | ||||||||||
| ***EBITDAEI/Interest expenses = (Earnings before taxes+Fin exp+Net non operating income+depreciation+Positive Goodwill)/Interest expenses | ||||||||||
| ****EBITDA: Operating Income+Depreciation+Amortization | ||||||||||
Liquidity ratioas of September 2005 was 1.10, reflecting a decrease of 0.32 compared to 2004. This is explained by the reduction in time deposits for capital reduction purposes in some subsidiaries. Nevertheless, the company is still showing a strong liquidity shape after the capital reduction and refinancing done during the last two years.
Leverage as of September 2005 was 0.88, compared with the 0.83 registered last year. This is mainly explained by the exchange rate effects in Chile.
ROE as of September 2005 was 1.44% compared with the 1.34% in 2004, mainly explained by the higher net income during 2005.
ROAincreased from 0.32% to 0.37% explained by the higher net income and lower total assets.
Interest Coverage improved 5.7%, from 3.31 to 3.50, mainly due to the reduction in interest expense and to the 4.7% increase of EBITDA, from US$1,563 million to US$1,637 million.
Pg. 15
| PRESS RELEASE | |
CONSOLIDATED BALANCE SHEET
ASSETSUNDERCHILEANGAAP,MILLIONCH$
| Table 5 | ||||||||
| ASSETS - (million Ch$) | 9M 04 | 9M 05 | Var 05-04 | Chg % | ||||
| CURRENT ASSETS | ||||||||
| Cash | 59,813 | 55,531 | (4,282) | (7.2%) | ||||
| Time deposits | 371,917 | 225,408 | (146,510) | (39.4%) | ||||
| Marketable securities | 15,146 | 3,858 | (11,288) | (74.5%) | ||||
| Accounts receivable, net | 570,157 | 607,517 | 37,360 | 6.6% | ||||
| Notes receivable, net | 2,719 | 3,728 | 1,009 | 37.1% | ||||
| Other accounts receivable, net | 42,694 | 69,916 | 27,222 | 63.8% | ||||
| Amounts due from related companies | 132,588 | 12,058 | (120,531) | (90.9%) | ||||
| Inventories | 81,450 | 78,658 | (2,792) | (3.4%) | ||||
| Income taxes recoverable | 91,660 | 71,318 | (20,342) | (22.2%) | ||||
| Prepaid expenses | 41,386 | 43,698 | 2,312 | 5.6% | ||||
| Deferred income taxes | 72,461 | 42,276 | (30,185) | (41.7%) | ||||
| Other current assets | 45,801 | 31,277 | (14,523) | (31.7%) | ||||
| Total currrent assets | 1,527,792 | 1,245,241 | (282,551) | (18.5%) | ||||
| PROPERTY, PLANT AND EQUIPMENT | ||||||||
| Land | 121,387 | 122,812 | 1,425 | 1.2% | ||||
| Buildings and infraestructure and works in progress | 10,745,641 | 9,771,586 | (974,055) | (9.1%) | ||||
| Machinery and equipment | 1,888,444 | 1,648,723 | (239,721) | (12.7%) | ||||
| Other plant and equipment | 361,766 | 402,923 | 41,157 | 11.4% | ||||
| Technical appraisal | 654,148 | 556,975 | (97,173) | (14.9%) | ||||
Sub - Total | 13,771,387 | 12,503,018 | (1,268,369) | (9.2%) | ||||
| Accumulated depreciation | (5,368,099) | (5,131,999) | 236,100 | 4.4% | ||||
| Total property, plant and equipment | 8,403,287 | 7,371,019 | (1,032,268) | (12.3%) | ||||
| OTHER ASSETS | ||||||||
| Investments in related companies | 213,518 | 173,145 | (40,373) | (18.9%) | ||||
| Investments in other companies | 105,128 | 45,283 | (59,845) | (56.9%) | ||||
| Positive goodwill, net | 767,785 | 708,024 | (59,761) | (7.8%) | ||||
| Negative goodwill, net | (69,788) | (41,888) | 27,900 | 40.0% | ||||
| Long-term receivables | 113,302 | 107,668 | (5,634) | (5.0%) | ||||
| Amounts due from related companies | 777 | 98,357 | 97,580 | - | ||||
| Intangibles | 88,355 | 80,150 | (8,205) | (9.3%) | ||||
| Accumulated amortization | (46,947) | (47,041) | (94) | (0.2%) | ||||
| Others assets | 177,958 | 264,263 | 86,305 | 48.5% | ||||
| Total other assets | 1,350,090 | 1,387,960 | 37,870 | 2.8% | ||||
| TOTAL ASSETS | 11,281,169 | 10,004,220 | (1,276,949) | (11.3%) | ||||
Pg. 16
| PRESS RELEASE | |
ASSETSUNDERCHILEANGAAP,THOUSANDUS$
| Table 5.1 | ||||||||
| ASSETS - (thousand US$) | 9M 04 | 9M 05 | Var 05-04 | Chg % | ||||
| CURRENT ASSETS | ||||||||
| Cash | 113,026 | 104,933 | (8,093) | (7.2%) | ||||
| Time deposits | 702,791 | 425,940 | (276,851) | (39.4%) | ||||
| Marketable securities | 28,620 | 7,290 | (21,330) | (74.5%) | ||||
| Accounts receivable, net | 1,077,394 | 1,147,991 | 70,597 | 6.6% | ||||
| Notes receivable, net | 5,138 | 7,045 | 1,907 | 37.1% | ||||
| Other accounts receivable, net | 80,676 | 132,116 | 51,440 | 63.8% | ||||
| Amounts due from related companies | 250,545 | 22,785 | (227,760) | (90.9%) | ||||
| Inventories | 153,911 | 148,636 | (5,275) | (3.4%) | ||||
| Income taxes recoverable | 173,204 | 134,766 | (38,438) | (22.2%) | ||||
| Prepaid expenses | 78,205 | 82,574 | 4,369 | 5.6% | ||||
| Deferred income taxes | 136,926 | 79,886 | (57,040) | (41.7%) | ||||
| Other current assets | 86,547 | 59,102 | (27,445) | (31.7%) | ||||
| Total currrent assets | 2,886,984 | 2,353,063 | (533,921) | (18.5%) | ||||
| PROPERTY, PLANT AND EQUIPMENT | ||||||||
| Land | 229,378 | 232,071 | 2,693 | 1.2% | ||||
| Buildings and infraestructure and works in progress | 20,305,445 | 18,464,825 | (1,840,620) | (9.1%) | ||||
| Machinery and equipment | 3,568,489 | 3,115,500 | (452,989) | (12.7%) | ||||
| Other plant and equipment | 683,610 | 761,382 | 77,772 | 11.4% | ||||
| Technical appraisal | 1,236,107 | 1,052,484 | (183,623) | (14.9%) | ||||
| Sub - Total | 26,023,029 | 23,626,263 | (2,396,766) | (9.2%) | ||||
| Accumulated depreciation | (10,143,800) | (9,697,656) | 446,144 | 4.4% | ||||
| Total property, plant and equipment | 15,879,228 | 13,928,607 | (1,950,621) | (12.3%) | ||||
| OTHER ASSETS | ||||||||
| Investments in related companies | 403,473 | 327,182 | (76,291) | (18.9%) | ||||
| Investments in other companies | 198,655 | 85,568 | (113,087) | (56.9%) | ||||
| Positive goodwill, net | 1,450,841 | 1,337,914 | (112,927) | (7.8%) | ||||
| Negative goodwill, net | (131,875) | (79,154) | 52,721 | 40.0% | ||||
| Long-term receivables | 214,101 | 203,454 | (10,647) | (5.0%) | ||||
| Amounts due from related companies | 1,468 | 185,860 | 184,392 | - | ||||
| Intangibles | 166,960 | 151,455 | (15,505) | (9.3%) | ||||
| Accumulated amortization | (88,713) | (88,892) | (179) | (0.2%) | ||||
| Others assets | 336,277 | 499,363 | 163,086 | 48.5% | ||||
| Total other assets | 2,551,187 | 2,622,751 | 71,564 | 2.8% | ||||
| TOTAL ASSETS | 21,317,402 | 18,904,421 | (2,412,981) | (11.3%) | ||||
Pg. 17
| PRESS RELEASE | |
LIABILITIES ANDSHAREHOLDERSEQUITYUNDERCHILEANGAAP,MILLIONCH$
| Table 6 | ||||||||
| LIABILITIES AND SHAREHOLDER´S EQUITY - (million Ch$) | 9M 04 | 9M 05 | Var 05-04 | Chg % | ||||
| CURRENT LIABILITIES | ||||||||
| Short-term debt due to banks and financial institutions | 246,197 | 95,797 | (150,400) | 61.1% | ||||
| Current portion of long-term debt due to banks and financial institutions | 122,235 | 107,269 | (14,966) | 12.2% | ||||
| Promissory notes | - | - | - | |||||
| Current portion of bonds payable | 83,414 | 317,016 | 233,602 | - | ||||
| Current portion of long-term notes payable | 25,180 | 26,587 | 1,407 | (5.6%) | ||||
| Dividends payable | 3,940 | 16,556 | 12,616 | - | ||||
| Accounts payable | 215,418 | 243,755 | 28,336 | (13.2%) | ||||
| Short-term notes payable | 7,133 | 14,956 | 7,823 | (109.7%) | ||||
| Miscellaneous payables | 47,559 | 57,552 | 9,993 | (21.0%) | ||||
| Accounts payable to related companies | 91,544 | 49,844 | (41,700) | 45.6% | ||||
| Accrued expenses | 61,842 | 56,621 | (5,221) | 8.4% | ||||
| Withholdings | 60,126 | 48,472 | (11,653) | 19.4% | ||||
| Income taxes payable | 38,258 | 55,039 | 16,781 | (43.9%) | ||||
| Anticipated income | 8,695 | 4,361 | (4,334) | 49.8% | ||||
| Deferred income taxes | - | - | - | - | ||||
| Reinbursable financial contribution | 2,279 | 1,870 | (409) | 17.9% | ||||
| Other current liabilities | 64,809 | 32,514 | (32,295) | 49.8% | ||||
| Total current liabilities | 1,078,629 | 1,128,209 | 49,580 | (4.6%) | ||||
| LONG-TERM LIABILITIES | ||||||||
| Due to banks and financial institutions | 742,522 | 546,925 | (195,597) | 26.3% | ||||
| Bonds payable | 2,645,551 | 2,249,182 | (396,369) | 15.0% | ||||
| Long -term notes payable | 174,209 | 118,486 | (55,724) | 32.0% | ||||
| Accounts payables | 25,833 | 48,827 | 22,994 | (89.0%) | ||||
| Amounts payable to related companies | - | 9,631 | 9,631 | - | ||||
| Accrued expenses | 338,264 | 329,090 | (9,174) | 2.7% | ||||
| Deferred income taxes | 64,464 | 73,302 | 8,838 | (13.7%) | ||||
| Reinbursable financial contribution | 7,129 | 4,895 | (2,234) | 31.3% | ||||
| Other long-term liabilities | 40,469 | 173,478 | 133,009 | - | ||||
| Total long-term liabilities | 4,038,439 | 3,553,814 | (484,625) | 12.0% | ||||
| Minority interest | 3,453,966 | 2,742,877 | (711,089) | (20.6%) | ||||
| SHAREHOLDERS´ EQUITY | ||||||||
| Paid-in capital, no par value | 2,294,543 | 2,283,404 | (11,139) | (0.5%) | ||||
| Additional paid-in capital | 43,596 | 54,802 | 11,206 | 25.7% | ||||
| Additional paid-in capital (share premium) | 166,626 | 166,631 | 5 | 0.0% | ||||
| Other reserves | (27,163) | (190,505) | (163,342) | - | ||||
Total capital and reserves | 2,477,603 | 2,314,332 | (163,270) | (6.6%) | ||||
| Retained earnings | 198,855 | 227,736 | 28,880 | 14.5% | ||||
| Net income for the period | 36,415 | 37,251 | 836 | 2.3% | ||||
| Deficits of subsidaries in development stage | (2,738) | - | 2,738 | (100.0%) | ||||
Total retained earnings | 232,533 | 264,987 | 32,454 | 14.0% | ||||
| Total shareholder´s equity | 2,710,135 | 2,579,320 | (130,815) | (4.8%) | ||||
| TOTAL LIABILITIES AND SHAREHOLDER´S EQUITY | 11,281,169 | 10,004,220 | (1,276,949) | (11.3%) | ||||
Pg. 18
| PRESS RELEASE | |
LIABILITIES ANDSHAREHOLDERSEQUITYUNDERCHILEANGAAP,THOUSANDUS$
| Table 6.1 | ||||||||
| LIABILITIES - (thousand US$) | 9M 04 | 9M 05 | Var 05-04 | Chg % | ||||
| CURRENT LIABILITIES | ||||||||
| Short-term debt due to banks and financial institutions | 465,224 | 181,022 | (284,202) | 61.1% | ||||
| Current portion of long-term debt due to banks and financial in | 230,982 | 202,701�� | (28,281) | 12.2% | ||||
| Current portion of bonds payable | 157,622 | 599,047 | 441,425 | - | ||||
| Current portion of long-term notes payable | 47,582 | 50,240 | 2,658 | (5.6%) | ||||
| Dividends payable | 7,444 | 31,285 | 23,841 | - | ||||
| Accounts payable | 407,064 | 460,610 | 53,546 | (13.2%) | ||||
| Short-term notes payable | 13,479 | 28,262 | 14,783 | (109.7%) | ||||
| Miscellaneous payables | 89,869 | 108,752 | 18,883 | (21.0%) | ||||
| Accounts payable to related companies | 172,986 | 94,187 | (78,799) | 45.6% | ||||
| Accrued expenses | 116,860 | 106,994 | (9,866) | 8.4% | ||||
| Withholdings | 113,616 | 91,596 | (22,020) | 19.4% | ||||
| Income taxes payable | 72,294 | 104,004 | 31,710 | (43.9%) | ||||
| Anticipated income | 16,430 | 8,241 | (8,189) | 49.8% | ||||
| Reinbursable financial contribution | 4,307 | 3,534 | (773) | 17.9% | ||||
| Other current liabilities | 122,467 | 61,440 | (61,027) | 49.8% | ||||
| Total current liabilities | 2,038,225 | 2,131,914 | 93,689 | (4.6%) | ||||
| LONG-TERM LIABILITIES | ||||||||
| Due to banks and financial institutions | 1,403,102 | 1,033,494 | (369,608) | 26.3% | ||||
| Bonds payable | 4,999,151 | 4,250,155 | (748,996) | 15.0% | ||||
| Long -term notes payable | 329,194 | 223,896 | (105,298) | 32.0% | ||||
| Accounts payables | 48,816 | 92,267 | 43,451 | (89.0%) | ||||
| Amounts payable to related companies | - | 18,198 | 18,198 | - | ||||
| Accrued expenses | 639,198 | 621,862 | (17,336) | 2.7% | ||||
| Deferred income taxes | 121,814 | 138,514 | 16,700 | (13.7%) | ||||
| Reinbursable financial contribution | 13,471 | 9,250 | (4,221) | 31.3% | ||||
| Other long-term liabilities | 76,471 | 327,811 | 251,340 | - | ||||
| Total long-term liabilities | 7,631,216 | 6,715,446 | (915,770) | 12.0% | ||||
| Minority interest | 6,526,769 | 5,183,063 | (1,343,706) | (20.6%) | ||||
| SHAREHOLDERS´ EQUITY | ||||||||
| Paid-in capital, no par value | 4,335,871 | 4,314,823 | (21,048) | (0.5%) | ||||
| Additional paid-in capital | 82,382 | 103,556 | 21,174 | 25.7% | ||||
| Additional paid-in capital (share premium) | 314,865 | 314,874 | 9 | 0.0% | ||||
| Other reserves | (51,328) | (359,986) | (308,658) | - | ||||
Total capital and reserves | 4,681,789 | 4,373,266 | (308,523) | (6.6%) | ||||
| Retained earnings | 375,766 | 430,340 | 54,574 | 14.5% | ||||
| Net income for the period | 68,812 | 70,392 | 1,580 | 2.3% | ||||
| Deficits of subsidaries in development stage | (5,173) | - | 5,173 | (100.0%) | ||||
| Total retained earnings | 439,404 | 500,732 | 61,328 | 14.0% | ||||
| Total shareholder´s equity | 5,121,193 | 4,873,998 | (247,195) | (4.8%) | ||||
| TOTAL LIABILITIES AND SHAREHOLDER´S EQUITY | 21,317,402 | 18,904,421 | (2,412,981) | (11.3%) | ||||
Pg. 19
| PRESS RELEASE | |
CONSOLIDATED BALANCE SHEET ANALYSIS
The Company’sTotal Assets decreased by Ch$1,276,949 million. This was due to:
| • | A decrease of Ch1,032,268 million, or 12.3% inFixed Assetsbecause of the depreciation for the year of Ch$400,000 million and the effect of the exchange rate of Ch$769,000 million on the fixed assets of overseas companies, In accordance with the methodology of carrying the non-monetary assets in nominal Dollars, pursuant to Technical Bulletin Nº 64 in the subsidiaries located in countries with unstable currencies. This was partly compensated by the incorporation of new fixed assets amounting to Ch$280,000 million. | |
| • | Current Assetsdecreased Ch$282,551 million, mainly due to: | |
| • | A decrease of Ch$146,510 million in time deposits mainly explained by a decrease in deposits for the capital reduction in Codensa of Ch$147,980 million and in Emgesa of Ch$68,919 million. This is partially compensated by an increase in time deposits in Edelnor of Ch$23,994 million, Cachoeira Dourada of Ch$13,337 million, Betania of Ch$12,632 million, Investluz of Ch$12,533 million and Endesa of Ch$12,012 million. | |
| • | A decrease of Ch$120,530 million of amounts due from related companies explained by debt refinanced over one year in Atacama Finance, of Ch$98,046 million; as well as the exchange rate effect on this refinancing. | |
This was partially compensated by: | ||
| • | An increase of Ch$37,360 million in accounts receivables, mainly due to the increase in invoicing at the subsidiaries Coelce of Ch$15,729 million, Codensa of Ch$15,695 million, Chilectra of Ch$14,992 million, and Endesa Costanera of Ch$13,033 million, partially compensated by a reduction of Ch$11,189 million in Cachoeira Dourada due to the agreement with Celg and Ch$7,905 million in El Chocon. | |
| • | Other long term assetsshow an increase of Ch$37,870 million, explained mainly as follows: | |
| • | An increase of Ch$97,580 million in amounts due from related companies, basically explained by the refinancing of the Atacama Finance loan of Ch$98,046 million. | |
| • | An increase of Ch$86,305 million in other long term assets, mainly due to the investment in Empresa Eléctrica de Bogotá of Ch$40,325 million and higher regulatory assets in Brazil of Ch$14,791 million, higher wholesale market fund in Argentina of Ch$19,200 million and deferred expenses of Ch$14,685 million. This was partially compensated by lower effects of the new Fair Value accounting for derivatives of Ch$9,381 million and deferred commissions and expenses of on loans of Ch$8,556 million. | |
| This was partially compensated by: | ||
| • | Decrease of positive goodwill of Ch$59,761 million. This corresponds to the annual average amortization by Ch$55,000 million, plus, the exchange rate effect on other several minor positive goodwill located in subsidiaries accounted in US Dollars. | |
| • | Decrease of Ch$59,845 million in Investments in Other Companies, basically the investment in Empresa Eléctrica de Bogotá, as a result of the liquidation of Luz de Bogotá. | |
Pg. 20
| PRESS RELEASE | |
| Total LiabilitiesandShareholder´s Equityshow a reduction of Ch$1,276,949 million, due principally to: | ||
| • | Short-term liabilitiesshow an increase of Ch$49,580 million or 4.6% as a result of: | |
| • | Increase of Ch$233,602 million in short term bond obligations following the transfer to short term of the Endesa International bonds for Ch$79,380 million and Edegel of Ch$34,062 million, Endesa Chile of Ch$106,317 million, Edelnor of Ch$13,626 and Emgesa of Ch$34,337 million, partially compensated by payments in Edegel of Ch$18,897 million, Endesa Chile of Ch$13,780 and Ampla of Ch$8,033 million. | |
| This was partially compensated by: | ||
| • | A decrease in the short term and the short-term portion of the long-term obligation with banks for Ch$150,400 million. This is due to payments in advance and refinancing in Emgesa of Ch$66,029 million, Ampla of Ch$56,137 million, Coelce of Ch$30,036 million and Edesur of Ch$32,864 million. | |
| • | A decrease of Ch$41,700 million in the accounts payable to related companies, basically from Enersis to Endesa Internacional of Ch$29,498 million due to the payment and price adjustment on the purchase of Elesur. | |
| • | Long term liabilitiesreduction of Ch$484,625 million or 12.0 % due basically to the following: | |
| • | Decrease of Ch$195,596 million due to banks, mainly explained by prepayments with excess flow or through bond refinancing. | |
| • | Decrease of Ch$396,369 million in bonds payable, due to the transfer to short term of bonds, partially compensated by new issuances in Betania for Ch$69,339 million, Emgesa for Ch$48,537 million, Ampla for Ch$26,077 million, Edegel for Ch$18,690 million, Coelce for Ch$15,811 million, Edesur for Ch$14.499 million and Edelnor for Ch$9,495 million, to prepay bank debt. | |
| This was partially compensated by: | ||
| • | An increase of Ch$130,775 million in other long term liabilities, due to the Fair Value accounting of the swaps subscribed by Enersis and the transfer from short term of the quality service fines in Edesur of Ch$25,065 million. | |
Minority interestdecreased by Ch$711,089 million, mainly explained by the effect of capital reduction in Emgesa and Codensa, added to the effect of the reduction in the investments in the foreign subsidiaries controlled in US Dollars in accordance with bulletin N°64.
Equity decreased by Ch$130,815 million. This variation is explained principally by the reduction of Ch$163,342 in other reserves, due to the revaluation of the Chilean Peso and its effect on the equity given the difference in conversion adjustment on the investments controlled in US Dollars, partially compensated by the increase of Ch$28,880 million in retained earnings.
Pg. 21
| PRESS RELEASE | |
DEBTMATURITY WITHTHIRDPARTIES,MILLIONCH$
| Table 7 | ||||||||||||||||
| TOTAL | ||||||||||||||||
| Million Ch$ | 2005 | 2006 | 2007 | 2008 | 2009 | 2010 | Balance | |||||||||
| Chile | 6,135 | 383,450 | 26,706 | 304,014 | 335,494 | 212,032 | 987,175 | 2,255,006 | ||||||||
| Enersis | 393 | 172,378 | 1,566 | 83,681 | 1,658 | 1,658 | 421,385 | 682,719 | ||||||||
| Chilectra | - | - | - | - | - | - | - | - | ||||||||
| Other (*) | 2,128 | 1,203 | - | - | - | - | - | 3,332 | ||||||||
| Endesa Chile (**) | 3,614 | 209,869 | 25,140 | 220,333 | 333,836 | 210,374 | 565,790 | 1,568,955 | ||||||||
| Argentina | 10,730 | 68,895 | 39,629 | 24,116 | 20,396 | 13,592 | 10,391 | 187,748 | ||||||||
| Edesur | 386 | 40,635 | 20,661 | 8,256 | - | - | - | 69,938 | ||||||||
| Costanera | 10,343 | 23,181 | 18,968 | 15,860 | 20,396 | 13,592 | 10,391 | 112,731 | ||||||||
| Hidroinvest | - | 5,080 | - | - | - | - | - | 5,080 | ||||||||
| Perú | 37,179 | 92,531 | 41,262 | 20,255 | 27,979 | 4,739 | 23,084 | 247,030 | ||||||||
| Edelnor | 6,872 | 50,153 | 9,510 | 4,739 | 6,319 | 4,739 | 18,427 | 100,759 | ||||||||
| Edegel | 30,307 | 42,378 | 31,752 | 15,516 | 21,660 | - | 4,657 | 146,271 | ||||||||
| Brasil | 13,634 | 55,720 | 61,620 | 109,379 | 51,025 | 68,147 | 55,605 | 415,131 | ||||||||
| Coelce | 5,153 | 22,610 | 23,731 | 24,680 | 13,679 | 6,859 | 52,677 | 149,389 | ||||||||
| Ampla | 8,025 | 30,942 | 35,043 | 83,658 | 37,347 | 61,288 | 2,927 | 259,230 | ||||||||
| Cachoeira | 456 | 2,169 | 2,846 | 1,041 | - | - | - | 6,512 | ||||||||
| Colombia | 46,379 | 52,659 | 13,483 | - | 84,280 | 27,736 | 194,150 | 418,687 | ||||||||
| Codensa | 38,472 | - | - | - | 11,557 | - | 104,009 | 154,037 | ||||||||
| Emgesa | 1,166 | 39,177 | - | - | 72,724 | - | 48,538 | 161,604 | ||||||||
| Betania | 6,741 | 13,483 | 13,483 | - | - | 27,736 | 41,604 | 103,046 | ||||||||
| TOTAL | 114,057 | 653,256 | 182,700 | 457,764 | 519,174 | 326,245 | 1,270,406 | 3,523,602 | ||||||||
DEBTMATURITY WITHTHIRDPARTIES,THOUSANDUS$
| Table 7.1 | ||||||||||||||||
| TOTAL | ||||||||||||||||
| Thousand US$ | 2005 | 2006 | 2007 | 2008 | 2009 | 2010 | Balance | |||||||||
| Chile | 11,593 | 724,584 | 50,464 | 574,478 | 633,965 | 400,665 | 1,865,411 | 4,261,160 | ||||||||
| Enersis | 744 | 325,733 | 2,959 | 158,128 | 3,132 | 3,133 | 796,268 | 1,290,096 | ||||||||
| Chilectra | - | - | - | - | - | - | - | - | ||||||||
| Other (*) | 4,022 | 2,274 | - | - | - | - | - | 6,296 | ||||||||
| Endesa Chile (**) | 6,828 | 396,577 | 47,506 | 416,350 | 630,832 | 397,532 | 1,069,142 | 2,964,768 | ||||||||
| Argentina | 20,275 | 130,187 | 74,885 | 45,570 | 38,540 | 25,683 | 19,636 | 354,777 | ||||||||
| Edesur | 730 | 76,785 | 39,041 | 15,601 | - | - | - | 132,158 | ||||||||
| Costanera | 19,545 | 43,804 | 35,844 | 29,969 | 38,540 | 25,683 | 19,636 | 213,021 | ||||||||
| Hidroinvest | - | 9,599 | - | - | - | - | - | 9,599 | ||||||||
| Perú | 70,255 | 174,851 | 77,971 | 38,275 | 52,870 | 8,955 | 43,621 | 466,799 | ||||||||
| Edelnor | 12,985 | 94,771 | 17,971 | 8,955 | 11,940 | 8,955 | 34,821 | 190,399 | ||||||||
| Edegel | 57,270 | 80,080 | 60,000 | 29,320 | 40,930 | - | 8,800 | 276,400 | ||||||||
| Brasil | 25,764 | 105,291 | 116,440 | 206,688 | 96,420 | 128,773 | 105,073 | 784,450 | ||||||||
| Coelce | 9,737 | 42,724 | 44,843 | 46,636 | 25,848 | 12,961 | 99,541 | 282,292 | ||||||||
| Ampla | 15,164 | 58,469 | 66,218 | 158,084 | 70,572 | 115,813 | 5,532 | 489,852 | ||||||||
| Cachoeira | 862 | 4,098 | 5,379 | 1,967 | - | - | - | 12,306 | ||||||||
| Colombia | 87,639 | 99,507 | 25,477 | - | 159,260 | 52,411 | 366,875 | 791,169 | ||||||||
| Codensa | 72,698 | - | - | - | 21,838 | - | 196,540 | 291,076 | ||||||||
| Emgesa | 2,203 | 74,030 | - | - | 137,422 | - | 91,719 | 305,374 | ||||||||
| Betania | 12,739 | 25,477 | 25,477 | - | - | 52,411 | 78,616 | 194,720 | ||||||||
| TOTAL | 215,527 | 1,234,421 | 345,237 | 865,011 | 981,055 | 616,487 | 2,400,615 | 6,658,355 | ||||||||
| (*) Includes: CAM | ||||||||||||||||
| (**) Includes: Endesa Chile Internacional, Pangue, Pehuenche, San Isidro, Celta and Tunel El Melon. Does not includes Ch$1,127 million intercompany debt with Enersis | ||||||||||||||||
Source: Internal financial report
Pg. 22
| PRESS RELEASE | |
CONSOLIDATED CASH FLOW
UNDERCHILEANGAAP, MILLIONCH$
| Table 8 | ||||||||
| Million Ch$ | 9M 04 | 9M 05 | Var 05-04 | Chg % | ||||
| CASH FLOWS PROVIDED BY OPERATING ACTIVITIES | ||||||||
| Net income (loss) for the year | 36,415 | 37,251 | 836 | 2.3% | ||||
| Gain (losses) from sales of assets: | ||||||||
| Losses (gain) on sale of property, plant and equipment | (519) | (1,812) | (1,293) | - | ||||
| Charges (credits) to income which do not represent cash flows: | ||||||||
| Depreciation | 310,995 | 283,634 | (27,361) | (8.8%) | ||||
| Amortization of intangibles | 4,928 | 6,022 | 1,094 | 22.2% | ||||
| Write-offs and accrued expenses | 20,582 | 21,656 | 1,074 | 5.2% | ||||
| Equity in income of related companies | (29,216) | (13,443) | 15,773 | 54.0% | ||||
| Equity in losses of related companies | - | 8,516 | 8,516 | - | ||||
| Amortization of positive goodwill | 40,917 | 40,980 | 63 | 0.2% | ||||
| Amortization of negative goodwill | (13,996) | (11,990) | 2,006 | 14.3% | ||||
| Price-level restatement, net | 925 | 1,521 | 596 | 64.4% | ||||
| Exchange difference, net | (13,038) | 5,720 | 18,758 | 143.9% | ||||
| Other credits to income which do not represent cash flows | (8,527) | (25,440) | (16,913) | (198.3%) | ||||
| Other charges to income which do not represent cash flows | 69,394 | 88,900 | 19,506 | 28.1% | ||||
| Changes in assets which affect cash flows: | - | |||||||
| Decrease (increase) in trade receivables | 21,835 | (50,350) | (72,185) | - | ||||
| Decrease (increase) in inventory | (13,122) | (25,780) | (12,658) | (96.5%) | ||||
| Decrease (increase) in other assets | (52,888) | 6,790 | 59,678 | 112.8% | ||||
| Changes in liabilities which affect cash flow: | - | |||||||
| Decreased (increase) in payable accounts associated with operating results | (104,503) | 15,075 | 119,578 | 114.4% | ||||
| Decreased (increase) of payable interest | 39,772 | 32,785 | (6,987) | (17.6%) | ||||
| Decreased (increase) in income tax payable | 23,598 | 35,446 | 11,848 | 50.2% | ||||
| Decreased (increase) in other accounts payable associated with non-operating results | 7,639 | (8,649) | (16,288) | (213.2%) | ||||
| Decreased (increase) in value added tax and other similar taxes payable, net | (13,912) | (34,594) | (20,682) | (148.7%) | ||||
| Income (loss) attributable to minority interest | 77,950 | 105,257 | 27,307 | 35.0% | ||||
| NET CASH FLOW PROVIDED BY OPERATING ACTIVITIES | 405,229 | 517,495 | 112,266 | 27.7% | ||||
Pg. 23
| PRESS RELEASE | |
| Cont. Table 8 | ||||||||
| Million Ch$ | 9M 04 | 9M 05 | Var 05-04 | Chg % | ||||
| CASH FLOWS FROM FINANCING ACTIVITIES | ||||||||
| Proceeds from issuance of shares issued to minorities | - | - | - | - | ||||
| Proceeds from debt issuance | 721,793 | 285,650 | (436,143) | (60.4%) | ||||
| Proceeds from bond issuance | 239,567 | 155,142 | (84,425) | (35.2%) | ||||
| Proceeds from loans obtained from related companies | - | - | - | - | ||||
| Proceeds from other loans obtained from related companies | - | - | - | - | ||||
| Other sources of financing | 26,473 | 622 | (25,851) | (97.6%) | ||||
| Capital paid | (4,082) | (246,241) | (242,159) | - | ||||
| Dividends paid | (93,292) | (106,617) | (13,325) | (14.3%) | ||||
| Payment of debt | (1,002,757) | (509,641) | 493,116 | 49.2% | ||||
| Payment of bonds | (17,107) | (98,121) | (81,014) | - | ||||
| Payments of loans obtained from related companies | - | - | - | - | ||||
| Payments of other loans obtained from related companies | - | - | - | - | ||||
| Payments of shares issuance costs | - | - | - | - | ||||
| Payments of bonds issuance costs | (2,641) | (898) | 1,743 | 66.0% | ||||
| Other disbursements for financing | (8,448) | (13,228) | (4,780) | (56.6%) | ||||
| NET CASH FLOW FROM FINANCING ACTIVITIES | (140,493) | (533,332) | (392,839) | - | ||||
| CASH FLOWS FROM INVESTING ACTIVITIES | ||||||||
| Proceeds from sale of property, plant and equipment | 1,244 | 4,471 | 3,227 | - | ||||
| Sale of investment | 2,684 | - | (2,684) | (100.0%) | ||||
| Other loans received from related companies | 12,795 | 2,710 | (10,085) | (78.8%) | ||||
| Other receipts from investments | 41,238 | 3,589 | (37,649) | (91.3%) | ||||
| Additions to property, plant and equipment | (199,398) | (218,306) | (18,908) | (9.5%) | ||||
| Long-term investments | - | (32,314) | (32,314) | - | ||||
| Investment in financing instruments | (17,541) | - | 17,541 | - | ||||
| Other loans granted to related companies | - | - | - | - | ||||
| Other investment disbursements | (1,773) | (658) | 1,115 | 62.9% | ||||
| NET CASH FLOW FROM INVESTMENT ACTIVITIES | (160,750) | (240,508) | (79,758) | (49.6%) | ||||
| NET CASH FLOW FOR THE PERIOD | 103,986 | (256,345) | (360,331) | - | ||||
| EFFECT OF PRICE-LEVEL RESTATEMENT ON CASH AND CASH EQUIVALENT | (2,690) | 3,060 | 5,750 | - | ||||
| NET VARIATION ON CASH AND CASH EQUIVALENT | 101,296 | (253,285) | (354,581) | - | ||||
| CASH AND CASH EQUIVALENT AT THE BEGINNING OF THE YEAR | 347,585 | 560,371 | 212,786 | 61.2% | ||||
| CASH AND CASH EQUIVALENT AT THE END OF THE YEAR | 448,881 | 307,086 | (141,795) | (31.6%) | ||||
Pg. 24
| PRESS RELEASE | |
UNDERCHILEANGAAP,THOUSANDUS$
| Table 8.1 | ||||||||
| Thousand US$ | 9M 04 | 9M 05 | Var 05-04 | Chg % | ||||
| CASH FLOWS PROVIDED BY OPERATING ACTIVITIES | ||||||||
| Net income (loss) for the year | 68,811 | 70,391 | 1,580 | 2.3% | ||||
| Gain (losses) from sales of assets: | ||||||||
| Losses (gain) on sale of property, plant and equipment | (981) | (3,424) | (2,443) | - | ||||
| Charges (credits) to income which do not represent cash flows: | ||||||||
| Depreciation | 587,670 | 535,968 | (51,702) | (8.8%) | ||||
| Amortization of intangibles | 9,312 | 11,379 | 2,067 | 22.2% | ||||
| Write-offs and accrued expenses | 38,893 | 40,923 | 2,030 | 5.2% | ||||
| Equity in income of related companies | (55,208) | (25,402) | 29,806 | 54.0% | ||||
| Equity in losses of related companies | - | 16,091 | 16,091 | - | ||||
| Amortization of positive goodwill | 77,319 | 77,438 | 119 | 0.2% | ||||
| Amortization of negative goodwill | (26,447) | (22,658) | 3,789 | 14.3% | ||||
| Price-level restatement, net | 1,748 | 2,874 | 1,126 | 64.4% | ||||
| Exchange difference, net | (24,637) | 10,809 | 35,446 | 143.9% | ||||
| Other credits to income which do not represent cash flows | (16,113) | (48,073) | (31,960) | (198.3%) | ||||
| Other charges to income which do not represent cash flows | 131,130 | 167,990 | 36,860 | 28.1% | ||||
| Changes in assets which affect cash flows: | ||||||||
| Decrease (increase) in trade receivables | 41,260 | (95,144) | (136,404) | - | ||||
| Decrease (increase) in inventory | (24,796) | (48,715) | (23,919) | (96.5%) | ||||
| Decrease (increase) in other assets | (99,940) | 12,832 | 112,772 | 112.8% | ||||
| Changes in liabilities which affect cash flow: | ||||||||
| Decreased (increase) in payable accounts associated with operating results | (197,474) | 28,486 | 225,960 | 114.4% | ||||
| Decreased (increase) of payable interest | 75,155 | 61,951 | (13,204) | (17.6%) | ||||
| Decreased (increase) in income tax payable | 44,592 | 66,980 | 22,388 | 50.2% | ||||
| Decreased (increase) in other accounts payable associated with non-operating results | 14,435 | (16,344) | (30,779) | (213.2%) | ||||
| Decreased (increase) in value added tax and other similar taxes payable, net | (26,289) | (65,370) | (39,081) | (148.7%) | ||||
| Income (loss) attributable to minority interest | 147,298 | 198,899 | 51,601 | 35.0% | ||||
| NET CASH FLOW PROVIDED BY OPERATING ACTIVITIES | 765,739 | 977,882 | 212,143 | 27.7% | ||||
Pg. 25
| PRESS RELEASE | |
| Cont. Table 8.1 | ||||||||
| Thousand US$ | 9M 04 | 9M 05 | Var 05-04 | Chg % | ||||
| CASH FLOWS FROM FINANCING ACTIVITIES | ||||||||
| Proceeds from issuance of shares issued to minorities | - | - | - | - | ||||
| Proceeds from debt issuance | 1,363,932 | 539,777 | (824,155) | (60.4%) | ||||
| Proceeds from bond issuance | 452,697 | 293,162 | (159,535) | (35.2%) | ||||
| Proceeds from loans obtained from related companies | - | - | - | - | ||||
| Proceeds from other loans obtained from related companies | - | - | - | - | ||||
| Other sources of financing | 50,025 | 1,176 | (48,849) | (97.6%) | ||||
| Capital paid | (7,714) | (465,307) | (457,593) | - | ||||
| Dividends paid | (176,289) | (201,469) | (25,180) | (14.3%) | ||||
| Payment of debt | (1,894,854) | (963,041) | 931,813 | 49.2% | ||||
| Payment of bonds | (32,326) | (185,415) | (153,089) | - | ||||
| Payments of loans obtained from related companies | - | - | - | - | ||||
| Payments of other loans obtained from related companies | - | - | - | - | ||||
| Payments of shares issuance costs | - | - | - | - | ||||
| Payments of bonds issuance costs | (4,991) | (1,696) | 3,295 | 66.0% | ||||
| Other disbursements for financing | (15,964) | (24,996) | (9,032) | (56.6%) | ||||
| NET CASH FLOW FROM FINANCING ACTIVITIES | (265,482) | (1,007,809) | (742,327) | - | ||||
| CASH FLOWS FROM INVESTING ACTIVITIES | ||||||||
| Proceeds from sale of property, plant and equipment | 2,351 | 8,448 | 6,097 | - | ||||
| Sale of investment | 5,072 | - | (5,072) | (100.0%) | ||||
| Other loans received from related companies | 24,178 | 5,121 | (19,057) | (78.8%) | ||||
| Other receipts from investments | 77,925 | 6,782 | (71,143) | (91.3%) | ||||
| Additions to property, plant and equipment | (376,791) | (412,521) | (35,730) | (9.5%) | ||||
| Long-term investments | - | (61,062) | (61,062) | - | ||||
| Investment in financing instruments | (33,146) | - | 33,146 | - | ||||
| Other loans granted to related companies | - | - | - | - | ||||
| Other investment disbursements | (3,350) | (1,243) | 2,107 | 62.9% | ||||
| NET CASH FLOW FROM INVESTMENT ACTIVITIES | (303,761) | (454,475) | (150,714) | (49.6%) | ||||
| NET CASH FLOW FOR THE PERIOD | 196,497 | (484,401) | (680,898) | - | ||||
| EFFECT OF PRICE-LEVEL RESTATEMENT ON CASH AND CASH EQUIVALENT | (5,083) | 5,783 | 10,866 | - | ||||
| NET VARIATION ON CASH AND CASH EQUIVALENT | 191,413 | (478,618) | (670,031) | - | ||||
| CASH AND CASH EQUIVALENT AT THE BEGINNING OF THE YEAR | 656,812 | 1,058,902 | 402,090 | 61.2% | ||||
| CASH AND CASH EQUIVALENT AT THE END OF THE YEAR | 848,226 | 580,284 | (267,942) | (31.6%) | ||||
Pg. 26
| PRESS RELEASE | |
CONSOLIDATED CASH FLOW ANALYSIS
During the period, the Company generated a negative net cash flow of Ch$256,345 million, comprised of the following activities:
| Table 9 | ||||||||
| Effective Cash Flow (million Ch$) | 9M 04 | 9M 05 | Var 05-04 | Chg % | ||||
| Operating | 405,229 | 517,495 | 112,266 | 27.7% | ||||
| Financing | (140,493) | (533,332) | (392,839) | (279.6%) | ||||
| Investment | (160,750) | (240,508) | (79,758) | (49.6%) | ||||
| Net cash flow of the period | 103,986 | (256,345) | (360,331) | (346.5%) | ||||
| Table 9.1 | ||||||||
| Effective Cash Flow (thousand US$) | 9M 04 | 9M 05 | Var 05-04 | Chg % | ||||
| Operating | 765,739 | 977,882 | 212,143 | 27.7% | ||||
| Financing | (265,482) | (1,007,809) | (742,327) | (279.6%) | ||||
| Investment | (303,761) | (454,475) | (150,714) | (49.6%) | ||||
| Net cash flow of the period | 196,497 | (484,401) | (680,898) | (346.5%) | ||||
Operating activities generated a net positive cash flow of Ch$517,495 million, an increase of Ch$112,266 million. As of September 2005, the operating cash flow is comprised mainly of:
| • | Net income for the period amounting to Ch$37,251 million, plus: | ||
| • | Charges of Ch$456,950 million to the income statement that do not represent cash flow and correspond mainly to the Depreciation of the period for Ch$283,634 million, write-offs and provisions for Ch$21,656 million, amortizations of positive goodwill of Ch$40,980 million, amortization of intangibles of Ch$6,022 million, losses in investments of Ch$8,516 million, and other charges that do not represent cash flow for Ch$88,900 million, which includes the Ch$52,142 negative conversion effect of the application of the Technical Bulletin N°64 over the foreign subsidiaries. | ||
| • | The variation of net liabilities that affect cash flow of Ch$40,062 million. | ||
| • | The above was partly compensated by: | ||
| • | Increase in net assets which affect operating cash flow of Ch$69,340 million. | ||
| • | Credits for Ch$25,440 million that do not represent cash flows, of which Ch$14,895 million correspond to the positive effect of the conversion of the overseas branches. | ||
| • | Profit on investment in related companies of Ch$13,443 million. | ||
| • | Negative goodwill amortization of Ch$11,990 million. | ||
| • | Profit on sales of assets of Ch$1,812 million. | ||
Financing activities produced a negative cash flow of Ch$533,332 million mainly due to the payment of loans for a value of Ch$509,641 million, capital paid of Ch$246,241 million and third parties dividend payments of Ch$106,617 million, payments to the public for Ch$98,121 million and other disbursements for Ch$13,228 million. The above is partly compensated by the receipt of loans for Ch$285,650 million, bond issues for Ch$155,141 million and other sources of financing for Ch$622 million.
Pg. 27
| PRESS RELEASE | |
Investment activitiesgenerated a net negative cash flow of Ch$240,508 million that correspond mainly to the incorporation of fixed assets for Ch$218,306 million and other long term investments for Ch$32,314 million, partially compensated by the sale of fixed assets of Ch$4,471 million and other investments sources of Ch$3,589 million.
CASHFLOWRECEIVEDFROMFOREIGNSUBSIDIARIES BYENERSIS,CHILECTRA ANDENDESACHILE(*)
| Table 10 | ||||||||||||||||||||
| Millions Ch$ | Interest Received | Dividends Received | Management Fee | Prepayment intercompany | Others | |||||||||||||||
| 9M 04 | 9M 05 | 9M 04 | 9M 05 | 9M 04 | 9M 05 | 9M 04 | 9M 05 | 9M 04 | 9M 05 | |||||||||||
| Argentina | 4,525 | 4,278 | 1,317 | - | - | - | 10,588 | - | - | - | ||||||||||
| Peru | - | - | 10,985 | 9,200 | - | - | - | - | 2,049 | 7,375 | ||||||||||
| Brazil | 1,713 | 1,762 | 8,711 | 18,894 | - | - | - | - | - | - | ||||||||||
| Colombia | 12,029 | - | 5,699 | 8,242 | - | - | - | 22,550 | - | 46,251 | ||||||||||
| Total | 18,267 | 6,040 | 26,713 | 36,336 | - | - | 10,588 | 22,550 | 2,049 | 53,626 | ||||||||||
| Millions Ch$ | Total Cash Received | |||||||||||||||||||
| 9M 04 | 9M 05 | |||||||||||||||||||
| Argentina | 16,431 | 4,278 | ||||||||||||||||||
| Peru | 13,035 | 16,575 | ||||||||||||||||||
| Brazil | 10,424 | 20,656 | ||||||||||||||||||
| Colombia | 17,728 | 77,043 | ||||||||||||||||||
| Total | 57,617 | 118,551 | ||||||||||||||||||
| Table 10.1 | ||||||||||||||||||||
| Thousand US$ | Interest Received | Dividends Received | Management Fee | Prepayment intercompany | Others | |||||||||||||||
| 9M 04 | 9M 05 | 9M 04 | 9M 05 | 9M 04 | 9M 05 | 9M 04 | 9M 05 | 9M 04 | 9M 05 | |||||||||||
| Argentina | 8,551 | 8,084 | 2,489 | - | - | - | 20,008 | - | - | - | ||||||||||
| Peru | - | - | 20,759 | 17,384 | - | - | - | - | 3,873 | 13,936 | ||||||||||
| Brazil | 3,237 | 3,329 | 16,461 | 35,703 | - | - | - | - | - | - | ||||||||||
| Colombia | 22,731 | - | 10,768 | 15,574 | - | - | - | 42,611 | - | 87,399 | ||||||||||
| Total | 34,518 | 11,413 | 50,477 | 68,662 | - | - | 20,008 | 42,611 | 3,873 | 101,335 | ||||||||||
| Thousand US$ | Total Cash Received | |||||||||||||||||||
| 9M 04 | 9M 05 | |||||||||||||||||||
| Argentina | 31,048 | 8,084 | ||||||||||||||||||
| Peru | 24,631 | 31,321 | ||||||||||||||||||
| Brazil | 19,698 | 39,032 | ||||||||||||||||||
| Colombia | 33,499 | 145,583 | ||||||||||||||||||
| Total | 108,876 | 224,020 | ||||||||||||||||||
| (*) Source: Internal financial report | ||||||||||||||||||||
Pg. 28
| PRESS RELEASE | |
CAPEX ANDDEPRECIATION
| Table 11 | ||||||||
| Payments for Additions of Fixed assets | Depreciation | |||||||
| Million Ch$ | 9M 04 | 9M 05 | 9M 04 | 9M 05 | ||||
| Endesa | 85,258 | 37,517 | 136,375 | 132,476 | ||||
| Chilectra S.A. | 15,154 | 30,050 | 11,165 | 11,987 | ||||
| Edesur S.A. | 22,983 | 22,052 | 40,506 | 33,086 | ||||
| Edelnor S.A. | 8,769 | 10,939 | 13,414 | 12,194 | ||||
| Ampla | 36,258 | 60,712 | 35,844 | 30,229 | ||||
| Coelce | 23,276 | 37,906 | 30,009 | 25,742 | ||||
| Codensa S.A. | 4,298 | 15,137 | 40,929 | 35,067 | ||||
| Cam Ltda. | 1,284 | 859 | 909 | 755 | ||||
| Inmobiliaria Manso de Velasco Ltda. | 16 | 560 | 228 | 267 | ||||
| Synapsis Soluciones y Servicios Ltda. | 2,056 | 2,464 | 774 | 1,048 | ||||
| Holding Enersis | 43 | 110 | 843 | 783 | ||||
| Total | 199,398 | 218,306 | 310,995 | 283,634 | ||||
| Table 11.1 | ||||||||
| Payments for Additions of Fixed assets | Depreciation | |||||||
| Thousand US$ | 9M 04 | 9M 05 | 9M 04 | 9M 05 | ||||
| Endesa | 161,107 | 70,893 | 257,700 | 250,333 | ||||
| Chilectra S.A. | 28,636 | 56,784 | 21,098 | 22,651 | ||||
| Edesur S.A. | 43,429 | 41,671 | 76,543 | 62,521 | ||||
| Edelnor S.A. | 16,571 | 20,671 | 25,348 | 23,042 | ||||
| Ampla | 68,514 | 114,724 | 67,732 | 57,122 | ||||
| Coelce | 43,984 | 71,629 | 56,706 | 48,643 | ||||
| Codensa S.A. | 8,121 | 28,604 | 77,341 | 66,264 | ||||
| Cam Ltda. | 2,426 | 1,623 | 1,718 | 1,427 | ||||
| Inmobiliaria Manso de Velasco Ltda. | 31 | 1,057 | 431 | 505 | ||||
| Synapsis Soluciones y Servicios Ltda. | 3,885 | 4,656 | 1,463 | 1,980 | ||||
| Holding Enersis | 81 | 209 | 1,593 | 1,480 | ||||
| Total | 376,785 | 412,521 | 587,672 | 535,967 | ||||
Pg. 29
| PRESS RELEASE | |
ANALYSIS OF THE EXCHANGE RISK AND THE INTEREST RATE
The company has a high percentage of its loans in US Dollars as a great part of its sales in the different markets where it operates are mainly indexed to that currency. Nevertheless, the Brazilian and Colombian markets are less indexed to the US Dollar and, therefore, subsidiaries in those markets have most of their liabilities in local currency. In the case of Argentina, an important portion of their income come from the exports of energy to Brazil. These are indexed to the dollar, reducing the exposure of the exchange rate risk in this country.
In a scenario of a high exchange risk, the company has continued with its policy of partly covering its liabilities in Dollars in order to mitigate the effects of the fluctuations in the exchange rate on the results. Considering the important reduction in the accounting mismatch in recent years, the company has modified its policy on Dollar-Peso hedging in order to establish a policy of covering cash flows, together with a maximum permissible accounting mismatch, on which hedging operations will be performed.
As of September 2005, on a consolidated basis, the company has hedged in Chile, by means of USD/UF Swap operations, an amount of US$700 million and by means of forwards contracts US$74 million, due primarily to the modification of the hedging policy. A year ago, the company had already contracted US$700 million of the total Swap Dollar-UF as part of the establishment of the new hedging policy and there were not forwards contracted.
With regard to interest rate risk, the company has, on a consolidated basis, a proportion of its indebtedness at a fixed rate/variable rate ratio of approximately 82.1% / 17.9% fixed / variable as of September, 2005. The percentage of its indebtedness at a fixed rate has remained fairly constant if compared with the 84.5% / 15.5% ratio as of the same date of the previous year. This is due to the fact that the risk levels have also remained in the hedging levels determined by the company’s new policy.
Pg. 30
| PRESS RELEASE | |
GENERATION BUSINESS
| Table 12 | ||||||||||
| Million US$ | Million Ch$ | |||||||||
| 9M 04 | 9M 05 | 9M 04 | 9M 05 | Chg % | ||||||
| Operating Revenues | 1,566 | 1,640 | 828,590 | 867,839 | 4.7% | |||||
| Operating Costs | (978) | (1,037) | (517,698) | (549,035) | (6.1%) | |||||
| Selling and Administrative Expenses | (48) | (54) | (25,487) | (28,460) | (11.7%) | |||||
| Operating Income | 539 | 549 | 285,404 | 290,345 | 1.7% | |||||
| Interest Income | 22 | 25 | 11,801 | 13,066 | 10.7% | |||||
| Interest Expenses | (288) | (261) | (152,500) | (138,186) | 9.4% | |||||
| Net Financial Income (Expenses) | (266) | (236) | (140,699) | (125,119) | 11.1% | |||||
| Equity Gains from Related Company | 36 | 14 | 19,158 | 7,538 | (60.7%) | |||||
| Equity Losses from Related Company | (0) | (16) | (66) | (8,565) | - | |||||
| Net Income from Related Companies | 36 | (2) | 19,092 | (1,027) | (105.4%) | |||||
| Other Non Operating Income | 30 | 75 | 15,787 | 39,524 | 150.4% | |||||
| Other Non Operating Expenses | (61) | (77) | (32,058) | (40,718) | (27.0%) | |||||
| Net other Non Operating Income (Expenses) | (31) | (2) | (16,271) | (1,194) | 92.7% | |||||
| Price Level Restatement | 2 | 3 | 1,278 | 1,608 | 25.7% | |||||
| Foreign Exchange Effect | 17 | 20 | 8,821 | 10,623 | 20.4% | |||||
| Net of Monetary Exposure | 19 | 23 | 10,099 | 12,231 | 21.1% | |||||
| Positive Goodwill Amortization | (2) | (2) | (1,221) | (1,054) | 13.7% | |||||
| Non Operating Income | (244) | (220) | (128,999) | (116,165) | 9.9% | |||||
| Net Income b. Taxes, Min Int and Neg Goodwill Amort. | 296 | 329 | 156,404 | 174,180 | 11.4% | |||||
| Extraordinary Items | - | - | - | - | - | |||||
| Income Tax | (143) | (132) | (75,858) | (69,747) | 8.1% | |||||
| Minority Interest | (62) | (71) | (32,674) | (37,564) | (15.0%) | |||||
| Negative Goodwill Amortization | 25 | 22 | 13,149 | 11,847 | (9.9%) | |||||
| NET INCOME | 115 | 149 | 61,022 | 78,716 | 29.0% | |||||
NETINCOME
Endesa Chile recorded a Net Income of Ch$78,716 million which is Ch$17,694 million higher than the previous year. This is mainly explained by:
OPERATINGINCOME
Endesa Chile’s operating income reached Ch$290,345 million, an increase of 1.7% mainly due to higher operating income in our subsidiaries in Chile and Brazil partially offset by lower operating income in our subsidiaries in Argentina.
In Chile, operating income in the third quarter of 2005 was Ch$120,219 million, 11.4 % higher than in the same period of 2004. Sales increased by 13.2%, from Ch$352,574 to Ch$399,043 million as a result of a favorable hydrology in the quarter and an increase in the node price following the application of the Short Law II effective from June 13, 2005. Electricity sales volumes reached 15,121 GWh, equivalent to a 14.0 % increase over 2004. The incorporation of the Ralco hydroelectric plant allowed to add 3,581 GWh to the system. Regarding thermal generation, this fell by 749 GWh compared to the same period of 2004; however, this implied a higher cost in the first six months of the year as a result of the restrictions on natural gas from Argentina that directly impacted on our subsidiary San Isidro whose operating income showed a decrease of Ch$29,741 million derived from the generation using liquid fuels and the rise in their international prices.
Pg. 31
| PRESS RELEASE | |
In Argentina, operating income for the period January-September 2005 was Ch$18,948 million, compared to the Ch$27,192 million in the same period of 2004. This operating income is explained by Ch$8,349 million of operating income from Endesa Costanera and Ch$10,599 million from El Chocon.
This lower operating income in Endesa Costanera, which reached Ch$13,265 million, is mainly explained by the higher costs of Ch$20,070 million, as a consequence of generating electricity using liquid fuel (fuel oil) for export to Brazil, caused by the calling of the lines to that country at the end of the first half year of this year as a result of the delayed rains in southern Brazil. This led to a large gap between contract energy prices and generating costs which adversely affected the results. Operating revenues in Endesa Costanera increased 4.9% reaching Ch$109,585 million, however has seen its revenues reduced with respect to fixed charges for capacity on its export business to Brazil, which has been compensated by the reorientation of operations to the Argentine market. Physical sales increased by 14.6 % in the period, reaching 6,683 GWh compared to the 5,834 GWh during 2004.
The lower operating income of Endesa Costanera was partially offset by the improved operating income from El Chocón, basically explained by the increase of Ch$4,498 million in its revenues due to improved hydrology in the Comahue region and to an increase in energy sales prices. Physical sales of El Chocón reached 2,988 GWh during the nine-month period, a 4.7% increase over the corresponding 2004 period.
In Brazil, operating income of Cachoeira Dourada reached Ch$18,570 million in 2005, Ch$8,320 million higher than in the same period of the year before. Favorable hydrology in the south-east-center region permitted the production of Cachoeira to increase by 10.5 %, thus reducing its energy purchase needs. Revenues increased by 30.4% as a result of higher physical sales, the tariff adjustment and higher average sales price. The cost of sales were reduced by 4.7% to Ch$19,618 million.
In Colombia, operating income as of the third quarter of 2005 reached Ch$92,140 million, 5.3% below the level of 2004, basically explained by lower operating revenues coming from Emgesa, due to worse hydrology which reduced the hydroelectric generation. Operating revenues in Betenia increased Ch$1,432 million, but higher spot prices increase Ch$3,470 million the energy purchases.
In Peru, operating income for Edegel reached Ch$40,469 million, 5.4% below the level of the same period of 2004, mainly due to 16.6% lower revenues on the sale of electricity, because of the decrease in spot prices due to the good hydrology. Hydroelectric production increased by 6.6 % and physical sales by 7.6 %. The cost of sales also declined by 26.8% to Ch$42,360 million, mainly the result of lower costs for fuel, and energy and capacity purchases, because 2004 was a dry year in Peru.
NONOPERATINGINCOME
Non operating income decreased from a loss of Ch$ 128,999 million to a loss of Ch$ 116,165 million as of September 2005. This variation had a positive effect in the company’s net income.
Pg. 32
| PRESS RELEASE | |
| Table 13 | ||||||||||||||
| Country | Market | GWh Sold | Var 05-04 | Chg % | Market Share (*) | |||||||||
| 9M 04 | 9M 05 | 9M 04 | 9M 05 | |||||||||||
| Chile | SIC & SING | 13,260 | 15,121 | 1,861 | 14.0% | 38.9% | 41.1% | |||||||
| SIC | 12,515 | 14,424 | 1,909 | 15.3% | 48.5% | 51.8% | ||||||||
| SING | 745 | 697 | (48) | (6.5%) | 9.0% | 7.8% | ||||||||
| Argentina | SIN | 8,688 | 9,671 | 983 | 11.3% | 14.0% | 14.7% | |||||||
| Chocón | 2,855 | 2,988 | 133 | 4.7% | 4.6% | 4.5% | ||||||||
| Costanera | 5,834 | 6,683 | 849 | 14.6% | 9.4% | 10.2% | ||||||||
| Perú | SICN | 3,226 | 3,472 | 246 | 7.6% | 23.4% | 24.1% | |||||||
| Edegel | 3,226 | 3,472 | 246 | 7.6% | ||||||||||
| Colombia | SIN | 11,631 | 11,276 | (355) | (3.1%) | 24.1% | 22.1% | |||||||
| Betania | 1,951 | 2,043 | 92 | 4.7% | 4.0% | 4.0% | ||||||||
| Emgesa | 9,680 | 9,233 | (447) | (4.6%) | 20.1% | 18.1% | ||||||||
| Brazil | SICN | 2,815 | 2,898 | 83 | 2.9% | 1.2% | 1.2% | |||||||
| Cachoeira | 2,815 | 2,898 | 83 | 2.9% | ||||||||||
| Total | 39,620 | 42,437 | 2,817 | 7.1% | ||||||||||
| (*) Respect to GWh sold | ||||||||||||||
| Table 14 | ||||||||||
| Company | GWh Produced | Var 05-04 | Chg % | |||||||
| 9M 04 | 9M 05 | |||||||||
| Chilean Companies | 12,086 | 13,778 | 1,692 | 14.0% | ||||||
| Chocón | 2,737 | 2,849 | 112 | 4.1% | ||||||
| Costanera | 5,738 | 6,663 | 924 | 16.1% | ||||||
| Edegel | 3,068 | 3,306 | 239 | 7.8% | ||||||
| Betania | 1,415 | 1,570 | 155 | 10.9% | ||||||
| Emgesa | 7,603 | 7,285 | (318) | (4.2%) | ||||||
| Cachoeira | 2,394 | 2,645 | 251 | 10.5% | ||||||
| TOTAL | 35,041 | 38,096 | 3,055 | 8.7% | ||||||

Pg. 33
| PRESS RELEASE | |
DISTRIBUTION BUSINESS
| Table 15 | ||||||||
| Distribution Business | 9M 04 | 9M 05 | Var 05-04 | Chg % | ||||
| Customers (Th) | 10,825 | 11,129 | 304 | 2.8% | ||||
| GWh Sold | 38,905 | 41,033 | 2,128 | 5.5% | ||||
| Clients/Employe | 1,523 | 1,559 | 37 | 2.4% | ||||
| Energy Losses % (9M) | 11.9% | 11.9% | - | 0.0% | ||||
| Energy Losses % (TTM) | 11.9% | 11.9% | - | 0.0% | ||||
HIGHLIGHTS
InChile, physical sales in our concession area increased by 4.7% and the energy losses reached 5.5% . The billing was over 100%.
InBrazil, Coelce’s physicals sales increased by 8%, driven by higher temperatures. The energy losses were 14.1% and the billing was over 100%.
The April tariff revision was of 23.59%, but this revision was suspended and the increase limited to 11.13% due to judicial actions; Coelce billed with this tariff increase from May ‘05 to September ‘05. In October 7th the lawsuits were dropped and Coelce started billing with the 23.59% increase.
Ampla’s physical sales increased by 6.7%, driven by higher temperatures and by more economic activity. The energy losses decreased from 22.9% to 22.7%, and the billing was 99%, both due mainly to theDAT network.
InColombia, the energy sales in our concession area increased by 4.3% and the energy losses decreased from 9.9% to 9.6% . The billing was over 100%.
InArgentina, physical sales in our concession area increased by 4.8% . The energy losses decreased from 11.8% to 11.6% .
InPeru, physical sales in our concession area increased by 6.5%, and the energy losses reached 8.6% as of September 2005. The November VAD adjustment is expected to be around 0%.
Pg. 34
| PRESS RELEASE | |
CHILECTRA(UNDERCHILEANGAAP)
INCOMESTATEMENT
| Table 16 | ||||||||||
| Million US$ | Million Ch$ | |||||||||
| 9M 04 | 9M 05 | 9M 04 | 9M 05 | Chg % | ||||||
| Revenues from Sales | 646 | 751 | 341,854 | 397,432 | 16.3% | |||||
| Other Operating Revenues | 60 | 59 | 31,839 | 31,116 | (2.3%) | |||||
| Operating Revenues | 706 | 810 | 373,692 | 428,547 | 14.7% | |||||
| Energy Purchases | (410) | (509) | (217,112) | (269,590) | (24.2%) | |||||
| Other Operating Cost | (74) | (80) | (39,204) | (42,153) | (7.5%) | |||||
| Operating Costs | (484) | (589) | (256,317) | (311,743) | (21.6%) | |||||
| Selling and Administrative Expenses | (56) | (55) | (29,826) | (29,010) | 2.7% | |||||
| Operating Income | 165 | 166 | 87,549 | 87,794 | 0.3% | |||||
| Interest Income | 3 | 2 | 1,519 | 959 | (36.9%) | |||||
| Interest Expenses | (49) | (43) | (25,983) | (22,492) | 13.4% | |||||
| Net Financial Income (Expenses) | (46) | (41) | (24,464) | (21,533) | 12.0% | |||||
| Equity Gains from Related Company | 8 | 14 | 4,282 | 7,590 | 77.3% | |||||
| Equity Losses from Related Company | (25) | (33) | (13,467) | (17,454) | (29.6%) | |||||
| Net Income from Related Companies | (17) | (19) | (9,185) | (9,863) | (7.4%) | |||||
| Other Non Operating Income | 9 | 10 | 4,994 | 5,091 | 1.9% | |||||
| Other Non Operating Expenses | (6) | (4) | (3,346) | (1,959) | 41.5% | |||||
| Conversion Effect (BT 64) | - | - | - | - | ||||||
| Net other Non Operating Income (Expenses) | 3 | 6 | 1,648 | 3,132 | 90.1% | |||||
| Price Level Restatement | 0 | 6 | 186 | 3,421 | - | |||||
| Foreign Exchange Effect | - | - | - | - | ||||||
| Net of Monetary Exposure | 0 | 6 | 186 | 3,421 | - | |||||
| Positive Goodwill Amortization | (1) | (1) | (343) | (439) | (28.1%) | |||||
| Non Operating Income | (61) | (48) | (32,158) | (25,282) | 21.4% | |||||
| Net Income b. Taxes, Min Int and Neg Goodwill Amort. | 105 | 118 | 55,390 | 62,512 | 12.9% | |||||
| Extraordinary Items | - | - | - | - | ||||||
| Income Tax | (15) | (21) | (7,825) | (11,315) | (44.6%) | |||||
| Minority Interest | 3 | (1) | 1,562 | (471) | (130.2%) | |||||
| Negative Goodwill Amortization | - | - | - | - | ||||||
| NET INCOME | 93 | 96 | 49,128 | 50,725 | 3.3% | |||||
ADDITIONALINFORMATION
| Table 17 | ||||||||
| Chilectra | 9M 04 | 9M 05 | Chg % | |||||
| Customers (Th) | 1,361 | 1,396 | 2.6% | |||||
| GWh Sold | 8,449 | 8,847 | 4.7% | |||||
| Clients/Employee | 1,975 | 1,983 | 0.4% | |||||
| Energy Losses % (9M) | 5.2% | 5.6% | 7.9% | |||||
| Energy Losses % (TTM) | 5.2% | 5.5% | 6.6% | |||||
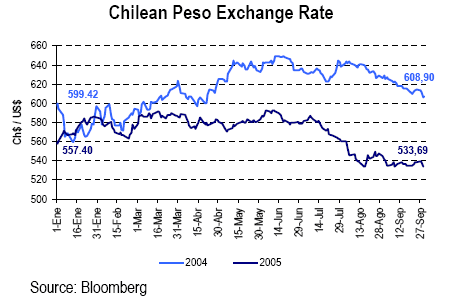
Pg. 35
| PRESS RELEASE | |
AMPLA(UNDERCHILEANGAAP*)
OPERATINGINCOME
| Table 18 | ||||||||||
| Million US$ | Million Ch$ | |||||||||
| 9M 04 | 9M 05 | 9M 04 | 9M 05 | Chg % | ||||||
| Revenues from Sales | 537 | 640 | 284,001 | 338,482 | 19.2% | |||||
| Other Operating Revenues | 27 | 32 | 14,476 | 16,834 | 16.3% | |||||
| Operating Revenues | 564 | 671 | 298,478 | 355,315 | 19.0% | |||||
| Energy Purchases | (295) | (320) | (155,858) | (169,184) | (8.6%) | |||||
| Other Operating Cost | (169) | (209) | (89,692) | (110,723) | (23.4%) | |||||
| Operating Costs | (464) | (529) | (245,550) | (279,907) | (14.0%) | |||||
| Selling and Administrative Expenses | (23) | (26) | (11,911) | (13,603) | (14.2%) | |||||
| Operating Income | 78 | 117 | 41,017 | 61,805 | 50.7% | |||||
| * Please take note that these figures could differed from those accounted under Brazilian GAAP. | ||||||||||
ADDITIONALINFORMATION
| Table 19 | ||||||||
| Ampla | 9M 04 | 9M 05 | Chg % | |||||
| Customers (Th) | 2,096 | 2,191 | 4.6% | |||||
| GWh Sold | 5,644 | 6,020 | 6.7% | |||||
| Clients/Employee | 1,507 | 1,554 | 3.1% | |||||
| Energy Losses % (9M) | 22.9% | 22.7% | (0.9%) | |||||
| Energy Losses % (TTM) | 22.9% | 22.7% | (0.7%) | |||||
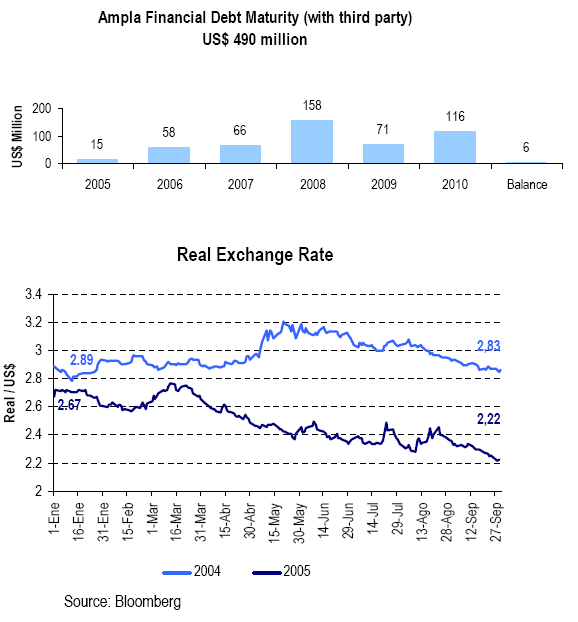
Pg. 36
| PRESS RELEASE | |
COELCE(UNDERCHILEANGAAP*)
OPERATINGINCOME
| Table 20 | ||||||||||
| Million US$ | Million Ch$ | |||||||||
| 9M 04 | 9M 05 | 9M 04 | 9M 05 | Chg % | ||||||
| Revenues from Sales | 397 | 423 | 210,257 | 223,999 | 6.5% | |||||
| Other Operating Revenues | 6 | 12 | 3,053 | 6,550 | 114.5% | |||||
| Operating Revenues | 403 | 436 | 213,311 | 230,548 | 8.1% | |||||
| Energy Purchases | (247) | (208) | (130,746) | (110,295) | 15.6% | |||||
| Other Operating Cost | (105) | (104) | (55,811) | (54,877) | 1.7% | |||||
| Operating Costs | (353) | (312) | (186,557) | (165,173) | 11.5% | |||||
| Selling and Administrative Expenses | (47) | (50) | (24,857) | (26,255) | (5.6%) | |||||
| Operating Income | 4 | 74 | 1,897 | 39,120 | - | |||||
| * Please take note that these figures could differed from those accounted under Brazilian GAAP. | ||||||||||
ADDITIONALINFORMATION
| Table 21 | ||||||||
| Coelce | 9M 04 | 9M 05 | Chg % | |||||
| Customers (Th) | 2,318 | 2,409 | 4.0% | |||||
| GWh Sold | 4,483 | 4,843 | 8.0% | |||||
| Clients/Employee | 1,709 | 1,842 | 7.8% | |||||
| Energy Losses % (9M) | 13.7% | 14.0% | 2.4% | |||||
| Energy Losses % (TTM) | 13.7% | 14.1% | 3.0% | |||||
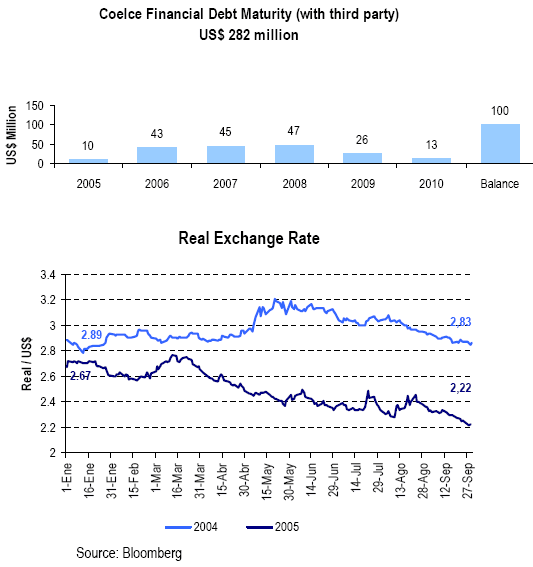
Pg. 37
| PRESS RELEASE | |
CODENSA(UNDERCHILEANGAAP*)
OPERATINGINCOME
| Table 22 | ||||||||||
| Million US$ | Million Ch$ | |||||||||
| 9M 04 | 9M 05 | 9M 04 | 9M 05 | Chg % | ||||||
| Revenues from Sales | 437 | 442 | 231,045 | 233,657 | 1.1% | |||||
| Other Operating Revenues | 130 | 122 | 68,966 | 64,510 | (6.5%) | |||||
| Operating Revenues | 567 | 563 | 300,011 | 298,168 | (0.6%) | |||||
| Energy Purchases | (267) | (255) | (141,311) | (134,906) | 4.5% | |||||
| Other Operating Cost | (156) | (152) | (82,793) | (80,658) | 2.6% | |||||
| Operating Costs | (423) | (407) | (224,104) | (215,565) | 3.8% | |||||
| Selling and Administrative Expenses | (12) | (15) | (6,417) | (8,021) | (25.0%) | |||||
| Operating Income | 131 | 141 | 69,490 | 74,582 | 7.3% | |||||
| * Please take note that these figures could differed from those accounted under Colombian GAAP. | ||||||||||
ADDITIONALINFORMATION
| Table 23 | ||||||||
| Codensa | 9M 04 | 9M 05 | Chg % | |||||
| Customers (Th) | 2,008 | 2,055 | 2.4% | |||||
| GWh Sold | 7,165 | 7,470 | 4.3% | |||||
| Clients/Employee | 2,338 | 2,309 | (1.3%) | |||||
| Energy Losses % (9M) | 9.7% | 9.5% | (1.9%) | |||||
| Energy Losses % (TTM) | 9.9% | 9.6% | (3.8%) | |||||
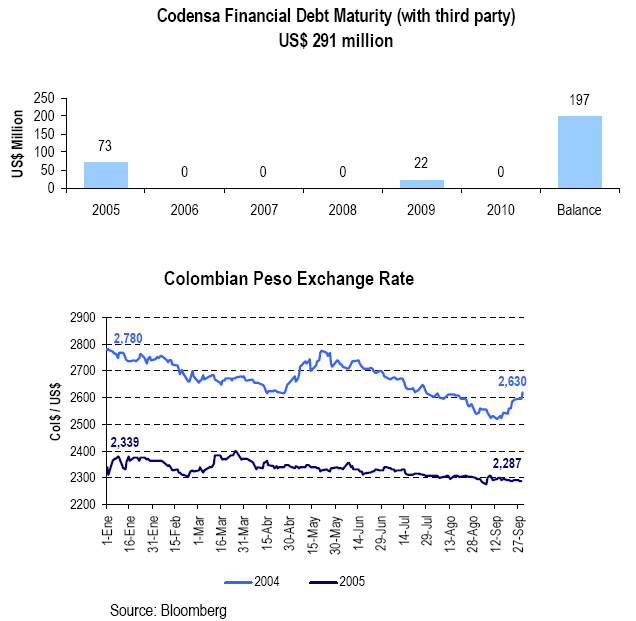
Pg. 38
| PRESS RELEASE | |
EDELNOR(UNDERCHILEANGAAP*)
OPERATINGINCOME
| Table 24 | ||||||||||
| Million US$ | Million Ch$ | |||||||||
| 9M 04 | 9M 05 | 9M 04 | 9M 05 | Chg % | ||||||
| Revenues from Sales | 270 | 274 | 142,811 | 145,230 | 1.7% | |||||
| Other Operating Revenues | 8 | 7 | 4,322 | 3,486 | (19.3%) | |||||
| Operating Revenues | 278 | 281 | 147,132 | 148,716 | 1.1% | |||||
| Energy Purchases | (176) | (181) | (93,231) | (95,962) | (2.9%) | |||||
| Other Operating Cost | (35) | (32) | (18,315) | (17,193) | 6.1% | |||||
| Operating Costs | (211) | (214) | (111,547) | (113,155) | (1.4%) | |||||
| Selling and Administrative Expenses | (25) | (25) | (13,439) | (13,409) | 0.2% | |||||
| Operating Income | 42 | 42 | 22,146 | 22,152 | 0.0% | |||||
| * Please take note that these figures could differed from those accounted under Peruvian GAAP. | ||||||||||
ADDITIONALINFORMATION
| Table 25 | ||||||||
| Edelnor | 9M 04 | 9M 05 | Chg % | |||||
| Customers (Th) | 909 | 920 | 1.3% | |||||
| GWh Sold | 3,150 | 3,355 | 6.5% | |||||
| Clients/Employee | 1,671 | 1,729 | 3.5% | |||||
| Energy Losses % (9M) | 8.4% | 8.6% | 2.3% | |||||
| Energy Losses % (TTM) | 8.4% | 8.6% | 1.5% | |||||
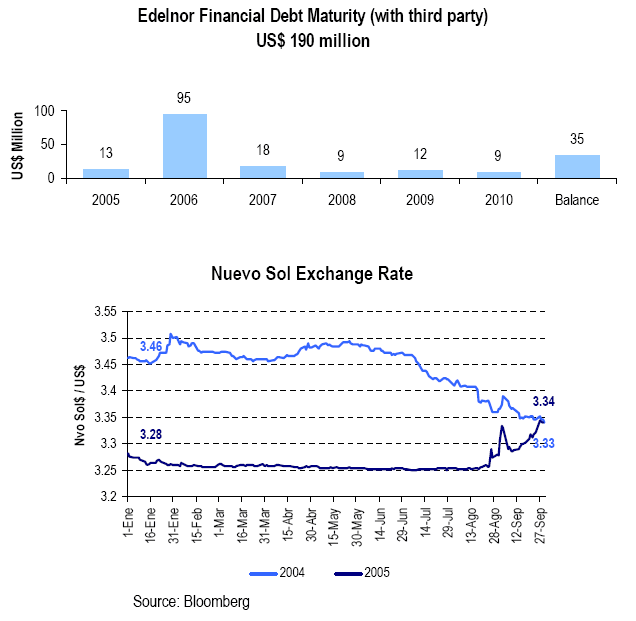
Pg. 39
| PRESS RELEASE | |
EDESUR(UNDERCHILEANGAAP*)
OPERATINGINCOME
| Table 26 | ||||||||||
| Million US$ | Million Ch$ | |||||||||
| 9M 04 | 9M 05 | 9M 04 | 9M 05 | Chg % | ||||||
| Revenues from Sales | 303 | 311 | 160,464 | 164,351 | 2.4% | |||||
| Other Operating Revenues | 22 | 25 | 11,428 | 13,291 | 16.3% | |||||
| Operating Revenues | 325 | 336 | 171,893 | 177,642 | 3.3% | |||||
| Energy Purchases | (159) | (188) | (83,963) | (99,582) | (18.6%) | |||||
| Other Operating Cost | (121) | (111) | (64,016) | (58,517) | 8.6% | |||||
| Operating Costs | (280) | (299) | (147,979) | (158,099) | (6.8%) | |||||
| Selling and Administrative Expenses | (43) | (41) | (22,670) | (21,906) | 3.4% | |||||
| Operating Income | 2 | (4) | 1,244 | (2,363) | - | |||||
| * Please take note that these figures could differed from those accounted under Argentinean GAAP. | ||||||||||
ADDITIONALINFORMATION
| Table 27 | ||||||||
| Edesur | 9M 04 | 9M 05 | Chg % | |||||
| Customers (Th) | 2,133 | 2,158 | 1.2% | |||||
| GWh Sold | 10,014 | 10,498 | 4.8% | |||||
| Clients/Employee | 940 | 941 | 0.1% | |||||
| Energy Losses % (9M) | 11.8% | 11.7% | (0.8%) | |||||
| Energy Losses % (TTM) | 11.8% | 11.6% | (1.5%) | |||||
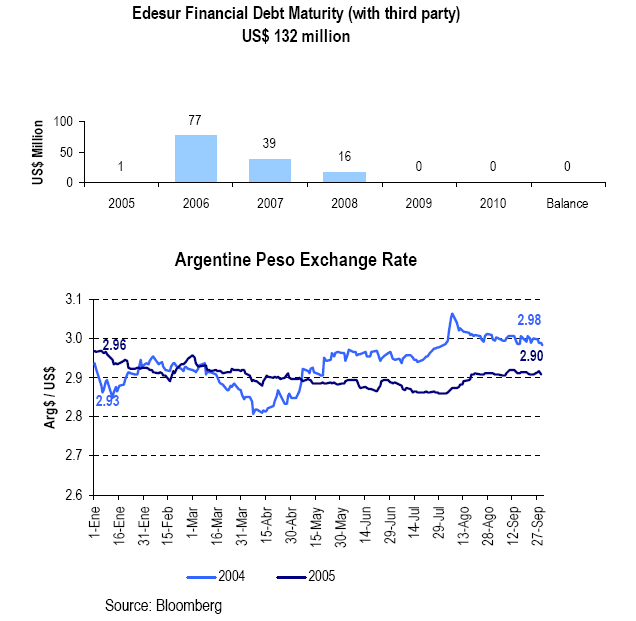
Pg. 40
| PRESS RELEASE | |
PARTIALLY CONSOLIDATED INCOME STATEMENT
(Parent Company Consolidated with Enersis Internacional Nine Months 2005 Earnings Report)
UNDERCHILEANGAAP,MILLIONCH$
| Table 29 | ||||||||||||
| 3Q 04 | 3Q 05 | Var % | (in million Ch$ of 9M04) | 9M 04 | 9M 05 | Var % | ||||||
| 843 | 831 | (1.4%) | Gross Operating Margin | 2,530 | 2,585 | 2.2% | ||||||
| (5,077) | (4,108) | 19.1% | S&A Expenses | (12,694) | (11,642) | 8.3% | ||||||
| (4,234) | (3,277) | 22.6% | Operating Income | (10,164) | (9,057) | 10.9% | ||||||
| 16,040 | 28,007 | 74.6% | Endesa | 36,601 | 47,215 | 29.0% | ||||||
| 33,482 | 30,890 | (7.7%) | Chilectra | 57,287 | 59,522 | 3.9% | ||||||
| (2,975) | (3,551) | (19.4%) | Edesur | (8,491) | (12,298) | (44.8%) | ||||||
| (221) | 2,353 | - | Edelnor | 1,279 | 5,057 | - | ||||||
| (14,226) | 709 | 105.0% | Ampla | (13,848) | (17,862) | (29.0%) | ||||||
| (720) | 539 | 174.9% | Coelce | (1,199) | 790 | 165.9% | ||||||
| 3,056 | 2,759 | (9.7%) | Codensa | 8,242 | 10,227 | 24.1% | ||||||
| 1,041 | 734 | (29.5%) | CAM LTDA | 2,725 | 2,623 | (3.8%) | ||||||
| 436 | 699 | 60.4% | Inm Manso de Velasco | 2,031 | 1,639 | (19.3%) | ||||||
| 1,078 | 379 | (64.9%) | Synapsis | 3,081 | 2,282 | (25.9%) | ||||||
| 4,268 | 4,142 | NA | CGTF | 10,055 | 5,905 | NA | ||||||
| (828) | (34) | 95.9% | Other | (1,045) | (4,342) | - | ||||||
| 40,432 | 67,626 | 67.3% | Net Income from Related Companies | 96,717 | 100,758 | 4.2% | ||||||
| 9,868 | 10,787 | 9.3% | Interest Income | 36,276 | 37,183 | 2.5% | ||||||
| (15,059) | (15,370) | (2.1%) | Interest Expense | (57,403) | (50,263) | 12.4% | ||||||
| (5,190) | (4,583) | 11.7% | Net Financial Income (Expenses) | (21,127) | (13,080) | 38.1% | ||||||
| 2,507 | 2,180 | (13.0%) | Other Non Operating Income | 7,097 | 10,363 | 46.0% | ||||||
| (184) | 820 | - | Other Non Operating Expenses | (9,516) | (2,562) | 73.1% | ||||||
| 2,323 | 3,000 | 29.1% | Net other Non Operating Income (Expenses) | (2,419) | 7,801 | - | ||||||
| (1,202) | (659) | 45.2% | Price Level Restatement | (1,198) | (1,355) | (13.1%) | ||||||
| (8,431) | (24,326) | (188.5%) | Foreign Exchange Effect | 4,322 | (20,367) | - | ||||||
| (9,633) | (24,985) | (159.4%) | Net Monetary Exposure | 3,124 | (21,722) | - | ||||||
| (13,198) | (12,713) | 3.7% | Positive Goodwill Amortization | (39,349) | (39,483) | (0.3%) | ||||||
| 14,734 | 28,345 | 92.4% | Non Operating Income | 36,945 | 34,274 | (7.2%) | ||||||
| 10,499 | 25,068 | 138.8% | Net Income before (1), (2) & (3) | 26,781 | 25,217 | (5.8%) | ||||||
| 11,916 | 7,195 | (39.6%) | Income Tax (1) | 9,602 | 12,004 | 25.0% | ||||||
| (330) | 9 | 102.7% | Negative Goodwill Amortization (2) | 33 | 30 | (9.0%) | ||||||
| - | - | NA | Minority Interest (3) | - | - | NA | ||||||
| 22,086 | 32,272 | 46.1% | NET INCOME | 36,415 | 37,251 | 2.3% | ||||||
| 0.68 | 0.99 | EPS (Ch$) | 1.12 | 1.14 | ||||||||
| 0.06 | 0.09 | EPADS (US$) | 0.11 | 0.11 | ||||||||
| 32,651,166 | 32,651,166 | Common Shares Outstanding (Th) | 32,651,166 | 32,651,166 | ||||||||
Pg. 41
| PRESS RELEASE | |
UNDERCHILEANGAAP,THOUSANDUS$
| Table 29.1 | ||||||||||||
| 3Q 04 | 3Q 05 | Var % | (in thousand US$ of 9M05) | 9M 04 | 9M 05 | Var % | ||||||
| 1,592 | 1,570 | (1.4%) | Gross Operating Margin | 4,780 | 4,885 | 2.2% | ||||||
| (9,593) | (7,763) | 19.1% | S&A Expenses | (23,987) | (21,999) | 8.3% | ||||||
| (8,001) | (6,192) | 22.6% | Operating Income | (19,206) | (17,115) | 10.9% | ||||||
| 30,310 | 52,923 | 74.6% | Endesa | 69,163 | 89,220 | 29.0% | ||||||
| 63,269 | 58,371 | (7.7%) | Chilectra | 108,251 | 112,475 | 3.9% | ||||||
| (5,621) | (6,710) | (19.4%) | Edesur | (16,046) | (23,239) | (44.8%) | ||||||
| (418) | 4,446 | - | Edelnor | 2,417 | 9,556 | - | ||||||
| (26,883) | 1,340 | 105.0% | Cerj | (26,168) | (33,753) | (29.0%) | ||||||
| (1,360) | 1,019 | 174.9% | Coelce | (2,266) | 1,493 | 165.9% | ||||||
| 5,775 | 5,214 | (9.7%) | Codensa | 15,575 | 19,325 | 24.1% | ||||||
| 1,968 | 1,387 | (29.5%) | CAM LTDA | 5,150 | 4,957 | (3.8%) | ||||||
| 823 | 1,321 | 60.4% | Inm Manso de Velasco | 3,838 | 3,097 | (19.3%) | ||||||
| 2,038 | 716 | (64.9%) | Synapsis | 5,821 | 4,312 | (25.9%) | ||||||
| 8,066 | 7,827 | NA | CGTF | 19,000 | 11,158 | NA | ||||||
| (1,565) | (64) | 95.9% | Other | (1,976) | (8,205) | - | ||||||
| 76,402 | 127,789 | 67.3% | Net Income from Related Companies | 182,761 | 190,397 | 4.2% | ||||||
| 18,648 | 20,384 | 9.3% | Interest Income | 68,548 | 70,263 | 2.5% | ||||||
| (28,455) | (29,044) | (2.1%) | Interest Expense | (108,471) | (94,979) | 12.4% | ||||||
| (9,807) | (8,660) | 11.7% | Net Financial Income (Expenses) | (39,923) | (24,717) | 38.1% | ||||||
| 4,737 | 4,119 | (13.0%) | Other Non Operating Income | 13,410 | 19,582 | 46.0% | ||||||
| (348) | 1,550 | - | Other Non Operating Expenses | (17,982) | (4,841) | 73.1% | ||||||
| 4,390 | 5,669 | 29.1% | Net other Non Operating Income (Expenses) | (4,572) | 14,741 | - | ||||||
| (2,271) | (1,245) | 45.2% | Price Level Restatement | (2,264) | (2,560) | (13.1%) | ||||||
| (15,931) | (45,967) | (188.5%) | Foreign Exchange Effect | 8,167 | (38,486) | - | ||||||
| (18,203) | (47,213) | (159.4%) | Net Monetary Exposure | 5,903 | (41,047) | - | ||||||
| (24,940) | (24,023) | 3.7% | Positive Goodwill Amortization | (74,356) | (74,609) | (0.3%) | ||||||
| 27,841 | 53,562 | 92.4% | Non Operating Income | 69,813 | 64,766 | (7.2%) | ||||||
| 19,840 | 47,370 | 138.8% | Net Income before (1), (2) & (3) | 50,607 | 47,651 | (5.8%) | ||||||
| 22,517 | 13,596 | (39.6%) | Income Tax (1) | 18,144 | 22,683 | 25.0% | ||||||
| (623) | 17 | 102.7% | Negative Goodwill Amortization (2) | 62 | 57 | (9.0%) | ||||||
| - | - | NA | Minority Interest (3) | - | - | NA | ||||||
| 41,734 | 60,983 | 46.1% | NET INCOME | 68,811 | 70,391 | 2.3% | ||||||
| 0.68 | 0.99 | EPS (Ch$) | 1.12 | 1.14 | ||||||||
| 0.06 | 0.09 | EPADS (US$) | 0.11 | 0.11 | ||||||||
| 32,651,166 | 32,651,166 | Common Shares Outstanding (Th) | 32,651,166 | 32,651,166 | ||||||||
Pg. 42
| PRESS RELEASE | |
OWNERSHIP OF THE COMPANY AS OF SEPTEMBER 30,2005
TOTAL SHAREHOLDERS: 9,364
CONFERENCE CALL INVITATION
Enersis is pleased to inform you that it will hold a conference call to review its results for the period, on Friday, October 28th, 2005, at 11:00 AM New York time (12:00 PM Chilean Time). To participate, please dial +1 (617) 597-5376 or +1 (866) 510-0707 (toll free USA), approximately 10 minutes prior to the scheduled start time, Passcode ID: 44911206
The phone replay will be available since October 28th, 2005, until November 4th, 2005, dialing +1 (617) 801-6888 or 1+ (888) 286-8010 (toll free USA) Passcode ID: 74873900
To access the call online, or to access the replay, go to:http://www.enersis.com Investor Relations, the conference will be complemented by a Power Point “slides show”.
Pg. 43
| PRESS RELEASE | |
CONTACTINFORMATION
For further information, please contact us:
| Susana Rey | ||||||
| Head of Investor Relations | ||||||
| srm@e.enersis.cl | ||||||
| 56 (2) 353 4554 | ||||||
| Cristian Palacios | Marcela Muñoz | Ignacio Gonzalez | Carmen Poblete | |||
| Investor Relations | Investor Relations | Investor Relations | Investor Relations | |||
| Representative | Representative | Representative | Representative | |||
| cpg1@e.enersis.cl | mml1@e.enersis.cl | ijgr@e.enersis.cl | cpt@e.enersis.cl | |||
| 56 (2) 353 4492 | 56 (2) 353 4555 | 56 (2) 353 4552 | 56 (2) 353 4447 | |||
| Mariluz Muñoz | ||||||
| Investor Relations | ||||||
| Assistant | ||||||
| mlmr@e.enersis.cl | ||||||
| 56 (2) 353 4682 | ||||||
DISCLAIMER
This Press Release contains statements that could constitute forward-looking statements within the meaning of the Private Securities Litigation Reform Act of 1995. These statements appear in a number of places in this announcement and include statements regarding the intent, belief or current expectations of Enersis and its management with respect to, among other things: (1) Enersis’ business plans; (2) Enersis’ cost-reduction plans; (3) trends affecting Enersis’ financial condition or results of operations, including market trends in the electricity sector in Chile or elsewhere; (4) supervision and regulation of the electricity sector in Chile or elsewhere; and (5) the future effect of any changes in the laws and regulations applicable to Enersis’ or its affiliates. Such forward-looking statements are not guarantees of future performance and involve risks and uncertainties. Actual results may differ materially from those in the forward-looking statements as a result of various factors. These factors include a decline in the equity capital markets of the United States or Chile, an increase in the market rates of interest in the United States or elsewhere, adverse decisions by government regulators in Chile or elsewhere and other factors described in Enersis’ Annual Report on Form 20-F. Readers are cautioned not to place undue reliance on those forward-looking statements, which state only as of their dates. Enersis undertakes no obligation to release publicly the result of any revisions to these forward-looking statements.
Pg. 44
SIGNATURES
Pursuant to the requirements of the Securities Exchange Act of 1934, as amended, the Registrant has duly caused this report to be signed on its behalf by the undersigned, thereunto duly authorized.
| ENERSIS S.A. | |||||||
| Date: November 03, 2005 | By: | /s/ Mario Valcarce | |||||
| Name: Mario Valcarce | |||||||
| Title: Chief Executive Officer | |||||||