FORM 6-K
SECURITIES AND EXCHANGE COMMISSION
Washington, D.C. 20549
Report of Foreign Issuer
Pursuant to Rule 13a-16 or 15d-16 of
the Securities Exchange Act of 1934
For the month of July, 2010
Commission File Number: 001-12440
ENERSIS S.A.
(Translation of Registrant’s Name into English)
Santa Rosa 76
Santiago, Chile
(Address of principal executive office)
Indicate by check mark whether the registrant files or will file
annual reports under cover of Form 20-F or Form 40-F:
Form 20-F [X] Form 40-F [ ]
Indicate by check mark if the registrant is submitting the Form 6-K
in paper as permitted by Regulation S-T Rule 101(b)(1):
Yes [ ] No [X]
Indicate by check mark if the registrant is submitting the Form 6-K
in paper as permitted by Regulation S-T Rule 101(b)(7):
Yes [ ] No [X]
Indicate by check mark whether by furnishing the information
ontained in this Form, the Registrant is also thereby furnishing the
information to the Commission
pursuant to Rule 12g3-2(b) under the Securities Exchange Act of 1934:
Yes [ ] No [X]
If °;Yes” is marked, indicate below the file number assigned to the registrant
in connection with Rule 12g3-2(b): N/A
| PRESS RELEASE |
| First Half 2010 |
ENERSIS
ANNOUNCES CONSOLIDATED RESULTS
FOR FIRST HALF ENDED June 30th, 2010
Highlights for the Period
SUMMARY
- During the first half, as immediate effects of the February 27th earthquake tended to be offset, an important surge in electricity demand was registered in Santiago. This increasing trend has been observed also in all our concession areas, which have experienced important increases in demand, particularly in Brazil.
- During the first half of the year, we have seen an economic recovery positively impacting the demand of electricity. In fact, physical sales for our distribution business showed an increase of 5.7%.
- The contribution in EBITDA of our two lines of business was as follows:
- Generation and Transmission 53%
- Distribution 47%
- Operating Income from Generation and Transmission business decreased 26.7% compared to 1H09, mainly as a result of the decreasing results from our Chilean, Brazilian and Colombian operations, related to lower sales and higher operating costs derived from an increasing thermal production.
- Net Income before taxes decreased 17.7% compared to 1H09, mainly due to the decrease in results from our Generation & Transmission businesses, partially offset by the increase in results from Distribution activities.
- Income Taxes increased 48.6%, mainly due to the effects of dollar variations over payable taxes.
- As of June 30, 2010, net profit attributable to the company’s shareholders amounted to Ch$ 198,173, a 45.1% decrease, mainly due to a decrease in energy sales and also an increase in tax payment.
- A lower average interest rate has allowed us to reduce the average cost of our debt.
- In line with the above, our leverage ratio improved 50 bps. while the ROE reached 14.3%.
Some operating figures of the semester are:
- Operating Costs reached Ch$ 2,292,103 million; in line with 1H09 figures.
- EBITDA reached Ch$ 1,090,089 million, or reduction of 11.3%.
Pg. 1
Operating Income decreased 15.5%, mainly explained by lower results from our GenerationBusiness, partially offset by higher contribution from our Distribution Business.
DISTRIBUTIONBUSINESS
Consolidated figures for Distribution Business are detailed as follows:
Operating Revenues increased 1.3%, amounting to Ch$ 2,106,375 million.
Operating Costs reached Ch$ 1,721,309 million in line with same period last year.
EBITDA increased 7%, amounting to Ch$ 509,292 million.
Operating income increased by 5.1% amounting to Ch$ 385,066 million, mainly explained bybetter performance of subsidiaries in Brazil.
Positive factors that influenced these results are the following:
Consolidated physical sales grew 5.7%, on average mainly explained by demand growth in oursubsidiaries in Brazil and Peru.
An Addition of 391 thousand new clients. This confirms our sustained natural growth indistribution business. This is equivalent to the incorporation of a new mid-size distributioncompany every year.
In Brazil, EBITDA increased Ch 72,901 million, as a result of:
Demand recovery.
Higher average sales prices.
In Peru, EBITDA increased Ch$ 664 million, as a result of:
Higher purchase/sales margins.
7.2% increase in demand.
In Colombia, EBITDA decreased Ch$ 1,060 million, as a result of:
Lower revenues due to the deconsolidation of Codensa Hogar’s revenues, distortingcomparison basis.
In Chile, EBITDA decreased Ch$ 22,223 million, which is explained mainly by the following:
Lower margins due to a lower VAD indexer variation in comparison to the prior year
Higher maintenance costs.
In Argentina, EBITDA decreased Ch$ 15,471 million, as result of:
Higher sales to industrial customers over the residential customers.
Higher operational costs.
GENERATION ANDTRANSMISSIONBUSINESS
Consolidated results for Generation and Transmission Business are detailed as follows:
Pg. 2
Consolidated physical sales decreased 7.7%, totaling 30,810 GWh, primarily in Argentina andColombia.
Due to a mix of lower sales and reduced prices, Operating Revenues decreased 7.4%,amounting to Ch$ 1,296,886 million.
Operating Costs amounted Ch$ 841,116 million, with an 8% increase, mainly explained byhigher energy purchases in Colombia.
EBITDA decreased 21%, amounting to Ch$ 579,847 million.
Operating Income decreased 26.7% amounting to Ch$ 455,769 million.
Hydro generation experienced a 9.9 % decrease, mainly attributable to Colombia.
In Chile, EBITDA decreased by Ch$ 120,897 million which is explained primarily by the following:
A 2.3% lower generation volume.
Average prices decreased 19%.
These effects were partially offset by a 20.2% decrease in fuel costs.
In Colombia, EBITDA decreased by Ch$ 9,064 million, which is explained primarily by the following:
Low hydrology due to “El Niño”.
Less efficient production mix due to higher thermal production.
Higher energy purchases and fuel costs, partially offset by 32% higher average salesprices.
In Peru, EBITDA decreased by Ch$ 8,716 million, as consequence of:
3.2% lower physical sales.
Higher costs of energy purchases due to the absence of the non-recurrent provisionaccumulated as of June 2009, related to distributors without contracts.
In Argentina, EBITDA decreased by Ch$ 2,533 million, as a result of:
16% decrease in physical sales.
16% of higher costs of fuel.
Partially offset by a better generation mix.
In Brazil, EBITDA decreased by Ch$ 14,510 million, as a result of:
A decrease in income from the transmission business, due to the reduced operation of thetransmission lines compared to the 1H09.
Partially offset by the increasing income from the generation business, which experiencedimproved sales margins.
Pg. 3
FINANCIALSUMMARY
The average interest rate, a major cost factor, fell from 8.3% to 7.6%, which represents apositive development for the overall Group.
Liquidity, a key consideration in our financial management, continues to be in a very solidposition, as shown below:
Non-committed credit lines: US$ 527 million available in the aggregate for Enersis andEndesa Chile in the local markets.
Committed credit lines: US$ 650 million in undrawn revolving debt facilities in theinternational markets and US$ 185 million in the local markets, on a consolidated basis.
Cash and cash equivalents amount to US $1,246 million.
Coverage and Protection: In order to mitigate exchange rate and interest rate risks, Enersis hasestablished strict internal rules to protect our cash flows and balance sheet from variations inthese variables.
Our exchange rate policy is based on cash flows and it strives to maintain a balancebetween US dollar indexed flows, and assets and liabilities in such currency. In additionto this policy, we have contracted Cross Currency Swaps for a total amount ofUS$1,327 million and Forwards, for US$137 million.
In order to reduce volatility on financial results due to changes in market interest rate,we seek to maintain an adequate balance in debt structures. Additionally, we havecontracted Interest Rate Swaps for US$ 394 million.
The aforementioned financial policies are being permanently evaluated and adjusted to the changing macroeconomic scenario, in order to achieve the most efficient levels of protection.
MARKETSUMMARY
During the first half of 2010, Chilean stock exchange selective index (IPSA) showed a positive performance in opposite trend to other international stock markets. The IPSA registered a 13.51% increase; compared to other indexes evolutions as Bovespa: -11.6%; Dow Jones Industrials: -6.27%; S&P 500: -7.57%; UKX: -9.16%; FTSE 250: +0.64%.
Enersis shares’ price in the local market decreased 6.21% during the period. The main factor that influenced this negative variation was the significant divestments made by local pension funds.
During this year, Enersis continued to be among the most traded companies at the Santiago Stock Exchange, with an average trading volume of US$ 10.5 million per day during the first half of 2010.
| Top Five Daily Average Traded Amount at SSE in First Half 2010 | |
| Thousand US$ | |
| SQM | 15,262 |
| LAN | 13,706 |
| CENCOSUD | 11,344 |
| ENDESA CHILE | 10,998 |
| ENERSIS | 10,450 |
| Source: Santiago Stock Exchange (SSE) | |
Pg. 4
RISKRATINGCLASSIFICATIONINFORMATION
Enersis credit profile has continued to strengthen in 2010, with solid debt coverage ratios, liquidity position and low leverage levels. The positive perspective on operational and credit profile of Enersis has been reflected in the upgrades received during the first half of the year, from Fitch Ratings, S&P and Feller Rate.
Current ratings are further supported by our well diversified asset portfolio, strong credit metrics, adequate debt structure and robust liquidity. Enersis' geographic diversification through Latin America provides us with a natural hedge against different regulations and weather conditions. Most of our operating subsidiaries are financially strong and have a leading market position in the countries where they operate.
Enersis’ current risk classifications are:
International Ratings:
| Enersis | S&P | Moody’s | Fitch |
| Corporate | BBB+, Stable | Baa3, Stable | BBB+, Stable |
Domestic Ratings (for securities issued in Chile):
| Enersis | Feller Rate | Fitch |
| Shares | 1stClass Level 1 | 1stClass Level 1 |
| Bonds | AA, Stable | AA, Stable |
Pg. 5
TABLE OFCONTENTS
| Summary | 1 | |
| Distribution Business | 2 | |
| Generation and Transmission Business | 2 | |
| Financial Summary | 4 | |
| Market Summary | 4 | |
| Risk Rating Classification Information | 5 | |
| TABLE OF CONTENTS | 6 | |
| GENERAL INFORMATION | 8 | |
| SIMPLIFIEDORGANIZATIONALSTRUCTURE | 9 | |
| MARKET INFORMATION | 10 | |
| EQUITYMARKET | 10 | |
| DEBTMARKET | 13 | |
| CONSOLIDATEDINCOMESTATEMENTANALYSIS | 14 | |
| NETINCOME | 14 | |
| OPERATINGINCOME | 14 | |
| NETFINANCIALINCOME | 16 | |
| TAXES | 16 | |
| CONSOLIDATEDBALANCESHEETANALYSIS | 17 | |
| ASSETSUNDERIFRS | 17 | |
| BOOK VALUE AND ECONOMIC VALUE OF ASSETS | 19 | |
| LIABILITIES ANDSHAREHOLDERS’ EQUITYUNDERIFRS | 20 | |
| DEBTMATURITY WITHTHIRDPARTIES, MILLIONCH$ | 21 | |
| DEBTMATURITY WITHTHIRDPARTIES, THOUSANDUS$ | 22 | |
| EVOLUTIONOFKEYFINANCIALRATIOS | 22 | |
| CONSOLIDATED STATEMENTS OF CASH FLOWS ANALYSIS | 24 | |
| UNDERIFRS | 24 | |
| CASHFLOWRECEIVEDFROMFOREIGNSUBSIDIARIES BYENERSIS, CHILECTRA ANDENDESACHILE | 25 | |
| CAPEX ANDDEPRECIATION | 25 | |
| THE PRINCIPAL RISKS ASSOCIATED TO THE ACTIVITIES OF THE ENERSIS GROUP | 26 | |
| ARGENTINA | 29 | |
| GENERATION | 29 | |
| Endesa Costanera | 29 | |
| El Chocón | 29 | |
| DISTRIBUTION | 30 | |
| Edesur | 30 | |
| BRAZIL | 31 | |
| ENDESABRASIL | 31 | |
| GENERATION | 31 | |
| Cachoeira | 31 | |
| Fortaleza (cgtf) | 32 | |
| TRANSMISSION | 32 | |
| CIEN | 32 | |
| DISTRIBUTION | 33 | |
Pg. 6
| Ampla | 33 | |
| Coelce | 34 | |
| CHILE | 35 | |
| GENERATION | 35 | |
| Endesa Chile | 35 | |
| DISTRIBUTION | 36 | |
| Chilectra | 36 | |
| COLOMBIA | 37 | |
| GENERATION | 37 | |
| Emgesa | 37 | |
| DISTRIBUTION | 38 | |
| Codensa | 38 | |
| PERU | 39 | |
| GENERATION | 39 | |
| Edegel | 39 | |
| DISTRIBUTION | 39 | |
| Edelnor | 39 | |
| CONFERENCE CALL INVITATION | 41 | |
| CONTACTINFORMATION | 42 | |
| DISCLAIMER | 42 |
Pg. 7
GENERALINFORMATION
(Santiago, Chile, Tuesday 27th, July 2010) Enersis S.A. (NYSE: ENI), announced today its consolidated financial results for the quarter ended on June 30th, 2010. All figures are in Chilean pesos (Ch$) under International Financial Reporting Standards (IFRS). Variations refer to the period ended as of June 30th, 2009 and June 30th, 2010.
Figures as of June 30th, 2010 are additionally translated into US$, merely as a convenience translation, using the exchange rate of US$1 = Ch$547.19 as of June 30th, 2010 for the Balance Sheet, and the average exchange rate for the semester of US$1 = Ch$524.84 for the Income Statement, Cash Flow Statements, Capex and Depreciation values.
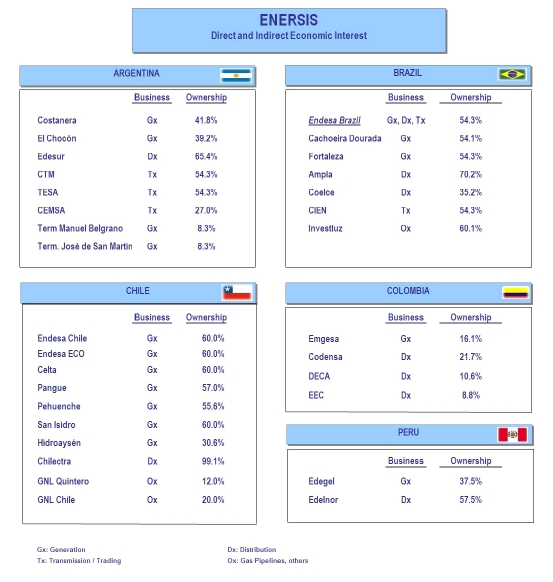
The consolidation includes the following investment vehicles and companies,
a) In Chile: Endesa Chile (NYSE: EOC)*, Chilectra, Synapsis, CAM, and Inmobiliaria Manso de Velasco.
b) Outside Chile: Distrilima (Peru), Endesa Brasil (Brazil)**, Edesur (Argentina) and Codensa (Colombia).
In the following pages you will find a detailed financial statement analysis, a brief explanation for the most important variations and comments on main items in the P&L and Cash Flow Statements compared to the information as of June 30th, 2009.
* Includes Endesa Chile Chilean subsidiaries (Celta, Pangue, Pehuenche, San Isidro, and Túnel El Melón), non Chilean subsidiaries (Costanera, El Chocón, Edegel and Emgesa) and jointly controlled companies or associates companies (Gas Atacama, Transquillota and HidroAysén).
** Includes Endesa Fortaleza, CIEN, Cachoeira Dourada, Ampla and Coelce.
Pg. 8
SIMPLIFIEDORGANIZATIONALSTRUCTURE
Pg. 9
MARKETINFORMATION
EQUITYMARKET
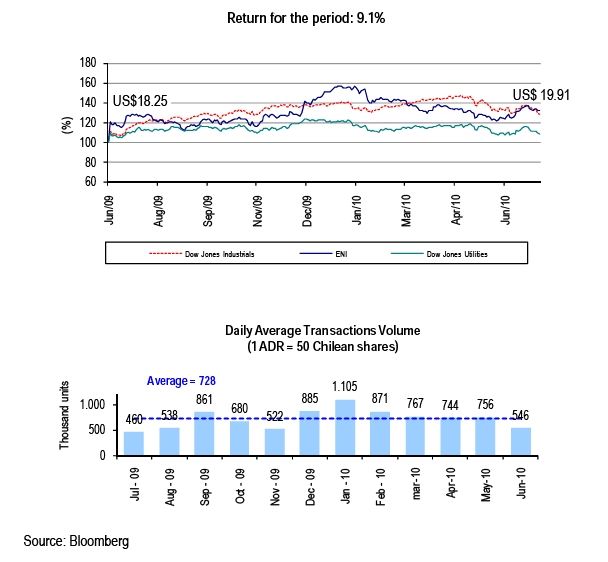
New York Stock Exchange (NYSE)
The chart below shows the performance of Enersis’ ADR (“ENI”) price at the NYSE, compared to the Dow Jones Industrials and the Dow Jones Utilities indexes over the last 12 months:
Pg. 10
Santiago Stock Exchange (BCS)
The chart below shows the performance of Enersis’ Chilean stock price over the last 12 months compared to the Chilean Selective Stock Index (IPSA):
![]()
Pg. 11
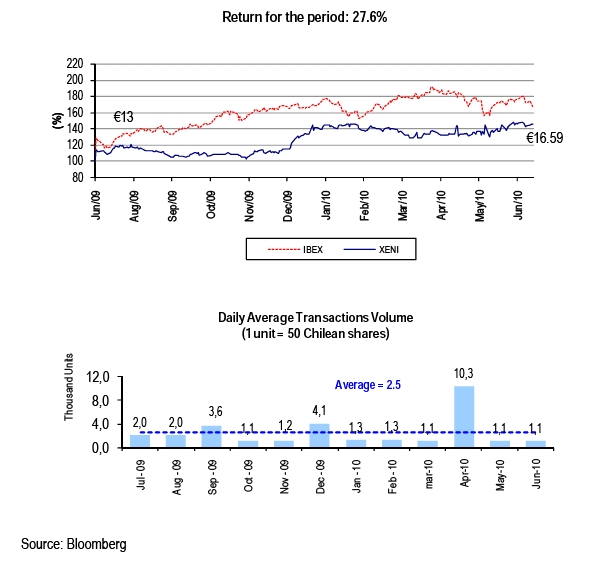
Madrid Stock Exchange (Latibex) - Spain
The chart below shows Enersis’ share price (“XENI”) at the Latibex over the last 12 months compared to the Local Stock Index (IBEX):
Pg. 12
DEBTMARKET
Yankee Bonds Price Evolution
The following chart shows the pricing of two of our Yankee Bonds over the last twelve months compared to the Ishares Iboxx Investment Grade Corporate Bond Fund Index:
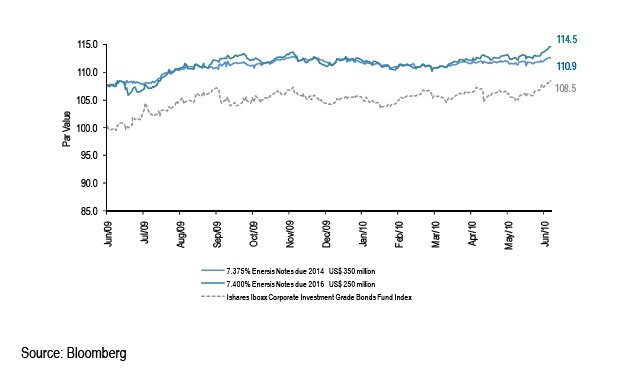
(*) IShares Iboxx Corporate Investment Grade Bonds Fund is an exchange traded fund incorporated in the U.S.A. The Index measures the performance of a fixed number of investment grade corporate bonds.
Pg. 13
CONSOLIDATEDINCOMESTATEMENTANALYSIS
NETINCOME
Enersis’ Net Income attributable to the Owners of the Company for the first half 2010 was Ch$ 198,173 million, representing a 45.1% decrease over the same’ last year period, which was Ch$ 360,906 million.
Under IFRS
| Table 1 | ||||||||||
| CONSOLIDATED INCOME STATEMENT | (Million Ch$) | (Thousand US$) | ||||||||
| 1H09 | 1H10 | Var 1H09-1H10 | Chg % | 1H10 | ||||||
| Sales | 3,105,843 | 2,972,213 | (133,629) | (4.3%) | 5,663,085 | |||||
| Energy sales | 2,837,816 | 2,745,996 | (91,820) | (3.2%) | 5,232,063 | |||||
| Other sales | 24,261 | 21,089 | (3,172) | (13.1%) | 40,181 | |||||
| Other services | 243,766 | 205,129 | (38,637) | (15.9%) | 390,840 | |||||
| Other operating income | 168,485 | 156,241 | (12,244) | (7.3%) | 297,692 | |||||
| Revenues | 3,274,328 | 3,128,454 | (145,874) | (4.5%) | 5,960,777 | |||||
| Power purchased | (834,602) | (754,408) | 80,194 | 9.6% | (1,437,406) | |||||
| Cost of fuel consumed | (356,328) | (345,649) | 10,679 | 3.0% | (658,580) | |||||
| Transportation expenses | (139,289) | (195,018) | (55,729) | (40.0%) | (371,576) | |||||
| Other variable procurements and services | (323,911) | (346,543) | (22,632) | (7.0%) | (660,284) | |||||
| Procurements and Services | (1,654,130) | (1,641,619) | 12,511 | 0.8% | (3,127,846) | |||||
| Contribution Margin | 1,620,199 | 1,486,836 | (133,363) | (8.2%) | 2,832,931 | |||||
| Work on non-current assets | 14,476 | 14,831 | 355 | 2.5% | 28,259 | |||||
| Employee expenses | (177,469) | (177,604) | (135) | (0.1%) | (338,397) | |||||
| Other fixed operating expenses | (228,103) | (233,974) | (5,871) | (2.6%) | (445,800) | |||||
| Gross Operating Income (EBITDA) | 1,229,103 | 1,090,089 | (139,014) | (11.3%) | 2,076,993 | |||||
| Depreciation and amortization | (220,996) | (235,748) | (14,752) | (6.7%) | (449,181) | |||||
| Impairment losses (Reversals) | (18,924) | (17,989) | 935 | 4.9% | (34,275) | |||||
| Operating Income | 989,183 | 836,352 | (152,831) | (15.5%) | 1,593,537 | |||||
| Net Financial Income | (152,741) | (146,957) | 5,785 | 3.8% | (280,003) | |||||
| Financial income | 67,896 | 71,497 | 3,601 | 5.3% | 136,226 | |||||
| Financial expenses | (217,826) | (224,843) | (7,017) | (3.2%) | (428,402) | |||||
| Income (Loss) for indexed assets and liabilities | 21,346 | (7,664) | (29,009) | (135.9%) | (14,602) | |||||
| Foreign currency exchange differences, net | (24,157) | 14,053 | 38,210 | 158.2% | 26,775 | |||||
| Gains | 35,174 | 64,280 | 29,106 | 82.7% | 122,476 | |||||
| Losses | (59,332) | (50,228) | 9,104 | 15.3% | (95,701) | |||||
| Net Income From Related Comp. Cons. by the Prop. Eq. Method | 1,627 | 464 | (1,163) | (71.5%) | 883 | |||||
| Net Income From Other Investments | 1,799 | (283) | (2,082) | (115.7%) | (539) | |||||
| Net Income From Sales of Assets | 203 | 1,575 | 1,372 | 677.2% | 3,000 | |||||
| Net Income Before Taxes | 840,070 | 691,150 | (148,920) | (17.7%) | 1,316,878 | |||||
| Income Tax | (149,063) | (221,490) | (72,427) | (48.6%) | (422,014) | |||||
| NET INCOME ATTRIBUTABLE TO: | 691,007 | 469,661 | (221,347) | (32.0%) | 894,865 | |||||
| Shareholders of the Company | 360,906 | 198,173 | (162,733) | (45.1%) | 377,588 | |||||
| Minority Interest | 330,101 | 271,488 | (58,614) | (17.8%) | 517,277 | |||||
| Earning per share (Ch$ /share and US$ / ADR) | 11.1 | 6.1 | (5.0) | (45.1%) | 0.6 | |||||
OPERATINGINCOME
Operating Income for the first half of 2010 decreased by Ch$ 152,831 million, from Ch$ 989,183 million to Ch$ 836,352 million as of June 30th2010, representing a decrease of 15.5%; the above is mainly due to the decrease in results from our generation subsidiaries in Chile, Brazil and Colombia, partially offset by better results from our distribution subsidiaries in Brazil.
Pg. 14
Operating Revenues and costs, broken down by business line for the half ending on June 30th, 2009 and 2010 are:
Table 2 | ||||||||||||||||
| Generation and Transmission | Distribution | |||||||||||||||
| Operating Income by | ||||||||||||||||
| Businesses | Million Ch$ | Chg% | Th. US$ | Million Ch$ | Chg% | Th. US$ | ||||||||||
| 1H09 | 1H10 | 1H10 | 1H09 | 1H10 | 1H10 | |||||||||||
| Operating Revenues | 1,400,992 | 1,296,886 | (7.4%) | 2,471,012 | 2,080,025 | 2,106,375 | 1.3% | 4,013,367 | ||||||||
| Operating Costs | (779,116) | (841,116) | 8.0% | (1,602,615) | (1,713,768) | (1,721,309) | 0.4% | (3,279,684) | ||||||||
| Operating Income | 621,876 | 455,769 | (26.7%) | 868,397 | 366,257 | 385,066 | 5.1% | 733,683 | ||||||||
| Eliminations and Others | Consolidated | |||||||||||||||
| Operating Income by | ||||||||||||||||
| Businesses | Million Ch$ | Chg% | Th. US$ | Million Ch$ | Chg% | Th. US$ | ||||||||||
| 1H09 | 1H10 | 1H10 | 1H09 | 1H10 | 1H10 | |||||||||||
| Operating Revenues | (206,689) | (274,807) | 33.0% | (523,601) | 3,274,328 | 3,128,454 | (4.5%) | 5,960,777 | ||||||||
| Operating Costs | 207,739 | 270,323 | 30.1% | 515,058 | (2,285,145) | (2,292,103) | 0.3% | (4,367,241) | ||||||||
| Operating Income | 1,050 | (4,484) | (527.1%) | (8,543) | 989,183 | 836,352 | (15.5%) | 1,593,537 | ||||||||
Generation and Transmission Businessesreached an Operating Income of Ch$ 455,769 million, representing a Ch$ 166,107 million drop from the same period last year or the equivalent to a 26.7% decrease. Physical sales decreased 7.7% amounting to 30,810 GWh for the first half 2010 (33,367 GWh as of the first half 2009).
Operating income for Generation and Transmission business line, detailed by country in the following table:
| Table 3 | ||||||||||||||||||||||||
| Chile | Argentina | Brazil | ||||||||||||||||||||||
| Generation & Transmission | Million Ch$ | Chg% | Th. US$ | Million Ch$ | Chg% | Th. US$ | Million Ch$ | Chg% | Th. US$ | |||||||||||||||
| 1H09 | 1H10 | 1H10 | 1H09 | 1H10 | 1H10 | 1H09 | 1H10 | 1H10 | ||||||||||||||||
| Operating Revenues | 739,334 | 620,971 | (16.0%) | 1,183,162 | 164,351 | 172,075 | 4.7% | 327,861 | 153,537 | 130,492 | (15.0%) | 248,632 | ||||||||||||
| % of consolidated | 53% | 48% | 48% | 12% | 13% | 13% | 11% | 10% | 10% | |||||||||||||||
| Operating Costs | (397,197) | (400,781) | 0.9% | (763,626) | (138,363) | (146,322) | 5.8% | (278,794) | (76,594) | (76,214) | (0.5%) | (145,213) | ||||||||||||
| % of consolidated | 51% | 48% | 48% | 18% | 17% | 17% | 10% | 9% | 9% | |||||||||||||||
| Operating Income | 342,138 | 220,190 | (35.6%) | 419,537 | 25,988 | 25,753 | (0.9%) | 49,068 | 76,943 | 54,278 | (29.5%) | 103,419 | ||||||||||||
| Peru | Colombia | Consolidated | ||||||||||||||||||||||
| Generation & Transmission | Million Ch$ | Chg% | Th. US$ | Million Ch$ | Chg% | Th. US$ | Million Ch$ | Chg% | Th. US$ | |||||||||||||||
| 1H09 | 1H10 | 1H10 | 1H09 | 1H10 | 1H10 | 1H09 | 1H10 | 1H10 | ||||||||||||||||
| Operating Revenues | 109,726 | 109,444 | (0.3%) | 208,528 | 234,471 | 264,343 | 12.7% | 503,664 | 1,400,992 | 1,296,886 | (7.4%) | 2,471,012 | ||||||||||||
| % of consolidated | 8% | 8% | 8% | 17% | 20% | 20% | 100% | |||||||||||||||||
| Operating Costs | (61,697) | (70,770) | 14.7% | (134,841) | (105,693) | (147,468) | 39.5% | (280,977) | (779,116) | (841,116) | 8.0% | (1,602,615) | ||||||||||||
| % of consolidated | 8% | 8% | 8% | 14% | 18% | 18% | ||||||||||||||||||
| Operating Income | 48,029 | 38,674 | (19.5%) | 73,687 | 128,778 | 116,875 | (9.2%) | 222,687 | 621,876 | 455,769 | (26.7%) | 868,397 | ||||||||||||
Distribution businessincreased its operating income by Ch$18,809 million, equivalent to 5.1% and totaling Ch$385,066 million.
Physical sales amounted to 32,996 GWh, representing an increase of 1,772 GWh, equivalent to 5.7% variation. Our customers increased by 391 thousand, amounting 13,108 thousand customer base.
Operating income for Distribution line of business, detailed by country, as follows:
| Table 4 | ||||||||||||||||||||||||
| Chile | Argentina | Brazil | ||||||||||||||||||||||
| Distribution | Million Ch$ | Chg% | Th. US$ | Million Ch$ | Chg% | Th. US$ | Million Ch$ | Chg% | Th. US$ | |||||||||||||||
| 1H09 | 1H10 | 1H10 | 1H09 | 1H10 | 1H10 | 1H09 | 1H10 | 1H10 | ||||||||||||||||
| Operating Revenues | 579,183 | 441,023 | (23.9%) | 840,301 | 184,211 | 151,683 | (17.7%) | 289,007 | 807,596 | 971,900 | 20.3% | 1,851,803 | ||||||||||||
| % of consolidated | 28% | 21% | 21% | 9% | 7% | 7% | 39% | 46% | 46% | |||||||||||||||
| Operating Costs | (508,718) | (393,565) | (22.6%) | (749,876) | (159,538) | (140,179) | (12.1%) | (267,090) | (667,581) | (773,805) | 15.9% | (1,474,363) | ||||||||||||
| % of consolidated | 30% | 23% | 23% | 9% | 8% | 8% | 39% | 45% | 45% | |||||||||||||||
| Operating Income | 70,465 | 47,458 | (32.7%) | 90,424 | 24,673 | 11,503 | (53.4%) | 21,918 | 140,015 | 198,096 | 41.5% | 377,440 | ||||||||||||
| Peru | Colombia | Consolidated | ||||||||||||||||||||||
| Distribution | Million Ch$ | Chg% | Th. US$ | Million Ch$ | Chg% | Th. US$ | Million Ch$ | Chg% | Th. US$ | |||||||||||||||
| 1H09 | 1H10 | 1H10 | 1H09 | 1H10 | 1H10 | 1H09 | 1H10 | 1H10 | ||||||||||||||||
| Operating Revenues | 154,197 | 154,874 | 0.4% | 295,088 | 354,839 | 386,896 | 9.0% | 737,168 | 2,080,025 | 2,106,375 | 1.3% | 4,013,367 | ||||||||||||
| % of consolidated | 7% | 7% | 7% | 17% | 18% | 18% | ||||||||||||||||||
| Operating Costs | (121,522) | (121,804) | 0.2% | (232,078) | (256,409) | (291,956) | 13.9% | (556,277) | (1,713,768) | (1,721,309) | 0.4% | (3,279,684) | ||||||||||||
| % of consolidated | 7% | 7% | 7% | 15% | 17% | 17% | ||||||||||||||||||
| Operating Income | 32,674 | 33,070 | 1.2% | 63,009 | 98,430 | 94,939 | (3.5%) | 180,892 | 366,257 | 385,066 | 5.1% | 733,683 | ||||||||||||
Pg. 15
NETFINANCIALINCOME
The company’s net financial income for the first half of 2010 was negative Ch$ 146,957 million, representing a 3.8% improvement over the same period last year. This variation is mainly explained by the positive change in Foreign currency exchange differences which improved in Ch$ 38,210 million mainly due to depreciation of the Chilean peso and Argentinean peso relative to the American dollar.
The above mentioned positive effects were partially offset with higher financial costs of Ch$ 29,009 million due to the change on the Inflation Index Unit – UF (Unidades de Fomento) over Chile’s UF denominated debt. During the present period, the UF increased 1.2% compared to a decrease of 2.4% experienced during equal period last year.
TAXES
Income Tax increased Ch$ 72,427 million in first half 2010. The latter is mostly explained by increases in: Enersis Ch$ 44,975 million, Endesa Chile Ch$ 36,751 million, Chilectra Ch$ 12,365 million mainly by effects of dollar exchange over income tax partially offset by lower income taxes in Gas Atacama Ch$ 15,570 million, Edesur Ch$ 4,737 million and Emgesa Ch$ 2,491 million.
Pg. 16
CONSOLIDATEDBALANCESHEETANALYSIS
ASSETSUNDERIFRS
| Table 5 | ||||||||||
| ASSETS | (Million Ch$) | (Thousand US$) | ||||||||
| FY2009 | 1H10 | Var FY2009-1H10 | Chg % | 1H10 | ||||||
| CURRENT ASSETS | ||||||||||
| Cash and cash equivalents | 1,134,901 | 676,755 | (458,146) | (40.4%) | 1,236,783 | |||||
| Other current financial assets | 1,536 | 1,395 | (141) | (9.2%) | 2,550 | |||||
| Other current non-financial assets | 38,502 | 31,083 | (7,418) | (19.3%) | 56,806 | |||||
| Trade accounts receivable and other receivables | 1,138,647 | 1,259,530 | 120,883 | 10.6% | 2,301,815 | |||||
| Accounts receivable from related companies | 19,014 | 29,096 | 10,082 | 53.0% | 53,174 | |||||
| Inventories | 56,319 | 64,335 | 8,016 | 14.2% | 117,574 | |||||
| Current tax receivable | 112,176 | 132,916 | 20,741 | 18.5% | 242,907 | |||||
| Non-current assets (or disposal groups) classified as held for sale | 70,361 | 63,708 | (6,653) | (9.5%) | 116,428 | |||||
| Total Current Assets | 2,571,456 | 2,258,821 | (312,635) | (12.2%) | 4,128,037 | |||||
| Other non-current financial assets | 30,497 | 24,950 | (5,546) | (18.2%) | 45,597 | |||||
| Other non-current non-financial assets | 94,255 | 98,766 | 4,511 | 4.8% | 180,497 | |||||
| Trade accounts receivables and other receivables, net | 194,977 | 218,646 | 23,669 | 12.1% | 399,580 | |||||
| Investments in associates accounted for using the equity method | 21,281 | 12,344 | (8,937) | (42.0%) | 22,559 | |||||
| Intangibles assets apart from increased value | 1,446,122 | 1,511,177 | 65,054 | 4.5% | 2,761,704 | |||||
| Increased value | 1,501,352 | 1,532,956 | 31,604 | 2.1% | 2,801,506 | |||||
| Property, plant and equipment, net | 6,864,071 | 7,209,136 | 345,065 | 5.0% | 13,174,832 | |||||
| Investment properties | 31,232 | 31,079 | (153) | (0.5%) | 56,798 | |||||
| Deferred tax assets | 454,897 | 467,506 | 12,609 | 2.8% | 854,375 | |||||
| Total Non-Current Assets | 10,638,685 | 11,106,560 | 467,876 | 4.4% | 20,297,447 | |||||
| TOTAL ASSETS | 13,210,140 | 13,365,381 | 155,240 | 1.2% | 24,425,484 | |||||
Total Assetsincreased Ch$155,240 million, mainly due to:
Increase in Non-Current Assets in Ch$ 467,876 million equal to 4.4%, mainly due to:
Increase in Property, plant and equipment, net by Ch$ 345,065 million due to conversion effect to Chilean pesos from subsidiaries statements, in approximately Ch$ 320,000 million, additions for the period in approximately Ch$ 209,165 million, partially compensated by depreciation during the period for Ch$ 185,453 million.
Increase in Intangible Assets, different of those originated in Increased value, by Ch$ 65,064 million, mainly due to increases in intangible assets in Ampla and Coelce concessions for Ch$ 87,915 million, partially compensated by the Ch$ 45,819 million in amortizations for the period.
Increase in Increased value (commercial funds) by Ch$ 31,604 million as a result of the conversion effect coming from those subsidiaries whose functional currency is different from the Chilean peso.
Increase in Non-current receivables by Ch$ 23,669 million mainly due to increases at Ampla, for Ch$ 15,301 million, and also due to the dollarization of the FONINVEMEM by Ch$ 13,770 million, partially offset by decreases in CGTF, by Ch$ 2,308 million, and Chilectra, by Ch$ 2,094 million.
The above is partially offset by:
Ch$ 312,635 million decrease in Current Assets, equal to 12.2%, as a result of:
Ch$ 458,146 million decrease in cash and cash equivalent, primarily explained by decreases in term deposits at Endesa Chile for Ch$ 208,458 million used to pay debt and dividends, Codensa for Ch$ 130,675 million used to pay dividends, Emgesa Ch$ 146,866 million due to acapital reduction, for Cien Ch$ 85,758 million used to pay debt and Ampla for Ch$ 54,299 million used to pay debt. This decrease in cash and cash equivalent was partially offset by increases term deposits in Chilectra for Ch$ 76,254 million, Coelce for Ch$ 24,617 million, Edesur for Ch$ 16,269 million, Cachoeira Dourada for Ch$ 9,564 million and Edelnor for Ch$ 3,690 million.
Pg. 17
Increase in Trade accounts receivable and other receivables for Ch$ 120,883 million, primarily due to an increase in trade account receivable in Cien for Ch$ 40,788 million, Codensa in Ch$ 31,398 million, Coelce in Ch$ 27,605 million, Chocón in Ch$ 22,154 million, Emgesa in Ch$ 17,158 million, Cachoeira Dourada in Ch$6,367 million, Edesur in Ch$ 5,261 million, Edelnor in Ch$ 5,436 million and San Isidro in Ch$ 2,260 million. This effect is partially compensated by decreases in Chilectra Ch$ 31,659 million and in Endesa Chile in Ch$ 13,354 million.
Increase in Current tax receivable by Ch$ 20,741 million, which mainly corresponds to a higher Value Added Tax (“IVA”) receivable and increases in payments with charge to income taxes at Ampla for Ch$ 13,530 million, at Endesa Chile for Ch$ 2,975 million and at Edesur for Ch$ 2,340 million.
Pg. 18
BOOKVALUE ANDECONOMICVALUE OFASSETS
Regarding the more important assets, the following should be mentioned:
Properties, Plants and Equipment are valued at their purchase cost, net of the corresponding accumulated depreciation and impairment loss they have been subject to. Properties, Plants and Equipment, net of their residual value, if applicable, are linearly by distributing the cost of their different elements along the estimated years of useful life, which is the period that the companies expect to use them. The useful life is reviewed regularly.
The capital gain (lower investments or goodwill value) generated by consolidation represents the acquisition cost surplus on the Group’s share in terms of the reasonable value of assets and liabilities, including the identifiable contingent liabilities of a Subsidiary at the time of acquisition.
Capital gain is not amortized. Instead, at the closing of each accounting period an assessment is made of whether any impairment has occurred during the period that could reduce its recoverable value to an amount below the registered net cost, proceeding in this event to make a timely impairment adjustment (See Note 3.e to the Consolidated Financial Statements).
Throughout the fiscal year and in particular at the date of closing, an assessment is made as to any indication of possible loss due to the impairment of any asset. In the event of any such indication, an estimate of the recoverable sum of said asset is made to determine, if applicable, the depreciated amount. If this involves identifiable assets that do not originate independent cash flows, the recoverability of the Cash Generating Unit that the asset belongs to is estimated, understanding as such the smaller Group of identifiable assets that generate independent cash incomes.
Assets expressed in foreign currency are submitted at the prevalent exchange rate at the closing of the period.
Notes and accounts receivable from related companies are classified according to their short and long term maturities. These operations are adjusted according to prevalent market equity conditions.
In summary, assets are valued according to the International Financial Reporting Standards, whose criteria are expressed in Note 3 of the Consolidated Financial Statements.
Pg. 19
LIABILITIES ANDSHAREHOLDERS’ EQUITYUNDERIFRS
| Table 6 | ||||||
| LIABILITIES AND SHAREHOLDERS' EQUITY | (Million Ch$) | (Thousand US$) | ||||
| FY2009 | 1H10 | Var FY2009-1H10 | Chg % | 1H10 | ||
| CURRENT LIABILITIES | ||||||
| Other current financial liabilities | 732.428 | 635.078 | (97.350) | (13,3%) | 1.160.617 | |
| Trade accounts payable and other payables | 976.506 | 970.245 | (6.262) | (0,6%) | 1.773.140 | |
| Accounts payable to related companies | 111.956 | 78.716 | (33.240) | (29,7%) | 143.854 | |
| Provisions | 100.024 | 100.007 | (18) | (0,0%) | 182.764 | |
| Current tax payable | 185.286 | 137.395 | (47.891) | (25,8%) | 251.092 | |
| Current post-employment benefit obligations | 4.915 | 6.498 | 1.583 | 32,2% | 11.876 | |
| Other current non-financial liabilities | 33.622 | 45.478 | 11.856 | 35,3% | 83.111 | |
| Liabilities (or disposal groups) classified as held for sale | 50.650 | 41.608 | (9.042) | (17,9%) | 76.039 | |
| Total Current Liabilities | 2.195.388 | 2.015.024 | (180.364) | (8,2%) | 3.682.493 | |
| NON-CURRENT LIABILITIES | ||||||
| Other non-current financial liabilities | 3.543.626 | 3.597.854 | 54.228 | 1,5% | 6.575.146 | |
| Non-current liabilities | 58.728 | 45.116 | (13.612) | (23,2%) | 82.450 | |
| Accounts payable to related companies | 3.557 | 2.610 | (947) | (26,6%) | 4.770 | |
| Provisions | 250.287 | 255.230 | 4.943 | 2,0% | 466.437 | |
| Deferred tax liabilities | 573.049 | 606.897 | 33.848 | 5,9% | 1.109.115 | |
| Non-current post-employment benefit obligations | 182.689 | 190.826 | 8.137 | 4,5% | 348.738 | |
| Other non-current non-financial liabilities | 25.814 | 28.312 | 2.498 | 9,7% | 51.740 | |
| Total Non-Current Liabilities | 4.637.749 | 4.726.844 | 89.095 | 1,9% | 8.638.396 | |
| SHAREHOLDERS' EQUITY | ||||||
| Issued share capital | 2.824.883 | 2.824.883 | - | 0,0% | 5.162.526 | |
| Retained earnings (losses) | 1.817.613 | 1.923.909 | 106.296 | 5,8% | 3.515.979 | |
| Additional paid-in capital | 158.760 | 158.760 | - | 0,0% | 290.136 | |
| Other Reserves | (1.282.776) | (1.201.243) | 81.533 | 6,4% | (2.195.294) | |
| - | ||||||
| Equity Attributable to Shareholders of the Company | 3.518.480 | 3.706.309 | 187.829 | 5,3% | 6.773.348 | |
| Equity Attributable to Minority Interest | 2.858.524 | 2.917.204 | 58.680 | 2,1% | 5.331.246 | |
| Total Shareholders' Equity | 6.377.004 | 6.623.513 | 246.509 | 3,9% | 12.104.594 | |
| TOTAL LIABILITIES AND SHAREHOLDERS' EQUITY | 13.210.140 | 13.365.381 | 155.240 | 1,2% | 24.425.484 | |
The company’sTotal Liabilities and Shareholder´s Equityincreased by Ch$ 155,240 million from the period ended on December 31st, 2009, largely due to the increase in non-current liabilities in Ch$ 89,095 million plus the Ch$ 246,509 million increase in Shareholders’ Equity. The detail is explained as follows:
Non Current Liabilitiesincreased by Ch$ 89,095 million, equal to 1.9%, mainly due to:
Other non financial liabilities (financial debt and derivatives) increased in Ch$ 54,228 million, mainly due to Emgesa for Ch$ 56,471 million because of the conversion effect, Codensa Ch$ 45,739 million, as a result of bonds issuance and conversion effect, Enersis Ch$ 7,384 million due to conversion effect and variation of UF net of derivatives, Edelnor by Ch$ 13,742 million due to conversion effect and more debt and Edegel by Ch$ 7,022, partially compensated by lower dollar denominated debt in Cien and rate exchange effect for Ch$ 25,957 million, for transfer debt from the long term to the short in Ampla by Ch$ 21,942 million and Costanera by Ch$ 17,742 million.
Increase in deferred tax liabilities in Ch$ 33,848 million, mainly due to conversion effect of foreign subsidiaries by Ch$ 27,800 million and recognition of new deferred tax of Ch$ 5,921 million.
Decrease inCurrent Liabilitiesof Ch$ 180,364 million, a 8,2% drop, due to:
Decrease in Other current liabilities (financial debt and derivatives) for Ch$ 97,350 million, mainly in Endesa Chile for Ch$ 126,705 million, due to bank loans payments and Ampla for Ch$ 40,791 million due to bond payments, partially compensated by increases in Costanera by Ch$ 17,442 million for transfer from the long term to the short, in Chocón for Ch$ 6,477 million due to loans, in Coelce for Ch$ 9,186 million and Codensa Ch$ 4,993 million for convertion effect.
Pg. 20
Decrease in Current tax payable for Ch$ 47,891 million which mainly corresponds to Endesa Chile by Ch$ 34,801 million, Emgesa by Ch$ 21,274 million, Pangue by Ch$ 8,569 million, Pehuenche by Ch$ 4,558 million and Codensa by Ch$ 4,035 million due to payments taxes. Partially compensated for increases in Coelce of Ch$ 10,002 million, CGTF by Ch$ 9,527 million, Enersis by Ch$ 5,886 million and Ampla in Ch$ 4,354 million, all due to payable taxes.
Decrease in accounts payable to related companies by Ch$ 33,240 million which mainly corresponds to dividend payments to Endesa Latinoamerica and lower payable accounts to Cemsa in Ch$ 8,984 million. Partially offset by higher in other current non-financial liabilities by Ch$ 11,856 million, mainly due to an increase in deferred income at San Isidro.
Total Shareholders’ equityincreased by Ch$ 246,509 million with compared to December of 2009. The Total shareholders' equity attributable to the Owners of the Company increased in Ch$ 187,829 million which is explained mainly by the effect of the net income for the period.
The minorities participation increased in Ch$ 58,680 million, as a consequence of the net effects in the results, the conversion net effects, minimum dividends, reserves and derivatives hedge.
DEBTMATURITY WITHTHIRDPARTIES, MILLIONCH$
| Table 7 | ||||||||
| (Million Ch$) | 2010 | 2011 | 2012 | 2013 | 2014 | 2015 | Balance | TOTAL |
| Chile | 19,147 | 100,274 | 24,488 | 231,886 | 398,043 | 122,813 | 804,936 | 1,701,588 |
| Enersis | 1,024 | 2,137 | 2,260 | 2,389 | 277,174 | 2,672 | 226,397 | 514,052 |
| Chilectra | 294 | - | - | - | - | - | - | 294 |
| Other | 29 | 1,454 | - | - | - | 2,694 | (2,694) | 1,483 |
| Endesa Chile (*) | 17,799 | 96,684 | 22,229 | 229,497 | 120,869 | 117,447 | 581,234 | 1,185,758 |
| Argentina | 53,594 | 77,695 | 36,793 | 13,932 | 15,631 | - | - | 197,644 |
| Edesur | 6,193 | 17,980 | 15,547 | 396 | 289 | - | - | 40,404 |
| Costanera | 35,508 | 27,715 | 14,564 | 13,537 | 15,342 | - | - | 106,665 |
| Chocón | 11,742 | 32,000 | 6,682 | - | - | - | - | 50,424 |
| Hidroinvest | 150 | - | - | - | - | - | - | 150 |
| CTM | - | - | - | - | - | - | - | - |
| TESA | - | - | - | - | - | - | - | - |
| Peru | 27,605 | 52,567 | 104,593 | 77,734 | 53,599 | 26,118 | 88,754 | 430,970 |
| Edelnor | 4,238 | 20,432 | 33,216 | 50,915 | 28,637 | - | 48,419 | 185,857 |
| Edegel | 23,368 | 32,135 | 71,376 | 26,819 | 24,962 | 26,118 | 40,335 | 245,112 |
| Brazil | 135,080 | 279,285 | 295,693 | 110,896 | 66,950 | 25,397 | 21,239 | 934,539 |
| Endesa Brasil | 56,967 | - | - | - | - | - | - | 56,967 |
| Coelce | 20,733 | 80,719 | 67,154 | 50,864 | 42,765 | 1,916 | 8,651 | 272,803 |
| Ampla | 22,169 | 128,894 | 159,258 | 52,541 | 15,555 | 15,017 | 1,929 | 395,362 |
| Cachoeira | - | - | - | - | - | - | - | - |
| Cien | 32,122 | 64,148 | 62,799 | - | - | - | - | 159,069 |
| Fortaleza | 3,089 | 5,524 | 6,483 | 7,490 | 8,630 | 8,464 | 10,659 | 50,339 |
| Colombia | 77,487 | 126,744 | 97,573 | 69,421 | 112,820 | - | 449,320 | 933,365 |
| Codensa | 31,398 | 57,611 | 9,713 | 69,421 | 72,014 | - | 177,586 | 417,744 |
| Emgesa | 46,089 | 69,133 | 87,859 | - | 40,806 | - | 271,734 | 515,622 |
| TOTAL | 312,913 | 636,564 | 559,139 | 503,869 | 647,043 | 174,328 | 1,364,250 | 4,198,106 |
| (*) Includes: Endesa Chile, Pangue, Pehuenche, San Isidro, Celta and Túnel el melón | ||||||||
Pg. 21
DEBT MATURITY WITH THIRD PARTIES, THOUSAND US$
| Table 7.1 | ||||||||
| (Thousand US$) | 2010 | 2011 | 2012 | 2013 | 2014 | 2015 | Balance | TOTAL |
| Chile | 34,992 | 183,252 | 44,753 | 423,777 | 727,431 | 224,443 | 1,471,036 | 3,109,684 |
| Enersis | 1,872 | 3,905 | 4,129 | 4,367 | 506,540 | 4,883 | 413,744 | 939,440 |
| Chilectra | 538 | - | - | - | - | - | - | 538 |
| Other | 54 | 2,656 | - | - | - | 4,923 | (4,923) | 2,710 |
| Endesa Chile (*) | 32,529 | 176,691 | 40,624 | 419,410 | 220,891 | 214,636 | 1,062,215 | 2,166,996 |
| Argentina | 97,943 | 141,989 | 67,239 | 25,461 | 28,566 | - | - | 361,199 |
| Edesur | 11,318 | 32,858 | 28,412 | 723 | 528 | - | - | 73,840 |
| Costanera | 64,891 | 50,649 | 26,616 | 24,738 | 28,038 | - | - | 194,933 |
| Chocón | 21,459 | 58,481 | 12,211 | - | - | - | - | 92,151 |
| Hidroinvest | 275 | - | - | - | - | - | - | 275 |
| CTM | - | - | - | - | - | - | - | - |
| TESA | - | - | - | - | - | - | - | - |
| Peru | 50,449 | 96,066 | 191,145 | 142,060 | 97,954 | 47,730 | 162,200 | 787,605 |
| Edelnor | 7,744 | 37,339 | 60,703 | 93,048 | 52,335 | - | 88,488 | 339,658 |
| Edegel | 42,705 | 58,727 | 130,442 | 49,012 | 45,619 | 47,730 | 73,713 | 447,947 |
| Brazil | 246,861 | 510,398 | 540,384 | 202,664 | 122,352 | 46,414 | 38,815 | 1,707,888 |
| Endesa Brasil | 104,108 | - | - | - | - | - | - | 104,108 |
| Coelce | 37,890 | 147,516 | 122,724 | 92,955 | 78,154 | 3,502 | 15,811 | 498,552 |
| Ampla | 40,514 | 235,555 | 291,047 | 96,020 | 28,426 | 27,444 | 3,525 | 722,532 |
| Cachoeira | - | - | - | - | - | - | - | - |
| Cien | 58,704 | 117,231 | 114,765 | - | - | - | - | 290,701 |
| Fortaleza | 5,645 | 10,095 | 11,847 | 13,689 | 15,772 | 15,469 | 19,479 | 91,995 |
| Colombia | 141,609 | 231,628 | 178,316 | 126,869 | 206,180 | - | 821,141 | 1,705,743 |
| Codensa | 57,381 | 105,285 | 17,751 | 126,869 | 131,607 | - | 324,542 | 763,434 |
| Emgesa | 84,228 | 126,342 | 160,565 | - | 74,574 | - | 496,599 | 942,308 |
| TOTAL | 571,854 | 1,163,333 | 1,021,838 | 920,831 | 1,182,482 | 318,588 | 2,493,192 | 7,672,118 |
| (*) Includes: Endesa Chile, Pangue, Pehuenche, San Isidro, Celta and Túnel el melón | ||||||||
EVOLUTIONOFKEYFINANCIALRATIOS
| Table 8 | |||||
| Indicator | Unit | FY2009 | 1H10 | Var FY2009-1H10 | Chg % |
| Liquidity | Times | 1.17 | 1.12 | (0.05) | (4.3%) |
| Acid ratio test * | Times | 1.14 | 1.09 | (0.05) | (4.8%) |
| Working capital | Million Ch$ | 376,068 | 243,797 | (132,271) | (35.2%) |
| Working capital | Thousand US$ | 687,272 | 445,544 | (241,728) | (35.2%) |
| Leverage ** | Times | 1.07 | 1.02 | (0.05) | (5.0%) |
| Short-term debt | % | 32.1 | 29.9 | (2.24) | (7.0%) |
| Long-term debt | % | 67.9 | 70.1 | 2.24 | 3.3% |
| * (Current assets net of inventories and prepaid expenses) / Current liabilities | |||||
| ** Total debt / (equity + minority interest) | |||||
| Indicator | Unit | 1H09 | 1H10 | Var 1H09/1H10 | Chg % |
| Financial expenses coverage * | Times | 5.57 | 4.99 | (0.58) | (10.4%) |
| Op. income / Op. rev. | % | 30.21 | 26.73 | (3.48) | (11.5%) |
| ROE ** | % | 19.30% | 14.33% | (0.05) | (25.7%) |
| ROA ** | % | 9.12% | 8.26% | (0.01) | (9.4%) |
| * EBITDA / Financial costs | |||||
| ** Annualized figures |
Liquidity indexas of June, 2010 was 1.12, showing a decrease of 0.05 times, equivalent to 4.3% with respect to December 2009. Despite the decrease, the ratio still reflects the persistent strong liquidity position, maintaining its bank borrowings and financing its investments with its cash surpluses and having a satisfactory debt maturity pattern.
Leverage ratiowas 1.02, showing a decrease of 0.05 times, equivalent to 5% as of December 31st, 2009.
Pg. 22
Financial Expenses Coveragereached 4.99 times, a decrease of 0.58 times or 10.4% drop from the ratio registered on equal period the precedent year. This is mainly the result of the EBITDA decrease within the first half of the year, partly offset by the improving financial income resulting from the decrease in average cost of debt.
Operating Income over Operating Revenuesprofitability decreased 11.5%, reaching a 26.73% as of June, 2010.
The annualROEof the Parent Company reached 14.33 %, a decrease of 5 pp. from the registered as of December 2009. This decrease is derived from the lower results for the period.
AnnualROAreached 8.26% in June 2010, a decrease of 1 pp. from the registered as of December 2009, reflecting the decrease in the present half’s results plus the increase in Total Assets.
Pg. 23
CONSOLIDATEDSTATEMENTS OFCASHFLOWSANALYSIS
UNDERIFRS
| Table 9 | ||||||
| CASH FLOW | (Million Ch$) | (Thousand US$) | ||||
| 1H09 | 1H10 | Var 1H09-1H10 | Chg % | 1H10 | ||
| Net Income | 691,007 | 469,661 | (221,347) | (32.0%) | 894,865 | |
| Adjustments to Reconcile to Operating Income | ||||||
| Taxes Payable | 149,063 | 221,490 | 72,427 | 48.6% | 422,014 | |
| Decrease (increse) in inventories | 91 | 16,365 | 16,274 | 17886.9% | 31,181 | |
| Decrease (increase) in trade accounts receivable | (12,240) | (71,545) | (59,305) | (484.5%) | (136,319) | |
| Decrease (increase) in other operating accounts receivable | (67,896) | (71,497) | (3,601) | (5.3%) | (136,226) | |
| Decrease (increase) in trade accounts payable | (205,962) | 25,700 | 231,662 | 112.5% | 48,967 | |
| Decrease (increase) in other operating accounts payable | 196,480 | 232,506 | 36,026 | 18.3% | 443,004 | |
| Depreciation and amortization | 220,996 | 235,748 | 14,752 | 6.7% | 449,181 | |
| (Reversal of) Impairment losses | 18,924 | 17,989 | (935) | (4.9%) | 34,275 | |
| Provisions | 20,732 | (1,470) | (22,202) | (107.1%) | (2,801) | |
| Unrealized foreign currency exchange differences | 24,157 | (14,053) | (38,210) | (158.2%) | (26,775) | |
| Non-distributed gains from associates | (1,627) | (464) | 1,163 | 71.5% | (883) | |
| Minority interest | - | - | - | - | ||
| Other non-cash | 2,001 | (103,137) | (105,138) | (5255.5%) | (196,512) | |
| Total adjustments to Reconcile to Operating Income | 344,718 | 487,632 | 142,914 | 41.5% | 929,106 | |
| Income tax proceeds (payments) | (222,845) | (203,073) | 19,772 | 8.9% | (386,923) | |
| Other operating proceeds (disbursements) | (225) | (512) | (287) | (127.8%) | (976) | |
| NET CASH FLOWS PROVIDED BY OPERATING ACTIVITIES | 812,656 | 753,707 | (58,948) | (7.3%) | 1,436,071 | |
| Net Cash Flows provided by (used in) Investing Activities | ||||||
| Acquisitions of associates | (19,912) | - | 19,912 | (100.0%) | - | |
| Loans to related companies | (7,299) | - | 7,299 | (100.0%) | - | |
| Proceeds from sales of property, plant and equipment | 1,973 | 2,745 | 772 | 39.1% | 5,231 | |
| Purchase of property, plant and equipment | (257,817) | (209,165) | 48,653 | 18.9% | (398,530) | |
| Proceeds from sales of intangible assets | 3,922 | 1,114 | (2,807) | (71.6%) | 2,123 | |
| Acquisitions of intangible assets | (83,643) | (89,292) | (5,649) | (6.8%) | (170,132) | |
| Prepayments and third party loans | - | (2,996) | (2,996) | (5,708) | ||
| Proceeds from dividends | 5,146 | 5,171 | 26 | 0.5% | 9,853 | |
| Proceeds from interest received | 1,878 | 1,569 | (310) | (16.5%) | 2,989 | |
| Other investment proceeds (disbursements) | (24,313) | 10,966 | 35,278 | 145.1% | 20,893 | |
| NET CASH FLOWS PROVIDED BY (USED IN) INVESTING ACTIVITIES | (380,065) | (279,887) | 100,178 | 26.4% | (533,281) | |
| Cash Flows provided by (used in) Financing Activities | ||||||
| Long-term loans obtained | 406,878 | 156,664 | (250,213) | (61.5%) | 298,500 | |
| Payments of loans | (373,659) | (442,225) | (68,566) | (18.3%) | (842,590) | |
| Repayments of liabilities for financial leases | (2,684) | (4,749) | (2,065) | (76.9%) | (9,048) | |
| Payments on loans from related companies | (1,428) | (4,574) | (3,147) | (220.4%) | (8,716) | |
| Dividends paid | (259,653) | (440,009) | (180,356) | (69.5%) | (838,368) | |
| Payments of interest | (143,436) | (111,443) | 31,993 | 22.3% | (212,338) | |
| Other financing proceeds (payments) | (340,310) | (90,637) | 249,673 | 73.4% | (172,694) | |
| NET CASH FLOWS PROVIDED BY (USED IN) FINANCING ACTIVITIES | (714,292) | (936,972) | (222,680) | (31.2%) | (1,785,253) | |
| NET INCREASE (DECREASE) IN CASH AND CASH EQUIVALENTS BEFORE EFFECTS OF FOREIGN EXCHANGE RATE VARIATIONS | (281,702) | (463,152) | (181,451) | (64.4%) | (882,463) | |
| Effects of foreign exchange rate variations on cash and cash equivalents | (89,278) | 5,006 | 94,285 | 105.6% | 9,539 | |
| Net Increase (Decrease) in Cash and Cash Equivalents | (370,980) | (458,146) | (87,166) | (23.5%) | (872,924) | |
| Beginning balance of cash and cash equivalents | 1,318,062 | 1,134,901 | (183,161) | (13.9%) | 2,162,375 | |
| Ending Balance of Cash and Cash Equivalents | 947,082 | 676,755 | (270,327) | (28.5%) | 1,289,450 | |
Pg. 24
The company generated a negative cash flow of Ch$ 463,152 million for the period, which can be broken down as follows:
Operating activitiesgenerated a positive net cash flow of Ch$ 753,707 million that represents a decrease of 7.3% regarding last year’s first half. This cash flow is composed primarily with net income of the period for Ch$ 469,661 million, which is adjusted to operating income in Ch$ 487,632 million. This adjustment includes fixed asset amortization, depreciation and impairments for Ch$ 235,737 million, interest for Ch$ 232,506, taxes for Ch$ 221,490 million, partially compensated by the tax payments of Ch$ 203,073 million.
Investment activitiesgenerated a net negative cash flow of Ch$ 279,887 million, which compared with the same period of the preceding year represents a 26.4% increase, or the equivalent to Ch$ 100,178 million. This flow corresponds primarily to the incorporation of fixed assets for Ch$ 209,165 million.
Financing activitiesoriginated a negative cash flow of Ch$ 936,972 million, due to payments of loans for Ch$ 442,225 million, dividends paid for Ch$ 440,009 million, interests paid for Ch$ 111,443 million and other financial payments for Ch$ 90,637 million. The aforementioned was partially compensated for loans obtained for Ch$ 156,664 million.
CASHFLOWRECEIVEDFROMFOREIGNSUBSIDIARIES BYENERSIS, CHILECTRA ANDENDESACHILE
| Table 10 | ||||||||||
| Cash Flow (Thousand US$) | Interest Received | Dividends Received | Capital Reductions | Others | Total Cash Received | |||||
| 1H09 | 1H10 | 1H09 | 1H10 | 1H09 | 1H10 | 1H09 | 1H10 | 1H09 | 1H10 | |
| Argentina | 152.9 | 207.3 | - | - | - | - | 712.5 | 495.6 | 865.4 | 702.9 |
| Peru | - | - | 13,533.1 | 31,869.2 | - | - | - | - | 13,533.1 | 31,869.2 |
| Brazil | 11,864.0 | - | 30,618.6 | 141,908.9 | - | - | - | - | 42,482.5 | 141,908.9 |
| Colombia | - | - | 23,941.5 | 123,964.2 | - | 59,462.9 | - | - | 23,941.5 | 183,427.1 |
| Total | 12,016.8 | 207.3 | 68,093.2 | 297,742.2 | - | 59,462.9 | 712.5 | 495.6 | 80,822.5 | 357,908.1 |
| Source: Internal Financial Report | ||||||||||
CAPEX ANDDEPRECIATION
| Table 11 | ||||||||||||
| Million Ch$ | Thousand US$ | Million Ch$ | Thousand US$ | |||||||||
| 1H09 | 1H10 | 1H10 | 1H09 | 1H10 | 1H10 | |||||||
| Endesa Chile | 169,230 | 143,752 | 273,897 | 96,976 | 98,930 | 188,496 | ||||||
| Cachoeira | - | - | - | 3,308 | 3,529 | 6,724 | ||||||
| Endesa Fortaleza | - | - | - | 3,655 | 3,982 | 7,587 | ||||||
| Cien | 379 | 1,884 | 3,590 | 9,441 | 16,965 | 32,324 | ||||||
| Chilectra S.A. | 15,602 | 13,852 | 26,393 | 9,815 | 10,524 | 20,052 | ||||||
| Edesur | 27,358 | 19,959 | 38,029 | 8,800 | 7,157 | 13,637 | ||||||
| Edelnor | 19,942 | 10,162 | 19,362 | 10,017 | 10,275 | 19,577 | ||||||
| Ampla (*) | 38,110 | 41,271 | 78,635 | 24,514 | 27,159 | 51,747 | ||||||
| Coelce (*) | 44,040 | 46,644 | 88,873 | 19,771 | 18,660 | 35,554 | ||||||
| Codensa | 22,460 | 16,659 | 31,741 | 26,873 | 29,042 | 55,335 | ||||||
| Cam Ltda. | 1,388 | 539 | 1,027 | 916 | 870 | 1,658 | ||||||
| Inmobiliaria Manso de Velasco Ltda. | 461 | 493 | 939 | 131 | 142 | 271 | ||||||
| Synapsis | 931 | 1,732 | 3,300 | 1,389 | 1,512 | 2,881 | ||||||
| Enersis holding and investment companies | 66 | 133 | 253 | 562 | 537 | 1,023 | ||||||
| Total | 339,967 | 297,080 | 566,039 | 216,168 | 229,284 | 436,865 | ||||||
| (*) Includes concessions intangible assets. | ||||||||||||
Pg. 25
THEPRINCIPALRISKS ASSOCIATED TO THE ACTIVITIES OF THEENERSISGROUP
Commercial and Regulatory Risk
The Group’s activities are subject to a broad range of governmental standards and environmental regulations. Any modification of such standards and issues may affect the Group’s activities, economic situation and operating results.
The Group’s distribution activity is subject to a wide range of rules regarding tariffs and other issues that govern their activities in each of the countries where it operates and which could modify distribution subsidiaries operating results.
The Group’s generation activity requires environmental impact studies, acquisition of licenses, permits and other mandatory approvals as well as to be in compliance with all the requirements provided for in such licenses, permits and standards.
The Group’s generation activity is subject to existing hydrological and weather conditions in the geographic zones in which the Group’s hydroelectric generating plants are located. Commercial policies have been planned in order to moderate the possible impact of changes in these variables.
Interest Rate Risk
Interest rate variations modify the reasonable value of those assets and liabilities that accrue a fixed interest rate, as well as the future flow of assets and liabilities pegged to a variable interest rate.
Consistent with our current interest rate hedging policy, the portion of fixed and/or hedged debt rate to the total gross debt was 45% as of June 30th, 2010 on a consolidated basis.
Depending on the Group’s forecasts and debt structure objectives, hedging transactions take place through contracted derivatives that mitigate these risks.
Exchange Rate Risk
The exchange rate risk is mainly related to the following transactions: Foreign currency debts contracted by Group’s subsidiaries, payments made on international markets for the acquisition of projects related materials, group companies’ incomes directly linked to the evolution of the dollar and incoming cash flows from our subsidiaries abroad are exposed to exchange rate fluctuations.
In order to mitigate exchange rate risks, Enersis’ exchange rate hedging policy is based on cash flows and it strives to maintain a balance between dollar indexed flows and the asset and liability levels in such currency. Currency swaps and exchange rate forwards are the instruments currently used in compliance with this policy. Likewise, the policy strives to refinance debts in each company’s functional currency.
Commodities Risk
Enersis is exposed to the price fluctuation risk on some commodities, basically fuel purchases for the electricity generation and also of energy transactions in the local markets.
With the objective of reducing risks in extreme drought situations, the company has designed a trading policy that defines sales commitment levels consistent with its generating plants’ firm energy capacity in a dry year and includes risk mitigation clauses in some contracts with unregulated clients.
Pg. 26
Liquidity Risk
In engaging committed long term borrowing facilities and short term financial investments the Group maintains a consistent liquidity policy, for the adequate amounts required to support projected needs for the period, contingent with the situation and the expectations of the debt and equity markets.
As of June 30th, 2010, the Enersis Group held liquidity in the amount of Ch$ 676,755,156 thousand in cash and cash equivalent and Ch$ 320,500,000 thousand in available credit lines. As of December 31st, 2009, the Enersis Group held liquidity in the amount of Ch$ 1,134,900,821 thousand in cash and cash equivalent and Ch$ 253,550,000 thousand in available credit lines.
Credit Risk
Credit risk in accounts receivable, originating from trading activities, is historically very limited given that the short term collection conditions with customers doesn’t allow them to individually accumulate significant amounts. Additionally, in the case of the so called “unregulated clients” of our electricity generation and distribution business, a formal procedure is applied to control the credit risk, using a systematic evaluation of our counterparties, index definition and credit risk factors by virtue of which the contracts are approved or additional guarantee requirements are defined.
Furthermore, in our electricity generating business line, in the event of non-payment, some countries allow power supply cut-offs, and in almost all contracts such lack of payment is established as cause for contract termination. To this end, credit risks are constantly monitored and the maximum amounts exposed to payment risks are measured, which, as has been said, are limited.
In turn, in our electricity distribution business line, the energy supply cut-off is, in all cases, a power held by our companies when faced with default by our customers, applied in accordance with the regulation in force in each country, enabling the credit risk evaluation and control process, which in fact is also limited.
Surplus cash flow investments are placed in prime national and foreign financial entities (with an investment grade equivalent risk rating) with established limits set for each entity (not more than 30% per entity).
In the selection of banks for investment, consideration is given to those that hold two investment grade classifications, considering the three main international risk agencies (Moody’s, S&P and Fitch Ratings).
Positions are backed up by treasury bonds from the country of operations and instruments issued by the most reputable banks, favoring, wherever possible, the first ones.
Derivatives are engaged through highly solvent entities such that about 90% of operations are carried out with entities that hold an A or higher rating.
Risk Measurement
The Enersis Group measures the Value at Risk of its debt and financial derivatives positions with a view to guaranteeing that the risk taken by the company remains consistent with the risk exposure defined by Management, thus restricting the volatility of its financial results. The positions portfolio used in the calculations of the current Value at Risk is comprised of debt and financial derivatives.
The calculated Value at Risk represents the possible value loss of the aforementioned positions portfolio over one day time horizon with 95% probability. To this end the volatility of the risk variables that affect the value of the positions portfolio has been studied, including: The U.S. dollar Libor interest rate, theusual banking local indexes for debts, and taking into account the different currencies our companies operate under and the exchange rates of the different currencies involved in the calculation.
Pg. 27
Other Risks
A portion of Enersis and Endesa Chile’s debt is subject to cross default provisions. If certain defaults in debt of certain specific subsidiaries are not remedied within specified grace periods, a cross default could affect Endesa Chile and Enersis, and under certain scenarios, debts at the holding company level could be accelerated.
Nonpayment – after any applicable grace period – of the debts of Enersis and Endesa Chile, or their so-called Relevant Subsidiaries, with an individual principal amount outstanding in excess of US$ 50 million dollars (or its equivalent in other currencies), and with a missed payment also in excess of US$ 50 million dollars, could give rise to a cross default of several bank revolving debt facilities at the Endesa Chile and Enersis levels. Furthermore, some of these debt facilities are also subject to cross acceleration provisions in the event of a default in other Relevant Subsidiary debt, for reasons other than payment default, for events such as bankruptcy, insolvency proceedings, and materially adverse governmental or legal actions, in all cases for amounts in excess of US$ 50 million dollars.
Similarly, nonpayment – after any given applicable grace period - of the debts of these companies or any of their Chilean subsidiaries, in single indebtedness in default with a principal in excess of US$ 30 million dollars, could potentially give rise to a cross default of Enersis and Endesa Chile Yankee bonds.
There are no clauses in the credit agreements by which changes in the corporate or debt classification of these companies from risk classification agencies could trigger prepayments. Nevertheless, a modification in the Standard & Poor’s (S&P) debt risk classification in foreign currency could trigger a change in the margin applicable to determine the interest rate, in the credit loans issued in 2004 and 2006.
Pg. 28

ARGENTINA
GENERATION
ENDESACOSTANERA
Operating income of Costanera amounted to Ch$ 6,597 million as of June 2010, a 1.9% reduction compared to 2009 first half. Physical sales declined by 21.1%, reaching 3,986 GWh as of June 2010 due to the plants major maintenance. Procurement and services cost increased by 12.4% between both periods, which is mainly explained by higher fuel costs.
Negative conversion effect from local currency to Chilean pesos, reduced 16.9% the 2010 first half results compared to last year’s figure.
| Table 12 | ||||||
| Endesa Costanera | Million Ch$ | Thousand US$ | ||||
| 1H09 | 1H10 | Var 1H09-1H10 | Chg % | 1H10 | ||
| Operating Revenues | 130,155 | 139,866 | 9,711 | 7.5% | 266,493 | |
| Procurement and Services | (104,224) | (117,195) | (12,971) | (12.4%) | (223,296) | |
| Contribution Margin | 25,931 | 22,671 | (3,260) | (12.6%) | 43,197 | |
| Other Costs | (9,268) | (8,134) | 1,134 | 12.2% | (15,499) | |
| Gross Operating Income (EBITDA) | 16,663 | 14,537 | (2,126) | (12.8%) | 27,698 | |
| Depreciation and Amortization | (9,941) | (7,940) | 2,001 | 20.1% | (15,128) | |
| Operating Income | 6,722 | 6,597 | (125) | (1.9%) | 12,570 | |
| Figures may differ from those accounted under Argentine GAAP. | ||||||
| Table 12.1 | ||||||
| Endesa Costanera | 1H09 | 1H10 | Var 1H09-1H10 | Chg% | ||
| GWh Produced | 5,028 | 3,940 | (1,088) | (21.6%) | ||
| GWh Sold | 5,052 | 3,986 | (1,066) | (21.1%) | ||
| Market Share | 9.7% | 7.3% | (2.4) pp. | |||
ELCHOCÓN
El Chocón showed a favorable reservoir level as a result of the storage during 2009, thus contributing a greater hydroelectric availability and reducing costs of energy purchases by nearly 25.3%, offsetting the 2.6% decrease of physical sales. Its operating income, therefore, rose by 1.4% to Ch$ 16,958 million as of the end of June 2010.
Negative conversion effect from local currency to Chilean pesos, reduced 16.9% the 2010 first half results compared to last year’s figure.
| Table 13 | ||||||
| El Chocón | Million Ch$ | Thousand US$ | ||||
| 1H09 | 1H10 | Var 1H09-1H10 | Chg % | 1H10 | ||
| Operating Revenues | 30,720 | 29,243 | (1,478) | (4.8%) | 55,717 | |
| Procurement and Services | (9,705) | (8,248) | 1,457 | 15.0% | (15,716) | |
| Contribution Margin | 21,015 | 20,995 | (21) | (0.1%) | 40,002 | |
| Other Costs | (2,467) | (2,445) | 22 | 0.9% | (4,658) | |
| Gross Operating Income (EBITDA) | 18,549 | 18,550 | 1 | 0.0% | 35,344 | |
| Depreciation and Amortization | (1,821) | (1,591) | 230 | 12.6% | (3,032) | |
| Operating Income | 16,727 | 16,958 | 231 | 1.4% | 32,311 | |
| Figures may differ from those accounted under Argentine GAAP. | ||||||
Pg. 29
| Table 13.1 | ||||
| El Chocón | 1H09 | 1H10 | Var 1H09-1H10 | Chg% |
| GWh Produced | 1,533 | 1,533 | (1) | (0.0%) |
| GWh Sold | 1,750 | 1,704 | (46) | (2.6%) |
| Market Share | 3.4% | 3.1% | (0.2) pp. |
DISTRIBUTION
EDESUR
Operating income decreased 53.4% to Ch$ 11,503 million mainly due to the negative conversion effect from local currency to Chilean pesos, which reduced 16.9% the 2010 first half results compared to last year’s figure.
Additionally, Edesur’s results decreased due to a worse sales mix and higher SG&A costs. The above mentioned effects were partially offset by a higher energy demand.
| Table 14 | ||||||
| Edesur | Million Ch$ | Thousand US$ | ||||
| 1H09 | 1H10 | Var 1H09-1H10 | Chg% | 1H10 | ||
| Operating Revenues | 184,211 | 151,683 | (32,528) | (17.7%) | 289,007 | |
| Procurement and Services | (87,188) | (73,295) | 13,893 | 15.9% | (139,652) | |
| Contribution Margin | 97,023 | 78,388 | (18,635) | (19.2%) | 149,356 | |
| Other Costs | (61,877) | (58,713) | 3,163 | 5.1% | (111,869) | |
| Gross Operating Income (EBITDA) | 35,146 | 19,674 | (15,472) | (44.0%) | 37,486 | |
| Depreciation and Amortization | (10,473) | (8,171) | 2,302 | 22.0% | (15,569) | |
| Operating Income | 24,673 | 11,503 | (13,170) | (53.4%) | 21,918 | |
| Figures may differ from those accounted under Argentine GAAP. | ||||||
| Table 14.1 | ||||
| Edesur | 1H09 | 1H10 | Var 1H09-1H10 | Chg% |
| Customers (Th) | 2,281 | 2,367 | 86 | 3.8% |
| GWh Sold | 7,970 | 8,279 | 309 | 3.9% |
| Clients/ Employee | 862 | 893 | 30 | 3.5% |
| Energy Losses (%) | 10.5% | 10.5% | 0.0 pp. |
Pg. 30
![]()
BRAZIL
ENDESABRASIL
| Table 15 | ||||||
| Endesa Brasil | (Million Ch$) | (Thousand US$) | ||||
| 1H09 | 1H10 | Var 1H09-1H10 | Chg % | 1H10 | ||
| Total Revenues | 921,596 | 1,038,180 | 116,585 | 12.7% | 1,978,089 | |
| Procurements and Services | (502,340) | (570,995) | (68,656) | (13.7%) | (1,087,941) | |
| Contribution Margin | 419,256 | 467,185 | 47,929 | 11.4% | 890,148 | |
| Other Costs | (129,018) | (131,762) | (2,743) | (2.1%) | (251,051) | |
| Gross Operating Income (EBITDA) | 290,238 | 335,424 | 45,186 | 15.6% | 639,097 | |
| Depreciation and Amortization | (74,146) | (83,787) | (9,641) | (13.0%) | (159,643) | |
| Operating Income | 216,091 | 251,637 | 35,545 | 16.4% | 479,454 | |
| Net Financial Income | (23,545) | (45,223) | (21,677) | (92.1%) | (86,165) | |
Financial income | 32,356 | 49,911 | 17,555 | 54.3% | 95,098 | |
Financial expenses | (68,035) | (98,731) | (30,696) | (45.1%) | (188,117) | |
Income (Loss) for indexed assets and liabilities | - | - | - | - | ||
Foreign currency exchange differences, net | 12,133 | 3,598 | (8,535) | (70.3%) | 6,855 | |
Gains | 16,058 | 21,090 | 5,032 | 31.3% | 40,184 | |
Losses | (3,925) | (17,492) | (13,568) | (345.7%) | (33,329) | |
| Net Income from Related Comp. Cons. by the Prop. Eq. Method | - | - | - | - | ||
| Net Income from Other Investments | - | - | - | - | ||
| Net Income from Sales of Assets | 6 | 97 | 91 | 1553.0% | 185 | |
| Net Income before Taxes | 192,552 | 206,511 | 13,959 | 7.2% | 393,475 | |
Income Tax | (45,701) | (46,419) | (718) | (1.6%) | (88,444) | |
| NET INCOME | 146,851 | 160,092 | 13,242 | 9.0% | 305,031 | |
| Net Income Attributable to Owners of the Company | 103,834 | 100,400 | (3,434) | (3.3%) | 191,297 | |
| Net Income Attributable to Minority Interest | 43,017 | 59,692 | 16,675 | 38.8% | 113,734 | |
GENERATION
CACHOEIRA
Operating Income increased 32%, reaching Ch$ 33,215 million, due to a 12.5% of higher sales volume boosted by the better hydrology and the recovery of the demand during the period. In addition, average sales prices were 1.3% higher in local currency.
A positive conversion effect from local currency to Chilean pesos increased 9.2% results compared to the figure of the same period last year.
| Table 16 | ||||||
| Cachoeira | Million Ch$ | Thousand US$ | ||||
| 1H09 | 1H10 | Var 1H09-1H10 | Chg% | 1H10 | ||
| Operating Revenues | 42,622 | 52,876 | 10,254 | 24.1% | 100,747 | |
| Procurement and Services | (10,587) | (12,850) | (2,264) | (21.4%) | (24,484) | |
| Contribution Margin | 32,036 | 40,026 | 7,990 | 24.9% | 76,262 | |
| Other Costs | (3,548) | (3,268) | 280 | 7.9% | (6,226) | |
| Gross Operating Income (EBITDA) | 28,488 | 36,758 | 8,270 | 29.0% | 70,037 | |
| Depreciation and Amortization | (3,322) | (3,543) | (221) | (6.7%) | (6,751) | |
| Operating Income | 25,166 | 33,215 | 8,049 | 32.0% | 63,285 | |
| Figures may differ from those accounted under Brazilian GAAP. | ||||||
| Table 16.1 | ||||
| Cachoeira | 1H09 | 1H10 | Var 1H09-1H10 | Chg% |
| GWh Produced | 1,325 | 1,525 | 200 | 15.1% |
| GWh Sold | 1,712 | 1,926 | 214 | 12.5% |
| Market Share | 0.9% | 1.0% | 0.0 pp. |
Pg. 31
FORTALEZA(CGTF)
Operating Income increased 68.7% due to a better purchase/sales mix resulting of the increase in average sales prices by 8.8%, measured in local currency, and also due to the decrease in energy purchases, as a result of the lower spot prices prevailing in the market due to the better hydrology prevailing in the system especially between January and May, and also due to the higher own-generation.
Additionally, the better sales mix helped to improve results, as sales to the regulated segment over total sales increased. It its worth mentioning that the regulated sales experienced a positive price adjustment in April 2010.
The above was partially offset by an increase in fuel costs as part of the higher own-generation.
In addition, a positive conversion effect from local currency to Chilean pesos increased 9.2% the results compared to the figure of the same period last year.
| Table 17 | ||||||
| Fortaleza | Million Ch$ | Thousand US$ | ||||
| 1H09 | 1H10 | Var 1H09-1H10 | Chg% | 1H10 | ||
| Operating Revenues | 62,659 | 68,966 | 6,307 | 10.1% | 131,403 | |
| Procurement and Services | (35,519) | (30,115) | 5,404 | 15.2% | (57,379) | |
| Contribution Margin | 27,140 | 38,851 | 11,711 | 43.2% | 74,024 | |
| Other Costs | (4,941) | (3,556) | 1,386 | 28.0% | (6,775) | |
| Gross Operating Income (EBITDA) | 22,199 | 35,295 | 13,097 | 59.0% | 67,250 | |
| Depreciation and Amortization | (3,655) | (4,011) | (356) | (9.7%) | (7,642) | |
| Operating Income | 18,544 | 31,285 | 12,741 | 68.7% | 59,608 | |
| Figures may differ from those accounted under Brazilian GAAP. | ||||||
| Table 17.1 | ||||||
| Fortaleza | 1H09 | 1H10 | Var 1H09-1H10 | Chg% | ||
| GWh Produced | 95 | 450 | 355 | 374.0% | ||
| GWh Sold | 1,651 | 1,381 | (270) | (16.3%) | ||
| Market Share | 0.9% | 0.7% | (0.2) pp. | |||
TRANSMISSION
CIEN
Our transmission line company, CIEN, decreased its operating income to a loss of Ch$ 8,024 million, due to the lack of contracts during the first half 2010 when compared to equal period of 2009. After the law enacted on December 2009 that recognizes for all the transmission lines the right of a regulated income, we are expecting the ANEEL’s resolution determining the annual allowed income for CIEN. It its worth mentioning that the law enacted last December granted CIEN the condition of a public service provider.
On the other hand, it is important mentioning that it has been signed an agreement of energy transportation with CAMMESA (Argentina) that will provide transmission availability during second half 2010.
In addition, a positive conversion effect from local currency to Chilean pesos increased 9.2% the results compared to the figure of the same period last year.
Pg. 32
| Table 18 | ||||||
| Cien | Million Ch$ | Thousand US$ | ||||
| 1H09 | 1H10 | Var 1H09-1H10 | Chg% | 1H10 | ||
| Operating Revenues | 51,798 | 11,595 | (40,203) | (77.6%) | 22,092 | |
| Procurement and Services | (1,212) | 3,538 | 4,750 | 391.8% | 6,741 | |
| Contribution Margin | 50,586 | 15,133 | (35,453) | (70.1%) | 28,833 | |
| Other Costs | (5,340) | (6,180) | (841) | (15.7%) | (11,776) | |
| Gross Operating Income (EBITDA) | 45,246 | 8,952 | (36,294) | (80.2%) | 17,057 | |
| Depreciation and Amortization | (9,465) | (16,976) | (7,511) | (79.4%) | (32,345) | |
| Operating Income | 35,781 | (8,024) | (43,805) | (122.4%) | (15,288) | |
| Figures may differ from those accounted under Brazilian GAAP. | ||||||
DISTRIBUTION
AMPLA
Operating Income increased 34.4% to Ch$ 102,477 million mainly due to a 6.5% increase of energy demand driven by high temperatures and recovery in economic activity. In addition, Ampla registered better sales mix in residential, commercial and industrial segments as well as tolls.
The latter was partially compensated by the increase in the energy purchase costs and higher energy losses.
All the above mentioned, has been boosted by positive conversion effect due to the appreciation of Brazilian Real relative to the Chilean peso.
| Table 19 | ||||||
| Ampla | Million Ch$ | Thousand US$ | ||||
| 1H09 | 1H10 | Var 1H09-1H10 | Chg% | 1H10 | ||
| Operating Revenues | 466,114 | 529,347 | 63,233 | 13.6% | 1,008,587 | |
| Procurement and Services | (297,030) | (320,756) | (23,726) | (8.0%) | (611,150) | |
| Contribution Margin | 169,084 | 208,591 | 39,506 | 23.4% | 397,437 | |
| Other Costs | (68,298) | (65,709) | 2,588 | 3.8% | (125,199) | |
| Gross Operating Income (EBITDA) | 100,787 | 142,881 | 42,095 | 41.8% | 272,238 | |
| Depreciation and Amortization | (24,514) | (40,404) | (15,890) | (64.8%) | (76,984) | |
| Operating Income | 76,273 | 102,477 | 26,205 | 34.4% | 195,254 | |
| Figures may differ from those accounted under Brazilian GAAP. | ||||||
| Table 19.1 | ||||
| Ampla | 1H09 | 1H10 | Var 1H09-1H10 | Chg% |
| Customers (Th) | 2,493 | 2,535 | 42 | 1.7% |
| GWh Sold | 4,660 | 4,965 | 305 | 6.5% |
| Clients/Employee | 1,963 | 2,159 | 196 | 10.0% |
| Energy Losses % | 20.6% | 21.3% | 0.7 pp. |
Pg. 33
COELCE
Operating Income increased 50% to Ch$ 95,726 million mainly due to a 16% increase in energy demand explained by a better economic scenario which boosted energy consumption in all segments; additionally, Coelce registered higher average sales margins due to better sales mix in residential, commercial, industrials and other rural customers and tolls.
The latter was partially offset by higher energy losses and cost of energy purchases.
All the above mentioned, has been boosted by positive conversion effect due to Real appreciation relative to the Chilean peso.
| Table 20 | ||||||
| Coelce | Million Ch$ | Thousand US$ | ||||
| 1H09 | 1H10 | Var 1H09-1H10 | Chg% | 1H10 | ||
| Operating Revenues | 341,481 | 442,553 | 101,072 | 29.6% | 843,216 | |
| Procurement and Services | (214,381) | (277,968) | (63,586) | (29.7%) | (529,624) | |
| Contribution Margin | 127,100 | 164,586 | 37,486 | 29.5% | 313,592 | |
| Other Costs | (43,507) | (50,158) | (6,651) | (15.3%) | (95,569) | |
| Gross Operating Income (EBITDA) | 83,593 | 114,427 | 30,834 | 36.9% | 218,023 | |
| Depreciation and Amortization | (19,770) | (18,701) | 1,070 | 5.4% | (35,631) | |
| Operating Income | 63,823 | 95,726 | 31,904 | 50.0% | 182,392 | |
| Figures may differ from those accounted under Brazilian GAAP. | ||||||
| Table 20.1 | ||||
| Coelce | 1H09 | 1H10 | Var 1H09-1H10 | Chg% |
| Customers (Th) | 2,903 | 3,026 | 124 | 4.3% |
| GWh Sold | 3,695 | 4,284 | 589 | 16.0% |
| Clients/Employee | 2,262 | 2,376 | 113 | 5.0% |
| Energy Losses % | 11.6% | 11.9% | 0.3 pp. |
Pg. 34

CHILE
GENERATION
ENDESACHILE
Consolidated Income Statement of Endesa Chile
| Table 21 | ||||||
| Endesa Chile | (Million Ch$) | (Thousand US$) | ||||
| 1H09 | 1H10 | Var 1H09-1H10 | Chg % | 1H10 | ||
| Total Revenues | 1,260,985 | 1,178,416 | (82,568) | (6.5%) | 2,245,287 | |
| Procurements and Services | (530,212) | (585,969) | (55,756) | (10.5%) | (1,116,471) | |
| Contribution Margin | 730,772 | 592,448 | (138,325) | (18.9%) | 1,128,816 | |
| Other Costs | (85,632) | (88,861) | (3,229) | (3.8%) | (169,310) | |
| Gross Operating Income (EBITDA) | 645,140 | 503,587 | (141,554) | (21.9%) | 959,505 | |
| Depreciation and Amortization | (98,675) | (101,074) | (2,399) | (2.4%) | (192,581) | |
| Operating Income | 546,465 | 402,512 | (143,953) | (26.3%) | 766,924 | |
| Net Financial Income | (98,750) | (57,056) | 41,694 | 42.2% | (108,712) | |
Financial income | 17,100 | 7,807 | (9,293) | (54.3%) | 14,875 | |
Financial expenses | (99,145) | (74,133) | 25,012 | 25.2% | (141,249) | |
Income (Loss) for indexed assets and liabilities | 9,657 | (2,099) | (11,756) | (121.7%) | (4,000) | |
Foreign currency exchange differences, net | (26,362) | 11,369 | 37,731 | 143.1% | 21,661 | |
Gains | 12,762 | 22,504 | 9,742 | 76.3% | 42,878 | |
Losses | (39,125) | (11,136) | 27,989 | 71.5% | (21,217) | |
| Net Income from Related Comp. Cons. by the Prop. Eq. Method | 43,836 | 41,100 | (2,736) | (6.2%) | 78,310 | |
| Net Income from Other Investments | (139) | (0) | 139 | 99.9% | (0) | |
| Net Income from Sales of Assets | (16) | 92 | 108 | 687.8% | 176 | |
| Net Income before Taxes | 491,397 | 386,649 | (104,748) | (21.3%) | 736,698 | |
Income Tax | (83,111) | (107,374) | (24,263) | (29.2%) | (204,584) | |
| NET INCOME | 408,286 | 279,275 | (129,011) | (31.6%) | 532,114 | |
| Net Income Attributable to Owners of the Company | 331,237 | 208,535 | (122,702) | (37.0%) | 397,331 | |
| Net Income Attributable to Minority Interest | 77,048 | 70,740 | (6,309) | (8.2%) | 134,784 | |
| *Includes generation subsidiaries in Chile, Argentina, Colombia and Peru. | ||||||
Chilean Operations
Operating income in Chile was Ch$ 220,190 million as of June 2010, a reduction of 35.6% compared to the same period of the previous year. Physical sales remained in line, although at average prices expressed in pesos were approximately 18.7% lower. This is explained by decreased sales at the spot market because of the reduced dispatch of the thermal plants, partially compensated by higher sales to unregulated and regulated customers that showed a recovery in demand.
The decrease of the operating income was also partially offset by a 2.2% reduction in procurement and services costs, mainly due to a 20.2% decrease in fuel purchase costs associated with the lower thermal dispatch.
This resulted in an EBITDA or gross margin of the generation business reaching Ch$ 270,008 million as of June 2010, compared to Ch$ 390,904 million in the first half of 2009.
Pg. 35
| Table 22 | ||||||
| Chilean Electricity Business | Million Ch$ | Thousand US$ | ||||
| 1H09 | 1H10 | Var 1H09-1H10 | Chg% | 1H10 | ||
| Operating Revenues | 739,334 | 620,971 | (118,363) | (16.0%) | 1,183,162 | |
| Procurement and Services | (316,987) | (310,108) | 6,879 | 2.2% | (590,862) | |
| Contribution Margin | 422,347 | 310,863 | (111,484) | (26.4%) | 592,300 | |
| Other Costs | (31,443) | (40,855) | (9,412) | (29.9%) | (77,843) | |
| Gross Operating Income (EBITDA) | 390,904 | 270,008 | (120,897) | (30.9%) | 514,457 | |
| Depreciation and Amortization | (48,767) | (49,818) | (1,051) | (2.2%) | (94,921) | |
| Operating Income | 342,138 | 220,190 | (121,948) | (35.6%) | 419,537 | |
| Table 22.1 | ||||||
| Chilean Electricity Business | 1H09 | 1H10 | Var 1H09-1H10 | Chg% | ||
| GWh Produced | 10,375 | 10,140 | (235) | (2.3%) | ||
| GWh Sold | 10,515 | 10,517 | 2 | 0.0% | ||
| Market Share | 39.9% | 39.9% | (0.0) pp. | |||
DISTRIBUTION
CHILECTRA
Operating Income decreased 32.7%, to Ch$ 47,458 million, when compared to the first half of 2009. Despite the increase in demand in all customers’ segments, tariff was negatively affected by the decrease in indexes comprised within the tariff polynomial equation when compared with 1H09. Additionally, the decrease in sub-transmission tolls set by the authority and the amendment on the fixation process for electricity purchase cost resulting of the operation in full force of the new auctioned long-term contracts for energy purchase also contributed to the decrease in tariff during the first half of 2010.
Energy losses increased 0.1 pp. when compared to the first half of 2009.
| Table 23 | ||||||
| Chilectra | (Million Ch$) | (Thousand US$) | ||||
| 1H09 | 1H10 | Var 1H09-1H10 | Chg % | 1H10 | ||
| Sales | 563,749 | 436,676 | (127,073) | (22.5%) | 832,017 | |
| Other operating income | 15,434 | 4,347 | (11,087) | (71.8%) | 8,283 | |
| Total Revenues | 579,183 | 441,023 | (138,160) | (23.9%) | 840,301 | |
| Procurements and Services | (453,064) | (334,936) | 118,128 | 26.1% | (638,167) | |
| Contribution Margin | 126,119 | 106,088 | (20,031) | (15.9%) | 202,133 | |
| Other Costs | (41,554) | (43,746) | (2,191) | (5.3%) | (83,351) | |
| Gross Operating Income (EBITDA) | 84,565 | 62,342 | (22,223) | (26.3%) | 118,782 | |
| Depreciation and Amortization | (14,099) | (14,884) | (784) | (5.6%) | (28,358) | |
| Operating Income | 70,465 | 47,458 | (23,007) | (32.7%) | 90,424 | |
| Net Financial Income | (907) | 153 | 1,060 | 116.8% | 291 | |
Financial income | 8,059 | 4,617 | (3,442) | (42.7%) | 8,796 | |
Financial expenses | (9,082) | (4,413) | 4,668 | 51.4% | (8,409) | |
Income (Loss) for indexed assets and liabilities | (583) | 531 | 1,114 | 191.1% | 1,012 | |
Foreign currency exchange differences, net | 698 | (582) | (1,280) | (183.3%) | (1,108) | |
Gains | 1,502 | 565 | (937) | (62.4%) | 1,076 | |
Losses | (803) | (1,147) | (344) | (42.8%) | (2,185) | |
| Net Income from Related Comp. Cons. by the Prop. Eq. Method | 37,586 | 36,811 | (775) | (2.1%) | 70,138 | |
| Net Income from Other Investments | 759 | - | (759) | (100.0%) | - | |
| Net Income from Sales of Assets | (330) | (44) | 286 | 86.8% | (83) | |
| Net Income before Taxes | 107,573 | 84,378 | (23,194) | (21.6%) | 160,770 | |
Income Tax | (7,409) | (19,774) | (12,365) | (166.9%) | (37,677) | |
| NET INCOME | 100,164 | 64,604 | (35,560) | (35.5%) | 123,093 | |
| Net Income Attributable to Owners of the Company | 98,890 | 64,604 | (34,286) | (34.7%) | 123,093 | |
| Net Income Attributable to Minority Interest | 1,274 | 0 | (1,274) | 0 | ||
Pg. 36
| Table 23.1 | ||||
| Chilectra | 1H09 | 1H10 | Var 1H09-1H10 | Chg% |
| Customers (Th) | 1,559 | 1,598 | 39 | 2.5% |
| GWh Sold | 6,175 | 6,307 | 132 | 2.1% |
| Clients/ Employee | 2,141 | 2,171 | 30 | 1.4% |
| Energy Losses (%) | 5.9% | 6.1% | 0.1 pp. |

COLOMBIA
GENERATION
EMGESA
The operating income of Emgesa was Ch$ 116,875 million as of June 2010, a 9.2% decrease compared to the same period of 2009. This is mainly explained by a less efficient production mix due to low hydrology as a consequence of the El Niño phenomenon, which has mitigated its impact since May 2010. This situation led to an increase in thermal production, replacing hydroelectric dispatch, which decreased by 30.9% comparing both periods. The climatic factor caused an increase of 53.1% in procurement and services cost because of higher energy purchases and higher costs of fuel consumption for the thermal generation of Ch$ 23,233 million and Ch$ 12,180 million respectively. This was partially compensated by a higher average price due to the greater thermal production resting from the low hydrology. EBITDA, or gross margin, in Colombia decreased 6.3% in the first half of 2010, reaching Ch$ 137,285 million. The effect of converting the financial statements from Colombian pesos to Chilean pesos caused a 6.4% increase of the results between both periods.
| Table 24 | ||||||
| Emgesa | Million Ch$ | Thousand US$ | ||||
| 1H09 | 1H10 | Var 1H09-1H10 | Chg% | 1H10 | ||
| Operating Revenues | 234,471 | 264,188 | 29,717 | 12.7% | 503,368 | |
| Procurement and Services | (72,061) | (110,319) | (38,257) | (53.1%) | (210,195) | |
| Contribution Margin | 162,409 | 153,869 | (8,540) | (5.3%) | 293,174 | |
| Other Costs | (15,905) | (16,585) | (679) | (4.3%) | (31,599) | |
| Gross Operating Income (EBITDA) | 146,504 | 137,285 | (9,219) | (6.3%) | 261,574 | |
| Depreciation and Amortization | (17,726) | (20,410) | (2,684) | (15.1%) | (38,887) | |
| Operating Income | 128,778 | 116,875 | (11,903) | (9.2%) | 222,687 | |
| Figures may differ from those accounted under Colombian GAAP. | ||||||
| Table 24.1 | ||||
| Emgesa | 1H09 | 1H10 | Var 1H09-1H10 | Chg% |
| GWh Produced | 6,634 | 5,098 | (1,535) | (23.1%) |
| GWh Sold | 8,391 | 7,138 | (1,253) | (14.9%) |
| Market Share | 21.2% | 17.7% | (3.5) pp. |
Pg. 37
DISTRIBUTION
CODENSA
Operating Income decreased 3.5% to Ch$ 94,939 million, mainly due to Codensa Hogar’s change in business model, and also due to lower average sales price. The deconsolidation of Codensa Hogar’s operating revenues distorts the comparison basis. These effects were partially offset by higher demand on Cundinamarca and lower maintenance costs.
It is worth mentioning that starting this year, the change in the Codensa Hogar business model will be reflected in the financial statements of the company as they will be deconsolidated from Codensa’s operating revenues. Therefore, all income from the retail business, which corresponds to the commissions received from Colpatria, will be classified as Financial Income.
The above was partially offset by the positive conversion effect (6.4%) from local currency to Chilean pesos.
| Table 25 | ||||||
| Codensa | Million Ch$ | Thousand US$ | ||||
| 1H09 | 1H10 | Var 1H09-1H10 | Chg% | 1H10 | ||
| Operating Revenues | 354,839 | 386,896 | 32,057 | 9.0% | 737,168 | |
| Procurement and Services | (183,895) | (215,407) | (31,512) | (17.1%) | (410,424) | |
| Contribution Margin | 170,944 | 171,489 | 545 | 0.3% | 326,745 | |
| Other Costs | (43,994) | (45,599) | (1,605) | (3.6%) | (86,881) | |
| Gross Operating Income (EBITDA) | 126,950 | 125,890 | (1,060) | (0.8%) | 239,863 | |
| Depreciation and Amortization | (28,520) | (30,951) | (2,431) | (8.5%) | (58,972) | |
| Operating Income | 98,430 | 94,939 | (3,490) | (3.5%) | 180,892 | |
| Figures may differ from those accounted under Colombian GAAP. | ||||||
| Table 25.1 | ||||
| Codensa | 1H09 | 1H10 | Var 1H09-1H10 | Chg% |
| Customers (Th) | 2,438 | 2,506 | 68 | 2.8% |
| GWh Sold | 5,889 | 6,125 | 236 | 4.0% |
| Clients/ Employee | 2,358 | 2,416 | 59 | 2.5% |
| Energy Losses (%) | 8.3% | 8.6% | 0.3 pp. |
Pg. 38

PERU
GENERATION
EDEGEL
Edegel achieved an operating income of Ch$ 38,674 million for the 1H of 2010, a reduction of 19.6% compared to the first half of 2009. This is mainly explained by lower physical sales and a higher procurement and services costs. The 3.2% decline in physical sales was due to lower sales to unregulated customers, particularly to Electroperú, whose contract ended in September 2009. The 47.1% increase in procurement and services cost reflects the absence of the non-recurring reversal of provisions for energy purchases of distribution companies without contracts registered as of June 2009. This was partially compensated as our Peruvian operation maintained an efficient production mix with 60% hydroelectric and the rest thermal, reflecting lower fuel consumption costs of Ch$ 479 million. The effect of converting the financial statements from Peruvian soles to Chilean pesos caused a 3% decrease of the results between both periods.
| Table 26 | ||||||
| Edegel | Million Ch$ | Thousand US$ | ||||
| 1H09 | 1H10 | Var 1H09-1H10 | Chg% | 1H10 | ||
| Operating Revenues | 109,726 | 109,444 | (283) | (0.3%) | 208,528 | |
| Procurement and Services | (27,233) | (40,057) | (12,824) | (47.1%) | (76,322) | |
| Contribution Margin | 82,493 | 69,387 | (13,106) | (15.9%) | 132,206 | |
| Other Costs | (15,407) | (11,080) | 4,327 | 28.1% | (21,111) | |
| Gross Operating Income (EBITDA) | 67,086 | 58,307 | (8,779) | (13.1%) | 111,095 | |
| Depreciation and Amortization | (18,993) | (19,633) | (640) | (3.4%) | (37,408) | |
| Operating Income | 48,092 | 38,674 | (9,419) | (19.6%) | 73,687 | |
| Figures may differ from those accounted under Peruvian GAAP. | ||||||
| Table 26.1 | ||||
| Edegel | 1H09 | 1H10 | Var 1H09-1H10 | Chg% |
| GWh Produced | 4,301 | 4,101 | (200) | (4.6%) |
| GWh Sold | 4,295 | 4,157 | (138) | (3.2%) |
| Market Share | 31.9% | 28.6% | (3.3) pp. |
DISTRIBUTION
EDELNOR
Operating Income increased 1.2% to Ch$ 33,070 million, mainly due to an increase in energy sales. The latter, partially offset by higher energy losses and lower average sales prices.
| Table 27 | ||||||
| Edelnor | Million Ch$ | Thousand US$ | ||||
| 1H09 | 1H10 | Var 1H09-1H10 | Chg% | 1H10 | ||
| Operating Revenues | 154,197 | 154,874 | 677 | 0.4% | 295,088 | |
| Procurement and Services | (94,182) | (94,801) | (619) | (0.7%) | (180,628) | |
| Contribution Margin | 60,015 | 60,073 | 58 | 0.1% | 114,460 | |
| Other Costs | (16,493) | (15,887) | 606 | 3.7% | (30,271) | |
| Gross Operating Income (EBITDA) | 43,522 | 44,186 | 664 | 1.5% | 84,189 | |
| Depreciation and Amortization | (10,847) | (11,116) | (269) | (2.5%) | (21,180) | |
| Operating Income | 32,674 | 33,070 | 396 | 1.2% | 63,009 | |
| Figures may differ from those accounted under Peruvian GAAP. | ||||||
Pg. 39
| Table 27.2 | ||||
| Edelnor | 1H09 | 1H10 | Var 1H09-1H10 | Chg% |
| Customers (Th) | 1,044 | 1,076 | 32 | 3.0% |
| GWh Sold | 2,836 | 3,036 | 200 | 7.1% |
| Clients/ Employee | 1,703 | 1,938 | 235 | 13.8% |
| Energy Losses (%) | 8.1% | 8.2% | 0.1 pp. |
Operating Income by Subsidiary
Summary of operating revenues, operating costs (including procurements, services and other costs) and operating income of all Enersis’ subsidiaries, for the first half ended in June 2009 and June 2010, detailed as follows:
| Table 28 | ||||||
| 1H09 | 1H10 | |||||
| Million Ch$ | Operating | Operating Costs | Operating Income | Operating | Operating Costs | Operating Income |
| Revenues | Revenues | |||||
| Endesa Chile (*) | 1,260,985 | (714,519) | 546,465 | 1,178,416 | (775,904) | 402,512 |
| Cachoeira (**) | 42,622 | (17,457) | 25,166 | 52,876 | (19,661) | 33,215 |
| Fortaleza (***) | 62,659 | (44,115) | 18,544 | 68,966 | (37,681) | 31,285 |
| Cien (**) | 51,798 | (16,017) | 35,781 | 11,595 | (19,619) | (8,024) |
| Chilectra | 579,183 | (508,718) | 70,465 | 441,023 | (393,565) | 47,458 |
| Edesur | 184,211 | (159,538) | 24,673 | 151,683 | (140,179) | 11,503 |
| Distrilima (Edelnor) | 154,197 | (121,522) | 32,674 | 154,874 | (121,804) | 33,070 |
| Ampla | 466,114 | (389,841) | 76,273 | 529,347 | (426,869) | 102,477 |
| Investluz (Coelce) | 341,481 | (277,659) | 63,823 | 442,553 | (346,827) | 95,726 |
| Codensa | 354,839 | (256,409) | 98,430 | 386,896 | (291,956) | 94,939 |
| CAM Ltda. | 76,411 | (75,924) | 487 | 54,839 | (56,003) | (1,164) |
| Inmobiliaria Manso de Velasco Ltda. | 2,064 | (1,875) | 189 | 2,733 | (2,217) | 517 |
| Synapsis Soluciones y Servicios IT Ltda. | 35,181 | (30,438) | 4,743 | 34,805 | (32,913) | 1,892 |
| Enersis Holding and other investment vehicles | 6,274 | (14,568) | (8,294) | 7,380 | (15,392) | (8,011) |
| Consolidation Adjustments | (343,691) | 343,455 | (236) | (389,531) | 388,488 | (1,044) |
| Total Consolidation | 3,274,328 | (2,285,145) | 989,183 | 3,128,454 | (2,292,103) | 836,352 |
| (*) Since January 1st, 2009, includes Gas Atacama, Transquillota e HydroAysén | ||||||
| (**) Consolidated by Endesa Chile until September 30th, 2005. Since October 1st, 2005 isconsolidated by Enersisthrough Endesa Brasil. | ||||||
| (***) Since October 1st, 2005, these subsidiaries are consolidated by Enersis through Endesa Brasil. | ||||||
| Table 28.1 | |||
| 1H10 | |||
| Thousand US$ | Operating | Operating Costs | Operating Income |
| Revenues | |||
| Endesa Chile (*) | 2,245,287 | (1,478,363) | 766,924 |
| Cachoeira (**) | 100,747 | (37,462) | 63,285 |
| Fortaleza (***) | 131,403 | (71,795) | 59,608 |
| Cien (**) | 22,092 | (37,380) | (15,288) |
| Chilectra | 840,301 | (749,876) | 90,424 |
| Edesur | 289,007 | (267,090) | 21,918 |
| Distrilima (Edelnor) | 295,088 | (232,078) | 63,009 |
| Ampla | 1,008,587 | (813,333) | 195,254 |
| Investluz (Coelce) | 843,216 | (660,824) | 182,392 |
| Codensa | 737,168 | (556,277) | 180,892 |
| CAM Ltda. | 104,486 | (106,704) | (2,218) |
| Inmobiliaria Manso de Velasco Ltda. | 5,208 | (4,224) | 984 |
| Synapsis Soluciones y Servicios IT Ltda. | 66,316 | (62,711) | 3,605 |
| Enersis Holding and other investment vehicles | 14,062 | (29,326) | (15,265) |
| Consolidation Adjustments | (742,191) | 740,202 | (1,988) |
| Total Consolidation | 5,960,777 | (4,367,241) | 1,593,537 |
Pg. 40
![]()
CONFERENCECALLINVITATION
Enersis is pleased to invite you to participate in aConference Callwith the management to review the results for the period,on Wednesday, July 28th, 2010, 12:00 p.m. Eastern Time(12:00 p.m. Chilean Time). There will be a question and answer session following management's comments. Representing Enersis will be Mr. Alfredo Ergas, Chief Financial Officer and Mr. Ricardo Alvial, Risk Management & IR Director.
To participate, please dial +1 (617) 213-4851 or +1 (888) 679-8040 (toll free USA), approximately 10 minutes prior to the scheduled start time, Passcode ID: 61752794
To access the phone replay, please dial +1 (617) 801-6888 or +1 (888) 286-8010 (toll free USA) Passcode ID: 72210055.
FOR THISCONFERENCECALL YOU CAN ACCESS PREVIOUSLY TO THE PRE-REGISTRATION SITE AT
HTTPS://WWW.THECONFERENCINGSERVICE.COM/PREREG/KEY.PROCESS?KEY=PHJ986CN6AND MAKE YOUR REGISTRATION QUICKER. IF NOT,PLEASE CONNECT APPROXIMATELY15MINUTES PRIOR TO THE SCHEDULED START TIME. YOU CAN ALSO ACCESS TO THE CONFERENCE CALL REPLAY THROUGH OUR WEBSITE AT
HTTP://PHX.CORPORATE-IR.NET/PHOENIX.ZHTML?C=83615&P=IROL-IRHOME.
Pg. 41
CONTACTINFORMATION
For further information, please contact us:
| Ricardo Alvial | Rodrigo Pérez | |||
| Risk Management and IR Director | Head of Investor Relations | |||
| ram@e.enersis.cl | rapr@e.enersis.cl | |||
| 56 (2) 353 4682 | 56 (2) 353 4554 | |||
| Carmen Poblete | Romina Valderrama | Erika Vargas | ||
| Shares Department | Investor Relations | Investor Relations | ||
| Associate | Associate | Associate | ||
| cpt@e.enersis.cl | rvh@enersis.cl | emvb@enersis.cl | ||
| 56 (2) 353 4447 | 56 (2) 353 4552 | 56 (2) 353 4555 | ||
| María Luz Muñoz | ||||
| Investor Relations | ||||
| Assistant | ||||
| mlmr@e.enersis.cl | ||||
| 56 (2) 353 4682 | ||||
DISCLAIMER
This Press Release contains statements that could constitute forward-looking statements within the meaning of the Private Securities Litigation Reform Act of 1995. These statements appear in a number of places in this announcement and include statements regarding the intent, belief or current expectations of Enersis and its management with respect to, among other things: (1) Enersis’ business plans; (2) Enersis’ cost-reduction plans; (3) trends affecting Enersis’ financial condition or results of operations, including market trends in the electricity sector in Chile or elsewhere; (4) supervision and regulation of the electricity sector in Chile or elsewhere; and (5) the future effect of any changes in the laws and regulations applicable to Enersis’ or its subsidiaries. Such forward-looking statements are not guarantees of future performance and involve risks and uncertainties. Actual results may differ materially from those in the forward-lookin g statements as a result of various factors. These factors include a decline in the equity capital markets of the United States or Chile, an increase in the market rates of interest in the United States or elsewhere, adverse decisions by government regulators in Chile or elsewhere and other factors described in Enersis’ Annual Report on Form 20-F. Readers are cautioned not to place undue reliance on those forward-looking statements, which state only as of their dates. Enersis undertakes no obligation to release publicly the result of any revisions to these forward-looking statements.
Pg. 42
SIGNATURES
Pursuant to the requirements of the Securities Exchange Act of 1934, as amended, the Registrant has duly caused this report to be signed on its behalf by the undersigned, thereunto duly authorized.
| ENERSIS S.A. | |
| By: /s/ Ignacio Antoñanzas | |
| -------------------------------------------------- | |
| Title: Chief Executive Officer |
Date: July 28, 2010