FORM 6-K
SECURITIES AND EXCHANGE COMMISSION
Washington, D.C. 20549
Report of Foreign Issuer
Pursuant to Rule 13a-16 or 15d-16 of
the Securities Exchange Act of 1934
For the month of October, 2010
Commission File Number: 001-12440
ENERSIS S.A.
(Translation of Registrant’s Name into English)
Santa Rosa 76
Santiago, Chile
(Address of principal executive office)
Indicate by check mark whether the registrant files or will file
annual reports under cover of Form 20-F or Form 40-F:
Form 20-F [X] Form 40-F [ ]
Indicate by check mark if the registrant is submitting the Form 6-K
in paper as permitted by Regulation S-T Rule 101(b)(1):
Yes [ ] No [X]
Indicate by check mark if the registrant is submitting the Form 6-K
in paper as permitted by Regulation S-T Rule 101(b)(7):
Yes [ ] No [X]
Indicate by check mark whether by furnishing the information
ontained in this Form, the Registrant is also thereby furnishing the
information to the Commission
pursuant to Rule 12g3-2(b) under the Securities Exchange Act of 1934:
Yes [ ] No [X]
If °;Yes” is marked, indicate below the file number assigned to the registrant
in connection with Rule 12g3-2(b): N/A
![]()
ENERSIS
ANNOUNCES CONSOLIDATED RESULTS
FOR NINE-MONTH PERIOD ENDED ON SEPTEMBER 30, 2010
| Highlights for the Period |
SUMMARY
We continued evidencing a strong growth in electricity demand in the five countries in which weoperate, and especially in Brazil and Peru.
This increase in demand has been largely supported by the strong economic activityexperienced in these markets. 2010 Consensus forecasts for GDP increases in the countrieswere we operate consider figures of 7.5% in Argentina, Brazil and Peru, 5.2% in Chile, and4.4% in Colombia.
The performance of the Latin American economies, even under the financial stress experiencedon a worldwide basis during 2010, it's a clear sign of the strong resilience of demand andeconomic activity in the five countries were we operate.
A well diversified mix of assets, contributed to balance the structure of our EBITDA, as follows,
| •Generation and Transmission | 55% | ||
| •Distribution | 45% |
In light of our improved overall financial shape, Moody's placed the Baa3 senior unsecuredrating of Enersis under review for a possible upgrade.
Our client´s base increased in more than 380,000 new customers, confirming the high stabilitycoming from natural growth.
In this regards, its important highlighting our Brazilian distribution business, which presents anincrease of 20% in Operating Income.
As expected, main physical data confirmed that the second half of 2010 would behave betterthan the first half of this year. In fact, if we compare the third and the second quarter (on aquarterly basis), we have the following positive changes:
| In Generation | |
| •Energy Sales increased 5% | |
| •Generation increased 12% | |
| •Energy Purchases decreased 35% | |
| In Distribution | |
| •Energy Sales increased 4.4% |
Total Operating Income of the period totaled Ch$ 1,289,551 million, equivalent to a 15%decrease compared with the same period of 2009.
As of September 30th, 2010, net income attributable to the company's shareholders amountedto Ch$ 342,141 million, a 36% decrease, mainly explained by the reasons previously given.
Pg.1
![]()
DISTRIBUTION BUSINESS
Consolidated figures for the Distribution Businesses are detailed as follows:
Operating Revenues increased 1.2%, amounting to Ch$ 3,184,955 million.
Operating Costs reached Ch$ 2,627,975 million, which represent a 1.7% increase comparedwith 3Q09.
EBITDA totaled Ch$ 747,356 million, in line with the same period of 2009.
Operating income slightly decreased by 1.2% amounting to Ch$ 556,981 million, mainlyexplained by the lower results on our Chilean and Argentine operations, almost completelyoffset by the important increase in the results from our Brazilian subsidiaries.
Higher demand faced by our distribution subsidiaries in Brazil and Peru, confirming the steadyand sustained growth in demand experienced during 2010.
Positive factors that influenced these results by country are the following:
In Brazil, EBITDA increased Ch$ 45,481 million, as a result of:
The sustained increase in demand experienced by our subsidiaries.
The improvement in sales mix and margins.
In Peru, EBITDA increased Ch$ 1,610 million, as a result of:
Better sales margins and lower SG&A costs.
7.5% increase in demand.
In Colombia, EBITDA increased Ch$ 1,691 million, mainly as a result of:
Higher demand experienced during the year, which allowed the company to offset the highercost of energy purchased and also the lower revenues due to the deconsolidation of CodensaHogar's revenues, distorting comparison basis.
In Chile, EBITDA decreased Ch$ 28,205 million, which is explained mainly by the following:
A lower purchase/sales mix.
A 9% lower VAD due to the negative indexer variation compared to 3Q09.
All the above was partially offset by higher sales volumes related to the increase in electricitydemand experienced during 2010.
In Argentina, EBITDA decreased Ch$ 20,605 million, as result of:
A lower sales mix, represented by higher sales to industrial customers over residentialcustomers.
Higher operational costs, mainly boosted by fines imposed by the authority.
In 2009, a General Agreement was recognized with the Provincial Government related toenergy consumption for impoverished people living in shanty towns. The agreement impliedCh$ 8,285 million.
Pg.2
![]()
GENERATION AND TRANSMISSION BUSINESS
Consolidated results for Generation and Transmission Business are detailed as follows:
Consolidated physical sales decreased 5.0%, totaling 47,313 GWh, primarily due to lower salesin Argentina and Colombia.
Due to lower sales, partially offset by higher prices, Total Revenues decreased 1.2%,amounting to Ch$ 2,076,441 million.
Operating Costs amounted Ch$ 1,330,803 million, a 16.4% increase, mainly explained byhigher energy purchases in Chile and higher costs of fuel in Argentina.
EBITDA decreased 17.4%, amounting to Ch$ 931,647 million.
Operating Income decreased 22.3% amounting to Ch$ 745,638 million.
Hydro generation experienced a 10.7% decrease, mainly attributable to Colombia and Chile.
In Argentina, EBITDA decreased by Ch$ 1,691 million, as a result of:
34% of higher costs of fuel.
Partially offset by higher average prices of approximately 33%.
In Chile, EBITDA decreased by Ch$ 180,001 million which is explained primarily by the following:
Lower sales prices of approximately 9.3%.
Higher cost of Ch$ 64,640 million due to a surge in energy purchases in Chile.
The latter was partially offset by a decrease of 3.6% in cost of fuel.
In Colombia, EBITDA decreased by Ch$ 2,046 million, which is explained primarily by the following:
Ch$ 9,638 million in higher costs of fuel.
Higher transportation costs of 8.2%.
The above mentioned was partially offset by a 19% increase in average sales of prices, dueto the increase in market prices related to the higher thermal production in the country.
In Peru, EBITDA decreased by Ch$ 3,311 million, as consequence of:
Higher costs of energy purchases by Ch$ 5,145 million due to the absence of the non-recurrent provision accumulated as of September 30, 2009, related to distributors withoutcontracts.
A 13.4% of increase in fuel costs due to the increase in thermal generation.
In Brazil, EBITDA decreased by Ch$ 8,724 million, as a result of:
A decrease in income from the transmission business, due to the reduced operation of thetransmission lines compared to the year 2009.
Partially offset by the increasing income from the generation business, which experiencedimproved sales margins.
Pg.3
![]()
FINANCIAL SUMMARY
- The average interest rate increased, from 7.4% up to 8.4%, mainly because of inflationary effects.
- Liquidity, a key consideration in our financial management, continues to be in a very solid position, as shown below:
- Non-committed credit lines: US$ 527 million available in the aggregate for Enersis and Endesa Chile in the local markets.
- Committed long term credit lines for US$ 962 million on a consolidated basis, available for Enersis and Endesa, of which US$ 450 million are due in the short term.
- Cash and cash equivalents amounts to US $1,558 million.
- Coverage and Protection: In order to mitigate exchange rate and interest rate risks, Enersis has established strict internal rules to protect our cash flows and balance sheet from variations invariables
- Our exchange rate policy is based on cash flows and it strives to maintain a balance between US dollar indexed flows, and assets and liabilities in such currency. In addition to this policy, we have contracted Cross Currency Swaps for a total amount of US$1,406 million and Forwards, for US$138 million.
- In order to reduce volatility on financial results due to changes in market interest rates, we seek to maintain an adequate balance in debt structures. Additionally, we have contracted Interest Rate Swaps for US$ 384 million.
- Our exchange rate policy is based on cash flows and it strives to maintain a balance between US dollar indexed flows, and assets and liabilities in such currency. In addition to this policy, we have contracted Cross Currency Swaps for a total amount of US$1,406 million and Forwards, for US$138 million.
The aforementioned financial policies are being permanently evaluated and adjusted to the changing macroeconomic scenario, in order to achieve the most efficient levels of protection.
MARKETSUMMARY
During the first nine months of 2010, the Chilean stock exchange main index (IPSA) showed an important increase of 33.9%, over performing when compared to other international stock markets, which have also shown a positive trend during this year, as follows: Bovespa: 1.2%, S&P 500: 2.3%, UKX: 2.5%, Dow Jones Industrials: 3.4% and FTSE 250: 13.2% (all yields measured in local currencies).
Enersis shares' price in the local market decreased 0.6% during the period. Divestitures made by Chilean pension funds have influenced the evolution of Enersis stock, which is underperforming in the local market. During this year, Enersis continued to be among the most traded companies at the Santiago Stock Exchange, with an average trading volume of US$ 10.2 million per day during the nine-month period.
| Top Five Daily Average Traded Amount at the Santiago Stock Exchange YTD as of September 2010 | |
| US $ Thousand | |
| LAN | 18,701 |
| SQM | 18,205 |
| CENCOSUD | 13,666 |
| ENDESA | 11,850 |
| ENERSIS | 10,170 |
Pg.4
![]()
Source: Bloomberg
RISKRATINGCLASSIFICATIONINFORMATION
Enersis' credit ratings have been upgraded in the first quarter of 2010, due to Company's improvements in the liquidity position and reduction of leverage. The positive perspectives on operational and credit profile of Enersis have been reflected in the upgrades received by Fitch Ratings, Standard & Poors and Feller Rate.
Current ratings are further supported by our well diversified asset portfolio, strong credit metrics, adequate debt structure and solid liquidity. Enersis' geographic diversification through Latin America provides us a natural hedge against different regulations and weather conditions. Most of our operating subsidiaries are financially strong and have leading market positions in the countries where they operate.
On September 29, 2010, Moody's placed the Baa3 senior unsecured rating of Enersis under review for possible upgrade.
Enersis' current risk classifications are:
International Ratings:
| Enersis | S&P | Moody's | Fitch |
| Corporate | BBB+, Stable | Baa3, (+) Revision | BBB+, Stable |
Domestic Ratings (for securities issued in Chile):
| Enersis | Feller Rate | Fitch |
| Shares | 1stClass Level 1 | 1stClass Level 1 |
| Bonds | AA, Stable | AA, Stable |
Pg.5
![]()
TABLE OF CONTENTS
| Summary | 1 | |
| Distribution Business | 2 | |
| Generation and Transmission Business | 3 | |
| Financial Summary | 4 | |
| Market Summary | 4 | |
| Risk Rating Classification Information | 5 | |
| TABLE OF CONTENTS | 6 | |
| GENERAL INFORMATION | 8 | |
| SIMPLIFIEDORGANIZATIONALSTRUCTURE | 9 | |
| MARKET INFORMATION | 10 | |
| EQUITYMARKET | 10 | |
| DEBTMARKET | 13 | |
| CONSOLIDATEDINCOMESTATEMENTANALYSIS | 14 | |
| NETINCOME | 14 | |
| OPERATINGINCOME | 14 | |
| NETFINANCIALINCOME | 16 | |
| TAXES | 16 | |
| CONSOLIDATEDBALANCESHEETANALYSIS | 17 | |
| ASSETSUNDERIFRS | 17 | |
| BOOK VALUE AND ECONOMIC VALUE OF ASSETS | 19 | |
| LIABILITIES ANDSHAREHOLDERS' EQUITYUNDERIFRS | 20 | |
| DEBTMATURITY WITHTHIRDPARTIES, THOUSANDUS$ | 21 | |
| (*) INCLUDES: ENDESACHILE, PANGUE, PEHUENCHE, SANISIDRO, CELTA ANDTÚNEL EL MELÓN | 21 | |
| DEBTMATURITY WITHTHIRDPARTIES, MILLIONCH$ | 22 | |
| (*) INCLUDES: ENDESACHILE, PANGUE, PEHUENCHE, SANISIDRO, CELTA ANDTÚNELELMELÓN | 22 | |
| EVOLUTIONOFKEYFINANCIALRATIOS | 22 | |
| CONSOLIDATED STATEMENTS OF CASH FLOWS ANALYSIS | 24 | |
| UNDERIFRS | 24 | |
| CASHFLOWRECEIVEDFROMFOREIGNSUBSIDIARIES BYENERSIS, CHILECTRA ANDENDESACHILE | 25 | |
| CAPEX ANDDEPRECIATION | 25 | |
| THE PRINCIPAL RISKS ASSOCIATED TO THE ACTIVITIES OF THE ENERSIS GROUP | 26 | |
| ARGENTINA | 30 | |
| GENERATION | 30 | |
| Endesa Costanera | 30 | |
| El Chocón | 30 | |
| DISTRIBUTION | 31 | |
| Edesur | 31 | |
| BRAZIL | 32 | |
| ENDESABRASIL | 32 | |
| GENERATION | 32 | |
| Cachoeira | 32 | |
| Fortaleza (cgtf) | 33 | |
| TRANSMISSION | 33 | |
Pg.6
![]()
| CIEN | 33 | |
| DISTRIBUTION | 33 | |
| Ampla | 33 | |
| Coelce | 34 | |
| CHILE | 35 | |
| GENERATION | 35 | |
| Endesa Chile | 35 | |
| DISTRIBUTION | 36 | |
| Chilectra | 36 | |
| COLOMBIA | 37 | |
| GENERATION | 37 | |
| Emgesa | 37 | |
| DISTRIBUTION | 38 | |
| Codensa | 38 | |
| PERU | 39 | |
| GENERATION | 39 | |
| Edegel | 39 | |
| DISTRIBUTION | 39 | |
| Edelnor | 39 | |
| CONFERENCE CALL INVITATION | 42 | |
| CONTACTINFORMATION | 43 | |
| DISCLAIMER | 43 |
Pg.7
![]()
GENERAL INFORMATION
(Santiago, Chile, Wednesday 27th, October 2010) Enersis S.A. (NYSE: ENI), announced today its consolidated financial results for the period ended September 30, 2010. All figures are in Chilean pesos (Ch$) under International Financial Reporting Standards (IFRS). Variations refer to the period ended between September 30, 2009 and September 30, 2010.
Figures as of September 30, 2010 are additionally translated into US$, merely as a convenience translation, using the exchange rate of US$ 1 = Ch$ 483.65 as of September 30, 2010 for the Balance Sheet, and the average exchange rate for the period of US$ 1 = Ch$ 520.16 for the Income Statement, Cash Flow Statements, Capex and Depreciation values.
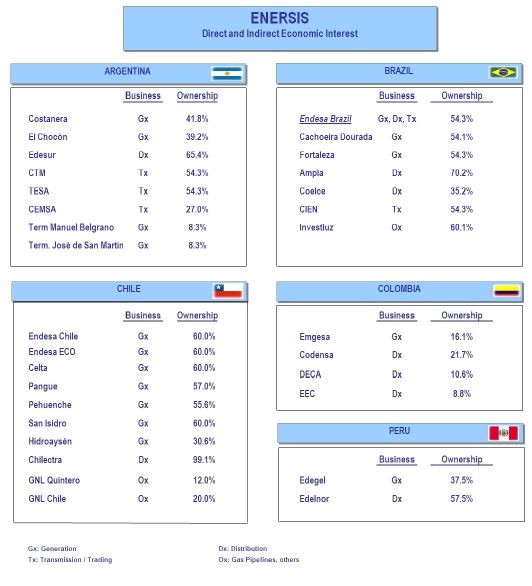
The consolidation includes the following investment vehicles and companies,
a) In Chile: Endesa Chile (NYSE: EOC)*, Chilectra, Synapsis, CAM, and Inmobiliaria Manso de Velasco.
b) Outside Chile: Distrilima (Peru), Endesa Brasil (Brazil)**, Edesur (Argentina) and Codensa (Colombia).
In the following pages you will find a detailed financial statement analysis, a brief explanation for the most important variations and comments on main items in the P&L and Cash Flow Statements compared to the information as of September 30, 2009.
* Includes Endesa Chile Chilean subsidiaries (Celta, Pangue, Pehuenche, San Isidro, and Túnel El Melón), non Chilean subsidiaries (Costanera, El Chocón, Edegel and Emgesa) and jointly controlled companies (Gas Atacama, Transquillota and HidroAysén).
** Includes Endesa Fortaleza, CIEN, Cachoeira Dourada, Ampla and Coelce.
Pg.8
![]()
SIMPLIFIEDORGANIZATIONALSTRUCTURE
Pg.9
![]()
MARKET INFORMATION
EQUITYMARKET
New York Stock Exchange (NYSE)
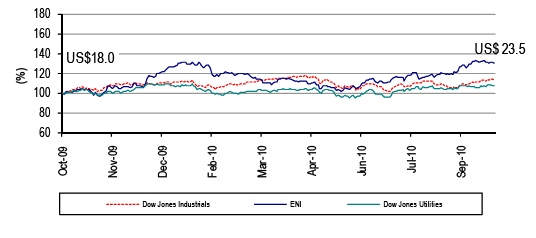
The chart below shows the performance of Enersis' ADR ("ENI") price at the NYSE, compared to the Dow Jones Industrials and the Dow Jones Utilities indexes over the last 12 months:
Return for the period: 30.5%
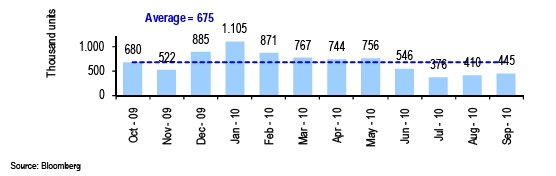
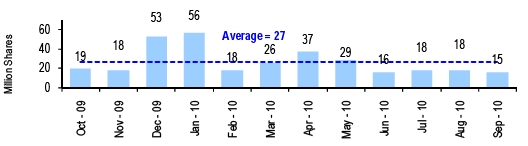
Daily Average Transactions Volume
(1 ADR = 50 Chilean shares)
Pg.10
![]()
Santiago Stock Exchange (BCS)
The chart below shows the performance of Enersis' Chilean stock price over the last 12 months compared to the Chilean Selective Stock Index (IPSA):
Return for the period: 15.1%
![]()
Daily Average Transactions Volume
Santiago Stock Exchange and Chilean Electronic Exchange
Source: Bloomberg
Pg.11
![]()
Madrid Stock Exchange (Latibex) - Spain
The chart below shows Enersis' share price ("XENI") at the Latibex over the last 12 months compared to the Local Stock Index (IBEX):
Return for the period: 39.5%
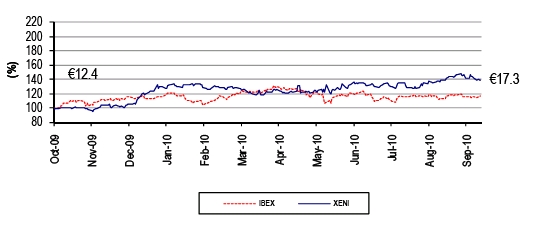
Daily Average Transactions Volume
(1 unit = 50 Chilean shares)
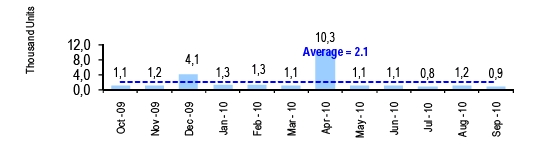
Source: Bloomberg
Pg.12
![]()
DEBTMARKET
Yankee Bonds Price Evolution
The following chart shows the pricing of two of our Yankee Bonds over the last 12 months compared to the Ishares Iboxx Investment Grade Corporate Bond Fund Index:
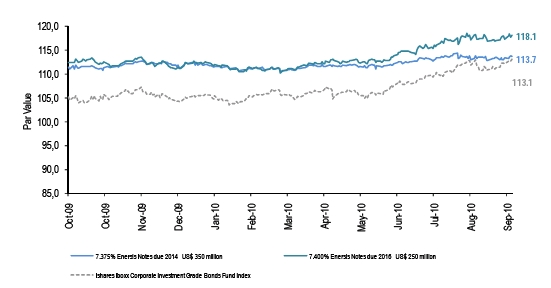
Source: Bloomberg
(*) IShares Iboxx Corporate Investment Grade Bonds Fund is an exchange traded fund incorporated in the U.S.A. The Index measures the performance of a fixed number of investment grade corporate bonds.
Pg.13
![]()
CONSOLIDATED INCOME STATEMENT ANALYSIS
NETINCOME
Enersis' Net Income attributable to the Owners of the Company for the nine-months period 2010 was Ch$ 342,141 million, representing a 36.0% decrease over the same last year's period, which was Ch$ 534,776 million.
| Under IFRS | ||||||
| Table 1 | ||||||
| CONSOLIDATED INCOME STATEMENT | (Million Ch$) | (Thousand US$) | ||||
| 3Q09 | 3Q10 | Var 3Q09-3Q10 | Chg % | 3Q10 | ||
| Sales | 4,644,696 | 4,610,359 | (34,338) | (0.7%) | 8,863,348 | |
| Energy sales | 4,231,970 | 4,234,951 | 2,980 | 0.1% | 8,141,631 | |
| Other sales | 38,680 | 34,862 | (3,817) | (9.9%) | 67,022 | |
| Other services | 374,047 | 340,546 | (33,500) | (9.0%) | 654,695 | |
| Other operating income | 255,631 | 220,013 | (35,618) | (13.9%) | 422,972 | |
| Revenues | 4,900,328 | 4,830,372 | (69,956) | (1.4%) | 9,286,320 | |
| Power purchased | (1,223,870) | (1,140,692) | 83,178 | 6.8% | (2,192,964) | |
| Cost of fuel consumed | (503,315) | (572,987) | (69,672) | (13.8%) | (1,101,560) | |
| Transportation expenses | (205,803) | (324,905) | (119,102) | (57.9%) | (624,625) | |
| Other variable procurements and services | (518,080) | (526,839) | (8,759) | (1.7%) | (1,012,840) | |
| Procurements and Services | (2,451,068) | (2,565,424) | (114,356) | (4.7%) | (4,931,989) | |
| Contribution Margin | 2,449,260 | 2,264,948 | (184,312) | (7.5%) | 4,354,330 | |
| Work on non-current assets | 20,705 | 30,864 | 10,158 | 49.1% | 59,335 | |
| Employee expenses | (265,111) | (267,176) | (2,065) | (0.8%) | (513,643) | |
| Other fixed operating expenses | (323,109) | (351,283) | (28,174) | (8.7%) | (675,336) | |
| Gross Operating Income (EBITDA) | 1,881,745 | 1,677,353 | (204,393) | (10.9%) | 3,224,686 | |
| Depreciation and amortization | (331,288) | (355,185) | (23,897) | (7.2%) | (682,838) | |
| Impairment losses (Reversals) | (27,818) | (32,617) | (4,799) | (17.3%) | (62,705) | |
| Operating Income | 1,522,639 | 1,289,551 | (233,088) | (15.3%) | 2,479,143 | |
| Net Financial Income | (212,945) | (229,117) | (16,172) | (7.6%) | (440,474) | |
| Financial income | 127,828 | 101,475 | (26,353) | (20.6%) | 195,084 | |
| Financial expenses | (343,080) | (327,496) | 15,584 | 4.5% | (629,606) | |
| Income (Loss) for indexed assets and liabilities | 25,918 | (12,414) | (38,332) | (147.9%) | (23,866) | |
| Foreign currency exchange differences, net | (23,611) | 9,319 | 32,929 | 139.5% | 17,915 | |
| Gains | 47,409 | 60,649 | 13,240 | 27.9% | 116,598 | |
| Losses | (71,020) | (51,331) | 19,689 | 27.7% | (98,683) | |
| Net Income From Related Comp. Cons. by the Prop. Eq. Method | 2,261 | 1,348 | (913) | (40.4%) | 2,592 | |
| Net Income From Other Investments | 1,548 | 139 | (1,410) | (91.0%) | 266 | |
| Net Income From Sales of Assets | 728 | 3,044 | 2,315 | 318.0% | 5,851 | |
| Net Income Before Taxes | 1,314,232 | 1,064,965 | (249,267) | (19.0%) | 2,047,379 | |
| Income Tax | (272,335) | (283,192) | (10,857) | (4.0%) | (544,432) | |
| NET INCOME ATTRIBUTABLE TO: | 1,041,897 | 781,773 | (260,124) | (25.0%) | 1,502,947 | |
| Shareholders of the Company | 534,776 | 342,141 | (192,635) | (36.0%) | 657,761 | |
| Minority Interest | 507,122 | 439,632 | (67,489) | (13.3%) | 845,186 | |
| Earning per share (Ch$ /share and US$ / ADR) | 16.4 | 10.5 | (5.9) | (36.0%) | 1.0 | |
OPERATINGINCOME
Operating Income for the nine-months period of 2010 decreased by Ch$ 233,088 million, from Ch$ 1,522,639 million to Ch$ 1,289,551 million, representing a decrease of 15.3%; the above is mainly due to the decrease in results from our generation subsidiaries in Chile and Brazil, which was partially offset by better results from our distribution subsidiaries in Brazil.
Operating Revenues and Costs, broken down by business line for the nine-month period ending on September 30, 2009 and 2010 are:
Pg.14
![]()
| Table 2 | ||||||||||||||||
| Generation and Transmission | Distribution | |||||||||||||||
| Operating Income by | ||||||||||||||||
| Businesses | Million Ch$ | Chg% | Th. US$ | Million Ch$ | Chg% | Th. US$ | ||||||||||
| 3Q09 | 3Q10 | 3Q10 | 3Q09 | 3Q10 | 3Q10 | |||||||||||
| Operating Revenues | 2,102,436 | 2,076,441 | (1.2%) | 3,991,928 | 3,147,335 | 3,184,955 | 1.2% | 6,123,030 | ||||||||
| Operating Costs | (1,143,243) | (1,330,803) | 16.4% | (2,558,449) | (2,583,464) | (2,627,975) | 1.7% | (5,052,243) | ||||||||
| Operating Income | 959,193 | 745,638 | (22.3%) | 1,433,479 | 563,871 | 556,981 | (1.2%) | 1,070,787 | ||||||||
| Eliminations and Others | Consolidated | |||||||||||||||
| Operating Income by | ||||||||||||||||
| Businesses | Million Ch$ | Chg% | Th. US$ | Million Ch$ | Chg% | Th. US$ | ||||||||||
| 3Q09 | 3Q10 | 3Q10 | 3Q09 | 3Q10 | 3Q10 | |||||||||||
| Operating Revenues | (349,443) | (431,024) | 23.3% | (828,638) | 4,900,328 | 4,830,372 | (1.4%) | 9,286,320 | ||||||||
| Operating Costs | 349,018 | 417,956 | 19.8% | 803,515 | (3,377,688) | (3,540,821) | 4.8% | (6,807,176) | ||||||||
| Operating Income | (425) | (13,068) | 2974.8% | (25,123) | 1,522,639 | 1,289,551 | (15.3%) | 2,479,143 | ||||||||
Generation and Transmission Businessesreached an Operating Income of Ch$ 745,638 million, representing a Ch$ 213,555 million drop from the same period last year or the equivalent to a 22.3% decrease. Physical sales decreased 5.0% amounting to 47,313 GWh for the first nine-month period 2010 (49,786 GWh for the same period in 2009).
Operating income for Generation and Transmission business line, detailed by country in the following table:
| Table 3 | ||||||||||||||||||||||||
| Chile | Argentina | Brazil | ||||||||||||||||||||||
| Generation & Transmission | Million Ch$ | Chg% | Th. US$ | Million Ch$ | Chg% | Th. US$ | Million Ch$ | Chg% | Th. US$ | |||||||||||||||
| 3Q09 | 3Q10 | 3Q10 | 3Q09 | 3Q10 | 3Q10 | 3Q09 | 3Q10 | 3Q10 | ||||||||||||||||
| Operating Revenues | 1,070,213 | 984,721 | (8.0%) | 1,893,112 | 254,365 | 302,320 | 18.9% | 581,206 | 243,897 | 238,660 | (2.1%) | 458,820 | ||||||||||||
| % of consolidated | 51% | 47% | 47% | 12% | 15% | 15% | 12% | 11% | 11% | |||||||||||||||
| Operating Costs | (537,634) | (634,822) | 18.1% | (1,220,435) | (218,584) | (264,808) | 21.1% | (509,089) | (111,540) | (128,428) | 15.1% | (246,901) | ||||||||||||
| % of consolidated | 47% | 48% | 48% | 19% | 20% | 20% | 10% | 10% | 10% | |||||||||||||||
| Operating Income | 532,578 | 349,900 | (34.3%) | 672,677 | 35,781 | 37,513 | 4.8% | 72,118 | 132,357 | 110,232 | (16.7%) | 211,919 | ||||||||||||
| Peru | Colombia | Consolidated | ||||||||||||||||||||||
| Generation & Transmission | Million Ch$ | Chg% | Th. US$ | Million Ch$ | Chg% | Th. US$ | Million Ch$ | Chg% | Th. US$ | |||||||||||||||
| 3Q09 | 3Q10 | 3Q10 | 3Q09 | 3Q10 | 3Q10 | 3Q09 | 3Q10 | 3Q10 | ||||||||||||||||
| Operating Revenues | 159,865 | 161,205 | 0.8% | 309,913 | 374,771 | 390,201 | 4.1% | 750,155 | 2,102,436 | 2,076,441 | (1.2%) | 3,991,928 | ||||||||||||
| % of consolidated | 8% | 8% | 8% | 18% | 19% | 19% | 100% | 100% | ||||||||||||||||
| Operating Costs | (100,598) | (106,219) | 5.6% | (204,204) | (175,561) | (197,192) | 12.3% | (379,099) | (1,143,243) | (1,330,803) | 16.4% | (2,558,449) | ||||||||||||
| % of consolidated | 9% | 8% | 8% | 15% | 15% | 15% | 100% | 100% | ||||||||||||||||
| Operating Income | 59,267 | 54,986 | (7.2%) | 105,709 | 199,210 | 193,008 | (3.1%) | 371,056 | 959,193 | 745,638 | (22.3%) | 1,433,479 | ||||||||||||
Distribution businessdecreased its operating income by Ch$ 6,891 million, equivalent to 1.2% and totaling Ch$ 556,981 million.
Physical sales amounted to 50,063 GWh, representing an increase of 2,736 GWh, equivalent to 5.8% variation. Our customers increased by 380 thousand, amounting 13,184 thousand customers.
Operating income for Distribution line of business, detailed by country, as follows:
| Table 4 | ||||||||||||||||||||||||
| Chile | Argentina | Brazil | ||||||||||||||||||||||
| Distribution | Million Ch$ | Chg% | Th. US$ | Million Ch$ | Chg% | Th. US$ | Million Ch$ | Chg% | Th. US$ | |||||||||||||||
| 3Q09 | 3Q10 | 3Q10 | 3Q09 | 3Q10 | 3Q10 | 3Q09 | 3Q10 | 3Q10 | ||||||||||||||||
| Operating Revenues | 849,645 | 723,062 | (14.9%) | 1,390,076 | 254,069 | 222,307 | (12.5%) | 427,382 | 1,265,227 | 1,416,243 | 11.9% | 2,722,706 | ||||||||||||
| % of consolidated | 40% | 35% | 35% | 12% | 11% | 11% | 60% | 68% | 68% | |||||||||||||||
| Operating Costs | (738,497) | (641,481) | (13.1%) | (1,233,238) | (222,796) | (209,263) | (6.1%) | (402,305) | (1,050,052) | (1,157,562) | 10.2% | (2,225,396) | ||||||||||||
| % of consolidated | 65% | 48% | 48% | 19% | 16% | 16% | 92% | 87% | 87% | |||||||||||||||
| Operating Income | 111,148 | 81,581 | (26.6%) | 156,838 | 31,273 | 13,044 | (58.3%) | 25,078 | 215,176 | 258,681 | 20.2% | 497,310 | ||||||||||||
| Peru | Colombia | Consolidated | ||||||||||||||||||||||
| Distribution | Million Ch$ | Chg% | Th. US$ | Million Ch$ | Chg% | Th. US$ | Million Ch$ | Chg% | Th. US$ | |||||||||||||||
| 3Q09 | 3Q10 | 3Q10 | 3Q09 | 3Q10 | 3Q10 | 3Q09 | 3Q10 | 3Q10 | ||||||||||||||||
| Operating Revenues | 228,052 | 230,578 | 1.1% | 443,283 | 550,342 | 592,765 | 7.7% | 1,139,582 | 3,147,335 | 3,184,955 | 1.2% | 6,123,030 | ||||||||||||
| % of consolidated | 11% | 11% | 11% | 26% | 29% | 29% | 150% | 151% | ||||||||||||||||
| Operating Costs | (179,747) | (181,160) | 0.8% | (348,278) | (392,373) | (438,508) | 11.8% | (843,025) | (2,583,464) | (2,627,975) | 1.7% | (5,052,243) | ||||||||||||
| % of consolidated | 16% | 14% | 14% | 34% | 33% | 33% | 226% | 230% | ||||||||||||||||
| Operating Income | 48,305 | 49,418 | 2.3% | 95,005 | 157,969 | 154,257 | (2.3%) | 296,557 | 563,871 | 556,981 | (1.2%) | 1,070,787 | ||||||||||||
Pg.15
![]()
NETFINANCIALINCOME
The Company's net financial income as of September 30, 2010 was negative Ch$ 229,117 million, representing a decrease of 7.6% over the same period last year. The latter is mainly explained by a lower Financial Income by Ch$ 26.353 million related to a diminishing in the amount of cash deposits during the period, as well as higher financial costs of Ch$ 38,332 million due to the change on the Inflation Index Unit UF (Unidades de Fomento) over Chile's UF denominated debt. During the present period, the UF increased 1.9% compared to a decrease of 2.9% experienced during equal period last year.
The above mentioned negative effects were partially offset with lower financial expenses of Ch$ 15,584 million due to a lower average debt stock and also due to a positive variation of foreign currency exchange differences by Ch$ 32,929 million, mainly linked to the operations of Chile, Argentina and Brazil.
TAXES
Income Tax increased by Ch$ 10,857 million during the first nine-month period of 2010. The latter is mostly explained by increases in: Enersis Ch$ 35,357 million, Endesa Chile Ch$ 12,234 million, Chilectra Ch$ 2,314 million mainly by effects of dollar exchange over income tax, besides El Chocón by Ch$ 4,768 million and Codensa for Ch$ 7,834 million. The latter was partially offset by lower income taxes in Gas Atacama Ch$ 16,102 million, Cien Ch$ 15,933 million, Edesur Ch$ 6,485 million, Ampla Ch$ 5,391 million, Coelce Ch$ 4,611 million and Pangue by Ch$ 4,007 million.
Pg.16
![]()
CONSOLIDATED BALANCE SHEET ANALYSIS
ASSETSUNDERIFRS
| Table 5 | ||||||||||
| ASSETS | (Million Ch$) | (Thousand US$) | ||||||||
| FY2009 | 3Q10 | Var FY2009-3Q10 | Chg % | 3Q10 | ||||||
| CURRENT ASSETS | ||||||||||
| Cash and cash equivalents | 1,134,901 | 753,705 | (381,196) | (33.6%) | 1,558,368 | |||||
| Other current financial assets | 1,536 | 1,829 | 293 | 19.1% | 3,781 | |||||
| Other current non-financial assets | 38,502 | 33,156 | (5,346) | (13.9%) | 68,554 | |||||
| Trade accounts receivable and other receivables | 1,138,647 | 1,267,427 | 128,780 | 11.3% | 2,620,545 | |||||
| Accounts receivable from related companies | 19,014 | 20,506 | 1,491 | 7.8% | 42,397 | |||||
| Inventories | 56,319 | 63,211 | 6,891 | 12.2% | 130,695 | |||||
| Current tax receivable | 112,176 | 138,675 | 26,500 | 23.6% | 286,727 | |||||
| Non-current assets (or disposal groups) classified as held for sale | 70,361 | 91,732 | 21,372 | 30.4% | 189,667 | |||||
| Total Current Assets | 2,571,456 | 2,370,240 | (201,216) | (7.8%) | 4,900,734 | |||||
| Other non-current financial assets | 30,497 | 50,970 | 20,474 | 67.1% | 105,387 | |||||
| Other non-current non-financial assets | 94,255 | 124,158 | 29,903 | 31.7% | 256,711 | |||||
| Trade accounts receivables and other receivables, net | 194,977 | 216,524 | 21,547 | 11.1% | 447,688 | |||||
| Investments in associates accounted for using the equity method | 21,281 | 10,470 | (10,812) | (50.8%) | 21,648 | |||||
| Intangibles assets apart from increased value | 1,446,122 | 1,443,830 | (2,292) | (0.2%) | 2,985,279 | |||||
| Increased value | 1,501,352 | 1,492,110 | (9,241) | (0.6%) | 3,085,104 | |||||
| Property, plant and equipment, net | 6,864,071 | 6,915,827 | 51,756 | 0.8% | 14,299,240 | |||||
| Investment properties | 31,232 | 30,754 | (477) | (1.5%) | 63,588 | |||||
| Deferred tax assets | 454,897 | 440,741 | (14,156) | (3.1%) | 911,281 | |||||
| Total Non-Current Assets | 10,638,685 | 10,725,386 | 86,701 | 0.8% | 22,175,924 | |||||
| TOTAL ASSETS | 13,210,140 | 13,095,626 | (114,515) | (0.9%) | 27,076,658 | |||||
Total Assetsdecreased Ch$ 114,515 million, mainly due to:
- Ch$ 201,216 million decrease in Current Assets, equal to 7.8%, as a result of:
- Ch$ 381,196 million decrease in cash and cash equivalent, primarily explained by decreases in term deposits at Endesa Chile for Ch$ 208,475 million used to pay debt and dividends, Emgesa for Ch$ 132,374 million due to a capital reduction, Cien for Ch$ 85,033 million used to pay debt, Ampla for Ch$ 70,583 million used to pay debt and Codensa for Ch$ 57,821 million used to pay dividends. This decrease in cash and cash equivalent was partially offset by increases in term deposits at Chilectra for Ch$ 57,038 million, Coelce for Ch$ 45,524 million, Cachoeira Dourada for Ch$ 28,093 million and Edesur for Ch$ 14,329 million.
- Increase in Trade accounts receivable and other receivables for Ch$ 128,780 million, primarily due to an increase in trade account receivable at Cien in Ch$ 67,791 million, Endesa Chile in Ch$ 29,637 million, El Chocón in Ch$ 24,218 million, Chilectra in Ch$ 15,794 million, Codensa in Ch$ 13,024 million, Emgesa in Ch$ 11,338 million, CGTF in Ch$ 6,516 million and Cachoeira Dourada in Ch$ 3,950 million. This effect was partially compensated by decreases in Ampla by Ch$ 20,105 million, Costanera in Ch$ 14,891 million, Coelce in Ch$ 10,315 million and in Pehuenche in Ch$ 3,576 million.
- Increase in Current tax receivable by Ch$ 26,500 million, which mainly corresponds to a higher Value Added Tax ("IVA") receivable and increases in payments with charge to income taxes at Endesa Chile for Ch$ 23,384 million and Ampla for Ch$ 4,330 million.
- Increase in available-for-sale non-current assets by Ch$ 21,372 million, basically related to a reclassification of Synapsis' assets.
The above is partially offset by:
Increase in Non-Current Assets in Ch$ 86,701 million equal to 0.8%, mainly due to:
Pg.17
![]()
Increase in Property, plant and equipment, net by Ch$ 51,756 million due to conversion effect toChilean pesos from subsidiaries statements, in approximately Ch$ 115,405 million, additions forthe period in approximately Ch$ 210,999 million, partially compensated by depreciation duringthe period for Ch$ 275,647 million.
Increase in Non-current receivables by Ch$ 21,547 million mainly due to increases at Ampla, forCh$ 18,371 million, Coelce for Ch$ 10,522 million and Endesa Chile for Ch$ 4,489 million. Thelatter was partially offset due to a decrease in Edesur for Ch$ 4,814 million, Chilectra by Ch$3,086 million and CGTF for Ch$ 2,523 million.
Increase in Other non-current financial assets by Ch$ 20,474 million mainly explained byEndesa Chile's derivatives effects by Ch$ 12,536 million, Coelce by Ch$ 4,411 million related topension funds surplus and Enersis by Ch$ 3,561 million.
Decrease in Investments in associates accounted for using the equity method by Ch$ 10,812million, which is mainly explained by the equity variation in GNL Quintero due to negative effectof themark-to-marketvariation of the Swap derivative.
Pg.18
![]()
BOOKVALUE ANDECONOMICVALUE OFASSETS
Regarding the more important assets, the following should be mentioned:
Properties, Plants and Equipment are valued at their purchase cost, net of the corresponding accumulated depreciation and impairment loss they have been subject to. Properties, Plants and Equipment, net of their residual value, if applicable, are linearly by distributing the cost of their different elements along the estimated years of useful life, which is the period that the companies expect to use them. The useful life is reviewed regularly.
The capital gain (lower investments or goodwill value) generated by consolidation represents the acquisition cost surplus on the Group's share in terms of the reasonable value of assets and liabilities, including the identifiable contingent liabilities of a Subsidiary at the time of acquisition.
Capital gain is not amortized. Instead, at the closing of each accounting period an assessment is made of whether any impairment has occurred during the period that could reduce its recoverable value to an amount below the registered net cost, proceeding in this event to make a timely impairment adjustment (See Note 3.e to the Consolidated Financial Statements).
Throughout the fiscal year and in particular at the date of closing, an assessment is made as to any indication of possible loss due to the impairment of any asset. In the event of any such indication, an estimate of the recoverable sum of said asset is made to determine, if applicable, the depreciated amount. If this involves identifiable assets that do not originate independent cash flows, the recoverability of the Cash Generating Unit that the asset belongs to is estimated, understanding as such the smaller Group of identifiable assets that generate independent cash incomes.
Assets expressed in foreign currency are submitted at the prevalent exchange rate at the closing of the period.
Notes and accounts receivable from related companies are classified according to their short and long term maturities. These operations are adjusted according to prevalent market equity conditions.
In summary, assets are valued according to the International Financial Reporting Standards, whose criteria are expressed in Note 3 of the Consolidated Financial Statements.
Pg.19
![]()
LIABILITIES ANDSHAREHOLDERS' EQUITYUNDERIFRS
| Table 6 | ||||||||||
| LIABILITIES AND SHAREHOLDERS' EQUITY | (Million Ch$) | (Thousand US$) | ||||||||
| FY2009 | 3Q10 | Var FY2009-3Q10 | Chg % | 3Q10 | ||||||
| CURRENT LIABILITIES | ||||||||||
| Other current financial liabilities | 732,428 | 693,259 | (39,169) | (5.3%) | 1,433,390 | |||||
| Trade accounts payable and other payables | 976,506 | 1,012,949 | 36,443 | 3.7% | 2,094,384 | |||||
| Accounts payable to related companies | 111,956 | 90,546 | (21,410) | (19.1%) | 187,213 | |||||
| Provisions | 100,024 | 93,580 | (6,444) | (6.4%) | 193,487 | |||||
| Current tax payable | 185,286 | 116,971 | (68,314) | (36.9%) | 241,851 | |||||
| Current post-employment benefit obligations | 4,915 | 6,422 | 1,507 | 30.7% | 13,279 | |||||
| Other current non-financial liabilities | 33,622 | 35,372 | 1,751 | 5.2% | 73,136 | |||||
| Liabilities (or disposal groups) classified as held for sale | 50,650 | 52,185 | 1,534 | 3.0% | 107,898 | |||||
| Total Current Liabilities | 2,195,388 | 2,101,285 | (94,103) | (4.3%) | 4,344,639 | |||||
| NON-CURRENT LIABILITIES | ||||||||||
| Other non-current financial liabilities | 3,543,626 | 3,259,556 | (284,070) | (8.0%) | 6,739,493 | |||||
| Non-current liabilities | 58,728 | 78,411 | 19,683 | 33.5% | 162,123 | |||||
| Accounts payable to related companies | 3,557 | 2,263 | (1,294) | (36.4%) | 4,678 | |||||
| Provisions | 250,287 | 237,506 | (12,781) | (5.1%) | 491,070 | |||||
| Deferred tax liabilities | 573,049 | 568,801 | (4,248) | (0.7%) | 1,176,060 | |||||
| Non-current post-employment benefit obligations | 182,689 | 189,660 | 6,971 | 3.8% | 392,143 | |||||
| Other non-current non-financial liabilities | 25,814 | 27,053 | 1,239 | 4.8% | 55,936 | |||||
| Total Non-Current Liabilities | 4,637,749 | 4,363,250 | (274,499) | (5.9%) | 9,021,503 | |||||
| SHAREHOLDERS' EQUITY | ||||||||||
| Issued share capital | 2,824,883 | 2,824,883 | - | 0.0% | 5,840,758 | |||||
| Retained earnings (losses) | 1,817,613 | 2,023,338 | 205,725 | 11.3% | 4,183,476 | |||||
| Additional paid-in capital | 158,760 | 158,760 | - | 0.0% | 328,253 | |||||
| Other equity changes | - | - | - | - | ||||||
| Reserves | (1,282,776) | (1,307,986) | (25,210) | (2.0%) | (2,704,406) | |||||
| - | ||||||||||
| Equity Attributable to Shareholders of the Company | 3,518,480 | 3,698,995 | 180,515 | 5.1% | 7,648,082 | |||||
| Equity Attributable to Minority Interest | 2,858,524 | 2,932,096 | 73,572 | 2.6% | 6,062,434 | |||||
| Total Shareholders' Equity | 6,377,004 | 6,631,091 | 254,087 | 4.0% | 13,710,516 | |||||
| TOTAL LIABILITIES AND SHAREHOLDERS' EQUITY | 13,210,140 | 13,095,626 | (114,515) | (0.9%) | 27,076,658 | |||||
The company's Total Liabilities and Shareholder´s Equity decreased by Ch$ 114,515 million from the period ended on December 31st, 2009, largely due to the decrease in non-current liabilities in Ch$ 274,499 million, current liabilities by Ch$ 94,103 million, both which were partially compensated by an increase in Shareholders' equity by Ch$ 254,087 million. The detail is explained as follows:
- Non-Current Liabilities decreased by Ch$ 274,499 million, equal to 5.9%, mainly due to:
- Other non-current financial liabilities (financial debt and derivatives) diminished by Ch$ 284,070 million, mainly due to decreases in Endesa Chile by Ch$ 120,937 million related to a loan payment, Ampla by Ch$ 104,073 million, due to a loan and bond payment plus conversion effect. Coelce decreased by Ch$ 41,434 million, mainly because of a reclassification from the long term to the short term and foreign currency exchange effect, Cien by Ch$ 31,162 million, due to loan payment and conversion effect, Edegel by Ch$ 13,041 million, because of a reclassification from the long term to the short term and bond coupon payment and Edesur by Ch$ 10,018 million due to bond payment and short term reclassification. This decrease was partially compensated by increases in Emgesa by Ch$ 35,304 million and Codensa by Ch$ 31,197 million, both due conversion effect. Increase in Enersis can be explained by hedge derivatives effects by Ch$ 15,331 million.
- Decrease in Current Liabilities of Ch$ 94,103 million, a 4.3% drop, due to:
- Decrease in Current tax payable for Ch$ 68,314 million which mainly corresponds to Endesa Chile by Ch$ 34,519 million, Emgesa by Ch$ 32,397 million, Pangue by Ch$ 8,354 million, Edegel by Ch$ 7,732 million and Codensa by Ch$ 4,177 million due to tax payments. The latter was partially compensated for increases in CGTF by Ch$ 10,757 million and Coelce by Ch$ 10,002 million.
- Decrease in Other current liabilities (financial debt and derivatives) for Ch$ 39,169 million, mainly in Endesa Chile for Ch$ 132,281 million and GasAtacama for Ch$ 6,547 million, both due to loans payments. This was partially offset by Ampla, subsidiary that increased its currentliabilities by Ch$ 33,318 million, mainly explained by new loan facilities and reclassificationsfrom the long term. The same reasons apply to Chocón and Costanera, for Ch$ 19,435 millionand Ch$ 14,883 million respectively.
- Decrease in accounts payable to related companies by Ch$ 21,410 million which mainlycorresponds to dividend payments to Endesa Latinoamerica and lower payable accounts toCemsa in Ch$ 17,962 million.
- The above was in part compensated by an increase in current accounts payable and othercommercial liabilities by Ch$ 36,443 million, related to Cien by Ch$ 57,256 million, Coelce byCh$ 30,227 million, Edesur and Chilectra by Ch$ 27,954 million and Ch$ 11,971 millionrespectively. This effect was softened due to decreases in Endesa Chile by Ch$ 65,344 million,Endesa Eco by $ 12,496 million, Costanera by Ch$13,434 million and Pehuenche by Ch$ 2,061million.
Pg.20
![]()
Total Shareholders' equity increased by Ch$ 254,087 million when compared to December 2009. The Total shareholders' equity attributable to the Owners of the Company increased in Ch$ 180,515 million which is explained mainly by the effect of the net income for the period.
The minorities participation increased in Ch$ 73,572 million, as a consequence of the net effects in the results, the conversion net effects, minimum dividends, reserves and derivatives hedge.
DEBTMATURITY WITHTHIRDPARTIES, MILLIONUS$
| Table 7 | ||||||||||||||||
| (Million US$) | 2010 | 2011 | 2012 | 2013 | 2014 | 2015 | Balance | TOTAL | ||||||||
| Chile | 37.4 | 83.7 | 49.0 | 425.8 | 741.5 | 226.7 | 1,596.0 | 3,160.1 | ||||||||
| Enersis | 2.1 | 4.3 | 4.6 | 4.9 | 562.8 | 5.4 | 459.7 | 1,043.8 | ||||||||
| Chilectra | 0.0 | - | - | - | - | - | - | 0.0 | ||||||||
| Endesa Chile (*) | 35.2 | 79.3 | 44.4 | 421.0 | 178.6 | 221.3 | 1,136.3 | 2,116.2 | ||||||||
| Argentina | 62.1 | 152.6 | 66.3 | 25.4 | 43.0 | 13.5 | - | 362.8 | ||||||||
| Edesur | 11.1 | 32.6 | 28.2 | 0.7 | 0.5 | - | - | 73.1 | ||||||||
| Costanera | 35.2 | 56.6 | 26.0 | 24.7 | 42.5 | 13.5 | - | 198.4 | ||||||||
| Chocón | 15.5 | 63.4 | 12.1 | - | - | - | - | 91.1 | ||||||||
| Hidroinvest | 0.3 | - | - | - | - | - | - | 0.3 | ||||||||
| CTM | - | - | - | - | - | - | - | - | ||||||||
| TESA | - | - | - | - | - | - | - | - | ||||||||
| Peru | 32.5 | 97.6 | 132.2 | 143.9 | 101.8 | 80.8 | 210.3 | 799.1 | ||||||||
| Edelnor | 0.9 | 38.5 | 62.2 | 94.3 | 53.4 | 48.4 | 52.1 | 349.8 | ||||||||
| Edegel | 31.7 | 59.1 | 70.0 | 49.5 | 48.4 | 32.4 | 158.2 | 449.3 | ||||||||
| Brazil | 221.0 | 522.1 | 558.3 | 216.4 | 140.8 | 49.5 | 46.6 | 1,754.7 | ||||||||
| Endesa Brasil | 114.2 | - | - | - | - | - | - | 114.2 | ||||||||
| Coelce | 18.5 | 143.5 | 123.6 | 103.0 | 96.8 | 4.5 | 21.5 | 511.5 | ||||||||
| Ampla | 21.9 | 245.3 | 303.1 | 100.2 | 29.8 | 28.7 | 5.2 | 734.3 | ||||||||
| Cachoeira | - | - | - | - | - | - | - | - | ||||||||
| Cien | 60.9 | 121.6 | 119.2 | - | - | - | - | 301.7 | ||||||||
| Fortaleza | 5.4 | 11.7 | 12.3 | 13.2 | 14.2 | 16.3 | 19.9 | 93.0 | ||||||||
| Colombia | 149.3 | 244.1 | 188.0 | 133.7 | 217.3 | 138.7 | 726.8 | 1,797.9 | ||||||||
| Codensa | 60.5 | 111.0 | 18.7 | 133.7 | 138.7 | - | 342.1 | 804.7 | ||||||||
| Emgesa | 88.8 | 133.2 | 169.2 | - | 78.6 | 138.7 | 384.7 | 993.2 | ||||||||
| TOTAL | 502.3 | 1,100.1 | 993.7 | 945.2 | 1,244.4 | 509.3 | 2,579.7 | 7,874.7 | ||||||||
| (*) Includes: Endesa Chile, Pangue, Pehuenche, San Isidro, Celta and Túnel el melón | ||||||||||||||||
Pg.21
![]()
DEBTMATURITY WITHTHIRDPARTIES, MILLIONCH$
| Table 7.1 | ||||||||||||||||
| (Million Ch$) | 2010 | 2011 | 2012 | 2013 | 2014 | 2015 | Balance | TOTAL | ||||||||
| Chile | 18,072 | 40,472 | 23,701 | 205,958 | 358,619 | 109,648 | 771,912 | 1,528,381 | ||||||||
| Enersis | 1,025 | 2,098 | 2,219 | 2,347 | 272,219 | 2,624 | 222,324 | 504,857 | ||||||||
| Chilectra | 17 | - | - | - | - | - | - | 17 | ||||||||
| Endesa Chile (*) | 17,029 | 38,374 | 21,481 | 203,611 | 86,400 | 107,023 | 549,588 | 1,023,507 | ||||||||
| Argentina | 30,032 | 73,790 | 32,054 | 12,270 | 20,795 | 6,535 | - | 175,477 | ||||||||
| Edesur | 5,358 | 15,774 | 13,640 | 347 | 254 | - | - | 35,372 | ||||||||
| Costanera | 17,028 | 27,353 | 12,552 | 11,923 | 20,541 | 6,535 | - | 95,933 | ||||||||
| Chocón | 7,514 | 30,663 | 5,862 | - | - | - | - | 44,039 | ||||||||
| Hidroinvest | 133 | - | - | - | - | - | - | 133 | ||||||||
| CTM | - | - | - | - | - | - | - | - | ||||||||
| TESA | - | - | - | - | - | - | - | - | ||||||||
| Peru | 15,741 | 47,203 | 63,941 | 69,592 | 49,234 | 39,093 | 101,696 | 386,502 | ||||||||
| Edelnor | 415 | 18,621 | 30,103 | 45,632 | 25,810 | 23,408 | 25,193 | 169,183 | ||||||||
| Edegel | 15,326 | 28,581 | 33,838 | 23,960 | 23,425 | 15,686 | 76,503 | 217,319 | ||||||||
| Brazil | 106,898 | 252,521 | 270,009 | 104,652 | 68,107 | 23,940 | 22,536 | 848,662 | ||||||||
| Endesa Brasil | 55,255 | - | - | - | - | - | - | 55,255 | ||||||||
| Coelce | 8,954 | 69,426 | 59,787 | 49,818 | 46,826 | 2,161 | 10,395 | 247,368 | ||||||||
| Ampla | 10,614 | 118,640 | 146,609 | 48,446 | 14,430 | 13,897 | 2,528 | 355,164 | ||||||||
| Cachoeira | - | - | - | - | - | - | - | - | ||||||||
| Cien | 29,442 | 58,797 | 57,656 | - | - | - | - | 145,896 | ||||||||
| Fortaleza | 2,634 | 5,658 | 5,956 | 6,388 | 6,851 | 7,881 | 9,613 | 44,980 | ||||||||
| Colombia | 72,191 | 118,081 | 90,904 | 64,676 | 105,108 | 67,092 | 351,517 | 869,569 | ||||||||
| Codensa | 29,252 | 53,673 | 9,049 | 64,676 | 67,092 | - | 165,448 | 389,190 | ||||||||
| Emgesa | 42,939 | 64,408 | 81,854 | - | 38,017 | 67,092 | 186,069 | 480,378 | ||||||||
| TOTAL | 242,934 | 532,068 | 480,608 | 457,148 | 601,864 | 246,308 | 1,247,662 | 3,808,591 | ||||||||
| (*) Includes: Endesa Chile, Pangue, Pehuenche, San Isidro, Celta and Túnel El Melón | ||||||||||||||||
EVOLUTIONOFKEYFINANCIALRATIOS
| Table 8 | ||||||||||
| Indicator | Unit | FY2009 | 3Q10 | Var FY2009-3Q10 | Chg % | |||||
| Liquidity | Times | 1.17 | 1.13 | (0.04) | (3.4%) | |||||
| Acid ratio test * | Times | 1.15 | 1.10 | (0.05) | (4.3%) | |||||
| Working capital | Million Ch$ | 376,068 | 268,955 | (107,113) | (28.5%) | |||||
| Working capital | Thousand US$ | 777,563 | 556,095 | (221,468) | (28.5%) | |||||
| Leverage ** | Times | 1.07 | 0.97 | (0.10) | (9.3%) | |||||
| Short-term debt | % | 32.0 | 33.0 | 1.00 | 3.1% | |||||
| Long-term debt | % | 68.0 | 67.0 | (1.00) | (1.5%) | |||||
| * (Current assets net of inventories and prepaid expenses) / Current liabilities ** Total debt / (equity + minority interest) | ||||||||||
| Table 8.1 | ||||||||||
| Indicator | Unit | 3Q09 | 3Q10 | Var 3Q09-3Q10 | Chg % | |||||
| Financial expenses coverage * | Times | 5.52 | 5.07 | (0.45) | (8.1%) | |||||
| Op. income / Op. rev. | % | 31.07 | 26.70 | (4.38) | (14.1%) | |||||
| ROE ** | % | 20.43 | 12.96 | (7.47) | (36.6%) | |||||
| ROA ** | % | 9.82 | 7.72 | (2.10) | (21.4%) | |||||
| * EBITDA / Financial costs ** Annualized figures | ||||||||||
Liquidity, a key consideration in our financial management, continues to be in a very solid position. As of September, 2010, liquidity reached 1.13 times, decreasing 0.04 times, equivalent to a 3.4% when compared to December 2009. Enersis has a sound financial profile and ample access to credit markets. In fact, the Company has been serving its debt maturities with own generated resources, with an appropriate maturity schedule.
The company has credit lines with financial institutions, as described below:
Uncommitted credit lines for US$ 527 million available for Enersis and Endesa Chile.
Committed long term credit lines by US$ 962 million available for Enersis and Endesa Chile, ofwhich US$ 450 million are due in the short term.
Pg.22
![]()
Cash and cash equivalents amounted to US$ 1,558 million on a consolidated basis.
Leverage ratio was 0.97, showing a decrease of 9.3% as of December, 2009.
Financial Expenses Coverage reached 5.07 times, a decrease of 0.45 times or 8.1% drop from the ratio registered on equal period the precedent year. This is mainly the result of the EBITDA decrease during this year and also due to the increase in financial costs.
Operating Income over Operating Revenues profitability decreased 14.1%, reaching a 26.70% as of September, 2010.
The annual ROE of the Parent Company reached 13.0%, a decrease of 36.6% from the registered as of December 2009. This decrease is derived from the lower results for the period.
Annual ROA reached 7.7% in September 2010, a decrease of 2 pp. from the registered as of December 2009, reflecting the decrease in the present period's results plus the increase in Total Assets.
Pg.23
![]()
CONSOLIDATEDSTATEMENTS OFCASHFLOWSANALYSIS
UNDERIFRS
| Table 9 | ||||||
| CASH FLOW | (Million Ch$) | (Thousand US$) | ||||
| 3Q09 | 3Q10 | Var 3Q09-3Q10 | Chg % | 3Q10 | ||
| Net Income | 1,041,897 | 781,773 | (260,124) | (25.0%) | 1,502,947 | |
| Adjustments to Reconcile to Operating Income | ||||||
| Taxes Payable | 272,335 | 283,192 | 10,857 | 4.0% | 544,432 | |
| Decrease (increse) in inventories | (6,054) | 13,709 | 19,763 | 326.5% | 26,356 | |
| Decrease (increase) in trade accounts receivable | (2,841) | (184,575) | (181,734) | (6396.5%) | (354,842) | |
| Decrease (increase) in other operating accounts receivable | (127,828) | (101,475) | 26,353 | 20.6% | (195,084) | |
| Decrease (increase) in trade accounts payable | (200,355) | (6,585) | 193,770 | 96.7% | (12,659) | |
| Decrease (increase) in other operating accounts payable | 317,162 | 339,910 | 22,748 | 7.2% | 653,472 | |
| Depreciation and amortization | 331,288 | 355,185 | 23,897 | 7.2% | 682,838 | |
| (Reversal of) Impairment losses | 27,818 | 32,617 | 4,799 | 17.3% | 62,705 | |
| Provisions | 16,841 | (10,822) | (27,663) | (164.3%) | (20,805) | |
| Unrealized foreign currency exchange differences | 23,611 | (9,319) | (32,929) | (139.5%) | (17,915) | |
| Non-distributed gains from associates | (2,261) | (1,348) | 913 | 40.4% | (2,592) | |
| Minority interest | - | - | - | - | ||
| Other non-cash | 54,565 | (13,744) | (68,310) | (125.2%) | (26,423) | |
| Total adjustments to Reconcile to Operating Income | 704,282 | 696,746 | (7,536) | (1.1%) | 1,339,484 | |
| Dividends paid | - | - | - | - | ||
| Dividends received | - | - | - | - | ||
| Payments of interest classified as operating | - | - | - | - | ||
| Proceeds of interest received classified as operating | - | - | - | - | ||
| Income tax proceeds (payments) | (341,758) | (341,634) | 124 | 0.0% | (656,787) | |
| Other operating proceeds (disbursements) | (2,266) | (1,139) | 1,127 | 49.7% | (2,190) | |
| NET CASH FLOWS PROVIDED BY OPERATING ACTIVITIES | 1,402,155 | 1,135,745 | (266,410) | (19.0%) | 2,183,454 | |
| Net Cash Flows provided by (used in) Investing Activities | ||||||
| Acquisitions of associates | (19,912) | - | 19,912 | (100.0%) | - | |
| Loans to related companies | (6,285) | - | 6,285 | (100.0%) | - | |
| Proceeds from sales of property, plant and equipment | 13,918 | 4,129 | (9,790) | (70.3%) | 7,938 | |
| Purchase of property, plant and equipment | (363,053) | (302,451) | 60,602 | 16.7% | (581,458) | |
| Proceeds from sales of intangible assets | 756 | 1,414 | 658 | 87.0% | 2,718 | |
| Acquisitions of intangible assets | (136,949) | (124,451) | 12,498 | 9.1% | (239,256) | |
| Acquisitions of other long-term assets | (92) | - | 92 | (100.0%) | - | |
| Proceeds from prepayments reimbursed and third party loans | - | - | - | - | ||
| Prepayments and third party loans | - | - | - | - | ||
| Proceeds from dividends | 2,672 | 2,545 | (127) | (4.8%) | 4,892 | |
| Proceeds from interest received | 3,865 | 5,871 | 2,007 | 51.9% | 11,288 | |
| Other investment proceeds (disbursements) | (8,383) | (7,244) | 1,139 | 13.6% | (13,927) | |
| NET CASH FLOWS PROVIDED BY (USED IN) INVESTING ACTIVITIES | (513,464) | (420,188) | 93,275 | 18.2% | (807,806) | |
| Cash Flows provided by (used in) Financing Activities | ||||||
| Long-term loans obtained | 674,642 | 202,432 | (472,210) | (70.0%) | 389,172 | |
| Proceeds from loans from related companies | - | - | - | - | ||
| Payments of loans | (990,432) | (535,706) | 454,726 | 45.9% | (1,029,887) | |
| Repayments of liabilities for financial leases | (2,928) | (20,834) | (17,906) | (611.6%) | (40,053) | |
| Payments on loans from related companies | (1,475) | - | 1,475 | (100.0%) | - | |
| Dividends paid | (344,419) | (455,921) | (111,502) | (32.4%) | (876,501) | |
| Payments of interest | (189,971) | (197,875) | (7,904) | (4.2%) | (380,413) | |
| Other financing proceeds (payments) | (5,764) | (95,220) | (89,457) | (1552.1%) | (183,060) | |
| NET CASH FLOWS PROVIDED BY (USED IN) FINANCING ACTIVITIES | (860,348) | (1,103,125) | (242,777) | (28.2%) | (2,120,741) | |
| NET INCREASE (DECREASE) IN CASH AND CASH EQUIVALENTS BEFORE EFFECTS OF FOREIGN EXCHANGE RATE VARIATIONS | 28,344 | (387,568) | (415,911) | (1467.4%) | (745,093) | |
| Effects of foreign exchange rate variations on cash and cash equivalents | (16,743) | 6,371 | 23,115 | 138.1% | 12,249 | |
| Net Increase (Decrease) in Cash and Cash Equivalents | 11,600 | (381,196) | (392,797) | (3386.1%) | (732,844) | |
| Beginning balance of cash and cash equivalents | 1,318,062 | 1,134,901 | (183,161) | (13.9%) | 2,181,830 | |
| Ending Balance of Cash and Cash Equivalents | 1,329,662 | 753,705 | (575,958) | (43.3%) | 1,448,986 | |
Pg.24
![]()
The company generated a negative cash flow of Ch$ 387,568 million for the period, which can be broken down as follows:
Operating activities generated a positive net cash flow of Ch$ 1,135,745 million that represents a decrease of 19.0% regarding last year's first nine-month period. This cash flow is composed primarily with net income of the period for Ch$ 781,773 million, which is adjusted to operating income in Ch$ 353,972 million. This adjustment includes fixed asset amortization, depreciation and impairments for Ch$ 387,801 million, interest for Ch$ 327,495 million, taxes for Ch$ 283,192 million, partially compensated by the tax payments of Ch$ 341,634 million.
Investment activities generated a net negative cash flow of Ch$ 420,188 million, which compared with the same period of the preceding year represented an 18.2% increase. This flow corresponds primarily to the incorporation of fixed assets for Ch$ 302,451 million and intangible assets purchases (IFRIC 12) by Ch$ 124,451 million.
Financing activities originated a negative cash flow of Ch$ 1,103,125 million, due to payments of loans for Ch$ 535,706 million, dividends paid for Ch$ 455,921 million, interests paid for Ch$ 197,875 million and other financial payments for Ch$ 95,220 million. The aforementioned was partially compensated for loans obtained for Ch$ 202.432 million.
CASHFLOWRECEIVEDFROMFOREIGNSUBSIDIARIES BYENERSIS, CHILECTRA ANDENDESACHILE
| Table 10 | ||||||||||
| Cash Flow (Thousand US$) | Interest Received | Dividends Received | Capital Reductions | Others | Total Cash Received | |||||
| 3Q09 | 3Q10 | 3Q09 | 3Q10 | 3Q09 | 3Q10 | 3Q09 | 3Q10 | 3Q09 | 3Q10 | |
| Argentina | 1,080.1 | 1,481.6 | 8,140.1 | 8,663.3 | - | - | - | - | 9,220.2 | 10,144.9 |
| Peru | - | - | 22,977.9 | 46,892.5 | - | - | - | - | 22,977.9 | 46,892.5 |
| Brazil | 11,864.0 | - | 30,618.6 | 178,619.5 | - | - | - | - | 42,482.5 | 178,619.5 |
| Colombia | - | - | 62,703.4 | 141,036.6 | - | 59,462.9 | - | - | 62,703.4 | 200,499.5 |
| Total | 12,944.1 | 1,481.6 | 124,440.0 | 375,211.8 | - | 59,462.9 | - | - | 137,384.1 | 436,156.4 |
| Source: Internal Financial Report | ||||||||||
CAPEX ANDDEPRECIATION
| Table 11 | ||||||||||||
| Payments for Additions of Fixed Assets | Depreciation | |||||||||||
| Million Ch$ | Thousand US$ | Million Ch$ | Thousand US$ | |||||||||
| 3Q09 | 3Q10 | 3Q10 | 3Q09 | 3Q10 | 3Q10 | |||||||
| Endesa Chile | 234,599 | 174,729 | 335,914 | 144,052 | 148,127 | 284,772 | ||||||
| Cachoeira | 814 | 4,701 | 9,038 | 5,086 | 5,501 | 10,576 | ||||||
| Endesa Fortaleza | - | 1,870 | 3,595 | 5,627 | 6,007 | 11,548 | ||||||
| Cien | - | 1,884 | 3,622 | 12,985 | 23,587 | 45,346 | ||||||
| Chilectra S.A. | 16,571 | 23,091 | 44,392 | 14,886 | 15,824 | 30,421 | ||||||
| Edesur | 41,229 | 34,787 | 66,877 | 12,251 | 10,572 | 20,325 | ||||||
| Edelnor | 26,194 | 15,435 | 29,674 | 14,888 | 15,383 | 29,574 | ||||||
| Ampla (*) | 71,493 | 71,820 | 138,073 | 37,539 | 40,179 | 77,244 | ||||||
| Coelce (*) | 60,900 | 53,535 | 102,920 | 31,017 | 28,385 | 54,570 | ||||||
| Codensa | 38,314 | 38,305 | 73,641 | 40,441 | 44,082 | 84,747 | ||||||
| Cam Ltda. | 2,019 | 702 | 1,350 | 1,349 | 1,316 | 2,530 | ||||||
| Inmobiliaria Manso de Velasco Ltda. | 675 | 521 | 1,002 | 184 | 214 | 411 | ||||||
| Synapsis | 2,108 | 2,237 | 4,301 | 1,911 | 2,343 | 4,504 | ||||||
| Enersis holding and investment companies | 529 | 174 | 335 | 853 | 575 | 1,105 | ||||||
| Total | 495,445 | 423,791 | 814,732 | 323,069 | 342,095 | 657,673 | ||||||
| (*) Includes concessions intangible assets. | ||||||||||||
Pg.25
![]()
THEPRINCIPALRISKS ASSOCIATED TO THE ACTIVITIES OF THEENERSISGROUP
Commercial and Regulatory Risk
The Group's activities are subject to a broad range of governmental standards and environmental regulations. Any modification of such standards and regulations may affect the Group's activities, economic situation and operating results.
The Group's distribution activity is subject to a wide range of rules regarding tariffs and other issues that govern their activities in each of the countries where it operates and which could modify distribution subsidiaries operating results.
The Group's generation activity is subject to existing hydrological and weather conditions in the geographic zones in which the Group's hydroelectric generating plants are located. Commercial policies have been planned in order to moderate the possible impact of changes in these variables.
Group's activities are subject a wide of environmental regulation that Enersis fulfills constantly. Modifications applied on such regulations may affect the operations, economic condition or the results of these operations.
Enersis and its operating subsidiaries are subject to environmental regulations which, among other things, require the company to conduct environmental impact studies for future projects, obtaining permits, licenses and other authorizations and the fulfillment of all requirements of those licenses, permits and norms. As any other regulated company, Enersis cannot guarantee:
The approval from regulators of environmental impact studies.
That public opposition may not cause delays or modifications to any proposed project and
That laws or regulations may not change or be interpreted in a manner that could adverselyaffect the operations or the plans for companies in which Enersis or its subsidiaries holdinvestments.
Interest Rate Risk
Interest rate variations modify the fair value of those assets and liabilities that accrue a fixed interest rate, as well as the future flows of assets and liabilities pegged to a variable interest rate.
In compliance with our current interest rate hedging policy, the portion of fixed and/or hedged debt to the total net debt was 46% as of September 30, 2010 on a consolidated basis.
Depending on the Group's estimates and debt structure objectives, hedging transactions take place contracting derivatives that mitigate these risks.
Exchange Rate Risk
The exchange rate risks are mainly related to the following transactions:
Foreign currency debts contracted by Group's companies.
Payments to be made on international markets for the acquisition of projects related materials.
Group companies' incomes directly linked to the evolution of the dollar, and
Incoming cash flows from our subsidiaries abroad exposed to exchange rate fluctuations.
Pg.26
![]()
In order to mitigate exchange rate risks, Enersis' exchange rate hedging policy is based on cash flows and it strives to maintain a balance between dollar indexed flows and the asset and liability levels in such currency. Currency swaps and exchange rate forwards are the instruments currently used in compliance with this policy. Likewise, the policy strives to refinance debts in each company's functional currency.
Commodities Risk
Enersis is exposed to the price fluctuation risk on some commodities, basically through fuel purchases for the electricity generation and also energy transactions (buying and/or selling) in the local markets.
In order to reduce risks in extreme drought conditions, the company has designed a trading policy that defines sales commitment levels consistent with its generating plants' firm energy in a dry year, including risk mitigation clauses in some unregulated clients' contracts.
Liquidity Risk
In engaging committed long term credit facilities and short term financial investments the Group maintains a consistent liquidity policy, for the amounts required to support projected needs for the period, contingent with the situation and the expectations in the debt and capital markets.
As of September 30, 2010, the Enersis Group held liquidity in the amount of Ch$ 753,704,597 thousand in cash and cash equivalent and Ch$ 247,527,000 thousand in committed long term credit lines. As of December 31st, 2009, the Enersis Group held liquidity in the amount of Ch$ 1,134,900,821 thousand in cash and cash equivalent and Ch$ 253,550,000 thousand in committed long term credit lines.
Credit Risk
Credit risk in accounts receivable, originating from trading activities, has been historically very limited given that the short term collection conditions with customers doesn't allow them to individually accumulate significant amounts. Additionally, in the case of the so-called "unregulated clients" of our electricity generation and distribution business, a formal procedure is applied to control the credit risk, using a systematic evaluation of our counterparties, index definition and credit risk factors by virtue of which the contracts are approved or additional guarantee requirements are defined.
Furthermore, in our electricity generating business line, in the event of non-payment, some countries allow power supply cut-offs, and in almost all contracts a lack of payment is established as cause for contract termination. For this purpose, credit risks are constantly monitored and the maximum amounts exposed to payment risks are measured, which are limited.
In turn, in our electricity distribution business line, the energy supply cut-off is a power held by our companies in case of default by our customers, applied in accordance with the applicable regulation in each country, enabling the credit risk evaluation and control process, which is also limited.
Surplus cash flow investments are placed in prime national and foreign financial entities (with an investment grade equivalent risk rating) with limits set for each entity.
In the selection of banks for investment, are considered those that hold two investment grade classifications, according to the three main international risk agencies (Moody's, S&P and Fitch Ratings).
Positions are backed up by treasury bonds from the country of operations and instruments issued by the most reputable banks, favoring, wherever possible, the first ones.
Pg.27
![]()
Derivatives are engaged with highly solvent entities; about 90% of operations are conducted with entities that hold an A or higher rating.
Risk Measurement
The Enersis Group measures the Value at Risk (VaR) of its debt and financial derivatives positions in order to guarantee that the risk taken by the company remains consistent with the risk exposure defined by Management, thus restricting the volatility of its financial results.
The positions portfolio used in the calculations of the current Value at Risk is comprised of debt and financial derivatives.
The calculated Value at Risk represents the possible value loss of the aforementioned positions portfolio over one day time horizon with 95% of confidence.
The volatility of the risk variables that affect the value of the positions portfolio has been studied, including:
The U.S. dollar Libor interest rate.
The usual banking local indexes for debts, taking into account the different currencies ourcompanies operate under, and
The exchange rates of the different currencies involved in the calculation.
The calculation of VaR is based on generating possible future scenarios (at one day) of market values (both spot and term) for the risk variables, using Monte Carlo simulations. The number of scenarios generated ensures compliance with the simulation convergence criteria. A matrix of volatilities and correlations between the various risk variables calculated based on the historical values of the logarithmic price return, has been applied to simulate the future price scenario.
Once the price scenarios have been obtained, the fair value of the portfolio is calculated using such scenarios, obtaining a distribution of possible values at one day. The one-day 95% confidence VaR number is calculated as the 5% percentile of the potential increases in the fair value of the portfolio in one day.
The various debt positions and financial derivatives included in the calculation have been valued consistently using the financial capital calculation methodology reported to Management.
Other Risks
A portion of Enersis and Endesa Chile's debt is subject to cross default provisions. If certain defaults in debt of certain specific subsidiaries are not remedied within specified grace periods, a cross default could affect Endesa Chile and Enersis, and under certain scenarios, debts at the holding company level could be accelerated.
Nonpayment after any applicable grace period of the debts of Enersis and Endesa Chile, or their so-called Relevant Subsidiaries, with an individual principal amount outstanding in excess of US$ 50 million dollars (or its equivalent in other currencies), and with a missed payment also in excess of US$ 50 million dollars, could give rise to a cross default of several bank revolving debt facilities at the Endesa Chile and Enersis levels. Furthermore, some of these debt facilities are also subject to cross acceleration provisions in the event of a default in other Relevant Subsidiary debt, for reasons other than payment default, for events such as bankruptcy, insolvency proceedings, and materially adverse governmental or legal actions, in all cases for amounts in excess of US$ 50 million dollars.
Pg.28
![]()
Similarly, nonpayment after any given applicable grace period - of the debts of these companies or any of their Chilean subsidiaries, in single indebtedness in default with a principal in excess of US$ 30 million dollars, could potentially give rise to a cross default of Enersis and Endesa Chile Yankee bonds.
There are no clauses in the credit agreements by which changes in the corporate or debt classification of these companies from risk classification agencies could trigger prepayments. Nevertheless, a modification in the Standard & Poor's (S&P) debt risk classification in foreign currency could trigger a change in the margin applicable to determine the interest rate, in the credit loans executed in 2004 and 2006, and in local credit lines executed in 2009.
Pg.29
![]()

ARGENTINA
GENERATION
ENDESACOSTANERA
The operating income of Costanera reached Ch$ 7,713 million as of September 2010, increasing by 74.4% compared to September 30, 2009. This result is mainly explained by an increase in sales by Ch$ 51,028 million, explained by a 41% increase in the company's average energy sale prices, partially offset by a decrease in physical sales by 11.7%.
The increase in procurement and services costs of Ch$ 51,751 million more than compensated the larger revenue, mainly due to a 34.1% increase in fuel costs.
Argentine peso depreciation relative to the Chilean peso generated a negative conversion effect of 13.7%.
| Table 12 | ||||||
| Endesa Costanera | Million Ch$ | Thousand US$ | ||||
| 3Q09 | 3Q10 | Var 3Q09-3Q10 | Chg% | 3Q10 | ||
| Operating Revenues | 201,586 | 252,614 | 51,028 | 25.3% | 485,647 | |
| Procurement and Services | (169,174) | (220,925) | (51,751) | (30.6%) | (424,725) | |
| Contribution Margin | 32,412 | 31,689 | (723) | (2.2%) | 60,922 | |
| Other Costs | (13,513) | (12,596) | 916 | 6.8% | (24,216) | |
| Gross Operating Income (EBITDA) | 18,899 | 19,093 | 194 | 1.0% | 36,706 | |
| Depreciation and Amortization | (14,477) | (11,380) | 3,098 | 21.4% | (21,877) | |
| Operating Income | 4,422 | 7,713 | 3,291 | 74.4% | 14,829 | |
| Figures may differ from those accounted under Argentine GAAP. | ||||||
| Table 12.1 | ||||||
| Endesa Costanera | 3Q09 | 3Q10 | Var 3Q09-3Q10 | Chg% | ||
| GWh Produced | 6,715 | 5,910 | (805) | (12.0%) | ||
| GWh Sold | 6,745 | 5,957 | (788) | (11.7%) | ||
| Market Share | 8.6% | 7.2% | (1.4) pp. | |||
ELCHOCÓN
Operating income was reduced by 4.1% explained by Ch$ 2,429 million of lower revenues, partially compensated by the reduction of Ch$ 886 million in procurement and services costs.
El Chocón showed a generation level 8.9% below the year before due to reduced hydroelectric availability as a result of the reservoir-operation controls limiting levels per basin.
Argentine peso depreciation relative to the Chilean peso generated a negative conversion effect of 13.7%.
| Table 13 | ||||||
| El Chocón | Million Ch$ | Thousand US$ | ||||
| 3Q09 | 3Q10 | Var 3Q09-3Q10 | Chg% | 3Q10 | ||
| Operating Revenues | 47,810 | 45,381 | (2,429) | (5.1%) | 87,245 | |
| Procurement and Services | (13,726) | (12,840) | 886 | 6.5% | (24,684) | |
| Contribution Margin | 34,084 | 32,541 | (1,543) | (4.5%) | 62,560 | |
| Other Costs | (3,810) | (3,642) | 169 | 4.4% | (7,001) | |
| Gross Operating Income (EBITDA) | 30,274 | 28,900 | (1,374) | (4.5%) | 55,559 | |
| Depreciation and Amortization | (2,604) | (2,357) | 247 | 9.5% | (4,532) | |
| Operating Income | 27,670 | 26,543 | (1,127) | (4.1%) | 51,028 | |
| Figures may differ from those accounted under Argentine GAAP. | ||||||
Pg.30
![]()
| Table 13.1 | ||||||||
| El Chocón | 3Q09 | 3Q10 | Var 3Q09-3Q10 | Chg% | ||||
| GWh Produced | 2,628 | 2,395 | (233) | (8.9%) | ||||
| GWh Sold | 2,904 | 2,646 | (257) | (8.9%) | ||||
| Market Share | 3.7% | 3.2% | (0.5) pp. |
DISTRIBUTION
EDESUR
Operating income decreased 58.3% to Ch$ 13,044 million mainly due to an increase in variable costs, mainly fines related to failures in quality service, salary increases and a poorer sales mix and the recognition, in 2009, of a General Agreement with the Provincial Government related to energy consumption for impoverished people living in shanty towns, which implied Ch$ 8,285 million. Physical sales rose 4.3% reaching 12,623 GWh. Energy losses reached 10.6% and the customer base increased in 65 thousand clients.
The above mentioned effects were partially offset by a higher energy demand and lower cost of energy purchases.
Argentine peso depreciation relative to the Chilean peso generated a negative conversion effect of 13.7%
| Table 14 | ||||||||||
| Edesur | Million Ch$ | Thousand US$ | ||||||||
| 3Q09 | 3Q10 | Var 3Q09-3Q10 | Chg% | 3Q10 | ||||||
| Operating Revenues | 254,069 | 222,307 | (31,762) | (12.5%) | 427,382 | |||||
| Procurement and Services | (120,257) | (107,637) | 12,620 | 10.5% | (206,931) | |||||
| Contribution Margin | 133,812 | 114,670 | (19,142) | (14.3%) | 220,452 | |||||
| Other Costs | (88,019) | (89,482) | (1,463) | (1.7%) | (172,029) | |||||
| Gross Operating Income (EBITDA) | 45,792 | 25,188 | (20,605) | (45.0%) | 48,423 | |||||
| Depreciation and Amortization | (14,519) | (12,143) | 2,376 | 16.4% | (23,345) | |||||
| Operating Income | 31,273 | 13,044 | (18,229) | (58.3%) | 25,078 | |||||
| Figures may differ from those accounted under Argentine GAAP. | ||||||||||
| Table 14.1 | ||||||||||
| Edesur | 3Q09 | 3Q10 | Var 3Q09-3Q10 | Chg% | ||||||
| Customers (Th) | 2,288 | 2,354 | 65 | 2.8% | ||||||
| GWh Sold | 12,099 | 12,623 | 524 | 4.3% | ||||||
| Clients/ Employee | 862 | 898 | 35 | 4.1% | ||||||
| Energy Losses (%) | 10.5% | 10.6% | 0.1 pp. |
Pg.31
![]()

BRAZIL
ENDESABRASIL
The operating income in Brazil amounted to Ch$ 367,843 million, 6.2% higher than the Ch$ 346,257 million reported to September 30, 2009.
| Table 15 | ||||||
| Endesa Brasil | (Million Ch$) | (Thousand US$) | ||||
| 3Q09 | 3Q10 | Var 3Q09-3Q10 | Chg % | 3Q10 | ||
| Total Revenues | 1,422,538 | 1,562,063 | 139,525 | 9.8% | 3,003,044 | |
| Procurements and Services | (775,158) | (866,676) | (91,519) | (11.8%) | (1,666,173) | |
| Contribution Margin | 647,381 | 695,387 | 48,007 | 7.4% | 1,336,872 | |
| Other Costs | (188,298) | (199,364) | (11,066) | (5.9%) | (383,274) | |
| Gross Operating Income (EBITDA) | 459,083 | 496,023 | 36,941 | 8.0% | 953,598 | |
| Depreciation and Amortization | (112,826) | (128,181) | (15,354) | (13.6%) | (246,425) | |
| Operating Income | 346,257 | 367,843 | 21,586 | 6.2% | 707,172 | |
| Net Financial Income | (31,659) | (69,411) | (37,752) | (119.2%) | (133,442) | |
| Financial income | 78,215 | 73,769 | (4,446) | (5.7%) | 141,820 | |
| Financial expenses | (118,963) | (142,249) | (23,286) | (19.6%) | (273,472) | |
| Income (Loss) for indexed assets and liabilities | - | - | - | - | ||
| Foreign currency exchange differences, net | 9,090 | (931) | (10,021) | (110.2%) | (1,790) | |
| Gains | 25,340 | 27,012 | 1,672 | 6.6% | 51,931 | |
| Losses | (16,251) | (27,944) | (11,693) | (72.0%) | (53,721) | |
| Net Income from Related Comp. Cons. by the Prop. Eq. Method | - | - | - | - | ||
| Net Income from Other Investments | - | - | - | - | ||
| Net Income from Sales of Assets | 94 | 12 | (82) | (87.3%) | 23 | |
| Net Income before Taxes | 314,692 | 298,444 | (16,248) | (5.2%) | 573,754 | |
| Income Tax | (77,044) | (50,843) | 26,202 | 34.0% | (97,745) | |
| NET INCOME | 237,648 | 247,601 | 9,953 | 4.2% | 476,009 | |
| Net Income Attributable to Owners of the Company | 166,029 | 163,584 | (2,444) | (1.5%) | 314,488 | |
| Net Income Attributable to Minority Interest | 71,619 | 84,017 | 12,398 | 17.3% | 161,521 | |
GENERATION
CACHOEIRA
The operating income of our subsidiary Cachoeira Dourada rose by Ch$ 19,299 million, from Ch$ 37,458 million to September 30, 2009 to Ch$ 56.757 million in the current year. The rise described before is the consequence of the 18% increase in prices, measured in local currency. Additionally, physical energy sales grew by 6.4% to 2,947 GWh as of September 30, 2010.
| Table 16 | ||||||
| Cachoeira | Million Ch$ | Thousand US$ | ||||
| 3Q09 | 3Q10 | Var 3Q09-3Q10 | Chg% | 3Q10 | ||
| Operating Revenues | 64,691 | 86,727 | 22,036 | 34.1% | 166,731 | |
| Procurement and Services | (17,263) | (19,598) | (2,336) | (13.5%) | (37,677) | |
| Contribution Margin | 47,429 | 67,129 | 19,700 | 41.5% | 129,054 | |
| Other Costs | (4,859) | (4,848) | 11 | 0.2% | (9,321) | |
| Gross Operating Income (EBITDA) | 42,570 | 62,281 | 19,711 | 46.3% | 119,733 | |
| Depreciation and Amortization | (5,112) | (5,524) | (412) | (8.1%) | (10,619) | |
| Operating Income | 37,458 | 56,757 | 19,299 | 51.5% | 109,114 | |
| Figures may differ from those accounted under Brazilian GAAP. | ||||||
| Table 16.1 | ||||||
| Cachoeira | 3Q09 | 3Q10 | Var 3Q09-3Q10 | Chg% | ||
| GWh Produced | 2,194 | 2,490 | 296 | 13.5% | ||
| GWh Sold | 2,769 | 2,947 | 178 | 6.4% | ||
| Market Share | 1.0% | 1.0% | (0.0) pp. |
Pg.32
![]()
FORTALEZA(CGTF)
The operating income of Endesa Fortaleza (CGTF), as of September 30, 2010, increased by Ch$ 8,975 million, amounting to Ch$ 45,031 million, when compared to the same period of 2009. This increase is mainly due to higher revenues explained by the rise in the average sale price, expressed in local currency, of 6.0% and reduced energy purchases costs. This is partially offset by a rise in the cost of fuel purchases of Ch$ 11,686 million, related to higher generation in the period. Physical sales declined by 119 GWh to reach 2,210 GWh in September 2010.
| Table 17 | ||||||
| Fortaleza | Million Ch$ | Thousand US$ | ||||
| 3Q09 | 3Q10 | Var 3Q09-3Q10 | Chg% | 3Q10 | ||
| Operating Revenues | 100,079 | 109,832 | 9,753 | 9.7% | 211,150 | |
| Procurement and Services | (51,578) | (53,299) | (1,721) | (3.3%) | (102,466) | |
| Contribution Margin | 48,501 | 56,533 | 8,032 | 16.6% | 108,684 | |
| Other Costs | (6,817) | (5,474) | 1,343 | 19.7% | (10,524) | |
| Gross Operating Income (EBITDA) | 41,684 | 51,059 | 9,375 | 22.5% | 98,160 | |
| Depreciation and Amortization | (5,627) | (6,027) | (400) | (7.1%) | (11,588) | |
| Operating Income | 36,057 | 45,031 | 8,975 | 24.9% | 86,572 | |
| Figures may differ from those accounted under Brazilian GAAP. | ||||||
| Table 17.1 | ||||||
| Fortaleza | 3Q09 | 3Q10 | Var 3Q09-3Q10 | Chg% | ||
| GWh Produced | 251 | 1,121 | 871 | 347.6% | ||
| GWh Sold | 2,329 | 2,210 | (119) | (5.1%) | ||
| Market Share | 0.8% | 0.7% | (0.1) pp. |
TRANSMISSION
CIEN
The operating income of CIEN was a positive Ch$ 11,701 million, which represents a fall of Ch$ 50,860 million compared to September 30, 2009. In 2009 the company exported energy to Uruguay and Argentina starting as of February that year, but the present year there have been smaller exports of energy to Argentina.
| Table 18 | ||||||
| Cien | Million Ch$ | Thousand US$ | ||||
| 3Q09 | 3Q10 | Var 3Q09-3Q10 | Chg% | 3Q10 | ||
| Operating Revenues | 84,192 | 46,455 | (37,737) | (44.8%) | 89,309 | |
| Procurement and Services | (1,522) | (496) | 1,026 | 67.4% | (954) | |
| Contribution Margin | 82,670 | 45,959 | (36,711) | (44.4%) | 88,356 | |
| Other Costs | (7,095) | (8,734) | (1,639) | (23.1%) | (16,791) | |
| Gross Operating Income (EBITDA) | 75,575 | 37,225 | (38,350) | (50.7%) | 71,565 | |
| Depreciation and Amortization | (13,014) | (25,525) | (12,510) | (96.1%) | (49,071) | |
| Operating Income | 62,561 | 11,701 | (50,860) | (81.3%) | 22,494 | |
| Figures may differ from those accounted under Brazilian GAAP. | ||||||
DISTRIBUTION
AMPLA
Operating Income amounted Ch$ 114,117 million and almost had no variation when compared to September, 2009. This is explained by higher electricity prices measured in local currency, an increase in tolls revenues and higher sales volume, which increased by 6.0%, reaching 7,309 GWh. The latter was partially offset by increase in node prices for the power purchased and an increase in technical losses.
Pg.33
![]()
All the above mentioned, has been boosted by positive conversion effect due to the appreciation of Brazilian Real relative to the Chilean peso.
| Table 19 | ||||||
| Ampla | Million Ch$ | Thousand US$ | ||||
| 3Q09 | 3Q10 | Var 3Q09-3Q10 | Chg% | 3Q10 | ||
| Operating Revenues | 710,102 | 766,439 | 56,337 | 7.9% | 1,473,469 | |
| Procurement and Services | (457,005) | (490,011) | (33,006) | (7.2%) | (942,039) | |
| Contribution Margin | 253,097 | 276,428 | 23,331 | 9.2% | 531,429 | |
| Other Costs | (100,861) | (100,823) | 39 | 0.0% | (193,830) | |
| Gross Operating Income (EBITDA) | 152,236 | 175,606 | 23,370 | 15.4% | 337,599 | |
| Depreciation and Amortization | (37,539) | (61,489) | (23,950) | (63.8%) | (118,212) | |
| Operating Income | 114,696 | 114,117 | (580) | (0.5%) | 219,388 | |
| Figures may differ from those accounted under Brazilian GAAP. | ||||||
| Table 19.1 | ||||||
| Ampla | 3Q09 | 3Q10 | Var 3Q09-3Q10 | Chg% | ||
| Customers (Th) | 2,511 | 2,554 | 43 | 1.7% | ||
| GWh Sold | 6,895 | 7,309 | 414 | 6.0% | ||
| Clients/Employee | 1,976 | 2,189 | 213 | 10.8% | ||
| Energy Losses % | 20.9% | 21.1% | 0.2 pp. |
COELCE
Operating Income rose by 43.9% to Ch$ 144,678 million, mainly due to a 14.9% increase in energy demand explained by a better economic scenario which boosted energy consumption in all segments; additionally, Coelce registered higher average sales prices due to better sales mix in residential, commercial, industrials and other rural customers and tolls. The latter was partially offset by higher energy losses and cost of energy purchases.
All the above mentioned, has been boosted by positive conversion effect due to Real appreciation relative to the Chilean peso.
| Table 20 | ||||||
| Coelce | Million Ch$ | Thousand US$ | ||||
| 3Q09 | 3Q10 | Var 3Q09-3Q10 | Chg% | 3Q10 | ||
| Operating Revenues | 534,783 | 649,803 | 115,020 | 21.5% | 1,249,238 | |
| Procurement and Services | (339,441) | (401,428) | (61,987) | (18.3%) | (771,740) | |
| Contribution Margin | 195,342 | 248,375 | 53,033 | 27.1% | 477,497 | |
| Other Costs | (63,759) | (74,312) | (10,553) | (16.6%) | (142,864) | |
| Gross Operating Income (EBITDA) | 131,583 | 174,063 | 42,480 | 32.3% | 334,633 | |
| Depreciation and Amortization | (31,017) | (29,385) | 1,632 | 5.3% | (56,492) | |
| Operating Income | 100,566 | 144,678 | 44,112 | 43.9% | 278,141 | |
| Figures may differ from those accounted under Brazilian GAAP. | ||||||
| Table 20.1 | ||||||
| Coelce | 3Q09 | 3Q10 | Var 3Q09-3Q10 | Chg% | ||
| Customers (Th) | 2,934 | 3,059 | 125 | 4.3% | ||
| GWh Sold | 5,706 | 6,555 | 849 | 14.9% | ||
| Clients/Employee | 2,291 | 2,353 | 63 | 2.7% | ||
| Energy Losses % | 11.5% | 11.9% | 0.4 pp. |
Pg.34
![]()

CHILE
GENERATION
ENDESACHILE
Consolidated Income Statement of Endesa Chile
| Table 21 | ||||||
| Endesa Chile | (Million Ch$) | (Thousand US$) | ||||
| 3Q09 | 3Q10 | Var 3Q09-3Q10 | Chg % | 3Q10 | ||
| Total Revenues | 1,879,052 | 1,849,260 | (29,792) | (1.6%) | 3,555,175 | |
| Procurements and Services | (775,722) | (935,999) | (160,277) | (20.7%) | (1,799,444) | |
| Contribution Margin | 1,103,330 | 913,261 | (190,068) | (17.2%) | 1,755,732 | |
| Other Costs | (127,763) | (125,676) | 2,087 | 1.6% | (241,610) | |
| Gross Operating Income (EBITDA) | 975,566 | 787,585 | (187,981) | (19.3%) | 1,514,121 | |
| Depreciation and Amortization | (146,626) | (151,359) | (4,733) | (3.2%) | (290,985) | |
| Operating Income | 828,941 | 636,227 | (192,714) | (23.2%) | 1,223,137 | |
| Net Financial Income | (130,696) | (92,347) | 38,349 | 29.3% | (177,535) | |
| Financial income | 23,664 | 7,705 | (15,958) | (67.4%) | 14,814 | |
| Financial expenses | (141,413) | (108,658) | 32,755 | 23.2% | (208,892) | |
| Income (Loss) for indexed assets and liabilities | 11,363 | (3,086) | (14,449) | (127.2%) | (5,933) | |
| Foreign currency exchange differences, net | (24,310) | 11,691 | 36,001 | 148.1% | 22,476 | |
| Gains | 16,016 | 24,373 | 8,357 | 52.2% | 46,857 | |
| Losses | (40,326) | (12,682) | 27,644 | 68.6% | (24,381) | |
| Net Income from Related Comp. Cons. by the Prop. Eq. Method | 69,495 | 67,543 | (1,952) | (2.8%) | 129,850 | |
| Net Income from Other Investments | (251) | 139 | 389 | 155.3% | 266 | |
| Net Income from Sales of Assets | 34 | 833 | 799 | 2357.3% | 1,602 | |
| Net Income before Taxes | 767,523 | 612,394 | (155,129) | (20.2%) | 1,177,319 | |
| Income Tax | (143,438) | (148,961) | (5,523) | (3.9%) | (286,375) | |
| NET INCOME | 624,085 | 463,434 | (160,651) | (25.7%) | 890,944 | |
| Net Income Attributable to Owners of the Company | 509,184 | 351,525 | (157,659) | (31.0%) | 675,801 | |
| Net Income Attributable to Minority Interest | 114,901 | 111,909 | (2,992) | (2.6%) | 215,144 | |
| *Includes generation subsidiaries in Chile, Argentina, Colombia and Peru. | ||||||
Chilean Operations
The operating income of the Chilean business as of September 30, 2010 was Ch$ 349,900 million, 34.3% below the level for the same period of 2009. Physical sales remained in line, although average prices expressed in pesos fell by approximately 9.3%. This is explained by the fall in sales on the spot market due to reduced hydrology, partially compensated by higher sales to un-regulated and regulated customers which showed a recovery in demand to remain at an aggregate level in line with that at September 30, 2009.
The reduced operating result was also affected by a 20.8% increase in procurement and service costs, mainly explained by larger purchases of energy and an increase in transport costs. This led Chile's EBITDA, or gross operating margin, to reach Ch$ 424,465 million for the nine-month period to September, 2010, compared to Ch$ 604,466 million as of September 30, 2009.
| Table 22 | ||||||
| Chilean Electricity Business | Million Ch$ | Thousand US$ | ||||
| 3Q09 | 3Q10 | Var 3Q09-3Q10 | Chg% | 3Q10 | ||
| Operating Revenues | 1,070,213 | 984,721 | (85,491) | (8.0%) | 1,893,112 | |
| Procurement and Services | (414,345) | (500,645) | (86,300) | (20.8%) | (962,482) | |
| Contribution Margin | 655,868 | 484,076 | (171,792) | (26.2%) | 930,630 | |
| Other Costs | (51,402) | (59,612) | (8,209) | (16.0%) | (114,602) | |
| Gross Operating Income (EBITDA) | 604,466 | 424,465 | (180,001) | (29.8%) | 816,028 | |
| Depreciation and Amortization | (71,887) | (74,565) | (2,678) | (3.7%) | (143,351) | |
| Operating Income | 532,578 | 349,900 | (182,679) | (34.3%) | 672,677 | |
Pg.35
![]()
| Table 22.1 | ||||||||
| Chilean Electricity Business | 3Q09 | 3Q10 | Var 3Q09-3Q10 | Chg% | ||||
| GWh Produced | 16,068 | 15,431 | (637) | (4.0%) | ||||
| GWh Sold | 16,071 | 16,005 | (66) | (0.4%) | ||||
| Market Share | 40.6% | 39.6% | (1.1) pp. |
DISTRIBUTION
CHILECTRA
Operating Income decreased 26.6%, to Ch$ 81,581 million, when compared to the first nine-month period of 2009. This is mainly explained by lower tariffs, higher fixed costs and a slowdown in the activity in other services related to the subsidiary. This was partially compensated by an increase in demand by 3.8%, explained partially by an increase in the customer base.
Energy losses remained stable when compared to the first nine-month period of 2009.
| Table 23 | ||||||
| Chilectra | (Million Ch$) | (Thousand US$) | ||||
| 3Q09 | 3Q10 | Var 3Q09-3Q10 | Chg % | 3Q10 | ||
| Sales | 829,697 | 713,320 | (116,377) | (14.0%) | 1,371,348 | |
| Other operating income | 19,948 | 9,742 | (10,206) | (51.2%) | 18,728 | |
| Total Revenues | 849,645 | 723,062 | (126,583) | (14.9%) | 1,390,076 | |
| Procurements and Services | (657,442) | (555,336) | 102,106 | 15.5% | (1,067,625) | |
| Contribution Margin | 192,203 | 167,726 | (24,477) | (12.7%) | 322,451 | |
| Other Costs | (60,118) | (63,846) | (3,728) | (6.2%) | (122,743) | |
| Gross Operating Income (EBITDA) | 132,085 | 103,880 | (28,205) | (21.4%) | 199,708 | |
| Depreciation and Amortization | (20,937) | (22,299) | (1,363) | (6.5%) | (42,870) | |
| Operating Income | 111,148 | 81,581 | (29,568) | (26.6%) | 156,838 | |
| Net Financial Income | (283) | (531) | (248) | (87.8%) | (1,020) | |
| Financial income | 11,832 | 7,026 | (4,806) | (40.6%) | 13,508 | |
| Financial expenses | (13,695) | (6,245) | 7,450 | 54.4% | (12,006) | |
| Income (Loss) for indexed assets and liabilities | (55) | 9 | 64 | 115.5% | 16 | |
| Foreign currency exchange differences, net | 1,635 | (1,321) | (2,956) | (180.8%) | (2,539) | |
| Gains | 3,080 | 673 | (2,408) | (78.2%) | 1,293 | |
| Losses | (1,445) | (1,993) | (548) | (37.9%) | (3,832) | |
| Net Income from Related Comp. Cons. by the Prop. Eq. Method | 57,873 | 49,934 | (7,939) | (13.7%) | 95,998 | |
| Net Income from Other Investments | 759 | - | (759) | (100.0%) | - | |
| Net Income from Sales of Assets | 4 | (3) | (7) | (185.7%) | (6) | |
| Net Income before Taxes | 169,502 | 130,981 | (38,521) | (22.7%) | 251,809 | |
| Income Tax | (18,923) | (21,237) | (2,314) | (12.2%) | (40,828) | |
| NET INCOME | 150,579 | 109,744 | (40,835) | (27.1%) | 210,981 | |
| Net Income Attributable to Owners of the Company | 148,668 | 109,743 | (38,925) | (26.2%) | 210,980 | |
| Net Income Attributable to Minority Interest | 1,910 | 0 | (1,910) | 1 | ||
| Table 23.1 | ||||||
| Chilectra | 3Q09 | 3Q10 | Var 3Q09-3Q10 | Chg% | ||
| Customers (Th) | 1,563 | 1,606 | 43 | 2.7% | ||
| GWh Sold | 9,390 | 9,749 | 360 | 3.8% | ||
| Clients/ Employee | 2,141 | 2,202 | 61 | 2.9% | ||
| Energy Losses (%) | 6.0% | 6.0% | (0.0) pp. | |||
Pg.36
![]()

COLOMBIA
GENERATION
EMGESA
The operating income of our business in Colombia was Ch$ 193,008 million as of the end of September 2010, 3.1% lower than in the first nine-months of 2009. The main factor was an increase of Ch$ 4,156 million in depreciation and amortization, mainly explained by the accounting of higher investments that increased its comparison base.
EBITDA, or gross operating income, fell by 0.9% at the end of September 2010 to Ch$ 224,295 million, mainly explained by an increase in other fixed operating costs of Ch$ 2,604 million.
In commercial terms, physical sales declined by 1,590 GWh (12.4%), which was more than compensated by a 18.9% rise in the average sale price following the greater thermal production due to the low hydrology at the beginning of this year, positively affecting revenues which rose by Ch$ 15,430 million (4.1%). This effect was partially reduced by higher procurement and service costs of Ch$ 14,239 million (11.3%), influenced mainly by higher fuel consumption for the thermal generation of Ch$ 9,638 million. This was due to a less efficient production mix because of the low hydrology at the start of the year as a result of the El Niño phenomenon, which impact has been partially mitigated in the second half of the year. This situation led to an increase in thermal production, replacing hydroelectric dispatch which fell by 1,684 GWh (17.9%), comparing both periods.
The effect of translating the financial statements from the Colombian peso to the Chilean peso in both periods produces an increase in Chilean pesos of 5.7% as of September 2010, compared to September 2009.
| Table 24 | ||||||
| Emgesa | Million Ch$ | Thousand US$ | ||||
| 3Q09 | 3Q10 | Var 3Q09-3Q10 | Chg% | 3Q10 | ||
| Operating Revenues | 374,771 | 390,201 | 15,430 | 4.1% | 750,155 | |
| Procurement and Services | (126,407) | (140,646) | (14,239) | (11.3%) | (270,391) | |
| Contribution Margin | 248,364 | 249,554 | 1,191 | 0.5% | 479,765 | |
| Other Costs | (22,100) | (25,259) | (3,160) | (14.3%) | (48,561) | |
| Gross Operating Income (EBITDA) | 226,264 | 224,295 | (1,969) | (0.9%) | 431,204 | |
| Depreciation and Amortization | (27,130) | (31,286) | (4,156) | (15.3%) | (60,148) | |
| Operating Income | 199,133 | 193,008 | (6,125) | (3.1%) | 371,056 | |
| Figures may differ from those accounted under Colombian GAAP. | ||||||
| Table 24.1 | ||||||||
| Emgesa | 3Q09 | 3Q10 | Var 3Q09-3Q10 | Chg% | ||||
| GWh Produced | 9,922 | 8,519 | (1,403) | (14.1%) | ||||
| GWh Sold | 12,790 | 11,200 | (1,590) | (12.4%) | ||||
| Market Share | 21.1% | 18.3% | (2.8) pp. |
Pg.37
![]()
DISTRIBUTION
CODENSA
Operating Income decreased 2.3% to Ch$ 154.257 million, mainly due to an increase in items that do not represent cash outflows (depreciation & amortization). Cash flow generation improved, which is mainly the result of the increase in sales as part of the recovery in demand 2010, which allowed the company to offset the increase in the cost of energy purchased, related to the lower hydrology experienced during the year in Colombia.
The higher Cash Flow generation allowed Codensa to offset the effects related to the Codensa Hogar's change in business model and the deconsolidation of the operating revenues generated by this business line, which distorts the comparison basis.
It is worth mentioning that starting this year, the change in the Codensa Hogar business model will be reflected in the financial statements of the company as they will be deconsolidated from Codensa's operating revenues. Therefore, all income from the retail business, which corresponds to the commissions received from Colpatria, will be classified as Financial Income.
Additionally, the higher demand experienced on Cundinamarca (which is part of Codensa Consolidated), which was accompanied by higher tariffs, and also due the positive conversion effect (5.7%) from local currency to Chilean pesos, all helping boosting Codensa's results.
| Table 25 | ||||||
| Codensa | Million Ch$ | Thousand US$ | ||||
| 3Q09 | 3Q10 | Var 3Q09-3Q10 | Chg% | 3Q10 | ||
| Operating Revenues | 550,342 | 592,765 | 42,423 | 7.7% | 1,139,582 | |
| Procurement and Services | (284,398) | (324,334) | (39,936) | (14.0%) | (623,527) | |
| Contribution Margin | 265,943 | 268,431 | 2,488 | 0.9% | 516,055 | |
| Other Costs | (64,921) | (65,718) | (797) | (1.2%) | (126,341) | |
| Gross Operating Income (EBITDA) | 201,023 | 202,713 | 1,691 | 0.8% | 389,713 | |
| Depreciation and Amortization | (43,054) | (48,456) | (5,403) | (12.5%) | (93,157) | |
| Operating Income | 157,969 | 154,257 | (3,712) | (2.3%) | 296,557 | |
| Figures may differ from those accounted under Colombian GAAP. | ||||||
| Table 25.1 | ||||||||
| Codensa | 3Q09 | 3Q10 | Var 3Q09-3Q10 | Chg% | ||||
| Customers (Th) | 2,456 | 2,525 | 69 | 2.8% | ||||
| GWh Sold | 8,998 | 9,276 | 278 | 3.1% | ||||
| Clients/ Employee | 2,380 | 2,362 | (18) | (0.8%) | ||||
| Energy Losses (%) | 8.3% | 8.6% | 0.3 pp. |
Pg.38
![]()

PERU
GENERATION
EDEGEL
Operating income in Peru was Ch$ 54,986 million, a reduction of 7.0% with respect to September 30, 2009. This is mainly explained by an increase in energy purchase costs, mainly reflecting the absence of the reversal of non-recurring provisions for energy purchases for distributor customers without contracts which were booked in the period to September 30, 2009 and, to a lesser degree, greater physical purchases at higher average prices, required to meet the increase of 169 GWh (2.7%) in physical sales. In addition, there was a higher fuel cost of Ch$ 3,965 million due to the increased thermal dispatch in the period.
The effect of translating the financial statements from the Peruvian sol to the Chilean peso in both periods produces a reduction in Chilean pesos of 1.8% to September 2010, compared to September 30, 2009.
| Table 26 | ||||||
| Edegel | Million Ch$ | Thousand US$ | ||||
| 3Q09 | 3Q10 | Var 3Q09-3Q10 | Chg% | 3Q10 | ||
| Operating Revenues | 159,865 | 161,205 | 1,340 | 0.8% | 309,913 | |
| Procurement and Services | (49,853) | (60,798) | (10,944) | (22.0%) | (116,882) | |
| Contribution Margin | 110,012 | 100,407 | (9,605) | (8.7%) | 193,031 | |
| Other Costs | (22,371) | (16,077) | 6,294 | 28.1% | (30,908) | |
| Gross Operating Income (EBITDA) | 87,641 | 84,330 | (3,311) | (3.8%) | 162,123 | |
| Depreciation and Amortization | (28,543) | (29,344) | (801) | (2.8%) | (56,413) | |
| Operating Income | 59,098 | 54,986 | (4,112) | (7.0%) | 105,709 | |
| Figures may differ from those accounted under Peruvian GAAP. | ||||||
| Table 26.1 | ||||||
| Edegel | 3Q09 | 3Q10 | Var 3Q09-3Q10 | Chg% | ||
| GWh Produced | 6,029 | 6,229 | 200 | 3.3% | ||
| GWh Sold | 6,179 | 6,349 | 169 | 2.7% | ||
| Market Share | 30.6% | 29.0% | (1.6) pp. | |||
DISTRIBUTION
EDELNOR
Operating Income increased 2.3% to Ch$ 49,418 million, mainly due to a higher sales volume by 7.3% reaching 4,550 GWh, and the increase of revenues coming from other services offered by this subsidiary.
The latter was partially offset by higher energy losses by 0.1 pp and a change in sales mix. The client base increased during the period in 36,000 new customers.
Pg.39
![]()
| Table 27 | ||||||
| Edelnor | Million Ch$ | Thousand US$ | ||||
| 3Q09 | 3Q10 | Var 3Q09-3Q10 | Chg% | 3Q10 | ||
| Operating Revenues | 228,052 | 230,578 | 2,526 | 1.1% | 443,283 | |
| Procurement and Services | (138,739) | (140,739) | (2,000) | (1.4%) | (270,568) | |
| Contribution Margin | 89,313 | 89,840 | 527 | 0.6% | 172,715 | |
| Other Costs | (24,903) | (23,820) | 1,083 | 4.3% | (45,793) | |
| Gross Operating Income (EBITDA) | 64,410 | 66,020 | 1,610 | 2.5% | 126,922 | |
| Depreciation and Amortization | (16,105) | (16,602) | (497) | (3.1%) | (31,917) | |
| Operating Income | 48,305 | 49,418 | 1,113 | 2.3% | 95,005 | |
| Figures may differ from those accounted under Peruvian GAAP. | ||||||
| Table 27.1 | ||||||
| Edelnor | 3Q09 | 3Q10 | Var 3Q09-3Q10 | Chg% | ||
| Customers (Th) | 1,050 | 1,086 | 36 | 3.4% | ||
| GWh Sold | 4,239 | 4,550 | 311 | 7.3% | ||
| Clients/ Employee | 1,753 | 1,943 | 190 | 10.8% | ||
| Energy Losses (%) | 8.1% | 8.2% | 0.1 pp. | |||
Operating Income by Subsidiary
Summary of operating revenues, operating costs (including procurements, services and other costs) and operating income of all Enersis' subsidiaries, for the nine-months ended in September 30, 2009 and September 2010, detailed as follows:
| Table 28 | 3Q09 | 3Q10 | ||||
| Million Ch$ | Operating Revenues | Operating Costs | Operating Income | Operating Revenues | Operating Costs | Operating Income |
| Endesa Chile (*) | 1,879,052 | (1,050,111) | 828,941 | 1,849,260 | (1,213,033) | 636,227 |
| Cachoeira (**) | 64,691 | (27,233) | 37,458 | 86,727 | (29,970) | 56,757 |
| Fortaleza (***) | 100,079 | (64,022) | 36,057 | 109,832 | (64,800) | 45,031 |
| Cien (**) | 84,192 | (21,631) | 62,561 | 46,455 | (34,754) | 11,701 |
| Chilectra | 849,645 | (738,497) | 111,148 | 723,062 | (641,481) | 81,581 |
| Edesur | 254,069 | (222,796) | 31,273 | 222,307 | (209,263) | 13,044 |
| Distrilima (Edelnor) | 228,052 | (179,747) | 48,305 | 230,578 | (181,160) | 49,418 |
| Ampla | 710,102 | (595,406) | 114,696 | 766,439 | (652,323) | 114,117 |
| Investluz (Coelce) | 534,783 | (434,217) | 100,566 | 649,803 | (505,125) | 144,678 |
| Codensa | 550,342 | (392,373) | 157,969 | 592,765 | (438,508) | 154,257 |
| CAM Ltda. | 112,753 | (111,608) | 1,145 | 86,587 | (87,981) | (1,393) |
| Inmobiliaria Manso de Velasco Ltda. | 3,075 | (3,063) | 12 | 4,507 | (3,704) | 802 |
| ICT | - | - | - | 970 | (489) | 481 |
| Synapsis Soluciones y Servicios IT Ltda. | 53,195 | (47,374) | 5,821 | 50,497 | (52,894) | (2,397) |
| Enersis Holding and other investment vehicles | 9,251 | (21,669) | (12,419) | 11,790 | (24,572) | (12,782) |
| Consolidation Adjustments | (532,954) | 532,060 | (894) | (601,209) | 599,239 | (1,970) |
| Total Consolidation | 4,900,328 | (3,377,688) | 1,522,639 | 4,831,342 | (3,541,337) | 1,290,005 |
| (*) Since January 1st, 2009, includes Gas Atacama, Transquillota e HydroAysén. | ||||||
Pg.40
![]()
| Table 28.1 | 3Q10 | ||
| Thousand US$ | Operating Revenues | Operating Costs | Operating Income |
| Endesa Chile (*) | 3,555,175 | (2,332,039) | 1,223,137 |
| Cachoeira (**) | 166,731 | (57,617) | 109,114 |
| Fortaleza (***) | 211,150 | (124,578) | 86,572 |
| Cien (**) | 89,309 | (66,815) | 22,494 |
| Chilectra | 1,390,076 | (1,233,238) | 156,838 |
| Edesur | 427,382 | (402,305) | 25,078 |
| Distrilima (Edelnor) | 443,283 | (348,278) | 95,005 |
| Ampla | 1,473,469 | (1,254,081) | 219,388 |
| Investluz (Coelce) | 1,249,238 | (971,096) | 278,141 |
| Codensa | 1,139,582 | (843,025) | 296,557 |
| CAM Ltda. | 166,463 | (169,141) | (2,678) |
| Inmobiliaria Manso de Velasco Ltda. | 8,664 | (7,122) | 1,542 |
| ICT | 1,865 | (940) | 924 |
| Synapsis Soluciones y Servicios IT Ltda. | 97,080 | (101,689) | (4,609) |
| Enersis Holding and other investment vehicles | 22,667 | (47,239) | (24,572) |
| Consolidation Adjustments | (1,155,815) | 1,152,027 | (3,788) |
| Total Consolidation | 9,286,320 | (6,807,176) | 2,479,143 |
Pg.41
![]()
OWNERSHIP OF THECOMPANY AS OFSEPTEMBER30, 2010
TOTAL SHAREHOLDERS: 7,796
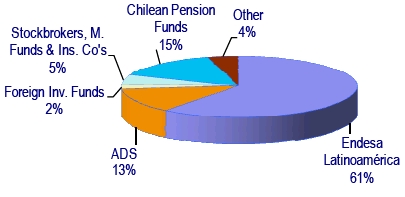
CONFERENCECALLINVITATION
Enersis is pleased to invite you to participate in aConference Callwith the management to review the results for the period,on Thursday, October 28th, 2010, 11:00 a.m. Eastern Time(12:00 p.m. Chilean Time). There will be a question and answer session following management's comments. Representing Enersis will be Mr. Alfredo Ergas, Chief Financial Officer.
To participate, please dial +1 (617) 213-4846 or +1 (888) 679-8033 (toll free USA), approximately 10 minutes prior to the scheduled start time, Passcode ID: 17251425
To access the phone replay, please dial +1 (617) 801-6888 or +1 (888) 286-8010 (toll free USA) Passcode ID: 90890900.
FOR THISCONFERENCECALL YOU CAN ACCESS PREVIOUSLY TO THE PRE-REGISTRATION SITE AT HTTPS://WWW.THECONFERENCINGSERVICE.COM/PREREG/KEY.PROCESS?KEY= PMB87PFEEAND MAKE YOUR REGISTRATION QUICKER. IF NOT,PLEASE CONNECT APPROXIMATELY15MINUTES PRIOR TO THE SCHEDULED START TIME. YOU CAN ALSO ACCESS TO THE CONFERENCE CALL REPLAY THROUGH OUR WEBSITE ATHTTP://PHX.CORPORATE-IR.NET/PHOENIX.ZHTML?C=83615& amp;P=IROL-IRHOME.
Pg.42
![]()
CONTACTINFORMATION
For further information, please contact us:
| Ricardo Alvial | Rodrigo Pérez | |
| Risk Management and IR Director | Head of Investor Relations | |
| ram@e.enersis.cl | rapr@e.enersis.cl | |
| 56 (2) 353 4682 | 56 (2) 353 4554 |
| Carmen Poblete | Romina Valderrama | Erika Vargas | Nicolás Donoso |
| Shares Department | Investor Relations | Investor Relations | Investor Relations |
| Associate | Associate | Associate | Associate |
| cpt@e.enersis.cl | rvh@enersis.cl | emvb@enersis.cl | ndo@enersis.cl |
| 56 (2) 353 4447 | 56 (2) 353 4552 | 56 (2) 353 4555 | 56 (2) 353 4492 |
| María Luz Muñoz |
| Investor Relations |
| Assistant |
| mlmr@e.enersis.cl |
| 56 (2) 353 4682 |
DISCLAIMER
This Press Release contains statements that could constitute forward-looking statements within the meaning of the Private Securities Litigation Reform Act of 1995. These statements appear in a number of places in this announcement and include statements regarding the intent, belief or current expectations of Enersis and its management with respect to, among other things: (1) Enersis' business plans; (2) Enersis' cost-reduction plans; (3) trends affecting Enersis' financial condition or results of operations, including market trends in the electricity sector in Chile or elsewhere; (4) supervision and regulation of the electricity sector in Chile or elsewhere; and (5) the future effect of any changes in the laws and regulations applicable to Enersis' or its subsidiaries. Such forward-looking statements are not guarantees of future performance and involve risks and uncertainties. Actual results may differ materially from those in the forward-looking statements as a re sult of various factors. These factors include a decline in the equity capital markets of the United States or Chile, an increase in the market rates of interest in the United States or elsewhere, adverse decisions by government regulators in Chile or elsewhere and other factors described in Enersis' Annual Report on Form 20-F. Readers are cautioned not to place undue reliance on those forward-looking statements, which state only as of their dates. Enersis undertakes no obligation to release publicly the result of any revisions to these forward-looking statements.
Pg.43
SIGNATURES
Pursuant to the requirements of the Securities Exchange Act of 1934, as amended, the Registrant has duly caused this report to be signed on its behalf by the undersigned, thereunto duly authorized.
| ENERSIS S.A. | |
| By: /s/ Ignacio Antoñanzas | |
| -------------------------------------------------- | |
| Title: Chief Executive Officer |
Date: October 28, 2010