FORM 6-K
SECURITIES AND EXCHANGE COMMISSION
Washington, D.C. 20549
Report of Foreign Issuer
Pursuant to Rule 13a-16 or 15d-16 of
the Securities Exchange Act of 1934
For the month of February, 2012
Commission File Number: 001-12440
ENERSIS S.A.
(Translation of Registrant’s Name into English)
Santa Rosa 76
Santiago, Chile
(Address of principal executive office)
Indicate by check mark whether the registrant files or will file
annual reports under cover of Form 20-F or Form 40-F:
Form 20-F [X] Form 40-F [ ]
Indicate by check mark if the registrant is submitting the Form 6-K
in paper as permitted by Regulation S-T Rule 101(b)(1):
Yes [ ] No [X]
Indicate by check mark if the registrant is submitting the Form 6-K
in paper as permitted by Regulation S-T Rule 101(b)(7):
Yes [ ] No [X]
Indicate by check mark whether by furnishing the information
ontained in this Form, the Registrant is also thereby furnishing the
information to the Commission
pursuant to Rule 12g3-2(b) under the Securities Exchange Act of 1934:
Yes [ ] No [X]
If °;Yes” is marked, indicate below the file number assigned to the registrant
in connection with Rule 12g3-2(b): N/A
 | PRESS RELEASE Year Ended 2011 |
ENERSIS
ANNOUNCES CONSOLIDATED RESULTS
FOR YEAR ENDED ON DECEMBER 31, 2011
| Highlights for the Period |
SUMMARY
Ø2011 confirmed the strong growth in demand for electricity in the countries where we operate, as a result of the dynamic economic activity in these markets.
ØRegarding distribution business, it is important to note the improvement in our Peruvian and Chilean operations, with growth in electricity demand of 7.3% and 4.6% respectively.
ØOur Bocamina I coal-fired thermal plant damaged by the Chilean earthquake in February 2010, restarted operations. This allowed us to provide the Chilean Central Interconnected System(“SIC”) with a stable andreliable source of energy during a dry year.
ØOur distribution business customer base increased by around 384,000 customers, which confirms the natural growth of this business, an important stabilizing factor for our cash flows.
ØIn the generation business, operating revenues fell 2.9% mainly due to lower average sales prices, partially offset by higher physical sales in Peru and Colombia.
ØEBITDA for the Enersis Group was very balanced in terms of business segment:
•Generation and Transmission: 56%
•Distribution: 44%
ØThe Company’s EBITDAdecreased by Ch$ 134,323 million, or 5.9%, primarily due to Ch$ 70,601 million in higher costs related to fuel consumption in the generation business, mainly in Argentina and Chile. Additionally, Enersis accounted for the full impact of the equity tax reform in Colombia, for taxes payable throughout the 2011-2014 period. This non-recurring factor affected operating income of our Colombian operations (both distribution and generation subsidiaries) by Ch$ 72,671 million. The aforementioned decreases were partially offset by better results in our Chilean and Peruvian distribution companies, together with our generation facilities in Peru and Brazil, as well as our transmission in Brazil.
ØOperating income for 2011 amounted to Ch$ 1,566,311 million, representing a decline of 8.1% compared to 2010. It is important to highlight the negative operating performance of our subsidiaries in Argentina because of a long-time postponement of tariff adjustments, due to the delay in the accomplishment of certain issues set by an act of agreement subscribed with the National Government of Argentina, which is affecting the financial equilibrium in Edesur.
ØBecause of the aforementioned, Enersis S.A., made some provisions for its subsidiaries Empresa Distribuidora Sur S.A., and Central Costanera S.A., that had an impact of Ch$ 106,750 million over Enersis’results. Without these provisions, results would have been similar to those obtained in 2010, despite the severe drought affecting Chile for the last 30 months. This ratifies the benefit of being properly diversified.
Pg. 1
| PRESS RELEASE Year Ended 2011 |
DISTRIBUTIONBUSINESS
Consolidated figures for the distribution businesses are detailed as follows:
ØOperating revenues rose by 1.2% to Ch$ 4,447,427 million.
ØProcurement and service costs were Ch$ 2,904,966 million, 1.5% lower than 2010.
ØEBITDA in 2011 amounted to Ch$ 939,597 million, a reduction of 4.4% compared to 2010, mainly due to the reduced results of our businesses in Argentina, Colombia and Brazil, partially compensated by improvements in Chile and Peru.
Factors influencing this lower distribution business EBITDA, as follows:
In Chile,EBITDA grew by Ch$ 12,538 million, mainly explained by:
ØBetter energy sales margin related to 4.6% higher energy demand, which was reflected in higher sales volume in almost every market segment.
ØLower personnel expenses for Ch$ 4,974 million.
In Peru,EBITDA rose by Ch$ 5,944 million as result of:
Ø7.3% increase in physical sales in every market segment.
ØLower procurement and services costs by Ch$ 3,182 million, mainly because of synergies in technology and information systems.
In Argentina,EBITDA decreased by Ch$ 36,245 million, mainly explained by:
ØCh$ 23,866 million increased in salaries under unions agreements, higher payroll and extra time payments.
ØLower sales margin mainly explained by 2.3% lower industrial sales, compensated by a 2.8% increase in sales volume related to a higher residential consumption, which reflects growth in the number of clients and lower temperatures during the winter season of 2011.
In Brazil,EBITDA decreased by Ch$ 4,217 million as result of:
ØLower energy sales revenues in Coelce, explained by lower average sales price related to a 6.4% drop in energy sales from the industrial segment.
ØThe above was partially compensated by higher energy sales volume in Ampla and Coelce.
In Colombia,EBITDA decreased by Ch$ 21,704 million, mostly as result of:
ØThe effect of the Colombian government equity tax reform, which implied recording in 2011 the entire tax payable during 2011-2014.
ØThe previous effect more than offset the positive operating margins registered in 2011, as result of 2.7% increase in energy sales in all the client segments.
Pg. 2
| PRESS RELEASE Year Ended 2011 |
GENERATION ANDTRANSMISSIONBUSINESS
ØConsolidated physical sales increased 2.2% to 64,840 GWh, explained by increases in all the countries where we operate, led by Peru, Colombia and Chile.
ØOperating revenues decreased 2.9% to Ch$ 2,700,026 million, mainly explained by lower average sales prices, more than offsetting the higher physical sales.
ØProcurement and services costs declined by 2.1% to Ch$ 1,272,985 million as a result of lower other variable costs and transportation expenses, partially offset by higher fuel consumption in Argentina and Chile.
ØEBITDA amounted to Ch$ 1,200,281 million, a decrease of 7.3% compared to the previous year.
ØConsolidated hydroelectric generation remained almost the same than in 2010, representing a 59% of total generation.
Factors affecting these results are:
In Chile,EBITDA decreased Ch$ 110,189 million, mainly due to:
ØDecrease in energy sales revenues explained by lower average price, due to lower water availability which impacted energy sales to the spot market. This was partially offset by a 1.0% increase in energy sales volume.
ØHigher energy purchase costs of Ch$ 66,320 million and higher fuel consumption of Ch$ 32,088 million linked to a poorer hydrological condition, partially offset by lower transport expenses of Ch$ 46,133 million.
In Colombia, EBITDA fell by Ch$ 7,283 million, mainly due to:
ØIncrease in other fixed operating costs of Ch$ 40,804 million, mainly explained by the non-recurring effect of the equity tax reform which implied the booking on January 1, 2011 of the full amount payable in the period 2011-2014.
ØReduced energy sales revenues of Ch$ 10,742 million due to a 4.0% lower average energy sale prices, partially compensated by an increase of 2.0% in physical sales.
ØReduction in energy cost purchases of Ch$ 43,256 million, explained by lower thermal dispatch because of higher hydro generation.
In Peru,EBITDA increased by Ch$ 32,851 million due to:
ØHigher energy sales revenues of Ch$ 31,049 million explained by higher generation from both thermal and hydro facilities, and also higher average price and a 9.9% increase in sales volume.
ØLower personnel expenses of Ch$ 8,819 million and a decrease in the energy purchase costs by Ch$ 1,691 million.
ØThe latter was partially offset by higher fuel consumption cost of Ch$ 3,913 million linked to higher thermal dispatch, and higher transport expenses by Ch$ 3,615 million.
In Argentina, EBITDA decreased by Ch$ 14,242 million due to:
ØHigher fuel consumption cost of Ch$ 40,195 million, increase in transport expenses of Ch$ 4,529 million related to higher thermal dispatch, and also higher energy purchases costs of Ch$ 4,444 million.
Pg. 3
| PRESS RELEASE Year Ended 2011 |
ØHigher personnel expenses of Ch$ 4,563 million, explained by increased wages under unions agreements.
ØThis was partially offset by higher energy sales of Ch$ 44,256 million, related to 12.8% increase in average energy sales price.
In Brazil, EBITDA increased by Ch$ 4,202 million due to:
ØIncrease of Ch$ 10,747 millionin Cachoeira Dourada’s contribution margin due to 5.3%increase in average sales price and 4.0% increase in physical sales.
ØHigher contribution margin of Ch$2,468 million in CIEN, due to its recognition as regulatory asset by the local authority since April 2011, permitting entrance of tolls according to RAP(permitted annual remuneration) system.
ØLower energy purchase costs of Ch$ 4,736 million and lower fuel consumption costs of Ch$ 1,771 million in Fortaleza, due to 37.9% lower generation. The latter caused an increase in spot market purchases, which allowed to maximize margin in a high hydrology and low prices scenario.
FINANCIALSUMMARY
ØThe average nominal interest rate increased from 8.5% up to 9.6%, mainly because of inflationary effects in Chile.
ØLiquidity, a key consideration in our financial management, continues to be in a very solid position, as shown below on a consolidated basis for Enersis:
·Cash and cash equivalents amount to US$ 2,350 million.
·Committed credit lines for US$ 818 million.
·Non-committed credit lines available for US$ 1,944 million.
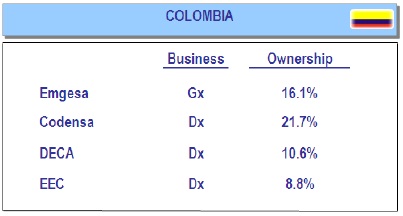
ØIn this context, it is important to highlight the successful issuance of an unsecured bond in local currency by Emgesa in the international capital markets, for the Colombian peso equivalent of US$ 400 million. This break-through deal, the first bond issued in local currency by a privatesector Colombian company in the international markets, was rated “Investment Grade” by Fitch Ratings and Standard and Poor’s.
ØIn June 2011, Ampla successfully issued local bonds (debentures) for the equivalent of US$160 million, maturing in 5 and 7 years, allowing the extension of its debt’smaturity.
ØIn November, Coelce issued local bonds (debentures) for the equivalent of US$ 240 million, also maturing in 5 and 7 years.
ØCoverage and protection: In order to mitigate exchange rate and interest rate risks, Enersis has established strict internal rules to protect our cash flows and balance sheet from fluctuations in these variables.
·Our exchange rate policy is based on cash flows and we strive to maintain a balance between US dollar indexed flows, and assets and liabilities in such currency. In addition to this policy, we have contracted cross currency swaps for a total amount of US$ 1,379 million and forwards for US$ 105 million.
Pg. 4
| PRESS RELEASE Year Ended 2011 |
· In order to reduce financial results’ volatility due to changes in market interest rates, weseek to maintain an adequate balance in our debt structure. Thus, we have contracted interest rate swaps (from variable to fixed rates) for US$ 315 million.
MARKETSUMMARY
ØThe Chilean Stock Exchange’s main index, IPSA, showed an important decrease of 15.2% during 2011. This has been consistent with the global economic scenario and the behavior of the principal stock exchanges. In Latin America, all the countries where the group has presence have shown negative numbers: BOVESPA (Brazil): -18.1%; COLCAP (Colombia): -13.8%; MERVAL (Argentina): -30.1% and ISBVL (Peru): -14.7%. In developed countries, the stock exchanges showed mixed results: IBEX: -13.1%, UKX: -5.6%; FTSE 250: -12.6%; S&P 500: 0% and Dow Jones Industrial: +5.5%. All these stock performances are calculated in their domestic currency and are therefore not comparable.
ØIn line with that markets, Enersis’ share price decreased during last 12 months. The price as of December 31, 2011 was $182.6 which represents a 16.0% decrease in comparison with December 31, 2010 price, when it reached $217.4. This low performance is mainly explained by the negative global economic scenario and also by the drought affecting Chile for the last 30 months, reducing the results of its generation affiliates.
ØEnersis’ ADS lost 24.1% of its value during 2011. The price fell from US$23.2 on December 31, 2010, to US$17.6 on December 31, 2011. The global economic situation, together with a high volatility in the international equity markets, as well as the drought that affected the Chilean territory, impacted the equity’s value.
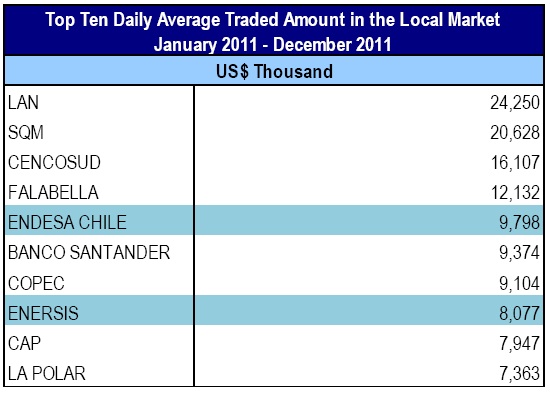
ØDuring 2011, Enersis was, again, among the most actively traded companies in the local market (Santiago Stock Exchange and Chilean Electronic Exchange), with a daily average trading volume of US$ 8.1 million.
|
| Source: Santiago Stock |
Pg. 5
| PRESS RELEASE Year Ended 2011 |
RISKRATINGCLASSIFICATIONINFORMATION
Enersis’current ratings are supported by its well diversified asset portfolio, strong credit metrics, adequate debt structure and solid liquidity.The Company’sgeographic diversification in Latin America provides a natural hedge against different regulations and weather conditions. Most ofEnersis’operating subsidiaries are financially strong and have leading market positions in the countries where Enersis operates.
Summarizing the main events occurred during 2011, we can highlight the following,
On April 25, 2011, Moody's upgraded the senior unsecured rating of Enersis from“Baa3”to“Baa2”,with stable outlook.
On July 15, 2011,Feller Rate confirmed the “AA” local rating of Enersis’bonds, shares and commercial papers program. Rating perspectives continue to be stable.
More recently, Standard & Poor’s (November 30, 2011) and Fitch Ratings (January 5, 2012) affirmed the international credit risk rating for Enersison “BBB+”, with stableoutlook.
The current international risk ratings are,
| Enersis | S&P | Moody’s | Fitch |
| Corporate | BBB+ / Stable | Baa2 / Stable | BBB+ / Stable |
The domestic ratings (for securities issued in Chile),
| Enersis | Feller Rate | Fitch |
| Shares | 1stClass Level 1 | 1stClass Level 1 |
| Bonds | AA / Stable | AA / Stable |
Pg. 6
| PRESS RELEASE Year Ended 2011 |
| TABLE OFCONTENTS | |
Summary | 1 |
Distribution Business | 2 |
Generation and Transmission Business | 3 |
Financial Summary | 4 |
Market Summary | 5 |
Risk Rating Classification Information | 6 |
TABLE OF CONTENTS | 7 |
| YEAR ENDED DECEMBER 31, 2011 | 9 |
| GENERAL INFORMATION | 9 |
SIMPLIFIED ORGANIZATIONAL STRUCTURE | 10 |
CONSOLIDATED INCOME STATEMENT ANALYSIS | 11 |
NET INCOME | 11 |
OPERATING INCOME | 11 |
NET FINANCIAL INCOME | 13 |
SALE OF ASSETS | 13 |
TAXES | 13 |
CONSOLIDATED BALANCE SHEET ANALYSIS | 14 |
ASSETS UNDER IFRS | 14 |
| BOOK VALUE AND ECONOMIC VALUE OF ASSETS | 16 |
| LIABILITIES AND SHAREHOLDERS’ EQUITY UNDER IFRS | 17 |
DEBT MATURITY WITH THIRD PARTIES, THOUSAND US$ | 19 |
DEBT MATURITY WITH THIRD PARTIES, MILLION CH$ | 19 |
EVOLUTION OF KEY FINANCIAL RATIOS | 20 |
UNDER IFRS | 21 |
CASH FLOW RECEIVED FROM FOREIGN SUBSIDIARIES BY ENERSIS, CHILECTRA AND ENDESA CHILE | 22 |
| THE PRINCIPAL RISKS ASSOCIATED TO THE ACTIVITIES OF THE ENERSIS GROUP | 23 |
| ARGENTINA | 28 |
GENERATION | 28 |
Endesa Costanera | 28 |
El Chocon | 29 |
DISTRIBUTION | 30 |
Edesur | 30 |
| BRAZIL | 31 |
ENDESA BRASIL | 31 |
GENERATION | 31 |
Cachoeira | 31 |
Fortaleza (cgtf) | 32 |
TRANSMISSION | 33 |
CIEN | 33 |
DISTRIBUTION | 34 |
Ampla | 34 |
Coelce | 35 |
| Pg. 7 | |
| PRESS RELEASE Year Ended 2011 |
| CHILE | 36 |
GENERATION | 36 |
Endesa Chile | 36 |
DISTRIBUTION | 37 |
Chilectra | 37 |
| COLOMBIA | 39 |
GENERATION | 39 |
Emgesa | 39 |
DISTRIBUTION | 40 |
Codensa | 40 |
GENERATION | 41 |
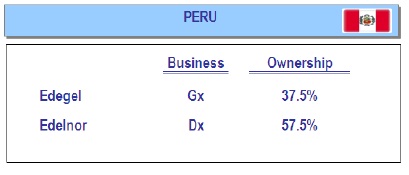
Edegel | 41 |
DISTRIBUTION | 42 |
Edelnor | 42 |
| MARKET INFORMATION | 44 |
EQUITY MARKET | 44 |
DEBT MARKET | 47 |
| CONFERENCE CALL INVITATION | 48 |
DISCLAIMER | 49 |
| Pg. 8 | |
| PRESS RELEASE Year Ended 2011 |
YEARENDEDDECEMBER31, 2011
GENERALINFORMATION
(Santiago, Chile, Tuesday, January 31, 2012.) Enersis S.A. (NYSE: ENI), announced today its consolidated financial results for the year ended December 31, 2011. All figures are in Chilean pesos (Ch$) and in accordance with International Financial Reporting Standards (IFRS). Variations refer to comparison between the year ended December 31, 2010 and December 31, 2011.
Figures as of December 31, 2011 are additionally translated into US$, merely as a convenience translation, using the exchange rate of US$ 1 = Ch$ 519.20 for the Balance Sheet, and the average exchange rate for the period of US$ 1 = Ch$ 483.57 for the Income Statement, Cash Flow Statements, Capex and Depreciation values.
The consolidation includes the following investment vehicles and companies:
a) In Chile: Endesa Chile (NYSE: EOC)*, Chilectra, and Inmobiliaria Manso de Velasco.
b) Others than Chile: Distrilima (Peru), Endesa Brasil (Brazil)**, Edesur (Argentina) and Codensa (Colombia).
| * | Includes Endesa Chile Chilean subsidiaries (Celta, Pangue, Pehuenche, San Isidro, and Tunel El Melón), non Chilean subsidiaries (Endesa Costanera, El Chocon, Edegel and Emgesa) and jointly controlled companies (Gas Atacama, Transquillota and Hidroaysén.) |
| ** | Includes Endesa Fortaleza, CIEN, Cachoeira Dourada, Ampla and Coelce. |
Pg. 9
| PRESS RELEASE Year Ended 2011 |
SIMPLIFIEDORGANIZATIONALSTRUCTURE
 | ||
 |  | |
 |
| |
| ||

Pg. 10
| PRESS RELEASE Year Ended 2011 |
CONSOLIDATEDINCOMESTATEMENTANALYSIS
NETINCOME
Enersis’ Net Income attributable to the owners of the controller for the cumulative period as of December 31, 2011 reached Ch$ 375,471 million, representing a 22.8% decrease over the same period 2010, which was Ch$ 486,227 million.
Under IFRS
Table 1 | ||||||
CONSOLIDATED INCOME STATEMENT | (Million Ch$) | (Thousand US$) | ||||
| 2010 | 2011 | Var 2010-2011 | Chg % | 2011 | |
Sales | 6,179,230 | 6,254,252 | 75,022 | 1.2% | 12,933,499 | |
Energy sales | 5,653,725 | 5,805,296 | 151,571 | 2.7% | 12,005,079 | |
Other sales | 50,571 | 31,746 | (18,825) | (37.2%) | 65,650 | |
Other services | 474,934 | 417,210 | (57,724) | (12.2%) | 862,770 | |
Other operating income | 384,351 | 280,628 | (103,723) | (27.0%) | 580,326 | |
Revenues | 6,563,581 | 6,534,880 | (28,701) | (0.4%) | 13,513,825 | |
Energy purchases | (1,554,715) | (1,762,818) | (208,104) | (13.4%) | (3,645,425) | |
Fuel consumption | (672,038) | (742,639) | (70,601) | (10.5%) | (1,535,743) | |
Transportation expenses | (405,983) | (393,991) | 11,992 | 3.0% | (814,755) | |
Other variable costs | (888,910) | (638,986) | 249,924 | 28.1% | (1,321,393) | |
Procurements and Services | (3,521,646) | (3,538,435) | (16,788) | (0.5%) | (7,317,316) | |
|
|
|
|
|
| |
Contribution Margin | 3,041,935 | 2,996,446 | (45,489) | (1.5%) | 6,196,508 | |
Other work performed by entity and capitalized | 44,869 | 50,173 | 5,304 | 11.8% | 103,756 | |
Employee benefits expense | (374,678) | (378,552) | (3,874) | (1.0%) | (782,828) | |
Other fixed operating expenses | (450,435) | (540,698) | (90,264) | (20.0%) | (1,118,139) | |
Gross Operating Income (EBITDA) | 2,261,691 | 2,127,368 | (134,323) | (5.9%) | 4,399,297 | |
Depreciation and amortization | (449,017) | (424,900) | 24,117 | 5.4% | (878,673) | |
Reversal of impairment profit (impairment loss) recognized in profit or loss | (108,373) | (136,157) | (27,784) | (25.6%) | (281,567) | |
Operating Income | 1,704,301 | 1,566,311 | (137,990) | (8.1%) | 3,239,057 | |
Net Financial Income | (270,605) | (236,585) | 34,020 | 12.6% | (489,247) | |
Financial income | 171,237 | 233,613 | 62,376 | 36.4% | 483,100 | |
Financial costs | (438,358) | (465,411) | (27,053) | (6.2%) | (962,449) | |
Gain (Loss) for indexed assets and liabilities | (15,056) | (25,092) | (10,036) | (66.7%) | (51,889) | |
Foreign currency exchange differences, net | 11,572 | 20,306 | 8,733 | 75.5% | 41,991 | |
Gains | 91,331 | 80,873 | (10,459) | (11.5%) | 167,241 | |
Losses | (79,759) | (60,567) | 19,192 | 24.1% | (125,250) | |
Share of profit (loss) of associates accounted for using the equity method | 1,016 | 8,466 | 7,450 | 733.5% | 17,507 | |
Net Income From Other Investments | 273 | 1,038 | 766 | 280.7% | 2,147 | |
Net Income From Sale of Assets | 11,711 | (5,853) | (17,563) | (150.0%) | (12,103) | |
Net Income Before Taxes | 1,446,695 | 1,333,377 | (113,318) | (7.8%) | 2,757,362 | |
Income Tax | (346,007) | (460,837) | (114,830) | (33.2%) | (952,989) | |
NET INCOME ATTRIBUTABLE TO: | 1,100,688 | 872,541 | (228,148) | (20.7%) | 1,804,373 | |
Owners of parent | 486,227 | 375,471 | (110,756) | (22.8%) | 776,457 | |
Non-controlling interest | 614,462 | 497,069 | (117,392) | (19.1%) | 1,027,916 | |
Earning per share (Ch$ /share and US$ / ADR) | 14.9 | 11.5 | (3.4) | (22.8%) | 1.2 | |
OPERATINGINCOME
Operating income decreased by Ch$ 137,990 million, or 8.1% when compared to 2010.
Below we present operating revenues and costs breakdown by business line for the period ending on December 31, 2010 and 2011:
Pg. 11
| PRESS RELEASE Year Ended 2011 |
Table 2 |
|
|
|
|
|
|
|
|
|
|
|
|
|
Operating Income by Businesses | Generation and Transmission | Distribution | |||||||||||
Million Ch$ |
| Chg% |
| Th. US$ |
| Million Ch$ |
| Chg% |
| Th. US$ | |||
2010 | 2011 |
|
|
| 2011 |
| 2010 | 2011 |
|
|
| 2011 | |
Operating Revenues | 2,780,604 | 2,700,026 |
| (2.9%) |
| 5,583,527 |
| 4,392,626 | 4,447,427 |
| 1.2% |
| 9,197,071 |
Operating Costs | (1,730,510) | (1,705,652) |
| (1.4%) |
| (3,527,209) |
| (3,700,891) | (3,854,905) |
| 4.2% |
| (7,971,762) |
Operating Income | 1,050,094 | 994,374 |
| (5.3%) |
| 2,056,318 |
| 691,735 | 592,522 |
| (14.3%) |
| 1,225,308 |
|
|
|
|
|
|
|
|
|
|
|
|
|
|
Operating Income by Businesses | Eliminations and Others |
| Consolidated | ||||||||||
Million Ch$ |
| Chg% |
| Th. US$ |
| Million Ch$ |
| Chg% |
| Th. US$ | |||
2010 | 2011 |
|
|
| 2011 |
| 2010 | 2011 |
|
|
| 2011 | |
Operating Revenues | (609,649) | (612,573) |
| 0.5% |
| (1,266,773) |
| 6,563,581 | 6,534,880 |
| (0.4%) |
| 13,513,825 |
Operating Costs | 572,121 | 591,988 |
| 3.5% |
| 1,224,203 |
| (4,859,280) | (4,968,570) |
| 2.2% |
| (10,274,768) |
Operating Income | (37,528) | (20,585) |
| (45.1%) |
| (42,569) |
| 1,704,301 | 1,566,311 |
| (8.1%) |
| 3,239,057 |
Operating income for generation and transmission business line, detailed by country is shown in the following table:
Table 3 |
|
|
|
|
|
|
|
|
|
|
|
|
|
|
|
|
|
|
|
|
Generation & Transmission | Chile |
| Argentina |
| Brazil | |||||||||||||||
Million Ch$ |
| Chg% |
| Th. US$ |
| Million Ch$ |
| Chg% |
| Th. US$ |
| Million Ch$ |
| Chg% |
| Th. US$ | ||||
2010 | 2011 |
|
|
| 2011 |
| 2010 | 2011 |
|
|
| 2011 |
| 2010 | 2011 |
|
|
| 2011 | |
Operating Revenues | 1,345,371 | 1,257,995 |
| (6.5%) |
| 2,601,475 |
| 358,090 | 395,296 |
| 10.4% |
| 817,454 |
| 359,211 | 309,049 |
| (14.0%) |
| 639,099 |
% of consolidated | 48% | 47% |
|
|
| 47% |
| 13% | 15% |
|
|
| 15% |
| 13% | 11% |
|
|
| 11% |
Operating Costs | (832,601) | (859,191) |
| 3.2% |
| (1,776,766) |
| (311,379) | (361,383) |
| 16.1% |
| (747,322) |
| (200,399) | (105,556) |
| (47.3%) |
| (218,285) |
% of consolidated | 48% | 50% |
|
|
| 50% |
| 18% | 21% |
|
|
| 21% |
| 12% | 6% |
|
|
| 6% |
|
|
|
|
|
|
|
|
|
|
|
|
|
|
|
|
|
|
|
|
|
Operating Income | 512,769 | 398,804 |
| (22.2%) |
| 824,708 |
| 46,710 | 33,914 |
| (27.4%) |
| 70,132 |
| 158,812 | 203,493 |
| 28.1% |
| 420,814 |
|
|
|
|
|
|
|
|
|
|
|
|
|
|
|
|
|
|
|
|
|
Generation & Transmission | Peru |
| Colombia |
| Consolidated | |||||||||||||||
Million Ch$ |
| Chg% |
| Th. US$ |
| Million Ch$ |
| Chg% |
| Th. US$ |
| Million Ch$ |
| Chg% |
| Th. US$ | ||||
2010 | 2011 |
|
|
| 2011 |
| 2010 | 2011 |
|
|
| 2011 |
| 2010 | 2011 |
|
|
| 2011 | |
Operating Revenues | 211,264 | 239,841 |
| 13.5% |
| 495,981 |
| 507,526 | 498,569 |
| (1.8%) |
| 1,031,017 |
| 2,780,604 | 2,700,026 |
| (2.9%) |
| 5,583,527 |
% of consolidated | 8% | 9% |
|
|
| 9% |
| 18% | 18% |
|
|
| 18% |
| 100% | 100% |
|
|
|
|
Operating Costs | (140,944) | (135,187) |
| (4.1%) |
| (279,560) |
| (246,044) | (245,061) |
| (0.4%) |
| (506,774) |
| (1,730,510) | (1,705,652) |
| (1.4%) |
| (3,527,209) |
% of consolidated | 8% | 8% |
|
|
| 8% |
| 14% | 14% |
|
|
| 14% |
| 100% | 100% |
|
|
|
|
|
|
|
|
|
|
|
|
|
|
|
|
|
|
|
|
|
|
|
|
|
Operating Income | 70,319 | 104,655 |
| 48.8% |
| 216,421 |
| 261,482 | 253,508 |
| (3.0%) |
| 524,243 |
| 1,050,094 | 994,374 |
| (5.3%) |
| 2,056,318 |
Distribution businessshowed a Ch$ 99,213 million lower operating income, totaling Ch$ 592,522 million. Physical sales amounted to 69,552 GWh, representing an increase of 2,278 GWh, or 3.4%. Our customer base increased by 384 thousand of new clients approximately, amounting to 13.7 million customers.
Operating Income for distribution business line, detailed by country, is as follows:
Table 4 |
|
|
|
|
|
|
|
|
|
|
|
|
|
|
|
|
|
|
|
|
Distribution | Chile |
| Argentina |
| Brazil | |||||||||||||||
Million Ch$ |
| Chg% |
| Th. US$ |
| Million Ch$ |
| Chg% |
| Th. US$ |
| Million Ch$ |
| Chg% |
| Th. US$ | ||||
2010 | 2011 |
|
|
| 2011 |
| 2010 | 2011 |
|
|
| 2011 |
| 2010 | 2011 |
|
|
| 2011 | |
Operating Revenues | 1,016,997 | 1,046,191 |
| 2.9% |
| 2,163,474 |
| 295,538 | 279,725 |
| (5.4%) |
| 578,458 |
| 1,987,042 | 1,976,716 |
| (0.5%) |
| 4,087,755 |
% of consolidated | 23% | 24% |
|
|
| 24% |
| 7% | 6% |
|
|
| 6% |
| 45% | 44% |
|
|
| 44% |
Operating Costs | (905,231) | (926,506) |
| 2.4% |
| (1,915,971) |
| (291,594) | (416,895) |
| 43.0% |
| (862,119) |
| (1,683,188) | (1,622,070) |
| (3.6%) |
| (3,354,364) |
% of consolidated | 24% | 24% |
|
|
| 24% |
| 8% | 11% |
|
|
| 11% |
| 45% | 42% |
|
|
| 42% |
|
|
|
|
|
|
|
|
|
|
|
|
|
|
|
|
|
|
|
|
|
Operating Income | 111,767 | 119,685 |
| 7.1% |
| 247,502 |
| 3,944 | (137,170) |
| (3578.0%) |
| (283,661) |
| 303,854 | 354,646 |
| 16.7% |
| 733,391 |
|
|
|
|
|
|
|
|
|
|
|
|
|
|
|
|
|
|
|
|
|
Distribution | Peru |
| Colombia |
| Consolidated | |||||||||||||||
Million Ch$ |
| Chg% |
| Th. US$ |
| Million Ch$ |
| Chg% |
| Th. US$ |
| Million Ch$ |
| Chg% |
| Th. US$ | ||||
2010 | 2011 |
|
|
| 2011 |
| 2010 | 2011 |
|
|
| 2011 |
| 2010 | 2011 |
|
|
| 2011 | |
Operating Revenues | 307,159 | 329,309 |
| 7.2% |
| 680,996 |
| 785,890 | 815,487 |
| 3.8% |
| 1,686,388 |
| 4,392,626 | 4,447,427 |
| 1.2% |
| 9,197,071 |
% of consolidated | 7% | 7% |
|
|
| 7% |
| 18% | 18% |
|
|
| 18% |
| 100% | 100% |
|
|
|
|
Operating Costs | (242,211) | (259,410) |
| 7.1% |
| (536,447) |
| (578,667) | (630,025) |
| 8.9% |
| (1,302,861) |
| (3,700,891) | (3,854,905) |
| 4.2% |
| (7,971,762) |
% of consolidated | 7% | 7% |
|
|
| 7% |
| 16% | 16% |
|
|
| 16% |
| 100% | 100% |
|
|
|
|
|
|
|
|
|
|
|
|
|
|
|
|
|
|
|
|
|
|
|
|
|
Operating Income | 64,948 | 69,900 |
| 7.6% |
| 144,549 |
| 207,222 | 185,462 |
| (10.5%) |
| 383,527 |
| 691,735 | 592,522 |
| (14.3%) |
| 1,225,308 |
Pg. 12
| PRESS RELEASE Year Ended 2011 |
NETFINANCIALINCOME
The Company’s net financial income as of December 31, 2011 wasa loss of Ch$ 236,585 million, representing an improvement of 12.6% over 2010. The latter is mainly explained by higher financial income of Ch$ 62,376 million, mainly as a result of recognition of the agreement with CELG by Ch$ 35,181 million; the update on liabilities related to pension plans in Brazil and higher time deposits during the period mainly explained by Chilectra, CGTF and Enersis.
The latter was partially offset by higher financial expense by Ch$27,053 million, explained by the update on pensions in Brazil and a higher average cost of debt.
Additionally, during the period the Company registered a loss for indexed assets and liabilities of Ch$ 10,036 million, as a result of to the negative impact of inflation over U.F. denominated debt in Chile. The U.F., a non-transaction currency linked to the inflation in Chile, increased its value by 3.9% during 2011, when compared to the 2.5% increase registered during 2010.
SALE OFASSETS
The net income from sale of assets registered a decrease of Ch$ 17,564 million, explained by the recognition of the loss generated due to the sale of CAM.
TAXES
Income tax net expense increased by Ch$ 114,830 million at the end of December 2011. The latter is explained by increases in: Ampla by Ch$ 20,097 million; CIEN by Ch$ 19,333 million; Cachoeira Dourada by Ch$ 12,815 million; Edesur by Ch$ 11,613 million; Chilectra by Ch$ 10,213 million; Coelce by Ch$ 12,269 million; Endesa Chile by Ch$ 8,291 million; San Isidro by Ch$ 7,268 million; Edegel by Ch$ 6,812 million; Pangue by Ch$ 10,213 million; Codensa by Ch$ 5,757 million; Enersis by Ch$ 5,560 million and Emgesa by Ch$ 4,105 million.
The latter was partially offset by decreases in: Pehuenche by Ch$ 8,253 million; Celta by Ch$ 4,039 million and Gas Atacama by Ch$ 857 million
Pg. 13
| PRESS RELEASE Year Ended 2011 |
CONSOLIDATEDBALANCESHEETANALYSIS
ASSETSUNDERIFRS
Table 5 |
|
|
|
|
|
|
ASSETS | (Million Ch$) |
| (Thousand US$) | |||
| As of Dec 31, 2010 | As of December 31, 2011 | Var 2010-2011 | Chg % | As of December 31, 2011 | |
|
|
|
|
|
| |
CURRENT ASSETS |
|
|
|
|
|
|
Cash and cash equivalents | 961,355 | 1,219,921 | 258,566 | 26.9% |
| 2,349,617 |
Other current financial assets | 7,818 | 939 | (6,878) | (88.0%) |
| 1,809 |
Other current non-financial assets | 35,993 | 72,466 | 36,473 | 101.3% |
| 139,573 |
Trade and other current receivables | 1,038,098 | 977,602 | (60,496) | (5.8%) |
| 1,882,901 |
Accounts receivable from related companies | 20,472 | 35,283 | 14,811 | 72.3% |
| 67,956 |
Inventories | 62,652 | 77,926 | 15,274 | 24.4% |
| 150,088 |
Current tax assets | 137,987 | 141,828 | 3,840 | 2.8% |
| 273,166 |
Non-current assets (or disposal groups) classified as held for sale | 73,893 | - | (73,893) | (100.0%) |
| - |
Total Current Assets | 2,338,268 | 2,525,965 | 187,697 | 8.0% |
| 4,865,110 |
|
|
|
|
|
|
|
NON-CURRENT ASSETS |
|
|
|
|
|
|
Other non-current financial assets | 62,969 | 37,355 | (25,614) | (40.7%) |
| 71,947 |
Other non-current non-financial assets | 103,736 | 109,501 | 5,765 | 5.6% |
| 210,904 |
Trade accounts receivables and other receivables, net | 319,568 | 443,328 | 123,760 | 38.7% |
| 853,868 |
Investment accounted for using equity method | 14,102 | 13,193 | (908) | (6.4%) |
| 25,411 |
Intangible assets other than goodwill | 1,452,586 | 1,467,398 | 14,812 | 1.0% |
| 2,826,268 |
Goodwill | 1,477,022 | 1,476,404 | (618) | (0.0%) |
| 2,843,613 |
Property, plant and equipment, net | 6,751,941 | 7,242,731 | 490,790 | 7.3% |
| 13,949,790 |
Investment properties | 33,019 | 38,056 | 5,037 | 15.3% |
| 73,297 |
Deferred tax assets | 452,634 | 379,939 | (72,696) | (16.1%) |
| 731,777 |
Total Non-Current Assets | 10,667,577 | 11,207,906 | 540,329 | 5.1% |
| 21,586,875 |
|
|
|
|
|
|
|
TOTAL ASSETS | 13,005,845 | 13,733,871 | 728,026 | 5.6% |
| 26,451,985 |
Total Assetsincreased Ch$ 728,026 million, mainly due to:
ØCh$ 540,329 million increase in non-current assets, or 5.1%, as a result of:
vCh$ 490,790 million increase in Property, Plant and Equipment, explained by the net effect resulting from the translation of financial statements from local currencies to Chilean pesos by Ch$ 314,867 million, and additions for the period in approximately Ch$ 498,142 million. The latter was partially offset by the depreciation for the period of Ch$ 322,218 million.
vCh$ 14,812 million increase in intangible assets other than goodwill, due to additions for the period of Ch$ 191,072 million, partially offset by the depreciation for the period of Ch$ 102,682 million, the exchange rates variations and the translation effect of Ch$ 15,036 million and effects related to the application of IFRIC 12 by Ch$ 58,542 million.
vCh$ 123,760 million increase in trade accounts receivables and other receivables, mainly due to the increase in Ampla by Ch$ 62,736 million and Coelce by Ch$ 23,054 million, by the appliance of IFRIC 12 interpretation, related to service concession arrangements. Also due to increases in Costanera and Chocon for a total consideration of Ch$ 25,148 million due to FONINVEMEN II and Cachoeira Dourada due to the agreement with CELG by Ch$ 12,866 million. The latter was partially offset by the decrease in Chilectra by Ch$ 3,347 million and CIEN by Ch$ 2,263 million.
The latter was partially compensated by
Pg. 14
| PRESS RELEASE Year Ended 2011 |
vCh$ 72,696 million decrease in deferred taxes in: Codensa by Ch$ 30,704 million; Edesur by Ch$ 17,449 million; CIEN by Ch$ 15,550 million; Chilectra by Ch$ 8,870 million and Enersis by Ch$ 2,385 million.
vDecrease of Ch$ 25,614 million in other non-current financial assets, mainly explained by the drop in Endesa Chile by Ch$ 15,878 million, due to MTM of derivatives and reduction in Enersis by Ch$ 8,667 million in cash collateral.
ØCh$ 187,697 million increase in current assets or 8.0%, mainly due to:
vCh$ 258,566 million increase in Cash and Cash Equivalent, primarily explained by increases in: Enersis by Ch$ 266,013 million due to increases inrepos; higher amount of time deposits in Emgesa by Ch$ 61,676 million, Coelce by Ch$ 58,658 million, Codensa by Ch$ 55,608 million Cachoeira Dourada by Ch$ 41,348 million, CGTF by Ch$ 23,112 million, Edegel by Ch$ 18,899 million, Endesa Argentina by Ch$ 3,424 million and Endesa Chile by Ch$ 2,835 million. The latter was partially offset by decreases in Endesa Brasil by Ch$ 143,892 million explained by a payment made to IFC and dividends, Chilectra by Ch$ 80,239 million due to debt payment and dividends, Edesur by Ch$ 24,227 million due to decreases in time deposits, Edelnor by Ch$ 17,502 million and CIEN by Ch$ 11,421 million.
vIncrease in other current non-financial assets by Ch$ 36,473 million, mainly explained by prepayments of goods and services, mostly related to insurances.
vCh$ 73,893 million decrease in non-current assets classified as held for sell, related to the selling process of the former subsidiaries CAM and Synapsis, that took place in the first quarter of 2011.
vDecrease in trade and other accounts receivables by Ch$ 60,496 million mainly explained by: Coelce by Ch$ 41,821 million, Chilectra by Ch$ 32,779 million, Ampla by Ch$ 18,724 million, GasAtacama by Ch$ 7,947 million, CGTF by Ch$ 1,295 million and Codensa by Ch$ 975 million. The latter was partially compensated by increases in Endesa Chile by Ch$ 21,186 million, Pehuenche by Ch$ 19,352 million, Edelnor by Ch$ 12,688 million, Edegel by Ch$ 6,009 million and Pangue by Ch$ 3,946 million.
Pg. 15
| PRESS RELEASE Year Ended 2011 |
BOOKVALUE ANDECONOMICVALUE OFASSETS
Regarding the more important assets, the following should be mentioned:
Properties, Plants and Equipment are valued at their purchase cost, net of the corresponding accumulated depreciation and impairment loss they have been subject to. Properties, Plants and Equipment, net of their residual value, if applicable, are linearly depreciated by distributing the cost of their different elements along the estimated years of useful life, which is the period that the companies expect to use them. The useful life is reviewed regularly.
The goodwill value generated by consolidation represents the acquisition cost surplus on the Group’sstake in terms of the reasonable value of assets and liabilities, including the identifiable contingent liabilities of a subsidiary at the time of acquisition. Goodwill is not amortized. Instead, at the closing of each accounting period an assessment is made of whether any impairment has occurred during the period that could reduce its recoverable value to an amount below the registered net cost, proceeding in this event to make a timely impairment adjustment (See Note 3.e to the Consolidated Financial Statements).
Throughout the fiscal year and in particular at the date of closing, an assessment is made as to any indication of possible loss due to the impairment of any asset. In the event of any such indication, an estimate of the recoverable sum of said asset is made to determine, if applicable, the depreciated amount. If this involves identifiable assets that do not originate independent cash flows, the recoverability of the Cash Generating Unit that the asset belongs to is estimated, understanding as such the smaller group of identifiable assets that generate independent cash incomes.
Assets expressed in foreign currency are expressed at the prevalent exchange rate at the closing of the period.
Notes and accounts receivable from related companies are classified according to their short and long term maturities. These operations are adjusted according to prevalent market equity conditions.
In summary, assets are valued according to the International Financial Reporting Standards, whose criteria are expressed in Note 3 of the Consolidated Financial Statements.
Pg. 16
| PRESS RELEASE Year Ended 2011 |

Table 6 |
|
|
|
|
|
|
LIABILITIES AND SHAREHOLDERS' EQUITY | (Million Ch$) |
| (Thousand US$) | |||
| As of Dec 31, 2010 | As of December 31, 2011 | Var 2010-2011 | Chg % | As of December 31, 2011 | |
|
|
|
|
|
|
|
CURRENT LIABILITIES |
|
|
|
|
|
|
Other current financial liabilities | 665,598 | 672,082 | 6,484 | 1.0% |
| 1,294,458 |
Trade and other current payables | 1,224,490 | 1,235,064 | 10,574 | 0.9% |
| 2,378,784 |
Accounts payable to related companies | 148,202 | 157,178 | 8,975 | 6.1% |
| 302,730 |
Other short-term provisions | 115,449 | 99,703 | (15,747) | (13.6%) |
| 192,031 |
Current tax liabilities | 147,667 | 235,853 | 88,187 | 59.7% |
| 454,263 |
Current provisions for employee benefits | 5,450 | - | (5,450) | (100.0%) |
| - |
Other current non-financial liabilities | 35,791 | 60,653 | 24,863 | 69.5% |
| 116,821 |
Liabilities (or disposal groups) classified as held for sale | 64,630 | - | (64,630) | (100.0%) |
| - |
Total Current Liabilities | 2,407,277 | 2,460,534 | 53,256 | 2.2% |
| 4,739,086 |
|
|
|
|
|
|
|
NON-CURRENT LIABILITIES |
|
|
|
|
|
|
Other non-current financial liabilities | 3,014,956 | 3,271,355 | 256,399 | 8.5% |
| 6,300,761 |
Non-current payables | 37,237 | 14,305 | (22,932) | (61.6%) |
| 27,551 |
Accounts payable to related companies | 1,084 | - | (1,084) | (100.0%) |
| - |
Other-long term provisions | 225,522 | 202,574 | (22,949) | (10.2%) |
| 390,165 |
Deferred tax liabilities | 555,924 | 508,438 | (47,485) | (8.5%) |
| 979,272 |
Non-current provisions for employee benefits | 215,819 | 277,526 | 61,707 | 28.6% |
| 534,526 |
Other non-current non-financial liabilities | 33,997 | 102,985 | 68,988 | 202.9% |
| 198,354 |
Total Non-Current Liabilities | 4,084,540 | 4,377,183 | 292,644 | 7.2% |
| 8,430,630 |
|
|
|
|
|
|
|
SHAREHOLDERS' EQUITY |
|
|
|
|
|
|
Issued capital | 2,824,883 | 2,824,883 | - | 0.0% |
| 5,440,838 |
Retained earnings (losses) | 2,103,690 | 2,232,969 | 129,279 | 6.1% |
| 4,300,788 |
Share premium | 158,760 | 158,760 | - | 0.0% |
| 305,777 |
Other equity changes | - | - | - |
|
| - |
Reserves | (1,351,787) | (1,320,883) | 30,905 | 2.3% |
| (2,544,073) |
|
|
| - |
|
|
|
Equity Attributable to Shareholders of the Company | 3,735,545 | 3,895,729 | 160,184 | 4.3% |
| 7,503,329 |
Equity Attributable to Minority Interest | 2,778,483 | 3,000,425 | 221,942 | 8.0% |
| 5,778,939 |
Total Shareholders' Equity | 6,514,028 | 6,896,154 | 382,126 | 5.9% |
| 13,282,269 |
|
|
|
|
|
|
|
TOTAL LIABILITIES AND SHAREHOLDERS' EQUITY | 13,005,845 | 13,733,871 | 728,026 | 5.6% |
| 26,451,985 |
TheCompany’s total liabilities and shareholders’ equity increased by Ch$ 728,026 million, whencompared to the period ended on December 31, 2010, due to Ch$ 382,126 million increase inshareholders’ equity, Ch$ 292,643 million increase in non-current liabilities and Ch$ 53,257 million increase of current liabilities. The detail is explained as follows:
ØNon-current liabilities increased by Ch$ 292,643 million, or 7.2%, mainly due to:
vOther non-current financial liabilities (financial debt and derivatives) increased by Ch$ 256,399 million, mainly due to increases in: Emgesa by Ch$ 147,029 million, due to the issuance of a bond in local currency in the international capital market; in Coelce by Ch$ 82,662 million due to higher amount of loans; in Endesa Chile by Ch$ 38,476 million, due to the effect of debt in US$ and UF; in Ampla by Ch$ 9,875 million due to exchange rate differences; in Codensa by Ch$ 18,636 million; in Chocon by Ch$ 17,138 million and Edesur by Ch$ 8,611 million. The latter was partially offset by CIEN by Ch$ 56,400 million, due to a loan payment.
vOther non-current non-financial liabilities increased by Ch$ 68,988 million, mainly in Emgesa and Codensa by Ch$ 22,026 million and Ch$ 14,519 million respectively, due to the recording of the equity tax impact as of January 2, 2011. Also due to increases in Endesa Chile by Ch$ 8,881 million, CIEN by Ch$ 4,461 million, Coelce by Ch$ 3,699 million, Cachoeira Dourada by Ch$ 3,501 million and in Ampla by Ch$ 2,147 million.
Pg. 17
| PRESS RELEASE Year Ended 2011 |
vIncrease in non-current provisions for employee benefits of Ch$ 61,707 million due to increases in Ampla by Ch$ 44,229 million; Emgesa by Ch$ 4,778 million; Edesur by Ch$ 4,009, Coelce by Ch$ 2,134 million; Codensa by Ch$ 1,692 million; Chilectra by Ch$ 1,527 million and Endesa Chile by Ch$ 714 million.
vDecreases in Other long term provisions by Ch$ 22,949 million due to lower provisions in CIEN by Ch$ 36,149; Edegel by Ch$ 8,617 million and Edesur by Ch$ 2,211 million, partially compensated by increases in Ampla of Ch$ 13,294 million; Coelce by Ch$ 9,212 million and Codensa by Ch$ 2,596 million.
vDecrease in non-current payable by Ch$ 22,932 million due to the decrease in Coelce by Ch$ 5,935 million; Cachoeira Dourada by Ch$ 4,700 million; CIEN by Ch$ 4,599 million and Ampla by Ch$ 3,965 million.
ØCurrent liabilities increased by Ch$ 53,257 million, equivalent to 2,2%, mainly explained by the following changes:
vIncrease in current tax liabilities by Ch$ 88,187 million, explained by increases in Chilectra by Ch$ 15,833 million; Cachoeira Dourada by Ch$ 14,780 million; Emgesa by Ch$ 14,175 million; Edegel by Ch$ 14,056 million; San Isidro by Ch$ 5,740 million; Ampla by Ch$ 5,533 million and Pehuenche by Ch$ 4,804 million.
vIncrease in Other current non-financial liabilities by Ch$ 24,863 million, explained by increases in: Ampla by Ch$ 8,138 million; Edesur by Ch$ 6,612 million; Edelnor by Ch$ 3,445 million; Coelce by Ch$ 2,728 million; Codensa by Ch$ 1,425 million; Cachoeira Dourada by Ch$ 836 million and CGTF by Ch$ 715 million.
The above was partially offset by:
vReduction in liabilities included in groups of assets for disposal classified as held for sale, of Ch$64,630 million, as a result of the sale of the liabilities of CAM and Synapsis during the third quarter of 2011.
Equity increases by Ch$382,126 million with respect to 2010:
vThe equity attributable to owners of the controller increases by Ch$160,184 million, mainly explained by the effect of the comprehensive result for the period of Ch$ 368,569 million, primarily driven by the result of the dominant of Ch$ 375,471 million, positive translation reserves of Ch$ 60,107 million, negative hedge reserve of Ch$ 41,094 million and negative other reserves of Ch$ 25,916 million, less dividends of Ch$ 209,887 million.
vNon-controller participations increased by Ch$ 221,942 million, mainly explained by the effect of the comprehensive result for the period of Ch$ 602,765 million, principally driven by the result for the period of the non-controllers of Ch$ 497,069 million and other comprehensive results of the period of Ch$ 105,696 million, partially offset by the reduction in other equity movements of Ch$ 380,823 million.
Pg. 18
| PRESS RELEASE Year Ended 2011 |
Table 7 |
|
|
|
|
|
|
|
|
(Thousand US$) | 2012 | 2013 | 2014 | 2015 | 2016 | 2017 | Balance | TOTAL |
Chile | 108,829.1 | 423,483.2 | 736,635.3 | 223,650.4 | 426,470.4 | 17,622.3 | 1,074,414.4 | 3,011,105.0 |
Enersis | 4,492.9 | 4,751.2 | 551,142.6 | 5,313.3 | 412,063.1 | 5,941.9 | 32,118.8 | 1,015,823.8 |
Chilectra | 0.6 | - | - | - | - | - | - | 0.6 |
Endesa Chile | 104,335.6 | 418,731.9 | 185,492.7 | 218,337.0 | 14,407.3 | 11,680.3 | 1,042,295.7 | 1,995,280.6 |
Argentina | 170,558.8 | 106,393.4 | 60,023.8 | 35,065.6 | 17,077.1 | - | - | 389,118.8 |
Edesur | 41,828.9 | 42,946.4 | 6,988.0 | - | - | - | - | 91,763.3 |
Costanera | 98,247.6 | 34,996.2 | 27,958.6 | 27,341.9 | 17,077.1 | - | - | 205,621.3 |
Chocón | 30,207.3 | 28,450.8 | 25,077.2 | 7,723.8 | - | - | - | 91,459.1 |
Hidroinvest | 275.0 | - | - | - | - | - | - | 275.0 |
CTM | - | - | - | - | - | - | - | - |
TESA | - | - | - | - | - | - | - | - |
Peru | 115,630.2 | 110,663.4 | 107,015.5 | 83,759.3 | 88,965.9 | 84,269.0 | 141,167.3 | 731,470.7 |
Edelnor | 55,684.8 | 58,917.5 | 56,738.0 | 50,040.8 | 31,602.4 | 37,093.8 | 59,345.3 | 349,422.6 |
Edegel | 59,945.4 | 51,745.9 | 50,277.5 | 33,718.5 | 57,363.5 | 47,175.2 | 81,822.0 | 382,048.1 |
Brazil | 529,486.2 | 227,965.7 | 163,503.3 | 137,081.1 | 187,498.7 | 128,575.8 | 141,668.2 | 1,515,778.9 |
Endesa Brasil | - | - | - | - | - | - | - | - |
Coelce | 119,141.8 | 98,395.9 | 96,580.1 | 38,857.3 | 91,942.6 | 63,785.0 | 79,395.4 | 588,098.1 |
Ampla | 287,995.6 | 115,178.5 | 51,489.4 | 81,671.9 | 87,887.1 | 56,493.6 | 58,395.7 | 739,112.0 |
Cachoeira | - | - | - | - | - | - | - | - |
Cien | 108,929.4 | - | - | - | - | - | - | 108,929.4 |
Fortaleza | 13,419.3 | 14,391.4 | 15,433.8 | 16,551.9 | 7,669.0 | 8,297.1 | 3,877.0 | 79,639.5 |
Colombia | 174,359.9 | 41,179.8 | 284,480.4 | 128,686.9 | 74,638.4 | 289,030.7 | 689,813.1 | 1,682,189.2 |
Codensa | 17,357.3 | 41,179.8 | 211,561.2 | - | 74,638.4 | 201,523.7 | 41,179.8 | 587,440.2 |
Emgesa | 157,002.7 | - | 72,919.1 | 128,686.9 | - | 87,507.1 | 648,633.3 | 1,094,749.1 |
TOTAL | 1,098,864.3 | 909,685.5 | 1,351,658.2 | 608,243.3 | 794,650.5 | 519,497.8 | 2,047,063.1 | 7,329,662.7 |
DEBTMATURITY WITHTHIRDPARTIES, MILLIONCH$
Table 7.1 |
|
|
|
|
|
|
|
|
(Million Ch$) | 2012 | 2013 | 2014 | 2015 | 2016 | 2017 | Balance | TOTAL |
Chile | 56,504 | 219,872 | 382,461 | 116,119 | 221,423 | 9,149 | 557,836 | 1,563,366 |
Enersis | 2,333 | 2,467 | 286,153 | 2,759 | 213,943 | 3,085 | 16,676 | 527,416 |
Chilectra | 0 | - | - | - | - | - | - | 0 |
Endesa Chile | 54,171 | 217,406 | 96,308 | 113,361 | 7,480 | 6,064 | 541,160 | 1,035,950 |
Argentina | 88,554 | 55,239 | 31,164 | 18,206 | 8,866 | - | - | 202,030 |
Edesur | 21,718 | 22,298 | 3,628 | - | - | - | - | 47,644 |
Costanera | 51,010 | 18,170 | 14,516 | 14,196 | 8,866 | - | - | 106,759 |
Chocón | 15,684 | 14,772 | 13,020 | 4,010 | - | - | - | 47,486 |
Hidroinvest | 143 | - | - | - | - | - | - | 143 |
CTM | - | - | - | - | - | - | - | - |
TESA | - | - | - | - | - | - | - | - |
Peru | 60,035 | 57,456 | 55,562 | 43,488 | 46,191 | 43,752 | 73,294 | 379,780 |
Edelnor | 28,912 | 30,590 | 29,458 | 25,981 | 16,408 | 19,259 | 30,812 | 181,420 |
Edegel | 31,124 | 26,866 | 26,104 | 17,507 | 29,783 | 24,493 | 42,482 | 198,359 |
Brazil | 274,909 | 118,360 | 84,891 | 71,172 | 97,349 | 66,757 | 73,554 | 786,992 |
Endesa Brasil | - | - | - | - | - | - | - | - |
Coelce | 61,858 | 51,087 | 50,144 | 20,175 | 47,737 | 33,117 | 41,222 | 305,341 |
Ampla | 149,527 | 59,801 | 26,733 | 42,404 | 45,631 | 29,332 | 30,319 | 383,747 |
Cachoeira | - | - | - | - | - | - | - | - |
Cien | 56,556 | - | - | - | - | - | - | 56,556 |
Fortaleza | 6,967 | 7,472 | 8,013 | 8,594 | 3,982 | 4,308 | 2,013 | 41,349 |
Colombia | 90,528 | 21,381 | 147,702 | 66,814 | 38,752 | 150,065 | 358,151 | 873,393 |
Codensa | 9,012 | 21,381 | 109,843 | - | 38,752 | 104,631 | 21,381 | 304,999 |
Emgesa | 81,516 | - | 37,860 | 66,814 | - | 45,434 | 336,770 | 568,394 |
TOTAL | 570,530 | 472,309 | 701,781 | 315,800 | 412,583 | 269,723 | 1,062,835 | 3,805,561 |
Pg. 19
| PRESS RELEASE Year Ended 2011 |
EVOLUTIONOFKEYFINANCIALRATIOS
Table 8 |
|
|
|
|
|
Indicator | Unit | As of Dec 31, 2010 | As of December 31, 2011 | Var 2010-2011 | Chg % |
Liquidity | Times | 0.97 | 1.03 | 0.06 | 6.2% |
Acid ratio test * | Times | 0.94 | 0.98 | 0.04 | 4.3% |
Working capital | Million Ch$ | (69,010) | 65,431 | 134,441 | 194.8% |
Working capital | Thousand US$ | (132,915) | 126,023 | 258,939 | 194.8% |
Leverage ** | Times | 1.00 | 0.99 | (0.01) | (1.0%) |
Short-term debt | % | 37.0 | 36.0 | (1.00) | (2.7%) |
Long-term debt | % | 63.0 | 64.0 | 1.00 | 1.6% |
* (Current assets net of inventories and prepaid expenses) / Current liabilities |
|
|
| ||
** Total debt / (equity + minority interest) |
|
|
|
|
|
|
|
|
|
|
|
Table 8.1 |
|
|
|
|
|
Indicator | Unit | 2010 | 2011 | Var 2010-2011 | Chg % |
Financial expenses coverage * | Times | 5.12 | 4.52 | (0.59) | (11.6%) |
Op. income / Op. rev. | % | 25.97 | 23.97 | (2.00) | (7.7%) |
ROE ** | % | 13.41 | 9.84 | (3.57) | (26.6%) |
ROA ** | % | 8.40 | 6.53 | (1.87) | (22.3%) |
* EBITDA / Financial costs |
|
|
|
|
|
** Annualized figures |
|
|
|
|
|
The liquidity ratio at December 31, 2011 was 1.03:1, a slight increase of 0.06 times, equivalent to 6.2%, with respect to December 31, 2010. This reflects a company with a solid liquidity position, maintaining its bank debt, financing its investments with cash generation and a satisfactory debt maturity structure.
The leverage ratio is 0.99:1 as of December 31, 2011, reducing by 1.0% with respect to December 31, 2010.
The financial cost coverage shows a fall of 0.59 times, equivalent to 11.6%, passing from 5.12:1 at December 31, 2010 to 4.52:1 at December 31,2011. This is the result of the fall in the company’sEBITDA in 2011.
The profitability indicator, being operating income over ordinary revenues, declined 7.7% to 24.0% at December 31, 2011.
On the other hand, the annualized return on equity of the owners of the controller (dominant) is 9.8%, with a fall of 26.6% with respect to December 31, 2010 when it was 13.4%. This was the result of the lower result reported for the period, added to the increase of the equity of the owners.
The annualized return on assets passed from 8.4% as of December 31, 2010 to 6.5% in December 31, 2011 as a result of the decline in the result for the present period and the increase in assets.
Pg. 20
| PRESS RELEASE Year Ended 2011 |
Consolidated Statements of Cash Flows Analysis
UNDERIFRS
Table 9 | ||||||
Cash Flow | (Million Ch$) |
| (Thousand US$) | |||
| 2010 | 2011 | Var 2010-2011 | Chg % | 2011 | |
|
|
|
|
|
|
|
Net Income | 1,100,688 | 872,541 | (228,148) | (20.7%) | 1,804,373 | |
Adjustments to reconcile net income | ||||||
Income tax expense | 346,007 | 460,837 | 114,830 | 33.2% | 952,989 | |
Decrease (increse) in inventories | 13,375 | (9,319) | (22,694) | (169.7%) | (19,271) | |
Decrease (increase) in trade accounts receivable | (164,046) | (10,784) | 153,262 | 93.4% | (22,301) | |
Decrease (increase) in other operating accounts receivable | (171,237) | (233,613) | (62,376) | (36.4%) | (483,100) | |
Decrease (increase) in trade accounts payable | 128,805 | (179,340) | (308,144) | (239.2%) | (370,866) | |
Decrease (increase) in other operating accounts payable | 453,414 | 490,504 | 37,090 | 8.2% | 1,014,338 | |
Depreciation and amortization expense | 449,017 | 424,900 | (24,117) | (5.4%) | 878,673 | |
(Reversal of) Impairment losses | 108,373 | 136,157 | 27,784 | 25.6% | 281,567 | |
Provisions | (29,193) | (83,617) | (54,423) | (186.4%) | (172,915) | |
Unrealized foreign currency exchange differences | (11,572) | (20,306) | (8,733) | (75.5%) | (41,991) | |
Non-distributed gains from associates | (1,016) | (8,466) | (7,450) | (733.5%) | (17,507) | |
Minority interest | - | - | - | - | ||
Other non-cash | 71,286 | 242,958 | 171,672 | 240.8% | 502,425 | |
Total adjustments to Reconcile to Operating Income | 1,193,213 | 1,209,911 | 16,698 | 1.4% | 2,502,040 | |
Dividends paid | - | - | - | - | ||
Dividends received | - | - | - | - | ||
Payments of interest classified as operating | - | - | - | - | ||
Proceeds of interest received classified as operating | - | - | - | - | ||
Income taxes refund (paid) | (349,297) | (361,092) | (11,795) | (3.4%) | (746,721) | |
Other inflows (outflows) of cash | (1,189) | (22,913) | (21,724) | (1826.3%) | (47,384) | |
NET CASH FLOWS PROVIDED BY OPERATING ACTIVITIES | 1,943,415 | 1,698,446 | (244,969) | (12.6%) |
| 3,512,307 |
|
|
|
|
|
|
|
Net Cash Flows provided by (used in) Investing Activities |
|
|
|
|
|
|
Cash flows from loss of control of subsidiaries or other businesses. | - | 12,662 | 12,662 |
|
| 26,185 |
Acquisitions of associates | - | - | - |
|
| - |
Cash flows used for the purchase of non-controlling | - | - |
|
|
|
|
Loans to related companies | - | (26) | (26) |
|
| (53) |
Proceeds from sales of property, plant and equipment | 8,890 | 6,049 | (2,841) | (32.0%) |
| 12,509 |
Purchase of property, plant and equipment | (473,922) | (498,142) | (24,220) | (5.1%) |
| (1,030,134) |
Proceeds from sales of intangible assets | 1,425 | 8,966 | 7,541 | 529.3% |
| 18,540 |
Acquisitions of intangible assets | (227,419) | (187,864) | 39,555 | 17.4% |
| (388,494) |
Proceeds from other long term assets. | - | 41 | 41 |
|
| 85 |
Purchase of other long-term assets | - | - | - |
|
| - |
Proceeds from prepayments reimbursed and third party loans | - | - | - |
|
| - |
Prepayments and third party loans | - | (1,285) | (1,285) |
|
| (2,657) |
Dividends received | 3,279 | 4,025 | 746 | 22.8% |
| 8,324 |
Interest received | 6,808 | 19,612 | 12,804 | 188.1% |
| 40,556 |
Other inflows (outflows) of cash | (94,842) | 11,992 | 106,834 | 112.6% |
| 24,799 |
NET CASH FLOWS FROM (USED IN) INVESTING ACTIVITIES | (775,781) | (623,970) | 151,811 | 19.6% |
| (1,290,340) |
|
|
|
|
|
|
|
Cash Flows provided by (used in) Financing Activities |
|
|
|
|
|
|
Proceeds from shares issue | - | 97 | 97 |
|
| 201 |
Proceeds from long-term borrowings | 263,125 | 646,273 | 383,148 | 145.6% |
| 1,336,462 |
Repayments of borrowings | 822 | 9,129 | 8,307 | 1011.0% |
| 18,878 |
Payments of loans | (740,287) | (629,404) | 110,882 | 15.0% |
| (1,301,579) |
Payments of finance lease liabilities | (24,130) | (11,479) | 12,651 | 52.4% |
| (23,738) |
Repayment of loans to related companies | - | - | - |
|
| - |
Dividends paid | (556,087) | (648,107) | (92,020) | (16.5%) |
| (1,340,255) |
Interest paid | (244,596) | (248,097) | (3,501) | (1.4%) |
| (513,053) |
Other financing proceeds (payments) | 18,132 | (9,841) | (27,974) | (154.3%) |
| (20,351) |
NET CASH FLOWS PROVIDED BY (USED IN) FINANCING ACTIVITIES | (1,283,021) | (891,430) | 391,591 | 30.5% |
| (1,843,434) |
|
|
|
|
|
|
|
NET INCREASE (DECREASE) IN CASH AND CASH EQUIVALENTS BEFORE EFFECTS OF EXCHANGE RATE | (115,387) | 183,047 | 298,434 | 258.6% |
| 378,533 |
|
|
|
|
|
|
|
Effect of exchange rate changes on cash and cash equivalents | (58,159) | 75,519 | 133,678 | 229.8% |
| 156,170 |
Net Increase (Decrease) in Cash and Cash Equivalents | (173,546) | 258,566 | 432,112 | 249.0% | 534,703 | |
Cash and cash equivalents at end of period | 1,134,901 | 961,355 | (173,546) | (15.3%) |
| 1,988,037 |
Ending Balance of Cash and Cash Equivalents | 961,355 | 1,219,921 | 258,566 | 26.9% |
| 2,522,740 |
Pg. 21
| PRESS RELEASE Year Ended 2011 |
The company generated a negative net cash flow during the period of Ch$ 183,047 million, comprising the following:
Operating activities for 2011 generated a net positive flow of Ch$ 1,698,447 million, a fall of 12.6% compared to the year before. This flow comprises mainly the earnings for the period of Ch$ 872,541 million, which is adjusted to reconcile the result of Ch$ 708,679 million. This adjustment includes the amortization, depreciation and impairment of assets of Ch$ 561,057 million and interest expenses of Ch$ 256,891 million. This is partly compensated by the reduction in working capital of Ch$ 107,436 million.
Investment activities generated a negative net cash flow of Ch$ 623,970 million, representing an increase in cash of 19.6% or Ch$ 151,811 million compared to the same period of 2010. These disbursements relate mainly to the acquisition of properties, plant and equipment of Ch$ 498,142 million and the incorporation of intangible assets (IFRIC 12) of Ch$187,864 million, compensated partly by the net cash flow from the sale of CAM and Synapsis of Ch$12,662 million and interests received of Ch$ 19,612 million.
Financing activities generated a net negative cash flow of Ch$ 891,430 million, principally the payment of dividends for Ch$ 648,107 million, loan repayments of Ch$ 629,404 million and interest payments of Ch$ 248,097 million. This is partially offset by loan drawings of Ch$ 646,273 million.
CASHFLOWRECEIVEDFROMFOREIGNSUBSIDIARIES BYENERSIS, CHILECTRA ANDENDESACHILE
Table 10 |
|
|
|
|
|
|
|
|
|
|
Cash Flow | Interest Received | Dividends Received | Capital Reductions | Others | Total Cash Received | |||||
(Thousand US$) | ||||||||||
| 2010 | 2011 | 2010 | 2011 | 2010 | 2011 | 2010 | 2011 | 2010 | 2011 |
Argentina | 1,586.2 | 1,503.3 | 8,772.2 | - | - | - | - | 101.8 | 10,358.5 | 1,605.1 |
Peru | - | - | 68,582.2 | 77,896.4 | - | - | - | - | 68,582.2 | 77,896.4 |
Brazil | - | - | 194,835.9 | 345,810.2 | - | - | - | - | 194,835.9 | 345,810.2 |
Colombia | - | - | 221,251.8 | 27,664.4 | 59,462.9 | - | - | - | 280,714.7 | 27,664.4 |
Others | - | - | - | - | - | - | - | - | - | - |
Total | 1,586.2 | 1,503.3 | 493,442.1 | 451,371.1 | 59,462.9 | - | - | 101.8 | 554,491.3 | 452,976.2 |
Source: Internal Financial Report
Pg. 22
| PRESS RELEASE Year Ended 2011 |
Table 11 |
|
|
|
|
|
|
|
|
|
| Payments for Additions of Fixed Assets |
| Depreciation | ||||||
|
|
|
|
|
|
|
|
|
|
| Million Ch$ |
| Thousand US$ |
| Million Ch$ |
| Thousand US$ | ||
| 2010 | 2011 |
| 2011 |
| 2010 | 2011 |
| 2011 |
Endesa Chile | 254,872 | 264,883 |
| 547,766 |
| 175,068 | 170,051 |
| 351,657 |
Cachoeira | 4,668 | 686 |
| 1,419 |
| 7,383 | 7,280 |
| 15,055 |
Endesa Fortaleza | 1,870 | 7,530 |
| 15,572 |
| 7,999 | 8,051 |
| 16,649 |
Cien | 1,884 | 310 |
| 641 |
| 29,986 | 11,122 |
| 23,000 |
Chilectra S.A. | 31,148 | 19,947 |
| 41,249 |
| 21,191 | 21,777 |
| 45,034 |
Edesur | 58,221 | 82,014 |
| 169,601 |
| 14,279 | 13,244 |
| 27,388 |
Edelnor | 33,203 | 37,704 |
| 77,970 |
| 19,800 | 20,002 |
| 41,363 |
Ampla (*) | 120,785 | 131,519 |
| 271,975 |
| 44,976 | 56,424 |
| 116,682 |
Coelce (*) | 102,946 | 51,309 |
| 106,105 |
| 51,936 | 41,649 |
| 86,128 |
Codensa | 76,255 | 77,456 |
| 160,175 |
| 59,143 | 59,957 |
| 123,988 |
Cam Ltda.(**) | 1,148 | 46 |
| 95 |
| 1,774 | 294 |
| 608 |
Inmobiliaria Manso de Velasco Ltda. | 708 | 2,311 |
| 4,779 |
| 285 | 259 |
| 536 |
Synapsis (***) | 3,326 | 488 |
| 1,009 |
| 3,084 | 478 |
| 988 |
Enersis holding and investment companies | 388 | 991 |
| 2,049 |
| 1,080 | 1,208 |
| 2,498 |
Total | 691,422 | 677,194 |
| 1,400,405 |
| 437,984 | 411,796 |
| 851,575 |
(*) Includes concessions intangible assets. |
|
|
|
|
|
|
|
|
|
(**) Company sold on February 24th, 2011. | |||||||||
(***) Company sold on March 1st, 2011. | |||||||||
THEPRINCIPALRISKS ASSOCIATED TO THE ACTIVITIES OF THEENERSISGROUP
Commercial and Regulatory Risk
The Group’s activities are subject to a broad range of governmental standards and environmentalregulations. Any modification of such standards and regulations may affect the Group’s activities,economic situation and operating results.
The Group’s distribution activity is subject to a wide range of rulesregarding tariffs and other issues that govern their activities in each of the countries where it operates and which could modify distribution subsidiaries operating results.
The Group’s generation activity is subject to existing hydrological and weatherconditions in thegeographic zones in which the Group’s hydroelectric generating plants are located. Commercial policieshave been planned in order to moderate the possible impact of changes in these variables.
Group’s activities are subjectto certain environmental regulation which Enersis fulfills constantly. Modifications applied on such regulations may affect the operations, economic condition or the results of these operations.
Enersis and its operating subsidiaries are subject to environmental regulations which, among other things, require the company to conduct environmental impact studies for future projects, obtaining permits, licenses and other authorizations and the fulfillment of all requirements of those licenses, permits and norms. As any other regulated company, Enersis cannot guarantee:
·The approval from regulators of environmental impact studies.
Pg. 23
| PRESS RELEASE Year Ended 2011 |
·That public opposition may not cause delays or modifications to any proposed project and
·That laws or regulations may not change or be interpreted in a manner that could adversely affect the operations or the plans for companies in which Enersis or its subsidiaries hold investments.
The group’s commercial activity has been planned to moderate possible impacts resulting fromchanges in hydrological conditions.
Enersis group’s operations include hydroelectric generation and therefore depend on the hydrologicalconditions at any time in the broad geographical zones where its hydroelectric generation installations are located. If hydrological conditions produce droughts or other conditions that negatively affect hydroelectric generation, the results could be adversely affected. Enersis has therefore defined as an essential part of its commercial policy not to contract 100% of its total capacity. The electricity business is also affected by atmospheric conditions like average temperatures which govern consumption. The different weather conditions can produce differences in the margin obtained by the business.
Financial situation and the results from operations could be adversely affected if risk exposureweren’t efficiently managed in regards to interest rates, prices of commodities, and exchangerates.
Interest Rate Risk
Interest rate variations modify the fair value of those assets and liabilities that accrue a fixed interest rate, as well as the future flows of assets and liabilities pegged to a variable interest rate.
In compliance with our current interest rate hedging policy, the portion of fixed and/or hedged debt to the total net debt was 62% as of December 31, 2011 on a consolidated basis.
Depending on the Group’s estimates and debt structure objectives, hedging transactions take placehiring derivatives that mitigate these risks.
The structure of Enersis’ financial debt sort by fixed, protected and variable interest rate, and after derivatives, is as follows:
Net Position:
| Dec. 31 | Dec. 31 | |
| 2011 | 2010 | |
| % | % | |
| Fixed Interest Rate | 62% | 51% |
| Variable Interest Rate | 38% | 49% |
| Total | 100% | 100% |
Exchange Rate Risk
The exchange rate risks are mainly related to the following transactions:
·Foreign currency debts raised by Group’s companies.
·Payments to be made on international markets for the acquisition of projects related materials.
·Group companies’ incomes directly linked to the evolutionof the dollar, and
Pg. 24
| PRESS RELEASE Year Ended 2011 |
·Incoming cash flows from our subsidiaries abroad exposed to exchange rate fluctuations.
In order to mitigate exchange rate risks, Enersis’ exchange rate hedging policy is based on cash flowsand it strives to maintain a balance between dollar indexed flows and the asset and liability levels in such currency. Cross currency swaps and exchange rate forwards are the instruments currently used incompliance with this policy. Likewise, the policy looks to refinance debts in each company’s functional currency.
Commodities Risk
Enersis is exposed to the price fluctuation risk on some commodities, basically through
·Fuel purchases for the electricity generation and also,
·Energy transactions in the local markets.
In order to reduce risks in extreme drought conditions, the company has designed a trading policy thatdefines sales commitment levels consistent with its generating plants’ firm energy in a dry year, including risk mitigation clauses in some unregulated clients’ contracts.
In view of the operative conditions by the electricity generation market in Chile has experienced, like extreme drought and rising oil prices, the company has decided to hire a derivative to place a cap on the Brent price for consumption. As of December 31, 2011 there are no outstanding coverage instruments and instruments taken in the past have been specific and for no considerable monetary amounts. Market and operative conditions will be constantly analyzed to adjust the volume hedged or take new hedges for the following months.
Liquidity Risk
In engaging committed long term credit facilities and short term financial investments the Group maintains a consistent liquidity policy, for the amounts required to support projected needs for the period, contingent with the situation and the expectations in the debt and capital markets.
As of December 31, 2011, the Enersis Group held liquidity in the amount of Ch$ 1,217,904 million in Cash and Cash Equivalent and Ch$ 424,561 million in committed long term credit lines. As of December 31st, 2010, the Enersis Group held liquidity in the amount of Ch$ 961,355 million in Cash and Cash Equivalent and Ch$ 242,750 million in committed long term credit lines.
Credit Risk
Credit risk in accounts receivable, originating from trading activities, has been historically very limitedgiven that the short term collection conditions with customers doesn’t allow them to individuallyaccumulate significant amounts. Additionally, in the case of the so-called “unregulated clients” of ourelectricity generation and distribution business, a formal procedure is applied to control the credit risk, using a systematic evaluation of our counterparties, index definition and credit risk factors by virtue of which the contracts are approved or additional guarantee requirements are defined.
Furthermore, in our electricity generating business, in the event of non-payment, some countries allow power supply cut-offs, and in almost all contracts a lack of payment is established as cause for contract termination. For this purpose, credit risks are constantly monitored and the maximum amounts exposed to payment risks are measured, which are limited.
Pg. 25
| PRESS RELEASE Year Ended 2011 |
In turn, in our electricity distribution business, the energy supply cut-off is a power held by our companies in case of default by our customers, applied in accordance with the applicable regulation in each country, enabling the credit risk evaluation and control process, which is also limited.
Surplus cash flow investments are placed in prime national and foreign financial entities (with an investment grade equivalent risk rating) with limits set for each entity.
In the selection of banks for investment, the Group considers those that hold two investment grade classifications, according to the three main international risk agencies (Moody’s, S&P and FitchRatings).
Positions are backed up by treasury bonds from the country of operations and instruments issued by the most reputable banks, favoring, wherever possible, the first ones.
Derivatives are engaged with highly solvent entities; about 80% of operations are conducted with entities that hold an A- or higher rating.
Risk Measurement
The Enersis Group measures the Value at Risk (VaR) of its debt and financial derivatives positions in order to guarantee that the risk taken by the company remains consistent with the risk exposure defined by Management, thus restricting the volatility of its financial results.
The positions portfolio used in the calculations of the current Value at Risk is comprised of debt and financial derivatives.
The calculated Value at Risk represents the possible value loss of the aforementioned positions portfolio over one day time horizon with 95% of confidence.
The volatility of the risk variables that affect the value of the positions portfolio has been studied, including:
·The U.S. dollar Libor interest rate.
·The usual banking local indexes for debts, taking into account the different currencies our companies operate under, and
·The exchange rates of the different currencies involved in the calculation.
The calculation of VaR is based on generating possible future scenarios (at one day) of market values (both spot and term) for the risk variables, using Bootstrapping methodology. The number of scenarios generated ensures compliance with the simulation convergence criteria. A matrix of volatilities and correlations between the various risk variables calculated based on the historical values of the logarithmic price return, has been applied to simulate the future price scenario.
Once the price scenarios have been obtained, the fair value of the portfolio is calculated using such scenarios, obtaining a distribution of possible values at one day. The one-day 95% confidence VaR number is calculated as the 5% percentile of the potential increases in the fair value of the portfolio in one day.
The various debt positions and financial derivatives included in the calculation have been valued consistently using the financial capital calculation methodology reported to Management.
Pg. 26
| PRESS RELEASE Year Ended 2011 |
Taking in consideration the above mentioned hypotheses, the breakdown for VaR in every mentioned type of positions is the following:
| Financial Positions | Dec. 31 2011 Th Ch$ | Dec. 31 2010 Th Ch$ |
Interest Rate | 41,560,004 | 38,847,459 |
Exchange Rate | 3,602,591 | 539,575 |
Correlation | (310,050) | (2,695,024) |
Total | 44,852,545 | 36,692,010 |
Other Risks
A portion of Enersis and Endesa Chile’s debt is subject to cross default provisions. If certain defaults indebt of certain specific subsidiaries are not remedied within specified grace periods, a cross default could affect Endesa Chile and Enersis, and under certain scenarios, debts at the holding company level could be accelerated.
Nonpayment–after any applicable grace period–of the debts of Enersis and Endesa Chile, or their so-called Relevant Subsidiaries, with an individual principal amount outstanding in excess of US$ 50 million (or its equivalent in other currencies), and with a missed payment also in excess of US$ 50 million, could give rise to a cross default of several bank revolving debt facilities at the Endesa Chile and Enersis levels. Furthermore, some of these debt facilities are also subject to cross acceleration provisions in the event of a default in other Relevant Subsidiary debt, for reasons other than payment default, for events such as bankruptcy, insolvency proceedings, and materially adverse governmental or legal actions, in all cases for amounts in excess of US$ 50 million.
Similarly, nonpayment–after any given applicable grace period - of the debts of these companies or any of their Chilean subsidiaries, in single indebtedness in default with a principal in excess of US$ 30 million dollars, could potentially give rise to a cross default of Enersis and Endesa Chile Yankee bonds.
There are no clauses in the credit agreements by which changes in the corporate or debt classification of these companies from risk classification agencies could trigger prepayments. Nevertheless, amodification in the Standard & Poor’s (S&P) debt risk classification in foreign currency could trigger a change in the margin applicable to determine the interest rate, in the credit loans executed in 2006, and in local credit lines executed in 2009.
Pg. 27
| PRESS RELEASE Year Ended 2011 |
ARGENTINA |  |
| GENERATION |
In Argentina, the 2011 operating result amounted to Ch$ 33,914 million, which represents a 27.4% drop in relation to last year’s records. That is primarily explained because of higher fuel consumption, transportation expenses and energy purchases. The foregoing was partially offset by a higher operating income of Ch$ 37,207 million, due mostly to a price increment in average energy sales prices stated in pesos.
The EBITDA of the operations in Argentina amounted to Ch$ 50,562 million; namely, 22% lower with respect to that recorded in 2010.
ENDESACOSTANERA
Endesa Costanera’s operating result amounted to Ch$ 6,480 million in the year 2010; i.e., a 40.2% drop with respect to the previous year. Although income increased by 15.8% in 2011, because of an increase in physical sales and higher average prices, supply and services costs increased by 19.4% mostly because of fuel consumption costs totaling Ch$ 40,195 million and Ch$ 4,373 million in transportation costs as a consequence of the 5.4% increment in generation in 2011.Physical sales reached 8,493.3 GWh (8,017.7 GWh during 2010).
The effect of converting these financial statements from Argentine peso to the Chilean peso in both periods was to generate a 10.1% reduction in Chilean pesos in 2011 when compared to 2010.
Table 12 |
|
|
|
|
|
|
Endesa Costanera | Million Ch$ |
|
| Thousand US$ | ||
| 2010 | 2011 | Var 2010-2011 | Chg% |
| 2011 |
Operating Revenues | 295,231 | 341,824 | 46,593 | 15.8% |
| 706,876 |
Procurement and Services | (250,349) | (298,842) | (48,492) | (19.4%) |
| (617,991) |
Contribution Margin | 44,882 | 42,982 | (1,900) | (4.2%) |
| 88,886 |
Other Costs | (19,690) | (23,247) | (3,557) | (18.1%) |
| (48,074) |
Gross Operating Income (EBITDA) | 25,192 | 19,735 | (5,456) | (21.7%) |
| 40,812 |
Depreciation and Amortization | (14,352) | (13,256) | 1,096 | 7.6% |
| (27,412) |
Operating Income | 10,840 | 6,480 | (4,360) | (40.2%) |
| 13,400 |
Figures may differ from those accounted under Argentine GAAP. |
|
|
|
|
| |
|
|
|
|
|
| |
Table 12.1 |
|
|
|
|
|
|
Endesa Costanera | 2010 | 2011 | Var 2010-2011 | Chg% |
|
|
GWh Produced | 7,965 | 8,397 | 432 | 5.4% |
|
|
GWh Sold | 8,018 | 8,493 | 476 | 5.9% |
|
|
Market Share | 7.2% | 7.3% | 0.1 pp. |
|
|
|
Pg. 28
| PRESS RELEASE Year Ended 2011 |
ELCHOCON
The effect of converting these financial statements from the Argentine peso to the Chilean peso in both periods was to generate a 10.1% reduction in Chilean pesos, as of December 2011 when compared to December 2010.
Table 13 |
|
|
|
|
|
|
El Chocón | Million Ch$ |
|
| Thousand US$ | ||
| 2010 | 2011 | Var 2010-2011 | Chg% |
| 2011 |
Operating Revenues | 57,173 | 48,341 | (8,832) | (15.4%) |
| 99,967 |
Procurement and Services | (17,475) | (16,876) | 599 | 3.4% |
| (34,898) |
Contribution Margin | 39,698 | 31,466 | (8,232) | (20.7%) |
| 65,070 |
Other Costs | (4,940) | (4,903) | 38 | 0.8% |
| (10,138) |
Gross Operating Income (EBITDA) | 34,758 | 26,563 | (8,195) | (23.6%) |
| 54,931 |
Depreciation and Amortization | (3,107) | (2,821) | 286 | 9.2% |
| (5,833) |
Operating Income | 31,651 | 23,742 | (7,908) | (25.0%) |
| 49,098 |
Figures may differ from those accounted under Argentine GAAP. |
|
|
|
|
| |
|
|
|
|
|
|
|
Table 13.1 |
|
|
|
|
|
|
El Chocón | 2010 | 2011 | Var 2010-2011 | Chg% |
|
|
GWh Produced | 2,975 | 2,404 | (571) | (19.2%) |
|
|
GWh Sold | 3,361 | 2,888 | (473) | (14.1%) |
|
|
Market Share | 3.0% | 2.5% | (0.6) pp. |
|
|
|
Pg. 29
| PRESS RELEASE Year Ended 2011 |
DISTRIBUTION
EDESUR
In Argentina, our Edesur affiliate shows an operating result drop in the amount of Ch$ 141,114 million, upon going from Ch$ 3,944 million during 2010, to a negative result of Ch$ 137,170 million in the present year. The negative operating evolution of the company arises as a result of increased operating costs derived from the country’s rate of inflation, without the corresponding tariff increases because of the delay in meeting certain clauses of the Minutes of Agreement executed with the National Government of Argentina, especially via the semi-annual recognition of tariff adjustments incorporated into the Cost Monitoring Mechanism (MMC, in its Spanish acronym) and the implementation of an Integral Tariff Review (RTI, in its Spanish acronym) as provided in such Minutes, all of which is heavily impacting Edesur’s financial balance.
Upon confronting this situation, by the closing of 2011 the company registered provisions related to Property, Plant and Equipment totaling Ch$ 106,450 million meant to cover practically the entire equity risk that this company represents to the Enersis Group. Such provisions were registered in the negative operating result indicated in the preceding paragraph.
With respect to the rest of the operating evolution, operating expenses increased by Ch$ 20,016 million, associated mostly to salary increases related to labor agreements, as well as other fixed operating costs that increased by Ch$ 2,643 million. Physical sales increased by 2.8% reaching 17,233 GWh in 2011. The loss of energy remained at the level of 10.5% and the number of clients exceeded 2.3 million.
The effect of converting the financial statements of both these periods from the Argentine peso to the Chilean peso caused a 10.1% drop as of December 31, 2010, when compared to the previous year.
Table 14 |
|
|
|
|
|
|
Edesur | Million Ch$ |
|
| Thousand US$ | ||
| 2010 | 2011 | Var 2010-2011 | Chg% |
| 2011 |
Operating Revenues | 295,538 | 279,725 | (15,813) | (5.4%) |
| 578,458 |
Procurement and Services | (142,566) | (141,880) | 686 | 0.5% |
| (293,401) |
Contribution Margin | 152,973 | 137,845 | (15,128) | (9.9%) |
| 285,057 |
Other Costs | (132,461) | (153,578) | (21,117) | (15.9%) |
| (317,592) |
Gross Operating Income (EBITDA) | 20,512 | (15,733) | (36,245) | (176.7%) |
| (32,536) |
Depreciation and Amortization | (16,568) | (121,437) | (104,869) | (633.0%) |
| (251,125) |
Operating Income | 3,944 | (137,170) | (141,114) | (3578.0%) |
| (283,661) |
Figures may differ from those accounted under Argentine GAAP. |
|
|
|
|
| |
|
|
|
|
|
|
|
Table 14.1 |
|
|
|
|
|
|
Edesur | 2010 | 2011 | Var 2010-2011 | Chg% |
| |
Customers (Th) | 2,353 | 2,389 | 36 | 1.5% |
|
|
GWh Sold | 16,759 | 17,233 | 474 | 2.8% |
|
|
Clients/Employee | 896 | 838 | (57) | (6.4%) |
|
|
Energy Losses % | 10.5% | 10.5% | 0.0% |
|
|
|
Pg. 30
| PRESS RELEASE Year Ended 2011 |
BRAZIL |  |
ENDESABRASIL Operating Income amounted to Ch$ 555,424 million, 21.3% higher than the Ch$ 457,893 million reported in 2010. |
Table 15 |
|
|
|
|
|
|
Endesa Brasil | (Million Ch$) |
|
| (Thousand US$) | ||
| 2010 | 2011 | Var 2010-2011 | Chg % |
| 2011 |
Sales | 1,948,849 | 1,973,427 | 24,579 | 1.3% |
| 4,080,955 |
Other operating income | 277,000 | 194,395 | (82,606) | (29.8%) |
| 401,999 |
Total Revenues | 2,225,849 | 2,167,822 | (58,027) | (2.6%) |
| 4,482,954 |
Procurements and Services | (1,292,520) | (1,227,078) | 65,443 | 5.1% |
| (2,537,539) |
Contribution Margin | 933,328 | 940,745 | 7,416 | 0.8% |
| 1,945,416 |
Other Costs | (247,941) | (253,335) | (5,394) | (2.2%) |
| (523,886) |
Gross Operating Income (EBITDA) | 685,387 | 687,409 | 2,022 | 0.3% |
| 1,421,530 |
Depreciation and Amortization | (227,494) | (131,985) | 95,509 | 42.0% |
| (272,939) |
Operating Income | 457,893 | 555,424 | 97,531 | 21.3% |
| 1,148,591 |
Net Financial Income | (63,226) | (39,338) | 23,888 | 37.8% |
| (81,349) |
Financial income | 130,699 | 171,883 | 41,184 | 31.5% |
| 355,446 |
Financial expenses | (191,832) | (225,561) | (33,729) | (17.6%) |
| (466,450) |
Income (Loss) for indexed assets and liabilities | - | - | - |
|
| - |
Foreign currency exchange differences, net | (2,093) | 14,340 | 16,433 | 785.2% |
| 29,655 |
Gains | 30,287 | 17,950 | (12,337) | (40.7%) |
| 37,119 |
Losses | (32,380) | (3,610) | 28,770 | 88.9% |
| (7,465) |
Net Income from Related Comp. Cons. by the Prop. Eq.Method | - | - | - |
|
| - |
Net Income from Other Investments | - | - | - |
|
| - |
Net Income from Sales of Assets | 23 | - | (23) | (100.0%) |
| - |
Net Income before Taxes | 394,690 | 516,086 | 121,396 | 30.8% |
| 1,067,242 |
Income Tax | (67,395) | (128,503) | (61,108) | (90.7%) |
| (265,738) |
NET INCOME | 327,295 | 387,583 | 60,288 | 18.4% |
| 801,504 |
Net Income Attributable to Owners of the Company | 224,155 | 285,159 | 61,004 | 27.2% |
| 589,696 |
Net Income Attributable to Minority Interest | 103,140 | 102,424 | (716) | (0.7%) |
| 211,808 |
GENERATION
In Brazil, the operating result of our affiliates amounted to Ch$ 203,493 million, which is 28.1% higher than the previous year, whose operating results amounted to Ch$ 158,812 million.
CACHOEIRA
The operating result of our Cachoeira Dourada affiliate increased by Ch$ 14,418 million, due principally to increased average sale prices, stated in local currency, and to the increment in physical sales of energy by 153 GWh, which reached 3,986.1 GWh in 2011.
In effect, the conversion of these financial statements from Brazilian reals to Chilean pesos in both periods caused a 0.2% drop in Chilean pesos as of for 2011 as compared to 2010.
Pg. 31
| PRESS RELEASE Year Ended 2011 |
Table 16 |
|
|
|
|
|
|
Cachoeira | Million Ch$ |
|
| Thousand US$ | ||
| 2010 | 2011 | Var 2010-2011 | Chg% |
| 2011 |
Operating Revenues | 115,663 | 126,646 | 10,983 | 9.5% |
| 261,898 |
Procurement and Services | (26,120) | (26,356) | (236) | (0.9%) |
| (54,504) |
Contribution Margin | 89,542 | 100,290 | 10,747 | 12.0% |
| 207,395 |
Other Costs | (6,270) | (6,512) | (241) | (3.9%) |
| (13,466) |
Gross Operating Income (EBITDA) | 83,272 | 93,778 | 10,506 | 12.6% |
| 193,929 |
Depreciation and Amortization | (7,410) | (3,497) | 3,913 | 52.8% |
| (7,232) |
Operating Income | 75,863 | 90,281 | 14,418 | 19.0% |
| 186,697 |
Figures may differ from those accounted under Brazilian GAAP. |
|
|
|
|
| |
|
|
|
|
|
|
|
Table 16.1 |
|
|
|
|
|
|
Cachoeira | 2010 | 2011 | Var 2010-2011 | Chg% |
|
|
GWh Produced | 3,430 | 3,121 | (309) | (9.0%) |
|
|
GWh Sold | 3,833 | 3,986 | 153 | 4.0% |
|
|
Market Share | 1.0% | 0.9% | (0.0) pp. |
|
|
|
FORTALEZA(CGTF)
The operating result of Endesa Fortaleza (CGTF) amounted to Ch$ 49,186 million, showing a Ch$ 9,928 million reduction as compared to the previous year. This reduction is mostly attributable to lower sale prices and to a drop in physical sales by 115 GWh, reaching 2,842.0 GWh in 2011.
In effect, the conversion of these financial statements from the Brazilian reals to the Chilean peso in both periods caused a 0.2% drop in Chilean pesos in 2011 when compared to 2010.
Table 17 |
|
|
|
|
|
|
Fortaleza | Million Ch$ |
|
| Thousand US$ | ||
| 2010 | 2011 | Var 2010-2011 | Chg% |
| 2011 |
Operating Revenues | 150,371 | 129,485 | (20,886) | (13.9%) |
| 267,769 |
Procurement and Services | (76,164) | (65,271) | 10,893 | 14.3% |
| (134,977) |
Contribution Margin | 74,208 | 64,215 | (9,993) | (13.5%) |
| 132,793 |
Other Costs | (7,060) | (6,906) | 154 | 2.2% |
| (14,282) |
Gross Operating Income (EBITDA) | 67,148 | 57,308 | (9,840) | (14.7%) |
| 118,511 |
Depreciation and Amortization | (8,033) | (8,122) | (89) | (1.1%) |
| (16,796) |
Operating Income | 59,114 | 49,186 | (9,928) | (16.8%) |
| 101,715 |
Figures may differ from those accounted under Brazilian GAAP. |
|
|
|
|
| |
|
|
|
|
|
|
|
Table 17.1 |
|
|
|
|
|
|
Fortaleza | 2010 | 2011 | Var 2010-2011 | Chg% |
|
|
GWh Produced | 1,665 | 1,033 | (632) | (37.9%) |
|
|
GWh Sold | 2,957 | 2,842 | (115) | (3.9%) |
|
|
Market Share | 0.7% | 0.7% | (0.1) pp. |
|
|
|
Pg. 32
| PRESS RELEASE Year Ended 2011 |
TRANSMISSION
CIEN
On the other hand, CIEN shows an increased operating result of Ch$ 40,725 million, reaching Ch$ 68,781 million as of 2011. The foregoing is mostly due to the initiation of toll charges (RAP – Permitted Annual Remuneration) at CIEN as of April 2011, as well as to lower asset depreciation, amortization and deterioration costs during 2011.
In effect, the conversion of these financial statements from the Brazilian reals to the Chilean peso in both periods caused a 0.2% drop in Chilean pesos in 2011 compared to 2010.
Table 18 |
|
|
|
|
|
|
Cien | Million Ch$ |
|
| Thousand US$ | ||
| 2010 | 2011 | Var 2010-2011 | Chg% |
| 2011 |
Operating Revenues | 98,909 | 59,918 | (38,991) | (39.4%) |
| 123,908 |
Procurement and Services | (7,277) | 34,182 | 41,459 | 569.8% |
| 70,687 |
Contribution Margin | 91,632 | 94,100 | 2,468 | 2.7% |
| 194,595 |
Other Costs | (10,791) | (9,252) | 1,540 | 14.3% |
| (19,132) |
Gross Operating Income (EBITDA) | 80,841 | 84,849 | 4,008 | 5.0% |
| 175,463 |
Depreciation and Amortization | (52,786) | (16,068) | 36,718 | 69.6% |
| (33,227) |
Operating Income | 28,055 | 68,781 | 40,726 | 145.2% |
| 142,236 |
Figures may differ from those accounted under Brazilian GAAP. |
|
|
|
|
| |
Pg. 33
| PRESS RELEASE Year Ended 2011 |
DISTRIBUTION
In Brazil, the operating result of our distribution affiliates amounted to Ch$ 354,645 million, which was 16.7% higher than that obtained for 2010.
AMPLA
Ampla’s operating result amounted to Ch$ 173,657 million, which compared to the previous year, representing an increase of Ch$ 52,969 million. Such increment is mostly attributable to a 2.2% greater margin in energy purchase/sale, a 3.0% increase in physical sales reaching 10,223 GWh during 2011 and to lower deterioration costs of Ch$48,737 million. Energy losses dropped by 0.8% p.p., going from 20.5% to 19.7%. The number of Ampla’s clients increased by 73 thousand, thus exceeding 2.6 million clients.
The effect of converting the financial statements of both these periods from the Brazilian reals to the Chilean peso caused a 0.2% drop in Chilean pesos in 2011, as compared to the previous year.
Table 19 |
|
|
|
|
|
|
Ampla | Million Ch$ |
|
| Thousand US$ | ||
| 2010 | 2011 | Var 2010-2011 | Chg% |
| 2011 |
Operating Revenues | 1,046,387 | 1,117,269 | 70,883 | 6.8% |
| 2,310,461 |
Procurement and Services | (695,862) | (759,227) | (63,364) | (9.1%) |
| (1,570,045) |
Contribution Margin | 350,525 | 358,043 | 7,518 | 2.1% |
| 740,416 |
Other Costs | (122,226) | (125,512) | (3,286) | (2.7%) |
| (259,553) |
Gross Operating Income (EBITDA) | 228,299 | 232,531 | 4,232 | 1.9% |
| 480,863 |
Depreciation and Amortization | (107,610) | (58,874) | 48,737 | 45.3% |
| (121,748) |
Operating Income | 120,688 | 173,657 | 52,969 | 43.9% |
| 359,115 |
Figures may differ from those accounted under Brazilian GAAP. |
|
|
|
|
| |
|
|
|
|
|
|
|
Table 19.1 |
|
|
|
|
|
|
Ampla | 2010 | 2011 | Var 2010-2011 | Chg% |
|
|
Customers (Th) | 2,571 | 2,643 | 73 | 2.8% |
|
|
GWh Sold | 9,927 | 10,223 | 296 | 3.0% |
|
|
Clients/Employee | 2,132 | 2,227 | 96 | 4.5% |
|
|
Energy Losses % | 20.5% | 19.7% | (0.8) pp. |
|
|
|
Pg. 34
| PRESS RELEASE Year Ended 2011 |
COELCE
Coelce’s operating income dropped by 1.2% to Ch$2,176 million, reaching Ch$180,988 million in 2011. This operating result drop is mostly attributable to a 9.8% lower local currency unit margins of energy purchases/sales, partly offset by the reduction in the costs of depreciation, amortization and deterioration to the tune of Ch$6,272 million. Physical sales increased by 1.4%, amounting to 8,970 GWh in 2011. Energy losses decreased by 0.2% p.p. up to 11.9% in 2011. Coelce’s number of clients expanded by 130 thousand, reaching 3.2 million clients.
The effect of converting the financial statements of both these periods from the Brazilian reals to the Chilean peso caused a 0.2% drop in Chilean pesos in 2011, as compared to the previous year.
Table 20 |
|
|
|
|
|
|
Coelce | Million Ch$ |
|
| Thousand US$ | ||
| 2010 | 2011 | Var 2010-2011 | Chg% |
| 2011 |
Operating Revenues | 940,655 | 859,446 | (81,209) | (8.6%) |
| 1,777,295 |
Procurement and Services | (615,112) | (537,909) | 77,204 | 12.6% |
| (1,112,370) |
Contribution Margin | 325,543 | 321,538 | (4,005) | (1.2%) |
| 664,925 |
Other Costs | (91,032) | (95,477) | (4,444) | (4.9%) |
| (197,441) |
Gross Operating Income (EBITDA) | 234,510 | 226,061 | (8,449) | (3.6%) |
| 467,484 |
Depreciation and Amortization | (51,345) | (45,073) | 6,272 | 12.2% |
| (93,208) |
Operating Income | 183,165 | 180,988 | (2,177) | (1.2%) |
| 374,276 |
Figures may differ from those accounted under Brazilian GAAP. |
|
|
|
|
| |
|
|
|
|
|
|
|
Table 20.1 |
|
|
|
|
|
|
Coelce | 2010 | 2011 | Var 2010-2011 | Chg% |
|
|
Customers (Th) | 3,095 | 3,224 | 130 | 4.2% |
|
|
GWh Sold | 8,850 | 8,970 | 120 | 1.4% |
|
|
Clients/Employee | 2,366 | 2,463 | 97 | 4.1% |
|
|
Energy Losses % | 12.1% | 11.9% | (0.2) pp. |
|
|
|
Pg. 35
| PRESS RELEASE Year Ended 2011 |
CHILE |  |
| GENERATION | |
ENDESACHILE |
Consolidated Income Statement of Endesa Chile
Table 21 |
|
|
|
|
|
|
Endesa Chile | (Million Ch$) |
|
| (Thousand US$) | ||
| 2010 | 2011 | Var 2010-2011 | Chg % |
| 2011 |
Sales | 2,397,945 | 2,387,451 | (10,493) | (0.4%) |
| 4,937,137 |
Other operating income | 37,438 | 17,039 | (20,399) | (54.5%) |
| 35,236 |
Total Revenues | 2,435,382 | 2,404,490 | (30,892) | (1.3%) |
| 4,972,373 |
Procurements and Services | (1,191,328) | (1,217,260) | (25,932) | (2.2%) |
| (2,517,237) |
Contribution Margin | 1,244,055 | 1,187,230 | (56,825) | (4.6%) |
| 2,455,136 |
Other Costs | (173,617) | (213,340) | (39,723) | (22.9%) |
| (441,176) |
Gross Operating Income (EBITDA) | 1,070,438 | 973,890 | (96,547) | (9.0%) |
| 2,013,960 |
Depreciation and Amortization | (179,714) | (185,920) | (6,206) | (3.5%) |
| (384,474) |
Operating Income | 890,724 | 787,971 | (102,753) | (11.5%) |
| 1,629,486 |
Net Financial Income | (119,717) | (121,295) | (1,579) | (1.3%) |
| (250,833) |
Financial income | 10,083 | 28,039 | 17,956 | 178.1% |
| 57,984 |
Financial expenses | (142,256) | (137,535) | 4,721 | 3.3% |
| (284,417) |
Income (Loss) for indexed assets and liabilities | (3,163) | (5,333) | (2,170) | (68.6%) |
| (11,028) |
Foreign currency exchange differences, net | 15,619 | (6,467) | (22,086) | (141.4%) |
| (13,373) |
Gains | 33,104 | 21,212 | (11,891) | (35.9%) |
| 43,866 |
Losses | (17,485) | (27,679) | (10,194) | (58.3%) |
| (57,239) |
Net Income from Related Comp. Cons. by the Prop. Eq.Method | 91,674 | 123,033 | 31,360 | 34.2% |
| 254,427 |
Net Income from Other Investments | 273 | 1,038 | 765 | 280.7% |
| 2,147 |
Net Income from Sales of Assets | 1,621 | 973 | (649) | (40.0%) |
| 2,011 |
Net Income before Taxes | 864,575 | 791,719 | (72,856) | (8.4%) |
| 1,637,238 |
Income Tax | (179,964) | (210,565) | (30,600) | (17.0%) |
| (435,437) |
NET INCOME | 684,611 | 581,155 | (103,456) | (15.1%) |
| 1,201,801 |
Net Income Attributable to Owners of the Company | 533,556 | 446,874 | (86,682) | (16.2%) |
| 924,114 |
Net Income Attributable to Minority Interest | 151,055 | 134,281 | (16,774) | (11.1%) |
| 277,686 |
*Includes generation subsidiaries in Chile, Argentina, Colombia and Peru.
Chilean Operations
The operating result in Chile for 2011 amounted to Ch$ 398,804 million, a decrease of 22.2% compared to 2010. The foregoing is mostly explained because of a drop in operating income showing a negative variation of 6.5% mostly due to a 6.6% reduction in average energy sales prices stated in pesos, added to the 2.0% increment in supply and services costs; which, in turn, were mostly attributable to higher energy purchasing costs and fuel consumption, partially offset by lower transportation costs.
The foregoing was also partially offset by greater physical sales, which increased by 1.0% in 2011; noteworthy among which were sales to non-regulated clients and on the spot market, as compared to the previous year.
The EBITDA of the business in Chile, or gross operating result, amounted to Ch$ 486,959 million in 2011, which represents an 18.5% drop when compared to 2010.
Pg. 36
| PRESS RELEASE Year Ended 2011 |
Table 22 |
|
|
|
|
|
|
Chilean Electricity Business | Million Ch$ |
|
| Thousand US$ | ||
| 2010 | 2011 | Var 2010-2011 | Chg% |
| 2011 |
Operating Revenues | 1,345,371 | 1,257,995 | (87,376) | (6.5%) |
| 2,601,475 |
Procurement and Services | (666,388) | (679,799) | (13,410) | (2.0%) |
| (1,405,792) |
Contribution Margin | 678,982 | 578,197 | (100,786) | (14.8%) |
| 1,195,683 |
Other Costs | (81,834) | (91,237) | (9,403) | (11.5%) |
| (188,674) |
Gross Operating Income (EBITDA) | 597,149 | 486,959 | (110,189) | (18.5%) |
| 1,007,009 |
Depreciation and Amortization | (84,379) | (88,155) | (3,776) | (4.5%) |
| (182,301) |
Operating Income | 512,769 | 398,804 | (113,965) | (22.2%) |
| 824,708 |
|
|
|
|
|
|
|
|
|
|
|
|
|
|
Table 22.1 |
|
|
|
|
|
|
Chilean Electricity Business | 2010 | 2011 | Var 2010-2011 | Chg% |
|
|
GWh Produced | 20,914 | 20,722 | (192) | (0.9%) |
|
|
GWh Sold | 21,847 | 22,070 | 222 | 1.0% |
|
|
Market Share | 39.8% | 38.0% | (1.8) pp. |
|
|
|
DISTRIBUTION
CHILECTRA
In Chile, our Chilectra affiliate showed an operating result of Ch$ 119,685 million, which represents an increment of Ch$ 7,918 million compared to 2010, or the equivalent of 7.1%. Such increment is mostly explained by the greater margin of the energy business, to the tune of Ch$ 26,062 million, as a result of the greater demand for electric energy during the present period and the drop of other fixed operating expenses amounting to Ch$ 3,876 million, explained mostly by lower costs associated to maintenance and repair activities and others. The foregoing, however, was partly offset by increased personnel costs of Ch$ 4,721 million, higher transportation costs of Ch$ 7,242 million and the recognition of losses brought about by the provisions made over its investments in Argentina by Ch$ 4,800 million. Energy losses dropped by 0.3 p.p. compared to 2010, reaching 5.5%. Physical energy sales expanded by 4.6%, reaching 13,697 GWh as of December 2011.
The number of clients expanded by 28 thousand clients, exceeding 1.6 million during the present period.
Pg. 37
| PRESS RELEASE Year Ended 2011 |
Table 23 |
|
|
|
|
|
|
Chilectra | (Million Ch$) |
|
| (Thousand US$) | ||
| 2010 | 2011 | Var 2010-2011 | Chg % |
| 2011 |
Sales | 1,003,001 | 1,035,360 | 32,359 | 3.2% |
| 2,141,076 |
Other operating income | 13,996 | 10,831 | (3,166) | (22.6%) |
| 22,398 |
Total Revenues | 1,016,997 | 1,046,191 | 29,194 | 2.9% |
| 2,163,474 |
Procurements and Services | (788,044) | (803,854) | (15,810) | (2.0%) |
| (1,662,333) |
Contribution Margin | 228,953 | 242,337 | 13,383 | 5.8% |
| 501,141 |
Other Costs | (87,024) | (87,869) | (845) | (1.0%) |
| (181,709) |
Gross Operating Income (EBITDA) | 141,929 | 154,468 | 12,538 | 8.8% |
| 319,432 |
Depreciation and Amortization | (30,163) | (34,783) | (4,620) | (15.3%) |
| (71,930) |
Operating Income | 111,767 | 119,685 | 7,918 | 7.1% |
| 247,502 |
Net Financial Income | 2,470 | 10,648 | 8,178 | 331.1% |
| 22,020 |
Financial income | 10,576 | 15,874 | 5,298 | 50.1% |
| 32,827 |
Financial expenses | (8,049) | (4,383) | 3,665 | 45.5% |
| (9,065) |
Income (Loss) for indexed assets and liabilities | 154 | 42 | (112) | (72.6%) |
| 87 |
Foreign currency exchange differences, net | (212) | (885) | (673) | (318.2%) |
| (1,830) |
Gains | 2,679 | 798 | (1,881) | (70.2%) |
| 1,650 |
Losses | (2,891) | (1,683) | 1,208 | 41.8% |
| (3,480) |
Net Income from Related Comp. Cons. by the Prop. Eq.Method | 60,117 | 14,077 | (46,040) | (76.6%) |
| 29,111 |
Net Income from Other Investments | - | - | - |
|
| - |
Net Income from Sales of Assets | (3) | (4) | (1) | (28.5%) |
| (9) |
Net Income before Taxes | 174,351 | 144,406 | (29,945) | (17.2%) |
| 298,624 |
Income Tax | (23,402) | (33,615) | (10,213) | (43.6%) |
| (69,514) |
NET INCOME | 150,948 | 110,791 | (40,157) | (26.6%) |
| 229,110 |
Net Income Attributable to Owners of the Company | 150,948 | 110,791 | (40,158) | (26.6%) |
| 229,110 |
Net Income Attributable to Minority Interest |
|
|
|
|
|
|
Table 23.1 |
|
|
|
| ||
Chilectra | 2010 | 2011 | Var 2010-2011 | Chg% | ||
Customers (Th) | 1,610 | 1,638 | 28 | 1.8% | ||
GWh Sold | 13,098 | 13,697 | 599 | 4.6% | ||
Clients/Employee | 2,239 | 2,301 | 62 | 2.8% | ||
Energy Losses % | 5.8% | 5.5% | (0.3) pp. |
| ||
Pg. 38
| PRESS RELEASE Year Ended 2011 |
COLOMBIA |  |
GENERATION | |
EMGESA |
The operating result of our operation in Colombia amounted to Ch$ 253,508 million in 2011, dropping by Ch$ 7,975 million or by the equivalent of 3.0% compared to the previous year. The main effect comes from the impact of the reform on the Equity Tax, which entailed registering –on January 1, 2011- the total amount payable under this concept during the entire 2011-2014 period, including a 25% surcharge. Thus, the alluded tax went from an effective rate of 4.8% to 6.0% on Net Equity as of January 1, 2011. This situation affected the operating result by Ch$ 40,182 million. To that we must add this year’s lower income because of energy sales of Ch$ 10,742 million, explained by the drop in average energy sales prices.
The foregoing was almost totally offset by the drop in energy and fuel purchase costs, which dropped by Ch$ 43,256 million and Ch$ 3,834 million, respectively, as a consequence of a greater hydraulic generation in the year 2011.
Physical energy sales grew by 2.0% reaching 15,111 GWh and the EBITDA or gross operating result in Colombia dropped by 3.0% in FY 2011, reaching Ch$ 290,773 million.
The effect of converting these financial statements from Colombian to Chilean pesos in both fiscal years caused a 2.6% reduction in their Chilean peso amount as of December de 2011 when compared to those of December 2010.
Table 24 |
|
|
|
|
|
|
Emgesa | Million Ch$ |
|
| Thousand US$ | ||
| 2010 | 2011 | Var 2010-2011 | Chg% |
| 2011 |
Operating Revenues | 507,526 | 498,569 | (8,958) | (1.8%) |
| 1,031,017 |
Procurement and Services | (176,746) | (134,978) | 41,768 | 23.6% |
| (279,128) |
Contribution Margin | 330,780 | 363,591 | 32,811 | 9.9% |
| 751,889 |
Other Costs | (32,725) | (72,819) | (40,094) | (122.5%) |
| (150,585) |
Gross Operating Income (EBITDA) | 298,055 | 290,773 | (7,283) | (2.4%) |
| 601,304 |
Depreciation and Amortization | (36,573) | (37,264) | (691) | (1.9%) |
| (77,061) |
Operating Income | 261,482 | 253,508 | (7,974) | (3.0%) |
| 524,243 |
Figures may differ from those accounted under Colombian GAAP. |
|
|
|
|
| |
|
|
|
|
|
|
|
Table 24.1 |
|
|
|
|
|
|
Emgesa | 2010 | 2011 | Var 2010-2011 | Chg% |
|
|
GWh Produced | 11,283 | 12,090 | 808 | 7.2% |
|
|
GWh Sold | 14,817 | 15,112 | 294 | 2.0% |
|
|
Market Share | 17.9% | 18.8% | 0.8 pp. |
|
|
|
Pg. 39
| PRESS RELEASE Year Ended 2011 |
DISTRIBUTION
CODENSA
In Colombia, Codensa’s operating result during this period amounted to Ch$ 185,462 million, which represents a drop of Ch$ 21,760 million. The principal effect arose from the impact of the reform on Equity Taxes, which entailed registering –on January 1, 2011- the total amount payable under this concept during the entire 2011-2014 period, including a 25% surcharge. Thus, this tax went from an effective rate of 4.8% to 6% over Net Equity as of January 2011. This situation affected the company’s operating result by Ch$ 19,663 million. Additionally, during the year other fixed operating costs increased to the tune of Ch$ 24,193, partly offset by a better margin in energy purchases/sales. Physical sales expanded by 2.7%, reaching 12,857 GWh in the present year. Energy losses dropped by 0.4 p.p. up to 8.1% and the number of clients increased by 70 thousand, reaching 2.6 million as of December 2011.
The effect of converting these financial statements from Colombian to Chilean pesos in both fiscal years caused a 2.6% reduction in their Chilean peso amount as of December de 2011 when compared to those of December 2010.
Table 25 |
|
|
|
|
|
|
Codensa | Million Ch$ |
|
| Thousand US$ | ||
| 2010 | 2011 | Var 2010-2011 | Chg% |
| 2011 |
Operating Revenues | 785,890 | 815,487 | 29,597 | 3.8% |
| 1,686,388 |
Procurement and Services | (426,626) | (451,192) | (24,566) | (5.8%) |
| (933,043) |
Contribution Margin | 359,264 | 364,295 | 5,031 | 1.4% |
| 753,345 |
Other Costs | (87,641) | (114,377) | (26,735) | (30.5%) |
| (236,526) |
Gross Operating Income (EBITDA) | 271,623 | 249,918 | (21,704) | (8.0%) |
| 516,820 |
Depreciation and Amortization | (64,400) | (64,456) | (56) | (0.1%) |
| (133,293) |
Operating Income | 207,222 | 185,462 | (21,760) | (10.5%) |
| 383,527 |
Figures may differ from those accounted under Colombian GAAP. |
|
|
|
|
| |
|
|
|
|
|
|
|
Table 25.1 |
|
|
|
|
|
|
Codensa | 2010 | 2011 | Var 2010-2011 | Chg% |
| |
Customers (Th) | 2,547 | 2,617 | 70 | 2.8% |
|
|
GWh Sold | 12,515 | 12,857 | 343 | 2.7% |
|
|
Clients/Employee | 2,351 | 2,377 | 25 | 1.1% |
|
|
Energy Losses % | 8.5% | 8.1% | (0.4) pp. |
|
|
|
Pg. 40
| PRESS RELEASE Year Ended 2011 |
PERU |  |
| GENERATION | |
EDEGEL |
In Peru, the operating result amounted to Ch$ 104,655 million in 2011, which represents a 48.8% increment compared to that registered in 2010. This growth is mostly attributable to a Ch$ 28,578 million increase in operating income, as a consequence of a 9.9% increment in tangible (physical) sales and a hike in the average price of energy sales. The foregoing was also favored by lower personnel expenses in the amount of Ch$ 8,819 million.
This better result was partly offset by greater fuel consumption and transportation costs totaling Ch$ 7,528 million, given Edegel’s greater thermal generation.
Physical sales grew by 9.9% reaching 9,449.5 GWh as of December 2011 (8,598.2 GWh in 2010). The EBITDA of the business in Peru, or gross operating result, amounted to Ch$ 141,379 million in 2011, which represents an increment of 30.3% when comparing it to 2010.
The effect of converting these financial statements from Peruvian sols to Chilean pesos in both fiscal years caused a 2.7% reduction in their Chilean peso amount as of December de 2011, when compared to those of December 2010.
Table 26 |
|
|
|
|
|
|
Edegel | Million Ch$ |
|
| Thousand US$ | ||
| 2010 | 2011 | Var 2010-2011 | Chg% |
| 2011 |
Operating Revenues | 211,264 | 239,841 | 28,578 | 13.5% |
| 495,981 |
Procurement and Services | (80,241) | (85,650) | (5,410) | (6.7%) |
| (177,121) |
Contribution Margin | 131,023 | 154,191 | 23,168 | 17.7% |
| 318,860 |
Other Costs | (22,495) | (12,812) | 9,683 | 43.0% |
| (26,495) |
Gross Operating Income (EBITDA) | 108,528 | 141,379 | 32,851 | 30.3% |
| 292,365 |
Depreciation and Amortization | (38,209) | (36,724) | 1,484 | 3.9% |
| (75,944) |
Operating Income | 70,319 | 104,655 | 34,335 | 48.8% |
| 216,421 |
Figures may differ from those accounted under Peruvian GAAP. |
|
|
|
|
| |
|
|
|
|
|
|
|
Table 26.1 |
|
|
|
|
|
|
Edegel | 2010 | 2011 | Var 2010-2011 | Chg% |
|
|
GWh Produced | 8,466 | 9,153 | 687 | 8.1% |
|
|
GWh Sold | 8,598 | 9,450 | 851 | 9.9% |
|
|
Market Share | 29.1% | 29.7% | 0.6 pp. |
|
|
|
Pg. 41
| PRESS RELEASE Year Ended 2011 |
DISTRIBUTION
EDELNOR
In Peru, our Edelnor affiliate shows an operating result de Ch$ 69,900 million; i.e. Ch$ 4,952 million higher to that obtained in the previous year. Such increment is mostly attributable to greater physical sales of energy, which increased by 7.3% reaching 6,572 GWh during the current period, added to greater purchase/sale unit margins and to greater income from other services amounting to Ch$ 1,235 million and lower fixed costs of Ch$ 747 million. Energy losses diminished by 0.1% p.p. up to 8.2% in the current year. The number of clients expanded by 46 thousand, exceeding 1.1 million clients.
The effect of converting the financial statements of both these periods from Peruvian sols to Chilean pesos caused a 2.7% drop in Chilean pesos as of December 2011, as compared to the same period of 2010.
Table 27 |
|
|
|
|
|
|
Edelnor | Million Ch$ |
|
| Thousand US$ | ||
| 2010 | 2011 | Var 2010-2011 | Chg% |
| 2011 |
Operating Revenues | 307,159 | 329,309 | 22,150 | 7.2% |
| 680,996 |
Procurement and Services | (193,646) | (210,905) | (17,259) | (8.9%) |
| (436,142) |
Contribution Margin | 113,513 | 118,404 | 4,891 | 4.3% |
| 244,854 |
Other Costs | (27,105) | (26,052) | 1,053 | 3.9% |
| (53,874) |
Gross Operating Income (EBITDA) | 86,408 | 92,352 | 5,944 | 6.9% |
| 190,980 |
Depreciation and Amortization | (21,460) | (22,453) | (993) | (4.6%) |
| (46,431) |
Operating Income | 64,948 | 69,900 | 4,951 | 7.6% |
| 144,549 |
Figures may differ from those accounted under Peruvian GAAP. |
|
|
|
|
| |
|
|
|
|
|
|
|
Table 27.1 |
|
|
|
|
|
|
Edelnor | 2010 | 2011 | Var 2010-2011 | Chg% |
| |
Customers (Th) | 1,098 | 1,144 | 47 | 4.2% |
|
|
GWh Sold | 6,126 | 6,572 | 446 | 7.3% |
|
|
Clients/Employee | 1,985 | 2,080 | 95 | 4.8% |
|
|
Energy Losses % | 8.3% | 8.2% | (0.1) pp. |
|
|
|
Pg. 42
| PRESS RELEASE Year Ended 2011 |
Operating Income by Subsidiary
Summary of operating revenues, operating costs (including procurements, services and other costs) and operating income of all Enersis’ subsidiaries, for the period ended in December 31, 2010 and December 31, 2011, detailed as follows:
Table 28 |
|
|
|
|
|
|
2010 | 2011 | |||||
Million Ch$ | Operating Revenues | Operating Costs | Operating Income | Operating Revenues | Operating Costs | Operating Income |
Endesa Chile (*) | 2,435,382 | (1,544,659) | 890,724 | 2,404,490 | (1,616,520) | 787,971 |
Cachoeira (**) | 115,663 | (39,800) | 75,863 | 126,646 | (36,365) | 90,281 |
Fortaleza (***) | 150,371 | (91,257) | 59,114 | 129,485 | (80,299) | 49,186 |
Cien (**) | 98,909 | (70,854) | 28,055 | 59,918 | 8,863 | 68,781 |
Chilectra | 1,016,997 | (905,231) | 111,767 | 1,046,191 | (926,506) | 119,685 |
Edesur | 295,538 | (291,594) | 3,944 | 279,725 | (416,895) | (137,170) |
Distrilima (Edelnor) | 307,159 | (242,211) | 64,948 | 329,309 | (259,410) | 69,900 |
Ampla | 1,046,387 | (925,698) | 120,688 | 1,117,269 | (943,612) | 173,657 |
Coelce | 940,655 | (757,490) | 183,165 | 859,446 | (678,458) | 180,988 |
Codensa | 785,890 | (578,667) | 207,222 | 815,487 | (630,025) | 185,462 |
CAM Ltda. | 132,194 | (132,925) | (731) | 15,739 | (17,179) | (1,439) |
Inmobiliaria Manso de Velasco Ltda. | 10,835 | (2,937) | 7,898 | 8,099 | (2,396) | 5,703 |
Synapsis Soluciones y Servicios IT Ltda. | 66,070 | (69,143) | (3,073) | 6,693 | (6,556) | 137 |
ICT | 2,398 | (2,479) | (81) | 6,120 | (5,159) | 961 |
Enersis Holding and other investment vehicles | 21,854 | (43,027) | (21,173) | 39,259 | (58,718) | (19,459) |
Consolidation Adjustments | (862,720) | 838,690 | (24,030) | (708,997) | 700,664 | (8,333) |
Total Consolidation | 6,563,581 | (4,859,280) | 1,704,301 | 6,534,880 | (4,968,570) | 1,566,311 |
Table 28.1 |
|
|
| |||
2011 | ||||||
Thousand US$ | Operating Revenues | Operating Costs | Operating Income | |||
Endesa Chile (*) | 4,972,373 | (3,342,886) | 1,629,486 | |||
Cachoeira (**) | 261,898 | (75,201) | 186,697 | |||
Fortaleza (***) | 267,769 | (166,054) | 101,715 | |||
Cien (**) | 123,908 | 18,328 | 142,236 | |||
Chilectra | 2,163,474 | (1,915,971) | 247,502 | |||
Edesur | 578,458 | (862,119) | (283,661) | |||
Distrilima (Edelnor) | 680,996 | (536,447) | 144,549 | |||
Ampla | 2,310,461 | (1,951,345) | 359,115 | |||
Investluz (Coelce) | 1,777,295 | (1,403,019) | 374,276 | |||
Codensa | 1,686,388 | (1,302,861) | 383,527 | |||
CAM Ltda. | 32,548 | (35,525) | (2,977) | |||
Inmobiliaria Manso de Velasco Ltda. | 16,749 | (4,955) | 11,794 | |||
Synapsis Soluciones y Servicios IT Ltda. | 13,841 | (13,558) | 283 | |||
ICT | 12,656 | (10,668) | 1,988 | |||
Enersis Holding and other investment vehicles | 81,186 | (121,426) | (40,240) | |||
Consolidation Adjustments | (1,466,173) | 1,448,940 | (17,233) | |||
Total Consolidation | 13,513,825 | (10,274,768) | 3,239,057 | |||
(*) Since January 1st, 2009, includes Gas Atacama, Transquillota e HydroAysén
(**) Consolidated by Endesa Chile until September 30th, 2005. Since October 1st, 2005 is consolidated by Enersis through Endesa Brasil.
(***) Since October 1st, 2005, these subsidiaries are consolidated by Enersis through Endesa Brasil.
Pg. 43
| PRESS RELEASE Year Ended 2011 |
MARKETINFORMATION
EQUITYMARKET
New York Stock Exchange (NYSE)
The charts below show the performance of Enersis’ ADS (“ENI”) price at the NYSE, compared to the Dow Jones Industrials and the Dow Jones Utilities indexes over the last 12 months, as well as the trading volume, both in the NYSE.
ENI - Stock price evolution compared to
Dow Jones Industrials and Dow Jones Utilities
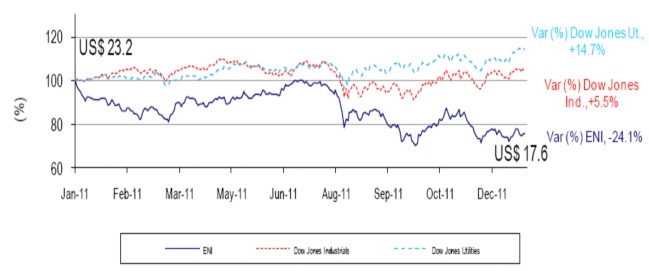
Daily Average Transactions Volume
New York Stock Exchange (1 ADS = 50 common shares)
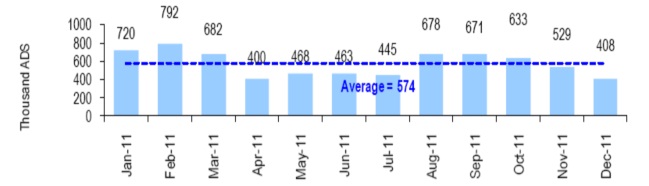
Pg. 44
| PRESS RELEASE Year Ended 2011 |
Santiago Stock Exchange (BCS)
The charts below show the performance of Enersis’ Chilean stock price over the last 12 months compared to the Chilean Selective Stock Index (IPSA), as well as the daily average aggregate trading volume in the Santiago and Chilean Electronic Stock Exchange:
Enersis -Stock price evolution compared to IPSA |
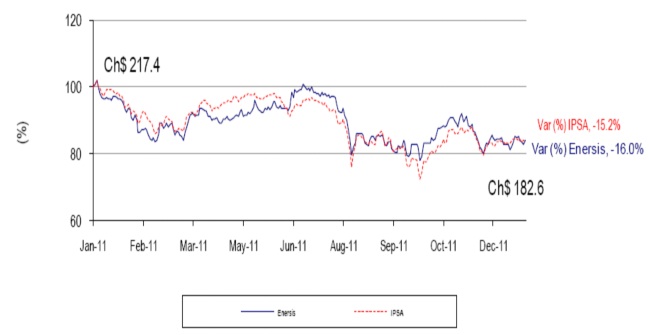 |
Daily Average Transactions Volume |
 |
Pg. 45
| PRESS RELEASE Year Ended 2011 |
Madrid Stock Exchange (Latibex) - Spain
The charts below show Enersis’ share price (“XENI”) at the Latibex over the last 12 months compared to the local stock index (IBEX), as well as the daily average trading volume in the Latibex.
XENI - Stock price evolution compared to Latibex
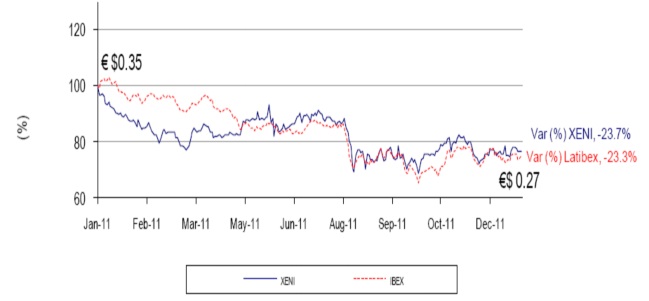
Daily Average Transactions Volume
Latibex (1 Unit = 1 common share)
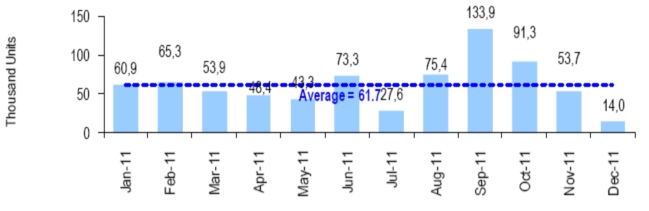
Note:Since May 2011 onwards, the Madrid Stock Exchange modified the terms of transactions’ relations for companies listed in Latibex, changing the former contract per unit of Enersis using a 50:1 ratio, to a 1:1 ratio. Therefore, each share traded in that exchange became equivalent to one common share traded in its domestic market. The charts above consider price evolution and sales volume according to the new standard.
Source: Bloomberg
Pg. 46
| PRESS RELEASE Year Ended 2011 |
DEBTMARKET
Yankee Bonds Price Evolution
The following chart shows the pricing of two of our Yankee Bonds over the last 12 months compared to the Ishares Iboxx Investment Grade Corporate Bond Fund Index:
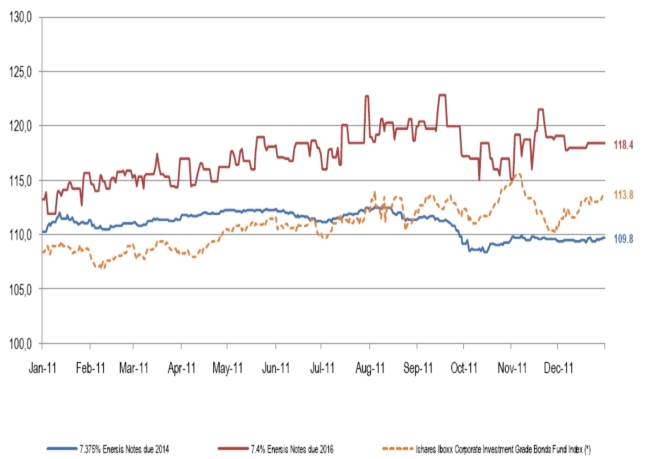
Source: Bloomberg
(*) Ishares Iboxx Investment Grade Corporate Bond Fund Index is an exchange traded fund incorporated in the U.S.A. The Index measures the performance of a fixed number of investment grade corporate bonds.
Pg. 47
| PRESS RELEASE Year Ended 2011 |
OWNERSHIP OF THECOMPANY AS OFDECEMBER31, 2011
TOTAL SHAREHOLDERS: 7,446
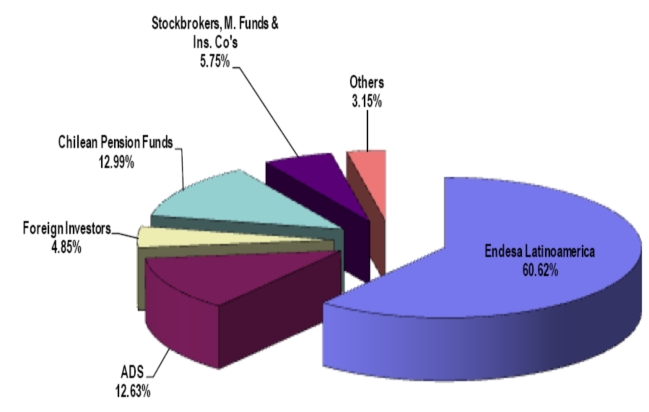
CONFERENCECALLINVITATION
Enersis is pleased to invite you to participate in aConference Callwith the management to review the results for the period, onTuesday, January 31, 2012, at 15:00 PM EST (17:00 PM Local Chile Time).
There will be a question and answer session following management's comments. Representing Enersis will be Mr. Alfredo Ergas, Chief Financial Officer and the Investor Relations Team.
To participate, please dial+1 (617) 213 4853or+1 (888) 680 0865(toll free USA), approximately 10 minutes prior to the scheduled start time,Passcode ID: 83418216.
To access the phone replay, please dial+1 (617) 801 6888or+1 (888) 286 8010(toll free USA)
Passcode ID: 92221486.
FOR THISCONFERENCECALL YOU CAN ACCESS PREVIOUSLY TO THE PRE-REGISTRATION SITE AT
HTTPS://WWW.THECONFERENCINGSERVICE.COM/PREREG/KEY.PROCESS?KEY=PVX6QQLA3
AND MAKE YOUR REGISTRATION QUICKER. IF NOT,PLEASE CONNECT APPROXIMATELY15MINUTES PRIOR TO THE SCHEDULED START TIME. YOU CAN ALSO ACCESS TO THE CONFERENCE CALL REPLAY THROUGH OURINVESTORRELATIONS WEBSITE AT HTTP://WWW.ENERSIS.CL.
Pg. 48
| PRESS RELEASE Year Ended 2011 |
Contact Information
For further information, please contact us:
| Ricardo Alvial | Denisse Labarca | |||
| Investments and Risks Director | Head of Investor Relations | |||
| mlmr@enersis.cl | denisse.labarca@enersis.cl | |||
| (56-2) 353 4682 | (56-2) 353 4576 | |||
| Nicolas Donoso | Jorge Velis | Carmen Poblete | ||
| Investor Relations Associate | Investor Relations Associate | Shares Department Representative | ||
| ndo@enersis.cl | jgve@enersis.cl | cpt@enersis.cl | ||
| (56-2) 353 4492 | (56-2) 353 4552 | (56-2) 353 4447 | ||
| Maria Luz Muñoz | ||||
| Investor Relations Assistant | ||||
| mlmr@enersis.cl | ||||
| (56-2) 353 4682 |
DISCLAIMER
This Press Release contains statements that could constitute forward-looking statements within the meaning of the Private Securities Litigation Reform Act of 1995. These statements appear in a number of places in this announcement and include statements regarding the intent, belief or currentexpectations of Enersis and its management with respect to, among other things: (1) Enersis’ business plans; (2) Enersis’ cost-reduction plans; (3) trends affecting Enersis’ financial condition or results ofoperations, including market trends in the electricity sector in Chile or elsewhere; (4) supervision and regulation of the electricity sector in Chile or elsewhere; and (5) the future effect of any changes in thelaws and regulations applicable to Enersis’ or its subsidiaries. Such forward-looking statements are not guarantees of future performance and involve risks and uncertainties. Actual results may differ materially from those in the forward-looking statements as a result of various factors. These factors include a decline in the equity capital markets of the United States or Chile, an increase in the market rates of interest in the United States or elsewhere, adverse decisions by government regulators in Chileor elsewhere and other factors described in Enersis’ Annual Report on Form 20-F. Readers are cautioned not to place undue reliance on those forward-looking statements, which state only as of their dates. Enersis undertakes no obligation to release publicly the result of any revisions to these forward-looking statements.
Pg. 49
SIGNATURES
Pursuant to the requirements of the Securities Exchange Act of 1934, as amended, the Registrant has duly caused this report to be signed on its behalf by the undersigned, thereunto duly authorized.
| ENERSIS S.A. | |
| By: /s/ Ignacio Antoñanzas Alvear | |
| -------------------------------------------------- | |
| Title: Chief Executive Officer |
Date: February 01, 2012