FORM 6-K
SECURITIES AND EXCHANGE COMMISSION
Washington, D.C. 20549
Report of Foreign Issuer
Pursuant to Rule 13a-16 or 15d-16 of
the Securities Exchange Act of 1934
For the month of October, 2011
Commission File Number: 001-12440
ENERSIS S.A.
(Translation of Registrant’s Name into English)
Santa Rosa 76
Santiago, Chile
(Address of principal executive office)
Indicate by check mark whether the registrant files or will file
annual reports under cover of Form 20-F or Form 40-F:
Form 20-F [X] Form 40-F [ ]
Indicate by check mark if the registrant is submitting the Form 6-K
in paper as permitted by Regulation S-T Rule 101(b)(1):
Yes [ ] No [X]
Indicate by check mark if the registrant is submitting the Form 6-K
in paper as permitted by Regulation S-T Rule 101(b)(7):
Yes [ ] No [X]
Indicate by check mark whether by furnishing the information
ontained in this Form, the Registrant is also thereby furnishing the
information to the Commission
pursuant to Rule 12g3-2(b) under the Securities Exchange Act of 1934:
Yes [ ] No [X]
If °;Yes” is marked, indicate below the file number assigned to the registrant
in connection with Rule 12g3-2(b): N/A
![]()
ENERSIS
ANNOUNCES CONSOLIDATED RESULTS
FOR THE PERIOD ENDED ON SEPTEMBER 30, 2011
Highlights for the Period
Summary
Ø The first nine months of the year confirmed the strong growth in demand for electricity in the countries where we operate, as a result of the dynamic economic activity in these markets.
Ø Regarding the distribution business, it is important to note the improvement in our Peruvian and Chilean operations, with growth in electricity demand of 7.6% and 4.9% respectively.
Ø In the generation business, operating revenues fell 3.1% mainly due to lower sales average prices, partially offset by higher physical sales in Peru and Argentina.
Ø Our Bocamina I coal-fired thermal plant damaged by the Chilean earthquake in February 2010, started operating once again. This has permitted us to provide the Chilean Central Interconnected System (“SIC”) with a stable and secure source of energy during a dry year.
Ø The Company’s EBITDA showed a decrease of Ch$ 165,706 million, primarily due to Ch$ 24,910 million in higher costs related to power purchases in the generation business, mainly in Chile. This decrease was partially compensated by lower purchase prices in other countries. Additionally, Enersis accounted for the full impact of the equity tax reform in Colombia, for taxes payable throughout the 2011-2014 period. This non-recurring factor affected operating income of our Colombian operations (both distribution and generation subsidiaries) by Ch$ 59,558 million. Results in our Brazilian and Peruvian generation companies and in our Chilean and Peruvian distribution companies partly offset the lower results in other countries and business segments.
Ø EBITDA for the Enersis Group was very balanced in terms of business segment:
• Generation and Transmission: 54%
• Distribution: 46%
Ø Our distribution business customer base increased by around 355,000 customers, which confirms the natural growth of this business, an important stabilizing factor for our cash flows.
Ø Operating income for the period amounted to Ch$ 1,199,430 million, representing a decline of 7.0% compared to the same period in 2010.
Pg. 1
Distribution Business
Consolidated figures for the distribution businesses are detailed as follows:
Ø Operating revenues rose by 3.3% to Ch$ 3,289,889 million.
Ø The cost of sales was Ch$ 2,135,763 million, a 5.8% increase over the same period of the previous year.
Ø EBITDA in the period amounted to Ch$ 698,325 million, a reduction of 6.8% compared to the same period in 2010, principally due to the reduced results of our businesses in Argentina, Colombia and Brazil, partially compensated by improvements in Chile and Peru.
The factors influencing this lower distribution business EBITDA are:
In Chile, EBITDA grew by Ch$ 18,057 million, mainly explained by:
Ø A better energy sales margin related to 4.9% higher physical energy sales, which was reflected in higher sales volume in every market segment.
Ø Greater non-energy revenues as a result of higher economic activity, which impacted revenues from other businesses.
In Peru, EBITDA rose by Ch$ 4,677 million as a result of:
Ø A 7.6% increase in physical sales, as well as greater revenues from other businesses.
Ø Lower procurement and services costs mainly from synergies in technology and information systems, partially compensated by increases in energy purchases.
In Argentina, EBITDA decreased by Ch$ 34,368 million, mainly explained by:
Ø A reduced energy sales margin explained mainly by lower industrial and commercial client sales margins, and by increased wages under collective bargaining agreements, partly offset by,
Ø Higher residential consumption, which reflects growth in the number of clients and lower temperatures during this winter season in relation to last year’s.
In Brazil, EBITDA decreased by Ch$ 10,629 million as a result of:
Ø Reduced sales margin, both in Ampla and in Coelce, and higher fixed costs in Ampla, partly offset by,
Ø Higher revenues in Ampla due to greater physical sales.
In Colombia, EBITDA decreased by Ch$ 28,773 million, principally as a result of:
Ø The effect of the Colombian government equity tax reform, which implied recording on January 1st, 2011 the entire tax payable for this concept within 2011-2014.
Ø This effect more than offset the positive operating results registered in the period.
Pg. 2
Generation and Transmission Business
Ø Consolidated physical sales increased by 1.2% to 47,857 GWh, led by increases in Argentina and Peru, partially offset by decreases in Chile, Brazil and Colombia.
Ø Operating revenues decreased 3.1% to Ch$ 2,012,421, mainly explained by lower sales prices, partially offset by higher physical sales in Peru and Argentina.
Ø Procurement and services costs rose by 1.4% to Ch$ 1,023,462 million as a result of higher energy purchase costs in Chile and higher fuel consumption in Argentina.
Ø EBITDA amounted to Ch$ 822,178 million, a decrease of 11.8% compared with the nine‑month period ending September 30, 2010.
Ø Consolidated hydroelectric generation declined by 7.0%, explained by Chile, Argentina and Brazil, partially offset with Colombia y Peru.
The factors affecting these results are:
In Chile,EBITDA decreased by Ch$ 111,408 million, mainly due to:
Ø Higher energy purchase costs of Ch$ 62,675 million,
Ø Lower sales revenues of Ch$ 56,950 million due to lower water availability which impacted sales to the spot market.
Ø Partially compensated by lower fuel consumption of Ch$ 16,600 million and lower transport expenses of Ch$ 17,666 million and,
In Colombia, EBITDA fell by Ch$ 23,793 million, mainly due to:
Ø An increase in other fixed operating costs of Ch$ 38,958 million, mainly explained by the non-recurring effect of the equity tax reform which implied the booking on January 1, 2011 of the full amount payable in the period 2011-2014.
Ø Reduced energy sales revenues of Ch$ 24,867 million due to 5.0% lower average sales prices and a decrease of 1.4% in physical sales, partially compensated by
Ø A reduction in cost of energy purchases of Ch$ 39,881 million, explained by lower thermal dispatch because of higher hydro generation.
In Peru, EBITDA increased by Ch$ 21,440 million due to:
Ø Higher energy sales revenues of Ch$ 15,193 million explained by higher generation from both thermal and hydro facilities, and
Ø Lower personnel expenses by Ch$ 9,724 million and a decrease in the cost of energy purchases by Ch$ 1,460 million, partially compensated by
Ø Higher fuel consumption cost of Ch$ 2,095 million and an increase in transport expenses of Ch$ 1,896 million, linked to the higher thermal dispatch.
In Argentina, EBITDA decreased by Ch$ 13,913 million due to:
Ø A higher fuel consumption cost of Ch$ 43,166 million, and an increase in transport expenses of Ch$ 3,896 million related to higher thermal dispatch.
Ø Higher energy purchases costs of Ch$ 4,500 million, and an increase in personnel expenses of Ch$ 4,222 million, explained by increased wages under collective bargaining agreements, partially offset by
Ø Higher energy sales of Ch$ 44,989 million, linked to a 7.4% increase in sales volume.
Pg. 3
![]()
In Brazil,EBITDA rose by Ch$ 18,205 million due to:
Ø Increase of Ch$ 14,016 million in contribution margin due to the recognition of CIEN as a regulatory asset by local authorities since April 2011, thereby allowing the billing of toll revenues according to the RAP system (permitted annual revenue.)
Ø Lower fuel consumption of Ch$ 3,137 million, due to a 69% lower generation in Fortaleza. The latter increased its power purchases in the spot market, taking advantage of the low price of the energy, thus increasing its margin. This was partially offset by a 3.3% lower sales volume in Cachoeira Dourada.
Financial Summary
Ø The average interest rate increased, from 8.4% up to 9.3%, mainly because of inflationary effects.
Ø Liquidity, a key consideration in our financial management, continues to be in a very solid position, as shown below on a consolidated basis for Enersis:
· Cash and cash equivalents amount to US$ 1,797 million.
· Committed credit lines for US$ 792 million.
· Non-committed credit lines available for US$ 1,789 million available on a consolidated basis.
Ø Within this context, it is important to highlight the successful issuance of an unsecured bond in local currency by Emgesa, our Colombian generation subsidiary, in the international capital markets, for the Colombian peso equivalent of US$ 400 million. This break-through deal, the first bond issued in local currency by a private sector Colombian company in the international markets, was rated “Investment Grade” by Fitch Ratings and Standard and Poor’s.
Ø Additionally, as of June 2011, Ampla finished a successful issuance of local bonds (debentures) for the equivalent of US$ 160 million, maturing in 5 and 7 years, allowing the extension of its debt’s duration.
Ø Coverage and protection: In order to mitigate exchange rate and interest rate risks, Enersis has established strict internal rules to protect our cash flows and balance sheet from fluctuations in these variables.
· Our exchange rate policy is based on cash flows and we strive to maintain a balance between US dollar indexed flows, and assets and liabilities in such currency. In addition to this policy, we have contracted cross currency swaps for a total amount of US$ 1,365 million and forwards for US$ 287 million.
· In order to reduce financial results’ volatility due to changes in market interest rates, we seek to maintain an adequate balance in our debt structure. Thus, we have contracted interest rate swaps (from variable to fixed rates) for US$ 318 million.
Pg. 4
![]()
Market Summary
Ø Chilean Stock Exchange main index, IPSA, has shown an important decrease in the last 12 months (-19.04%). This has been consistent with the global economic scenario and the behavior of the principal stock exchanges. In Latin America, all the countries where the group has presence have shown negative numbers: BOVESPA (Brazil): -25.49%; COLCAP (Colombia): -10.30%; MERVAL (Argentina): -7.11% and ISBVL (Peru): -3.43%. In more developed countries, the performance of the stock exchanges have also been negative during the last 12 months: IBEX: -18.22%, UKX: -8.30%; FTSE 250: -7.30%; S&P 500: -1.29% and Dow Jones Industrial: +0.77%.
Ø Enersis’ share price has decreased considerably during last 12 months. The price as of September 30, 2011 was $180.1, which represents a -21.63% variation in comparison with October 1, 2010 price, when it reached $229.8. This low performance is explained mainly by the negative global economic scenario and also by the drought that affected Chile this year, reducing the results of its affiliates in Generation.
Ø During the last 12 months, Enersis’ ADS has lost 29.22% of its value. The price fell from US$23.9 on October 1, 2010, to US$16.9 on September 30, 2011. The global economic situation and the Chilean drought affected the value, but there’s also an impact caused by the Chilean Peso devaluation against US Dollar during the last months. The exchange rate as of September 30, 2010 was Ch$ 483.55 and as of September 30, 2011 was Ch$ 521.76, which represents a -11.5% devaluation.
Ø During the last twelve months period, Enersis continued to be among the most actively traded companies in the local market (Santiago Stock Exchange and Chilean Electronic Exchange), with a daily average trading volume of US$ 8.7 million.
Source: Bloomberg
Pg. 5
![]()
Risk Rating Classification Information
Enersis’ current ratings are supported by our well diversified asset portfolio, strong credit metrics, adequate debt structure and solid liquidity. Enersis’ geographic diversification in Latin America provides the company a natural hedge against different regulations and weather conditions. Most of their operating subsidiaries are financially strong and have leading market positions in the countries where we operate.
On July 12, 2011, Feller Rate confirmed the “AA” local rating of Enersis’ solvency, bonds and bond program. At the same time, it confirmed the “1st Class Level 1” rating for its shares and the “1st Class +A/AA” rating for its commercial papers program. Rating perspectives continue to be “Stable”.
The current international risk ratings are:
Enersis | S&P | Moody’s | Fitch |
Corporate | BBB+ / Stable | Baa2 / Stable | BBB+ / Stable |
The domestic ratings (for securities issued in Chile):
Enersis | Feller Rate | Fitch |
Shares | 1st Class Level 1 | 1stClass Level 1 |
Bonds | AA / Stable | AA / Stable |
Pg. 6
Table ofContents
1 | ||
2 | ||
3 | ||
4 | ||
5 | ||
6 | ||
Table ofContents .7 | 7 | |
General Information..9 | 9 | |
Simplified Organizational Structure.10 | 10 | |
Market Information.11 | 11 | |
Equity Market.11 | 11 | |
Debt Market.14 | 14 | |
Consolidated Income Statement Analysis.15 | 15 | |
Net Income.15 | 15 | |
Operating Income.15 | 15 | |
Net Financial Income.17 | 17 | |
Sale of Assets.17 | 17 | |
Taxes.17 | 17 | |
Consolidated Balance Sheet Analysis.18 | 18 | |
Assets Under IFRS..18 | 18 | |
Book Value and Economic Value of Assets.20 | 20 | |
Liabilities and Shareholders’ Equity Under IFRS..21 | 21 | |
Debt Maturity with Third Parties, Thousand US$.23 | 23 | |
Debt Maturity with Third Parties, Million Ch$.23 | 23 | |
Evolution Of Key Financial Ratios.24 | 24 | |
Under IFRS..25 | 25 | |
Cash Flow Received From Foreign Subsidiaries by Enersis, Chilectra and Endesa Chile.26 | 26 | |
The Principal Risks associated to the activities of the Enersis Group 28 | 28 | |
Argentina..33 | 33 | |
Generation.33 | 33 | |
Endesa Costanera.33 | 33 | |
El Chocon.34 | 34 | |
Distribution.35 | 35 | |
Edesur.35 | 35 | |
Brazil..36 | 36 | |
Endesa Brasil.36 | 36 | |
Generation.36 | 36 | |
Cachoeira.36 | 36 | |
Fortaleza (cgtf) 37 | 37 | |
Transmission.38 | 38 | |
CIEN..38 | 38 | |
Distribution.39 | 39 | |
Ampla.39 | 39 | |
Pg. 7
Coelce.40 | 40 | |
Chile..41 | 41 | |
Generation.41 | 41 | |
Endesa Chile.41 | 41 | |
Distribution.42 | 42 | |
Chilectra.42 | 42 | |
Colombia..44 | 44 | |
Generation.44 | 44 | |
Emgesa.44 | 44 | |
Distribution.45 | 45 | |
Codensa.45 | 45 | |
Generation.46 | 46 | |
Edegel 46 | 46 | |
Distribution.47 | 47 | |
Edelnor.47 | 47 | |
Conference Call Invitation..49 | 49 | |
Disclaimer.50 | 50 |
Pg. 8
![]()
General Information
(Santiago, Chile, Wednesday, October 26, 2011.) Enersis S.A. (NYSE: ENI), announced today its consolidated financial results for the nine months period of 2011. All figures are in Chilean pesos (Ch$) and in accordance with International Financial Reporting Standards (IFRS). Variations refer to comparison between the period ended on September 30, 2010 and September 30, 2011.
Figures as of September 30, 2011 are additionally translated into US$, merely as a convenience translation, using the exchange rate of US$ 1 = Ch$ 521.76 as of September 30, 2011 for the Balance Sheet, and the average exchange rate for the period of US$ 1 = Ch$ 474.35 for the Income Statement, Cash Flow Statements, Capex and Depreciation values.
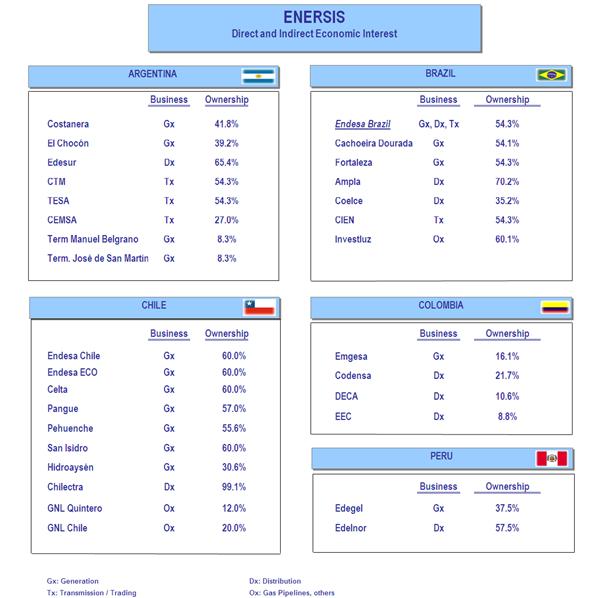
The consolidation includes the following investment vehicles and companies,
a) In Chile: Endesa Chile (NYSE: EOC)*, Chilectra, and Inmobiliaria Manso de Velasco.
b) Others than Chile: Distrilima (Peru), Endesa Brasil (Brazil)**, Edesur (Argentina) and Codensa (Colombia).
In the following pages you will find a detailed financial statement analysis, a brief explanation for the most important variations and comments on main items in the P&L and Cash Flow Statements compared to the information as of September 30, 2011.
* Includes Endesa Chile Chilean subsidiaries (Celta, Pangue, Pehuenche, San Isidro, and Tunel El Melon), non Chilean subsidiaries (Endesa Costanera, El Chocon, Edegel and Emgesa) and jointly controlled companies (Gas Atacama, Transquillota and Hidroaysen.)
** Includes Endesa Fortaleza, CIEN, Cachoeira Dourada, Ampla and Coelce.
Pg. 9
![]()
Simplified Organizational Structure
Pg. 10
![]()
Market Information
Equity Market
New York Stock Exchange (NYSE)
The charts below show the performance of Enersis’ ADS (“ENI”) price at the NYSE, compared to the Dow Jones Industrials and the Dow Jones Utilities indexes over the last 12 months, as well as the trading volume, both in the NYSE.
Source: Bloomberg
Pg. 11
![]()
Santiago Stock Exchange (BCS)
The charts below show the performance of Enersis’ Chilean stock price over the last 12 months compared to the Chilean Selective Stock Index (IPSA), as well as the daily average aggregate trading volume in the Santiago and Chilean Electronic Stock Exchange:
Source: Bloomberg
Pg. 12
![]()
Madrid Stock Exchange (Latibex) - Spain
The charts below show Enersis’ share price (“XENI”) at the Latibex over the last 12 months compared to the local stock index (IBEX), as well as the daily average trading volume in the Latibex.
Source: Bloomberg
Pg. 13
![]()
Debt Market
Yankee Bonds Price Evolution
The following chart shows the pricing of two of our Yankee Bonds over the last 12 months compared to the Ishares Iboxx Investment Grade Corporate Bond Fund Index:
Source: Bloomberg
(*) Ishares Iboxx Investment Grade Corporate Bond Fund Index is an exchange traded fund incorporated in the U.S.A. The Index measures the performance of a fixed number of investment grade corporate bonds.
Pg. 14
![]()
Consolidated Income Statement Analysis
Net Income
Enersis’ Net Income attributable to the Owners of the Company for the cumulative period as of September 30, 2011 reached Ch$ 319,026 million, representing a 6.8% decrease over the same period 2010, which was Ch$ 342,141 million.
Under IFRS
CONSOLIDATED INCOME STATEMENT | (Million Ch$) | (Thousand US$) | ||||
| 9M 2010 | 9M 2011 | Var 2010-2011 | Chg % | 9M 2011 | |
Sales | 4,616,738 | 4,645,608 | 28,870 | 0.6% | 9,793,629 | |
Energy sales | 4,217,515 | 4,323,338 | 105,823 | 2.5% | 9,114,237 | |
Other sales | 34,862 | 20,770 | (14,093) | (40.4%) | 43,786 | |
Other services | 364,360 | 301,500 | (62,860) | (17.3%) | 635,606 | |
Other operating income | 213,634 | 203,192 | (10,443) | (4.9%) | 428,358 | |
Revenues | 4,830,372 | 4,848,799 | 18,428 | 0.4% | 10,221,987 | |
Energy purchases | (1,140,692) | (1,309,276) | (168,584) | (14.8%) | (2,760,147) | |
Fuel consumption | (572,987) | (595,644) | (22,657) | (4.0%) | (1,255,706) | |
Transportation expenses | (334,410) | (303,241) | 31,168 | 9.3% | (639,278) | |
Other variable costs | (517,334) | (475,038) | 42,296 | 8.2% | (1,001,451) | |
Procurements and Services | (2,565,424) | (2,683,200) | (117,776) | (4.6%) | (5,656,582) | |
|
|
|
|
|
| |
Contribution Margin | 2,264,948 | 2,165,600 | (99,349) | (4.4%) | 4,565,404 | |
Other work performed by entity and capitalized | 30,864 | 35,665 | 4,801 | 15.6% | 75,187 | |
Employee benefits expense | (267,176) | (269,352) | (2,176) | (0.8%) | (567,834) | |
Other fixed operating expenses | (351,283) | (420,266) | (68,983) | (19.6%) | (885,982) | |
Gross Operating Income (EBITDA) | 1,677,353 | 1,511,647 | (165,706) | (9.9%) | 3,186,776 | |
Depreciation and amortization | (355,185) | (313,265) | 41,920 | 11.8% | (660,409) | |
Reversal of impairment profit (impairment loss) recognized in profit or loss | (32,617) | 1,048 | 33,665 | 103.2% | 2,210 | |
Operating Income | 1,289,551 | 1,199,430 | (90,121) | (7.0%) | 2,528,577 | |
Net Financial Income | (229,117) | (194,141) | 34,976 | 15.3% | (409,278) | |
Financial income | 101,475 | 134,089 | 32,614 | 32.1% | 282,678 | |
Financial costs | (327,496) | (320,468) | 7,028 | 2.1% | (675,594) | |
Gain (Loss) for indexed assets and liabilities | (12,414) | (17,038) | (4,624) | (37.2%) | (35,919) | |
Foreign currency exchange differences, net | 9,319 | 9,277 | (42) | (0.4%) | 19,557 | |
Gains | 60,649 | 68,060 | 7,411 | 12.2% | 143,480 | |
Losses | (51,331) | (58,783) | (7,452) | (14.5%) | (123,924) | |
Share of profit (loss) of associates accounted for using the equity method | 1,348 | 5,848 | 4,500 | 333.8% | 12,328 | |
Net Income From Other Investments | 139 | 376 | 237 | 171.1% | 792 | |
Net Income From Sale of Assets | 3,044 | (7,172) | (10,215) | (335.6%) | (15,119) | |
Net Income Before Taxes | 1,064,965 | 1,004,341 | (60,623) | (5.7%) | 2,117,300 | |
Income Tax | (283,192) | (316,550) | (33,358) | (11.8%) | (667,334) | |
NET INCOME ATTRIBUTABLE TO: | 781,773 | 687,791 | (93,982) | (12.0%) | 1,449,966 | |
Owners of parent | 342,141 | 319,026 | (23,115) | (6.8%) | 672,553 | |
Non-controlling interest | 439,632 | 368,766 | (70,866) | (16.1%) | 777,413 | |
Earning per share (Ch$ /share and US$ / ADR) | 10.5 | 9.8 | (0.7) | (6.8%) | 1.0 | |
Operating Income
Operating income decreased by Ch$ 90,121 million, or 7.0% when compared to September 2010.
Below we present operating revenues and costs breakdown by business line for the period ending on September 30, 2010 and 2011 are:
Pg. 15
Table 2 |
|
|
|
|
|
|
|
|
|
|
|
|
|
|
Operating Income by Businesses | Generation and Transmission | Distribution | ||||||||||||
Million Ch$ |
| Chg% |
| Th. US$ |
| Million Ch$ |
| Chg% |
| Th. US$ |
| |||
9M 2010 | 9M 2011 |
|
|
| 9M 2011 |
| 9M 2010 | 9M 2011 |
|
|
| 9M 2011 |
| |
Operating Revenues | 2,076,441 | 2,012,421 |
| (3.1%) |
| 4,242,482 |
| 3,184,955 | 3,289,889 |
| 3.3% |
| 6,935,572 |
|
Operating Costs | (1,330,803) | (1,320,909) |
| (0.7%) |
| (2,784,671) |
| (2,625,969) | (2,771,712) |
| 5.6% |
| (5,843,179) |
|
Operating Income | 745,638 | 691,513 |
| (7.3%) |
| 1,457,811 |
| 558,987 | 518,177 |
| (7.3%) |
| 1,092,394 |
|
|
|
|
|
|
|
|
|
|
|
|
|
|
|
|
Operating Income by Businesses | Eliminations and Others |
| Consolidated |
| ||||||||||
Million Ch$ |
| Chg% |
| Th. US$ |
| Million Ch$ |
| Chg% |
| Th. US$ |
| |||
9M 2010 | 9M 2011 |
|
|
| 9M 2011 |
| 9M 2010 | 9M 2011 |
|
|
| 9M 2011 |
| |
Operating Revenues | (431,024) | (453,510) |
| 5.2% |
| (956,067) |
| 4,830,372 | 4,848,799 |
| 0.4% |
| 10,221,987 |
|
Operating Costs | 415,950 | 443,251 |
| 6.6% |
| 934,439 |
| (3,540,821) | (3,649,369) |
| 3.1% |
| (7,693,410) |
|
Operating Income | (15,074) | (10,259) |
| (31.9%) |
| (21,627) |
| 1,289,551 | 1,199,430 |
| (7.0%) |
| 2,528,577 |
|
Generation and transmission businessshowed an Operating income of Ch$ 691,513 million, representing a Ch$ 54,126 million decrease from the same period 2010, or 7.3%. Physical sales increased 1.2% amounting to 47,857 GWh as of September 2011 (47,313 GWh for the same period in 2010).
Operating income for generation and transmission business line, detailed by country is shown in the following table:
Table 3 |
|
|
|
|
|
|
|
|
|
|
|
|
|
|
|
|
|
|
|
|
Generation & Transmission | Chile |
| Argentina |
| Brazil | |||||||||||||||
Million Ch$ |
| Chg% |
| Th. US$ |
| Million Ch$ |
| Chg% |
| Th. US$ |
| Million Ch$ |
| Chg% |
| Th. US$ | ||||
9M 2010 | 9M 2011 |
|
|
| 9M 2011 |
| 9M 2010 | 9M 2011 |
|
|
| 9M 2011 |
| 9M 2010 | 9M 2011 |
|
|
| 9M 2011 | |
Operating Revenues | 984,721 | 908,325 |
| (7.8%) |
| 1,914,884 |
| 302,320 | 341,325 |
| 12.9% |
| 719,565 |
| 238,660 | 223,042 |
| (6.5%) |
| 470,206 |
% of consolidated | 47% | 45% |
|
|
| 45% |
| 15% | 17% |
|
|
| 17% |
| 11% | 11% |
|
|
| 11% |
Operating Costs | (634,822) | (662,966) |
| 4.4% |
| (1,397,630) |
| (264,808) | (315,891) |
| 19.3% |
| (665,946) |
| (128,428) | (56,285) |
| (56.2%) |
| (118,657) |
% of consolidated | 48% | 50% |
|
|
| 50% |
| 20% | 24% |
|
|
| 24% |
| 10% | 4% |
|
|
| 4% |
|
|
|
|
|
|
|
|
|
|
|
|
|
|
|
|
|
|
|
|
|
Operating Income | 349,900 | 245,360 |
| (29.9%) |
| 517,254 |
| 37,513 | 25,434 |
| (32.2%) |
| 53,619 |
| 110,232 | 166,757 |
| 51.3% |
| 351,549 |
|
|
|
|
|
|
|
|
|
|
|
|
|
|
|
|
|
|
|
|
|
Generation & Transmission | Peru |
| Colombia |
| Consolidated | |||||||||||||||
Million Ch$ |
| Chg% |
| Th. US$ |
| Million Ch$ |
| Chg% |
| Th. US$ |
| Million Ch$ |
| Chg% |
| Th. US$ | ||||
9M 2010 | 9M 2011 |
|
|
| 9M 2011 |
| 9M 2010 | 9M 2011 |
|
|
| 9M 2011 |
| 9M 2010 | 9M 2011 |
|
|
| 9M 2011 | |
Operating Revenues | 161,205 | 174,349 |
| 8.2% |
| 367,554 |
| 390,201 | 365,899 |
| (6.2%) |
| 771,370 |
| 2,076,441 | 2,012,421 |
| (3.1%) |
| 4,242,482 |
% of consolidated | 8% | 9% |
|
|
| 9% |
| 19% | 18% |
|
|
| 18% |
| 100% | 100% |
|
|
|
|
Operating Costs | (106,219) | (94,801) |
| (10.7%) |
| (199,853) |
| (197,192) | (191,486) |
| (2.9%) |
| (403,682) |
| (1,330,803) | (1,320,909) |
| (0.7%) |
| (2,784,671) |
% of consolidated | 8% | 7% |
|
|
| 7% |
| 15% | 14% |
|
|
| 14% |
| 100% | 100% |
|
|
|
|
|
|
|
|
|
|
|
|
|
|
|
|
|
|
|
|
|
|
|
|
|
Operating Income | 54,986 | 79,549 |
| 44.7% |
| 167,700 |
| 193,008 | 174,413 |
| (9.6%) |
| 367,688 |
| 745,638 | 691,513 |
| (7.3%) |
| 1,457,811 |
Distribution businessshowed a Ch$ 40,810 million lower operating income, totaling Ch$ 518,177 million. Physical sales amounted to 51,942 GWh, representing an increase of 1,879 GWh, or 3.8%. Our customer base increased by 355 thousand new clients approximately, amounting to 13.5 million customers.
Operating Income for distribution business line, detailed by country, as follows:
Table 4 |
|
|
|
|
|
|
|
|
|
|
|
|
|
|
|
|
|
|
|
|
Distribution | Chile |
| Argentina |
| Brazil | |||||||||||||||
Million Ch$ |
| Chg% |
| Th. US$ |
| Million Ch$ |
| Chg% |
| Th. US$ |
| Million Ch$ |
| Chg% |
| Th. US$ | ||||
9M 2010 | 9M 2011 |
|
|
| 9M 2011 |
| 9M 2010 | 9M 2011 |
|
|
| 9M 2011 |
| 9M 2010 | 9M 2011 |
|
|
| 9M 2011 | |
Operating Revenues | 723,062 | 778,005 |
| 7.6% |
| 1,640,150 |
| 222,307 | 205,924 |
| (7.4%) |
| 434,119 |
| 1,416,243 | 1,471,515 |
| 3.9% |
| 3,102,171 |
% of consolidated | 23% | 24% |
|
|
| 24% |
| 7% | 6% |
|
|
| 6% |
| 44% | 45% |
|
|
| 45% |
Operating Costs | (641,481) | (680,096) |
| 6.0% |
| (1,433,742) |
| (209,263) | (226,226) |
| 8.1% |
| (476,919) |
| (1,155,564) | (1,211,564) |
| 4.8% |
| (2,554,157) |
% of consolidated | 24% | 25% |
|
|
| 25% |
| 8% | 8% |
|
|
| 8% |
| 44% | 44% |
|
|
| 44% |
|
|
|
|
|
|
|
|
|
|
|
|
|
|
|
|
|
|
|
|
|
Operating Income | 81,581 | 97,909 |
| 20.0% |
| 206,407 |
| 13,044 | (20,302) |
| (255.6%) |
| (42,800) |
| 260,678 | 259,950 |
| (0.3%) |
| 548,014 |
|
|
|
|
|
|
|
|
|
|
|
|
|
|
|
|
|
|
|
|
|
Distribution | Peru |
| Colombia |
| Consolidated | |||||||||||||||
Million Ch$ |
| Chg% |
| Th. US$ |
| Million Ch$ |
| Chg% |
| Th. US$ |
| Million Ch$ |
| Chg% |
| Th. US$ | ||||
9M 2010 | 9M 2011 |
|
|
| 9M 2011 |
| 9M 2010 | 9M 2011 |
|
|
| 9M 2011 |
| 9M 2010 | 9M 2011 |
|
|
| 9M 2011 | |
Operating Revenues | 230,578 | 238,636 |
| 3.5% |
| 503,081 |
| 592,765 | 595,808 |
| 0.5% |
| 1,256,052 |
| 3,184,955 | 3,289,889 |
| 3.3% |
| 6,935,572 |
% of consolidated | 7% | 7% |
|
|
| 7% |
| 19% | 18% |
|
|
| 18% |
| 100% | 100% |
|
|
|
|
Operating Costs | (181,152) | (183,991) |
| 1.6% |
| (387,880) |
| (438,508) | (469,835) |
| 7.1% |
| (990,481) |
| (2,625,969) | (2,771,712) |
| 5.6% |
| (5,843,179) |
% of consolidated | 7% | 7% |
|
|
| 7% |
| 17% | 17% |
|
|
| 17% |
| 100% | 100% |
|
|
|
|
|
|
|
|
|
|
|
|
|
|
|
|
|
|
|
|
|
|
|
|
|
Operating Income | 49,426 | 54,646 |
| 10.6% |
| 115,201 |
| 154,257 | 125,974 |
| (18.3%) |
| 265,571 |
| 558,987 | 518,177 |
| (7.3%) |
| 1,092,394 |
Pg. 16
![]()
Net Financial Income
The Company’s net financial income as of September 30, 2011 was negative Ch$ 194,141 million, representing an improvement of 15.3% over the same period 2010. The latter is mainly explained by: (i) Higher financial income by Ch$ 32,614 million, mainly as a result of the increase in pension plan assets in Brazil by Ch$ 20,151 million and higher time deposits during the period mainly explained by Chilectra and Endesa Brasil and (ii) Lower expenses by Ch$ 7,028 million mainly explained by the effect of the exchange rate prevailing during this period and partially offset by a higher average debt.
The latter was partially offset by higher loss for indexed assets and liabilities of Ch$ 4,624 million, as a result of to the negative impact of inflation over U.F. denominated debt in Chile. The U.F., a non-transaction currency linked to the inflation in Chile, increased its value by 2.6% during the current period, when compared to the 1.9% increase registered during the same period 2010.
Sale of Assets
The net income from sale of assets registered a decrease of Ch$ 10,215 million, explained by the recognition of the loss generated due to the sale of CAM.
Taxes
Income tax net expense increased by Ch$ 33,358 million at the end of September 2011. The latter is explained by decreases in: CIEN by Ch$ 24,305 million; Enersis by Ch$ 7,734 million; Endesa Chile by Ch$ 7,366 million; San Isidro by Ch$ 6,730 million; Coelce by Ch$ 5,879 million; Ampla by Ch$ 5,279 million; Pangue by Ch$ 3,693 million, Edegel by Ch$ 3,417 million and Emgesa by Ch$ 2,068 million.
The latter was partially offset by decreases in Edesur by Ch$ 12,283 million; Pehuenche by Ch$ 10,262 million; Chocón by Ch$ 6,759 million and Celta by Ch$ 3,144 million.
Pg. 17
![]()
Consolidated Balance Sheet Analysis
Assets Under IFRS
Table 5 |
|
|
|
|
|
|
ASSETS | (Million Ch$) |
| (Thousand US$) | |||
| As of Dec 31, 2010 | As of September 30, 2011 | Var 2010-2011 | Chg % | As of September 30, 2011 | |
|
|
|
|
|
| |
CURRENT ASSETS |
|
|
|
|
|
|
Cash and cash equivalents | 961,355 | 937,454 | (23,901) | (2.5%) |
| 1,796,715 |
Other current financial assets | 7,818 | 45,362 | 37,544 | 480.3% |
| 86,940 |
Other current non-financial assets | 35,993 | 37,648 | 1,655 | 4.6% |
| 72,155 |
Trade and other current receivables | 1,038,098 | 1,082,709 | 44,611 | 4.3% |
| 2,075,109 |
Accounts receivable from related companies | 20,472 | 23,077 | 2,606 | 12.7% |
| 44,230 |
Inventories | 62,652 | 82,873 | 20,221 | 32.3% |
| 158,833 |
Current tax assets | 137,987 | 127,924 | (10,063) | (7.3%) |
| 245,179 |
Non-current assets (or disposal groups) classified as held for sale | 73,893 | - | (73,893) | (100.0%) |
| - |
Total Current Assets | 2,338,268 | 2,337,047 | (1,221) | (0.1%) |
| 4,479,160 |
|
|
|
|
|
|
|
|
|
|
|
|
|
|
Other non-current financial assets | 62,969 | 40,648 | (22,320) | (35.4%) |
| 77,906 |
Other non-current non-financial assets | 103,736 | 119,819 | 16,083 | 15.5% |
| 229,644 |
Trade accounts receivables and other receivables, net | 319,568 | 405,243 | 85,675 | 26.8% |
| 776,685 |
Investment accounted for using equity method | 14,102 | 14,131 | 29 | 0.2% |
| 27,083 |
Intangible assets other than goodwill | 1,452,586 | 1,489,738 | 37,152 | 2.6% |
| 2,855,217 |
Goodwill | 1,477,022 | 1,492,543 | 15,521 | 1.1% |
| 2,860,593 |
Property, plant and equipment, net | 6,751,941 | 7,268,063 | 516,122 | 7.6% |
| 13,929,897 |
Investment properties | 33,019 | 34,249 | 1,230 | 3.7% |
| 65,642 |
Deferred tax assets | 452,634 | 434,862 | (17,773) | (3.9%) |
| 833,451 |
Total Non-Current Assets | 10,667,577 | 11,299,297 | 631,720 | 5.9% |
| 21,656,119 |
|
|
|
|
|
|
|
TOTAL ASSETS | 13,005,845 | 13,636,343 | 630,498 | 4.8% |
| 26,135,279 |
Total Assets increased Ch$ 630,498 million, mainly due to:
Ø Ch$ 631,720 million increase in non-current assets, or 5.9%, as a result of:
v Ch$ 516,122 million increase in Property, Plant and Equipment, explained by the net effect resulting from the translation of financial statements from local currencies to Chilean pesos by Ch$ 384,480 million, and additions for the period in approximately Ch$ 358,967 million. The latter was partially offset by the depreciation for the period of Ch$ 237,833 million.
v Ch$ 37,152 million increase in intangible assets other than goodwill, due to exchange rates variations, explained by: the translation effect of Ch$ 21,435 million; and additions for the period of Ch$ 134,020 million. The latter was partially offset by the depreciation for the period of Ch$ 75,432 million.
v Ch$ 85,675 million increase in trade accounts receivables and other receivables, mainly due to the increase in Ampla by Ch$ 57,655 million and Coelce by Ch$ 10,678 million, by the appliance of IFRIC 12 interpretation, related to service concession arrangements. Also due to increases in Costanera and Chocón for a total consideration of Ch$ 24,005 million due to FONINVEMEN II. Partially offset by decrease in Cachoeira Dourada by Ch$ 5,371 million and Chilectra by Ch$ 3,172 million.
v Ch$ 15,521 million increase in goodwill related to fluctuation of local currency against Chilean peso.
Pg. 18
![]()
v Ch$ 16,083 million increase in other non-current non financial assets, mainly explained by an increase of liens in Cachoeira by Ch$ 5,551 million and Coelce by Ch$ 9,542 million.
v Decrease of Ch$ 22,230 million in other non-current non financial assets, mainly explained by drop in Endesa Chile by Ch$ 20,405 million, due to MTM of derivatives and diminish in Enersis by Ch$ 2,565 million in Deutsche Bank’s deposits.
v Decrease of Ch$ 22,320 million in other non-current non financial assets, mainly explained by drop in Endesa Chile by Ch$ 20,405 million, due to MTM of derivatives and diminish in Enersis by Ch$ 2,565 million in cash collateral.
Ø Ch$ 1,222 million of decrease in current assets or 0.1% decrease, mainly due to:
v Ch$ 73,893 million decrease in non-current assets classified as held for sell, related to the selling process of the former subsidiaries CAM and Synapsis, that took place in the first quarter.
v Ch$ 23,901 million decrease in Cash and Cash Equivalent, primarily explained by decreases in: Endesa Chile by Ch$ 179,808 million due to debt amortizations and dividend payments; Endesa Brasil by Ch$ 92,311 million explained by a payment made to IFC and Chilectra by Ch$ 51,988 million linked to lower amount of time deposits; Edelnor by Ch$ 16,264 million; Edesur by Ch$ 8,177 million due to decreases in time deposits and Codensa by Ch$ 5,169 due to debt amortization. The above was partially compensated by increases in: Enersis by Ch$ 131,477 million, Emgesa by Ch$ 95,527 million, Cachoeira Dourada by Ch$ 38,792 million; Gas Atacama by Ch$ 17,566 million, Ampla by Ch$ 28,706 million, Edegel by Ch$ 12,339 million and Coelce by Ch$ 10,310 million.
v Increase in trade and other accounts receivables by Ch$44,611 million mainly due to increases in Fortaleza by Ch$78,131 million, in San Isidro by Ch$21,302 million, in Emgesa by Ch$ 14,83 million, in Endesa Chile by Ch$12,828 million and in Edelnor by Ch$8,218 million; partly offset by decreases in Coelce by Ch$43,397 million, in Chilectra bye Ch$34,765 million, in Ampla by Ch$8,959 million and in GasAtacama by Ch$8,948 million.
v Increase in other current financial assets by Ch$37,544 million, mainly explained by increases in Fortaleza’s time deposits held until maturity by Ch$38,971 million.
v Increase in inventory by Ch$20,221 million, mainly due to increases in Edelnor by Ch$4,927 million, in Codensa by Ch$3,359 million, in Enersis by Ch$2,423 million, in Celta by Ch$2,301 million, in Endesa Chile by Ch$1,913 million, in Edegel by Ch$1,528 million and in Edesur by Ch$1,347 million.
Pg. 19
Book Value and Economic Value of Assets
Regarding the more important assets, the following should be mentioned:
Properties, Plants and Equipment are valued at their purchase cost, net of the corresponding accumulated depreciation and impairment loss they have been subject to. Properties, Plants and Equipment, net of their residual value, if applicable, are linearly depreciated by distributing the cost of their different elements along the estimated years of useful life, which is the period that the companies expect to use them. The useful life is reviewed regularly.
The goodwill value generated by consolidation represents the acquisition cost surplus on the Group’s stake in terms of the reasonable value of assets and liabilities, including the identifiable contingent liabilities of a subsidiary at the time of acquisition. Goodwill is not amortized. Instead, at the closing of each accounting period an assessment is made of whether any impairment has occurred during the period that could reduce its recoverable value to an amount below the registered net cost, proceeding in this event to make a timely impairment adjustment (See Note 3.e to the Consolidated Financial Statements).
Throughout the fiscal year and in particular at the date of closing, an assessment is made as to any indication of possible loss due to the impairment of any asset. In the event of any such indication, an estimate of the recoverable sum of said asset is made to determine, if applicable, the depreciated amount. If this involves identifiable assets that do not originate independent cash flows, the recoverability of the Cash Generating Unit that the asset belongs to is estimated, understanding as such the smaller group of identifiable assets that generate independent cash incomes.
Assets expressed in foreign currency are expressed at the prevalent exchange rate at the closing of the period.
Notes and accounts receivable from related companies are classified according to their short and long term maturities. These operations are adjusted according to prevalent market equity conditions.
In summary, assets are valued according to the International Financial Reporting Standards, whose criteria are expressed in Note 3 of the Consolidated Financial Statements.
Pg. 20
![]()
Liabilities and Shareholders’ Equity Under IFRS
Table 6 |
|
|
|
|
|
|
LIABILITIES AND SHAREHOLDERS' EQUITY | (Million Ch$) |
| (Thousand US$) | |||
| As of Dec 31, 2010 | As of September 30, 2011 | Var 2010-2011 | Chg % | As of September 30, 2011 | |
|
|
|
|
|
|
|
CURRENT LIABILITIES |
|
|
|
|
|
|
Other current financial liabilities | 665,598 | 705,358 | 39,760 | 6.0% |
| 1,351,883 |
Trade and other current payables | 1,224,490 | 1,152,080 | (72,410) | (5.9%) |
| 2,208,065 |
Accounts payable to related companies | 148,202 | 125,704 | (22,498) | (15.2%) |
| 240,923 |
Other short-term provisions | 115,449 | 101,832 | (13,617) | (11.8%) |
| 195,171 |
Current tax liabilities | 147,667 | 158,883 | 11,217 | 7.6% |
| 304,514 |
Current provisions for employee benefits | 5,450 | - | (5,450) | (100.0%) |
| - |
Other current non-financial liabilities | 35,791 | 73,491 | 37,700 | 105.3% |
| 140,851 |
Liabilities (or disposal groups) classified as held for sale | 64,630 | - | (64,630) | (100.0%) |
| - |
Total Current Liabilities | 2,407,277 | 2,317,348 | (89,929) | (3.7%) |
| 4,441,407 |
|
|
|
|
|
|
|
NON-CURRENT LIABILITIES |
|
|
|
|
|
|
Other non-current financial liabilities | 3,014,956 | 3,291,067 | 276,110 | 9.2% |
| 6,307,626 |
Non-current payables | 37,237 | 22,897 | (14,340) | (38.5%) |
| 43,885 |
Accounts payable to related companies | 1,084 | - | (1,084) | (100.0%) |
| - |
Other-long term provisions | 225,522 | 213,814 | (11,708) | (5.2%) |
| 409,795 |
Deferred tax liabilities | 555,924 | 562,265 | 6,341 | 1.1% |
| 1,077,631 |
Non-current provisions for employee benefits | 215,819 | 228,376 | 12,557 | 5.8% |
| 437,703 |
Other non-current non-financial liabilities | 33,997 | 89,782 | 55,785 | 164.1% |
| 172,075 |
Total Non-Current Liabilities | 4,084,540 | 4,408,201 | 323,661 | 7.9% |
| 8,448,714 |
|
|
|
|
|
|
|
SHAREHOLDERS' EQUITY |
|
|
|
|
|
|
Issued capital | 2,824,883 | 2,824,883 | - | 0.0% |
| 5,414,142 |
Retained earnings (losses) | 2,103,690 | 2,210,958 | 107,269 | 5.1% |
| 4,237,500 |
Share premium | 158,760 | 158,760 | - | 0.0% |
| 304,277 |
Other equity changes | - | - | - |
|
| - |
Reserves | (1,351,787) | (1,297,803) | 53,984 | 4.0% |
| (2,487,357) |
|
|
| - |
|
|
|
Equity Attributable to Shareholders of the Company | 3,735,545 | 3,896,797 | 161,253 | 4.3% |
| 7,468,563 |
Equity Attributable to Minority Interest | 2,778,483 | 3,013,997 | 235,514 | 8.5% |
| 5,776,596 |
Total Shareholders' Equity | 6,514,028 | 6,910,794 | 396,766 | 6.1% |
| 13,245,159 |
|
|
|
|
|
|
|
TOTAL LIABILITIES AND SHAREHOLDERS' EQUITY | 13,005,845 | 13,636,343 | 630,498 | 4.8% |
| 26,135,279 |
The Company’s total liabilities and shareholders’ equity increased by Ch$ 630,498 million, when compared to the period ended on December 31, 2010, due to Ch$ 323,661 million increase in non-current liabilities and the Ch$ 396,766 million increase in shareholders’ equity. The latter was partially offset by the Ch$ 89,929 million decrease of current liabilities. The detail is explained as follows:
Ø Non-current liabilities increased by Ch$ 323,661 million, or 7.9%, mainly due to:
v Other non-current financial liabilities (financial debt and derivatives) increased by Ch$276,110 million, mainly in Emgesa by Ch$155,746 million, due to the issuance of a bond in local currency in the international capital market, in Endesa Chile by Ch$69,215 million, due to the effect of debt in US$ and UF, in Ampla by Ch$36,340 million, in Codensa by Ch$23,007 million, in Costanera by Ch$18,974 million, in Edegel by Ch$15,942 million and in Edesur by Ch$9,376 million. This increase was partially offset by the decrease in Cien by Ch$28,345 million following a loan repayment, and in Coelce by Ch$20,188 million.
v Other non-current non-financial liabilities increased by Ch$55,785 million, mainly in Emgesa and Codensa by Ch$22,023 million and Ch$14,393 million respectively, due to the recording of the equity tax impact as of January 2, 2011. Also due to increases in Cien of Ch$5,294 million, Cachoeira Dourada of Ch$3,499 million and in Ampla of Ch$2,658 million.
Pg. 21
![]()
Ø Current liabilities declined by Ch$89,929 million, equivalent to 3.7%, mainly explained by the following changes:
v Decrease in current trade and other accounts payable for Ch$72,410 million, basically relating to decreases in Ampla of Ch$72,457 million, in Endesa Chile of Ch$54,393 million, in Codensa of Ch$53,706 million, in Emgesa of Ch$35,639 million, in Cien of Ch$27,078 million and in Enersis of Ch$19,146 million. This was partially offset by increases in CGTF of Ch$135,130 million, Edesur of Ch$53,732 million, Costanera of Ch$12,955 million and Edelnor of Ch$1,526 million.
v Reduction in liabilities included in groups of assets for disposal classified as held for sale, of Ch$64,630 million, as a result of the sale of the liabilities of CAM and Synapsis during the third quarter of 2011.
The above was partially offset by:
v An increase in other financial liabilities, current, (financial debt and derivatives) of Ch$39,760 million, mainly in Emgesa by Ch$104,803 million, due to the transfer from long term and bond issued, in Ampla by Ch$19,043 million and in Edelnor by Ch$16,427 million. This was partially compensated by the decrease in Endesa Brasil by Ch$51,906 million due to the payment to IFC, in Codensa by Ch$39,502 million following the repayment of domestic bonds and in Edegel by Ch$12,887 million.
Equity increases by Ch$396,766 million with respect to December 2010:
v The equity attributable to owners of the controller increases by Ch$161,252 million, mainly explained by the effect of the comprehensive result for the period of Ch$349,778 million, primarily driven by the result of the dominant of Ch$319,026 million, positive translation reserves of Ch$75,876 million, negative hedge reserve of Ch$44,527 million and negative other reserves of Ch$597 million, less dividends of Ch$193,034 million.
v Non-controller participations increase by Ch$235,514 million, mainly explained by the effect of the comprehensive result for the period of Ch$499,654 million, principally driven by the result for the period of the non-controllers of Ch$368,766 million and other comprehensive results of the period of Ch$130,888 million, partially offset by the reduction in other equity movements of Ch$264,140 million.
Pg. 22
![]()
Debt Maturity with Third Parties, Thousand US$
Table 7 |
|
|
|
|
|
|
|
|
(Thousand US$) | 2011 | 2012 | 2013 | 2014 | 2015 | 2016 | Balance | TOTAL |
Chile | 12,049.5 | 84,967.5 | 425,062.5 | 736,164.9 | 225,839.6 | 421,594.3 | 1,127,076.6 | 3,032,754.7 |
Enersis | 2,116.4 | 4,414.4 | 4,668.3 | 541,517.4 | 5,220.5 | 404,862.1 | 37,411.0 | 1,000,210.1 |
Chilectra | 16.4 | - | - | - | - | - | - | 16.4 |
Endesa Chile | 9,916.7 | 80,553.1 | 420,394.2 | 194,647.5 | 220,619.1 | 16,732.2 | 1,089,665.6 | 2,032,528.3 |
Argentina | 61,841.4 | 112,069.4 | 97,783.1 | 60,490.4 | 35,175.0 | - | 17,077.1 | 384,436.4 |
Edesur | 8,096.8 | 25,120.4 | 43,957.5 | 7,152.6 | - | - | - | 84,327.3 |
Costanera | 53,469.6 | 56,320.2 | 24,994.8 | 27,960.0 | 27,341.9 | - | 17,077.1 | 207,163.5 |
Chocón | - | 30,628.7 | 28,830.9 | 25,377.8 | 7,833.2 | - | - | 92,670.6 |
Hidroinvest | 275.0 | - | - | - | - | - | - | 275.0 |
CTM | - | - | - | - | - | - | - | - |
TESA | - | - | - | - | - | - | - | - |
Peru | 27,836.6 | 127,679.0 | 146,015.0 | 104,561.5 | 82,369.8 | 95,300.8 | 160,938.0 | 744,700.7 |
Edelnor | 7,389.0 | 67,815.9 | 95,299.0 | 54,781.6 | 48,651.3 | 37,937.3 | 32,455.8 | 344,329.9 |
Edegel | 20,447.6 | 59,863.0 | 50,716.0 | 49,780.0 | 33,718.5 | 57,363.5 | 128,482.2 | 400,370.9 |
Brazil | 142,833.6 | 531,173.7 | 222,341.7 | 156,983.6 | 102,760.4 | 99,978.7 | 145,193.0 | 1,401,264.7 |
Endesa Brasil | - | - | - | - | - | - | - | - |
Coelce | 21,642.8 | 119,688.5 | 98,466.5 | 96,491.8 | 10,621.6 | 10,474.5 | 33,092.9 | 390,478.6 |
Ampla | 58,556.7 | 287,928.6 | 109,507.7 | 45,083.6 | 75,614.4 | 81,835.2 | 99,926.1 | 758,452.2 |
Cachoeira | - | - | - | - | - | - | - | - |
Cien | 56,278.8 | 110,159.6 | - | - | - | - | - | 166,438.4 |
Fortaleza | 6,355.3 | 13,397.0 | 14,367.5 | 15,408.3 | 16,524.4 | 7,669.0 | 12,174.1 | 85,895.6 |
Colombia | 161,871.4 | 176,872.8 | 125,842.0 | 204,511.5 | 130,541.5 | 75,714.1 | 992,950.8 | 1,868,304.0 |
Codensa | - | 17,607.4 | 125,842.0 | 130,541.5 | - | 75,714.1 | 246,201.2 | 595,906.2 |
Emgesa | 161,871.4 | 159,265.3 | - | 73,970.0 | 130,541.5 | - | 746,749.5 | 1,272,397.8 |
TOTAL | 406,432.5 | 1,032,762.3 | 1,017,044.3 | 1,262,712.0 | 576,686.4 | 692,587.8 | 2,443,235.5 | 7,431,460.6 |
Debt Maturity with Third Parties, Million Ch$ | ||||||||
Table 7.1 |
|
|
|
|
|
|
|
|
(Million Ch$) | 2011 | 2012 | 2013 | 2014 | 2015 | 2016 | Balance | TOTAL |
Chile | 6,287 | 44,333 | 221,781 | 384,101 | 117,834 | 219,971 | 588,063 | 1,582,370 |
Enersis | 1,104 | 2,303 | 2,436 | 282,542 | 2,724 | 211,241 | 19,520 | 521,870 |
Chilectra | 9 | - | - | - | - | - | - | 9 |
Endesa Chile | 5,174 | 42,029 | 219,345 | 101,559 | 115,110 | 8,730 | 568,544 | 1,060,492 |
Argentina | 32,266 | 58,473 | 51,019 | 31,561 | 18,353 | - | 8,910 | 200,584 |
Edesur | 4,225 | 13,107 | 22,935 | 3,732 | - | - | - | 43,999 |
Costanera | 27,898 | 29,386 | 13,041 | 14,588 | 14,266 | - | 8,910 | 108,090 |
Chocón | - | 15,981 | 15,043 | 13,241 | 4,087 | - | - | 48,352 |
Hidroinvest | 143 | - | - | - | - | - | - | 143 |
CTM | - | - | - | - | - | - | - | - |
TESA | - | - | - | - | - | - | - | - |
Peru | 14,524 | 66,618 | 76,185 | 54,556 | 42,977 | 49,724 | 83,971 | 388,555 |
Edelnor | 3,855 | 35,384 | 49,723 | 28,583 | 25,384 | 19,794 | 16,934 | 179,658 |
Edegel | 10,669 | 31,234 | 26,462 | 25,973 | 17,593 | 29,930 | 67,037 | 208,897 |
Brazil | 74,525 | 277,145 | 116,009 | 81,908 | 53,616 | 52,165 | 75,756 | 731,124 |
Endesa Brasil | - | - | - | - | - | - | - | - |
Coelce | 11,292 | 62,449 | 51,376 | 50,346 | 5,542 | 5,465 | 17,267 | 203,736 |
Ampla | 30,553 | 150,230 | 57,137 | 23,523 | 39,453 | 42,698 | 52,137 | 395,730 |
Cachoeira | - | - | - | - | - | - | - | - |
Cien | 29,364 | 57,477 | - | - | - | - | - | 86,841 |
Fortaleza | 3,316 | 6,990 | 7,496 | 8,039 | 8,622 | 4,001 | 6,352 | 44,817 |
Colombia | 84,458 | 92,285 | 65,659 | 106,706 | 68,111 | 39,505 | 518,082 | 974,806 |
Codensa | - | 9,187 | 65,659 | 68,111 | - | 39,505 | 128,458 | 310,920 |
Emgesa | 84,458 | 83,098 | - | 38,595 | 68,111 | - | 389,624 | 663,886 |
TOTAL | 212,060 | 538,854 | 530,653 | 658,833 | 300,892 | 361,365 | 1,274,783 | 3,877,439 |
Pg. 23
![]()
Evolution Of Key Financial Ratios
Table 8 |
|
|
|
|
|
Indicator | Unit | As of Dec 31, 2010 | As of September 30, 2011 | Var 2010-2011 | Chg % |
Liquidity | Times | 0.97 | 1.01 | 0.04 | 4.1% |
Acid ratio test * | Times | 0.94 | 0.96 | 0.02 | 2.1% |
Working capital | Million Ch$ | (69,010) | 19,698 | 88,708 | 128.5% |
Working capital | Thousand US$ | (132,263) | 37,754 | 170,016 | 128.5% |
Leverage ** | Times | 1.00 | 0.97 | (0.03) | (3.0%) |
Short-term debt | % | 37.0 | 34.0 | (3.00) | (8.1%) |
Long-term debt | % | 63.0 | 66.0 | 3.00 | 4.8% |
* (Current assets net of inventories and prepaid expenses) / Current liabilities | |||||
** Total debt / (equity + minority interest) | |||||
|
|
|
|
|
|
Table 8.1 |
|
|
|
|
|
Indicator | Unit | 9M 2010 | 9M 2011 | Var 2010-2011 | Chg % |
Financial expenses coverage * | Times | 5.07 | 4.61 | (0.47) | (9.2%) |
Op. income / Op. rev. | % | 26.70 | 24.74 | (1.96) | (7.3%) |
ROE ** | % | 12.96 | 12.19 | (0.76) | (5.9%) |
ROA ** | % | 7.70 | 7.53 | (0.17) | 2.5% |
* EBITDA / Financial costs ** Annualized figures | |||||
The current ratio at September 2011 was 1.01:1, a slight increase of 0.04 times, equivalent to 4.1%, with respect to December 2010. This reflects a company with a solid liquidity position, maintaining its bank debt, financing its investments with cash generation and a satisfactory debt maturity structure.
The debt ratio is 0.97:1 as of September 30, 2011, reducing by 3.0% with respect to December 2010.
The financial cost coverage shows a fall of 0.47 times, equivalent to 9.2%, passing from 5.07:1 at September 2010 to 4.61:1 at September 2011. This is the result of the fall in the company’s EBITDA in this current period.
The profitability indicator, being operating income over ordinary revenues, declined by 7.3% to 24.7% at September 2011.
On the other hand, the annualized return on equity of the owners of the controller (dominant) is 12.2%, with a fall of 5.9% with respect to September 2010 when it was 13.0%. This was the result of the lower result reported for the period, added to the increase of the equity of the owners.
The annualized return on assets passed from 7.7% as of September 2010 to 7.5% in September 2011 as a result of the decline in the result for the present period and the increase in assets.
Pg. 24
![]()
Consolidated Statements of Cash Flows Analysis
Under IFRS
Table 9 | ||||||
CASH FLOW | (Million Ch$) |
| (Thousand US$) | |||
| 9M 2010 | 9M 2011 | Var 2010-2011 | Chg % | 9M 2011 | |
|
|
|
|
|
|
|
Net Income | 781,773 | 687,791 | (93,982) | (12.0%) | 1,449,966 | |
Adjustments to reconcile net income | ||||||
Income tax expense | 283,192 | 316,550 | 33,358 | 11.8% | 667,334 | |
Decrease (increse) in inventories | 13,709 | (11,103) | (24,813) | (181.0%) | (23,407) | |
Decrease (increase) in trade accounts receivable | (184,575) | (25,996) | 158,578 | 85.9% | (54,804) | |
Decrease (increase) in other operating accounts receivable | (101,475) | (121,111) | (19,636) | (19.4%) | (255,319) | |
Decrease (increase) in trade accounts payable | (6,585) | (153,940) | (147,355) | (2237.8%) | (324,527) | |
Decrease (increase) in other operating accounts payable | 339,910 | 324,528 | (15,382) | (4.5%) | 684,154 | |
Depreciation and amortization expense | 355,185 | 313,265 | (41,920) | (11.8%) | 660,409 | |
(Reversal of) Impairment losses | 32,617 | (1,048) | (33,665) | (103.2%) | (2,210) | |
Provisions | (10,822) | (21,619) | (10,797) | (99.8%) | (45,576) | |
Unrealized foreign currency exchange differences | (9,319) | (9,277) | 42 | 0.4% | (19,557) | |
Non-distributed gains from associates | (1,348) | (5,848) | (4,500) | (333.8%) | (12,328) | |
Minority interest | - | - | - | - | ||
Other non-cash | (13,744) | 115,111 | 128,856 | 937.5% | 242,672 | |
Total adjustments to Reconcile to Operating Income | 696,746 | 719,513 | 22,767 | 3.3% | 1,516,839 | |
Dividends paid | - | - | - | - | ||
Dividends received | - | - | - | - | ||
Payments of interest classified as operating | - | - | - | - | ||
Proceeds of interest received classified as operating | - | - | - | - | ||
Income taxes refund (paid) | (341,634) | (312,802) | 28,832 | 8.4% | (659,433) | |
Other inflows (outflows) of cash | (1,139) | (21,941) | (20,802) | (1825.9%) | (46,256) | |
| ||||||
NET CASH FLOWS PROVIDED BY OPERATING ACTIVITIES | 1,135,745 | 1,072,561 | (63,184) | (5.6%) |
| 2,261,117 |
|
|
|
|
|
|
|
Net Cash Flows provided by (used in) Investing Activities |
|
|
|
|
|
|
Cash flows from loss of control of subsidiaries or other businesses. | - | 12,662 | 12,662 |
|
| 26,694 |
Acquisitions of associates | - | - | - |
|
| - |
Cash flows used for the purchase of non-controlling | - | - |
|
|
|
|
Loans to related companies | - | - | - |
|
| - |
Proceeds from sales of property, plant and equipment | 4,129 | 3,579 | (550) | (13.3%) |
| 7,545 |
Purchase of property, plant and equipment | (302,451) | (355,826) | (53,375) | (17.6%) |
| (750,134) |
Proceeds from sales of intangible assets | 1,414 | 7,591 | 6,177 | 437.0% |
| 16,003 |
Acquisitions of intangible assets | (124,451) | (133,280) | (8,829) | (7.1%) |
| (280,974) |
Proceeds from other long term assets. | - |
|
|
|
|
|
Purchase of other long-term assets | - | - | - |
|
| - |
Proceeds from prepayments reimbursed and third party loans | - | - | - |
|
| - |
Prepayments and third party loans | - | (1,259) | (1,259) |
|
| (2,653) |
Dividends received | 2,545 | 4,013 | 1,468 | 57.7% |
| 8,459 |
Interest received | 5,871 | 15,456 | 9,584 | 163.2% |
| 32,583 |
Other inflows (outflows) of cash | (7,244) | 6,291 | 13,535 | 186.8% |
| 13,261 |
NET CASH FLOWS FROM (USED IN) INVESTING ACTIVITIES | (420,188) | (440,774) | (20,585) | (4.9%) |
| (929,216) |
|
|
|
|
|
|
|
Cash Flows provided by (used in) Financing Activities |
|
|
|
|
|
|
Proceeds from long-term borrowings | 202,432 | 491,956 | 289,524 | 143.0% |
| 1,037,116 |
Repayments of borrowings | - | - | - |
|
| - |
Payments of loans | (549,880) | (448,529) | 101,351 | 18.4% |
| (945,566) |
Payments of finance lease liabilities | (20,834) | (8,640) | 12,194 | 58.5% |
| (18,215) |
Repayment of loans to related companies | - | - | - |
|
| - |
Dividends paid | (455,921) | (566,338) | (110,417) | (24.2%) |
| (1,193,923) |
Interest paid | (197,875) | (186,251) | 11,625 | 5.9% |
| (392,644) |
Other financing proceeds (payments) | (81,046) | (5,251) | 75,795 | 93.5% |
| (11,070) |
NET CASH FLOWS PROVIDED BY (USED IN) FINANCING ACTIVITIES | (1,103,125) | (723,053) | 380,072 | 34.5% |
| (1,524,303) |
|
|
|
|
|
|
|
NET INCREASE (DECREASE) IN CASH AND CASH EQUIVALENTS BEFORE EFFECTS OF EXCHANGE RATE | (387,568) | (91,266) | 296,302 | 76.5% |
| (192,401) |
|
|
|
|
|
|
|
Effect of exchange rate changes on cash and cash equivalents | 6,371 | 67,365 | 60,993 | 957.3% |
| 142,015 |
Net Increase (Decrease) in Cash and Cash Equivalents | (381,196) | (23,901) | 357,295 | 93.7% | (50,387) | |
Cash and cash equivalents at end of period | 1,134,901 | 961,355 | (173,546) | (15.3%) |
| 2,026,679 |
Ending Balance of Cash and Cash Equivalents | 753,705 | 937,454 | 183,749 | 24.4% |
| 1,976,292 |
Pg. 25
![]()
The company generated a negative net cash flow during the period of Ch$91,266 million, comprising the following:
Operating activities to September 30, 2011 generated a net positive flow of Ch$1,072,561 million, a fall of 5.6% compared to the same period of the year before. This flow comprises mainly the earnings for the period of Ch$687,791 million, which is adjusted to reconcile the result of Ch$514,120 million. This adjustment includes the amortization, depreciation and impairment of assets of Ch$312,217 million and interest expenses of Ch$203,418 million. This is partly compensated by the reduction in working capital of Ch$185,682 million.
Investment activities generated a negative net cash flow of Ch$440,774 million, representing a reduction in cash of 4.9% or Ch$20,586 million compared to the same period of 2010. These disbursements relate mainly to the acquisition of properties, plant and equipment of Ch$355,826 million and the incorporation of intangible assets (IFRIC 12) of Ch$133,280 million, compensated partly by the net cash flow from the sale of CAM and Synapsis of Ch$12,662 million.
Financing activities generated a net negative cash flow of Ch$723,053 million, principally the payment of dividends for Ch$566,338 million, loan repayments of Ch$448,529 million and interest payments of Ch$186,251 million. This is partially offset by loan drawings of Ch$491,956 million.
Cash Flow Received From Foreign Subsidiaries by Enersis, Chilectra and Endesa Chile
Table 10 |
|
|
|
|
|
|
|
|
|
|
Cash Flow | Interest Received | Dividends Received | Capital Reductions | Others | Total Cash Received | |||||
(Thousand US$) | ||||||||||
| 9M 2010 | 9M 2011 | 9M 2010 | 9M 2011 | 9M 2010 | 9M 2011 | 9M 2010 | 9M 2011 | 9M 2010 | 9M 2011 |
Argentina | 1,481.6 | 1,293.5 | 8,663.3 | - | - | - | - | - | 10,144.9 | 1,293.5 |
Peru | - | - | 46,892.5 | 61,600.7 | - | - | - | - | 46,892.5 | 61,600.7 |
Brazil | - | - | 178,619.5 | 172,779.9 | - | - | - | - | 178,619.5 | 172,779.9 |
Colombia | - | - | 141,036.6 | 27,664.4 | 59,462.9 | - | - | - | 200,499.5 | 27,664.4 |
Others | - | - | - | - | - | - | - | - | - | - |
Total | 1,481.6 | 1,293.5 | 375,211.8 | 262,045.0 | 59,462.9 | - | - | - | 436,156.4 | 263,338.6 |
Source: Internal Financial Report
Pg. 26
![]()
Table 11 |
|
|
|
|
|
|
|
|
|
| Payments for Additions of Fixed Assets |
| Depreciation | ||||||
|
|
|
|
|
|
|
|
|
|
| Million Ch$ |
| Thousand US$ |
| Million Ch$ |
| Thousand US$ | ||
| 9M 2010 | 9M 2011 |
| 9M 2011 |
| 9M 2010 | 9M 2011 |
| 9M 2011 |
Endesa Chile | 174,729 | 195,400 |
| 411,932 |
| 148,127 | 124,390 |
| 262,233 |
Cachoeira | 4,701 | 1,799 |
| 3,793 |
| 5,501 | 5,538 |
| 11,675 |
Endesa Fortaleza | 1,870 | 5,521 |
| 11,639 |
| 6,007 | 6,072 |
| 12,801 |
Cien | 1,884 | 1,450 |
| 3,057 |
| 23,587 | 7,876 |
| 16,604 |
Chilectra S.A. | 23,091 | 18,445 |
| 38,885 |
| 15,824 | 16,151 |
| 34,049 |
Edesur | 34,787 | 57,399 |
| 121,006 |
| 10,572 | 9,729 |
| 20,510 |
Edelnor | 15,435 | 24,056 |
| 50,714 |
| 15,383 | 14,596 |
| 30,771 |
Ampla (*) | 71,820 | 89,003 |
| 187,631 |
| 40,179 | 42,547 |
| 89,695 |
Coelce (*) | 53,535 | 41,739 |
| 87,992 |
| 28,385 | 30,212 |
| 63,691 |
Codensa | 38,305 | 48,078 |
| 101,356 |
| 44,082 | 44,550 |
| 93,918 |
Cam Ltda. | 702 | 46 |
| 97 |
| 1,316 | 294 |
| 620 |
Inmobiliaria Manso de Velasco Ltda. | 521 | 1,922 |
| 4,052 |
| 214 | 198 |
| 417 |
Synapsis | 2,237 | 488 |
| 1,029 |
| 2,343 | 478 |
| 1,008 |
Enersis holding and investment companies | 174 | 777 |
| 1,638 |
| 575 | 886 |
| 1,868 |
Total | 423,791 | 486,123 |
| 1,024,819 |
| 342,095 | 303,517 |
| 639,859 |
(*) Includes concessions intangible assets. | |||||||||
Pg. 27
The Principal Risks associated to the activities of the Enersis Group
Commercial and Regulatory Risk
The Group’s activities are subject to a broad range of governmental standards and environmental regulations. Any modification of such standards and regulations may affect the Group’s activities, economic situation and operating results.
The Group’s distribution activity is subject to a wide range of rules regarding tariffs and other issues that govern their activities in each of the countries where it operates and which could modify distribution subsidiaries operating results.
The Group’s generation activity is subject to existing hydrological and weather conditions in the geographic zones in which the Group’s hydroelectric generating plants are located. Commercial policies have been planned in order to moderate the possible impact of changes in these variables.
Group’s activities are subject to certain environmental regulation which Enersis fulfills constantly. Modifications applied on such regulations may affect the operations, economic condition or the results of these operations.
Enersis and its operating subsidiaries are subject to environmental regulations which, among other things, require the company to conduct environmental impact studies for future projects, obtaining permits, licenses and other authorizations and the fulfillment of all requirements of those licenses, permits and norms. As any other regulated company, Enersis cannot guarantee:
· The approval from regulators of environmental impact studies.
· That public opposition may not cause delays or modifications to any proposed project and
· That laws or regulations may not change or be interpreted in a manner that could adversely affect the operations or the plans for companies in which Enersis or its subsidiaries hold investments.
The group’s commercial activity has been planned to moderate possible impacts resulting from changes in hydrological conditions.
Enersis group’s operations include hydroelectric generation and therefore depend on the hydrological conditions at any time in the broad geographical zones where its hydroelectric generation installations are located. If hydrological conditions produce droughts or other conditions that negatively affect hydroelectric generation, the results could be adversely affected. Enersis has therefore defined as an essential part of its commercial policy not to contract 100% of its total capacity. The electricity business is also affected by atmospheric conditions like average temperatures which govern consumption. The different weather conditions can produce differences in the margin obtained by the business.
Financial situation and the results from operations could be adversely affected if risk exposure weren’t efficiently managed in regards to interest rates, prices of commodities, and exchange rates.
Interest Rate Risk
Interest rate variations modify the fair value of those assets and liabilities that accrue a fixed interest rate, as well as the future flows of assets and liabilities pegged to a variable interest rate.
Pg. 28
![]()
In compliance with our current interest rate hedging policy, the portion of fixed and/or hedged debt to the total net debt was 55% as of September 30, 2011 on a consolidated basis.
Depending on the Group’s estimates and debt structure objectives, hedging transactions take place hiring derivatives that mitigate these risks.
The structure of Enersis’ financial debt sort by fixed, protected and variable interest rate, and after derivatives, is as follows:
Net Position:
| Sep. 30th 2011 | Sep. 30th 2010 |
% | % | |
Fixed Interest Rate | 55% | 51% |
Variable Interest Rate | 45% | 49% |
Total | 100% | 100% |
Exchange Rate Risk
The exchange rate risks are mainly related to the following transactions:
- Foreign currency debts raised by Group’s companies.
- Payments to be made on international markets for the acquisition of projects related materials.
- Group companies’ incomes directly linked to the evolution of the dollar, and
- Incoming cash flows from our subsidiaries abroad exposed to exchange rate fluctuations.
In order to mitigate exchange rate risks, Enersis’ exchange rate hedging policy is based on cash flows and it strives to maintain a balance between dollar indexed flows and the asset and liability levels in such currency. Crosscurrency swaps and exchange rate forwards are the instruments currently used in compliance with this policy. Likewise, the policy looks to refinance debts in each company’s functional currency.
Commodities Risk
Enersis is exposed to the price fluctuation risk on some commodities, basically through
- Fuel purchases for the electricity generation and also,
- Energy transactions in the local markets.
In order to reduce risks in extreme drought conditions, the company has designed a trading policy that defines sales commitment levels consistent with its generating plants’ firm energy in a dry year, including risk mitigation clauses in some unregulated clients’ contracts.
In view of the operative conditions by the electricity generation market in Chile has experienced, like extreme drought and rising oil prices, the company has decided to hire a derivative to place a cap on the Brent price for consumption As of September 30th 2011 there are no outstanding coverage instruments and instruments taken in the past have been specific and for no considerable monetary amounts. Market and operative conditions will be constantly analyzed to adjust the volume hedged or take new hedges for the following months.
Pg. 29
![]()
Liquidity Risk
In engaging committed long term credit facilities and short term financial investments the Group maintains a consistent liquidity policy, for the amounts required to support projected needs for the period, contingent with the situation and the expectations in the debt and capital markets.
As of September 30, 2011, the Enersis Group held liquidity in the amount of Ch$ 937,454 million in Cash and Cash Equivalent and Ch$ 385,060 million in committed long term credit lines. As of December 31st, 2010, the Enersis Group held liquidity in the amount of Ch$ 961,355 million in Cash and Cash Equivalent and Ch$ 242,750 million in committed long term credit lines.
Credit Risk
Credit risk in accounts receivable, originating from trading activities, has been historically very limited given that the short term collection conditions with customers doesn’t allow them to individually accumulate significant amounts. Additionally, in the case of the so-called “unregulated clients” of our electricity generation and distribution business, a formal procedure is applied to control the credit risk, using a systematic evaluation of our counterparties, index definition and credit risk factors by virtue of which the contracts are approved or additional guarantee requirements are defined.
Furthermore, in our electricity generating business, in the event of non-payment, some countries allow power supply cut-offs, and in almost all contracts a lack of payment is established as cause for contract termination. For this purpose, credit risks are constantly monitored and the maximum amounts exposed to payment risks are measured, which are limited.
In turn, in our electricity distribution business, the energy supply cut-off is a power held by our companies in case of default by our customers, applied in accordance with the applicable regulation in each country, enabling the credit risk evaluation and control process, which is also limited.
Surplus cash flow investments are placed in prime national and foreign financial entities (with an investment grade equivalent risk rating) with limits set for each entity.
In the selection of banks for investment, the Group considers those that hold two investment grade classifications, according to the three main international risk agencies (Moody’s, S&P and Fitch Ratings).
Positions are backed up by treasury bonds from the country of operations and instruments issued by the most reputable banks, favoring, wherever possible, the first ones.
Derivatives are engaged with highly solvent entities; about 90% of operations are conducted with entities that hold an A or higher rating.
Risk Measurement
The Enersis Group measures the Value at Risk (VaR) of its debt and financial derivatives positions in order to guarantee that the risk taken by the company remains consistent with the risk exposure defined by Management, thus restricting the volatility of its financial results.
The positions portfolio used in the calculations of the current Value at Risk is comprised of debt and financial derivatives.
Pg. 30
![]()
The calculated Value at Risk represents the possible value loss of the aforementioned positions portfolio over one day time horizon with 95% of confidence.
The volatility of the risk variables that affect the value of the positions portfolio has been studied, including:
- The U.S. dollar Libor interest rate.
- The usual banking local indexes for debts, taking into account the different currencies our companies operate under, and
- The exchange rates of the different currencies involved in the calculation.
The calculation of VaR is based on generating possible future scenarios (at one day) of market values (both spot and term) for the risk variables, using Bootstrapping methodology. The number of scenarios generated ensures compliance with the simulation convergence criteria. A matrix of volatilities and correlations between the various risk variables calculated based on the historical values of the logarithmic price return, has been applied to simulate the future price scenario.
Once the price scenarios have been obtained, the fair value of the portfolio is calculated using such scenarios, obtaining a distribution of possible values at one day. The one-day 95% confidence VaR number is calculated as the 5% percentile of the potential increases in the fair value of the portfolio in one day.
The various debt positions and financial derivatives included in the calculation have been valued consistently using the financial capital calculation methodology reported to Management.
Taking in consideration the above mentioned hypotheses, the breakdown for VaR in every mentioned type of positions is the following:
Financial Positions | Sep. 30th 2011 | Sep. 30th 2010 |
Th Ch$ | Th Ch$ | |
Interest Rate | 58,886,502 | 38,847,459 |
Exchange Rate | 2,003,543 | 539,575 |
Correlation | (3,497,613) | (2,695,024) |
Total | 57,392,432 | 36,692,010 |
Other Risks
A portion of Enersis and Endesa Chile’s debt is subject to cross default provisions. If certain defaults in debt of certain specific subsidiaries are not remedied within specified grace periods, a cross default could affect Endesa Chile and Enersis, and under certain scenarios, debts at the holding company level could be accelerated.
Nonpayment – after any applicable grace period – of the debts of Enersis and Endesa Chile, or their so-called Relevant Subsidiaries, with an individual principal amount outstanding in excess of US$ 50 million (or its equivalent in other currencies), and with a missed payment also in excess of US$ 50 million, could give rise to a cross default of several bank revolving debt facilities at the Endesa Chile and
Pg. 31
![]()
Enersis levels. Furthermore, some of these debt facilities are also subject to cross acceleration provisions in the event of a default in other Relevant Subsidiary debt, for reasons other than payment default, for events such as bankruptcy, insolvency proceedings, and materially adverse governmental or legal actions, in all cases for amounts in excess of US$ 50 million dollars.
Similarly, nonpayment – after any given applicable grace period - of the debts of these companies or any of their Chilean subsidiaries, in single indebtedness in default with a principal in excess of US$ 30 million dollars, could potentially give rise to a cross default of Enersis and Endesa Chile Yankee bonds.
There are no clauses in the credit agreements by which changes in the corporate or debt classification of these companies from risk classification agencies could trigger prepayments. Nevertheless, a modification in the Standard & Poor’s (S&P) debt risk classification in foreign currency could trigger a change in the margin applicable to determine the interest rate, in the credit loans executed in 2006, and in local credit lines executed in 2009.
Pg. 32
Argentina

Generation
In Argentina, operating income to the close of September 2011 was Ch$25,435 million, which represents a reduction of 32.2% compared to the previous year. This is basically explained by higher fuel costs, energy purchases and transport expenses. This is partly compensated by larger revenues which grew by 12.9% due to a 7.4% rise in physical sales.
Endesa Costanera
The operating income of Endesa Costanera reached Ch$9,930 million to September 2011, 28.7% greater than the result for the same period of the previous year. This increase is mainly explained by a 20.2% increase in physical sales, partially offset by a rise in the costs of fuel consumption.
The effect of translating the financial statements from the Argentine peso to the Chilean peso in both periods produces a fall in Chilean pesos of 12.4% at September 2011, with respect to September 2010.
Table 12 |
|
|
|
|
|
|
Endesa Costanera | Million Ch$ |
|
| Thousand US$ | ||
| 9M 2010 | 9M 2011 | Var 2010-2011 | Chg% |
| 9M 2011 |
Operating Revenues | 252,614 | 306,738 | 54,124 | 21.4% |
| 646,650 |
Procurement and Services | (220,925) | (271,307) | (50,382) | (22.8%) |
| (571,955) |
Contribution Margin | 31,689 | 35,432 | 3,743 | 11.8% |
| 74,695 |
Other Costs | (12,596) | (15,637) | (3,040) | (24.1%) |
| (32,964) |
Gross Operating Income (EBITDA) | 19,093 | 19,795 | 702 | 3.7% |
| 41,731 |
Depreciation and Amortization | (11,380) | (9,865) | 1,515 | 13.3% |
| (20,796) |
Operating Income | 7,713 | 9,930 | 2,217 | 28.7% |
| 20,935 |
Figures may differ from those accounted under Argentine GAAP. |
|
|
|
|
| |
|
|
|
|
|
| |
Table 12.1 |
|
|
|
|
|
|
Endesa Costanera | 9M 2010 | 9M 2011 | Var 2010-2011 | Chg% |
|
|
GWh Produced | 5,910 | 7,090 | 1,181 | 20.0% |
|
|
GWh Sold | 5,957 | 7,158 | 1,201 | 20.2% |
|
|
Market Share* | 7.2% | 8.2% | 1.0 pp. |
|
|
|
(*)As percentage of total sales of the system | ||||||
Pg. 33
El Chocon
The operating income of El Chocón was Ch$16,533 million to September 2011, reflecting a fall of 37.7% compared to the same period of 2010. This is mainly explained by a 21.4% reduction in physical sales.
The effect of translating the financial statements from the Argentine peso to the Chilean peso in both periods produces a fall in Chilean pesos of 12.4% at September 2011, with respect to September 2010.
Table 13 |
|
|
|
|
|
|
El Chocón | Million Ch$ |
|
| Thousand US$ | ||
| 9M 2010 | 9M 2011 | Var 2010-2011 | Chg% |
| 9M 2011 |
Operating Revenues | 45,381 | 34,696 | (10,685) | (23.5%) |
| 73,145 |
Procurement and Services | (12,840) | (12,643) | 196 | 1.5% |
| (26,654) |
Contribution Margin | 32,541 | 22,053 | (10,488) | (32.2%) |
| 46,491 |
Other Costs | (3,642) | (3,425) | 216 | 5.9% |
| (7,221) |
Gross Operating Income (EBITDA) | 28,900 | 18,627 | (10,272) | (35.5%) |
| 39,269 |
Depreciation and Amortization | (2,357) | (2,095) | 263 | 11.1% |
| (4,416) |
Operating Income | 26,543 | 16,533 | (10,010) | (37.7%) |
| 34,854 |
Figures may differ from those accounted under Argentine GAAP. |
|
|
|
|
| |
|
|
|
|
|
|
|
Table 13.1 |
|
|
|
|
|
|
El Chocón | 9M 2010 | 9M 2011 | Var 2010-2011 | Chg% |
|
|
GWh Produced | 2,395 | 1,703 | (692) | (28.9%) |
|
|
GWh Sold | 2,646 | 2,079 | (567) | (21.4%) |
|
|
Market Share* | 3.2% | 2.4% | (0.8) pp. |
|
|
|
(*)As percentage of total sales of the system | ||||||
Pg. 34
![]()
Distribution
Edesur
In Argentina, our subsidiary Edesur saw a decline in its operating income of Ch$33,346 million, from Ch$13,044 million to September 2010 to a loss of Ch$20,302 million in the present period. This is mainly explained by the increase in personnel costs of Ch$17,954 million, principally related to wage increases under labor agreements, and an increase in other fixed operating costs of Ch$6,515 million, partially offset by an increase in physical sales which rose by 3.5% to 13,064 GWh to September 2011. Energy losses remained at 10.6% and the number of customers passed 2.3 million.
The effect of translating the financial statements from the Argentine peso to the Chilean peso in both periods produces a fall in Chilean pesos of 12.4% to September 2011 compared to the same period of last year.
Table 14 |
|
|
|
|
|
|
Edesur | Million Ch$ |
|
| Thousand US$ | ||
| 9M 2010 | 9M 2011 | Var 2010-2011 | Chg% |
| 9M 2011 |
Operating Revenues | 222,307 | 205,924 | (16,383) | (7.4%) |
| 434,119 |
Procurement and Services | (107,637) | (103,825) | 3,812 | 3.5% |
| (218,877) |
Contribution Margin | 114,670 | 102,100 | (12,570) | (11.0%) |
| 215,242 |
Other Costs | (89,482) | (111,280) | (21,798) | (24.4%) |
| (234,596) |
Gross Operating Income (EBITDA) | 25,188 | (9,181) | (34,368) | (136.4%) |
| (19,354) |
Depreciation and Amortization | (12,143) | (11,122) | 1,022 | 8.4% |
| (23,446) |
Operating Income | 13,044 | (20,302) | (33,346) | (255.6%) |
| (42,800) |
Figures may differ from those accounted under Argentine GAAP. |
|
|
|
|
| |
|
|
|
|
|
|
|
Table 14.1 |
|
|
|
|
|
|
Edesur | 9M 2010 | 9M 2011 | Var 2010-2011 | Chg% |
| |
Customers (Th) | 2,354 | 2,367 | 13 | 0.6% |
|
|
GWh Sold | 12,623 | 13,064 | 441 | 3.5% |
|
|
Clients/Employee | 898 | 830 | (67) | (7.5%) |
|
|
Energy Losses % | 10.6% | 10.6% | 0.0% |
|
|
|
Pg. 35

Endesa Brasil
Operating Income amounted to Ch$ 420,987 million, 14.4 % higher than the Ch$ 367,843 million reported as of September 30, 2010.
Table 15 |
|
|
|
|
|
|
Endesa Brasil | (Million Ch$) |
|
| (Thousand US$) | ||
| 9M 2010 | 9M 2011 | Var 2010-2011 | Chg % |
| 9M 2011 |
Sales | 1,423,250 | 1,460,357 | 37,108 | 2.6% |
| 3,078,649 |
Other operating income | 138,814 | 142,014 | 3,200 | 2.3% |
| 299,387 |
Total Revenues | 1,562,063 | 1,602,371 | 40,308 | 2.6% |
| 3,378,036 |
Procurements and Services | (866,676) | (914,674) | (47,998) | (5.5%) |
| (1,928,268) |
Contribution Margin | 695,387 | 687,697 | (7,690) | (1.1%) |
| 1,449,767 |
Other Costs | (199,364) | (186,769) | 12,594 | 6.3% |
| (393,738) |
Gross Operating Income (EBITDA) | 496,023 | 500,928 | 4,904 | 1.0% |
| 1,056,030 |
Depreciation and Amortization | (128,181) | (79,941) | 48,239 | 37.6% |
| (168,528) |
Operating Income | 367,843 | 420,987 | 53,144 | 14.4% |
| 887,502 |
Net Financial Income | (69,411) | (43,681) | 25,730 | 37.1% |
| (92,085) |
Financial income | 73,769 | 99,981 | 26,212 | 35.5% |
| 210,775 |
Financial expenses | (142,249) | (149,171) | (6,922) | (4.9%) |
| (314,475) |
Income (Loss) for indexed assets and liabilities | - | - | - |
|
| - |
Foreign currency exchange differences, net | (931) | 5,510 | 6,441 | 691.6% |
| 11,615 |
Gains | 27,012 | 16,085 | (10,927) | (40.5%) |
| 33,910 |
Losses | (27,944) | (10,576) | 17,368 | 62.2% |
| (22,295) |
Net Income from Related Comp. Cons. by the Prop. Eq.Method | - | - | - |
|
| - |
Net Income from Other Investments | - | - | - |
|
| - |
Net Income from Sales of Assets | 12 | - | (12) | (100.0%) |
| - |
Net Income before Taxes | 298,444 | 377,306 | 78,862 | 26.4% |
| 795,417 |
Income Tax | (50,843) | (85,916) | (35,073) | (69.0%) |
| (181,124) |
NET INCOME | 247,601 | 291,390 | 43,789 | 17.7% |
| 614,293 |
Net Income Attributable to Owners of the Company | 163,584 | 208,569 | 44,985 | 27.5% |
| 439,695 |
Net Income Attributable to Minority Interest | 84,017 | 82,821 | (1,196) | (1.4%) |
| 174,598 |
Generation
In Brazil, the operating income of our subsidiaries amounted to Ch$166,757 million, which is 51.3% higher than in the same period of the year before when operating income was Ch$110,232 million.
Cachoeira
The operating income of our subsidiary Cachoeira Dourada increased by Ch$4,442 million, principally due to a 7.9% increase in average sale prices, expressed in local currency. Physical energy sales declined by 98 GWh to 2,848.8 GWh to September 2011.
The effect of translating the financial statements from the Brazilian real to the Chilean peso in both periods produces a fall in Chilean pesos of 0.5% at September 2011, with respect to September 2010.
Pg. 36
![]()
Table 16 |
|
|
|
|
|
|
Cachoeira | Million Ch$ |
|
| Thousand US$ | ||
| 9M 2010 | 9M 2011 | Var 2010-2011 | Chg% |
| 9M 2011 |
Operating Revenues | 86,727 | 90,531 | 3,805 | 4.4% |
| 190,854 |
Procurement and Services | (19,598) | (19,653) | (55) | (0.3%) |
| (41,432) |
Contribution Margin | 67,129 | 70,878 | 3,750 | 5.6% |
| 149,422 |
Other Costs | (4,848) | (4,084) | 764 | 15.8% |
| (8,610) |
Gross Operating Income (EBITDA) | 62,281 | 66,794 | 4,514 | 7.2% |
| 140,812 |
Depreciation and Amortization | (5,524) | (5,595) | (71) | (1.3%) |
| (11,795) |
Operating Income | 56,757 | 61,199 | 4,442 | 7.8% |
| 129,017 |
Figures may differ from those accounted under Brazilian GAAP. |
|
|
|
|
| |
|
|
|
|
|
|
|
Table 16.1 |
|
|
|
|
|
|
Cachoeira | 9M 2010 | 9M 2011 | Var 2010-2011 | Chg% |
|
|
GWh Produced | 2,490 | 2,047 | (443) | (17.8%) |
|
|
GWh Sold | 2,947 | 2,849 | (98) | (3.3%) |
|
|
Market Share* | 1.0% | 0.9% | (0.1) pp. |
|
|
|
(*)As percentage of total sales of the system | ||||||
Fortaleza (cgtf)
The operating income of Endesa Fortaleza (CGTF) was Ch$39,723 million, a reduction of Ch$5,309 million with respect to the same period of 2010. This reduction is mainly due to lower sale prices and a fall in physical sales which declined by 198 GWh to 2,012.3 GWh to September 2011.
The effect of translating the financial statements from the Brazilian real to the Chilean peso in both periods produces a fall in Chilean pesos of 0.5% at September 2011, with respect to September 2010.
Table 17 |
|
|
|
|
|
|
Fortaleza | Million Ch$ |
|
| Thousand US$ | ||
| 9M 2010 | 9M 2011 | Var 2010-2011 | Chg% |
| 9M 2011 |
Operating Revenues | 109,832 | 98,999 | (10,833) | (9.9%) |
| 208,705 |
Procurement and Services | (53,299) | (48,573) | 4,726 | 8.9% |
| (102,398) |
Contribution Margin | 56,533 | 50,427 | (6,106) | (10.8%) |
| 106,307 |
Other Costs | (5,474) | (4,583) | 891 | 16.3% |
| (9,662) |
Gross Operating Income (EBITDA) | 51,059 | 45,844 | (5,215) | (10.2%) |
| 96,646 |
Depreciation and Amortization | (6,027) | (6,120) | (93) | (1.5%) |
| (12,903) |
Operating Income | 45,031 | 39,723 | (5,308) | (11.8%) |
| 83,743 |
Figures may differ from those accounted under Brazilian GAAP. |
|
|
|
|
| |
|
|
|
|
|
|
|
Table 17.1 |
|
|
|
|
|
|
Fortaleza | 9M 2010 | 9M 2011 | Var 2010-2011 | Chg% |
|
|
GWh Produced | 1,121 | 348 | (773) | (69.0%) |
|
|
GWh Sold | 2,210 | 2,012 | (198) | (8.9%) |
|
|
Market Share* | 0.7% | 0.6% | (0.1) pp. |
|
|
|
(*)As percentage of total sales of the system | ||||||
Pg. 37
![]()
Transmission
CIEN
On the other hand, Cien produced an increase in operating income of Ch$56,930 million to reach Ch$68,631 million at September 2011. This is basically due to the start of the toll charge (RAP) in Cien from April 2011 and reduced depreciation, amortization and impairment of assets in the period.
The effect of translating the financial statements from the Brazilian real to the Chilean peso in both periods produces a fall in Chilean pesos of 0.5% at September 2011, with respect to September 2010.
Table 18 |
|
|
|
|
|
|
Cien | Million Ch$ |
|
| Thousand US$ | ||
| 9M 2010 | 9M 2011 | Var 2010-2011 | Chg% |
| 9M 2011 |
Operating Revenues | 46,455 | 38,860 | (7,595) | (16.4%) |
| 81,922 |
Procurement and Services | (496) | 21,116 | 21,612 | 4357.4% |
| 44,515 |
Contribution Margin | 45,959 | 59,975 | 14,016 | 30.5% |
| 126,437 |
Other Costs | (8,734) | (4,362) | 4,372 | 50.1% |
| (9,195) |
Gross Operating Income (EBITDA) | 37,225 | 55,614 | 18,388 | 49.4% |
| 117,242 |
Depreciation and Amortization | (25,525) | 13,017 | 38,542 | 151.0% |
| 27,442 |
Operating Income | 11,701 | 68,631 | 56,930 | 486.6% |
| 144,684 |
Figures may differ from those accounted under Brazilian GAAP. |
|
|
|
|
| |
Pg. 38
![]()
Distribution
In Brazil, the operating income of our distribution subsidiaries was Ch$259,951 million, which is 0.3% lower than that obtained to September 2010.
Ampla
The operating income of Ampla was Ch$128,331 million, representing an increase of Ch$14.214 million in the same period of the previous year. This increase is mainly due to a higher unit energy sale margin of 2.0% in local currency, an increase of 4.3% in physical sales to 7,627 GWh and a reduced charge for depreciation, amortization and impairment of Ch$14,037 million. Energy losses declined by 1.3 p.p., moving from 21.1% to 19.8%. The number of customers of Ampla rose by 67 thousand to over 2.6 million.
The effect of translating the financial statements from the Brazilian real to the Chilean peso in both periods produces a fall in Chilean pesos of 0.5% to September 2011 compared to the same period of 2010.
Table 19 |
|
|
|
|
|
|
Ampla | Million Ch$ |
|
| Thousand US$ | ||
| 9M 2010 | 9M 2011 | Var 2010-2011 | Chg% |
| 9M 2011 |
Operating Revenues | 766,439 | 829,718 | 63,279 | 8.3% |
| 1,749,169 |
Procurement and Services | (490,011) | (555,716) | (65,704) | (13.4%) |
| (1,171,531) |
Contribution Margin | 276,428 | 274,003 | (2,425) | (0.9%) |
| 577,638 |
Other Costs | (100,823) | (98,219) | 2,603 | 2.6% |
| (207,061) |
Gross Operating Income (EBITDA) | 175,606 | 175,783 | 178 | 0.1% |
| 370,578 |
Depreciation and Amortization | (61,489) | (47,452) | 14,037 | 22.8% |
| (100,036) |
Operating Income | 114,117 | 128,332 | 14,215 | 12.5% |
| 270,542 |
Figures may differ from those accounted under Brazilian GAAP. |
|
|
|
|
| |
|
|
|
|
|
|
|
Table 19.1 |
|
|
|
|
|
|
Ampla | 9M 2010 | 9M 2011 | Var 2010-2011 | Chg% |
|
|
Customers (Th) | 2,554 | 2,621 | 67 | 2.6% |
|
|
GWh Sold | 7,309 | 7,627 | 318 | 4.4% |
|
|
Clients/Employee | 2,189 | 2,197 | 8 | 0.4% |
|
|
Energy Losses % | 21.1% | 19.8% | (1.3) pp. |
|
|
|
Pg. 39
![]()
Coelce
On the other hand, the operating income of Coelce decreased by 10.2% or Ch$14.941 million, to Ch$131,620 million. This fall in operating income is due principally to the lower unit energy sale margin of 4.2% in local currency and a higher charge for depreciation, amortization and impairment of Ch$4,136 million. Physical sales rose by 0.2% to 6,566 GWh at September 2011. Energy losses increased to 12.0% at September 2011. The number of customers in Coelce rose by 131 thousand, almost reaching a total of 3.2 million.
The effect of translating the financial statements from the Brazilian real to the Chilean peso in both periods produces a fall in Chilean pesos of 0.5% to September 2011 compared to the same period of 2010.
Table 20 |
|
|
|
|
|
|
Coelce | Million Ch$ |
|
| Thousand US$ | ||
| 9M 2010 | 9M 2011 | Var 2010-2011 | Chg% |
| 9M 2011 |
Operating Revenues | 649,803 | 641,796 | (8,007) | (1.2%) |
| 1,353,002 |
Procurement and Services | (401,428) | (409,831) | (8,402) | (2.1%) |
| (863,984) |
Contribution Margin | 248,375 | 231,966 | (16,410) | (6.6%) |
| 489,018 |
Other Costs | (72,429) | (66,826) | 5,603 | 7.7% |
| (140,878) |
Gross Operating Income (EBITDA) | 175,947 | 165,140 | (10,807) | (6.1%) |
| 348,139 |
Depreciation and Amortization | (29,385) | (33,521) | (4,136) | (14.1%) |
| (70,668) |
Operating Income | 146,562 | 131,619 | (14,943) | (10.2%) |
| 277,472 |
Figures may differ from those accounted under Brazilian GAAP. |
|
|
|
|
| |
|
|
|
|
|
|
|
Table 20.1 |
|
|
|
|
|
|
Coelce | 9M 2010 | 9M 2011 | Var 2010-2011 | Chg% |
|
|
Customers (Th) | 3,059 | 3,190 | 131 | 4.3% |
|
|
GWh Sold | 6,555 | 6,566 | 10 | 0.2% |
|
|
Clients/Employee | 2,353 | 2,468 | 114 | 4.9% |
|
|
Energy Losses % | 11.9% | 12.0% | 0.0 pp. |
|
|
|
Pg. 40
![]()
Chile


Generation
Endesa Chile
Consolidated Income Statement of Endesa Chile
Table 21 |
|
|
|
|
|
|
Endesa Chile | (Million Ch$) |
|
| (Thousand US$) | ||
| 9M 2010 | 9M 2011 | Var 2010-2011 | Chg % |
| 9M 2011 |
Sales | 1,816,390 | 1,791,612 | (24,778) | (1.4%) |
| 3,776,983 |
Other operating income | 32,870 | 12,368 | (20,502) | (62.4%) |
| 26,073 |
Total Revenues | 1,849,260 | 1,803,980 | (45,280) | (2.4%) |
| 3,803,056 |
Procurements and Services | (935,999) | (977,776) | (41,778) | (4.5%) |
| (2,061,297) |
Contribution Margin | 913,261 | 826,203 | (87,058) | (9.5%) |
| 1,741,759 |
Other Costs | (125,676) | (161,788) | (36,112) | (28.7%) |
| (341,073) |
Gross Operating Income (EBITDA) | 787,585 | 664,416 | (123,170) | (15.6%) |
| 1,400,686 |
Depreciation and Amortization | (151,359) | (133,754) | 17,605 | 11.6% |
| (281,973) |
Operating Income | 636,227 | 530,662 | (105,565) | (16.6%) |
| 1,118,713 |
Net Financial Income | (92,347) | (101,126) | (8,779) | (9.5%) |
| (213,188) |
Financial income | 7,705 | 10,185 | 2,480 | 32.2% |
| 21,472 |
Financial expenses | (108,658) | (100,967) | 7,691 | 7.1% |
| (212,853) |
Income (Loss) for indexed assets and liabilities | (3,086) | (3,880) | (794) | (25.7%) |
| (8,180) |
Foreign currency exchange differences, net | 11,691 | (6,464) | (18,155) | (155.3%) |
| (13,626) |
Gains | 24,373 | 12,339 | (12,034) | (49.4%) |
| 26,012 |
Losses | (12,682) | (18,802) | (6,121) | (48.3%) |
| (39,638) |
Net Income from Related Comp. Cons. by the Prop. Eq.Method | 67,543 | 90,136 | 22,594 | 33.5% |
| 190,021 |
Net Income from Other Investments | 139 | 376 | 237 | 171.1% |
| 792 |
Net Income from Sales of Assets | 833 | 711 | (122) | (14.7%) |
| 1,499 |
Net Income before Taxes | 612,394 | 520,759 | (91,635) | (15.0%) |
| 1,097,837 |
Income Tax | (148,961) | (149,693) | (733) | (0.5%) |
| (315,576) |
NET INCOME | 463,434 | 371,066 | (92,368) | (19.9%) |
| 782,262 |
Net Income Attributable to Owners of the Company | 351,525 | 278,006 | (73,519) | (20.9%) |
| 586,078 |
Net Income Attributable to Minority Interest | 111,909 | 93,060 | (18,849) | (16.8%) |
| 196,184 |
*Includes generation subsidiaries in Chile, Argentina, Colombia and Peru.
Chilean Operations
The operating income in Chile to September 30, 2011 amounted to Ch$ 245,359 million, representing a fall of 29.9% compared to the same period of the year before. This is mainly explained by a 7.8% reduction in operating revenues and a 5.8% increase in procurement and service costs, mainly due to higher energy purchase costs, partially compensated by reduced fuel consumption costs and transport expenses.
Revenues declined due principally to a 1.9% reduction in physical sales as a result of the lower hydroelectric availability which produced fewer sales on the spot market, partially offset by larger sales to non-regulated customers, plus a 3.9% reduction in average energy sale prices expressed in pesos.
Pg. 41
![]()
The EBITDA of the Chilean business, or gross operating margin, amounted to Ch$ 313,057 million to September 30, 2011, which represents a fall of 26.2% compared to the same period of 2010.
Table 22 |
|
|
|
|
|
|
Chilean Electricity Business | Million Ch$ |
|
| Thousand US$ | ||
| 9M 2010 | 9M 2011 | Var 2010-2011 | Chg% |
| 9M 2011 |
Operating Revenues | 984,721 | 908,325 | (76,396) | (7.8%) |
| 1,914,884 |
Procurement and Services | (500,645) | (529,538) | (28,893) | (5.8%) |
| (1,116,344) |
Contribution Margin | 484,076 | 378,788 | (105,289) | (21.8%) |
| 798,541 |
Other Costs | (59,612) | (65,730) | (6,119) | (10.3%) |
| (138,569) |
Gross Operating Income (EBITDA) | 424,465 | 313,057 | (111,408) | (26.2%) |
| 659,971 |
Depreciation and Amortization | (74,565) | (67,698) | 6,868 | 9.2% |
| (142,717) |
Operating Income | 349,900 | 245,360 | (104,540) | (29.9%) |
| 517,254 |
|
|
|
|
|
|
|
|
|
|
|
|
|
|
Table 22.1 |
|
|
|
|
|
|
Chilean Electricity Business | 9M 2010 | 9M 2011 | Var 2010-2011 | Chg% |
|
|
GWh Produced | 15,431 | 14,499 | (932) | (6.0%) |
|
|
GWh Sold | 16,005 | 15,697 | (308) | (1.9%) |
|
|
Market Share* | 39.6% | 36.4% | (3.2) pp. |
|
|
|
(*)As percentage of total sales of the system | ||||||
Distribution
Chilectra
In Chile, our subsidiary Chilectra reports operating income of Ch$97,909 million which represents an increase of Ch$16,328 million over the same period of the year before, or the equivalent of 20.0%. This is mainly explained by a higher energy business margin of Ch$20,888 million as a result of greater demand for electricity in the current period and a larger margin from other businesses associated with the reduced activity during 2010, especially with large customers, and businesses of network transfers following the earthquake of February 27, 2010. This is partially offset by an increase in personnel costs of Ch$2,729 million related to a larger payment in variable remuneration. Energy losses declined by 0.6 p.p. with respect to the same period of 2010, reaching 5.4%. Physical energy sales fell by 4.9% to 10,223 GWh to September 2011. The number of customers rose by 24 thousand, exceeding 1.6 million in the current period.
Pg. 42
![]()
Table 23 |
|
|
|
|
|
|
Chilectra | (Million Ch$) |
|
| (Thousand US$) | ||
| 9M 2010 | 9M 2011 | Var 2010-2011 | Chg % |
| 9M 2011 |
Sales | 713,320 | 769,463 | 56,143 | 7.9% |
| 1,622,142 |
Other operating income | 9,742 | 8,542 | (1,200) | (12.3%) |
| 18,007 |
Total Revenues | 723,062 | 778,005 | 54,943 | 7.6% |
| 1,640,150 |
Procurements and Services | (555,336) | (592,284) | (36,948) | (6.7%) |
| (1,248,621) |
Contribution Margin | 167,726 | 185,721 | 17,995 | 10.7% |
| 391,528 |
Other Costs | (63,846) | (63,785) | 61 | 0.1% |
| (134,468) |
Gross Operating Income (EBITDA) | 103,880 | 121,937 | 18,057 | 17.4% |
| 257,061 |
Depreciation and Amortization | (22,299) | (24,027) | (1,728) | (7.7%) |
| (50,653) |
Operating Income | 81,581 | 97,909 | 16,329 | 20.0% |
| 206,407 |
Net Financial Income | (531) | 8,005 | 8,536 | 1608.4% |
| 16,876 |
Financial income | 7,026 | 12,510 | 5,483 | 78.0% |
| 26,373 |
Financial expenses | (6,245) | (3,934) | 2,311 | 37.0% |
| (8,294) |
Income (Loss) for indexed assets and liabilities | 9 | 2 | (7) | (79.2%) |
| 4 |
Foreign currency exchange differences, net | (1,321) | (572) | 748 | 56.7% |
| (1,206) |
Gains | 673 | 698 | 26 | 3.8% |
| 1,472 |
Losses | (1,993) | (1,270) | 723 | 36.3% |
| (2,678) |
Net Income from Related Comp. Cons. by the Prop. Eq.Method | 49,934 | 47,616 | (2,318) | (4.6%) |
| 100,383 |
Net Income from Other Investments | - | - | - |
|
| - |
Net Income from Sales of Assets | (3) | 2 | 5 | 164.0% |
| 5 |
Net Income before Taxes | 130,981 | 153,533 | 22,552 | 17.2% |
| 323,671 |
Income Tax | (21,237) | (22,105) | (868) | (4.1%) |
| (46,601) |
NET INCOME | 109,744 | 131,428 | 21,684 | 19.8% |
| 277,070 |
Net Income Attributable to Owners of the Company | 109,743 | 131,428 | 21,684 | 19.8% |
| 277,069 |
Net Income Attributable to Minority Interest |
|
|
|
|
|
|
Table 23.1 |
|
|
|
| ||
Chilectra | 9M 2010 | 9M 2011 | Var 2010-2011 | Chg% | ||
Customers (Th) | 1,606 | 1,630 | 24 | 1.5% | ||
GWh Sold | 9,749 | 10,223 | 473 | 4.9% | ||
Clients/Employee | 2,202 | 2,286 | 84 | 3.8% | ||
Energy Losses % | 6.0% | 5.4% | (0.6) pp. |
| ||

Pg. 43
![]()
Colombia

Generation
Emgesa
The operating result in Colombia was Ch$174,413 million to the close of September 2011, representing a 9.6% fall compared to the same period of 2010. The principal impact is from the reform of the equity tax promulgated by the Colombian government, which meant the booking on January 1, 2011 of the whole amount payable for this concept over the period 2011-2014, including a surcharge of 25%, resulting in the effective tax rate rising from 4.8% to 6% of liquid capital as of January 1, 2011. This affected operating income by Ch$39,900 million.
In addition, there was the effect of reduced revenues of Ch$24,302 million, explained by a 10.9% fall in the average energy sale price in local currency and a decline in physical sales of 158 GWh due to reduced thermal generation, compensated partially by higher hydroelectric generation. The latter produced a positive effect on the costs of energy purchases and fuel consumption which fell by Ch$39,881 and Ch$2.871 million respectively.
The EBITDA, or gross operating margin, in Colombia, declined by 10.6% in the period to September 2011 to reach Ch$ 200,502 million, mainly explained by the negative impact of the government measures mentioned above.
The effect of translating the financial statements from the Colombian peso to the Chilean peso in both periods produces a fall in Chilean pesos of 4.4% at September 2011, with respect to September 2010.
Table 24 |
|
|
|
|
|
|
Emgesa | Million Ch$ |
|
| Thousand US$ | ||
| 9M 2010 | 9M 2011 | Var 2010-2011 | Chg% |
| 9M 2011 |
Operating Revenues | 390,201 | 365,899 | (24,302) | (6.2%) |
| 771,370 |
Procurement and Services | (140,646) | (101,373) | 39,273 | 27.9% |
| (213,710) |
Contribution Margin | 249,554 | 264,526 | 14,972 | 6.0% |
| 557,660 |
Other Costs | (25,259) | (64,024) | (38,764) | (153.5%) |
| (134,972) |
Gross Operating Income (EBITDA) | 224,295 | 200,502 | (23,793) | (10.6%) |
| 422,688 |
Depreciation and Amortization | (31,286) | (26,089) | 5,197 | 16.6% |
| (55,000) |
Operating Income | 193,008 | 174,413 | (18,596) | (9.6%) |
| 367,688 |
Figures may differ from those accounted under Colombian GAAP. |
|
|
|
|
| |
|
|
|
|
|
|
|
Table 24.1 |
|
|
|
|
|
|
Emgesa | 9M 2010 | 9M 2011 | Var 2010-2011 | Chg% |
|
|
GWh Produced | 8,519 | 8,616 | 96 | 1.1% |
|
|
GWh Sold | 11,200 | 11,041 | (158) | (1.4%) |
|
|
Market Share* | 18.3% | 18.6% | 0.3 pp. |
|
|
|
(*)As percentage of total sales of the system | ||||||
Pg. 44
![]()
Distribution
Codensa
In Colombia, the operating income of Codensa during this period was Ch$125,974 million, which represents a fall of Ch$28,283 million. The principal effect comes from the impact of the reform of the equity tax by the Colombian government which implied the booking on January 1, 2011 of the whole amount payable for this concept during the period 2011-2014, including a surcharge of 25%, with which the tax passed from an effective rate of 4.8% to 6% over the liquid capital at January 1, 2011. This situation affected operating income by Ch$19,239 million. There was also an increase in other fixed operating costs of Ch$5,270 million. This is partially compensated by an increase in physical sales of 3.1% to 9,568 GWh in the present period. Energy losses fell by 0.4 p.p. and the number of customers rose by 73 thousand to 2.6 million at September 2011.
The effect of translating the financial statements from the Colombian peso to the Chilean peso in both periods produces a fall in Chilean pesos of 4.4% to September 2011 compared to September 2010.
Table 25 |
|
|
|
|
|
|
Codensa | Million Ch$ |
|
| Thousand US$ | ||
| 9M 2010 | 9M 2011 | Var 2010-2011 | Chg% |
| 9M 2011 |
Operating Revenues | 592,765 | 595,808 | 3,043 | 0.5% |
| 1,256,052 |
Procurement and Services | (324,334) | (328,112) | (3,778) | (1.2%) |
| (691,708) |
Contribution Margin | 268,431 | 267,697 | (734) | (0.3%) |
| 564,344 |
Other Costs | (65,718) | (93,757) | (28,039) | (42.7%) |
| (197,653) |
Gross Operating Income (EBITDA) | 202,713 | 173,940 | (28,773) | (14.2%) |
| 366,692 |
Depreciation and Amortization | (48,456) | (47,966) | 490 | 1.0% |
| (101,120) |
Operating Income | 154,257 | 125,974 | (28,283) | (18.3%) |
| 265,571 |
Figures may differ from those accounted under Colombian GAAP. |
|
|
|
|
| |
|
|
|
|
|
|
|
Table 25.1 |
|
|
|
|
|
|
Codensa | 9M 2010 | 9M 2011 | Var 2010-2011 | Chg% |
| |
Customers (Th) | 2,525 | 2,598 | 73 | 2.9% |
|
|
GWh Sold | 9,276 | 9,568 | 292 | 3.1% |
|
|
Clients/Employee | 2,362 | 2,353 | (9) | (0.4%) |
|
|
Energy Losses % | 8.6% | 8.2% | (0.4) pp. |
|
|
|
Pg. 45
![]()

Generation
Edegel
In Peru, the operating income amounted to Ch$79,549 million, which represents a 44.7% increase over that reported to September 30, 2010. This growth is mainly explained by an increase of Ch$13,145 million in sales revenues as a result of 10.6% higher sales partially compensated by a 2.8% fall in the average energy sale price in local currency. In addition, there were lower operating costs of Ch$11,418 million.
The EBITDA of the business in Peru, or gross operating margin, was Ch$105,770 million to September 30, 2011, representing an increase of 25.4% compared to the same period of 2010.
The effect of translating the financial statements from the Peruvian sol to the Chilean peso in both periods produces a fall in Chilean pesos of 7.0% at September 2011, with respect to September 2010.
Table 26 |
|
|
|
|
|
|
Edegel | Million Ch$ |
|
| Thousand US$ | ||
| 9M 2010 | 9M 2011 | Var 2010-2011 | Chg% |
| 9M 2011 |
Operating Revenues | 161,205 | 174,349 | 13,145 | 8.2% |
| 367,554 |
Procurement and Services | (60,798) | (63,001) | (2,204) | (3.6%) |
| (132,816) |
Contribution Margin | 100,407 | 111,348 | 10,941 | 10.9% |
| 234,738 |
Other Costs | (16,077) | (5,578) | 10,499 | 65.3% |
| (11,760) |
Gross Operating Income (EBITDA) | 84,330 | 105,770 | 21,440 | 25.4% |
| 222,978 |
Depreciation and Amortization | (29,344) | (26,221) | 3,123 | 10.6% |
| (55,278) |
Operating Income | 54,986 | 79,549 | 24,563 | 44.7% |
| 167,700 |
Figures may differ from those accounted under Peruvian GAAP. |
|
|
|
|
| |
|
|
|
|
|
|
|
Table 26.1 |
|
|
|
|
|
|
Edegel | 9M 2010 | 9M 2011 | Var 2010-2011 | Chg% |
|
|
GWh Produced | 6,229 | 6,775 | 547 | 8.8% |
|
|
GWh Sold | 6,349 | 7,021 | 672 | 10.6% |
|
|
Market Share* | 29.0% | 29.5% | 0.6 pp. |
|
|
|
Pg. 46
Distribution
Edelnor
In Peru, our subsidiary Edelnor shows operating income of Ch$54,645 million, Ch$5,219 million more than that obtained in the same period of the year before, when it reached Ch$49,426 millions. This increase is mainly due to higher energy sales which rose by 7.6% to 4,895 GWh in the present period, plus the higher unit sale margin and reduced fixed costs of Ch$1,877 million. Energy losses remained at 8.2% in the period. The number of customers increased 46 thousand, exceeding 1.1 million customers.
The effect of translating the financial statements from the Peruvian sol to the Chilean peso in both periods produces a fall in Chilean pesos of 7.0% to September 2011 compared to the same period of 2010.
Table 27 |
|
|
|
|
|
|
Edelnor | Million Ch$ |
|
| Thousand US$ | ||
| 9M 2010 | 9M 2011 | Var 2010-2011 | Chg% |
| 9M 2011 |
Operating Revenues | 230,578 | 238,636 | 8,058 | 3.5% |
| 503,081 |
Procurement and Services | (140,739) | (145,997) | (5,259) | (3.7%) |
| (307,784) |
Contribution Margin | 89,840 | 92,639 | 2,799 | 3.1% |
| 195,297 |
Other Costs | (23,811) | (21,934) | 1,877 | 7.9% |
| (46,240) |
Gross Operating Income (EBITDA) | 66,028 | 70,705 | 4,677 | 7.1% |
| 149,057 |
Depreciation and Amortization | (16,602) | (16,059) | 543 | 3.3% |
| (33,855) |
Operating Income | 49,426 | 54,646 | 5,219 | 10.6% |
| 115,201 |
Figures may differ from those accounted under Peruvian GAAP. |
|
|
|
|
| |
|
|
|
|
|
|
|
Table 27.1 |
|
|
|
|
|
|
Edelnor | 9M 2010 | 9M 2011 | Var 2010-2011 | Chg% |
| |
Customers (Th) | 1,086 | 1,132 | 46 | 4.2% |
|
|
GWh Sold | 4,550 | 4,895 | 345 | 7.6% |
|
|
Clients/Employee | 1,939 | 2,028 | 85 | 4.4% |
|
|
Energy Losses % | 8.2% | 8.2% | 0.0 pp. |
|
|
|
Pg. 47
![]()
Operating Income by Subsidiary
Summary of operating revenues, operating costs (including procurements, services and other costs) and operating income of all Enersis’ subsidiaries, for the period ended in September 30, 2010 and September 30, 2011, detailed as follows:
Table 28 |
|
|
|
|
|
|
9M 2010 | 9M 2011 | |||||
Million Ch$ | Operating Revenues | Operating Costs | Operating Income | Operating Revenues | Operating Costs | Operating Income |
Endesa Chile (*) | 1,849,260 | (1,213,033) | 636,227 | 1,803,980 | (1,273,318) | 530,662 |
Cachoeira (**) | 86,727 | (29,970) | 56,757 | 90,531 | (29,332) | 61,199 |
Fortaleza (***) | 109,832 | (64,800) | 45,032 | 98,999 | (59,276) | 39,723 |
Cien (**) | 46,455 | (34,754) | 11,701 | 38,860 | 29,771 | 68,631 |
Chilectra | 723,062 | (641,481) | 81,581 | 778,005 | (680,096) | 97,909 |
Edesur | 222,307 | (209,263) | 13,044 | 205,924 | (226,226) | (20,302) |
Distrilima (Edelnor) | 230,578 | (181,152) | 49,426 | 238,636 | (183,991) | 54,645 |
Ampla | 766,439 | (652,322) | 114,117 | 829,718 | (701,387) | 128,331 |
Coelce | 649,803 | (503,242) | 146,561 | 641,797 | (510,177) | 131,620 |
Codensa | 592,765 | (438,508) | 154,257 | 595,809 | (469,835) | 125,974 |
CAM Ltda. | 86,587 | (87,980) | (1,393) | 15,739 | (17,179) | (1,440) |
Inmobiliaria Manso de Velasco Ltda. | 4,507 | (3,704) | 803 | 4,576 | (3,806) | 770 |
Synapsis Soluciones y Servicios IT Ltda. | 50,497 | (52,895) | (2,398) | 6,693 | (6,556) | 137 |
ICT | 970 | (489) | 481 | 4,026 | (3,926) | 100 |
Enersis Holding and other investment vehicles | 11,792 | (26,467) | (14,675) | 27,240 | (40,214) | (12,974) |
Consolidation Adjustments | (601,209) | 599,239 | (1,970) | (531,734) | 526,179 | (5,555) |
Total Consolidation | 4,830,372 | (3,540,821) | 1,289,551 | 4,848,799 | (3,649,369) | 1,199,430 |
Table 28.1 |
|
|
| |||
9M 2011 | ||||||
Thousand US$ | Operating Revenues | Operating Costs | Operating Income | |||
Endesa Chile (*) | 3,803,057 | (2,684,343) | 1,118,714 | |||
Cachoeira (**) | 190,853 | (61,836) | 129,017 | |||
Fortaleza (***) | 208,705 | (124,963) | 83,742 | |||
Cien (**) | 81,923 | 62,762 | 144,684 | |||
Chilectra | 1,640,150 | (1,433,743) | 206,407 | |||
Edesur | 434,118 | (476,918) | (42,800) | |||
Distrilima (Edelnor) | 503,080 | (387,880) | 115,200 | |||
Ampla | 1,749,168 | (1,478,628) | 270,541 | |||
Investluz (Coelce) | 1,353,003 | (1,075,529) | 277,474 | |||
Codensa | 1,256,054 | (990,482) | 265,572 | |||
CAM Ltda. | 33,180 | (36,216) | (3,036) | |||
Inmobiliaria Manso de Velasco Ltda. | 9,647 | (8,024) | 1,623 | |||
Synapsis Soluciones y Servicios IT Ltda. | 14,110 | (13,821) | 289 | |||
ICT | 8,487 | (8,277) | 211 | |||
Enersis Holding and other investment vehicles | 57,426 | (84,777) | (27,351) | |||
Consolidation Adjustments | (1,120,974) | 1,109,263 | (11,711) | |||
Total Consolidation | 10,221,986 | (7,693,410) | 2,528,576 | |||
(*) Since January 1st, 2009, includes Gas Atacama, Transquillota e HydroAysén
(**) Consolidated by Endesa Chile until September 30th, 2005. Since October 1st, 2005 is
consolidated by Enersis through Endesa Brasil.
(***) Since October 1st, 2005, these subsidiaries are consolidated by Enersis through Endesa Brasil.
Pg. 48
Ownership of the Company as of September 30, 2011
Conference Call Invitation
Enersis is pleased to invite you to participate in aConference Call with the management to review the results for the period, onWednesday, October 26, 2011, 16:00 PM EST (17:00 PM Local Chile Time.) There will be a question and answer session following management's comments. Representing Enersis will be Mr. Alfredo Ergas, Chief Financial Officer and the Investor Relations Team.
To participate, please dial+1 (617) 213 4864 or+1 (888) 713 4211 (toll free USA), approximately 10 minutes prior to the scheduled start time,Passcode ID: 70446719.
To access the phone replay, please dial+1 (617) 801 6888or+1 (888) 286 8010 (toll free USA)Passcode ID: 94432584.
For this Conference Call you can access previously to the pre-registration site at
https://www.theconferencingservice.com/prereg/key.process?key=PCB4GHMFN
and make your registration quicker. If not, please connect approximately 15 minutes prior to the scheduled start time. You can also access to the conference call replay through our Investor Relations website at http://www.enersis.cl.
Pg. 49
![]()
Contact Information
For further information, please contact us:
Ricardo Alvial Investments and Risks Director mlmr@enersis.cl (56-2) 353 4682 | Denisse Labarca Head of Investor Relations denisse.labarca@enersis.cl (56-2) 353 4576 |
Nicolas Donoso Investor Relations Associate ndo@enersis.cl (56-2) 353 4492
| Jorge Velis InvestorRelations Associate jgve@enersis.cl (56-2) 353 4552 | Carmen Poblete Shares Department Representative cpt@enersis.cl (56-2) 353 4447
| |
Maria Luz Muñoz Investor Relations Assistant mlmr@enersis.cl (56-2) 353 4682 |
| ||
Disclaimer
This Press Release contains statements that could constitute forward-looking statements within the meaning of the Private Securities Litigation Reform Act of 1995. These statements appear in a number of places in this announcement and include statements regarding the intent, belief or current expectations of Enersis and its management with respect to, among other things: (1) Enersis’ business plans; (2) Enersis’ cost-reduction plans; (3) trends affecting Enersis’ financial condition or results of operations, including market trends in the electricity sector in Chile or elsewhere; (4) supervision and regulation of the electricity sector in Chile or elsewhere; and (5) the future effect of any changes in the laws and regulations applicable to Enersis’ or its subsidiaries. Such forward-looking statements are not guarantees of future performance and involve risks and uncertainties. Actual results may differ materially from those in the forward-looking statements as a result of various factors. These factors include a decline in the equity capital markets of the United States or Chile, an increase in the market rates of interest in the United States or elsewhere, adverse decisions by government regulators in Chile or elsewhere and other factors described in Enersis’ Annual Report on Form 20-F. Readers are cautioned not to place undue reliance on those forward-looking statements, which state only as of their dates. Enersis undertakes no obligation to release publicly the result of any revisions to these forward-looking statements.
Pg. 50
SIGNATURES
Pursuant to the requirements of the Securities Exchange Act of 1934, as amended, the Registrant has duly caused this report to be signed on its behalf by the undersigned, thereunto duly authorized.
| ENERSIS S.A. | |
| By: /s/ Ignacio Antoñanzas Alvear | |
| -------------------------------------------------- | |
| Title: Chief Executive Officer |
Date: October 27, 2011