FORM 6-K
SECURITIES AND EXCHANGE COMMISSION
Washington, D.C. 20549
Report of Foreign Issuer
Pursuant to Rule 13a-16 or 15d-16 of
the Securities Exchange Act of 1934
For the month of April, 2011
Commission File Number: 001-12440
ENERSIS S.A.
(Translation of Registrant’s Name into English)
Santa Rosa 76
Santiago, Chile
(Address of principal executive office)
Indicate by check mark whether the registrant files or will file
annual reports under cover of Form 20-F or Form 40-F:
Form 20-F [X] Form 40-F [ ]
Indicate by check mark if the registrant is submitting the Form 6-K
in paper as permitted by Regulation S-T Rule 101(b)(1):
Yes [ ] No [X]
Indicate by check mark if the registrant is submitting the Form 6-K
in paper as permitted by Regulation S-T Rule 101(b)(7):
Yes [ ] No [X]
Indicate by check mark whether by furnishing the information
ontained in this Form, the Registrant is also thereby furnishing the
information to the Commission
pursuant to Rule 12g3-2(b) under the Securities Exchange Act of 1934:
Yes [ ] No [X]
If °;Yes” is marked, indicate below the file number assigned to the registrant
in connection with Rule 12g3-2(b): N/A
| | PRESS RELEASE 1Q 2011 |
ENERSIS
ANNOUNCES CONSOLIDATED RESULTS
FOR THEPERIOD ENDED ON MARCH 31st,, 2011
Highlights for the Period
Summary
Ø On April 25, Moody's upgraded the international senior unsecured debt rating of Enersis and our subsidiary Endesa Chile to Baa2 from Baa3, with stable outlook. According to the agency, the upgrade of both companies “largely reflects each issuer’s strong consolidated credit metrics”, and also factors that “internal cash flow generation will remain robust and that dividend policy will continue to be conservative”.
Ø Within this financial context, it’s important to highlight the successful issuance on the international markets of an unsecured bond issued by Emgesa, our Colombian generation subsidiary, for an amount equivalent to US$ 400 million in Colombian pesos.
Ø The first quarter of this year confirmed the growth in electricity demand experienced in the markets where we operate, of which we can highlight the strong increase in demand observed in our Chilean and Peruvian operations, where demand for electricity grew 9.1% and 7.7% respectively.
Ø This relevant increase in demand is mostly attributable to the stronger economic activity in these markets, in every segment.
Ø The boosted activity, according to consensus forecasts, will remain during 2011, based on projections for GDP growth, of 6.8% in Peru, 6.0% in Chile, 5.8% in Argentina, 4.6% in Colombia and 4.1% in Brazil.
Ø Linked to the above mentioned it is important to highlight that a proper commercial policy and also the availability of our thermal capacity allowed us to satisfy the growing demand, although Chile is facing one of the more severe droughts in the last 60 years.
Ø In this context, it is important to highlight the recovery of our coal-fired power plant Bocamina I, damaged by the last year earthquake. This positive achievement allowed us to provide the country with a more secure and stable source of energy during a dry year.
Ø A well diversified mix of assets, contributed to balance the structure of our EBITDA, as follows,
| § Generation and Transmission § Distribution | 53% 47% |
Ø Our Distribution client´s base increased by more than 372,000 new customers, confirming the high stability coming from the natural growth of our business.
Ø Operating income of the period totaled Ch$ 350,715 million, equivalent to a 9% decrease compared with the same period of 2010.
Pg. 1
| | PRESS RELEASE 1Q 2011 |
Distribution Business
Consolidated figures for the Distribution Businesses are detailed as follows:
Ø Operating Revenues increased 4.1%, amounting to Ch$ 1,075,926 million.
Ø Operating Costs reached Ch$ 921,954 million, which represent an 8.8% increase compared with 2010.
Ø EBITDA totaled Ch$ 205,985 million, a 17.7% decrease when compared with 2010, mainly due to the decrease in results from our Colombian and Brazilian operations, partially offset by better results from our Chilean and Peruvian operations.
Factors that influenced these results, on a country by country basis, are the following:
In Chile, EBITDA increased Ch$ 6,975 million, which is mainly the result of:
Ø A better sales margin mainly related to the strong demand observed during the quarter.
Ø An increase in revenues from ancillary services, mainly related to the higher economic activity prevailing during the first quarter of the year 2011 when compared with 2010.
In Peru, EBITDA increased Ch$ 340 million, as a result of:
Ø Higher physical sales by 7.7%, which resulted in increased revenues from energy sales.
Ø The increase in revenues from ancillary services.
Ø The latter was partially offset by higher energy losses by 0.3 pp.
In Argentina, EBITDA decreased Ch$ 8,311 million, as result of:
Ø A lower purchase/sales margin measured in Argentinean pesos.
Ø An increase in operational costs, mainly related to higher costs due an increase in wages.
Ø The above mentioned was partially offset by an increase in physical sales, mainly explained by the higher demand related to the increase in economic activity in the country.
In Brazil, EBITDA decreased Ch$ 26,092 million, as a result of:
Ø A decrease in sales margin on both Ampla and Coelce, due to a worse sales margin mainly related to a reduced tariff in Ampla related to a lower energy cost recognized, and a worse sales mix at the level of Coelce.
Ø The above was partially offset by an increase in physical sales at the level of Ampla.
In Colombia, EBITDA decreased Ch$ 17,343 million, mainly due to
Ø The effect of the government reform on the Equity Tax, which resulted in registering as of January 1st 2011 the entire amount to be paid for this concept within the period 2011-2014.
Ø This one-time effect completely offset the better sales margins recorded during the period, resulting from higher physical sales and lower energy looses.
Pg. 2
| | PRESS RELEASE 1Q 2011 |
Generation and Transmission Business
Ø Consolidated physical sales rose by 3.8% to 15,672 GWh, increasing mainly in Colombia, Peru and Argentina. As a result of these higher physical sales and higher average sales prices, sales revenues increased by 8.6% when compared to the first quarter of 2010, reaching Ch$ 630,888 million.
Ø Operating Revenues increased 9.5%, when compared with same period 2010, amounting to Ch$ 639,046 million.
Ø Operating Costs reached Ch$ 438,281 million, which represent a 14.3% increase compared with 2010, as a result of higher energy and fuel purchase costs in our Chilean, Brazilian and Argentinean operations.
Ø EBITDA totaled Ch$ 231,710 million, an 11.5% decrease when compared with 2010.
Ø Consolidated hydroelectric generation decrease 2.7%, mainly explained by reductions in Brazil, Chile and Argentina, partially compensated by increases in Colombia and Peru.
Factors that influenced these results, on a country by country basis, are the following:
In Peru, EBITDA increased by Ch$ 2.870 million due to:
Ø Higher energy sales revenues of Ch$ 5,364 million, resulting from a higher sales volume related to the increasing energy demand observed in the country.
Ø Lower energy purchase costs of Ch$ 1,904 million.
Ø Partially compensated by increased fuel costs of Ch$ 2,036 million.
In Chile, EBITDA fell by Ch$ 4,048 million mainly due to:
Ø Higher energy purchase costs by Ch$ 43,316 million.
Ø Higher transportation costs of Ch$ 3,484 million.
Ø Partially compensated by higher energy sales revenues of Ch$ 31,873 million.
In Brazil, EBITDA fell by Ch$ 5,253 million mainly due to:
Ø Higher energy purchase costs of approximately Ch$ 14,756 million, mainly at the level of Endesa Fortaleza.
Ø Partially compensated by higher energy sales revenues of Ch$ 12,353 million.
In Argentina, EBITDA fell by Ch$ 6,162 million due to:
Ø Higher fuel costs of Ch$ 11,720 million.
Ø Partially compensated by higher energy sales revenues of Ch$ 10,173 million.
In Colombia, EBITDA decreased Ch$ 17,601 million, mainly due to
Ø The effect of the government reform on the Equity Tax, which resulted in registering as of January 1st 2011 the entire amount to be paid for this concept within the period 2011-2014.
Ø This one-time effect completely offset the better sales margins recorded during the period, resulting from better hydrology and higher physical sales.
Pg. 3
| | PRESS RELEASE 1Q 2011 |
Financial Summary
Ø The average interest rate increased, from 7.4% up to 8.5%, mainly because of inflationary effects.
Ø Liquidity, a key consideration in our financial management, continues to be in a very solid position, as shown below:
· Cash and cash equivalents amount to US$ 2,080 million in the aggregate for Enersis Consolidated.
· Committed long term credit lines for US$ 975 million in the aggregate for Enersis Consolidated, of which US$ 268 million are due on the short term.
· Non-committed credit lines for US$ 1,866 million available in the aggregate for Enersis Consolidated.
Ø Within this context, it’s important to highlight the successful issuance on the international markets of an unsecured bond in local currency by Emgesa, our Colombian generation subsidiary, for an amount equivalent to US$ 400 million. This breaking-through deal, the first bond issued in local currency on the international markets by a Colombian private company, was rated as Investment Grade by Fitch and Standard and Poor’s, ratified our criteria of allowing subsidiaries to be financially healthy by its own merits.
Ø Coverage and Protection: In order to mitigate exchange rate and interest rate risks, Enersis has established strict internal rules to protect our cash flows and balance sheet from variations in these variables.
· Our exchange rate policy is based on cash flows and it strives to maintain a balance between US dollar indexed flows, and assets and liabilities in such currency. In addition to this policy, we have contracted Cross Currency Swaps for a total amount of US$ 1,437 million and Forwards, for US$ 329 million.
· In order to reduce volatility on financial results due to changes in market interest rates, we seek to maintain an adequate balance upon our debt structures. Thus, we have contracted Interest Rate Swaps for US$ 354 million.
Market Summary
Since April 2010, and despite the divestments made during the last months by foreign investors, the Chilean stock exchange main index (IPSA) has shown an important increase of 21.7%, over performing when compared to other international stock markets: Bovespa: -3.6%, S&P 500: 12.5%, UKX: 2.8%, Dow Jones Industrials: 12.8% and FTSE 250: 12.4% (all yields measured in local currencies).
Enersis’ share price in the local market decreased 7.0% during the period. Divestitures made by Chilean pension funds and other foreign investors have influenced the evolution of Enersis stock, which underperformed in the local market. During the last twelve months, Enersis continued to be among the most traded companies at the local market (Santiago Stock Exchange and Chilean Electronic Exchange), with a daily average trading volume of US$ 9.7 million.
Enersis’ ADR price underperformed the Dow Jones Industrials and S&P indexes, with a return of 1.7% in the twelve-month period of April 2010 – March 2011.
Pg. 4
| | PRESS RELEASE 1Q 2011 |
Source: Bloomberg
Risk Rating Classification Information
Enersis’ international and domestic credit ratings have been upgraded in 2010, due to Company’s improvements in its liquidity position and lower leverage. The positive perspectives on operational and credit profile of Enersis have been reflected in the upgrades received by Fitch Ratings and Standard & Poor’s for our international ratings and by Feller Rate and Fitch Rating for our domestic rating.
Current ratings are further supported by our well diversified asset portfolio, strong credit metrics, adequate debt structure and solid liquidity. Enersis’ geographic diversification through Latin America provides us a natural hedge against different regulations and weather conditions. Most of our operating subsidiaries are financially strong and have leading market positions in the countries where they operate.
Additionally, on April 25, 2011, Moody's upgraded the international senior unsecured rating of Enersis from Baa3 to Baa2 with stable outlook. According to the agency, this improvement reflects Enersis’ long established and strong financial position.
The current risk classifications are:
Ø International Ratings:
Enersis | S&P | Moody’s | Fitch |
Corporate | BBB+ / Stable | Baa2 / Stable | BBB+ / Stable |
Ø Domestic Ratings (for securities issued in Chile):
Enersis | Feller Rate | Fitch |
Shares | 1st Class Level 1 | 1stClass Level 1 |
Bonds | AA / Stable | AA / Stable |
Pg. 5
| | PRESS RELEASE 1Q 2011 |
Table ofContents
Summary | 1 | |
Distribution Business | 2 | |
Generation and Transmission Business | 3 | |
Financial Summary | 4 | |
Market Summary | 4 | |
Risk Rating Classification Information | 5 | |
| TABLE OF CONTENTS | 6 | |
| GENERAL INFORMATION | 8 | |
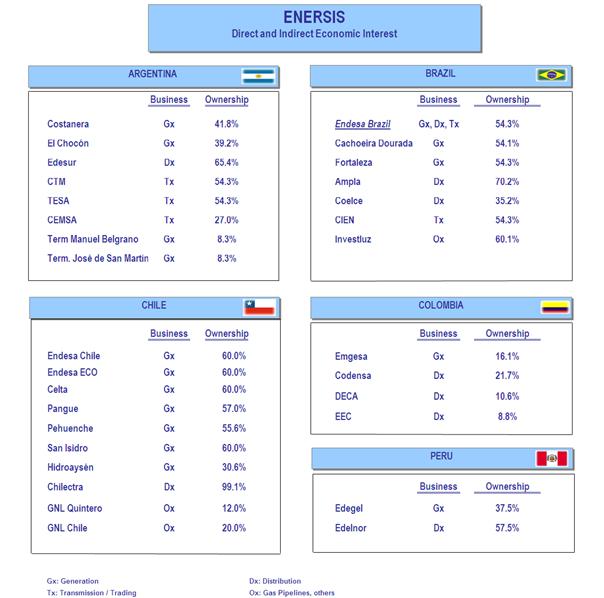
SIMPLIFIED ORGANIZATIONAL STRUCTURE | 9 | |
| MARKET INFORMATION | 10 | |
EQUITY MARKET | 10 | |
DEBT MARKET | 13 | |
CONSOLIDATED INCOME STATEMENT ANALYSIS | 14 | |
NET INCOME | 14 | |
OPERATING INCOME | 14 | |
NET FINANCIAL INCOME | 16 | |
TAXES | 16 | |
CONSOLIDATED BALANCE SHEET ANALYSIS | 17 | |
ASSETS UNDER IFRS | 17 | |
| BOOK VALUE AND ECONOMIC VALUE OF ASSETS | 19 | |
LIABILITIES AND SHAREHOLDERS’ EQUITY UNDER IFRS | 20 | |
DEBT MATURITY WITH THIRD PARTIES, MILLION US$ | 22 | |
DEBT MATURITY WITH THIRD PARTIES, MILLION CH$ | 22 | |
EVOLUTION OF KEY FINANCIAL RATIOS | 23 | |
UNDER IFRS | 24 | |
CASH FLOW RECEIVED FROM FOREIGN SUBSIDIARIES BY ENERSIS, CHILECTRA AND ENDESA CHILE | 25 | |
| THE PRINCIPAL RISKS ASSOCIATED TO THE ACTIVITIES OF THE ENERSIS GROUP | 26 | |
| ARGENTINA | 30 | |
GENERATION | 30 | |
Endesa Costanera | 30 | |
El Chocón | 30 | |
DISTRIBUTION | 31 | |
Edesur | 31 | |
| BRAZIL | 32 | |
ENDESA BRASIL | 32 | |
GENERATION | 32 | |
Cachoeira | 32 | |
Fortaleza (cgtf) | 33 | |
TRANSMISSION | 33 | |
CIEN | 33 | |
DISTRIBUTION | 34 | |
Ampla | 34 | |
Pg. 6
| | PRESS RELEASE 1Q 2011 |
Coelce | 35 | |
GENERATION | 36 | |
Endesa Chile | 36 | |
DISTRIBUTION | 37 | |
Chilectra | 37 | |
| COLOMBIA | 38 | |
GENERATION | 38 | |
Emgesa | 38 | |
DISTRIBUTION | 39 | |
Codensa | 39 | |
GENERATION | 40 | |
Edegel | 40 | |
DISTRIBUTION | 41 | |
Edelnor | 41 | |
| CONFERENCE CALL INVITATION | 43 | |
CONTACT INFORMATION | 44 | |
DISCLAIMER | 44 |
Pg. 7
| | PRESS RELEASE 1Q 2011 |
General Information
(Santiago, Chile, Wednesday 27th, April 2011) Enersis S.A. (NYSE: ENI), announced today its consolidated financial results for the first quarter of 2011. All figures are in Chilean pesos (Ch$) and in accordance to International Financial Reporting Standards (IFRS). Variations refer to comparison between the period ended on March 31, 2010 and March 31, 2011.
Figures as of March 31, 2011 are additionally translated into US$, merely as a convenience translation, using the exchange rate of US$ 1 = Ch$ 479.46 as of March 31, 2011 for the Balance Sheet, and the average exchange rate for the period of US$ 1 = Ch$ 481.81 for the Income Statement, Cash Flow Statements, Capex and Depreciation values.
The consolidation includes the following investment vehicles and companies,
a) In Chile: Endesa Chile (NYSE: EOC)*, Chilectra, and Inmobiliaria Manso de Velasco.
b) Outside Chile: Distrilima (Peru), Endesa Brasil (Brazil)**, Edesur (Argentina) and Codensa (Colombia).
In the following pages you will find a detailed financial statement analysis, a brief explanation for the most important variations and comments on main items in the P&L and Cash Flow Statements compared to the information as of March 31, 2011.
* Includes Endesa Chile Chilean subsidiaries (Celta, Pangue, Pehuenche, San Isidro, and Túnel El Melón), non Chilean subsidiaries (Endesa Costanera, El Chocón, Edegel and Emgesa) and jointly controlled companies (Gas Atacama, Transquillota and HidroAysén).
** Includes Endesa Fortaleza, CIEN, Cachoeira Dourada, Ampla and Coelce.
Pg. 8
| | PRESS RELEASE 1Q 2011 |
Market Information
Equity Market
New York Stock Exchange (NYSE)
The chart below shows the performance of Enersis’ ADR (“ENI”) price at the NYSE, compared to the Dow Jones Industrials and the Dow Jones Utilities indexes over the last 12 months:
Source: Bloomberg
Pg. 10
| | PRESS RELEASE 1Q 2011 |
Santiago Stock Exchange (BCS)
The chart below shows the performance of Enersis’ Chilean stock price over the last 12 months compared to the Chilean Selective Stock Index (IPSA):
Pg. 11
| | PRESS RELEASE 1Q 2011 |
Madrid Stock Exchange (Latibex) - Spain
The chart below shows Enersis’ share price (“XENI”) at the Latibex over the last 12 months compared to the local stock index (IBEX):
Pg. 12
| | PRESS RELEASE 1Q 2011 |
Debt Market
Yankee Bonds Price Evolution
The following chart shows the pricing of two of our Yankee Bonds over the last 12 months compared to the Ishares Iboxx Investment Grade Corporate Bond Fund Index:
(*)Ishares Iboxx Investment Grade Corporate Bond Fund Index is an exchange traded fund incorporated in the U.S.A. The Index measures the performance of a fixed number of investment grade corporate bonds.
Pg. 13
| | PRESS RELEASE 1Q 2011 |
CONSOLIDATED INCOME STATEMENT ANALYSIS
Net Income
Enersis’ Net Income attributable to the Owners of the Company for the period 2010 was Ch$ 95,851 million, representing a 4.3% increase over the same last year’s period, which was Ch$ 91,926 million.
Under IFRS
Table 1 |
|
|
|
|
|
|
CONSOLIDATED INCOME STATEMENT | (Million Ch$) |
| (Thousand US$) | |||
| 1Q 2010 | 1Q 2011 | Var 2010-2011 | Chg % |
| 1Q 2011 |
Sales | 1,417,314 | 1,502,128 | 84,814 | 6.0% |
| 3,117,677 |
Energy sales | 1,323,006 | 1,385,458 | 62,452 | 4.7% |
| 2,875,528 |
Other sales | 11,062 | 11,457 | 395 | 3.6% |
| 23,779 |
Other services | 83,246 | 105,213 | 21,967 | 26.4% |
| 218,370 |
Other operating income | 63,012 | 73,441 | 10,429 | 16.6% |
| 152,428 |
Revenues | 1,480,326 | 1,575,569 | 95,243 | 6.4% |
| 3,270,105 |
|
|
|
|
|
|
|
Power purchased | (379,229) | (445,138) | (65,909) | (17.4%) |
| (923,887) |
Cost of fuel consumed | (153,150) | (152,939) | 211 | 0.1% |
| (317,426) |
Transportation expenses | (78,504) | (90,199) | (11,695) | (14.9%) |
| (187,210) |
Other variable procurements and services | (160,405) | (184,769) | (24,364) | (15.2%) |
| (383,489) |
Procurements and Services | (771,289) | (873,046) | (101,757) | (13.2%) |
| (1,812,012) |
|
|
|
|
|
|
|
Contribution Margin | 709,038 | 702,524 | (6,514) | (0.9%) |
| 1,458,093 |
|
|
|
|
|
|
|
Work on non-current assets | 7,006 | 8,623 | 1,617 | 23.1% |
| 17,897 |
Employee expenses | (84,636) | (90,759) | (6,122) | (7.2%) |
| (188,370) |
Other fixed operating expenses | (117,343) | (186,028) | (68,684) | (58.5%) |
| (386,102) |
Gross Operating Income (EBITDA) | 514,064 | 434,360 | (79,703) | (15.5%) |
| 901,518 |
Depreciation and amortization | (120,376) | (105,646) | 14,729 | 12.2% |
| (219,270) |
Impairment losses (Reversals) | (8,426) | 22,001 | 30,427 | 361.1% |
| 45,663 |
Operating Income | 385,262 | 350,715 | (34,547) | (9.0%) |
| 727,911 |
|
|
|
|
|
|
|
Net Financial Income | (83,034) | (69,391) | 13,644 | 16.4% |
| (144,021) |
Financial income | 24,022 | 40,948 | 16,926 | 70.5% |
| 84,989 |
Financial expenses | (96,882) | (108,203) | (11,321) | (11.7%) |
| (224,576) |
Income (Loss) for indexed assets and liabilities | (1,142) | (3,719) | (2,577) | (225.6%) |
| (7,719) |
Foreign currency exchange differences, net | (9,033) | 1,583 | 10,616 | 117.5% |
| 3,285 |
Gains | 23,820 | 20,465 | (3,355) | (14.1%) |
| 42,475 |
Losses | (32,852) | (18,882) | 13,970 | 42.5% |
| (39,190) |
Net Income From Related Comp. Cons. by the Prop. Eq.Method | 703 | 2,379 | 1,676 | 238.6% |
| 4,938 |
Net Income From Other Investments | (130) | 52 | 182 | 139.9% |
| 108 |
Net Income From Sales of Assets | 732 | (8,977) | (9,709) | (1326.2%) |
| (18,632) |
|
|
|
|
|
|
|
Net Income Before Taxes | 303,532 | 274,778 | (28,754) | (9.5%) |
| 570,304 |
Income Tax | (96,750) | (93,438) | 3,312 | 3.4% |
| (193,931) |
NET INCOME ATTRIBUTABLE TO: | 206,782 | 181,340 | (25,442) | (12.3%) |
| 376,373 |
Shareholders of the Company | 91,926 | 95,851 | 3,925 | 4.3% |
| 198,939 |
Minority Interest | 114,856 | 85,489 | (29,367) | (25.6%) |
| 177,434 |
|
|
|
|
|
|
|
Earning per share (Ch$ /share and US$ / ADR) | 2.8 | 2.9 | 0.1 | 4.3% |
| 0.3 |
Operating Income
Operating Income for the period 2010 decreased by Ch$ 34,547, from Ch$ 385,262 million to Ch$ 350,715 million, representing a decrease of 9%; the above is mainly due to the decrease in results from our distribution subsidiaries in Brazil, Colombia and Argentina, which was partially offset by better results from Chile.
Operating Revenues and Costs, broken down by business line for the period ending on March 31, 2011 and 2011 are:
Pg. 14
| | PRESS RELEASE 1Q 2011 |
Table 2 |
|
|
|
|
|
|
|
|
|
|
|
|
|
Operating Income by Businesses | Generation and Transmission | Distribution | |||||||||||
Million Ch$ |
| Chg% |
| Th. US$ |
| Million Ch$ |
| Chg% |
| Th. US$ | |||
1Q 2010 | 1Q 2011 |
|
|
| 1Q 2011 |
| 1Q 2010 | 1Q 2011 |
|
|
| 1Q 2011 | |
Operating Revenues | 583,442 | 639,046 |
| 9.5% |
| 1,326,345 |
| 1,033,690 | 1,075,926 |
| 4.1% |
| 2,233,092 |
Operating Costs | (383,604) | (438,281) |
| 14.3% |
| (909,656) |
| (847,231) | (921,954) |
| 8.8% |
| (1,913,522) |
Operating Income | 199,838 | 200,765 |
| 0.5% |
| 416,689 |
| 186,459 | 153,972 |
| (17.4%) |
| 319,571 |
|
|
|
|
|
|
|
|
|
|
|
|
|
|
Operating Income by Businesses | Eliminations and Others |
| Consolidated | ||||||||||
Million Ch$ |
| Chg% |
| Th. US$ |
| Million Ch$ |
| Chg% |
| Th. US$ | |||
1Q 2010 | 1Q 2011 |
|
|
| 1Q 2011 |
| 1Q 2010 | 1Q 2011 |
|
|
| 1Q 2011 | |
Operating Revenues | (136,805) | (139,403) |
| 1.9% |
| (289,333) |
| 1,480,326 | 1,575,569 |
| 6.4% |
| 3,270,105 |
Operating Costs | 135,770 | 135,381 |
| (0.3%) |
| 280,984 |
| (1,095,064) | (1,224,854) |
| 11.9% |
| (2,542,194) |
Operating Income | (1,035) | (4,023) |
| 288.7% |
| (8,350) |
| 385,262 | 350,715 |
| (9.0%) |
| 727,911 |
Generation and Transmission Businesses reached an Operating Income of Ch$ 200,765 million, representing a Ch$ 927 million rise from the same period last year or the equivalent to 0.5% increase. Physical sales increased 3.8% amounting to 15,672 GWh as of March 2011 (15,095 GWh for the same period in 2011).
Operating income for Generation and Transmission business line, detailed by country in the following table:
Table 3 |
|
|
|
|
|
|
|
|
|
|
|
|
|
|
|
|
|
|
|
|
Generation & Transmission | Chile |
| Argentina |
| Brazil | |||||||||||||||
Million Ch$ |
| Chg% |
| Th. US$ |
| Million Ch$ |
| Chg% |
| Th. US$ |
| Million Ch$ |
| Chg% |
| Th. US$ | ||||
1Q 2010 | 1Q 2011 |
|
|
| 1Q 2011 |
| 1Q 2010 | 1Q 2011 |
|
|
| 1Q 2011 |
| 1Q 2010 | 1Q 2011 |
|
|
| 1Q 2011 | |
Operating Revenues | 283,400 | 322,519 |
| 13.8% |
| 669,390 |
| 62,614 | 69,460 |
| 10.9% |
| 144,165 |
| 59,453 | 72,320 |
| 21.6% |
| 150,101 |
% of consolidated | 49% | 50% |
|
|
| 50% |
| 11% | 11% |
|
|
| 11% |
| 10% | 11% |
|
|
| 11% |
Operating Costs | (188,684) | (227,787) |
| 20.7% |
| (472,774) |
| (46,417) | (58,305) |
| 25.6% |
| (121,013) |
| (34,367) | (28,650) |
| (16.6%) |
| (59,462) |
% of consolidated | 49% | 52% |
|
|
| 52% |
| 12% | 13% |
|
|
| 13% |
| 9% | 7% |
|
|
| 7% |
|
|
|
|
|
|
|
|
|
|
|
|
|
|
|
|
|
|
|
|
|
Operating Income | 94,716 | 94,732 |
| 0.0% |
| 196,616 |
| 16,197 | 11,155 |
| (31.1%) |
| 23,152 |
| 25,087 | 43,671 |
| 74.1% |
| 90,639 |
|
|
|
|
|
|
|
|
|
|
|
|
|
|
|
|
|
|
|
|
|
Generation & Transmission | Peru |
| Colombia |
| Consolidated | |||||||||||||||
Million Ch$ |
| Chg% |
| Th. US$ |
| Million Ch$ |
| Chg% |
| Th. US$ |
| Million Ch$ |
| Chg% |
| Th. US$ | ||||
1Q 2010 | 1Q 2011 |
|
|
| 1Q 2011 |
| 1Q 2010 | 1Q 2011 |
|
|
| 1Q 2011 |
| 1Q 2010 | 1Q 2011 |
|
|
| 1Q 2011 | |
Operating Revenues | 54,935 | 59,474 |
| 8.3% |
| 123,439 |
| 123,263 | 115,384 |
| (6.4%) |
| 239,480 |
| 583,442 | 639,046 |
| 9.5% |
| 1,326,345 |
% of consolidated | 9% | 9% |
|
|
| 9% |
| 21% | 18% |
|
|
| 18% |
| 100% | 100% |
|
|
|
|
Operating Costs | (35,222) | (36,180) |
| 2.7% |
| (75,091) |
| (79,137) | (87,470) |
| 10.5% |
| (181,545) |
| (383,604) | (438,281) |
| 14.3% |
| (909,656) |
% of consolidated | 9% | 8% |
|
|
| 8% |
| 21% | 20% |
|
|
| 20% |
| 100% | 100% |
|
|
|
|
|
|
|
|
|
|
|
|
|
|
|
|
|
|
|
|
|
|
|
|
|
Operating Income | 19,713 | 23,295 |
| 18.2% |
| 48,348 |
| 44,126 | 27,913 |
| (36.7%) |
| 57,934 |
| 199,838 | 200,765 |
| 0.5% |
| 416,689 |
Distribution businessdecreased its Operating Income by Ch$ 32,487 million, equivalent to 17.4% and totaling Ch$ 153,972 million. Physical sales amounted to 17,270 GWh, representing an increase of 621 GWh, equivalent to a 3.7% variation. Our customer base increased by 372,000 approximately, amounting to 13.4 million customers.
Operating Income for Distribution business line, detailed by country, as follows:
Table 4 |
|
|
|
|
|
|
|
|
|
|
|
|
|
|
|
|
|
|
|
|
Distribution | Chile |
| Argentina |
| Brazil | |||||||||||||||
Million Ch$ |
| Chg% |
| Th. US$ |
| Million Ch$ |
| Chg% |
| Th. US$ |
| Million Ch$ |
| Chg% |
| Th. US$ | ||||
1Q 2010 | 1Q 2011 |
|
|
| 1Q 2011 |
| 1Q 2010 | 1Q 2011 |
|
|
| 1Q 2011 |
| 1Q 2010 | 1Q 2011 |
|
|
| 1Q 2011 | |
Operating Revenues | 212,465 | 245,131 |
| 15.4% |
| 508,770 |
| 76,217 | 71,992 |
| (5.5%) |
| 149,421 |
| 482,585 | 491,132 |
| 1.8% |
| 1,019,348 |
% of consolidated | 36% | 38% |
|
|
| 38% |
| 13% | 11% |
|
|
| 11% |
| 83% | 77% |
|
|
| 77% |
Operating Costs | (189,138) | (215,052) |
| 13.7% |
| (446,342) |
| (69,388) | (73,163) |
| 5.4% |
| (151,851) |
| (382,104) | (404,028) |
| 5.7% |
| (838,563) |
% of consolidated | 49% | 49% |
|
|
| 49% |
| 18% | 17% |
|
|
| 17% |
| 100% | 92% |
|
|
| 92% |
|
|
|
|
|
|
|
|
|
|
|
|
|
|
|
|
|
|
|
|
|
Operating Income | 23,327 | 30,079 |
| 28.9% |
| 62,428 |
| 6,829 | (1,171) |
| (117.1%) |
| (2,430) |
| 100,481 | 87,104 |
| (13.3%) |
| 180,785 |
|
|
|
|
|
|
|
|
|
|
|
|
|
|
|
|
|
|
|
|
|
Distribution | Peru |
| Colombia |
| Consolidated | |||||||||||||||
Million Ch$ |
| Chg% |
| Th. US$ |
| Million Ch$ |
| Chg% |
| Th. US$ |
| Million Ch$ |
| Chg% |
| Th. US$ | ||||
1Q 2010 | 1Q 2011 |
|
|
| 1Q 2011 |
| 1Q 2010 | 1Q 2011 |
|
|
| 1Q 2011 |
| 1Q 2010 | 1Q 2011 |
|
|
| 1Q 2011 | |
Operating Revenues | 75,731 | 79,676 |
| 5.2% |
| 165,368 |
| 186,692 | 187,995 |
| 0.7% |
| 390,185 |
| 1,033,690 | 1,075,926 |
| 4.1% |
| 2,233,092 |
% of consolidated | 13% | 12% |
|
|
| 12% |
| 32% | 29% |
|
|
| 29% |
| 177% | 184% |
|
|
|
|
Operating Costs | (59,425) | (62,985) |
| 6.0% |
| (130,726) |
| (147,175) | (166,726) |
| 13.3% |
| (346,040) |
| (847,231) | (921,954) |
| 8.8% |
| (1,913,522) |
% of consolidated | 15% | 14% |
|
|
| 14% |
| 38% | 38% |
|
|
| 38% |
| 221% | 240% |
|
|
|
|
|
|
|
|
|
|
|
|
|
|
|
|
|
|
|
|
|
|
|
|
|
Operating Income | 16,306 | 16,691 |
| 2.4% |
| 34,642 |
| 39,517 | 21,270 |
| (46.2%) |
| 44,145 |
| 186,459 | 153,972 |
| (17.4%) |
| 319,571 |
Pg. 15
| | PRESS RELEASE 1Q 2011 |
Net Financial Income
The Company’s Net Financial Income as of March 31, 2011 was negative Ch$ 69,391 million, representing an improvement of 16.4% over the same period last year. The latter is mainly explained by: (i) higher Financial Income by Ch$ 16.926 million equivalent to Ch$ 13,644 million, as a consequence of an increase in the amount of financial incomes due to the Brazilian pension plan by Ch$ 11,267 million and higher cash deposits during the period, (ii) lower expenses related to Foreign Currency Exchange Differences by Ch$ 10,616 million, primarily linked to Chile, Argentina and Brazil.
The latter was partially offset by: (i) higher Financial Expenses by Ch$ 11,321 million, due to an increase of average interest rates during this period and an update of pension funds (ii)higher costs related to indexed liabilities by Ch$ 2,577 million, linked to the negative effect of inflation over U.F. denominated debt in Chile. U.F., a non-transaction currency linked to the inflation in Chile, increased its value by 0.6%
Taxes
Income Tax increase by Ch$ 3,312 million at the end of March 2011. The latter is mostly explained by decreases in: Ampla by Ch$ 6,459 million, Coelce by Ch$ 5,150 million, Endesa Chile by Ch$ 4,816 million, Edesur by Ch$ 2,941 million and Pangue by Ch$1,465 million. The latter was partially offset by increases in Cien by Ch$ 5,843 million, Emgesa by Ch$ 2,582 million, Pehuenche by Ch$ 2,380 million Codensa by Ch$ 1,218 million, Edegel by Ch$ 1,162 million and Chilectra by Ch$ 720 million.
Pg. 16
| | PRESS RELEASE 1Q 2011 |
consolidated balance sheet analysis
Assets Under IFRS
Table 5 |
|
|
|
|
|
|
ASSETS | (Million Ch$) |
| (Thousand US$) | |||
| As of Dec 31, 2010 | As of March. 31, 2011 | Var 2010-2011 | Chg % | As of March. 31, 2011 | |
|
|
|
|
|
| |
CURRENT ASSETS |
|
|
|
|
|
|
Cash and cash equivalents | 961,355 | 997,180 | 35,825 | 3.7% |
| 2,079,798 |
Other current financial assets | 7,818 | 8,807 | 989 | 12.7% |
| 18,368 |
Other current non-financial assets | 35,993 | 23,659 | (12,334) | (34.3%) |
| 49,346 |
Trade and other current receivables | 1,038,098 | 1,040,112 | 2,014 | 0.2% |
| 2,169,340 |
Accounts receivable from related companies | 20,472 | 21,304 | 832 | 4.1% |
| 44,433 |
Inventories | 62,652 | 65,150 | 2,498 | 4.0% |
| 135,882 |
Current tax assets | 137,987 | 159,097 | 21,109 | 15.3% |
| 331,825 |
Non-current assets (or disposal groups) classified as held for sale | 73,893 | - | (73,893) | (100.0%) |
| - |
Total Current Assets | 2,338,268 | 2,315,308 | (22,960) | (1.0%) |
| 4,828,991 |
|
|
|
|
|
|
|
|
|
|
|
|
|
|
Other non-current financial assets | 62,969 | 60,908 | (2,061) | (3.3%) |
| 127,034 |
Other non-current non-financial assets | 103,736 | 115,738 | 12,002 | 11.6% |
| 241,393 |
Trade accounts receivables and other receivables, net | 319,568 | 366,416 | 46,848 | 14.7% |
| 764,226 |
Investment accounted for using equity method | 14,102 | 16,703 | 2,602 | 18.4% |
| 34,838 |
Intangible assets other than goodwill | 1,452,586 | 1,542,215 | 89,629 | 6.2% |
| 3,216,567 |
Goodwill | 1,477,022 | 1,504,511 | 27,489 | 1.9% |
| 3,137,928 |
Property, plant and equipment, net | 6,751,941 | 6,950,473 | 198,533 | 2.9% |
| 14,496,461 |
Investment properties | 33,019 | 33,338 | 319 | 1.0% |
| 69,533 |
Deferred tax assets | 452,634 | 452,871 | 236 | 0.1% |
| 944,543 |
Total Non-Current Assets | 10,667,577 | 11,043,173 | 375,596 | 3.5% |
| 23,032,523 |
|
|
|
|
|
|
|
TOTAL ASSETS | 13,005,845 | 13,358,482 | 352,637 | 2.7% |
| 27,861,514 |
Total Assets increased Ch$ 352,637 million, mainly due to:
Ø Ch$ 375,596 million increase in Non-Current Assets, equal to a 3.5%, as a result of:
v Ch$ 198,533 increase in Property, Plant and Equipment, explained by the conversion effect to Chilean pesos from subsidiaries’ financial statements by Ch$ 171,436 million, and additions for the period in approximately Ch$ 112,682 million. The latter was partially offset explained by the depreciation for the period by Ch$ 79,903 million.
v Ch$ 89,629 million increase in Intangible Assets other than Goodwill, due exchange rates variations.
v Ch$ 46,848 million increase in Trade Accounts Receivables and Other Receivables, mainly due to the increase in Ampla and Coelce, by the appliance of IFRIC 12 interpretation, regarding Service Conversion Arrangements.
v Ch$ 27,489 million increase in Goodwill linked to fluctuation of local currency against Chilean peso.
v Ch$ 12,002 million increase in Other Non-Current Financial Assets, mainly explained by an increase of liens in Ampla and Coelce.
The above was partially offset by:
Ø Decrease in Current Assets by Ch$ 22,960 million, which equals to a 1.0% decrease, mainly due to:
v Ch$ 73,893 million decrease in Non-Current Assets Classified as Held for Sell, related to the selling process of the former subsidiariesCAM andSynapsis, executed during this quarter.
Pg. 17
| | PRESS RELEASE 1Q 2011 |
v Ch$ 12,334 million decrease in Other Current Financial Assets, due to lower liens delivered by Ampla.
v Ch$ 35,825 million increase in Cash and Cash Equivalent, primarily explained by increases in Time Deposits at Emgesa by Ch$ 68,952 million; Chilectra by Ch$ 46,119 million due to increases inrepos(repurchase agreements); Cachoeira Dourada by Ch$ 26,382 million and Fortaleza by Ch$ 14,532, and Edegel by Ch$ 10,535 million all explained by an increase in Time Deposits. The effects explained above were partially offset by the Ch$ 40,479 million decrease at Endesa Chile; Ch$ 40,479 million decrease in Endesa Brazil linked to a payment made to IFC. Other decreases affected: Ch$ 16,870 million reduction at Codensa; Ch$ 16,870 million decrease at Enersis; Edelnor by Ch$ 10,189 million; CIEN by Ch$ 8,685 million; Ampla by Ch$ 5,809 million and Coelce by Ch$ 3,565 million.
v Ch$ 21,109 million increase in Current Tax Assets, mostly explained by higher tax payments on account of Endesa Chile by Ch$ 27,954 million which was partially offset by a decrease in fiscal credit related to San Isidro by Ch$ 8,040 million.
Pg. 18
| | PRESS RELEASE 1Q 2011 |
Book Value and Economic Value of Assets
Regarding the more important assets, the following should be mentioned:
Properties, Plants and Equipment are valued at their purchase cost, net of the corresponding accumulated depreciation and impairment loss they have been subject to. Properties, Plants and Equipment, net of their residual value, if applicable, are linearly by distributing the cost of their different elements along the estimated years of useful life, which is the period that the companies expect to use them. The useful life is reviewed regularly.
The capital gain (lower investments or goodwill value) generated by consolidation represents the acquisition cost surplus on the Group’s share in terms of the reasonable value of assets and liabilities, including the identifiable contingent liabilities of a Subsidiary at the time of acquisition.
Capital gain is not amortized. Instead, at the closing of each accounting period an assessment is made of whether any impairment has occurred during the period that could reduce its recoverable value to an amount below the registered net cost, proceeding in this event to make a timely impairment adjustment (See Note 3.e to the Consolidated Financial Statements).
Throughout the fiscal year and in particular at the date of closing, an assessment is made as to any indication of possible loss due to the impairment of any asset. In the event of any such indication, an estimate of the recoverable sum of said asset is made to determine, if applicable, the depreciated amount. If this involves identifiable assets that do not originate independent cash flows, the recoverability of the Cash Generating Unit that the asset belongs to is estimated, understanding as such the smaller Group of identifiable assets that generate independent cash incomes.
Assets expressed in foreign currency are submitted at the prevalent exchange rate at the closing of the period.
Notes and accounts receivable from related companies are classified according to their short and long term maturities. These operations are adjusted according to prevalent market equity conditions.
In summary, assets are valued according to the International Financial Reporting Standards, whose criteria are expressed in Note 3 of the Consolidated Financial Statements.
Pg. 19
| | PRESS RELEASE 1Q 2011 |
Liabilities and Shareholders’ Equity Under IFRS
Table 6 |
|
|
|
|
|
|
LIABILITIES AND SHAREHOLDERS' EQUITY | (Million Ch$) |
| (Thousand US$) | |||
| As of Dec 31, 2010 | As of March. 31, 2011 | Var 2010-2011 | Chg % | As of March. 31, 2011 | |
|
|
|
|
|
|
|
CURRENT LIABILITIES |
|
|
|
|
|
|
Other current financial liabilities | 665,598 | 596,181 | (69,417) | (10.4%) |
| 1,243,443 |
Trade and other current payables | 1,224,490 | 1,099,287 | (125,203) | (10.2%) |
| 2,292,761 |
Accounts payable to related companies | 148,202 | 148,865 | 663 | 0.4% |
| 310,485 |
Other short-term provisions | 115,449 | 99,529 | (15,920) | (13.8%) |
| 207,585 |
Current tax liabilities | 147,667 | 172,734 | 25,067 | 17.0% |
| 360,267 |
Current provisions for employee benefits | 5,450 | 2,889 | (2,562) | (47.0%) |
| 6,025 |
Other current non-financial liabilities | 35,791 | 43,627 | 7,837 | 21.9% |
| 90,992 |
Liabilities (or disposal groups) classified as held for sale | 64,630 | - | (64,630) | (100.0%) |
| - |
Total Current Liabilities | 2,407,277 | 2,163,112 | (244,165) | (10.1%) |
| 4,511,560 |
|
|
|
|
|
|
|
NON-CURRENT LIABILITIES |
|
|
|
|
|
|
Other non-current financial liabilities | 3,014,956 | 3,284,480 | 269,524 | 8.9% |
| 6,850,374 |
Non-current payables | 37,237 | 23,062 | (14,175) | (38.1%) |
| 48,100 |
Accounts payable to related companies | 1,084 | 1,115 | 31 | 2.8% |
| 2,326 |
Other-long term provisions | 225,522 | 235,490 | 9,967 | 4.4% |
| 491,156 |
Deferred tax liabilities | 555,924 | 569,198 | 13,274 | 2.4% |
| 1,187,165 |
Non-current provisions for employee benefits | 215,819 | 226,623 | 10,804 | 5.0% |
| 472,663 |
Other non-current non-financial liabilities | 33,997 | 87,001 | 53,004 | 155.9% |
| 181,456 |
Total Non-Current Liabilities | 4,084,540 | 4,426,969 | 342,429 | 8.4% |
| 9,233,240 |
|
|
|
|
|
|
|
SHAREHOLDERS' EQUITY |
|
|
|
|
|
|
Issued capital | 2,824,883 | 2,824,883 | - | 0.0% |
| 5,891,801 |
Retained earnings (losses) | 2,103,690 | 2,153,470 | 49,780 | 2.4% |
| 4,491,448 |
Share premium | 158,760 | 158,760 | - | 0.0% |
| 331,122 |
Other equity changes | - | - | - |
|
| - |
Reserves | (1,351,787) | (1,253,025) | 98,762 | 7.3% |
| (2,613,409) |
|
|
| - |
|
|
|
Equity Attributable to Shareholders of the Company | 3,735,545 | 3,884,087 | 148,543 | 4.0% |
| 8,100,962 |
Equity Attributable to Minority Interest | 2,778,483 | 2,884,313 | 105,829 | 3.8% |
| 6,015,753 |
Total Shareholders' Equity | 6,514,028 | 6,768,400 | 254,372 | 3.9% |
| 14,116,715 |
|
|
|
|
|
|
|
TOTAL LIABILITIES AND SHAREHOLDERS' EQUITY | 13,005,845 | 13,358,482 | 352,637 | 2.7% |
| 27,861,514 |
The Company’s Total Liabilities and Shareholders’ Equity increased by Ch$ 352,637 million, on the period ended on December 31, 2010, due to Ch$ 342,429 million increase in Non-Current Liabilities and the Ch$ 254,372 million increase in Shareholders’ Equity. The latter was partially compensated by the Ch$ 244,165 million decrease of Current Liabilities. The detail is explained as follows:
Ø Non-Current Liabilities increased by Ch$ 342,429 million, equal to a raise of 8.4%, mainly due to:
v Other Non-Current Financial Liabilities (financial debt and derivatives) increased by Ch$ 269,524 million, mainly explained by increases in: Emgesa by Ch$ 207,136 due to the issuance of a bond in the American market; Endesa Chile by Ch$ 17,954 million due to foreign currency exchange differences; Edegel by Ch$ 10,913 million due to a loan denominated in US dollars; Codensa by Ch$ 6,432 million, Edelnor by Ch$ 4,291 million and Edesur by Ch$ 3,856 million due to foreign currency exchange differences and,partially offset by decreases in Enersis by Ch$ 5,356 million due to the effects of hedge derivatives.
v Other Non-Current Non-Financial Liabilities increased by Ch$ 53,004 million, mainly due to the recognition of a tax applied on equity at Emgesa and Codensa by Ch$ 31,205 million and Ch$ 20,971 million, respectively.
Ø Current Liabilities decreased by Ch$ 244,165 million, equaling a 10.1% drop, due to:
v Ch$ 125,203 million decrease in Trade and Other Current Payables, corresponding to decreases in: Ampla by Ch$ 54,775 million; Codensa by Ch$ 53,276 million; Emgesa by Ch$ 34,286 million; Endesa Chile by Ch$ 13,018 million; San Isidro by Ch$ 11,166 million and Enersis by Ch$ 10,457 million. All the above was partially offset by increases in: Edesur by Ch$ 18,777 million; Coelce by Ch$ 15,906 million; Pehuenche by Ch$ 8,546 million and Chilectra by Ch$ 4,203 million.
Pg. 20
| | PRESS RELEASE 1Q 2011 |
v Ch$ 69,417 million decrease in Other Current Financial Liabilities (debt and derivatives), mainly explained by decreases in: Endesa Brazil by Ch$ 51,906 million, linked to a payment made to IFC; Codensa by Ch$ 40,093 million due to bond amortizations, Edegel by Ch$ 12,980 million and Edelnor by Ch$ 7,585 million, both related to bank loan payments. The latter was compensated by an increase in bank loans in Ampla by Ch$ 29,989 million, Coelce by Ch$ 7,495 million. CIEN increased by Ch$ 6,405 million due to accrued interests and Emgesa by Ch$ 2,390 million, due to the effect on local bonds.
v Ch$ 64,630 million decrease in Liabilities (or disposal groups) Classified as Held for Sale, related to the selling process of CAM and Synapsis, executed during the first quarter of 2011.
v Ch$ 15,920 million decrease in Other Short-Term Provisions, due to lesser provisions related to personnel benefits in: Endesa Chile by Ch$ 5,559 million; Enersis by Ch$ 2,584 million and Edelnor by Ch$ 725 million.
v Ch$ 25,067 million increase in Current Tax Liabilities, mainly explained by increases in: Codensa by Ch$ 12,479 million; Emgesa by Ch$ 11,886 million; Edesur by Ch$ 3,850 million; Coelce by Ch$ 3,761 million and San Isidro by Ch$ 2,686 million. The latter was partially offset by decreases in CIEN by Ch$ 7,473 million and CGTF by Ch$ 3,305 million.
Total Shareholders’ Equity increased by Ch$ 254,372 million when compared to December 31, 2010. The Total Shareholders' Equity Attributable to the Owners of the Company increased by Ch$ 148,543 million which is mainly explained by the effect of the net income for the period for Ch$ 174,061 million, where it is important to highlight the effect of controlling shareholder’s result by Ch$ 95,851 million. Additionally, the Equity increased by: positive conversion reserves by Ch$ 88,850 million; negative hedging reserves by Ch$ 7,492 million and other positive reserves by Ch$ 17,405 million. The provisory dividend related to the exercise 2010 reachedCh$ 28,755 million
The Minority Shareholders’ participation increased by Ch$ 105,829 million, as a consequence of: the net effects in results by Ch$ 85,489 million; other results by Ch$ 99,514 million and other equity changes by Ch$ 79,174 million.
Pg. 21
| | PRESS RELEASE 1Q 2011 |
Table 7 |
|
|
|
|
|
|
|
|
(Thousand US$) | 2011 | 2012 | 2013 | 2014 | 2015 | 2016 | Balance | TOTAL |
Chile | 28,716.7 | 88,073.0 | 426,279.4 | 796,549.1 | 175,073.7 | 447,287.8 | 1,175,036.3 | 3,137,015.9 |
Enersis | 4,430.2 | 4,685.0 | 4,954.3 | 574,701.8 | 5,540.5 | 429,688.5 | 39,651.0 | 1,063,651.2 |
Chilectra | 473.8 | - | - | - | - | - | - | 473.8 |
Endesa Chile (*) | 23,812.7 | 83,388.0 | 421,325.0 | 221,847.3 | 169,533.2 | 17,599.3 | 1,135,385.4 | 2,072,890.9 |
Argentina | 130,246.5 | 96,115.6 | 68,301.4 | 45,967.3 | 30,418.8 | - | - | 371,049.6 |
Edesur | 24,122.7 | 22,918.4 | 23,960.0 | 1,998.3 | - | - | - | 72,999.3 |
Costanera | 82,342.1 | 41,828.7 | 24,740.0 | 27,960.0 | 27,341.9 | - | - | 204,212.7 |
Chocón | 23,506.7 | 31,368.5 | 19,601.5 | 16,009.0 | 3,076.9 | - | - | 93,562.6 |
Hidroinvest | 275.0 | - | - | - | - | - | - | 275.0 |
CTM | - | - | - | - | - | - | - | - |
TESA | - | - | - | - | - | - | - | - |
Peru | 59,585.4 | 122,292.0 | 142,137.1 | 102,814.4 | 81,772.0 | 87,710.8 | 167,441.4 | 763,753.0 |
Edelnor | 15,612.8 | 62,464.4 | 91,864.3 | 53,248.4 | 48,053.4 | 30,347.3 | 39,180.8 | 340,771.4 |
Edegel | 43,972.6 | 59,827.6 | 50,272.8 | 49,565.9 | 33,718.5 | 57,363.5 | 128,260.6 | 422,981.6 |
Brazil | 553,619.0 | 591,247.8 | 230,010.6 | 150,228.2 | 51,883.5 | 13,740.5 | 34,667.6 | 1,625,397.2 |
Endesa Brasil | - | - | - | - | - | - | - | - |
Coelce | 134,758.6 | 134,458.5 | 110,176.3 | 103,277.2 | 5,023.1 | 4,855.7 | 19,844.6 | 512,394.1 |
Ampla | 279,377.8 | 318,908.2 | 106,124.0 | 32,247.0 | 31,090.6 | 1,216.3 | 2,649.7 | 771,613.5 |
Cachoeira | - | - | - | - | - | - | - | - |
Cien | 127,562.8 | 125,097.4 | - | - | - | - | - | 252,660.2 |
Fortaleza | 11,919.7 | 12,783.7 | 13,710.3 | 14,704.0 | 15,769.9 | 7,668.5 | 12,173.4 | 88,729.4 |
Colombia | 165,240.8 | 180,554.4 | 128,461.4 | 208,768.4 | 133,258.7 | 77,290.1 | 1,013,619.0 | 1,907,192.8 |
Codensa | - | 17,973.9 | 128,461.4 | 133,258.7 | - | 77,290.1 | 251,325.9 | 608,310.0 |
Emgesa | 165,240.8 | 162,580.5 | - | 75,509.7 | 133,258.7 | - | 762,293.1 | 1,298,882.8 |
TOTAL | 937,408.4 | 1,078,282.7 | 995,189.8 | 1,304,327.3 | 472,406.6 | 626,029.2 | 2,390,764.4 | 7,804,408.5 |
Debt Maturity with Third Parties, Million Ch$
Table 7.1 |
|
|
|
|
|
|
|
|
(Million Ch$) | 2011 | 2012 | 2013 | 2014 | 2015 | 2016 | Balance | TOTAL |
Chile | 13,768.5 | 42,227.5 | 204,383.9 | 381,913.4 | 83,940.8 | 214,456.6 | 563,382.9 | 1,504,073.6 |
Enersis | 2,124.1 | 2,246.2 | 2,375.4 | 275,546.5 | 2,656.4 | 206,018.4 | 19,011.1 | 509,978.2 |
Chilectra | 227.2 | - | - | - | - | - | - | 227.2 |
Endesa Chile (*) | 11,417.2 | 39,981.2 | 202,008.5 | 106,366.9 | 81,284.4 | 8,438.2 | 544,371.9 | 993,868.3 |
Argentina | 62,448.0 | 46,083.6 | 32,747.8 | 22,039.5 | 14,584.6 | - | - | 177,903.4 |
Edesur | 11,565.9 | 10,988.4 | 11,487.8 | 958.1 | - | - | - | 35,000.2 |
Costanera | 39,479.8 | 20,055.2 | 11,861.8 | 13,405.7 | 13,109.3 | - | - | 97,911.8 |
Chocón | 11,270.5 | 15,039.9 | 9,398.1 | 7,675.7 | 1,475.3 | - | - | 44,859.5 |
Hidroinvest | 131.9 | - | - | - | - | - | - | 131.9 |
CTM | - | - | - | - | - | - | - | - |
TESA | - | - | - | - | - | - | - | - |
Peru | 28,568.8 | 58,634.1 | 68,149.0 | 49,295.4 | 39,206.4 | 42,053.8 | 80,281.5 | 366,189.0 |
Edelnor | 7,485.7 | 29,949.2 | 44,045.2 | 25,530.5 | 23,039.7 | 14,550.3 | 18,785.6 | 163,386.2 |
Edegel | 21,083.1 | 28,684.9 | 24,103.8 | 23,764.9 | 16,166.7 | 27,503.5 | 61,495.8 | 202,802.8 |
Brazil | 265,438.1 | 283,479.7 | 110,280.9 | 72,028.4 | 24,876.1 | 6,588.0 | 16,621.7 | 779,313.0 |
Endesa Brasil | - | - | - | - | - | - | - | - |
Coelce | 64,611.4 | 64,467.5 | 52,825.1 | 49,517.3 | 2,408.4 | 2,328.1 | 9,514.7 | 245,672.5 |
Ampla | 133,950.5 | 152,903.7 | 50,882.2 | 15,461.1 | 14,906.7 | 583.2 | 1,270.4 | 369,957.8 |
Cachoeira | - | - | - | - | - | - | - | - |
Cien | 61,161.3 | 59,979.2 | - | - | - | - | - | 121,140.5 |
Fortaleza | 5,715.0 | 6,129.3 | 6,573.5 | 7,050.0 | 7,561.0 | 3,676.7 | 5,836.6 | 42,542.2 |
Colombia | 79,226.4 | 86,568.6 | 61,592.1 | 100,096.1 | 63,892.2 | 37,057.5 | 485,989.8 | 914,422.7 |
Codensa | - | 8,617.8 | 61,592.1 | 63,892.2 | - | 37,057.5 | 120,500.7 | 291,660.3 |
Emgesa | 79,226.4 | 77,950.8 | - | 36,203.9 | 63,892.2 | - | 365,489.1 | 622,762.3 |
TOTAL | 449,450 | 516,993.4 | 477,153.7 | 625,372.8 | 226,500.1 | 300,156.0 | 1,146,275.9 | 3,741,901.7 |
Pg. 22
| | PRESS RELEASE 1Q 2011 |
Table 8 |
|
|
|
|
|
Indicator | Unit | As of Dec 31, 2010 | As of March. 31, 2011 | Var 2010-2011 | Chg % |
Liquidity | Times | 0.97 | 1.07 | 0.10 | 10.3% |
Acid ratio test * | Times | 0.94 | 1.04 | 0.10 | 10.6% |
Working capital | Million Ch$ | (69,010) | 152,196 | 221,205 | 320.5% |
Working capital | Thousand US$ | (143,932) | 317,432 | 461,363 | 320.5% |
Leverage ** | Times | 1.00 | 0.97 | (0.03) | (3.0%) |
Short-term debt | % | 37.0 | 33.0 | (4.00) | (10.8%) |
Long-term debt | % | 63.0 | 67.0 | 4.00 | 6.3% |
* (Current assets net of inventories and prepaid expenses) / Current liabilities | |||||
** Total debt / (equity + minority interest) | |||||
Table 8.1 |
|
|
|
|
|
Indicator | Unit | 1Q 2010 | 1Q 2011 | Var 2010-2011 | Chg % |
Financial expenses coverage * | Times | 4.80 | 3.94 | (0.87) | (18.0%) |
Op. income / Op. rev. | % | 26.03 | 22.26 | (3.77) | (14.5%) |
ROE ** | % | 18.10 | 13.07 | (5.04) | (27.8%) |
ROA ** | % | 9.14 | 8.01 | (1.14) | (12.4%) |
* EBITDA / Financial costs |
|
|
|
|
|
** Annualized figures |
|
|
|
|
|
Liquidity, a key consideration in our financial management, continues to be in a very solid position. As of March 2011, liquidity reached 1.07 times, increasing 0.10 times, equivalent to a 10.3% when compared to December 2010. Enersis has a sound financial profile and ample access to credit markets. In fact, the Company has been serving its debt maturities with own generated resources, with an appropriate maturity schedule.
The Company has credit lines with financial institutions, as described below:
Ø Cash and cash equivalents amount to US$ 2,080 million in the aggregate for Enersis Consolidated.
Ø Committed long term credit lines for US$ 975 million in the aggregate for Enersis Consolidated, of which US$ 268 million are due on the short term.
Ø Non-committed credit lines for US$ 1,866 million available in the aggregate for Enersis Consolidated.
Leverage ratio, as of March 31, 2011, reached 0.97, showing a decrease of 3.0% as of December 2010.
Financial Expenses Coverage reached 3.9 times, a decrease of 0.87 times or 18.0% drop from the ratio registered on equal period the precedent year. This is mainly the result of the EBITDA decrease during this period, and the increase in Financial Expenses.
Operating Income over Operating Revenues profitability decreased 14.5%, reaching a 22.3% as of March 2011.
The annual ROE of the Parent Company reached 13.1%, a decrease of 27.8% from the registered as of March 2010. This decrease is derived from the lower results for the period, together with an increase in shareholders’ equity.
Annual ROA reached 8.0% in March 2011, a decrease of 12.4% from the registered as of March 2010, reflecting the decrease in the present period’s results partially offset by a decrease in Total Assets.
Pg. 23
| | PRESS RELEASE 1Q 2011 |
Under IFRS
Table 9 | ||||||
CASH FLOW | (Million Ch$) |
| (Thousand US$) | |||
| 1Q 2010 | 1Q 2011 | Var 2010-2011 | Chg % | 1Q 2011 | |
|
|
|
|
|
|
|
Net Income | 206,782 | 181,340 | (25,442) | (12.3%) | 376,373 | |
Adjustments to reconcile net income | ||||||
Income tax expense | 96,750 | 93,438 | (3,312) | (3.4%) | 193,931 | |
Decrease (increse) in inventories | 24,429 | (2,011) | (26,440) | (108.2%) | (4,174) | |
Decrease (increase) in trade accounts receivable | 13,743 | 45,576 | 31,834 | 231.6% | 94,594 | |
Decrease (increase) in other operating accounts receivable | (24,022) | (40,948) | (16,926) | (70.5%) | (84,989) | |
Decrease (increase) in trade accounts payable | (89,433) | (129,621) | (40,189) | (44.9%) | (269,030) | |
Decrease (increase) in other operating accounts payable | 98,024 | 111,922 | 13,898 | 14.2% | 232,295 | |
Depreciation and amortization expense | 120,376 | 105,646 | (14,729) | (12.2%) | 219,270 | |
(Reversal of) Impairment losses | 8,426 | (22,001) | (30,427) | (361.1%) | (45,663) | |
Provisions | 7,981 | (5,767) | (13,748) | (172.3%) | (11,969) | |
Unrealized foreign currency exchange differences | 9,033 | (1,583) | (10,616) | (117.5%) | (3,285) | |
Non-distributed gains from associates | (703) | (2,379) | (1,676) | (238.6%) | (4,938) | |
Minority interest | - | - | - | - | ||
Other non-cash | (60,485) | (60,706) | (221) | (0.4%) | (125,995) | |
Total adjustments to Reconcile to Operating Income | 204,119 | 91,567 | (112,552) | (55.1%) | 190,047 | |
Dividends paid | - | - | - | - | ||
Dividends received | - | - | - | - | ||
Payments of interest classified as operating | - | - | - | - | ||
Proceeds of interest received classified as operating | - | - | - | - | ||
Income taxes refund (paid) | (33,038) | (2,818) | 30,220 | 91.5% | (5,850) | |
Other inflows (outflows) of cash | (79) | (149) | (70) | (88.5%) | (310) | |
NET CASH FLOWS PROVIDED BY OPERATING ACTIVITIES | 377,783 | 269,939 | (107,844) | (28.5%) |
| 560,260 |
|
|
|
|
|
|
|
Net Cash Flows provided by (used in) Investing Activities |
|
|
|
|
|
|
Cash flows from loss of control of subsidiaries or other businesses. | - | 15,367 | 15,367 |
|
| 31,894 |
Acquisitions of associates | - | - | - |
|
| - |
Cash flows used for the purchase of non-controlling | - | - | - |
|
|
|
Loans to related companies | - | - | - |
|
| - |
Proceeds from sales of property, plant and equipment | 471 | 494 | 23 | 4.9% |
| 1,025 |
Purchase of intangible assets | (79,947) | (109,666) | (29,719) | (37.2%) |
| (227,613) |
Proceeds from sales of intangible assets | 983 | 923 | (60) | (6.1%) |
| 1,916 |
Acquisitions of intangible assets | (38,194) | (49,682) | (11,488) | (30.1%) |
| (103,115) |
Proceeds from other long term assets. | - | - | - |
|
| - |
Purchase of other long-term assets | - | - | - |
|
| - |
Proceeds from prepayments reimbursed and third party loans | - | - | - |
|
| - |
Prepayments and third party loans | (735) | (1,246) | (512) | (69.6%) |
| (2,587) |
Dividends received | - | - | - |
|
| - |
Interest received | 93 | 1,640 | 1,548 | 1672.4% |
| 3,404 |
Other inflows (outflows) of cash | 654 | (1,776) | (2,430) | (371.7%) |
| (3,687) |
NET CASH FLOWS FROM (USED IN) FINANCING ACTIVITIES | (116,676) | (143,947) | (27,271) | (23.4%) |
| (298,762) |
|
|
|
|
|
|
|
Cash Flows provided by (used in) Financing Activities |
|
|
|
|
|
|
Proceeds from long-term borrowings | 86,500 | 284,354 | 197,855 | 228.7% |
| 590,180 |
Repayments of borrowings | - | - | - |
|
| - |
Payments of loans | (322,294) | (204,835) | 117,460 | 36.4% |
| (425,136) |
Payments of finance lease liabilities | (1,675) | (2,840) | (1,165) | (69.5%) |
| (5,894) |
Repayment of loans to related companies | - | - | - |
|
| - |
Dividends paid | (117,251) | (173,252) | (56,001) | (47.8%) |
| (359,585) |
Interest paid | (76,488) | (61,479) | 15,010 | 19.6% |
| (127,600) |
Other financing proceeds (payments) | - | - | - |
|
| - |
NET CASH FLOWS PROVIDED BY (USED IN) FINANCING ACTIVITIES | (431,209) | (158,051) | 273,158 | 63.3% |
| (328,036) |
|
|
|
|
|
|
|
NET INCREASE (DECREASE) IN CASH AND CASH EQUIVALENTS BEFORE EFFECTS OF EXCHANGE RATE | (170,102) | (32,059) | 138,043 | 81.2% |
| (66,538) |
|
|
|
|
|
|
|
Effect of exchange rate changes on cash and cash equivalents | 57,364 | 67,884 | 10,520 | 18.3% |
| 140,893 |
Net Increase (Decrease) in Cash and Cash Equivalents | (112,738) | 35,825 | 148,563 | 131.8% | 74,355 | |
Cash and cash equivalents at end of period | 1,134,901 | 961,355 | (173,546) | (15.3%) |
| 1,995,299 |
Ending Balance of Cash and Cash Equivalents | 1,022,163 | 997,180 | (24,983) | (2.4%) |
| 2,069,654 |
Pg. 24
| | PRESS RELEASE 1Q 2011 |
The Company generated a negative cash flow of Ch$ 32,059 million for the period, which can be detailed as follows:
Operating Activities generated a positive net cash flow of Ch$ 269,939 million that represents a decrease of 28.5% when compared to previous exercise. This cash flow is composed primarily with net income of the period for Ch$ 181,340 million, which is adjusted to operating income in Ch$ 91,566 million. This adjustment includes asset amortization, depreciation and impairments for Ch$ 83,645 million, taxes for Ch$ 93,438 million, partially compensated by a decrease in Accounts Payable by Ch$ 129,621 million.
Investment activities generated a net negative cash flow of Ch$ 143,947 million, which compared with the same period of the preceding year represented a lower cash equivalent by Ch$ 27,271 million, or 23.4%. This cash flow corresponds primarily to the incorporation of Property, Plant and Equipment by Ch$ 109,666 million, intangible assets’ purchases (IFRIC 12) by Ch$ 49,682 million and other investments by Ch$ 1,776 million.
Financing activities originated a negative cash flow of Ch$ 158,051 million, due to loans payments for Ch$ 204,835 million, dividends paid for Ch$ 173,252 million and interests paid for Ch$ 61,478 million. The aforementioned was partially compensated for loans obtained for Ch$ 284,354 million.
Cash Flow Received From Foreign Subsidiaries by Enersis, Chilectra and Endesa Chile
Table 10 |
|
|
|
|
|
|
|
|
|
|
Cash Flow | Interest Received | Dividends Received | Capital Reductions | Others | Total Cash Received | |||||
(Thousand US$) | ||||||||||
| 1Q 2010 | 1Q 2011 | 1Q 2010 | 1Q 2011 | 1Q 2010 | 1Q 2011 | 1Q 2010 | 1Q 2011 | 1Q 2010 | 1Q 2011 |
Argentina | 105.1 | 101.8 | - | - | - | - | - | - | 105.1 | 101.8 |
Peru | - | - | - | - | - | - | - | - | - | - |
Brazil | - | - | - | - | - | - | - | - | - | - |
Colombia | - | - | 56,413.3 | - | - | - | - | - | 56,413.3 | - |
Others | - | 1,218.8 | - | - | - | - | - | - | - | 1,218.8 |
Total | 105.1 | 1,320.5 | 56,413.3 | - | - | - | - | - | 56,518.4 | 1,320.5 |
Source: Internal Financial Report
Table 11 |
|
|
|
|
|
|
|
|
|
| Payments for Additions of Fixed Assets |
| Depreciation | ||||||
|
|
|
|
|
|
|
|
|
|
| Million Ch$ |
| Thousand US$ |
| Million Ch$ |
| Thousand US$ | ||
| 1Q 2010 | 1Q 2011 |
| 1Q 2011 |
| 1Q 2010 | 1Q 2011 |
| 1Q 2011 |
Endesa Chile | 50,361 | 73,146 |
| 151,815 |
| 48,886 | 41,757 |
| 86,667 |
Cachoeira | - | - |
| - |
| 1,791 | 1,847 |
| 3,833 |
Endesa Fortaleza | - | - |
| - |
| 1,977 | 2,017 |
| 4,186 |
Cien | - | - |
| - |
| 9,072 | 5,923 |
| 12,293 |
Chilectra S.A. | 8,937 | 10,531 |
| 21,857 |
| 5,266 | 5,284 |
| 10,967 |
Edesur | 8,061 | 11,990 |
| 24,885 |
| 3,590 | 3,201 |
| 6,644 |
Edelnor | 3,813 | 5,126 |
| 10,639 |
| 4,975 | 4,876 |
| 10,120 |
Ampla (*) | 26,275 | 29,694 |
| 61,630 |
| 13,966 | 12,187 |
| 25,294 |
Coelce (*) | 11,550 | 16,348 |
| 33,930 |
| 11,804 | 10,932 |
| 22,689 |
Codensa | 7,268 | 8,002 |
| 16,608 |
| 14,393 | 14,514 |
| 30,124 |
Cam Ltda. | 332 | 46 |
| 95 |
| 436 | 294 |
| 610 |
Inmobiliaria Manso de Velasco Ltda. | 346 | 226 |
| 469 |
| 71 | 68 |
| 141 |
Synapsis | 703 | 488 |
| 1,013 |
| 675 | 478 |
| 992 |
Enersis holding and investment companies | 126 | 334 |
| 693 |
| 267 | 281 |
| 583 |
Total | 117,772 | 155,931 |
| 323,636 |
| 117,169 | 103,659 |
| 215,145 |
(*) Includes concessions intangible assets. |
|
|
|
|
|
|
|
|
|
Pg. 25
| | PRESS RELEASE 1Q 2011 |
Commercial and Regulatory Risk
The Group’s activities are subject to a broad range of governmental standards and environmental regulations. Any modification of such standards and regulations may affect the Group’s activities, economic situation and operating results.
The Group’s distribution activity is subject to a wide range of rules regarding tariffs and other issues that govern their activities in each of the countries where it operates and which could modify distribution subsidiaries operating results.
The Group’s generation activity is subject to existing hydrological and weather conditions in the geographic zones in which the Group’s hydroelectric generating plants are located. Commercial policies have been planned in order to moderate the possible impact of changes in these variables.
Group’s activities are subject a wide of environmental regulation that Enersis fulfills constantly. Modifications applied on such regulations may affect the operations, economic condition or the results of these operations.
Enersis and its operating subsidiaries are subject to environmental regulations which, among other things, require the company to conduct environmental impact studies for future projects, obtaining permits, licenses and other authorizations and the fulfillment of all requirements of those licenses, permits and norms. As any other regulated company, Enersis cannot guarantee:
· The approval from regulators of environmental impact studies.
· That public opposition may not cause delays or modifications to any proposed project and
· That laws or regulations may not change or be interpreted in a manner that could adversely affect the operations or the plans for companies in which Enersis or its subsidiaries hold investments.
Interest Rate Risk
Interest rate variations modify the fair value of those assets and liabilities that accrue a fixed interest rate, as well as the future flows of assets and liabilities pegged to a variable interest rate.
In compliance with our current interest rate hedging policy, the portion of fixed and/or hedged debt to the total net debt was 54% as of March 31, 2011 on a consolidated basis.
Depending on the Group’s estimates and debt structure objectives, hedging transactions take place contracting derivatives that mitigate these risks.
Exchange Rate Risk
The exchange rate risks are mainly related to the following transactions:
- Foreign currency debts contracted by Group’s companies.
- Payments to be made on international markets for the acquisition of projects related materials.
- Group companies’ incomes directly linked to the evolution of the dollar, and
- Incoming cash flows from our subsidiaries abroad exposed to exchange rate fluctuations.
Pg. 26
| | PRESS RELEASE 1Q 2011 |
Commodities Risk
Enersis is exposed to the price fluctuation risk on some commodities, basically through fuel purchases for the electricity generation and also energy transactions (buying and/or selling) in the local markets.
In order to reduce risks in extreme drought conditions, the company has designed a trading policy that defines sales commitment levels consistent with its generating plants’ firm energy in a dry year, including risk mitigation clauses in some unregulated clients’ contracts.
In view of the operative conditions faced by the electricity generation market in Chile, like extreme drought and rising oil prices, the company has decided to take a hedge to place a cap on the Brent price for consumption projected for the period April-July 2011. Market and operative conditions will be constantly analyzed to adjust the volume hedged or take new hedges for the following months.
Liquidity Risk
In engaging committed long term credit facilities and short term financial investments the Group maintains a consistent liquidity policy, for the amounts required to support projected needs for the period, contingent with the situation and the expectations in the debt and capital markets.
As of March 31, 2011, the Enersis Group held liquidity in the amount of Ch$ 997,179,889 thousand in cash and cash equivalent and Ch$339,048,000thousand in committed long term credit lines. As of December 31st, 2010, the Enersis Group held liquidity in the amount of Ch$ 961,355,037 thousand in cash and cash equivalent and Ch$ 242,750,000 thousand in committed long term credit lines.
Credit Risk
Credit risk in accounts receivable, originating from trading activities, has been historically very limited given that the short term collection conditions with customers doesn’t allow them to individually accumulate significant amounts. Additionally, in the case of the so-called “unregulated clients” of our electricity generation and distribution business, a formal procedure is applied to control the credit risk, using a systematic evaluation of our counterparties, index definition and credit risk factors by virtue of which the contracts are approved or additional guarantee requirements are defined.
Furthermore, in our electricity generating business line, in the event of non-payment, some countries allow power supply cut-offs, and in almost all contracts a lack of payment is established as cause for contract termination. For this purpose, credit risks are constantly monitored and the maximum amounts exposed to payment risks are measured, which are limited.
In turn, in our electricity distribution business line, the energy supply cut-off is a power held by our companies in case of default by our customers, applied in accordance with the applicable regulation in each country, enabling the credit risk evaluation and control process, which is also limited.
Surplus cash flow investments are placed in prime national and foreign financial entities (with an investment grade equivalent risk rating) with limits set for each entity.
Pg. 27
| | PRESS RELEASE 1Q 2011 |
Positions are backed up by treasury bonds from the country of operations and instruments issued by the most reputable banks, favoring, wherever possible, the first ones.
Derivatives are engaged with highly solvent entities; about 90% of operations are conducted with entities that hold an A or higher rating.
Risk Measurement
The Enersis Group measures the Value at Risk (VaR) of its debt and financial derivatives positions in order to guarantee that the risk taken by the company remains consistent with the risk exposure defined by Management, thus restricting the volatility of its financial results.
The positions portfolio used in the calculations of the current Value at Risk is comprised of debt and financial derivatives.
The calculated Value at Risk represents the possible value loss of the aforementioned positions portfolio over one day time horizon with 95% of confidence.
The volatility of the risk variables that affect the value of the positions portfolio has been studied, including:
- The U.S. dollar Libor interest rate.
- The usual banking local indexes for debts, taking into account the different currencies our companies operate under, and
- The exchange rates of the different currencies involved in the calculation.
The calculation of VaR is based on generating possible future scenarios (at one day) of market values (both spot and term) for the risk variables, using Monte Carlo simulations. The number of scenarios generated ensures compliance with the simulation convergence criteria. A matrix of volatilities and correlations between the various risk variables calculated based on the historical values of the logarithmic price return, has been applied to simulate the future price scenario.
Once the price scenarios have been obtained, the fair value of the portfolio is calculated using such scenarios, obtaining a distribution of possible values at one day. The one-day 95% confidence VaR number is calculated as the 5% percentile of the potential increases in the fair value of the portfolio in one day.
The various debt positions and financial derivatives included in the calculation have been valued consistently using the financial capital calculation methodology reported to Management.
Other Risks
A portion of Enersis and Endesa Chile’s debt is subject to cross default provisions. If certain defaults in debt of certain specific subsidiaries are not remedied within specified grace periods, a cross default could affect Endesa Chile and Enersis, and under certain scenarios, debts at the holding company level could be accelerated.
Nonpayment – after any applicable grace period – of the debts of Enersis and Endesa Chile, or their so-called Relevant Subsidiaries, with an individual principal amount outstanding in excess of US$ 50 million dollars (or its equivalent in other currencies), and with a missed payment also in excess of US$ 50 million dollars, could give rise to a cross default of several bank revolving debt facilities at the Endesa
Pg. 28
| | PRESS RELEASE 1Q 2011 |
Similarly, nonpayment – after any given applicable grace period - of the debts of these companies or any of their Chilean subsidiaries, in single indebtedness in default with a principal in excess of US$ 30 million dollars, could potentially give rise to a cross default of Enersis and Endesa Chile Yankee bonds.
There are no clauses in the credit agreements by which changes in the corporate or debt classification of these companies from risk classification agencies could trigger prepayments. Nevertheless, a modification in the Standard & Poor’s (S&P) debt risk classification in foreign currency could trigger a change in the margin applicable to determine the interest rate, in the credit loans executed in 2004 and 2006, and in local credit lines executed in 2009.
Pg. 29
| | PRESS RELEASE 1Q 2011 |

Generation
Endesa Costanera
The Operating Income reached Ch$ 6,097 million during the first quarter 2011, increasing by 7.4% when compared to the same period in 2010. This is mainly explained by Ch$ 13,622 million of larger revenues related to energy sales, which were partially compensated by an increase of Ch$ 11,720 million in fuel costs. It is important to highlight that Operating Revenues increased by 25.3%, supported by a 17.2% rise in physical sales and an 11.5% increase on the average sale price, measured in local currency.
The effect of converting the financial statements from the Argentine peso to the Chilean peso in both periods produces a reduction in Chilean pesos of 9.8% as of March 2011, with respect to March 2010.
Table 12 |
|
|
|
|
|
|
Endesa Costanera | Million Ch$ |
|
| Thousand US$ | ||
| 1Q 2010 | 1Q 2011 | Var 2010-2011 | Chg% |
| 1Q 2011 |
Operating Revenues | 46,317 | 58,055 | 11,737 | 25.3% |
| 120,493 |
Procurement and Services | (32,898) | (44,908) | (12,010) | (36.5%) |
| (93,207) |
Contribution Margin | 13,419 | 13,147 | (272) | (2.0%) |
| 27,286 |
Other Costs | (3,731) | (4,074) | (343) | (9.2%) |
| (8,456) |
Gross Operating Income (EBITDA) | 9,688 | 9,073 | (615) | (6.4%) |
| 18,830 |
Depreciation and Amortization | (4,011) | (2,976) | 1,035 | 25.8% |
| (6,177) |
Operating Income | 5,677 | 6,097 | 419 | 7.4% |
| 12,653 |
Figures may differ from those accounted under Argentine GAAP. |
|
|
|
|
| |
Table 12.1 |
|
|
|
| ||
Endesa Costanera | 1Q 2010 | 1Q 2011 | Var 2010-2011 | Chg% | ||
GWh Produced | 1,919 | 2,301 | 383 | 19.9% | ||
GWh Sold | 1,968 | 2,306 | 338 | 17.2% | ||
Market Share | 7.0% | 7.9% | 0.9 pp. |
|
El Chocón
Operating Income reached Ch$ 5,362 million, decreasing 42.6% when compared to first quarter 2010. The latter is mainly explained by lower Operating Revenues for Ch$ 3,442 million, related to a decrease in physical sales by 24.6%. This is linked to poorer hydrological conditions, leading to a generation of energy 34.7% lower when compared to first quarter 2010. Additionally, during the period El Chocón experienced higher costs related to energy purchases and tolls.
The effect of converting the financial statements from the Argentine peso to the Chilean peso in both periods produces a reduction in Chilean pesos of 9.8% as of March 2011, with respect to March 2010.
Pg. 30
| | PRESS RELEASE 1Q 2011 |
Table 13 |
|
|
|
|
|
|
El Chocón | Million Ch$ |
|
| Thousand US$ | ||
| 1Q 2010 | 1Q 2011 | Var 2010-2011 | Chg% |
| 1Q 2011 |
Operating Revenues | 14,843 | 11,401 | (3,442) | (23.2%) |
| 23,663 |
Procurement and Services | (3,626) | (4,247) | (622) | (17.2%) |
| (8,816) |
Contribution Margin | 11,218 | 7,154 | (4,064) | (36.2%) |
| 14,848 |
Other Costs | (1,077) | (1,070) | 7 | 0.6% |
| (2,221) |
Gross Operating Income (EBITDA) | 10,141 | 6,084 | (4,057) | (40.0%) |
| 12,626 |
Depreciation and Amortization | (792) | (722) | 70 | 8.8% |
| (1,498) |
Operating Income | 9,349 | 5,362 | (3,987) | (42.6%) |
| 11,128 |
Figures may differ from those accounted under Argentine GAAP. |
|
|
|
|
| |
Table 13.1 |
|
|
|
| ||
El Chocón | 1Q 2010 | 1Q 2011 | Var 2010-2011 | Chg% | ||
GWh Produced | 819 | 535 | (284) | (34.7%) | ||
GWh Sold | 895 | 675 | (220) | (24.6%) | ||
Market Share | 3.2% | 2.3% | (0.9) pp. |
|
Distribution
Edesur
Operating Income decreased Ch$ 8,000 million, mainly due to a lower purchase/sales margin measured in Argentinean pesos, which was partially offset by a 0.7% increase in physical sales.
On the other hand, operational costs increased due to higher personnel wages, linked to the inflation that the country is experiencing.
Energy losses remained at 10.5%, the same level when compared to 2010. The customer base increased by 40,000 new clients, surpassing the 2.3 million clients served in the concession area.
The effect of converting the financial statements from the Argentine peso to the Chilean peso in both periods produces a reduction in Chilean pesos of 9.8% as of March 2011, with respect to March 2010.
Table 14 |
|
|
|
|
|
|
Edesur | Million Ch$ |
|
| Thousand US$ | ||
| 1Q 2010 | 1Q 2011 | Var 2010-2011 | Chg% |
| 1Q 2011 |
Operating Revenues | 76,217 | 71,992 | (4,225) | (5.5%) |
| 149,421 |
Procurement and Services | (37,163) | (36,765) | 398 | 1.1% |
| (76,306) |
Contribution Margin | 39,054 | 35,227 | (3,827) | (9.8%) |
| 73,114 |
Other Costs | (28,225) | (32,710) | (4,485) | (15.9%) |
| (67,889) |
Gross Operating Income (EBITDA) | 10,829 | 2,518 | (8,311) | (76.8%) |
| 5,225 |
Depreciation and Amortization | (4,000) | (3,689) | 311 | 7.8% |
| (7,656) |
Operating Income | 6,829 | (1,171) | (8,000) | (117.1%) |
| (2,430) |
Figures may differ from those accounted under Argentine GAAP. |
|
|
|
|
| |
Table 14.1 |
|
|
|
| ||
Edesur | 1Q 2010 | 1Q 2011 | Var 2010-2011 | Chg% | ||
Customers (Th) | 2,316 | 2,356 | 40 | 1.7% | ||
GWh Sold | 4,313 | 4,345 | 32 | 0.7% | ||
Clients/ Employee | 877 | 863 | (14) | (1.6%) | ||
Energy Losses (%) | 10.5% | 10.5% | 0.0% |
|
Pg. 31
BRAZIL |
|

Endesa Brasil
The Operating Income in Brazil amounted to Ch$ 128,172 million, 2.1% higher than the Ch$ 125,590 million reported as of March 31, 2010.
Table 15 |
|
|
|
|
|
|
Endesa Brasil | (Million Ch$) |
|
| (Thousand US$) | ||
| 1Q 2010 | 1Q 2011 | Var 2010-2011 | Chg % |
| 1Q 2011 |
Total Revenues | 508,624 | 522,064 | 13,440 | 2.6% |
| 1,083,548 |
Procurements and Services | (275,031) | (321,460) | (46,429) | (16.9%) |
| (667,192) |
Contribution Margin | 233,593 | 200,605 | (32,989) | (14.1%) |
| 416,356 |
Other Costs | (62,494) | (63,482) | (989) | (1.6%) |
| (131,758) |
Gross Operating Income (EBITDA) | 171,100 | 137,122 | (33,978) | (19.9%) |
| 284,598 |
Depreciation and Amortization | (45,510) | (8,950) | 36,560 | 80.3% |
| (18,576) |
Operating Income | 125,590 | 128,172 | 2,582 | 2.1% |
| 266,023 |
Net Financial Income | (22,713) | (19,114) | 3,598 | 15.8% |
| (39,672) |
Financial income | 13,230 | 28,374 | 15,145 | 114.5% |
| 58,891 |
Financial expenses | (32,597) | (48,132) | (15,534) | (47.7%) |
| (99,898) |
Income (Loss) for indexed assets and liabilities | - | - | - |
|
| - |
Foreign currency exchange differences, net | (3,345) | 643 | 3,988 | 119.2% |
| 1,335 |
Gains | 9,898 | 3,796 | (6,102) | (61.7%) |
| 7,878 |
Losses | (13,243) | (3,153) | 10,090 | 76.2% |
| (6,543) |
Net Income from Related Comp. Cons. by the Prop. Eq.Method | - | - | - |
|
| - |
Net Income from Other Investments | - | - | - |
|
| - |
Net Income from Sales of Assets | 1 | - | (1) | (100.0%) |
| - |
Net Income before Taxes | 102,878 | 109,058 | 6,180 | 6.0% |
| 226,350 |
Income Tax | (22,561) | (17,314) | 5,247 | 23.3% |
| (35,936) |
NET INCOME | 80,317 | 91,744 | 11,426 | 14.2% |
| 190,414 |
Net Income Attributable to Owners of the Company | 49,275 | 61,588 | 12,313 | 25.0% |
| 127,827 |
Net Income Attributable to Minority Interest | 31,042 | 30,155 | (887) | (2.9%) |
| 62,587 |
Generation
Cachoeira
The Operating Income rose by Ch$ 5,457 million, from Ch$14,495 million as of March, 2010 to Ch$ 19,952 million during the current year. The latter is the outcome of a 25% increase on average prices measured in local currency, fully offsetting a 2.7% decrease in physical sales.
The effect of converting the financial statements from the Brazilian real to the Chilean peso in both periods produces an increase in Chilean pesos of 0.5% as of March 2011, with respect to March 2010.
Table 16 |
|
|
|
|
|
|
Cachoeira | Million Ch$ |
|
| Thousand US$ | ||
| 1Q 2010 | 1Q 2011 | Var 2010-2011 | Chg% |
| 1Q 2011 |
Operating Revenues | 24,372 | 29,733 | 5,362 | 22.0% |
| 61,712 |
Procurement and Services | (6,599) | (6,325) | 274 | 4.2% |
| (13,128) |
Contribution Margin | 17,773 | 23,408 | 5,636 | 31.7% |
| 48,584 |
Other Costs | (1,487) | (1,605) | (118) | (7.9%) |
| (3,331) |
Gross Operating Income (EBITDA) | 16,286 | 21,804 | 5,518 | 33.9% |
| 45,253 |
Depreciation and Amortization | (1,791) | (1,852) | (61) | (3.4%) |
| (3,844) |
Operating Income | 14,495 | 19,952 | 5,457 | 37.6% |
| 41,410 |
Figures may differ from those accounted under Brazilian GAAP. |
|
|
|
|
| |
Table 16.1 |
|
|
|
| ||
Cachoeira | 1Q 2010 | 1Q 2011 | Var 2010-2011 | Chg% | ||
GWh Produced | 847 | 557 | (290) | (34.3%) | ||
GWh Sold | 858 | 835 | (23) | (2.7%) | ||
Market Share | 0.8% | 0.8% | (0.0) pp. |
|
Pg. 32
| | PRESS RELEASE 1Q 2011 |
Fortaleza (cgtf)
The Operating Income decreased by Ch$ 6,941 million, reaching Ch$ 10,772 when compared to the same period of 2010. This increase is mainly due to higher costs linked to energy purchases by Ch$ 14,547 million. The latter was partially offset by higher Operating Revenues.
The effect of converting the financial statements from the Brazilian real to the Chilean peso in both periods produces an increase in Chilean pesos of 0.5% as of March 2011, with respect to March 2010.
Table 17 |
|
|
|
|
|
|
Fortaleza | Million Ch$ |
|
| Thousand US$ | ||
| 1Q 2010 | 1Q 2011 | Var 2010-2011 | Chg% |
| 1Q 2011 |
Operating Revenues | 35,051 | 42,587 | 7,536 | 21.5% |
| 88,390 |
Procurement and Services | (13,241) | (28,101) | (14,860) | (112.2%) |
| (58,323) |
Contribution Margin | 21,810 | 14,486 | (7,324) | (33.6%) |
| 30,066 |
Other Costs | (2,120) | (1,691) | 429 | 20.3% |
| (3,509) |
Gross Operating Income (EBITDA) | 19,690 | 12,795 | (6,895) | (35.0%) |
| 26,557 |
Depreciation and Amortization | (1,977) | (2,023) | (46) | (2.3%) |
| (4,199) |
Operating Income | 17,713 | 10,772 | (6,941) | (39.2%) |
| 22,358 |
Figures may differ from those accounted under Brazilian GAAP. |
|
|
|
|
| |
Table 17.1 |
|
|
|
| ||
Fortaleza | 1Q 2010 | 1Q 2011 | Var 2010-2011 | Chg% | ||
GWh Produced | 104 | 0 | (104) | (100.0%) | ||
GWh Sold | 663 | 663 | 0 | 0.0% | ||
Market Share | 0.7% | 0.6% | (0.0) pp. |
|
Transmission
CIEN
CIEN recorded an Operating Income of Ch$ 13,963 million, which represents an increase of Ch$ 19,913 million compared to March 31, 2010. The EBITDA decreased mainly due to lower sales during the period.
The effect of converting the financial statements from the Brazilian real to the Chilean peso in both periods produces an increase in Chilean pesos of 0.5% as of March 2011, with respect to March 2010.
Table 18 |
|
|
|
|
|
|
Cien | Million Ch$ |
|
| Thousand US$ | ||
| 1Q 2010 | 1Q 2011 | Var 2010-2011 | Chg% |
| 1Q 2011 |
Operating Revenues | 1,495 | 1,324 | (172) | (11.5%) |
| 2,747 |
Procurement and Services | 3,732 | (759) | (4,490) | (120.3%) |
| (1,575) |
Contribution Margin | 5,227 | 565 | (4,662) | (89.2%) |
| 1,172 |
Other Costs | (2,100) | (1,484) | 615 | 29.3% |
| (3,081) |
Gross Operating Income (EBITDA) | 3,127 | (920) | (4,047) | (129.4%) |
| (1,909) |
Depreciation and Amortization | (9,077) | 14,882 | 23,960 | 264.0% |
| 30,889 |
Operating Income | (5,950) | 13,963 | 19,913 | 334.7% |
| 28,980 |
Figures may differ from those accounted under Brazilian GAAP. |
|
|
|
|
| |
Pg. 33
| | PRESS RELEASE 1Q 2011 |
Distribution
Ampla
Operating Income amounted to Ch$ 47,868 million, a 20.4% decrease when compared to first quarter 2010. The decrease is mostly explained by a lower purchase/sales margin and higher operating costs, especially related to external services.
The above was partially offset by a 4.6% increase in sales volume. It is worth mentioning the 1.2p decrease in energy losses during the period, which is the outcome of the application in full force of advanced and technology-based solutions for controlling non-technical losses.
Energy losses reached 20.2%. The customer base increased by 58,000 new clients, surpassing the 2.5 million clients served in the concession area.
The effect of converting the financial statements from the Brazilian real to the Chilean peso in both periods produces an increase in Chilean pesos of 0.5% as of March 2011, with respect to March 2010.
Table 19 |
|
|
|
|
|
|
Ampla | Million Ch$ |
|
| Thousand US$ | ||
| 1Q 2010 | 1Q 2011 | Var 2010-2011 | Chg% |
| 1Q 2011 |
Operating Revenues | 280,380 | 280,380 | (0) | (0.0%) |
| 581,930 |
Procurement and Services | (168,092) | (191,134) | (23,042) | (13.7%) |
| (396,700) |
Contribution Margin | 112,287 | 89,245 | (23,042) | (20.5%) |
| 185,229 |
Other Costs | (31,329) | (32,601) | (1,272) | (4.1%) |
| (67,663) |
Gross Operating Income (EBITDA) | 80,958 | 56,645 | (24,313) | (30.0%) |
| 117,566 |
Depreciation and Amortization | (20,800) | (8,776) | 12,024 | 57.8% |
| (18,215) |
Operating Income | 60,158 | 47,868 | (12,289) | (20.4%) |
| 99,351 |
Figures may differ from those accounted under Brazilian GAAP. |
|
|
|
|
| |
Table 19.1 |
|
|
|
| ||
Ampla | 1Q 2010 | 1Q 2011 | Var 2010-2011 | Chg% | ||
Customers (Th) | 2,529 | 2,587 | 58 | 2.3% | ||
GWh Sold | 2,621 | 2,741 | 120 | 4.6% | ||
Clients/Employee | 2,063 | 2,145 | 82 | 4.0% | ||
Energy Losses % | 21.3% | 20.2% | (1.2) pp. |
|
Pg. 34
| | PRESS RELEASE 1Q 2011 |
Coelce
Operating Income reached Ch$ 38,817 million, showing a decrease of 3.7% when compared to first quarter 2010. The result is explained by a lower purchase/sales margin by 2.6% and a 2.4% decrease in physical sales.
Energy losses reached 12.1%. The customer base increased by 130,000 new clients, surpassing the 3.1 million clients served in the concession area.
The effect of converting the financial statements from the Brazilian real to the Chilean peso in both periods produces an increase in Chilean pesos of 0.5% as of March 2011, with respect to March 2010.
Table 20 |
|
|
|
|
|
|
Coelce | Million Ch$ |
|
| Thousand US$ | ||
| 1Q 2010 | 1Q 2011 | Var 2010-2011 | Chg% |
| 1Q 2011 |
Operating Revenues | 202,205 | 209,570 | 7,365 | 3.6% |
| 434,964 |
Procurement and Services | (125,709) | (136,533) | (10,824) | (8.6%) |
| (283,376) |
Contribution Margin | 76,497 | 73,037 | (3,460) | (4.5%) |
| 151,588 |
Other Costs | (24,414) | (23,665) | 749 | 3.1% |
| (49,117) |
Gross Operating Income (EBITDA) | 52,082 | 49,372 | (2,710) | (5.2%) |
| 102,472 |
Depreciation and Amortization | (11,789) | (10,555) | 1,234 | 10.5% |
| (21,907) |
Operating Income | 40,293 | 38,817 | (1,477) | (3.7%) |
| 80,564 |
Figures may differ from those accounted under Brazilian GAAP. |
|
|
|
|
| |
Table 20.1 |
|
|
|
| ||
Coelce | 1Q 2010 | 1Q 2011 | Var 2010-2011 | Chg% | ||
Customers (Th) | 2,996 | 3,126 | 129 | 4.3% | ||
GWh Sold | 2,153 | 2,101 | (52) | (2.4%) | ||
Clients/Employee | 2,369 | 2,485 | 116 | 4.9% | ||
Energy Losses % | 11.7% | 12.1% | 0.4 pp. |
|
Pg. 35
| | PRESS RELEASE 1Q 2011 |
Chile |
|

Generation
Endesa Chile
Consolidated Income Statement of Endesa Chile
Table 21 |
|
|
|
|
|
|
Endesa Chile | (Million Ch$) |
|
| (Thousand US$) | ||
| 1Q 2010 | 1Q 2011 | Var 2010-2011 | Chg % |
| 1Q 2011 |
Total Revenues | 530,033 | 573,935 | 43,902 | 8.3% |
| 1,191,206 |
Procurements and Services | (261,841) | (285,284) | (23,443) | (9.0%) |
| (592,110) |
Contribution Margin | 268,191 | 288,651 | 20,459 | 7.6% |
| 599,096 |
Other Costs | (42,555) | (87,285) | (44,731) | (105.1%) |
| (181,161) |
Gross Operating Income (EBITDA) | 225,637 | 201,365 | (24,271) | (10.8%) |
| 417,935 |
Depreciation and Amortization | (50,236) | (42,765) | 7,471 | 14.9% |
| (88,760) |
Operating Income | 175,400 | 158,600 | (16,800) | (9.6%) |
| 329,175 |
Net Financial Income | (30,399) | (30,281) | 119 | 0.4% |
| (62,847) |
Financial income | 3,316 | 5,158 | 1,843 | 55.6% |
| 10,706 |
Financial expenses | (37,605) | (34,688) | 2,917 | 7.8% |
| (71,995) |
Income (Loss) for indexed assets and liabilities | (25) | (1,093) | (1,068) | (4208.6%) |
| (2,268) |
Foreign currency exchange differences, net | 3,915 | 342 | (3,573) | (91.3%) |
| 710 |
Gains | 6,797 | 6,529 | (268) | (3.9%) |
| 13,550 |
Losses | (2,881) | (6,187) | (3,305) | (114.7%) |
| (12,840) |
Net Income from Related Comp. Cons. by the Prop. Eq.Method | 20,649 | 27,281 | 6,632 | 32.1% |
| 56,622 |
Net Income from Other Investments | - | 52 | 52 |
|
| 108 |
Net Income from Sales of Assets | (7) | 39 | 47 | 648.6% |
| 82 |
Net Income before Taxes | 165,643 | 155,692 | (9,952) | (6.0%) |
| 323,139 |
Income Tax | (45,456) | (48,569) | (3,113) | (6.8%) |
| (100,806) |
NET INCOME | 120,187 | 107,122 | (13,065) | (10.9%) |
| 222,333 |
Net Income Attributable to Owners of the Company | 93,729 | 96,859 | 3,130 | 3.3% |
| 201,031 |
Net Income Attributable to Minority Interest | 26,458 | 10,263 | (16,195) | (61.2%) |
| 21,302 |
*Includes generation subsidiaries in Chile, Argentina, Colombia and Peru.
Chilean Operations
The Operating Income of our Chilean operations reached Ch$ 94,732 million, result that almost suffered no variations when compared to the same period of the previous year.
The Operating Revenues increased due to a 15% rise on average prices, partially offset by a decrease in physical sales. This effect is mostly explained by lower sales in the spot market, linked to the poorer hydrology persistent in the country. Despite of the latter, higher sales in the regulated and non-regulated markets were registered, mainly explained by the economic recovery of Chile. It is important to mention that regulated and non-regulated customers showed an important increase in consumption when compared to the first quarter 2010, period that was affected by an earthquake in February 2010.
Additionally, the Operating Income was also affected by an increase of 27.2% for Procurement and Services, due to higher energy purchases and transport costs.
Pg. 36
| | PRESS RELEASE 1Q 2011 |
Table 22 |
|
|
|
|
|
|
Chilean Electricity Business | Million Ch$ |
|
| Thousand US$ | ||
| 1Q 2010 | 1Q 2011 | Var 2010-2011 | Chg% |
| 1Q 2011 |
Operating Revenues | 283,400 | 322,519 | 39,119 | 13.8% |
| 669,390 |
Procurement and Services | (145,226) | (184,656) | (39,430) | (27.2%) |
| (383,254) |
Contribution Margin | 138,175 | 137,863 | (311) | (0.2%) |
| 286,136 |
Other Costs | (18,502) | (22,238) | (3,737) | (20.2%) |
| (46,156) |
Gross Operating Income (EBITDA) | 119,673 | 115,625 | (4,048) | (3.4%) |
| 239,980 |
Depreciation and Amortization | (24,957) | (20,893) | 4,064 | 16.3% |
| (43,364) |
Operating Income | 94,716 | 94,732 | 16 | 0.0% |
| 196,616 |
Table 22.1 |
|
|
|
| |
Chilean Electricity Business | 1Q 2010 | 1Q 2011 | Var 2010-2011 | Chg% | |
GWh Produced | 5,190 | 4,874 | (316) | (6.1%) | |
GWh Sold | 5,336 | 5,169 | (167) | (3.1%) | |
Market Share | 41.3% | 35.9% | (5.4) pp. |
|
Distribution
Chilectra
Operating Income amounted to Ch$ 30,079 million, showing an increase of 28.9% when compared to the period ended on March 31, 2010.
The increase is explained mainly due to better sales margin related to electricity business line, associated to a higher demand during the first quarter. Additionally, revenues from ancillary services also increased, explained by the lower comparison base when judged against 2010, especially regarding major clients and the effects post-earthquake.
The latter was partially offset by an increase in personnel wages.
Energy losses reached 5.7%. The customer base increased by 27,000 new clients, reaching 1.6 million clients served in the concession area.
Table 23 |
|
|
|
|
|
|
Chilectra | (Million Ch$) |
|
| (Thousand US$) | ||
| 1Q 2010 | 1Q 2011 | Var 2010-2011 | Chg % |
| 1Q 2011 |
Sales | 210,586 | 241,556 | 30,971 | 14.7% |
| 501,352 |
Other operating income | 1,879 | 3,574 | 1,695 | 90.2% |
| 7,419 |
Total Revenues | 212,465 | 245,131 | 32,666 | 15.4% |
| 508,770 |
Procurements and Services | (161,762) | (186,781) | (25,020) | (15.5%) |
| (387,666) |
Contribution Margin | 50,703 | 58,349 | 7,646 | 15.1% |
| 121,104 |
Other Costs | (20,435) | (21,105) | (671) | (3.3%) |
| (43,804) |
Gross Operating Income (EBITDA) | 30,268 | 37,244 | 6,975 | 23.0% |
| 77,300 |
Depreciation and Amortization | (6,942) | (7,165) | (223) | (3.2%) |
| (14,872) |
Operating Income | 23,327 | 30,079 | 6,752 | 28.9% |
| 62,428 |
Net Financial Income | (9) | 1,696 | 1,705 | 18069.2% |
| 3,520 |
Financial income | 2,044 | 3,554 | 1,510 | 73.8% |
| 7,376 |
Financial expenses | (2,332) | (1,877) | 455 | 19.5% |
| (3,896) |
Income (Loss) for indexed assets and liabilities | 190 | 263 | 73 | 38.5% |
| 545 |
Foreign currency exchange differences, net | 89 | (244) | (333) | (374.9%) |
| (506) |
Gains | 91 | 45 | (46) | (50.5%) |
| 94 |
Losses | (3) | (289) | (286) | (11132.0%) |
| (600) |
Net Income from Related Comp. Cons. by the Prop. Eq.Method | 20,726 | 15,456 | (5,271) | (25.4%) |
| 32,078 |
Net Income from Other Investments | - | - | - |
|
| - |
Net Income from Sales of Assets | - | 0 | 0 |
|
| 1 |
Net Income before Taxes | 44,043 | 47,230 | 3,187 | 7.2% |
| 98,027 |
Income Tax | (6,595) | (7,316) | (720) | (10.9%) |
| (15,184) |
NET INCOME | 37,448 | 39,915 | 2,467 | 6.6% |
| 82,843 |
Net Income Attributable to Owners of the Company | 36,785 | 39,914 | 3,129 | 8.5% |
| 82,843 |
Net Income Attributable to Minority Interest | 663 | 0 | (663) |
|
| 0 |
Table 23.1 |
|
|
|
| ||
Chilectra | 1Q 2010 | 1Q 2011 | Var 2010-2011 | Chg% | ||
Customers (Th) | 1,589 | 1,616 | 27 | 1.7% | ||
GWh Sold | 3,046 | 3,338 | 291 | 9.6% | ||
Clients/ Employee | 2,177 | 2,220 | 43 | 2.0% | ||
Energy Losses (%) | 6.1% | 5.7% | (0.4) pp. |
|
Pg. 37
| | PRESS RELEASE 1Q 2011 |
|
|

Generation
Emgesa
The Operating Income reached Ch$ 27,913 million, 36.7% lower when compared to first quarter 2010. The main factor in this result was the effect of the government reform on the Equity Tax, which resulted in registering as of January 1st 2011 the entire amount to be paid for this concept within the period 2011-2014. This one-time effect completely offset the better sales margins recorded during the period, as a consequence of better hydrological conditions and higher physical sales.
The effect of translating the financial statements from the Colombian peso to the Chilean peso in both periods produces an increase in Chilean pesos of 3.7% as of March 2011, with respect to March 2010.
Contribution Margin |
|
|
|
|
|
|
Emgesa | Million Ch$ |
|
| Thousand US$ | ||
| 1Q 2010 | 1Q 2011 | Var 2010-2011 | Chg% |
| 1Q 2011 |
Operating Revenues | 123,263 | 115,384 | (7,879) | (6.4%) |
| 239,480 |
Procurement and Services | (60,055) | (29,623) | 30,432 | 50.7% |
| (61,483) |
Contribution Margin | 63,208 | 85,761 | 22,553 | 35.7% |
| 177,997 |
Other Costs | (9,211) | (49,365) | (40,154) | (435.9%) |
| (102,458) |
Gross Operating Income (EBITDA) | 53,997 | 36,395 | (17,601) | (32.6%) |
| 75,538 |
Depreciation and Amortization | (9,871) | (8,482) | 1,389 | 14.1% |
| (17,604) |
Operating Income | 44,126 | 27,913 | (16,212) | (36.7%) |
| 57,934 |
Figures may differ from those accounted under Colombian GAAP. |
|
|
|
|
| |
Table 24.1 |
|
|
|
| ||
Emgesa | 1Q 2010 | 1Q 2011 | Var 2010-2011 | Chg% | ||
GWh Produced | 2,260 | 2,743 | 483 | 21.4% | ||
GWh Sold | 3,333 | 3,631 | 298 | 8.9% | ||
Market Share | 16.7% | 18.9% | 2.2 pp. |
|
Pg. 38
| | PRESS RELEASE 1Q 2011 |
Distribution
Codensa
Operating Income reached Ch$ 21,270 million, representing a decrease of 46.2% when compared to first quarter 2010. The latter is explained to the effect of the government reform on the Equity Tax, which resulted in registering as of January 1st 2011, the entire amount to be paid for this concept within the period 2011-2014. This one-time effect completely offset the better sales margins recorded during the period, resulting from higher physical sales and lower energy losses.
Energy losses reached 8.3%. The customer base increased by 76,000 new clients, surpassing the 2.5 million clients served in the concession area.
The effect of translating the financial statements from the Colombian peso to the Chilean peso in both periods produces an increase in Chilean pesos of 3.7% as of March 2011, with respect to March 2010.
Table 25 |
|
|
|
|
|
|
Codensa | Million Ch$ |
|
| Thousand US$ | ||
| 1Q 2010 | 1Q 2011 | Var 2010-2011 | Chg% |
| 1Q 2011 |
Operating Revenues | 186,692 | 187,995 | 1,304 | 0.7% |
| 390,185 |
Procurement and Services | (105,438) | (103,808) | 1,631 | 1.5% |
| (215,453) |
Contribution Margin | 81,253 | 84,188 | 2,934 | 3.6% |
| 174,732 |
Other Costs | (26,707) | (46,984) | (20,277) | (75.9%) |
| (97,515) |
Gross Operating Income (EBITDA) | 54,547 | 37,204 | (17,343) | (31.8%) |
| 77,217 |
Depreciation and Amortization | (15,030) | (15,934) | (904) | (6.0%) |
| (33,072) |
Operating Income | 39,517 | 21,270 | (18,247) | (46.2%) |
| 44,145 |
Figures may differ from those accounted under Colombian GAAP. |
|
|
|
|
| |
Table 25.1 |
|
|
|
| ||
Codensa | 1Q 2010 | 1Q 2011 | Var 2010-2011 | Chg% | ||
Customers (Th) | 2,488 | 2,564 | 76 | 3.1% | ||
GWh Sold | 3,000 | 3,113 | 113 | 3.8% | ||
Clients/ Employee | 2,437 | 2,355 | (82) | (3.4%) | ||
Energy Losses (%) | 8.6% | 8.3% | (0.3) pp. |
|
Pg. 39
| | PRESS RELEASE 1Q 2011 |
|
|

Generation
Edegel
Operating Income registered Ch$ 23,295 million, an increase of 18.2% with respect to the same period in 2010. The latter is mainly explained by a Ch$ 5,364 million increase in energy sales that relied on a 17.1% increase in physical sales. Another positive effect was the decrease in energy purchases that represented Ch $ 1,904 million lower expenses.
The above was partially offset by an increase in fuel costs, due to a higher generation of electricity based on thermal facilities and also to higher transportation costs.
The effect of translating the financial statements from the Peruvian sol to the Chilean peso in both periods produces a decrease in Chilean pesos of 4.7% as of March 2011, with respect to March 2010.
Table 26 |
|
|
|
|
|
|
Edegel | Million Ch$ |
|
| Thousand US$ | ||
| 1Q 2010 | 1Q 2011 | Var 2010-2011 | Chg% |
| 1Q 2011 |
Operating Revenues | 54,935 | 59,474 | 4,540 | 8.3% |
| 123,439 |
Procurement and Services | (20,036) | (21,831) | (1,795) | (9.0%) |
| (45,311) |
Contribution Margin | 34,899 | 37,643 | 2,744 | 7.9% |
| 78,128 |
Other Costs | (5,595) | (5,469) | 126 | 2.2% |
| (11,351) |
Gross Operating Income (EBITDA) | 29,304 | 32,174 | 2,870 | 9.8% |
| 66,777 |
Depreciation and Amortization | (9,591) | (8,879) | 712 | 7.4% |
| (18,429) |
Operating Income | 19,713 | 23,295 | 3,582 | 18.2% |
| 48,348 |
Figures may differ from those accounted under Peruvian GAAP. |
|
|
|
|
| |
Table 26.1 |
|
|
|
| ||
Edegel | 1Q 2010 | 1Q 2011 | Var 2010-2011 | Chg% | ||
GWh Produced | 1,987 | 2,338 | 351 | 17.7% | ||
GWh Sold | 2,042 | 2,391 | 350 | 17.1% | ||
Market Share | 28.3% | 30.7% | 2.3 pp. |
|
Pg. 40
| | PRESS RELEASE 1Q 2011 |
Distribution
Edelnor
Operating Income reached Ch$16,690 million, representing a 2.4% increase when compared to first quarter 2010. The aforementioned is explained by a 7.7% rose in sales volume, and the increase in revenues from ancillary services. The latter was partially offset by a lower purchase/sales margin by 1.4%.
Energy losses reached 8.3%. The customer base increased by 42,000 new clients, surpassing the 1.1 million clients served in the concession area.
The effect of translating the financial statements from the Peruvian sol to the Chilean peso in both periods produces a decrease in Chilean pesos of 4.7% as of March 2011, with respect to March 2010.
Table 27 |
|
|
|
|
|
|
Edelnor | Million Ch$ |
|
| Thousand US$ | ||
| 1Q 2010 | 1Q 2011 | Var 2010-2011 | Chg% |
| 1Q 2011 |
Operating Revenues | 75,731 | 79,676 | 3,945 | 5.2% |
| 165,368 |
Procurement and Services | (46,464) | (50,752) | (4,288) | (9.2%) |
| (105,336) |
Contribution Margin | 29,267 | 28,924 | (343) | (1.2%) |
| 60,033 |
Other Costs | (7,568) | (6,883) | 685 | 9.0% |
| (14,286) |
Gross Operating Income (EBITDA) | 21,699 | 22,041 | 342 | 1.6% |
| 45,747 |
Depreciation and Amortization | (5,396) | (5,351) | 45 | 0.8% |
| (11,106) |
Operating Income | 16,303 | 16,690 | 387 | 2.4% |
| 34,641 |
Figures may differ from those accounted under Peruvian GAAP. |
|
|
|
|
| |
Table 27.1 |
|
|
|
| ||
Edelnor | 1Q 2010 | 1Q 2011 | Var 2010-2011 | Chg% | ||
Customers (Th) | 1,068 | 1,109 | 42 | 3.9% | ||
GWh Sold | 1,516 | 1,632 | 116 | 7.7% | ||
Clients/ Employee | 1,923 | 2,002 | 79 | 4.1% | ||
Energy Losses (%) | 8.1% | 8.3% | 0.3 pp. |
|
Operating Income by Subsidiary
Summary of operating revenues, operating costs (including procurements, services and other costs) and operating income of all Enersis’ subsidiaries, for the twelve-months ended in March 31, 2010 and March 31, 2011, detailed as follows:
Table 28 | 1Q 2010 | 1Q 2011 | ||||
Million Ch$ | Operating Revenues | Operating Costs | Operating Income | Operating Revenues | Operating Costs | Operating Income |
Endesa Chile (*) | 530,033 | (354,632) | 175,401 | 573,935 | (415,335) | 158,600 |
Cachoeira (**) | 24,372 | (9,877) | 14,495 | 29,733 | (9,781) | 19,952 |
Fortaleza (***) | 35,051 | (17,338) | 17,713 | 42,587 | (31,815) | 10,772 |
Cien (**) | 1,495 | (7,445) | (5,950) | 1,324 | 12,639 | 13,963 |
Chilectra | 212,465 | (189,138) | 23,327 | 245,131 | (215,052) | 30,079 |
Edesur | 76,217 | (69,388) | 6,829 | 71,992 | (73,163) | (1,171) |
Distrilima (Edelnor) | 75,731 | (59,425) | 16,306 | 79,676 | (62,985) | 16,691 |
Ampla | 280,379 | (220,221) | 60,158 | 280,380 | (232,511) | 47,869 |
Investluz (Coelce) | 202,206 | (161,913) | 40,293 | 209,570 | (170,753) | 38,817 |
Codensa | 186,691 | (147,175) | 39,516 | 187,995 | (166,726) | 21,269 |
CAM Ltda. | 25,543 | (26,354) | (811) | 15,739 | (17,179) | (1,440) |
Inmobiliaria Manso de Velasco Ltda. | 2,031 | (1,281) | 750 | 1,050 | (1,190) | (140) |
Synapsis Soluciones y Servicios IT Ltda. | 16,408 | (14,777) | 1,631 | 6,693 | (6,556) | 137 |
ICT | - | - | - | 1,315 | (1,167) | 148 |
Enersis Holding and other investment vehicles | 2,850 | (6,978) | (4,128) | 8,067 | (12,054) | (3,987) |
Consolidation Adjustments | (191,146) | 190,878 | (268) | (179,618) | 178,774 | (844) |
Total Consolidation | 1,480,326 | (1,095,064) | 385,262 | 1,575,569 | (1,224,854) | 350,715 |
(*) Since January 1st, 2009, includes Gas Atacama, Transquillota e HydroAysén.
Pg. 41
| | PRESS RELEASE 1Q 2011 |
Table 28.1 | 1Q 2011 | ||
Thousand US$ | Operating Revenues | Operating Costs | Operating Income |
Endesa Chile (*) | 1,191,206 | (862,031) | 329,175 |
Cachoeira (**) | 61,711 | (20,301) | 41,411 |
Fortaleza (***) | 88,390 | (66,032) | 22,357 |
Cien (**) | 2,748 | 26,232 | 28,980 |
Chilectra | 508,771 | (446,342) | 62,429 |
Edesur | 149,420 | (151,850) | (2,430) |
Distrilima (Edelnor) | 165,368 | (130,726) | 34,642 |
Ampla | 581,931 | (482,578) | 99,352 |
Investluz (Coelce) | 434,964 | (354,399) | 80,565 |
Codensa | 390,185 | (346,041) | 44,144 |
CAM Ltda. | 32,666 | (35,655) | (2,989) |
Inmobiliaria Manso de Velasco Ltda. | 2,179 | (2,470) | (291) |
Synapsis Soluciones y Servicios IT Ltda. | 13,891 | (13,607) | 284 |
ICT | 2,729 | (2,422) | 307 |
Enersis Holding and other investment vehicles | 16,743 | (25,018) | (8,275) |
Consolidation Adjustments | (372,798) | 371,047 | (1,752) |
Total Consolidation | 3,270,104 | (2,542,193) | 727,911 |
Pg. 42
| | PRESS RELEASE 1Q 2011 |
Conference Call Invitation
Enersis is pleased to invite you to participate in aConference Call with the management to review the results for the period,on Thursday, April 28th , 2011, 10:00 A.M. Eastern Time (11:00 A.M. Chilean Time). There will be a question and answer session following management's comments. Representing Enersis will be Mr. Alfredo Ergas, Chief Financial Officer and the Investor Relations Team.
To participate, please dial +1 (617) 213-4870 or +1 (888) 713 42 18 (toll free USA), approximately 10 minutes prior to the scheduled start time, Passcode ID: 86431365
To access the phone replay, please dial +1 (617) 801-6888 or +1 (888) 286-8010 (toll free USA) Passcode ID: 34712958
For this Conference Call you can access previously to the pre-registration site at https://www.theconferencingservice.com/prereg/key.process?key=P7KMHKQPK and make your registration quicker. If not, please connect approximately 15 minutes prior to the scheduled start time. You can also access to the conference call replay through our website at http://phx.corporate-ir.net/phoenix.zhtml?c=83615&p=irol-irhome.
Pg. 43
| | PRESS RELEASE 1Q 2011 |
Contact Information
For further information, please contact us:
Ricardo Alvial Risk Management and IR Director ram@e.enersis.cl 56 (2) 353 4682 | Rodrigo Perez Head of Investor Relations rapr@e.enersis.cl 56 (2) 353 4554 |
Carmen Poblete Shares Department Associate cpt@e.enersis.cl 56 (2) 353 4447 | Romina Valderrama Investor Relations Associate rvh@enersis.cl 56 (2) 353 4552 | Melissa Vargas Investor Relations Associate emvb@enersis.cl 56 (2) 353 4555 | Nicolás Donoso Investor Relations Associate ndo@enersis.cl 56 (2) 353 4492 |
María Luz Muñoz
Investor Relations
Assistant
mlmr@e.enersis.cl
56 (2) 353 4682
Disclaimer
This Press Release contains statements that could constitute forward-looking statements within the meaning of the Private Securities Litigation Reform Act of 1995. These statements appear in a number of places in this announcement and include statements regarding the intent, belief or current expectations of Enersis and its management with respect to, among other things: (1) Enersis’ business plans; (2) Enersis’ cost-reduction plans; (3) trends affecting Enersis’ financial condition or results of operations, including market trends in the electricity sector in Chile or elsewhere; (4) supervision and regulation of the electricity sector in Chile or elsewhere; and (5) the future effect of any changes in the laws and regulations applicable to Enersis’ or its subsidiaries. Such forward-looking statements are not guarantees of future performance and involve risks and uncertainties. Actual results may differ materially from those in the forward-looking statements as a result of various factors. These factors include a decline in the equity capital markets of the United States or Chile, an increase in the market rates of interest in the United States or elsewhere, adverse decisions by government regulators in Chile or elsewhere and other factors described in Enersis’ Annual Report on Form 20-F. Readers are cautioned not to place undue reliance on those forward-looking statements, which state only as of their dates. Enersis undertakes no obligation to release publicly the result of any revisions to these forward-looking statements.
Pg. 44
SIGNATURES
Pursuant to the requirements of the Securities Exchange Act of 1934, as amended, the Registrant has duly caused this report to be signed on its behalf by the undersigned, thereunto duly authorized.
| ENERSIS S.A. | |
| By: /s/ Ignacio Antoñanzas Alvear | |
| -------------------------------------------------- | |
| Title: Chief Executive Officer |
Date: April 28, 2011