FORM 6-K
SECURITIES AND EXCHANGE COMMISSION
Washington, D.C. 20549
Report of Foreign Issuer
Pursuant to Rule 13a-16 or 15d-16 of
the Securities Exchange Act of 1934
For the month of July, 2011
Commission File Number: 001-12440
ENERSIS S.A.
(Translation of Registrant’s Name into English)
Santa Rosa 76
Santiago, Chile
(Address of principal executive office)
Indicate by check mark whether the registrant files or will file
annual reports under cover of Form 20-F or Form 40-F:
Form 20-F [X] Form 40-F [ ]
Indicate by check mark if the registrant is submitting the Form 6-K
in paper as permitted by Regulation S-T Rule 101(b)(1):
Yes [ ] No [X]
Indicate by check mark if the registrant is submitting the Form 6-K
in paper as permitted by Regulation S-T Rule 101(b)(7):
Yes [ ] No [X]
Indicate by check mark whether by furnishing the information
ontained in this Form, the Registrant is also thereby furnishing the
information to the Commission
pursuant to Rule 12g3-2(b) under the Securities Exchange Act of 1934:
Yes [ ] No [X]
If °;Yes” is marked, indicate below the file number assigned to the registrant
in connection with Rule 12g3-2(b): N/A
| | PRESS RELEASE |
ENERSIS
ANNOUNCES CONSOLIDATED RESULTS
FOR THE PERIOD ENDED ON JUNE 30, 2011
Highlights for the Period
Summary
Ø The first half of the year confirmed the strong growth in demand for electricity in the countries where we operate, based on the dynamic economic activity in these markets.
Ø Regarding the distribution business, it is important to note the improvement in our Peruvian and Chilean operations, with growth in electricity demand of 7.9% and 6.6% respectively.
Ø In the generation business, and taking into account this growth scenario, a sound commercial policy and the availability of our thermal generation, enabled us to achieve operating revenues 2.3% higher than those reported through June 2010, despite one of most severe droughts in Chile in the last 60 years.
Ø In this context, it is important to note the recovery of our Bocamina I coal-fired thermal plant which was damaged by the earthquake in Chile in February 2010. This permits us to provide the Chilean Central Interconnected System (“SIC”) with a stable and secure source of energy during a dry year.
Ø The Company’s EBITDA showed a decrease of Ch$ 164,803 million, mainly due to Ch$ 68,420 million in higher costs related to power purchases in the generation business, mainly in Chile. Additionally, Enersis accounted for the full impact of the equity tax reform in Colombia, for taxes payable throughout the 2011-2014 period. This non-recurring factor affected operating income of our Colombian operations (both distribution and generation subsidiaries) by Ch$ 59,478 million. It is also important to mention the lower results in our Brazilian and Argentine distribution companies.
Ø EBITDA for the Enersis Group was perfectly balanced in terms of business segment:
• Distribution: 50%
• Generation and Transmission: 50%
Ø Our distribution business customer base increased by over 341,000 customers, which confirms the natural growth of this business, an important stabilizing factor for our cash flows.
Ø Operating income for the period amounted to Ch$ 735,065 million, representing a decline of 12.1% compared to the same period in 2010.
Pg. 1
| | PRESS RELEASE |
Distribution Business
Consolidated figures for the distribution businesses are detailed as follows:
Ø Operating revenues rose by 3.5% to Ch$ 2,179,500 million.
Ø The cost of sales was Ch$ 1,406,636 million, a 6.8% increase over the same period of the previous year.
Ø EBITDA in the period amounted to Ch$ 467,351 million, a reduction of 8.2% compared to the same period in 2010, principally due to the reduced results of our businesses in Brazil, Argentina and Colombia, partially compensated by improvements in Chile and Peru.
The factors influencing this result are:
In Chile, EBITDA grew by Ch$ 16,124 million, mainly explained by:
Ø A better sales margin related to stronger demand in the semester, which was reflected in higher sales volume in every market segment.
Ø Greater revenues as a result of higher economic activity, which impacted revenues from other businesses.
In Peru, EBITDA rose by Ch$ 4,799 million as a result of:
Ø A 7.9% increase in physical sales.
Ø Greater revenues from other businesses.
Ø Reduced personnel expenses of Ch$ 3,059 million.
Ø Lower other variable costs by Ch$ 1,398 million.
In Argentina, EBITDA fell by Ch$ 20,579 million, mainly explained by:
Ø A reduced energy sales margin which could not be offset by the 3.1% increase in physical sales, due to an 11.0% reduction in average prices.
Ø Increase in the cost of sales, mainly explained by wage increases under collective agreements.
In Brazil, EBITDA decreased by Ch$ 20,714 million as a result of:
Ø Reduced sales margin, both in Ampla and in Coelce, and higher fixed costs in Ampla, partially compensated by higher physical sales in Ampla.
In Colombia, EBITDA decreased by Ch$ 21,571 million, principally as a result of:
Ø The effect of the Colombian government equity tax reform, which implied recording on January 1st, 2011 the entire tax payable for this concept in the 2011-2014 period by Ch$ 19,348 million in Codensa.
Ø This non-recurring operating effect more than offset the improved margins obtained as a result of the higher energy sales and reduced energy losses during the period.
Pg. 2
| | PRESS RELEASE |
Generation and Transmission Business
Ø Consolidated physical sales increased by 2.5% to 31,579 GWh, contributed by Argentina, Peru and Colombia.
Ø The latter was partially offset by decreases in Chile and Brazil. As a consequence, and due to a 2.3% increase in average sales prices, operating revenues amounted to Ch$ 1,327,158 million in 2011, a 2.3% increase over 2010.
Ø Procurement and services costs rose by 14.5% to Ch$ 716,059 million as a result of higher energy purchase costs, mainly in Chile, Argentina, and Brazil partially offset by Colombia and Peru.
Ø EBITDA amounted Ch$ 463,696 million, a decrease 20.0% compared with first half of 2010.
Ø Consolidated hydroelectric generation declined by 8.3%, explained by Chile, Argentina and Brazil, partially offset with Colombia y Peru.
The factors affecting this result are:
In Chile,EBITDA decreased by Ch$ 103,519 million, mainly due to:
Ø Higher energy purchase costs of Ch$ 105,304 million,
Ø Partially compensated by higher energy sales revenues of Ch$ 8,625 million and lower transport expenses of Ch$ 5,115 million.
In Peru, EBITDA increased by Ch$ 16,647 million due to:
Ø Higher energy sales revenues of Ch$ 7,407 million, and
Ø Lower cost of energy purchases of Ch$ 2,589 million, partially compensated by
Ø Higher fuel consumption cost of Ch$ 2,824 million.
In Argentina, EBITDA decreased by Ch$ 9,746 million due to:
Ø A higher fuel consumption cost of Ch$ 36,102 million, and
Ø Higher energy purchases costs of Ch$ 2,666 million and transport costs of Ch$ 2,134 million, partially compensated by
Ø Higher energy sales of Ch$ 36,838 million.
In Brazil,EBITDA rose by Ch$ 1,924 million due to:
Ø Recognition of CIEN as regulatory asset by local authorities since April 2011, allowing the billing of tolls according to RAP system (permitted annual revenue.)
Ø Higher energy revenues driven by higher average energy sale prices, which more than compensated the 5.5% fall in physical sales, mainly explained by Cachoeira Dourada.
In Colombia, EBITDA fell by Ch$ 21,456 million, mainly due to:
Ø An increase in other fixed operating costs of Ch$ 40,390 million, mainly explained by the non-recurring effect of the equity tax reform which implied the booking on January 1, 2011 of the full amount payable in the period 2011-2014, this situation impact to EBITDA in Ch$ 39,713 million.
Ø Reduced energy sales revenues of Ch$ 31,945 million, partially compensated by
Ø A reduction in cost of energy purchases of Ch$ 39,605 million.
Pg. 3
| | PRESS RELEASE |
Financial Summary
Ø Liquidity, a key consideration in our financial management, continues to be in a very solid position, as shown below on a consolidated basis for Enersis:
· Cash and cash equivalents amount to US$ 1,638 million.
· Committed credit lines for US$ 1,002 million, of which US$ 245 million expire in the short term.
· Non-committed credit lines for US$ 1,937 million available.
Ø Within this context, it is important to highlight the successful issuance of an unsecured bond in local currency by Emgesa, our Colombian generation subsidiary, in the international capital markets, for the Colombian peso equivalent of US$ 400 million. This break-through deal, the first bond issued in local currency by a private sector Colombian company in the international markets, was rated “Investment Grade” by Fitch Ratings and Standard and Poor’s.
Ø Coverage and protection: In order to mitigate exchange rate and interest rate risks, Enersis has established strict internal rules to protect our cash flows and balance sheet from fluctuations in these variables.
· Our exchange rate policy is based on cash flows and it strives to maintain a balance between US dollar indexed flows, and assets and liabilities in such currency. In addition to this policy, we have contracted cross currency swaps for a total amount of US$ 1,470 million and forwards for US$ 387 million.
· In order to reduce volatility on financial results due to changes in market interest rates, we seek to maintain an adequate balance for our debt structures. Thus, we have contracted interest rate swaps (from variable to fixed rates) for US$ 346 million.
Market Summary
Ø Since July 2010, the Chilean Stock Exchange main index (IPSA) has shown an increase of 19.1%. Other important stock exchanges showed a strong performance during the period: S&P 500: 28.5%, UKX: 23.7%, Dow Jones Industrials: 27.6%, FTSE 250: 30.6% and IBEX: 0.6% (all yields measured in local currencies.)
Ø Enersis’ share price in the local Chilean market was practically the same on June 30, 2010 and 2011. Divestitures made by Chilean pension funds and other foreign investors have influenced the evolution of Enersis’ stock price, which underperformed when compared to the local IPSA index.
Ø Enersis’ ADS price underperformed the Dow Jones Industrials and S&P indexes, but still showed a robust return of 16.1% in the twelve month period between June 2010 and June 2011. This is attributable to the appreciation of the Chilean peso against the United States dollars, from Ch$ 547.19 = US$ 1 in June 30, 2010 to Ch$ 468.15 = US$ 1 in June 30, 2011, an appreciation of 16.9% for the Chilean peso against the United States dollar.
Ø During the last twelve months period, Enersis continued to be among the most actively traded companies in the local market (Santiago Stock Exchange and Chilean Electronic Exchange), with a daily average trading volume of US$ 8.9 million.
Pg. 4
| | PRESS RELEASE |
| Top Ten Daily Average Traded Amount in the Local Market | |
| July 2010 - June 2011 | |
| US$ Thousand | |
| LAN | 23,143 |
| SQM | 21,584 |
| CENCOSUD | 18,269 |
| FALABELLA | 15,264 |
| LA POLAR | 12,511 |
| ENDESA CHILE | 12,299 |
| COPEC | 10,349 |
| CAP | 10,026 |
| ENERSIS | 8,901 |
| RIPLEY | 8,892 |
Source: Bloomberg
Risk Rating Classification Information
Enersis’ current ratings are supported by our well diversified asset portfolio, strong credit metrics, adequate debt structure and solid liquidity. Enersis’ geographic diversification in Latin America provides us a natural hedge against different regulations and weather conditions. Most of our operating subsidiaries are financially strong and have leading market positions in the countries where we operate.
On July 12, 2011, Feller Rate confirmed the “AA” local rating of Enersis’ solvency, bonds and bond program. At the same time, it confirmed the “1st Class Level 1” rating for its shares and the “1st Class +A/AA” rating for its commercial papers program. Rating perspectives continue to be “Stable”.
The current international risk ratings are:
Enersis | S&P | Moody’s | Fitch |
Corporate | BBB+ / Stable | Baa2 / Stable | BBB+ / Stable |
The domestic ratings (for securities issued in Chile):
Enersis | Feller Rate | Fitch |
Shares | 1st Class Level 1 | 1stClass Level 1 |
Bonds | AA / Stable | AA / Stable |
Pg. 5
| | PRESS RELEASE |
Table ofContents
| Summary | 1 |
| Distribution Business | 2 |
| Generation and Transmission Business | 3 |
| Financial Summary | 4 |
| Market Summary | 4 |
| Risk Rating Classification Information | 5 |
TABLE OF CONTENTS | 6 |
GENERAL INFORMATION | 8 |
SIMPLIFIED ORGANIZATIONAL STRUCTURE | 9 |
MARKET INFORMATION | 10 |
EQUITY MARKET | 10 |
| DEBT MARKET | 13 |
| CONSOLIDATED INCOME STATEMENT ANALYSIS | 14 |
| NET INCOME | 14 |
| OPERATING INCOME | 14 |
| NET FINANCIAL INCOME | 16 |
| SALE OF ASSETS | 16 |
| TAXES | 16 |
| CONSOLIDATED BALANCE SHEET ANALYSIS | 17 |
| ASSETS UNDER IFRS | 17 |
BOOK VALUE AND ECONOMIC VALUE OF ASSETS | 19 |
LIABILITIES AND SHAREHOLDERS’ EQUITY UNDER IFRS | 20 |
| DEBT MATURITY WITH THIRD PARTIES, THOUSAND US$ | 22 |
| DEBT MATURITY WITH THIRD PARTIES, MILLION CH$ | 22 |
| EVOLUTION OF KEY FINANCIAL RATIOS | 23 |
| UNDER IFRS | 24 |
| CASH FLOW RECEIVED FROM FOREIGN SUBSIDIARIES BY ENERSIS, CHILECTRA AND ENDESA CHILE | 25 |
THE PRINCIPAL RISKS ASSOCIATED TO THE ACTIVITIES OF THE ENERSIS GROUP | 26 |
ARGENTINA | 30 |
GENERATION | 30 |
| Endesa Costanera | 30 |
| El Chocon | 31 |
| DISTRIBUTION | 32 |
| Edesur | 32 |
BRAZIL | 33 |
ENDESA BRASIL | 33 |
| GENERATION | 33 |
| Cachoeira | 33 |
| Fortaleza (cgtf) | 34 |
| TRANSMISSION | 34 |
| CIEN | 34 |
| DISTRIBUTION | 35 |
| Ampla | 35 |
Pg. 6
| | PRESS RELEASE |
| Coelce | 36 |
| GENERATION | 37 |
| Endesa Chile | 37 |
| DISTRIBUTION | 38 |
| Chilectra | 38 |
COLOMBIA | 39 |
GENERATION | 39 |
| Emgesa | 39 |
| DISTRIBUTION | 40 |
| Codensa | 40 |
| GENERATION | 41 |
| Edegel | 41 |
| DISTRIBUTION | 42 |
| Edelnor | 42 |
CONFERENCE CALL INVITATION | 44 |
DISCLAIMER | 45 |
Pg. 7
| | PRESS RELEASE |
General Information
(Santiago, Chile, Thursday 28, July 2011). Enersis S.A. (NYSE: ENI), announced today its consolidated financial results for the first half period of 2011. All figures are in Chilean pesos (Ch$) and in accordance with International Financial Reporting Standards (IFRS). Variations refer to comparison between the period ended on June 30, 2010 and June 30, 2011.
Figures as of June 30, 2011 are additionally translated into US$, merely as a convenience translation, using the exchange rate of US$ 1 = Ch$ 468.15 as of June 30, 2011 for the Balance Sheet, and the average exchange rate for the period of US$ 1 = Ch$ 475.58 for the Income Statement, Cash Flow Statements, Capex and Depreciation values.
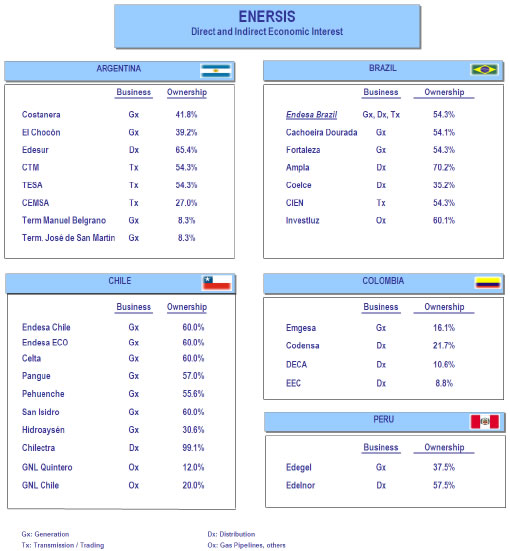
The consolidation includes the following investment vehicles and companies,
a) In Chile: Endesa Chile (NYSE: EOC)*, Chilectra, and Inmobiliaria Manso de Velasco.
b) Outside Chile: Distrilima (Peru), Endesa Brasil (Brazil)**, Edesur (Argentina) and Codensa (Colombia).
In the following pages you will find a detailed financial statement analysis, a brief explanation for the most important variations and comments on main items in the P&L and Cash Flow Statements compared to the information as of June 30, 2011.
* Includes Endesa Chile Chilean subsidiaries (Celta, Pangue, Pehuenche, San Isidro, and Tunel El Melon), non Chilean subsidiaries (Endesa Costanera, El Chocon, Edegel and Emgesa) and jointly controlled companies (Gas Atacama, Transquillota and Hidroaysen.)
** Includes Endesa Fortaleza, CIEN, Cachoeira Dourada, Ampla and Coelce.
Pg. 8
| | PRESS RELEASE |
| | PRESS RELEASE |
Market Information
Equity Market
New York Stock Exchange (NYSE)
The charts below show the performance of Enersis’ ADS (“ENI”) price at the NYSE, compared to the Dow Jones Industrials and the Dow Jones Utilities indexes over the last 12 months, as well as the trading volume, both in the NYSE.
ADS return for the period in US$: 16.1%
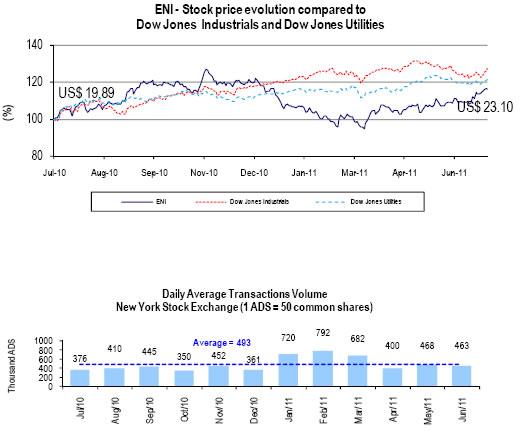
Source: Bloomberg
Pg. 10
| | PRESS RELEASE |
Santiago Stock Exchange (BCS)
The charts below show the performance of Enersis’ Chilean stock price over the last 12 months compared to the Chilean Selective Stock Index (IPSA), as well as the daily average aggregate trading volume in the Santiago and Chilean Electronic Stock Exchange:
Enersis stock return for the period in Chilean peso: 0.1%
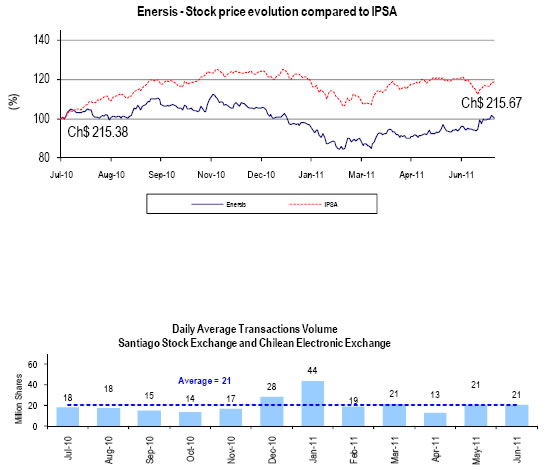
Source: Bloomberg
Pg. 11
| | PRESS RELEASE |
Madrid Stock Exchange (Latibex) - Spain
The charts below show Enersis’ share price (“XENI”) at the Latibex over the last 12 months compared to the local stock index (IBEX), as well as the daily average trading volume in the Latibex
XENI stock return for the period in Euro: -2.6%
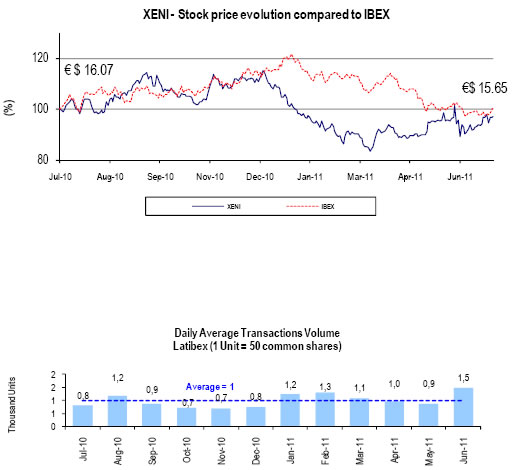
Source: Bloomberg
Pg. 12
| | PRESS RELEASE |
Debt Market
Yankee Bonds Price Evolution
The following chart shows the pricing of two of our Yankee Bonds over the last 12 months compared to the Ishares Iboxx Investment Grade Corporate Bond Fund Index:
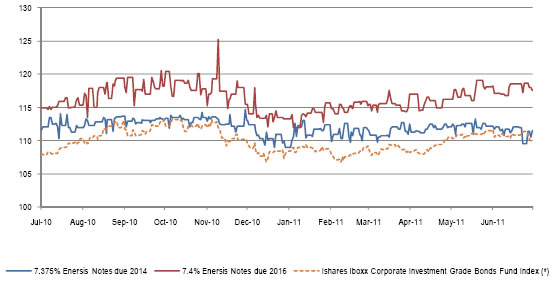
Source: Bloomberg
(*) Ishares Iboxx Investment Grade Corporate Bond Fund Index is an exchange traded fund incorporated in the U.S.A. The Index measures the performance of a fixed number of investment grade corporate bonds.
Pg. 13
| | PRESS RELEASE |
Consolidated Income Statement Analysis
Net Income
Enersis’ Net Income attributable to the Owners of the Company for the cumulative period as of June 30, 2011 reached Ch$ 201,756 million, representing a 1.8% increase over the same last year’s period, which was Ch$ 198,173 million.
Under IFRS
Table 1 | ||||||
CONSOLIDATED INCOME STATEMENT | (Million Ch$) | (Thousand US$) | ||||
| 1H 2010 | 1H 2011 | Var 2010-2011 | Chg % | 1H 2011 | |
Sales | 2,972,213 | 3,057,656 | 85,442 | 2.9% | 6,429,319 | |
Energy sales | 2,745,996 | 2,856,048 | 110,052 | 4.0% | 6,005,400 | |
Other sales | 21,089 | 21,327 | 238 | 1.1% | 44,843 | |
Other services | 205,129 | 180,281 | (24,848) | (12.1%) | 379,076 | |
Other operating income | 156,241 | 144,066 | (12,175) | (7.8%) | 302,927 | |
Revenues | 3,128,454 | 3,201,722 | 73,267 | 2.3% | 6,732,246 | |
Energy purchases | (754,408) | (888,399) | (133,991) | (17.8%) | (1,868,033) | |
Fuel consumption | (345,649) | (370,347) | (24,698) | (7.1%) | (778,727) | |
Transportation expenses | (195,018) | (194,243) | 775 | 0.4% | (408,434) | |
Other variable costs | (346,543) | (347,506) | (962) | (0.3%) | (730,698) | |
Procurements and Services | (1,641,619) | (1,800,495) | (158,876) | (9.7%) | (3,785,893) | |
|
|
|
|
|
| |
Contribution Margin | 1,486,836 | 1,401,227 | (85,609) | (5.8%) | 2,946,353 | |
Other work performed by entity and capitalized | 14,831 | 22,554 | 7,723 | 52.1% | 47,425 | |
Employee benefits expense | (177,604) | (173,397) | 4,208 | 2.4% | (364,601) | |
Other fixed operating expenses | (233,974) | (325,098) | (91,125) | (38.9%) | (683,583) | |
Gross Operating Income (EBITDA) | 1,090,089 | 925,286 | (164,803) | (15.1%) | 1,945,594 | |
Depreciation and amortization | (235,748) | (206,023) | 29,725 | 12.6% | (433,205) | |
Reversal of impairment profit (impairment loss) recognized in profit or loss | (17,989) | 15,802 | 33,791 | 187.8% | 33,228 | |
Operating Income | 836,352 | 735,065 | (101,287) | (12.1%) | 1,545,617 | |
Net Financial Income | (146,957) | (136,887) | 10,070 | 6.9% | (287,832) | |
Financial income | 71,497 | 93,169 | 21,672 | 30.3% | 195,907 | |
Financial costs | (224,843) | (217,623) | 7,219 | 3.2% | (457,596) | |
Gain (Loss) for indexed assets and liabilities | (7,664) | (13,102) | (5,438) | (71.0%) | (27,549) | |
Foreign currency exchange differences, net | 14,053 | 669 | (13,384) | (95.2%) | 1,406 | |
Gains | 64,280 | 16,283 | (47,998) | (74.7%) | 34,238 | |
Losses | (50,228) | (15,614) | 34,614 | 68.9% | (32,832) | |
Share of profit (loss) of associates accounted for using the equity method | 464 | 4,322 | 3,859 | 832.3% | 9,088 | |
Net Income From Other Investments | (283) | 182 | 464 | 164.3% | 382 | |
Net Income From Sale of Assets | 1,575 | (7,336) | (8,910) | (565.9%) | (15,425) | |
Net Income Before Taxes | 691,150 | 595,346 | (95,805) | (13.9%) | 1,251,831 | |
Income Tax | (221,490) | (178,628) | 42,861 | 19.4% | (375,601) | |
NET INCOME ATTRIBUTABLE TO: | 469,661 | 416,717 | (52,943) | (11.3%) | 876,230 | |
Owners of parent | 198,173 | 201,756 | 3,583 | 1.8% | 424,232 | |
Non-controlling interest | 271,488 | 214,961 | (56,526) | (20.8%) | 451,998 | |
Earning per share (Ch$ /share and US$ / ADR) | 6.1 | 6.2 | 0.1 | 1.8% | 0.6 | |
Operating Income
Operating income decreased by Ch$ 101,287 million, or 12.1% when compared with June 2010.
Operating revenues and costs, broken down by business line for the period ending on June 30, 2010 and 2011 are:
Pg. 14
| | PRESS RELEASE |
Table 2 |
|
|
|
|
|
|
|
|
|
|
|
|
|
|
Operating Income by Businesses | Generation and Transmission | Distribution | ||||||||||||
Million Ch$ |
| Chg% |
| Th. US$ |
| Million Ch$ |
| Chg% |
| Th. US$ |
| |||
1H 2010 | 1H 2011 |
|
|
| 1H 2011 |
| 1H 2010 | 1H 2011 |
|
|
| 1H 2011 |
| |
Operating Revenues | 1,296,886 | 1,327,158 |
| 2.3% |
| 2,790,610 |
| 2,106,375 | 2,179,500 |
| 3.5% |
| 4,582,826 |
|
Operating Costs | (841,116) | (937,831) |
| 11.5% |
| (1,971,973) |
| (1,721,309) | (1,826,935) |
| 6.1% |
| (3,841,488) |
|
Operating Income | 455,769 | 389,327 |
| (14.6%) |
| 818,636 |
| 385,066 | 352,566 |
| (8.4%) |
| 741,338 |
|
|
|
|
|
|
|
|
|
|
|
|
|
|
|
|
Operating Income by Businesses | Eliminations and Others |
| Consolidated |
| ||||||||||
Million Ch$ |
| Chg% |
| Th. US$ |
| Million Ch$ |
| Chg% |
| Th. US$ |
| |||
1H 2010 | 1H 2011 |
|
|
| 1H 2011 |
| 1H 2010 | 1H 2011 |
|
|
| 1H 2011 |
| |
Operating Revenues | (274,807) | (304,937) |
| 11.0% |
| (641,189) |
| 3,128,454 | 3,201,722 |
| 2.3% |
| 6,732,246 |
|
Operating Costs | 270,323 | 298,109 |
| 10.3% |
| 626,832 |
| (2,292,103) | (2,466,657) |
| 7.6% |
| (5,186,629) |
|
Operating Income | (4,484) | (6,828) |
| 52.3% |
| (14,357) |
| 836,352 | 735,065 |
| (12.1%) |
| 1,545,617 |
|
Generation and transmission business showed an Operating income of Ch$ 389,327 million, representing a Ch$ 66,442 million decrease from the same period 2010, or 14.6%. Physical sales increased 2.5% amounting to 31,579 GWh as of June 2011 (30,810 GWh for the same period in 2011).
Operating income for generation and transmission business line, detailed by country is shown in the following table:
Table 3 |
|
|
|
|
|
|
|
|
|
|
|
|
|
|
|
|
|
|
|
|
Generation & Transmission | Chile |
| Argentina |
| Brazil | |||||||||||||||
Million Ch$ |
| Chg% |
| Th. US$ |
| Million Ch$ |
| Chg% |
| Th. US$ |
| Million Ch$ |
| Chg% |
| Th. US$ | ||||
1H 2010 | 1H 2011 |
|
|
| 1H 2011 |
| 1H 2010 | 1H 2011 |
|
|
| 1H 2011 |
| 1H 2010 | 1H 2011 |
|
|
| 1H 2011 | |
Operating Revenues | 620,971 | 615,186 |
| (0.9%) |
| 1,293,550 |
| 172,075 | 204,079 |
| 18.6% |
| 429,117 |
| 130,492 | 134,926 |
| 3.4% |
| 283,708 |
% of consolidated | 48% | 46% |
|
|
| 46% |
| 13% | 15% |
|
|
| 15% |
| 10% | 10% |
|
|
| 10% |
Operating Costs | (400,781) | (489,906) |
| 22.2% |
| (1,030,123) |
| (146,322) | (186,340) |
| 27.3% |
| (391,816) |
| (76,214) | (44,963) |
| (41.0%) |
| (94,543) |
% of consolidated | 48% | 52% |
|
|
| 52% |
| 17% | 20% |
|
|
| 20% |
| 9% | 5% |
|
|
| 5% |
|
|
|
|
|
|
|
|
|
|
|
|
|
|
|
|
|
|
|
|
|
Operating Income | 220,190 | 125,280 |
| (43.1%) |
| 263,427 |
| 25,753 | 17,739 |
| (31.1%) |
| 37,300 |
| 54,278 | 89,963 |
| 65.7% |
| 189,165 |
|
|
|
|
|
|
|
|
|
|
|
|
|
|
|
|
|
|
|
|
|
Generation & Transmission | Peru |
| Colombia |
| Consolidated | |||||||||||||||
Million Ch$ |
| Chg% |
| Th. US$ |
| Million Ch$ |
| Chg% |
| Th. US$ |
| Million Ch$ |
| Chg% |
| Th. US$ | ||||
1H 2010 | 1H 2011 |
|
|
| 1H 2011 |
| 1H 2010 | 1H 2011 |
|
|
| 1H 2011 |
| 1H 2010 | 1H 2011 |
|
|
| 1H 2011 | |
Operating Revenues | 109,444 | 115,117 |
| 5.2% |
| 242,057 |
| 264,343 | 232,228 |
| (12.1%) |
| 488,304 |
| 1,296,886 | 1,327,158 |
| 2.3% |
| 2,790,610 |
% of consolidated | 8% | 9% |
|
|
| 9% |
| 20% | 17% |
|
|
| 17% |
| 100% | 100% |
|
|
|
|
Operating Costs | (70,770) | (57,610) |
| (18.6%) |
| (121,136) |
| (147,468) | (133,391) |
| (9.5%) |
| (280,481) |
| (841,116) | (937,831) |
| 11.5% |
| (1,971,973) |
% of consolidated | 8% | 6% |
|
|
| 6% |
| 18% | 14% |
|
|
| 14% |
| 100% | 100% |
|
|
|
|
|
|
|
|
|
|
|
|
|
|
|
|
|
|
|
|
|
|
|
|
|
Operating Income | 38,674 | 57,508 |
| 48.7% |
| 120,921 |
| 116,875 | 98,836 |
| (15.4%) |
| 207,823 |
| 455,769 | 389,327 |
| (14.6%) |
| 818,636 |
Distribution businessshowed a Ch$ 32,501 million lower operating income, totaling Ch$ 352,566 million. Physical sales amounted to 34,320 GWh, representing an increase of 1,324 GWh, or 4.0%. Our customer base increased by 341,000new clients approximately, amounting to 13.4 million customers.
Operating Income for distribution business line, detailed by country, as follows:
Table 4 |
|
|
|
|
|
|
|
|
|
|
|
|
|
|
|
|
|
|
|
|
Distribution | Chile |
| Argentina |
| Brazil | |||||||||||||||
Million Ch$ |
| Chg% |
| Th. US$ |
| Million Ch$ |
| Chg% |
| Th. US$ |
| Million Ch$ |
| Chg% |
| Th. US$ | ||||
1H 2010 | 1H 2011 |
|
|
| 1H 2011 |
| 1H 2010 | 1H 2011 |
|
|
| 1H 2011 |
| 1H 2010 | 1H 2011 |
|
|
| 1H 2011 | |
Operating Revenues | 441,023 | 504,214 |
| 14.3% |
| 1,060,209 |
| 151,683 | 139,425 |
| (8.1%) |
| 293,167 |
| 971,900 | 989,326 |
| 1.8% |
| 2,080,251 |
% of consolidated | 21% | 23% |
|
|
| 23% |
| 7% | 6% |
|
|
| 6% |
| 46% | 45% |
|
|
| 45% |
Operating Costs | (393,565) | (440,432) |
| 11.9% |
| (926,094) |
| (140,179) | (147,656) |
| 5.3% |
| (310,477) |
| (773,805) | (802,939) |
| 3.8% |
| (1,688,337) |
% of consolidated | 23% | 24% |
|
|
| 24% |
| 8% | 8% |
|
|
| 8% |
| 45% | 44% |
|
|
| 44% |
|
|
|
|
|
|
|
|
|
|
|
|
|
|
|
|
|
|
|
|
|
Operating Income | 47,458 | 63,782 |
| 34.4% |
| 134,115 |
| 11,503 | (8,232) |
| (171.6%) |
| (17,309) |
| 198,096 | 186,387 |
| (5.9%) |
| 391,915 |
|
|
|
|
|
|
|
|
|
|
|
|
|
|
|
|
|
|
|
|
|
Distribution | Peru |
| Colombia |
| Consolidated | |||||||||||||||
Million Ch$ |
| Chg% |
| Th. US$ |
| Million Ch$ |
| Chg% |
| Th. US$ |
| Million Ch$ |
| Chg% |
| Th. US$ | ||||
1H 2010 | 1H 2011 |
|
|
| 1H 2011 |
| 1H 2010 | 1H 2011 |
|
|
| 1H 2011 |
| 1H 2010 | 1H 2011 |
|
|
| 1H 2011 | |
Operating Revenues | 154,874 | 158,417 |
| 2.3% |
| 333,102 |
| 386,896 | 388,119 |
| 0.3% |
| 816,096 |
| 2,106,375 | 2,179,500 |
| 3.5% |
| 4,582,826 |
% of consolidated | 7% | 7% |
|
|
| 7% |
| 18% | 18% |
|
|
| 18% |
| 100% | 100% |
|
|
|
|
Operating Costs | (121,804) | (120,109) |
| (1.4%) |
| (252,552) |
| (291,956) | (315,798) |
| 8.2% |
| (664,028) |
| (1,721,309) | (1,826,935) |
| 6.1% |
| (3,841,488) |
% of consolidated | 7% | 7% |
|
|
| 7% |
| 17% | 17% |
|
|
| 17% |
| 100% | 100% |
|
|
|
|
|
|
|
|
|
|
|
|
|
|
|
|
|
|
|
|
|
|
|
|
|
Operating Income | 33,070 | 38,308 |
| 15.8% |
| 80,550 |
| 94,939 | 72,320 |
| (23.8%) |
| 152,068 |
| 385,066 | 352,566 |
| (8.4%) |
| 741,338 |
Pg. 15
| | PRESS RELEASE |
Net Financial Income
The Company’s net financial income as of June 30, 2011 was negative Ch$ 136,887 million, representing an improvement of 6.9% over the same period 2010. The latter is mainly explained by: (i) Higher financial income by Ch$ 21,672 million,mainly as a result of the increase in pension plan assets in Brazil by Ch$ 15,611 millionand higher time deposits during the period mainly explained by Chilectra and Endesa Brasil and (ii) Lower expenses by Ch$ 7,219 millionmainly explained by the effect the exchange rate prevailing during this period and partially offset by a lower average debt.
The latter was partially offset by higher loss for indexed assets and liabilities of Ch$ 5,438 million, linked to the negative impact of inflation over U.F. denominated debt in Chile. The U.F., a non-transaction currency linked to the inflation in Chile, increased its value by 2.0% during the current period, when compared to the 1.2% increase registered during the same period 2010.
Additionally, a Ch$ 13,384 million lower income related to foreign currency exchange differences was registered during the period, primarily linked to the devaluation of the Argentine peso against the U.S. dollars. In Argentina, the devaluation reached 3.4% in 2011 as well as in 2010, resulting in a loss of Ch$13,774 million in net effect an assets and debt in U.S. dollars.
Sale of Assets
The net income from sale of assets registered a decrease of Ch$ 8,910 million, explained by the recognition of the loss generated due to the sale of CAM.
Taxes
Income tax decreased by Ch$ 42,861 million at the end of June 2011. The latter is explained by decreases in: Endesa Chile (on a stand-alone basis) by Ch$ 17,519 million; Enersis by Ch$ 14,528 million; Chilectra by Ch$ 8,574 million; Edesur by Ch$ 7,299 million; Coelce by Ch$ 6,730 million; Pehuenche by Ch$ 6,395 million; Chocon by Ch$ 5,717 million and Celta by Ch$ 2,580 million.
The latter was partially offset by increases in Cien by Ch$ 11,637 million; San Isidro by Ch$ 5,643 million; Emgesa by Ch$ 5,577 million; Codensa by Ch$ 3,354 million and Edegel by Ch$ 2,160 million
Pg. 16
| | PRESS RELEASE |
Consolidated Balance Sheet Analysis
Assets Under IFRS
Table 5 |
|
|
|
|
|
|
ASSETS | (Million Ch$) |
| (Thousand US$) | |||
| As of Dec 31, 2010 | As of June 30, 2011 | Var 2010-2011 | Chg % | As of June 30, 2011 | |
|
|
|
|
|
| |
CURRENT ASSETS |
|
|
|
|
|
|
Cash and cash equivalents | 961,355 | 766,646 | (194,709) | (20.3%) |
| 1,637,607 |
Other current financial assets | 7,818 | 6,453 | (1,364) | (17.5%) |
| 13,784 |
Other current non-financial assets | 35,993 | 17,756 | (18,237) | (50.7%) |
| 37,929 |
Trade and other current receivables | 1,038,098 | 1,052,546 | 14,448 | 1.4% |
| 2,248,310 |
Accounts receivable from related companies | 20,472 | 20,511 | 40 | 0.2% |
| 43,814 |
Inventories | 62,652 | 75,375 | 12,723 | 20.3% |
| 161,005 |
Current tax assets | 137,987 | 130,167 | (7,820) | (5.7%) |
| 278,045 |
Non-current assets (or disposal groups) classified as held for sale | 73,893 | - | (73,893) | (100.0%) |
| - |
Total Current Assets | 2,338,268 | 2,069,455 | (268,813) | (11.5%) |
| 4,420,495 |
|
|
|
|
|
|
|
|
|
|
|
|
|
|
Other non-current financial assets | 62,969 | 73,425 | 10,456 | 16.6% |
| 156,840 |
Other non-current non-financial assets | 103,736 | 116,924 | 13,188 | 12.7% |
| 249,758 |
Trade accounts receivables and other receivables, net | 319,568 | 371,783 | 52,215 | 16.3% |
| 794,153 |
Investment accounted for using equity method | 14,102 | 16,344 | 2,242 | 15.9% |
| 34,911 |
Intangible assets other than goodwill | 1,452,586 | 1,585,402 | 132,816 | 9.1% |
| 3,386,527 |
Goodwill | 1,477,022 | 1,508,418 | 31,396 | 2.1% |
| 3,222,084 |
Property, plant and equipment, net | 6,751,941 | 7,036,840 | 284,899 | 4.2% |
| 15,031,165 |
Investment properties | 33,019 | 33,514 | 495 | 1.5% |
| 71,588 |
Deferred tax assets | 452,634 | 461,339 | 8,704 | 1.9% |
| 985,451 |
Total Non-Current Assets | 10,667,577 | 11,203,989 | 536,411 | 5.0% |
| 23,932,476 |
|
|
|
|
|
|
|
TOTAL ASSETS | 13,005,845 | 13,273,443 | 267,598 | 2.1% |
| 28,352,971 |
Total Assets increased Ch$ 267,598 million, mainly due to:
Ø Ch$ 536,411 million increase in non-current assets, or 5.0%, as a result of:
v Ch$ 284,899 million increase in Property, Plant and Equipment, explained by the net effect resulting from the translation of financial statements from local currencies to Chilean pesos by Ch$ 170,921 million, and additions for the period in approximately Ch$ 241,562 million. The latter was partially offset explained by the depreciation for the period by Ch$ 152,729 million.
v Ch$ 132,816 million increase in intangible assets other than goodwill, due to exchange rates variations, explained by: the translation effect by Ch$ 85,887 million; and additions for the period of Ch$ 91,475 million. The latter was partially offset by the depreciation for the period of Ch$ 53,294 million.
v Ch$ 52,215 million increase in trade accounts receivables and other receivables, mainly due to the increase in Ampla by Ch$ 42,700 million and Coelce by Ch$ 4,504 million, by the appliance of IFRIC 12 interpretation, regarding service concession arrangements.
v Ch$ 31,396 million increase in goodwill related to fluctuation of local currency against Chilean peso.
v Ch$ 13,188 million increase in other non-current non financial assets, mainly explained by an increase of liens in Coelce by Ch$ 9,106 million and Ampla by Ch$ 2,170 million.
Pg. 17
| | PRESS RELEASE |
The above was partially offset by:
Ø 268,813 million of decrease in current assets by Ch$ , or 11.5% decrease, mainly due to:
v Ch$ 194,709 million decrease in Cash and Cash Equivalent, primarily explained by decreases in: Endesa Chile by Ch$ 195,554 million due to debt amortizations and dividend payments; Chilectra by Ch$ 84,601 million linked to lower amount of time deposits; Endesa Brasil by Ch$ 67,000 million explained by a payment made to IFC; Codensa by Ch$ 34,824 due to debt amortization; Edelnor by Ch$ 16,264 million; Edesur by Ch$ 11,674 million due to decreases in Time Deposits and Ampla by Ch$ 8,552 million. The above was partially compensated by increases in: Emgesa by Ch$ 62,700 million, Cachoeira Dourada by Ch$ 50,499 million and Fortaleza by Ch$ 30,244 million, all of them explained by increases in Time Deposits. Other increases were registered in Enersis by Ch$ 27,853 million, Coelce by Ch$ 24,200 million, Edegel by Ch$ 23,903 million and Gas Atacama by Ch$ 12,523 million.
v Ch$ 73,893 million decrease in non-current assets classified as held for sell, related to the selling process of the former subsidiaries CAM and Synapsis, executed during this quarter.
Pg. 18
| | PRESS RELEASE |
Book Value and Economic Value of Assets
Regarding the more important assets, the following should be mentioned:
Properties, Plants and Equipment are valued at their purchase cost, net of the corresponding accumulated depreciation and impairment loss they have been subject to. Properties, Plants and Equipment, net of their residual value, if applicable, are linearly depreciated by distributing the cost of their different elements along the estimated years of useful life, which is the period that the companies expect to use them. The useful life is reviewed regularly.
The goodwill value generated by consolidation represents the acquisition cost surplus on the Group’s stake in terms of the reasonable value of assets and liabilities, including the identifiable contingent liabilities of a subsidiary at the time of acquisition. Goodwill is not amortized. Instead, at the closing of each accounting period an assessment is made of whether any impairment has occurred during the period that could reduce its recoverable value to an amount below the registered net cost, proceeding in this event to make a timely impairment adjustment (See Note 3.e to the Consolidated Financial Statements).
Throughout the fiscal year and in particular at the date of closing, an assessment is made as to any indication of possible loss due to the impairment of any asset. In the event of any such indication, an estimate of the recoverable sum of said asset is made to determine, if applicable, the depreciated amount. If this involves identifiable assets that do not originate independent cash flows, the recoverability of the Cash Generating Unit that the asset belongs to is estimated, understanding as such the smaller Group of identifiable assets that generate independent cash incomes.
Assets expressed in foreign currency are submitted at the prevalent exchange rate at the closing of the period.
Notes and accounts receivable from related companies are classified according to their short and long term maturities. These operations are adjusted according to prevalent market equity conditions.
In summary, assets are valued according to the International Financial Reporting Standards, whose criteria are expressed in Note 3 of the Consolidated Financial Statements.
Pg. 19
| | PRESS RELEASE |
Liabilities and Shareholders’ Equity Under IFRS
Table 6 |
|
|
|
|
|
|
LIABILITIES AND SHAREHOLDERS' EQUITY | (Million Ch$) |
| (Thousand US$) | |||
| As of Dec 31, 2010 | As of June 30, 2011 | Var 2010-2011 | Chg % | As of June 30, 2011 | |
|
|
|
|
|
|
|
CURRENT LIABILITIES |
|
|
|
|
|
|
Other current financial liabilities | 665,598 | 702,488 | 36,890 | 5.5% |
| 1,500,562 |
Trade and other current payables | 1,224,490 | 1,129,789 | (94,701) | (7.7%) |
| 2,413,306 |
Accounts payable to related companies | 148,202 | 147,978 | (225) | (0.2%) |
| 316,090 |
Other short-term provisions | 115,449 | 105,818 | (9,631) | (8.3%) |
| 226,035 |
Current tax liabilities | 147,667 | 97,945 | (49,722) | (33.7%) |
| 209,217 |
Current provisions for employee benefits | 5,450 | 2,881 | (2,570) | (47.1%) |
| 6,153 |
Other current non-financial liabilities | 35,791 | 44,584 | 8,793 | 24.6% |
| 95,234 |
Liabilities (or disposal groups) classified as held for sale | 64,630 | - | (64,630) | (100.0%) |
| - |
Total Current Liabilities | 2,407,277 | 2,231,482 | (175,795) | (7.3%) |
| 4,766,597 |
|
|
|
|
|
|
|
NON-CURRENT LIABILITIES |
|
|
|
|
|
|
Other non-current financial liabilities | 3,014,956 | 3,160,363 | 145,406 | 4.8% |
| 6,750,748 |
Non-current payables | 37,237 | 18,445 | (18,792) | (50.5%) |
| 39,399 |
Accounts payable to related companies | 1,084 | - | (1,084) | (100.0%) |
| - |
Other-long term provisions | 225,522 | 227,947 | 2,425 | 1.1% |
| 486,910 |
Deferred tax liabilities | 555,924 | 551,691 | (4,233) | (0.8%) |
| 1,178,449 |
Non-current provisions for employee benefits | 215,819 | 230,587 | 14,768 | 6.8% |
| 492,549 |
Other non-current non-financial liabilities | 33,997 | 79,402 | 45,404 | 133.6% |
| 169,607 |
Total Non-Current Liabilities | 4,084,540 | 4,268,434 | 183,894 | 4.5% |
| 9,117,663 |
|
|
|
|
|
|
|
SHAREHOLDERS' EQUITY |
|
|
|
|
|
|
Issued capital | 2,824,883 | 2,824,883 | - | 0.0% |
| 6,034,140 |
Retained earnings (losses) | 2,103,690 | 2,131,338 | 27,648 | 1.3% |
| 4,552,681 |
Share premium | 158,760 | 158,760 | - | 0.0% |
| 339,121 |
Other equity changes | - | - | - |
|
| - |
Reserves | (1,351,787) | (1,230,323) | 121,465 | 9.0% |
| (2,628,052) |
|
|
| - |
|
|
|
Equity Attributable to Shareholders of the Company | 3,735,545 | 3,884,658 | 149,113 | 4.0% |
| 8,297,891 |
Equity Attributable to Minority Interest | 2,778,483 | 2,888,869 | 110,386 | 4.0% |
| 6,170,820 |
Total Shareholders' Equity | 6,514,028 | 6,773,527 | 259,499 | 4.0% |
| 14,468,711 |
|
|
|
|
|
|
|
TOTAL LIABILITIES AND SHAREHOLDERS' EQUITY | 13,005,845 | 13,273,443 | 267,598 | 2.1% |
| 28,352,971 |
The Company’s total liabilities and shareholders’ equity increased by Ch$ 267,598 million, compared with the period ended on December 31, 2010, due to Ch$ 183,894 million increase in non-current liabilities and the Ch$ 259,499 million increase in shareholders’ equity. The latter was partially compensated by the Ch$ 175,795 million decrease of current liabilities. The detail is explained as follows:
Ø Non-current liabilities increased by Ch$ 183,894 million, or 4.5%, mainly due to:
v Other non-current financial liabilities (financial debt and derivatives) increased by Ch$ 145,406 million, mainly explained by increases in: Emgesa by Ch$ 149,203 million due to the issuance of a bond in local currency in the American market; Codensa by Ch$ 14,448 million; El Chocon by Ch$ 7,751 million; Endesa Chile by Ch$ 5,755 million due to the indexation effect over the U.F. denominated debt. The above was partially compensated by a Ch$ 15,494 million decrease in Ampla, due to a debt payment.
v Other non-current non-financial liabilities increased by Ch$ 45,404 million, mainly due to the recognition of a tax applied on equity at Emgesa and Codensa by Ch$ 26,801 million and Ch$ 17,605 million, respectively.
Ø Current Liabilities decreased by Ch$ 175,795 million, or 7.3%, due to:
v Ch$ 94,701 million decrease in trade and other current payables, corresponding to decreases in: Codensa by Ch$ 56,050 million; Ampla by Ch$ 48,277 million; Enersis by Ch$ 31,854 million; Emgesa by Ch$ 29,917 million; Cien by Ch$ 17,475 million; San Isidro by Ch$ 10,048million and Edegel by Ch$ 4,395 million. All the above was partially offset by increases in: Fortaleza by Ch$ 73,681 million; Coelce by Ch$ 27,966 million; Edesur by Ch$ 18,144 million; Pehuenche by Ch$ 4,594 million and Chilectra by Ch$ 1,566 million.
Pg. 20
| | PRESS RELEASE |
v Ch$ 64,630 million decrease in liabilities (or disposal groups) classified as held for sale, related to the selling process of CAM and Synapsis, executed during the first quarter of 2011.
v Ch$ 49,722 million decrease in current tax liabilities, mainly explained by decreases in: Emgesa by Ch$ 25,769 million; Codensa by Ch$ 11,906 million; Pangue by Ch$ 4,721 million; Pehuenche by Ch$ 3,859 million and Edesur by Ch$ 2,923 million.The above was partially compensated by increases in Edegel by Ch$ 5,216 million and San Isidro by Ch$ 3,322 million.
The above was partially offset by:
v Ch$ 36,890 million increase in other current financial liabilities (debt and derivatives), mainly explained by increases in: Emgesa by Ch$ 88,142 million due to reclassifications of debt from the long to the short term; Ampla by Ch$ 45,275 million; Coelce by Ch$ 10,353 million; Cien by Ch$ 3,436 million and Endesa Chile by Ch$ 2,509 million, explained by derivatives. The aforementioned explanations were in part compensated by decreases in: Endesa Brasil by Ch$ 51,906 million, linked to a payment made to IFC; Codensa by Ch$ 37,790 million due to bond amortizations; Edegel by Ch$ 12,448 million; El Chocon by Ch$ 10,070 million and Edelnor by Ch$ 4,037 million, due to loan and bond payments.
Total shareholders’ equity increased by Ch$ 259,499 million when compared to December 31, 2010.
v The total shareholders' equity attributable to the owners of the company increased by Ch$ 149,113 million which is mainly explained by the effect of the net income for the period of Ch$ 302,402 Million, where it is important to highlight the effect of controlling shareholder’s result by Ch$ 201,756 million. Additionally, the Equity increased by: positive conversion reserves by Ch$ 99,513 million; negative hedging reserves by Ch$ 2,144 million and other negative reserves by Ch$ 1,012 million. Dividends related to the current exercise reached Ch$ 157,798 million.
v The minority shareholders’ participation increased by Ch$ 110,386 million, as a consequence of the effect of the Net Income for the period of Ch$ 349,359 million, where it is important to highlight the effect of minority interest’s result by Ch$ 214,961 million and other consolidated results by Ch$ 134,398 million. The latter is partially compensated by lower equity changes by Ch$ 238,973 million.
Pg. 21
| | PRESS RELEASE |
Debt Maturity with Third Parties, Thousand US$
Table 7 |
|
|
|
|
|
|
|
|
(Million US$) | 2011 | 2012 | 2013 | 2014 | 2015 | 2016 | Balance | TOTAL |
Chile | 16.0 | 89.7 | 427.2 | 750.8 | 228.2 | 3.1 | 1,675.8 | 3,190.7 |
Enersis | 2.3 | 4.9 | 5.2 | 600.2 | 5.8 | 2.9 | 487.3 | 1,108.5 |
Chilectra | - | - | - | - | - | - | - | 0.0 |
Endesa Chile | 13.6 | 84.8 | 422.0 | 150.6 | 222.4 | 0.2 | 1,188.5 | 2,082.3 |
Argentina | 87.5 | 86.8 | 78.2 | 51.2 | 30.4 | - | 17.1 | 351.3 |
Edesur | 8.5 | 13.7 | 34.0 | 7.3 | - | - | - | 63.5 |
Costanera | 62.7 | 42.1 | 24.7 | 28.0 | 27.3 | - | 17.1 | 201.9 |
Chocón | 16.1 | 31.1 | 19.5 | 15.9 | 3.1 | - | - | 85.6 |
Hidroinvest | 0.3 | - | - | - | - | - | - | 0.3 |
CTM | - | - | - | - | - | - | - | - |
TESA | - | - | - | - | - | - | - | - |
Peru | 49.7 | 124.4 | 145.1 | 104.8 | 82.8 | 16.9 | 240.1 | 763.7 |
Edelnor | 14.9 | 64.5 | 94.0 | 54.9 | 49.1 | 10.9 | 60.1 | 348.4 |
Edegel | 34.8 | 59.9 | 51.0 | 49.9 | 33.7 | 6.0 | 180.0 | 415.3 |
Brazil | 451.0 | 619.1 | 243.1 | 164.7 | 62.9 | 9.7 | 63.8 | 1,614.3 |
Endesa Brasil | - | - | - | - | - | - | - | - |
Coelce | 105.1 | 141.7 | 116.4 | 114.1 | 12.4 | 1.0 | 48.6 | 539.3 |
Ampla | 272.7 | 332.7 | 111.4 | 34.3 | 33.1 | 0.1 | 3.9 | 788.3 |
Cachoeira | - | - | - | - | - | - | - | - |
Cien | 66.4 | 130.4 | - | - | - | - | - | 196.8 |
Fortaleza | 6.7 | 14.3 | 15.3 | 16.3 | 17.4 | 8.5 | 11.3 | 89.8 |
Colombia | 178.1 | 190.3 | 135.4 | 220.0 | 140.4 | - | 1,149.7 | 2,013.9 |
Codensa | 4.0 | 18.9 | 135.4 | 140.4 | - | - | 346.3 | 645.1 |
Emgesa | 174.1 | 171.3 | - | 79.6 | 140.4 | - | 803.4 | 1,368.8 |
TOTAL | 782.3 | 1,110.2 | 1,029.0 | 1,291.5 | 544.7 | 29.6 | 3,146.5 | 7,933.9 |
Debt Maturity with Third Parties, Million Ch$
Table 7.1 |
|
|
|
|
|
|
|
|
(Million Ch$) | 2011 | 2012 | 2013 | 2014 | 2015 | 2016 | Balance | TOTAL |
Chile | 7,476 | 41,996 | 200,000 | 351,489 | 106,831 | 1,430 | 784,516 | 1,493,738 |
Enersis | 1,098 | 2,290 | 2,422 | 280,966 | 2,709 | 1,335 | 228,108 | 518,928 |
Chilectra | - | - | - | - | - | - | - | 0 |
Endesa Chile | 6,378 | 39,706 | 197,578 | 70,523 | 104,122 | 94 | 556,409 | 974,809 |
Argentina | 40,976 | 40,630 | 36,630 | 23,981 | 14,241 | - | 7,995 | 164,454 |
Edesur | 3,992 | 6,394 | 15,929 | 3,426 | - | - | - | 29,740 |
Costanera | 29,336 | 19,700 | 11,582 | 13,089 | 12,800 | - | 7,995 | 94,502 |
Chocón | 7,520 | 14,537 | 9,120 | 7,466 | 1,440 | - | - | 40,083 |
Hidroinvest | 129 | - | - | - | - | - | - | 129 |
CTM | - | - | - | - | - | - | - | - |
TESA | - | - | - | - | - | - | - | - |
Peru | 23,258 | 58,228 | 67,914 | 49,055 | 38,760 | 7,903 | 112,417 | 357,535 |
Edelnor | 6,988 | 30,192 | 44,024 | 25,679 | 22,975 | 5,109 | 28,133 | 163,100 |
Edegel | 16,270 | 28,037 | 23,890 | 23,376 | 15,785 | 2,794 | 84,283 | 194,435 |
Brazil | 211,125 | �� 289,825 | 113,788 | 77,113 | 29,436 | 4,538 | 29,886 | 755,712 |
Endesa Brasil | - | - | - | - | - | - | - | - |
Coelce | 49,211 | 66,324 | 54,471 | 53,411 | 5,793 | 483 | 22,763 | 252,456 |
Ampla | 127,668 | 155,771 | 52,158 | 16,072 | 15,507 | 53 | 1,836 | 369,065 |
Cachoeira | - | - | - | - | - | - | - | - |
Cien | 31,090 | 61,057 | - | - | - | - | - | 92,147 |
Fortaleza | 3,157 | 6,672 | 7,160 | 7,630 | 8,136 | 4,002 | 5,287 | 42,044 |
Colombia | 83,393 | 89,080 | 63,379 | 103,000 | 65,745 | - | 538,219 | 942,815 |
Codensa | 1,868 | 8,868 | 63,379 | 65,745 | - | - | 162,128 | 301,989 |
Emgesa | 81,524 | 80,212 | - | 37,254 | 65,745 | - | 376,091 | 640,826 |
TOTAL | 366,228 | 519,760 | 481,712 | 604,638 | 255,014 | 13,871 | 1,473,032 | 3,714,254 |
Pg. 22
| | PRESS RELEASE |
Evolution Of Key Financial Ratios
Table 8 |
|
|
|
|
|
Indicator | Unit | As of Dec 31, 2010 | As of June 30, 2011 | Var 2010-2011 | Chg % |
Liquidity | Times | 0.97 | 0.93 | (0.04) | (4.1%) |
Acid ratio test * | Times | 0.94 | 0.89 | (0.05) | (5.3%) |
Working capital | Million Ch$ | (69,009.51) | (162,027.81) | (93,018.30) | (134.8%) |
Working capital | Thousand US$ | (147,408.97) | (346,102.35) | (198,693.37) | (134.8%) |
Leverage ** | Times | 1.00 | 0.96 | (0.04) | (4.0%) |
Short-term debt | % | 37.00 | 34.00 | (3.00) | (8.1%) |
Long-term debt | % | 63.00 | 66.00 | 3.00 | 4.8% |
* (Current assets net of inventories and prepaid expenses) / Current liabilities |
|
|
| ||
** Total debt / (equity + minority interest) |
|
|
|
|
|
|
|
|
|
|
|
Table 8.1 |
|
|
|
|
|
Indicator | Unit | 1H 2010 | 1H 2011 | Var 2010-2011 | Chg % |
Financial expenses coverage * | Times | 4.99 | 4.02 | (0.97) | (19.4%) |
Op. income / Op. rev. | % | 26.73 | 22.96 | (3.78) | (14.1%) |
ROE ** | % | 14.33 | 12.91 | (1.43) | (10.0%) |
ROA ** | % | 8.26 | 7.87 | (0.39) | (4.8%) |
* EBITDA / Financial costs |
|
|
|
|
|
** Annualized figures |
|
|
|
|
|
Liquidity, a key consideration in our financial management, continues to be in a very solid position. As of June 2011, liquidity reached 0.93 times, representing a slight decrease of 0.04 times, equivalent to a 4.1% drop when compared to December 2010. Enersis has a sound financial profile and ample access to credit markets. In fact, the Company has been serving its debt maturities with own generated resources, with an appropriate maturity schedule.
Leverage ratio, as of June 30, 2011, reached 0.96 times, showing a decrease of 4.0% when compared to December 2010.
Financial expense coverage reached 4.02 times, a decrease of 0.97 times or 19.4% drop from the ratio registered on equal period the precedent year. This is mainly the result of the EBITDA decrease during this period.
Operating income over operating revenues ratio decreased 14.1%, reaching to 23.0% as of June 2011.
The annual ROE of the Parent Company reached 12.9%, representing a decrease of 9.9% when compared to June 2010. This drop is explained by the increase in equity attributable to the shareholders of the Company, slightly offset by higher results for the period attributable to the shareholders of the Company.
Annual ROA reached 7.9% as of June 2011, a 4.8% decrease from the registered as of June 2010, reflecting the lower consolidated results, and the increase in Total Assets.
Pg. 23
| | PRESS RELEASE |
Consolidated Statements of Cash Flows Analysis
Under IFRS
Table 9 | ||||||
CASH FLOW | (Million Ch$) |
| (Thousand US$) | |||
| 1H 2010 | 1H 2011 | Var 2010-2011 | Chg % | 1H 2011 | |
|
|
|
|
|
|
|
Net Income | 469,661 | 416,717 | (52,943) | (11.3%) | 876,230 | |
Adjustments to reconcile net income | ||||||
Income tax expense | 221,490 | 178,628 | (42,861) | (19.4%) | 375,601 | |
Decrease (increse) in inventories | 16,365 | (10,475) | (26,840) | (164.0%) | (22,026) | |
Decrease (increase) in trade accounts receivable | (71,545) | 18,111 | 89,656 | 125.3% | 38,081 | |
Decrease (increase) in other operating accounts receivable | (71,497) | (93,169) | (21,672) | (30.3%) | (195,907) | |
Decrease (increase) in trade accounts payable | 25,700 | (146,360) | (172,060) | (669.5%) | (307,750) | |
Decrease (increase) in other operating accounts payable | - | - | - | - | ||
Depreciation and amortization expense | 235,748 | 206,023 | (29,725) | (12.6%) | 433,205 | |
(Reversal of) Impairment losses | 17,989 | (15,802) | (33,791) | (187.8%) | (33,228) | |
Provisions | (1,470) | (7,006) | (5,536) | (376.5%) | (14,732) | |
Unrealized foreign currency exchange differences | (14,053) | (669) | 13,384 | 95.2% | (1,406) | |
Non-distributed gains from associates | (464) | (4,322) | (3,859) | (832.3%) | (9,088) | |
Minority interest | - | - | - | - | ||
Other non-cash | (103,137) | 95,417 | 198,554 | 192.5% | 200,633 | |
Total adjustments to Reconcile to Operating Income | 255,126 | 220,376 | (34,750) | (13.6%) | 463,383 | |
Dividends paid | - | - | - | - | ||
Dividends received | - | - | - | - | ||
Payments of interest classified as operating | - | - | - | - | ||
Proceeds of interest received classified as operating | - | - | - | - | ||
Income taxes refund (paid) | (203,073) | (249,447) | (46,374) | (22.8%) | (524,511) | |
Other inflows (outflows) of cash | (512) | (10,892) | (10,380) | (2025.7%) | (22,903) | |
Other adjustments for which the impact in cash corresponds to cash flow provided by investing or financing activities. | 232,506 | 230,725 | (1,781) | (0.8%) | ||
NET CASH FLOWS PROVIDED BY OPERATING ACTIVITIES | 753,707 | 607,479 | (146,228) | (19.4%) |
| 1,277,344 |
|
|
|
|
|
|
|
Net Cash Flows provided by (used in) Investing Activities |
|
|
|
|
|
|
Cash flows from loss of control of subsidiaries or other businesses. | - | 15,367 | 15,367 |
|
| 32,311 |
Acquisitions of associates | - | - | - |
|
| - |
Cash flows used for the purchase of non-controlling | - | - | - |
|
|
|
Loans to related companies | - | 17 | 17 |
|
| 36 |
Proceeds from sales of property, plant and equipment | 2,745 | 2,566 | (179) | (6.5%) |
| 5,396 |
Purchase of property, plant and equipment | (209,165) | (241,562) | (32,397) | (15.5%) |
| (507,932) |
Proceeds from sales of intangible assets | 1,114 | 7,348 | 6,233 | 559.3% |
| 15,450 |
Acquisitions of intangible assets | (89,292) | (91,475) | (2,183) | (2.4%) |
| (192,344) |
Proceeds from other long term assets. | - | - | - |
|
| - |
Purchase of other long-term assets | - | - | - |
|
| - |
Proceeds from prepayments reimbursed and third party loans | - | - | - |
|
| - |
Prepayments and third party loans | (2,996) | (1,269) | 1,727 | 57.6% |
| (2,669) |
Dividends received | 5,171 | 2,430 | (2,741) | (53.0%) |
| 5,110 |
Interest received | 1,569 | 11,898 | 10,329 | 658.5% |
| 25,017 |
Other inflows (outflows) of cash | 10,966 | (4,047) | (15,013) | (136.9%) |
| (8,510) |
NET CASH FLOWS FROM (USED IN) INVESTING ACTIVITIES | (279,887) | (298,728) | (18,841) | (6.7%) |
| (628,134) |
|
|
|
|
|
|
|
Cash Flows provided by (used in) Financing Activities |
|
|
|
|
|
|
Proceeds from long-term borrowings | 156,664 | 322,720 | 166,056 | 106.0% |
| 678,582 |
Repayments of borrowings | - | - | - |
|
| - |
Payments of loans | (442,225) | (307,050) | 135,175 | 30.6% |
| (645,633) |
Payments of finance lease liabilities | (4,749) | (5,812) | (1,063) | (22.4%) |
| (12,221) |
Repayment of loans to related companies | (4,574) | - | 4,574 | (100.0%) |
| - |
Dividends paid | (440,009) | (503,450) | (63,441) | (14.4%) |
| (1,058,602) |
Interest paid | (111,443) | (104,064) | 7,379 | 6.6% |
| (218,815) |
Other financing proceeds (payments) | (90,637) | (4,222) | 86,415 | 95.3% |
| (8,877) |
NET CASH FLOWS PROVIDED BY (USED IN) FINANCING ACTIVITIES | (936,972) | (601,877) | 335,095 | 35.8% |
| (1,265,564) |
|
|
|
|
|
|
|
NET INCREASE (DECREASE) IN CASH AND CASH EQUIVALENTS BEFORE EFFECTS OF EXCHANGE RATE | (463,152) | (293,126) | 170,026 | 36.7% |
| (616,354) |
|
|
|
|
|
|
|
Effect of exchange rate changes on cash and cash equivalents | 5,006 | 98,416 | 93,410 | 1865.8% |
| 206,940 |
Net Increase (Decrease) in Cash and Cash Equivalents | (458,146) | (194,709) | 263,436 | 57.5% | (409,414) | |
Cash and cash equivalents at end of period | 1,134,901 | 961,355 | (173,546) | (15.3%) |
| 2,021,437 |
Ending Balance of Cash and Cash Equivalents | 676,755 | 766,646 | 89,891 | 13.3% |
| 1,612,023 |
Pg. 24
| | PRESS RELEASE |
The Company generated a negative cash flow of Ch$ 293,126 million for the period, which can be detailed as follows:
Operating activities generated a positive net cash flow of Ch$ 607,479 million that represents a decrease of 19.4% when compared to previous fiscal year. This cash flow is composed primarily with net income of the period for Ch$ 416,717 million, which is adjusted to operating income in Ch$ 306,040 million. This adjustment includes asset amortization and depreciation for Ch$ 190,221 million and interests for Ch$ 137,556 million. The latter was partially compensated by a decrease in working capital by Ch$ 115,279 million.
Investment activities generated a net negative cash flow of Ch$ 298,728 million, Ch$ 18,841 million compared with the same period, or 6.7%. This cash flow corresponds primarily to the incorporation of Property, Plant and Equipment by Ch$ 241,562 million, intangible assets’ purchases (IFRIC 12) by Ch$ 91,475 million, compensated by the sale of CAM and Synapsis by Ch$ 15,367 million.
Financing activities originated a negative cash flow of Ch$ 601,877 million, due to dividends paid for Ch$ 503,450 million, loans payments for Ch$ 307,050 million and interests paid for Ch$ 104,064 million. The aforementioned was partially compensated for loans obtained for Ch$ 322,720 million.
Cash Flow Received From Foreign Subsidiaries by Enersis, Chilectra and Endesa Chile
Table 10 |
|
|
|
|
|
|
|
|
|
|
Cash Flow | Interest Received | Dividends Received | Capital Reductions | Others | Total Cash Received | |||||
(Thousand US$) | ||||||||||
| 1H 2010 | 1H 2011 | 1H 2010 | 1H 2011 | 1H 2010 | 1H 2011 | 1H 2010 | 1H 2011 | 1H 2010 | 1H 2011 |
Argentina | 207.3 | 101.8 | - | - | - | - | 495.6 | 1,191.8 | 702.9 | 1,293.5 |
Peru | - | - | 31,869.2 | 26,330.2 | - | - | - | - | 31,869.2 | 26,330.2 |
Brazil | - | - | 141,908.9 | - | - | - | - | - | 141,908.9 | - |
Colombia | - | - | 123,964.2 | 15,833.0 | 59,462.9 | - | - | - | 183,427.1 | 15,833.0 |
Others | - | 1,218.8 | - | - | - | - | - | - | - | 1,218.8 |
Total | 207.3 | 1,320.5 | 297,742.2 | 42,163.2 | 59,462.9 | - | 495.6 | 1,191.8 | 357,908.1 | 44,675.5 |
Source: Internal Financial Report
Table 11 |
|
|
|
|
|
|
|
|
|
| Payments for Additions of Fixed Assets |
| Depreciation | ||||||
|
|
|
|
|
|
|
|
|
|
| Million Ch$ |
| Thousand US$ |
| Million Ch$ |
| Thousand US$ | ||
| 1H 2010 | 1H 2011 |
| 1H 2011 |
| 1H 2010 | 1H 2011 |
| 1H 2011 |
Endesa Chile | 143,752 | 147,625 |
| 310,410 |
| 98,930 | 83,330 |
| 175,218 |
Cachoeira | - | 1,514 |
| 3,183 |
| 3,529 | 3,828 |
| 8,049 |
Endesa Fortaleza | - | 1,532 |
| 3,221 |
| 3,982 | 4,074 |
| 8,566 |
Cien | 1,884 | 66 |
| 139 |
| 16,965 | 3,783 |
| 7,954 |
Chilectra S.A. | 13,852 | 16,802 |
| 35,329 |
| 10,524 | 8,845 |
| 18,598 |
Edesur | 19,959 | 33,924 |
| 71,332 |
| 7,157 | 6,420 |
| 13,499 |
Edelnor | 10,162 | 13,871 |
| 29,166 |
| 10,275 | 9,686 |
| 20,367 |
Ampla (*) | 41,271 | 59,088 |
| 124,244 |
| 27,159 | 28,574 |
| 60,082 |
Coelce (*) | 46,644 | 31,501 |
| 66,237 |
| 18,660 | 20,112 |
| 42,289 |
Codensa | 16,659 | 23,971 |
| 50,404 |
| 29,042 | 29,514 |
| 62,059 |
Cam Ltda. | 539 | 46 |
| 97 |
| 870 | 294 |
| 618 |
Inmobiliaria Manso de Velasco Ltda. | 493 | 670 |
| 1,409 |
| 142 | 133 |
| 280 |
Synapsis | 1,732 | 488 |
| 1,026 |
| 1,512 | 478 |
| 1,005 |
Enersis holding and investment companies | 133 | 581 |
| 1,222 |
| 537 | 569 |
| 1,196 |
Total | 297,080 | 331,679 |
| 697,420 |
| 229,284 | 199,640 |
| 419,782 |
(*) Includes concessions intangible assets. |
|
|
|
|
|
|
|
|
|
Pg. 25
| | PRESS RELEASE |
The Principal Risks associated to the activities of the Enersis Group
Commercial and Regulatory Risk
The Group’s activities are subject to a broad range of governmental standards and environmental regulations. Any modification of such standards and regulations may affect the Group’s activities, economic situation and operating results.
The Group’s distribution activity is subject to a wide range of rules regarding tariffs and other issues that govern their activities in each of the countries where it operates and which could modify distribution subsidiaries operating results.
The Group’s generation activity is subject to existing hydrological and weather conditions in the geographic zones in which the Group’s hydroelectric generating plants are located. Commercial policies have been planned in order to moderate the possible impact of changes in these variables.
Group’s activities are subject to certain environmental regulation which Enersis fulfills constantly. Modifications applied on such regulations may affect the operations, economic condition or the results of these operations.
Enersis and its operating subsidiaries are subject to environmental regulations which, among other things, require the company to conduct environmental impact studies for future projects, obtaining permits, licenses and other authorizations and the fulfillment of all requirements of those licenses, permits and norms. As any other regulated company, Enersis cannot guarantee:
· The approval from regulators of environmental impact studies.
· That public opposition may not cause delays or modifications to any proposed project and
· That laws or regulations may not change or be interpreted in a manner that could adversely affect the operations or the plans for companies in which Enersis or its subsidiaries hold investments.
Interest Rate Risk
Interest rate variations modify the fair value of those assets and liabilities that accrue a fixed interest rate, as well as the future flows of assets and liabilities pegged to a variable interest rate.
In compliance with our current interest rate hedging policy, the portion of fixed and/or hedged debt to the total net debt was 50% as of June 30, 2011 on a consolidated basis.
Depending on the Group’s estimates and debt structure objectives, hedging transactions take place hiring derivatives that mitigate these risks.
Exchange Rate Risk
The exchange rate risks are mainly related to the following transactions:
- Foreign currency debts raised by Group’s companies.
- Payments to be made on international markets for the acquisition of projects related materials.
- Group companies’ incomes directly linked to the evolution of the dollar, and
- Incoming cash flows from our subsidiaries abroad exposed to exchange rate fluctuations.
Pg. 26
| | PRESS RELEASE |
In order to mitigate exchange rate risks, Enersis’ exchange rate hedging policy is based on cash flows and it strives to maintain a balance between dollar indexed flows and the asset and liability levels in such currency. Crosscurrency swaps and exchange rate forwards are the instruments currently used in compliance with this policy. Likewise, the policy looks to refinance debts in each company’s functional currency.
Commodities Risk
Enersis is exposed to the price fluctuation risk on some commodities, basically through fuel purchases for the electricity generation and also energy transactions in the local markets.
In order to reduce risks in extreme drought conditions, the company has designed a trading policy that defines sales commitment levels consistent with its generating plants’ firm energy in a dry year, including risk mitigation clauses in some unregulated clients’ contracts.
In view of the operative conditions by the electricity generation market in Chile has experienced, like extreme drought and rising oil prices, the company has decided to hire a derivative to place a cap on the Brent price for consumption projected for the period April-July 2011. Market and operative conditions will be constantly analyzed to adjust the volume hedged or take new hedges for the following months.
Liquidity Risk
In engaging committed long term credit facilities and short term financial investments the Group maintains a consistent liquidity policy, for the amounts required to support projected needs for the period, contingent with the situation and the expectations in the debt and capital markets.
As of June 30, 2011, the Enersis Group held liquidity in the amount of Ch$ 766,646 million in Cash and Cash Equivalent and Ch$ 354,858 million in committed long term credit lines. As of December 31st, 2010, the Enersis Group held liquidity in the amount of Ch$ 961,355 million in Cash and Cash Equivalent and Ch$ 242,750 million in committed long term credit lines.
Credit Risk
Credit risk in accounts receivable, originating from trading activities, has been historically very limited given that the short term collection conditions with customers doesn’t allow them to individually accumulate significant amounts. Additionally, in the case of the so-called “unregulated clients” of our electricity generation and distribution business, a formal procedure is applied to control the credit risk, using a systematic evaluation of our counterparties, index definition and credit risk factors by virtue of which the contracts are approved or additional guarantee requirements are defined.
Furthermore, in our electricity generating business, in the event of non-payment, some countries allow power supply cut-offs, and in almost all contracts a lack of payment is established as cause for contract termination. For this purpose, credit risks are constantly monitored and the maximum amounts exposed to payment risks are measured, which are limited.
In turn, in our electricity distribution business, the energy supply cut-off is a power held by our companies in case of default by our customers, applied in accordance with the applicable regulation in each country, enabling the credit risk evaluation and control process, which is also limited.
Pg. 27
| | PRESS RELEASE |
Surplus cash flow investments are placed in prime national and foreign financial entities (with an investment grade equivalent risk rating) with limits set for each entity.
In the selection of banks for investment, the Group considers those that hold two investment grade classifications, according to the three main international risk agencies (Moody’s, S&P and Fitch Ratings).
Positions are backed up by treasury bonds from the country of operations and instruments issued by the most reputable banks, favoring, wherever possible, the first ones.
Derivatives are engaged with highly solvent entities; about 90% of operations are conducted with entities that hold an A or higher rating.
Risk Measurement
The Enersis Group measures the Value at Risk (VaR) of its debt and financial derivatives positions in order to guarantee that the risk taken by the company remains consistent with the risk exposure defined by Management, thus restricting the volatility of its financial results.
The positions portfolio used in the calculations of the current Value at Risk is comprised of debt and financial derivatives.
The calculated Value at Risk represents the possible value loss of the aforementioned positions portfolio over one day time horizon with 95% of confidence.
The volatility of the risk variables that affect the value of the positions portfolio has been studied, including:
- The U.S. dollar Libor interest rate.
- The usual banking local indexes for debts, taking into account the different currencies our companies operate under, and
- The exchange rates of the different currencies involved in the calculation.
The calculation of VaR is based on generating possible future scenarios (at one day) of market values (both spot and term) for the risk variables, using Monte Carlo simulations. The number of scenarios generated ensures compliance with the simulation convergence criteria. A matrix of volatilities and correlations between the various risk variables calculated based on the historical values of the logarithmic price return, has been applied to simulate the future price scenario.
Once the price scenarios have been obtained, the fair value of the portfolio is calculated using such scenarios, obtaining a distribution of possible values at one day. The one-day 95% confidence VaR number is calculated as the 5% percentile of the potential increases in the fair value of the portfolio in one day.
The various debt positions and financial derivatives included in the calculation have been valued consistently using the financial capital calculation methodology reported to Management.
Other Risks
A portion of Enersis and Endesa Chile’s debt is subject to cross default provisions. If certain defaults in debt of certain specific subsidiaries are not remedied within specified grace periods, a cross defaultcould affect Endesa Chile and Enersis, and under certain scenarios, debts at the holding company level could be accelerated.
Pg. 28
| | PRESS RELEASE |
Nonpayment – after any applicable grace period – of the debts of Enersis and Endesa Chile, or their so-called Relevant Subsidiaries, with an individual principal amount outstanding in excess of US$ 50 million (or its equivalent in other currencies), and with a missed payment also in excess of US$ 50 million, could give rise to a cross default of several bank revolving debt facilities at the Endesa Chile and Enersis levels. Furthermore, some of these debt facilities are also subject to cross acceleration provisions in the event of a default in other Relevant Subsidiary debt, for reasons other than payment default, for events such as bankruptcy, insolvency proceedings, and materially adverse governmental or legal actions, in all cases for amounts in excess of US$ 50 million dollars.
Similarly, nonpayment – after any given applicable grace period - of the debts of these companies or any of their Chilean subsidiaries, in single indebtedness in default with a principal in excess of US$ 30 million dollars, could potentially give rise to a cross default of Enersis and Endesa Chile Yankee bonds.
There are no clauses in the credit agreements by which changes in the corporate or debt classification of these companies from risk classification agencies could trigger prepayments. Nevertheless, a modification in the Standard & Poor’s (S&P) debt risk classification in foreign currency could trigger a change in the margin applicable to determine the interest rate, in the credit loans executed in 2006, and in local credit lines executed in 2009.
Pg. 29
| | PRESS RELEASE |
Argentina

Generation
Endesa Costanera
The operating income reached Ch$ 7,698 million during the first semester 2011, increasing by 16.7% when compared to the same period in 2010. This is mainly explained by Ch$ 42,905 million of greater revenues related to energy sales, which were partially compensated by an increase of Ch$ 36,102 million in fuel cost. It is important to highlight that operating revenues increased by 29.3%, supported by a 23.4% rise in physical sales.
The net effect of translating the financial statements from the Argentine peso to Chilean pesos in both periods was negative, resulting in a 12.2% decrease in Chilean pesos as of June 2011.
Table 12 |
|
|
|
|
|
|
Endesa Costanera | Million Ch$ |
|
| Thousand US$ | ||
| 1H 2010 | 1H 2011 | Var 2010-2011 | Chg% |
| 1H 2011 |
Operating Revenues | 139,866 | 180,888 | 41,022 | 29.3% |
| 380,353 |
Procurement and Services | (117,195) | (156,963) | (39,769) | (33.9%) |
| (330,046) |
Contribution Margin | 22,671 | 23,925 | 1,253 | 5.5% |
| 50,306 |
Other Costs | (8,134) | (9,803) | (1,668) | (20.5%) |
| (20,612) |
Gross Operating Income (EBITDA) | 14,537 | 14,122 | (415) | (2.9%) |
| 29,695 |
Depreciation and Amortization | (7,940) | (6,425) | 1,515 | 19.1% |
| (13,509) |
Operating Income | 6,597 | 7,698 | 1,100 | 16.7% |
| 16,186 |
Figures may differ from those accounted under Argentine GAAP. |
|
|
|
|
| |
|
|
|
|
|
|
|
Table 12.1 |
|
|
|
|
|
|
Endesa Costanera | 1H 2010 | 1H 2011 | Var 2010-2011 | Chg% |
|
|
GWh Produced | 3,940 | 4,885 | 945 | 24.0% |
|
|
GWh Sold | 3,986 | 4,919 | 933 | 23.4% |
|
|
Market Share | 7.3% | 8.5% | 1.2 pp. |
|
|
|
Pg. 30
| | PRESS RELEASE |
El Chocon
Operating income reached Ch$ 10,769 million, decreasing 36.5% when compared to first semester 2010. The latter is mainly explained by lower operating revenues for Ch$ 6,060 million, as a consequence of 18.1% lower physical sales. This is mainly explained by poorer hydrological conditions, leading to an electricity generation 26.1% lower when compared to June 2010. Additionally, during this period El Chocon experienced higher costs related to energy purchases.
The net effect of translating the financial statements from the Argentine peso to Chilean pesos in both periods was negative, resulting in a 12.2% decrease in Chilean pesos as of June 2011.
Table 13 |
|
|
|
|
|
|
El Chocón | Million Ch$ |
|
| Thousand US$ | ||
| 1H 2010 | 1H 2011 | Var 2010-2011 | Chg% |
| 1H 2011 |
Operating Revenues | 29,243 | 23,183 | (6,060) | (20.7%) |
| 48,746 |
Procurement and Services | (8,248) | (8,748) | (500) | (6.1%) |
| (18,394) |
Contribution Margin | 20,995 | 14,435 | (6,560) | (31.2%) |
| 30,352 |
Other Costs | (2,445) | (2,253) | 192 | 7.8% |
| (4,738) |
Gross Operating Income (EBITDA) | 18,550 | 12,182 | (6,368) | (34.3%) |
| 25,614 |
Depreciation and Amortization | (1,591) | (1,413) | 179 | 11.2% |
| (2,970) |
Operating Income | 16,958 | 10,769 | (6,189) | (36.5%) |
| 22,644 |
Figures may differ from those accounted under Argentine GAAP. |
|
|
|
|
| |
|
|
|
|
|
|
|
Table 13.1 |
|
|
|
|
|
|
El Chocón | 1H 2010 | 1H 2011 | Var 2010-2011 | Chg% |
|
|
GWh Produced | 1,533 | 1,132 | (400) | (26.1%) |
|
|
GWh Sold | 1,704 | 1,395 | (309) | (18.1%) |
|
|
Market Share | 3.1% | 2.4% | (0.7) pp. |
|
|
|
Pg. 31
| | PRESS RELEASE |
Distribution
Edesur
Operating income decreased Ch$ 19,735 million, mainly due to a 4.2% lower purchase/sales margin measured in Argentine pesos, which was partially offset by a 3.1% increase in physical sales.
On the other hand, operational costs increased by Ch$ 10,563 million due to higher personnel expenses, as a result of wage increases under collective agreements. Energy losses remained at 10.5%.
The net effect of translating the financial statements from the Argentine peso to Chilean pesos in both periods was negative, resulting in a 12.2% decrease in Chilean pesos as of June 2011.
Table 14 |
|
|
|
|
|
|
Edesur | Million Ch$ |
|
| Thousand US$ | ||
| 1H 2010 | 1H 2011 | Var 2010-2011 | Chg% |
| 1H 2011 |
Operating Revenues | 151,683 | 139,425 | (12,258) | (8.1%) |
| 293,167 |
Procurement and Services | (73,295) | (69,645) | 3,650 | 5.0% |
| (146,443) |
Contribution Margin | 78,388 | 69,779 | (8,609) | (11.0%) |
| 146,725 |
Other Costs | (58,713) | (70,684) | (11,971) | (20.4%) |
| (148,627) |
Gross Operating Income (EBITDA) | 19,674 | (905) | (20,579) | (104.6%) |
| (1,903) |
Depreciation and Amortization | (8,171) | (7,327) | 844 | 10.3% |
| (15,407) |
Operating Income | 11,503 | (8,232) | (19,735) | (171.6%) |
| (17,309) |
Figures may differ from those accounted under Argentine GAAP. |
|
|
|
|
| |
|
|
|
|
|
|
|
Table 14.1 |
|
|
|
|
|
|
Edesur | 1H 2010 | 1H 2011 | Var 2010-2011 | Chg% |
| |
Customers (Th) | 2,367 | 2,366 | (1) | (0.0%) |
|
|
GWh Sold | 8,279 | 8,539 | 260 | 3.1% |
|
|
Clients/ Employee | 896 | 870 | (26) | (2.9%) |
|
|
Energy Losses (%) | 10.5% | 10.5% | 0.0% |
|
|
|
Pg. 32
| | PRESS RELEASE |
Brazil

Endesa Brasil
The operating income in Brazil amounted to Ch$ 272,235 million, 8.2 % higher than the Ch$ 251,637 million reported as of June 30, 2010.
Table 15 |
|
|
|
|
|
|
Endesa Brasil | (Million Ch$) |
|
| (Thousand US$) | ||
| 1H 2010 | 1H 2011 | Var 2010-2011 | Chg % |
| 1H 2011 |
Total Revenues | 1,038,180 | 1,068,338 | 30,158 | 2.9% |
| 2,246,391 |
Procurements and Services | (570,995) | (601,757) | (30,762) | (5.4%) |
| (1,265,312) |
Contribution Margin | 467,185 | 466,581 | (604) | (0.1%) |
| 981,079 |
Other Costs | (131,762) | (153,338) | (21,577) | (16.4%) |
| (322,424) |
Gross Operating Income (EBITDA) | 335,424 | 313,243 | (22,181) | (6.6%) |
| 658,655 |
Depreciation and Amortization | (83,787) | (41,008) | 42,779 | 51.1% |
| (86,228) |
Operating Income | 251,637 | 272,235 | 20,598 | 8.2% |
| 572,427 |
Net Financial Income | (45,223) | (27,350) | 17,873 | 39.5% |
| (57,509) |
Financial income | 49,911 | 69,186 | 19,275 | 38.6% |
| 145,477 |
Financial expenses | (98,731) | (98,223) | 509 | 0.5% |
| (206,533) |
Income (Loss) for indexed assets and liabilities | - | - | - |
|
| - |
Foreign currency exchange differences, net | 3,598 | 1,687 | (1,911) | (53.1%) |
| 3,547 |
Gains | 21,090 | 5,047 | (16,043) | (76.1%) |
| 10,612 |
Losses | (17,492) | (3,360) | 14,132 | 80.8% |
| (7,065) |
Net Income from Related Comp. Cons. by the Prop. Eq.Method | - | - | - |
|
| - |
Net Income from Other Investments | - | - | - |
|
| - |
Net Income from Sales of Assets | 97 | - | (97) | (100.0%) |
| - |
Net Income before Taxes | 206,511 | 244,885 | 38,374 | 18.6% |
| 514,919 |
Income Tax | (46,419) | (52,735) | (6,317) | (13.6%) |
| (110,886) |
NET INCOME | 160,092 | 192,150 | 32,057 | 20.0% |
| 404,032 |
Net Income Attributable to Owners of the Company | 100,400 | 129,481 | 29,080 | 29.0% |
| 272,259 |
Net Income Attributable to Minority Interest | 59,692 | 62,669 | 2,977 | 5.0% |
| 131,774 |
Generation
Cachoeira
The operating income rose by Ch$ 6,664 million, amounting to Ch$ 39,879 million in June 2011. The latter is the outcome of a 20.6% increase on average prices measured in local currency, fully offsetting a 7.0% decrease in physical sales.
The net effect of translating the financial statements from the Brazilian real to the Chilean pesos in both periods was positive, resulting in a 0.1% increase in Chilean pesos as of June 2011.
Table 16 |
|
|
|
|
|
|
Cachoeira | Million Ch$ |
|
| Thousand US$ | ||
| 1H 2010 | 1H 2011 | Var 2010-2011 | Chg% |
| 1H 2011 |
Operating Revenues | 52,876 | 59,300 | 6,424 | 12.1% |
| 124,690 |
Procurement and Services | (12,850) | (12,608) | 242 | 1.9% |
| (26,511) |
Contribution Margin | 40,026 | 46,692 | 6,667 | 16.7% |
| 98,180 |
Other Costs | (3,268) | (2,982) | 285 | 8.7% |
| (6,271) |
Gross Operating Income (EBITDA) | 36,758 | 43,710 | 6,952 | 18.9% |
| 91,909 |
Depreciation and Amortization | (3,543) | (3,831) | (288) | (8.1%) |
| (8,056) |
Operating Income | 33,215 | 39,879 | 6,664 | 20.1% |
| 83,853 |
Figures may differ from those accounted under Brazilian GAAP. |
|
|
|
|
| |
|
|
|
|
|
|
|
Table 16.1 |
|
|
|
|
|
|
Cachoeira | 1H 2010 | 1H 2011 | Var 2010-2011 | Chg% |
| |
GWh Produced | 1,525 | 1,137 | (388) | (25.4%) |
|
|
GWh Sold | 1,926 | 1,792 | (134) | (7.0%) |
|
|
Market Share | 1.0% | 0.9% | (0.1) pp. |
|
|
|
Pg. 33
| | PRESS RELEASE |
Fortaleza (cgtf)
The operating income decreased by Ch$ 7,465 million, amounting to Ch$ 23,819 when compared to the same period of 2010. This decrease is primarily the result of lower average prices and lower physical sales reaching to 1,334 GWh in June 2011.
The net effect of translating the financial statements from the Brazilian real to the Chilean pesos in both periods was negative, resulting in a 0.1% decrease in Chilean pesos as of June 2011.
Table 17 |
|
|
|
|
|
|
Fortaleza | Million Ch$ |
|
| Thousand US$ | ||
| 1H 2010 | 1H 2011 | Var 2010-2011 | Chg% |
| 1H 2011 |
Operating Revenues | 68,966 | 61,169 | (7,797) | (11.3%) |
| 128,620 |
Procurement and Services | (30,115) | (29,440) | 674 | 2.2% |
| (61,904) |
Contribution Margin | 38,851 | 31,729 | (7,122) | (18.3%) |
| 66,715 |
Other Costs | (3,556) | (3,822) | (266) | (7.5%) |
| (8,036) |
Gross Operating Income (EBITDA) | 35,295 | 27,907 | (7,389) | (20.9%) |
| 58,679 |
Depreciation and Amortization | (4,011) | (4,087) | (77) | (1.9%) |
| (8,595) |
Operating Income | 31,285 | 23,819 | (7,465) | (23.9%) |
| 50,085 |
Figures may differ from those accounted under Brazilian GAAP. |
|
|
|
|
| |
|
|
|
|
|
|
|
Table 17.1 |
|
|
|
|
|
|
Fortaleza | 1H 2010 | 1H 2011 | Var 2010-2011 | Chg% |
| |
GWh Produced | 450 | 215 | (235) | (52.2%) |
|
|
GWh Sold | 1,381 | 1,334 | (47) | (3.4%) |
|
|
Market Share | 0.7% | 0.7% | (0.0) pp. |
|
|
|
Transmission
CIEN
CIEN recorded an operating income of Ch$ 28,119 million, which represents an increase of Ch$ 36,142 million compared to June, 2010, due to the recognition of CIEN as a regulatory asset by local authorities since April 2011, allowing the billing of tolls according to RAP (permitted annual revenue) system and lower depreciation of fixed assets during this period.
The net effect of translating the financial statements from the Brazilian real to the Chilean pesos in both periods was positive, resulting in a 0.1% increase in Chilean pesos as of June 2011.
Table 18 |
|
|
|
|
|
|
Cien | Million Ch$ |
|
| Thousand US$ | ||
| 1H 2010 | 1H 2011 | Var 2010-2011 | Chg% |
| 1H 2011 |
Operating Revenues | 11,595 | 17,047 | 5,452 | 47.0% |
| 35,844 |
Procurement and Services | 3,538 | (2,591) | (6,129) | (173.2%) |
| (5,447) |
Contribution Margin | 15,133 | 14,456 | (677) | (4.5%) |
| 30,396 |
Other Costs | (6,180) | (3,526) | 2,655 | 43.0% |
| (7,413) |
Gross Operating Income (EBITDA) | 8,952 | 10,930 | 1,978 | 22.1% |
| 22,983 |
Depreciation and Amortization | (16,976) | 17,188 | 34,164 | 201.2% |
| 36,141 |
Operating Income | (8,024) | 28,119 | 36,142 | 450.4% |
| 59,125 |
Figures may differ from those accounted under Brazilian GAAP. |
|
|
|
|
| |
Pg. 34
| | PRESS RELEASE |
Distribution
Ampla
Operating income amounted to Ch$ 97,707 million, a 4.7% decrease when compared to first semester 2010. The decrease is mostly explained by a lower purchase/sales margin in local currency of 3.4% and higher operating costs, especially related to external services. The above was partially offset by a 5.1% increase in sales volume that reached 5,217 GWh as of June 2011 and lower cost of depreciation, amortization and impairment by CH$ 10,882.
Energy losses decreased 1.4pp to 19.9%.The customer base increased by 70,000 new clients, to a total exceeding 2.6 million clients.
The net effect of translating the financial statements from the Brazilian real to the Chilean pesos in both periods was negative, resulting in a 0.1% decrease in Chilean pesos as of June 2011.
Table 19 |
|
|
|
|
|
|
Ampla | Million Ch$ |
|
| Thousand US$ | ||
| 1H 2010 | 1H 2011 | Var 2010-2011 | Chg% |
| 1H 2011 |
Operating Revenues | 529,347 | 561,888 | 32,541 | 6.1% |
| 1,181,479 |
Procurement and Services | (320,756) | (367,915) | (47,159) | (14.7%) |
| (773,614) |
Contribution Margin | 208,591 | 193,973 | (14,618) | (7.0%) |
| 407,866 |
Other Costs | (65,709) | (66,744) | (1,035) | (1.6%) |
| (140,342) |
Gross Operating Income (EBITDA) | 142,881 | 127,229 | (15,652) | (11.0%) |
| 267,524 |
Depreciation and Amortization | (40,404) | (29,522) | 10,882 | 26.9% |
| (62,077) |
Operating Income | 102,477 | 97,707 | (4,771) | (4.7%) |
| 205,447 |
Figures may differ from those accounted under Brazilian GAAP. |
|
|
|
|
| |
|
|
|
|
|
|
|
Table 19.1 |
|
|
|
|
|
|
Ampla | 1H 2010 | 1H 2011 | Var 2010-2011 | Chg% |
|
|
Customers (Th) | 2,535 | 2,605 | 70 | 2.8% |
|
|
GWh Sold | 4,965 | 5,217 | 253 | 5.1% |
|
|
Clients/Employee | 2,080 | 2,158 | 78 | 3.8% |
|
|
Energy Losses % | 21.3% | 19.9% | (1.4) pp. |
|
|
|
Pg. 35
| | PRESS RELEASE |
Coelce
Operating income amounted to Ch$ 88,680 million, showing a decrease of 8.5% when compared to first semester 2010. The result is explained by a lower purchase/sales margin by 2.6% and a 0.6% decrease in physical sales.
Energy losses reached 11.9%.The customer base increased by 130,000 new clients, to a total exceeding 3.1 million.
The net effect of translating the financial statements from the Brazilian real to the Chilean pesos in both periods was negative, resulting in a 0.1% decrease in Chilean pesos as of June 2011.
Table 20 |
|
|
|
|
|
|
Coelce | Million Ch$ |
|
| Thousand US$ | ||
| 1H 2010 | 1H 2011 | Var 2010-2011 | Chg% |
| 1H 2011 |
Operating Revenues | 442,553 | 427,438 | (15,115) | (3.4%) |
| 898,772 |
Procurement and Services | (277,968) | (273,795) | 4,173 | 1.5% |
| (575,708) |
Contribution Margin | 164,586 | 153,643 | (10,943) | (6.6%) |
| 323,064 |
Other Costs | (48,927) | (44,385) | 4,542 | 9.3% |
| (93,329) |
Gross Operating Income (EBITDA) | 115,658 | 109,258 | (6,401) | (5.5%) |
| 229,736 |
Depreciation and Amortization | (18,701) | (20,578) | (1,877) | (10.0%) |
| (43,268) |
Operating Income | 96,958 | 88,680 | (8,278) | (8.5%) |
| 186,467 |
Figures may differ from those accounted under Brazilian GAAP. |
|
|
|
|
| |
|
|
|
|
|
|
|
Table 20.1 |
|
|
|
|
|
|
Coelce | 1H 2010 | 1H 2011 | Var 2010-2011 | Chg% |
|
|
Customers (Th) | 3,026 | 3,157 | 130 | 4.3% |
|
|
GWh Sold | 4,284 | 4,257 | (28) | (0.6%) |
|
|
Clients/Employee | 2,366 | 2,457 | 91 | 3.8% |
|
|
Energy Losses % | 11.9% | 11.9% | 0.1 pp. |
|
|
|
Pg. 36
| | PRESS RELEASE |
Chile

Generation
Endesa Chile
Consolidated Income Statement of Endesa Chile
Table 21 |
|
|
|
|
|
|
Endesa Chile | (Million Ch$) |
|
| (Thousand US$) | ||
| 1H 2010 | 1H 2011 | Var 2010-2011 | Chg % |
| 1H 2011 |
Total Revenues | 1,178,571 | 1,176,178 | (2,394) | (0.2%) |
| 2,473,144 |
Procurements and Services | (585,969) | (671,445) | (85,476) | (14.6%) |
| (1,411,845) |
Contribution Margin | 592,603 | 504,733 | (87,870) | (14.8%) |
| 1,061,299 |
Other Costs | (88,861) | (117,136) | (28,275) | (31.8%) |
| (246,301) |
Gross Operating Income (EBITDA) | 503,742 | 387,597 | (116,145) | (23.1%) |
| 814,998 |
Depreciation and Amortization | (101,230) | (84,976) | 16,254 | 16.1% |
| (178,678) |
Operating Income | 402,512 | 302,621 | (99,891) | (24.8%) |
| 636,320 |
Net Financial Income | (57,056) | (62,278) | (5,222) | (9.2%) |
| (130,952) |
Financial income | 7,807 | 8,336 | 529 | 6.8% |
| 17,528 |
Financial expenses | (74,133) | (67,476) | 6,657 | 9.0% |
| (141,881) |
Income (Loss) for indexed assets and liabilities | (2,099) | (2,939) | (840) | (40.0%) |
| (6,181) |
Foreign currency exchange differences, net | 11,369 | (198) | (11,567) | (101.7%) |
| (417) |
Gains | 22,504 | 9,544 | (12,960) | (57.6%) |
| 20,068 |
Losses | (11,136) | (9,742) | 1,393 | 12.5% |
| (20,485) |
Net Income from Related Comp. Cons. by the Prop. Eq.Method | 41,100 | 56,656 | 15,555 | 37.8% |
| 119,129 |
Net Income from Other Investments | (0) | 182 | 182 | 138877.9% |
| 382 |
Net Income from Sales of Assets | 92 | 542 | 450 | 488.1% |
| 1,140 |
Net Income before Taxes | 386,649 | 297,723 | (88,926) | (23.0%) |
| 626,020 |
Income Tax | (107,374) | (85,950) | 21,423 | 20.0% |
| (180,728) |
NET INCOME | 279,275 | 211,772 | (67,502) | (24.2%) |
| 445,293 |
Net Income Attributable to Owners of the Company | 208,535 | 161,726 | (46,809) | (22.4%) |
| 340,061 |
Net Income Attributable to Minority Interest | 70,740 | 50,046 | (20,694) | (29.3%) |
| 105,231 |
*Includes generation subsidiaries in Chile, Argentina, Colombia and Peru.
Chilean Operations
Operating income in Chile amounted to Ch$ 125,280 million, 43.1% lower than the same period in 2010 mainly explained by an increase in Ch$ 95,419 million or 30.8% in procurements and services costs, due to higher costs for energy purchases during this period.
Operating revenues decreased by Ch$ 5,785 million due to physical sales fell by 3.3% to 10,168.9 GWh, due to the reduced availability hydraulic resulted in lower spot market sales partially offset by an increase of 4.9% in average selling price of energy.
Table 22 |
|
|
|
|
|
|
Chilean Electricity Business | Million Ch$ |
|
| Thousand US$ | ||
| 1H 2010 | 1H 2011 | Var 2010-2011 | Chg% |
| 1H 2011 |
Operating Revenues | 620,971 | 615,186 | (5,785) | (0.9%) |
| 1,293,550 |
Procurement and Services | (310,108) | (405,528) | (95,419) | (30.8%) |
| (852,701) |
Contribution Margin | 310,863 | 209,659 | (101,204) | (32.6%) |
| 440,849 |
Other Costs | (40,855) | (43,170) | (2,315) | (5.7%) |
| (90,774) |
Gross Operating Income (EBITDA) | 270,008 | 166,489 | (103,519) | (38.3%) |
| 350,075 |
Depreciation and Amortization | (49,818) | (41,208) | 8,610 | 17.3% |
| (86,648) |
Operating Income | 220,190 | 125,280 | (94,909) | (43.1%) |
| 263,427 |
|
|
|
|
|
|
|
|
|
|
|
|
|
|
Table 22.1 |
|
|
|
|
|
|
Chilean Electricity Business | 1H 2010 | 1H 2011 | Var 2010-2011 | Chg% |
|
|
GWh Produced | 10,140 | 9,188 | (952) | (9.4%) |
|
|
GWh Sold | 10,517 | 10,169 | (348) | (3.3%) |
|
|
Market Share | 39.9% | 35.4% | (4.5) pp. |
|
|
|
Pg. 37
| | PRESS RELEASE |
Distribution
Chilectra
Operating income amounted to Ch$ 63,782 million, showing an increase of 34.4% when compared to the period ended on June 30, 2010. The increase is explained mainly due to better sales margin related to electricity business line and other businesses by Ch$1,372, associated to a higher demand during the first semester compared to 2010. The latter was partially offset by Ch$ 2,238 million higher in personnel expenses due to increase in variable remuneration.
Energy losses reached 5.6%. The customer base increased by 22,000 new clients, reaching 1.6 million clients served in the concession area.
Table 23 |
|
|
|
|
|
|
Chilectra | (Million Ch$) |
|
| (Thousand US$) | ||
| 1H 2010 | 1H 2011 | Var 2010-2011 | Chg % |
| 1H 2011 |
Sales | 436,676 | 498,381 | 61,706 | 14.1% |
| 1,047,944 |
Other operating income | 4,347 | 5,833 | 1,485 | 34.2% |
| 12,264 |
Total Revenues | 441,023 | 504,214 | 63,191 | 14.3% |
| 1,060,209 |
Procurements and Services | (334,936) | (382,130) | (47,194) | (14.1%) |
| (803,502) |
Contribution Margin | 106,088 | 122,085 | 15,997 | 15.1% |
| 256,707 |
Other Costs | (43,746) | (43,618) | 127 | 0.3% |
| (91,716) |
Gross Operating Income (EBITDA) | 62,342 | 78,466 | 16,124 | 25.9% |
| 164,991 |
Depreciation and Amortization | (14,884) | (14,684) | 200 | 1.3% |
| (30,876) |
Operating Income | 47,458 | 63,782 | 16,324 | 34.4% |
| 134,115 |
Net Financial Income | 153 | 5,073 | 4,921 | 3221.2% |
| 10,668 |
Financial income | 4,617 | 8,620 | 4,003 | 86.7% |
| 18,124 |
Financial expenses | (4,413) | (3,556) | 857 | 19.4% |
| (7,477) |
Income (Loss) for indexed assets and liabilities | 531 | 97 | (434) | (81.7%) |
| 204 |
Foreign currency exchange differences, net | (582) | (87) | 494 | 85.0% |
| (184) |
Gains | 565 | 623 | 58 | 10.2% |
| 1,309 |
Losses | (1,147) | (710) | 437 | 38.1% |
| (1,493) |
Net Income from Related Comp. Cons. by the Prop. Eq.Method | 36,811 | 34,808 | (2,003) | (5.4%) |
| 73,191 |
Net Income from Other Investments | - | - | - |
|
| - |
Net Income from Sales of Assets | (44) | 2 | 46 | 104.6% |
| 4 |
Net Income before Taxes | 84,378 | 103,666 | 19,287 | 22.9% |
| 217,978 |
Income Tax | (19,774) | (11,200) | 8,574 | 43.4% |
| (23,551) |
NET INCOME | 64,604 | 92,466 | 27,862 | 43.1% |
| 194,427 |
Net Income Attributable to Owners of the Company | 64,604 | 92,465 | 27,861 | 43.1% |
| 194,427 |
Net Income Attributable to Minority Interest | 0 | 0 | 0 |
|
| 0 |
Table 23.1 |
|
|
|
|
Chilectra | 1H 2010 | 1H 2011 | Var 2010-2011 | Chg% |
Customers (Th) | 1,598 | 1,620 | 22 | 1.4% |
GWh Sold | 6,307 | 6,726 | 419 | 6.6% |
Clients/ Employee | 2,180 | 2,241 | 61 | 2.8% |
Energy Losses (%) | 6.1% | 5.6% | (0.4) pp. |
|
Pg. 38
| | PRESS RELEASE |
Colombia
Generation
Emgesa
The Operating income amounted Ch$ 98,836 million, 15.4% lower when compared to first half 2010. This result is mainly explained by the non-recurring effect of the government reform on the equity tax, which implied recording on January1, 2011.The entire tax is payable throughout the 2011-2014 period, including a surcharge of 25% in equity tax of 4.8% to 6.0% over net equity as of 1st January 2010. This situation affected the operating income in Ch $ 39,713 million.
Additionally sales revenues decreased by Ch $ 32,115 million, mainly due to a reduction in the average price in local currency.
On the other hand, physical sales increase 1.2% due to a 21.8% increased hydroelectric generation in the period. The latter produced a positive impact on energy purchase costs and fuel consumption, which decreased by Ch $ 39,605 million and Ch $ 12,856 million, respectively.
The net effect of translating the financial statements from the Colombian peso to the Chilean pesos in both periods was negative, resulting in a 3.8% decrease in Chilean pesos as of June 2011.
Table 24 |
|
|
|
|
|
|
Emgesa | Million Ch$ |
|
| Thousand US$ | ||
| 1H 2010 | 1H 2011 | Var 2010-2011 | Chg% |
| 1H 2011 |
Operating Revenues | 264,343 | 232,228 | (32,116) | (12.1%) |
| 488,304 |
Procurement and Services | (110,319) | (59,460) | 50,858 | 46.1% |
| (125,027) |
Contribution Margin | 154,024 | 172,767 | 18,743 | 12.2% |
| 363,277 |
Other Costs | (16,585) | (56,783) | (40,199) | (242.4%) |
| (119,398) |
Gross Operating Income (EBITDA) | 137,440 | 115,984 | (21,456) | (15.6%) |
| 243,879 |
Depreciation and Amortization | (20,565) | (17,148) | 3,417 | 16.6% |
| (36,056) |
Operating Income | 116,875 | 98,836 | (18,039) | (15.4%) |
| 207,823 |
Figures may differ from those accounted under Colombian GAAP. |
|
|
|
|
| |
|
|
|
|
|
|
|
Table 24.1 |
|
|
|
|
|
|
Emgesa | 1H 2010 | 1H 2011 | Var 2010-2011 | Chg% |
|
|
GWh Produced | 5,098 | 5,510 | 411 | 8.1% |
|
|
GWh Sold | 7,138 | 7,224 | 86 | 1.2% |
|
|
Market Share | 17.7% | 18.6% | 0.9 pp. |
|
|
|
Pg. 39
| | PRESS RELEASE |
Distribution
Codensa
Operating income amounted Ch$ 72,320 million, representing a decrease of 23.8% when compared to first semester 2010. This result is mainly explained by the non-recurring effect of the government reform on the equity tax, which implied recording on January1, 2011.The entire tax is payable throughout the 2011-2014 period, including a surcharge of 25% in equity tax of 4.8% to 6.0% over net equity as of 1st January 2011,affecting the operating income by Ch$ 19.348 million. The higher tax expense is partially offset by a greater energy sales margin in local currency and increased physical sales by 2.9% to 6,305 GWh in this period.
Energy losses reached 8.3%.The customer base increased by 74,000 new clients to a total exceeding 2.6 million.
The net effect of translating the financial statements from the Colombian peso to the Chilean pesos in both periods was negative, resulting in a 3.8% decrease in Chilean pesos as of June 2011.
Table 25 |
|
|
|
|
|
|
Codensa | Million Ch$ |
|
| Thousand US$ | ||
| 1H 2010 | 1H 2011 | Var 2010-2011 | Chg% |
| 1H 2011 |
Operating Revenues | 386,896 | 388,119 | 1,223 | 0.3% |
| 816,096 |
Procurement and Services | (215,407) | (215,550) | (143) | (0.1%) |
| (453,235) |
Contribution Margin | 171,489 | 172,569 | 1,080 | 0.6% |
| 362,860 |
Other Costs | (45,599) | (68,251) | (22,652) | (49.7%) |
| (143,510) |
Gross Operating Income (EBITDA) | 125,890 | 104,318 | (21,571) | (17.1%) |
| 219,350 |
Depreciation and Amortization | (30,951) | (31,998) | (1,047) | (3.4%) |
| (67,282) |
Operating Income | 94,939 | 72,320 | (22,619) | (23.8%) |
| 152,068 |
Figures may differ from those accounted under Colombian GAAP. |
|
|
|
|
| |
|
|
|
|
|
|
|
Table 25.1 |
|
|
|
|
|
|
Codensa | 1H 2010 | 1H 2011 | Var 2010-2011 | Chg% |
| |
Customers (Th) | 2,506 | 2,580 | 74 | 3.0% |
|
|
GWh Sold | 6,125 | 6,305 | 180 | 2.9% |
|
|
Clients/ Employee | 2,445 | 2,369 | (76) | (3.1%) |
|
|
Energy Losses (%) | 8.5% | 8.3% | (0.2) pp. |
|
|
|
Pg. 40
| | PRESS RELEASE |
Peru

Generation
Edegel
Operating Income amounted Ch$ 57,508 million, an increase of 48.7% with respect to the same period in 2010. This is mainly explained by Ch$ 5,614 million higher in sales revenues from energy sales, which is supported mainly by 14.2% higher sales volumes and Ch$ 13,160 million lower operating expenses.
The net effect of translating the financial statements from the Peruvian sol to Chilean pesos in both periods was negative, resulting in a 7.3% decrease in Chilean pesos as of June 2011.
Table 26 |
|
|
|
|
|
|
Edegel | Million Ch$ |
|
| Thousand US$ | ||
| 1H 2010 | 1H 2011 | Var 2010-2011 | Chg% |
| 1H 2011 |
Operating Revenues | 109,444 | 115,117 | 5,674 | 5.2% |
| 242,057 |
Procurement and Services | (40,057) | (40,721) | (664) | (1.7%) |
| (85,623) |
Contribution Margin | 69,387 | 74,396 | 5,010 | 7.2% |
| 156,433 |
Other Costs | (11,080) | 557 | 11,637 | 105.0% |
| 1,172 |
Gross Operating Income (EBITDA) | 58,307 | 74,954 | 16,647 | 28.6% |
| 157,605 |
Depreciation and Amortization | (19,633) | (17,446) | 2,187 | 11.1% |
| (36,684) |
Operating Income | 38,674 | 57,508 | 18,834 | 48.7% |
| 120,921 |
Figures may differ from those accounted under Peruvian GAAP. |
|
|
|
|
| |
|
|
|
|
|
|
|
Table 26.1 |
|
|
|
|
|
|
Edegel | 1H 2010 | 1H 2011 | Var 2010-2011 | Chg% |
|
|
GWh Produced | 4,101 | 4,657 | 556 | 13.6% |
|
|
GWh Sold | 4,157 | 4,746 | 589 | 14.2% |
|
|
Market Share | 28.6% | 30.0% | 1.4 pp. |
|
|
|
Pg. 41
| | PRESS RELEASE |
Distribution
Edelnor
Operating income amounted Ch$ 38,307 million, representing a 15.8% increase when compared to first semester 2010. This is mainly explained by a 7.9% rose in sales volume reaching 3,276 GWh. The latter was partially offset by a lower purchase/sales margin.
Energy losses reached 8.3%.The customer base increased by 45,000 new clients, to a total exceeding 1.1 million.
The net effect of translating the financial statements from the Peruvian sol to Chilean pesos in both periods was negative, resulting in a 7.3% decrease in Chilean pesos as of June 2011.
Table 27 |
|
|
|
|
|
|
Edelnor | Million Ch$ |
|
| Thousand US$ | ||
| 1H 2010 | 1H 2011 | Var 2010-2011 | Chg% |
| 1H 2011 |
Operating Revenues | 154,874 | 158,417 | 3,543 | 2.3% |
| 333,102 |
Procurement and Services | (94,801) | (97,601) | (2,800) | (3.0%) |
| (205,225) |
Contribution Margin | 60,073 | 60,816 | 743 | 1.2% |
| 127,877 |
Other Costs | (15,887) | (11,833) | 4,054 | 25.5% |
| (24,881) |
Gross Operating Income (EBITDA) | 44,186 | 48,983 | 4,797 | 10.9% |
| 102,996 |
Depreciation and Amortization | (11,116) | (10,676) | 440 | 4.0% |
| (22,449) |
Operating Income | 33,070 | 38,307 | 5,237 | 15.8% |
| 80,547 |
Figures may differ from those accounted under Peruvian GAAP. |
|
|
|
|
| |
|
|
|
|
|
|
|
Table 27.1 |
|
|
|
|
|
|
Edelnor | 1H 2010 | 1H 2011 | Var 2010-2011 | Chg% |
| |
Customers (Th) | 1,076 | 1,121 | 45 | 4.2% |
|
|
GWh Sold | 3,036 | 3,276 | 240 | 7.9% |
|
|
Clients/ Employee | 1,884 | 2,023 | 139 | 7.4% |
|
|
Energy Losses (%) | 8.2% | 8.3% | 0.1 pp. |
|
|
|
Operating Income by Subsidiary
Summary of operating revenues, operating costs (including procurements, services and other costs) and operating income of all Enersis’ subsidiaries, for the period ended in June 30, 2010 and June 30, 2011, detailed as follows:
Table 28 | 1H 2010 | 1H 2011 | ||||
Million Ch$ | Operating Revenues | Operating Costs | Operating Income | Operating Revenues | Operating Costs | Operating Income |
Endesa Chile (*) | 1,178,571 | (776,059) | 402,512 | 1,176,178 | (873,556) | 302,621 |
Cachoeira (**) | 52,876 | (19,661) | 33,215 | 59,300 | (19,421) | 39,879 |
Fortaleza (***) | 68,966 | (37,681) | 31,285 | 61,169 | (37,350) | 23,819 |
Cien (**) | 11,595 | (19,619) | (8,024) | 17,047 | 11,072 | 28,119 |
Chilectra | 441,023 | (393,565) | 47,458 | 504,214 | (440,432) | 63,782 |
Edesur | 151,683 | (140,179) | 11,503 | 139,425 | (147,656) | (8,232) |
Distrilima (Edelnor) | 154,874 | (121,804) | 33,070 | 158,417 | (120,110) | 38,307 |
Ampla | 529,347 | (426,869) | 102,477 | 561,888 | (464,181) | 97,707 |
Coelce | 442,553 | (345,596) | 96,958 | 427,438 | (338,758) | 88,680 |
Codensa | 386,896 | (291,956) | 94,939 | 388,119 | (315,798) | 72,320 |
CAM Ltda. | 54,839 | (56,003) | (1,164) | 15,739 | (17,179) | (1,439) |
Inmobiliaria Manso de Velasco Ltda. | 2,733 | (2,217) | 517 | 2,135 | (2,281) | (146) |
Synapsis Soluciones y Servicios IT Ltda. | 34,805 | (32,913) | 1,892 | 6,693 | (6,556) | 137 |
ICT | - | - | - | 2,647 | (2,598) | 49 |
Enersis Holding and other investment vehicles | 7,380 | (16,623) | (9,243) | 18,237 | (26,091) | (7,855) |
Consolidation Adjustments | (389,686) | 388,643 | (1,044) | (336,923) | 334,240 | (2,683) |
Total Consolidation | 3,128,454 | (2,292,103) | 836,352 | 3,201,722 | (2,466,657) | 735,065 |
Pg. 42
| | PRESS RELEASE |
Table 28.1 | 1H 2011 | ||
Thousand US$ | Operating Revenues | Operating Costs | Operating Income |
Endesa Chile (*) | 2,473,144 | (1,836,823) | 636,320 |
Cachoeira (**) | 124,690 | (40,837) | 83,853 |
Fortaleza (***) | 128,620 | (78,535) | 50,085 |
Cien (**) | 35,844 | 23,281 | 59,125 |
Chilectra | 1,060,209 | (926,094) | 134,115 |
Edesur | 293,167 | (310,477) | (17,309) |
Distrilima (Edelnor) | 333,102 | (252,555) | 80,547 |
Ampla | 1,181,479 | (976,032) | 205,447 |
Investluz (Coelce) | 898,772 | (712,305) | 186,467 |
Codensa | 816,096 | (664,028) | 152,068 |
CAM Ltda. | 33,095 | (36,121) | (3,027) |
Inmobiliaria Manso de Velasco Ltda. | 4,490 | (4,797) | (307) |
Synapsis Soluciones y Servicios IT Ltda. | 14,073 | (13,786) | 288 |
ICT | 5,565 | (5,463) | 102 |
Enersis Holding and other investment vehicles | 38,346 | (54,862) | (16,516) |
Consolidation Adjustments | (708,447) | 702,806 | (5,641) |
Total Consolidation | 6,732,246 | (5,186,629) | 1,545,617 |
(*) Since January 1st, 2009, includes Gas Atacama, Transquillota e HydroAysén
(**) Consolidated by Endesa Chile until September 30th, 2005. Since October 1st, 2005 is
consolidated by Enersis through Endesa Brasil.
(***) Since October 1st, 2005, these subsidiaries are consolidated by Enersis through Endesa Brasil.
Pg. 43
| | PRESS RELEASE |
Ownership of the Company as of June 30, 2011
TOTAL SHAREHOLDERS: 7,541
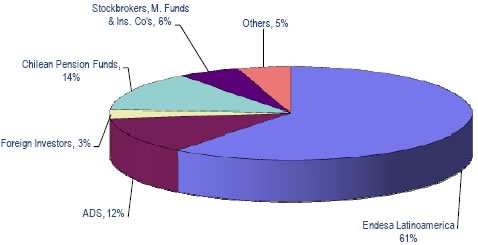
Conference Call Invitation
Enersis is pleased to invite you to participate in aConference Call with the management to review the results for the period, on Friday, July 29th, 2011, 11:00 AM Eastern Time (11:00 AM Chilean Time). There will be a question and answer session following management's comments. Representing Enersis will be Mr. Alfredo Ergas, Chief Financial Officer and the Investor Relations Team.
To participate, please dial+1 (617) 213 4861 or+1 (888) 713 4199 (toll free USA), approximately 10 minutes prior to the scheduled start time,Passcode ID: 87057220.
To access the phone replay, please dial+1 (617) 801 6888 or+1 (888) 286 8010 (toll free USA)Passcode ID: 23357593.
For this Conference Call you can access previously to the pre-registration site at
https://www.theconferencingservice.com/prereg/key.process?key=PJNLXDD8M
and make your registration quicker. If not, please connect approximately 15 minutes prior to the scheduled start time. You can also access to the conference call replay through our Investor Relations website at http://www.enersis.cl.
Pg. 44
| | PRESS RELEASE |
Contact Information
For further information, please contact us:
Ricardo Alvial Investments and Risks Director mlmr@enersis.cl 56 (2) 353 4682 | Denisse Labarca Head of Investor Relations denisse.labarca@enersis.cl 56 (2) 353 4576 |
Carmen Poblete Shares Department Associate cpt@enersis.cl 56 (2) 353 4447 | Nicolás Donoso Investor Relations Associate ndo@enersis.cl 56 (2) 353 4492 | Romina Valderrama Investor Relations Associate rvh@enersis.cl 56 (2) 353 4552 | Melissa Vargas Investor Relations Associate emvb@enersis.cl 56 (2) 353 4555 |
Maria Luz Muñoz
Investor Relations
Assistant
mlmr@enersis.cl
56 (2) 353 4682
Disclaimer
This Press Release contains statements that could constitute forward-looking statements within the meaning of the Private Securities Litigation Reform Act of 1995. These statements appear in a number of places in this announcement and include statements regarding the intent, belief or current expectations of Enersis and its management with respect to, among other things: (1) Enersis’ business plans; (2) Enersis’ cost-reduction plans; (3) trends affecting Enersis’ financial condition or results of operations, including market trends in the electricity sector in Chile or elsewhere; (4) supervision and regulation of the electricity sector in Chile or elsewhere; and (5) the future effect of any changes in the laws and regulations applicable to Enersis’ or its subsidiaries. Such forward-looking statements are not guarantees of future performance and involve risks and uncertainties. Actual results may differ materially from those in the forward-looking statements as a result of various factors. These factors include a decline in the equity capital markets of the United States or Chile, an increase in the market rates of interest in the United States or elsewhere, adverse decisions by government regulators in Chile or elsewhere and other factors described in Enersis’ Annual Report on Form 20-F. Readers are cautioned not to place undue reliance on those forward-looking statements, which state only as of their dates. Enersis undertakes no obligation to release publicly the result of any revisions to these forward-looking statements.
Pg. 45
SIGNATURES
Pursuant to the requirements of the Securities Exchange Act of 1934, as amended, the Registrant has duly caused this report to be signed on its behalf by the undersigned, thereunto duly authorized.
| ENERSIS S.A. | |
| By: /s/ Ignacio Antoñanzas Alvear | |
| -------------------------------------------------- | |
| Title: Chief Executive Officer |
Date: July 28, 2011