United States
Securities and Exchange Commission
Washington, D.C. 20549
Form N-CSR
Certified Shareholder Report of Registered Management Investment Companies
811-8042
(Investment Company Act File Number)
Federated Insurance Series
_______________________________________________________________
(Exact Name of Registrant as Specified in Charter)
Federated Investors Funds
4000 Ericsson Drive
Warrendale, Pennsylvania 15086-7561
(Address of Principal Executive Offices)
(412) 288-1900
(Registrant's Telephone Number)
John W. McGonigle, Esquire
Federated Investors Tower
1001 Liberty Avenue
Pittsburgh, Pennsylvania 15222-3779
(Name and Address of Agent for Service)
(Notices should be sent to the Agent for Service)
Date of Fiscal Year End: 12/31/15
Date of Reporting Period: 12/31/15
Item 1. Reports to Stockholders

| Share Class |
| Primary |
| Service |

| 1 | Please see the footnotes to the line graphs under “Fund Performance and Growth of a $10,000 Investment” below for the definition of, and more information about, the S&P 500. |
| 2 | Please see the footnotes to the line graphs under “Fund Performance and Growth of a $10,000 Investment” below for the definition of, and more information about, the Blended Index (60% MSCI ACWI and 40% BUSUI). The Blended Index is being used for comparison purposes because, although it is not the Fund's broad-based securities market index, the Fund's Adviser believes it more closely reflects the market sectors in which the Fund invests. |
| 3 | The MSCI EAFE Index is an equity index which captures large- and mid-cap representation across developed markets countries around the world, excluding the United States and Canada. With 906 constituents, the index covers approximately 85% of the free float-adjusted market capitalization in each country. The index is unmanaged, and it is not possible to invest directly in an index. |
| 4 | The Barclays U.S. Aggregate Bond Index measures the investment grade, U.S. dollar-denominated, fixed-rate taxable bond market, including Treasuries, government-related and corporate securities, mortgage-backed securities (agency fixed-rate and hybrid ARM pass-throughs), asset-backed securities and commercial mortgage-backed securities. The index is unmanaged, and it is not possible to invest directly in an index. |
| 5 | The DBIQ Optimum Yield Diversified Commodity Index is based on 14 commodities drawn from the energy, precious metals, industrial metals and agriculture sectors. The index is unmanaged, and it is not possible to invest directly in an index. |
| 6 | The Barclays U.S. TIPS Index represents a market index made up of U.S. TIPS. The index is unmanaged, and it is not possible to invest directly in an index. |
| 7 | Volatility is a statistical measurement of the frequency and level of changes in the value of an asset, index or instrument without regard to the direction of those changes. Volatility may result from rapid and dramatic price swings. |
| 8 | The CBOE Volatility Index (VIX) is a key measure of market expectations of near-term volatility conveyed by S&P 500 stock index option prices. The index is unmanaged, and it is not possible to invest directly in an index. |
| 9 | Diversification does not assure a profit nor protect against loss. |
| 10 | Bond prices are sensitive to changes in interest rates, and a rise in interest rates can cause a decline in their prices. |
| 11 | International investing involves special risks including currency risk, increased volatility, political risks and differences in auditing and other financial standards. Prices of emerging markets securities can be significantly more volatile than the prices of securities in developed countries and currency risk and political risks are accentuated in emerging markets. |
| 12 | The Fund's use of derivative instruments involves risks different from, or possibly greater than, the risks associated with investing directly in securities and other traditional instruments. |
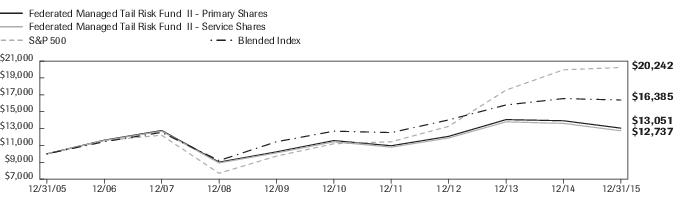
| Federated Managed Tail Risk Fund II - | Primary Shares | Service Shares | NA | S&P 500 | Blended Index |
| F | F | NA | I | I | |
| 12/31/2005 | 10,000 | 10,000 | 10,000 | 10,000 | |
| 12/31/2006 | 11,621 | 11,578 | 11,579 | 11,439 | |
| 12/31/2007 | 12,769 | 12,694 | 12,216 | 12,550 | |
| 12/31/2008 | 9,020 | 8,928 | 7,696 | 9,205 | |
| 12/31/2009 | 10,235 | 10,113 | 9,733 | 11,435 | |
| 12/31/2010 | 11,574 | 11,428 | 11,199 | 12,692 | |
| 12/31/2011 | 10,961 | 10,799 | 11,435 | 12,523 | |
| 12/31/2012 | 12,076 | 11,882 | 13,265 | 14,029 | |
| 12/31/2013 | 14,063 | 13,796 | 17,562 | 15,800 | |
| 12/31/2014 | 13,927 | 13,613 | 19,966 | 16,558 | |
| 12/31/2015 | 13,051 | 12,737 | 20,242 | 16,385 |
| 1 Year | 5 Years | 10 Years | |
| Primary Shares | -6.29% | 2.43% | 2.70% |
| Service Shares | -6.43% | 2.19% | 2.45% |
| S&P 500 | 1.38% | 12.57% | 7.31% |
| Blended Index | -1.04% | 5.24% | 5.06% |
| 1 | The Fund's performance assumes the reinvestment of all dividends and distributions. The S&P 500, the MSCI ACWI and the BUSUI have been adjusted to reflect reinvestment of dividends on securities in the index. |
| The S&P 500 is a capitalization-weighted index of 500 stocks designed to measure performance of the broad domestic economy through changes in the aggregate market value of 500 stocks representing all major industries. The index is not adjusted to reflect sales loads, expenses or other fees that the Securities and Exchange Commission (SEC) requires to be reflected in the Fund's performance. The index is unmanaged and, unlike the Fund, is not affected by cash flows. It is not possible to invest directly in an index. | 2 |
| The MSCI ACWI captures large- and mid-cap representation across 23 developed markets and 23 emerging markets countries. The index covers approximately 85% of the global investable equity opportunity set. The BUSUI covers USD-denominated taxable bonds that are rated either investment-grade or high-yield. The indexes are not adjusted to reflect sales loads, expenses or other fees that the SEC requires to be reflected in the Fund's performance. The indexes are unmanaged and, unlike the Fund, are not affected by cash flows. It is not possible to invest directly in an index. | 3 |
| Sector | Percentage of Total Net Assets |
| Securities Sold Short | (3.3)% |
| Derivative Contracts—Short (notional value)2 | (2.9)% |
| Domestic Equity Securities | 38.4% |
| International Equity Securities | 23.7% |
| U.S. Treasury Securities | 6.8% |
| Trade Finance Agreements | 5.4% |
| Domestic Fixed-Income Securities | 5.0% |
| U.S. Government Agency Mortgage-Backed Securities | 1.5% |
| International Fixed-Income Securities | 1.0% |
| Non-Agency Mortgage-Backed Securities | 0.4% |
| Asset-Backed Securities | 0.3% |
| Floating Rate Loan | 0.2% |
| Foreign Governments/Agencies | 0.2% |
| Adjustment for Derivative Contracts (notional value)2 | 2.9% |
| Derivative Contracts3,4 | 0.0% |
| Other Security Types5 | 5.7% |
| Cash Equivalents6 | 10.9% |
| Other Assets and Liabilities—Net7 | 3.8% |
| TOTAL | 100.0% |
| 1 | See the Fund's Prospectus for a description of the principal types of securities in which the Fund invests. As of the date specified above, the Fund owned shares of one or more affiliated investment companies. For purposes of this table, the affiliated investment company (other than an affiliated money market mutual fund) is not treated as a single portfolio security, but rather the Fund is treated as owning a pro rata portion of each security and each other asset and liability owned by the affiliated investment company. Accordingly, the percentages of total net assets shown in the table will differ from those presented on the Portfolio of Investments. |
| 2 | Represents the notional value of S&P 500 futures contracts held by the Federated Prudent Bear Fund and Federated Absolute Return Fund. |
| 3 | Based upon net unrealized appreciation (depreciation) or value of the derivative contracts as applicable. Derivative contracts may consist of futures, forwards, options and swaps. The impact of a derivative contract on the Fund's performance may be larger than its unrealized appreciation (depreciation) or value may indicate. In many cases, the notional value or amount of a derivative contract may provide a better indication of the contract's significance to the portfolio. More complete information regarding the Fund's direct investments in derivative contracts, including unrealized appreciation (depreciation), value, and notional values or amounts of such contracts, can be found in the table at the end of the Portfolio of Investments included in this Report. |
| 4 | Represents less than 0.1%. |
| 5 | Other Security Types consist of exchange-traded funds and purchased options. |
| 6 | Cash Equivalents include any investments in money market mutual funds and/or overnight repurchase agreements. |
| 7 | Assets, other than investments in securities and derivative contracts, less liabilities. See Statement of Assets and Liabilities. |
| Shares, Contracts or Principal Amount | Value | ||
| INVESTMENT COMPANIES—84.3%1 | |||
| 14,715 | Emerging Markets Fixed Income Core Fund | $496,757 | |
| 1,634,101 | Federated Absolute Return Fund, Institutional Shares | 16,749,537 | |
| 42,894 | Federated Bank Loan Core Fund | 416,070 | |
| 931,097 | Federated Clover Small Value Fund, Institutional Shares | 21,219,690 | |
| 360,692 | Federated Emerging Markets Equity Fund, Institutional Shares | 2,784,539 | |
| 1,102,122 | Federated Equity Income Fund, Inc., Institutional Shares | 24,114,435 | |
| 292,664 | Federated InterContinental Fund, Institutional Shares | 13,676,176 | |
| 994,351 | Federated Intermediate Corporate Bond Fund, Institutional Shares | 9,098,314 | |
| 423,226 | Federated International Leaders Fund, Class R6 Shares | 13,060,753 | |
| 3,721,372 | Federated International Strategic Value Dividend Fund, Institutional Shares | 13,062,015 | |
| 1,230,822 | Federated Kaufmann Large Cap Fund, Class R6 Shares | 23,213,304 | |
| 384,638 | Federated Mortgage Core Portfolio | 3,788,683 | |
| 1,381,721 | Federated Project and Trade Finance Core Fund | 12,919,089 | |
| 3,801,433 | Federated Prudent Bear Fund, Institutional Shares | 8,287,124 | |
| 2,447,987 | Federated Strategic Value Dividend Fund, Institutional Shares | 13,806,645 | |
| 968 | Federated U.S. Gov't Securities Fund 2-5 Years, Institutional Shares | 10,567 | |
| 289,163 | High Yield Bond Portfolio | 1,682,926 | |
| TOTAL INVESTMENT COMPANIES (IDENTIFIED COST $196,214,206) | 178,386,624 | ||
| CORPORATE BONDS—0.8% | |||
| $30,000 | ACE INA Holdings, Inc., 3.350%, 5/03/2026 | 29,952 | |
| 25,000 | Advance Auto Parts, Inc., 4.500%, 12/01/2023 | 25,543 | |
| 60,000 | Altria Group, Inc., Sr. Unsecd. Note, 4.000%, 01/31/2024 | 62,271 | |
| 150,000 | American Honda Finance Co, Unsecd. Deb., Series MTN, 2.250%, 8/15/2019 | 150,460 | |
| 60,000 | Atmos Energy Corp., Sr. Unsecd. Note, 4.125%, 10/15/2044 | 57,597 | |
| 75,000 | Autodesk, Inc., Sr. Unsecd. Note, 4.375%, 6/15/2025 | 73,849 | |
| 100,000 | AutoZone, Inc., Sr. Unsecd. Note, 3.250%, 4/15/2025 | 96,961 | |
| 20,000 | BB&T Corp., Sr. Unsecd. Note, Series MTN, 2.250%, 02/01/2019 | 20,092 | |
| 50,000 | Bank of America Corp., Sub. Note, Series L, 3.950%, 4/21/2025 | 48,787 | |
| 100,000 | Becton, Dickinson and Co., Sr. Unsecd. Note, 4.685%, 12/15/2044 | 101,281 | |
| 100,000 | Canadian Natural Resources Ltd., 3.900%, 2/01/2025 | 87,449 | |
| 22,000 | Carpenter Technology Corp., Sr. Unsecd. Note, 4.450%, 03/01/2023 | 21,178 | |
| 30,000 | Comerica, Inc., 3.800%, 7/22/2026 | 29,609 | |
| 50,000 | 2,3 | Embraer Overseas Ltd., Sr. Unsecd. Note, Series 144A, 5.696%, 09/16/2023 | 48,875 |
| 40,000 | Energy Transfer Partners LP, Sr. Unsecd. Note, 4.900%, 02/01/2024 | 35,722 | |
| 50,000 | Energy Transfer Partners, Sr. Unsecd. Note, 4.050%, 3/15/2025 | 41,161 | |
| 50,000 | Exelon Generation Co. LLC, Sr. Unsecd. Note, 4.250%, 06/15/2022 | 50,730 | |
| 50,000 | Host Hotels & Resorts LP, Sr. Unsecd. Note, Series E, 4.000%, 6/15/2025 | 48,041 | |
| 40,000 | Invesco Finance PLC, Sr. Unsecd. Note, 3.750%, 1/15/2026 | 40,357 | |
| 40,000 | 2,3 | Liberty Mutual Group, Inc., Series 144A, 4.850%, 8/01/2044 | 37,189 |
| 70,000 | Liberty Property LP, Sr. Unsecd. Note, 3.750%, 4/01/2025 | 67,708 | |
| 15,000 | Mondelez International, Inc., Sr. Unsecd. Note, 4.000%, 02/01/2024 | 15,498 | |
| 25,000 | NextEra Energy Capital Holdings, Inc., Sr. Unsecd. Note, 2.700%, 09/15/2019 | 24,912 | |
| 50,000 | ProLogis LP, Sr. Unsecd. Note, 3.350%, 02/01/2021 | 50,692 | |
| 100,000 | Prudential Financial, Inc., Sr. Unsecd. Note, Series MTN, 4.600%, 05/15/2044 | 99,888 | |
| 25,000 | Textron, Inc., Sr. Unsecd. Note, 4.300%, 03/01/2024 | 25,516 | |
| 25,000 | Verisk Analytics, Inc., Sr. Unsecd. Note, 5.500%, 6/15/2045 | 23,952 |
| Shares, Contracts or Principal Amount | Value | ||
| CORPORATE BONDS—continued | |||
| $125,000 | Verizon Communications, Inc., Sr. Unsecd. Note, 5.150%, 09/15/2023 | $137,650 | |
| 25,000 | Viacom, Inc., Sr. Unsecd. Note, 3.875%, 04/01/2024 | 23,485 | |
| 30,000 | Visa, Inc., Sr. Unsecd. Note, 3.150%, 12/14/2025 | 30,101 | |
| 90,000 | Williams Partners LP, 4.900%, 1/15/2045 | 57,463 | |
| 10,000 | Williams Partners LP, 5.100%, 9/15/2045 | 6,600 | |
| 55,000 | Worthington Industries, Inc., Sr. Unsecd. Note, 4.550%, 04/15/2026 | 54,494 | |
| TOTAL CORPORATE BONDS (IDENTIFIED COST $1,652,361) | 1,725,063 | ||
| ASSET-BACKED SECURITIES—0.2% | |||
| 150,000 | American Express Credit Account Master Trust 2014-1, A, 0.543%, 12/15/2021 | 149,593 | |
| 125,000 | Capital One Multi Asset Execution Trust 2014-A4, A4, 0.526%, 06/15/2022 | 125,074 | |
| 150,000 | 2,3 | Penarth Master Issuer 2015-1A, A1, 0.760%, 03/18/2019 | 149,854 |
| TOTAL ASSET-BACKED SECURITIES (IDENTIFIED COST $425,000) | 424,521 | ||
| COMMERCIAL MORTGAGE-BACKED SECURITIES—0.2% | |||
| 225,000 | Citigroup Commercial Mortgage Trust 2015-GC33 AS, 4.114%, 9/10/2058 | 230,043 | |
| 50,000 | Commercial Mortgage Trust 2015-DC1 AM, 3.724%, 2/10/2048 | 50,344 | |
| 105,000 | WF-RBS Commercial Mortgage Trust 2014-C25 B, 4.236%, 11/15/2047 | 105,925 | |
| TOTAL COMMERCIAL MORTGAGE-BACKED SECURITIES (IDENTIFIED COST $391,380) | 386,312 | ||
| EXCHANGE-TRADED FUNDS—5.0% | |||
| 84,481 | iShares Dow Jones U.S. Real Estate Index Fund | 6,345,368 | |
| 320,592 | 4 | PowerShares DB Commodity Index Tracking Fund | 4,283,109 |
| TOTAL EXCHANGE-TRADED FUNDS (IDENTIFIED COST $13,646,519) | 10,628,477 | ||
| U.S. TREASURY—5.1% | |||
| $432,289 | U.S. Treasury Inflation-Protected Bond, 0.750%, 2/15/2045 | 376,862 | |
| 743,245 | U.S. Treasury Inflation-Protected Bond, 1.375%, 2/15/2044 | 756,126 | |
| 1,555,361 | U.S. Treasury Inflation-Protected Bond, 1.750%, 1/15/2028 | 1,699,029 | |
| 793,295 | U.S. Treasury Inflation-Protected Bond, 2.000%, 1/15/2026 | 881,838 | |
| 3,047 | U.S. Treasury Inflation-Protected Note, 0.125%, 4/15/2020 | 3,010 | |
| 48,200 | U.S. Treasury Inflation-Protected Note, 0.250%, 1/15/2025 | 46,005 | |
| 100,272 | U.S. Treasury Inflation-Protected Note, 0.375%, 7/15/2025 | 97,089 | |
| 934,697 | U.S. Treasury Inflation-Protected Note, 2.000%, 1/15/2016 | 934,113 | |
| 989,769 | U.S. Treasury Inflation-Protected Note, Series A-2024, 0.625%, 1/15/2024 | 978,789 | |
| 882,368 | U.S. Treasury Inflation-Protected Note, Series D-2018, 1.375%, 7/15/2018 | 913,538 | |
| 1,648,972 | U.S. Treasury Inflation-Protected Note, Series D-2020, 1.250%, 7/15/2020 | 1,715,575 | |
| 551,920 | U.S. Treasury Inflation-Protected Note, Series D-2024, 0.125%, 7/15/2024 | 524,396 | |
| 1,280,094 | U.S. Treasury Inflation-Protected Note, Series W-2016, 0.125%, 4/15/2016 | 1,274,544 | |
| 507,515 | U.S. Treasury Inflation-Protected Note, Series X-2019, 0.125%, 4/15/2019 | 504,541 | |
| 1,000 | United States Treasury Bond, 3.000%, 11/15/2044 | 997 | |
| 2,000 | United States Treasury Bond, 3.000%, 5/15/2045 | 1,992 | |
| TOTAL U.S. TREASURY (IDENTIFIED COST $11,061,337) | 10,708,444 | ||
| PURCHASED CALL OPTIONS—0.5% | |||
| 400 | SPDR S&P 500 ETF Trust, Strike Price $200, Expiration Date, 6/17/2016 | 462,600 | |
| 325 | SPDR S&P 500 ETF Trust, Strike Price $200, Expiration Date, 12/16/2016 | 500,662 | |
| 250 | SPDR S&P 500 ETF Trust, Strike Price $210, Expiration Date, 3/18/2016 | 71,000 | |
| TOTAL PURCHASED CALL OPTIONS (IDENTIFIED COST $952,325) | 1,034,262 |
| Shares, Contracts or Principal Amount | Value | ||
| REPURCHASE AGREEMENT—3.7% | |||
| $7,892,000 | Interest in $600,000,000 joint repurchase agreement 0.32%, dated 12/31/2015 under which Bank of America, N.A. will repurchase securities provided as collateral for $600,021,333 on 1/4/2016. The securities provided as collateral at the end of the period held with BNY Mellon as tri-party agent, were U.S. Government Agency securities maturing on 2/25/2044 and the market value of those underlying securities was $618,021,974. (AT COST) | $7,892,000 | |
| TOTAL INVESTMENTS—99.8% (IDENTIFIED COST $232,235,128)5 | 211,185,703 | ||
| OTHER ASSETS AND LIABILITIES - NET—0.2%6 | 512,779 | ||
| TOTAL NET ASSETS—100% | $211,698,482 |
| Description | Number of Contracts | Notional Value | Expiration Date | Unrealized Appreciation (Depreciation) |
| 4United States Ultra Bond Long Futures | 10 | $1,586,875 | March 2016 | $20,212 |
| 4United States Treasury Notes 2-Year Long Futures | 28 | $6,082,563 | March 2016 | $ (10,563) |
| 4United States Treasury Notes 5-Year Short Futures | 8 | $946,563 | March 2016 | $2,357 |
| 4United States Treasury Notes 10-Year Short Futures | 27 | $3,399,469 | March 2016 | $5,299 |
| NET UNREALIZED APPRECIATION ON FUTURES CONTRACTS | $17,305 | |||
| 1 | Affiliated holdings. |
| 2 | Denotes a restricted security that either: (a) cannot be offered for public sale without first being registered, or being able to take advantage of an exemption from registration, under the Securities Act of 1933; or (b) is subject to a contractual restriction on public sales. At December 31, 2015, these restricted securities amounted to $235,918, which represented 0.1% of total net assets. |
| 3 | Denotes a restricted security that may be resold without restriction to “qualified institutional buyers” as defined in Rule 144A under the Securities Act of 1933 and that the Fund has determined to be liquid under criteria established by the Fund's Board of Trustees (the “Trustees”). At December 31, 2015, these liquid restricted securities amounted to $235,918, which represented 0.1% of total net assets. |
| 4 | Non-income-producing security. |
| 5 | The cost of investments for federal tax purposes amounts to $232,714,042. |
| 6 | Assets, other than investments in securities, less liabilities. See Statement of Assets and Liabilities. |
| Valuation Inputs | ||||
| Level 1— Quoted Prices | Level 2— Other Significant Observable Inputs | Level 3— Significant Unobservable Inputs | Total | |
| Investment Companies1 | $159,083,099 | $19,303,525 | $— | $178,386,624 |
| Debt Securities: | ||||
| Corporate Bonds | — | 1,725,063 | — | 1,725,063 |
| Asset-Backed Securities | — | 424,521 | — | 424,521 |
| Commercial Mortgage-Backed Securities | 386,312 | 386,312 | ||
| U.S. Treasury | — | 10,708,444 | — | 10,708,444 |
| Purchased Call Options | 1,034,262 | — | — | 1,034,262 |
| Exchange-Traded Funds | 10,628,477 | — | — | 10,628,477 |
| Repurchase Agreement | — | 7,892,000 | — | 7,892,000 |
| TOTAL SECURITIES | $170,745,838 | $40,439,865 | $— | $211,185,703 |
| Other Financial Instruments2 | ||||
| Assets | 27,868 | — | — | 27,868 |
| Liabilities | (10,563) | — | — | (10,563) |
| TOTAL OTHER FINANCIAL INSTRUMENTS | $17,305 | $— | $— | $17,305 |
| 1 | Emerging Markets Fixed Income Core Fund, Federated Bank Loan Core Fund, Federated Mortgage Core Portfolio, Federated Project and Trade Finance Core Fund and High Yield Bond Portfolio are affiliated holdings offered only to registered investment companies and other accredited investors. Investments in these funds are deemed Level 2 due to the fact that the net asset value (the NAV) is not publicly available and, with respect to Federated Project and Trade Finance Core Fund due to the fact that the price of shares redeemed may be determined as of the closing NAV of the fund up to twenty-four days after receipt of a shareholder redemption request. |
| 2 | Other financial instruments include futures contracts. |
| MTN | —Medium Term Note |
| Year Ended December 31 | 2015 | 2014 | 2013 | 2012 | 2011 |
| Net Asset Value, Beginning of Period | $5.55 | $7.06 | $6.25 | $6.02 | $6.40 |
| Income From Investment Operations: | |||||
| Net investment income | 0.08 | 0.081 | 0.111 | 0.07 | 0.04 |
| Net realized and unrealized gain (loss) on investments, futures contracts and foreign currency transactions | (0.42) | (0.13) | 0.91 | 0.54 | (0.38) |
| TOTAL FROM INVESTMENT OPERATIONS | (0.34) | (0.05) | 1.02 | 0.61 | (0.34) |
| Less Distributions: | |||||
| Distributions from net investment income | (0.09) | (0.12) | (0.07) | (0.03) | (0.04) |
| Distributions from net realized gain on investments, futures contracts and foreign currency transactions | (0.01) | (1.34) | (0.14) | (0.35) | — |
| TOTAL DISTRIBUTIONS | (0.10) | (1.46) | (0.21) | (0.38) | (0.04) |
| Net Asset Value, End of Period | $5.11 | $5.55 | $7.06 | $6.25 | $6.02 |
| Total Return2 | (6.29)% | (0.97)% | 16.45% | 10.17% | (5.29)% |
| Ratios to Average Net Assets: | |||||
| Net expenses | 0.28% | 0.30% | 0.50% | 1.04%3 | 1.13%3 |
| Net investment income | 1.54% | 1.41% | 1.62% | 0.99% | 0.86% |
| Expense waiver/reimbursement4 | 0.67% | 0.61% | 0.53% | 0.01% | 0.03% |
| Supplemental Data: | |||||
| Net assets, end of period (000 omitted) | $141,823 | $153,165 | $169,658 | $165,598 | $176,315 |
| Portfolio turnover | 49% | 39% | 137% | 103% | 229% |
| 1 | Per share numbers have been calculated using the average shares method. |
| 2 | Based on net asset value. Total returns do not reflect any additional fees or expenses that may be imposed by separate accounts of insurance companies or in connection with any variable annuity or variable life insurance contract. |
| 3 | The net expense ratio is calculated without reduction for expense offset arrangements. The net expense ratios are 1.04% and 1.13% for the years ended December 31, 2012 and 2011, respectively, after taking into account these expense reductions. |
| 4 | This expense decrease is reflected in both the net expense and the net investment income ratios shown above. |
| Year Ended December 31 | 2015 | 2014 | 2013 | 2012 | 2011 |
| Net Asset Value, Beginning of Period | $5.54 | $7.07 | $6.26 | $6.02 | $6.40 |
| Income From Investment Operations: | |||||
| Net investment income | 0.07 | 0.081 | 0.141 | 0.06 | 0.04 |
| Net realized and unrealized gain (loss) on investments, futures contracts and foreign currency transactions | (0.42) | (0.16) | 0.86 | 0.55 | (0.39) |
| TOTAL FROM INVESTMENT OPERATIONS | (0.35) | (0.08) | 1.00 | 0.61 | (0.35) |
| Less Distributions: | |||||
| Distributions from net investment income | (0.08) | (0.11) | (0.05) | (0.02) | (0.03) |
| Distributions from net realized gain on investments, futures contracts and foreign currency transactions | (0.01) | (1.34) | (0.14) | (0.35) | — |
| TOTAL DISTRIBUTIONS | (0.09) | (1.45) | (0.19) | (0.37) | (0.03) |
| Net Asset Value, End of Period | $5.10 | $5.54 | $7.07 | $6.26 | $6.02 |
| Total Return2 | (6.43)% | (1.33)% | 16.11% | 10.03% | (5.51)% |
| Ratios to Average Net Assets: | |||||
| Net expenses | 0.53% | 0.54% | 0.75% | 1.29%3 | 1.40%3 |
| Net investment income | 1.29% | 1.46% | 2.01% | 0.73% | 0.42% |
| Expense waiver/reimbursement4 | 0.67% | 0.63% | 0.54% | 0.01% | 0.03% |
| Supplemental Data: | |||||
| Net assets, end of period (000 omitted) | $69,876 | $67,434 | $10,101 | $4,146 | $4,781 |
| Portfolio turnover | 49% | 39% | 137% | 103% | 229% |
| 1 | Per share numbers have been calculated using the average shares method. |
| 2 | Based on net asset value. Total returns do not reflect any additional fees or expenses that may be imposed by separate accounts of insurance companies or in connection with any variable annuity or variable life insurance contract. |
| 3 | The net expense ratio is calculated without reduction for expense offset arrangements. The net expense ratios are 1.29% and 1.40% for the years ended December 31, 2012 and 2011, respectively, after taking into account these expense reductions. |
| 4 | This expense decrease is reflected in both the net expense and the net investment income ratios shown above. |
| Assets: | ||
| Total investment in securities, at value including $178,386,624 of investment in affiliated holdings (Note 5) (identified cost $232,235,128) | $211,185,703 | |
| Cash | 137 | |
| Cash denominated in foreign currencies (identified cost $57) | 45 | |
| Restricted cash (Note 2) | 31,145 | |
| Income receivable | 72,508 | |
| Receivable for investments sold | 2,229,681 | |
| Receivable for shares sold | 37,234 | |
| Receivable for daily variation margin on futures | 2,171 | |
| TOTAL ASSETS | 213,558,624 | |
| Liabilities: | ||
| Payable for investments purchased | $1,631,192 | |
| Payable for shares redeemed | 160,581 | |
| Payable to adviser (Note 5) | 856 | |
| Payable for distribution services fee (Note 5) | 15,120 | |
| Accrued expenses (Note 5) | 52,393 | |
| TOTAL LIABILITIES | 1,860,142 | |
| Net assets for 41,427,936 shares outstanding | $211,698,482 | |
| Net Assets Consist of: | ||
| Paid-in capital | $241,051,213 | |
| Net unrealized depreciation of investments, futures contracts and translation of assets and liabilities in foreign currency | (21,032,132) | |
| Accumulated net realized loss on investments, futures contracts and written options | (11,647,600) | |
| Undistributed net investment income | 3,327,001 | |
| TOTAL NET ASSETS | $211,698,482 | |
| Net Asset Value, Offering Price and Redemption Proceeds Per Share | ||
| Primary Shares: | ||
| $141,822,783 ÷ 27,730,955 shares outstanding, no par value, unlimited shares authorized | $5.11 | |
| Service Shares: | ||
| $69,875,699 ÷ 13,696,981 shares outstanding, no par value, unlimited shares authorized | $5.10 |
| Investment Income: | ||
| Dividends (including $3,647,016 received from affiliated holdings (Note 5)) | $3,905,339 | |
| Interest | 120,384 | |
| Investment income allocated from an affiliated partnership (Note 5) | 29,586 | |
| TOTAL INCOME | 4,055,309 | |
| Expenses: | ||
| Investment adviser fee (Note 5) | $1,670,277 | |
| Administrative fee (Note 5) | 174,267 | |
| Custodian fees | 19,973 | |
| Transfer agent fee | 23,435 | |
| Directors'/Trustees' fees (Note 5) | 2,574 | |
| Auditing fees | 28,579 | |
| Legal fees | 9,138 | |
| Portfolio accounting fees | 74,608 | |
| Distribution services fee (Note 5) | 186,323 | |
| Printing and postage | 104,204 | |
| Miscellaneous (Note 5) | 10,860 | |
| EXPENSES BEFORE ALLOCATION | 2,304,238 | |
| Expenses allocated from affiliated partnership (Note 5) | 339 | |
| TOTAL EXPENSES | 2,304,577 | |
| Waiver/reimbursement of investment adviser fee (Note 5) | (1,487,227) | |
| Net expenses | 817,350 | |
| Net investment income | 3,237,959 | |
| Realized and Unrealized Gain (Loss) on Investments, Futures Contracts, Written Options and Foreign Currency Transactions: | ||
| Net realized gain on investments (including realized gain of $2,998,724 on sales of investments in affiliated holdings (Note 5)) | 1,004,513 | |
| Net realized loss on futures contracts | (5,337,550) | |
| Net realized gain on written options | 353,873 | |
| Net realized loss on investments and foreign currency transactions allocated from affiliated partnership (Note 5) | (24,990) | |
| Realized gain distribution from affiliated investment company shares (Note 5) | 1,336,645 | |
| Net change in unrealized depreciation of investments and translation of assets and liabilities in foreign currency | (14,810,321) | |
| Net change in unrealized appreciation of futures contracts | 9,182 | |
| Net realized and unrealized loss on investments, futures contracts, written options and foreign currency transactions | (17,468,648) | |
| Change in net assets resulting from operations | $(14,230,689) |
| Year Ended December 31 | 2015 | 2014 |
| Increase (Decrease) in Net Assets | ||
| Operations: | ||
| Net investment income | $3,237,959 | $2,912,431 |
| Net realized gain (loss) on investments including allocation from partnership, futures contracts, written options and foreign currency transactions | (2,667,509) | 3,589,053 |
| Net change in unrealized appreciation/depreciation of investments, futures contracts and translation of assets and liabilities in foreign currency | (14,801,139) | (9,265,307) |
| CHANGE IN NET ASSETS RESULTING FROM OPERATIONS | (14,230,689) | (2,763,823) |
| Distributions to Shareholders: | ||
| Distributions from net investment income | ||
| Primary Shares | (2,454,018) | (2,874,468) |
| Service Shares | (1,109,052) | (430,562) |
| Distributions from net realized gain on investments, futures contracts and written options | ||
| Primary Shares | (205,639) | (31,489,099) |
| Service Shares | (101,669) | (4,843,857) |
| CHANGE IN NET ASSETS RESULTING FROM DISTRIBUTIONS TO SHAREHOLDERS | (3,870,378) | (39,637,986) |
| Share Transactions: | ||
| Proceeds from sale of shares | 39,746,282 | 69,343,629 |
| Net asset value of shares issued to shareholders in payment of distributions declared | 3,870,379 | 39,637,985 |
| Cost of shares redeemed | (34,416,079) | (25,739,698) |
| CHANGE IN NET ASSETS RESULTING FROM SHARE TRANSACTIONS | 9,200,582 | 83,241,916 |
| Change in net assets | (8,900,485) | 40,840,107 |
| Net Assets: | ||
| Beginning of period | 220,598,967 | 179,758,860 |
| End of period (including undistributed net investment income of $3,327,001 and $3,559,033, respectively) | $211,698,482 | $220,598,967 |
| ■ | Shares of other mutual funds or non-exchange-traded investment companies are valued based upon their reported NAVs. |
| ■ | Equity securities listed on an exchange or traded through a regulated market system are valued at their last reported sale price or official closing price in their principal exchange or market. |
| ■ | Fixed-income securities acquired with remaining maturities greater than 60 days are fair valued using price evaluations provided by a pricing service approved by the Trustees. |
| ■ | Fixed-income securities and repurchase agreements acquired with remaining maturities of 60 days or less are valued at their cost (adjusted for the accretion of any discount or amortization of any premium), unless the issuer's creditworthiness is impaired or other factors indicate that amortized cost is not an accurate estimate of the investment's fair value, in which case it would be valued in the same manner as a longer-term security. |
| ■ | Derivative contracts listed on exchanges are valued at their reported settlement or closing price, except that options are valued at the mean of closing bid and asked quotations. |
| ■ | Over-the-counter (OTC) derivative contracts are fair valued using price evaluations provided by a pricing service approved by the Trustees. |
| ■ | For securities that are fair valued in accordance with procedures established by and under the general supervision of the Trustees, certain factors may be considered such as: the last traded or purchase price of the security, information obtained by contacting the issuer or dealers, analysis of the issuer's financial statements or other available documents, fundamental analytical data, the nature and duration of restrictions on disposition, the movement of the market in which the security is normally traded, public trading in similar securities or derivative contracts of the issuer or comparable issuers, movement of a relevant index, or other factors including but not limited to industry changes and relevant government actions. |
| ■ | With respect to securities traded principally in foreign markets, significant trends in U.S. equity markets or in the trading of foreign securities index futures contracts; |
| ■ | Political or other developments affecting the economy or markets in which an issuer conducts its operations or its securities are traded; |
| ■ | Announcements concerning matters such as acquisitions, recapitalizations, litigation developments, or a natural disaster affecting the issuer's operations or regulatory changes or market developments affecting the issuer's industry. |
| Contracts | Number of Contracts | Premium |
| Outstanding at 12/31/2014 | — | $— |
| Contracts written | 7,450 | 492,986 |
| Contracts exercised | — | — |
| Contracts expired | — | — |
| Contracts bought back | (7,450) | (492,986) |
| Outstanding at 12/31/2015 | — | $— |
| Fair Value of Derivative Instruments | ||
| Asset | ||
| Statement of Assets and Liabilities Location | Fair Value | |
| Derivatives not accounted for as hedging instruments under ASC Topic 815 | ||
| Equity contracts | Total investments in securities at value-options | $1,034,262 |
| Interest rate contracts | Receivable for daily variation margin on futures | 17,305* |
| Total derivatives not accounted for as hedging instruments under ASC Topic 815 | $1,051,567 | |
| * | Includes cumulative appreciation of futures contracts as reported in the footnotes to the Portfolio of Investments. Only the current day's variation margin is reported within the Statement of Assets and Liabilities. |
| Amount of Realized Gain or (Loss) on Derivatives Recognized in Income | ||||
| Futures Contracts | Written Option Contracts | Purchased Option Contracts | Total | |
| Interest rate contracts | $(432,906) | $83,043 | $(34,311) | $(384,174) |
| Equity contracts | (4,904,644) | 270,830 | (2,107,804) | (6,741,618) |
| TOTAL | $(5,337,550) | $353,873 | $(2,142,115) | $(7,125,792) |
| Change in Unrealized Appreciation or (Depreciation) on Derivatives Recognized in Income | |||
| Futures Contracts | Purchased Option Contracts | Total | |
| Interest rate contracts | $9,182 | $— | $9,182 |
| Equity contracts | — | 81,937 | 81,937 |
| TOTAL | $9,182 | $81,937 | $91,119 |
| Year Ended December 31 | 2015 | 2014 | ||
| Primary Shares: | Shares | Amount | Shares | Amount |
| Shares sold | 2,609,269 | $13,934,238 | 468,344 | $2,888,259 |
| Shares issued to shareholders in payment of distributions declared | 480,951 | 2,659,658 | 6,125,413 | 34,363,567 |
| Shares redeemed | (2,968,731) | (16,030,077) | (3,001,009) | (17,816,310) |
| NET CHANGE RESULTING FROM PRIMARY SHARE TRANSACTIONS | 121,489 | $563,819 | 3,592,748 | $19,435,516 |
| Year Ended December 31 | 2015 | 2014 | ||
| Service Shares: | Shares | Amount | Shares | Amount |
| Shares sold | 4,739,241 | $25,812,044 | 11,171,053 | $66,455,370 |
| Shares issued to shareholders in payment of distributions declared | 218,937 | 1,210,721 | 940,181 | 5,274,418 |
| Shares redeemed | (3,433,951) | (18,386,002) | (1,367,365) | (7,923,388) |
| NET CHANGE RESULTING FROM SERVICE SHARE TRANSACTIONS | 1,524,227 | $8,636,763 | 10,743,869 | $63,806,400 |
| NET CHANGE RESULTING FROM TOTAL FUND SHARE TRANSACTIONS | 1,645,716 | $9,200,582 | 14,336,617 | $83,241,916 |
| Increase (Decrease) | ||
| Paid-In Capital | Undistributed Net Investment Income (Loss) | Accumulated Net Realized Gain (Loss) |
| $(120) | $93,079 | $(92,959) |
| 2015 | 2014 | |
| Ordinary income1 | $3,563,070 | $17,575,480 |
| Long-term capital gains | $307,308 | $22,062,506 |
| 1 | For tax purposes, short-term capital gain distributions are considered ordinary income distributions. |
| Undistributed ordinary income | $3,327,270 |
| Net unrealized depreciation | $(21,528,351) |
| Capital loss carryforwards and deferrals | $(11,151,650) |
| Expiration Year | Short-Term | Long-Term | Total |
| No Expiration | $2,614,488 | $— | $2,614,488 |
| 2016 | $6,189,290 | NA | $6,189,290 |
| 2017 | $2,259,665 | NA | $2,259,665 |
| Administrative Fee | Average Daily Net Assets of the Investment Complex |
| 0.150% | on the first $5 billion |
| 0.125% | on the next $5 billion |
| 0.100% | on the next $10 billion |
| 0.075% | on assets in excess of $20 billion |
| Share Class Name | Percentage of Average Daily Net Assets of Class |
| Primary Shares | 0.25% |
| Service Shares | 0.25% |
| Distribution Services Fees Incurred | |
| Service Shares | $186,323 |
| Balance of Shares Held 12/31/2014 | Purchases/ Additions | Sales/ Reductions | Balance of Shares Held 12/31/2015 | Value | Dividend Income/ Allocated Investment Income | Realized Gain Distribution/ Allocated Net Realized Gain (Loss) | |
| Emerging Markets Fixed Income Core Fund | 15,758 | 16,467 | (17,510) | 14,715 | $496,757 | $29,586 | $(24,990) |
| Federated Absolute Return Fund, Institutional Shares | — | 1,810,602 | (176,501) | 1,634,101 | $16,749,537 | $— | — |
| Federated Bank Loan Core Fund | 619,287 | 106,564 | (682,957) | 42,894 | $416,070 | $100,578 | — |
| Federated Clover Small Value Fund, Institutional Shares | 882,546 | 111,572 | (63,021) | 931,097 | $21,219,690 | $112,617 | 394,784 |
| Federated Emerging Markets Equity Fund, Institutional Shares | — | 392,114 | (31,422) | 360,692 | $2,784,539 | $22,898 | — |
| Federated Equity Income Fund, Inc., Institutional Shares | 3,134,669 | 62,076 | (2,094,623) | 1,102,122 | $24,114,435 | $769,697 | 256,539 |
| Federated InterContinental Fund, Institutional Shares | 442,409 | 38,052 | (187,797) | 292,664 | $13,676,176 | $315,841 | — |
| Federated Intermediate Corporate Bond Fund, Institutional Shares | 985,728 | 329,309 | (320,686) | 994,351 | $9,098,314 | $373,793 | 11,187 |
| Federated International Leaders Fund, Class R6 | 42,805 | 393,549 | (13,128) | 423,226 | $13,060,753 | $219,171 | — |
| Federated International Strategic Value Dividend Fund, Institutional Shares | 3,157,059 | 761,565 | (197,252) | 3,721,372 | $13,062,015 | $471,394 | — |
| Federated Kaufmann Large Cap Fund, Class R6 Shares | — | 1,321,950 | (91,128) | 1,230,822 | $23,213,304 | $— | 1,631 |
| Federated Mortgage Core Portfolio | 505,336 | 245,760 | (366,458) | 384,638 | $3,788,683 | $154,496 | — |
| Federated Project and Trade Finance Core Fund | 1,790,243 | 129,858 | (538,380) | 1,381,721 | $12,919,089 | $521,955 | — |
| Federated Prudent Bear Fund, Institutional Shares | 5,406,092 | 869,276 | (2,473,935) | 3,801,433 | $8,287,124 | $— | — |
| Federated Strategic Value Dividend Fund, Institutional Shares | 503,544 | 3,128,917 | (1,184,474) | 2,447,987 | $13,806,645 | $436,659 | 668,431 |
| Federated U.S. Gov't Securities Fund: 2-5 Years, Institutional Shares | 956 | 12 | — | 968 | $10,567 | $128 | — |
| High Yield Bond Portfolio | 289,963 | 203,000 | (203,800) | 289,163 | $1,682,926 | $147,789 | 4,073 |
| TOTAL OF AFFILIATED TRANSACTIONS | 17,776,395 | 9,920,643 | (8,643,072) | 19,053,966 | $178,386,624 | $3,676,602 | $1,311,655 |
| Purchases | $104,874,290 |
| Sales | $100,650,678 |
February 12, 2016
| Beginning Account Value 7/1/2015 | Ending Account Value 12/31/2015 | Expenses Paid During Period1 | |
| Actual: | |||
| Primary Shares | $1,000 | $937.60 | $1.37 |
| Service Shares | $1,000 | $935.80 | $2.59 |
| Hypothetical (assuming a 5% return before expenses): | |||
| Primary Shares | $1,000 | $1,023.79 | $1.43 |
| Service Shares | $1,000 | $1,022.53 | $2.70 |
| 1 | Expenses are equal to the Fund's annualized net expense ratios, multiplied by the average account value over the period, multiplied by 184/365 (to reflect the one-half-year period). The expenses shown in the table do not include the charges and expenses imposed by the insurance company under the variable insurance product contract. Please refer to the variable insurance product prospectus for a complete listing of these expenses. The annualized net expense ratios are as follows: |
| Primary Shares | 0.28% |
| Service Shares | 0.53% |
| Name Birth Date Positions Held with Trust Date Service Began | Principal Occupation(s) for Past Five Years, Other Directorships Held and Previous Position(s) |
| John F. Donahue* Birth Date: July 28, 1924 Trustee Indefinite Term Began serving: October 1993 | Principal Occupations: Director or Trustee of the Federated Fund Family; Chairman and Director, Federated Investors, Inc.; Chairman of the Federated Fund Family's Executive Committee. Previous Positions: Chairman of the Federated Fund Family; Trustee, Federated Investment Management Company; Chairman and Director, Federated Investment Counseling. |
| J. Christopher Donahue* Birth Date: April 11, 1949 Trustee Indefinite Term Began serving: October 1993 | Principal Occupations: Principal Executive Officer and President of certain of the Funds in the Federated Fund Family; Director or Trustee of the Funds in the Federated Fund Family; President, Chief Executive Officer and Director, Federated Investors, Inc.; Chairman and Trustee, Federated Investment Management Company; Trustee, Federated Investment Counseling; Chairman and Director, Federated Global Investment Management Corp.; Chairman, Federated Equity Management Company of Pennsylvania and Passport Research, Ltd. (investment advisory subsidiary of Federated); Trustee, Federated Shareholder Services Company; Director, Federated Services Company. Previous Positions: President, Federated Investment Counseling; President and Chief Executive Officer, Federated Investment Management Company, Federated Global Investment Management Corp. and Passport Research, Ltd. |
| * | Family relationships and reasons for “interested” status: John F. Donahue is the father of J. Christopher Donahue; both are “interested” due to their beneficial ownership of shares of Federated Investors, Inc. and the positions they hold with Federated and its subsidiaries. |
| Name Birth Date Positions Held with Trust Date Service Began | Principal Occupation(s) for Past Five Years, Other Directorships Held, Previous Position(s) and Qualifications |
| John T. Collins Birth Date: January 24, 1947 Trustee Indefinite Term Began serving: October 2013 | Principal Occupations: Director or Trustee of the Federated Fund Family; Retired. Other Directorships Held: Director, Chair of the Compensation Committee, Audit Committee member, KLX Corp. Qualifications: Mr. Collins has served in several business and financial management roles and directorship positions throughout his career. Mr. Collins previously served as Chairman and CEO, The Collins Group, Inc. (a private equity firm). Mr. Collins serves as Chairman Emeriti, Bentley University. Mr. Collins previously served as Director, FleetBoston Financial Corp.; Director and Audit Committee Member, Bank of America Corp. and Director, Beth Israel Deaconess Medical Center (Harvard University Affiliate Hospital). |
| G. Thomas Hough Birth Date: February 28, 1955 Trustee Indefinite Term Began serving: August 2015 | Principal Occupations: Director or Trustee of the Federated Fund Family; Retired. Other Directorships Held: Director, Chair of the Audit Committee, Governance Committee, Publix Super Markets, Inc. Qualifications: Mr. Hough has served in accounting, business management and directorship positions throughout his career. Mr. Hough most recently held the position of Americas Vice Chair of Assurance with Ernst & Young LLP. Mr. Hough is an Executive Committee member of the United States Golf Association, he serves on the President's Cabinet and Business School Board of Visitors for the University of Alabama and is on the Business School Board of Visitors for Wake Forest University. |
| Name Birth Date Positions Held with Trust Date Service Began | Principal Occupation(s) for Past Five Years, Other Directorships Held, Previous Position(s) and Qualifications |
| Maureen Lally-Green Birth Date: July 5, 1949 Trustee Indefinite Term Began serving: August 2009 | Principal Occupations: Director or Trustee of the Federated Fund Family; Adjunct Professor of Law, Duquesne University School of Law. Other Directorships Held: Director, CONSOL Energy Inc. Qualifications: Judge Lally-Green has served in various legal and business roles and directorship positions throughout her career. Judge Lally-Green previously served as: Associate General Secretary, Diocese of Pittsburgh; a member of the Superior Court of Pennsylvania; and as a Professor of Law, Duquesne University School of Law. Judge Lally-Green also holds the positions on either a public or not for profit Board of Directors as follows: Member, Pennsylvania State Board of Education (public); Director and Chair, UPMC Mercy Hospital; Regent, St. Vincent Seminary; Director, Epilepsy Foundation of Western and Central Pennsylvania; Director and Vice Chair, Our Campaign for the Church Alive!, Inc.; Director, Saint Vincent College; Director, Pennsylvania Bar Institute; and Director and Chair, Cardinal Wuerl North Catholic High School, Inc. Judge Lally-Green has held the positions of: Director, Auberle; Director, Ireland Institute of Pittsburgh; Director, Saint Thomas More Society; and Director, Catholic High Schools of the Diocese of Pittsburgh, Inc. |
| Peter E. Madden Birth Date: March 16, 1942 Trustee Indefinite Term Began serving: October 1993 | Principal Occupation: Director or Trustee, and Chair of the Board of Directors or Trustees, of the Federated Fund Family; Retired. Other Directorships Held: None. Qualifications: Mr. Madden has served in several business management, mutual fund services and directorship positions throughout his career. Mr. Madden previously served as President, Chief Operating Officer and Director, State Street Bank and Trust Company (custodian bank) and State Street Corporation (financial services). He was Director, VISA USA and VISA International and Chairman and Director, Massachusetts Bankers Association. Mr. Madden served as Director, Depository Trust Corporation and Director, The Boston Stock Exchange. Mr. Madden also served as a Representative to the Commonwealth of Massachusetts General Court. |
| Charles F. Mansfield, Jr. Birth Date: April 10, 1945 Trustee Indefinite Term Began serving: November 1999 | Principal Occupations: Director or Trustee of the Federated Fund Family; Management Consultant. Other Directorships Held: None. Qualifications: Mr. Mansfield has served in several banking, business management and educational roles and directorship positions throughout his career. Mr. Mansfield previously served as Chief Executive Officer, PBTC International Bank; Partner, Arthur Young & Company (now Ernst & Young LLP); Chief Financial Officer of Retail Banking Sector, Chase Manhattan Bank; Senior Vice President, HSBC Bank USA (formerly, Marine Midland Bank); Vice President, Citibank; Assistant Professor of Banking and Finance, Frank G. Zarb School of Business, Hofstra University; Executive Vice President DVC Group, Inc. (marketing, communications and technology). |
| Thomas M. O'Neill Birth Date: June 14, 1951 Trustee Indefinite Term Began serving: October 2006 | Principal Occupations: Director or Trustee, Chair of the Audit Committee of the Federated Fund Family; Sole Proprietor, Navigator Management Company (investment and strategic consulting). Other Directorships Held: None. Qualifications: Mr. O'Neill has served in several business, mutual fund and financial management roles and directorship positions throughout his career. Mr. O'Neill serves as Director, Medicines for Humanity and Director, The Golisano Children's Museum of Naples, Florida. Mr. O'Neill previously served as Chief Executive Officer and President, Managing Director and Chief Investment Officer, Fleet Investment Advisors; President and Chief Executive Officer, Aeltus Investment Management, Inc.; General Partner, Hellman, Jordan Management Co., Boston, MA; Chief Investment Officer, The Putnam Companies, Boston, MA; Credit Analyst and Lending Officer, Fleet Bank; Director and Consultant, EZE Castle Software (investment order management software); and Director, Midway Pacific (lumber). |
| P. Jerome Richey Birth Date: February 23, 1949 Trustee Indefinite Term Began serving: October 2013 | Principal Occupations: Director or Trustee of the Federated Fund Family; Management Consultant. Other Directorships Held: None. Qualifications: Mr. Richey has served in several business and legal management roles and directorship positions throughout his career. Mr. Richey most recently held the positions of Senior Vice Chancellor and Chief Legal Officer, University of Pittsburgh. Mr. Richey serves as Board Member, Epilepsy Foundation of Western Pennsylvania and Board member, World Affairs Council of Pittsburgh. Mr. Richey previously served as Chief Legal Officer and Executive Vice President, CONSOL Energy Inc. and Shareholder, Buchanan Ingersoll & Rooney PC (a law firm). |
| John S. Walsh Birth Date: November 28, 1957 Trustee Indefinite Term Began serving: January 1999 | Principal Occupations: Director or Trustee of the Federated Fund Family; President and Director, Heat Wagon, Inc. (manufacturer of construction temporary heaters); President and Director, Manufacturers Products, Inc. (distributor of portable construction heaters); President, Portable Heater Parts, a division of Manufacturers Products, Inc. Other Directorships Held: None. Qualifications: Mr. Walsh has served in several business management roles and directorship positions throughout his career. Mr. Walsh previously served as Vice President, Walsh & Kelly, Inc. (paving contractors). |
| Name Birth Date Address Positions Held with Trust Date Service Began | Principal Occupation(s) for Past Five Years and Previous Position(s) |
| John W. McGonigle Birth Date: October 26, 1938 EXECUTIVE VICE PRESIDENT AND SECRETARY Officer since: September 1993 | Principal Occupations: Executive Vice President and Secretary of the Federated Fund Family; Vice Chairman, Executive Vice President, Secretary and Director, Federated Investors, Inc. Previous Positions: Trustee, Federated Investment Management Company and Federated Investment Counseling; Director, Federated Global Investment Management Corp., Federated Services Company and Federated Securities Corp. |
| Lori A. Hensler Birth Date: January 6, 1967 TREASURER Officer since: April 2013 | Principal Occupations: Principal Financial Officer and Treasurer of the Federated Fund Family; Senior Vice President, Federated Administrative Services; Financial and Operations Principal for Federated Securities Corp. and Edgewood Services, Inc.; and Assistant Treasurer, Federated Investors Trust Company. Ms. Hensler has received the Certified Public Accountant designation. Previous Positions: Controller of Federated Investors, Inc.; Senior Vice President and Assistant Treasurer, Federated Investors Management Company; Treasurer, Federated Investors Trust Company; Assistant Treasurer, Federated Administrative Services, Federated Administrative Services, Inc., Federated Securities Corp., Edgewood Services, Inc., Federated Advisory Services Company, Federated Equity Management Company of Pennsylvania, Federated Global Investment Management Corp., Federated Investment Counseling, Federated Investment Management Company, Passport Research, Ltd., and Federated MDTA, LLC; Financial and Operations Principal for Federated Securities Corp., Edgewood Services, Inc. and Southpointe Distribution Services, Inc. |
| Peter J. Germain Birth Date: September 3, 1959 CHIEF LEGAL OFFICER Officer since: January 2005 | Principal Occupations: Mr. Germain is Chief Legal Officer of the Federated Fund Family. He is General Counsel and Vice President, Federated Investors, Inc.; President, Federated Administrative Services and Federated Administrative Services, Inc.; Vice President, Federated Securities Corp.; Secretary, Federated Private Asset Management, Inc.; and Secretary, Retirement Plan Service Company of America. Mr. Germain joined Federated in 1984 and is a member of the Pennsylvania Bar Association. Previous Positions: Deputy General Counsel, Special Counsel, Managing Director of Mutual Fund Services, Federated Investors, Inc.; Senior Vice President, Federated Services Company; and Senior Corporate Counsel, Federated Investors, Inc. |
| Richard B. Fisher Birth Date: May 17, 1923 Vice President Officer since: September 1993 | Principal Occupations: Vice Chairman or Vice President of some of the Funds in the Federated Fund Family; Vice Chairman, Federated Investors, Inc.; Chairman, Federated Securities Corp. Previous Positions: President and Director or Trustee of some of the Funds in the Federated Fund Family; Executive Vice President, Federated Investors, Inc.; Director and Chief Executive Officer, Federated Securities Corp. |
| John B. Fisher Birth Date: May 16, 1956 President Officer since: November 2004 | Principal Occupations: President, Director/Trustee and CEO, Federated Advisory Services Company, Federated Equity Management Company of Pennsylvania, Federated Global Investment Management Corp., Federated Investment Counseling, Federated Investment Management Company; President and CEO of Passport Research, Ltd.; President of some of the Funds in the Federated Fund Family; Director, Federated Investors Trust Company. Previous Positions: President and Director of the Institutional Sales Division of Federated Securities Corp.; President and Director of Federated Investment Counseling; Director, Edgewood Securities Corp.; Director, Federated Services Company; Director, Federated Investors, Inc.; Chairman and Director, Southpointe Distribution Services, Inc.; President, Technology, Federated Services Company. |
| Stephen Van Meter Birth Date: June 5, 1975 CHIEF COMPLIANCE OFFICER AND SENIOR VICE PRESIDENT Officer since: July 2015 | Principal Occupations: Senior Vice President and Chief Compliance Officer of the Federated Fund Family; Vice President and Chief Compliance Officer of Federated Investors, Inc. and Chief Compliance Officer of certain of its subsidiaries. Mr. Van Meter joined Federated in October 2011. He holds FINRA licenses under Series 3, 7, 24 and 66. Previous Positions: Mr. Van Meter previously held the position of Compliance Operating Officer, Federated Investors, Inc. Prior to joining Federated, Mr. Van Meter served at the United States Securities and Exchange Commission in the positions of Senior Counsel, Office of Chief Counsel, Division of Investment Management and Senior Counsel, Division of Enforcement. |
| Stephen F. Auth Birth Date: September 3, 1956 101 Park Avenue 41st Floor New York, NY 10178 CHIEF INVESTMENT OFFICER Officer since: November 2002 | Principal Occupations: Stephen F. Auth is Chief Investment Officer of various Funds in the Federated Fund Family; Executive Vice President, Federated Investment Counseling, Federated Global Investment Management Corp. and Federated Equity Management Company of Pennsylvania. Previous Positions: Executive Vice President, Federated Investment Management Company and Passport Research, Ltd. (investment advisory subsidiary of Federated); Senior Vice President, Global Portfolio Management Services Division; Senior Vice President, Federated Investment Management Company and Passport Research, Ltd.; Senior Managing Director and Portfolio Manager, Prudential Investments. |
| Robert J. Ostrowski Birth Date: April 26, 1963 Chief Investment Officer Officer since: May 2004 | Principal Occupations: Robert J. Ostrowski joined Federated in 1987 as an Investment Analyst and became a Portfolio Manager in 1990. He was named Chief Investment Officer of Federated's taxable fixed-income products in 2004 and also serves as a Senior Portfolio Manager. Mr. Ostrowski became an Executive Vice President of the Fund's Adviser in 2009 and served as a Senior Vice President of the Fund's Adviser from 1997 to 2009. Mr. Ostrowski has received the Chartered Financial Analyst designation. He received his M.S. in Industrial Administration from Carnegie Mellon University. |
| Deborah A. Cunningham Birth Date: September 15, 1959 Chief Investment Officer Officer since: June 2012 | Principal Occupations: Deborah A. Cunningham was named Chief Investment Officer of Federated's money market products in 2004. She joined Federated in 1981 and has been a Senior Portfolio Manager since 1997 and an Executive Vice President of the Fund's Adviser since 2009. Ms. Cunningham has received the Chartered Financial Analyst designation and holds an M.S.B.A. in Finance from Robert Morris College. |

Federated Investors Funds
4000 Ericsson Drive
Warrendale, PA 15086-7561
or call 1-800-341-7400.
CUSIP 313916819
2016 ©Federated Investors, Inc.
| 1 | Please see the footnotes to the line graphs under “Fund Performance and Growth of a $10,000 Investment” below for the definition of, and more information about, the Blended Index. |
| 2 | There are no guarantees that dividend-paying stocks will continue to pay dividends. In addition, dividend-paying stocks may not experience the same capital appreciation potential as non-dividend-paying stocks. |
| 3 | Please see the footnotes to the line graphs under “Fund Performance and Growth of a $10,000 Investment” below for the definition of, and more information about, the S&P 500 Index. |
| 4 | Bond prices are sensitive to changes in interest rates and a rise in interest rates can cause a decline in their prices. |
| 5 | The Fund's use of derivative instruments involves risks different from, or possibly greater than, the risks associated with investing directly in securities or other traditional instruments. |
| 6 | Volatility is a statistical measurement of the frequency and level of changes in the value of an asset, index or instrument without regard to the direction of those changes. Volatility may result from rapid and dramatic price swings. There can be no guarantee that the Fund will maintain its target annualized volatility. Furthermore, while the volatility management portion of the strategy seeks enhanced returns with more consistent volatility levels over time, attaining and maintaining the target volatility does not ensure that the Fund will deliver enhanced returns. |
| 7 | High-yield, lower-rated securities generally entail greater market, credit and liquidity risks than investment-grade securities and may include higher volatility and higher risk of default. |
| 8 | International investing involves special risks including currency risk, increased volatility, political risks and differences in auditing and other financial standards. Prices of emerging markets securities can be significantly more volatile than the prices of securities in developed countries and currency risk and political risks are accentuated in emerging markets. |
| 9 | The value of some mortgage-backed securities may be particularly sensitive to changes in the prevailing interest rates, and although the securities are generally supported by some form of government or private insurance, there is no assurance that private guarantors or insurers will meet their obligations. |
| 10 | Investment-grade securities are securities that are rated at least “BBB- (minus)” or unrated securities of a comparable quality. Noninvestment-grade securities are securities that are not rated at least “BBB- (minus)” or unrated securities of a comparable quality. Credit ratings are an indication of the risk that a security will default. They do not protect a security from credit risk. Lower-rated bonds typically offer higher yields to help compensate investors for the increased risk associated with them. Among these risks are lower credit-worthiness, greater price volatility, more risk to principal and income than with higher-rated securities and increased possibilities of default. |
| 11 | Duration is a measure of a security's price sensitivity to changes in interest rates. Securities with longer durations are more sensitive to changes in interest rates than securities of shorter durations. |
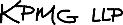
| Federated Managed Volatility Fund II | NA | S&P 500 | R1000V | Blended Index | |
| F | NA | I | I | I | |
| 12/31/2005 | 10,000 | 10,000 | 10,000 | 10,000 | |
| 12/31/2006 | 11,564 | 11,579 | 12,225 | 11,393 | |
| 12/31/2007 | 12,031 | 12,216 | 12,203 | 11,720 | |
| 12/31/2008 | 9,579 | 7,696 | 7,707 | 9,105 | |
| 12/31/2009 | 12,288 | 9,733 | 9,224 | 11,603 | |
| 12/31/2010 | 13,773 | 11,199 | 10,654 | 13,133 | |
| 12/31/2011 | 14,430 | 11,435 | 10,696 | 13,659 | |
| 12/31/2012 | 16,385 | 13,265 | 12,569 | 15,602 | |
| 12/31/2013 | 19,948 | 17,562 | 16,657 | 17,546 | |
| 12/31/2014 | 20,748 | 19,966 | 18,898 | 18,954 | |
| 12/31/2015 | 19,162 | 20,242 | 18,174 | 18,623 |
| 1 Year | 5 Years | 10 Years | |
| Fund | -7.64% | 6.83% | 6.72% |
| S&P 500 | 1.38% | 12.57% | 7.31% |
| R1000V | -3.83% | 11.27% | 6.16% |
| Blended Index | -1.75% | 7.23% | 6.42% |
| 1 | The Fund's performance assumes the reinvestment of all dividends and distributions. The S&P 500, R1000V and the Blended Index have been adjusted to reflect reinvestment of dividends on securities in the indexes. |
| 2 | The S&P 500 is a capitalization-weighted index of 500 stocks designed to measure performance of the broad domestic economy through changes in the aggregate market value of 500 stocks representing all major industries. |
| 3 | The S&P 500, R1000V and the Blended Index are not adjusted to reflect sales charges, expenses or other fees that the Securities and Exchange Commission requires to be reflected in the Fund's performance. The indexes are unmanaged and, unlike the Fund, are not affected by cash flows. It is not possible to invest directly in an index. |
| 4 | The Russell 1000® Value Index measures the performance of the large-cap value segment of the U.S. equity universe. It includes those Russell 1000® Index companies with lower price-to-book ratios and lower expected growth values. The R1000V is constructed to provide a comprehensive and unbiased barometer for the large-cap value segment. The R1000V is completely reconstituted annually to ensure new and growing equities are included and that the represented companies continue to reflect value characteristics. The BEMAI tracks total returns for external-currency-denominated debt instruments of the emerging markets. The BHY2%ICI is an issuer-constrained version of the Barclays U.S. Corporate High-Yield Index that measures the market of USD-denominated, noninvestment-grade, fixed-rate, taxable corporate bonds. The index follows the same rules as the uncapped index but limits the exposure of each issuer to 2% of the total market value and redistributes any excess market value index-wide on a pro-rata basis. The BMB covers agency mortgage-backed pass-through securities (both fixed-rate and hybrid ARM) issued by Ginnie Mae (GNMA), Fannie Mae (FNMA) and Freddie Mac (FHLMC). |
| Portfolio Composition | Percentage of Total Net Assets |
| Domestic Equity Securities | 34.6% |
| Domestic Fixed-Income Securities | 33.0% |
| International Fixed-Income Securities | 22.3% |
| International Equity Securities | 3.5% |
| U.S. Treasury Security | 0.1% |
| Derivative Contracts2,3 | (0.0)% |
| Other Security Types4 | 0.3% |
| Cash Equivalents5 | 4.6% |
| Other Assets and Liabilities—Net6 | 1.6% |
| TOTAL | 100.0% |
| Sector Composition of Equity Holdings | Percentage of Equity Securities |
| Financials | 28.7% |
| Information Technology | 13.3% |
| Health Care | 13.0% |
| Industrials | 12.2% |
| Energy | 10.8% |
| Consumer Discretionary | 7.7% |
| Consumer Staples | 6.7% |
| Utilities | 3.2% |
| Telecommunication Services | 2.8% |
| Materials | 1.6% |
| TOTAL | 100.0% |
| 1 | See the Fund's Prospectus and Statement of Additional Information for a description of the types of securities in which the Fund invests. As of the date specified above, the Fund owned shares of one or more affiliated investment companies. For purposes of this table, the affiliated investment company (other than an affiliated money market mutual fund) is not treated as a single portfolio security, but rather the Fund is treated as owning a pro rata portion of each security and each other asset and liability owned by the affiliated investment company. Accordingly, the percentages of total net assets shown in the table will differ from those presented on the Portfolio of Investments. |
| 2 | Based upon net unrealized appreciation (depreciation) or value of the derivative contracts as applicable. Derivative contracts may consist of futures, forwards, options and swaps. The impact of a derivative contract on the Fund's performance may be larger than its unrealized appreciation (depreciation) or value may indicate. In many cases, the notional value or amount of a derivative contract may provide a better indication of the contract's significance to the portfolio. More complete information regarding the Fund's direct investments in derivative contracts, including unrealized appreciation (depreciation), value and notional values or amounts of such contracts, can be found in the table at the end of the Portfolio of Investments included in this Report. |
| 3 | Represent less than 0.1%. |
| 4 | Other Security Types consist of purchased options. |
| 5 | Cash Equivalents include any investments in money market mutual funds and/or overnight repurchase agreements. |
| 6 | Assets, other than investments in securities and derivative contracts, less liabilities. See Statement of Assets and Liabilities. |
| 7 | Sector classifications are based upon, and individual portfolio securities are assigned to, the classifications of the Global Industry Classification Standard (GICS) except that the Adviser assigns a classification to securities not classified by the GICS and to securities for which the Adviser does not have access to the classification made by the GICS. |
| Principal Amount, Contracts or Shares | Value | ||
| COMMON STOCKS—37.6% | |||
| Consumer Discretionary—2.9% | |||
| 43,121 | Best Buy Co., Inc. | $1,313,034 | |
| 15,277 | Big Lots, Inc. | 588,776 | |
| 28,471 | Darden Restaurants, Inc. | 1,811,894 | |
| 16,497 | Delphi Automotive PLC | 1,414,288 | |
| 17,812 | Foot Locker, Inc. | 1,159,383 | |
| 16,014 | Home Depot, Inc. | 2,117,851 | |
| 15,107 | Kohl's Corp. | 719,546 | |
| 27,874 | Lowe's Cos., Inc. | 2,119,539 | |
| 56,686 | M.D.C. Holdings, Inc. | 1,447,194 | |
| 33,736 | Pulte Group, Inc. | 601,176 | |
| 39,537 | TJX Cos., Inc. | 2,803,569 | |
| 9,680 | Target Corp. | 702,865 | |
| 17,593 | Walt Disney Co. | 1,848,672 | |
| TOTAL | 18,647,787 | ||
| Consumer Staples—2.6% | |||
| 58,623 | Altria Group, Inc. | 3,412,445 | |
| 37,015 | Archer-Daniels-Midland Co. | 1,357,710 | |
| 12,367 | Campbell Soup Co. | 649,886 | |
| 15,509 | ConAgra Foods, Inc. | 653,860 | |
| 169,251 | Koninklijke Ahold NV- ADR | 3,577,120 | |
| 33,683 | PepsiCo, Inc. | 3,365,605 | |
| 36,608 | Philip Morris International, Inc. | 3,218,209 | |
| TOTAL | 16,234,835 | ||
| Energy—4.1% | |||
| 27,203 | Apache Corp. | 1,209,718 | |
| 104,122 | Baker Hughes, Inc. | 4,805,230 | |
| 37,716 | Ensco PLC | 580,449 | |
| 53,153 | Marathon Oil Corp. | 669,196 | |
| 71,132 | Marathon Petroleum Corp. | 3,687,483 | |
| 18,024 | National Oilwell Varco, Inc. | 603,624 | |
| 100,816 | Noble Corp. PLC | 1,063,609 | |
| 401,883 | Technip SA | 5,025,547 | |
| 39,233 | Tesoro Petroleum Corp. | 4,133,981 | |
| 58,838 | Valero Energy Corp. | 4,160,435 | |
| TOTAL | 25,939,272 | ||
| Financials—10.9% | |||
| 17,952 | American Financial Group, Inc., Ohio | 1,293,980 | |
| 141,948 | American International Group, Inc. | 8,796,518 | |
| 33,276 | Assurant, Inc. | 2,680,049 | |
| 422,085 | Bank of America Corp. | 7,103,691 | |
| 11,166 | Capital One Financial Corp. | 805,962 | |
| 42,669 | Comerica, Inc. | 1,784,844 | |
| 60,746 | Corporate Office Properties Trust | 1,326,085 | |
| 8,568 | Digital Realty Trust, Inc. | 647,912 | |
| 23,692 | Discover Financial Services | 1,270,365 |
| Principal Amount, Contracts or Shares | Value | ||
| COMMON STOCKS—continued | |||
| Financials—continued | |||
| 11,292 | Goldman Sachs Group, Inc. | $2,035,157 | |
| 179,170 | Hartford Financial Services Group, Inc. | 7,786,728 | |
| 178,886 | Hospitality Properties Trust | 4,677,869 | |
| 127,016 | J.P. Morgan Chase & Co. | 8,386,866 | |
| 74,671 | Lincoln National Corp. | 3,752,964 | |
| 101,728 | Morgan Stanley | 3,235,968 | |
| 37,525 | Old Republic International Corp. | 699,091 | |
| 30,054 | PNC Financial Services Group | 2,864,447 | |
| 3,272 | Public Storage | 810,474 | |
| 81,922 | Retail Properties of America, Inc. | 1,209,988 | |
| 32,653 | STORE Capital Corp. | 757,550 | |
| 108,673 | The Bank of New York Mellon Corp. | 4,479,501 | |
| 47,716 | Wells Fargo & Co. | 2,593,842 | |
| TOTAL | 68,999,851 | ||
| Health Care—5.0% | |||
| 41,809 | Aetna, Inc. | 4,520,389 | |
| 16,555 | Amgen, Inc. | 2,687,373 | |
| 15,354 | Anthem, Inc. | 2,140,962 | |
| 29,375 | Cardinal Health, Inc. | 2,622,306 | |
| 43,729 | Gilead Sciences, Inc. | 4,424,937 | |
| 16,993 | GlaxoSmithKline PLC, ADR | 685,668 | |
| 39,475 | Johnson & Johnson | 4,054,872 | |
| 61,788 | Merck & Co., Inc. | 3,263,642 | |
| 20,984 | Pfizer, Inc. | 677,364 | |
| 9,867 | St. Jude Medical, Inc. | 609,485 | |
| 86,441 | TEVA Pharmaceutical-SP ADR | 5,673,987 | |
| TOTAL | 31,360,985 | ||
| Industrials—4.6% | |||
| 39,701 | Alaska Air Group, Inc. | 3,196,328 | |
| 35,705 | Boeing Co. | 5,162,586 | |
| 9,571 | Caterpillar, Inc. | 650,445 | |
| 29,260 | Delta Air Lines, Inc. | 1,483,189 | |
| 23,131 | Deluxe Corp. | 1,261,565 | |
| 36,037 | Eaton Corp PLC | 1,875,365 | |
| 35,211 | General Dynamics Corp. | 4,836,583 | |
| 21,948 | General Electric Co. | 683,680 | |
| 11,634 | Lockheed Martin Corp. | 2,526,323 | |
| 21,981 | Manpower Group, Inc. | 1,852,779 | |
| 65,334 | Masco Corp. | 1,848,952 | |
| 28,718 | Nielsen Holdings PLC | 1,338,259 | |
| 7,220 | Northrop Grumman Corp. | 1,363,208 | |
| 6,553 | Parker-Hannifin Corp. | 635,510 | |
| 6,033 | Stanley Black & Decker, Inc. | 643,902 | |
| TOTAL | 29,358,674 | ||
| Information Technology—4.6% | |||
| 39,174 | Apple, Inc. | 4,123,455 | |
| 86,986 | Avnet, Inc. | 3,726,480 | |
| 24,046 | CA, Inc. | 686,754 | |
| 42,492 | CSRA, Inc. | 1,274,760 |
| Principal Amount, Contracts or Shares | Value | ||
| COMMON STOCKS—continued | |||
| Information Technology—continued | |||
| 215,124 | Cisco Systems, Inc. | $5,841,692 | |
| 42,736 | Computer Sciences Corp. | 1,396,612 | |
| 125,951 | EMC Corp. Mass | 3,234,422 | |
| 46,423 | HP, Inc. | 549,648 | |
| 46,423 | Hewlett Packard Enterprise Co. | 705,630 | |
| 25,030 | Intel Corp. | 862,284 | |
| 4,439 | International Business Machines Corp. | 610,895 | |
| 25,696 | Jabil Circuit, Inc. | 598,460 | |
| 84,911 | Maxim Integrated Products, Inc. | 3,226,618 | |
| 23,802 | Microsoft Corp. | 1,320,535 | |
| 61,156 | Xerox Corp. | 650,088 | |
| TOTAL | 28,808,333 | ||
| Materials—0.6% | |||
| 50,713 | Avery Dennison Corp. | 3,177,677 | |
| 11,951 | Dow Chemical Co. | 615,237 | |
| TOTAL | 3,792,914 | ||
| Telecommunication Services—1.1% | |||
| 16,120 | BCE, Inc. | 622,554 | |
| 53,693 | CenturyLink, Inc. | 1,350,916 | |
| 103,335 | Verizon Communications | 4,776,144 | |
| TOTAL | 6,749,614 | ||
| Utilities—1.2% | |||
| 30,327 | Duke Energy Corp. | 2,165,045 | |
| 31,943 | Entergy Corp. | 2,183,623 | |
| 33,447 | NiSource, Inc. | 652,551 | |
| 69,691 | Public Service Enterprises Group, Inc. | 2,696,345 | |
| TOTAL | 7,697,564 | ||
| TOTAL COMMON STOCKS (IDENTIFIED COST $232,929,621) | 237,589,829 | ||
| STRUCTURED SECURITY—0.5% | |||
| Information Technology—0.5% | |||
| $29,100 | 1,2 | AAPL, Issued by JPMorgan Chase Bank, ELN, 8.200%, 2/23/2016 (IDENTIFIED COST $3,630,659) | 3,097,986 |
| ADJUSTABLE RATE MORTGAGE—0.0% | |||
| 13,665 | Federal National Mortgage Association, 2.311%, 09/01/2037 (IDENTIFIED COST $13,763) | 14,502 | |
| ASSET-BACKED SECURITY—0.0% | |||
| 225,000 | Santander Drive Auto Receivables Trust 2013-1, Class D, 2.270%, 01/15/2019 (IDENTIFIED COST $224,972) | 224,880 | |
| COLLATERALIZED MORTGAGE OBLIGATIONS—0.8% | |||
| 1,000,000 | Citigroup Commercial Mortgage Trust 2013-GC11 B, 3.732%, 04/10/2046 | 985,289 | |
| 55,000 | Commercial Mortgage Pass-Through Certificates 2012-LC4 B, 4.934%, 12/10/2044 | 59,655 | |
| 620,000 | Commercial Mortgage Trust 2014-LC17 B, 4.490%, 10/10/2047 | 643,326 | |
| 439,873 | Federal National Mortgage Association REMIC 2006-117 GF, 0.772%, 12/25/2036 | 439,679 | |
| 414,622 | Federal National Mortgage Association REMIC 2012-1 F, 0.872%, 02/25/2042 | 416,241 | |
| 630,000 | GS Mortgage Securities Corp. II 2012-GCJ7 B, 4.740%, 05/10/2045 | 665,603 | |
| 980,000 | GS Mortgage Securities Trust 2014-GC24 B, 4.507%, 09/10/2047 | 1,008,005 | |
| 590,000 | 1,2 | UBS-Barclays Commercial Mortgage Trust 2013-C6 B, 3.875%, 04/10/2046 | 586,494 |
| Principal Amount, Contracts or Shares | Value | ||
| COLLATERALIZED MORTGAGE OBLIGATIONS—continued | |||
| $495,000 | WF-RBS Commercial Mortgage Trust 2014-C25 B, 4.236%, 11/15/2047 | $499,359 | |
| TOTAL COLLATERALIZED MORTGAGE OBLIGATIONS (IDENTIFIED COST $5,346,387) | 5,303,651 | ||
| COMMERCIAL MORTGAGE-BACKED SECURITIES—0.3% | |||
| Consumer Discretionary—0.3% | |||
| 1,050,000 | 1,2 | FREMF Mortgage Trust 2013-K25, Class B, 3.618%, 11/25/2045 | 1,030,116 |
| 790,000 | 1,2 | FREMF Mortgage Trust 2015-K49, Class B, 3.848%, 10/25/2048 | 697,957 |
| TOTAL COMMERCIAL MORTGAGE-BACKED SECURITIES (IDENTIFIED COST $1,782,397) | 1,728,073 | ||
| CORPORATE BONDS—15.1% | |||
| Aerospace/Defense—0.0% | |||
| 225,000 | 1,2 | Embraer Overseas Ltd., Sr. Unsecd. Note, Series 144A, 5.696%, 09/16/2023 | 219,937 |
| 40,000 | 1,2 | Latam Airlines 2015-1 Pass Through Trust, Series 144A, 4.200%, 11/15/2027 | 37,600 |
| TOTAL | 257,537 | ||
| Agency—0.1% | |||
| 540,000 | Export-Import Bank, Series EMTN, 4.000%, 08/07/2017 | 554,256 | |
| Automotive—0.1% | |||
| 480,000 | 1,2 | Hyundai Capital America, Sr. Unsecd. Note, Series 144A, 2.550%, 02/06/2019 | 476,691 |
| 350,000 | 1,2 | NEMAK SA, Series 144A, 5.500%, 02/28/2023 | 352,625 |
| TOTAL | 829,316 | ||
| Banking—2.9% | |||
| 300,000 | ADCB Finance Cayman, Ltd., Series EMTN, 4.500%, 03/06/2023 | 301,137 | |
| 510,000 | 1,2 | BBVA Bancomer SA Mexico, Jr. Sub. Note, Series 144A, 5.350%, 11/12/2029 | 502,350 |
| 200,000 | BBVA Bancomer SA Texas, Sub. Note, Series REGS, 6.500%, 03/10/2021 | 213,000 | |
| 300,000 | BBVA Paraguay SA, Series REGS, 9.750%, 02/11/2016 | 300,925 | |
| 400,000 | Banco Bradesco (Cayman), Sub., Series REGS, 5.750%, 03/01/2022 | 375,000 | |
| 200,000 | Banco Btg Pactual/Cayman, Series REGS, 4.000%, 01/16/2020 | 149,200 | |
| 500,000 | Banco Davivienda S A, Series REGS, 5.875%, 07/09/2022 | 500,625 | |
| 100,000 | Banco de Credito del Peru, Jr. Sub. Note, Series REGS, 9.750%, 11/06/2069 | 115,000 | |
| 200,000 | Banco de Credito del Peru, Series REGS, 6.125%, 04/24/2027 | 210,000 | |
| 100,000 | Banco Del Estado, Sr. Unsecd. Note, Series REGS, 4.125%, 10/07/2020 | 103,343 | |
| 600,000 | Banco Do Brasil (Cayman), Series REGS, 5.875%, 01/26/2022 | 511,500 | |
| 419,000 | Banco Do Brasil S.A., 3.875%, 10/10/2022 | 320,535 | |
| 500,000 | Banco Internacional del Peru, Sr. Unsecd. Note, Series REGS, 5.750%, 10/07/2020 | 536,250 | |
| 200,000 | 1,2 | Banco Reservas Rep Domin, Series 144A, 7.000%, 02/01/2023 | 197,147 |
| 150,000 | Banco Santander Chile SA, Sr. Unsecd. Note, Series REGS, 3.875%, 09/20/2022 | 149,733 | |
| 600,000 | Bank of China (Hong Kong) Ltd., Sr. Unsecd. Note, Series EMTN, 2.875%, 06/30/2020 | 603,015 | |
| 510,000 | 1,2 | Bank of China Ltd., Series 144A, 5.000%, 11/13/2024 | 526,986 |
| 600,000 | Bank of China Ltd., Sub. Note, Series REGS, 5.000%, 11/13/2024 | 619,983 | |
| 350,000 | Bbva Banco Continental, Series REGS, 5.000%, 08/26/2022 | 358,750 | |
| 200,000 | Caixa Economica Federal, Series REGS, 3.500%, 11/07/2022 | 153,000 | |
| 300,000 | 1,2 | Corpbanca, Series 144A, 3.875%, 09/22/2019 | 297,976 |
| 500,000 | Emirates NBD Tier 1 Ltd., 5.750%, 05/29/2049 | 480,885 | |
| 1,400,000 | Export-Import Bank Korea, Sr. Unsecd. Note, 2.625%, 12/30/2020 | 1,398,254 | |
| 1,000,000 | Export-Import Bank of China/The via Avi Funding Co. Ltd., Sr. Unsecd. Note, Series REGS, 3.800%, 09/16/2025 | 999,565 | |
| 800,000 | Export-Import Bank of India, Sr. Unsecd. Note, Series EMTN, 3.875%, 10/02/2019 | 824,162 | |
| 250,000 | ICICI Bank Ltd., Series REGS, 5.750%, 11/16/2020 | 277,509 | |
| 750,000 | Industrial & Commercial Bank of China, Sr. Unsecd. Note, Series MTN, 2.905%, 11/13/2020 | 744,716 | |
| 600,000 | Industrial and Commercial Bank of China Ltd., Jr. Sub. Note, Series REGS, 6.000%, 12/29/2049 | 638,791 | |
| 400,000 | 1,2 | Industrial Bank of Korea, Sr. Unsecd. Note, Series 144A, 2.000%, 04/23/2020 | 392,795 |
| Principal Amount, Contracts or Shares | Value | ||
| CORPORATE BONDS—continued | |||
| Banking—continued | |||
| $300,000 | Itau Unibanco Holding SA, Sr. Unsecd. Note, Series REGS, 2.850%, 05/26/2018 | $286,050 | |
| 300,000 | Itau Unibanco Holding SA, Sub., Series REGS, 5.500%, 08/06/2022 | 273,375 | |
| 200,000 | Kookmin Bank, Series REGS, 1.625%, 07/14/2017 | 199,165 | |
| 300,000 | Korea Development Bank, Sr. Unsecd. Note, 2.250%, 05/18/2020 | 298,592 | |
| 200,000 | Korea Development Bank, Sr. Unsecd. Note, 2.875%, 08/22/2018 | 203,503 | |
| 600,000 | Korea Development Bank, Sr. Unsecd. Note, 3.000%, 09/14/2022 | 604,128 | |
| 200,000 | 1,2 | NongHyup Bank, Sr. Unsecd. Note, Series 144A, 2.250%, 09/19/2017 | 200,718 |
| 630,000 | 1,2 | RSHB Capital S.A., Series 144A, 5.100%, 07/25/2018 | 625,899 |
| 500,000 | 1,2 | Turkiye Halk Bankasi AS, Sr. Unsecd. Note, Series 144A, 4.750%, 02/11/2021 | 477,482 |
| 290,000 | 1,2 | Turkiye Is Bankasi (Isbank), Series 144A, 5.000%, 06/25/2021 | 283,255 |
| 230,000 | Vnesheconombank (VEB), Series REGS, 5.942%, 11/21/2023 | 215,624 | |
| 200,000 | Vnesheconombank (VEB), Series REGS, 6.025%, 07/05/2022 | 189,878 | |
| 720,000 | Vnesheconombank (VEB), Sr. Unsecd. Note, Series REGS, 6.902%, 07/09/2020 | 730,796 | |
| 200,000 | 1,2 | Vnesheconombank, Sr. Unsecd. Note, Series 144A, 5.375%, 02/13/2017 | 201,246 |
| 200,000 | 1,2 | Woori Bank, Sub. Note, Series 144A, 5.875%, 04/13/2021 | 224,932 |
| 200,000 | 1,2 | Yapi ve Kredi Bankasi A.S., Series 144A, 5.250%, 12/03/2018 | 203,484 |
| TOTAL | 18,020,259 | ||
| Basic Industry - Chemicals—0.2% | |||
| 400,000 | Albemarle Corp., 4.150%, 12/01/2024 | 383,003 | |
| 400,000 | Albemarle Corp., Sr. Unsecd. Note, 5.450%, 12/01/2044 | 388,228 | |
| 285,000 | Valspar Corp., Sr. Unsecd. Note, 3.300%, 02/01/2025 | 272,119 | |
| 450,000 | Valspar Corp., Sr. Unsecd. Note, 4.400%, 02/01/2045 | 403,762 | |
| TOTAL | 1,447,112 | ||
| Beverage & Tobacco—0.0% | |||
| 250,000 | Ajecorp BV, Series REGS, 6.500%, 05/14/2022 | 108,750 | |
| Broadcast Radio & TV—0.0% | |||
| 232,000 | Grupo Televisa S.A., Sr. Note, 8.500%, 03/11/2032 | 281,148 | |
| Building & Development—0.0% | |||
| 100,000 | Odebrecht Finance Ltd., Sr. Unsecd. Note, Series REGS, 7.500%, 09/29/2049 | 54,125 | |
| Building Materials—0.1% | |||
| 700,000 | 1,2 | Cemex S.A. de C.V.,Series 144A, 6.500%, 12/10/2019 | 677,250 |
| Chemicals & Plastics—0.5% | |||
| 275,000 | Alfa S.A., Sr. Unsecd. Note, Series REGS, 6.875%, 03/25/2044 | 256,438 | |
| 200,000 | Braskem America Finance , Series REGS, 7.125%, 07/22/2041 | 150,000 | |
| 400,000 | Braskem Finance Ltd., Series REGS, 5.750%, 04/15/2021 | 350,000 | |
| 475,000 | 1,2 | Groupe Office Cherifien des Phosphates SA, Series 144A, 6.875%, 04/25/2044 | 468,032 |
| 550,000 | 1,2 | Groupe Office Cherifien des Phosphates SA, Sr. Unsecd. Note, Series 144A, 4.500%, 10/22/2025 | 514,285 |
| 450,000 | 1,2 | Groupe Office Cherifien des Phosphates SA, Sr. Unsecd. Note, Series 144A, 5.625%, 04/25/2024 | 458,396 |
| 200,000 | Groupe Office Cherifien des Phosphates SA, Sr. Unsecd. Note, Series REGS, 6.875%, 04/25/2044 | 197,066 | |
| 200,000 | Mexichem SA de CV, Sr. Unsecd. Note, Series REGS, 5.875%, 09/17/2044 | 168,500 | |
| 500,000 | Sinochem Offshore Capital Co. Ltd., Sr. Unsecd. Note, Series REGS, 3.250%, 04/29/2019 | 504,477 | |
| 250,000 | Sinochem Overseas Capital Co. Ltd., Company Guarantee, Series REGS, 4.500%, 11/12/2020 | 262,607 | |
| TOTAL | 3,329,801 | ||
| Communications - Cable & Satellite—0.6% | |||
| 1,000,000 | 1,2 | CCO Safari II LLC, Series 144A, 6.484%, 10/23/2045 | 1,002,972 |
| 1,400,000 | DIRECTV Holdings LLC, Sr. Unsecd. Note, 5.150%, 03/15/2042 | 1,308,874 | |
| 1,500,000 | Time Warner Cable, Inc., Company Guarantee, 5.500%, 09/01/2041 | 1,359,930 | |
| TOTAL | 3,671,776 |
| Principal Amount, Contracts or Shares | Value | ||
| CORPORATE BONDS—continued | |||
| Communications - Media & Entertainment—0.6% | |||
| $1,000,000 | CBS Corp., 4.900%, 08/15/2044 | $912,521 | |
| 1,400,000 | Viacom, Inc., Sr. Unsecd. Note, 5.850%, 09/01/2043 | 1,260,393 | |
| 1,400,000 | WPP Finance 2010, Sr. Unsecd. Note, 5.125%, 09/07/2042 | 1,325,485 | |
| TOTAL | 3,498,399 | ||
| Communications - Telecom Wireless—0.1% | |||
| 640,000 | America Movil S.A.B. de C.V., Company Guarantee, 5.000%, 03/30/2020 | 695,875 | |
| Communications - Telecom Wirelines—0.1% | |||
| 700,000 | Verizon Communications, Inc., Sr. Unsecd. Note, 6.550%, 09/15/2043 | 833,916 | |
| Conglomerates—0.1% | |||
| 400,000 | CITIC Ltd., Sr. Unsecd. Note, Series EMTN, 6.875%, 01/21/2018 | 432,316 | |
| 400,000 | Hutch Whampoa Int. 12 Ltd., Series REGS, 6.000%, 05/29/2049 | 419,162 | |
| TOTAL | 851,478 | ||
| Consumer Cyclical - Automotive—0.2% | |||
| 1,000,000 | General Motors Co., Sr. Unsecd. Note, 5.200%, 04/01/2045 | 944,856 | |
| Consumer Cyclical - Retailers—0.1% | |||
| 1,000,000 | Bed Bath & Beyond, Inc., 5.165%, 08/01/2044 | 849,965 | |
| Consumer Cyclical - Services—0.1% | |||
| 370,000 | Alibaba Group Holding Lt, Sr. Unsecd. Note, 3.125%, 11/28/2021 | 359,520 | |
| 500,000 | Alibaba Group Holding Lt, Sr. Unsecd. Note, 3.600%, 11/28/2024 | 479,421 | |
| TOTAL | 838,941 | ||
| Consumer Non-Cyclical - Food/Beverage—0.0% | |||
| 100,000 | Cosan Overseas Ltd., 8.250%, 11/29/2049 | 80,750 | |
| Consumer Non-Cyclical - Tobacco—0.1% | |||
| 680,000 | Reynolds American, Inc., Sr. Unsecd. Note, Series, 7.000%, 08/04/2041 | 766,673 | |
| Consumer Products—0.1% | |||
| 180,000 | Fomento Economico Mexicano, SA de C.V., 2.875%, 05/10/2023 | 168,488 | |
| 200,000 | Fomento Economico Mexicano, SA de C.V., 4.375%, 05/10/2043 | 177,790 | |
| TOTAL | 346,278 | ||
| Energy - Integrated—0.2% | |||
| 500,000 | CNPC General Capital Ltd., Sr. Unsecd. Note, Series EMTN, 2.700%, 11/25/2019 | 499,026 | |
| 150,000 | Petroleos Mexicanos, 6.500%, 06/02/2041 | 130,425 | |
| 1,050,000 | Petroleos Mexicanos, Sr. Unsecd. Note, 6.375%, 01/23/2045 | 893,950 | |
| TOTAL | 1,523,401 | ||
| Energy - Midstream—0.2% | |||
| 1,400,000 | Kinder Morgan Energy Partners LP, Sr. Unsecd. Note, 6.375%, 03/01/2041 | 1,171,029 | |
| Energy - Oil Field Services—0.2% | |||
| 1,400,000 | Weatherford International Ltd., 7.000%, 03/15/2038 | 978,250 | |
| Energy - Refining—0.1% | |||
| 620,000 | Phillips 66, Sr. Unsecd. Note, 4.875%, 11/15/2044 | 555,382 | |
| Farming & Agriculture—0.2% | |||
| 1,000,000 | 1,2 | Kazagro Natl Mgmt Hldng., Series 144A, 4.625%, 05/24/2023 | 859,534 |
| 100,000 | Marfrig Overseas Ltd., Series REGS, 9.500%, 05/04/2020 | 98,500 | |
| TOTAL | 958,034 | ||
| Finance—0.3% | |||
| 350,000 | 1,2 | Africa Finance Corp., Sr. Unsecd. Note, Series 144A, 4.375%, 04/29/2020 | 352,222 |
| 300,000 | 1,2 | Corp Financi De Desarrol, Sr. Unsecd. Note, Series 144A, 4.750%, 07/15/2025 | 296,250 |
| 650,000 | MAF Global Securities, 7.125%, 10/29/2049 | 661,063 |
| Principal Amount, Contracts or Shares | Value | ||
| CORPORATE BONDS—continued | |||
| Finance—continued | |||
| $700,000 | Sukuk Funding No3 Ltd., 4.348%, 12/03/2018 | $724,388 | |
| TOTAL | 2,033,923 | ||
| Financial Institution - Banking—0.9% | |||
| 150,000 | Bank of America Corp., Sub. Note, 6.500%, 09/15/2037 | 173,479 | |
| 900,000 | Bank of America Corp., Sub. Note, Series MTN, 4.000%, 01/22/2025 | 883,418 | |
| 1,500,000 | Goldman Sachs Group, Inc., Sr. Unsecd. Note, 6.250%, 02/01/2041 | 1,795,222 | |
| 850,000 | J.P. Morgan Chase & Co., Sub. Note, 3.375%, 05/01/2023 | 837,208 | |
| 650,000 | Merrill Lynch & Co., Inc., Sub. Note, 7.750%, 05/14/2038 | 884,008 | |
| 450,000 | Morgan Stanley, Sr. Unsecd. Note, Series MTN, 6.250%, 08/09/2026 | 528,261 | |
| 475,000 | Morgan Stanley, Sub. Note, Series MTN, 4.100%, 05/22/2023 | 480,953 | |
| TOTAL | 5,582,549 | ||
| Financial Institution - Broker/Asset Mgr/Exchange—0.1% | |||
| 500,000 | Jefferies Group LLC, Sr. Unsecd. Note, 6.500%, 01/20/2043 | 463,669 | |
| 400,000 | Jefferies Group, Inc., Sr. Unsecd. Note, 6.250%, 01/15/2036 | 371,463 | |
| TOTAL | 835,132 | ||
| Financial Institution - Insurance - P&C—0.2% | |||
| 800,000 | 1,2 | Liberty Mutual Group, Inc., Series 144A, 4.850%, 08/01/2044 | 743,788 |
| 500,000 | 1,2 | Nationwide Mutual Insurance Co., Sub. Note, Series 144A, 9.375%, 08/15/2039 | 729,925 |
| TOTAL | 1,473,713 | ||
| Financial Institution - REIT - Other—0.2% | |||
| 1,000,000 | WP Carey, Inc., Sr. Unsecd. Note, 4.600%, 04/01/2024 | 999,265 | |
| Financial Intermediaries—0.2% | |||
| 400,000 | ADIB Capital Invest 1 Ltd, 6.375%, 10/29/2049 | 405,520 | |
| 150,000 | 1,2 | Banco Santander, S.A., Series 144A, 4.125%, 11/09/2022 | 150,188 |
| 350,000 | Banco Santander, S.A., Series REGS, 4.125%, 11/09/2022 | 350,437 | |
| 200,000 | 1,2 | Investcorp SA, Series 144A, 8.250%, 11/01/2017 | 203,013 |
| 200,000 | Ooredoo International Finance Ltd., Series REGS, 3.375%, 10/14/2016 | 202,444 | |
| TOTAL | 1,311,602 | ||
| Food Products—0.1% | |||
| 300,000 | Grupo Bimbo SAB de CV, Sr. Unsecd. Note, Series REGS, 3.875%, 06/27/2024 | 292,606 | |
| 120,000 | JBS USA LLC/JBS USA Finance, Inc., Sr. Unsecd. Note, Series REGS, 8.250%, 02/01/2020 | 120,600 | |
| TOTAL | 413,206 | ||
| Metals & Mining—0.5% | |||
| 100,000 | CSN Resources SA, Series REGS, 6.500%, 07/21/2020 | 49,750 | |
| 500,000 | China Hongqiao Group, 7.625%, 06/26/2017 | 498,657 | |
| 200,000 | 1,2 | Codelco, Inc., Series 144A, 3.000%, 07/17/2022 | 179,897 |
| 200,000 | Codelco, Inc., Series REGS, 3.000%, 07/17/2022 | 179,896 | |
| 600,000 | 1,2 | Codelco, Inc., Sr. Unsecd. Note, Series 144A, 4.875%, 11/04/2044 | 482,061 |
| 600,000 | GTL Trade Finance, Inc., Sr. Unsecd. Note, Series REGS, 7.250%, 10/20/2017 | 595,500 | |
| 280,000 | 1,2 | Petra Diamonds US Treasury PLC, Series 144A, 8.250%, 05/31/2020 | 230,300 |
| 375,000 | Southern Copper Corp., Sr. Unsecd. Note, 3.875%, 04/23/2025 | 337,557 | |
| 600,000 | Vale Overseas Ltd., 4.375%, 01/11/2022 | 455,004 | |
| TOTAL | 3,008,622 | ||
| Oil & Gas—2.2% | |||
| 390,335 | 2 | Afren PLC, Series 144A, 6.625%, 12/09/2020 | 7,885 |
| 195,167 | 3,4 | Afren PLC, Series REGS, 11.500%, 02/01/2016 | 3,942 |
| 1,000,000 | CNOOC Finance 2014 ULC, 4.250%, 04/30/2024 | 1,011,189 | |
| 300,000 | Empresa Nacional del Petroleo, Note, Series REGS, 5.250%, 08/10/2020 | 310,724 |
| Principal Amount, Contracts or Shares | Value | ||
| CORPORATE BONDS—continued | |||
| Oil & Gas—continued | |||
| $300,000 | 1,2 | KazMunaiGaz Finance Sub B.V., Company Guarantee, Series 144A, 6.375%, 04/09/2021 | $309,967 |
| 500,000 | KazMunaiGaz Finance Sub B.V., Series REGS, 6.375%, 04/09/2021 | 516,612 | |
| 400,000 | Korea National Oil Corp., Sr. Unsecd. Note, Series REGS, 3.250%, 07/10/2024 | 401,334 | |
| 374,000 | ONGC Videsh Ltd., 3.750%, 05/07/2023 | 365,380 | |
| 400,000 | Pacific Rubiales Energy Corp., Sr. Unsecd. Note, Series REGS, 5.625%, 01/19/2025 | 82,000 | |
| 350,000 | Pemex Project Funding Master Trust, Sr. Unsecd. Note, 6.625%, 06/15/2038 | 309,750 | |
| 1,900,000 | Pertamina Persero PT, Sr. Unsecd. Note, Series REGS, 5.625%, 05/20/2043 | 1,496,522 | |
| 351,000 | Pertamina PT, Note, Series REGS, 5.250%, 05/23/2021 | 350,989 | |
| 150,000 | Petrobras Global Finance BV, 3.405%, 03/17/2020 | 106,875 | |
| 100,000 | Petrobras Global Finance BV, Sr. Unsecd. Note, 3.250%, 03/17/2017 | 92,750 | |
| 1,000,000 | Petrobras Global Finance BV, Sr. Unsecd. Note, 4.375%, 05/20/2023 | 662,500 | |
| 340,000 | Petrobras Global Finance BV, Sr. Unsecd. Note, 5.625%, 05/20/2043 | 208,250 | |
| 300,000 | Petrobras International Finance Co., 5.875%, 03/01/2018 | 267,750 | |
| 400,000 | Petrobras International Finance Co., 6.875%, 01/20/2040 | 262,000 | |
| 300,000 | Petrobras International Finance Co., Company Guarantee, 7.875%, 03/15/2019 | 266,250 | |
| 600,000 | Petrobras International Finance Co., Sr. Unsecd. Note, 5.750%, 01/20/2020 | 472,500 | |
| 103,000 | Petroleos Mexicanos, 3.500%, 07/18/2018 | 102,461 | |
| 200,000 | Petroleos Mexicanos, Company Guarantee, 5.500%, 01/21/2021 | 202,240 | |
| 450,000 | Petroleos Mexicanos, Sr. Unsecd. Note, 4.875%, 01/18/2024 | 420,750 | |
| 1,300,000 | 1,2 | Petroleos Mexicanos, Sr. Unsecd. Note, Series 144A, 4.500%, 01/23/2026 | 1,145,300 |
| 240,000 | Petroleos Mexicanos, Sr. Unsecd. Note, Series REGS, 5.625%, 01/23/2046 | 184,548 | |
| 300,000 | 1,2 | Petroleos Mexicanos, Unsecd. Note, Series 144A, 5.625%, 01/23/2046 | 230,685 |
| 100,000 | Petroleum Co. of Trinidad, Sr. Unsecd. Note, Series REGS, 9.750%, 08/14/2019 | 104,500 | |
| 500,000 | Petronas Capital Ltd., Sr. Unsecd. Note, Series REGS, 3.500%, 03/18/2025 | 481,551 | |
| 100,000 | Petronas Capital Ltd., Sr. Unsecd. Note, Series REGS, 4.500%, 03/18/2045 | 95,165 | |
| 500,000 | 1,2 | Puma International Financing SA, Series 144A, 6.750%, 02/01/2021 | 494,125 |
| 250,000 | 1,2 | Reliance Industries Ltd., Sr. Unsecd. Note, Series 144A, 4.875%, 02/10/2045 | 226,355 |
| 800,000 | Sinopec Group Overseas Development 2015 Ltd., Sr. Unsecd. Note, Series REGS, 3.250%, 04/28/2025 | 759,270 | |
| 300,000 | 1,2 | Thai Oil PCL, Series 144A, 4.875%, 01/23/2043 | 282,497 |
| 300,000 | Thai Oil PCL, Series REGS, 4.875%, 01/23/2043 | 282,497 | |
| 1,300,000 | Tupras Turkiye Petrol Ra, Series REGS, 4.125%, 05/02/2018 | 1,298,810 | |
| TOTAL | 13,815,923 | ||
| Paper Products—0.0% | |||
| 150,000 | Fibria Overseas Finance, Sr. Unsecd. Note, 5.250%, 05/12/2024 | 142,875 | |
| Railroad—0.1% | |||
| 600,000 | 1,2 | Lima Metro Line 2 Finance Ltd., Series 144A, 5.875%, 07/05/2034 | 585,000 |
| Real Estate—0.5% | |||
| 500,000 | China Oversea Fin Ky III, 6.375%, 10/29/2043 | 526,731 | |
| 1,100,000 | China Overseas Finance Cayman V Ltd., Sr. Unsecd. Note, Series A, 3.950%, 11/15/2022 | 1,093,688 | |
| 600,000 | Country Garden Holdings, Sr. Unsecd. Note, 7.500%, 03/09/2020 | 639,551 | |
| 600,000 | Franshion Brilliant Ltd., 5.750%, 03/19/2019 | 641,392 | |
| 200,000 | 1,2 | Qatari Diar Finance QSC, Foreign Gov't. Guarantee, Series 144A, 5.000%, 07/21/2020 | 221,142 |
| 300,000 | Wanda Properties Oversea, Sr. Unsecd. Note, 4.875%, 11/21/2018 | 308,801 | |
| TOTAL | 3,431,305 | ||
| Retailers—0.0% | |||
| 200,000 | Saci Falabella, Series REGS, 3.750%, 04/30/2023 | 195,086 | |
| Software & Services—0.1% | |||
| 500,000 | 1,2 | Tencent Holdings Ltd., Sr. Unsecd. Note, Series 144A, 3.800%, 02/11/2025 | 491,011 |
| Principal Amount, Contracts or Shares | Value | ||
| CORPORATE BONDS—continued | |||
| Sovereign—0.2% | |||
| $304,687 | Angola, Government of, Sr. Unsecd. Note, Series REGS, 7.000%, 08/16/2019 | $293,323 | |
| 400,000 | 1,2 | Georgia, Government of, Series 144A, 7.750%, 07/05/2017 | 416,812 |
| 350,000 | Mexico, Government of, Series REGS, 4.875%, 01/15/2024 | 346,500 | |
| TOTAL | 1,056,635 | ||
| State/Provincial—0.6% | |||
| 1,100,000 | 1,2 | Buenos Aires, City of, Sr. Unsecd. Note, Series 144A, 8.950%, 02/19/2021 | 1,166,000 |
| 1,700,000 | Provincia De Buenos Aires, Series REGS, 10.875%, 01/26/2021 | 1,793,500 | |
| 900,000 | Provincia De Buenos Aires, Series REGS, 9.375%, 09/14/2018 | 918,000 | |
| TOTAL | 3,877,500 | ||
| Technology—0.3% | |||
| 630,000 | Fidelity National Informa, Sr. Unsecd. Note, 5.000%, 10/15/2025 | 651,517 | |
| 300,000 | Lenovo Group Ltd., Sr. Unsecd. Note, 4.700%, 05/08/2019 | 310,392 | |
| 945,000 | Microsoft Corp., Sr. Unsecd. Note, 4.000%, 02/12/2055 | 850,595 | |
| TOTAL | 1,812,504 | ||
| Technology Services—0.1% | |||
| 400,000 | 1,2 | Samsung Electron America, Series 144A, 1.750%, 04/10/2017 | 399,210 |
| Telecommunications & Cellular—0.4% | |||
| 200,000 | America Movil S.A.B. de C.V., 6.125%, 11/15/2037 | 217,695 | |
| 40,000 | Axtel SAB de CV, Series REGS, 9.000%, 01/31/2020 | 41,700 | |
| 275,000 | 1,2 | Bharti Airtel International Netherlands BV, Series 144A, 5.350%, 05/20/2024 | 289,664 |
| 270,000 | Bharti Airtel International Netherlands BV, Series REGs, 5.125%, 03/11/2023 | 280,122 | |
| 40,000 | 1,2 | Colombia Telecomunicaciones SA ESP, Sub. Note, Series 144A, 8.500%, 12/29/2049 | 34,500 |
| 200,000 | 1,2 | Digicel Ltd., Series 144A, 6.000%, 04/15/2021 | 169,500 |
| 220,000 | Oi S.A., Series REGS, 5.750%, 02/10/2022 | 102,300 | |
| 400,000 | 1,2 | Qtel International Finance Ltd., Series 144A, 3.250%, 02/21/2023 | 389,990 |
| 400,000 | 1,2 | Turkcell Iletisim Hizmetleri A.S., Unsecd. Note, Series 144A, 5.750%, 10/15/2025 | 387,380 |
| 600,000 | Vimpelcom, Sr. Unsecd. Note, Series REGS, 5.200%, 02/13/2019 | 590,400 | |
| TOTAL | 2,503,251 | ||
| Transportation—0.2% | |||
| 1,500,000 | 1,2 | DP World Ltd., Series 144A, 6.850%, 07/02/2037 | 1,481,250 |
| Transportation - Services—0.1% | |||
| 480,000 | 1,2 | Enterprise Rent-A-Car USA Finance Co., Sr. Unsecd. Note, Series 144A, 4.500 2/15/2045 | 447,819 |
| Utilities—0.8% | |||
| 200,000 | 1,2 | ContourGlobal Power Holdings SA, Series 144A, 7.125%, 06/01/2019 | 190,500 |
| 675,000 | 1,2 | Electricite de France SA, Jr. Sub. Note, Series 144A, 5.625%, 12/29/2049 | 644,456 |
| 600,000 | Empresa de Energia de Bogota SA, Sr. Unsecd. Note, Series REGS, 6.125%, 11/10/2021 | 618,000 | |
| 580,000 | 1,2 | Empresa Electrica Angamo, Series 144A, 4.875%, 05/25/2029 | 519,122 |
| 800,000 | 1,2 | Enel Finance International SA, Company Guarantee, Series 144A, 6.000%, 10/07/2039 | 897,523 |
| 400,000 | Eskom Holdings Ltd., Sr. Unsecd. Note, Series REGS, 5.750%, 01/26/2021 | 349,494 | |
| 350,000 | Inkia Energy Ltd., Series REGS, 8.375%, 04/04/2021 | 342,650 | |
| 490,000 | Israel Electric Corp. Ltd., Series REGS, 7.250%, 01/15/2019 | 544,910 | |
| 200,000 | Majapahit Holding BV, Series REGS, 7.875%, 06/29/2037 | 217,000 | |
| 300,000 | Power Sector Assets & Liabilities Management Corp., Company Guarantee, Series REGS, 7.390%, 12/02/2024 | 388,140 | |
| TOTAL | 4,711,795 | ||
| Utility - Electric—0.1% | |||
| 400,000 | Saudi Electric Global Sukuk, Series REGS, 4.000%, 04/08/2024 | 397,580 | |
| TOTAL CORPORATE BONDS (IDENTIFIED COST $100,154,980) | 95,131,313 |
| Principal Amount, Contracts or Shares | Value | ||
| FOREIGN GOVERNMENTS/AGENCIES—8.6% | |||
| Banking—0.2% | |||
| $1,365,000 | African Export-Import Bank, Series EMTN, 5.750%, 07/27/2016 | $1,385,463 | |
| Sovereign—8.4% | |||
| 1,250,000 | 1,2 | Angola, Government of, Sr. Unsecd. Note, Series 144A, 9.500%, 11/12/2025 | 1,162,500 |
| 1,009,467 | Argentina, Government of, Note, Series $DSC, 8.280%, 12/31/2033 | 1,133,127 | |
| 1,093,590 | Argentina, Government of, Note, Series NY, 8.280%, 12/31/2033 | 1,257,628 | |
| 300,000 | 1,2 | Armenia, Government of, Sr. Unsecd. Note, Series 144A, 6.000%, 09/30/2020 | 290,889 |
| 900,000 | 1,2 | Armenia, Government of, Unsecd. Note, Series 144A, 7.150%, 03/26/2025 | 869,499 |
| 400,000 | Azerbaijan, Government of, Sr. Unsecd. Note, Series REGS, 4.750%, 03/18/2024 | 373,112 | |
| 200,000 | 1,2 | Bolivia, Government of, Series 144A, 4.875%, 10/29/2022 | 203,500 |
| 3,800,000 | Brazil, Government of, Sr. Unsecd. Note, 5.625%, 01/07/2041 | 2,755,000 | |
| 330,000 | 1,2 | Cameroon, Government of, Sr. Unsecd. Note, Series 144A, 9.500%, 11/19/2025 | 306,900 |
| 250,000 | Chile, Government of, 3.625%, 10/30/2042 | 217,500 | |
| 1,000,000 | Colombia, Government of, Sr. Unsecd. Note, 5.000%, 06/15/2045 | 835,000 | |
| 500,000 | Colombia, Government of, Sr. Unsecd. Note, 5.625%, 02/26/2044 | 456,250 | |
| 500,000 | Costa Rica, Government of, Series REGS, 4.375%, 04/30/2025 | 420,000 | |
| 800,000 | 1,2 | Croatia, Government of, Series 144A, 6.000%, 01/26/2024 | 833,384 |
| 700,000 | Croatia, Government of, Sr. Unsecd. Note, Series REGS, 6.250%, 04/27/2017 | 725,220 | |
| 250,000 | 1,2 | Dominican Republic, Government of, Series 144A, 5.875%, 04/18/2024 | 249,375 |
| 400,000 | 1,2 | Dominican Republic, Government of, Sr. Unsecd. Note, Series 144A, 5.500%, 01/27/2025 | 385,000 |
| 500,000 | Dubai, Government of, Series EMTN, 5.250%, 01/30/2043 | 421,895 | |
| 200,000 | Ecuador, Government of, Series REGS, 7.950%, 06/20/2024 | 147,500 | |
| 400,000 | Egypt, Government of, Note, Series REGS, 6.875%, 04/30/2040 | 324,000 | |
| 400,000 | 1,2 | Egypt, Government of, Sr. Unsecd. Note, Series 144A, 5.875%, 06/11/2025 | 346,680 |
| 1,900,000 | El Salvador, Government , Series REGS, 7.625%, 02/01/2041 | 1,607,875 | |
| 400,000 | 1,2 | Gabon, Government of, Unsecd. Note, Series 144A, 6.950%, 06/16/2025 | 318,080 |
| 200,000 | Guatemala, Government of, Sr. Unsecd. Note, Series REGS, 5.750%, 06/06/2022 | 209,500 | |
| 200,000 | Honduras, Government of, Series REGS, 8.750%, 12/16/2020 | 221,000 | |
| 156,000 | Hungary, Government of, 4.125%, 02/19/2018 | 162,488 | |
| 350,000 | Hungary, Government of, 5.750%, 11/22/2023 | 391,615 | |
| 1,766,000 | Hungary, Government of, 6.375%, 03/29/2021 | 2,013,240 | |
| 335,000 | Hungary, Government of, Unsecd. Note, 6.250%, 01/29/2020 | 374,624 | |
| 780,000 | 1,2 | Indonesia, Government of, Series 144A, 3.375%, 04/15/2023 | 724,809 |
| 800,000 | Indonesia, Government of, Series REGS, 5.375%, 10/17/2023 | 831,750 | |
| 800,000 | ndonesia, Government of, Series REGS, 5.875%, 03/13/2020 | 867,154 | |
| 300,000 | 1,2 | Indonesia, Government of, Sr. Unsecd. Note, Series 144A, 5.950%, 01/08/2046 | 295,373 |
| 1,000,000 | 1,2 | Indonesia, Government of, Unsecd. Note, Series 144A, 4.350%, 09/10/2024 | 955,920 |
| 600,000 | Iraq, Government of, Bond, Series REGS, 5.800%, 01/15/2028 | 403,824 | |
| 600,000 | 1,2 | Ivory Coast, Government of, Series 144A, 5.375%, 07/23/2024 | 532,248 |
| 300,000 | 1,2 | Ivory Coast, Government of, Unsecd. Note, Series 144A, 6.375%, 03/03/2028 | 273,024 |
| 200,000 | Jamaica, Government of, 7.875%, 07/28/2045 | 194,500 | |
| 200,000 | Jamaica, Government of, Sr. Unsecd. Note, 6.750%, 04/28/2028 | 198,500 | |
| 250,000 | 1,2 | Kazakhstan, Government of, Company Guarantee, Series 144A, 6.375%, 10/06/2020 | 247,050 |
| 300,000 | Kazakhstan, Government of, Series REGS, 4.875%, 10/14/2044 | 250,257 | |
| 300,000 | 1,2 | Kazakhstan, Government of, Sr. Unsecd. Note, Series 144A, 5.125%, 07/21/2025 | 295,656 |
| 2,000,000 | Lebanon, Government of, Sr. Unsecd. Note, Series REGS, 6.650%, 02/26/2030 | 1,940,160 | |
| 300,000 | Mexico, Government of, Note, 5.125%, 01/15/2020 | 327,000 | |
| 1,000,000 | Mexico, Government of, Note, 6.050%, 01/11/2040 | 1,095,000 | |
| 1,200,000 | Mexico, Government of, Sr. Unsecd. Note, 3.600%, 01/30/2025 | 1,169,400 | |
| 200,000 | 1,2 | Mongolia, Government of, Series 144A, 4.125%, 01/05/2018 | 182,760 |
| Principal Amount, Contracts or Shares | Value | ||
| FOREIGN GOVERNMENTS/AGENCIES—continued | |||
| Sovereign—continued | |||
| $200,000 | 1,2 | Pakistan, Government of, Series 144A, 7.250%, 04/15/2019 | $203,697 |
| 400,000 | 1,2 | Pakistan, Government of, Unsecd. Note, Series 144A, 6.750%, 12/03/2019 | 402,390 |
| 700,000 | Panama, Government of, Sr. Unsecd. Note, 3.750%, 03/16/2025 | 686,000 | |
| 500,000 | 1,2 | Paraguay, Government of, Series 144A, 6.100%, 08/11/2044 | 477,500 |
| 605,000 | Peru, Government of, Sr. Unsecd. Note, 5.625%, 11/18/2050 | 617,100 | |
| 600,000 | Philippines, Government, Sr. Unsecd. Note, 3.950%, 01/20/2040 | 606,982 | |
| 800,000 | Philippines, Government of, 6.375%, 01/15/2032 | 1,020,926 | |
| 200,000 | Qatar, Govenrment of, Series REGS, 3.125%, 01/20/2017 | 203,324 | |
| 745,000 | Republic of Ghana, Unsecd. Note, Series REGS, 8.500%, 10/04/2017 | 724,453 | |
| 500,000 | Republic of Poland, 3.000%, 03/17/2023 | 495,000 | |
| 600,000 | Republic of Poland, Sr. Unsecd. Note, 6.375%, 07/15/2019 | 685,500 | |
| 90,000 | 1,2 | Romania, Government of, Series 144A, 4.875%, 01/22/2024 | 96,687 |
| 800,000 | Romania, Government of, Series REGS, 4.375%, 08/22/2023 | 832,760 | |
| 1,000,000 | 1,2 | Russia, Government of, Sr. Unsecd. Note, Series 144A, 5.625%, 04/04/2042 | 946,000 |
| 1,500,000 | Russia, Government of, Sr. Unsecd. Note, Series REGS, 12.750%, 06/24/2028 | 2,370,990 | |
| 200,000 | Senegal, Government of, Unsecd. Note, Series REGS, 6.250%, 07/30/2024 | 178,000 | |
| 300,000 | 1,2 | Serbia, Government of, Series 144A, 5.875%, 12/03/2018 | 315,600 |
| 600,000 | 1,2 | Serbia, Government of, Series 144A, 7.250%, 09/28/2021 | 678,272 |
| 500,000 | South Africa, Government, Sr. Unsecd. Note, 5.875%, 09/16/2025 | 511,105 | |
| 600,000 | South Africa, Government of, 5.875%, 05/30/2022 | 626,518 | |
| 300,000 | 1,2 | Sri Lanka, Government of, Series 144A, 6.000%, 01/14/2019 | 293,942 |
| 300,000 | Sri Lanka, Government of, Sr. Unsecd. Note, Series REGS, 5.875%, 07/25/2022 | 273,763 | |
| 400,000 | 1,2 | Tunisia, Government of , Series 144A, 5.750%, 01/30/2025 | 346,188 |
| 1,700,000 | Turkey, Government of, 7.000%, 09/26/2016 | 1,759,500 | |
| 3,425,000 | Turkey, Government of, Sr. Unsecd. Note, 4.250%, 04/14/2026 | 3,211,115 | |
| 708 | 1,2 | Ukraine, Government of, Unsecd. Note, Series 144A, 7.750%, 09/01/2019 | 655 |
| 140,000 | 1,2 | Ukraine, Government of, Unsecd. Note, Series 144A, 7.750%, 09/01/2020 | 128,800 |
| 110,000 | 1,2 | Ukraine, Government of, Unsecd. Note, Series 144A, 7.750%, 09/01/2021 | 99,942 |
| 110,000 | 1,2 | Ukraine, Government of, Unsecd. Note, Series 144A, 7.750%, 09/01/2022 | 99,636 |
| 110,000 | 1,2 | Ukraine, Government of, Unsecd. Note, Series 144A, 7.750%, 09/01/2023 | 97,922 |
| 110,000 | 1,2 | Ukraine, Government of, Unsecd. Note, Series 144A, 7.750%, 09/01/2024 | 97,340 |
| 110,000 | 1,2 | Ukraine, Government of, Unsecd. Note, Series 144A, 7.750%, 09/01/2025 | 96,754 |
| 110,000 | 1,2 | Ukraine, Government of, Unsecd. Note, Series 144A, 7.750%, 09/01/2026 | 95,713 |
| 110,000 | 1,2 | Ukraine, Government of, Unsecd. Note, Series 144A, 7.750%, 09/01/2027 | 95,700 |
| 220,000 | 1,2 | Ukraine, Government of, Unsecd. Note, Series GDP., 1.000%, 05/31/2040 | 86,900 |
| 300,000 | Ukraine, Government of, Unsecd. Note, Series REGS, 7.750%, 09/01/2026 | 261,036 | |
| 600,000 | Uruguay, Government of, 4.375%, 10/27/2027 | 589,500 | |
| 600,000 | Uruguay, Government of, Sr. Unsecd. Note, 5.100%, 06/18/2050 | 517,500 | |
| 4,750,000 | Venezuela, Government of, Series REGS, 7.000%, 03/31/2038 | 1,769,375 | |
| 200,000 | Vietnam, Government of, Sr. Unsecd. Note, Series REGS, 4.800%, 11/19/2024 | 192,076 | |
| 700,000 | 1,2 | Zambia, Government of, Series 144A, 8.970%, 07/30/2027 | 552,090 |
| TOTAL | 53,141,017 | ||
| TOTAL FOREIGN GOVERNMENTS/AGENCIES (IDENTIFIED COST $57,284,726) | 54,526,480 | ||
| MORTGAGE-BACKED SECURITIES—4.3% | |||
| Federal Home Loan Mortgage Corporation—1.2% | |||
| 603,287 | Federal Home Loan Mortgage Corp. Pool A95704, 3.500%, 30 Year, 12/01/2040 | 622,605 | |
| 574,296 | Federal Home Loan Mortgage Corp. Pool G08554, 3.500%, 30 Year, 10/01/2043 | 592,238 | |
| 1,477,603 | Federal Home Loan Mortgage Corp. Pool G08563, 4.000%, 30 Year, 01/01/2044 | 1,563,938 |
| Principal Amount, Contracts or Shares | Value | ||
| MORTGAGE-BACKED SECURITIES—continued | |||
| Federal Home Loan Mortgage Corporation—continued | |||
| $1,147,340 | Federal Home Loan Mortgage Corp. Pool G08567, 4.000%, 30 Year, 01/01/2044 | $1,214,378 | |
| 1,819,637 | Federal Home Loan Mortgage Corp. Pool G08608, 3.000%, 30 Year, 09/01/2044 | 1,821,221 | |
| 15,330 | Federal Home Loan Mortgage Corp. Pool J07260, 4.500%, 15 Year, 03/01/2023 | 16,373 | |
| 1,169,115 | Federal Home Loan Mortgage Corp. Pool Q19607, 4.000%, 30 Year, 07/01/2043 | 1,238,886 | |
| 412,306 | Federal Home Loan Mortgage Corp. Pool Q21934, 4.000%, 30 Year, 09/01/2043 | 436,525 | |
| TOTAL | 7,506,164 | ||
| Government National Mortgage Association—0.9% | |||
| 13,753 | Government National Mortgage Association Pool 2796, 7.000%, 08/20/2029 | 16,042 | |
| 7,063 | Government National Mortgage Association Pool 3040, 7.000%, 02/20/2031 | 8,256 | |
| 19,134 | Government National Mortgage Association Pool 3188, 6.500%, 01/20/2032 | 22,059 | |
| 26,037 | Government National Mortgage Association Pool 3239, 6.500%, 05/20/2032 | 30,075 | |
| 1,650,017 | Government National Mortgage Association Pool MA2445, 3.500%, 30 Year, 12/20/2044 | 1,722,698 | |
| 1,829,084 | Government National Mortgage Association Pool MA2520, 3.000%, 30 Year, 01/20/2045 | 1,857,401 | |
| 2,081,540 | Government National Mortgage Association Pool MA2521, 3.500%, 30 Year, 01/20/2045 | 2,173,229 | |
| TOTAL | 5,829,760 | ||
| Federal National Mortgage Association—2.2% | |||
| 1,514,372 | Federal National Mortgage Association Pool AH2899, 4.500%, 30 Year, 01/01/2041 | 1,654,771 | |
| 1,600,873 | Federal National Mortgage Association Pool AL4168, 2.500%, 15 Year, 09/01/2028 | 1,619,774 | |
| 1,320,731 | Federal National Mortgage Association Pool AL6225, 3.000%, 15 Year, 01/01/2030 | 1,362,085 | |
| 75,058 | Federal National Mortgage Association Pool AO8829, 3.500%, 30 Year, 07/01/2042 | 77,544 | |
| 1,656,969 | Federal National Mortgage Association Pool AS2979, 3.000%, 15 Year, 08/01/2029 | 1,710,662 | |
| 1,710,684 | Federal National Mortgage Association Pool AS4301, 4.000%, 30 Year, 01/01/2045 | 1,811,439 | |
| 2,129,826 | Federal National Mortgage Association Pool AS4314, 2.500%, 15 Year, 01/01/2030 | 2,149,314 | |
| 1,186,014 | Federal National Mortgage Association Pool AW2446, 3.500%, 30 Year, 05/01/2044 | 1,224,548 | |
| 1,845,274 | Federal National Mortgage Association Pool AX0833, 3.500%, 30 Year, 09/01/2044 | 1,905,517 | |
| TOTAL | 13,515,654 | ||
| TOTAL MORTGAGE-BACKED SECURITIES (IDENTIFIED COST $26,950,868) | 26,851,578 | ||
| PURCHASED CALL OPTIONS—0.3% | |||
| 725 | SPDR S&P 500 ETF Trust, Strike Price: $200.00; Expiration Date: 6/17/2016 | 838,462 | |
| 2,760 | SPDR S&P 500 ETF Trust, Strike Price: $210.00; Expiration Date: 3/18/2016 | 783,840 | |
| TOTAL PURCHASED CALL OPTIONS (IDENTIFIED COST $1,727,705) | 1,622,302 | ||
| U.S. TREASURY—0.1% | |||
| 633,162 | U.S. Treasury Inflation-Protected Note, Series D-2021, 0.625%, 07/15/2021 (IDENTIFIED COST $694,073) | 637,581 | |
| INVESTMENT COMPANY—26.9% | |||
| 26,738,569 | 5 | Federated High Income Bond Fund II, Primary Shares (IDENTIFIED COST $181,702,460) | 170,057,298 |
| REPURCHASE AGREEMENT—4.4% | |||
| 28,066,000 | Interest in $600,000,000 joint repurchase agreement 0.32%, dated 12/31/2015 under which Bank of America, N.A. will repurchase a security provided as collateral for $600,021,333 on 1/4/2016. The securities provided as collateral at the end of the period held with BNY Mellon as tri-party agent, were U.S. Government Agency securities maturing on 2/25/2044 and the market value of those underlying securities was $618,021,974. (AT COST) | 28,066,000 | |
| TOTAL INVESTMENTS—98.9% (IDENTIFIED COST $640,508,611)6 | 624,851,473 | ||
| OTHER ASSETS AND LIABILITIES - NET—1.1%7 | 6,849,127 | ||
| TOTAL NET ASSETS—100% | $631,700,600 |
| Description | Number of Contracts | Notional Value | Expiration Date | Unrealized Appreciation (Depreciation) |
| 3S&P 500 Long Futures | 81 | $41,216,850 | March 2016 | $(310,088) |
| 3United States Treasury Bond Long Futures | 10 | $1,537,500 | March 2016 | $(4,555) |
| 3United States Treasury Note 5-Year Long Futures | 215 | $25,438,867 | March 2016 | $(57,673) |
| 3United States Treasury Bond Ultra Short Futures | 150 | $23,803,125 | March 2016 | $(132,174) |
| 3United States Treasury Note 10-Year Short Futures | 316 | $39,786,375 | March 2016 | $166,433 |
| NET UNREALIZED DEPRECIATION ON FUTURES CONTRACTS | $(338,057) | |||
| Counterparty | Reference Entity | Buy/ Sell | Pay/ Receive Fixed Rate | Expiration Date | Implied Credit Spread at 12/31/20158 | Notional Amount | Market Value | Upfront Premiums Paid (Received) | Unrealized Appreciation (Depreciation) |
| OTC Swaps: | |||||||||
| Barclays Capital | Series 24 EM CDX Index | Buy | 1.00% | 12/20/2020 | 3.69% | $8,624,000 | $965,820 | $985,723 | $(19,903) |
| Barclays Capital | Government of Brazil Bond | Buy | 1.00% | 12/20/2020 | 5.21% | $2,600,000 | $431,084 | $367,914 | $63,170 |
| TOTAL CREDIT DEFAULT SWAPS | $1,396,904 | $1,353,637 | $43,267 | ||||||
| 1 | Denotes a restricted security that either: (a) cannot be offered for public sale without first being registered, or being able to take advantage of an exemption from registration, under the Securities Act of 1933; or (b) is subject to a contractual restriction on public sales. At December 31, 2015, these restricted securities amounted to $43,093,857, which represented 6.8% of total net assets. |
| 2 | Denotes a restricted security that may be resold without restriction to “qualified institutional buyers” as defined in Rule 144A under the Securities Act of 1933 and that the Fund has determined to be liquid under criteria established by the Fund's Board of Trustees (the “Trustees”). At December 31, 2015, these liquid restricted securities amounted to $43,085,972, which represented 6.8% of total net assets. |
| 3 | Non-income-producing security. |
| 4 | Issuer in default. |
| 5 | Affiliated holding. |
| 6 | The cost of investments for federal tax purposes amounts to $642,730,958. |
| 7 | Assets, other than investments in securities, less liabilities. See Statement of Assets and Liabilities. |
| 8 | Implied credit spreads, represented in absolute terms, utilized in determining the market value of credit default swap agreements serve as an indicator of the current status of the payment/performance risk and represent the likelihood or risk of default for the credit derivative. The implied credit spread of a particular referenced entity reflects the cost of buying/selling protection and may include upfront payments required to be made to enter into the agreement. Wider credit spreads represent a deterioration of the referenced entity's credit soundness and a greater likelihood or risk of default or other credit event occurring as defined under the terms of the agreement. A credit spread identified as “Defaulted” indicates a credit event has occurred for the referenced entity or obligation. |
| Valuation Inputs | ||||
| Level 1— Quoted Prices | Level 2— Other Significant Observable Inputs | Level 3— Significant Unobservable Inputs | Total | |
| Equity Securities: | ||||
| Common Stocks | ||||
| Domestic | $215,732,983 | $— | $— | $215,732,983 |
| International | $21,856,846 | — | — | 21,856,846 |
| Structured Security | — | 3,097,986 | — | 3,097,986 |
| Debt Securities: | ||||
| Adjustable Rate Mortgage | — | 14,502 | — | 14,502 |
| Asset-Backed Security | — | 224,880 | — | 224,880 |
| Collateralized Mortgage Obligations | — | 5,303,651 | — | 5,303,651 |
| Commercial Mortgage-Backed Securities | — | 1,728,073 | — | 1,728,073 |
| Corporate Bonds | — | 95,131,313 | — | 95,131,313 |
| Foreign Governments/Agencies | — | 54,526,480 | — | 54,526,480 |
| Mortgage-Backed Securities | — | 26,851,578 | — | 26,851,578 |
| U.S. Treasury | — | 637,581 | — | 637,581 |
| Purchased Call Options | 1,622,302 | — | — | 1,622,302 |
| Investment Company | 170,057,298 | — | — | 170,057,298 |
| Repurchase Agreement | — | 28,066,000 | — | 28,066,000 |
| TOTAL SECURITIES | $409,269,429 | $215,582,044 | $— | $624,851,473 |
| Other Financial Instruments2 | ||||
| Assets | 166,433 | 1,396,904 | — | 1,563,337 |
| Liabilities | (504,490) | — | — | (504,490) |
| OTHER FINANCIAL INSTRUMENTS | $(338,057) | $1,396,904 | $— | $1,058,847 |
| * | Other financial instruments include futures contracts and swap contracts. |
| ADR | —American Depositary Receipt |
| ELN | —Equity-Linked Notes |
| MTN | —Medium Term Note |
| REIT | —Real Estate Investment Trust |
| REMIC | —Real Estate Mortgage Investment Conduit |
| Year Ended December 31 | 2015 | 2014 | 2013 | 2012 | 2011 |
| Net Asset Value, Beginning of Period | $10.54 | $11.30 | $9.56 | $9.22 | $9.15 |
| Income From Investment Operations: | |||||
| Net investment income1 | 0.44 | 0.54 | 0.50 | 0.44 | 0.43 |
| Net realized and unrealized gain (loss) on investments, written options, futures contracts, swap contracts and foreign currency transactions | (1.20) | (0.12) | 1.54 | 0.77 | 0.002 |
| TOTAL FROM INVESTMENT OPERATIONS | (0.76) | 0.42 | 2.04 | 1.21 | 0.43 |
| Less Distributions: | |||||
| Distributions from net investment income | (0.44) | (0.38) | (0.30) | (0.29) | (0.36) |
| Distributions from net realized gain on investments, futures contracts, swap contracts and foreign currency transactions | (0.05) | (0.80) | — | (0.58) | — |
| TOTAL DISTRIBUTIONS | (0.49) | (1.18) | (0.30) | (0.87) | (0.36) |
| Net Asset Value, End of Period | $9.29 | $10.54 | $11.30 | $9.56 | $9.22 |
| Total Return3 | (7.64)% | 4.01% | 21.74% | 13.55% | 4.77% |
| Ratios to Average Net Assets: | |||||
| Net expenses | 0.75%4 | 0.76% | 0.82% | 0.82% | 1.02%4 |
| Net investment income | 4.38% | 4.99% | 4.80% | 4.75% | 4.74% |
| Expense waiver/reimbursement5 | 0.16% | 0.15% | 0.16% | 0.16% | 0.16% |
| Supplemental Data: | |||||
| Net assets, end of period (000 omitted) | $631,701 | $652,011 | $451,067 | $235,409 | $122,494 |
| Portfolio turnover | 97% | 54% | 52% | 27% | 114% |
| Portfolio turnover (excluding purchases and sales from dollar-roll transactions) | 97% | 54% | 52% | 27% | 113% |
| 1 | Per share numbers have been calculated using the average shares method. |
| 2 | Represents less than $0.01. |
| 3 | Based on net asset value. Total returns do not reflect any additional fees or expenses that may be imposed by separate accounts of insurance companies or in connection with any variable annuity or variable life insurance contract. |
| 4 | The net expense ratio is calculated without reduction for expense offset arrangements. The net expense ratios are 0.75% and 1.02% for the years ended December 31, 2015 and 2011, respectively, after taking into account these expense reductions. |
| 5 | This expense decrease is reflected in both the net expense and the net investment income ratios shown above. |
| Assets: | ||
| Total investment in securities, at value including $170,057,298 of investment in an affiliated holding (Note 5) (identified cost $640,508,611) | $624,851,473 | |
| Cash | 1,034,973 | |
| Cash denominated in foreign currencies (identified cost $872,894) | 791,874 | |
| Restricted cash (Note 2) | 2,816,280 | |
| Income receivable | 3,048,603 | |
| Swaps, at value (premium received $1,353,637) | 1,396,904 | |
| Receivable for investments sold | 3,199,398 | |
| Receivable for shares sold | 446,396 | |
| TOTAL ASSETS | 637,585,901 | |
| Liabilities: | ||
| Payable for investments purchased | $4,315,579 | |
| Payable for shares redeemed | 302,138 | |
| Payable for daily variation margin on futures | 1,156,943 | |
| Payable for periodic payments on swap contracts | 3,430 | |
| Payable to adviser (Note 5) | 9,164 | |
| Accrued expenses (Note 5) | 98,047 | |
| TOTAL LIABILITIES | 5,885,301 | |
| Net assets for 67,991,305 shares outstanding | $631,700,600 | |
| Net Assets Consist of: | ||
| Paid-in capital | $678,085,035 | |
| Net unrealized depreciation of investments, futures contracts, swap contracts and translation of assets and liabilities in foreign currency | (16,033,079) | |
| Accumulated net realized loss on investments, futures contracts, swap contracts and foreign currency transactions | (60,074,937) | |
| Undistributed net investment income | 29,723,581 | |
| TOTAL NET ASSETS | $631,700,600 | |
| Net Asset Value, Offering Price and Redemption Proceeds Per Share: | ||
| $631,700,600 ÷ 67,991,305 shares outstanding, no par value, unlimited shares authorized | $9.29 |
| Investment Income: | |||
| Dividends (including $10,003,392 received from an affiliated holding and net of foreign taxes withheld of $218,981) | $24,818,917 | ||
| Interest | 9,970,038 | ||
| TOTAL INCOME | 34,788,955 | ||
| Expenses: | |||
| Investment adviser fee (Note 5) | $5,083,817 | ||
| Administrative fee (Note 5) | 655,421 | ||
| Custodian fees | 67,675 | ||
| Transfer agent fee | 59,676 | ||
| Directors'/Trustees' fees (Note 5) | 5,515 | ||
| Auditing fees | 32,480 | ||
| Legal fees | 9,418 | ||
| Portfolio accounting fees | 168,520 | ||
| Printing and postage | 97,584 | ||
| Miscellaneous (Note 5) | 15,989 | ||
| TOTAL EXPENSES | 6,196,095 | ||
| Reimbursement and Reduction: | |||
| Reimbursement of investment adviser fee (Note 5) | $(1,080,890) | ||
| Fees paid indirectly from directed brokerage arrangements (Note 6) | (1,608) | ||
| TOTAL REIMBURSEMENT AND REDUCTION | (1,082,498) | ||
| Net expenses | 5,113,597 | ||
| Net investment income | 29,675,358 | ||
| Realized and Unrealized Gain (Loss) on Investments, Futures Contracts, Swap Contracts and Foreign Currency Transactions: | |||
| Net realized loss on investments (including realized loss of $(1,655,881) on sales of investments in an affiliated holding (Note 5)) and foreign currency transactions | (29,977,243) | ||
| Net realized loss on futures contracts | (26,401,287) | ||
| Net realized loss on swap contracts | (133,055) | ||
| Net change in unrealized appreciation of investments and translation of assets and liabilities in foreign currency | (28,600,904) | ||
| Net change in unrealized depreciation of futures contracts | 715,071 | ||
| Net change in unrealized appreciation of swap contracts | 43,267 | ||
| Net realized and unrealized loss on investments, futures contracts, swap contracts and foreign currency transactions | (84,354,151) | ||
| Change in net assets resulting from operations | $(54,678,793) |
| Year Ended December 31 | 2015 | 2014 |
| Increase (Decrease) in Net Assets | ||
| Operations: | ||
| Net investment income | $29,675,358 | $27,876,687 |
| Net realized gain (loss) on investments, futures contracts, swap contracts and foreign currency transactions | (56,511,585) | 12,283,024 |
| Net change in unrealized appreciation/depreciation of investments, futures contracts, swap contracts and translation of assets and liabilities in foreign currency | (27,842,566) | (22,642,996) |
| CHANGE IN NET ASSETS RESULTING FROM OPERATIONS | (54,678,793) | 17,516,715 |
| Distributions to Shareholders: | ||
| Distributions from net investment income | (28,593,501) | (16,297,881) |
| Distributions from net realized gain on investments | (3,066,670) | (34,307,764) |
| CHANGE IN NET ASSETS RESULTING FROM DISTRIBUTIONS TO SHAREHOLDERS | (31,660,171) | (50,605,645) |
| Share Transactions: | ||
| Proceeds from sale of shares | 182,578,967 | 262,897,715 |
| Net asset value of shares issued to shareholders in payment of distributions declared | 31,660,171 | 50,605,645 |
| Cost of shares redeemed | (148,210,146) | (79,470,869) |
| CHANGE IN NET ASSETS RESULTING FROM SHARE TRANSACTIONS | 66,028,992 | 234,032,491 |
| Change in net assets | (20,309,972) | 200,943,561 |
| Net Assets: | ||
| Beginning of period | 652,010,572 | 451,067,011 |
| End of period (including undistributed net investment income of $29,723,581 and $28,390,343, respectively) | $631,700,600 | $652,010,572 |
| ■ | Equity securities listed on an exchange or traded through a regulated market system are valued at their last reported sale price or official closing price in their principal exchange or market. |
| ■ | Fixed-income securities acquired with remaining maturities greater than 60 days are fair valued using price evaluations provided by a pricing service approved by the Trustees. |
| ■ | Fixed-income securities and repurchase agreements acquired with remaining maturities of 60 days or less are valued at their cost (adjusted for the accretion of any discount or amortization of any premium), unless the issuer's creditworthiness is impaired or other factors indicate that amortized cost is not an accurate estimate of the investment's fair value, in which case it would be valued in the same manner as a longer-term security. |
| ■ | Shares of other mutual funds or non-exchange-traded investment companies are valued based upon their reported NAVs. |
| ■ | Derivative contracts listed on exchanges are valued at their reported settlement or closing price, except that options are valued at the mean of closing bid and asked quotations. |
| ■ | Over-the-counter (OTC) derivative contracts are fair valued using price evaluations provided by a pricing service approved by the Trustees. |
| ■ | For securities that are fair valued in accordance with procedures established by and under the general supervision of the Trustees, certain factors may be considered such as: the last traded or purchase price of the security, information obtained by contacting the issuer or dealers, analysis of the issuer's financial statements or other available documents, fundamental analytical data, the nature and duration of restrictions on disposition, the movement of the market in which the security is normally traded, public trading in similar securities or derivative contracts of the issuer or comparable issuers, movement of a relevant index, or other factors including but not limited to industry changes and relevant government actions. |
| ■ | With respect to securities traded principally in foreign markets, significant trends in U.S. equity markets or in the trading of foreign securities index futures contracts; |
| ■ | Political or other developments affecting the economy or markets in which an issuer conducts its operations or its securities are traded; |
| ■ | Announcements concerning matters such as acquisitions, recapitalizations, litigation developments, or a natural disaster affecting the issuer's operations or regulatory changes or market developments affecting the issuer's industry. |
| Security | Acquisition Date | Cost | Market Value |
| Afren PLC, Series 144A, 6.625%, 12/09/2020 | 11/26/2013 - 1/30/2014 | $389,786 | $7,885 |
| Fair Value of Derivative Instruments | ||||
| Asset | Liability | |||
| Statement of Assets and Liabilities Location | Fair Value | Statement of Assets and Liabilities Location | Fair Value | |
| Derivatives not accounted for as hedging instruments under ASC Topic 815 | ||||
| Interest rate contracts | $— | Payable for daily variation margin on futures | $27,969* | |
| Equity contracts | Total investments in securities at value-options | $1,622,302 | Payable for daily variation margin on futures | $310,088* |
| Credit contracts | Swaps, at value | $1,396,904 | — | |
| Total derivatives not accounted for as hedging instruments under ASC Topic 815 | $3,019,206 | $338,057 | ||
| * | Includes cumulative depreciation of futures contracts as reported in the footnotes to the Portfolio of Investments. Only the current day's variation margin is reported within the Statement of Assets and Liabilities. |
| Amount of Realized Gain or (Loss) on Derivatives Recognized in Income | |||||
| Credit Default Swaps | Futures Contracts | Forward Exchange Contracts | Purchased Option Contracts | Total | |
| Interest rate contracts | $— | $(1,730,255) | $— | $— | $(1,730,255) |
| Foreign exchange contracts | — | — | 1,432,960 | — | 1,432,960 |
| Credit contracts | (133,055) | — | — | — | (133,055) |
| Equity contracts | — | (24,671,032) | — | (562,337) | (25,233,369) |
| TOTAL | $(133,055) | $(26,401,287) | $1,432,960 | $(562,337) | $(25,663,719) |
| Change in Unrealized Appreciation or (Depreciation) on Derivatives Recognized in Income | ||||
| Credit Default Swaps | Futures Contracts | Purchased Option Contracts | Total | |
| Interest rate contracts | $— | $991,320 | $— | $991,320 |
| Credit contracts | 43,267 | — | — | 43,267 |
| Equity contracts | — | (276,249) | (105,403) | (381,652) |
| TOTAL | $43,267 | $715,071 | $(105,403) | $652,935 |
| Year Ended December 31 | 2015 | 2014 |
| Shares sold | 18,131,684 | 24,348,355 |
| Shares issued to shareholders in payment of distributions declared | 3,088,797 | 4,966,207 |
| Shares redeemed | (15,116,917) | (7,353,587) |
| NET CHANGE RESULTING FROM FUND SHARE TRANSACTIONS | 6,103,564 | 21,960,975 |
| Increase (Decrease) | ||
| Paid-In Capital | Undistributed Net Investment Income (Loss) | Accumulated Net Realized Gain (Loss) |
| $(111) | $251,381 | $(251,270) |
| 2015 | 2014 | |
| Ordinary income1 | $ 28,593,501 | $27,561,268 |
| Long-term capital gains | $3,066,670 | $23,044,377 |
| 1 | For tax purposes, short-term capital gain distributions are considered ordinary income distributions. |
| Undistributed ordinary income | $29,852,994 |
| Net unrealized depreciation | $(17,967,252) |
| Capital loss carryforwards | $(58,270,177) |
| Expiration Year | Short-Term | Long-Term | Total |
| No Expiration | $38,925,053 | $16,553,392 | $55,478,445 |
| 2016 | $1,610,350 | NA | $1,610,350 |
| 2017 | $1,181,382 | NA | $1,181,382 |
| Administrative Fee | Average Daily Net Assets of the Investment Complex |
| 0.150% | on the first $5 billion |
| 0.125% | on the next $5 billion |
| 0.100% | on the next $10 billion |
| 0.075% | on assets in excess of $20 billion |
| Federated High Income Bond Fund II, Primary Shares | |
| Balance of Shares Held 12/31/2014 | 24,725,686 |
| Purchases/Additions | 4,898,869 |
| Sales/Reductions | (2,885,986) |
| Balance of Shares Held 12/31/2015 | 26,738,569 |
| Value | $170,057,298 |
| Dividend Income | $10,003,392 |
| Purchases | $637,156,894 |
| Sales | $594,965,751 |
| Country | Percentage of Net Assets |
| United States | 44.4% |
| Mexico | 1.8% |
| China | 1.7% |
| Brazil | 1.2% |
| Turkey | 1.2% |
| Argentina | 1.0% |
| Israel | 1.0% |
| Other1 | 15.3% |
| 1 | Countries representing less than 1.0% have been aggregated under the designation “Other.” |
February 12, 2016
| Beginning Account Value 7/1/2015 | Ending Account Value 12/31/2015 | Expenses Paid During Period1,2 | |
| Actual | $1,000 | $927.10 | $3.69 |
| Hypothetical (assuming a 5% return before expenses) | $1,000 | $1,021.37 | $3.87 |
| 1 | Expenses are equal to the Fund's annualized net expense ratio of 0.76%, multiplied by the average account value over the period, multiplied by 184/365 (to reflect the one-half-year period). The expenses shown in the table do not include the charges and expenses imposed by the insurance company under the variable insurance product contract. Please refer to the variable insurance product prospectus for a complete listing of these expenses. |
| 2 | Actual and Hypothetical expenses paid during the period utilizing the Fund's current Fee Limit of 0.86% (as reflected in the Notes to Financial Statements, Note 5 under Expense Limitation), multiplied by the average account value over the period, multiplied by 184/365 (to reflect expenses paid as if they had been in effect throughout the most recent one-half-year period) would be $4.18 and $4.38 respectively. |
| Name Birth Date Positions Held with Trust Date Service Began | Principal Occupation(s) for Past Five Years, Other Directorships Held and Previous Position(s) |
| John F. Donahue* Birth Date: July 28, 1924 Trustee Indefinite Term Began serving: October 1993 | Principal Occupations: Director or Trustee of the Federated Fund Family; Chairman and Director, Federated Investors, Inc.; Chairman of the Federated Fund Family's Executive Committee. Previous Positions: Chairman of the Federated Fund Family; Trustee, Federated Investment Management Company; Chairman and Director, Federated Investment Counseling. |
| J. Christopher Donahue* Birth Date: April 11, 1949 Trustee Indefinite Term Began serving: October 1993 | Principal Occupations: Principal Executive Officer and President of certain of the Funds in the Federated Fund Family; Director or Trustee of the Funds in the Federated Fund Family; President, Chief Executive Officer and Director, Federated Investors, Inc.; Chairman and Trustee, Federated Investment Management Company; Trustee, Federated Investment Counseling; Chairman and Director, Federated Global Investment Management Corp.; Chairman, Federated Equity Management Company of Pennsylvania and Passport Research, Ltd. (investment advisory subsidiary of Federated); Trustee, Federated Shareholder Services Company; Director, Federated Services Company. Previous Positions: President, Federated Investment Counseling; President and Chief Executive Officer, Federated Investment Management Company, Federated Global Investment Management Corp. and Passport Research, Ltd. |
| * | Family relationships and reasons for “interested” status: John F. Donahue is the father of J. Christopher Donahue; both are “interested” due to their beneficial ownership of shares of Federated Investors, Inc. and the positions they hold with Federated and its subsidiaries. |
| Name Birth Date Positions Held with Trust Date Service Began | Principal Occupation(s) for Past Five Years, Other Directorships Held, Previous Position(s) and Qualifications |
| John T. Collins Birth Date: January 24, 1947 Trustee Indefinite Term Began serving: October 2013 | Principal Occupations: Director or Trustee of the Federated Fund Family; Retired. Other Directorships Held: Director, Chair of the Compensation Committee, Audit Committee member, KLX Corp. Qualifications: Mr. Collins has served in several business and financial management roles and directorship positions throughout his career. Mr. Collins previously served as Chairman and CEO, The Collins Group, Inc. (a private equity firm). Mr. Collins serves as Chairman Emeriti, Bentley University. Mr. Collins previously served as Director, FleetBoston Financial Corp.; Director and Audit Committee Member, Bank of America Corp. and Director, Beth Israel Deaconess Medical Center (Harvard University Affiliate Hospital). |
| G. Thomas Hough Birth Date: February 28, 1955 Trustee Indefinite Term Began serving: August 2015 | Principal Occupations: Director or Trustee of the Federated Fund Family; Retired. Other Directorships Held: Director, Chair of the Audit Committee, Governance Committee, Publix Super Markets, Inc. Qualifications: Mr. Hough has served in accounting, business management and directorship positions throughout his career. Mr. Hough most recently held the position of Americas Vice Chair of Assurance with Ernst & Young LLP. Mr. Hough is an Executive Committee member of the United States Golf Association, he serves on the President's Cabinet and Business School Board of Visitors for the University of Alabama and is on the Business School Board of Visitors for Wake Forest University. |
| Name Birth Date Positions Held with Trust Date Service Began | Principal Occupation(s) for Past Five Years, Other Directorships Held, Previous Position(s) and Qualifications |
| Maureen Lally-Green Birth Date: July 5, 1949 Trustee Indefinite Term Began serving: August 2009 | Principal Occupations: Director or Trustee of the Federated Fund Family; Adjunct Professor of Law, Duquesne University School of Law. Other Directorships Held: Director, CONSOL Energy Inc. Qualifications: Judge Lally-Green has served in various legal and business roles and directorship positions throughout her career. Judge Lally-Green previously served as: Associate General Secretary, Diocese of Pittsburgh; a member of the Superior Court of Pennsylvania; and as a Professor of Law, Duquesne University School of Law. Judge Lally-Green also holds the positions on either a public or not for profit Board of Directors as follows: Member, Pennsylvania State Board of Education (public); Director and Chair, UPMC Mercy Hospital; Regent, St. Vincent Seminary; Director, Epilepsy Foundation of Western and Central Pennsylvania; Director and Vice Chair, Our Campaign for the Church Alive!, Inc.; Director, Saint Vincent College; Director, Pennsylvania Bar Institute; and Director and Chair, Cardinal Wuerl North Catholic High School, Inc. Judge Lally-Green has held the positions of: Director, Auberle; Director, Ireland Institute of Pittsburgh; Director, Saint Thomas More Society; and Director, Catholic High Schools of the Diocese of Pittsburgh, Inc. |
| Peter E. Madden Birth Date: March 16, 1942 Trustee Indefinite Term Began serving: October 1993 | Principal Occupation: Director or Trustee, and Chair of the Board of Directors or Trustees, of the Federated Fund Family; Retired. Other Directorships Held: None. Qualifications: Mr. Madden has served in several business management, mutual fund services and directorship positions throughout his career. Mr. Madden previously served as President, Chief Operating Officer and Director, State Street Bank and Trust Company (custodian bank) and State Street Corporation (financial services). He was Director, VISA USA and VISA International and Chairman and Director, Massachusetts Bankers Association. Mr. Madden served as Director, Depository Trust Corporation and Director, The Boston Stock Exchange. Mr. Madden also served as a Representative to the Commonwealth of Massachusetts General Court. |
| Charles F. Mansfield, Jr. Birth Date: April 10, 1945 Trustee Indefinite Term Began serving: November 1999 | Principal Occupations: Director or Trustee of the Federated Fund Family; Management Consultant. Other Directorships Held: None. Qualifications: Mr. Mansfield has served in several banking, business management and educational roles and directorship positions throughout his career. Mr. Mansfield previously served as Chief Executive Officer, PBTC International Bank; Partner, Arthur Young & Company (now Ernst & Young LLP); Chief Financial Officer of Retail Banking Sector, Chase Manhattan Bank; Senior Vice President, HSBC Bank USA (formerly, Marine Midland Bank); Vice President, Citibank; Assistant Professor of Banking and Finance, Frank G. Zarb School of Business, Hofstra University; Executive Vice President DVC Group, Inc. (marketing, communications and technology). |
| Thomas M. O'Neill Birth Date: June 14, 1951 Trustee Indefinite Term Began serving: October 2006 | Principal Occupations: Director or Trustee, Chair of the Audit Committee of the Federated Fund Family; Sole Proprietor, Navigator Management Company (investment and strategic consulting). Other Directorships Held: None. Qualifications: Mr. O'Neill has served in several business, mutual fund and financial management roles and directorship positions throughout his career. Mr. O'Neill serves as Director, Medicines for Humanity and Director, The Golisano Children's Museum of Naples, Florida. Mr. O'Neill previously served as Chief Executive Officer and President, Managing Director and Chief Investment Officer, Fleet Investment Advisors; President and Chief Executive Officer, Aeltus Investment Management, Inc.; General Partner, Hellman, Jordan Management Co., Boston, MA; Chief Investment Officer, The Putnam Companies, Boston, MA; Credit Analyst and Lending Officer, Fleet Bank; Director and Consultant, EZE Castle Software (investment order management software); and Director, Midway Pacific (lumber). |
| P. Jerome Richey Birth Date: February 23, 1949 Trustee Indefinite Term Began serving: October 2013 | Principal Occupations: Director or Trustee of the Federated Fund Family; Management Consultant. Other Directorships Held: None. Qualifications: Mr. Richey has served in several business and legal management roles and directorship positions throughout his career. Mr. Richey most recently held the positions of Senior Vice Chancellor and Chief Legal Officer, University of Pittsburgh. Mr. Richey serves as Board Member, Epilepsy Foundation of Western Pennsylvania and Board member, World Affairs Council of Pittsburgh. Mr. Richey previously served as Chief Legal Officer and Executive Vice President, CONSOL Energy Inc. and Shareholder, Buchanan Ingersoll & Rooney PC (a law firm). |
| John S. Walsh Birth Date: November 28, 1957 Trustee Indefinite Term Began serving: January 1999 | Principal Occupations: Director or Trustee of the Federated Fund Family; President and Director, Heat Wagon, Inc. (manufacturer of construction temporary heaters); President and Director, Manufacturers Products, Inc. (distributor of portable construction heaters); President, Portable Heater Parts, a division of Manufacturers Products, Inc. Other Directorships Held: None. Qualifications: Mr. Walsh has served in several business management roles and directorship positions throughout his career. Mr. Walsh previously served as Vice President, Walsh & Kelly, Inc. (paving contractors). |
| Name Birth Date Address Positions Held with Trust Date Service Began | Principal Occupation(s) for Past Five Years and Previous Position(s) |
| John W. McGonigle Birth Date: October 26, 1938 EXECUTIVE VICE PRESIDENT AND SECRETARY Officer since: September 1993 | Principal Occupations: Executive Vice President and Secretary of the Federated Fund Family; Vice Chairman, Executive Vice President, Secretary and Director, Federated Investors, Inc. Previous Positions: Trustee, Federated Investment Management Company and Federated Investment Counseling; Director, Federated Global Investment Management Corp., Federated Services Company and Federated Securities Corp. |
| Lori A. Hensler Birth Date: January 6, 1967 TREASURER Officer since: April 2013 | Principal Occupations: Principal Financial Officer and Treasurer of the Federated Fund Family; Senior Vice President, Federated Administrative Services; Financial and Operations Principal for Federated Securities Corp. and Edgewood Services, Inc.; and Assistant Treasurer, Federated Investors Trust Company. Ms. Hensler has received the Certified Public Accountant designation. Previous Positions: Controller of Federated Investors, Inc.; Senior Vice President and Assistant Treasurer, Federated Investors Management Company; Treasurer, Federated Investors Trust Company; Assistant Treasurer, Federated Administrative Services, Federated Administrative Services, Inc., Federated Securities Corp., Edgewood Services, Inc., Federated Advisory Services Company, Federated Equity Management Company of Pennsylvania, Federated Global Investment Management Corp., Federated Investment Counseling, Federated Investment Management Company, Passport Research, Ltd., and Federated MDTA, LLC; Financial and Operations Principal for Federated Securities Corp., Edgewood Services, Inc. and Southpointe Distribution Services, Inc. |
| Peter J. Germain Birth Date: September 3, 1959 CHIEF LEGAL OFFICER Officer since: January 2005 | Principal Occupations: Mr. Germain is Chief Legal Officer of the Federated Fund Family. He is General Counsel and Vice President, Federated Investors, Inc.; President, Federated Administrative Services and Federated Administrative Services, Inc.; Vice President, Federated Securities Corp.; Secretary, Federated Private Asset Management, Inc.; and Secretary, Retirement Plan Service Company of America. Mr. Germain joined Federated in 1984 and is a member of the Pennsylvania Bar Association. Previous Positions: Deputy General Counsel, Special Counsel, Managing Director of Mutual Fund Services, Federated Investors, Inc.; Senior Vice President, Federated Services Company; and Senior Corporate Counsel, Federated Investors, Inc. |
| Richard B. Fisher Birth Date: May 17, 1923 Vice President Officer since: September 1993 | Principal Occupations: Vice Chairman or Vice President of some of the Funds in the Federated Fund Family; Vice Chairman, Federated Investors, Inc.; Chairman, Federated Securities Corp. Previous Positions: President and Director or Trustee of some of the Funds in the Federated Fund Family; Executive Vice President, Federated Investors, Inc.; Director and Chief Executive Officer, Federated Securities Corp. |
| John B. Fisher Birth Date: May 16, 1956 President Officer since: November 2004 | Principal Occupations: President, Director/Trustee and CEO, Federated Advisory Services Company, Federated Equity Management Company of Pennsylvania, Federated Global Investment Management Corp., Federated Investment Counseling, Federated Investment Management Company; President and CEO of Passport Research, Ltd.; President of some of the Funds in the Federated Fund Family; Director, Federated Investors Trust Company. Previous Positions: President and Director of the Institutional Sales Division of Federated Securities Corp.; President and Director of Federated Investment Counseling; Director, Edgewood Securities Corp.; Director, Federated Services Company; Director, Federated Investors, Inc.; Chairman and Director, Southpointe Distribution Services, Inc.; President, Technology, Federated Services Company. |
| Stephen Van Meter Birth Date: June 5, 1975 CHIEF COMPLIANCE OFFICER AND SENIOR VICE PRESIDENT Officer since: July 2015 | Principal Occupations: Senior Vice President and Chief Compliance Officer of the Federated Fund Family; Vice President and Chief Compliance Officer of Federated Investors, Inc. and Chief Compliance Officer of certain of its subsidiaries. Mr. Van Meter joined Federated in October 2011. He holds FINRA licenses under Series 3, 7, 24 and 66. Previous Positions: Mr. Van Meter previously held the position of Compliance Operating Officer, Federated Investors, Inc. Prior to joining Federated, Mr. Van Meter served at the United States Securities and Exchange Commission in the positions of Senior Counsel, Office of Chief Counsel, Division of Investment Management and Senior Counsel, Division of Enforcement. |
| Stephen F. Auth Birth Date: September 3, 1956 101 Park Avenue 41st Floor New York, NY 10178 CHIEF INVESTMENT OFFICER Officer since: November 2002 | Principal Occupations: Stephen F. Auth is Chief Investment Officer of various Funds in the Federated Fund Family; Executive Vice President, Federated Investment Counseling, Federated Global Investment Management Corp. and Federated Equity Management Company of Pennsylvania. Previous Positions: Executive Vice President, Federated Investment Management Company and Passport Research, Ltd. (investment advisory subsidiary of Federated); Senior Vice President, Global Portfolio Management Services Division; Senior Vice President, Federated Investment Management Company and Passport Research, Ltd.; Senior Managing Director and Portfolio Manager, Prudential Investments. |
| Robert J. Ostrowski Birth Date: April 26, 1963 Chief Investment Officer Officer since: May 2004 | Principal Occupations: Robert J. Ostrowski joined Federated in 1987 as an Investment Analyst and became a Portfolio Manager in 1990. He was named Chief Investment Officer of Federated's taxable fixed-income products in 2004 and also serves as a Senior Portfolio Manager. Mr. Ostrowski became an Executive Vice President of the Fund's Adviser in 2009 and served as a Senior Vice President of the Fund's Adviser from 1997 to 2009. Mr. Ostrowski has received the Chartered Financial Analyst designation. He received his M.S. in Industrial Administration from Carnegie Mellon University. |
| Deborah A. Cunningham Birth Date: September 15, 1959 Chief Investment Officer Officer since: June 2012 | Principal Occupations: Deborah A. Cunningham was named Chief Investment Officer of Federated's money market products in 2004. She joined Federated in 1981 and has been a Senior Portfolio Manager since 1997 and an Executive Vice President of the Fund's Adviser since 2009. Ms. Cunningham has received the Chartered Financial Analyst designation and holds an M.S.B.A. in Finance from Robert Morris College. |
Federated Investors Funds
4000 Ericsson Drive
Warrendale, PA 15086-7561
or call 1-800-341-7400.
2016 ©Federated Investors, Inc.
| Share Class |
| Primary |
| Service |
| 1 | Please see the footnotes to the line graphs below for definitions of, and further information about, the BHY2%ICI. |
| 2 | Please see the footnotes to the line graphs below for definitions of, and further information about, the LVHCYFA. |
| 3 | High-yield, lower-rated securities generally entail greater market, credit and liquidity risks than investment-grade securities and may include higher volatility and a higher risk of default. |
| 4 | The Barclays U.S. Aggregate Bond Index is a broad-based index that measures the investment grade, U.S. dollar-denominated, fixed-rate taxable bond market. The index is unmanaged, and it is not possible to invest directly in an index. |
| 5 | Bond prices are sensitive to changes in interest rates, and a rise in interest rates can cause a decline in their prices. |
| 6 | Credit Suisse High Yield Bond Index serves as a benchmark to evaluate the performance of low-quality bonds. Low-quality is defined as those bonds in the range from “BB” to “CCC” and defaults. The index is unmanaged, and it is not possible to invest directly in an index. |

| Federated High Income Bond Fund II - | Primary Shares | Service Shares | NA | BHY2%ICI | LVHCYFA |
| F | F | NA | I | I | |
| 12/31/2005 | 10,000 | 10,000 | 10,000 | 10,000 | |
| 12/31/2006 | 11,080 | 11,057 | 11,076 | 11,007 | |
| 12/31/2007 | 11,460 | 11,409 | 11,327 | 11,310 | |
| 12/31/2008 | 8,481 | 8,432 | 8,395 | 8,542 | |
| 12/31/2009 | 12,964 | 12,856 | 13,329 | 12,385 | |
| 12/31/2010 | 14,873 | 14,705 | 15,319 | 14,099 | |
| 12/31/2011 | 15,642 | 15,429 | 16,079 | 14,589 | |
| 12/31/2012 | 17,941 | 17,637 | 18,616 | 16,646 | |
| 12/31/2013 | 19,194 | 18,823 | 20,001 | 17,734 | |
| 12/31/2014 | 19,711 | 19,279 | 20,492 | 18,027 | |
| 12/31/2015 | 19,204 | 18,754 | 19,584 | 17,434 |
| 1 Year | 5 Years | 10 Years | |
| Primary Shares | -2.57% | 5.24% | 6.74% |
| Service Shares | -2.72% | 4.98% | 6.49% |
| BHY2%ICI | -4.43% | 5.03% | 6.95% |
| LVHCYFA | -3.29% | 4.32% | 5.68% |
| 1 | The Fund's performance assumes the reinvestment of all dividends and distributions. The BHY2%ICI and the LVHCYFA have been adjusted to reflect reinvestment of dividends on securities in the index and average. |
| 2 | The BHY2%ICI is an issuer-constrained version of the Barclays U.S. Corporate High-Yield Index that measures the market of USD-denominated, noninvestment-grade, fixed-rate, taxable corporate bonds. The index follows the same rules as the uncapped index but limits the exposure of each issuer to 2% of the total market value and redistributes any excess market value index-wide on a pro-rata basis. The BHY2%ICI is not adjusted to reflect sales charges, expenses or other fees that the Securities and Exchange Commission (SEC) requires to be reflected in the Fund's performance. The index is unmanaged and unlike the Fund, is not affected by cash flows. It is not possible to invest directly in an index. |
| 3 | Lipper figures represent the average of the total returns reported by all mutual funds designated by Lipper, Inc., as falling into the respective category and is not adjusted to reflect any sales charges. These total returns are reported net of expenses and other fees that the SEC requires to be reflected in a mutual fund's performance. |
| Index Classification | Percentage of Total Net Assets |
| Technology | 10.9% |
| Health Care | 9.6% |
| Media Entertainment | 7.3% |
| Packaging | 6.5% |
| Cable Satellite | 6.4% |
| Midstream | 6.1% |
| Independent Energy | 4.2% |
| Automotive | 4.0% |
| Gaming | 4.0% |
| Wireless Communications | 4.3% |
| Financial Institutions | 3.9% |
| Pharmaceuticals | 3.7% |
| Other2 | 26.5% |
| Cash Equivalents3 | 0.9% |
| Other Assets and Liabilities—Net4 | 1.7% |
| TOTAL | 100.0% |
| 1 | Index classifications are based upon, and individual portfolio securities are assigned to, the classifications and sub-classifications of the Barclays U.S. Corporate High Yield 2% Issuer Capped Index (BHY2%ICI). Individual portfolio securities that are not included in the BHY2%ICI are assigned to an index classification by the Fund's Adviser. |
| 2 | For purposes of this table, index classifications which constitute less than 3.5% of the Fund's total net assets have been aggregated under the designation “Other.” |
| 3 | Cash Equivalents include any investments in money market mutual funds and/or overnight repurchase agreements. |
| 4 | Assets, other than investments in securities, less liabilities. See Statement of Assets and Liabilities. |
| Principal Amount or Shares | Value | ||
| CORPORATE BONDS—97.4% | |||
| Aerospace/Defense—0.9% | |||
| $325,000 | 1,2 | KLX, Inc., Sr. Unsecd. Note, Series 144A, 5.875%, 12/1/2022 | $310,375 |
| 525,000 | TransDigm, Inc., 5.50%, 10/15/2020 | 510,563 | |
| 500,000 | TransDigm, Inc., 7.50%, 7/15/2021 | 520,000 | |
| 825,000 | TransDigm, Inc., Sr. Sub. Note, 6.00%, 7/15/2022 | 810,562 | |
| 400,000 | TransDigm, Inc., Sr. Sub. Note, 6.50%, 7/15/2024 | 399,800 | |
| 375,000 | 1,2 | TransDigm, Inc., Sr. Sub. Note, Series 144A, 6.50%, 5/15/2025 | 364,688 |
| TOTAL | 2,915,988 | ||
| Automotive—4.0% | |||
| 1,275,000 | Affinia Group, Inc., Sr. Unsecd. Note, 7.75%, 5/1/2021 | 1,304,070 | |
| 975,000 | American Axle & Manufacturing Holdings, Inc., Sr. Note, 6.625%, 10/15/2022 | 1,023,750 | |
| 175,000 | American Axle & Manufacturing Holdings, Inc., Sr. Note, 7.75%, 11/15/2019 | 194,250 | |
| 275,000 | American Axle & Manufacturing Holdings, Inc., Sr. Unsecd. Note, 6.25%, 3/15/2021 | 285,657 | |
| 1,375,000 | 1,2 | Gates Global LLC, Series 144A, 6.00%, 7/15/2022 | 996,875 |
| 475,000 | Goodyear Tire & Rubber Co., Sr. Unsecd. Note, 5.125%, 11/15/2023 | 489,250 | |
| 875,000 | 1 | International Automotive Components, Sr. Secd. Note, Series 144A, 9.125%, 6/1/2018 | 752,500 |
| 800,000 | 1,2 | J.B. Poindexter, Inc., Series 144A, 9.00%, 4/1/2022 | 840,000 |
| 825,000 | Lear Corp., 4.75%, 1/15/2023 | 833,250 | |
| 625,000 | Lear Corp., 5.25%, 1/15/2025 | 639,062 | |
| 250,000 | Lear Corp., 5.375%, 3/15/2024 | 258,125 | |
| 1,000,000 | MPG Holdco I, Inc., Sr. Unsecd. Note, 7.375%, 10/15/2022 | 1,015,000 | |
| 500,000 | 1,2 | Omega US Sub LLC, Sr. Unsecd. Note, Series 144A, 8.75%, 7/15/2023 | 463,750 |
| 350,000 | 1,2 | Schaeffler AG, Series 144A, 4.25%, 5/15/2021 | 349,125 |
| 400,000 | 1,2 | Schaeffler AG, Series 144A, 4.75%, 5/15/2021 | 404,000 |
| 1,075,000 | 1,2 | Schaeffler AG, Series 144A, 6.75%, 11/15/2022 | 1,161,000 |
| 200,000 | 1,2 | Schaeffler Finance BV, Series 144A, 4.75%, 5/15/2023 | 197,000 |
| 1,025,000 | UCI International, Inc., Company Guarantee, 8.625%, 2/15/2019 | 358,750 | |
| 175,000 | 1,2 | ZF North America Capital, Inc., Series 144A, 4.50%, 4/29/2022 | 171,719 |
| 675,000 | 1,2 | ZF North America Capital, Inc., Series 144A, 4.75%, 4/29/2025 | 645,468 |
| TOTAL | 12,382,601 | ||
| Building Materials—2.0% | |||
| 200,000 | Allegion PLC, Sr. Unsecd. Note, 5.875%, 9/15/2023 | 204,500 | |
| 450,000 | Allegion US Holdings Co., Inc., Sr. Unsecd. Note, 5.75%, 10/1/2021 | 457,875 | |
| 1,075,000 | 1,2 | American Builders & Contractors Supply Co., Inc., Series 144A, 5.625%, 4/15/2021 | 1,093,812 |
| 75,000 | 1,2 | American Builders & Contractors Supply Co., Inc., Sr. Unsecd. Note, Series 144A, 5.75%, 12/15/2023 | 75,750 |
| 275,000 | 1,2 | Anixter, Inc., Sr. Unsecd. Note, Series 144A, 5.50%, 3/1/2023 | 277,062 |
| 275,000 | 1,2 | Beacon Roofing Supply, Inc., Sr. Unsecd. Note, Series 144A, 6.375%, 10/1/2023 | 281,531 |
| 325,000 | 1,2 | Building Materials Corp. of America, Sr. Unsecd. Note, Series 144A, 6.00%, 10/15/2025 | 333,125 |
| 250,000 | 1,2 | HD Supply, Inc., Series 144A, 5.25%, 12/15/2021 | 255,938 |
| 300,000 | HD Supply, Inc., Sr. Unsecd. Note, 7.50%, 7/15/2020 | 313,500 | |
| 225,000 | 1,2 | Masonite International Corp., Sr. Unsecd. Note, Series 144A, 5.625%, 3/15/2023 | 233,438 |
| 675,000 | 1,2 | NCI Building System, Inc., Sr. Unsecd. Note, Series 144A, 8.25%, 1/15/2023 | 712,125 |
| 1,025,000 | 1,2 | RSI Home Products, Inc., Series 144A, 6.50%, 3/15/2023 | 1,060,875 |
| 350,000 | 1,2 | USG Corp., Sr. Note, Series 144A, 5.875%, 11/1/2021 | 365,750 |
| 575,000 | 1,2 | USG Corp., Sr. Unsecd. Note, Series 144A, 5.50%, 3/1/2025 | 585,781 |
| TOTAL | 6,251,062 |
| Principal Amount or Shares | Value | ||
| CORPORATE BONDS—continued | |||
| Cable Satellite—6.4% | |||
| $150,000 | 1,2 | Altice Financing SA, Series 144A, 6.625%, 2/15/2023 | $148,500 |
| 575,000 | 1,2 | Altice US Finance I Corp., Series 144A, 5.375%, 7/15/2023 | 577,875 |
| 225,000 | 1,2 | Altice US Finance I Corp., Sr. Unsecd. Note, Series 144A, 7.75%, 7/15/2025 | 208,125 |
| 775,000 | CCO Holdings LLC/Cap Corp., 5.75%, 9/1/2023 | 796,312 | |
| 175,000 | 1,2 | CCO Holdings LLC/Cap Corp., Series 144A, 5.375%, 5/1/2025 | 174,563 |
| 400,000 | 1,2 | CCO Holdings LLC/Cap Corp., Sr. Unsecd. Note, Series 144A, 5.875%, 5/1/2027 | 399,000 |
| 500,000 | 1,2 | CCOH Safari LLC, Sr. Unsecd. Note, Series 144A, 5.75%, 2/15/2026 | 502,500 |
| 1,225,000 | 1,2 | Cequel Communications Holdings, Sr. Unsecd. Note, Series 144A, 5.125%, 12/15/2021 | 1,107,094 |
| 450,000 | 1,2 | Cequel Communications Holdings, Sr. Unsecd. Note, Series 144A, 5.125%, 12/15/2021 | 406,688 |
| 625,000 | Charter Communications Holdings II, 5.125%, 2/15/2023 | 627,344 | |
| 850,000 | Charter Communications Holdings II, 5.75%, 1/15/2024 | 875,500 | |
| 225,000 | Charter Communications Holdings II, 6.625%, 1/31/2022 | 237,656 | |
| 2,050,000 | DISH DBS Corp., 5.875%, 7/15/2022 | 1,916,750 | |
| 450,000 | DISH DBS Corp., Sr. Unsecd. Note, 5.875%, 11/15/2024 | 401,625 | |
| 675,000 | Intelsat (Luxembourg) S. A., 7.75%, 6/1/2021 | 317,250 | |
| 775,000 | Intelsat (Luxembourg) S. A., Sr. Unsecd. Note, 8.125%, 6/1/2023 | 352,625 | |
| 1,150,000 | Intelsat Jackson Holdings S.A., 6.625%, 12/15/2022 | 738,875 | |
| 1,800,000 | Intelsat Jackson Holdings S.A., Sr. Unsecd. Note, 5.50%, 8/1/2023 | 1,422,000 | |
| 625,000 | 1,2 | Neptune Finco Corp., Sr. Unsecd. Note, Series 144A, 10.125%, 1/15/2023 | 653,125 |
| 1,150,000 | 1,2 | Neptune Finco Corp., Sr. Unsecd. Note, Series 144A, 10.875%, 10/15/2025 | 1,207,500 |
| 450,000 | 1,2 | Neptune Finco Corp., Sr. Unsecd. Note, Series 144A, 6.625%, 10/15/2025 | 469,125 |
| 1,425,000 | 1,2 | Sirius XM Radio, Inc., Series 144A, 4.625%, 5/15/2023 | 1,401,844 |
| 400,000 | 1,2 | Sirius XM Radio, Inc., Series 144A, 6.00%, 7/15/2024 | 419,000 |
| 675,000 | 1,2 | Sirius XM Radio, Inc., Sr. Unsecd. Note, Series 144A, 5.375%, 4/15/2025 | 680,906 |
| 550,000 | 1,2 | Unitymedia Hessen GmbH & Co. KG/Unitymedia NRW GmbH, Series 144A, 5.00%, 1/15/2025 | 527,312 |
| 950,000 | 1,2 | Unitymedia Hessen GmbH & Co. KG/Unitymedia NRW GmbH, Series 144A, 5.50%, 1/15/2023 | 951,187 |
| 275,000 | 1,2 | Unitymedia KabelBW GmbH, Series 144A, 6.125%, 1/15/2025 | 272,773 |
| 900,000 | 1,2 | Virgin Media Secured Finance PLC, Series 144A, 5.25%, 1/15/2026 | 877,500 |
| 900,000 | 1,2 | Virgin Media Secured Finance PLC, Series 144A, 6.375%, 4/15/2023 | 916,875 |
| 200,000 | 1,2 | Virgin Media, Inc., Sr. Unsecd. Note, Series 144A, 5.75%, 1/15/2025 | 193,000 |
| 300,000 | 1,2 | Ziggo Finance BV, Sr. Unsecd. Note, Series 144A, 5.875%, 1/15/2025 | 279,375 |
| TOTAL | 20,059,804 | ||
| Chemicals—2.4% | |||
| 850,000 | Ashland, Inc., 4.75%, 8/15/2022 | 829,812 | |
| 325,000 | Celanese US Holdings LLC, 4.625%, 11/15/2022 | 321,750 | |
| 675,000 | 1,2 | Compass Minerals International, Inc., Series 144A, 4.875%, 7/15/2024 | 646,313 |
| 625,000 | 1,2 | Dupont Performance Coatings, Series 144A, 7.375%, 5/1/2021 | 660,547 |
| 525,000 | 1,2 | Eco Services Operations LLC, Sr. Unsecd. Note, Series 144A, 8.50%, 11/1/2022 | 448,875 |
| 75,000 | Georgia Gulf Corp., 4.875%, 5/15/2023 | 67,781 | |
| 625,000 | Hexion U.S. Finance Corp., 6.625%, 4/15/2020 | 492,188 | |
| 775,000 | Hexion U.S. Finance Corp., Sr. Secd. Note, 8.875%, 2/1/2018 | 550,250 | |
| 700,000 | Huntsman International LLC, Sr. Unsecd. Note, 4.875%, 11/15/2020 | 642,250 | |
| 725,000 | 1,2 | Huntsman International LLC, Sr. Unsecd. Note, Series 144A, 5.125%, 11/15/2022 | 656,125 |
| 250,000 | 1,2 | Platform Specialty Products Corp., Series 144A, 10.37%, 5/1/2021 | 250,000 |
| 1,400,000 | 1,2 | Platform Specialty Products Corp., Sr. Unsecd. Note, Series 144A, 6.50%, 2/1/2022 | 1,218,000 |
| 250,000 | 1,2 | WR Grace & Co.—Conn., Sr. Unsecd. Note, Series 144A, 5.125%, 10/1/2021 | 253,125 |
| 300,000 | 1,2 | WR Grace & Co.—Conn., Sr. Unsecd. Note, Series 144A, 5.625%, 10/1/2024 | 304,125 |
| TOTAL | 7,341,141 |
| Principal Amount or Shares | Value | ||
| CORPORATE BONDS—continued | |||
| Construction Machinery—0.7% | |||
| $350,000 | United Rentals, Inc., 4.625%, 7/15/2023 | $350,438 | |
| 175,000 | United Rentals, Inc., 5.75%, 11/15/2024 | 174,125 | |
| 1,550,000 | United Rentals, Inc., Sr. Unsecd. Note, 5.50%, 7/15/2025 | 1,509,312 | |
| 175,000 | United Rentals, Inc., Sr. Unsecd. Note, 6.125%, 6/15/2023 | 179,813 | |
| TOTAL | 2,213,688 | ||
| Consumer Cyclical Services—1.4% | |||
| 650,000 | 1,2 | Garda World Security Corp., Series 144A, 7.25%, 11/15/2021 | 562,250 |
| 825,000 | 1,2 | Garda World Security Corp., Series 144A, 7.25%, 11/15/2021 | 713,625 |
| 1,600,000 | 1,2 | Hearthside Group Holdings LLC, Series 144A, 6.50%, 5/1/2022 | 1,488,000 |
| 950,000 | IHS, Inc., Sr. Unsecd. Note, 5.00%, 11/1/2022 | 965,437 | |
| 275,000 | ServiceMaster Co., Sr. Unsecd. Note, 7.10%, 3/1/2018 | 275,000 | |
| 250,000 | ServiceMaster Co., Sr. Unsecd. Note, 7.45%, 8/15/2027 | 250,000 | |
| TOTAL | 4,254,312 | ||
| Consumer Products—2.8% | |||
| 1,875,000 | 1,2 | AOT Bedding Super Holdings LLC, Series 144A, 8.125%, 10/1/2020 | 1,968,750 |
| 1,025,000 | FGI Operating Co. LLC/FGI Finance, Inc., 7.875%, 5/1/2020 | 743,125 | |
| 1,350,000 | 1,2 | First Quality Finance Co., Inc., Series 144A, 4.625%, 5/15/2021 | 1,235,250 |
| 875,000 | 1,2 | Party City Holdings, Inc., Sr. Unsecd. Note, Series 144A, 6.125%, 8/15/2023 | 853,125 |
| 1,675,000 | 1,2 | Prestige Brands Holdings, Inc., Series 144A, 5.375%, 12/15/2021 | 1,616,375 |
| 300,000 | 1,2 | Spectrum Brands, Inc., Series 144A, 6.125%, 12/15/2024 | 313,500 |
| 550,000 | 1,2 | Spectrum Brands, Inc., Sr. Unsecd. Note, Series 144A, 5.75%, 7/15/2025 | 566,500 |
| 775,000 | Springs Industries, Inc., 6.25%, 6/1/2021 | 771,125 | |
| 475,000 | 1,2 | Vista Outdoor, Inc., Sr. Unsecd. Note, Series 144A, 5.875%, 10/1/2023 | 489,250 |
| TOTAL | 8,557,000 | ||
| Diversified Manufacturing—1.7% | |||
| 375,000 | 1,2 | EnerSys, Inc., Sr. Unsecd. Note, Series 144A, 5.00%, 4/30/2023 | 375,000 |
| 1,300,000 | 1,2 | Entegris, Inc., Series 144A, 6.00%, 4/1/2022 | 1,321,125 |
| 1,225,000 | 1,2 | Gardner Denver, Inc., Series 144A, 6.875%, 8/15/2021 | 943,250 |
| 900,000 | 1,2 | Hamilton Sundstrand Corp., Series 144A, 7.75%, 12/15/2020 | 652,500 |
| 825,000 | 1,2 | Milacron LLC, Series 144A, 7.75%, 2/15/2021 | 773,437 |
| 1,225,000 | WESCO Distribution, Inc., Sr. Unsecd. Note, 5.375%, 12/15/2021 | 1,182,125 | |
| TOTAL | 5,247,437 | ||
| Financial Institutions—3.9% | |||
| 175,000 | AerCap Ireland Capital Ltd/AerCap Global Aviation Trust, 4.625%, 10/30/2020 | 179,594 | |
| 800,000 | AerCap Ireland Capital Ltd/AerCap Global Aviation Trust, Sr. Unsecd. Note, 4.50%, 5/15/2021 | 815,000 | |
| 200,000 | AerCap Ireland Capital Ltd/AerCap Global Aviation Trust, Sr. Unsecd. Note, 4.625%, 7/1/2022 | 202,750 | |
| 175,000 | Ally Financial, Inc., Sr. Sub. Note, 5.75%, 11/20/2025 | 177,625 | |
| 700,000 | Ally Financial, Inc., Sr. Unsecd. Note, 3.25%, 11/5/2018 | 688,625 | |
| 1,300,000 | Ally Financial, Inc., Sr. Unsecd. Note, 3.75%, 11/18/2019 | 1,285,375 | |
| 950,000 | Ally Financial, Inc., Sr. Unsecd. Note, 4.125%, 2/13/2022 | 942,875 | |
| 400,000 | Ally Financial, Inc., Sr. Unsecd. Note, 4.625%, 5/19/2022 | 403,000 | |
| 625,000 | Ally Financial, Inc., Sr. Unsecd. Note, 5.125%, 9/30/2024 | 642,188 | |
| 475,000 | 1,2 | CIT Group Holdings, Inc., Sr. 2nd Priority Note, Series 144A, 6.625%, 4/1/2018 | 502,313 |
| 150,000 | CIT Group Holdings, Inc., Sr. Unsecd. Note, 5.375%, 5/15/2020 | 157,500 | |
| 750,000 | CIT Group, Inc., Sr. Unsecd. Note, 5.00%, 8/1/2023 | 763,125 | |
| 1,725,000 | 1,2 | Hockey Merger Sub 2 Inc., Sr. Unsecd. Note, Series 144A, 7.875%, 10/1/2021 | 1,556,812 |
| 750,000 | 1,2 | Hub Holdings LLC/Hub Hol, Sr. Unsecd. Note, Series 144A, 8.125%, 7/15/2019 | 705,000 |
| 1,500,000 | International Lease Finance Corp., 5.875%, 8/15/2022 | 1,601,250 |
| Principal Amount or Shares | Value | ||
| CORPORATE BONDS—continued | |||
| Financial Institutions—continued | |||
| $1,550,000 | 1,2 | Quicken Loans, Inc., Series 144A, 5.75%, 5/1/2025 | $1,482,187 |
| TOTAL | 12,105,219 | ||
| Food & Beverage—3.3% | |||
| 2,100,000 | 1,2 | Anna Merger Sub, Inc., Series 144A, 7.75%, 10/1/2022 | 1,858,500 |
| 1,300,000 | Aramark Corp., Sr. Unsecd. Note, 5.75%, 3/15/2020 | 1,347,125 | |
| 200,000 | 1,2 | Aramark Services, Inc., Sr. Unsecd. Note, Series 144A, 5.125%, 1/15/2024 | 204,250 |
| 325,000 | Constellation Brands, Inc., Sr. Unsecd. Note, 4.75%, 12/1/2025 | 331,906 | |
| 775,000 | 1,2 | Dean Foods Co., Sr. Unsecd. Note, Series 144A, 6.50%, 3/15/2023 | 807,938 |
| 1,625,000 | Pinnacle Foods Finance LLC/Pinnacle Foods Finance Corp., 4.875%, 5/1/2021 | 1,564,062 | |
| 375,000 | 1,2 | Post Holdings, Inc., Sr. Unsecd. Note, Series 144A, 7.75%, 3/15/2024 | 393,750 |
| 900,000 | 1,2 | Post Holdings, Inc., Sr. Unsecd. Note, Series 144A, 8.00%, 7/15/2025 | 956,250 |
| 250,000 | Smithfield Foods, Inc., 6.625%, 8/15/2022 | 260,313 | |
| 115,000 | 1,2 | Smithfield Foods, Inc., Sr. Note, Series 144A, 5.25%, 8/1/2018 | 116,725 |
| 100,000 | TreeHouse Foods, Inc., 4.875%, 3/15/2022 | 95,500 | |
| 2,350,000 | U.S. Foodservice, Inc., Sr. Unsecd. Note, 8.50%, 6/30/2019 | 2,426,375 | |
| TOTAL | 10,362,694 | ||
| Gaming—4.0% | |||
| 375,000 | Affinity Gaming LLC, Sr. Unsecd. Note, 9.00%, 5/15/2018 | 378,750 | |
| 450,000 | Ameristar Casinos, Inc., Sr. Unsecd. Note, 7.50%, 4/15/2021 | 471,375 | |
| 700,000 | Boyd Gaming Corp., Sr. Unsecd. Note, 6.875%, 5/15/2023 | 722,750 | |
| 675,000 | 1,2 | Chester Downs & Marina, Series 144A, 9.25%, 2/1/2020 | 487,688 |
| 450,000 | GLP Capital LP/GLP Financing II, Inc., 5.375%, 11/1/2023 | 441,000 | |
| 1,050,000 | MGM Mirage, Inc., 7.75%, 3/15/2022 | 1,119,562 | |
| 725,000 | MGM Mirage, Inc., Sr. Unsecd. Note, 6.75%, 10/1/2020 | 748,563 | |
| 675,000 | MGM Resorts International, 6.00%, 3/15/2023 | 671,625 | |
| 875,000 | Mohegan Tribal Gaming Authority, 9.75%, 9/1/2021 | 877,187 | |
| 1,450,000 | Penn National Gaming, Inc., 5.875%, 11/1/2021 | 1,413,750 | |
| 775,000 | Pinnacle Entertainment, Inc., 6.375%, 8/1/2021 | 818,594 | |
| 425,000 | Pinnacle Entertainment, Inc., 7.75%, 4/1/2022 | 464,047 | |
| 574,000 | 1,2 | Rivers Pittsburgh LP, Sr. Secd. Note, Series 144A, 9.50%, 6/15/2019 | 596,960 |
| 1,650,000 | 1,2 | Seminole Hard Rock Entertainment, Inc./Seminole Hard Rock International LLC, Series 144A, 5.875%, 5/15/2021 | 1,654,125 |
| 485,000 | 1,2 | Seminole Tribe of Florida, Bond, Series 144A, 7.804%, 10/1/2020 | 501,975 |
| 1,175,000 | Station Casinos, Inc., Sr. Note, 7.50%, 3/1/2021 | 1,204,375 | |
| TOTAL | 12,572,326 | ||
| Health Care—9.6% | |||
| 1,025,000 | 1,2 | Air Medical Group Holdings, Inc., Sr. Unsecd. Note, Series 144A, 6.375%, 5/15/2023 | 917,375 |
| 1,175,000 | Amsurg Corp., Sr. Unsecd. Note, 5.625%, 7/15/2022 | 1,167,656 | |
| 1,775,000 | CHS/Community Health Systems, Inc., Sr. Unsecd. Note, 6.875%, 2/1/2022 | 1,692,906 | |
| 725,000 | CHS/Community Health Systems, Inc., Term Loan—1st Lien, 5.125%, 8/1/2021 | 725,000 | |
| 200,000 | DaVita HealthCare Partners, Inc., 5.00%, 5/1/2025 | 193,500 | |
| 750,000 | DaVita HealthCare Partners, Inc., 5.125%, 7/15/2024 | 751,406 | |
| 650,000 | Emdeon, Inc., 11.00%, 12/31/2019 | 680,063 | |
| 425,000 | 1,2 | Emdeon, Inc., Sr. Unsecd. Note, Series 144A, 6.00%, 2/15/2021 | 396,313 |
| 1,475,000 | 1,2 | Envision Healthcare Holdings, Inc., Series 144A, 5.125%, 7/1/2022 | 1,452,875 |
| 600,000 | HCA, Inc., 4.75%, 5/1/2023 | 595,500 | |
| 1,675,000 | HCA, Inc., 5.00%, 3/15/2024 | 1,675,000 | |
| 525,000 | HCA, Inc., 5.875%, 2/15/2026 | 528,281 | |
| 675,000 | HCA, Inc., Bond, 5.875%, 3/15/2022 | 713,813 | |
| 2,025,000 | HCA, Inc., Sr. Unsecd. Note, 5.375%, 2/1/2025 | 2,002,219 |
| Principal Amount or Shares | Value | ||
| CORPORATE BONDS—continued | |||
| Health Care—continued | |||
| $925,000 | HCA, Inc., Sr. Unsecd. Note, 7.50%, 2/15/2022 | $1,029,062 | |
| 725,000 | HCA, Inc., Term Loan—1st Lien, 5.25%, 4/15/2025 | 732,250 | |
| 325,000 | 1,2 | Hill-Rom Holdings, Inc., Sr. Unsecd. Note, Series 144A, 5.75%, 9/1/2023 | 333,125 |
| 1,250,000 | Iasis Healthcare, Sr. Unsecd. Note, 8.375%, 5/15/2019 | 1,156,250 | |
| 425,000 | LifePoint Health, Inc., 5.875%, 12/1/2023 | 432,438 | |
| 775,000 | LifePoint Health, Inc., Sr. Unsecd. Note, 5.50%, 12/1/2021 | 790,500 | |
| 200,000 | 1,2 | MEDNAX, Inc., Sr. Unsecd. Note, Series 144A, 5.25%, 12/1/2023 | 201,500 |
| 1,975,000 | 1,2 | MPH Acquisition Holdings LLC, Series 144A, 6.625%, 4/1/2022 | 1,984,875 |
| 2,550,000 | 1,2 | Ortho-Clinical Diagnostics, Inc., Series 144A, 6.625%, 5/15/2022 | 1,753,125 |
| 1,375,000 | 1,2 | Sterigenics-Nordion Holdings LLC, Sr. Unsecd. Note, Series 144A, 6.50%, 5/15/2023 | 1,316,562 |
| 1,000,000 | 1,2 | Surgical Care Affiliates, Inc., Sr. Unsecd. Note, Series 144A, 6.00%, 4/1/2023 | 980,000 |
| 500,000 | 1,2 | Team Health, Inc., Sr. Unsecd. Note, Series 144A, 7.25%, 12/15/2023 | 518,750 |
| 675,000 | Teleflex, Inc., Sr. Unsecd. Note, 5.25%, 6/15/2024 | 675,000 | |
| 1,525,000 | Tenet Healthcare Corp., 8.125%, 4/1/2022 | 1,528,812 | |
| 1,050,000 | Tenet Healthcare Corp., Note, 4.375%, 10/1/2021 | 1,018,500 | |
| 425,000 | Tenet Healthcare Corp., Sr. Secd. Note, 4.50%, 4/1/2021 | 416,500 | |
| 575,000 | Tenet Healthcare Corp., Sr. Unsecd. Note, 6.75%, 6/15/2023 | 534,391 | |
| 950,000 | Wolverine Healthcare, Sr. Note, 10.625%, 6/1/2020 | 959,500 | |
| TOTAL | 29,853,047 | ||
| Independent Energy—4.2% | |||
| 800,000 | Antero Resources Corp., 6.00%, 12/1/2020 | 672,000 | |
| 275,000 | Antero Resources Corp., Sr. Unsecd. Note, 5.125%, 12/1/2022 | 210,375 | |
| 275,000 | 1,2 | Antero Resources Corp., Sr. Unsecd. Note, Series 144A, 5.625%, 6/1/2023 | 215,875 |
| 450,000 | Antero Resources Finance Corp., 5.375%, 11/1/2021 | 362,250 | |
| 725,000 | Approach Resources, Inc., 7.00%, 6/15/2021 | 261,000 | |
| 350,000 | BreitBurn Energy Partners L.P., 7.875%, 4/15/2022 | 64,750 | |
| 200,000 | California Resources Corp., Sr. Unsecd. Note, 5.50%, 9/15/2021 | 64,000 | |
| 1,100,000 | California Resources Corp., Sr. Unsecd. Note, 6.00%, 11/15/2024 | 338,250 | |
| 50,000 | Carrizo Oil & Gas, Inc., 6.25%, 4/15/2023 | 40,750 | |
| 1,025,000 | Carrizo Oil & Gas, Inc., Sr. Unsecd. Note, 7.50%, 9/15/2020 | 900,719 | |
| 225,000 | Chaparral Energy, Inc., 7.625%, 11/15/2022 | 52,875 | |
| 175,000 | Chaparral Energy, Inc., Company Guarantee, 9.875%, 10/1/2020 | 44,625 | |
| 75,000 | Chesapeake Energy Corp., 5.75%, 3/15/2023 | 22,125 | |
| 75,000 | Chesapeake Energy Corp., Sr. Unsecd. Note, 5.375%, 6/15/2021 | 20,625 | |
| 1,350,000 | Chesapeake Energy Corp., Sr. Unsecd. Note, 6.875%, 11/15/2020 | 391,500 | |
| 125,000 | 1,2 | Crownrock LP/Crownrock F, Series 144A, 7.125%, 4/15/2021 | 117,812 |
| 250,000 | 1,2 | Crownrock LP/Crownrock F, Unsecd. Note, Series 144A, 7.75%, 2/15/2023 | 236,250 |
| 250,000 | EP Energy LLC/Everest Acquisition Finance, Inc., Sr. Unsecd. Note, 6.375%, 6/15/2023 | 126,250 | |
| 175,000 | EP Energy LLC/Everest Acquisition Finance, Inc., Sr. Unsecd. Note, 7.75%, 9/1/2022 | 90,125 | |
| 700,000 | EP Energy/EP Finance, Inc., 9.375%, 5/1/2020 | 449,750 | |
| 550,000 | Energy XXI Gulf Coast, Inc., 7.50%, 12/15/2021 | 62,563 | |
| 150,000 | Energy XXI Gulf Coast, Inc., Sr. Unsecd. Note, 6.875%, 3/15/2024 | 17,250 | |
| 50,000 | Gulfport Energy Corp., Sr. Unsecd. Note, 6.625%, 5/1/2023 | 42,000 | |
| 975,000 | Gulfport Energy Corp., Sr. Unsecd. Note, 7.75%, 11/1/2020 | 877,500 | |
| 600,000 | 1,2 | Halcon Resources Corp., Series 144A, 8.625%, 2/1/2020 | 416,250 |
| 325,000 | Laredo Petroleum, 5.625%, 1/15/2022 | 284,375 | |
| 225,000 | Laredo Petroleum, Sr. Unsecd. Note, 6.25%, 3/15/2023 | 196,875 | |
| 175,000 | Laredo Petroleum, Sr. Unsecd. Note, 7.375%, 5/1/2022 | 161,875 | |
| 1,125,000 | Legacy Reserves, 6.625%, 12/1/2021 | 241,875 |
| Principal Amount or Shares | Value | ||
| CORPORATE BONDS—continued | |||
| Independent Energy—continued | |||
| $550,000 | Linn Energy LLC, 6.50%, 5/15/2019 | $99,000 | |
| 325,000 | Linn Energy LLC, 6.50%, 9/15/2021 | 45,500 | |
| 350,000 | Linn Energy LLC, Company Guarantee, 7.75%, 2/1/2021 | 52,500 | |
| 200,000 | Linn Energy LLC, Sr. Unsecd. Note, 6.25%, 11/1/2019 | 34,000 | |
| 1,225,000 | Northern Oil and Gas, Inc., Sr. Note, 8.00%, 6/1/2020 | 820,750 | |
| 400,000 | Oasis Petroleum, Inc., 6.875%, 1/15/2023 | 250,000 | |
| 125,000 | Oasis Petroleum, Inc., 6.875%, 3/15/2022 | 80,625 | |
| 650,000 | Oasis Petroleum, Inc., Company Guarantee, 6.50%, 11/1/2021 | 433,875 | |
| 175,000 | PDC Energy, Inc., 7.75%, 10/15/2022 | 168,875 | |
| 475,000 | RSP Permian, Inc., Sr. Unsecd. Note, 6.625%, 10/1/2022 | 439,375 | |
| 150,000 | 1,2 | RSP Permian, Inc., Sr. Unsecd. Note, Series 144A, 6.625%, 10/1/2022 | 138,750 |
| 150,000 | Range Resources Corp., 5.00%, 8/15/2022 | 112,875 | |
| 300,000 | Range Resources Corp., Sr. Sub. Note, 5.00%, 3/15/2023 | 225,000 | |
| 597,000 | 1,2 | Range Resources Corp., Sr. Unsecd. Note, Series 144A, 4.875%, 5/15/2025 | 455,959 |
| 950,000 | Rice Energy, Inc., Sr. Unsecd. Note, 6.25%, 5/1/2022 | 688,750 | |
| 350,000 | SM Energy Co., Sr. Unsecd. Note, 5.00%, 1/15/2024 | 229,250 | |
| 325,000 | SM Energy Co., Sr. Unsecd. Note, 5.625%, 6/1/2025 | 215,312 | |
| 225,000 | SM Energy Co., Sr. Unsecd. Note, 6.50%, 1/1/2023 | 166,500 | |
| 175,000 | Sandridge Energy, Inc., 7.50%, 2/15/2023 | 19,906 | |
| 500,000 | Sandridge Energy, Inc., 7.50%, 3/15/2021 | 55,000 | |
| 550,000 | Sandridge Energy, Inc., 8.125%, 10/15/2022 | 63,250 | |
| 775,000 | W&T Offshore, Inc., Sr. Unsecd. Note, 8.50%, 6/15/2019 | 275,125 | |
| 175,000 | Whiting Petroleum Corp., Sr. Unsecd. Note, 5.75%, 3/15/2021 | 128,450 | |
| 1,150,000 | Whiting Petroleum Corp., Sr. Unsecd. Note, 6.25%, 4/1/2023 | 833,750 | |
| TOTAL | 13,014,846 | ||
| Industrial - Other—2.1% | |||
| 575,000 | Anixter International, Inc., 5.125%, 10/1/2021 | 577,156 | |
| 450,000 | Anixter International, Inc., 5.625%, 5/1/2019 | 469,688 | |
| 900,000 | 1,2 | Belden, Inc., Sr. Sub., Series 144A, 5.25%, 7/15/2024 | 832,500 |
| 925,000 | 1,2 | Belden, Inc., Sr. Sub., Series 144A, 5.50%, 9/1/2022 | 894,937 |
| 800,000 | 1,2 | Cleaver-Brooks, Inc., Series 144A, 8.75%, 12/15/2019 | 776,000 |
| 1,000,000 | 1,2 | Hillman Group, Inc., Unsecd. Note, Series 144A, 6.375%, 7/15/2022 | 835,000 |
| 1,275,000 | 1,2 | Mirror Bidco/Dematic, Series 144A, 7.75%, 12/15/2020 | 1,287,750 |
| 850,000 | 1,2 | Unifrax Investment Corp., Series 144A, 7.50%, 2/15/2019 | 760,750 |
| TOTAL | 6,433,781 | ||
| Leisure—0.9% | |||
| 650,000 | Cedar Fair LP, Sr. Unsecd. Note, 5.375%, 6/1/2024 | 659,750 | |
| 175,000 | Cinemark USA, Inc., 5.125%, 12/15/2022 | 174,344 | |
| 775,000 | 1,3,4,5,6 | Hard Rock Park Operations LLC, Sr. Secd. Note, Series 144A, 7.40%, 4/1/2012 | 0 |
| 350,000 | Regal Cinemas, Inc., 5.75%, 2/1/2025 | 339,062 | |
| 425,000 | Regal Entertainment Group, Sr. Unsecd. Note, 5.75%, 3/15/2022 | 426,594 | |
| 1,100,000 | 1,2 | Six Flags Entertainment Corp., Sr. Note, Series 144A, 5.25%, 1/15/2021 | 1,119,250 |
| TOTAL | 2,719,000 | ||
| Lodging—0.3% | |||
| 600,000 | Hilton Worldwide Finance LLC, Sr. Unsecd. Note, 5.625%, 10/15/2021 | 624,750 | |
| 150,000 | RHP Hotel Property/RHP Finance Corp., Sr. Unsecd. Note, 5.00%, 4/15/2023 | 150,750 | |
| TOTAL | 775,500 | ||
| Media Entertainment—7.3% | |||
| 475,000 | AMC Networks, Inc., 7.75%, 7/15/2021 | 501,125 |
| Principal Amount or Shares | Value | ||
| CORPORATE BONDS—continued | |||
| Media Entertainment—continued | |||
| $450,000 | AMC Networks, Inc., Sr. Unsecd. Note, 4.75%, 12/15/2022 | $451,688 | |
| 250,000 | CBS Outdoor Americas Capital LLC/Corp., Sr. Unsecd. Note, 5.25%, 2/15/2022 | 256,563 | |
| 675,000 | CBS Outdoor Americas Capital LLC/Corp., Sr. Unsecd. Note, 5.625%, 2/15/2024 | 696,094 | |
| 275,000 | CBS Outdoor Americas Capital LLC/Corp., Sr. Unsecd. Note, 5.875%, 3/15/2025 | 280,156 | |
| 1,150,000 | Clear Channel Communications, Inc., Company Guarantee, 9.00%, 3/1/2021 | 806,437 | |
| 200,000 | 1,2 | Clear Channel International BV, Sr. Unsecd. Note, Series 144A, 8.75%, 12/15/2020 | 200,000 |
| 275,000 | Clear Channel Worldwide, 6.50%, 11/15/2022 | 266,406 | |
| 1,650,000 | Clear Channel Worldwide, Series B, 6.50%, 11/15/2022 | 1,614,937 | |
| 475,000 | Cumulus Media, Inc., Sr. Unsecd. Note, 7.75%, 5/1/2019 | 162,688 | |
| 1,250,000 | 1,2 | Emerald Expo Holdings, Inc., Series 144A, 9.00%, 6/15/2021 | 1,212,500 |
| 775,000 | Entercom Radio LLC, Sr. Sub. Note, 10.50%, 12/1/2019 | 806,000 | |
| 250,000 | Gannett Co., Inc., 5.125%, 10/15/2019 | 259,375 | |
| 950,000 | Gannett Co., Inc., 6.375%, 10/15/2023 | 1,004,625 | |
| 100,000 | 1,2 | Gannett Co., Inc., Sr. Unsecd. Note, Series 144A, 4.875%, 9/15/2021 | 100,500 |
| 100,000 | 1,2 | Gannett Co., Inc., Sr. Unsecd. Note, Series 144A, 5.50%, 9/15/2024 | 100,250 |
| 1,350,000 | Gray Television, Inc., 7.50%, 10/1/2020 | 1,392,187 | |
| 150,000 | Lamar Media Corp., 5.00%, 5/1/2023 | 152,625 | |
| 425,000 | Lamar Media Corp., 5.875%, 2/1/2022 | 448,375 | |
| 375,000 | Lamar Media Corp., Sr. Unsecd. Note, 5.375%, 1/15/2024 | 388,125 | |
| 1,100,000 | Lin Television Corp., Sr. Unsecd. Note, 5.875%, 11/15/2022 | 1,097,250 | |
| 1,225,000 | 1,2 | Match Group, Inc., Sr. Unsecd. Note, Series 144A, 6.75%, 12/15/2022 | 1,218,875 |
| 900,000 | 1,2 | Nexstar Broadcasting, Inc., Sr. Unsecd. Note, Series 144A, 6.125%, 2/15/2022 | 884,250 |
| 900,000 | 1,2 | Nielsen Finance LLC/Nielsen Finance Co., Series 144A, 5.00%, 4/15/2022 | 892,125 |
| 1,000,000 | 1,2 | Nielsen Finance LLC/Nielsen Finance Co., Series 144A, 5.50%, 10/1/2021 | 1,028,750 |
| 725,000 | 1,2 | Radio One, Inc., Series 144A, 7.375%, 4/15/2022 | 647,969 |
| 800,000 | 1,2 | Radio One, Inc., Series 144A, 9.25%, 2/15/2020 | 636,000 |
| 1,650,000 | 1,2 | Sinclair Television Group, Series 144A, 5.625%, 8/1/2024 | 1,610,812 |
| 100,000 | Sinclair Television Group, Sr. Unsecd. Note, 6.125%, 10/1/2022 | 102,500 | |
| 1,350,000 | 1,2 | Southern Graphics Systems, Inc., Series 144A, 8.375%, 10/15/2020 | 1,363,500 |
| 325,000 | 1,2 | Time, Inc., Series 144A, 5.75%, 4/15/2022 | 298,188 |
| 800,000 | 1,2 | Townsquare Media, Inc., Sr. Unsecd. Note, Series 144A, 6.50%, 4/1/2023 | 735,000 |
| 1,025,000 | 1,2 | Tribune Media Co., Sr. Unsecd. Note, Series 144A, 5.875%, 7/15/2022 | 1,027,562 |
| TOTAL | 22,643,437 | ||
| Metals & Mining—0.6% | |||
| 1,025,000 | ArcelorMittal SA, 6.125%, 6/1/2025 | 750,813 | |
| 250,000 | Steel Dynamics, Inc., Sr. Unsecd. Note, 5.125%, 10/1/2021 | 232,500 | |
| 100,000 | Steel Dynamics, Inc., Sr. Unsecd. Note, 5.25%, 4/15/2023 | 91,750 | |
| 725,000 | Steel Dynamics, Inc., Sr. Unsecd. Note, 5.50%, 10/1/2024 | 663,375 | |
| 500,000 | 1 | Wise Metals Intermediate Holdings LLC/Wise Holdings Finance Corp., Series 144A, 9.75%, 6/15/2019 | 250,625 |
| TOTAL | 1,989,063 | ||
| Midstream—6.1% | |||
| 725,000 | Access Midstream Partners LP, Sr. Note, 4.875%, 5/15/2023 | 588,654 | |
| 125,000 | Access Midstream Partners LP, Sr. Unsecd. Note, 4.875%, 3/15/2024 | 100,320 | |
| 500,000 | Atlas Pipeline Partners LP, 5.875%, 8/1/2023 | 467,500 | |
| 375,000 | Chesapeake Midstream Partners L. P., Sr. Unsecd. Note, 6.125%, 7/15/2022 | 355,310 | |
| 800,000 | Crestwood Midstream Partners LP, Sr. Unsecd. Note, 6.125%, 3/1/2022 | 560,000 | |
| 825,000 | 1,2 | Crestwood Midstream Partners LP, Sr. Unsecd. Note, Series 144A, 6.25%, 4/1/2023 | 579,562 |
| 2,525,000 | Energy Transfer Equity LP, 5.875%, 1/15/2024 | 2,070,500 | |
| 450,000 | 1,2 | Ferrellgas LP/Ferrellgas Finance Corp., Sr. Unsecd. Note, Series 144A, 6.75%, 6/15/2023 | 369,000 |
| Principal Amount or Shares | Value | ||
| CORPORATE BONDS—continued | |||
| Midstream—continued | |||
| $500,000 | Ferrellgas, L.P., Sr. Unsecd. Note, 6.50%, 5/1/2021 | $427,500 | |
| 825,000 | Ferrellgas, L.P., Sr. Unsecd. Note, 6.75%, 1/15/2022 | 699,187 | |
| 750,000 | 1,2 | Hiland Partners LP, Series 144A, 5.50%, 5/15/2022 | 721,406 |
| 525,000 | Holly Energy Partners LP, Sr. Unsecd. Note, 6.50%, 3/1/2020 | 522,375 | |
| 775,000 | 1,2 | Kinder Morgan, Inc., Sr. Unsecd. Note, Series 144A, 5.625%, 11/15/2023 | 710,004 |
| 425,000 | 1,2 | MPLX LP, Series 144A, 4.50%, 7/15/2023 | 382,373 |
| 600,000 | 1,2 | MPLX LP, Series 144A, 4.875%, 12/1/2024 | 541,500 |
| 575,000 | 1,2 | MPLX LP, Series 144A, 4.875%, 6/1/2025 | 517,500 |
| 250,000 | Regency Energy Partners LP, 4.50%, 11/1/2023 | 216,732 | |
| 475,000 | Regency Energy Partners LP, 5.00%, 10/1/2022 | 421,558 | |
| 700,000 | Regency Energy Partners LP, 5.50%, 4/15/2023 | 631,169 | |
| 875,000 | Rose Rock Midstream LP/Rose Rock Finance Corp., Sr. Unsecd. Note, 5.625%, 7/15/2022 | 625,625 | |
| 925,000 | 1,2 | Rose Rock Midstream LP/Rose Rock Finance Corp., Sr. Unsecd. Note, Series 144A, 5.625%, 11/15/2023 | 661,375 |
| 1,725,000 | Sabine Pass LNG LP, 5.625%, 2/1/2021 | 1,595,625 | |
| 225,000 | Sabine Pass LNG LP, 5.625%, 4/15/2023 | 198,563 | |
| 300,000 | Sabine Pass LNG LP, 6.25%, 3/15/2022 | 279,000 | |
| 750,000 | 1,2 | Sabine Pass LNG LP, Series 144A, 5.625%, 3/1/2025 | 637,500 |
| 550,000 | Suburban Propane Partners LP, 5.50%, 6/1/2024 | 448,250 | |
| 698,000 | Suburban Propane Partners LP, 7.375%, 8/1/2021 | 673,570 | |
| 275,000 | Suburban Propane Partners LP, Sr. Unsecd. Note, 5.75%, 3/1/2025 | 225,500 | |
| 925,000 | Summit Midstream Holdings LLC, 5.50%, 8/15/2022 | 689,125 | |
| 275,000 | Summit Midstream Holdings LLC, Sr. Unsecd. Note, 7.50%, 7/1/2021 | 235,125 | |
| 300,000 | Targa Resources Partners LP/Targa Resources Partners Finance Corp., Sr. Unsecd. Note, 4.25%, 11/15/2023 | 232,500 | |
| 150,000 | Targa Resources Partners LP/Targa Resources Partners Finance Corp., Sr. Unsecd. Note, 5.25%, 5/1/2023 | 122,250 | |
| 470,000 | Tesoro Logistics LP, Sr. Unsecd. Note, 5.875%, 10/1/2020 | 451,200 | |
| 325,000 | Tesoro Logistics LP, Sr. Unsecd. Note, 6.125%, 10/15/2021 | 310,375 | |
| 50,000 | 1,2 | Tesoro Logistics LP, Sr. Unsecd. Note, Series 144A, 5.50%, 10/15/2019 | 48,750 |
| 200,000 | 1,2 | Tesoro Logistics LP, Sr. Unsecd. Note, Series 144A, 6.25%, 10/15/2022 | 190,500 |
| 625,000 | Western Refining Logistics LP/WNRL Finance Corp., Sr. Unsecd. Note, 7.50%, 2/15/2023 | 600,000 | |
| TOTAL | 19,106,983 | ||
| Oil Field Services—0.1% | |||
| 450,000 | Cgg SA, Sr. Unsecd. Note, 6.875%, 1/15/2022 | 186,750 | |
| 525,000 | FTS International, Inc., 6.25%, 5/1/2022 | 149,625 | |
| TOTAL | 336,375 | ||
| Packaging—6.5% | |||
| 1,100,000 | 1,2 | Ardagh Packaging Finance PLC, Company Guarantee, Series 144A, 9.125%, 10/15/2020 | 1,135,750 |
| 575,000 | 1,2 | Ardagh Packaging Finance PLC, Series 144A, 6.75%, 1/31/2021 | 554,875 |
| 70,588 | 1,2 | Ardagh Packaging Finance PLC, Series 144A, 7.00%, 11/15/2020 | 69,706 |
| 400,000 | 1,2 | Ardagh Packaging Finance PLC, Sr. Unsecd. Note, Series 144A, 6.00%, 6/30/2021 | 375,000 |
| 400,000 | 1,2 | Ardagh Packaging Finance PLC, Sr. Unsecd. Note, Series 144A, 9.125%, 10/15/2020 | 411,000 |
| 850,000 | Ball Corp., 4.00%, 11/15/2023 | 814,937 | |
| 500,000 | Ball Corp., 5.00%, 3/15/2022 | 512,500 | |
| 650,000 | Ball Corp., Sr. Unsecd. Note, 5.25%, 7/1/2025 | 667,062 | |
| 850,000 | Berry Plastics Corp., 5.125%, 7/15/2023 | 828,750 | |
| 1,800,000 | Berry Plastics Corp., 5.50%, 5/15/2022 | 1,795,500 | |
| 150,000 | 1,2 | Berry Plastics Corp., Series 144A, 6.00%, 10/15/2022 | 153,375 |
| 1,525,000 | 1,2 | Bway Holding Co., Series 144A, 9.125%, 8/15/2021 | 1,433,500 |
| 1,350,000 | Crown Americas LLC, 4.50%, 1/15/2023 | 1,326,375 | |
| 200,000 | Crown Americas LLC, Company Guarantee, 6.25%, 2/1/2021 | 206,750 |
| Principal Amount or Shares | Value | ||
| CORPORATE BONDS—continued | |||
| Packaging—continued | |||
| $950,000 | 1,2 | Multi Packaging Solutions, Inc., Series 144A, 8.50%, 8/15/2021 | $990,375 |
| 1,125,000 | 1,2 | Multi-Color Corp., Series 144A, 6.125%, 12/1/2022 | 1,119,375 |
| 150,000 | 1,2 | Owens-Brockway Glass Container, Inc., Series 144A, 5.00%, 1/15/2022 | 147,188 |
| 750,000 | 1,2 | Owens-Brockway Glass Container, Inc., Series 144A, 5.375%, 1/15/2025 | 735,937 |
| 250,000 | 1,2 | Owens-Brockway Glass Container, Inc., Series 144A, 5.875%, 8/15/2023 | 254,219 |
| 300,000 | 1,2 | Owens-Brockway Glass Container, Inc., Series 144A, 6.375%, 8/15/2025 | 308,813 |
| 1,250,000 | Reynolds Group Issuer, Inc./ LLC/LU, 5.75%, 10/15/2020 | 1,274,612 | |
| 1,225,000 | Reynolds Group, 8.25%, 2/15/2021 | 1,185,187 | |
| 300,000 | Reynolds Group, Sr. Unsecd. Note, 7.95%, 12/15/2025 | 280,500 | |
| 875,000 | 1,2 | Sealed Air Corp., Series 144A, 4.875%, 12/1/2022 | 880,469 |
| 650,000 | 1,2 | Sealed Air Corp., Series 144A, 5.25%, 4/1/2023 | 666,250 |
| 425,000 | 1,2 | Sealed Air Corp., Sr. Unsecd. Note, Series 144A, 5.125%, 12/1/2024 | 427,125 |
| 275,000 | 1,2 | Sealed Air Corp., Sr. Unsecd. Note, Series 144A, 5.50%, 9/15/2025 | 281,188 |
| 1,750,000 | 1,2 | Signode Industrial Group, Series 144A, 6.375%, 5/1/2022 | 1,496,250 |
| TOTAL | 20,332,568 | ||
| Paper—0.5% | |||
| 775,000 | Clearwater Paper Corp., Sr. Note, 4.50%, 2/1/2023 | 732,375 | |
| 625,000 | 1,2 | Clearwater Paper Corp., Sr. Unsecd. Note, Series 144A, 5.375%, 2/1/2025 | 606,250 |
| 275,000 | Graphic Packaging International, Inc., Sr. Unsecd. Note, 4.875%, 11/15/2022 | 279,125 | |
| TOTAL | 1,617,750 | ||
| Pharmaceuticals—3.7% | |||
| 50,000 | 1,2 | ENDO Finance LLC/ENDO Finco, Inc., Sr. Unsecd. Note, Series 144A, 5.375%, 1/15/2023 | 49,250 |
| 1,000,000 | 1,2 | ENDO Finance LLC/ENDO Finco, Inc., Sr. Unsecd. Note, Series 144A, 6.00%, 2/1/2025 | 990,000 |
| 1,000,000 | 1,2 | ENDO Finance LLC/ENDO Finco, Inc., Sr. Unsecd. Note, Series 144A, 6.00%, 7/15/2023 | 1,000,000 |
| 1,225,000 | Grifols Worldwide Operations Ltd., Sr. Unsecd. Note, 5.25%, 4/1/2022 | 1,234,188 | |
| 2,075,000 | 1,2 | Jaguar Holding Co. II/Pharmaceutical Product Development LLC, Sr. Unsecd. Note, Series 144A, 6.375%, 8/1/2023 | 2,028,312 |
| 150,000 | 1,2 | Mallinckrodt International Finance SA/Mallinckrodt CB LLC, Series 144A, 4.875%, 4/15/2020 | 145,125 |
| 1,225,000 | Mallinckrodt International Finance SA/Mallinckrodt CB LLC, Sr. Unsecd. Note, 4.75%, 4/15/2023 | 1,090,250 | |
| 675,000 | 1,2 | Mallinckrodt International Finance SA/Mallinckrodt CB LLC, Sr. Unsecd. Note, Series 144A, 5.50%, 4/15/2025 | 624,375 |
| 225,000 | 1,2 | Mallinckrodt International Finance SA/Mallinckrodt CB LLC, Sr. Unsecd. Note, Series 144A, 5.625%, 10/15/2023 | 214,875 |
| 375,000 | 1,2 | Quintiles Transnational Corp., Sr. Unsecd. Note, Series 144A, 4.875%, 5/15/2023 | 378,750 |
| 450,000 | 1,2 | Valeant Pharmaceuticals International, Inc., Series 144A, 5.625%, 12/1/2021 | 416,250 |
| 1,200,000 | 1,2 | Valeant Pharmaceuticals International, Inc., Series 144A, 7.50%, 7/15/2021 | 1,203,000 |
| 200,000 | 1,2 | Valeant Pharmaceuticals International, Inc., Sr. Unsecd. Note, Series 144A, 5.50%, 3/1/2023 | 177,000 |
| 50,000 | 1,2 | Vrx Escrow Corp, Series 144A, 5.375%, 3/15/2020 | 47,250 |
| 950,000 | 1,2 | Vrx Escrow Corp, Series 144A, 5.875%, 5/15/2023 | 852,625 |
| 1,125,000 | 1,2 | Vrx Escrow Corp, Series 144A, 6.125%, 4/15/2025 | 1,006,875 |
| TOTAL | 11,458,125 | ||
| Refining—0.4% | |||
| 525,000 | CVR Refining LLC/Coffeyville Finance, Inc., 6.50%, 11/1/2022 | 511,875 | |
| 850,000 | Tesoro Petroleum Corp., 5.125%, 4/1/2024 | 850,000 | |
| TOTAL | 1,361,875 | ||
| Restaurants—1.2% | |||
| 575,000 | 1,2 | 1011778 BC Unltd. Liability Co./New Red Finance, Inc., Series 144A, 4.625%, 1/15/2022 | 577,875 |
| 2,125,000 | 1,2 | 1011778 BC Unltd. Liability Co./New Red Finance, Inc., Series 144A, 6.00%, 4/1/2022 | 2,194,062 |
| 850,000 | NPC INTL/OPER CO. A&B, Inc., 10.50%, 1/15/2020 | 884,000 | |
| TOTAL | 3,655,937 | ||
| Retailers—2.8% | |||
| 1,775,000 | 1,2 | Argos Merger Sub, Inc., Sr. Unsecd. Note, Series 144A, 7.125%, 3/15/2023 | 1,764,350 |
| Principal Amount or Shares | Value | ||
| CORPORATE BONDS—continued | |||
| Retailers—continued | |||
| $525,000 | 1 | Jo-Ann Stores, Inc., Series 144A, 9.75%, 10/15/2019 | $291,375 |
| 625,000 | Limited Brands, Inc., 5.625%, 10/15/2023 | 665,625 | |
| 625,000 | Limited Brands, Inc., Sr. Unsecd. Note, 5.625%, 2/15/2022 | 664,844 | |
| 1,125,000 | 1,2 | Michaels Stores, Inc., Series 144A, 5.875%, 12/15/2020 | 1,164,375 |
| 900,000 | 1,2 | Neiman-Marcus Group, Inc., Series 144A, 8.75%, 10/15/2021 | 562,500 |
| 975,000 | 1,2 | PETCO Animal Supplies, Inc., Series 144A, 8.50%, 10/15/2017 | 993,281 |
| 950,000 | 1,2 | PETCO Animal Supplies, Inc., Sr. Note, Series 144A, 9.25%, 12/1/2018 | 976,125 |
| 1,125,000 | 1,2 | Rite Aid Corp., Sr. Unsecd. Note, Series 144A, 6.125%, 4/1/2023 | 1,168,594 |
| 125,000 | Sally Hldgs. LLC/Sally Capital, Inc., 5.625%, 12/1/2025 | 126,875 | |
| 325,000 | Sally Hldgs. LLC/Sally Capital, Inc., Sr. Note, 5.50%, 11/1/2023 | 333,937 | |
| TOTAL | 8,711,881 | ||
| Technology—10.9% | |||
| 775,000 | Advanced Micro Devices, Inc., 7.00%, 7/1/2024 | 507,625 | |
| 375,000 | Advanced Micro Devices, Inc., Sr. Unsecd. Note, 7.50%, 8/15/2022 | 256,875 | |
| 975,000 | 1,2 | BMC Software, Inc., Series 144A, 8.125%, 7/15/2021 | 652,031 |
| 650,000 | 1,2 | Blackboard, Inc., Sr. Unsecd. Note, Series 144A, 7.75%, 11/15/2019 | 565,500 |
| 1,100,000 | 1,2 | Blue Coat Systems, Inc., Sr. Unsecd. Note, Series 144A, 8.375%, 6/1/2023 | 1,111,000 |
| 1,100,000 | 1,2 | Boxer Parent Co., Inc., Series 144A, 9.00%, 10/15/2019 | 686,125 |
| 200,000 | CDW LLC/CDW Finance, 6.00%, 8/15/2022 | 211,750 | |
| 750,000 | CDW LLC/CDW Finance, Sr. Unsecd. Note, 5.00%, 9/1/2023 | 763,125 | |
| 1,350,000 | CDW LLC/CDW Finance, Sr. Unsecd. Note, 5.50%, 12/1/2024 | 1,417,500 | |
| 675,000 | 1,2 | CommScope Technologies Finance LLC, Series 144A, 6.00%, 6/15/2025 | 651,375 |
| 625,000 | 1,2 | CommScope, Inc., Series 144A, 5.50%, 6/15/2024 | 596,093 |
| 425,000 | 1,2 | CommScope, Inc., Sr. Note, Series 144A, 6.625%, 6/1/2020 | 431,375 |
| 1,050,000 | 1,2 | Ensemble S Merger Sub, Inc., Sr. Unsecd. Note, Series 144A, 9.00%, 9/30/2023 | 1,018,500 |
| 1,300,000 | 1,2 | First Data Corp., Series 144A, 5.375%, 8/15/2023 | 1,309,750 |
| 2,575,000 | 1,2 | First Data Corp., Series 144A, 5.75%, 1/15/2024 | 2,542,812 |
| 2,083,000 | 1,2 | First Data Corp., Sr. Secd. 2nd Priority Note, Series 144A, 8.75%, 1/15/2022 | 2,179,026 |
| 600,000 | 1,2 | First Data Corp., Sr. Unsecd. Note, Series 144A, 7.00%, 12/1/2023 | 601,500 |
| 1,000,000 | 1,2 | Igloo Holdings Corp., Sr. Note, Series 144A, 8.25%, 12/15/2017 | 1,001,250 |
| 2,425,000 | 1,2 | Infor Software Parent, Inc., Series 144A, 7.125%, 5/1/2021 | 1,761,156 |
| 150,000 | 1,2 | Infor US, Inc., Series 144A, 5.75%, 8/15/2020 | 151,500 |
| 1,525,000 | 1,2 | Infor US, Inc., Series 144A, 6.50%, 5/15/2022 | 1,292,437 |
| 400,000 | 1,2 | Interactive Data Corp., Series 144A, 5.875%, 4/15/2019 | 410,000 |
| 300,000 | Iron Mountain, Inc., 5.75%, 8/15/2024 | 290,625 | |
| 1,300,000 | 1,2 | Italics Merger Sub, Inc., Sr. Unsecd. Note, Series 144A, 7.125%, 7/15/2023 | 1,183,000 |
| 525,000 | 1,2 | MSCI, Inc., Series 144A, 5.75%, 8/15/2025 | 539,438 |
| 250,000 | 1,2 | MSCI, Inc., Sr. Unsecd. Note, Series 144A, 5.25%, 11/15/2024 | 254,375 |
| 275,000 | 1,2 | Micron Technology, Inc., Sr. Unsecd. Note, Series 144A, 5.25%, 1/15/2024 | 242,688 |
| 675,000 | 1,2 | Micron Technology, Inc., Sr. Unsecd. Note, Series 144A, 5.25%, 8/1/2023 | 609,188 |
| 450,000 | NCR Corp., 6.375%, 12/15/2023 | 444,938 | |
| 500,000 | NCR Corp., Sr. Unsecd. Note, 4.625%, 2/15/2021 | 478,125 | |
| 675,000 | NCR Corp., Sr. Unsecd. Note, 5.00%, 7/15/2022 | 657,282 | |
| 175,000 | NCR Corp., Sr. Unsecd. Note, 5.875%, 12/15/2021 | 173,032 | |
| 1,275,000 | 1,2 | Nuance Communications, Inc., Series 144A, 5.375%, 8/15/2020 | 1,283,058 |
| 825,000 | 1,2 | Qorvo, Inc., Sr. Unsecd. Note, Series 144A, 7.00%, 12/1/2025 | 851,812 |
| 675,000 | 1,2 | SS&C Technologies Holdings, Inc., Sr. Unsecd. Note, Series 144A, 5.875%, 7/15/2023 | 698,625 |
| 125,000 | 1,2 | Sabre GLBL, Inc., Series 144A, 5.25%, 11/15/2023 | 124,219 |
| 725,000 | 1,2 | Sabre GLBL, Inc., Series 144A, 5.375%, 4/15/2023 | 725,000 |
| Principal Amount or Shares | Value | ||
| CORPORATE BONDS—continued | |||
| Technology—continued | |||
| $625,000 | 1,2 | Sensata Technologies B.V., Series 144A, 5.625%, 11/1/2024 | $641,406 |
| 300,000 | 1,2 | Sensata Technologies B.V., Sr. Unsecd. Note, Series 144A, 5.00%, 10/1/2025 | 294,000 |
| 225,000 | 1,2 | Sensata Technologies UK Financing Co. PLC, Sr. Unsecd. Note, Series 144A, 6.25%, 2/15/2026 | 234,563 |
| 1,375,000 | 1,2 | Solera Holdings, Inc., Series 144A, 6.00%, 6/15/2021 | 1,390,468 |
| 475,000 | 1,2 | Solera Holdings, Inc., Series 144A, 6.125%, 11/1/2023 | 479,750 |
| 975,000 | Syniverse Holdings, Inc., Company Guarantee, 9.125%, 1/15/2019 | 450,938 | |
| 725,000 | Verisign, Inc., 4.625%, 5/1/2023 | 705,606 | |
| 1,025,000 | Zebra Technologies Corp., Sr. Note, 7.25%, 10/15/2022 | 1,073,687 | |
| TOTAL | 33,944,128 | ||
| Transportation Services—0.5% | |||
| 1,250,000 | HDTFS, Inc., 6.25%, 10/15/2022 | 1,300,000 | |
| 150,000 | Hertz Corp., 5.875%, 10/15/2020 | 155,438 | |
| 200,000 | Hertz Corp., Company Guarantee, 6.75%, 4/15/2019 | 204,800 | |
| TOTAL | 1,660,238 | ||
| Utility - Electric—1.3% | |||
| 1,450,000 | Calpine Corp., 5.75%, 1/15/2025 | 1,285,062 | |
| 175,000 | 1,2 | Calpine Corp., Bond, Series 144A, 6.00%, 1/15/2022 | 181,508 |
| 425,000 | 1,2 | Calpine Corp., Series 144A, 5.875%, 1/15/2024 | 437,750 |
| 15,521 | 1 | FPL Energy National Wind, Note, Series 144A, 6.125%, 3/25/2019 | 15,637 |
| 650,000 | NRG Energy, Inc., 6.25%, 5/1/2024 | 549,380 | |
| 475,000 | NRG Energy, Inc., Company Guarantee, 8.25%, 9/1/2020 | 463,125 | |
| 450,000 | NRG Energy, Inc., Sr. Unsecd. Note, 7.875%, 5/15/2021 | 424,125 | |
| 675,000 | 1,2 | TerraForm Power Operating LLC, Sr. Unsecd. Note, Series 144A, 5.875%, 2/1/2023 | 561,938 |
| 200,000 | 1,2 | TerraForm Power Operating LLC, Sr. Unsecd. Note, Series 144A, 6.125%, 6/15/2025 | 162,000 |
| TOTAL | 4,080,525 | ||
| Wireless Communications—4.3% | |||
| 1,200,000 | 1,2 | Altice SA, Series 144A, 7.75%, 5/15/2022 | 1,086,000 |
| 825,000 | 1,2 | Altice SA, Sr. Unsecd. Note, Series 144A, 7.625%, 2/15/2025 | 713,625 |
| 275,000 | 1,2 | Digicel Ltd., Series 144A, 6.00%, 4/15/2021 | 233,063 |
| 1,575,000 | 1,2 | Digicel Ltd., Sr. Unsecd. Note, Series 144A, 8.25%, 9/30/2020 | 1,307,250 |
| 225,000 | MetroPCS Wireless, Inc., 6.125%, 1/15/2022 | 231,750 | |
| 50,000 | MetroPCS Wireless, Inc., 6.731%, 4/28/2022 | 52,250 | |
| 1,025,000 | MetroPCS Wireless, Inc., Sr. Note, 6.625%, 11/15/2020 | 1,068,040 | |
| 75,000 | MetroPCS Wireless, Inc., Sr. Note, 6.633%, 4/28/2021 | 78,563 | |
| 800,000 | MetroPCS Wireless, Inc., Sr. Note, 6.836%, 4/28/2023 | 830,000 | |
| 925,000 | 1,2 | Numericable Group SA, Series 144A, 6.00%, 5/15/2022 | 899,562 |
| 425,000 | 1,2 | Numericable Group SA, Series 144A, 6.25%, 5/15/2024 | 411,188 |
| 2,275,000 | Sprint Capital Corp., Company Guarantee, 6.875%, 11/15/2028 | 1,598,187 | |
| 725,000 | Sprint Corp., 7.125%, 6/15/2024 | 531,062 | |
| 1,075,000 | Sprint Corp., 7.875%, 9/15/2023 | 810,012 | |
| 175,000 | Sprint Corp., Sr. Unsecd. Note, 7.625%, 2/15/2025 | 128,625 | |
| 300,000 | 1,2 | Sprint Nextel Corp., Series 144A, 7.00%, 3/1/2020 | 301,500 |
| 975,000 | Sprint Nextel Corp., Sr. Unsecd. Note, 6.00%, 11/15/2022 | 702,000 | |
| 375,000 | T-Mobile USA, Inc., 6.625%, 4/1/2023 | 383,438 | |
| 275,000 | T-Mobile USA, Inc., Sr. Unsecd. Note, 6.00%, 3/1/2023 | 279,125 | |
| 375,000 | T-Mobile USA, Inc., Sr. Unsecd. Note, 6.375%, 3/1/2025 | 380,625 | |
| 775,000 | T-Mobile USA, Inc., Sr. Unsecd. Note, 6.50%, 1/15/2024 | 792,437 | |
| 575,000 | T-Mobile USA, Inc., Sr. Unsecd. Note, 6.50%, 1/15/2026 | 581,894 | |
| TOTAL | 13,400,196 |
| Principal Amount or Shares | Value | ||
| CORPORATE BONDS—continued | |||
| Wireline Communications—0.6% | |||
| $225,000 | Level 3 Communications, Inc., Sr. Unsecd. Note, 5.75%, 12/1/2022 | $230,625 | |
| 400,000 | Level 3 Financing, Inc., 7.00%, 6/1/2020 | 419,000 | |
| 850,000 | 1,2 | Level 3 Financing, Inc., Series 144A, 5.375%, 5/1/2025 | 848,938 |
| 150,000 | Level 3 Financing, Inc., Sr. Unsecd. Note, 6.125%, 1/15/2021 | 155,625 | |
| 350,000 | 1,2 | Level 3 Financing, Inc., Sr. Unsecd. Note, Series 144A, 5.375%, 1/15/2024 | 352,625 |
| TOTAL | 2,006,813 | ||
| TOTAL CORPORATE BONDS (IDENTIFIED COST $334,100,979) | 303,365,340 | ||
| COMMON STOCKS—0.0% | |||
| Independent Energy—0.0% | |||
| 6,236 | 1,3,5 | Lone Pine Resources Canada Ltd. | 0 |
| 6,236 | 3,5 | Lone Pine Resources, Inc. | 8,419 |
| 50,000 | 1,3,5 | Lone Pine Resources, Inc., Escrow Shares | 0 |
| TOTAL COMMON STOCKS (IDENTIFIED COST $49,520) | 8,419 | ||
| REPURCHASE AGREEMENT—0.9% | |||
| $2,863,000 | Interest in $600,000,000 joint repurchase agreement 0.32%, dated 12/31/2015 under which Bank of America, N.A. will repurchase securities provided as collateral for $600,021,333 on 1/4/2016. The securities provided as collateral at the end of the period held with BNY Mellon as tri-party agent, were U.S. Government Agency securities maturing on 2/25/2044 and the market value of those underlying securities was $618,021,974. (AT COST) | 2,863,000 | |
| TOTAL INVESTMENTS—98.3% (IDENTIFIED COST $337,013,499)7 | 306,236,759 | ||
| OTHER ASSETS AND LIABILITIES - NET—1.7%8 | 5,390,247 | ||
| TOTAL NET ASSETS—100% | $311,627,006 |
| 1 | Denotes a restricted security that either: (a) cannot be offered for public sale without first being registered, or being able to take advantage of an exemption from registration, under the Securities Act of 1933; or (b) is subject to a contractual restriction on public sales. At December 31, 2015, these restricted securities amounted to $154,845,506, which represented 49.7% of total net assets. |
| 2 | Denotes a restricted security that may be resold without restriction to “qualified institutional buyers” as defined in Rule 144A under the Securities Act of 1933 and that the Fund has determined to be liquid under criteria established by the Fund's Board of Trustees (the “Trustees”). At December 31, 2015, these liquid restricted securities amounted to $153,535,369, which represented 49.3% of total net assets. |
| 3 | Non-income-producing security. |
| 4 | Issuer in default. |
| 5 | Market quotations and price evaluations are not available. Fair value determined in accordance with procedures established by and under the general supervision of the Trustees. |
| 6 | Principal amount and interest were not paid upon final maturity. |
| 7 | The cost of investments for federal tax purposes amounts to $337,783,185. |
| 8 | Assets, other than investments in securities, less liabilities. See Statement of Assets and Liabilities. |
| Valuation Inputs | ||||
| Level 1— Quoted Prices | Level 2— Other Significant Observable Inputs | Level 3— Significant Unobservable Inputs | Total | |
| Debt Securities: | ||||
| Corporate Bonds | $— | $303,365,340 | $0 | $303,365,340 |
| Equity Securities: | ||||
| Common Stocks | ||||
| International | — | — | 8,419 | 8,419 |
| Repurchase Agreement | — | 2,863,000 | — | 2,863,000 |
| TOTAL SECURITIES | $— | $306,228,340 | $8,419 | $306,236,759 |
| Year Ended December 31 | 2015 | 2014 | 2013 | 2012 | 2011 |
| Net Asset Value, Beginning of Period | $6.91 | $7.15 | $7.17 | $6.76 | $7.03 |
| Income From Investment Operations: | |||||
| Net investment income1 | 0.37 | 0.39 | 0.44 | 0.49 | 0.53 |
| Net realized and unrealized gain (loss) on investments | (0.53) | (0.20) | 0.04 | 0.46 | (0.18) |
| TOTAL FROM INVESTMENT OPERATIONS | (0.16) | 0.19 | 0.48 | 0.95 | 0.35 |
| Less Distributions: | |||||
| Distributions from net investment income | (0.39) | (0.43) | (0.50) | (0.54) | (0.62) |
| Net Asset Value, End of Period | $6.36 | $6.91 | $7.15 | $7.17 | $6.76 |
| Total Return2 | (2.57)% | 2.69% | 6.99% | 14.70% | 5.17% |
| Ratios to Average Net Assets: | |||||
| Net expenses | 0.77% | 0.77% | 0.79% | 0.77% | 0.79% |
| Net investment income | 5.55% | 5.60% | 6.21% | 7.14% | 7.77% |
| Expense waiver/reimbursement3 | — | — | — | 0.00%4 | 0.00%4 |
| Supplemental Data: | |||||
| Net assets, end of period (000 omitted) | $267,448 | $287,649 | $246,994 | $205,500 | $157,842 |
| Portfolio turnover | 33% | 33% | 32% | 33% | 38% |
| 1 | Per share numbers have been calculated using the average shares method. |
| 2 | Based on net asset value. Total returns do not reflect any additional fees or expenses that may be imposed by separate accounts of insurance companies or in connection with any variable annuity or variable life insurance contract. |
| 3 | This expense decrease is reflected in both the net expense and the net investment income ratios shown above. |
| 4 | Represents less than $0.01. |
| Year Ended December 31 | 2015 | 2014 | 2013 | 2012 | 2011 |
| Net Asset Value, Beginning of Period | $6.87 | $7.11 | $7.13 | $6.73 | $7.00 |
| Income From Investment Operations: | |||||
| Net investment income1 | 0.35 | 0.38 | 0.42 | 0.47 | 0.51 |
| Net realized and unrealized gain (loss) on investments | (0.52) | (0.21) | 0.04 | 0.45 | (0.18) |
| TOTAL FROM INVESTMENT OPERATIONS | (0.17) | 0.17 | 0.46 | 0.92 | 0.33 |
| Less Distributions: | |||||
| Distributions from net investment income | (0.37) | (0.41) | (0.48) | (0.52) | (0.60) |
| Net Asset Value, End of Period | $6.33 | $6.87 | $7.11 | $7.13 | $6.73 |
| Total Return2 | (2.72)% | 2.42% | 6.73% | 14.31% | 4.92% |
| Ratios to Average Net Assets: | |||||
| Net expenses | 1.01% | 1.02% | 1.04% | 1.02% | 1.04% |
| Net investment income | 5.29% | 5.35% | 5.97% | 6.88% | 7.50% |
| Expense waiver/reimbursement3 | — | — | — | 0.00%4 | 0.00%4 |
| Supplemental Data: | |||||
| Net assets, end of period (000 omitted) | $44,179 | $57,999 | $64,085 | $76,202 | $71,867 |
| Portfolio turnover | 33% | 33% | 32% | 33% | 38% |
| 1 | Per share numbers have been calculated using the average shares method. |
| 2 | Based on net asset value. Total returns do not reflect any additional fees or expenses that may be imposed by separate accounts of insurance companies or in connection with any variable annuity or variable life insurance contract. |
| 3 | This expense decrease is reflected in both the net expense and the net investment income ratios shown above. |
| 4 | Represents less than 0.01%. |
| Assets: | ||
| Total investment in securities, at value (identified cost $337,013,499) | $306,236,759 | |
| Cash | 704 | |
| Income receivable | 5,441,613 | |
| Receivable for shares sold | 26,457 | |
| TOTAL ASSETS | 311,705,533 | |
| Liabilities: | ||
| Payable for shares redeemed | $15,856 | |
| Payable to adviser (Note 5) | 5,122 | |
| Payable for custodian fees | 4,518 | |
| Payable for transfer agent fee | 6,433 | |
| Payable for portfolio accounting fees | 36,362 | |
| Payable for distribution services fee (Note 5) | 9,530 | |
| Accrued expenses (Note 5) | 706 | |
| TOTAL LIABILITIES | 78,527 | |
| Net assets for 49,059,062 shares outstanding | $311,627,006 | |
| Net Assets Consist of: | ||
| Paid-in capital | $345,278,830 | |
| Net unrealized depreciation of investments | (30,776,740) | |
| Accumulated net realized loss on investments | (22,698,973) | |
| Undistributed net investment income | 19,823,889 | |
| TOTAL NET ASSETS | $311,627,006 | |
| Net Asset Value, Offering Price and Redemption Proceeds Per Share | ||
| Primary Shares: | ||
| $267,447,986 ÷ 42,074,278 shares outstanding, no par value, unlimited shares authorized | $6.36 | |
| Service Shares: | ||
| $44,179,020 ÷ 6,984,784 shares outstanding, no par value, unlimited shares authorized | $6.33 |
| Investment Income: | ||
| Interest | $21,907,290 | |
| Dividends | 3,062 | |
| TOTAL INCOME | 21,910,352 | |
| Expenses: | ||
| Investment adviser fee (Note 5) | $2,083,522 | |
| Administrative fee (Note 5) | 271,728 | |
| Custodian fees | 18,425 | |
| Transfer agent fee | 33,966 | |
| Directors'/Trustees' fees (Note 5) | 3,555 | |
| Auditing fees | 29,800 | |
| Legal fees | 8,894 | |
| Portfolio accounting fees | 145,535 | |
| Distribution services fee (Note 5) | 135,584 | |
| Printing and postage | 50,599 | |
| Miscellaneous (Note 5) | 11,730 | |
| TOTAL EXPENSES | 2,793,338 | |
| Net expenses | 2,793,338 | |
| Net investment income | 19,117,014 | |
| Realized and Unrealized Gain (Loss) on Investments: | ||
| Net realized loss on investments | (2,643,998) | |
| Net change in unrealized depreciation of investments | (25,064,392) | |
| Net realized and unrealized loss on investments | (27,708,390) | |
| Change in net assets resulting from operations | $(8,591,376) |
| Year Ended December 31 | 2015 | 2014 |
| Increase (Decrease) in Net Assets | ||
| Operations: | ||
| Net investment income | $19,117,014 | $18,717,886 |
| Net realized gain (loss) on investments | (2,643,998) | 4,877,916 |
| Net change in unrealized appreciation/depreciation of investments | (25,064,392) | (16,062,110) |
| CHANGE IN NET ASSETS RESULTING FROM OPERATIONS | (8,591,376) | 7,533,692 |
| Distributions to Shareholders: | ||
| Distributions from net investment income | ||
| Primary Shares | (16,404,431) | (14,916,828) |
| Service Shares | (3,072,404) | (3,728,834) |
| CHANGE IN NET ASSETS RESULTING FROM DISTRIBUTIONS TO SHAREHOLDERS | (19,476,835) | (18,645,662) |
| Share Transactions: | ||
| Proceeds from sale of shares | 81,191,609 | 143,957,405 |
| Net asset value of shares issued to shareholders in payment of distributions declared | 9,473,444 | 11,958,275 |
| Cost of shares redeemed | (96,618,194) | (110,233,943) |
| CHANGE IN NET ASSETS RESULTING FROM SHARE TRANSACTIONS | (5,953,141) | 45,681,737 |
| Change in net assets | (34,021,352) | 34,569,767 |
| Net Assets: | ||
| Beginning of period | 345,648,358 | 311,078,591 |
| End of period (including undistributed net investment income of $19,823,889 and $19,460,485, respectively) | $311,627,006 | $345,648,358 |
| ■ | Fixed-income securities acquired with remaining maturities greater than 60 days are fair valued using price evaluations provided by a pricing service approved by the Trustees. |
| ■ | Fixed-income securities and repurchase agreements acquired with remaining maturities of 60 days or less are valued at their cost (adjusted for the accretion of any discount or amortization of any premium), unless the issuer's creditworthiness is impaired or other factors indicate that amortized cost is not an accurate estimate of the investment's fair value, in which case it would be valued in the same manner as a longer-term security. |
| ■ | Equity securities listed on an exchange or traded through a regulated market system are valued at their last reported sale price or official closing price in their principal exchange or market. |
| ■ | Shares of other mutual funds or non-exchange-traded investment companies are valued based upon their reported NAVs. |
| ■ | Derivative contracts listed on exchanges are valued at their reported settlement or closing price, except that options are valued at the mean of closing bid and asked quotations. |
| ■ | Over-the-counter (OTC) derivative contracts are fair valued using price evaluations provided by a pricing service approved by the Trustees. |
| ■ | For securities that are fair valued in accordance with procedures established by and under the general supervision of the Trustees, certain factors may be considered such as: the last traded or purchase price of the security, information obtained by contacting the issuer or dealers, analysis of the issuer's financial statements or other available documents, fundamental analytical data, the nature and duration of restrictions on disposition, the movement of the market in which the security is normally traded, public trading in similar securities or derivative contracts of the issuer or comparable issuers, movement of a relevant index, or other factors including but not limited to industry changes and relevant government actions. |
| ■ | With respect to securities traded principally in foreign markets, significant trends in U.S. equity markets or in the trading of foreign securities index futures contracts; |
| ■ | Political or other developments affecting the economy or markets in which an issuer conducts its operations or its securities are traded; |
| ■ | Announcements concerning matters such as acquisitions, recapitalizations, litigation developments, or a natural disaster affecting the issuer's operations or regulatory changes or market developments affecting the issuer's industry. |
| Security | Acquisition Date | Cost | Market Value |
| International Automotive Components, Sr. Secd. Note, Series 144A, 9.125%, 6/1/2018 | 5/26/2011-1/28/2015 | $889,688 | $752,500 |
| FPL Energy National Wind, Note, Series 144A, 6.125%, 3/25/2019 | 2/16/2005 | $15,521 | $15,637 |
| Hard Rock Park Operations LLC, Sr. Secd. Note, Series 144A, 7.40%, 4/1/2012 | 3/23/2006 | $737,477 | $0 |
| Jo-Ann Stores, Inc., Series 144A, 9.75%, 10/15/2019 | 10/9/2012-11/1/2013 | $525,872 | $291,375 |
| Lone Pine Resources Canada Ltd. | 1/30/2014 | $0 | $0 |
| Lone Pine Resources, Inc., Escrow Shares | 1/30/2014 | $0 | $0 |
| Wise Metals Intermediate Holdings LLC/Wise Holdings Finance Corp., Series 144A, 9.75%, 6/15/2019 | 4/11/2014-4/15/2014 | $497,844 | $250,625 |
| Year Ended December 31 | 2015 | 2014 | ||
| Primary Shares: | Shares | Amount | Shares | Amount |
| Shares sold | 10,351,120 | $69,968,422 | 16,865,839 | $118,315,427 |
| Shares issued to shareholders in payment of distributions declared | 958,240 | 6,401,040 | 1,194,404 | 8,229,441 |
| Shares redeemed | (10,865,623) | (72,747,658) | (10,995,390) | (76,950,842) |
| NET CHANGE RESULTING FROM PRIMARY SHARE TRANSACTIONS | 443,737 | $3,621,804 | 7,064,853 | $49,594,026 |
| Year Ended December 31 | 2015 | 2014 | ||
| Service Shares: | Shares | Amount | Shares | Amount |
| Shares sold | 1,679,673 | $11,223,187 | 3,674,963 | $25,641,978 |
| Shares issued to shareholders in payment of distributions declared | 461,322 | 3,072,404 | 542,770 | 3,728,834 |
| Shares redeemed | (3,593,865) | (23,870,536) | (4,795,305) | (33,283,101) |
| NET CHANGE RESULTING FROM SERVICE SHARE TRANSACTIONS | (1,452,870) | $(9,574,945) | (577,572) | $(3,912,289) |
| NET CHANGE RESULTING FROM TOTAL FUND SHARE TRANSACTIONS | (1,009,133) | $(5,953,141) | 6,487,281 | $45,681,737 |
| Increase (Decrease) | |
| Undistributed Net Investment Income (Loss) | Accumulated Net Realized Gain (Loss) |
| $723,225 | $(723,225) |
| 2015 | 2014 | |
| Ordinary Income | $19,476,835 | $18,645,662 |
| Undistributed ordinary income | $19,827,167 |
| Net unrealized depreciation | $(31,546,426) |
| Capital loss carryforwards | $(21,932,565) |
| Expiration Year | Short-Term | Long-Term | Total |
| No Expiration | $546,666 | $2,687,926 | $3,234,592 |
| 2017 | $9,764,569 | NA | $9,764,569 |
| 2018 | $8,933,404 | NA | $8,933,404 |
| Administrative Fee | Average Daily Net Assets of the Investment Complex |
| 0.150% | on the first $5 billion |
| 0.125% | on the next $5 billion |
| 0.100% | on the next $10 billion |
| 0.075% | on assets in excess of $20 billion |
| Distribution Services Fees Incurred | |
| Service Shares | $135,584 |
| Purchases | $111,881,595 |
| Sales | $116,143,633 |
February 12, 2016
| Beginning Account Value 7/1/2015 | Ending Account Value 12/31/2015 | Expenses Paid During Period1 | |
| Actual: | |||
| Primary Shares | $1,000 | $949.30 | $3.78 |
| Service Shares | $1,000 | $947.60 | $5.01 |
| Hypothetical (assuming a 5% return before expenses): | |||
| Primary Shares | $1,000 | $1,021.32 | $3.92 |
| Service Shares | $1,000 | $1,020.06 | $5.19 |
| 1 | Expenses are equal to the Fund's annualized net expense ratios, multiplied by the average account value over the period, multiplied by 184/365 (to reflect the one-half-year period). The expenses shown in the table do not include the charges and expenses imposed by the insurance company under the variable insurance product contract. Please refer to the variable insurance product prospectus for a complete listing of these expenses. The annualized net expense ratios are as follows: |
| Primary Shares | 0.77% |
| Service Shares | 1.02% |
| Name Birth Date Positions Held with Trust Date Service Began | Principal Occupation(s) for Past Five Years, Other Directorships Held and Previous Position(s) |
| John F. Donahue* Birth Date: July 28, 1924 Trustee Indefinite Term Began serving: October 1993 | Principal Occupations: Director or Trustee of the Federated Fund Family; Chairman and Director, Federated Investors, Inc.; Chairman of the Federated Fund Family's Executive Committee. Previous Positions: Chairman of the Federated Fund Family; Trustee, Federated Investment Management Company; Chairman and Director, Federated Investment Counseling. |
| J. Christopher Donahue* Birth Date: April 11, 1949 Trustee Indefinite Term Began serving: October 1993 | Principal Occupations: Principal Executive Officer and President of certain of the Funds in the Federated Fund Family; Director or Trustee of the Funds in the Federated Fund Family; President, Chief Executive Officer and Director, Federated Investors, Inc.; Chairman and Trustee, Federated Investment Management Company; Trustee, Federated Investment Counseling; Chairman and Director, Federated Global Investment Management Corp.; Chairman, Federated Equity Management Company of Pennsylvania and Passport Research, Ltd. (investment advisory subsidiary of Federated); Trustee, Federated Shareholder Services Company; Director, Federated Services Company. Previous Positions: President, Federated Investment Counseling; President and Chief Executive Officer, Federated Investment Management Company, Federated Global Investment Management Corp. and Passport Research, Ltd. |
| * | Family relationships and reasons for “interested” status: John F. Donahue is the father of J. Christopher Donahue; both are “interested” due to their beneficial ownership of shares of Federated Investors, Inc. and the positions they hold with Federated and its subsidiaries. |
| Name Birth Date Positions Held with Trust Date Service Began | Principal Occupation(s) for Past Five Years, Other Directorships Held, Previous Position(s) and Qualifications |
| John T. Collins Birth Date: January 24, 1947 Trustee Indefinite Term Began serving: October 2013 | Principal Occupations: Director or Trustee of the Federated Fund Family; Retired. Other Directorships Held: Director, Chair of the Compensation Committee, Audit Committee member, KLX Corp. Qualifications: Mr. Collins has served in several business and financial management roles and directorship positions throughout his career. Mr. Collins previously served as Chairman and CEO, The Collins Group, Inc. (a private equity firm). Mr. Collins serves as Chairman Emeriti, Bentley University. Mr. Collins previously served as Director, FleetBoston Financial Corp.; Director and Audit Committee Member, Bank of America Corp. and Director, Beth Israel Deaconess Medical Center (Harvard University Affiliate Hospital). |
| G. Thomas Hough Birth Date: February 28, 1955 Trustee Indefinite Term Began serving: August 2015 | Principal Occupations: Director or Trustee of the Federated Fund Family; Retired. Other Directorships Held: Director, Chair of the Audit Committee, Governance Committee, Publix Super Markets, Inc. Qualifications: Mr. Hough has served in accounting, business management and directorship positions throughout his career. Mr. Hough most recently held the position of Americas Vice Chair of Assurance with Ernst & Young LLP. Mr. Hough is an Executive Committee member of the United States Golf Association, he serves on the President's Cabinet and Business School Board of Visitors for the University of Alabama and is on the Business School Board of Visitors for Wake Forest University. |
| Name Birth Date Positions Held with Trust Date Service Began | Principal Occupation(s) for Past Five Years, Other Directorships Held, Previous Position(s) and Qualifications |
| Maureen Lally-Green Birth Date: July 5, 1949 Trustee Indefinite Term Began serving: August 2009 | Principal Occupations: Director or Trustee of the Federated Fund Family; Adjunct Professor of Law, Duquesne University School of Law. Other Directorships Held: Director, CONSOL Energy Inc. Qualifications: Judge Lally-Green has served in various legal and business roles and directorship positions throughout her career. Judge Lally-Green previously served as: Associate General Secretary, Diocese of Pittsburgh; a member of the Superior Court of Pennsylvania; and as a Professor of Law, Duquesne University School of Law. Judge Lally-Green also holds the positions on either a public or not for profit Board of Directors as follows: Member, Pennsylvania State Board of Education (public); Director and Chair, UPMC Mercy Hospital; Regent, St. Vincent Seminary; Director, Epilepsy Foundation of Western and Central Pennsylvania; Director and Vice Chair, Our Campaign for the Church Alive!, Inc.; Director, Saint Vincent College; Director, Pennsylvania Bar Institute; and Director and Chair, Cardinal Wuerl North Catholic High School, Inc. Judge Lally-Green has held the positions of: Director, Auberle; Director, Ireland Institute of Pittsburgh; Director, Saint Thomas More Society; and Director, Catholic High Schools of the Diocese of Pittsburgh, Inc. |
| Peter E. Madden Birth Date: March 16, 1942 Trustee Indefinite Term Began serving: October 1993 | Principal Occupation: Director or Trustee, and Chair of the Board of Directors or Trustees, of the Federated Fund Family; Retired. Other Directorships Held: None. Qualifications: Mr. Madden has served in several business management, mutual fund services and directorship positions throughout his career. Mr. Madden previously served as President, Chief Operating Officer and Director, State Street Bank and Trust Company (custodian bank) and State Street Corporation (financial services). He was Director, VISA USA and VISA International and Chairman and Director, Massachusetts Bankers Association. Mr. Madden served as Director, Depository Trust Corporation and Director, The Boston Stock Exchange. Mr. Madden also served as a Representative to the Commonwealth of Massachusetts General Court. |
| Charles F. Mansfield, Jr. Birth Date: April 10, 1945 Trustee Indefinite Term Began serving: November 1999 | Principal Occupations: Director or Trustee of the Federated Fund Family; Management Consultant. Other Directorships Held: None. Qualifications: Mr. Mansfield has served in several banking, business management and educational roles and directorship positions throughout his career. Mr. Mansfield previously served as Chief Executive Officer, PBTC International Bank; Partner, Arthur Young & Company (now Ernst & Young LLP); Chief Financial Officer of Retail Banking Sector, Chase Manhattan Bank; Senior Vice President, HSBC Bank USA (formerly, Marine Midland Bank); Vice President, Citibank; Assistant Professor of Banking and Finance, Frank G. Zarb School of Business, Hofstra University; Executive Vice President DVC Group, Inc. (marketing, communications and technology). |
| Thomas M. O'Neill Birth Date: June 14, 1951 Trustee Indefinite Term Began serving: October 2006 | Principal Occupations: Director or Trustee, Chair of the Audit Committee of the Federated Fund Family; Sole Proprietor, Navigator Management Company (investment and strategic consulting). Other Directorships Held: None. Qualifications: Mr. O'Neill has served in several business, mutual fund and financial management roles and directorship positions throughout his career. Mr. O'Neill serves as Director, Medicines for Humanity and Director, The Golisano Children's Museum of Naples, Florida. Mr. O'Neill previously served as Chief Executive Officer and President, Managing Director and Chief Investment Officer, Fleet Investment Advisors; President and Chief Executive Officer, Aeltus Investment Management, Inc.; General Partner, Hellman, Jordan Management Co., Boston, MA; Chief Investment Officer, The Putnam Companies, Boston, MA; Credit Analyst and Lending Officer, Fleet Bank; Director and Consultant, EZE Castle Software (investment order management software); and Director, Midway Pacific (lumber). |
| P. Jerome Richey Birth Date: February 23, 1949 Trustee Indefinite Term Began serving: October 2013 | Principal Occupations: Director or Trustee of the Federated Fund Family; Management Consultant. Other Directorships Held: None. Qualifications: Mr. Richey has served in several business and legal management roles and directorship positions throughout his career. Mr. Richey most recently held the positions of Senior Vice Chancellor and Chief Legal Officer, University of Pittsburgh. Mr. Richey serves as Board Member, Epilepsy Foundation of Western Pennsylvania and Board member, World Affairs Council of Pittsburgh. Mr. Richey previously served as Chief Legal Officer and Executive Vice President, CONSOL Energy Inc. and Shareholder, Buchanan Ingersoll & Rooney PC (a law firm). |
| John S. Walsh Birth Date: November 28, 1957 Trustee Indefinite Term Began serving: January 1999 | Principal Occupations: Director or Trustee of the Federated Fund Family; President and Director, Heat Wagon, Inc. (manufacturer of construction temporary heaters); President and Director, Manufacturers Products, Inc. (distributor of portable construction heaters); President, Portable Heater Parts, a division of Manufacturers Products, Inc. Other Directorships Held: None. Qualifications: Mr. Walsh has served in several business management roles and directorship positions throughout his career. Mr. Walsh previously served as Vice President, Walsh & Kelly, Inc. (paving contractors). |
| Name Birth Date Address Positions Held with Trust Date Service Began | Principal Occupation(s) for Past Five Years and Previous Position(s) |
| John W. McGonigle Birth Date: October 26, 1938 EXECUTIVE VICE PRESIDENT AND SECRETARY Officer since: September 1993 | Principal Occupations: Executive Vice President and Secretary of the Federated Fund Family; Vice Chairman, Executive Vice President, Secretary and Director, Federated Investors, Inc. Previous Positions: Trustee, Federated Investment Management Company and Federated Investment Counseling; Director, Federated Global Investment Management Corp., Federated Services Company and Federated Securities Corp. |
| Lori A. Hensler Birth Date: January 6, 1967 TREASURER Officer since: April 2013 | Principal Occupations: Principal Financial Officer and Treasurer of the Federated Fund Family; Senior Vice President, Federated Administrative Services; Financial and Operations Principal for Federated Securities Corp. and Edgewood Services, Inc.; and Assistant Treasurer, Federated Investors Trust Company. Ms. Hensler has received the Certified Public Accountant designation. Previous Positions: Controller of Federated Investors, Inc.; Senior Vice President and Assistant Treasurer, Federated Investors Management Company; Treasurer, Federated Investors Trust Company; Assistant Treasurer, Federated Administrative Services, Federated Administrative Services, Inc., Federated Securities Corp., Edgewood Services, Inc., Federated Advisory Services Company, Federated Equity Management Company of Pennsylvania, Federated Global Investment Management Corp., Federated Investment Counseling, Federated Investment Management Company, Passport Research, Ltd., and Federated MDTA, LLC; Financial and Operations Principal for Federated Securities Corp., Edgewood Services, Inc. and Southpointe Distribution Services, Inc. |
| Peter J. Germain Birth Date: September 3, 1959 CHIEF LEGAL OFFICER Officer since: January 2005 | Principal Occupations: Mr. Germain is Chief Legal Officer of the Federated Fund Family. He is General Counsel and Vice President, Federated Investors, Inc.; President, Federated Administrative Services and Federated Administrative Services, Inc.; Vice President, Federated Securities Corp.; Secretary, Federated Private Asset Management, Inc.; and Secretary, Retirement Plan Service Company of America. Mr. Germain joined Federated in 1984 and is a member of the Pennsylvania Bar Association. Previous Positions: Deputy General Counsel, Special Counsel, Managing Director of Mutual Fund Services, Federated Investors, Inc.; Senior Vice President, Federated Services Company; and Senior Corporate Counsel, Federated Investors, Inc. |
| Richard B. Fisher Birth Date: May 17, 1923 VICE PRESIDENT Officer since: September 1993 | Principal Occupations: Vice Chairman or Vice President of some of the Funds in the Federated Fund Family; Vice Chairman, Federated Investors, Inc.; Chairman, Federated Securities Corp. Previous Positions: President and Director or Trustee of some of the Funds in the Federated Fund Family; Executive Vice President, Federated Investors, Inc.; Director and Chief Executive Officer, Federated Securities Corp. |
| John B. Fisher Birth Date: May 16, 1956 PRESIDENT Officer since: November 2004 | Principal Occupations: President, Director/Trustee and CEO, Federated Advisory Services Company, Federated Equity Management Company of Pennsylvania, Federated Global Investment Management Corp., Federated Investment Counseling, Federated Investment Management Company; President and CEO of Passport Research, Ltd.; President of some of the Funds in the Federated Fund Family; Director, Federated Investors Trust Company. Previous Positions: President and Director of the Institutional Sales Division of Federated Securities Corp.; President and Director of Federated Investment Counseling; Director, Edgewood Securities Corp.; Director, Federated Services Company; Director, Federated Investors, Inc.; Chairman and Director, Southpointe Distribution Services, Inc.; President, Technology, Federated Services Company. |
| Stephen Van Meter Birth Date: June 5, 1975 CHIEF COMPLIANCE OFFICER AND SENIOR VICE PRESIDENT Officer since: July 2015 | Principal Occupations: Senior Vice President and Chief Compliance Officer of the Federated Fund Family; Vice President and Chief Compliance Officer of Federated Investors, Inc. and Chief Compliance Officer of certain of its subsidiaries. Mr. Van Meter joined Federated in October 2011. He holds FINRA licenses under Series 3, 7, 24 and 66. Previous Positions: Mr. Van Meter previously held the position of Compliance Operating Officer, Federated Investors, Inc. Prior to joining Federated, Mr. Van Meter served at the United States Securities and Exchange Commission in the positions of Senior Counsel, Office of Chief Counsel, Division of Investment Management and Senior Counsel, Division of Enforcement. |
| Stephen F. Auth Birth Date: September 3, 1956 101 Park Avenue 41st Floor New York, NY 10178 CHIEF INVESTMENT OFFICER Officer since: November 2002 | Principal Occupations: Stephen F. Auth is Chief Investment Officer of various Funds in the Federated Fund Family; Executive Vice President, Federated Investment Counseling, Federated Global Investment Management Corp. and Federated Equity Management Company of Pennsylvania. Previous Positions: Executive Vice President, Federated Investment Management Company and Passport Research, Ltd. (investment advisory subsidiary of Federated); Senior Vice President, Global Portfolio Management Services Division; Senior Vice President, Federated Investment Management Company and Passport Research, Ltd.; Senior Managing Director and Portfolio Manager, Prudential Investments. |
| Robert J. Ostrowski Birth Date: April 26, 1963 Chief Investment Officer Officer since: May 2004 | Principal Occupations: Robert J. Ostrowski joined Federated in 1987 as an Investment Analyst and became a Portfolio Manager in 1990. He was named Chief Investment Officer of Federated's taxable fixed-income products in 2004 and also serves as a Senior Portfolio Manager. Mr. Ostrowski became an Executive Vice President of the Fund's Adviser in 2009 and served as a Senior Vice President of the Fund's Adviser from 1997 to 2009. Mr. Ostrowski has received the Chartered Financial Analyst designation. He received his M.S. in Industrial Administration from Carnegie Mellon University. |
| Deborah A. Cunningham Birth Date: September 15, 1959 Chief Investment Officer Officer since: June 2012 | Principal Occupations: Deborah A. Cunningham was named Chief Investment Officer of Federated's money market products in 2004. She joined Federated in 1981 and has been a Senior Portfolio Manager since 1997 and an Executive Vice President of the Fund's Adviser since 2009. Ms. Cunningham has received the Chartered Financial Analyst designation and holds an M.S.B.A. in Finance from Robert Morris College. |
Federated Investors Funds
4000 Ericsson Drive
Warrendale, PA 15086-7561
or call 1-800-341-7400.
CUSIP 313916843
2016 ©Federated Investors, Inc.
| Share Class |
| Primary |
| Service |
| 1 | Please see the footnotes to the line graphs below for definitions of, and further information about, the RMCGI. |
| 2 | Please see the footnotes to the line graphs below for definitions of, and further information about, the MVMCGFA. |
| 3 | The S&P 500 Index is an unmanaged, capitalization-weighted index of 500 stocks designed to measure performance of the broad domestic economy through changes in the aggregate market value of 500 stocks representing all major industries. The index is unmanaged, and it is not possible to invest directly in an index. |
| 4 | The Russell 2000® Index measures the performance of the small-cap segment of the U.S. equity universe. The Russell 2000® Index is a subset of the Russell 3000® Index representing approximately 10% of the total market capitalization of that index. It includes approximately 2000 of the smallest securities based on a combination of their market cap and current index membership. The Russell 2000® Index is constructed to provide a comprehensive and unbiased small-cap barometer and is completely reconstituted annually to ensure larger stocks do not distort the performance and characteristics of the true small-cap opportunity set. The index is unmanaged, and it is not possible to invest directly in an index. |
| 5 | International investing involves special risks including currency risk, increased volatility, political risks and differences in auditing and other financial standards. |

| Federated Kaufmann Fund II - | Primary Shares | Service Shares | NA | RMCGI | MVMCGFA |
| F | F | NA | I | I | |
| 12/31/2005 | 10,000 | 10,000 | 10,000 | 10,000 | |
| 12/31/2006 | 11,488 | 11,460 | 11,066 | 10,900 | |
| 12/31/2007 | 13,904 | 13,824 | 12,330 | 12,589 | |
| 12/31/2008 | 8,094 | 8,031 | 6,865 | 6,940 | |
| 12/31/2009 | 10,480 | 10,368 | 10,043 | 9,845 | |
| 12/31/2010 | 12,366 | 12,208 | 12,692 | 12,444 | |
| 12/31/2011 | 10,724 | 10,561 | 12,483 | 11,839 | |
| 12/31/2012 | 12,578 | 12,358 | 14,456 | 13,488 | |
| 12/31/2013 | 17,624 | 17,260 | 19,622 | 18,300 | |
| 12/31/2014 | 19,336 | 18,889 | 21,958 | 19,659 | |
| 12/31/2015 | 20,569 | 20,051 | 21,914 | 19,608 |
| 1 Year | 5 Years | 10 Years | |
| Primary Shares | 6.37% | 10.71% | 7.48% |
| Service Shares | 6.15% | 10.43% | 7.20% |
| RMCGI | -0.20% | 11.54% | 8.16% |
| MVMCGFA | -0.26% | 9.52% | 6.97% |
| 1 | The Fund's performance assumes the reinvestment of all dividends and distributions. The RMCGI and MVMCGFA have been adjusted to reflect reinvestment of dividends on securities in the index and average. |
| 2 | The RMCGI measures the performance of the mid-cap growth segment of the U.S. equity universe. It includes those Russell Midcap® Index companies with higher price-to-book ratios and higher forecasted growth values. The RMCGI is constructed to provide a comprehensive and unbiased barometer of the mid-cap growth market. The RMCGI is completely reconstituted annually to ensure larger stocks do not distort the performance and characteristics of the true mid-cap growth market. The RMCGI is not adjusted to reflect sales charges, expenses or other fees that the Securities and Exchange Commission requires to be reflected in the Fund's performance. The index is unmanaged and unlike the Fund, is not affected by cash flows. It is not possible to invest directly in an index. |
| 3 | Morningstar figures represent the average of the total returns reported by all the mutual funds designated by Morningstar as falling into the respective category indicated. They do not reflect sales charges. |
| Sector Composition | Percentage of Total Net Assets |
| Health Care | 36.6% |
| Information Technology | 20.4% |
| Consumer Discretionary | 10.2% |
| Financials | 10.2% |
| Industrials | 5.4% |
| Materials | 3.9% |
| Consumer Staples | 2.4% |
| Telecommunication Services | 0.4% |
| Derivative Contracts2,3 | (0.0)% |
| Securities Lending Collateral4 | 3.6% |
| Cash Equivalents5 | 11.7% |
| Other Assets and Liabilities—Net6 | (4.8)% |
| TOTAL | 100.0% |
| 1 | Except for Securities Lending Collateral, Cash Equivalents and Other Assets and Liabilities, sector classifications are based upon, and individual portfolio securities are assigned to, the classifications of the Global Industry Classification Standard (GICS), except that the Adviser assigns a classification to securities not classified by the GICS and to securities for which the Adviser does not have access to the classification made by the GICS. |
| 2 | Represents less than 0.1%. |
| 3 | Based upon net unrealized appreciation (depreciation) or value of the derivative contracts as applicable. Derivative contracts may consist of futures, forwards, options and swaps. The impact of a derivative contract on the Fund's performance may be larger than its unrealized appreciation (depreciation) or value may indicate. In many cases, the notional value or amount of a derivative contract may provide a better indication of the contract's significance to the portfolio. More complete information regarding the Fund's direct investments in derivative contracts, including unrealized appreciation (depreciation), value and notional values or amounts of such contracts, can be found in the table at the end of the Portfolio of Investments included in this Report. |
| 4 | Cash collateral received from lending portfolio securities which is invested in short-term investments such as repurchase agreements or money market mutual funds. |
| 5 | Cash Equivalents include any investments in money market mutual funds and/or overnight repurchase agreements other than those representing securities lending collateral. |
| 6 | Assets, other than investments in securities and derivative contracts, less liabilities. See Statement of Assets and Liabilities. |
| Shares or Principal Amount | Value | ||
| COMMON STOCKS—89.2% | |||
| Consumer Discretionary—10.2% | |||
| 2,238 | 1 | Amazon.com, Inc. | $1,512,642 |
| 31,300 | Clubcorp Holdings, Inc. | 571,851 | |
| 4,995 | 2 | Cracker Barrel Old Country Store, Inc. | 633,516 |
| 26,800 | 1 | Dave & Buster's Entertainment, Inc. | 1,118,632 |
| 24,700 | Hanesbrands, Inc. | 726,921 | |
| 54,930 | Hilton Worldwide Holdings, Inc. | 1,175,502 | |
| 23,800 | 1 | La Quinta Holdings, Inc. | 323,918 |
| 13,700 | Las Vegas Sands Corp. | 600,608 | |
| 7,867 | Metaldyne Performance Group, Inc. | 144,281 | |
| 6,130 | 1 | Mohawk Industries, Inc. | 1,160,961 |
| 11,000 | Moncler SpA | 152,334 | |
| 708,680 | NagaCorp Limited | 446,648 | |
| 20,000 | 1 | One Group Hospitality, Inc./The | 59,800 |
| 110 | 1 | Priceline.com, Inc. | 140,244 |
| 447,207 | Samsonite International SA | 1,344,542 | |
| 35,000 | Starbucks Corp. | 2,101,050 | |
| 3,500 | Tractor Supply Co. | 299,250 | |
| 4,375 | Whirlpool Corp. | 642,556 | |
| 24,114 | 1 | Yoox Net-A-Porter Group | 899,548 |
| TOTAL | 14,054,804 | ||
| Consumer Staples—2.4% | |||
| 16,000 | 1,2 | Blue Buffalo Pet Products, Inc. | 299,360 |
| 4,900 | CVS Health Corp. | 479,073 | |
| 14,980 | 1 | Hain Celestial Group, Inc. | 605,042 |
| 10,181 | Smucker (J.M.) Co. | 1,255,725 | |
| 23,600 | 1 | Sprouts Farmers Market, Inc. | 627,524 |
| TOTAL | 3,266,724 | ||
| Financials—10.2% | |||
| 73,040 | American International Group, Inc. | 4,526,289 | |
| 6,350 | BlackRock, Inc. | 2,162,302 | |
| 36,200 | 1 | CBRE Group, Inc. | 1,251,796 |
| 68,670 | Chimera Investment Corp. | 936,659 | |
| 13,730 | Crown Castle International Corp. | 1,186,958 | |
| 77,300 | EverBank Financial Corp. | 1,235,254 | |
| 8,240 | Housing Development Finance Corp. Ltd. | 156,517 | |
| 8,125 | JPMorgan Chase & Co. | 536,494 | |
| 14,980 | Ryman Hospitality Properties | 773,567 | |
| 24,100 | Wells Fargo & Co. | 1,310,076 | |
| TOTAL | 14,075,912 | ||
| Health Care—36.3% | |||
| 10,360 | 1 | Acadia Pharmaceuticals, Inc. | 369,334 |
| 5,100 | 1 | Adeptus Health, Inc. | 278,052 |
| 5,281 | 1 | Advanced Accelerator Applications SA, ADR | 165,137 |
| 53,806 | 1 | Alkermes, Inc. | 4,271,120 |
| 6,200 | 1 | Allergan PLC | 1,937,500 |
| 27,473 | 1 | Amphastar Pharmaceuticals, Inc. | 390,941 |
| Shares or Principal Amount | Value | ||
| COMMON STOCKS—continued | |||
| Health Care—continued | |||
| 5,870 | 1 | Amsurg Corp. | $446,120 |
| 23,700 | 1 | Arena Pharmaceuticals, Inc. | 45,030 |
| 3,100 | 1 | aTyr Pharma, Inc. | 30,473 |
| 60,554 | 1,2,3 | BioDelivery Sciences International, Inc. | 290,054 |
| 82,320 | 1,3 | Catalyst Pharmaceutical Partners, Inc. | 201,684 |
| 4,240 | 1 | Cerner Corp. | 255,121 |
| 4,700 | 1 | Coherus Biosciences, Inc. | 107,912 |
| 310,000 | 1,3 | Corcept Therapeutics, Inc. | 1,543,800 |
| 48,200 | 1 | Dexcom, Inc. | 3,947,580 |
| 16,480 | 1 | Diplomat Pharmacy, Inc. | 563,945 |
| 220,470 | 1,3 | Dyax Corp. | 8,294,081 |
| 45,370 | 1,3 | Dynavax Technologies Corp. | 1,096,139 |
| 38,453 | 1,2,3 | Egalet Corp. | 423,752 |
| 44,700 | 1 | ExamWorks Group, Inc. | 1,189,020 |
| 7,500 | 1,2 | GW Pharmaceuticals PLC, ADR | 520,800 |
| 31,000 | 1,3 | Galapagos NV | 1,887,964 |
| 23,900 | 1,2,3 | Galapagos NV, ADR | 1,502,832 |
| 9,465 | 1 | Genmab A/S | 1,241,110 |
| 12,400 | Gilead Sciences, Inc. | 1,254,756 | |
| 16,426 | 1 | HealthEquity, Inc. | 411,800 |
| 12,490 | 1 | IDEXX Laboratories, Inc. | 910,771 |
| 1,870 | 1 | Illumina, Inc. | 358,937 |
| 2,126 | 1 | Insulet Corp. | 80,384 |
| 27,200 | 1,3 | Intersect ENT, Inc. | 612,000 |
| 12,300 | 1 | MacroGenics, Inc. | 380,931 |
| 10,890 | Medtronic PLC | 837,659 | |
| 44,611 | 1,3,4 | Minerva Neurosciences, Inc. | 270,789 |
| 86,900 | 1 | Nektar Therapeutics | 1,464,265 |
| 16,700 | 1 | Neovasc, Inc. | 75,150 |
| 30,976 | 1,2,3 | Ocular Therapeutix, Inc. | 290,245 |
| 41,900 | 1,3 | Otonomy, Inc. | 1,162,725 |
| 8,365 | 1,3 | Otonomy, Inc. | 232,129 |
| 10,220 | 1 | Poxel SA | 146,787 |
| 25,699 | 1,3 | Premier, Inc. | 906,404 |
| 248,090 | 1,3 | Progenics Pharmaceuticals, Inc. | 1,520,792 |
| 11,240 | 1 | Repligen Corp. | 317,979 |
| 5,000 | 1 | SAGE Therapeutics, Inc. | 291,500 |
| 19,560 | 1,3 | SCYNEXIS, Inc. | 121,468 |
| 14,980 | 1,2 | Seres Therapeutics, Inc. | 525,648 |
| 20,030 | Shire Ltd. | 1,372,732 | |
| 3,110 | Shire Ltd., ADR | 637,550 | |
| 19,710 | 1 | Spark Therapeutics, Inc. | 893,060 |
| 27,200 | 1,3 | SteadyMed Ltd. | 88,672 |
| 2,945 | 1,3,4 | SteadyMed Ltd. | 9,601 |
| 8,300 | 1 | Ultragenyx Pharmaceutical, Inc. | 931,094 |
| 71,100 | 1 | Veeva Systems, Inc. | 2,051,235 |
| 17,150 | 1,2 | Versartis, Inc. | 212,488 |
| 43,936 | 1,3 | Zogenix, Inc. | 647,617 |
| Shares or Principal Amount | Value | ||
| COMMON STOCKS—continued | |||
| Health Care—continued | |||
| 6,300 | 1 | Zynerba Pharmaceuticals, Inc. | $63,441 |
| TOTAL | 50,080,110 | ||
| Industrials—5.4% | |||
| 37,450 | Air Lease Corp. | 1,253,826 | |
| 10,601 | 1 | Caesar Stone SDOT Yam Ltd. | 459,447 |
| 7,600 | Danaher Corp. | 705,888 | |
| 16,100 | Hexcel Corp. | 747,845 | |
| 19,320 | KAR Auction Services, Inc. | 715,420 | |
| 9,400 | 1 | Middleby Corp. | 1,013,978 |
| 8,051 | 1 | Milacron Holdings Corp. | 100,718 |
| 31,750 | 1 | RPX Corp. | 349,250 |
| 9,400 | Safran SA | 643,773 | |
| 12,600 | 1 | Spirit Airlines, Inc. | 502,110 |
| 1,700 | Stanley Black & Decker, Inc. | 181,441 | |
| 9,990 | 1 | Verisk Analytics, Inc. | 768,031 |
| TOTAL | 7,441,727 | ||
| Information Technology—20.4% | |||
| 3,660 | 1 | Adobe Systems, Inc. | 343,820 |
| 14,980 | 1 | Alibaba Group Holding Ltd., ADR | 1,217,425 |
| 30,900 | Amadeus IT Holding SA | 1,360,628 | |
| 12,400 | Avago Technologies Ltd. | 1,799,860 | |
| 18,105 | 1 | BroadSoft, Inc. | 640,193 |
| 24,300 | 1,3 | ChannelAdvisor Corp. | 336,555 |
| 8,700 | 1 | Check Point Software Technologies Ltd. | 708,006 |
| 8,300 | 1 | CoStar Group, Inc. | 1,715,527 |
| 15,600 | 1 | Cvent, Inc. | 544,596 |
| 12,735 | 1 | Demandware, Inc. | 687,308 |
| 27,470 | 1 | Fitbit, Inc. | 812,837 |
| 23,900 | 1 | Fleetmatics Group PLC | 1,213,881 |
| 10,738 | 1,2 | GoDaddy, Inc. | 344,260 |
| 38,600 | 1 | Microsemi Corp. | 1,257,974 |
| 14,230 | 1,2 | Mobileye NV | 601,645 |
| 29,340 | 1 | NIC, Inc. | 577,411 |
| 23,600 | 1 | NXP Semiconductors NV | 1,988,300 |
| 8,000 | 1 | NetSuite, Inc. | 676,960 |
| 3,115 | 1 | Q2 Holdings, Inc. | 82,143 |
| 10,566 | 1 | Qorvo, Inc. | 537,809 |
| 35,550 | 1 | RADWARE Ltd. | 545,337 |
| 12,490 | 1 | Salesforce.com, Inc. | 979,216 |
| 20,600 | 1 | ServiceNow, Inc. | 1,783,136 |
| 71,400 | 1,3 | Textura Corp. | 1,540,812 |
| 15,600 | 1 | Tyler Technologies, Inc. | 2,719,392 |
| 27,470 | 1 | Vantiv, Inc. | 1,302,628 |
| 19,100 | 1 | Workday, Inc. | 1,521,888 |
| 14,455 | 1,2 | Zillow Group, Inc. | 339,403 |
| TOTAL | 28,178,950 | ||
| Materials—3.9% | |||
| 12,378 | Eagle Materials, Inc. | 748,002 | |
| 18,000 | Martin Marietta Materials | 2,458,440 |
| Shares or Principal Amount | Value | ||
| COMMON STOCKS—continued | |||
| Materials—continued | |||
| 8,500 | Sherwin-Williams Co. | $2,206,600 | |
| TOTAL | 5,413,042 | ||
| Telecommunication Services—0.4% | |||
| 20,940 | 1 | Zayo Group Holdings, Inc. | 556,795 |
| TOTAL COMMON STOCKS (IDENTIFIED COST $83,566,295) | 123,068,064 | ||
| WARRANTS—0.2% | |||
| Health Care—0.2% | |||
| 5,034 | 1 | Alexza Pharmaceuticals, Inc., Warrants | 4 |
| 59,342 | 1,6 | BioNano Genomics, Inc., Warrants | 0 |
| 44,611 | 1,3 | Minerva Neurosciences, Inc., Warrants | 82,174 |
| 128,250 | 1,3 | Zogenix, Inc., Warrants | 130,289 |
| TOTAL WARRANTS (IDENTIFIED COST $6,265) | 212,467 | ||
| CORPORATE BOND—0.1% | |||
| Health Care—0.1% | |||
| $95,000 | 4,5 | Protalix Biotherapeutics, Inc., Conv. Bond, 4.50%, 9/15/2018 (IDENTIFIED COST $95,000) | 68,657 |
| PREFERRED STOCKS—0.0% | |||
| Health Care—0.0% | |||
| 4,154 | 1,4 | aTyr Pharma, Inc., Pfd., Series E | 40,834 |
| 142,420 | 1,4,6 | BioNano Genomics, Inc., Pfd., Series C | 0 |
| TOTAL PREFERRED STOCKS (IDENTIFIED COST $245,000) | 40,834 | ||
| REPURCHASE AGREEMENTS—15.3% | |||
| $16,189,000 | Interest in $600,000,000 joint repurchase agreement 0.32%, dated 12/31/2015 under which Bank of America, N.A. will repurchase securities provided as collateral for $600,021,333 on 1/4/2016. The securities provided as collateral at the end of the period held with BNY Mellon as tri-party agent, were U.S. Government Agency securities maturing on 2/25/2044 and the market value of those underlying securities was $618,021,974. | 16,189,000 | |
| 4,965,316 | Interest in $600,000,000 joint repurchase agreement 0.32%, dated 12/31/2015 under which Bank of America, N.A. will repurchase securities provided as collateral for $600,021,333 on 1/4/2016. The securities provided as collateral at the end of the period held with BNY Mellon as tri-party agent, were U.S. Government Agency securities maturing on 2/25/2044 and the market value of those underlying securities was $618,021,974 (purchased with proceeds from securities lending collateral). | 4,965,316 | |
| TOTAL REPURCHASE AGREEMENTS (AT COST) | 21,154,316 | ||
| TOTAL INVESTMENTS—104.8% (IDENTIFIED COST $105,066,876)7 | 144,544,338 | ||
| OTHER ASSETS AND LIABILITIES - NET—(4.8)%8 | (6,636,641) | ||
| TOTAL NET ASSETS—100% | $137,907,697 |
| Settlement Date | Counterparty | Currency Units to Deliver/Receive | In Exchange For | Unrealized Depreciation |
| Contracts Purchased: | ||||
| 1/5/2016 | JPMorgan Chase | 559,747 DKK | $81,727 | $(217) |
| UNREALIZED DEPRECIATION ON FOREIGN EXCHANGE CONTRACTS | $(217) | |||
| 1 | Non-income-producing security. |
| 2 | All or a portion of these securities are temporarily on loan to unaffiliated broker/dealers. |
| 3 | Affiliated companies. |
| 4 | Denotes a restricted security that either: (a) cannot be offered for public sale without first being registered, or being able to take advantage of an exemption from registration, under the Securities Act of 1933; or (b) is subject to a contractual restriction on public sales. At December 31, 2015, these restricted securities amounted to $389,881, which represented 0.3% of total net assets. |
| 5 | Denotes a restricted security that may be resold without restriction to “qualified institutional buyers” as defined in Rule 144A under the Securities Act of 1933 and that the Fund has determined to be liquid under criteria established by the Fund's Board of Trustees (the “Trustees”). At December 31, 2015, these liquid restricted securities amounted to $68,657, which represented 0.1% of total net assets. |
| 6 | Market quotations and price evaluations are not available. Fair value determined in accordance with procedures established by and under the general supervision of the Trustees. |
| 7 | The cost of investments for federal tax purposes amounts to $105,801,881. |
| 8 | Assets, other than investments in securities, less liabilities. See Statement of Assets and Liabilities. |
| Valuation Inputs | ||||
| Level 1— Quoted Prices | Level 2— Other Significant Observable Inputs | Level 3— Significant Unobservable Inputs | Total | |
| Equity Securities: | ||||
| Common Stocks | ||||
| Domestic | $97,610,7181 | $— | $— | $97,610,718 |
| International | $15,804,763 | $9,652,583 | — | 25,457,346 |
| Warrants | — | 212,467 | 0 | 212,467 |
| Debt Securities: | ||||
| Corporate Bonds | — | 68,657 | — | 68,657 |
| Preferred Stocks | 40,834 | — | 0 | 40,834 |
| Repurchase Agreements | — | 21,154,316 | — | 21,154,316 |
| TOTAL SECURITIES | $113,456,315 | $31,088,023 | $0 | $144,544,338 |
| Other Financial Instruments2 | ||||
| Assets | — | — | — | — |
| Liabilities | (217) | — | — | (217) |
| TOTAL OTHER FINANCIAL INSTRUMENTS | $(217) | $— | $— | $(217) |
| 1 | Includes $250,925 of a security transferred from Level 3 to Level 1 because observable market data was obtained for the security. This transfer represents the value of the security at the beginning of the period. |
| 2 | Other financial instruments include foreign exchange contracts. |
| ADR | —American Depositary Receipt |
| DKK | —Danish Krone |
| SA | —Support Agreement |
| USD | —Unified School District |
| Year Ended December 31 | 2015 | 2014 | 2013 | 2012 | 2011 |
| Net Asset Value, Beginning of Period | $18.92 | $19.22 | $15.06 | $12.84 | $14.96 |
| Income From Investment Operations: | |||||
| Net investment income (loss) | (0.15)1 | (0.15)1 | (0.12)1 | (0.05)1 | (0.09)1 |
| Net realized and unrealized gain (loss) on investments, futures contracts, written options and foreign currency transactions | 1.44 | 1.91 | 5.76 | 2.27 | (1.88) |
| TOTAL FROM INVESTMENT OPERATIONS | 1.29 | 1.76 | 5.64 | 2.22 | (1.97) |
| Less Distributions: | |||||
| Distributions from net investment income | — | — | — | — | (0.15) |
| Distributions from net realized gain on investments, futures contracts, written options and foreign currency transactions | (2.79) | (2.06) | (1.48) | — | — |
| TOTAL DISTRIBUTIONS | (2.79) | (2.06) | (1.48) | — | (0.15) |
| Net Asset Value, End of Period | $17.42 | $18.92 | $19.22 | $15.06 | $12.84 |
| Total Return2 | 6.37% | 9.71% | 40.12% | 17.29% | (13.28)% |
| Ratios to Average Net Assets: | |||||
| Net expenses | 1.53%3 | 1.53%3 | 1.53%3 | 1.53%3 | 1.53%3 |
| Net investment income (loss) | (0.84)% | (0.83)% | (0.75)% | (0.34)% | (0.65)% |
| Expense waiver/reimbursement4 | 0.00%5 | 0.09% | 0.25% | 0.34% | 0.29% |
| Supplemental Data: | |||||
| Net assets, end of period (000 omitted) | $46,450 | $49,425 | $53,392 | $43,192 | $43,025 |
| Portfolio turnover | 60% | 51% | 71% | 65% | 63% |
| 1 | Per share numbers have been calculated using the average shares method. |
| 2 | Based on net asset value. Total returns do not reflect any additional fees or expenses that may be imposed by separate accounts of insurance companies or in connection with any variable annuity or variable life insurance contract. |
| 3 | The net expense ratio is calculated without reduction for expense offset arrangements. The net expense ratios are 1.53%, 1.53%, 1.53%, 1.53% and 1.53% for the years ended December 31, 2015, 2014, 2013, 2012 and 2011, respectively, after taking into account these expense reductions. |
| 4 | This expense decrease is reflected in both the net expense and the net investment income (loss) ratios shown above. |
| 5 | Represents less than 0.01%. |
| Year Ended December 31 | 2015 | 2014 | 2013 | 2012 | 2011 |
| Net Asset Value, Beginning of Period | $18.39 | $18.78 | $14.79 | $12.64 | $14.73 |
| Income From Investment Operations: | |||||
| Net investment income (loss) | (0.19)1 | (0.19)1 | (0.16)1 | (0.09)1 | (0.13)1 |
| Net realized and unrealized gain (loss) on investments, futures contracts, written options and foreign currency transactions | 1.41 | 1.86 | 5.63 | 2.24 | (1.84) |
| TOTAL FROM INVESTMENT OPERATIONS | 1.22 | 1.67 | 5.47 | 2.15 | (1.97) |
| Less Distributions: | |||||
| Distributions from net investment income | — | — | — | — | (0.12) |
| Distributions from net realized gain on investments, futures contracts, written options and foreign currency transactions | (2.79) | (2.06) | (1.48) | — | — |
| TOTAL DISTRIBUTIONS | (2.79) | (2.06) | (1.48) | — | (0.12) |
| Net Asset Value, End of Period | $16.82 | $18.39 | $18.78 | $14.79 | $12.64 |
| Total Return2 | 6.15% | 9.43% | 39.67% | 17.01% | (13.49)% |
| Ratios to Average Net Assets: | |||||
| Net expenses | 1.78%3 | 1.78%3 | 1.78%3 | 1.78%3 | 1.78%3 |
| Net investment income (loss) | (1.07)% | (1.08)% | (1.00)% | (0.65)% | (0.90)% |
| Expense waiver/reimbursement4 | 0.00%5 | 0.09% | 0.25% | 0.34% | 0.29% |
| Supplemental Data: | |||||
| Net assets, end of period (000 omitted) | $91,458 | $69,369 | $70,159 | $51,992 | $97,552 |
| Portfolio turnover | 60% | 51% | 71% | 65% | 63% |
| 1 | Per share numbers have been calculated using the average shares method. |
| 2 | Based on net asset value. Total returns do not reflect any additional fees or expenses that may be imposed by separate accounts of insurance companies or in connection with any variable annuity or variable life insurance contract. |
| 3 | The net expense ratio is calculated without reduction for expense offset arrangements. The net expense ratios are 1.78%, 1.78%, 1.78%, 1.78% and 1.78% for the years ended December 31, 2015, 2014, 2013, 2012 and 2011, respectively, after taking into account these expense reductions. |
| 4 | This expense decrease is reflected in both the net expense and the net investment income (loss) ratios shown above. |
| 5 | Represents less than 0.01%. |
| Assets: | ||
| Investment in repurchase agreements | $21,154,316 | |
| Investment in securities | 123,390,022 | |
| Total investment in securities, at value including $4,825,543 of securities loaned and $23,192,578 of investment in affiliated companies (identified cost $105,066,876) | $144,544,338 | |
| Cash | 585 | |
| Income receivable | 75,570 | |
| Receivable for investments sold | 141,288 | |
| Receivable for shares sold | 32,232 | |
| TOTAL ASSETS | 144,794,013 | |
| Liabilities: | ||
| Payable for investments purchased | 1,664,050 | |
| Payable for shares redeemed | 177,129 | |
| Unrealized depreciation on foreign exchange contracts | 217 | |
| Payable for collateral due to broker for securities lending | 4,965,316 | |
| Payable to adviser (Note 5) | 4,948 | |
| Payable for distribution services fee (Note 5) | 19,058 | |
| Accrued expenses (Note 5) | 55,598 | |
| TOTAL LIABILITIES | 6,886,316 | |
| Net assets for 8,104,816 shares outstanding | $137,907,697 | |
| Net Assets Consist of: | ||
| Paid-in capital | $89,839,139 | |
| Net unrealized appreciation of investments and translation of assets and liabilities in foreign currency | 39,477,736 | |
| Accumulated net realized gain on investments, futures contracts and foreign currency transactions | 8,763,080 | |
| Accumulated net investment income (loss) | (172,258) | |
| TOTAL NET ASSETS | $137,907,697 | |
| Net Asset Value, Offering Price and Redemption Proceeds Per Share | ||
| Primary Shares: | ||
| $46,449,825 ÷ 2,666,707 shares outstanding, no par value, unlimited shares authorized | $17.42 | |
| Service Shares: | ||
| $91,457,872 ÷ 5,438,109 shares outstanding, no par value, unlimited shares authorized | $16.82 |
| Investment Income: | |||
| Dividends (net of foreign taxes withheld of $5,121) | $741,979 | ||
| Interest (including income on securities loaned of $171,596) | 187,380 | ||
| TOTAL INCOME | 929,359 | ||
| Expenses: | |||
| Investment adviser fee (Note 5) | $1,720,853 | ||
| Administrative fee (Note 5) | 103,585 | ||
| Custodian fees | 34,852 | ||
| Transfer agent fee | 15,342 | ||
| Directors'/Trustees' fees (Note 5) | 1,944 | ||
| Auditing fees | 32,480 | ||
| Legal fees | 9,593 | ||
| Portfolio accounting fees | 64,020 | ||
| Distribution services fee (Note 5) | 206,016 | ||
| Printing and postage | 31,185 | ||
| Miscellaneous (Note 5) | 20,305 | ||
| TOTAL EXPENSES | 2,240,175 | ||
| Waivers and Reduction: | |||
| Waiver of investment adviser fee (Note 5) | $(2,445) | ||
| Waiver of other operating expenses (Note 5) | (498) | ||
| Fees paid indirectly from directed brokerage arrangements (Note 6) | (2,171) | ||
| TOTAL WAIVERS AND REDUCTION | (5,114) | ||
| Net expenses | 2,235,061 | ||
| Net investment income (loss) | (1,305,702) | ||
| Realized and Unrealized Gain (Loss) on Investments and Foreign Currency Transactions: | |||
| Net realized gain on investments (including realized gain of $663,377 on sales of investments in affiliated companies (Note 5)) and foreign currency transactions | 9,597,417 | ||
| Net change in unrealized appreciation of investments and translation of assets and liabilities in foreign currency | (1,894,145) | ||
| Net realized and unrealized gain on investments and foreign currency transactions | 7,703,272 | ||
| Change in net assets resulting from operations | $6,397,570 |
| Year Ended December 31 | 2015 | 2014 |
| Increase (Decrease) in Net Assets | ||
| Operations: | ||
| Net investment income (loss) | $(1,305,702) | $(1,166,792) |
| Net realized gain on investments, futures contracts and foreign currency transactions | 9,597,417 | 19,142,831 |
| Net change in unrealized appreciation/depreciation of investments and translation of assets and liabilities in foreign currency | (1,894,145) | (7,237,445) |
| CHANGE IN NET ASSETS RESULTING FROM OPERATIONS | 6,397,570 | 10,738,594 |
| Distributions to Shareholders: | ||
| Distributions from net realized gain on investments, futures contracts and foreign currency transactions | ||
| Primary Shares | (7,009,109) | (5,574,595) |
| Service Shares | (10,256,113) | (7,703,657) |
| CHANGE IN NET ASSETS RESULTING FROM DISTRIBUTIONS TO SHAREHOLDERS | (17,265,222) | (13,278,252) |
| Share Transactions: | ||
| Proceeds from sale of shares | 54,094,180 | 23,466,662 |
| Net asset value of shares issued to shareholders in payment of distributions declared | 17,265,219 | 13,278,250 |
| Cost of shares redeemed | (41,377,510) | (38,962,837) |
| CHANGE IN NET ASSETS RESULTING FROM SHARE TRANSACTIONS | 29,981,889 | (2,217,925) |
| Change in net assets | 19,114,237 | (4,757,583) |
| Net Assets: | ||
| Beginning of period | 118,793,460 | 123,551,043 |
| End of period (including accumulated net investment income (loss) of $(172,258) and $0, respectively) | $137,907,697 | $118,793,460 |
| ■ | Equity securities listed on an exchange or traded through a regulated market system are valued at their last reported sale price or official closing price in their principal exchange or market. |
| ■ | Fixed-income securities acquired with remaining maturities greater than 60 days are fair valued using price evaluations provided by a pricing service approved by the Trustees. |
| ■ | Fixed-income securities and repurchase agreements acquired with remaining maturities of 60 days or less are valued at their cost (adjusted for the accretion of any discount or amortization of any premium), unless the issuer's creditworthiness is impaired or other factors indicate that amortized cost is not an accurate estimate of the investment's fair value, in which case it would be valued in the same manner as a longer-term security. |
| ■ | Shares of other mutual funds or non-exchange-traded investment companies are valued based upon their reported NAVs. |
| ■ | Derivative contracts listed on exchanges are valued at their reported settlement or closing price, except that options are valued at the mean of closing bid and asked quotations. |
| ■ | Over-the-counter (OTC) derivative contracts are fair valued using price evaluations provided by a pricing service approved by the Trustees. |
| ■ | For securities that are fair valued in accordance with procedures established by and under the general supervision of the Trustees, certain factors may be considered such as: the last traded or purchase price of the security, information obtained by contacting the issuer or dealers, analysis of the issuer's financial statements or other available documents, fundamental analytical data, the nature and duration of restrictions on disposition, the movement of the market in which the security is normally traded, public trading in similar securities or derivative contracts of the issuer or comparable issuers, movement of a relevant index, or other factors including but not limited to industry changes and relevant government actions. |
| ■ | With respect to securities traded principally in foreign markets, significant trends in U.S. equity markets or in the trading of foreign securities index futures contracts; |
| ■ | Political or other developments affecting the economy or markets in which an issuer conducts its operations or its securities are traded; |
| ■ | Announcements concerning matters such as acquisitions, recapitalizations, litigation developments, or a natural disaster affecting the issuer's operations or regulatory changes or market developments affecting the issuer's industry. |
| Market Value of Securities Loaned | Market Value of Collateral |
| $4,825,543 | $4,965,316 |
| Security | Acquisition Date | Cost | Market Value |
| aTyr Pharma, Inc., Pfd., Series E | 3/31/2015 | $44,999 | $40,834 |
| BioNano Genomics, Inc., Pfd., Series C | 11/12/2014 | $200,000 | $0 |
| Minerva Neurosciences, Inc. | 3/31/2015 | $214,579 | $270,789 |
| SteadyMed Ltd. | 1/26/2015 | $25,000 | $9,601 |
| Fair Value of Derivative Instruments | ||
| Liability | ||
| Statement of Assets and Liabilities Location | Fair Value | |
| Derivatives not accounted for as hedging instruments under ASC Topic 815 | ||
| Foreign exchange contracts | Unrealized depreciation on foreign exchange contracts | $217 |
| Amount of Realized Gain or (Loss) on Derivatives Recognized in Income | |
| Forward Currency Contracts | |
| Foreign exchange contracts | $106 |
| Change in Unrealized Appreciation or (Depreciation) on Derivatives Recognized in Income | |
| Forward Currency Contracts | |
| Foreign exchange contracts | $(240) |
| Year Ended December 31 | 2015 | 2014 | ||
| Primary Shares: | Shares | Amount | Shares | Amount |
| Shares sold | 301,574 | $5,434,626 | 160,666 | $2,966,100 |
| Shares issued to shareholders in payment of distributions declared | 390,262 | 7,009,107 | 309,356 | 5,574,593 |
| Shares redeemed | (638,016) | (11,621,596) | (635,426) | (11,557,224) |
| NET CHANGE RESULTING FROM PRIMARY SHARE TRANSACTIONS | 53,820 | $822,137 | (165,404) | $(3,016,531) |
| Year Ended December 31 | 2015 | 2014 | ||
| Service Shares: | Shares | Amount | Shares | Amount |
| Shares sold | 2,786,564 | $48,659,554 | 1,128,203 | $20,500,562 |
| Shares issued to shareholders in payment of distributions declared | 590,450 | 10,256,112 | 438,705 | 7,703,657 |
| Shares redeemed | (1,710,426) | (29,755,914) | (1,530,492) | (27,405,613) |
| NET CHANGE RESULTING FROM SERVICE SHARE TRANSACTIONS | 1,666,588 | $29,159,752 | 36,416 | $798,606 |
| NET CHANGE RESULTING FROM TOTAL FUND SHARE TRANSACTIONS | 1,720,408 | $29,981,889 | (128,988) | $(2,217,925) |
| Increase (Decrease) | ||
| Paid-In Capital | Undistributed Net Investment Income (Loss) | Accumulated Net Realized Gain (Loss) |
| $(1,123,759) | $1,133,444 | $(9,685) |
| 2015 | 2014 | |
| Ordinary income1 | $169,238 | $— |
| Long-term capital gains | $17,095,984 | $13,278,252 |
| 1 | For tax purposes, short-term capital gain distributions are considered as ordinary income distributions. |
| Undistributed long-term capital gains | $9,326,827 |
| Net unrealized appreciation | $38,741,731 |
| Administrative Fee | Average Daily Net Assets of the Investment Complex |
| 0.150% | on the first $5 billion |
| 0.125% | on the next $5 billion |
| 0.100% | on the next $10 billion |
| 0.075% | on assets in excess of $20 billion |
| Share Class Name | Percentage of Average Daily Net Assets of Class |
| Primary Shares | 0.25% |
| Service Shares | 0.25% |
| Distribution Services Fees Incurred | Distribution Services Fees Waived | |
| Service Shares | $206,016 | $(498) |
| Affiliates | Balance of Shares Held or Par Value Held 12/31/2014 | Purchases/ Additions | Sales/ Reductions | Balance of Shares Held or Par Value Held 12/31/2015 | Value | Interest Income |
| BioDelivery Sciences International, Inc. | 75,930 | 18,860 | (34,236) | 60,554 | $290,054 | $— |
| Catalyst Pharmaceutical Partners, Inc. | — | 82,320 | — | 82,320 | 201,684 | — |
| ChannelAdvisor Corp. | 33,687 | 11,100 | (20,487) | 24,300 | 336,555 | — |
| Corcept Therapeutics, Inc. | 244,838 | 65,162 | 310,000 | 1,543,800 | — | |
| **Corcept Therapeutics, Inc., Warrants | 17,387 | — | (17,387) | — | — | — |
| *Dexcom, Inc. | 73,715 | 10,560 | (36,075) | 48,200 | 3,947,580 | — |
| Dyax Corp. | 251,400 | 34,593 | (65,523) | 220,470 | 8,294,081 | — |
| Dynavax Technologies Corp. | 37,200 | 15,747 | (7,577) | 45,370 | 1,096,139 | — |
| **Dynavax Technologies Corp., Warrants | 71,998 | — | (71,998) | — | — | — |
| Egalet Corp. | 23,100 | 15,990 | (637) | 38,453 | 423,752 | — |
| *ExamWorks Group, Inc. | 48,727 | 16,294 | (20,321) | 44,700 | 1,189,020 | — |
| Galapagos NV | 11,568 | 19,432 | — | 31,000 | 1,887,964 | — |
| Galapagos NV, ADR | — | 23,900 | — | 23,900 | 1,502,832 | — |
| Intersect ENT, Inc. | — | 27,200 | — | 27,200 | 612,000 | — |
| Minerva Neurosciences, Inc. | — | 44,611 | — | 44,611 | 270,789 | — |
| Minerva Neurosciences, Inc., Warrants | — | 44,611 | — | 44,611 | 82,174 | — |
| Ocular Therapeutix, Inc. | — | 33,650 | (2,674) | 30,976 | 290,245 | — |
| Otonomy, Inc. | 6,170 | 39,351 | (3,621) | 41,900 | 1,162,725 | — |
| Otonomy, Inc. | 8,365 | — | — | 8,365 | 232,129 | — |
| Premier, Inc. | 41,900 | 5,270 | (21,471) | 25,699 | 906,404 | — |
| Progenics Pharmaceuticals, Inc. | 248,090 | — | — | 248,090 | 1,520,792 | — |
| **Protalix Biotherapeutics, Inc. | 178,172 | 12,480 | (190,652) | — | — | — |
| *Protalix Biotherapeutics, Inc., Conv. Bond, Series 144A 4.50%, 9/15/2018 | 95,000 | — | — | 95,000 | 68,657 | 4,275 |
| SCYNEXIS, Inc. | — | 19,560 | — | 19,560 | 121,468 | — |
| SteadyMed Ltd. | — | 27,200 | — | 27,200 | 88,672 | — |
| SteadyMed Ltd. | — | 2,945 | — | 2,945 | 9,601 | — |
| Textura Corp. | 64,200 | 14,700 | (7,500) | 71,400 | 1,540,812 | — |
| **Threshold Pharmaceuticals, Inc., Class THL | 71,007 | 8,560 | (79,567) | — | — | — |
| **Zogenix, Inc. | 470,424 | — | (470,424) | — | — | — |
| Zogenix, Inc. | — | 43,936 | — | 43,936 | 647,617 | — |
| Zogenix, Inc., Warrants | 128,250 | — | — | 128,250 | 130,289 | — |
| TOTAL AFFILIATED COMPANIES | 2,201,128 | 638,032 | (1,050,150) | 1,789,010 | $28,397,835 | $4,275 |
| * | At December 31, 2015, the Fund no longer has ownership of at least 5% of the voting shares. |
| ** | The security is no longer held on the Fund's portfolio of investments. |
| Purchases | $78,177,260 |
| Sales | $72,523,888 |
| Country | Percentage of Net Assets |
| United States | 71.0% |
| Ireland | 4.0% |
| Belgium | 2.5% |
| Netherlands Antilles | 1.9% |
| United Kingdom | 1.8% |
| Israel | 1.3% |
| Singapore | 1.3% |
| Luxembourg | 1.0% |
| Spain | 1.0% |
| China | 0.9% |
| Denmark | 0.9% |
| Italy | 0.8% |
| France | 0.7% |
| Cayman Islands | 0.3% |
| India | 0.1% |
| Canada | 0.0% |
February 12, 2016
| Beginning Account Value 7/1/2015 | Ending Account Value 12/31/2015 | Expenses Paid During Period1 | |
| Actual: | |||
| Primary Shares | $1,000 | $946.70 | $7.51 |
| Service Shares | $1,000 | $945.50 | $8.73 |
| Hypothetical (assuming a 5% return before expenses): | |||
| Primary Shares | $1,000 | $1,017.49 | $7.78 |
| Service Shares | $1,000 | $1,016.23 | $9.05 |
| 1 | Expenses are equal to the Fund's annualized net expense ratios, multiplied by the average account value over the period, multiplied by 184/365 (to reflect the one-half-year period). The expenses shown in the table do not include the charges and expenses imposed by the insurance company under the variable insurance product contract. Please refer to the variable insurance product prospectus for a complete listing of these expenses. The annualized net expense ratios are as follows: |
| Primary Shares | 1.53% |
| Service Shares | 1.78% |
| Name Birth Date Positions Held with Trust Date Service Began | Principal Occupation(s) for Past Five Years, Other Directorships Held and Previous Position(s) |
| John F. Donahue* Birth Date: July 28, 1924 Trustee Indefinite Term Began serving: October 1993 | Principal Occupations: Director or Trustee of the Federated Fund Family; Chairman and Director, Federated Investors, Inc.; Chairman of the Federated Fund Family's Executive Committee. Previous Positions: Chairman of the Federated Fund Family; Trustee, Federated Investment Management Company; Chairman and Director, Federated Investment Counseling. |
| J. Christopher Donahue* Birth Date: April 11, 1949 Trustee Indefinite Term Began serving: October 1993 | Principal Occupations: Principal Executive Officer and President of certain of the Funds in the Federated Fund Family; Director or Trustee of the Funds in the Federated Fund Family; President, Chief Executive Officer and Director, Federated Investors, Inc.; Chairman and Trustee, Federated Investment Management Company; Trustee, Federated Investment Counseling; Chairman and Director, Federated Global Investment Management Corp.; Chairman, Federated Equity Management Company of Pennsylvania and Passport Research, Ltd. (investment advisory subsidiary of Federated); Trustee, Federated Shareholder Services Company; Director, Federated Services Company. Previous Positions: President, Federated Investment Counseling; President and Chief Executive Officer, Federated Investment Management Company, Federated Global Investment Management Corp. and Passport Research, Ltd. |
| * | Family relationships and reasons for “interested” status: John F. Donahue is the father of J. Christopher Donahue; both are “interested” due to their beneficial ownership of shares of Federated Investors, Inc. and the positions they hold with Federated and its subsidiaries. |
| Name Birth Date Positions Held with Trust Date Service Began | Principal Occupation(s) for Past Five Years, Other Directorships Held, Previous Position(s) and Qualifications |
| John T. Collins Birth Date: January 24, 1947 Trustee Indefinite Term Began serving: October 2013 | Principal Occupations: Director or Trustee of the Federated Fund Family; Retired. Other Directorships Held: Director, Chair of the Compensation Committee, Audit Committee member, KLX Corp. Qualifications: Mr. Collins has served in several business and financial management roles and directorship positions throughout his career. Mr. Collins previously served as Chairman and CEO, The Collins Group, Inc. (a private equity firm). Mr. Collins serves as Chairman Emeriti, Bentley University. Mr. Collins previously served as Director, FleetBoston Financial Corp.; Director and Audit Committee Member, Bank of America Corp. and Director, Beth Israel Deaconess Medical Center (Harvard University Affiliate Hospital). |
| G. Thomas Hough Birth Date: February 28, 1955 Trustee Indefinite Term Began serving: August 2015 | Principal Occupations: Director or Trustee of the Federated Fund Family; Retired. Other Directorships Held: Director, Chair of the Audit Committee, Governance Committee, Publix Super Markets, Inc. Qualifications: Mr. Hough has served in accounting, business management and directorship positions throughout his career. Mr. Hough most recently held the position of Americas Vice Chair of Assurance with Ernst & Young LLP. Mr. Hough is an Executive Committee member of the United States Golf Association, he serves on the President's Cabinet and Business School Board of Visitors for the University of Alabama and is on the Business School Board of Visitors for Wake Forest University. |
| Name Birth Date Positions Held with Trust Date Service Began | Principal Occupation(s) for Past Five Years, Other Directorships Held, Previous Position(s) and Qualifications |
| Maureen Lally-Green Birth Date: July 5, 1949 Trustee Indefinite Term Began serving: August 2009 | Principal Occupations: Director or Trustee of the Federated Fund Family; Adjunct Professor of Law, Duquesne University School of Law. Other Directorships Held: Director, CONSOL Energy Inc. Qualifications: Judge Lally-Green has served in various legal and business roles and directorship positions throughout her career. Judge Lally-Green previously served as: Associate General Secretary, Diocese of Pittsburgh; a member of the Superior Court of Pennsylvania; and as a Professor of Law, Duquesne University School of Law. Judge Lally-Green also holds the positions on either a public or not for profit Board of Directors as follows: Member, Pennsylvania State Board of Education (public); Director and Chair, UPMC Mercy Hospital; Regent, St. Vincent Seminary; Director, Epilepsy Foundation of Western and Central Pennsylvania; Director and Vice Chair, Our Campaign for the Church Alive!, Inc.; Director, Saint Vincent College; Director, Pennsylvania Bar Institute; and Director and Chair, Cardinal Wuerl North Catholic High School, Inc. Judge Lally-Green has held the positions of: Director, Auberle; Director, Ireland Institute of Pittsburgh; Director, Saint Thomas More Society; and Director, Catholic High Schools of the Diocese of Pittsburgh, Inc. |
| Peter E. Madden Birth Date: March 16, 1942 Trustee Indefinite Term Began serving: October 1993 | Principal Occupation: Director or Trustee, and Chair of the Board of Directors or Trustees, of the Federated Fund Family; Retired. Other Directorships Held: None. Qualifications: Mr. Madden has served in several business management, mutual fund services and directorship positions throughout his career. Mr. Madden previously served as President, Chief Operating Officer and Director, State Street Bank and Trust Company (custodian bank) and State Street Corporation (financial services). He was Director, VISA USA and VISA International and Chairman and Director, Massachusetts Bankers Association. Mr. Madden served as Director, Depository Trust Corporation and Director, The Boston Stock Exchange. Mr. Madden also served as a Representative to the Commonwealth of Massachusetts General Court. |
| Charles F. Mansfield, Jr. Birth Date: April 10, 1945 Trustee Indefinite Term Began serving: November 1999 | Principal Occupations: Director or Trustee of the Federated Fund Family; Management Consultant. Other Directorships Held: None. Qualifications: Mr. Mansfield has served in several banking, business management and educational roles and directorship positions throughout his career. Mr. Mansfield previously served as Chief Executive Officer, PBTC International Bank; Partner, Arthur Young & Company (now Ernst & Young LLP); Chief Financial Officer of Retail Banking Sector, Chase Manhattan Bank; Senior Vice President, HSBC Bank USA (formerly, Marine Midland Bank); Vice President, Citibank; Assistant Professor of Banking and Finance, Frank G. Zarb School of Business, Hofstra University; Executive Vice President DVC Group, Inc. (marketing, communications and technology). |
| Thomas M. O'Neill Birth Date: June 14, 1951 Trustee Indefinite Term Began serving: October 2006 | Principal Occupations: Director or Trustee, Chair of the Audit Committee of the Federated Fund Family; Sole Proprietor, Navigator Management Company (investment and strategic consulting). Other Directorships Held: None. Qualifications: Mr. O'Neill has served in several business, mutual fund and financial management roles and directorship positions throughout his career. Mr. O'Neill serves as Director, Medicines for Humanity and Director, The Golisano Children's Museum of Naples, Florida. Mr. O'Neill previously served as Chief Executive Officer and President, Managing Director and Chief Investment Officer, Fleet Investment Advisors; President and Chief Executive Officer, Aeltus Investment Management, Inc.; General Partner, Hellman, Jordan Management Co., Boston, MA; Chief Investment Officer, The Putnam Companies, Boston, MA; Credit Analyst and Lending Officer, Fleet Bank; Director and Consultant, EZE Castle Software (investment order management software); and Director, Midway Pacific (lumber). |
| P. Jerome Richey Birth Date: February 23, 1949 Trustee Indefinite Term Began serving: October 2013 | Principal Occupations: Director or Trustee of the Federated Fund Family; Management Consultant. Other Directorships Held: None. Qualifications: Mr. Richey has served in several business and legal management roles and directorship positions throughout his career. Mr. Richey most recently held the positions of Senior Vice Chancellor and Chief Legal Officer, University of Pittsburgh. Mr. Richey serves as Board Member, Epilepsy Foundation of Western Pennsylvania and Board member, World Affairs Council of Pittsburgh. Mr. Richey previously served as Chief Legal Officer and Executive Vice President, CONSOL Energy Inc. and Shareholder, Buchanan Ingersoll & Rooney PC (a law firm). |
| John S. Walsh Birth Date: November 28, 1957 Trustee Indefinite Term Began serving: January 1999 | Principal Occupations: Director or Trustee of the Federated Fund Family; President and Director, Heat Wagon, Inc. (manufacturer of construction temporary heaters); President and Director, Manufacturers Products, Inc. (distributor of portable construction heaters); President, Portable Heater Parts, a division of Manufacturers Products, Inc. Other Directorships Held: None. Qualifications: Mr. Walsh has served in several business management roles and directorship positions throughout his career. Mr. Walsh previously served as Vice President, Walsh & Kelly, Inc. (paving contractors). |
| Name Birth Date Address Positions Held with Trust Date Service Began | Principal Occupation(s) for Past Five Years and Previous Position(s) |
| John W. McGonigle Birth Date: October 26, 1938 EXECUTIVE VICE PRESIDENT AND SECRETARY Officer since: September 1993 | Principal Occupations: Executive Vice President and Secretary of the Federated Fund Family; Vice Chairman, Executive Vice President, Secretary and Director, Federated Investors, Inc. Previous Positions: Trustee, Federated Investment Management Company and Federated Investment Counseling; Director, Federated Global Investment Management Corp., Federated Services Company and Federated Securities Corp. |
| Lori A. Hensler Birth Date: January 6, 1967 TREASURER Officer since: April 2013 | Principal Occupations: Principal Financial Officer and Treasurer of the Federated Fund Family; Senior Vice President, Federated Administrative Services; Financial and Operations Principal for Federated Securities Corp. and Edgewood Services, Inc.; and Assistant Treasurer, Federated Investors Trust Company. Ms. Hensler has received the Certified Public Accountant designation. Previous Positions: Controller of Federated Investors, Inc.; Senior Vice President and Assistant Treasurer, Federated Investors Management Company; Treasurer, Federated Investors Trust Company; Assistant Treasurer, Federated Administrative Services, Federated Administrative Services, Inc., Federated Securities Corp., Edgewood Services, Inc., Federated Advisory Services Company, Federated Equity Management Company of Pennsylvania, Federated Global Investment Management Corp., Federated Investment Counseling, Federated Investment Management Company, Passport Research, Ltd., and Federated MDTA, LLC; Financial and Operations Principal for Federated Securities Corp., Edgewood Services, Inc. and Southpointe Distribution Services, Inc. |
| Peter J. Germain Birth Date: September 3, 1959 CHIEF LEGAL OFFICER Officer since: January 2005 | Principal Occupations: Mr. Germain is Chief Legal Officer of the Federated Fund Family. He is General Counsel and Vice President, Federated Investors, Inc.; President, Federated Administrative Services and Federated Administrative Services, Inc.; Vice President, Federated Securities Corp.; Secretary, Federated Private Asset Management, Inc.; and Secretary, Retirement Plan Service Company of America. Mr. Germain joined Federated in 1984 and is a member of the Pennsylvania Bar Association. Previous Positions: Deputy General Counsel, Special Counsel, Managing Director of Mutual Fund Services, Federated Investors, Inc.; Senior Vice President, Federated Services Company; and Senior Corporate Counsel, Federated Investors, Inc. |
| Richard B. Fisher Birth Date: May 17, 1923 VICE PRESIDENT Officer since: September 1993 | Principal Occupations: Vice Chairman or Vice President of some of the Funds in the Federated Fund Family; Vice Chairman, Federated Investors, Inc.; Chairman, Federated Securities Corp. Previous Positions: President and Director or Trustee of some of the Funds in the Federated Fund Family; Executive Vice President, Federated Investors, Inc.; Director and Chief Executive Officer, Federated Securities Corp. |
| John B. Fisher Birth Date: May 16, 1956 PRESIDENT Officer since: November 2004 | Principal Occupations: President, Director/Trustee and CEO, Federated Advisory Services Company, Federated Equity Management Company of Pennsylvania, Federated Global Investment Management Corp., Federated Investment Counseling, Federated Investment Management Company; President and CEO of Passport Research, Ltd.; President of some of the Funds in the Federated Fund Family; Director, Federated Investors Trust Company. Previous Positions: President and Director of the Institutional Sales Division of Federated Securities Corp.; President and Director of Federated Investment Counseling; Director, Edgewood Securities Corp.; Director, Federated Services Company; Director, Federated Investors, Inc.; Chairman and Director, Southpointe Distribution Services, Inc.; President, Technology, Federated Services Company. |
| Stephen Van Meter Birth Date: June 5, 1975 CHIEF COMPLIANCE OFFICER AND SENIOR VICE PRESIDENT Officer since: July 2015 | Principal Occupations: Senior Vice President and Chief Compliance Officer of the Federated Fund Family; Vice President and Chief Compliance Officer of Federated Investors, Inc. and Chief Compliance Officer of certain of its subsidiaries. Mr. Van Meter joined Federated in October 2011. He holds FINRA licenses under Series 3, 7, 24 and 66. Previous Positions: Mr. Van Meter previously held the position of Compliance Operating Officer, Federated Investors, Inc. Prior to joining Federated, Mr. Van Meter served at the United States Securities and Exchange Commission in the positions of Senior Counsel, Office of Chief Counsel, Division of Investment Management and Senior Counsel, Division of Enforcement. |
| Stephen F. Auth Birth Date: September 3, 1956 101 Park Avenue 41st Floor New York, NY 10178 CHIEF INVESTMENT OFFICER Officer since: November 2002 | Principal Occupations: Stephen F. Auth is Chief Investment Officer of various Funds in the Federated Fund Family; Executive Vice President, Federated Investment Counseling, Federated Global Investment Management Corp. and Federated Equity Management Company of Pennsylvania. Previous Positions: Executive Vice President, Federated Investment Management Company and Passport Research, Ltd. (investment advisory subsidiary of Federated); Senior Vice President, Global Portfolio Management Services Division; Senior Vice President, Federated Investment Management Company and Passport Research, Ltd.; Senior Managing Director and Portfolio Manager, Prudential Investments. |
| Robert J. Ostrowski Birth Date: April 26, 1963 Chief Investment Officer Officer since: May 2004 | Principal Occupations: Robert J. Ostrowski joined Federated in 1987 as an Investment Analyst and became a Portfolio Manager in 1990. He was named Chief Investment Officer of Federated's taxable fixed-income products in 2004 and also serves as a Senior Portfolio Manager. Mr. Ostrowski became an Executive Vice President of the Fund's Adviser in 2009 and served as a Senior Vice President of the Fund's Adviser from 1997 to 2009. Mr. Ostrowski has received the Chartered Financial Analyst designation. He received his M.S. in Industrial Administration from Carnegie Mellon University. |
| Deborah A. Cunningham Birth Date: September 15, 1959 Chief Investment Officer Officer since: June 2012 | Principal Occupations: Deborah A. Cunningham was named Chief Investment Officer of Federated's money market products in 2004. She joined Federated in 1981 and has been a Senior Portfolio Manager since 1997 and an Executive Vice President of the Fund's Adviser since 2009. Ms. Cunningham has received the Chartered Financial Analyst designation and holds an M.S.B.A. in Finance from Robert Morris College. |
Federated Investors Funds
4000 Ericsson Drive
Warrendale, PA 15086-7561
or call 1-800-341-7400.
CUSIP 313916777
2016 ©Federated Investors, Inc.
May Lose Value
| Security Type | Percentage of Total Net Assets |
| Commercial Paper and Notes | 42.7% |
| Variable Rate Instruments | 14.6% |
| Bank Instruments | 11.5% |
| U.S. Government Agency Securities | 2.9% |
| U.S. Treasury | 1.1% |
| Repurchase Agreements and Other Repurchase Agreements | 27.2% |
| Other Assets and Liabilities—Net2,3 | (0.0)% |
| TOTAL | 100.0% |
| Securities With an Effective Maturity of: | Percentage of Total Net Assets |
| 1-7 Days | 32.8%5 |
| 8-30 Days | 22.4% |
| 31-90 Days | 40.8% |
| 91-180 Days | 2.9% |
| 181 Days or more | 1.1% |
| Other Assets and Liabilities—Net2,3 | (0.0)% |
| TOTAL | 100.0% |
| 1 | Commercial Paper and Notes include any fixed-rate security that is not a bank instrument. A variable rate instrument is any security which has an interest rate that resets periodically. See the Fund's Prospectus for descriptions of commercial paper, repurchase agreements and bank instruments. |
| 2 | Assets, other than investments in securities, less liabilities. See Statement of Assets and Liabilities. |
| 3 | Represents less than 0.1%. |
| 4 | Effective maturity is determined in accordance with the requirements of Rule 2a-7 under the Investment Company Act of 1940, which regulates money market mutual funds. |
| 5 | Overnight securities comprised 19.3 % of the Fund's portfolio. |
| Principal Amount or Shares | Value | ||
| ASSET-BACKED SECURITY—0.1% | |||
| Finance - Equipment—0.1% | |||
| $150,509 | 1,2 | Axis Equipment Contract Backed Notes, Series 2015-1, Class A1, 0.520%, 4/20/2016 | $150,509 |
| CERTIFICATES OF DEPOSIT—11.5% | |||
| Finance - Banking—11.5% | |||
| 6,000,000 | Bank of Tokyo-Mitsubishi UFJ Ltd., 0.390%—0.400%, 2/10/2016 - 3/1/2016 | 6,000,000 | |
| 1,000,000 | DZ Bank AG Deutsche Zentral-Genossenschaftsbank, 0.390%, 2/2/2016 | 1,000,000 | |
| 2,000,000 | Natixis, 0.400%, 2/4/2016 - 2/16/2016 | 2,000,000 | |
| 7,000,000 | Sumitomo Mitsui Banking Corp., 0.400%, 1/14/2016 - 2/12/2016 | 7,000,000 | |
| TOTAL CERTIFICATES OF DEPOSIT | 16,000,000 | ||
| COMMERCIAL PAPER—34.2%3 | |||
| Aerospace/Auto—0.8% | |||
| 465,000 | 1,2 | ERAC USA Finance LLC, (GTD by Enterprise Holdings, Inc.), 0.851%, 1/28/2016 | 464,703 |
| 700,000 | 1,2 | Nissan Motor Acceptance Corp., (Nissan Motor Co., Ltd. SA), 0.480%, 1/7/2016 | 699,944 |
| TOTAL | 1,164,647 | ||
| Electrical Equipment—0.5% | |||
| 644,000 | 1,2 | Eaton Corp., (GTD by Eaton Corp. PLC), 0.700%, 1/11/2016 | 643,875 |
| Finance - Banking—12.2% | |||
| 1,000,000 | 1,2 | Antalis S.A., 0.481%, 3/3/2016 | 999,173 |
| 3,000,000 | 1,2 | BNP Paribas SA, 0.581%, 3/15/2016 | 2,996,423 |
| 3,000,000 | ING (U.S.) Funding LLC, 0.360%, 2/1/2016 | 2,999,070 | |
| 2,000,000 | 1,2 | Nationwide Building Society, 0.410%, 2/22/2016 | 1,998,816 |
| 5,000,000 | 1,2 | Standard Chartered Bank PLC, 0.391%, 1/29/2016 - 2/22/2016 | 4,997,963 |
| 3,000,000 | 1,2,4 | Westpac Banking Corp. Ltd., Sydney, 0.582%, 1/26/2016 | 3,000,000 |
| TOTAL | 16,991,445 | ||
| Finance - Commercial—5.7% | |||
| 3,000,000 | 1,2 | Atlantic Asset Securitization LLC, 0.320%, 1/14/2016 | 2,999,653 |
| 1,000,000 | 1,2 | CIESCO, LLC, 0.481%, 2/10/2016 | 999,467 |
| 4,000,000 | 1,2 | Versailles Commercial Paper LLC, 0.380%—0.631%, 2/1/2016 - 3/9/2016 | 3,997,828 |
| TOTAL | 7,996,948 | ||
| Finance - Retail—9.7% | |||
| 4,000,000 | American Express Credit Corp., 0.350%, 2/2/2016 | 3,998,755 | |
| 1,500,000 | 1,2 | CAFCO, LLC, 0.451%—0.501%, 2/1/2016 - 2/11/2016 | 1,499,237 |
| 3,000,000 | 1,2 | Chariot Funding LLC, 0.421%, 2/16/2016 | 2,998,390 |
| 5,000,000 | 1,2 | Sheffield Receivables Company LLC, 0.481%, 3/18/2016 | 4,994,867 |
| TOTAL | 13,491,249 | ||
| Machinery / Equipment / Auto—0.4% | |||
| 500,000 | 1,2 | Harley-Davidson Financial Services, Inc., (Harley-Davidson, Inc. SA), 0.530%, 1/13/2016 | 499,912 |
| Oil & Oil Finance—1.0% | |||
| 700,000 | 1,2 | Devon Energy Corp., 0.550%, 1/8/2016 | 699,925 |
| 700,000 | Motiva Enterprises LLC, 0.600%, 1/6/2016 | 699,942 | |
| TOTAL | 1,399,867 |
| Principal Amount or Shares | Value | ||
| COMMERCIAL PAPER—continued3 | |||
| Sovereign—3.6% | |||
| $5,000,000 | 1,2 | Kells Funding, LLC, 0.421%, 1/18/2016 | $4,999,183 |
| Telecommunications—0.3% | |||
| 400,000 | 1,2 | Bell Canada, 0.671%, 1/22/2016 | 399,844 |
| TOTAL COMMERCIAL PAPER | 47,586,970 | ||
| CORPORATE BONDS—6.2% | |||
| Finance - Banking—4.1% | |||
| 1,581,000 | Bank of America Corp., 1.250%, 1/11/2016 | 1,581,192 | |
| 3,165,000 | Bank of America Corp., 3.625%, 3/17/2016 | 3,182,847 | |
| 900,000 | Citigroup, Inc., 1.300%, 4/1/2016 | 900,618 | |
| TOTAL | 5,664,657 | ||
| Finance - Securities—2.1% | |||
| 3,000,000 | 1,2 | GE Capital International Funding Co., 0.964%, 4/15/2016 | 3,003,512 |
| TOTAL CORPORATE BONDS | 8,668,169 | ||
| CORPORATE NOTE—0.7% | |||
| Finance - Banking—0.7% | |||
| 1,000,000 | 1,2 | ING Bank N.V., 1.375%, 3/7/2016 | 1,001,407 |
| NOTES - VARIABLE—14.6%4 | |||
| Aerospace/Auto—1.4% | |||
| 2,000,000 | BMW US Capital LLC, (GTD by Bayerische Motoren Werke AG), 0.547%, 2/29/2016 | 2,000,000 | |
| Finance - Banking—13.2% | |||
| 1,000,000 | Bank of Montreal, 0.510%, 1/19/2016 | 1,000,000 | |
| 4,000,000 | 1,2 | Commonwealth Bank of Australia, 0.404%, 1/4/2016 | 4,000,000 |
| 3,150,000 | Connecticut HEFA, Series D Griffin Hospital, (Wells Fargo Bank, N.A. LOC), 0.420%, 1/7/2016 | 3,150,000 | |
| 2,000,000 | 1,2 | J.P. Morgan Securities LLC, 0.673%, 1/22/2016 | 2,000,000 |
| 1,120,000 | JPMorgan Chase & Co., 1.027%, 2/26/2016 | 1,120,264 | |
| 195,000 | Lancaster, PA IDA, Snavely's Mill, Inc., Series 2003—B, (Fulton Bank, N.A. LOC), 1.000%, 1/7/2016 | 195,000 | |
| 1,000,000 | Rabobank Nederland NV, Utrecht, 0.413%, 3/18/2016 | 1,000,000 | |
| 1,000,000 | Rabobank Nederland NV, Utrecht, 0.574%, 1/29/2016 | 1,000,000 | |
| 1,000,000 | Royal Bank of Canada, Montreal, 0.409%, 1/11/2016 | 1,000,000 | |
| 1,000,000 | Royal Bank of Canada, Montreal, 0.540%, 1/25/2016 | 1,000,000 | |
| 1,000,000 | Toronto Dominion Bank, 0.419%, 1/6/2016 | 1,000,000 | |
| 1,000,000 | Toronto Dominion Bank, 0.426%, 1/8/2016 | 1,000,000 | |
| 900,000 | U.S. Bank, N.A., 0.440%, 1/22/2016 | 900,140 | |
| TOTAL | 18,365,404 | ||
| TOTAL NOTES—VARIABLE | 20,365,404 | ||
| GOVERNMENT AGENCIES—2.9% | |||
| 2,000,000 | 5 | Federal Home Loan Bank System, 0.244%, 2/3/2016 | 1,998,025 |
| 2,000,000 | 5 | Federal Home Loan Mortgage Corp., 0.462%, 1/27/2016 | 1,999,462 |
| TOTAL GOVERNMENT AGENCIES | 3,997,487 | ||
| SOVEREIGN—1.5% | |||
| Sovereign—1.5% | |||
| 2,000,000 | International Bank for Reconstruction & Development (World Bank), 0.000%, 2/10/2016 | 1,998,889 | |
| U.S. TREASURY—1.1% | |||
| U.S. Treasury Notes—1.1% | |||
| 500,000 | United States Treasury, 0.500%, 11/30/2016 | 499,436 | |
| 1,000,000 | United States Treasury, 3.250%, 7/31/2016 | 1,014,800 | |
| TOTAL U.S. TREASURY | 1,514,236 |
| Principal Amount or Shares | Value | ||
| OTHER REPURCHASE AGREEMENTS—12.9% | |||
| Finance - Banking—12.9% | |||
| $1,000,000 | Citigroup Global Markets, Inc., 0.629%, 1/4/2016, interest in a $75,000,000 collateralized loan agreement, dated 12/31/2015, will repurchase securities provided as collateral for $75,005,167, in which asset-backed securities with a market value of $76,505,270 have been received as collateral and held with BNY Mellon as tri-party agent. | $1,000,000 | |
| 4,000,000 | HSBC Securities (USA), Inc., 0.324%, 1/4/2016, interest in a $170,000,000 collateralized loan agreement, dated 12/31/2015, will repurchase securities provided as collateral for $170,006,044, in which corporate bonds with a market value of $173,402,607 have been received as collateral and held with BNY Mellon as tri-party agent. | 4,000,000 | |
| 2,000,000 | Merrill Lynch, Pierce, Fenner & Smith, Inc., 0.426%, 1/4/2016, interest in a $175,000,000 collateralized loan agreement, dated 12/31/2015, will repurchase securities provided as collateral for $175,008,167, in which asset-backed securities with a market value of $178,508,330 have been received as collateral and held with BNY Mellon as tri-party agent. | 2,000,000 | |
| 6,000,000 | Mizuho Securities USA, Inc., 0.710%—1.511%, 1/7/2016, interest in a $297,000,000 collateralized loan agreement, dated 6/23/2015-12/31/2015, will repurchase securities provided as collateral for $297,728,658, in which asset-backed securities, certificates of deposit, collateralized mortgage obligations, corporate bonds, medium-term notes and U.S. Government Agency securities with a market value of $303,432,973 have been received as collateral and held with BNY Mellon as tri-party agent. | 6,000,000 | |
| 2,000,000 | RBC Capital Markets, LLC, 0.507%, 1/7/2016, interest in a $300,000,000 collateralized loan agreement, dated 12/17/2015, will repurchase securities provided as collateral for $300,137,500, in which corporate bonds and medium-term notes with a market value of $306,076,501 have been received as collateral and held with BNY Mellon as tri-party agent. | 2,000,000 | |
| 3,000,000 | Wells Fargo Securities LLC, 0.507%, 1/7/2016, interest in a $200,000,000 collateralized loan agreement, dated 10/19/2015, will repurchase securities provided as collateral for $200,255,5560, in which collateralized mortgage obligations with a market value of $204,218,167 have been received as collateral and held with BNY Mellon as tri-party agent. | 3,000,000 | |
| TOTAL OTHER REPURCHASE AGREEMENTS | 18,000,000 | ||
| REPURCHASE AGREEMENTS—14.3% | |||
| Finance - Banking—14.3% | |||
| 9,897,000 | Interest in $1,800,000,000 joint repurchase agreement 0.32%, dated 12/31/2015 under which Mitsubishi UFJ Securities (USA), Inc. will repurchase securities provided as collateral for $1,800,064,000 on 1/4/2016. The securities provided as collateral at the end of the period held with BNY Mellon as tri-party agent, were U.S. Government Agency securities with various maturities to 12/20/2064 and the market value of those underlying securities was $1,852,677,185. | 9,897,000 | |
| 10,000,000 | Interest in $2,500,000,000 joint repurchase agreement 0.33%, dated 12/31/2015 under which Natixis Financial Products LLC will repurchase securities provided as collateral for $2,500,091,667 on 1/4/2016. The securities provided as collateral at the end of the period held with BNY Mellon as tri-party agent, were U.S. Government Agency and U.S. Treasury securities with various maturities to 8/25/2051 and the market value of those underlying securities was $2,562,055,805. | 10,000,000 | |
| TOTAL REPURCHASE AGREEMENTS | 19,897,000 | ||
| TOTAL INVESTMENTS—100.0% (AT AMORTZED COST)6 | 139,180,071 | ||
| OTHER ASSETS AND LIABILITIES - NET—(0.0)%7 | (10,483) | ||
| TOTAL NET ASSETS—100% | $139,169,588 |
| 1 | Denotes a restricted security that either: (a) cannot be offered for public sale without first being registered, or being able to take advantage of an exemption from registration, under the Securities Act of 1933; or (b) is subject to a contractual restriction on public sales. At December 31, 2015, these restricted securities amounted to $50,044,631, which represented 36.0% of total net assets. |
| 2 | Denotes a restricted security that may be resold without restriction to “qualified institutional buyers” as defined in Rule 144A under the Securities Act of 1933 and that the Fund has determined to be liquid under criteria established by the Fund's Board of Trustees (the “Trustees”). At December 31, 2015, these liquid restricted securities amounted to $50,044,631, which represented 36.0% of total net assets. |
| 3 | Discount rate at time of purchase. |
| 4 | Denotes a variable rate security with current rate and next reset date shown. |
| 5 | Floating rate notes with current rate(s) and next reset date(s) shown. |
| 6 | Also represents cost of investments for federal tax purposes. |
| 7 | Assets, other than investments in securities, less liabilities. See Statement of Assets and Liabilities. |
| GTD | —Guaranteed |
| HEFA | —Health and Education Facilities Authority |
| IDA | —Industrial Development Authority |
| LOC | —Letter of Credit |
| Year Ended December 31 | 2015 | 2014 | 2013 | 2012 | 2011 |
| Net Asset Value, Beginning of Period | $1.00 | $1.00 | $1.00 | $1.00 | $1.00 |
| Income From Investment Operations: | |||||
| Net investment income | — | — | — | — | — |
| Net realized and unrealized gain (loss) on investments | 0.0001 | 0.0001 | 0.0001 | 0.0001 | (0.000)1 |
| TOTAL FROM INVESTMENT OPERATIONS | 0.0001 | 0.0001 | 0.0001 | 0.0001 | (0.000)1 |
| Less Distributions: | |||||
| Distributions from net realized gain on investments | (0.000)1 | — | — | — | — |
| Net Asset Value, End of Period | $1.00 | $1.00 | $1.00 | $1.00 | $1.00 |
| Total Return2 | 0.00% | 0.00% | 0.00% | 0.00% | 0.00% |
| Ratios to Average Net Assets: | |||||
| Net expenses | 0.34% | 0.26% | 0.27% | 0.40% | 0.36% |
| Net investment income | 0.00% | 0.00% | 0.00% | 0.00% | 0.00% |
| Expense waiver/reimbursement3 | 0.40% | 0.42% | 0.41% | 0.26% | 0.32% |
| Supplemental Data: | |||||
| Net assets, end of period (000 omitted) | $139,170 | $132,678 | $154,973 | $174,541 | $204,124 |
| 1 | Represents less than $0.001. |
| 2 | Based on net asset value. Total returns do not reflect any additional fees or expenses that may be imposed by separate accounts of insurance companies or in connection with any variable annuity or variable life insurance contract. |
| 3 | This expense decrease is reflected in both the net expense and the net investment income ratios shown above. |
| Assets: | ||
| Investment in repurchase agreements and other repurchase agreements | $37,897,000 | |
| Investment in securities | 101,283,071 | |
| Total investment in securities, at amortized cost and fair value | $139,180,071 | |
| Cash | 1,093 | |
| Income receivable | 98,219 | |
| Receivable for shares sold | 1,249 | |
| TOTAL ASSETS | 139,280,632 | |
| Liabilities: | ||
| Payable for shares redeemed | 81,377 | |
| Payable to adviser (Note 5) | 151 | |
| Payable for custodian fees | 6,546 | |
| Payable for portfolio accounting fees | 14,959 | |
| Payable for printing and postage | 3,801 | |
| Accrued expenses (Note 5) | 4,210 | |
| TOTAL LIABILITIES | 111,044 | |
| Net assets for 139,170,039 shares outstanding | $139,169,588 | |
| Net Assets Consist of: | ||
| Paid-in capital | $139,169,588 | |
| TOTAL NET ASSETS | $139,169,588 | |
| Net Asset Value, Offering Price and Redemption Proceeds Per Share: | ||
| $139,169,588 ÷ 139,170,039 shares outstanding, no par value, unlimited shares authorized | $1.00 |
| Investment Income: | ||
| Interest | $441,718 | |
| Expenses: | ||
| Investment adviser fee (Note 5) | $654,278 | |
| Administrative fee (Note 5) | 102,394 | |
| Custodian fees | 23,468 | |
| Transfer agent fee | 3,684 | |
| Directors'/Trustees' fees (Note 5) | 1,796 | |
| Auditing fees | 22,000 | |
| Legal fees | 9,044 | |
| Portfolio accounting fees | 49,620 | |
| Printing and postage | 87,305 | |
| Miscellaneous (Note 5) | 6,350 | |
| TOTAL EXPENSES | 959,939 | |
| Waiver of investment adviser fee (Note 5) | (518,221) | |
| Net expenses | 441,718 | |
| Net investment income | — | |
| Net realized gain on investments | 1,532 | |
| Change in net assets resulting from operations | $1,532 |
| Year Ended December 31 | 2015 | 2014 |
| Increase (Decrease) in Net Assets | ||
| Operations: | ||
| Net investment income | $— | $— |
| Net realized gain on investments | 1,532 | 282 |
| CHANGE IN NET ASSETS RESULTING FROM OPERATIONS | 1,532 | 282 |
| Distributions to Shareholders: | ||
| Distributions from net realized gain on investments | (1,349) | — |
| Share Transactions: | ||
| Proceeds from sale of shares | 81,522,557 | 82,602,288 |
| Net asset value of shares issued to shareholders in payment of distributions declared | 1,337 | — |
| Cost of shares redeemed | (75,032,191) | (104,898,328) |
| CHANGE IN NET ASSETS RESULTING FROM SHARE TRANSACTIONS | 6,491,703 | (22,296,040) |
| Change in net assets | 6,491,886 | (22,295,758) |
| Net Assets: | ||
| Beginning of period | 132,677,702 | 154,973,460 |
| End of period | $139,169,588 | $132,677,702 |
| Year Ended December 31 | 2015 | 2014 |
| Shares sold | 81,522,557 | 82,602,288 |
| Shares issued to shareholders in payment of distributions declared | 1,337 | — |
| Shares redeemed | (75,032,191) | (104,898,328) |
| NET CHANGE RESULTING FROM FUND SHARE TRANSACTIONS | 6,491,703 | (22,296,040) |
| 2015 | 2014 | |
| Ordinary income1 | $1,349 | $— |
| 1 | For tax purposes, short-term capital gain distributions are considered as ordinary income distributions. |
| Administrative Fee | Average Daily Net Assets of the Investment Complex |
| 0.150% | on the first $5 billion |
| 0.125% | on the next $5 billion |
| 0.100% | on the next $10 billion |
| 0.075% | on assets in excess of $20 billion |
February 12, 2016
| Beginning Account Value 7/1/2015 | Ending Account Value 12/312015 | Expenses Paid During Period1,2 | |
| Actual | $1,000 | $1,000.00 | $1.87 |
| Hypothetical (assuming a 5% return before expenses) | $1,000 | $1,023.34 | $1.89 |
| 1 | Expenses are equal to the Fund's annualized net expense ratio of 0.37%, multiplied by the average account value over the period, multiplied by 184/365 (to reflect the one-half-year period). The expenses shown in the table do not include the charges and expenses imposed by the insurance company under the variable insurance product contract. Please refer to the variable insurance product prospectus for a complete listing of these expenses. |
| 2 | Actual and Hypothetical expenses paid during the period, utilizing the Fund's current Fee Limit of 0.67% (as reflected in the Notes to Financial Statements, Note 5 under Expense Limitation), multiplied by the average account value over the period, multiplied by 184/365 (to reflect expenses paid as if they had been in effect throughout the most recent one-half-year period) would be $3.38 and $3.41, respectively. |
| For | Against | Abstain |
| 118,960,519.094 | 9,116,534.742 | 13,177,992.940 |
| Name Birth Date Positions Held with Trust Date Service Began | Principal Occupation(s) for Past Five Years, Other Directorships Held and Previous Position(s) |
| John F. Donahue* Birth Date: July 28, 1924 Trustee Indefinite Term Began serving: October 1993 | Principal Occupations: Director or Trustee of the Federated Fund Family; Chairman and Director, Federated Investors, Inc.; Chairman of the Federated Fund Family's Executive Committee. Previous Positions: Chairman of the Federated Fund Family; Trustee, Federated Investment Management Company; Chairman and Director, Federated Investment Counseling. |
| J. Christopher Donahue* Birth Date: April 11, 1949 Trustee Indefinite Term Began serving: October 1993 | Principal Occupations: Principal Executive Officer and President of certain of the Funds in the Federated Fund Family; Director or Trustee of the Funds in the Federated Fund Family; President, Chief Executive Officer and Director, Federated Investors, Inc.; Chairman and Trustee, Federated Investment Management Company; Trustee, Federated Investment Counseling; Chairman and Director, Federated Global Investment Management Corp.; Chairman, Federated Equity Management Company of Pennsylvania and Passport Research, Ltd. (investment advisory subsidiary of Federated); Trustee, Federated Shareholder Services Company; Director, Federated Services Company. Previous Positions: President, Federated Investment Counseling; President and Chief Executive Officer, Federated Investment Management Company, Federated Global Investment Management Corp. and Passport Research, Ltd. |
| * | Family relationships and reasons for “interested” status: John F. Donahue is the father of J. Christopher Donahue; both are “interested” due to their beneficial ownership of shares of Federated Investors, Inc. and the positions they hold with Federated and its subsidiaries. |
| Name Birth Date Positions Held with Trust Date Service Began | Principal Occupation(s) for Past Five Years, Other Directorships Held, Previous Position(s) and Qualifications |
| John T. Collins Birth Date: January 24, 1947 Trustee Indefinite Term Began serving: October 2013 | Principal Occupations: Director or Trustee of the Federated Fund Family; Retired. Other Directorships Held: Director, Chair of the Compensation Committee, Audit Committee member, KLX Corp. Qualifications: Mr. Collins has served in several business and financial management roles and directorship positions throughout his career. Mr. Collins previously served as Chairman and CEO, The Collins Group, Inc. (a private equity firm). Mr. Collins serves as Chairman Emeriti, Bentley University. Mr. Collins previously served as Director, FleetBoston Financial Corp.; Director and Audit Committee Member, Bank of America Corp. and Director, Beth Israel Deaconess Medical Center (Harvard University Affiliate Hospital). |
| G. Thomas Hough Birth Date: February 28, 1955 Trustee Indefinite Term Began serving: August 2015 | Principal Occupations: Director or Trustee of the Federated Fund Family; Retired. Other Directorships Held: Director, Chair of the Audit Committee, Governance Committee, Publix Super Markets, Inc. Qualifications: Mr. Hough has served in accounting, business management and directorship positions throughout his career. Mr. Hough most recently held the position of Americas Vice Chair of Assurance with Ernst & Young LLP. Mr. Hough is an Executive Committee member of the United States Golf Association, he serves on the President's Cabinet and Business School Board of Visitors for the University of Alabama and is on the Business School Board of Visitors for Wake Forest University. |
| Name Birth Date Positions Held with Trust Date Service Began | Principal Occupation(s) for Past Five Years, Other Directorships Held, Previous Position(s) and Qualifications |
| Maureen Lally-Green Birth Date: July 5, 1949 Trustee Indefinite Term Began serving: August 2009 | Principal Occupations: Director or Trustee of the Federated Fund Family; Adjunct Professor of Law, Duquesne University School of Law. Other Directorships Held: Director, CONSOL Energy Inc. Qualifications: Judge Lally-Green has served in various legal and business roles and directorship positions throughout her career. Judge Lally-Green previously served as: Associate General Secretary, Diocese of Pittsburgh; a member of the Superior Court of Pennsylvania; and as a Professor of Law, Duquesne University School of Law. Judge Lally-Green also holds the positions on either a public or not for profit Board of Directors as follows: Member, Pennsylvania State Board of Education (public); Director and Chair, UPMC Mercy Hospital; Regent, St. Vincent Seminary; Director, Epilepsy Foundation of Western and Central Pennsylvania; Director and Vice Chair, Our Campaign for the Church Alive!, Inc.; Director, Saint Vincent College; Director, Pennsylvania Bar Institute; and Director and Chair, Cardinal Wuerl North Catholic High School, Inc. Judge Lally-Green has held the positions of: Director, Auberle; Director, Ireland Institute of Pittsburgh; Director, Saint Thomas More Society; and Director, Catholic High Schools of the Diocese of Pittsburgh, Inc. |
| Peter E. Madden Birth Date: March 16, 1942 Trustee Indefinite Term Began serving: October 1993 | Principal Occupation: Director or Trustee, and Chair of the Board of Directors or Trustees, of the Federated Fund Family; Retired. Other Directorships Held: None. Qualifications: Mr. Madden has served in several business management, mutual fund services and directorship positions throughout his career. Mr. Madden previously served as President, Chief Operating Officer and Director, State Street Bank and Trust Company (custodian bank) and State Street Corporation (financial services). He was Director, VISA USA and VISA International and Chairman and Director, Massachusetts Bankers Association. Mr. Madden served as Director, Depository Trust Corporation and Director, The Boston Stock Exchange. Mr. Madden also served as a Representative to the Commonwealth of Massachusetts General Court. |
| Charles F. Mansfield, Jr. Birth Date: April 10, 1945 Trustee Indefinite Term Began serving: November 1999 | Principal Occupations: Director or Trustee of the Federated Fund Family; Management Consultant. Other Directorships Held: None. Qualifications: Mr. Mansfield has served in several banking, business management and educational roles and directorship positions throughout his career. Mr. Mansfield previously served as Chief Executive Officer, PBTC International Bank; Partner, Arthur Young & Company (now Ernst & Young LLP); Chief Financial Officer of Retail Banking Sector, Chase Manhattan Bank; Senior Vice President, HSBC Bank USA (formerly, Marine Midland Bank); Vice President, Citibank; Assistant Professor of Banking and Finance, Frank G. Zarb School of Business, Hofstra University; Executive Vice President DVC Group, Inc. (marketing, communications and technology). |
| Thomas M. O'Neill Birth Date: June 14, 1951 Trustee Indefinite Term Began serving: October 2006 | Principal Occupations: Director or Trustee, Chair of the Audit Committee of the Federated Fund Family; Sole Proprietor, Navigator Management Company (investment and strategic consulting). Other Directorships Held: None. Qualifications: Mr. O'Neill has served in several business, mutual fund and financial management roles and directorship positions throughout his career. Mr. O'Neill serves as Director, Medicines for Humanity and Director, The Golisano Children's Museum of Naples, Florida. Mr. O'Neill previously served as Chief Executive Officer and President, Managing Director and Chief Investment Officer, Fleet Investment Advisors; President and Chief Executive Officer, Aeltus Investment Management, Inc.; General Partner, Hellman, Jordan Management Co., Boston, MA; Chief Investment Officer, The Putnam Companies, Boston, MA; Credit Analyst and Lending Officer, Fleet Bank; Director and Consultant, EZE Castle Software (investment order management software); and Director, Midway Pacific (lumber). |
| P. Jerome Richey Birth Date: February 23, 1949 Trustee Indefinite Term Began serving: October 2013 | Principal Occupations: Director or Trustee of the Federated Fund Family; Management Consultant. Other Directorships Held: None. Qualifications: Mr. Richey has served in several business and legal management roles and directorship positions throughout his career. Mr. Richey most recently held the positions of Senior Vice Chancellor and Chief Legal Officer, University of Pittsburgh. Mr. Richey serves as Board Member, Epilepsy Foundation of Western Pennsylvania and Board member, World Affairs Council of Pittsburgh. Mr. Richey previously served as Chief Legal Officer and Executive Vice President, CONSOL Energy Inc. and Shareholder, Buchanan Ingersoll & Rooney PC (a law firm). |
| John S. Walsh Birth Date: November 28, 1957 Trustee Indefinite Term Began serving: January 1999 | Principal Occupations: Director or Trustee of the Federated Fund Family; President and Director, Heat Wagon, Inc. (manufacturer of construction temporary heaters); President and Director, Manufacturers Products, Inc. (distributor of portable construction heaters); President, Portable Heater Parts, a division of Manufacturers Products, Inc. Other Directorships Held: None. Qualifications: Mr. Walsh has served in several business management roles and directorship positions throughout his career. Mr. Walsh previously served as Vice President, Walsh & Kelly, Inc. (paving contractors). |
| Name Birth Date Address Positions Held with Trust Date Service Began | Principal Occupation(s) for Past Five Years and Previous Position(s) |
| John W. McGonigle Birth Date: October 26, 1938 EXECUTIVE VICE PRESIDENT AND SECRETARY Officer since: September 1993 | Principal Occupations: Executive Vice President and Secretary of the Federated Fund Family; Vice Chairman, Executive Vice President, Secretary and Director, Federated Investors, Inc. Previous Positions: Trustee, Federated Investment Management Company and Federated Investment Counseling; Director, Federated Global Investment Management Corp., Federated Services Company and Federated Securities Corp. |
| Lori A. Hensler Birth Date: January 6, 1967 TREASURER Officer since: April 2013 | Principal Occupations: Principal Financial Officer and Treasurer of the Federated Fund Family; Senior Vice President, Federated Administrative Services; Financial and Operations Principal for Federated Securities Corp. and Edgewood Services, Inc.; and Assistant Treasurer, Federated Investors Trust Company. Ms. Hensler has received the Certified Public Accountant designation. Previous Positions: Controller of Federated Investors, Inc.; Senior Vice President and Assistant Treasurer, Federated Investors Management Company; Treasurer, Federated Investors Trust Company; Assistant Treasurer, Federated Administrative Services, Federated Administrative Services, Inc., Federated Securities Corp., Edgewood Services, Inc., Federated Advisory Services Company, Federated Equity Management Company of Pennsylvania, Federated Global Investment Management Corp., Federated Investment Counseling, Federated Investment Management Company, Passport Research, Ltd., and Federated MDTA, LLC; Financial and Operations Principal for Federated Securities Corp., Edgewood Services, Inc. and Southpointe Distribution Services, Inc. |
| Peter J. Germain Birth Date: September 3, 1959 CHIEF LEGAL OFFICER Officer since: January 2005 | Principal Occupations: Mr. Germain is Chief Legal Officer of the Federated Fund Family. He is General Counsel and Vice President, Federated Investors, Inc.; President, Federated Administrative Services and Federated Administrative Services, Inc.; Vice President, Federated Securities Corp.; Secretary, Federated Private Asset Management, Inc.; and Secretary, Retirement Plan Service Company of America. Mr. Germain joined Federated in 1984 and is a member of the Pennsylvania Bar Association. Previous Positions: Deputy General Counsel, Special Counsel, Managing Director of Mutual Fund Services, Federated Investors, Inc.; Senior Vice President, Federated Services Company; and Senior Corporate Counsel, Federated Investors, Inc. |
| Richard B. Fisher Birth Date: May 17, 1923 VICE PRESIDENT Officer since: September 1993 | Principal Occupations: Vice Chairman or Vice President of some of the Funds in the Federated Fund Family; Vice Chairman, Federated Investors, Inc.; Chairman, Federated Securities Corp. Previous Positions: President and Director or Trustee of some of the Funds in the Federated Fund Family; Executive Vice President, Federated Investors, Inc.; Director and Chief Executive Officer, Federated Securities Corp. |
| John B. Fisher Birth Date: May 16, 1956 PRESIDENT Officer since: November 2004 | Principal Occupations: President, Director/Trustee and CEO, Federated Advisory Services Company, Federated Equity Management Company of Pennsylvania, Federated Global Investment Management Corp., Federated Investment Counseling, Federated Investment Management Company; President and CEO of Passport Research, Ltd.; President of some of the Funds in the Federated Fund Family; Director, Federated Investors Trust Company. Previous Positions: President and Director of the Institutional Sales Division of Federated Securities Corp.; President and Director of Federated Investment Counseling; Director, Edgewood Securities Corp.; Director, Federated Services Company; Director, Federated Investors, Inc.; Chairman and Director, Southpointe Distribution Services, Inc.; President, Technology, Federated Services Company. |
| Stephen Van Meter Birth Date: June 5, 1975 CHIEF COMPLIANCE OFFICER AND SENIOR VICE PRESIDENT Officer since: July 2015 | Principal Occupations: Senior Vice President and Chief Compliance Officer of the Federated Fund Family; Vice President and Chief Compliance Officer of Federated Investors, Inc. and Chief Compliance Officer of certain of its subsidiaries. Mr. Van Meter joined Federated in October 2011. He holds FINRA licenses under Series 3, 7, 24 and 66. Previous Positions: Mr. Van Meter previously held the position of Compliance Operating Officer, Federated Investors, Inc. Prior to joining Federated, Mr. Van Meter served at the United States Securities and Exchange Commission in the positions of Senior Counsel, Office of Chief Counsel, Division of Investment Management and Senior Counsel, Division of Enforcement. |
| Stephen F. Auth Birth Date: September 3, 1956 101 Park Avenue 41st Floor New York, NY 10178 CHIEF INVESTMENT OFFICER Officer since: November 2002 | Principal Occupations: Stephen F. Auth is Chief Investment Officer of various Funds in the Federated Fund Family; Executive Vice President, Federated Investment Counseling, Federated Global Investment Management Corp. and Federated Equity Management Company of Pennsylvania. Previous Positions: Executive Vice President, Federated Investment Management Company and Passport Research, Ltd. (investment advisory subsidiary of Federated); Senior Vice President, Global Portfolio Management Services Division; Senior Vice President, Federated Investment Management Company and Passport Research, Ltd.; Senior Managing Director and Portfolio Manager, Prudential Investments. |
| Robert J. Ostrowski Birth Date: April 26, 1963 Chief Investment Officer Officer since: May 2004 | Principal Occupations: Robert J. Ostrowski joined Federated in 1987 as an Investment Analyst and became a Portfolio Manager in 1990. He was named Chief Investment Officer of Federated's taxable fixed-income products in 2004 and also serves as a Senior Portfolio Manager. Mr. Ostrowski became an Executive Vice President of the Fund's Adviser in 2009 and served as a Senior Vice President of the Fund's Adviser from 1997 to 2009. Mr. Ostrowski has received the Chartered Financial Analyst designation. He received his M.S. in Industrial Administration from Carnegie Mellon University. |
| Deborah A. Cunningham Birth Date: September 15, 1959 Chief Investment Officer Officer since: June 2012 | Principal Occupations: Deborah A. Cunningham was named Chief Investment Officer of Federated's money market products in 2004. She joined Federated in 1981 and has been a Senior Portfolio Manager since 1997 and an Executive Vice President of the Fund's Adviser since 2009. Ms. Cunningham has received the Chartered Financial Analyst designation and holds an M.S.B.A. in Finance from Robert Morris College. |
Federated Investors Funds
4000 Ericsson Drive
Warrendale, PA 15086-7561
or call 1-800-341-7400.
2016 ©Federated Investors, Inc.
| Share Class |
| Primary |
| Service |
| 1 | Please see the footnotes to the line graphs under “Fund Performance and Growth of a $10,000 Investment” below for the definition of, and more information about, the BICI. |
| 2 | Bond prices are sensitive to changes in interest rates, and a rise in interest rates can cause a decline in their prices. |
| 3 | Volatility is a statistical measurement of the frequency and level of changes in the value of an asset, index or instrument without regard to the direction of those changes. Volatility may result from rapid and dramatic price swings. |
| 4 | Investment-grade securities are securities that are rated at least “BBB- (minus)” or unrated securities of a comparable quality. Noninvestment-grade securities are securities that are not rated at least “BBB- (minus)” or unrated securities of a comparable quality. Credit ratings are an indication of the risk that a security will default. They do not protect a security from credit risk. Lower-rated bonds typically offer higher yields to help compensate investors for the increased risk associated with them. Among these risks are lower credit-worthiness, greater price volatility, more risk to principal and income than with higher-rated securities and increased possibilities of default. |
| 5 | The Fund's use of derivative instruments involves risks different from, or possibly greater than, the risks associated with investing directly in securities and other traditional instruments. |
| 6 | Duration measures the price sensitivity of a fixed-income security to changes in interest rates. Securities with longer durations are more sensitive to changes in interest rates than securities of shorter durations. |

| Federated Quality Bond Fund II - | Primary Shares | Service Shares | NA | BICI |
| F | F | NA | I | |
| 12/31/2005 | 10,000 | 10,000 | 10,000 | |
| 12/31/2006 | 10,415 | 10,392 | 10,449 | |
| 12/31/2007 | 10,976 | 10,926 | 11,035 | |
| 12/31/2008 | 10,176 | 10,101 | 10,730 | |
| 12/31/2009 | 12,255 | 12,137 | 12,439 | |
| 12/31/2010 | 13,297 | 13,141 | 13,404 | |
| 12/31/2011 | 13,599 | 13,403 | 14,123 | |
| 12/31/2012 | 14,921 | 14,670 | 15,268 | |
| 12/31/2013 | 15,076 | 14,780 | 15,241 | |
| 12/31/2014 | 15,647 | 15,298 | 15,876 | |
| 12/31/2015 | 15,610 | 15,232 | 16,019 |
| 1 Year | 5 Years | 10 Years | |
| Primary Shares | -0.24% | 3.26% | 4.55% |
| Service Shares | -0.44% | 3.00% | 4.30% |
| BICI | 0.90% | 3.63% | 4.82% |
| 1 | The Fund's performance assumes the reinvestment of all dividends and distributions. The BICI has been adjusted to reflect reinvestment of dividends on securities in the index. |
| 2 | BICI is an unmanaged index that consists of dollar-denominated, investment-grade, publicly issued securities with a maturity of between one and ten years, a minimum amount outstanding of $250 million and that are issued by both corporate issuers and non-corporate issuers (supranationals, sovereigns, foreign agencies and foreign local governments). The index is not adjusted to reflect sales loads, expenses or other fees that the Securities and Exchange Commission requires to be reflected in the Fund's performance. The index is unmanaged and, unlike the Fund, is not affected by cash flows. It is not possible to invest directly in an index. |
| Security Type | Percentage of Total Net Assets |
| Corporate Debt Securities | 96.6% |
| Collateralized Mortgage Obligations | 0.3% |
| Mortgage-Backed Securities2 | 0.1% |
| Municipal Bond | 0.1% |
| Derivative Contracts3 | (0.1)% |
| Cash Equivalents4 | 1.7% |
| Other Assets and Liabilities—Net5 | 1.3% |
| TOTAL | 100.0% |
| 1 | See the Fund's Prospectus and Statement of Additional Information for a description of these security types. |
| 2 | For purposes of this table, Mortgage-Backed Securities include mortgage-backed securities guaranteed by GSEs. |
| 3 | Based upon net unrealized appreciation (depreciation) or value of the derivative contracts as applicable. Derivative contracts may consist of futures, forwards, options and swaps. The impact of a derivative contract on the Fund's performance may be larger than its unrealized appreciation (depreciation) or value may indicate. In many cases, the notional value or amount of a derivative contract may provide a better indication of the contract's significance to the portfolio. More complete information regarding the Fund's direct investments in derivative contracts, including unrealized appreciation (depreciation), value and notional values or amounts of such contracts, can be found in the table at the end of the Portfolio of Investments included in this Report. |
| 4 | Cash Equivalents include any investments in money market mutual funds and/or overnight repurchase agreements. |
| 5 | Assets, other than investments in securities and derivative contracts, less liabilities. See Statement of Assets and Liabilities. |
| Principal Amount | Value | ||
| CORPORATE BONDS—96.6% | |||
| Basic Industry - Chemicals—2.0% | |||
| $570,000 | Albemarle Corp., 4.15%, 12/1/2024 | $545,779 | |
| 640,000 | FMC Corp., Sr. Unsecd. Note, 3.95%, 2/1/2022 | 633,439 | |
| 800,000 | 1,2 | Incitec Pivot Finance LLC, Company Guarantee, Series 144A, 6.00%, 12/10/2019 | 868,483 |
| 1,290,000 | RPM International, Inc., 6.50%, 2/15/2018 | 1,392,200 | |
| 900,000 | RPM International, Inc., Sr. Unsecd. Note, 6.125%, 10/15/2019 | 985,621 | |
| 114,000 | Rohm & Haas Co., 6.00%, 9/15/2017 | 121,393 | |
| TOTAL | 4,546,915 | ||
| Basic Industry - Metals & Mining—4.5% | |||
| 750,000 | Allegheny Technologies, Inc., Sr. Note, 9.375%, 6/1/2019 | 603,750 | |
| 100,000 | 1,2 | Anglo American Capital PLC, Company Guarantee, Series 144A, 4.45%, 9/27/2020 | 72,071 |
| 630,000 | Anglogold Ashanti Holdings PLC, Sr. Note, 6.50%, 4/15/2040 | 422,100 | |
| 1,000,000 | Anglogold Ashanti Holdings PLC, Sr. Unsecd. Note, 5.125%, 8/1/2022 | 798,750 | |
| 660,000 | ArcelorMittal SA, Sr. Unsecd. Note, 5.25%, 2/25/2017 | 640,794 | |
| 230,000 | Carpenter Technology Corp., Sr. Unsecd. Note, 4.45%, 3/1/2023 | 221,407 | |
| 850,000 | Carpenter Technology Corp., Sr. Unsecd. Note, 5.20%, 7/15/2021 | 855,781 | |
| 1,020,000 | 1,2 | Gerdau S.A., Company Guarantee, Series 144A, 5.75%, 1/30/2021 | 813,450 |
| 700,000 | 1,2 | Gold Fields Orogen Holding BVI Ltd., Company Guarantee, Series 144A, 4.875%, 10/7/2020 | 525,000 |
| 280,000 | 1,2 | Hyundai Steel Co., Sr. Unsecd. Note, Series 144A, 4.625%, 4/21/2016 | 282,127 |
| 470,000 | 1,2 | Newcrest Finance Property Ltd., Sr. Unsecd. Note, Series 144A, 4.20%, 10/1/2022 | 394,607 |
| 1,200,000 | Reliance Steel & Aluminum Co., Sr. Unsecd. Note, 4.50%, 4/15/2023 | 1,119,203 | |
| 435,000 | Rio Tinto Finance USA Ltd., Company Guarantee, 6.50%, 7/15/2018 | 471,553 | |
| 1,570,000 | Southern Copper Corp., Sr. Unsecd. Note, 3.50%, 11/8/2022 | 1,454,272 | |
| 1,430,000 | Worthington Industries, Inc., Sr. Unsecd. Note, 6.50%, 4/15/2020 | 1,589,761 | |
| TOTAL | 10,264,626 | ||
| Basic Industry - Paper—0.6% | |||
| 150,000 | Westvaco Corp., 7.65%, 3/15/2027 | 166,592 | |
| 500,000 | Westvaco Corp., Sr. Deb., 7.50%, 6/15/2027 | 524,973 | |
| 700,000 | Weyerhaeuser Co., Sr. Unsecd. Note, 6.95%, 8/1/2017 | 746,630 | |
| TOTAL | 1,438,195 | ||
| Capital Goods - Aerospace & Defense—1.7% | |||
| 270,000 | 1,2 | BAE Systems Holdings, Inc., Sr. Unsecd. Note, Series 144A, 2.85%, 12/15/2020 | 269,734 |
| 280,000 | 1,2 | BAE Systems Holdings, Inc., Sr. Unsecd. Note, Series 144A, 3.85%, 12/15/2025 | 277,928 |
| 1,619,000 | 1,2 | Embraer Overseas Ltd., Sr. Unsecd. Note, Series 144A, 5.696%, 9/16/2023 | 1,582,572 |
| 270,000 | Lockheed Martin Corp., Sr. Unsecd. Note, 2.50%, 11/23/2020 | 269,357 | |
| 260,000 | Lockheed Martin Corp., Sr. Unsecd. Note, 3.55%, 1/15/2026 | 261,872 | |
| 320,000 | Rockwell Collins, Inc., Sr. Unsecd. Note, 3.10%, 11/15/2021 | 325,087 | |
| 910,000 | 1,2 | Textron Financial Corp., Jr. Sub. Note, Series 144A, 6.00%, 2/15/2067 | 648,375 |
| 295,000 | Textron, Inc., Sr. Unsecd. Note, 4.30%, 3/1/2024 | 301,087 | |
| TOTAL | 3,936,012 | ||
| Capital Goods - Building Materials—0.7% | |||
| 620,000 | Masco Corp., Sr. Unsecd. Note, 7.125%, 3/15/2020 | 717,650 | |
| 275,000 | Masco Corp., Unsecd. Note, 4.45%, 4/1/2025 | 270,187 | |
| 195,000 | Valmont Industries, Inc., 5.25%, 10/1/2054 | 166,795 | |
| 341,000 | Valmont Industries, Inc., Sr. Unsecd. Note, 6.625%, 4/20/2020 | 378,262 | |
| TOTAL | 1,532,894 | ||
| Capital Goods - Construction Machinery—0.5% | |||
| 1,010,000 | AGCO Corp., Sr. Unsecd. Note, 5.875%, 12/1/2021 | 1,089,201 |
| Principal Amount | Value | ||
| CORPORATE BONDS—continued | |||
| Capital Goods - Diversified Manufacturing—1.2% | |||
| $765,000 | Harsco Corp., 5.75%, 5/15/2018 | $682,763 | |
| 800,000 | 1,2 | Hutchison Whampoa International 14 Ltd., Unsecd. Note, Series 144A, 1.625%, 10/31/2017 | 793,978 |
| 1,190,000 | Pentair Ltd., Company Guarantee, 5.00%, 5/15/2021 | 1,242,234 | |
| TOTAL | 2,718,975 | ||
| Communications - Cable & Satellite—2.8% | |||
| 1,090,000 | DIRECTV Holdings LLC, Company Guarantee, 5.00%, 3/1/2021 | 1,177,177 | |
| 1,890,000 | NBC Universal, Inc., Sr. Unsecd. Note, 5.15%, 4/30/2020 | 2,112,319 | |
| 2,000,000 | Time Warner Cable, Inc., Company Guarantee, 5.00%, 2/1/2020 | 2,119,002 | |
| 800,000 | Time Warner Cable, Inc., Sr. Unsecd. Note, 8.375%, 3/15/2023 | 984,479 | |
| TOTAL | 6,392,977 | ||
| Communications - Media & Entertainment—2.6% | |||
| 300,000 | 1,2 | British Sky Broadcasting Group PLC, Series 144A, 3.75%, 9/16/2024 | 293,710 |
| 750,000 | CBS Corp., 3.70%, 8/15/2024 | 731,104 | |
| 420,000 | Grupo Televisa S.A., Sr. Unsecd. Note, 5.00%, 5/13/2045 | 362,954 | |
| 1,679,000 | Interpublic Group of Cos., Inc., Sr. Unsecd. Note, 2.25%, 11/15/2017 | 1,674,688 | |
| 500,000 | McGraw Hill Financial, Inc., Sr. Unsecd. Note, 3.30%, 8/14/2020 | 505,010 | |
| 200,000 | McGraw Hill Financial, Inc., Sr. Unsecd. Note, 4.00%, 6/15/2025 | 200,942 | |
| 595,000 | Omnicom Group, Inc., Sr. Unsecd. Note, 3.625%, 5/1/2022 | 601,666 | |
| 250,000 | Viacom, Inc., 2.50%, 9/1/2018 | 249,565 | |
| 400,000 | Viacom, Inc., Sr. Unsecd. Note, 3.875%, 4/1/2024 | 375,764 | |
| 900,000 | WPP Finance 2010, Sr. Unsecd. Note, 5.125%, 9/7/2042 | 852,097 | |
| TOTAL | 5,847,500 | ||
| Communications - Telecom Wireless—1.8% | |||
| 1,000,000 | American Tower Corp., Sr. Unsecd. Note, 4.50%, 1/15/2018 | 1,043,411 | |
| 2,300,000 | 1,2 | Crown Castle Towers LLC, Sr. Secd. Note, Series 144A, 5.495%, 1/15/2017 | 2,333,750 |
| 720,000 | 1,2 | SBA Tower Trust, Series 144A, 5.101%, 4/17/2017 | 729,742 |
| TOTAL | 4,106,903 | ||
| Communications - Telecom Wirelines—2.5% | |||
| 700,000 | AT&T, Inc., Sr. Unsecd. Note, 2.45%, 6/30/2020 | 690,369 | |
| 900,000 | AT&T, Inc., Sr. Unsecd. Note, 3.40%, 5/15/2025 | 866,806 | |
| 500,000 | CenturyLink, Inc., Sr. Note, Series Q, 6.15%, 9/15/2019 | 512,500 | |
| 730,000 | Telefonica Emisiones SAU, Sr. Unsecd. Note, 3.192%, 4/27/2018 | 744,659 | |
| 250,000 | Telefonica SA, Company Guarantee, 7.045%, 6/20/2036 | 301,378 | |
| 600,000 | Verizon Communications, Inc., Sr. Unsecd. Note, 4.15%, 3/15/2024 | 618,021 | |
| 1,735,000 | Verizon Communications, Inc., Sr. Unsecd. Note, 5.15%, 9/15/2023 | 1,910,587 | |
| TOTAL | 5,644,320 | ||
| Consumer Cyclical - Automotive—3.6% | |||
| 500,000 | American Honda Finance Corp., Sr. Unsecd. Note, Series MTN, 1.50%, 3/13/2018 | 496,524 | |
| 700,000 | 1,2 | Daimler Finance NA LLC, Company Guarantee, Series 144A, 1.875%, 1/11/2018 | 697,451 |
| 500,000 | 1,2 | Daimler Finance NA LLC, Sr. Unsecd. Note, Series 144A, 3.25%, 8/1/2024 | 487,913 |
| 650,000 | Ford Motor Credit Co., Sr. Unsecd. Note, 2.375%, 1/16/2018 | 648,837 | |
| 850,000 | Ford Motor Credit Co., Sr. Unsecd. Note, 3.00%, 6/12/2017 | 858,598 | |
| 670,000 | General Motors Co., Sr. Unsecd. Note, 4.00%, 4/1/2025 | 637,146 | |
| 750,000 | General Motors Financial Company, Inc., Sr. Unsecd. Note, 2.40%, 4/10/2018 | 746,713 | |
| 900,000 | 1,2 | Hyundai Capital America, Sr. Unsecd. Note, Series 144A, 2.875%, 8/9/2018 | 909,912 |
| 1,000,000 | 1,2 | RCI Banque SA, Sr. Unsecd. Note, Series 144A, 3.50%, 4/3/2018 | 1,020,082 |
| 740,000 | 1,2 | RCI Banque SA, Sr. Unsecd. Note, Series 144A, 4.60%, 4/12/2016 | 746,338 |
| 1,000,000 | 1,2 | Volkswagen International Finance NV, Company Guarantee, Series 144A, 2.375%, 3/22/2017 | 996,737 |
| TOTAL | 8,246,251 |
| Principal Amount | Value | ||
| CORPORATE BONDS—continued | |||
| Consumer Cyclical - Leisure—0.5% | |||
| $1,000,000 | 1 | Football Trust V, Pass Thru Cert., Series 144A, 5.35%, 10/5/2020 | $1,092,307 |
| Consumer Cyclical - Lodging—0.2% | |||
| 450,000 | Choice Hotels International, Inc., Company Guarantee, 5.70%, 8/28/2020 | 483,750 | |
| Consumer Cyclical - Retailers—1.0% | |||
| 210,000 | AutoNation, Inc., Sr. Unsecd. Note, 3.35%, 1/15/2021 | 209,509 | |
| 130,000 | AutoNation, Inc., Sr. Unsecd. Note, 4.50%, 10/1/2025 | 132,230 | |
| 600,000 | CVS Health Corp., Sr. Unsecd. Note, 2.80%, 7/20/2020 | 603,574 | |
| 595,000 | CVS Health Corp., Sr. Unsecd. Note, 3.875%, 7/20/2025 | 608,524 | |
| 210,000 | Dollar General Corp., Sr. Unsecd. Note, 4.15%, 11/1/2025 | 209,173 | |
| 450,000 | Wal-Mart Stores, Inc., Sr. Unsecd. Note, 1.125%, 4/11/2018 | 448,305 | |
| TOTAL | 2,211,315 | ||
| Consumer Cyclical - Services—0.8% | |||
| 250,000 | Boston University, Series MTNA, 7.625%, 7/15/2097 | 314,207 | |
| 350,000 | Expedia, Inc., 4.50%, 8/15/2024 | 338,425 | |
| 350,000 | Expedia, Inc., Company Guarantee, 5.95%, 8/15/2020 | 382,418 | |
| 370,000 | University of Southern California, Sr. Unsecd. Note, 5.25%, 10/1/2111 | 419,468 | |
| 280,000 | Visa, Inc., Sr. Unsecd. Note, 3.15%, 12/14/2025 | 280,941 | |
| TOTAL | 1,735,459 | ||
| Consumer Non-Cyclical - Food/Beverage—3.3% | |||
| 900,000 | Coca-Cola Femsa S.A.B de C.V., Sr. Unsecd. Note, 4.625%, 2/15/2020 | 952,270 | |
| 500,000 | 1,2 | Grupo Bimbo SAB de CV, Sr. Unsecd. Note, Series 144A, 3.875%, 6/27/2024 | 487,676 |
| 660,000 | 1,2 | Grupo Bimbo SAB de CV, Sr. Unsecd. Note, Series 144A, 4.50%, 1/25/2022 | 678,110 |
| 475,000 | 1,2 | HJ Heinz Co., Sr. Unsecd. Note, Series 144A, 2.80%, 7/2/2020 | 474,384 |
| 475,000 | 1,2 | HJ Heinz Co., Sr. Unsecd. Note, Series 144A, 3.95%, 7/15/2025 | 480,525 |
| 2,050,000 | 1,2 | Kerry Group Financial Services, Sr. Unsecd. Note, Series 144A, 3.20%, 4/9/2023 | 1,975,575 |
| 600,000 | Mead Johnson Nutrition Co., Sr. Unsecd. Note, 3.00%, 11/15/2020 | 600,762 | |
| 1,000,000 | PepsiCo, Inc., 2.25%, 1/7/2019 | 1,013,996 | |
| 725,000 | Tyson Foods, Inc., Sr. Unsecd. Note, 4.50%, 6/15/2022 | 773,226 | |
| TOTAL | 7,436,524 | ||
| Consumer Non-Cyclical - Health Care—1.6% | |||
| 420,000 | Agilent Technologies, Inc., Sr. Unsecd. Note, 3.20%, 10/1/2022 | 410,326 | |
| 940,000 | Agilent Technologies, Inc., Sr. Unsecd. Note, 3.875%, 7/15/2023 | 942,788 | |
| 890,000 | 1,2 | Bayer US Finance LLC, Unsecd. Note, Series 144A, 2.375%, 10/8/2019 | 891,274 |
| 740,000 | Becton Dickinson & Co., Sr. Unsecd. Note, 3.734%, 12/15/2024 | 748,170 | |
| 500,000 | Zimmer Biomet Holdings, Inc., Sr. Unsecd. Note, 2.70%, 4/1/2020 | 494,386 | |
| 130,000 | Zimmer Biomet Holdings, Inc., Sr. Unsecd. Note, 3.55%, 4/1/2025 | 126,639 | |
| TOTAL | 3,613,583 | ||
| Consumer Non-Cyclical - Pharmaceuticals—1.3% | |||
| 475,000 | AbbVie, Inc., Sr. Unsecd. Note, 2.50%, 5/14/2020 | 470,786 | |
| 300,000 | AbbVie, Inc., Sr. Unsecd. Note, 3.60%, 5/14/2025 | 296,702 | |
| 180,000 | Biogen Idec, Inc., Sr. Unsecd. Note, 2.90%, 9/15/2020 | 179,801 | |
| 210,000 | Biogen Idec, Inc., Sr. Unsecd. Note, 4.05%, 9/15/2025 | 211,501 | |
| 500,000 | Celgene Corp., Sr. Unsecd. Note, 2.875%, 8/15/2020 | 496,957 | |
| 340,000 | Celgene Corp., Sr. Unsecd. Note, 3.875%, 8/15/2025 | 339,594 | |
| 300,000 | Dentsply International, Inc., Sr. Unsecd. Note, 2.75%, 8/15/2016 | 302,264 | |
| 330,000 | Gilead Sciences, Inc., Sr. Unsecd. Note, 3.50%, 2/1/2025 | 333,159 | |
| 420,000 | Gilead Sciences, Inc., Sr. Unsecd. Note, 3.65%, 3/1/2026 | 424,258 | |
| TOTAL | 3,055,022 | ||
| Consumer Non-Cyclical - Supermarkets—0.3% | |||
| 610,000 | Kroger Co., Bond, 6.90%, 4/15/2038 | 756,054 |
| Principal Amount | Value | ||
| CORPORATE BONDS—continued | |||
| Consumer Non-Cyclical - Tobacco—0.6% | |||
| $290,000 | 1,2 | BAT International Finance PLC, Sr. Unsecd. Note, Series 144A, 3.95%, 6/15/2025 | $299,116 |
| 450,000 | Reynolds American, Inc., Sr. Unsecd. Note, 3.25%, 6/12/2020 | 457,853 | |
| 100,000 | Reynolds American, Inc., Sr. Unsecd. Note, 4.45%, 6/12/2025 | 104,839 | |
| 360,000 | Reynolds American, Inc., Sr. Unsecd. Note, Series, 7.00%, 8/4/2041 | 405,886 | |
| TOTAL | 1,267,694 | ||
| Energy - Independent—0.5% | |||
| 600,000 | Anadarko Petroleum Corp., Sr. Unsecd. Note, 3.45%, 7/15/2024 | 534,252 | |
| 232,000 | Apache Corp., Sr. Unsecd. Note, 3.25%, 4/15/2022 | 221,290 | |
| 475,000 | Marathon Oil Corp., Sr. Unsecd. Note, 3.85%, 6/1/2025 | 383,083 | |
| TOTAL | 1,138,625 | ||
| Energy - Integrated—2.5% | |||
| 1,300,000 | BP Capital Markets PLC, 1.375%, 5/10/2018 | 1,281,891 | |
| 1,000,000 | BP Capital Markets PLC, Sr. Unsecd. Note, 3.994%, 9/26/2023 | 1,023,756 | |
| 530,000 | 1,2 | CNPC Hong Kong Overseas Capital Ltd., Company Guarantee, Series 144A, 5.95%, 4/28/2041 | 621,954 |
| 585,000 | Husky Energy, Inc., 4.00%, 4/15/2024 | 536,377 | |
| 1,250,000 | Husky Oil Ltd., Deb., 7.55%, 11/15/2016 | 1,299,423 | |
| 800,000 | Petroleos Mexicanos, Company Guarantee, 5.50%, 1/21/2021 | 808,960 | |
| 175,000 | Petroleos Mexicanos, Sr. Unsecd. Note, 4.875%, 1/18/2024 | 163,625 | |
| TOTAL | 5,735,986 | ||
| Energy - Midstream—2.3% | |||
| 350,000 | 1,2 | Columbia Pipeline Group, Inc., Sr. Unsecd. Note, Series 144A, 3.30%, 6/1/2020 | 341,281 |
| 200,000 | 1,2 | Columbia Pipeline Group, Inc., Sr. Unsecd. Note, Series 144A, 4.50%, 6/1/2025 | 181,615 |
| 300,000 | Energy Transfer Partners LP, Sr. Unsecd. Note, 4.05%, 3/15/2025 | 246,965 | |
| 565,000 | Energy Transfer Partners LP, Sr. Unsecd. Note, 4.90%, 2/1/2024 | 504,580 | |
| 460,000 | Enterprise Products Operating LLC, 3.90%, 2/15/2024 | 430,082 | |
| 280,000 | 1,2 | Florida Gas Transmission Co. LLC, Sr. Unsecd. Note, Series 144A, 5.45%, 7/15/2020 | 297,603 |
| 1,600,000 | Kinder Morgan Energy Partners LP, Sr. Unsecd. Note, 5.30%, 9/15/2020 | 1,585,859 | |
| 540,000 | 1,2 | Texas Eastern Transmission LP, Sr. Unsecd. Note, Series 144A, 2.80%, 10/15/2022 | 480,738 |
| 610,000 | Williams Partners LP, 5.25%, 3/15/2020 | 567,107 | |
| 360,000 | Williams Partners LP, Sr. Unsecd. Note, 3.90%, 1/15/2025 | 271,143 | |
| 380,000 | Williams Partners LP, Sr. Unsecd. Note, 4.125%, 11/15/2020 | 339,656 | |
| TOTAL | 5,246,629 | ||
| Energy - Oil Field Services—0.8% | |||
| 450,000 | Noble Holding International Ltd., Company Guarantee, 4.90%, 8/1/2020 | 342,409 | |
| 300,000 | 1,2 | Schlumberger Holdings Corp., Sr. Unsecd. Note, Series 144A, 3.00%, 12/21/2020 | 296,507 |
| 300,000 | 1,2 | Schlumberger Holdings Corp., Sr. Unsecd. Note, Series 144A, 4.00%, 12/21/2025 | 296,795 |
| 1,000,000 | Weatherford International Ltd., 6.00%, 3/15/2018 | 923,350 | |
| TOTAL | 1,859,061 | ||
| Energy - Refining—0.6% | |||
| 275,000 | Marathon Petroleum Corp., Sr. Unsecd. Note, 3.625%, 9/15/2024 | 256,863 | |
| 225,000 | Phillips 66, Sr. Unsecd. Note, 4.875%, 11/15/2044 | 201,550 | |
| 215,000 | Valero Energy Corp., 7.50%, 4/15/2032 | 236,194 | |
| 635,000 | Valero Energy Corp., Sr. Unsecd. Note, 6.625%, 6/15/2037 | 639,860 | |
| TOTAL | 1,334,467 | ||
| Financial Institution - Banking—21.6% | |||
| 750,000 | American Express Credit Corp., Series MTN, 1.55%, 9/22/2017 | 749,924 | |
| 600,000 | American Express Credit Corp., Sr. Unsecd. Note, Series F, 2.60%, 9/14/2020 | 602,078 | |
| 1,180,000 | Associated Banc-Corp., Sr. Unsecd. Note, 5.125%, 3/28/2016 | 1,186,481 | |
| 450,000 | Associated Banc-Corp., Sub., 4.25%, 1/15/2025 | 451,332 | |
| 500,000 | BB&T Corp., Sr. Unsecd. Note, Series MTN, 2.25%, 2/1/2019 | 502,288 |
| Principal Amount | Value | ||
| CORPORATE BONDS—continued | |||
| Financial Institution - Banking—continued | |||
| $1,000,000 | Bank of America Corp., Series L, 2.65%, 4/1/2019 | $1,002,986 | |
| 500,000 | Bank of America Corp., Series MTN, 3.875%, 8/1/2025 | 508,623 | |
| 1,000,000 | Bank of America Corp., Sr. Unsecd. Note, 2.00%, 1/11/2018 | 999,308 | |
| 825,000 | Bank of America Corp., Sr. Unsecd. Note, 5.75%, 12/1/2017 | 882,990 | |
| 975,000 | Bank of America Corp., Sr. Unsecd. Note, Series MTN, 1.70%, 8/25/2017 | 972,679 | |
| 2,000,000 | Bank of America Corp., Sr. Unsecd. Note, Series MTN, 5.00%, 5/13/2021 | 2,187,934 | |
| 700,000 | Bank of America Corp., Sub. Note, Series L, 3.95%, 4/21/2025 | 683,012 | |
| 600,000 | Bank of Montreal, Sr. Unsecd. Note, Series MTN, 1.45%, 4/9/2018 | 597,300 | |
| 700,000 | Bank of New York Mellon Corp., Sr. Unsecd. Note, Series MTN, 2.30%, 9/11/2019 | 702,663 | |
| 550,000 | Bank of New York Mellon Corp., Sr. Unsecd. Note, Series MTN, 3.25%, 9/11/2024 | 554,540 | |
| 500,000 | Branch Banking & Trust Co., Sub. Note, 3.80%, 10/30/2026 | 508,343 | |
| 700,000 | Capital One Bank, Sr. Unsecd. Note, 2.40%, 9/5/2019 | 693,235 | |
| 620,000 | Capital One Bank, Sr. Unsecd. Note, Series BKNT, 2.15%, 11/21/2018 | 615,094 | |
| 190,000 | Capital One Financial Corp., Sr. Sub., 4.20%, 10/29/2025 | 188,068 | |
| 340,000 | Capital One Financial Corp., Sr. Unsecd. Note, 2.45%, 4/24/2019 | 340,961 | |
| 1,000,000 | Citigroup, Inc., Sr. Note, 5.375%, 8/9/2020 | 1,116,134 | |
| 150,000 | Citigroup, Inc., Sr. Unsecd. Note, 4.50%, 1/14/2022 | 160,895 | |
| 500,000 | Citigroup, Inc., Sub. Note, 4.40%, 6/10/2025 | 506,210 | |
| 910,000 | 1,2 | Citizens Financial Group, Inc., Sub. Note, Series 144A, 4.15%, 9/28/2022 | 914,549 |
| 480,000 | City National Corp., Sr. Unsecd. Note, 5.25%, 9/15/2020 | 534,334 | |
| 1,000,000 | Comerica Bank, Sub. Note, 5.20%, 8/22/2017 | 1,049,409 | |
| 400,000 | Compass Bank, Birmingham, Sr. Unsecd. Note, Series BKNT, 2.75%, 9/29/2019 | 396,486 | |
| 500,000 | Compass Bank, Birmingham, Sub. Note, Series BKNT, 3.875%, 4/10/2025 | 459,526 | |
| 445,000 | Fifth Third Bancorp, Sr. Unsecd. Note, 2.875%, 7/27/2020 | 445,151 | |
| 1,000,000 | Fifth Third Bancorp, Sub., 5.45%, 1/15/2017 | 1,036,937 | |
| 1,000,000 | Goldman Sachs Group, Inc., 2.60%, 4/23/2020 | 998,738 | |
| 1,000,000 | Goldman Sachs Group, Inc., Sr. Unsecd. Note, 3.50%, 1/23/2025 | 985,466 | |
| 500,000 | Goldman Sachs Group, Inc., Sub. Note, 4.25%, 10/21/2025 | 497,475 | |
| 1,840,000 | HSBC USA, Inc., Sr. Unsecd. Note, 1.625%, 1/16/2018 | 1,831,600 | |
| 250,000 | Huntington National Bank, Sr. Unsecd. Note, 1.70%, 2/26/2018 | 247,372 | |
| 600,000 | Huntington National Bank, Sr. Unsecd. Note, 2.20%, 4/1/2019 | 596,078 | |
| 250,000 | JPMorgan Chase & Co., Sr. Unsecd. Note, 2.35%, 1/28/2019 | 251,176 | |
| 500,000 | JPMorgan Chase & Co., Sr. Unsecd. Note, 4.25%, 10/15/2020 | 530,996 | |
| 1,000,000 | JPMorgan Chase & Co., Sr. Unsecd. Note, 4.50%, 1/24/2022 | 1,079,476 | |
| 2,000,000 | JPMorgan Chase & Co., Sub. Note, 3.375%, 5/1/2023 | 1,969,902 | |
| 500,000 | JPMorgan Chase & Co., Sub., 3.875%, 9/10/2024 | 498,536 | |
| 260,000 | MUFG Americas Holdings Corp., Sr. Unsecd. Note, 3.00%, 2/10/2025 | 249,544 | |
| 410,000 | MUFG Union Bank, N.A., Sr. Unsecd. Note, 2.25%, 5/6/2019 | 409,549 | |
| 250,000 | MUFG Union Bank, N.A., Sr. Unsecd. Note, 2.625%, 9/26/2018 | 252,552 | |
| 2,440,000 | Manufacturers & Traders Trust Co., Sub. Note, Series BKNT, 5.629%, 12/1/2021 | 2,410,842 | |
| 350,000 | Morgan Stanley, Sr. Unsecd. Note, 4.75%, 3/22/2017 | 362,638 | |
| 970,000 | Morgan Stanley, Sr. Unsecd. Note, 5.75%, 1/25/2021 | 1,090,797 | |
| 500,000 | Morgan Stanley, Sr. Unsecd. Note, Series GMTN, 5.50%, 7/24/2020 | 556,928 | |
| 2,010,000 | Morgan Stanley, Sr. Unsecd. Note, Series GMTN, 6.625%, 4/1/2018 | 2,205,400 | |
| 250,000 | Morgan Stanley, Sub. Note, 5.00%, 11/24/2025 | 266,061 | |
| 1,000,000 | Morgan Stanley, Sub. Note, Series MTN, 4.10%, 5/22/2023 | 1,012,532 | |
| 2,110,000 | Murray Street Investment Trust I, Sr. Unsecd. Note, 4.647%, 3/9/2017 | 2,174,621 | |
| 400,000 | PNC Funding Corp., Sub. Note, 5.625%, 2/1/2017 | 415,980 | |
| 1,500,000 | 1,2 | PNC Preferred Funding LLC, Jr. Sub. Note, Series 144A, 2.162%, 3/29/2049 | 1,338,750 |
| 700,000 | State Street Corp., Sr. Unsecd. Note, 3.30%, 12/16/2024 | 707,711 |
| Principal Amount | Value | ||
| CORPORATE BONDS—continued | |||
| Financial Institution - Banking—continued | |||
| $530,000 | SunTrust Banks, Inc., Sr. Unsecd. Note, 2.50%, 5/1/2019 | $533,112 | |
| 500,000 | Wells Fargo & Co., Series MTN, 3.50%, 3/8/2022 | 515,905 | |
| 1,175,000 | Westpac Banking Corp., Sr. Unsecd. Note, 4.875%, 11/19/2019 | 1,280,985 | |
| 1,900,000 | Wilmington Trust Corp., Sub. Note, 8.50%, 4/2/2018 | 2,141,410 | |
| TOTAL | 48,961,602 | ||
| Financial Institution - Broker/Asset Mgr/Exchange—2.2% | |||
| 170,000 | 1,2 | Cantor Fitzgerald LP, Bond, Series 144A, 7.875%, 10/15/2019 | 186,950 |
| 370,000 | Eaton Vance Corp., Sr. Unsecd. Note, 3.625%, 6/15/2023 | 373,870 | |
| 96,000 | Eaton Vance Corp., Sr. Unsecd. Note, 6.50%, 10/2/2017 | 102,533 | |
| 350,000 | Franklin Resources, Inc., Sr. Unsecd. Note, 4.625%, 5/20/2020 | 378,602 | |
| 220,000 | Invesco Finance PLC, Sr. Unsecd. Note, 3.75%, 1/15/2026 | 221,966 | |
| 400,000 | Jefferies Group LLC, Sr. Unsecd. Note, 6.50%, 1/20/2043 | 370,935 | |
| 835,000 | Jefferies Group LLC, Sr. Unsecd. Note, 6.875%, 4/15/2021 | 936,605 | |
| 90,000 | Raymond James Financial, Inc., Sr. Unsecd. Note, 4.25%, 4/15/2016 | 90,690 | |
| 193,000 | Raymond James Financial, Inc., Sr. Unsecd. Note, 5.625%, 4/1/2024 | 214,109 | |
| 240,000 | Raymond James Financial, Inc., Sr. Unsecd. Note, 8.60%, 8/15/2019 | 286,719 | |
| 640,000 | Stifel Financial Corp., 4.25%, 7/18/2024 | 637,132 | |
| 190,000 | Stifel Financial Corp., Sr. Unsecd. Note, 3.50%, 12/1/2020 | 188,101 | |
| 500,000 | TD Ameritrade Holding Corp., Sr. Unsecd. Note, 3.625%, 4/1/2025 | 506,970 | |
| 450,000 | 1,2 | TIAA Asset Management Finance Co. LLC, Sr. Unsecd. Note, Series 144A, 2.95%, 11/1/2019 | 451,491 |
| TOTAL | 4,946,673 | ||
| Financial Institution - Finance Companies—3.5% | |||
| 1,560,000 | Discover Bank, Sr. Unsecd. Note, 2.00%, 2/21/2018 | 1,550,492 | |
| 463,000 | Discover Bank, Sub., Series BKNT, 8.70%, 11/18/2019 | 548,387 | |
| 487,000 | Discover Financial Services, Sr. Unsecd. Note, 3.85%, 11/21/2022 | 483,657 | |
| 1,216,000 | 1,2 | GE Capital International Funding Co., Sr. Unsecd. Note, Series 144A, 2.342%, 11/15/2020 | 1,207,917 |
| 430,000 | General Electric Capital Corp., Sr. Unsecd. Note, Series GMTN, 4.625%, 1/7/2021 | 472,636 | |
| 1,300,000 | HSBC Finance Corp., Sr. Sub. Note, 6.676%, 1/15/2021 | 1,493,699 | |
| 1,000,000 | 1,2 | Lukoil International Finance BV, Series 144A, 6.356%, 6/7/2017 | 1,041,810 |
| 960,000 | 1,2 | Macquarie Group Ltd., Sr. Unsecd. Note, Series 144A, 6.00%, 1/14/2020 | 1,060,875 |
| TOTAL | 7,859,473 | ||
| Financial Institution - Insurance - Health—0.3% | |||
| 250,000 | UnitedHealth Group, Inc., Sr. Unsecd. Note, 2.70%, 7/15/2020 | 252,878 | |
| 405,000 | UnitedHealth Group, Inc., Sr. Unsecd. Note, 3.75%, 7/15/2025 | 418,388 | |
| TOTAL | 671,266 | ||
| Financial Institution - Insurance - Life—4.0% | |||
| 580,000 | Aflac, Inc., Sr. Unsecd. Note, 6.90%, 12/17/2039 | 750,890 | |
| 800,000 | American International Group, Inc., Sr. Unsecd. Note, 4.125%, 2/15/2024 | 823,586 | |
| 500,000 | Lincoln National Corp., Sr. Secd. Note, 8.75%, 7/1/2019 | 601,155 | |
| 290,000 | Lincoln National Corp., Sr. Unsecd. Note, 4.20%, 3/15/2022 | 303,649 | |
| 1,270,000 | 1,2 | Massachusetts Mutual Life Insurance Co., Sub. Note, Series 144A, 8.875%, 6/1/2039 | 1,847,525 |
| 1,300,000 | MetLife, Inc., Sr. Unsecd. Note, 4.75%, 2/8/2021 | 1,423,965 | |
| 500,000 | 1,2 | New York Life Global Funding, Series 144A, 1.45%, 12/15/2017 | 499,040 |
| 350,000 | 1,2 | Penn Mutual Life Insurance Co., Sr. Note, Series 144A, 7.625%, 6/15/2040 | 462,891 |
| 310,000 | Principal Financial Group, Inc., Sr. Unsecd. Note, 3.30%, 9/15/2022 | 309,900 | |
| 235,000 | 1,2 | Principal Life Global Funding II, Series 144A, 2.20%, 4/8/2020 | 233,167 |
| 400,000 | Prudential Financial, Inc., Sr. Unsecd. Note, Series MTN, 4.60%, 5/15/2044 | 399,552 | |
| 1,000,000 | Prudential Financial, Inc., Sr. Unsecd. Note, Series MTN, 6.10%, 6/15/2017 | 1,059,821 | |
| 250,000 | 1 | Union Central Life Insurance Co., Note, Series 144A, 8.20%, 11/1/2026 | 328,249 |
| TOTAL | 9,043,390 |
| Principal Amount | Value | ||
| CORPORATE BONDS—continued | |||
| Financial Institution - Insurance - P&C—2.1% | |||
| $250,000 | ACE INA Holdings, Inc., 2.30%, 11/3/2020 | $248,484 | |
| 200,000 | ACE INA Holdings, Inc., 3.35%, 5/3/2026 | 199,683 | |
| 300,000 | ACE INA Holdings, Inc., Sr. Unsecd. Note, 3.35%, 5/15/2024 | 303,331 | |
| 330,000 | CNA Financial Corp., 6.50%, 8/15/2016 | 339,845 | |
| 680,000 | CNA Financial Corp., Sr. Unsecd. Note, 5.875%, 8/15/2020 | 754,580 | |
| 500,000 | 1,2 | Liberty Mutual Group, Inc., Series 144A, 4.85%, 8/1/2044 | 464,867 |
| 1,000,000 | 1,2 | Nationwide Mutual Insurance Co., Sub. Note, Series 144A, 9.375%, 8/15/2039 | 1,459,851 |
| 1,050,000 | 1,2 | ZFS Finance USA Trust II, Jr. Sub. Note, Series 144A, 6.45%, 12/15/2065 | 1,066,275 |
| TOTAL | 4,836,916 | ||
| Financial Institution - REIT - Apartment—0.6% | |||
| 650,000 | Mid-America Apartment Communities LP, Sr. Unsecd. Note, 3.75%, 6/15/2024 | 638,158 | |
| 550,000 | Post Apartment Homes LP, Sr. Unsecd. Note, 3.375%, 12/1/2022 | 534,266 | |
| 300,000 | UDR, Inc., Company Guarantee, 4.625%, 1/10/2022 | 320,265 | |
| TOTAL | 1,492,689 | ||
| Financial Institution - REIT - Healthcare—0.7% | |||
| 960,000 | Health Care REIT, Inc., Sr. Unsecd. Note, 6.125%, 4/15/2020 | 1,076,353 | |
| 500,000 | Healthcare Trust of America, 3.70%, 4/15/2023 | 485,649 | |
| TOTAL | 1,562,002 | ||
| Financial Institution - REIT - Office—1.1% | |||
| 500,000 | Alexandria Real Estate Equities, Inc., 2.75%, 1/15/2020 | 492,150 | |
| 450,000 | Alexandria Real Estate Equities, Inc., Sr. Unsecd. Note, 4.60%, 4/1/2022 | 467,717 | |
| 680,000 | Boston Properties LP, Sr. Unsecd. Note, 3.80%, 2/1/2024 | 692,921 | |
| 200,000 | Boston Properties LP, Sr. Unsecd. Note, 5.875%, 10/15/2019 | 222,216 | |
| 700,000 | HRPT Properties Trust, Sr. Unsecd. Note, 6.25%, 6/15/2017 | 723,151 | |
| TOTAL | 2,598,155 | ||
| Financial Institution - REIT - Other—1.0% | |||
| 695,000 | Host Hotels & Resorts LP, Sr. Unsecd. Note, Series E, 4.00%, 6/15/2025 | 667,768 | |
| 750,000 | ProLogis LP, Sr. Unsecd. Note, 3.35%, 2/1/2021 | 760,385 | |
| 300,000 | ProLogis LP, Sr. Unsecd. Note, 4.25%, 8/15/2023 | 316,190 | |
| 450,000 | WP Carey, Inc., Sr. Unsecd. Note, 4.60%, 4/1/2024 | 449,669 | |
| TOTAL | 2,194,012 | ||
| Financial Institution - REIT - Retail—1.1% | |||
| 890,000 | Equity One, Inc., Bond, 6.00%, 9/15/2017 | 942,293 | |
| 450,000 | Equity One, Inc., Sr. Unsecd. Note, 3.75%, 11/15/2022 | 435,219 | |
| 100,000 | Kimco Realty Corp., Sr. Unsecd. Note, 3.40%, 11/1/2022 | 99,264 | |
| 921,000 | Regency Centers LP, Company Guarantee, 4.80%, 4/15/2021 | 991,246 | |
| TOTAL | 2,468,022 | ||
| Municipal Services—1.3% | |||
| 890,000 | 1,2 | Army Hawaii Family Housing, Series 144A, 5.524%, 6/15/2050 | 979,953 |
| 1,775,000 | 1,2 | Camp Pendleton & Quantico Housing LLC, Series 144A, 5.572%, 10/1/2050 | 1,925,147 |
| TOTAL | 2,905,100 | ||
| Sovereign—1.2% | |||
| 225,000 | Colombia, Government of, Sr. Unsecd. Note, 4.375%, 7/12/2021 | 226,125 | |
| 560,000 | Corp Andina De Fomento, Sr. Unsecd. Note, 3.75%, 1/15/2016 | 560,454 | |
| 320,000 | Corp Andina De Fomento, Sr. Unsecd. Note, 4.375%, 6/15/2022 | 341,472 | |
| 510,000 | Inter-American Development Bank, Series MTN, 6.75%, 7/15/2027 | 704,641 | |
| 900,000 | 1,2 | Qatar, Government of, Series 144A, 5.25%, 1/20/2020 | 994,275 |
| TOTAL | 2,826,967 | ||
| Technology—4.9% | |||
| 500,000 | Adobe Systems, Inc., Sr. Unsecd. Note, 3.25%, 2/1/2025 | 489,189 |
| Principal Amount | Value | ||
| CORPORATE BONDS—continued | |||
| Technology—continued | |||
| $400,000 | Apple, Inc., Sr. Unsecd. Note, 1.00%, 5/3/2018 | $396,995 | |
| 250,000 | Apple, Inc., Sr. Unsecd. Note, 2.40%, 5/3/2023 | 243,978 | |
| 400,000 | Apple, Inc., Sr. Unsecd. Note, 3.20%, 5/13/2025 | 405,572 | |
| 125,000 | Apple, Inc., Sr. Unsecd. Note, 4.45%, 5/6/2044 | 126,433 | |
| 600,000 | Autodesk, Inc., Sr. Unsecd. Note, 3.125%, 6/15/2020 | 596,983 | |
| 340,000 | Automatic Data Processing, Inc., 3.375%, 9/15/2025 | 347,317 | |
| 1,200,000 | BMC Software, Inc., 7.25%, 6/1/2018 | 994,500 | |
| 430,000 | Corning, Inc., Unsecd. Note, 4.75%, 3/15/2042 | 405,093 | |
| 915,000 | Fidelity National Information Services, Inc., Sr. Unsecd. Note, 3.50%, 4/15/2023 | 875,102 | |
| 305,000 | Fidelity National Information Services, Inc., Sr. Unsecd. Note, 3.875%, 6/5/2024 | 295,045 | |
| 130,000 | 1,2 | Flextronics International Ltd., Sr. Unsecd. Note, Series 144A, 4.75%, 6/15/2025 | 126,913 |
| 300,000 | 1,2 | Hewlett Packard Enterprise Co., Sr. Unsecd. Note, Series 144A, 2.85%, 10/5/2018 | 300,088 |
| 300,000 | 1,2 | Hewlett Packard Enterprise Co., Sr. Unsecd. Note, Series 144A, 3.60%, 10/15/2020 | 301,043 |
| 670,000 | Ingram Micro, Inc., Sr. Unsecd. Note, 5.00%, 8/10/2022 | 676,994 | |
| 250,000 | Intel Corp., Sr. Unsecd. Note, 2.45%, 7/29/2020 | 253,131 | |
| 500,000 | Intel Corp., Sr. Unsecd. Note, 3.70%, 7/29/2025 | 517,873 | |
| 460,000 | Keysight Technologies, Inc., 4.55%, 10/30/2024 | 443,048 | |
| 300,000 | 1,2 | Molex Electronics Technologies LLC, Sr. Unsecd. Note, Series 144A, 2.878%, 4/15/2020 | 292,593 |
| 190,000 | 1,2 | Molex Electronics Technologies LLC, Unsecd. Note, Series 144A, 3.90%, 4/15/2025 | 178,228 |
| 750,000 | Oracle Corp., Sr. Unsecd. Note, 2.80%, 7/8/2021 | 760,320 | |
| 750,000 | Oracle Corp., Sr. Unsecd. Note, 3.40%, 7/8/2024 | 762,814 | |
| 285,000 | SAIC, Inc., Company Guarantee, 5.95%, 12/1/2040 | 268,059 | |
| 195,000 | Verisk Analytics, Inc., Sr. Unsecd. Note, 4.125%, 9/12/2022 | 196,867 | |
| 670,000 | Verisk Analytics, Inc., Sr. Unsecd. Note, 4.875%, 1/15/2019 | 701,501 | |
| 250,000 | Verisk Analytics, Inc., Unsecd. Note, 4.00%, 6/15/2025 | 243,337 | |
| TOTAL | 11,199,016 | ||
| Transportation - Airlines—0.1% | |||
| 158,222 | Continental Airlines, Inc., Equip. Trust, Series 991A, 6.545%, 2/2/2019 | 168,499 | |
| Transportation - Railroads—1.3% | |||
| 82,299 | Burlington Northern Santa Fe Corp., Pass Thru Cert., Series 99-2, 7.57%, 1/2/2021 | 90,902 | |
| 1,100,000 | Burlington Northern Santa Fe Corp., Sr. Unsecd. Note, 3.45%, 9/15/2021 | 1,126,294 | |
| 1,250,000 | 1,2 | Kansas City Southern Industries, Inc., Sr. Unsecd. Note, Series 144A, 3.00%, 5/15/2023 | 1,185,023 |
| 300,000 | Union Pacific Corp., Sr. Unsecd. Note, 3.646%, 2/15/2024 | 313,613 | |
| 150,000 | Union Pacific Corp., Sr. Unsecd. Note, 3.75%, 3/15/2024 | 157,542 | |
| TOTAL | 2,873,374 | ||
| Transportation - Services—1.9% | |||
| 995,000 | 1,2 | Enterprise Rent-A-Car USA Finance Co., Series 144A, 6.375%, 10/15/2017 | 1,069,001 |
| 530,000 | 1,2 | Enterprise Rent-A-Car USA Finance Co., Sr. Unsecd. Note, Series 144A, 5.625%, 3/15/2042 | 570,874 |
| 1,120,000 | 1,2 | Penske Truck Leasing Co. LP & PTL Finance Corp., Series 144A, 3.75%, 5/11/2017 | 1,142,963 |
| 500,000 | 1,2 | Penske Truck Leasing Co. LP & PTL Finance Corp., Sr. Unsecd. Note, Series 144A, 3.375%, 2/1/2022 | 486,184 |
| 425,000 | Ryder System, Inc., Sr. Unsecd. Note, Series MTN, 2.45%, 11/15/2018 | 424,975 | |
| 625,000 | Ryder System, Inc., Sr. Unsecd. Note, Series MTN, 3.50%, 6/1/2017 | 638,743 | |
| TOTAL | 4,332,740 | ||
| Utility - Electric—5.6% | |||
| 310,000 | 1,2 | AEP Texas Central Co., Sr. Unsecd. Note, Series 144A, 3.85%, 10/1/2025 | 314,136 |
| 420,000 | Ameren Corp., Sr. Unsecd. Note, 2.70%, 11/15/2020 | 419,032 | |
| 880,000 | American Electric Power Co., Inc., Sr. Unsecd. Note, Series F, 2.95%, 12/15/2022 | 871,102 | |
| 1,000,000 | Berkshire Hathaway Energy Co., 3.50%, 2/1/2025 | 993,637 | |
| 1,126,156 | Bruce Mansfield Unit 1 2, Pass Thru Cert., 6.85%, 6/1/2034 | 1,132,643 | |
| 1,000,000 | 1,2 | Electricite de France SA, Jr. Sub. Note, Series 144A, 5.625%, 12/29/2049 | 954,750 |
| Principal Amount | Value | ||
| CORPORATE BONDS—continued | |||
| Utility - Electric—continued | |||
| $975,000 | Entergy Louisiana LLC, 1st Mtg. Bond, 5.40%, 11/1/2024 | $1,115,282 | |
| 550,000 | Exelon Generation Co. LLC, Sr. Unsecd. Note, 4.25%, 6/15/2022 | 558,034 | |
| 500,000 | Exelon Generation Co. LLC, Sr. Unsecd. Note, 5.75%, 10/1/2041 | 484,850 | |
| 220,000 | FirstEnergy Solutions Corp., Company Guarantee, 6.05%, 8/15/2021 | 235,067 | |
| 235,000 | Great Plains Energy, Inc., Note, 4.85%, 6/1/2021 | 252,800 | |
| 438,098 | 1,2 | Great River Energy, 1st Mtg. Note, Series 144A, 5.829%, 7/1/2017 | 448,904 |
| 900,000 | NextEra Energy Capital Holdings, Inc., Sr. Unsecd. Note, 2.40%, 9/15/2019 | 887,783 | |
| 366,000 | NextEra Energy Capital Holdings, Inc., Sr. Unsecd. Note, 2.70%, 9/15/2019 | 364,704 | |
| 500,000 | Northeast Utilities, Sr. Unsecd. Note, 1.60%, 1/15/2018 | 495,011 | |
| 1,090,000 | PPL Capital Funding, Inc., Sr. Unsecd. Note, 4.20%, 6/15/2022 | 1,136,322 | |
| 425,000 | PSEG Power LLC, Sr. Unsecd. Note, 4.15%, 9/15/2021 | 432,856 | |
| 230,000 | TECO Finance, Inc., Company Guarantee, 5.15%, 3/15/2020 | 247,255 | |
| 800,000 | UIL Holdings Corp., Sr. Unsecd. Note, 4.625%, 10/1/2020 | 843,368 | |
| 66,915 | Waterford 3 Funding Corp., 8.09%, 1/2/2017 | 66,772 | |
| 450,000 | Wisconsin Energy Corp., Sr. Unsecd. Note, 3.55%, 6/15/2025 | 453,488 | |
| TOTAL | 12,707,796 | ||
| Utility - Natural Gas—1.3% | |||
| 1,000,000 | Enbridge Energy Partners LP, Sr. Unsecd. Note, 4.20%, 9/15/2021 | 954,961 | |
| 1,600,000 | National Fuel Gas Co., Sr. Unsecd. Note, 3.75%, 3/1/2023 | 1,484,265 | |
| 200,000 | Sempra Energy, Sr. Unsecd. Note, 3.55%, 6/15/2024 | 199,274 | |
| 300,000 | 1,2 | Southeast Supply Header LLC, Sr. Unsecd. Note, Series 144A, 4.25%, 6/15/2024 | 288,390 |
| TOTAL | 2,926,890 | ||
| TOTAL CORPORATE BONDS (IDENTIFIED COST $217,755,045) | 219,305,827 | ||
| MORTGAGE-BACKED SECURITIES—0.1% | |||
| Federal Home Loan Mortgage Corporation—0.0% | |||
| 1,410 | Federal Home Loan Mortgage Corp., Pool C01051, 8.00%, 9/1/2030 | 1,688 | |
| Federal National Mortgage Association—0.0% | |||
| 77 | Federal National Mortgage Association, Pool 50276, 9.50%, 2/1/2020 | 85 | |
| Government National Mortgage Association—0.1% | |||
| 3,408 | Government National Mortgage Association, Pool 1512, 7.50%, 12/20/2023 | 3,900 | |
| 4,602 | Government National Mortgage Association, Pool 2630, 6.50%, 8/20/2028 | 5,281 | |
| 5,898 | Government National Mortgage Association, Pool 2631, 7.00%, 8/20/2028 | 6,864 | |
| 8,946 | Government National Mortgage Association, Pool 2658, 6.50%, 10/20/2028 | 10,271 | |
| 12,879 | Government National Mortgage Association, Pool 2701, 6.50%, 1/20/2029 | 14,791 | |
| 803 | Government National Mortgage Association, Pool 276337, 10.00%, 8/15/2019 | 894 | |
| 9,169 | Government National Mortgage Association, Pool 2796, 7.00%, 8/20/2029 | 10,695 | |
| 2,361 | Government National Mortgage Association, Pool 3039, 6.50%, 2/20/2031 | 2,723 | |
| 5,650 | Government National Mortgage Association, Pool 3040, 7.00%, 2/20/2031 | 6,605 | |
| 19,134 | Government National Mortgage Association, Pool 3188, 6.50%, 1/20/2032 | 22,059 | |
| 15,546 | Government National Mortgage Association, Pool 3239, 6.50%, 5/20/2032 | 17,957 | |
| 31,938 | Government National Mortgage Association, Pool 3261, 6.50%, 7/20/2032 | 36,906 | |
| 1,527 | Government National Mortgage Association, Pool 493514, 8.00%, 9/15/2030 | 1,762 | |
| 5,634 | Government National Mortgage Association, Pool 516688, 8.00%, 8/15/2029 | 6,788 | |
| TOTAL | 147,496 | ||
| TOTAL MORTGAGE-BACKED SECURITIES (IDENTIFIED COST $129,119) | 149,269 | ||
| MUNICIPAL BOND—0.1% | |||
| Municipal Services—0.1% | |||
| 410,000 | Chicago, IL, Taxable Project and Refunding Series 2012B GO Bonds, 5.432%, 1/1/2042 (IDENTIFIED COST $410,000) | 347,200 |
| Principal Amount | Value | ||
| COLLATERALIZED MORTGAGE OBLIGATION—0.3% | |||
| Commercial Mortgage—0.3% | |||
| $732,638 | TIAA Seasoned Commercial Mortgage Trust 2007-C4, Class AJ, 5.510%, 8/15/2039 (IDENTIFIED COST $726,933) | $732,596 | |
| REPURCHASE AGREEMENT—1.7% | |||
| 3,818,000 | Interest in $600,000,000 joint repurchase agreement 0.32%, dated 12/31/2015 under which Bank of America, N.A. will repurchase securities provided as collateral for $600,021,333 on 1/4/2016. The securities provided as collateral at the end of the period held with BNY Mellon as tri-party agent, were U.S. Government Agency securities maturing on 2/25/2044 and the market value of those underlying securities was $618,021,974. (AT COST) | 3,818,000 | |
| TOTAL INVESTMENTS—98.8% (IDENTIFIED COST $222,839,097)3 | 224,352,892 | ||
| OTHER ASSETS AND LIABILITIES - NET—1.2%4 | 2,613,392 | ||
| TOTAL NET ASSETS—100% | $226,966,284 |
| Description | Number of Contracts | Notional Value | Expiration Date | Unrealized Appreciation (Depreciation) |
| 5U.S. Treasury Note 10-Year Long Futures | 185 | $23,292,656 | March 2016 | $(22,661) |
| 5U.S. Treasury Long Bond Short Futures | 94 | $14,452,500 | March 2016 | $(64,727) |
| 5U.S. Treasury Ultra Bond Short Futures | 38 | $6,030,125 | March 2016 | $(76,094) |
| 5U.S. Treasury Note 2-Year Short Futures | 75 | $16,292,578 | March 2016 | $9,206 |
| NET UNREALIZED DEPRECIATION ON FUTURES CONTRACTS | $(154,276) | |||
| 1 | Denotes a restricted security that either: (a) cannot be offered for public sale without first being registered, or being able to take advantage of an exemption from registration, under the Securities Act of 1933; or (b) is subject to a contractual restriction on public sales. At December 31, 2015, these restricted securities amounted to $47,762,092, which represented 21.0% of total net assets. |
| 2 | Denotes a restricted security that may be resold without restriction to “qualified institutional buyers” as defined in Rule 144A under the Securities Act of 1933 and that the Fund has determined to be liquid under criteria established by the Fund's Board of Trustees (the “Trustees”). At December 31, 2015, these liquid restricted securities amounted to $46,341,536, which represented 20.4% of total net assets. |
| 3 | The cost of investments for federal tax purposes amounts to $222,839,326. |
| 4 | Assets, other than investments in securities, less liabilities. See Statement of Assets and Liabilities. |
| 5 | Non-income-producing security. |
| Valuation Inputs | ||||
| Level 1— Quoted Prices | Level 2— Other Significant Observable Inputs | Level 3— Significant Unobservable Inputs | Total | |
| Debt Securities: | ||||
| Corporate Bonds | $— | $219,305,827 | $— | $219,305,827 |
| Mortgage-Backed Securities | — | 149,269 | — | 149,269 |
| Municipal Bond | — | 347,200 | — | 347,200 |
| Collateralized Mortgage Obligation | — | 732,596 | — | 732,596 |
| Repurchase Agreement | — | 3,818,000 | — | 3,818,000 |
| TOTAL SECURITIES | $— | $224,352,892 | $— | $224,352,892 |
| Other Financial Instruments* | ||||
| Assets | $9,206 | $— | $— | $9,206 |
| Liabilities | (163,482) | — | — | (163,482) |
| TOTAL OTHER FINANCIAL INSTRUMENTS* | $(154,276) | $— | $— | $(154,276) |
| * | Other financial instruments include futures contracts. |
| GO | —General Obligation |
| MTN | —Medium Term Note |
| REIT | —Real Estate Investment Trust |
| Year Ended December 31 | 2015 | 2014 | 2013 | 2012 | 2011 |
| Net Asset Value, Beginning of Period | $11.42 | $11.43 | $11.80 | $11.21 | $11.55 |
| Income From Investment Operations: | |||||
| Net investment income1 | 0.37 | 0.40 | 0.41 | 0.44 | 0.50 |
| Net realized and unrealized gain (loss) on investments and futures contracts | (0.39) | 0.03 | (0.29) | 0.62 | (0.24) |
| TOTAL FROM INVESTMENT OPERATIONS | (0.02) | 0.43 | 0.12 | 1.06 | 0.26 |
| Less Distributions: | |||||
| Distributions from net investment income | (0.43) | (0.44) | (0.49) | (0.47) | (0.60) |
| Net Asset Value, End of Period | $10.97 | $11.42 | $11.43 | $11.80 | $11.21 |
| Total Return2 | (0.24)% | 3.79% | 1.04% | 9.72% | 2.27% |
| Ratios to Average Net Assets: | |||||
| Net expenses3 | 0.73% | 0.73% | 0.73% | 0.73% | 0.70% |
| Net investment income | 3.30% | 3.53% | 3.55% | 3.86% | 4.44% |
| Expense waiver/reimbursement | 0.05% | 0.04% | 0.06% | 0.03% | 0.06% |
| Supplemental Data: | |||||
| Net assets, end of period (000 omitted) | $198,990 | $220,355 | $230,647 | $255,527 | $265,952 |
| Portfolio turnover | 17% | 18% | 23% | 37% | 35% |
| 1 | Per share numbers have been calculated using the average shares method. |
| 2 | Based on net asset value. Total returns do not reflect any additional fees or expenses that may be imposed by separate accounts of insurance companies or in connection with any variable annuity or variable life insurance contract. |
| 3 | This expense decrease is reflected in both the net expense and the net investment income ratios shown above. |
| Year Ended December 31 | 2015 | 2014 | 2013 | 2012 | 2011 |
| Net Asset Value, Beginning of Period | $11.37 | $11.38 | $11.75 | $11.16 | $11.50 |
| Income From Investment Operations: | |||||
| Net investment income1 | 0.34 | 0.38 | 0.38 | 0.41 | 0.48 |
| Net realized and unrealized gain (loss) on investments and futures contracts | (0.38) | 0.01 | (0.29) | 0.62 | (0.25) |
| TOTAL FROM INVESTMENT OPERATIONS | (0.04) | 0.39 | 0.09 | 1.03 | 0.23 |
| Less Distributions: | |||||
| Distributions from net investment income | (0.40) | (0.40) | (0.46) | (0.44) | (0.57) |
| Net Asset Value, End of Period | $10.93 | $11.37 | $11.38 | $11.75 | $11.16 |
| Total Return2 | (0.44)% | 3.51% | 0.75% | 9.45% | 1.99% |
| Ratios to Average Net Assets: | |||||
| Net expenses | 0.98% | 0.98% | 0.98% | 0.98% | 0.95% |
| Net investment income | 3.04% | 3.29% | 3.29% | 3.62% | 4.21% |
| Expense waiver/reimbursement3 | 0.05% | 0.04% | 0.06% | 0.03% | 0.06% |
| Supplemental Data: | |||||
| Net assets, end of period (000 omitted) | $27,977 | $33,857 | $38,536 | $47,074 | $52,191 |
| Portfolio turnover | 17% | 18% | 23% | 37% | 35% |
| 1 | Per share numbers have been calculated using the average shares method. |
| 2 | Based on net asset value. Total returns do not reflect any additional fees or expenses that may be imposed by separate accounts of insurance companies or in connection with any variable annuity or variable life insurance contract. |
| 3 | This expense decrease is reflected in both the net expense and the net investment income ratios shown above. |
| Assets: | ||
| Total investment in securities, at value (identified cost $222,839,097) | $224,352,892 | |
| Cash | 553 | |
| Restricted cash (Note 2) | 377,625 | |
| Income receivable | 2,409,673 | |
| Receivable for shares sold | 24,483 | |
| TOTAL ASSETS | 227,165,226 | |
| Liabilities: | ||
| Payable for shares redeemed | $93,980 | |
| Payable for daily variation margin on futures contracts | 33,595 | |
| Payable to adviser (Note 5) | 2,975 | |
| Payable for auditing fees | 24,190 | |
| Payable for portfolio accounting fees | 26,885 | |
| Payable for transfer agent fee | 4,576 | |
| Payable for distribution services fee (Note 5) | 6,022 | |
| Accrued expenses (Note 5) | 6,719 | |
| TOTAL LIABILITIES | 198,942 | |
| Net assets for 20,703,176 shares outstanding | $226,966,284 | |
| Net Assets Consist of: | ||
| Paid-in capital | $219,704,171 | |
| Net unrealized appreciation of investments and futures contracts | 1,359,519 | |
| Accumulated net realized loss on investments and futures contracts | (2,040,171) | |
| Undistributed net investment income | 7,942,765 | |
| TOTAL NET ASSETS | $226,966,284 | |
| Net Asset Value, Offering Price and Redemption Proceeds Per Share | ||
| Primary Shares: | ||
| $198,989,734 ÷ 18,143,077 shares outstanding, no par value, unlimited shares authorized | $10.97 | |
| Service Shares: | ||
| $27,976,550 ÷ 2,560,099 shares outstanding, no par value, unlimited shares authorized | $10.93 |
| Investment Income: | ||
| Interest | $9,812,092 | |
| Expenses: | ||
| Investment adviser fee (Note 5) | $1,460,719 | |
| Administrative fee (Note 5) | 190,502 | |
| Custodian fees | 13,691 | |
| Transfer agent fee | 24,483 | |
| Directors'/Trustees' fees (Note 5) | 2,564 | |
| Auditing fees | 25,190 | |
| Legal fees | 8,894 | |
| Portfolio accounting fees | 109,931 | |
| Distribution services fee (Note 5) | 78,311 | |
| Printing and postage | 70,115 | |
| Miscellaneous (Note 5) | 9,721 | |
| TOTAL EXPENSES | 1,994,121 | |
| Waiver of investment adviser fee (Note 5) | (126,673) | |
| Net expenses | 1,867,448 | |
| Net investment income | 7,944,644 | |
| Realized and Unrealized Gain (Loss) on Investments and Futures Contracts: | ||
| Net realized gain on investments | 2,373,930 | |
| Net realized loss on futures contracts | (712,079) | |
| Net change in unrealized appreciation of investments | (10,937,762) | |
| Net change in unrealized depreciation of futures contracts | 930,827 | |
| Net realized and unrealized loss on investments and futures contracts | (8,345,084) | |
| Change in net assets resulting from operations | $(400,440) |
| Year Ended December 31 | 2015 | 2014 |
| Increase (Decrease) in Net Assets | ||
| Operations: | ||
| Net investment income | $7,944,644 | $9,266,245 |
| Net realized gain (loss) on investments and futures contracts | 1,661,851 | (2,073,574) |
| Net change in unrealized appreciation/depreciation of investments and futures contracts | (10,006,935) | 2,748,349 |
| CHANGE IN NET ASSETS RESULTING FROM OPERATIONS | (400,440) | 9,941,020 |
| Distributions to Shareholders: | ||
| Distributions from net investment income | ||
| Primary Shares | (8,119,140) | (8,630,882) |
| Service Shares | (1,147,215) | (1,321,729) |
| CHANGE IN NET ASSETS RESULTING FROM DISTRIBUTIONS TO SHAREHOLDERS | (9,266,355) | (9,952,611) |
| Share Transactions: | ||
| Proceeds from sale of shares | 11,390,887 | 17,000,776 |
| Net asset value of shares issued to shareholders in payment of distributions declared | 9,266,355 | 9,952,611 |
| Cost of shares redeemed | (38,235,928) | (41,913,330) |
| CHANGE IN NET ASSETS RESULTING FROM SHARE TRANSACTIONS | (17,578,686) | (14,959,943) |
| Change in net assets | (27,245,481) | (14,971,534) |
| Net Assets: | ||
| Beginning of period | 254,211,765 | 269,183,299 |
| End of period (including undistributed net investment income of $7,942,765 and $9,264,476, respectively) | $226,966,284 | $254,211,765 |
| ■ | Fixed-income securities acquired with remaining maturities greater than 60 days are fair valued using price evaluations provided by a pricing service approved by the Trustees. |
| ■ | Fixed-income securities and repurchase agreements acquired with remaining maturities of 60 days or less are valued at their cost (adjusted for the accretion of any discount or amortization of any premium), unless the issuer's creditworthiness is impaired or other factors indicate that amortized cost is not an accurate estimate of the investment's fair value, in which case it would be valued in the same manner as a longer-term security. |
| ■ | Derivative contracts listed on exchanges are valued at their reported settlement or closing price, except that options are valued at the mean of closing bid and asked quotations. |
| ■ | Over-the-counter (OTC) derivative contracts are fair valued using price evaluations provided by a pricing service approved by the Trustees. |
| ■ | Shares of other mutual funds or non-exchange-traded investment companies are valued based upon their reported NAVs. |
| ■ | For securities that are fair valued in accordance with procedures established by and under the general supervision of the Trustees, certain factors may be considered such as: the last traded or purchase price of the security, information obtained by contacting the issuer or dealers, analysis of the issuer's financial statements or other available documents, fundamental analytical data, the nature and duration of restrictions on disposition, the movement of the market in which the security is normally traded, public trading in similar securities or derivative contracts of the issuer or comparable issuers, movement of a relevant index, or other factors including but not limited to industry changes and relevant government actions. |
| ■ | With respect to securities traded principally in foreign markets, significant trends in U.S. equity markets or in the trading of foreign securities index futures contracts; |
| ■ | Political or other developments affecting the economy or markets in which an issuer conducts its operations or its securities are traded; |
| ■ | Announcements concerning matters such as acquisitions, recapitalizations, litigation developments, or a natural disaster affecting the issuer's operations or regulatory changes or market developments affecting the issuer's industry. |
| Security | Acquisition Date | Cost | Market Value |
| Football Trust V, Pass Thru Cert., Series 144A, 5.35%, 10/5/2020 | 3/24/2010 | $1,000,000 | $1,092,307 |
| Union Central Life Insurance Co., Note, Series 144A, 8.20%, 11/1/2026 | 5/14/1999–9/29/1999 | $248,411 | $328,249 |
| Fair Value of Derivative Instruments | ||
| Liability | ||
| Statement of Assets and Liabilities Location | Fair Value | |
| Derivatives not accounted for as hedging instruments under ASC Topic 815 | ||
| Interest rate contracts | Payable for daily variation margin on futures contracts | $154,276* |
| * | Includes cumulative depreciation of futures contracts as reported in the footnotes to the Portfolio of Investments. Only the current day's variation margin is reported within the Statement of Assets and Liabilities. |
| Amount of Realized Gain or (Loss) on Derivatives Recognized in Income | |
| Futures Contracts | |
| Interest rate contracts | $(712,079) |
| Change in Unrealized Appreciation or (Depreciation) on Derivatives Recognized in Income | |
| Futures Contracts | |
| Interest rate contracts | $930,827 |
| Year Ended December 31 | 2015 | 2014 | ||
| Primary Shares: | Shares | Amount | Shares | Amount |
| Shares sold | 928,581 | $10,421,996 | 1,374,350 | $15,753,134 |
| Shares issued to shareholders in payment of distributions declared | 726,870 | 8,119,140 | 770,614 | 8,630,882 |
| Shares redeemed | (2,812,663) | (31,480,004) | (3,026,001) | (34,660,458) |
| NET CHANGE RESULTING FROM PRIMARY SHARE TRANSACTIONS | (1,157,212) | $(12,938,868) | (881,037) | $(10,276,442) |
| Year Ended December 31 | 2015 | 2014 | ||
| Service Shares: | Shares | Amount | Shares | Amount |
| Share Sold | 86,688 | $968,891 | 108,783 | $1,247,642 |
| Shares issued to shareholders in payment of distributions declared | 102,889 | 1,147,215 | 118,223 | 1,321,729 |
| Shares redeemed | (606,340) | (6,755,924) | (635,688) | (7,252,872) |
| NET CHANGE RESULTING FROM SERVICE SHARE TRANSACTIONS | (416,763) | $(4,639,818) | (408,682) | $(4,683,501) |
| NET CHANGE RESULTING FROM TOTAL FUND SHARE TRANSACTIONS | (1,573,975) | $(17,578,686) | (1,289,719) | $(14,959,943) |
| 2015 | 2014 | |
| Ordinary income | $9,266,355 | $9,952,611 |
| Undistributed ordinary income | $7,942,765 |
| Net unrealized appreciation | $1,513,566 |
| Capital loss carryforwards | $(2,194,218) |
| Expiration Year | Short-Term | Long-Term | Total |
| No Expiration | $635,614 | $— | $635,614 |
| 2017 | $1,558,604 | NA | $1,558,604 |
| Administrative Fee | Average Daily Net Assets of the Investment Complex |
| 0.150% | on the first $5 billion |
| 0.125% | on the next $5 billion |
| 0.100% | on the next $10 billion |
| 0.075% | on assets in excess of $20 billion |
| Share Class Name | Percentage of Average Daily Net Assets of Class |
| Primary Shares | 0.25% |
| Service Shares | 0.25% |
| Distribution Services Fees Incurred | |
| Service Shares | $78,311 |
| Purchases | $41,420,428 |
| Sales | $56,012,099 |
February 12, 2016
| Beginning Account Value 7/1/2015 | Ending Account Value 12/31/2015 | Expenses Paid During Period1 | |
| Actual: | |||
| Primary Shares | $1,000 | $991.00 | $3.66 |
| Service Shares | $1,000 | $989.10 | $4.91 |
| Hypothetical (assuming a 5% return before expenses): | |||
| Primary Shares | $1,000 | $1,021.53 | $3.72 |
| Service Shares | $1,000 | $1,020.27 | $4.99 |
| 1 | Expenses are equal to the Fund's annualized net expense ratios, multiplied by the average account value over the period, multiplied by 184/365 (to reflect the one-half-year period). The expenses shown in the table do not include the charges and expenses imposed by the insurance company under the variable insurance product contract. Please refer to the variable insurance product prospectus for a complete listing of these expenses. The annualized net expense ratios are as follows: |
| Primary Shares | 0.73% |
| Service Shares | 0.98% |
| Name Birth Date Positions Held with Trust Date Service Began | Principal Occupation(s) for Past Five Years, Other Directorships Held and Previous Position(s) |
| John F. Donahue* Birth Date: July 28, 1924 Trustee Indefinite Term Began serving: October 1993 | Principal Occupations: Director or Trustee of the Federated Fund Family; Chairman and Director, Federated Investors, Inc.; Chairman of the Federated Fund Family's Executive Committee. Previous Positions: Chairman of the Federated Fund Family; Trustee, Federated Investment Management Company; Chairman and Director, Federated Investment Counseling. |
| J. Christopher Donahue* Birth Date: April 11, 1949 Trustee Indefinite Term Began serving: October 1993 | Principal Occupations: Principal Executive Officer and President of certain of the Funds in the Federated Fund Family; Director or Trustee of the Funds in the Federated Fund Family; President, Chief Executive Officer and Director, Federated Investors, Inc.; Chairman and Trustee, Federated Investment Management Company; Trustee, Federated Investment Counseling; Chairman and Director, Federated Global Investment Management Corp.; Chairman, Federated Equity Management Company of Pennsylvania and Passport Research, Ltd. (investment advisory subsidiary of Federated); Trustee, Federated Shareholder Services Company; Director, Federated Services Company. Previous Positions: President, Federated Investment Counseling; President and Chief Executive Officer, Federated Investment Management Company, Federated Global Investment Management Corp. and Passport Research, Ltd. |
| * | Family relationships and reasons for “interested” status: John F. Donahue is the father of J. Christopher Donahue; both are “interested” due to their beneficial ownership of shares of Federated Investors, Inc. and the positions they hold with Federated and its subsidiaries. |
| Name Birth Date Positions Held with Trust Date Service Began | Principal Occupation(s) for Past Five Years, Other Directorships Held, Previous Position(s) and Qualifications |
| John T. Collins Birth Date: January 24, 1947 Trustee Indefinite Term Began serving: October 2013 | Principal Occupations: Director or Trustee of the Federated Fund Family; Retired. Other Directorships Held: Director, Chair of the Compensation Committee, Audit Committee member, KLX Corp. Qualifications: Mr. Collins has served in several business and financial management roles and directorship positions throughout his career. Mr. Collins previously served as Chairman and CEO, The Collins Group, Inc. (a private equity firm). Mr. Collins serves as Chairman Emeriti, Bentley University. Mr. Collins previously served as Director, FleetBoston Financial Corp.; Director and Audit Committee Member, Bank of America Corp. and Director, Beth Israel Deaconess Medical Center (Harvard University Affiliate Hospital). |
| G. Thomas Hough Birth Date: February 28, 1955 Trustee Indefinite Term Began serving: August 2015 | Principal Occupations: Director or Trustee of the Federated Fund Family; Retired. Other Directorships Held: Director, Chair of the Audit Committee, Governance Committee, Publix Super Markets, Inc. Qualifications: Mr. Hough has served in accounting, business management and directorship positions throughout his career. Mr. Hough most recently held the position of Americas Vice Chair of Assurance with Ernst & Young LLP. Mr. Hough is an Executive Committee member of the United States Golf Association, he serves on the President's Cabinet and Business School Board of Visitors for the University of Alabama and is on the Business School Board of Visitors for Wake Forest University. |
| Name Birth Date Positions Held with Trust Date Service Began | Principal Occupation(s) for Past Five Years, Other Directorships Held, Previous Position(s) and Qualifications |
| Maureen Lally-Green Birth Date: July 5, 1949 Trustee Indefinite Term Began serving: August 2009 | Principal Occupations: Director or Trustee of the Federated Fund Family; Adjunct Professor of Law, Duquesne University School of Law. Other Directorships Held: Director, CONSOL Energy Inc. Qualifications: Judge Lally-Green has served in various legal and business roles and directorship positions throughout her career. Judge Lally-Green previously served as: Associate General Secretary, Diocese of Pittsburgh; a member of the Superior Court of Pennsylvania; and as a Professor of Law, Duquesne University School of Law. Judge Lally-Green also holds the positions on either a public or not for profit Board of Directors as follows: Member, Pennsylvania State Board of Education (public); Director and Chair, UPMC Mercy Hospital; Regent, St. Vincent Seminary; Director, Epilepsy Foundation of Western and Central Pennsylvania; Director and Vice Chair, Our Campaign for the Church Alive!, Inc.; Director, Saint Vincent College; Director, Pennsylvania Bar Institute; and Director and Chair, Cardinal Wuerl North Catholic High School, Inc. Judge Lally-Green has held the positions of: Director, Auberle; Director, Ireland Institute of Pittsburgh; Director, Saint Thomas More Society; and Director, Catholic High Schools of the Diocese of Pittsburgh, Inc. |
| Peter E. Madden Birth Date: March 16, 1942 Trustee Indefinite Term Began serving: October 1993 | Principal Occupation: Director or Trustee, and Chair of the Board of Directors or Trustees, of the Federated Fund Family; Retired. Other Directorships Held: None. Qualifications: Mr. Madden has served in several business management, mutual fund services and directorship positions throughout his career. Mr. Madden previously served as President, Chief Operating Officer and Director, State Street Bank and Trust Company (custodian bank) and State Street Corporation (financial services). He was Director, VISA USA and VISA International and Chairman and Director, Massachusetts Bankers Association. Mr. Madden served as Director, Depository Trust Corporation and Director, The Boston Stock Exchange. Mr. Madden also served as a Representative to the Commonwealth of Massachusetts General Court. |
| Charles F. Mansfield, Jr. Birth Date: April 10, 1945 Trustee Indefinite Term Began serving: November 1999 | Principal Occupations: Director or Trustee of the Federated Fund Family; Management Consultant. Other Directorships Held: None. Qualifications: Mr. Mansfield has served in several banking, business management and educational roles and directorship positions throughout his career. Mr. Mansfield previously served as Chief Executive Officer, PBTC International Bank; Partner, Arthur Young & Company (now Ernst & Young LLP); Chief Financial Officer of Retail Banking Sector, Chase Manhattan Bank; Senior Vice President, HSBC Bank USA (formerly, Marine Midland Bank); Vice President, Citibank; Assistant Professor of Banking and Finance, Frank G. Zarb School of Business, Hofstra University; Executive Vice President DVC Group, Inc. (marketing, communications and technology). |
| Thomas M. O'Neill Birth Date: June 14, 1951 Trustee Indefinite Term Began serving: October 2006 | Principal Occupations: Director or Trustee, Chair of the Audit Committee of the Federated Fund Family; Sole Proprietor, Navigator Management Company (investment and strategic consulting). Other Directorships Held: None. Qualifications: Mr. O'Neill has served in several business, mutual fund and financial management roles and directorship positions throughout his career. Mr. O'Neill serves as Director, Medicines for Humanity and Director, The Golisano Children's Museum of Naples, Florida. Mr. O'Neill previously served as Chief Executive Officer and President, Managing Director and Chief Investment Officer, Fleet Investment Advisors; President and Chief Executive Officer, Aeltus Investment Management, Inc.; General Partner, Hellman, Jordan Management Co., Boston, MA; Chief Investment Officer, The Putnam Companies, Boston, MA; Credit Analyst and Lending Officer, Fleet Bank; Director and Consultant, EZE Castle Software (investment order management software); and Director, Midway Pacific (lumber). |
| P. Jerome Richey Birth Date: February 23, 1949 Trustee Indefinite Term Began serving: October 2013 | Principal Occupations: Director or Trustee of the Federated Fund Family; Management Consultant. Other Directorships Held: None. Qualifications: Mr. Richey has served in several business and legal management roles and directorship positions throughout his career. Mr. Richey most recently held the positions of Senior Vice Chancellor and Chief Legal Officer, University of Pittsburgh. Mr. Richey serves as Board Member, Epilepsy Foundation of Western Pennsylvania and Board member, World Affairs Council of Pittsburgh. Mr. Richey previously served as Chief Legal Officer and Executive Vice President, CONSOL Energy Inc. and Shareholder, Buchanan Ingersoll & Rooney PC (a law firm). |
| John S. Walsh Birth Date: November 28, 1957 Trustee Indefinite Term Began serving: January 1999 | Principal Occupations: Director or Trustee of the Federated Fund Family; President and Director, Heat Wagon, Inc. (manufacturer of construction temporary heaters); President and Director, Manufacturers Products, Inc. (distributor of portable construction heaters); President, Portable Heater Parts, a division of Manufacturers Products, Inc. Other Directorships Held: None. Qualifications: Mr. Walsh has served in several business management roles and directorship positions throughout his career. Mr. Walsh previously served as Vice President, Walsh & Kelly, Inc. (paving contractors). |
| Name Birth Date Address Positions Held with Trust Date Service Began | Principal Occupation(s) for Past Five Years and Previous Position(s) |
| John W. McGonigle Birth Date: October 26, 1938 EXECUTIVE VICE PRESIDENT AND SECRETARY Officer since: September 1993 | Principal Occupations: Executive Vice President and Secretary of the Federated Fund Family; Vice Chairman, Executive Vice President, Secretary and Director, Federated Investors, Inc. Previous Positions: Trustee, Federated Investment Management Company and Federated Investment Counseling; Director, Federated Global Investment Management Corp., Federated Services Company and Federated Securities Corp. |
| Lori A. Hensler Birth Date: January 6, 1967 TREASURER Officer since: April 2013 | Principal Occupations: Principal Financial Officer and Treasurer of the Federated Fund Family; Senior Vice President, Federated Administrative Services; Financial and Operations Principal for Federated Securities Corp. and Edgewood Services, Inc.; and Assistant Treasurer, Federated Investors Trust Company. Ms. Hensler has received the Certified Public Accountant designation. Previous Positions: Controller of Federated Investors, Inc.; Senior Vice President and Assistant Treasurer, Federated Investors Management Company; Treasurer, Federated Investors Trust Company; Assistant Treasurer, Federated Administrative Services, Federated Administrative Services, Inc., Federated Securities Corp., Edgewood Services, Inc., Federated Advisory Services Company, Federated Equity Management Company of Pennsylvania, Federated Global Investment Management Corp., Federated Investment Counseling, Federated Investment Management Company, Passport Research, Ltd., and Federated MDTA, LLC; Financial and Operations Principal for Federated Securities Corp., Edgewood Services, Inc. and Southpointe Distribution Services, Inc. |
| Peter J. Germain Birth Date: September 3, 1959 CHIEF LEGAL OFFICER Officer since: January 2005 | Principal Occupations: Mr. Germain is Chief Legal Officer of the Federated Fund Family. He is General Counsel and Vice President, Federated Investors, Inc.; President, Federated Administrative Services and Federated Administrative Services, Inc.; Vice President, Federated Securities Corp.; Secretary, Federated Private Asset Management, Inc.; and Secretary, Retirement Plan Service Company of America. Mr. Germain joined Federated in 1984 and is a member of the Pennsylvania Bar Association. Previous Positions: Deputy General Counsel, Special Counsel, Managing Director of Mutual Fund Services, Federated Investors, Inc.; Senior Vice President, Federated Services Company; and Senior Corporate Counsel, Federated Investors, Inc. |
| Richard B. Fisher Birth Date: May 17, 1923 VICE PRESIDENT Officer since: September 1993 | Principal Occupations: Vice Chairman or Vice President of some of the Funds in the Federated Fund Family; Vice Chairman, Federated Investors, Inc.; Chairman, Federated Securities Corp. Previous Positions: President and Director or Trustee of some of the Funds in the Federated Fund Family; Executive Vice President, Federated Investors, Inc.; Director and Chief Executive Officer, Federated Securities Corp. |
| John B. Fisher Birth Date: May 16, 1956 PRESIDENT Officer since: November 2004 | Principal Occupations: President, Director/Trustee and CEO, Federated Advisory Services Company, Federated Equity Management Company of Pennsylvania, Federated Global Investment Management Corp., Federated Investment Counseling, Federated Investment Management Company; President and CEO of Passport Research, Ltd.; President of some of the Funds in the Federated Fund Family; Director, Federated Investors Trust Company. Previous Positions: President and Director of the Institutional Sales Division of Federated Securities Corp.; President and Director of Federated Investment Counseling; Director, Edgewood Securities Corp.; Director, Federated Services Company; Director, Federated Investors, Inc.; Chairman and Director, Southpointe Distribution Services, Inc.; President, Technology, Federated Services Company. |
| Stephen Van Meter Birth Date: June 5, 1975 CHIEF COMPLIANCE OFFICER AND SENIOR VICE PRESIDENT Officer since: July 2015 | Principal Occupations: Senior Vice President and Chief Compliance Officer of the Federated Fund Family; Vice President and Chief Compliance Officer of Federated Investors, Inc. and Chief Compliance Officer of certain of its subsidiaries. Mr. Van Meter joined Federated in October 2011. He holds FINRA licenses under Series 3, 7, 24 and 66. Previous Positions: Mr. Van Meter previously held the position of Compliance Operating Officer, Federated Investors, Inc. Prior to joining Federated, Mr. Van Meter served at the United States Securities and Exchange Commission in the positions of Senior Counsel, Office of Chief Counsel, Division of Investment Management and Senior Counsel, Division of Enforcement. |
| Stephen F. Auth Birth Date: September 3, 1956 101 Park Avenue 41st Floor New York, NY 10178 CHIEF INVESTMENT OFFICER Officer since: November 2002 | Principal Occupations: Stephen F. Auth is Chief Investment Officer of various Funds in the Federated Fund Family; Executive Vice President, Federated Investment Counseling, Federated Global Investment Management Corp. and Federated Equity Management Company of Pennsylvania. Previous Positions: Executive Vice President, Federated Investment Management Company and Passport Research, Ltd. (investment advisory subsidiary of Federated); Senior Vice President, Global Portfolio Management Services Division; Senior Vice President, Federated Investment Management Company and Passport Research, Ltd.; Senior Managing Director and Portfolio Manager, Prudential Investments. |
| Robert J. Ostrowski Birth Date: April 26, 1963 Chief Investment Officer Officer since: May 2004 | Principal Occupations: Robert J. Ostrowski joined Federated in 1987 as an Investment Analyst and became a Portfolio Manager in 1990. He was named Chief Investment Officer of Federated's taxable fixed-income products in 2004 and also serves as a Senior Portfolio Manager. Mr. Ostrowski became an Executive Vice President of the Fund's Adviser in 2009 and served as a Senior Vice President of the Fund's Adviser from 1997 to 2009. Mr. Ostrowski has received the Chartered Financial Analyst designation. He received his M.S. in Industrial Administration from Carnegie Mellon University. |
| Deborah A. Cunningham Birth Date: September 15, 1959 Chief Investment Officer Officer since: June 2012 | Principal Occupations: Deborah A. Cunningham was named Chief Investment Officer of Federated's money market products in 2004. She joined Federated in 1981 and has been a Senior Portfolio Manager since 1997 and an Executive Vice President of the Fund's Adviser since 2009. Ms. Cunningham has received the Chartered Financial Analyst designation and holds an M.S.B.A. in Finance from Robert Morris College. |
Federated Investors Funds
4000 Ericsson Drive
Warrendale, PA 15086-7561
or call 1-800-341-7400.
CUSIP 313916785
2016 ©Federated Investors, Inc.
| 1 | The Barclays Mortgage-Backed Securities Index and Barclays Government Index returned 1.51% and 0.86%, respectively. The Blended Index is being used for comparison purposes because, although it is not the Fund's broad-based securities market index, the Fund's Adviser believes it more closely reflects the market sectors in which the Fund invests. Please see the footnotes to the line graph under “Fund Performance and Growth of a $10,000 Investment” below for the definition of, and more information about, the Blended Index. |
| 2 | Duration measures the price sensitivity of a fixed-income security to changes in interest rates. Securities with longer durations are more sensitive to changes in interest rates than securities of shorter durations. |
| 3 | Investment-grade securities are securities that are rated at least “BBB- (minus)” or unrated securities of a comparable quality. Noninvestment-grade securities are securities that are not rated at least “BBB- (minus)” or unrated securities of a comparable quality. Credit ratings are an indication of the risk that a security will default. They do not protect a security from credit risk. Lower-rated bonds typically offer higher yields to help compensate investors for the increased risk associated with them. Among these risks are lower credit-worthiness, greater price volatility, more risk to principal and income than with higher-rated securities and increased possibilities of default. |
| 4 | The value of some mortgage-backed securities may be particularly sensitive to changes in prevailing interest rates, and although the securities are generally supported by some form of government or private insurance, there is no assurance that private guarantors or insurers will meet their obligations. |
| 5 | Bond prices are sensitive to changes in interest rates, and a rise in interest rates can cause a decline in their prices. |
| 6 | The Fund's use of derivative instruments involves risks different from, or possibly greater than, the risks associated with investing directly in securities and other traditional instruments. |
| Federated Fund for U.S. Government Securities II | NA | BMBS | BGI | Blended Index | |
| F | NA | I | I | I | |
| 12/31/2005 | 10,000 | 10,000 | 10,000 | 10,000 | |
| 12/31/2006 | 10,414 | 10,522 | 10,348 | 10,464 | |
| 12/31/2007 | 11,068 | 11,249 | 11,244 | 11,247 | |
| 12/31/2008 | 11,541 | 12,187 | 12,637 | 12,335 | |
| 12/31/2009 | 12,143 | 12,905 | 12,359 | 12,725 | |
| 12/31/2010 | 12,771 | 13,597 | 13,041 | 13,416 | |
| 12/31/2011 | 13,508 | 14,444 | 14,217 | 14,375 | |
| 12/31/2012 | 13,910 | 14,819 | 14,505 | 14,721 | |
| 12/31/2013 | 13,625 | 14,609 | 14,128 | 14,456 | |
| 12/31/2014 | 14,255 | 15,498 | 14,823 | 15,279 | |
| 12/31/2015 | 14,329 | 15,732 | 14,949 | 15,478 |
| 1 Year | 5 Years | 10 Years | |
| Fund | 0.52% | 2.33% | 3.66% |
| BMBS | 1.51% | 2.96% | 4.64% |
| BGI | 0.86% | 2.77% | 4.10% |
| Blended Index | 1.30% | 2.90% | 4.46% |
| 1 | The Fund's performance assumes the reinvestment of all dividends and distributions. The BMBS, BGI and Blended Index have been adjusted to reflect reinvestment of dividends on securities in the indexes. |
| 2 | The BMBS covers agency mortgage-backed pass-through securities (both fixed-rate and hybrid ARM) issued by Ginnie Mae (GNMA), Fannie Mae (FNMA) and Freddie Mac (FHLMC). The index is not adjusted to reflect sales loads, expenses or other fees that the Securities and Exchange Commission (SEC) requires to be reflected in the Fund's performance. The index is unmanaged and, unlike the Fund, is not affected by cash flows. It is not possible to invest directly in an index. |
| 3 | The BGI is a market value weighted index of U.S. government and government agency securities (other than mortgage securities) with maturities of one year or more. The index is not adjusted to reflect sales loads, expenses or other fees that the SEC requires to be reflected in the Fund's performance. The index is unmanaged and, unlike the Fund, is not affected by cash flows. It is not possible to invest directly in an index. |
| Type of Investments | Percentage of Total Net Assets |
| U.S. Government Agency Mortgage-Backed Securities | 42.4% |
| U.S. Treasury Securities | 19.7% |
| U.S. Government Agency Commercial Mortgage-Backed Securities | 17.2% |
| Non-Agency Mortgage-Backed Securities | 6.6% |
| Non-Agency Commercial Mortgage-Backed Securities | 3.7% |
| U.S. Government Agency Securities | 3.1% |
| Asset-Backed Securities | 2.9% |
| Repurchase Agreements2 | 4.1% |
| Other Assets and Liabilities—Net3 | 0.3% |
| TOTAL | 100.0% |
| 1 | See the Fund's Prospectus and Statement of Additional Information for a description of the types of securities in which the Fund invests. |
| 2 | Cash Equivalents include any investments in money market mutual funds and/or overnight repurchase agreements. |
| 3 | Assets, other than investments in securities, less liabilities. See Statement of Assets and Liabilities. |
| Principal Amount | Value | ||
| U.S. TREASURY—19.7% | |||
| U.S. Treasury Bonds—2.4% | |||
| $750,000 | 2.500%, 2/15/2045 | $673,477 | |
| 1,000,000 | 2.750%, 8/15/2042 | 956,615 | |
| 1,200,000 | 2.875%, 8/15/2045 | 1,166,406 | |
| 1,250,000 | 3.000%, 11/15/2044 | 1,246,484 | |
| TOTAL | 4,042,982 | ||
| U.S. Treasury Notes—17.3% | |||
| 2,000,000 | 0.875%, 7/31/2019 | 1,955,286 | |
| 7,000,000 | 1.375%, 2/29/2020 - 9/30/2020 | 6,900,990 | |
| 2,000,000 | 1.500%, 8/31/2018 | 2,013,971 | |
| 1,750,000 | 1.625%, 7/31/2020 | 1,742,161 | |
| 7,250,000 | 2.000%, 2/15/2023 - 8/15/2025 | 7,141,132 | |
| 2,000,000 | 2.375%, 8/15/2024 | 2,021,443 | |
| 1,500,000 | 2.750%, 2/15/2024 | 1,562,743 | |
| 5,500,000 | 3.125%, 5/15/2021 | 5,849,980 | |
| TOTAL | 29,187,706 | ||
| TOTAL U.S. TREASURY (IDENTIFIED COST $33,029,821) | 33,230,688 | ||
| ASSET-BACKED SECURITIES—2.9% | |||
| Auto Receivables—2.9% | |||
| 1,223,000 | Capital Auto Receivables Asset Trust 2015-2, Class D, 3.160%, 11/20/2020 | 1,221,469 | |
| 1,725,000 | Santander Drive Auto Receivables Trust 2014-3, Class D, 2.650%, 8/17/2020 | 1,721,400 | |
| 2,030,000 | Santander Drive Auto Receivables Trust 2015-2, Class D, 3.020%, 4/15/2021 | 2,012,744 | |
| TOTAL ASSET-BACKED SECURITIES (IDENTIFIED COST $4,968,998) | 4,955,613 | ||
| GOVERNMENT AGENCIES—3.1% | |||
| Federal Farm Credit System—0.8% | |||
| 1,000,000 | 5.750%, 12/7/2028 | 1,277,161 | |
| Federal Home Loan Bank System—0.9% | |||
| 1,100,000 | 7.125%, 2/15/2030 | 1,598,628 | |
| Federal Home Loan Mortgage Corporation—0.1% | |||
| 72,000 | 6.750%, 9/15/2029 | 102,366 | |
| Tennessee Valley Authority Bonds—1.3% | |||
| 2,000,000 | Tennessee Valley Authority, 4.650%, 6/15/2035 | 2,244,171 | |
| TOTAL GOVERNMENT AGENCIES (IDENTIFIED COST $4,128,784) | 5,222,326 | ||
| MORTGAGE-BACKED SECURITIES—42.4% | |||
| Government Agency—1.1% | |||
| 1,922,644 | 1,2 | FDIC Trust 2013-R2, Class A, 1.250%, 3/25/2033 | 1,840,823 |
| Federal Home Loan Mortgage Corporation—16.9% | |||
| 3,367,461 | 3.000%, 8/1/2043 - 5/1/2045 | 3,369,838 | |
| 5,195,627 | 3.500%, 4/1/2042 - 9/1/2043 | 5,360,978 | |
| 5,053,420 | 4.000%, 12/1/2041 - 1/1/2042 | 5,355,002 | |
| 5,597,905 | 4.500%, 6/1/2019 - 4/1/2041 | 6,029,502 | |
| 2,705,875 | 5.000%, 7/1/2019 - 6/1/2040 | 2,947,286 | |
| 3,355,115 | 5.500%, 12/1/2020 - 3/1/2040 | 3,749,908 | |
| 984,008 | 6.000%, 4/1/2017 - 7/1/2037 | 1,111,920 | |
| 190,012 | 6.500%, 6/1/2022 - 5/1/2031 | 217,920 | |
| 278,112 | 7.000%, 12/1/2029 - 4/1/2032 | 325,331 |
| Principal Amount | Value | ||
| MORTGAGE-BACKED SECURITIES—continued | |||
| Federal Home Loan Mortgage Corporation—continued | |||
| $67,680 | 7.500%, 12/1/2030 - 1/1/2031 | $80,322 | |
| 8,764 | 8.500%, 5/1/2030 | 10,651 | |
| 3,205 | 9.000%, 2/1/2025 - 5/1/2025 | 3,774 | |
| TOTAL | 28,562,432 | ||
| Federal National Mortgage Association—14.6% | |||
| 6,638,375 | 3.500%, 8/1/2042 - 9/1/2042 | 6,869,473 | |
| 5,375,258 | 4.000%, 2/1/2041 - 4/1/2042 | 5,702,317 | |
| 6,426,012 | 4.500%, 12/1/2019 - 2/1/2042 | 6,962,362 | |
| 1,459,208 | 5.000%, 7/1/2034 - 7/1/2040 | 1,608,211 | |
| 1,096,485 | 5.500%, 11/1/2021 - 4/1/2036 | 1,223,498 | |
| 1,460,770 | 6.000%, 4/1/2016 - 3/1/2038 | 1,639,002 | |
| 157,161 | 6.500%, 6/1/2029 - 11/1/2035 | 181,058 | |
| 257,391 | 7.000%, 2/1/2024 - 4/1/2032 | 300,676 | |
| 11,961 | 7.500%, 8/1/2028 - 2/1/2030 | 14,030 | |
| 11,784 | 8.000%, 7/1/2030 | 14,207 | |
| TOTAL | 24,514,834 | ||
| Government National Mortgage Association—9.8% | |||
| 1,964,442 | 3.000%, 7/20/2045 | 1,993,626 | |
| 5,931,088 | 3.500%, 6/15/2042 | 6,188,869 | |
| 4,355,362 | 4.500%, 6/20/2039 - 8/20/2040 | 4,715,598 | |
| 751,144 | 5.000%, 7/15/2034 | 836,469 | |
| 1,872,308 | 6.000%, 4/15/2032 - 7/20/2038 | 2,125,392 | |
| 593,139 | 6.500%, 12/15/2023 - 5/15/2032 | 685,801 | |
| 12,671 | 7.500%, 10/15/2029 - 3/20/2030 | 15,084 | |
| 2,467 | 8.000%, 4/15/2030 | 2,930 | |
| TOTAL | 16,563,769 | ||
| TOTAL MORTGAGE-BACKED SECURITIES (IDENTIFIED COST $68,421,949) | 71,481,858 | ||
| COLLATERALIZED MORTGAGE OBLIGATIONS—6.6% | |||
| Non-Agency Mortgage-Backed Securities—6.6% | |||
| 870,852 | Countrywide Alternative Loan Trust 2003-J3, Class 1A3, 5.250%, 11/25/2033 | 874,813 | |
| 773,773 | Countrywide Home Loans 2007-14, Class A18, 6.000%, 9/25/2037 | 713,831 | |
| 225,985 | Credit Suisse Mortgage Trust 2007-4, Class 4A2, 5.500%, 6/25/2037 | 181,532 | |
| 580,175 | 1,2 | Credit Suisse Mortgage Trust 2012-CIM2, Class A1, 3.000%, 6/25/2042 | 578,020 |
| 2,107,886 | 1,2 | Credit Suisse Mortgage Trust 2013-IVR3, Class A2, 3.000%, 5/25/2043 | 2,068,787 |
| 711,856 | 1,2 | Credit Suisse Mortgage Trust 2014-WIN2, Class A2, 3.500%, 10/25/2044 | 722,963 |
| 1,458,407 | 1,2 | Credit Suisse Mortgage Trust 2015-WIN1, Class A6, 3.500%, 12/25/2044 | 1,477,098 |
| 225,315 | First Horizon Alternative Mortgage Securities 2005-FA7, Class 2A1, 5.000%, 9/25/2020 | 220,401 | |
| 492,684 | Sequoia Mortgage Trust 2012-1, Class 2A1, 3.474%, 1/25/2042 | 494,033 | |
| 934,664 | 1,2 | Sequoia Mortgage Trust 2014-1, Class 2A5, 4.000%, 4/25/2044 | 945,210 |
| 1,981,306 | 1,2 | Sequoia Mortgage Trust 2014-4, Class A5, 3.500%, 11/25/2044 | 2,007,054 |
| 1,049,956 | Structured Asset Securities Corp. 2005-17, Class 5A1, 5.500%, 10/25/2035 | 874,066 | |
| TOTAL COLLATERALIZED MORTGAGE OBLIGATIONS (IDENTIFIED COST $11,480,004) | 11,157,808 | ||
| COMMERCIAL MORTGAGE-BACKED SECURITIES—20.9% | |||
| Agency Commercial Mortgage-Backed Securities—17.2% | |||
| 2,912,000 | 1,2 | FREMF Mortgage Trust 2011-K701, 4.436%, 7/25/2048 | 3,000,045 |
| 2,750,000 | 1,2 | FREMF Mortgage Trust 2013-K502, 2.834%, 3/25/2045 | 2,757,256 |
| 1,410,000 | 1,2 | FREMF Mortgage Trust 2014-K717, 3.630%, 11/25/2047 | 1,343,667 |
| 1,080,000 | 1,2 | FREMF Mortgage Trust 2015-K49, 3.848%, 10/25/2048 | 954,169 |
| 1,839,840 | FHLMC REMIC K010 A1, 3.320%, 7/25/2020 | 1,890,156 |
| Principal Amount | Value | ||
| COMMERCIAL MORTGAGE-BACKED SECURITIES—continued | |||
| Agency Commercial Mortgage-Backed Securities—continued | |||
| $2,688,018 | FHLMC REMIC K050 A1, 2.802%, 1/25/2025 | $2,737,569 | |
| 4,000,000 | FHLMC REMIC K703 A2, 2.699%, 5/25/2018 | 4,086,558 | |
| 2,000,000 | FHLMC REMIC K704 A2, 2.412%, 8/25/2018 | 2,030,865 | |
| 2,543,912 | FHLMC REMIC K720 A1, 2.316%, 11/25/2021 | 2,558,226 | |
| 1,500,000 | FHLMC REMIC K721 A1, 2.610%, 1/25/2022 | 1,525,048 | |
| 5,927,739 | FNMA REMIC 2011-M7 A2, 2.578%, 9/25/2018 | 6,017,013 | |
| TOTAL | 28,900,572 | ||
| Non-Agency Commercial Mortgage-Backed Securities—3.7% | |||
| 3,066,494 | Commercial Mortgage Pass-Through Certificates 2012-LC4, Class A2, 2.256%, 12/10/2044 | 3,080,240 | |
| 1,936,135 | 1,2 | DBUBS Mortgage Trust 2011-LC2A, Class A2, 3.386%, 7/10/2044 | 1,944,725 |
| 350,580 | 1,2 | GS Mortgage Securities Corp. 2010-C2, Class A1, 3.849%, 12/10/2043 | 360,304 |
| 141,055 | 1,2 | JP Morgan Chase Commercial Mortgage Securities 2010-C2, Class A1, 2.749%, 11/15/2043 | 142,004 |
| 752,886 | 1,2 | WF-RBS Commercial Mortgage Trust 2011-C3, Class A2, 3.240%, 3/15/2044 | 754,941 |
| TOTAL | 6,282,214 | ||
| TOTAL COMMERCIAL MORTGAGE-BACKED SECURITIES (IDENTIFIED COST $35,327,120) | 35,182,786 | ||
| REPURCHASE AGREEMENT—4.1% | |||
| 6,945,000 | Interest in $600,000,000 joint repurchase agreement 0.32%, dated 12/31/2015 under which Bank of America, N.A. will repurchase securities provided as collateral for $600,021,333 on 1/4/2016. The securities provided as collateral at the end of the period held with BNY Mellon as tri-party agent, were U.S. Government Agency securities maturing on 2/25/2044 and the market value of those underlying securitis was $618,021,974. (AT COST) | 6,945,000 | |
| TOTAL INVESTMENTS—99.7% (IDENTIFIED COST $164,301,676)3 | 168,176,079 | ||
| OTHER ASSETS AND LIABILITIES - NET—0.3%4 | 565,630 | ||
| TOTAL NET ASSETS—100% | $168,741,709 |
| 1 | Denotes a restricted security that either: (a) cannot be offered for public sale without first being registered, or being able to take advantage of an exemption from registration, under the Securities Act of 1933; or (b) is subject to a contractual restriction on public sales. At December 31, 2015, these restricted securities amounted to $20,897,066, which represented 12.4% of total net assets. |
| 2 | Denotes a restricted security that may be resold without restriction to “qualified institutional buyers” as defined in Rule 144A under the Securities Act of 1933 and that the Fund has determined to be liquid under criteria established by the Fund's Board of Trustees (the “Trustees”). At December 31, 2015, these liquid restricted securities amounted to $20,897,066, which represented 12.4% of total net assets. |
| 3 | The cost of investments for federal tax purposes amounts to $164,162,447. |
| 4 | Assets, other than investments in securities, less liabilities. See Statement of Assets and Liabilities. |
| FDIC | —Federal Deposit Insurance Corporation |
| FHLMC | —Federal Home Loan Mortgage Corporation |
| FNMA | —Federal National Mortgage Association |
| REMIC | —Real Estate Mortgage Investment Conduit |
| Year Ended December 31 | 2015 | 2014 | 2013 | 2012 | 2011 |
| Net Asset Value, Beginning of Period | $11.12 | $10.95 | $11.55 | $11.66 | $11.50 |
| Income From Investment Operations: | |||||
| Net investment income | 0.251 | 0.271 | 0.261 | 0.301 | 0.351 |
| Net realized and unrealized gain (loss) on investments and futures contracts | (0.19) | 0.23 | (0.49) | 0.03 | 0.29 |
| TOTAL FROM INVESTMENT OPERATIONS | 0.06 | 0.50 | (0.23) | 0.33 | 0.64 |
| Less Distributions: | |||||
| Distributions from net investment income | (0.30) | (0.33) | (0.37) | (0.44) | (0.48) |
| Net Asset Value, End of Period | $10.88 | $11.12 | $10.95 | $11.55 | $11.66 |
| Total Return2 | 0.52% | 4.62% | (2.05)% | 2.98% | 5.78% |
| Ratios to Average Net Assets: | |||||
| Net expenses | 0.76% | 0.76% | 0.76% | 0.76% | 0.74% |
| Net investment income | 2.25% | 2.45% | 2.34% | 2.60% | 3.10% |
| Expense waiver/reimbursement3 | 0.03% | 0.04% | 0.03% | 0.01% | 0.02% |
| Supplemental Data: | |||||
| Net assets, end of period (000 omitted) | $168,742 | $187,012 | $201,117 | $246,569 | $281,306 |
| Portfolio turnover | 34% | 51% | 94% | 127% | 157% |
| Portfolio turnover (excluding purchases and sales from dollar-roll transactions) | 27% | 26% | 38% | 31% | 51% |
| 1 | Per share numbers have been calculated using the average shares method. |
| 2 | Based on net asset value. Total returns do not reflect any additional fees or expenses that may be imposed by separate accounts of insurance companies or in connection with any variable annuity or variable life insurance contract. |
| 3 | This expense decrease is reflected in both the net expense and the net investment income ratios shown above. |
| Assets: | ||
| Total investment in securities, at value (identified cost $164,301,676) | $168,176,079 | |
| Cash | 11,793 | |
| Income receivable | 602,857 | |
| Receivable for shares sold | 12,649 | |
| TOTAL ASSETS | 168,803,378 | |
| Liabilities: | ||
| Payable for shares redeemed | $23,972 | |
| Payable to adviser (Note 5) | 2,642 | |
| Payable for custodian fees | 6,237 | |
| Payable for transfer agent fee | 3,216 | |
| Payable for portfolio accounting fees | 24,364 | |
| Accrued expenses (Note 5) | 1,238 | |
| TOTAL LIABILITIES | 61,669 | |
| Net assets for 15,505,506 shares outstanding | $168,741,709 | |
| Net Assets Consist of: | ||
| Paid-in capital | $161,518,621 | |
| Net unrealized appreciation of investments | 3,874,403 | |
| Accumulated net realized loss on investments and futures contracts | (811,500) | |
| Undistributed net investment income | 4,160,185 | |
| TOTAL NET ASSETS | $168,741,709 | |
| Net Asset Value, Offering Price and Redemption Proceeds Per Share: | ||
| $168,741,709 ÷ 15,505,506 shares outstanding, no par value, unlimited shares authorized | $10.88 |
| Investment Income: | ||
| Interest (including income on securities loaned of $2,320) | $5,432,324 | |
| Expenses: | ||
| Investment adviser fee (Note 5) | $1,082,185 | |
| Administrative fee (Note 5) | 141,135 | |
| Custodian fees | 23,405 | |
| Transfer agent fee | 17,775 | |
| Directors'/Trustees' fees (Note 5) | 2,067 | |
| Auditing fees | 23,000 | |
| Legal fees | 8,894 | |
| Portfolio accounting fees | 98,105 | |
| Printing and postage | 31,609 | |
| Miscellaneous (Note 5) | 6,805 | |
| TOTAL EXPENSES | 1,434,980 | |
| Waiver of investment adviser fee (Note 5) | (55,374) | |
| Net expenses | 1,379,606 | |
| Net investment income | 4,052,718 | |
| Realized and Unrealized Gain (Loss) on Investments and Futures Contracts: | ||
| Net realized gain on investments | 425,058 | |
| Net realized loss on futures contracts | (221,056) | |
| Net change in unrealized appreciation of investments | (3,316,660) | |
| Net change in unrealized depreciation of futures contracts | 61,812 | |
| Net realized and unrealized loss on investments and futures contracts | (3,050,846) | |
| Change in net assets resulting from operations | $1,001,872 |
| Year Ended December 31 | 2015 | 2014 |
| Increase (Decrease) in Net Assets | ||
| Operations: | ||
| Net investment income | $4,052,718 | $4,757,534 |
| Net realized gain on investments and futures contracts | 204,002 | 438,049 |
| Net change in unrealized appreciation/depreciation of investments and futures contracts | (3,254,848) | 3,745,144 |
| CHANGE IN NET ASSETS RESULTING FROM OPERATIONS | 1,001,872 | 8,940,727 |
| Distributions to Shareholders: | ||
| Distributions from net investment income | (5,031,901) | (5,762,197) |
| Share Transactions: | ||
| Proceeds from sale of shares | 23,920,600 | 20,359,676 |
| Net asset value of shares issued to shareholders in payment of distributions declared | 5,031,900 | 5,762,197 |
| Cost of shares redeemed | (43,192,276) | (43,405,571) |
| CHANGE IN NET ASSETS RESULTING FROM SHARE TRANSACTIONS | (14,239,776) | (17,283,698) |
| Change in net assets | (18,269,805) | (14,105,168) |
| Net Assets: | ||
| Beginning of period | 187,011,514 | 201,116,682 |
| End of period (including undistributed net investment income of $4,160,185 and $5,013,510, respectively) | $168,741,709 | $187,011,514 |
| ■ | Fixed-income securities acquired with remaining maturities greater than 60 days are fair valued using price evaluations provided by a pricing service approved by the Trustees. |
| ■ | Fixed-income securities and repurchase agreements acquired with remaining maturities of 60 days or less are valued at their cost (adjusted for the accretion of any discount or amortization of any premium), unless the issuer's creditworthiness is impaired or other factors indicate that amortized cost is not an accurate estimate of the investment's fair value, in which case it would be valued in the same manner as a longer-term security. |
| ■ | Derivative contracts listed on exchanges are valued at their reported settlement or closing price, except that options are valued at the mean of closing bid and asked quotations. |
| ■ | Over-the-counter (OTC) derivative contracts are fair valued using price evaluations provided by a pricing service approved by the Trustees. |
| ■ | Shares of other mutual funds or non-exchange-traded investment companies are valued based upon their reported NAVs. |
| ■ | For securities that are fair valued in accordance with procedures established by and under the general supervision of the Trustees, certain factors may be considered such as: the last traded or purchase price of the security, information obtained by contacting the issuer or dealers, analysis of the issuer's financial statements or other available documents, fundamental analytical data, the nature and duration of restrictions on disposition, the movement of the market in which the security is normally traded, public trading in similar securities or derivative contracts of the issuer or comparable issuers, movement of a relevant index, or other factors including but not limited to industry changes and relevant government actions. |
| Amount of Realized Gain or (Loss) on Derivatives Recognized in Income | |
| Futures Contracts | |
| Interest rate contracts | $(221,056) |
| Change in Unrealized Appreciation or (Depreciation) on Derivatives Recognized in Income | |
| Futures Contracts | |
| Interest rate contracts | $61,812 |
| Year Ended December 31 | 2015 | 2014 |
| Shares sold | 2,172,769 | 1,852,120 |
| Shares issued to shareholders in payment of distributions declared | 459,955 | 535,023 |
| Shares redeemed | (3,937,774) | (3,948,603) |
| NET CHANGE RESULTING FROM FUND SHARE TRANSACTIONS | (1,305,050) | (1,561,460) |
| Increase (Decrease) | |
| Undistributed Net Investment Income (Loss) | Accumulated Net Realized Gain (Loss) |
| $125,858 | $(125,858) |
| 2015 | 2014 | |
| Ordinary income | $5,031,901 | $5,762,197 |
| Undistributed ordinary income | $4,160,264 |
| Net unrealized appreciation | $4,013,632 |
| Capital loss carryforwards and deferrals | $(950,808) |
| Expiration Year | Short-Term | Long-Term | Total |
| No Expiration | $444,854 | $— | $444,854 |
| 2017 | $98,280 | NA | $98,280 |
| Administrative Fee | Average Daily Net Assets of the Investment Complex |
| 0.150% | on the first $5 billion |
| 0.125% | on the next $5 billion |
| 0.100% | on the next $10 billion |
| 0.075% | on assets in excess of $20 billion |
| Purchases | $17,702,997 |
| Sales | $3,194,128 |
February 12, 2016
| Beginning Account Value 7/1/2015 | Ending Account Value 12/31/2015 | Expenses Paid During Period1 | |
| Actual | $1,000 | $1,004.60 | $3.84 |
| Hypothetical (assuming a 5% return before expenses) | $1,000 | $1,021.37 | $3.87 |
| 1 | Expenses are equal to the Fund's annualized net expense ratio of 0.76%, multiplied by the average account value over the period, multiplied by 184/365 (to reflect the one-half-year period). The expenses shown in the table do not include the charges and expenses imposed by the insurance company under the variable insurance product contract. Please refer to the variable insurance product prospectus for a complete listing of these expenses. |
| Name Birth Date Positions Held with Trust Date Service Began | Principal Occupation(s) for Past Five Years, Other Directorships Held and Previous Position(s) |
| John F. Donahue* Birth Date: July 28, 1924 Trustee Indefinite Term Began serving: October 1993 | Principal Occupations: Director or Trustee of the Federated Fund Family; Chairman and Director, Federated Investors, Inc.; Chairman of the Federated Fund Family's Executive Committee. Previous Positions: Chairman of the Federated Fund Family; Trustee, Federated Investment Management Company; Chairman and Director, Federated Investment Counseling. |
| J. Christopher Donahue* Birth Date: April 11, 1949 Trustee Indefinite Term Began serving: October 1993 | Principal Occupations: Principal Executive Officer and President of certain of the Funds in the Federated Fund Family; Director or Trustee of the Funds in the Federated Fund Family; President, Chief Executive Officer and Director, Federated Investors, Inc.; Chairman and Trustee, Federated Investment Management Company; Trustee, Federated Investment Counseling; Chairman and Director, Federated Global Investment Management Corp.; Chairman, Federated Equity Management Company of Pennsylvania and Passport Research, Ltd. (investment advisory subsidiary of Federated); Trustee, Federated Shareholder Services Company; Director, Federated Services Company. Previous Positions: President, Federated Investment Counseling; President and Chief Executive Officer, Federated Investment Management Company, Federated Global Investment Management Corp. and Passport Research, Ltd. |
| * | Family relationships and reasons for “interested” status: John F. Donahue is the father of J. Christopher Donahue; both are “interested” due to their beneficial ownership of shares of Federated Investors, Inc. and the positions they hold with Federated and its subsidiaries. |
| Name Birth Date Positions Held with Trust Date Service Began | Principal Occupation(s) for Past Five Years, Other Directorships Held, Previous Position(s) and Qualifications |
| John T. Collins Birth Date: January 24, 1947 Trustee Indefinite Term Began serving: October 2013 | Principal Occupations: Director or Trustee of the Federated Fund Family; Retired. Other Directorships Held: Director, Chair of the Compensation Committee, Audit Committee member, KLX Corp. Qualifications: Mr. Collins has served in several business and financial management roles and directorship positions throughout his career. Mr. Collins previously served as Chairman and CEO, The Collins Group, Inc. (a private equity firm). Mr. Collins serves as Chairman Emeriti, Bentley University. Mr. Collins previously served as Director, FleetBoston Financial Corp.; Director and Audit Committee Member, Bank of America Corp. and Director, Beth Israel Deaconess Medical Center (Harvard University Affiliate Hospital). |
| G. Thomas Hough Birth Date: February 28, 1955 Trustee Indefinite Term Began serving: August 2015 | Principal Occupations: Director or Trustee of the Federated Fund Family; Retired. Other Directorships Held: Director, Chair of the Audit Committee, Governance Committee, Publix Super Markets, Inc. Qualifications: Mr. Hough has served in accounting, business management and directorship positions throughout his career. Mr. Hough most recently held the position of Americas Vice Chair of Assurance with Ernst & Young LLP. Mr. Hough is an Executive Committee member of the United States Golf Association, he serves on the President's Cabinet and Business School Board of Visitors for the University of Alabama and is on the Business School Board of Visitors for Wake Forest University. |
| Name Birth Date Positions Held with Trust Date Service Began | Principal Occupation(s) for Past Five Years, Other Directorships Held, Previous Position(s) and Qualifications |
| Maureen Lally-Green Birth Date: July 5, 1949 Trustee Indefinite Term Began serving: August 2009 | Principal Occupations: Director or Trustee of the Federated Fund Family; Adjunct Professor of Law, Duquesne University School of Law. Other Directorships Held: Director, CONSOL Energy Inc. Qualifications: Judge Lally-Green has served in various legal and business roles and directorship positions throughout her career. Judge Lally-Green previously served as: Associate General Secretary, Diocese of Pittsburgh; a member of the Superior Court of Pennsylvania; and as a Professor of Law, Duquesne University School of Law. Judge Lally-Green also holds the positions on either a public or not for profit Board of Directors as follows: Member, Pennsylvania State Board of Education (public); Director and Chair, UPMC Mercy Hospital; Regent, St. Vincent Seminary; Director, Epilepsy Foundation of Western and Central Pennsylvania; Director and Vice Chair, Our Campaign for the Church Alive!, Inc.; Director, Saint Vincent College; Director, Pennsylvania Bar Institute; and Director and Chair, Cardinal Wuerl North Catholic High School, Inc. Judge Lally-Green has held the positions of: Director, Auberle; Director, Ireland Institute of Pittsburgh; Director, Saint Thomas More Society; and Director, Catholic High Schools of the Diocese of Pittsburgh, Inc. |
| Peter E. Madden Birth Date: March 16, 1942 Trustee Indefinite Term Began serving: October 1993 | Principal Occupation: Director or Trustee, and Chair of the Board of Directors or Trustees, of the Federated Fund Family; Retired. Other Directorships Held: None. Qualifications: Mr. Madden has served in several business management, mutual fund services and directorship positions throughout his career. Mr. Madden previously served as President, Chief Operating Officer and Director, State Street Bank and Trust Company (custodian bank) and State Street Corporation (financial services). He was Director, VISA USA and VISA International and Chairman and Director, Massachusetts Bankers Association. Mr. Madden served as Director, Depository Trust Corporation and Director, The Boston Stock Exchange. Mr. Madden also served as a Representative to the Commonwealth of Massachusetts General Court. |
| Charles F. Mansfield, Jr. Birth Date: April 10, 1945 Trustee Indefinite Term Began serving: November 1999 | Principal Occupations: Director or Trustee of the Federated Fund Family; Management Consultant. Other Directorships Held: None. Qualifications: Mr. Mansfield has served in several banking, business management and educational roles and directorship positions throughout his career. Mr. Mansfield previously served as Chief Executive Officer, PBTC International Bank; Partner, Arthur Young & Company (now Ernst & Young LLP); Chief Financial Officer of Retail Banking Sector, Chase Manhattan Bank; Senior Vice President, HSBC Bank USA (formerly, Marine Midland Bank); Vice President, Citibank; Assistant Professor of Banking and Finance, Frank G. Zarb School of Business, Hofstra University; Executive Vice President DVC Group, Inc. (marketing, communications and technology). |
| Thomas M. O'Neill Birth Date: June 14, 1951 Trustee Indefinite Term Began serving: October 2006 | Principal Occupations: Director or Trustee, Chair of the Audit Committee of the Federated Fund Family; Sole Proprietor, Navigator Management Company (investment and strategic consulting). Other Directorships Held: None. Qualifications: Mr. O'Neill has served in several business, mutual fund and financial management roles and directorship positions throughout his career. Mr. O'Neill serves as Director, Medicines for Humanity and Director, The Golisano Children's Museum of Naples, Florida. Mr. O'Neill previously served as Chief Executive Officer and President, Managing Director and Chief Investment Officer, Fleet Investment Advisors; President and Chief Executive Officer, Aeltus Investment Management, Inc.; General Partner, Hellman, Jordan Management Co., Boston, MA; Chief Investment Officer, The Putnam Companies, Boston, MA; Credit Analyst and Lending Officer, Fleet Bank; Director and Consultant, EZE Castle Software (investment order management software); and Director, Midway Pacific (lumber). |
| P. Jerome Richey Birth Date: February 23, 1949 Trustee Indefinite Term Began serving: October 2013 | Principal Occupations: Director or Trustee of the Federated Fund Family; Management Consultant. Other Directorships Held: None. Qualifications: Mr. Richey has served in several business and legal management roles and directorship positions throughout his career. Mr. Richey most recently held the positions of Senior Vice Chancellor and Chief Legal Officer, University of Pittsburgh. Mr. Richey serves as Board Member, Epilepsy Foundation of Western Pennsylvania and Board member, World Affairs Council of Pittsburgh. Mr. Richey previously served as Chief Legal Officer and Executive Vice President, CONSOL Energy Inc. and Shareholder, Buchanan Ingersoll & Rooney PC (a law firm). |
| John S. Walsh Birth Date: November 28, 1957 Trustee Indefinite Term Began serving: January 1999 | Principal Occupations: Director or Trustee of the Federated Fund Family; President and Director, Heat Wagon, Inc. (manufacturer of construction temporary heaters); President and Director, Manufacturers Products, Inc. (distributor of portable construction heaters); President, Portable Heater Parts, a division of Manufacturers Products, Inc. Other Directorships Held: None. Qualifications: Mr. Walsh has served in several business management roles and directorship positions throughout his career. Mr. Walsh previously served as Vice President, Walsh & Kelly, Inc. (paving contractors). |
| Name Birth Date Address Positions Held with Trust Date Service Began | Principal Occupation(s) for Past Five Years and Previous Position(s) |
| John W. McGonigle Birth Date: October 26, 1938 EXECUTIVE VICE PRESIDENT AND SECRETARY Officer since: September 1993 | Principal Occupations: Executive Vice President and Secretary of the Federated Fund Family; Vice Chairman, Executive Vice President, Secretary and Director, Federated Investors, Inc. Previous Positions: Trustee, Federated Investment Management Company and Federated Investment Counseling; Director, Federated Global Investment Management Corp., Federated Services Company and Federated Securities Corp. |
| Lori A. Hensler Birth Date: January 6, 1967 TREASURER Officer since: April 2013 | Principal Occupations: Principal Financial Officer and Treasurer of the Federated Fund Family; Senior Vice President, Federated Administrative Services; Financial and Operations Principal for Federated Securities Corp. and Edgewood Services, Inc.; and Assistant Treasurer, Federated Investors Trust Company. Ms. Hensler has received the Certified Public Accountant designation. Previous Positions: Controller of Federated Investors, Inc.; Senior Vice President and Assistant Treasurer, Federated Investors Management Company; Treasurer, Federated Investors Trust Company; Assistant Treasurer, Federated Administrative Services, Federated Administrative Services, Inc., Federated Securities Corp., Edgewood Services, Inc., Federated Advisory Services Company, Federated Equity Management Company of Pennsylvania, Federated Global Investment Management Corp., Federated Investment Counseling, Federated Investment Management Company, Passport Research, Ltd., and Federated MDTA, LLC; Financial and Operations Principal for Federated Securities Corp., Edgewood Services, Inc. and Southpointe Distribution Services, Inc. |
| Peter J. Germain Birth Date: September 3, 1959 CHIEF LEGAL OFFICER Officer since: January 2005 | Principal Occupations: Mr. Germain is Chief Legal Officer of the Federated Fund Family. He is General Counsel and Vice President, Federated Investors, Inc.; President, Federated Administrative Services and Federated Administrative Services, Inc.; Vice President, Federated Securities Corp.; Secretary, Federated Private Asset Management, Inc.; and Secretary, Retirement Plan Service Company of America. Mr. Germain joined Federated in 1984 and is a member of the Pennsylvania Bar Association. Previous Positions: Deputy General Counsel, Special Counsel, Managing Director of Mutual Fund Services, Federated Investors, Inc.; Senior Vice President, Federated Services Company; and Senior Corporate Counsel, Federated Investors, Inc. |
| Richard B. Fisher Birth Date: May 17, 1923 VICE PRESIDENT Officer since: September 1993 | Principal Occupations: Vice Chairman or Vice President of some of the Funds in the Federated Fund Family; Vice Chairman, Federated Investors, Inc.; Chairman, Federated Securities Corp. Previous Positions: President and Director or Trustee of some of the Funds in the Federated Fund Family; Executive Vice President, Federated Investors, Inc.; Director and Chief Executive Officer, Federated Securities Corp. |
| John B. Fisher Birth Date: May 16, 1956 PRESIDENT Officer since: November 2004 | Principal Occupations: President, Director/Trustee and CEO, Federated Advisory Services Company, Federated Equity Management Company of Pennsylvania, Federated Global Investment Management Corp., Federated Investment Counseling, Federated Investment Management Company; President and CEO of Passport Research, Ltd.; President of some of the Funds in the Federated Fund Family; Director, Federated Investors Trust Company. Previous Positions: President and Director of the Institutional Sales Division of Federated Securities Corp.; President and Director of Federated Investment Counseling; Director, Edgewood Securities Corp.; Director, Federated Services Company; Director, Federated Investors, Inc.; Chairman and Director, Southpointe Distribution Services, Inc.; President, Technology, Federated Services Company. |
| Stephen Van Meter Birth Date: June 5, 1975 CHIEF COMPLIANCE OFFICER AND SENIOR VICE PRESIDENT Officer since: July 2015 | Principal Occupations: Senior Vice President and Chief Compliance Officer of the Federated Fund Family; Vice President and Chief Compliance Officer of Federated Investors, Inc. and Chief Compliance Officer of certain of its subsidiaries. Mr. Van Meter joined Federated in October 2011. He holds FINRA licenses under Series 3, 7, 24 and 66. Previous Positions: Mr. Van Meter previously held the position of Compliance Operating Officer, Federated Investors, Inc. Prior to joining Federated, Mr. Van Meter served at the United States Securities and Exchange Commission in the positions of Senior Counsel, Office of Chief Counsel, Division of Investment Management and Senior Counsel, Division of Enforcement. |
| Stephen F. Auth Birth Date: September 3, 1956 101 Park Avenue 41st Floor New York, NY 10178 CHIEF INVESTMENT OFFICER Officer since: November 2002 | Principal Occupations: Stephen F. Auth is Chief Investment Officer of various Funds in the Federated Fund Family; Executive Vice President, Federated Investment Counseling, Federated Global Investment Management Corp. and Federated Equity Management Company of Pennsylvania. Previous Positions: Executive Vice President, Federated Investment Management Company and Passport Research, Ltd. (investment advisory subsidiary of Federated); Senior Vice President, Global Portfolio Management Services Division; Senior Vice President, Federated Investment Management Company and Passport Research, Ltd.; Senior Managing Director and Portfolio Manager, Prudential Investments. |
| Robert J. Ostrowski Birth Date: April 26, 1963 Chief Investment Officer Officer since: May 2004 | Principal Occupations: Robert J. Ostrowski joined Federated in 1987 as an Investment Analyst and became a Portfolio Manager in 1990. He was named Chief Investment Officer of Federated's taxable fixed-income products in 2004 and also serves as a Senior Portfolio Manager. Mr. Ostrowski became an Executive Vice President of the Fund's Adviser in 2009 and served as a Senior Vice President of the Fund's Adviser from 1997 to 2009. Mr. Ostrowski has received the Chartered Financial Analyst designation. He received his M.S. in Industrial Administration from Carnegie Mellon University. |
| Deborah A. Cunningham Birth Date: September 15, 1959 Chief Investment Officer Officer since: June 2012 | Principal Occupations: Deborah A. Cunningham was named Chief Investment Officer of Federated's money market products in 2004. She joined Federated in 1981 and has been a Senior Portfolio Manager since 1997 and an Executive Vice President of the Fund's Adviser since 2009. Ms. Cunningham has received the Chartered Financial Analyst designation and holds an M.S.B.A. in Finance from Robert Morris College. |
Federated Investors Funds
4000 Ericsson Drive
Warrendale, PA 15086-7561
or call 1-800-341-7400.
2016 ©Federated Investors, Inc.
Item 2. Code of Ethics
(a) As of the end of the period covered by this report, the registrant has adopted a code of ethics (the "Section 406 Standards for Investment Companies - Ethical Standards for Principal Executive and Financial Officers") that applies to the registrant's Principal Executive Officer and Principal Financial Officer; the registrant's Principal Financial Officer also serves as the Principal Accounting Officer.
(c) There was no amendment to the registrant’s code of ethics described in Item 2(a) above during the period covered by the report.
(d) There was no waiver granted, either actual or implicit, from a provision to the registrant’s code of ethics described in Item 2(a) above during the period covered by the report.
(e) Not Applicable
(f)(3) The registrant hereby undertakes to provide any person, without charge, upon request, a copy of the code of ethics. To request a copy of the code of ethics, contact the registrant at 1-800-341-7400, and ask for a copy of the Section 406 Standards for Investment Companies - Ethical Standards for Principal Executive and Financial Officers.
Item 3. Audit Committee Financial Expert
The registrant's Board has determined that each of the following members of the Board's Audit Committee is an “audit committee financial expert,” and is "independent," for purposes of this Item: John T. Collins, G. Thomas Hough and Thomas M. O'Neill.
Item 4. Principal Accountant Fees and Services
(a) Audit Fees billed to the registrant for the two most recent fiscal years:
Fiscal year ended 2015 - $190,960
Fiscal year ended 2014 - $185,550
(b) Audit-Related Fees billed to the registrant for the two most recent fiscal years:
Fiscal year ended 2015 - $0
Fiscal year ended 2014 - $0
Amount requiring approval of the registrant’s audit committee pursuant to paragraph (c)(7)(ii) of Rule 2-01 of Regulation S-X, $0 and $0 respectively.
(c) Tax Fees billed to the registrant for the two most recent fiscal years:
Fiscal year ended 2015 - $0
Fiscal year ended 2014 - $0
Amount requiring approval of the registrant’s audit committee pursuant to paragraph (c)(7)(ii) of Rule 2-01 of Regulation S-X, $0 and $0 respectively.
(d) All Other Fees billed to the registrant for the two most recent fiscal years:
Fiscal year ended 2015 - $0
Fiscal year ended 2014 - $0
Amount requiring approval of the registrant’s audit committee pursuant to paragraph (c)(7)(ii) of Rule 2-01 of Regulation S-X, $0 and $0 respectively.
(e)(1) Audit Committee Policies regarding Pre-approval of Services.
The Audit Committee is required to pre-approve audit and non-audit services performed by the independent auditor in order to assure that the provision of such services do not impair the auditor’s independence. Unless a type of service to be provided by the independent auditor has received general pre-approval, it will require specific pre-approval by the Audit Committee. Any proposed services exceeding pre-approved cost levels will require specific pre-approval by the Audit Committee.
Certain services have the general pre-approval of the Audit Committee. The term of the general pre-approval is 12 months from the date of pre-approval, unless the Audit Committee specifically provides for a different period. The Audit Committee will annually review the services that may be provided by the independent auditor without obtaining specific pre-approval from the Audit Committee and may grant general pre-approval for such services. The Audit Committee will revise the list of general pre-approved services from time to time, based on subsequent determinations. The Audit Committee will not delegate its responsibilities to pre-approve services performed by the independent auditor to management.
The Audit Committee has delegated pre-approval authority to its Chairman. The Chairman will report any pre-approval decisions to the Audit Committee at its next scheduled meeting. The Committee will designate another member with such pre-approval authority when the Chairman is unavailable.
AUDIT SERVICES
The annual Audit services engagement terms and fees will be subject to the specific pre-approval of the Audit Committee. The Audit Committee must approve any changes in terms, conditions and fees resulting from changes in audit scope, registered investment company (RIC) structure or other matters.
In addition to the annual Audit services engagement specifically approved by the Audit Committee, the Audit Committee may grant general pre-approval for other Audit Services, which are those services that only the independent auditor reasonably can provide. The Audit Committee has pre-approved certain Audit services, all other Audit services must be specifically pre-approved by the Audit Committee.
AUDIT-RELATED SERVICES
Audit-related services are assurance and related services that are reasonably related to the performance of the audit or review of the Company’s financial statements or that are traditionally performed by the independent auditor. The Audit Committee believes that the provision of Audit-related services does not impair the independence of the auditor, and has pre-approved certain Audit-related services, all other Audit-related services must be specifically pre-approved by the Audit Committee.
TAX SERVICES
The Audit Committee believes that the independent auditor can provide Tax services to the Company such as tax compliance, tax planning and tax advice without impairing the auditor’s independence. However, the Audit Committee will not permit the retention of the independent auditor in connection with a transaction initially recommended by the independent auditor, the purpose of which may be tax avoidance and the tax treatment of which may not be supported in the Internal Revenue Code and related regulations. The Audit Committee has pre-approved certain Tax services, all Tax services involving large and complex transactions must be specifically pre-approved by the Audit Committee.
ALL OTHER SERVICES
With respect to the provision of services other than audit, review or attest services the pre-approval requirement is waived if:
| (1) | The aggregate amount of all such services provided constitutes no more than five percent of the total amount of revenues paid by the registrant, the registrant’s adviser (not including any sub-adviser whose role is primarily portfolio management and is subcontracted with or overseen by another investment adviser), and any entity controlling, controlled by, or under common control with the investment adviser that provides ongoing services to the registrant to its accountant during the fiscal year in which the services are provided; |
| (2) | Such services were not recognized by the registrant, the registrant’s adviser (not including any sub-adviser whose role is primarily portfolio management and is subcontracted with or overseen by another investment adviser), and any entity controlling, controlled by, or under common control with the investment adviser that provides ongoing services to the registrant at the time of the engagement to be non-audit services; and |
| (3) | Such services are promptly brought to the attention of the Audit Committee of the issuer and approved prior to the completion of the audit by the Audit Committee or by one or more members of the Audit Committee who are members of the board of directors to whom authority to grant such approvals has been delegated by the Audit Committee. |
The Audit Committee may grant general pre-approval to those permissible non-audit services classified as All Other services that it believes are routine and recurring services, and would not impair the independence of the auditor.
The SEC’s rules and relevant guidance should be consulted to determine the precise definitions of prohibited non-audit services and the applicability of exceptions to certain of the prohibitions.
PRE-APPROVAL FEE LEVELS
Pre-approval fee levels for all services to be provided by the independent auditor will be established annually by the Audit Committee. Any proposed services exceeding these levels will require specific pre-approval by the Audit Committee.
PROCEDURES
Requests or applications to provide services that require specific approval by the Audit Committee will be submitted to the Audit Committee by both the independent auditor and the Principal Accounting Officer and/or Internal Auditor, and must include a joint statement as to whether, in their view, the request or application is consistent with the SEC’s rules on auditor independence.
(e)(2) Percentage of services identified in items 4(b) through 4(d) that were approved by the registrants audit committee pursuant to paragraph (c)(7)(i)(C) of Rule 2-01 of Regulation S-X:
4(b)
Fiscal year ended 2015 – 0%
Fiscal year ended 2014 - 0%
Percentage of services provided to the registrants investment adviser and any entity controlling, controlled by, or under common control with the investment adviser that provides ongoing services to the registrant that were approved by the registrants audit committee pursuant to paragraph (c)(7)(i)(C) of Rule 2-01 of Regulation S-X, 0% and 0% respectively.
4(c)
Fiscal year ended 2015 – 0%
Fiscal year ended 2014 – 0%
Percentage of services provided to the registrants investment adviser and any entity controlling, controlled by, or under common control with the investment adviser that provides ongoing services to the registrant that were approved by the registrants audit committee pursuant to paragraph (c)(7)(i)(C) of Rule 2-01 of Regulation S-X, 0% and 0% respectively.
4(d)
Fiscal year ended 2015 – 0%
Fiscal year ended 2014 – 0%
Percentage of services provided to the registrants investment adviser and any entity controlling, controlled by, or under common control with the investment adviser that provides ongoing services to the registrant that were approved by the registrants audit committee pursuant to paragraph (c)(7)(i)(C) of Rule 2-01 of Regulation S-X, 0% and 0% respectively.
| (f) | NA |
| (g) | Non-Audit Fees billed to the registrant, the registrant’s investment adviser, and certain entities controlling, controlled by or under common control with the investment adviser: |
Fiscal year ended 2015 - $0
Fiscal year ended 2014 - $22,860
(h) The registrant’s Audit Committee has considered that the provision of non-audit services that were rendered to the registrant’s adviser (not including any sub-adviser whose role is primarily portfolio management and is subcontracted with or overseen by another investment adviser), and any entity controlling, controlled by, or under common control with the investment adviser that provides ongoing services to the registrant that were not pre-approved pursuant to paragraph (c)(7)(ii) of Rule 2-01 of Regulation S-X is compatible with maintaining the principal accountant’s independence.
Item 5. Audit Committee of Listed Registrants
Not Applicable
Item 6. Schedule of Investments
(a) The registrant’s Schedule of Investments is included as part of the Report to Stockholders filed under Item 1 of this form.
(b) Not Applicable; Fund had no divestments during the reporting period covered since the previous Form N-CSR filing.
Item 7. Disclosure of Proxy Voting Policies and Procedures for Closed-End Management Investment Companies
| Not Applicable |
Item 8. Portfolio Managers of Closed-End Management Investment Companies
| Not Applicable |
Item 9. Purchases of Equity Securities by Closed-End Management Investment Company and Affiliated Purchasers
| Not Applicable |
Item 10. Submission of Matters to a Vote of Security Holders
No Changes to Report
Item 11. Controls and Procedures
(a) The registrant’s President and Treasurer have concluded that the
registrant’s disclosure controls and procedures (as defined in rule 30a-3(c) under the Act) are effective in design and operation and are sufficient to form the basis of the certifications required by Rule 30a-(2) under the Act, based on their evaluation of these disclosure controls and procedures within 90 days of the filing date of this report on Form N-CSR.
(b) There were no changes in the registrant’s internal control over financial reporting (as defined in rule 30a-3(d) under the Act) during the second fiscal quarter of the period covered by this report that have materially affected, or are reasonably likely to materially affect, the registrant’s internal control over financial reporting.
Item 12. Exhibits
(a)(1) Code of Ethics- Not Applicable to this Report.
(a)(2) Certifications of Principal Executive Officer and Principal Financial Officer.
(a)(3) Not Applicable.
(b) Certifications pursuant to 18 U.S.C. Section 1350.
SIGNATURES
Pursuant to the requirements of the Securities Exchange Act of 1934 and the Investment Company Act of 1940, the registrant has duly caused this report to be signed on its behalf by the undersigned, thereunto duly authorized.
Registrant Federated Insurance Series
By /S/ Lori A. Hensler
Lori A. Hensler, Principal Financial Officer
Date February 12, 2016
Pursuant to the requirements of the Securities Exchange Act of 1934 and the Investment Company Act of 1940, this report has been signed below by the following persons on behalf of the registrant and in the capacities and on the dates indicated.
By /S/ John B. Fisher
John B. Fisher, Principal Executive Officer
Date February 12, 2016
By /S/ Lori A. Hensler
Lori A. Hensler, Principal Financial Officer
Date February 12, 2016