United States
Securities and Exchange Commission
Washington, D.C. 20549
Form N-CSR
Certified Shareholder Report of Registered Management Investment Companies
811-8042
(Investment Company Act File Number)
Federated Insurance Series
_______________________________________________________________
(Exact Name of Registrant as Specified in Charter)
Federated Investors Funds
4000 Ericsson Drive
Warrendale, Pennsylvania 15086-7561
(Address of Principal Executive Offices)
(412) 288-1900
(Registrant's Telephone Number)
Peter J. Germain, Esquire
Federated Investors Tower
1001 Liberty Avenue
Pittsburgh, Pennsylvania 15222-3779
(Name and Address of Agent for Service)
(Notices should be sent to the Agent for Service)
Date of Fiscal Year End: 12/31/17
Date of Reporting Period: 12/31/17
| Item 1. | Reports to Stockholders |

| Share Class | Primary | Service |

| 1 | Please see the footnotes to the line graphs under “Fund Performance and Growth of a $10,000 Investment” below for the definition of, and more information about, the S& P 500. |
| 2 | Please see the footnotes to the line graphs under “Fund Performance and Growth of a $10,000 Investment” below for the definition of, and more information about, the Blended Index (60% MSCI ACWI and 40% BBUSUI). The Blended Index is being used for comparison purposes because, although it is not the Fund's broad-based securities market index, the Fund's Adviser believes it more closely reflects the market sectors in which the Fund invests. |
| 3 | Volatility is a statistical measurement of the frequency and level of changes in the value of an asset, index or instrument without regard to the direction of those changes. Volatility may result from rapid and dramatic price swings. |
| 4 | The CBOE Volatility Index (VIX) is a key measure of market expectations of near-term volatility conveyed by S&P 500 stock index option prices.* |
| 5 | The Russell 2000® Index measures the performance of the small-cap segment of the U.S. equity universe. The index is a subset of the Russell 3000® Index representing approximately 10% of the total market capitalization of that index. It includes approximately 2000 of the smallest securities based on a combination of their market cap and current index membership. The R2000 is constructed to provide a comprehensive and unbiased small-cap barometer and is completely reconstituted annually to ensure larger stocks do not distort the performance and characteristics of the true small-cap opportunity set.* |
| 6 | The Bloomberg Barclays U.S. Aggregate Bond Index measures the investment grade, U.S. dollar-denominated, fixed-rate taxable bond market, including Treasuries, government-related and corporate securities, mortgage-backed securities (agency fixed-rate and hybrid ARM pass-throughs), asset-backed securities and commercial mortgage-backed securities.* |
| 7 | The DBIQ Optimum Yield Diversified Commodity Index is based on 14 commodities drawn from the Energy, Precious Metals, Industrial Metals and Agriculture sectors.* |
| 8 | The BofA Merrill Lynch U.S. High Yield Index tracks the performance of U.S. dollar-denominated below investment-grade corporate debt publicly issued in the U.S. domestic market.* |
| 9 | The Bloomberg Barclays U.S. TIPS Index is a market value-weighted index that tracks inflation-protected securities issued by the U.S. Treasury.* |
| 10 | Diversification does not assure a profit nor protect against loss. |
| 11 | The Fund's use of derivative instruments involves risks different from, or possibly greater than, the risks associated with investing directly in securities and other traditional instruments. |
| * | The index is unmanaged, and it is not possible to invest directly in an index. |
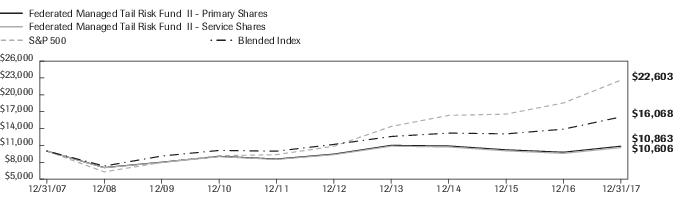
| Federated Managed Tail Risk Fund II - | Primary Shares | Service Shares | NA | S&P 500 | Blended Index |
| F | F | NA | I | I | |
| 12/31/2007 | 10,000 | 10,000 | 10,000 | 10,000 | |
| 12/31/2008 | 7,063 | 7,033 | 6,300 | 7,334 | |
| 12/31/2009 | 8,016 | 7,966 | 7,968 | 9,111 | |
| 12/31/2010 | 9,063 | 9,003 | 9,168 | 10,113 | |
| 12/31/2011 | 8,584 | 8,507 | 9,361 | 9,978 | |
| 12/31/2012 | 9,457 | 9,360 | 10,859 | 11,178 | |
| 12/31/2013 | 11,013 | 10,868 | 14,377 | 12,589 | |
| 12/31/2014 | 10,906 | 10,723 | 16,345 | 13,193 | |
| 12/31/2015 | 10,220 | 10,033 | 16,571 | 13,055 | |
| 12/31/2016 | 9,791 | 9,584 | 18,553 | 13,894 | |
| 12/31/2017 | 10,863 | 10,606 | 22,603 | 16,068 |
| 1 Year | 5 Years | 10 Years | |
| Primary Shares | 10.95% | 2.81% | 0.83% |
| Service Shares | 10.67% | 2.53% | 0.59% |
| S&P 500 | 21.83% | 15.79% | 8.50% |
| Blended Index | 15.65% | 7.53% | 4.86% |
| 1 | The Fund's performance assumes the reinvestment of all dividends and distributions. The S&P 500, the MSCI ACWI and the BBUSUI have been adjusted to reflect reinvestment of dividends on securities in the index. |
| 2 | The S&P 500 is a capitalization-weighted index of 500 stocks designed to measure performance of the broad domestic economy through changes in the aggregate market value of 500 stocks representing all major industries. The index is not adjusted to reflect sales loads, expenses or other fees that the Securities and Exchange Commission (SEC) requires to be reflected in the Fund's performance. The index is unmanaged and, unlike the Fund, is not affected by cash flows. It is not possible to invest directly in an index. |
| 3 | The MSCI ACWI captures large- and mid-cap representation across 23 developed markets and 23 emerging markets countries. The index covers approximately 85% of the global investable equity opportunity set. The BBUSUI covers USD-denominated taxable bonds that are rated either investment-grade or high-yield. The indexes are not adjusted to reflect sales loads, expenses or other fees that the SEC requires to be reflected in the Fund's performance. The indexes are unmanaged and, unlike the Fund, are not affected by cash flows. It is not possible to invest directly in an index. |
| Portfolio Composition | Percentage of Total Net Assets |
| Securities Sold Short | (2.3)% |
| Derivative Contracts—Short (notional value)2 | (1.7)% |
| Domestic Equity Securities | 37.8% |
| International Equity Securities | 20.4% |
| U.S. Treasury Securities | 9.3% |
| Domestic Fixed-Income Securities | 3.8% |
| Trade Finance Agreements | 4.9% |
| Asset-Backed Securities | 0.3% |
| International Fixed-Income Securities | 1.0% |
| Floating Rate Loan | 0.4% |
| Non-Agency Mortgage-Backed Securities | 0.3% |
| U.S. Government Agency Mortgage-Backed Securities | 1.4% |
| Foreign Governments/Agencies | 0.1% |
| Adjustment for Derivative Contracts (notional value)2 | 1.7% |
| Derivative Contracts3,4 | 0.0% |
| Other Security Types5 | 11.1% |
| Cash Equivalents6 | 8.1% |
| Other Assets and Liabilities—Net7 | 3.4% |
| TOTAL | 100.0% |
| 1 | See the Fund's Prospectus for a description of the principal types of securities in which the Fund invests. As of the date specified above, the Fund owned shares of one or more affiliated investment companies. For purposes of this table, the affiliated investment company (other than an affiliated money market mutual fund) is not treated as a single portfolio security, but rather the Fund is treated as owning a pro rata portion of each security and each other asset and liability owned by the affiliated investment company. Accordingly, the percentages of total net assets shown in the table will differ from those presented on the Portfolio of Investments. |
| 2 | Represents the notional value of S&P 500 futures contracts held by the Federated Prudent Bear Fund and Federated Absolute Return Fund. |
| 3 | Based upon net unrealized appreciation (depreciation) or value of the derivative contracts as applicable. Derivative contracts may consist of futures, forwards, options and swaps. The impact of a derivative contract on the Fund's performance may be larger than its unrealized appreciation (depreciation) or value may indicate. In many cases, the notional value or amount of a derivative contract may provide a better indication of the contract's significance to the portfolio. More complete information regarding the Fund's direct investments in derivative contracts, including unrealized appreciation (depreciation), value, and notional values or amounts of such contracts, can be found in the table at the end of the Portfolio of Investments included in this Report. |
| 4 | Represents less than 0.1%. |
| 5 | Other Security Types consist of exchange-traded funds. |
| 6 | Cash Equivalents include any investments in money market mutual funds and/or overnight repurchase agreements. |
| 7 | Assets, other than investments in securities and derivative contracts, less liabilities. See Statement of Assets and Liabilities. |
| Shares or Principal Amount | Value | ||
| 1 | INVESTMENT COMPANIES—79.1% | ||
| 71,406 | Emerging Markets Core Fund | $723,341 | |
| 1,561,176 | Federated Absolute Return Fund, Institutional Shares | 15,580,536 | |
| 71,954 | Federated Bank Loan Core Fund | 724,581 | |
| 817,546 | Federated Clover Small Value Fund, Institutional Shares | 21,256,199 | |
| 826,451 | Federated Equity Income Fund, Inc., Institutional Shares | 20,909,216 | |
| 704,213 | Federated Intermediate Corporate Bond Fund, Institutional Shares | 6,464,674 | |
| 401,179 | Federated International Leaders Fund, Class R6 Shares | 14,992,066 | |
| 3,816,293 | Federated International Strategic Value Dividend Fund, Institutional Shares | 14,387,424 | |
| 602,953 | Federated Kaufmann Large Cap Fund, Class R6 Shares | 14,507,040 | |
| 316,796 | Federated Mortgage Core Portfolio | 3,104,599 | |
| 1,232,320 | Federated Project and Trade Finance Core Fund | 11,189,468 | |
| 488,874 | Federated Prudent Bear Fund, Institutional Shares | 7,797,536 | |
| 3,394,487 | Federated Strategic Value Dividend Fund, Institutional Shares | 20,876,093 | |
| 992 | Federated U.S. Gov't Securities Fund: 2-5 Years, Institutional Shares | 10,672 | |
| 200,581 | High Yield Bond Portfolio | 1,283,721 | |
| TOTAL INVESTMENT COMPANIES (IDENTIFIED COST $158,194,997) | 153,807,166 | ||
| CORPORATE BONDS—1.3% | |||
| $25,000 | Abbott Laboratories, Sr. Unsecd. Note, 4.9%, 11/30/2046 | 28,753 | |
| 25,000 | Advance Auto Parts, Inc., 4.5%, 12/01/2023 | 26,313 | |
| 150,000 | American Honda Finance Co., Unsecd. Deb., Series MTN, 2.25%, 8/15/2019 | 150,245 | |
| 60,000 | Atmos Energy Corp., Sr. Unsecd. Note, 4.125%, 10/15/2044 | 65,622 | |
| 75,000 | Autodesk, Inc., Sr. Unsecd. Note, 4.375%, 6/15/2025 | 78,805 | |
| 100,000 | AutoZone, Inc., Sr. Unsecd. Note, 3.250%, 4/15/2025 | 99,755 | |
| 20,000 | BB&T Corp., Sr. Unsecd. Note, Series MTN, 2.250%, 2/01/2019 | 20,036 | |
| 50,000 | 2 | Bank of America Corp., Sr. Unsecd. Note, Series MTN, 1.971%, (3-month USLIBOR +0.650%), 10/01/2021 | 50,252 |
| 50,000 | Bank of America Corp., Sub. Note, Series L, 3.95%, 4/21/2025 | 51,743 | |
| 100,000 | Becton Dickinson & Co., Sr. Unsecd. Note, 4.685%, 12/15/2044 | 109,682 | |
| 30,000 | Berkshire Hathaway, Inc., Sr. Unsecd. Note, 3.125%, 3/15/2026 | 30,363 | |
| 100,000 | Canadian Natural Resources Ltd., 3.900%, 2/01/2025 | 103,087 | |
| 22,000 | Carpenter Technology Corp., Sr. Unsecd. Note, 4.450%, 3/01/2023 | 22,451 | |
| 30,000 | Chubb INA Holdings, Inc., 3.35%, 5/03/2026 | 30,641 | |
| 30,000 | Comerica, Inc., 3.8%, 7/22/2026 | 30,482 | |
| 50,000 | Embraer Overseas Ltd., Sr. Unsecd. Note, Series 144A, 5.696%, 9/16/2023 | 54,875 | |
| 40,000 | Energy Transfer Partners LP, Sr. Unsecd. Note, 4.900%, 2/01/2024 | 42,346 | |
| 50,000 | Energy Transfer Partners, Sr. Unsecd. Note, 4.05%, 3/15/2025 | 50,029 | |
| 70,000 | Enterprise Products Operating, Sr. Unsecd. Note, 3.95%, 2/15/2027 | 72,872 | |
| 70,000 | EverSource Energy, Sr. Unsecd. Note, 3.350%, 3/15/2026 | 70,487 | |
| 70,000 | Exelon Corp., Sr. Unsecd. Note, 3.4%, 4/15/2026 | 70,130 | |
| 50,000 | Exelon Generation Co. LLC, Sr. Unsecd. Note, 4.250%, 6/15/2022 | 52,508 | |
| 20,000 | Indiana Michigan Power Co., Sr. Unsecd. Note, Series K, 4.55%, 3/15/2046 | 22,884 | |
| 40,000 | Invesco Finance PLC, Sr. Unsecd. Note, 3.75%, 1/15/2026 | 41,385 | |
| 40,000 | Liberty Mutual Group, Inc., 4.85%, Series 144A, 8/01/2044 | 44,589 | |
| 70,000 | Liberty Property LP, Sr. Unsecd. Note, 3.75%, 4/01/2025 | 71,777 | |
| 40,000 | Masco Corp., Sr. Unsecd. Note, 4.375%, 4/01/2026 | 42,420 | |
| 50,000 | National Rural Utilities Cooperative Finance Corp., Sr. Sub., 5.250%, 4/20/2046 | 53,789 | |
| 70,000 | Newell Rubbermaid, Inc., Sr. Unsecd. Note, 4.2%, 4/01/2026 | 73,165 | |
| 25,000 | NextEra Energy Capital Holdings, Inc., Sr. Unsecd. Note, 2.700%, 9/15/2019 | 25,160 |
| Shares or Principal Amount | Value | ||
| CORPORATE BONDS—continued | |||
| $40,000 | O'Reilly Automotive, Inc., Sr. Unsecd. Note, 3.55%, 3/15/2026 | $40,471 | |
| 35,000 | ONEOK, Inc., Sr Unsecd. Note, Series 0, 4.95%, 7/13/2047 | 36,524 | |
| 100,000 | Omnicom Group, Inc., Sr. Unsecd. Note, 3.600%, 4/15/2026 | 101,317 | |
| 10,000 | Stryker Corp., Sr. Unsecd. Note, 3.5%, 3/15/2026 | 10,334 | |
| 60,000 | SunTrust Banks, Inc., Sr. Unsecd. Note, 2.9%, 3/03/2021 | 60,711 | |
| 20,000 | Textron, Inc., Sr. Unsecd. Note, 4.000%, 3/15/2026 | 20,892 | |
| 25,000 | Textron, Inc., Sr. Unsecd. Note, 4.300%, 3/01/2024 | 26,467 | |
| 20,000 | Total System Services, Inc., Sr. Unsecd. Note, 4.8%, 4/01/2026 | 21,669 | |
| 25,000 | Verisk Analytics, Inc., Sr. Unsecd. Note, 5.500%, 6/15/2045 | 29,212 | |
| 125,000 | Verizon Communications, Inc., Sr. Unsecd. Note, 5.150%, 9/15/2023 | 139,232 | |
| 16,000 | Viacom, Inc., Sr. Unsecd. Note, 3.875%, 4/01/2024 | 15,982 | |
| 30,000 | Visa, Inc., Sr. Unsecd. Note, 3.15%, 12/14/2025 | 30,693 | |
| 50,000 | 2 | Wells Fargo & Co., Sr. Unsecd. Note, 2.610%, (3-month USLIBOR +1.230%), 10/31/2023 | 51,364 |
| 90,000 | Williams Partners LP, 4.9%, 1/15/2045 | 95,760 | |
| 35,000 | Worthington Industries, Inc., Sr Unsecd. Note, Series 0, 4.3%, 8/01/2032 | 35,224 | |
| 55,000 | Worthington Industries, Inc., Sr. Unsecd. Note, 4.550%, 4/15/2026 | 57,073 | |
| TOTAL CORPORATE BONDS (IDENTIFIED COST $2,351,232) | 2,459,571 | ||
| ASSET-BACKED SECURITIES—0.1% | |||
| 150,000 | 2 | American Express Credit Account Master Trust 2014-1, Class A, 1.847%, (1-month USLIBOR +0.370%), 12/15/2021 | 150,572 |
| 90,000 | 2 | Navistar Financial Dealer Note Master Trust 2016-1, Class A, 2.902%, (1-month USLIBOR +1.350%), 9/27/2021 | 90,536 |
| 42,000 | PFS Financing Corp., 2016-BA, Class A, 1.87%, 10/15/2021 | 41,472 | |
| TOTAL ASSET-BACKED SECURITIES (IDENTIFIED COST $281,999) | 282,580 | ||
| COMMERCIAL MORTGAGE-BACKED SECURITIES—0.3% | |||
| 60,000 | Banc of America Commercial Mortgage Trust 2016-UBS10, Class A4, 3.17%, 7/15/2049 | 60,077 | |
| 95,000 | CD Commercial Mortgage Trust 2016-CD1, Class A4, 2.724%, 8/10/2049 | 92,348 | |
| 50,000 | Commercial Mortgage Trust 2015-DC1, Class AM, 3.724%, 2/10/2048 | 50,882 | |
| 150,000 | Federal Home Loan Mortgage Corp., 2.566%, 9/25/2020 | 151,016 | |
| 100,000 | JPMDB Commercial Mortgage Securities Trust 2016-C4, Class A3, 3.1413%, 12/15/2049 | 100,188 | |
| 105,000 | WF-RBS Commercial Mortgage Trust 2014-C25, Class B, 4.236%, 11/15/2047 | 106,975 | |
| TOTAL COMMERCIAL MORTGAGE-BACKED SECURITIES (IDENTIFIED COST $373,418) | 561,486 | ||
| COLLATERALIZED MORTGAGE OBLIGATION—0.0% | |||
| 85,000 | Bank A4, 3.488%, 11/15/2050 (IDENTIFIED COST $87,547) | 87,104 | |
| EXCHANGE-TRADED FUNDS—8.1% | |||
| 83,160 | iShares MSCI Emerging Market | 3,918,499 | |
| 70,312 | iShares Dow Jones U.S. Real Estate Index Fund | 5,695,975 | |
| 366,452 | 3 | PowerShares DB Commodity Index Tracking Fund | 6,086,768 |
| TOTAL EXCHANGE-TRADED FUNDS (IDENTIFIED COST $16,870,959) | 15,701,242 | ||
| U.S. TREASURY—6.3% | |||
| $106,981 | U.S. Treasury Inflation-Protected Bond, 0.750%, 2/15/2042 | 107,859 | |
| 437,855 | U.S. Treasury Inflation-Protected Bond, 0.750%, 2/15/2045 | 439,558 | |
| 51,092 | U.S. Treasury Inflation-Protected Bond, 0.875%, 2/15/2047 | 53,045 | |
| 51,011 | U.S. Treasury Inflation-Protected Bond, 1.000%, 2/15/2046 | 54,423 | |
| 872,431 | U.S. Treasury Inflation-Protected Bond, 1.375%, 2/15/2044 | 1,006,495 | |
| 1,436,465 | U.S. Treasury Inflation-Protected Bond, 1.750%, 1/15/2028 | 1,612,714 | |
| 1,140,890 | U.S. Treasury Inflation-Protected Bond, 2.000%, 1/15/2026 | 1,282,171 | |
| 765,537 | U.S. Treasury Inflation-Protected Bond, 2.375%, 1/15/2025 | 871,794 | |
| 1,579,050 | U.S. Treasury Inflation-Protected Note, 0.125%, 4/15/2019 | 1,575,222 |
| Shares or Principal Amount | Value | ||
| U.S. TREASURY—continued | |||
| $461,354 | U.S. Treasury Inflation-Protected Note, 0.125%, 4/15/2020 | $460,357 | |
| 353,858 | U.S. Treasury Inflation-Protected Note, 0.125%, 4/15/2021 | 352,300 | |
| 190,722 | U.S. Treasury Inflation-Protected Note, 0.125%, 1/15/2022 | 189,888 | |
| 740,424 | U.S. Treasury Inflation-Protected Note, 0.125%, 4/15/2022 | 735,066 | |
| 3,116 | U.S. Treasury Inflation-Protected Note, 0.125%, 7/15/2024 | 3,078 | |
| 49,989 | U.S. Treasury Inflation-Protected Note, 0.250%, 1/15/2025 | 49,515 | |
| 104,016 | U.S. Treasury Inflation-Protected Note, 0.375%, 7/15/2025 | 104,123 | |
| 229,759 | U.S. Treasury Inflation-Protected Note, 0.375%, 1/15/2027 | 228,021 | |
| 55,461 | U.S. Treasury Inflation-Protected Note, 0.375%, 7/15/2027 | 55,149 | |
| 1,026,502 | U.S. Treasury Inflation-Protected Note, 0.625%, 1/15/2024 | 1,043,681 | |
| 67,478 | U.S. Treasury Inflation-Protected Note, 0.625%, 1/15/2026 | 68,515 | |
| 1,710,163 | U.S. Treasury Inflation-Protected Note, 1.250%, 7/15/2020 | 1,765,335 | |
| 55,000 | United States Treasury Bond, 2.750%, 8/15/2047 | 55,069 | |
| 1,000 | United States Treasury Bond, 3.000%, 11/15/2044 | 1,051 | |
| 25,000 | United States Treasury Bond, 3.000%, 5/15/2047 | 26,287 | |
| 90,000 | United States Treasury Note, 2.000%, 11/30/2022 | 89,191 | |
| 15,000 | United States Treasury Note, 2.250%, 8/15/2027 | 14,798 | |
| TOTAL U.S. TREASURY (IDENTIFIED COST $12,291,578) | 12,244,705 | ||
| REPURCHASE AGREEMENT—4.8% | |||
| 9,246,000 | Interest in $950,000,000 joint repurchase agreement 1.42%, dated 12/29/2017 under which Bank of America, N.A. will repurchase securities provided as collateral for $950,149,889 on 1/2/2018. The securities provided as collateral at the end of the period held with BNY Mellon as tri-party agent, were U.S. Government Agency securities maturing on 7/20/2046 and the market value of those underlying securities was $969,152,887. (IDENTIFIED COST $9,246,000) | 9,246,000 | |
| TOTAL INVESTMENT IN SECURITIES—100.0% (IDENTIFIED COST $199,697,730)4 | 194,389,854 | ||
| OTHER ASSETS AND LIABILITIES - NET—0.0%5 | (50,889) | ||
| TOTAL NET ASSETS—100% | $194,338,965 |
| Description | Number of Contracts | Notional Value | Expiration Date | Value and Unrealized Appreciation (Depreciation) |
| 3United States Treasury Long Bond Long Futures | 3 | $459,000 | March 2018 | $1,204 |
| 3United States Treasury Notes 2-Year Long Futures | 16 | $3,425,750 | March 2018 | $(1,046) |
| 3United States Treasury Notes 5-Year Long Futures | 2 | $232,328 | March 2018 | $167 |
| 3United States Treasury Ultra Bond Long Futures | 7 | $1,173,594 | March 2018 | $5,180 |
| 3United States Treasury Notes 10-Year Short Futures | 10 | $1,240,469 | March 2018 | $7,803 |
| 3United States Treasury Ultra 10-Year Short Futures | 6 | $801,375 | March 2018 | $(1,232) |
| NET UNREALIZED APPRECIATION ON FUTURES CONTRACTS | $12,076 | |||
| 1 | Affiliated holdings. |
| Balance of Shares Held 12/31/2016 | Purchases/ Additions | Sales/ Reductions | Balance of Shares Held 12/31/2017 | Value | Change in Unrealized Appreciation/ Depreciation | Net Realized Gain/(Loss) | Dividend Income | Gain Distributions Received | |
| Emerging Markets Core Fund | 51,306 | 20,100 | — | 71,406 | $723,341 | $12,092 | $— | $33,215 | $834 |
| Federated Absolute Return Fund, Institutional Shares | 1,659,003 | 20,125 | (117,952) | 1,561,176 | 15,580,536 | 815,661 | (8,718) | 96,242 | — |
| Federated Bank Loan Core Fund | 77,949 | 3,565 | (9,560) | 71,954 | 724,581 | (10,491) | 3,339 | 36,112 | — |
| Federated Clover Small Value Fund, Institutional Shares | 730,265 | 184,407 | (97,126) | 817,546 | 21,256,199 | (1,237,090) | 438,749 | 159,370 | 3,025,002 |
| Federated Equity Income Fund, Inc., Institutional Shares | 833,185 | 114,586 | (121,320) | 826,451 | 20,909,216 | 1,739,827 | 233,600 | 475,082 | 677,436 |
| Federated Intermediate Corporate Bond Fund, Institutional Shares | 798,016 | 28,513 | (122,316) | 704,213 | 6,464,674 | 37,400 | (30,934) | 207,481 | 73,164 |
| Federated International Leaders Fund, Class R6 Shares | 349,652 | 127,110 | (75,583) | 401,179 | 14,992,066 | 2,842,187 | 22,891 | 98,675 | — |
| Federated International Strategic Value Dividend Fund, Institutional Shares | 2,977,505 | 1,321,549 | (482,761) | 3,816,293 | 14,387,424 | 1,044,943 | (45,606) | 495,249 | — |
| Federated Kaufmann Large Cap Fund, Class R6 Shares | 744,525 | 8,568 | (150,140) | 602,953 | 14,507,040 | 2,562,418 | 385,224 | — | 202,456 |
| Federated Mortgage Core Portfolio | 494,493 | 10,345 | (188,042) | 316,796 | 3,104,599 | 25,757 | (26,708) | 101,666 | — |
| Federated Project and Trade Finance Core Fund | 1,182,345 | 49,975 | — | 1,232,320 | 11,189,468 | (252,606) | — | 458,066 | — |
| Federated Prudent Bear Fund, Institutional Shares | 417,944 | 83,700 | (12,770) | 488,874 | 7,797,536 | (1,290,203) | (1,405) | — | — |
| Federated Strategic Value Dividend Fund, Institutional Shares | 3,245,193 | 499,370 | (350,076) | 3,394,487 | 20,876,093 | 591,936 | 225,805 | 752,745 | 1,316,516 |
| Federated U.S. Gov't Securities Fund: 2-5 Years, Institutional Shares | 980 | 12 | — | 992 | 10,672 | (108) | — | 138 | — |
| High Yield Bond Portfolio | 232,162 | 19,800 | (51,381) | 200,581 | 1,283,721 | 30,236 | (13,274) | 77,096 | — |
| Affiliated issuers no longer in the portfolio at period end | 545,762 | — | (545,762) | — | — | 2,501,233 | — | — | — |
| TOTAL OF AFFILIATED TRANSACTIONS | 14,340,285 | 2,491,725 | (2,324,789) | 14,507,221 | $153,807,166 | $9,413,192 | $1,182,963 | $2,991,137 | $5,295,408 |
| 2 | Floating/variable note with current rate and current maturity or next reset date shown. |
| 3 | Non-income-producing security. |
| 4 | The cost of investments for federal tax purposes amounts to $199,987,119. |
| 5 | Assets, other than investments in securities, less liabilities. See Statement of Assets and Liabilities. |
| Valuation Inputs | ||||
| Level 1— Quoted Prices | Level 2— Other Significant Observable Inputs | Level 3— Significant Unobservable Inputs | Total | |
| Investment Companies1 | $136,781,456 | $— | $— | $153,807,166 |
| Debt Securities: | ||||
| Corporate Bonds | — | 2,459,571 | — | 2,459,571 |
| Asset-Backed Securities | — | 282,580 | — | 282,580 |
| Commercial Mortgage-Backed Securities | — | 561,486 | — | 561,486 |
| Collateralized Mortgage Obligations | — | 87,104 | — | 87,104 |
| U.S. Treasury | — | 12,244,705 | — | 12,244,705 |
| Exchange-Traded Funds | 15,701,242 | — | — | 15,701,242 |
| Repurchase Agreement | — | 9,246,000 | — | 9,246,000 |
| TOTAL SECURITIES | $152,482,698 | $24,881,446 | $— | $194,389,854 |
| Other Financial Instruments2 | ||||
| Assets | $14,354 | $— | $— | $14,354 |
| Liabilities | (2,278) | — | — | (2,278) |
| TOTAL OTHER FINANCIAL INSTRUMENTS | $12,076 | $— | $— | $12,076 |
| 1 | As permitted by U.S. generally accepted accounting principles (GAAP), Investment Companies valued at $17,025,710 are measured at fair value using the net asset value (NAV) per share practical expedient and have not been categorized in the chart above but are included in the Total column. The amount included herein is intended to permit reconciliation of the fair value classifications to the amounts presented on the Statement of Assets and Liabilities. The price of shares redeemed in Emerging Markets Core Fund, Federated Bank Loan Core Fund, Federated Mortgage Core Portfolio and High Yield Bond Portfolio is the next determined NAV after receipt of a shareholder redemption request. The price of shares redeemed of Federated Project and Trade Finance Core Fund may be determined as of the closing NAV of the fund up to twenty-four days after receipt of a shareholder redemption request. |
| 2 | Other Financial Instruments are futures contracts. |
| LIBOR | —London Interbank Offered Rate |
| MTN | —Medium Term Note |
| Year Ended December 31 | 2017 | 2016 | 2015 | 2014 | 2013 |
| Net Asset Value, Beginning of Period | $4.81 | $5.11 | $5.55 | $7.06 | $6.25 |
| Income From Investment Operations: | |||||
| Net investment income | 0.081 | 0.081 | 0.08 | 0.081 | 0.111 |
| Net realized and unrealized gain (loss) on investments, futures contracts, written options and foreign currency transactions | 0.44 | (0.29) | (0.42) | (0.13) | 0.91 |
| TOTAL FROM INVESTMENT OPERATIONS | 0.52 | (0.21) | (0.34) | (0.05) | 1.02 |
| Less Distributions: | |||||
| Distributions from net investment income | (0.08) | (0.09) | (0.09) | (0.12) | (0.07) |
| Distributions from net realized gain on investments, futures contracts, written options and foreign currency transactions | — | — | (0.01) | (1.34) | (0.14) |
| TOTAL DISTRIBUTIONS | (0.08) | (0.09) | (0.10) | (1.46) | (0.21) |
| Net Asset Value, End of Period | $5.25 | $4.81 | $5.11 | $5.55 | $7.06 |
| Total Return2 | 10.95% | (4.20)% | (6.29)% | (0.97)% | 16.45% |
| Ratios to Average Net Assets: | |||||
| Net expenses | 0.30% | 0.28% | 0.28% | 0.30% | 0.50% |
| Net investment income | 1.65% | 1.57% | 1.54% | 1.41% | 1.62% |
| Expense waiver/reimbursement3 | 0.67% | 0.69% | 0.67% | 0.61% | 0.53% |
| Supplemental Data: | |||||
| Net assets, end of period (000 omitted) | $137,245 | $133,556 | $141,823 | $153,165 | $169,658 |
| Portfolio turnover | 18% | 21% | 49% | 39% | 137% |
| 1 | Per share numbers have been calculated using the average shares method. |
| 2 | Based on net asset value. Total returns do not reflect any additional fees or expenses that may be imposed by separate accounts of insurance companies or in connection with any variable annuity or variable life insurance contract. |
| 3 | This expense decrease is reflected in both the net expense and the net investment income ratios shown above. |
| Year Ended December 31 | 2017 | 2016 | 2015 | 2014 | 2013 |
| Net Asset Value, Beginning of Period | $4.80 | $5.10 | $5.54 | $7.07 | $6.26 |
| Income From Investment Operations: | |||||
| Net investment income | 0.071 | 0.061 | 0.07 | 0.081 | 0.141 |
| Net realized and unrealized gain (loss) on investments, futures contracts, written options and foreign currency transactions | 0.44 | (0.29) | (0.42) | (0.16) | 0.86 |
| TOTAL FROM INVESTMENT OPERATIONS | 0.51 | (0.23) | (0.35) | (0.08) | 1.00 |
| Less Distributions: | |||||
| Distributions from net investment income | (0.07) | (0.07) | (0.08) | (0.11) | (0.05) |
| Distributions from net realized gain on investments, futures contracts, written options and foreign currency transactions | — | — | (0.01) | (1.34) | (0.14) |
| TOTAL DISTRIBUTIONS | (0.07) | (0.07) | (0.09) | (1.45) | (0.19) |
| Net Asset Value, End of Period | $5.24 | $4.80 | $5.10 | $5.54 | $7.07 |
| Total Return2 | 10.67% | (4.48)% | (6.43)% | (1.33)% | 16.11% |
| Ratios to Average Net Assets: | |||||
| Net expenses | 0.54% | 0.53% | 0.53% | 0.54% | 0.75% |
| Net investment income | 1.36% | 1.32% | 1.29% | 1.46% | 2.01% |
| Expense waiver/reimbursement3 | 0.67% | 0.69% | 0.67% | 0.63% | 0.54% |
| Supplemental Data: | |||||
| Net assets, end of period (000 omitted) | $57,094 | $63,317 | $69,876 | $67,434 | $10,101 |
| Portfolio turnover | 18% | 21% | 49% | 39% | 137% |
| 1 | Per share numbers have been calculated using the average shares method. |
| 2 | Based on net asset value. Total returns do not reflect any additional fees or expenses that may be imposed by separate accounts of insurance companies or in connection with any variable annuity or variable life insurance contract. |
| 3 | This expense decrease is reflected in both the net expense and the net investment income ratios shown above. |
| Assets: | ||
| Investment in securities, at value including $153,807,166 of investment in affiliated holdings (identified cost $199,697,730) | $194,389,854 | |
| Cash | 863 | |
| Restricted cash (Note 2) | 27,605 | |
| Income receivable | 159,294 | |
| Receivable for shares sold | 44,234 | |
| Receivable for daily variation margin on futures contracts | 2,206 | |
| TOTAL ASSETS | 194,624,056 | |
| Liabilities: | ||
| Payable for investments purchased | $58,822 | |
| Payable for shares redeemed | 129,500 | |
| Payable to adviser (Note 5) | 1,804 | |
| Payable for administrative fees (Note 5) | 1,282 | |
| Payable for custodian fees | 7,490 | |
| Payable for auditing fees | 24,980 | |
| Payable for portfolio accounting fees | 36,690 | |
| Payable for distribution services fee (Note 5) | 12,066 | |
| Accrued expenses (Note 5) | 12,457 | |
| TOTAL LIABILITIES | 285,091 | |
| Net assets for 37,047,959 shares outstanding | $194,338,965 | |
| Net Assets Consist of: | ||
| Paid-in capital | $210,802,186 | |
| Net unrealized depreciation of investments and futures contracts | (5,295,800) | |
| Accumulated net realized loss on investments and futures contracts | (15,697,041) | |
| Undistributed net investment income | 4,529,620 | |
| TOTAL NET ASSETS | $194,338,965 | |
| Net Asset Value, Offering Price and Redemption Proceeds Per Share | ||
| Primary Shares: | ||
| Net asset value per share ($137,244,938 ÷ 26,148,844 shares outstanding), no par value, unlimited shares authorized | $5.25 | |
| Service Shares: | ||
| Net asset value per share ($57,094,027 ÷ 10,899,115 shares outstanding), no par value, unlimited shares authorized | $5.24 |
| Investment Income: | ||
| Dividends (including $2,991,137 received from affiliated holdings, see footnotes to Portfolio of Investments) | $3,267,492 | |
| Interest | 486,717 | |
| TOTAL INCOME | 3,754,209 | |
| Expenses: | ||
| Investment adviser fee (Note 5) | $1,455,690 | |
| Administrative fee (Note 5) | 153,638 | |
| Custodian fees | 16,747 | |
| Transfer agent fee | 19,288 | |
| Directors'/Trustees' fees (Note 5) | 2,836 | |
| Auditing fees | 29,390 | |
| Legal fees | 9,208 | |
| Portfolio accounting fees | 70,925 | |
| Distribution services fee (Note 5) | 146,314 | |
| Printing and postage | 89,004 | |
| Miscellaneous (Note 5) | 21,213 | |
| TOTAL EXPENSES | 2,014,253 | |
| Waiver/reimbursement of investment adviser fee (Note 5) | (1,295,516) | |
| Net expenses | 718,737 | |
| Net investment income | 3,035,472 | |
| Realized and Unrealized Gain (Loss) on Investments and Futures Contracts: | ||
| Net realized gain on investments (including net realized gain of $1,182,963 on sales of investments in affiliated holdings) | 1,184,194 | |
| Net realized gain on futures contracts | 42,074 | |
| Realized gain distributions from affiliated investment company shares | 5,295,408 | |
| Net change in unrealized depreciation of investments (including net change in unrealized depreciation of $9,413,192 on investments in affiliated holdings) | 10,601,729 | |
| Net change in unrealized depreciation of futures contracts | 16,245 | |
| Net realized and unrealized gain on investments and futures contracts | 17,139,650 | |
| Change in net assets resulting from operations | $20,175,122 |
| Year Ended December 31 | 2017 | 2016 |
| Increase (Decrease) in Net Assets | ||
| Operations: | ||
| Net investment income | $3,035,472 | $2,994,802 |
| Net realized gain (loss) on investments including allocation from affiliated partnership, futures contracts, written options and foreign currency transactions | 6,521,676 | (17,484,676) |
| Net change in unrealized appreciation of investments, futures contracts and translation of assets and liabilities in foreign currency | 10,617,974 | 5,118,358 |
| CHANGE IN NET ASSETS RESULTING FROM OPERATIONS | 20,175,122 | (9,371,516) |
| Distributions to Shareholders: | ||
| Distributions from net investment income | ||
| Primary Shares | (2,206,940) | (2,372,125) |
| Service Shares | (825,106) | (959,350) |
| CHANGE IN NET ASSETS RESULTING FROM DISTRIBUTIONS TO SHAREHOLDERS | (3,032,046) | (3,331,475) |
| Share Transactions: | ||
| Proceeds from sale of shares | 9,582,389 | 25,650,999 |
| Net asset value of shares issued to shareholders in payment of distributions declared | 3,032,046 | 3,331,475 |
| Cost of shares redeemed | (32,291,581) | (31,104,930) |
| CHANGE IN NET ASSETS RESULTING FROM SHARE TRANSACTIONS | (19,677,146) | (2,122,456) |
| Change in net assets | (2,534,070) | (14,825,447) |
| Net Assets: | ||
| Beginning of period | 196,873,035 | 211,698,482 |
| End of period (including undistributed net investment income of $4,529,620 and $3,069,391, respectively) | $194,338,965 | $196,873,035 |
| ■ | Shares of other mutual funds or non-exchange-traded investment companies are valued based upon their reported NAVs. |
| ■ | Equity securities listed on an exchange or traded through a regulated market system are valued at their last reported sale price or official closing price in their principal exchange or market. |
| ■ | Fixed-income securities are fair valued using price evaluations provided by a pricing service approved by the Fund's Board of Trustees (the “Trustees”). |
| ■ | Derivative contracts listed on exchanges are valued at their reported settlement or closing price, except that options are valued at the mean of closing bid and asked quotations. |
| ■ | Over-the-counter (OTC) derivative contracts are fair valued using price evaluations provided by a pricing service approved by the Trustees. |
| ■ | For securities that are fair valued in accordance with procedures established by and under the general supervision of the Trustees, certain factors may be considered such as: the last traded or purchase price of the security, information obtained by contacting the issuer or dealers, analysis of the issuer's financial statements or other available documents, fundamental analytical data, the nature and duration of restrictions on disposition, the movement of the market in which the security is normally traded, public trading in similar securities or derivative contracts of the issuer or comparable issuers, movement of a relevant index, or other factors including but not limited to industry changes and relevant government actions. |
| ■ | With respect to securities traded principally in foreign markets, significant trends in U.S. equity markets or in the trading of foreign securities index futures contracts; |
| ■ | Political or other developments affecting the economy or markets in which an issuer conducts its operations or its securities are traded; |
| ■ | Announcements concerning matters such as acquisitions, recapitalizations, litigation developments, or a natural disaster affecting the issuer's operations or regulatory changes or market developments affecting the issuer's industry. |
| Fair Value of Derivative Instruments | ||
| Asset | ||
| Statement of Assets and Liabilities Location | Fair Value | |
| Derivatives not accounted for as hedging instruments under ASC Topic 815 | ||
| Interest rate contracts | Receivable for daily variation margin on futures contracts | $12,076* |
| * | Includes cumulative net appreciation of futures contracts as reported in the footnotes to the Portfolio of Investments. Only the current day's variation margin is reported within the Statement of Assets and Liabilities. |
| Amount of Realized Gain or (Loss) on Derivatives Recognized in Income | |
| Futures Contracts | |
| Interest rate contracts | $42,074 |
| Change in Unrealized Appreciation or (Depreciation) on Derivatives Recognized in Income | |
| Futures Contracts | |
| Interest rate contracts | $16,245 |
| Year Ended December 31 | 2017 | 2016 | ||
| Primary Shares: | Shares | Amount | Shares | Amount |
| Shares sold | 1,260,101 | $6,261,034 | 2,955,103 | $14,301,919 |
| Shares issued to shareholders in payment of distributions declared | 452,242 | 2,206,940 | 492,142 | 2,372,125 |
| Shares redeemed | (3,354,022) | (16,735,488) | (3,387,677) | (16,394,502) |
| NET CHANGE RESULTING FROM PRIMARY SHARE TRANSACTIONS | (1,641,679) | $(8,267,514) | 59,568 | $279,542 |
| Year Ended December 31 | 2017 | 2016 | ||
| Service Shares: | Shares | Amount | Shares | Amount |
| Shares sold | 666,337 | $3,321,355 | 2,349,268 | $11,349,080 |
| Shares issued to shareholders in payment of distributions declared | 169,079 | 825,106 | 199,035 | 959,350 |
| Shares redeemed | (3,140,069) | (15,556,093) | (3,041,516) | (14,710,428) |
| NET CHANGE RESULTING FROM SERVICE SHARE TRANSACTIONS | (2,304,653) | $(11,409,632) | (493,213) | $(2,401,998) |
| NET CHANGE RESULTING FROM TOTAL FUND SHARE TRANSACTIONS | (3,946,332) | $(19,677,146) | (433,645) | $(2,122,456) |
| Increase (Decrease) | ||
| Paid-In Capital | Undistributed Net Investment Income (Loss) | Accumulated Net Realized Gain (Loss) |
| $(2,259,665) | $1,456,803 | $802,862 |
| 2017 | 2016 | |
| Ordinary income | $3,032,046 | $3,331,475 |
| Undistributed ordinary income | $4,529,905 |
| Net unrealized depreciation | $(5,597,265) |
| Capital loss carryforwards | $(15,395,861) |
| Short-Term | Long-Term | Total |
| $14,315,581 | $1,080,280 | $15,395,861 |
| Administrative Fee | Average Daily Net Assets of the Investment Complex |
| 0.100% | on assets up to $50 billion |
| 0.075% | on assets over $50 billion |
| Administrative Fee | Average Daily Net Assets of the Investment Complex |
| 0.150% | on the first $5 billion |
| 0.125% | on the next $5 billion |
| 0.100% | on the next $10 billion |
| 0.075% | on assets in excess of $20 billion |
| Share Class Name | Percentage of Average Daily Net Assets of Class |
| Primary Shares | 0.25% |
| Service Shares | 0.25% |
| Distribution Services Fees Incurred | |
| Service Shares | $146,314 |
| Purchases | $29,871,767 |
| Sales | $37,950,234 |

February 14, 2018
| Beginning Account Value 7/1/2017 | Ending Account Value 12/31/2017 | Expenses Paid During Period1 | |
| Actual: | |||
| Primary Shares | $1,000 | $1056.30 | $1.55 |
| Service Shares | $1,000 | $1054.30 | $2.85 |
| Hypothetical (assuming a 5% return before expenses): | |||
| Primary Shares | $1,000 | $1,023.70 | $1.53 |
| Service Shares | $1,000 | $1,022.40 | $2.80 |
| 1 | Expenses are equal to the Fund's annualized net expense ratios, multiplied by the average account value over the period, multiplied by 184/365 (to reflect the one-half-year period). The expenses shown in the table do not include the charges and expenses imposed by the insurance company under the variable insurance product contract. Please refer to the variable insurance product prospectus for a complete listing of these expenses. The annualized net expense ratios are as follows: |
| Primary Shares | 0.30% |
| Service Shares | 0.55% |
| Name Birth Date Positions Held with Trust Date Service Began | Principal Occupation(s) for Past Five Years, Other Directorships Held and Previous Position(s) |
| J. Christopher Donahue* Birth Date: April 11, 1949 Trustee Indefinite Term Began serving: September 1993 | Principal Occupations: Principal Executive Officer and President of certain of the Funds in the Federated Fund Family; Director or Trustee of the Funds in the Federated Fund Family; President, Chief Executive Officer and Director, Federated Investors, Inc.; Chairman and Trustee, Federated Investment Management Company; Trustee, Federated Investment Counseling; Chairman and Director, Federated Global Investment Management Corp.; Chairman and Trustee, Federated Equity Management Company of Pennsylvania; Trustee, Federated Shareholder Services Company; Director, Federated Services Company. Previous Positions: President, Federated Investment Counseling; President and Chief Executive Officer, Federated Investment Management Company, Federated Global Investment Management Corp. and Passport Research, Ltd; Chairman, Passport Research, Ltd. |
| Thomas R. Donahue* Birth Date: October 20, 1958 Trustee Indefinite Term Began serving: May 2016 | Principal Occupations: Director or Trustee of certain of the funds in the Federated Fund Family; Chief Financial Officer, Treasurer, Vice President and Assistant Secretary, Federated Investors, Inc.; Chairman and Trustee, Federated Administrative Services; Chairman and Director, Federated Administrative Services, Inc.; Trustee and Treasurer, Federated Advisory Services Company; Director or Trustee and Treasurer, Federated Equity Management Company of Pennsylvania, Federated Global Investment Management Corp., Federated Investment Counseling, and Federated Investment Management Company; Director, MDTA LLC; Director, Executive Vice President and Assistant Secretary, Federated Securities Corp.; Director or Trustee and Chairman, Federated Services Company and Federated Shareholder Services Company; and Director and President, FII Holdings, Inc. Previous Positions: Director, Federated Investors, Inc.; Assistant Secretary, Federated Investment Management Company, Federated Global Investment Management Company and Passport Research, LTD; Treasurer, Passport Research, LTD; Executive Vice President, Federated Securities Corp.; and Treasurer, FII Holdings, Inc. |
| * | Family relationships and reasons for “interested” status: J. Christopher Donahue and Thomas R. Donahue are brothers. Both are “interested” due to their beneficial ownership of shares of Federated Investors, Inc. and the positions they hold with Federated and its subsidiaries. |
| Name Birth Date Positions Held with Trust Date Service Began | Principal Occupation(s) for Past Five Years, Other Directorships Held, Previous Position(s) and Qualifications |
| John T. Collins Birth Date: January 24, 1947 Trustee Indefinite Term Began serving: October 2013 | Principal Occupations: Director or Trustee of the Federated Fund Family; formerly, Chairman and CEO, The Collins Group, Inc. (a private equity firm) (Retired). Other Directorships Held: Director, Current Chair of the Compensation Committee, KLX Corp. Qualifications: Mr. Collins has served in several business and financial management roles and directorship positions throughout his career. Mr. Collins previously served as Chairman and CEO, The Collins Group, Inc. (a private equity firm). Mr. Collins serves as Chairman Emeriti, Bentley University. Mr. Collins previously served as Director and Audit Committee Member, Bank of America Corp.; Director, FleetBoston Financial Corp.; and Director, Beth Israel Deaconess Medical Center (Harvard University Affiliate Hospital). |
| G. Thomas Hough Birth Date: February 28, 1955 Trustee Indefinite Term Began serving: August 2015 | Principal Occupations: Director or Trustee of the Federated Fund Family; formerly, Vice Chair, Ernst & Young LLP (public accounting firm) (Retired). Other Directorships Held: Director, Chair of the Audit Committee, Governance Committee, Publix Super Markets, Inc.; Director, Member of the Audit Committee and Technology Committee of Equifax, Inc. Qualifications: Mr. Hough has served in accounting, business management and directorship positions throughout his career. Mr. Hough most recently held the position of Americas Vice Chair of Assurance with Ernst & Young LLP (public accounting firm). Mr. Hough is an Executive Committee member of the United States Golf Association, he serves on the President's Cabinet and Business School Board of Visitors for the University of Alabama and is on the Business School Board of Visitors for Wake Forest University. |
| Name Birth Date Positions Held with Trust Date Service Began | Principal Occupation(s) for Past Five Years, Other Directorships Held, Previous Position(s) and Qualifications |
| Maureen Lally-Green Birth Date: July 5, 1949 Trustee Indefinite Term Began serving: August 2009 | Principal Occupations: Director or Trustee of the Federated Fund Family; Dean of the Duquesne University School of Law; Professor and Adjunct Professor of Law, Duquesne University School of Law; formerly, Interim Dean of the Duquesne University School of Law; Associate General Secretary and Director, Office of Church Relations, Diocese of Pittsburgh. Other Directorships Held: Director, CNX Resources Corporation (formerly known as CONSOL Energy Inc.). Qualifications: Judge Lally-Green has served in various legal and business roles and directorship positions throughout her career. Judge Lally-Green previously served as: Associate General Secretary, Diocese of Pittsburgh; a member of the Superior Court of Pennsylvania; and as a Professor of Law, Duquesne University School of Law. Judge Lally-Green also currently holds the positions on either a public or not for profit Board of Directors as follows: Director and Chair, UPMC Mercy Hospital; Director and Vice Chair, Our Campaign for the Church Alive!, Inc.; Director, Saint Vincent College; Member, Pennsylvania State Board of Education (public); and Director CNX Resources Corporation (formerly known as CONSOL Energy Inc.), where she currently serves as a member of the Compensation, Nominating and Corporate Governance Committee (Chair) and the Health, Safety and Environmental Committee. Judge Lally-Green has held the positions of: Director, Auberle; Director, Epilepsy Foundation of Western and Central Pennsylvania; Director, Ireland Institute of Pittsburgh; Director, Saint Thomas More Society; Director and Chair, Catholic High Schools of the Diocese of Pittsburgh, Inc.; Director, Pennsylvania Bar Institute; Regent, St. Vincent Seminary; and Director and Chair, Cardinal Wuerl North Catholic High School, Inc. |
| Charles F. Mansfield, Jr. Birth Date: April 10, 1945 Trustee Indefinite Term Began serving: September 1999 | Principal Occupations: Director or Trustee of the Federated Fund Family; Management Consultant. Other Directorships Held: None. Qualifications: Mr. Mansfield has served as a Marine Corps officer and in several banking, business management, educational roles and directorship positions throughout his long career. He remains active as a Management Consultant. |
| Thomas M. O'Neill Birth Date: June 14, 1951 Trustee Indefinite Term Began serving: August 2006 | Principal Occupations: Director or Trustee, Chair of the Audit Committee of the Federated Fund Family; Sole Proprietor, Navigator Management Company (investment and strategic consulting). Other Directorships Held: None. Qualifications: Mr. O'Neill has served in several business, mutual fund and financial management roles and directorship positions throughout his career. Mr. O'Neill serves as Director, Medicines for Humanity and Director, The Golisano Children's Museum of Naples, Florida. Mr. O'Neill previously served as Chief Executive Officer and President, Managing Director and Chief Investment Officer, Fleet Investment Advisors; President and Chief Executive Officer, Aeltus Investment Management, Inc.; General Partner, Hellman, Jordan Management Co., Boston, MA; Chief Investment Officer, The Putnam Companies, Boston, MA; Credit Analyst and Lending Officer, Fleet Bank; Director and Consultant, EZE Castle Software (investment order management software); and Director, Midway Pacific (lumber). |
| P. Jerome Richey Birth Date: February 23, 1949 Trustee Indefinite Term Began serving: October 2013 | Principal Occupations: Director or Trustee of the Federated Fund Family; Management Consultant; formerly, Senior Vice Chancellor and Chief Legal Officer, University of Pittsburgh and Executive Vice President and Chief Legal Officer, CNX Resources Corporation (formerly known as CONSOL Energy Inc.) Other Directorships Held: None. Qualifications: Mr. Richey has served in several business and legal management roles and directorship positions throughout his career. Mr. Richey most recently held the positions of Senior Vice Chancellor and Chief Legal Officer, University of Pittsburgh. Mr. Richey previously served as Chairman of the Board, Epilepsy Foundation of Western Pennsylvania and Chairman of the Board, World Affairs Council of Pittsburgh. Mr. Richey previously served as Chief Legal Officer and Executive Vice President, CNX Resources Corporation (formerly known as CONSOL Energy Inc.); and Board Member, Ethics Counsel and Shareholder, Buchanan Ingersoll & Rooney PC (a law firm). |
| John S. Walsh Birth Date: November 28, 1957 Trustee Indefinite Term Began serving: January 1999 | Principal Occupations: Director or Trustee, and Chair of the Board of Directors or Trustees, of the Federated Fund Family; President and Director, Heat Wagon, Inc. (manufacturer of construction temporary heaters); President and Director, Manufacturers Products, Inc. (distributor of portable construction heaters); President, Portable Heater Parts, a division of Manufacturers Products, Inc. Other Directorships Held: None. Qualifications: Mr. Walsh has served in several business management roles and directorship positions throughout his career. Mr. Walsh previously served as Vice President, Walsh & Kelly, Inc. (paving contractors). |
| Name Birth Date Address Positions Held with Trust Date Service Began | Principal Occupation(s) for Past Five Years and Previous Position(s) |
| Lori A. Hensler Birth Date: January 6, 1967 TREASURER Officer since: April 2013 | Principal Occupations: Principal Financial Officer and Treasurer of the Federated Fund Family; Senior Vice President, Federated Administrative Services; Financial and Operations Principal for Federated Securities Corp. and Edgewood Services, Inc.; and Assistant Treasurer, Federated Investors Trust Company. Ms. Hensler has received the Certified Public Accountant designation. Previous Positions: Controller of Federated Investors, Inc.; Senior Vice President and Assistant Treasurer, Federated Investors Management Company; Treasurer, Federated Investors Trust Company; Assistant Treasurer, Federated Administrative Services, Federated Administrative Services, Inc., Federated Securities Corp., Edgewood Services, Inc., Federated Advisory Services Company, Federated Equity Management Company of Pennsylvania, Federated Global Investment Management Corp., Federated Investment Counseling, Federated Investment Management Company, Passport Research, Ltd., and Federated MDTA, LLC; Financial and Operations Principal for Federated Securities Corp., Edgewood Services, Inc. and Southpointe Distribution Services, Inc. |
| Peter J. Germain Birth Date: September 3, 1959 CHIEF LEGAL OFFICER, SECRETARY and EXECUTIVE VICE PRESIDENT Officer since: January 2005 | Principal Occupations: Mr. Germain is Chief Legal Officer, Secretary and Executive Vice President of the Federated Fund Family. He is General Counsel, Chief Legal Officer, Secretary and Executive Vice President, Federated Investors, Inc.; Trustee and Senior Vice President, Federated Investors Management Company; Trustee and President, Federated Administrative Services; Director and President, Federated Administrative Services, Inc.; Director and Vice President, Federated Securities Corp.; Director and Secretary, Federated Private Asset Management, Inc.; Secretary, Federated Shareholder Services Company; and Secretary, Retirement Plan Service Company of America. Mr. Germain joined Federated in 1984 and is a member of the Pennsylvania Bar Association. Previous Positions: Deputy General Counsel, Special Counsel, Managing Director of Mutual Fund Services, Federated Investors, Inc.; Senior Vice President, Federated Services Company; and Senior Corporate Counsel, Federated Investors, Inc. |
| Richard B. Fisher Birth Date: May 17, 1923 Vice President Officer since: September 1993 | Principal Occupations: Vice Chairman or Vice President of some of the Funds in the Federated Fund Family; Vice Chairman, Federated Investors, Inc.; Chairman, Federated Securities Corp. Previous Positions: President and Director or Trustee of some of the Funds in the Federated Fund Family; Executive Vice President, Federated Investors, Inc.; Director and Chief Executive Officer, Federated Securities Corp. |
| John B. Fisher Birth Date: May 16, 1956 President Officer since: November 2004 | Principal Occupations: Principal Executive Officer and President of certain of the Funds in the Federated Fund Family; Director or Trustee of certain of the Funds in the Federated Fund Family; Vice President, Federated Investors, Inc.; President, Director/Trustee and CEO, Federated Advisory Services Company, Federated Equity Management Company of Pennsylvania, Federated Global Investment Management Corp., Federated Investment Counseling, Federated Investment Management Company; President and CEO of Passport Research, Ltd.; President of some of the Funds in the Federated Fund Complex and Director, Federated Investors Trust Company. Previous Positions: President and Director of the Institutional Sales Division of Federated Securities Corp.; President and Director of Federated Investment Counseling; Director, Edgewood Securities Corp.; Director, Federated Services Company; Director, Federated Investors, Inc.; Chairman and Director, Southpointe Distribution Services, Inc. and President, Technology, Federated Services Company. |
| Stephen Van Meter Birth Date: June 5, 1975 CHIEF COMPLIANCE OFFICER AND SENIOR VICE PRESIDENT Officer since: July 2015 | Principal Occupations: Senior Vice President and Chief Compliance Officer of the Federated Fund Family; Vice President and Chief Compliance Officer of Federated Investors, Inc. and Chief Compliance Officer of certain of its subsidiaries. Mr. Van Meter joined Federated in October 2011. He holds FINRA licenses under Series 3, 7, 24 and 66. Previous Positions: Mr. Van Meter previously held the position of Compliance Operating Officer, Federated Investors, Inc. Prior to joining Federated, Mr. Van Meter served at the United States Securities and Exchange Commission in the positions of Senior Counsel, Office of Chief Counsel, Division of Investment Management and Senior Counsel, Division of Enforcement. |
| Stephen F. Auth Birth Date: September 13, 1956 101 Park Avenue 41st Floor New York, NY 10178 CHIEF INVESTMENT OFFICER Officer since: November 2002 | Principal Occupations: Stephen F. Auth is Chief Investment Officer of various Funds in the Federated Fund Family; Executive Vice President, Federated Investment Counseling, Federated Global Investment Management Corp. and Federated Equity Management Company of Pennsylvania. Previous Positions: Executive Vice President, Federated Investment Management Company and Passport Research, Ltd. (investment advisory subsidiary of Federated); Senior Vice President, Global Portfolio Management Services Division; Senior Vice President, Federated Investment Management Company and Passport Research, Ltd.; Senior Managing Director and Portfolio Manager, Prudential Investments. |
| Robert J. Ostrowski Birth Date: April 26, 1963 Chief Investment Officer Officer since: May 2004 | Principal Occupations: Robert J. Ostrowski joined Federated in 1987 as an Investment Analyst and became a Portfolio Manager in 1990. He was named Chief Investment Officer of Federated's taxable fixed-income products in 2004 and also serves as a Senior Portfolio Manager. Mr. Ostrowski became an Executive Vice President of the Fund's Adviser in 2009 and served as a Senior Vice President of the Fund's Adviser from 1997 to 2009. Mr. Ostrowski has received the Chartered Financial Analyst designation. He received his M.S. in Industrial Administration from Carnegie Mellon University. |
| Deborah A. Cunningham Birth Date: September 15, 1959 Chief Investment Officer Officer since: June 2012 | Principal Occupations: Deborah A. Cunningham was named Chief Investment Officer of Federated's money market products in 2004. She joined Federated in 1981 and has been a Senior Portfolio Manager since 1997 and an Executive Vice President of the Fund's Adviser since 2009. Ms. Cunningham has received the Chartered Financial Analyst designation and holds an M.S.B.A. in Finance from Robert Morris College. |

Federated Investors Funds
4000 Ericsson Drive
Warrendale, PA 15086-7561
or call 1-800-341-7400.
CUSIP 313916819
2018 ©Federated Investors, Inc.
| 1 | Please see the footnotes to the line graphs under “Fund Performance and Growth of a $10,000 Investment” below for the definition of, and more information about, the Blended Index. |
| 2 | There are no guarantees that dividend-paying stocks will continue to pay dividends. In addition, dividend-paying stocks may not experience the same capital appreciation potential as non-dividend-paying stocks. |
| 3 | Volatility is a statistical measurement of the frequency and level of changes in the value of an asset, index or instrument without regard to the direction of those changes. Volatility may result from rapid and dramatic price swings. |
| 4 | The CBOE Volatility Index (VIX) is a key measure of market expectations of near-term volatility conveyed by S&P 500 stock index option prices.* |
| 5 | Please see the footnotes to the line graphs under “Fund Performance and Growth of a $10,000 Investment” below for the definition of, and more information about, the S& P 500. |
| 6 | High-yield, lower-rated securities generally entail greater market, credit and liquidity risks than investment-grade securities and may include higher volatility and a higher risk of default. |
| 7 | Investment-grade securities are securities that are rated at least “BBB- (minus)” or unrated securities of a comparable quality. Noninvestment-grade securities are securities that are not rated at least “BBB- (minus)” or unrated securities of a comparable quality. Credit ratings are an indication of the risk that a security will default. They do not protect a security from credit risk. Lower-rated bonds typically offer higher yields to help compensate investors for the increased risk associated with them. Among these risks are lower credit-worthiness, greater price volatility, more risk to principal and income than with higher-rated securities and increased possibilities of default. |
| 8 | The value of some mortgage-backed securities may be particularly sensitive to changes in the prevailing interest rates, and although the securities are generally supported by some form of government or private insurance, there is no assurance that private guarantors or insurers will meet their obligations. |
| 9 | Duration is a measure of a security's price sensitivity to changes in interest rates. Securities with longer durations are more sensitive to changes in interest rates than securities of shorter durations. |
| 10 | The Bloomberg Barclays U.S. Treasury Index measures U.S dollar-denominated, fixed-rate, nominal debt issued by the U.S. Treasury.* |
| 11 | The Fund's use of derivative instruments involves risks different from, and possibly greater than, the risks associated with investing directly in securities or other traditional instruments. |
| 12 | Bond prices are sensitive to changes in interest rates, and a rise in interest rates can cause a decline in their prices. |
| 13 | International investing involves special risks including currency risk, increased volatility, political risks and differences in auditing and other financial standards. Prices of emerging-market securities can be significantly more volatile than the prices of securities in developed countries, and currency risk and political risks are accentuated in emerging markets. |
| * | The index is unmanaged, and it is not possible to invest directly in an index. |
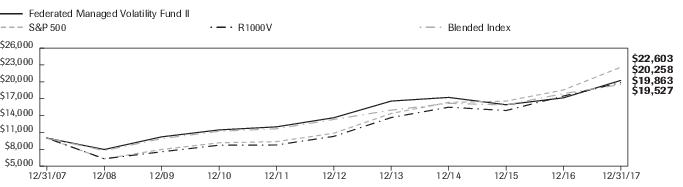
| Federated Managed Volatility Fund II | NA | S&P 500 | R1000V | Blended Index | |
| F | NA | I | I | I | |
| 12/31/2007 | 10,000 | 10,000 | 10,000 | 10,000 | |
| 12/31/2008 | 7,962 | 6,300 | 6,315 | 7,768 | |
| 12/31/2009 | 10,213 | 7,968 | 7,559 | 9,900 | |
| 12/31/2010 | 11,448 | 9,168 | 8,731 | 11,206 | |
| 12/31/2011 | 11,994 | 9,361 | 8,765 | 11,654 | |
| 12/31/2012 | 13,619 | 10,859 | 10,299 | 13,312 | |
| 12/31/2013 | 16,580 | 14,377 | 13,649 | 14,971 | |
| 12/31/2014 | 17,229 | 16,345 | 15,486 | 16,172 | |
| 12/31/2015 | 15,927 | 16,571 | 14,893 | 15,889 | |
| 12/31/2016 | 17,152 | 18,553 | 17,475 | 17,904 | |
| 12/31/2017 | 20,258 | 22,603 | 19,863 | 19,527 |
| 1 Year | 5 Years | 10 Years | |
| Fund | 18.11% | 8.26% | 7.31% |
| S&P 500 | 21.83% | 15.79% | 8.50% |
| R1000V | 13.66% | 14.04% | 7.10% |
| Blended Index | 9.06% | 7.96% | 6.92% |
| 1 | The Fund's performance assumes the reinvestment of all dividends and distributions. The S&P 500, R1000V and the Blended Index have been adjusted to reflect reinvestment of dividends on securities in the indexes. |
| 2 | The S&P 500 is a capitalization-weighted index of 500 stocks designed to measure performance of the broad domestic economy through changes in the aggregate market value of 500 stocks representing all major industries. |
| 3 | The S&P 500, R1000V and the Blended Index are not adjusted to reflect sales charges, expenses or other fees that the Securities and Exchange Commission (SEC) requires to be reflected in the Fund's performance. The indexes are unmanaged and, unlike the Fund, are not affected by cash flows. It is not possible to invest directly in an index. |
| 4 | The Russell 1000® Value Index measures the performance of the large-cap value segment of the U.S. equity universe. It includes those Russell 1000® Index companies with lower price-to-book ratios and lower expected growth values. The R1000V is constructed to provide a comprehensive and unbiased barometer for the large-cap value segment. The R1000V is completely reconstituted annually to ensure new and growing equities are included and that the represented companies continue to reflect value characteristics. The BBEMAI tracks total returns for external-currency-denominated debt instruments of the emerging markets. The BBHY2%ICI is an issuer-constrained version of the Bloomberg Barclays U.S. Corporate High-Yield Index that measures the market of USD-denominated, noninvestment-grade, fixed-rate, taxable corporate bonds. The index follows the same rules as the uncapped index but limits the exposure of each issuer to 2% of the total market value and redistributes any excess market value index-wide on a pro-rata basis. The BBMB covers agency mortgage-backed pass-through securities (both fixed-rate and hybrid ARM) issued by Ginnie Mae (GNMA), Fannie Mae (FNMA) and Freddie Mac (FHLMC). |
| Portfolio Composition | Percentage of Total Net Assets |
| Domestic Equity Securities | 38.5% |
| Domestic Fixed-Income Securities | 38.4% |
| International Fixed-Income Securities | 14.6% |
| International Equity Securities | 1.9% |
| Derivative Contracts2 | 0.3% |
| Other Security Types3 | 0.2% |
| Cash Equivalents4 | 4.4% |
| Other Assets and Liabilities—Net5 | 1.7% |
| TOTAL | 100.0% |
| Sector Composition of Equity Holdings | Percentage of Equity Securities |
| Financials | 26.7% |
| Health Care | 13.4% |
| Energy | 10.9% |
| Consumer Staples | 8.6% |
| Industrials | 8.5% |
| Information Technology | 8.4% |
| Consumer Discretionary | 6.8% |
| Utilities | 6.0% |
| Real Estate | 4.8% |
| Telecommunication Services | 3.0% |
| Materials | 2.9% |
| TOTAL | 100.0% |
| 1 | See the Fund's Prospectus and Statement of Additional Information for a description of the types of securities in which the Fund invests. As of the date specified above, the Fund owned shares of one or more affiliated investment companies. For purposes of this table, the affiliated investment company (other than an affiliated money market mutual fund) is not treated as a single portfolio security, but rather the Fund is treated as owning a pro rata portion of each security and each other asset and liability owned by the affiliated investment company. Accordingly, the percentages of total net assets shown in the table will differ from those presented on the Portfolio of Investments. |
| 2 | Based upon net unrealized appreciation (depreciation) or value of the derivative contracts as applicable. Derivative contracts may consist of futures, forwards, options and swaps. The impact of a derivative contract on the Fund's performance may be larger than its unrealized appreciation (depreciation) or value may indicate. In many cases, the notional value or amount of a derivative contract may provide a better indication of the contract's significance to the portfolio. More complete information regarding the Fund's direct investments in derivative contracts, including unrealized appreciation (depreciation), value and notional values or amounts of such contracts, can be found in the table at the end of the Portfolio of Investments included in this Report. |
| 3 | Other Security Types consist of purchased options. |
| 4 | Cash Equivalents include any investments in money market mutual funds and/or overnight repurchase agreements. |
| 5 | Assets, other than investments in securities and derivative contracts, less liabilities. See Statement of Assets and Liabilities. |
| 6 | Sector classifications are based upon, and individual portfolio securities are assigned to, the classifications of the Global Industry Classification Standard (GICS) except that the Adviser assigns a classification to securities not classified by the GICS and to securities for which the Adviser does not have access to the classification made by the GICS. |
| Shares, Principal Amount or Contracts | Value | ||
| COMMON STOCKS—40.4% | |||
| Consumer Discretionary—2.8% | |||
| 5,207 | Best Buy Co., Inc. | $356,523 | |
| 991 | Block (H&R), Inc. | 25,984 | |
| 1,729 | 1 | Charter Communications, Inc. | 580,875 |
| 19,221 | Comcast Corp., Class A | 769,801 | |
| 11,631 | Extended Stay America, Inc. | 220,989 | |
| 82,625 | Ford Motor Co. | 1,031,986 | |
| 34,803 | General Motors Co. | 1,426,575 | |
| 1,011 | Lear Corp. | 178,603 | |
| 21,515 | 1 | Liberty Expedia Holdings, Inc. | 953,760 |
| 3,038 | 1 | Liberty Sirius Group - C | 120,487 |
| 184 | 1 | Liberty Siriusxm Group | 7,298 |
| 12,535 | 1 | Liberty Ventures - Series A | 679,899 |
| 113 | 1 | Madison Square Garden, Co. - A | 23,826 |
| 12,741 | 1 | Michael Kors Holdings Ltd. | 802,046 |
| 33,502 | News Corp. | 556,133 | |
| 22,462 | Pulte Group, Inc. | 746,862 | |
| 10,135 | Ralph Lauren Corp. | 1,050,898 | |
| 12,765 | Royal Caribbean Cruises, Ltd. | 1,522,609 | |
| 4,103 | Scripps Networks Interactive | 350,314 | |
| 12,420 | Signet Jewelers Ltd. | 702,351 | |
| 15,779 | Target Corp. | 1,029,580 | |
| 1,432 | Tiffany & Co. | 148,856 | |
| 20,969 | Time Warner, Inc. | 1,918,035 | |
| 7,665 | Toll Brothers, Inc. | 368,073 | |
| 14,520 | Walt Disney Co. | 1,561,045 | |
| TOTAL | 17,133,408 | ||
| Consumer Staples—3.5% | |||
| 16,163 | Archer-Daniels-Midland Co. | 647,813 | |
| 19,838 | CVS Health Corp. | 1,438,255 | |
| 4,527 | Campbell Soup Co. | 217,794 | |
| 767 | Clorox Co. | 114,084 | |
| 24,965 | Colgate-Palmolive Co. | 1,883,609 | |
| 39,256 | Conagra Brands, Inc. | 1,478,773 | |
| 2,704 | 1 | Edgewell Personal Care Co. | 160,591 |
| 11,274 | Hershey Foods Corp. | 1,279,712 | |
| 4,276 | Kimberly-Clark Corp. | 515,942 | |
| 5,044 | Mondelez International, Inc. | 215,883 | |
| 373 | Nu Skin Enterprises, Inc. | 25,450 | |
| 2,182 | PepsiCo, Inc. | 261,665 | |
| 38,647 | Philip Morris International, Inc. | 4,083,055 | |
| 21,327 | Pinnacle Foods, Inc. | 1,268,317 | |
| 35,712 | Procter & Gamble Co. | 3,281,219 | |
| 8,561 | 1 | TreeHouse Foods, Inc. | 423,427 |
| 35,007 | Wal-Mart Stores, Inc. | 3,456,941 | |
| 11,314 | Walgreens Boots Alliance, Inc. | 821,623 | |
| TOTAL | 21,574,153 |
| Shares, Principal Amount or Contracts | Value | ||
| COMMON STOCKS—continued | |||
| Energy—4.4% | |||
| 16,698 | Anadarko Petroleum Corp. | $895,681 | |
| 2,185 | Andeavor Logistics LP | 249,833 | |
| 4,157 | Baker Hughes a GE Co. LLC | 131,527 | |
| 39,635 | Cabot Oil & Gas Corp., Class A | 1,133,561 | |
| 39,724 | Chevron Corp. | 4,973,048 | |
| 3,277 | Cimarex Energy Co. | 399,827 | |
| 2,537 | 1 | Concho Resources, Inc. | 381,108 |
| 30,611 | ConocoPhillips | 1,680,238 | |
| 4,625 | Devon Energy Corp. | 191,475 | |
| 16,275 | EOG Resources, Inc. | 1,756,235 | |
| 88,704 | Exxon Mobil Corp. | 7,419,203 | |
| 13,173 | Halliburton Co. | 643,764 | |
| 8,597 | Hess Corp. | 408,100 | |
| 27,122 | Kinder Morgan, Inc. | 490,095 | |
| 53,990 | 1 | Kosmos Energy LLC | 369,831 |
| 7,724 | Marathon Oil Corp. | 130,767 | |
| 18,648 | Marathon Petroleum Corp. | 1,230,395 | |
| 1,336 | Noble Energy, Inc. | 38,931 | |
| 1,351 | Occidental Petroleum Corp. | 99,515 | |
| 4,518 | Pioneer Natural Resources, Inc. | 780,936 | |
| 26,688 | Schlumberger Ltd. | 1,798,504 | |
| 1,521 | Targa Resources Investments, Inc. | 73,647 | |
| 18,253 | Valero Energy Corp. | 1,677,633 | |
| 16,976 | Williams Companies, Inc. | 517,598 | |
| TOTAL | 27,471,452 | ||
| Financials—10.8% | |||
| 48,155 | AGNC Investment Corp. | 972,249 | |
| 18,080 | Aflac, Inc. | 1,587,062 | |
| 52,436 | Ally Financial, Inc. | 1,529,034 | |
| 8,684 | American Express Co. | 862,408 | |
| 21,499 | American International Group, Inc. | 1,280,910 | |
| 12,181 | Assurant, Inc. | 1,228,332 | |
| 106 | Assured Guaranty Ltd. | 3,590 | |
| 4,928 | BB&T Corp. | 245,020 | |
| 236,188 | Bank of America Corp. | 6,972,270 | |
| 32,110 | 1 | Berkshire Hathaway, Inc., Class B | 6,364,844 |
| 61 | BlackRock, Inc. | 31,336 | |
| 18,292 | 1 | Brighthouse Financial, Inc. | 1,072,643 |
| 10,578 | Capital One Financial Corp. | 1,053,357 | |
| 69,956 | Chimera Investment Corp. | 1,292,787 | |
| 789 | Chubb Ltd. | 115,297 | |
| 69,410 | Citigroup, Inc. | 5,164,798 | |
| 3,634 | Citizens Financial Group, Inc. | 152,555 | |
| 23,752 | Discover Financial Services | 1,827,004 | |
| 138 | Fifth Third Bancorp | 4,187 | |
| 7,248 | Goldman Sachs Group, Inc. | 1,846,501 | |
| 12,633 | Hartford Financial Services Group, Inc. | 710,985 | |
| 80,697 | JPMorgan Chase & Co. | 8,629,737 | |
| 42,753 | KeyCorp | 862,328 |
| Shares, Principal Amount or Contracts | Value | ||
| COMMON STOCKS—continued | |||
| Financials—continued | |||
| 5,998 | Lazard Ltd., Class A | $314,895 | |
| 16,753 | Lincoln National Corp. | 1,287,803 | |
| 888 | MetLife, Inc. | 44,897 | |
| 44,241 | Morgan Stanley | 2,321,325 | |
| 72,489 | Navient Corp. | 965,554 | |
| 11,296 | 1 | OneMain Holdings, Inc. | 293,583 |
| 2,368 | PNC Financial Services Group | 341,679 | |
| 15,827 | PacWest Bancorp | 797,681 | |
| 37,993 | Popular, Inc. | 1,348,372 | |
| 4,090 | Principal Financial Group | 288,590 | |
| 19,372 | Prudential Financial | 2,227,393 | |
| 1,974 | Regions Financial Corp. | 34,111 | |
| 11,265 | Santander Consumer USA Holdings, Inc. | 209,754 | |
| 50 | State Street Corp. | 4,881 | |
| 10,298 | SunTrust Banks, Inc. | 665,148 | |
| 17,527 | Synchrony Financial | 676,717 | |
| 21,613 | The Bank of New York Mellon Corp. | 1,164,076 | |
| 14,510 | The Travelers Cos, Inc. | 1,968,136 | |
| 78,952 | Two Harbors Investment Corp. | 1,283,760 | |
| 27,967 | U.S. Bancorp | 1,498,472 | |
| 88,361 | Wells Fargo & Co. | 5,360,862 | |
| TOTAL | 66,906,923 | ||
| Health Care—5.4% | |||
| 39,440 | Abbott Laboratories | 2,250,841 | |
| 1,587 | Aetna, Inc. | 286,279 | |
| 5,519 | Allergan PLC | 902,798 | |
| 13,967 | Amgen, Inc. | 2,428,861 | |
| 7,036 | Anthem, Inc. | 1,583,170 | |
| 28,202 | Baxter International, Inc. | 1,822,977 | |
| 14,901 | Bristol-Myers Squibb Co. | 913,133 | |
| 3,650 | CIGNA Corp. | 741,279 | |
| 12,412 | 1 | Centene Corp. | 1,252,123 |
| 3,336 | Cooper Cos., Inc. | 726,848 | |
| 4,586 | 1 | Davita, Inc. | 331,339 |
| 26,126 | 1 | Endo International PLC | 202,477 |
| 11,486 | Gilead Sciences, Inc. | 822,857 | |
| 6,719 | 1 | HCA Healthcare, Inc. | 590,197 |
| 5,126 | Humana, Inc. | 1,271,607 | |
| 46,912 | Johnson & Johnson | 6,554,545 | |
| 1,157 | 1 | Juno Therapeutics, Inc. | 52,886 |
| 1,357 | 1 | Mallinckrodt PLC | 30,614 |
| 15,055 | Medtronic PLC | 1,215,691 | |
| 69,155 | Merck & Co., Inc. | 3,891,352 | |
| 5,885 | 1 | Mylan NV | 248,994 |
| 128,554 | Pfizer, Inc. | 4,656,226 | |
| 6,256 | Quest Diagnostics, Inc. | 616,153 | |
| 1,420 | Zimmer Biomet Holdings, Inc. | 171,351 | |
| TOTAL | 33,564,598 |
| Shares, Principal Amount or Contracts | Value | ||
| COMMON STOCKS—continued | |||
| Industrials—3.4% | |||
| 18,394 | AMETEK, Inc. | $1,333,013 | |
| 943 | CSX Corp. | 51,874 | |
| 9,449 | Caterpillar, Inc. | 1,488,973 | |
| 7,216 | Copa Holdings, Class A | 967,377 | |
| 11,273 | Crane Co. | 1,005,777 | |
| 5,478 | Cummins, Inc. | 967,634 | |
| 12,780 | Delta Air Lines, Inc. | 715,680 | |
| 3,776 | Eaton Corp. PLC | 298,342 | |
| 3,928 | Fortive Corp. | 284,191 | |
| 72,646 | General Electric Co. | 1,267,673 | |
| 282 | Huntington Ingalls Industries, Inc. | 66,467 | |
| 10,897 | Ingersoll-Rand PLC | 971,903 | |
| 284 | Jacobs Engineering Group, Inc. | 18,733 | |
| 4,894 | L3 Technologies, Inc. | 968,278 | |
| 2,752 | Lockheed Martin Corp. | 883,530 | |
| 13,159 | Masco Corp. | 578,207 | |
| 1,997 | Norfolk Southern Corp. | 289,365 | |
| 10,417 | Orbital ATK, Inc. | 1,369,836 | |
| 5,887 | Owens Corning, Inc. | 541,251 | |
| 6,693 | Parker-Hannifin Corp. | 1,335,789 | |
| 429 | Pitney Bowes, Inc. | 4,796 | |
| 2,610 | Roper Technologies, Inc. | 675,990 | |
| 13,060 | Ryder Systems, Inc. | 1,099,260 | |
| 5,465 | Spirit AeroSystems Holdings, Inc. – Class A | 476,821 | |
| 6,695 | Terex Corp. | 322,833 | |
| 7,440 | Textron, Inc. | 421,030 | |
| 4,274 | Union Pacific Corp. | 573,143 | |
| 8,318 | United Technologies Corp. | 1,061,127 | |
| 15,841 | Waste Management, Inc. | 1,367,078 | |
| TOTAL | 21,405,971 | ||
| Information Technology—3.4% | |||
| 36,242 | 1 | Arris International PLC | 931,057 |
| 69,864 | Cisco Systems, Inc. | 2,675,791 | |
| 1,552 | 1 | CoreLogic, Inc. | 71,718 |
| 2,302 | Cypress Semiconductor Corp. | 35,082 | |
| 539 | 1 | Echostar Holding Corp. | 32,286 |
| 2,566 | Fidelity National Information Services, Inc. | 241,435 | |
| 4,106 | 1 | First Solar, Inc. | 277,237 |
| 26,588 | HP, Inc. | 558,614 | |
| 66,968 | Intel Corp. | 3,091,243 | |
| 4,690 | International Business Machines Corp. | 719,540 | |
| 51,353 | Juniper Networks, Inc. | 1,463,561 | |
| 4,662 | Leidos Holdings, Inc. | 301,025 | |
| 60,191 | Marvell Technology Group Ltd. | 1,292,301 | |
| 6,717 | 1 | Micron Technology, Inc. | 276,203 |
| 6,198 | 1 | NXP Semiconductors NV | 725,724 |
| 1,576 | NetApp, Inc. | 87,184 | |
| 8,411 | 1 | Nuance Communications, Inc. | 137,520 |
| 332 | 1 | ON Semiconductor Corp. | 6,952 |
| Shares, Principal Amount or Contracts | Value | ||
| COMMON STOCKS—continued | |||
| Information Technology—continued | |||
| 63,426 | Oracle Corp. | $2,998,781 | |
| 23,798 | Qualcomm, Inc. | 1,523,548 | |
| 17,033 | 1 | Synopsys, Inc. | 1,451,893 |
| 4,433 | 1 | Trimble, Inc. | 180,157 |
| 14,284 | 1 | Twitter, Inc. | 342,959 |
| 20,080 | Western Digital Corp. | 1,596,962 | |
| 1,056 | 1 | Zynga, Inc. | 4,224 |
| TOTAL | 21,022,997 | ||
| Materials—1.2% | |||
| 3,812 | 1 | Alcoa Corp. | 205,352 |
| 14,169 | CF Industries Holdings, Inc. | 602,749 | |
| 6,775 | DowDuPont, Inc. | 482,516 | |
| 34,056 | 1 | Freeport-McMoRan, Inc. | 645,702 |
| 79,694 | Graphic Packaging Holding Co. | 1,231,272 | |
| 25,699 | Huntsman Corp. | 855,520 | |
| 7,266 | LyondellBasell Industries NV – Class A | 801,585 | |
| 31,488 | Newmont Mining Corp. | 1,181,430 | |
| 2,871 | Olin Corp. | 102,150 | |
| 3,750 | Praxair, Inc. | 580,050 | |
| 11,498 | WestRock Co. | 726,789 | |
| TOTAL | 7,415,115 | ||
| Real Estate—1.9% | |||
| 49,799 | American Homes 4 Rent | 1,087,610 | |
| 2,676 | Avalonbay Communities, Inc. | 477,425 | |
| 62,867 | Brandywine Realty Trust | 1,143,551 | |
| 20,827 | 1 | CBRE Group, Inc. | 902,017 |
| 4,361 | CoreCivic, Inc. | 98,123 | |
| 13,051 | DCT Industrial Trust, Inc. | 767,138 | |
| 47,579 | Duke Realty Corp. | 1,294,625 | |
| 10,600 | 1 | Equity Commonwealth | 323,406 |
| 543 | Essex Property Trust, Inc. | 131,064 | |
| 464 | Gaming and Leisure Properties, Inc. | 17,168 | |
| 42,000 | Host Hotels & Resorts, Inc. | 833,700 | |
| 12,573 | Lamar Advertising Co. – Class A | 933,420 | |
| 9,374 | Paramount Group, Inc. | 148,578 | |
| 12,648 | Park Hotels & Resorts, Inc. | 363,630 | |
| 29,575 | ProLogis, Inc. | 1,907,883 | |
| 11,359 | Rayonier, Inc. | 359,285 | |
| 1,524 | Vornado Realty Trust | 119,146 | |
| 8,946 | Welltower, Inc. | 570,486 | |
| 14,421 | Weyerhaeuser Co. | 508,484 | |
| TOTAL | 11,986,739 | ||
| Telecommunication Services—1.2% | |||
| 132,337 | AT&T, Inc. | 5,145,263 | |
| 11,726 | 1 | T-Mobile USA, Inc. | 744,718 |
| 24,274 | Telephone and Data System, Inc. | 674,817 | |
| 17,190 | Verizon Communications | 909,867 | |
| TOTAL | 7,474,665 |
| Shares, Principal Amount or Contracts | Value | ||
| COMMON STOCKS—continued | |||
| Utilities—2.4% | |||
| 56,577 | AES Corp. | $612,729 | |
| 8,204 | Ameren Corp. | 483,954 | |
| 21,741 | American Electric Power Co., Inc. | 1,599,485 | |
| 5,256 | Atmos Energy Corp. | 451,438 | |
| 28,382 | CMS Energy Corp. | 1,342,469 | |
| 90,315 | 1 | Calpine Corp. | 1,366,466 |
| 48,805 | CenterPoint Energy, Inc. | 1,384,110 | |
| 10,938 | DTE Energy Co. | 1,197,274 | |
| 377 | Duke Energy Corp. | 31,710 | |
| 1,735 | EverSource Energy | 109,617 | |
| 31,223 | MDU Resources Group, Inc. | 839,274 | |
| 6,522 | NextEra Energy, Inc. | 1,018,671 | |
| 24,699 | P G & E Corp. | 1,107,256 | |
| 13,218 | Pinnacle West Capital Corp. | 1,125,909 | |
| 6,106 | UGI Corp. | 286,677 | |
| 5,715 | Vectren Corp. | 371,589 | |
| 34,092 | Xcel Energy, Inc. | 1,640,166 | |
| TOTAL | 14,968,794 | ||
| TOTAL COMMON STOCKS (IDENTIFIED COST $221,736,054) | 250,924,815 | ||
| ADJUSTABLE RATE MORTGAGE—0.0% | |||
| $10,805 | 2 | Federal National Mortgage Association, 3.569%, 09/01/2037 (IDENTIFIED COST $10,883) | 11,379 |
| COLLATERALIZED MORTGAGE OBLIGATIONS—2.5% | |||
| 1,275,000 | Banc of America Commercial Mortgage Trust 2016-UBS10, Class A4, 3.170%, 07/15/2049 | 1,276,639 | |
| 1,100,000 | CD Commercial Mortgage Trust 2016-CD1, Class A4, 2.724%, 08/10/2049 | 1,069,292 | |
| 875,000 | Deutsche Bank Commercial Mortgage Trust 2016-C3, Class A5, 2.890%, 09/10/2049 | 860,981 | |
| 1,100,000 | Federal Home Loan Mortgage Corp. REMIC K060, Class A2, 3.271%, 10/25/2026 | 1,137,321 | |
| 983,540 | Federal Home Loan Mortgage Corp. REMIC K062, Class A1, 3.032%, 09/25/2026 | 1,003,687 | |
| 1,979,687 | Federal Home Loan Mortgage Corp. REMIC K063, Class A1, 3.045%, 08/25/2026 | 2,023,575 | |
| 1,000,000 | 2 | Federal Home Loan Mortgage Corp. REMIC K729, Class A2, 3.136% (1-month USLIBOR), 10/25/2024 | 1,027,897 |
| 306,752 | 2 | Federal National Mortgage Association REMIC 2006-117, Class GF, 1.902% (1-month USLIBOR +0.350%) , 12/25/2036 | 307,018 |
| 259,926 | 2 | Federal National Mortgage Association REMIC 2012-1, Class F, 2.002% (1-month USLIBOR +0.450%) , 02/25/2042 | 260,971 |
| 1,500,000 | Federal National Mortgage Association REMIC 2016-M11, Class A2, 2.369%, 07/25/2026 | 1,440,204 | |
| 980,000 | GS Mortgage Securities Trust 2014-GC24, Class B, 4.508%, 09/10/2047 | 1,024,079 | |
| 1,500,000 | JPMDB Commercial Mortgage Securities Trust 2016-C4, Class A3, 3.141%, 12/15/2049 | 1,502,814 | |
| 1,500,000 | Morgan Stanley Capital I Trust 2016-UB12, Class A4, 3.596%, 12/15/2049 | 1,538,744 | |
| 590,000 | UBS-Barclays Commercial Mortgage Trust 2013-C6, Class B, 3.875%, 04/10/2046 | 597,547 | |
| 495,000 | WF-RBS Commercial Mortgage Trust 2014-C25, Class B, 4.236%, 11/15/2047 | 504,309 | |
| TOTAL COLLATERALIZED MORTGAGE OBLIGATION (IDENTIFIED COST $15,820,034) | 15,575,078 | ||
| COMMERCIAL MORTGAGE-BACKED SECURITIES—0.4% | |||
| 750,000 | Federal Home Loan Mortgage Corp., K055, Class A2, 2.673%, 03/25/2026 | 741,897 | |
| 1,050,000 | �� | FREMF Mortgage Trust 2013-K25, Class B, 3.619%, 11/25/2045 | 1,071,002 |
| 790,000 | FREMF Mortgage Trust 2015-K49, Class B, 3.721%, 10/25/2048 | 797,114 | |
| TOTAL COMMERCIAL MORTGAGE-BACKED SECURITIES (IDENTIFIED COST $2,567,283) | 2,610,013 | ||
| CORPORATE BONDS—14.9% | |||
| Air Transportation—0.0% | |||
| 70,000 | Gol Finance, Sr. Unsecd. Note, Series 144A, 7.000%, 01/31/2025 | 69,161 |
| Shares, Principal Amount or Contracts | Value | ||
| CORPORATE BONDS—continued | |||
| Airport—0.1% | |||
| $400,000 | Mexico City Airport Trust, Sec. Fac. Bond, Series 144A, 5.500%, 10/31/2046 | $396,500 | |
| Banking—3.3% | |||
| 200,000 | Access Bank PLC, Sr. Unsecd. Note, Series REGS, 10.500%, 10/19/2021 | 225,736 | |
| 200,000 | Axiata SPV2 Bhd, Sr. Unsecd. Note, Series EMTN, 4.357%, 03/24/2026 | 211,541 | |
| 195,000 | BB&T Corp., Sr. Unsecd. Note, Series MTN, 2.750%, 04/01/2022 | 196,477 | |
| 200,000 | BBVA Banco Continental, Series REGS, 5.000%, 08/26/2022 | 216,250 | |
| 300,000 | BBVA Bancomer S.A. Mexico, Jr. Sub. Note, Series 144A 5.350%, 11/12/2029 | 300,000 | |
| 200,000 | BBVA Bancomer S.A. Texas, Sub. Note, Series REGS, 6.500%, 03/10/2021 | 218,250 | |
| 200,000 | Banco Bilbao Vizcaya Arge, Jr. Sub. Note, 6.125%, 02/16/2066 | 206,750 | |
| 200,000 | Banco Bradesco (Cayman), Sub Note, Series REGS, 5.750%, 03/01/2022 | 209,688 | |
| 200,000 | Banco De Bogota S.A., Sub. Note, Series REGS, 6.250%, 05/12/2026 | 216,160 | |
| 100,000 | Banco de Credito del Peru, Jr. Sub. Note, Series REGS, 9.750%, 11/06/2069 | 111,500 | |
| 100,000 | Banco de Credito del Peru, Series REGS, 6.125%, 04/24/2027 | 110,250 | |
| 100,000 | Banco Del Estado, Sr. Unsecd. Note, Series REGS, 4.125%, 10/07/2020 | 104,465 | |
| 219,000 | Banco Do Brasil S.A., 3.875%, 10/10/2022 | 215,879 | |
| 200,000 | Banco Inbursa S.A. Institucion, Sr. Unsecd. Note, Series 144A, 4.375%, 04/11/2027 | 200,876 | |
| 300,000 | Banco Internacional del Peru, Sr. Unsecd. Note, Series REGS, 5.750%, 10/07/2020 | 323,250 | |
| 150,000 | Banco Macro S.A., Sub. Note, Series 144A, 6.750%, 11/04/2026 | 155,582 | |
| 200,000 | Bancolombia S.A., 5.950%, 06/03/2021 | 216,800 | |
| 200,000 | Bangkok Bank PCL, Sr. Unsecd. Note, Series REGS, 3.875%, 09/27/2022 | 208,129 | |
| 250,000 | Bank of America Corp., Sr. Unsecd. Note, 3.705%, 04/24/2028 | 256,827 | |
| 150,000 | Bank of America Corp., Sub. Note, 6.500%, 09/15/2037 | 186,919 | |
| 300,000 | Bank of America Corp., Sub. Note, Series MTN, 4.000%, 01/22/2025 | 312,325 | |
| 510,000 | Bank of China Ltd., Series 144A, 5.000%, 11/13/2024 | 544,655 | |
| 600,000 | Bank of China Ltd., Sub. Note, Series REGS, 5.000%, 11/13/2024 | 640,771 | |
| 200,000 | Bank of East Asia Ltd., Sub. Note, 4.000%, 11/03/2026 | 200,052 | |
| 200,000 | Bank of New York Mellon Corp., Sr. Unsecd. Note, Series MTN, 2.661%, 05/16/2023 | 199,991 | |
| 200,000 | CBQ Finance Ltd., Sub. Note, Series REGS, 7.500%, 11/18/2019 | 214,087 | |
| 300,000 | China Construction Bank Corp., Sub. Note, Series EMTN, 4.250%, 08/20/2024 | 304,844 | |
| 570,000 | Citigroup, Inc., Sr. Unsecd. Note, 3.400%, 05/01/2026 | 574,287 | |
| 250,000 | Citizens Bank NA, Sr. Unsecd. Note, Series BKNT, 2.550%, 05/13/2021 | 249,250 | |
| 25,000 | Compania General de Combustibles, Sr. Unsecd. Note, Series REGS, 9.500%, 11/07/2021 | 26,750 | |
| 350,000 | Compass Bank, Birmingham, Sub. Note, Series BKNT, 3.875%, 04/10/2025 | 351,582 | |
| 200,000 | Credit Bank of Moscow, Sub. Note, Series 144A, 7.500%, 10/05/2027 | 185,871 | |
| 200,000 | Dib Tier 1 Sukuk 2 Ltd., Jr. Sub. Note, 6.750%, 07/20/2166 | 207,622 | |
| 300,000 | Emirates NBD Tier 1 Ltd., Jr. Sub. Note, 5.750%, 11/30/2066 | 305,270 | |
| 200,000 | Export-Import Bank Korea, Sr. Unsecd. Note, 1.750%, 05/26/2019 | 197,553 | |
| 600,000 | Export-Import Bank Korea, Sr. Unsecd. Note, 2.625%, 12/30/2020 | 594,702 | |
| 200,000 | Export-Import Bank of China/The via Avi Funding Co. Ltd., Sr. Unsecd. Note, Series REGS, 3.800%, 09/16/2025 | 204,946 | |
| 750,000 | Export-Import Bank of India, Sr. Unsecd. Note, Series EMTN, 3.875%, 10/02/2019 | 764,048 | |
| 200,000 | Global Bank Corp., Sr. Unsecd. Note, Series 144A, 4.500%, 10/20/2021 | 204,240 | |
| 500,000 | Goldman Sachs Group, Inc., Sr. Unsecd. Note, 6.250%, 02/01/2041 | 674,672 | |
| 200,000 | Hazine Mustesarligi Varlik Kiralama A.S., Sr. Unsecd. Note, Series 144A, 5.004%, 04/06/2023 | 203,631 | |
| 400,000 | HSBC Holdings PLC, Sr. Unsecd. Note, 3.900%, 05/25/2026 | 415,191 | |
| 200,000 | Huntington Bancshares, Inc., Sr. Unsecd. Note, 3.150%, 03/14/2021 | 203,278 | |
| 250,000 | ICICI Bank Ltd., Series REGS, 5.750%, 11/16/2020 | 268,644 | |
| 200,000 | ICICI Bank Ltd./Dubai, Sr. Unsecd. Note, Series 144A, 3.800%, 12/14/2027 | 197,727 | |
| 200,000 | Industrial and Commercial Bank of China Ltd., Sr. Unsecd. Note, 3.538%, 11/08/2027 | 199,184 | |
| 500,000 | Industrial and Commercial Bank of China Ltd., Sr. Unsecd. Note, Series MTN, 2.905%, 11/13/2020 | 499,284 |
| Shares, Principal Amount or Contracts | Value | ||
| CORPORATE BONDS—continued | |||
| Banking—continued | |||
| $400,000 | Industrial and Commercial Bank of China Ltd., Jr. Sub. Note, Series REGS, 6.000%,12/10/2066 | $414,700 | |
| 200,000 | Industrial Bank of Korea, Sr. Unsecd. Note, Series REGS, 2.000%, 04/23/2020 | 196,091 | |
| 300,000 | Itau Unibanco Holding S.A., Sub. Note, Series REGS, 6.200%, 12/21/2021 | 319,800 | |
| 850,000 | J.P. Morgan Chase & Co., Sub. Note, 3.375%, 05/01/2023 | 864,493 | |
| 300,000 | Korea Development Bank, Sr. Unsecd. Note, 2.250%, 05/18/2020 | 295,586 | |
| 200,000 | Manufacturers & Traders Trust Co., Sr. Unsecd. Note, Series BKNT, 2.500%, 05/18/2022 | 199,237 | |
| 200,000 | MTN Mauritius Investment, Sr. Unsecd. Note, Series 144A, 5.373%, 02/13/2022 | 207,279 | |
| 250,000 | Morgan Stanley, Sr. Unsecd. Note, Series MTN, 6.250%, 08/09/2026 | 298,821 | |
| 275,000 | Morgan Stanley, Sub. Note, Series MTN, 4.100%, 05/22/2023 | 286,810 | |
| 200,000 | Multibank, Inc., Sr. Unsecd. Note, Series 144A, 4.375%, 11/09/2022 | 199,750 | |
| 250,000 | Pampa Energia S.A., Sr. Unsecd. Note, Series 144A, 7.500%, 01/24/2027 | 275,035 | |
| 250,000 | 2 | QIB Sukuk Ltd., Sr. Unsecured Note, 2.936%, (3-month USLIBOR +1.500%) 08/18/2019 | 248,134 |
| 250,000 | Regions Financial Corp., Sr. Unsecd. Note, 3.200%, 02/08/2021 | 254,525 | |
| 200,000 | Sberbank, Sub. Note, Series REGS, 5.500%, 02/26/2024 | 203,630 | |
| 200,000 | Shinhan Bank, Sub. Note, Series 144A, 3.875%, 03/24/2026 | 202,904 | |
| 200,000 | Sibur Securities DAC, Sr. Unsecd. Note, Series 144A, 4.125%, 10/05/2023 | 200,346 | |
| 200,000 | T.C. Ziraat Bankasi A.S., Sr. Unsecd. Note, Series 144A, 5.125%, 09/29/2023 | 195,310 | |
| 300,000 | Turkiye Garanti Bankasi AS, Sr. Unsecd. Note, Series 144A, 5.875%, 03/16/2023 | 311,973 | |
| 300,000 | Turkiye Garanti Bankasi AS, Sub. Note, Series 144A, 6.125%, 05/24/2027 | 300,171 | |
| 300,000 | Turkiye Is Bankasi, Sub. Note, Series 144A, 7.000%, 06/29/2028 | 300,958 | |
| 200,000 | Turkiye Is Bankasi, Series REGS, 5.500%, 04/21/2019 | 204,231 | |
| 200,000 | Turkiye Vakiflar Bankasi T.A.O., Series 144A, 5.000%, 10/31/2018 | 202,051 | |
| 230,000 | Turkiye Vakiflar Bankasi, Sr. Unsecd. Note, Series 144A, 5.500%, 10/27/2021 | 230,710 | |
| 200,000 | United Bank for Africa PLC, Sr. Unsecured Note, Series REGS, 7.750%, 06/08/2022 | 207,032 | |
| 200,000 | VNESHECONOMBANK(VEB), Series REGS, 5.942%, 11/21/2023 | 217,869 | |
| 300,000 | VTB Bank OJSC, Sub. Note, Series REGS, 9.500%, 12/06/2066 | 332,778 | |
| 300,000 | Wells Fargo & Co., Sr. Unsecd. Note, 3.000%, 10/23/2026 | 294,302 | |
| 200,000 | Yapi ve Kredi Bankasi A.S., Sr. Unsecd. Note, Series 144A, 5.850%, 06/21/2024 | 200,378 | |
| 200,000 | Zenith Bank Ltd., Sr. Unsecd. Note, Series 144A, 7.375%, 05/30/2022 | 208,640 | |
| TOTAL | 20,909,330 | ||
| Brewing—0.1% | |||
| 300,000 | Anadolu Efes Biracilik ve Malt Sanayii A.S., Series REGS, 3.375%, 11/01/2022 | 293,938 | |
| Building & Development—0.0% | |||
| 100,000 | Odebrecht S.A., Company Guarantee, Series 144A, 7.500%, 12/14/2066 | 32,800 | |
| Business Equipment & Services—0.0% | |||
| 200,000 | GNL Quintero S.A., Sr. Unsecd. Note, Series REGS, 4.634%, 07/31/2029 | 209,000 | |
| Capital Goods - Aerospace & Defense—0.2% | |||
| 250,000 | Airbus Group SE, Sr. Unsecd. Note, Series 144A, 3.150%, 04/10/2027 | 251,011 | |
| 200,000 | Embraer Netherlands Finance, Sr. Unsecd. Note, 5.400%, 02/01/2027 | 216,250 | |
| 160,000 | Huntington Ingalls Industries, Sr. Unsecd. Note, Series 144A, 3.483%, 12/01/2027 | 159,800 | |
| 400,000 | Lockheed Martin Corp., Sr. Unsecd. Note, 2.900%, 03/01/2025 | 399,279 | |
| 185,000 | Northrop Grumman Corp., Sr. Unsecd. Note, 3.250%, 01/15/2028 | 185,607 | |
| 200,000 | Textron, Inc., Sr. Unsecd. Note, 3.650%, 03/15/2027 | 203,589 | |
| TOTAL | 1,415,536 | ||
| Capital Goods - Building Materials—0.1% | |||
| 50,000 | Allegion US Holdings Co., Sr. Unsecd. Note, 3.200%, 10/01/2024 | 49,538 | |
| 90,000 | Allegion US Holdings Co., Sr. Unsecd. Note, 3.550%, 10/01/2027 | 89,218 | |
| 200,000 | Cemex Finance LLC, Series REGS, 6.000%, 04/01/2024 | 212,000 |
| Shares, Principal Amount or Contracts | Value | ||
| CORPORATE BONDS—continued | |||
| Capital Goods - Building Materials—continued | |||
| $200,000 | Cemex, Sab De Cv, Series 144A, 7.750%, 04/16/2026 | $227,000 | |
| 165,000 | Masco Corp., Sr. Unsecured Note, Series 0, 4.500%, 05/15/2047 | 168,417 | |
| TOTAL | 746,173 | ||
| Capital Goods - Construction Machinery—0.0% | |||
| 120,000 | CNH Industrial NV, Sr. Unsecd. Note, Series MTN, 3.850%, 11/15/2027 | 119,872 | |
| Capital Goods - Diversified Manufacturing—0.1% | |||
| 300,000 | Parker-Hannifin Corp., Sr. Unsecd. Note, 3.250%, 03/01/2027 | 302,910 | |
| Chemicals & Plastics—0.3% | |||
| 200,000 | Albemarle Corp., 4.150%, 12/01/2024 | 212,182 | |
| 200,000 | Albemarle Corp., Sr. Unsecd. Note, 5.450%, 12/01/2044 | 236,683 | |
| 200,000 | Alpek Sa De CV, Sr. Unsecd. Note, Series REGS, 4.500%, 11/20/2022 | 205,750 | |
| 200,000 | Braskem Finance Ltd., 6.450%, 02/03/2024 | 225,002 | |
| 200,000 | Mexichem S.A. de CV, Sr. Unsecd. Note, Series 144A, 5.500%, 01/15/2048 | 195,250 | |
| 200,000 | OCP S.A., Sr. Unsecd. Note, Series REGS, 4.500%, 10/22/2025 | 200,659 | |
| 200,000 | PTT Global Chemical PCL, Series REGS, 4.250%, 09/19/2022 | 209,607 | |
| 200,000 | Phosagro OAO via Phosagro, Sr. Unsecd. Note, Series 144A, 3.950%, 11/03/2021 | 201,873 | |
| 250,000 | Sinochem Overseas Capital Co. Ltd., Company Guarantee, Series REGS, 4.500%, 11/12/2020 | 261,077 | |
| TOTAL | 1,948,083 | ||
| Communications - Cable & Satellite—0.2% | |||
| 250,000 | CCO Safari II LLC, 6.484%, 10/23/2045 | 292,264 | |
| 200,000 | Comcast Corp., Sr. Unsecd. Note, 3.150%, 02/15/2028 | 200,831 | |
| 350,000 | Comcast Corp., Sr. Unsecd. Note, 3.300%, 02/01/2027 | 357,379 | |
| 300,000 | Time Warner Cable, Inc., Company Guarantee, 5.500%, 09/01/2041 | 313,492 | |
| TOTAL | 1,163,966 | ||
| Communications - Media & Entertainment—0.2% | |||
| 300,000 | CBS Corp., 4.900%, 08/15/2044 | 316,206 | |
| 250,000 | Discovery Communications, Sr. Unsecd. Note, 4.900%, 03/11/2026 | 267,076 | |
| 300,000 | WPP Finance 2010, Sr. Unsecd. Note, 5.125%, 09/07/2042 | 324,267 | |
| TOTAL | 907,549 | ||
| Communications - Telecom Wireless—0.1% | |||
| 300,000 | American Tower Corp., Sr. Unsecd. Note, 5.000%, 02/15/2024 | 328,982 | |
| 360,000 | Crown Castle International Corp., Sr. Unsecd. Note, 3.700%, 06/15/2026 | 360,307 | |
| TOTAL | 689,289 | ||
| Communications - Telecom Wirelines—0.2% | |||
| 700,000 | AT&T, Inc., Sr. Unsecd. Note, 5.150%, 03/15/2042 | 728,271 | |
| 180,000 | Telefonica Emisiones SAU, Sr. Unsecd. Note, 5.213%, 03/08/2047 | 204,902 | |
| 534,000 | Verizon Communications, Inc., Sr. Unsecd. Note, 5.012%, 04/15/2049 | 561,806 | |
| TOTAL | 1,494,979 | ||
| Conglomerates—0.0% | |||
| 100,000 | Arcos Dorados Holdings, Inc., Sr. Unsecd. Note, Series 144A, 5.875%, 04/04/2027 | 105,966 | |
| Consumer Cyclical - Automotive—0.3% | |||
| 200,000 | Daimler Finance NA LLC, Sr. Unsecd. Note, Series 144A, 2.850%, 01/06/2022 | 200,947 | |
| 170,000 | Ford Motor Co., Sr. Unsecd. Note, 4.750%, 01/15/2043 | 172,893 | |
| 350,000 | General Motors Co., Sr. Unsecd. Note, 5.200%, 04/01/2045 | 370,893 | |
| 200,000 | Hyundai Capital America, Sr. Unsecd. Note, Series 144A, 3.100%, 04/05/2022 | 199,107 | |
| 200,000 | Hyundai Capital Services, Sr. Unsecd. Note, Series 144A, 3.000%, 08/29/2022 | 196,825 | |
| 200,000 | Kia Motors Corp., Sr. Unsecd. Note, Series 144A, 3.500%, 10/25/2027 | 196,968 |
| Shares, Principal Amount or Contracts | Value | ||
| CORPORATE BONDS—continued | |||
| Consumer Cyclical - Automotive—continued | |||
| $200,000 | Nissan Motor Acceptance Corp., Sr. Unsecd. Note, Series 144A, 2.250%, 01/13/2020 | $199,689 | |
| TOTAL | 1,537,322 | ||
| Consumer Cyclical - Retailers—0.1% | |||
| 185,000 | AutoZone, Inc., Sr. Unsecd. Note, 3.750%, 06/01/2027 | 188,068 | |
| 140,000 | Dollar General Corp., Sr. Unsecd. Note, 3.875%, 04/15/2027 | 146,244 | |
| TOTAL | 334,312 | ||
| Consumer Cyclical - Services—0.1% | |||
| 80,000 | Visa, Inc., Sr. Unsecd. Note, 2.750%, 09/15/2027 | 79,008 | |
| 200,000 | Visa, Inc., Sr. Unsecd. Note, 2.800%, 12/14/2022 | 203,038 | |
| TOTAL | 282,046 | ||
| Consumer Non-Cyclical - Food/Beverage—0.4% | |||
| 200,000 | Becle S.A. de CV, Sr. Unsecd. Note, Series 144A, 3.750%, 05/13/2025 | 201,037 | |
| 100,000 | BFF International Ltd., Sr. Unsecd. Note, Series 144A, 7.250%, 01/28/2020 | 107,500 | |
| 200,000 | Danone S.A., Sr. Unsecd. Note, Series 144A, 2.947%, 11/02/2026 | 195,060 | |
| 200,000 | Grupo Bimbo SAB de CV, Sr. Unsecd. Note, Series 144A, 3.875%, 06/27/2024 | 206,804 | |
| 200,000 | Grupo Bimbo SAB de CV, Series 144A, 4.875%, 06/27/2044 | 208,189 | |
| 90,000 | Heineken NV, Sr. Unsecd. Note, Series 144A, 3.500%, 01/29/2028 | 91,981 | |
| 200,000 | JBS Investments GmbH, Series REGS, 7.750%, 10/28/2020 | 204,750 | |
| 150,000 | JBS USA LLC/JBS USA Finance, Sr. Unsecd. Note, Series 144A, 7.250%, 06/01/2021 | 153,188 | |
| 140,000 | Kraft Heinz Foods Co., Sr. Unsecd. Note, 4.375%, 06/01/2046 | 139,112 | |
| 200,000 | Marfrig Holding Europe BV, Sr. Unsecd. Note, Series 144A, 7.000%, 03/15/2024 | 201,250 | |
| 200,000 | Minerva Luxembourg S.A., Sr. Unsecd. Note, Series 144A, 5.875%, 01/19/2028 | 194,850 | |
| 150,000 | Molson Coors Brewing Co., Sr. Unsecd. Note, 3.000%, 07/15/2026 | 147,051 | |
| 140,000 | Mondelez International Holdings Netherlands BV, Sr. Unsecd. Note, Series 144A, 2.000%, 10/28/2021 | 136,310 | |
| 200,000 | Sigma Alimentos S.A., Sr. Unsecd. Note, Series 144A, 4.125%, 05/02/2026 | 202,250 | |
| 50,000 | Smithfield Foods, Inc., Sr. Unsecd. Note, Series 144A, 4.250%, 02/01/2027 | 51,390 | |
| 95,000 | Tyson Foods, Inc., Sr. Unsecd. Note, 3.550%, 06/02/2027 | 97,438 | |
| TOTAL | 2,538,160 | ||
| Consumer Non-Cyclical - Health Care—0.1% | |||
| 200,000 | Agilent Technologies, Inc., Sr. Unsecd. Note, 3.875%, 07/15/2023 | 207,362 | |
| 200,000 | Becton Dickinson & Co., Sr. Unsecd. Note, 4.669%, 06/06/2047 | 217,230 | |
| 120,000 | Medtronic Global Holdings, Sr. Unsecd. Note, 3.350%, 04/01/2027 | 123,236 | |
| TOTAL | 547,828 | ||
| Consumer Non-Cyclical - Pharmaceuticals—0.1% | |||
| 100,000 | Abbott Laboratories, Sr. Unsecd. Note, 3.750%, 11/30/2026 | 102,848 | |
| 100,000 | Abbott Laboratories, Sr. Unsecd. Note, 4.900%, 11/30/2046 | 115,011 | |
| 190,000 | AstraZeneca PLC, Sr. Unsecd. Note, 2.375%, 06/12/2022 | 187,919 | |
| 200,000 | Celgene Corp., Sr. Unsecd. Note, 4.350%, 11/15/2047 | 208,424 | |
| 175,000 | Teva Pharmaceutical Industries Ltd., Sr. Unsecd. Note, 2.950%, 12/18/2022 | 157,144 | |
| 200,000 | Teva Pharmaceutical Finance, Sr. Unsecd. Note, 3.150%, 10/01/2026 | 165,389 | |
| TOTAL | 936,735 | ||
| Consumer Non-Cyclical - Products—0.0% | |||
| 200,000 | Reckitt Benckiser Treasury, Sr. Unsecd. Note, Series 144A, 3.000%, 06/26/2027 | 195,507 | |
| Consumer Non-Cyclical - Supermarkets—0.0% | |||
| 200,000 | Kroger Co., Sr. Unsecd. Note, 4.450%, 02/01/2047 | 200,328 | |
| Consumer Non-Cyclical - Tobacco—0.1% | |||
| 280,000 | Reynolds American, Inc., Sr. Unsecd. Note, 7.000%, 08/04/2041 | 379,864 |
| Shares, Principal Amount or Contracts | Value | ||
| CORPORATE BONDS—continued | |||
| Consumer Products—0.0% | |||
| $62,000 | Mastellone Hermanos S.A., Sr. Unsecd. Note, Series REGS, 12.625%, 07/03/2021 | $68,617 | |
| Energy - Independent—0.2% | |||
| 300,000 | Anadarko Petroleum Corp., Sr. Unsecd. Note, 5.550%, 03/15/2026 | 337,063 | |
| 400,000 | Canadian Natural Resources Ltd., Sr. Unsecd. Note, 3.800%, 04/15/2024 | 412,406 | |
| 300,000 | EOG Resources, Inc., Sr. Unsecd. Note, 4.150%, 01/15/2026 | 319,744 | |
| 300,000 | Marathon Oil Corp., Sr. Unsecd. Note, 3.850%, 06/01/2025 | 305,799 | |
| TOTAL | 1,375,012 | ||
| Energy - Integrated—0.1% | |||
| 110,000 | BP Capital Markets PLC, 3.119%, 05/04/2026 | 111,269 | |
| 185,000 | BP Capital Markets PLC, Sr. Unsecd. Note, 3.279%, 09/19/2027 | 187,446 | |
| 300,000 | Husky Energy, Inc., Sr. Unsecd. Note, 3.950%, 04/15/2022 | 310,640 | |
| 90,000 | Shell International Finance, Sr. Unsecd. Note, 2.875%, 05/10/2026 | 90,076 | |
| 75,000 | Shell International Finance, Sr. Unsecd. Note, 4.000%, 05/10/2046 | 80,009 | |
| TOTAL | 779,440 | ||
| Energy - Midstream—0.3% | |||
| 60,000 | Andeavor Logistics LP, Sr. Unsecd. Note, 4.250%, 12/01/2027 | 60,617 | |
| 175,000 | Energy Transfer Partners, Sr. Unsecd. Note, 4.050%, 03/15/2025 | 175,100 | |
| 300,000 | Enterprise Products Operating, Sr. Unsecd. Note, 3.950%, 02/15/2027 | 312,307 | |
| 200,000 | Kinder Morgan Energy Partners LP, Sr. Unsecd. Note, 6.375%, 03/01/2041 | 233,054 | |
| 240,000 | MPLX LP, Sr. Unsecd. Note, 4.125%, 03/01/2027 | 246,207 | |
| 200,000 | ONEOK, Inc., Sr Unsecured Note, Series 0, 4.950%, 07/13/2047 | 208,709 | |
| 120,000 | TC Pipelines, LP, Sr. Unsecd. Note, 3.900%, 05/25/2027 | 120,796 | |
| 200,000 | Williams Partners LP, Sr. Unsecd. Note, 3.900%, 01/15/2025 | 204,093 | |
| 200,000 | Williams Partners LP, Sr. Unsecd. Note, 4.125%, 11/15/2020 | 207,793 | |
| TOTAL | 1,768,676 | ||
| Energy - Oil Field Services—0.0% | |||
| 200,000 | Weatherford International Ltd., 7.000%, 03/15/2038 | 169,000 | |
| Energy - Refining—0.1% | |||
| 200,000 | HollyFrontier Corp., Sr. Unsecd. Note, 5.875%, 04/01/2026 | 222,834 | |
| 220,000 | Phillips 66, Sr. Unsecd. Note, 4.875%, 11/15/2044 | 252,749 | |
| 300,000 | Valero Energy Corp., Sr. Unsecd. Note, 3.650%, 03/15/2025 | 308,473 | |
| TOTAL | 784,056 | ||
| Farming & Agriculture—0.2% | |||
| 1,000,000 | Kazagro Natl Mgmt Hldng., Series 144A, 4.625%, 05/24/2023 | 1,013,678 | |
| Finance—0.2% | |||
| 300,000 | Corp Financi De Desarrol, Sr. Unsecd. Note, Series 144A, 4.750%, 07/15/2025 | 319,350 | |
| 200,000 | Gazprombk (GPB Finance), Sub. Note, 7.496%, 12/28/2023 | 205,644 | |
| 200,000 | ICD Sukuk Co. Ltd., Sr. Unsecd. Note, Series EMTN, 5.000%, 02/01/2027 | 207,915 | |
| 200,000 | Latam Finance Ltd., Sr. Unsecd. Note, Series 144A, 6.875%, 04/11/2024 | 209,000 | |
| 200,000 | MAF Global Securities, Jr. Sub. Note, 5.500%, 09/07/2066 | 205,006 | |
| 150,000 | SURA Asset Management S.A., Sr. Unsecd. Note, Series 144A, 4.375%, 04/11/2027 | 151,875 | |
| TOTAL | 1,298,790 | ||
| Financial Institution - Broker/Asset Mgr/Exchange—0.2% | |||
| 200,000 | Jefferies Group LLC, Sr. Unsecd. Note, 6.500%, 01/20/2043 | 236,527 | |
| 200,000 | Jefferies Group, Inc., Sr. Unsecd. Note, 6.250%, 01/15/2036 | 227,930 | |
| 400,000 | Stifel Financial Corp., Sr. Unsecd. Note, 3.500%, 12/01/2020 | 403,390 | |
| 200,000 | TD Ameritrade Holding Corp., Sr. Unsecd. Note, 3.300%, 04/01/2027 | 201,995 | |
| TOTAL | 1,069,842 |
| Shares, Principal Amount or Contracts | Value | ||
| CORPORATE BONDS—continued | |||
| Financial Institution - Finance Companies—0.1% | |||
| $200,000 | Discover Financial Services, Sr. Unsecd. Note, 4.100%, 02/09/2027 | $205,189 | |
| 200,000 | GE Capital International, Sr. Unsecd. Note, 3.373%, 11/15/2025 | 203,572 | |
| TOTAL | 408,761 | ||
| Financial Institution - Insurance - Life—0.2% | |||
| 350,000 | Aflac, Inc., Sr. Unsecd. Note, 3.625%, 06/15/2023 | 363,676 | |
| 350,000 | Lincoln National Corp., Sr. Unsecd. Note, 4.200%, 03/15/2022 | 368,894 | |
| 150,000 | Massachusetts Mutual Life, Sub. Note, Series 144A, 4.900%, 04/01/2077 | 170,875 | |
| 170,000 | Pacific Life Insurance Co., Sub. Note, Series 144A, 4.30%, 10/24/2067 | 170,952 | |
| 300,000 | Prudential Financial, Inc., Sr. Unsecd. Note, Series MTN, 4.600%, 05/15/2044 | 341,688 | |
| TOTAL | 1,416,085 | ||
| Financial Institution - Insurance - P&C—0.2% | |||
| 200,000 | Liberty Mutual Group, Inc., Series 144A, 4.850%, 08/01/2044 | 222,948 | |
| 500,000 | Nationwide Mutual Insurance Co., Sub. Note, Series 144A, 9.375%, 08/15/2039 | 852,331 | |
| TOTAL | 1,075,279 | ||
| Financial Institution - REIT - Apartment—0.1% | |||
| 200,000 | Avalonbay Communities, Inc., Sr. Unsecd. Note, Series MTN, 3.350%, 05/15/2027 | 201,725 | |
| 200,000 | UDR, Inc., 3.750%, 07/01/2024 | 205,959 | |
| TOTAL | 407,684 | ||
| Financial Institution - REIT - Healthcare—0.1% | |||
| 300,000 | Health Care REIT, Inc., Sr. Unsecd. Note, 4.950%, 01/15/2021 | 318,964 | |
| 200,000 | Healthcare Trust of America, Sr. Unsecd. Note, 3.750%, 07/01/2027 | 199,525 | |
| 100,000 | Physicians Realty Trust, Sr. Unsecd. Note, 3.950%, 01/15/2028 | 99,011 | |
| 100,000 | Physicians Realty Trust, Sr. Unsecd. Note, 4.300%, 03/15/2027 | 101,907 | |
| TOTAL | 719,407 | ||
| Financial Institution - REIT - Office—0.1% | |||
| 350,000 | Alexandria Real Estate Equities, Inc., Sr. Unsecd. Note, 3.900%, 06/15/2023 | 362,091 | |
| Financial Institution - REIT - Other—0.0% | |||
| 250,000 | WP Carey, Inc., Sr. Unsecd. Note, 4.600%, 04/01/2024 | 261,455 | |
| Financial Institution - REIT - Retail—0.0% | |||
| 190,000 | Kimco Realty Corp., Sr. Unsecd. Note, 3.800%, 04/01/2027 | 192,208 | |
| Financial Intermediaries—0.1% | |||
| 200,000 | ADIB Capital Invest 1 Ltd., Jr. Sub. Note, 6.375%, 04/16/2066 | 203,625 | |
| 200,000 | Huarong Finance II Co. Ltd., Sr. Unsecd. Note, Series EMTN, 3.250%, 06/03/2021 | 198,911 | |
| 250,000 | Ooredoo International Finance Ltd., Sr. Unsecd. Note, Series REGS, 5.000%, 10/19/2025 | 270,377 | |
| 200,000 | Trust F/1401, Sr. Unsecd. Note, Series 144A, 6.950%, 01/30/2044 | 218,500 | |
| TOTAL | 891,413 | ||
| Food & Drug Retailers—0.0% | |||
| 200,000 | Cencosud S.A., Series REGS, 4.875%, 01/20/2023 | 210,260 | |
| Forest Products—0.0% | |||
| 200,000 | Bahia SUL Holdings GmbH, Sr. Unsecd. Note, Series 144A, 5.750%, 07/14/2026 | 217,620 | |
| Home Products & Furnishings—0.0% | |||
| 200,000 | Arcelik AS, Sr. Unsecd. Note, Series REGS, 5.000%, 04/03/2023 | 202,594 | |
| Metals & Mining—0.7% | |||
| 110,000 | Anglogold Ashanti Holdings PLC, Sr. Unsecd. Note, 5.125%, 08/01/2022 | 115,315 | |
| 100,000 | CSN Islands XII Corp., Sr. Unsecd. Note, Series 144A, 7.000%, 12/23/2066 | 80,700 | |
| 200,000 | Chinalco Capital Holdings, Sr. Unsecd. Note, 4.000%, 08/25/2021 | 198,764 | |
| 300,000 | Codelco, Inc., Sr. Unsecd. Note, Series 144A, 4.250%, 07/17/2042 | 312,733 | |
| 200,000 | Codelco, Inc., Sr. Unsecd. Note, Series 144A, 4.875%, 11/04/2044 | 228,337 |
| Shares, Principal Amount or Contracts | Value | ||
| CORPORATE BONDS—continued | |||
| Metals & Mining—continued | |||
| $100,000 | Codelco, Inc., Sr. Unsecd. Note, Series 144A, 6.150%, 10/24/2036 | $127,469 | |
| 200,000 | Evraz Group S.A., Sr. Unsecd. Note, Series 144A, 5.375%, 03/20/2023 | 208,250 | |
| 200,000 | Fresnillo PLC, Series REGS, 5.500%, 11/13/2023 | 219,750 | |
| 200,000 | GTL Trade Finance, Inc., Sr. Unsecd. Note, Series 144A, 5.893%, 04/29/2024 | 215,500 | |
| 200,000 | Gerdau Trade, Inc., Sr. Unsecd. Note, Series 144A, 4.875%, 10/24/2027 | 199,250 | |
| 200,000 | JSW Steel Ltd., Sr. Unsecd. Note, 5.250%, 04/13/2022 | 205,022 | |
| 200,000 | Metalloinvest Finance DAC, Sr. Unsecd. Note, Series 144A, 4.850%, 05/02/2024 | 204,759 | |
| 75,000 | Southern Copper Corp., Sr. Unsecd. Note, 3.875%, 04/23/2025 | 77,982 | |
| 200,000 | Southern Copper Corp., Sr. Unsecd. Note, 5.250%, 11/08/2042 | 224,033 | |
| 150,000 | Southern Copper Corp., Sr. Unsecd. Note, 5.875%, 04/23/2045 | 181,697 | |
| 200,000 | VM Holding S.A., Sr. Unsecd. Note, Series 144A, 5.375%, 05/04/2027 | 212,500 | |
| 375,000 | Vale Overseas Ltd., 4.375%, 01/11/2022 | 388,687 | |
| 110,000 | Vale Overseas Ltd., 6.875%, 11/21/2036 | 135,300 | |
| 100,000 | Vale Overseas Ltd., Sr. Unsecd. Note, 5.875%, 06/10/2021 | 109,150 | |
| 120,000 | Vale Overseas Ltd., Sr. Unsecd. Note, 6.250%, 08/10/2026 | 139,320 | |
| 40,000 | Vale Overseas Ltd., Sr. Unsecd. Note, 8.250%, 01/17/2034 | 53,050 | |
| 200,000 | Vedanta Resources PLC, Sr. Unsecd. Note, Series 144A, 6.125%, 08/09/2024 | 204,572 | |
| 100,000 | Volcan Compania Minera S.A., Series 144A, 5.375%, 02/02/2022 | 105,000 | |
| 115,000 | Worthington Industries, Inc., Sr. Unsecured Note, Series 0, 4.300%, 08/01/2032 | 115,736 | |
| TOTAL | 4,262,876 | ||
| Oil & Gas—2.5% | |||
| 200,000 | Abu Dhabi Crude Oil Pipel, Series 144A, 4.600%, 11/02/2047 | 206,254 | |
| 1,000,000 | CNOOC Finance 2014 ULC, 4.250%, 04/30/2024 | 1,055,924 | |
| 500,000 | CNPC General Capital Ltd., Sr. Unsecd. Note, Series EMTN, 2.700%, 11/25/2019 | 500,304 | |
| 200,000 | China Oil & Gas Group Ltd., Sr. Unsecd. Note, 5.000%, 05/07/2020 | 204,000 | |
| 150,000 | Ecopetrol S.A., Sr. Unsecd. Note, 4.125%, 01/16/2025 | 151,125 | |
| 100,000 | Ecopetrol S.A., Sr. Unsecd. Note, 5.375%, 06/26/2026 | 108,220 | |
| 100,000 | Ecopetrol S.A., Sr. Unsecd. Note, 5.875%, 05/28/2045 | 102,450 | |
| 117,000 | Ecopetrol S.A., Sr. Unsecd. Note, 5.875%, 09/18/2023 | 129,578 | |
| 200,000 | Equate Petrochemical BV, Sr. Unsecd. Note, Series 144A, 3.000%, 03/03/2022 | 197,422 | |
| 200,000 | Gaz Capital S.A., Sr. Unsecd. Note, Series REGS, 4.950%, 02/06/2028 | 208,677 | |
| 500,000 | Gazprom Via Gaz Capital S.A., Sr. Unsecd. Note, Series 144A, 4.950%, 03/23/2027 | 521,325 | |
| 200,000 | Harvest Operations Corp., Sr. Unsecd. Note, Series 144A, 3.000%, 09/21/2022 | 198,218 | |
| 400,000 | KazMunayGas National Co. JSC, Sr. Unsecd. Note, Series 144A, 4.750%, 04/19/2027 | 422,504 | |
| 200,000 | KazMunayGas National Co. JSC, Sr. Unsecd. Note, Series 144A, 5.750%, 04/19/2047 | 213,750 | |
| 374,000 | ONGC Videsh Ltd., 3.750%, 05/07/2023 | 380,763 | |
| 200,000 | Oil & Gas Holdings, Sr. Unsecd. Note, Series 144A, 7.500%, 10/25/2027 | 205,224 | |
| 200,000 | PTTEP Treasury Center Co., Jr. Sub. Note, Series REGS, 4.875%, 12/18/2066 | 203,375 | |
| 150,000 | Pemex Project Funding Master Trust, Sr. Unsecd. Note, 6.625%, 06/15/2038 | 156,750 | |
| 200,000 | Pertamina Persero PT, Sr. Unsecd. Note, Series REGS, 5.625%, 05/20/2043 | 217,981 | |
| 200,000 | Pertamina Persero PT, Series 144A, 4.300%, 05/20/2023 | 209,502 | |
| 150,000 | Petrobras Global Finance BV, Sr. Unsecd. Note, 6.850%, 06/05/2115 | 144,937 | |
| 100,000 | Petrobras Global Finance, Sec. Fac. Bond, 7.250%, 03/17/2044 | 104,250 | |
| 400,000 | Petrobras Global Finance, Sr. Unsecd. Note, 7.375%, 01/17/2027 | 441,200 | |
| 200,000 | Petrobras Global Finance, Sr. Unsecd. Note, 8.750%, 05/23/2026 | 239,500 | |
| 200,000 | Petrobras Global Finance, Sr. Unsecd. Note, Series 144A, 5.299%, 01/27/2025 | 200,850 | |
| 742,000 | Petrobras Global Finance, Sr. Unsecd. Note, Series 144A, 5.999%, 01/27/2028 | 744,782 | |
| 250,000 | Petrobras International Finance Co., Sr. Unsecd. Note, 5.375%, 01/27/2021 | 260,625 | |
| 850,000 | Petroleos de Venezuela, S.A., Sr. Unsecd. Note, Series REGS, 6.000%, 11/15/2026 | 190,400 |
| Shares, Principal Amount or Contracts | Value | ||
| CORPORATE BONDS—continued | |||
| Oil & Gas—continued | |||
| $100,000 | Petroleos Mexicanos, 5.500%, 06/27/2044 | $92,246 | |
| 150,000 | Petroleos Mexicanos, 6.500%, 06/02/2041 | 154,650 | |
| 875,000 | Petroleos Mexicanos, Sr. Unsecured Note, Series 144A, 6.500%, 03/13/2027 | 957,469 | |
| 450,000 | Petroleos Mexicanos, Sr. Unsecd. Note, 4.875%, 01/18/2024 | 467,302 | |
| 500,000 | Petroleos Mexicanos, Sr. Unsecd. Note, 4.875%, 01/24/2022 | 522,375 | |
| 410,000 | Petroleos Mexicanos, Sr. Unsecd. Note, 6.375%, 01/23/2045 | 413,218 | |
| 100,000 | Petroleos Mexicanos, Sr. Unsecd. Note, 6.750%, 09/21/2047 | 104,635 | |
| 270,000 | Petroleos Mexicanos, Sr. Unsecd. Note, 6.875%, 08/04/2026 | 306,787 | |
| 100,000 | Petroleum Co. of Trinidad, Sr. Unsecd. Note, Series REGS, 9.750%, 08/14/2019 | 107,000 | |
| 200,000 | Puma International Financing S.A., Series REGS, 6.750%, 02/01/2021 | 204,202 | |
| 250,000 | Puma International Financing S.A., Sr. Unsecd. Note, Series 144A, 5.125%, 10/06/2024 | 255,496 | |
| 250,000 | Reliance Industries Ltd., Sr. Unsecd. Note, Series 144A, 3.667%, 11/30/2027 | 247,838 | |
| 250,000 | Reliance Industries Ltd., Sr. Unsecd. Note, Series 144A, 4.875%, 02/10/2045 | 278,922 | |
| 200,000 | Rosneft Oil Co., Series 144A, 4.199%, 03/06/2022 | 202,157 | |
| 200,000 | Saka Energi Indonesia PT, Sr. Unsecd. Note, Series 144A, 4.450%, 05/05/2024 | 203,430 | |
| 500,000 | Sinochem Offshore Capital Co. Ltd., Sr. Unsecd. Note, Series REGS, 3.250%, 04/29/2019 | 503,395 | |
| 200,000 | Sinopec Group Overseas Development 2017 Ltd., Sr. Unsecd. Note, Series 144A, 3.625%, 04/12/2027 | 201,462 | |
| 800,000 | Sinopec Group Overseas Development 2015 Ltd., Sr. Unsecd. Note, Series REGS, 3.250%, 04/28/2025 | 795,461 | |
| 396,000 | Sinopec Group Overseas Development 2016 Ltd., Sr. Unsecd. Note, Series REGS, 3.500%, 05/03/2026 | 399,120 | |
| 200,000 | Southern Gas Corridor CJSC, Unsecd. Note, Series 144A, 6.875%, 03/24/2026 | 227,738 | |
| 300,000 | Turkiye Petrol Rafinerile, Sr. Unsecd. Note, Series 144A, 4.500%, 10/18/2024 | 297,056 | |
| 200,000 | Ultrapar International S.A., Sr. Unsecd. Note, Series REGS, 5.250%, 10/06/2026 | 204,644 | |
| 200,000 | YPF Sociedad Anonima, Series 144A, 8.750%, 04/04/2024 | 230,200 | |
| 200,000 | YPF Sociedad Anonima, Sr. Unsecd. Note, Series 144A, 6.950%, 07/21/2027 | 212,800 | |
| 200,000 | YPF Sociedad Anonima, Sr. Unsecd. Note, Series 144A, 7.000%, 12/15/2047 | 198,700 | |
| TOTAL | 15,708,193 | ||
| Paper Products—0.1% | |||
| 100,000 | Fibria Overseas Finance, Sr. Unsecd. Note, 4.000%, 01/14/2025 | 99,187 | |
| 200,000 | Fibria Overseas Finance, Sr. Unsecd. Note, 5.500%, 01/17/2027 | 215,000 | |
| TOTAL | 314,187 | ||
| Printing & Publishing—0.0% | |||
| 200,000 | Myriad International Holdings BV, Sr. Unsecd. Note, Series 144A, 4.850%, 07/06/2027 | 207,883 | |
| Real Estate—0.3% | |||
| 200,000 | Alpha Star Holding Ltd., 4.970%, 04/09/2019 | 201,750 | |
| 300,000 | China Overseas Finance Cayman V Ltd., Sr. Unsecd. Note, Series A, 3.950%, 11/15/2022 | 309,107 | |
| 200,000 | Country Garden Holdings, Sr. Unsecd. Note, 7.500%, 03/09/2020 | 208,870 | |
| 400,000 | Franshion Brilliant Ltd., 5.750%, 03/19/2019 | 412,514 | |
| 300,000 | Franshion Brilliant Ltd., Sub. Note, 5.75%, 07/17/2066 | 309,046 | |
| 200,000 | Shimao Property Holdings , Sr. Unsecd. Note, 4.750%, 07/03/2022 | 199,657 | |
| 200,000 | Yanlord Land Group Ltd., Sr. Unsecd. Note, 5.875%, 01/23/2022 | 205,263 | |
| TOTAL | 1,846,207 | ||
| Retailers—0.1% | |||
| 200,000 | Golden Eagle Retail Group, Sr. Unsecd. Note, Series REGS, 4.625%, 05/21/2023 | 187,760 | |
| 100,000 | InRetail Consumer, Sr. Unsecd. Note, Series 144A, 5.250%, 10/10/2021 | 103,500 | |
| 200,000 | JD.com, Inc., Sr. Unsecd. Note, 3.875%, 04/29/2026 | 201,517 | |
| 200,000 | Saci Falabella, Series REGS, 3.750%, 04/30/2023 | 205,287 | |
| TOTAL | 698,064 |
| Shares, Principal Amount or Contracts | Value | ||
| CORPORATE BONDS—continued | |||
| Sovereign—0.0% | |||
| $200,000 | Kazakhstan Temir Zholy, Sr. Unsecd. Note, Series 144A, 4.850%, 11/17/2027 | $208,923 | |
| State/Provincial—0.4% | |||
| 400,000 | Buenos Aires, City of, Sr. Unsecd. Note, Series 144A, 8.950%, 02/19/2021 | 445,000 | |
| 200,000 | Province of Santa Fe, Sr. Unsecd. Note, Series 144A, 6.900%, 11/01/2027 | 211,730 | |
| 600,000 | Provincia De Buenos Aires, Series REGS, 10.875%, 01/26/2021 | 682,500 | |
| 700,000 | Provincia De Buenos Aires, Sr. Unsecd. Note, Series 144A, 7.875%, 06/15/2027 | 776,874 | |
| 150,000 | Provincia De Cordoba, Sr. Unsecd. Note, Series 144A, 7.450%, 09/01/2024 | 164,044 | |
| TOTAL | 2,280,148 | ||
| Steel—0.0% | |||
| 200,000 | OJSC Novo(Steel Funding), Sr. Unsecd. Note, Series REGS, 4.000%, 09/21/2024 | 200,860 | |
| Technology—0.4% | |||
| 600,000 | Apple, Inc., Sr. Unsecd. Note, 2.500%, 02/09/2022 | 600,803 | |
| 400,000 | Apple, Inc., Sr. Unsecd. Note, 2.900%, 09/12/2027 | 395,637 | |
| 70,000 | Diamond 1 Finance Corp./Diamond 2 Finance Corp., Sr. Secd. Note, Series 144A, 4.420%, 06/15/2021 | 72,991 | |
| 260,000 | Diamond 1 Finance Corp./Diamond 2 Finance Corp., Sr. Secd. Note, Series 144A, 6.020%, 06/15/2026 | 287,080 | |
| 125,000 | Equifax, Inc., Sr. Unsecd. Note, 2.300%, 06/01/2021 | 122,100 | |
| 100,000 | Microsoft Corp., Sr. Unsecd. Note, 2.400%, 08/08/2026 | 96,521 | |
| 245,000 | Microsoft Corp., Sr. Unsecd. Note, 4.000%, 02/12/2055 | 262,597 | |
| 200,000 | Oracle Corp., Sr. Unsecd. Note, 3.250%, 11/15/2027 | 203,583 | |
| 150,000 | Qualcomm, Inc., Sr. Unsecd. Note, 2.100%, 05/20/2020 | 149,411 | |
| TOTAL | 2,190,723 | ||
| Technology Services—0.3% | |||
| 200,000 | Alibaba Group Holding Ltd., Sr. Unsecd. Note, 3.400%, 12/06/2027 | 200,139 | |
| 800,000 | Alibaba Group Holding Ltd., Sr. Unsecd. Note, 3.600%, 11/28/2024 | 830,445 | |
| 200,000 | Baidu, Inc., Sr. Unsecd. Note, 3.625%, 07/06/2027 | 198,180 | |
| 200,000 | Lenovo Group Ltd., Sr. Unsecd. Note, Series EMTN, 3.875%, 03/16/2022 | 199,750 | |
| 500,000 | Tencent Holdings Ltd., Sr. Unsecd. Note, Series 144A, 3.800%, 02/11/2025 | 519,319 | |
| TOTAL | 1,947,833 | ||
| Telecommunications & Cellular—0.4% | |||
| 200,000 | America Movil S.A.B. de C.V., Company Guarantee, 5.000%, 03/30/2020 | 210,994 | |
| 200,000 | Bharti Airtel Ltd., Sr. Unsecd. Note, Series REGS, 4.375%, 06/10/2025 | 203,777 | |
| 200,000 | Digicel Ltd., Sr. Unsecd. Note, Series 144A, 6.000%, 04/15/2021 | 197,598 | |
| 200,000 | GTH Finance B.V., Sr. Unsecd. Note, Series 144A, 7.250%, 04/26/2023 | 225,276 | |
| 300,000 | HTA Group Ltd., Sr. Unsecd. Note, Series 144A, 9.125%, 03/08/2022 | 322,500 | |
| 200,000 | IHS Netherlands Holdco BV, Sr. Unsecd. Note, Series REGS, 9.500%, 10/27/2021 | 215,873 | |
| 200,000 | Liquid Telecommunications, Sec. Fac. Bond, Series 144A, 8.500%, 07/13/2022 | 211,358 | |
| 300,000 | Proven Honour Capital, Sr. Unsecd. Note, 4.125%, 05/19/2025 | 309,424 | |
| 200,000 | Veon Holdings BV, Sr. Unsecd. Note, Series REGS, 5.950%, 02/13/2023 | 215,500 | |
| 200,000 | Vimpelcom, Sr. Unsecd. Note, Series 144A, 4.950%, 06/16/2024 | 203,300 | |
| TOTAL | 2,315,600 | ||
| Transportation—0.1% | |||
| 200,000 | Adani Ports and Special, Sr. Unsecd. Note, Series 144A, 3.950%, 01/19/2022 | 204,378 | |
| 200,000 | Empresa De Transporte ME, Sr. Unsecd. Note, Series 144A, 5.000%, 01/25/2047 | 220,050 | |
| 200,000 | Lima Metro Line 2 Finance Ltd., Series 144A, 5.875%, 07/05/2034 | 216,850 | |
| TOTAL | 641,278 | ||
| Transportation - Railroads—0.1% | |||
| 175,000 | Burlington Northern Santa Fe Corp., Sr. Unsecd. Note, 3.000%, 04/01/2025 | 176,472 |
| Shares, Principal Amount or Contracts | Value | ||
| CORPORATE BONDS—continued | |||
| Transportation - Railroads—continued | |||
| $350,000 | Kansas City Southern Industries, Inc., Sr. Unsecd. Note, 3.125%, 06/01/2026 | $339,507 | |
| TOTAL | 515,979 | ||
| Transportation - Services—0.1% | |||
| 280,000 | Enterprise Rent-A-Car USA Finance Co., Sr. Unsecd. Note, Series 144A, 4.500%, 02/15/2045 | 288,508 | |
| 250,000 | Penske Truck Leasing Co. LP & PTL Finance Corp., Sr. Unsecd. Note, Series 144A, 3.375%, 02/01/2022 | 254,884 | |
| 250,000 | Ryder System, Inc., Sr. Unsecd. Note, Series MTN, 3.450%, 11/15/2021 | 256,567 | |
| TOTAL | 799,959 | ||
| Utilities—1.1% | |||
| 200,000 | Abu Dhabi National Energy, Sr. Unsecd. Note, Series REGS, 4.375%, 06/22/2026 | 206,330 | |
| 200,000 | Atmos Energy Corp., Sr. Unsecd. Note, 3.000%, 06/15/2027 | 199,183 | |
| 200,000 | Azure Power Energy Ltd., 1st lien Note, Series 144A, 5.500%, 11/03/2022 | 204,000 | |
| 300,000 | Berkshire Hathaway Energy Co., Sr. Unsecd. Note, 3.750%, 11/15/2023 | 312,743 | |
| 100,000 | Centrais Eletricas Brasileiras S.A., Sr. Unsecd. Note, Series REGS, 6.875%, 07/30/2019 | 105,100 | |
| 200,000 | EDP Finance BV, Sr. Unsecured Note, Series 144A, 3.625%, 07/15/2024 | 201,583 | |
| 375,000 | Electricite de France S.A., Jr. Sub. Note, Series 144A, 5.625%, 07/22/2066 | 388,594 | |
| 200,000 | Enel Finance International S.A., Company Guarantee, Series 144A, 6.000%, 10/07/2039 | 249,487 | |
| 65,000 | Enersis Americas S.A., Sr. Unsecd. Note, 4.000%, 10/25/2026 | 66,317 | |
| 400,000 | Eskom Holdings Ltd., Sr. Unsecd. Note, Series REGS, 5.750%, 01/26/2021 | 396,360 | |
| 250,000 | Exelon Corp., Sr. Unsecd. Note, 3.400%, 04/15/2026 | 250,466 | |
| 150,000 | Fortis, Inc., Sr. Unsecd. Note, 3.055%, 10/04/2026 | 145,066 | |
| 200,000 | Indo Energy Finance II, Series REGS, 6.375%, 01/24/2023 | 206,032 | |
| 200,000 | Infraestructura Energetic, Series 144A, 3.750%, 01/14/2028 | 197,800 | |
| 490,000 | Israel Electric Corp. Ltd., Series REGS, 7.250%, 01/15/2019 | 511,624 | |
| 200,000 | Majapahit Holding BV, Series REGS, 7.875%, 06/29/2037 | 270,760 | |
| 200,000 | Mazoon Assets Co. SAO, Sr. Unsecd. Note, Series 144A, 5.200%, 11/08/2027 | 200,500 | |
| 200,000 | Minejesa Capital BV, Sec. Fac. Bond, Series 144A, 5.625%, 08/10/2037 | 213,619 | |
| 110,000 | National Rural Utilities, Sr. Unsecd. Note, 2.950%, 02/07/2024 | 110,892 | |
| 400,000 | NextEra Energy Capital Holdings, Inc., Sr. Unsecd. Note, 3.625%, 06/15/2023 | 411,679 | |
| 65,000 | NiSource Finance Corp., Sr. Unsecd. Note, 4.375%, 05/15/2047 | 71,480 | |
| 100,000 | Pan American Energy LLC, Sr. Unsecd. Note, Series REGS, 7.875%, 05/07/2021 | 108,301 | |
| 300,000 | PPL Capital Funding, Inc., Sr. Unsecd. Note, 3.100%, 05/15/2026 | 294,078 | |
| 200,000 | State Grid Overseas Investment 2016 Ltd., Series 144A, 3.500%, 05/04/2027 | 201,125 | |
| 250,000 | Southern Co., Sr. Unsecd. Note, 3.250%, 07/01/2026 | 245,565 | |
| 120,000 | Southern Natural Gas, Sr. Unsecd. Note, Series 144A, 4.800%, 03/15/2047 | 132,381 | |
| 140,000 | Virginia Electric & Power, Sr. Unsecd. Note, Series A, 3.500%, 03/15/2027 | 144,982 | |
| TOTAL | 6,046,047 | ||
| TOTAL CORPORATE BONDS (IDENTIFIED COST $90,011,628) | 92,633,882 | ||
| FOREIGN GOVERNMENTS/AGENCIES—4.5% | |||
| Sovereign—4.5% | |||
| 100,000 | Argentina, Government of, Sr. Unsecd. Note, 5.625%, 01/26/2022 | 105,500 | |
| 750,000 | Argentina, Government of, Sr. Unsecd. Note, 6.875%, 01/26/2027 | 819,375 | |
| 700,000 | Argentina, Government of, Sr. Unsecd. Note, 7.500%, 04/22/2026 | 791,805 | |
| 200,000 | Argentina, Government of, Sr. Unsecd. Note, 8.000%, 10/08/2020 | 224,500 | |
| 200,000 | Bahrain, Government of, Series REGS, 5.500%, 03/31/2020 | 204,604 | |
| 200,000 | Bahrain, Government of, Sr. Unsecd. Note, Series 144A, 7.000%, 10/12/2028 | 203,052 | |
| 200,000 | Bahrain, Government of, Sr. Unsecd. Note, Series REGS, 7.000%, 10/12/2028 | 203,052 | |
| 200,000 | Belarus, Government of, Sr. Unsecd. Note, Series 144A, 7.625%, 06/29/2027 | 223,000 | |
| 30,000 | Belize, Government of, Sr. Unsecd. Note, Series 144A, 4.938%, 02/20/2034 | 17,813 |
| Shares, Principal Amount or Contracts | Value | ||
| FOREIGN GOVERNMENTS/AGENCIES—continued | |||
| Sovereign—continued | |||
| $200,000 | Bermuda, Government of, Sr. Unsecd. Note, Series 144A, 4.138%, 01/03/2023 | $209,724 | |
| 200,000 | Bolivia, Government of, Sr. Unsecd. Note, Series 144A, 4.500%, 03/20/2028 | 194,000 | |
| 200,000 | Brazil, Government of, Sr. Unsecd. Note, 4.625%, 01/13/2028 | 200,900 | |
| 800,000 | Brazil, Government of, Sr. Unsecd. Note, 6.000%, 04/07/2026 | 894,000 | |
| 330,000 | Cameroon, Government of, Sr. Unsecd. Note, Series 144A, 9.500%, 11/19/2025 | 396,000 | |
| 200,000 | Colombia, Government of, Sr. Unsecd. Note, 3.875%, 04/25/2027 | 203,600 | |
| 400,000 | Colombia, Government of, Sr. Unsecd. Note, 4.375%, 07/12/2021 | 421,800 | |
| 200,000 | Colombia, Government of, Sr. Unsecd. Note, 5.000%, 06/15/2045 | 211,500 | |
| 300,000 | Colombia, Government of, Sr. Unsecd. Note, 5.625%, 02/26/2044 | 343,500 | |
| 300,000 | Costa Rica, Government of, Series REGS, 4.375%, 04/30/2025 | 289,500 | |
| 200,000 | Costa Rica, Government of, Sr. Unsecd. Note, Series 144A, 7.158%, 03/12/2045 | 210,000 | |
| 300,000 | Croatia, Government of, Sr. Unsecd. Note, Series REGS, 5.500%, 04/04/2023 | 330,750 | |
| 250,000 | Dominican Republic, Government of, Series 144A, 5.875%, 04/18/2024 | 269,122 | |
| 200,000 | Dominican Republic, Government of, Sr. Unsecd. Note, Series 144A, 5.500%, 01/27/2025 | 211,750 | |
| 200,000 | Dominican Republic, Government of, Sr. Unsecd. Note, Series 144A, 6.850%, 01/27/2045 | 224,502 | |
| 150,000 | Dominican Republic, Government of, Sr. Unsecd. Note, Series REGS, 7.450%, 04/30/2044 | 178,875 | |
| 200,000 | Dubai, Government of, Series EMTN, 5.250%, 01/30/2043 | 202,000 | |
| 200,000 | Ecuador, Government of, Series 144A, 7.950%, 06/20/2024 | 212,500 | |
| 200,000 | Ecuador, Government of, Series REGS, 7.950%, 06/20/2024 | 212,500 | |
| 200,000 | Ecuador, Government of, Sr. Unsecd. Note, Series 144A, 9.650%, 12/13/2026 | 229,500 | |
| 400,000 | Egypt, Government of, Sr. Unsecd. Note, Series 144A, 8.500%, 01/31/2047 | 459,240 | |
| 50,000 | El Salvador, Government of, Bond, Series 144A, 7.750%, 01/24/2023 | 54,844 | |
| 150,000 | El Salvador, Government of, Series 144A, 6.375%, 01/18/2027 | 152,625 | |
| 150,000 | El Salvador, Government of, Series REGS, 7.625%, 02/01/2041 | 162,750 | |
| 50,000 | El Salvador, Government of, Sr. Unsecd. Note, Series 144A, 8.625%, 02/28/2029 | 58,500 | |
| 200,000 | Ethiopia, Government of, Sr. Unsecd. Note, Series REGS, 6.625%, 12/11/2024 | 209,500 | |
| 200,000 | Gabon, Government of, Series REGS, 6.375%, 12/12/2024 | 202,718 | |
| 200,000 | Ghana, Government of, Series REGS, 7.875%, 08/07/2023 | 219,620 | |
| 200,000 | Ghana, Government of, Sr. Unsecd. Note, Series REGS, 9.250%, 09/15/2022 | 226,560 | |
| 200,000 | Honduras, Government of, Sr. Unsecd. Note, Series 144A, 6.250%, 01/19/2027 | 213,420 | |
| 780,000 | Indonesia, Government of, Series 144A, 3.375%, 04/15/2023 | 786,993 | |
| 600,000 | Indonesia, Government of, Series REGS, 5.375%, 10/17/2023 | 668,514 | |
| 200,000 | Indonesia, Government of, Sr. Unsecd. Note, Series 144A, 3.850%, 07/18/2027 | 205,134 | |
| 400,000 | Indonesia, Government of, Sr. Unsecd. Note, Series 144A, 4.550%, 03/29/2026 | 422,416 | |
| 200,000 | Indonesia, Government of, Sr. Unsecd. Note, Series REGS, 4.750%, 01/08/2026 | 217,268 | |
| 200,000 | Indonesia, Government of, Sr. Unsecd. Note, Series REGS, 5.125%, 01/15/2045 | 221,061 | |
| 200,000 | Indonesia, Government of, Sr. Unsecd. Note, Series REGS, 5.250%, 01/17/2042 | 223,874 | |
| 400,000 | Indonesia, Government of, Unsecd. Note, Series 144A, 4.350%, 09/10/2024 | 421,960 | |
| 250,000 | Iraq, Government of, Unsecd. Note, Series REGS, 5.800%, 01/15/2028 | 241,135 | |
| 400,000 | Israel, Government of, Sr. Unsecd. Note, 2.875%, 03/16/2026 | 398,965 | |
| 374,220 | Ivory Coast, Government of, Sr. Unsecd. Note, Series REGS, 5.750%, 12/31/2032 | 373,440 | |
| 400,000 | Jamaica, Government of, Sr. Unsecd. Note, 6.750%, 04/28/2028 | 453,000 | |
| 300,000 | Jordan, Government of, Sr. Unsecd. Note, Series 144A, 7.375%, 10/10/2047 | 312,559 | |
| 200,000 | Kazakhstan, Government of, Series REGS, 4.875%, 10/14/2044 | 215,021 | |
| 200,000 | Kenya, Government of, Series REGS, 6.875%, 06/24/2024 | 212,792 | |
| 200,000 | Kuwait, Government of, Sr. Unsecd. Note, Series 144A, 3.500%, 03/20/2027 | 203,122 | |
| 450,000 | Lebanon, Government of, Sr. Secd. Note, Series EMTN, 6.100%, 10/04/2022 | 437,316 | |
| 100,000 | Lebanon, Government of, Sr. Unsecd. Note, 6.750%, 11/29/2027 | 95,292 | |
| 450,000 | Lebanon, Government of, Sr. Unsecd. Note, Series GMTN, 5.450%, 11/28/2019 | 446,445 |
| Shares, Principal Amount or Contracts | Value | ||
| FOREIGN GOVERNMENTS/AGENCIES—continued | |||
| Sovereign—continued | |||
| $200,000 | Lebanon, Government of, Sr. Unsecd. Note, Series GMTN, 6.250%, 11/04/2024 | $192,074 | |
| 700,000 | Mexico, Government of, Series MTN, 4.750%, 03/08/2044 | 707,700 | |
| 600,000 | Mexico, Government of, Sr. Secd. Note, 4.350%, 01/15/2047 | 573,000 | |
| 300,000 | Mexico, Government of, Sr. Unsecd. Note, 4.150%, 03/28/2027 | 311,100 | |
| 200,000 | Mexico, Government of, Sr. Unsecd. Note, 4.600%, 01/23/2046 | 197,200 | |
| 200,000 | Mongolia, Government of, Series 144A, 5.625%, 05/01/2023 | 201,787 | |
| 200,000 | Nigeria, Government of, Sr. Unsecd. Note, Series 144A, 6.500%, 11/28/2027 | 208,405 | |
| 200,000 | Pakistan, Government of, Sr. Unsecd. Note, Series 144A, 6.875%, 12/05/2027 | 200,525 | |
| 300,000 | Panama, Government of, Sr. Unsecd. Note, 4.300%, 04/29/2053 | 313,200 | |
| 400,000 | Panama, Government of, Sr. Unsecd. Note, 4.500%, 05/15/2047 | 430,600 | |
| 200,000 | Paraguay, Government of, Series 144A, 6.100%, 08/11/2044 | 228,000 | |
| 200,000 | Paraguay, Government of, Sr. Unsecd. Note, Series 144A, 4.700%, 03/27/2027 | 209,500 | |
| 100,000 | Peru, Government of, Bond, 8.750%, 11/21/2033 | 157,500 | |
| 200,000 | Peru, Government of, Sr. Unsecd. Note, 5.625%, 11/18/2050 | 256,600 | |
| 700,000 | Philippines, Government of, Sr. Unsecd. Note, 3.950%, 01/20/2040 | 720,581 | |
| 200,000 | Qatar, Government of, Sr. Unsecd. Note, Series REGS, 4.625%, 06/02/2046 | 207,208 | |
| 400,000 | Romania, Government of, Series REGS, 4.375%, 08/22/2023 | 428,400 | |
| 200,000 | Russia, Government of, Sr. Unsecd. Note, Series 144A, 4.750%, 05/27/2026 | 212,098 | |
| 400,000 | Russia, Government of, Sr. Unsecd. Note, Series 144A, 5.250%, 06/23/2047 | 418,520 | |
| 300,000 | Saudi Arabia, Government of, Sr. Unsecd. Note, Series 144A, 3.625%, 03/04/2028 | 297,300 | |
| 200,000 | Saudi Arabia, Government of, Sr Unsecured Note, Series REGS, 4.500%, 10/26/2046 | 199,600 | |
| 200,000 | South Africa, Government of, 5.875%, 05/30/2022 | 218,400 | |
| 200,000 | South Africa, Government of, Sr. Unsecd. Note, 5.650%, 09/27/2047 | 204,100 | |
| 200,000 | Sri Lanka, Government of, Series REGS, 6.850%, 11/03/2025 | 220,649 | |
| 300,000 | Sri Lanka, Government of, Sr. Unsecd. Note, Series REGS, 5.875%, 07/25/2022 | 316,266 | |
| 400,000 | Turkey, Government of, Sr. Unsecd. Note, 4.250%, 04/14/2026 | 381,277 | |
| 600,000 | Turkey, Government of, Sr. Unsecd. Note, 4.875%, 04/16/2043 | 526,314 | |
| 160,000 | Ukraine, Government of, Sr. Unsecd. Note, Series REGS, 7.750%, 09/01/2020 | 169,427 | |
| 400,000 | Ukraine, Government of, Sr. Unsecd. Note, Series REGS, 7.750%, 09/01/2022 | 425,292 | |
| 100,000 | Ukraine, Government of, Sr. Unsecd. Note, Series REGS, 7.750%, 09/01/2024 | 105,230 | |
| 140,000 | Ukraine, Government of, Unsecd. Note, Series 144A, 7.750%, 09/01/2020 | 148,249 | |
| 110,000 | Ukraine, Government of, Unsecd. Note, Series 144A, 7.750%, 09/01/2024 | 115,753 | |
| 110,000 | 1 | Ukraine, Government of, Unsecd. Note, Series GDP., 0.00% 05/31/2040 | 60,522 |
| 100,000 | Ukraine, Government of, Unsecd. Note, Series REGS, 7.750%, 09/01/2019 | 105,000 | |
| 500,000 | Uruguay, Government of, Sr. Unsecd. Note, 5.100%, 06/18/2050 | 555,000 | |
| 750,000 | Venezuela, Government of, 7.000%, 03/31/2038 | 153,750 | |
| 200,000 | Vietnam, Government of, Sr. Unsecd. Note, Series REGS, 4.800%, 11/19/2024 | 213,311 | |
| 300,000 | Zambia, Government of, Series 144A, 8.970%, 07/30/2027 | 337,145 | |
| 400,000 | Zambia, Government of, Series REGS, 5.375%, 09/20/2022 | 390,224 | |
| TOTAL FOREIGN GOVERNMENTS/AGENCIES (IDENTIFIED COST $27,290,490) | 28,271,615 | ||
| MORTGAGE-BACKED SECURITIES—15.9% | |||
| Federal Home Loan Mortgage Corporation—5.4% | |||
| 2,715,087 | Federal Home Loan Mortgage Corp. Pool A88745, 4.500%, 30 Year, 10/01/2037 | 2,909,583 | |
| 878,250 | Federal Home Loan Mortgage Corp. Pool G08563, 4.000%, 30 Year, 01/01/2044 | 923,417 | |
| 690,200 | Federal Home Loan Mortgage Corp. Pool G08567, 4.000%, 30 Year, 01/01/2044 | 725,695 | |
| 1,434,536 | Federal Home Loan Mortgage Corp. Pool G08608, 3.000%, 30 Year, 09/01/2044 | 1,440,257 | |
| 4,338,046 | Federal Home Loan Mortgage Corp. Pool G08705, 3.000%, 30 Year, 05/01/2046 | 4,344,502 | |
| 2,570,790 | Federal Home Loan Mortgage Corp. Pool G08710, 3.000%, 30 Year, 06/01/2046 | 2,574,615 |
| Shares, Principal Amount or Contracts | Value | ||
| MORTGAGE-BACKED SECURITIES—continued | |||
| Federal Home Loan Mortgage Corporation—continued | |||
| $1,995,015 | Federal Home Loan Mortgage Corp. Pool G08793, 4.000%, 30 Year, 12/01/2047 | $2,090,755 | |
| 1,379,664 | Federal Home Loan Mortgage Corp. Pool G18579, 3.500%, 15 Year, 12/01/2030 | 1,427,241 | |
| 2,478,269 | Federal Home Loan Mortgage Corp. Pool G67700, 3.500%, 30 Year, 08/01/2046 | 2,560,777 | |
| 7,026 | Federal Home Loan Mortgage Corp. Pool J07260, 4.500%, 15 Year, 03/01/2023 | 7,324 | |
| 4,953,918 | Federal Home Loan Mortgage Corp. Pool J14246, 3.500%, 15 Year, 02/01/2026 | 5,123,202 | |
| 860,488 | Federal Home Loan Mortgage Corp. Pool Q19607, 4.000%, 30 Year, 07/01/2043 | 905,817 | |
| 220,831 | Federal Home Loan Mortgage Corp. Pool Q21934, 4.000%, 30 Year, 09/01/2043 | 232,463 | |
| 3,123,608 | Federal Home Loan Mortgage Corp. Pool Q39440, 4.000%, 30 Year, 03/01/2046 | 3,273,022 | |
| 2,411,862 | Federal Home Loan Mortgage Corp. Pool V82514, 3.500%, 30 Year, 07/01/2046 | 2,483,492 | |
| 2,663,453 | Federal Home Loan Mortgage Corp. Pool V82653, 3.500%, 30 Year, 10/01/2046 | 2,742,556 | |
| TOTAL | 33,764,718 | ||
| Government National Mortgage Association—0.4% | |||
| 9,584 | Government National Mortgage Association Pool 2796, 7.000%, 30 Year, 08/20/2029 | 11,085 | |
| 5,138 | Government National Mortgage Association Pool 3040, 7.000%, 30 Year, 02/20/2031 | 5,972 | |
| 14,548 | Government National Mortgage Association Pool 3188, 6.500%, 30 Year, 01/20/2032 | 16,769 | |
| 18,554 | Government National Mortgage Association Pool 3239, 6.500%, 30 Year, 05/20/2032 | 21,359 | |
| 2,564,027 | Government National Mortgage Association Pool AS7206, 3.500%, 30 Year, 04/20/2046 | 2,653,534 | |
| TOTAL | 2,708,719 | ||
| Federal National Mortgage Association—10.1% | |||
| 1,946,055 | Federal National Mortgage Association Pool 890803, 3.500%, 15 Year, 01/01/2032 | 2,012,099 | |
| 1,268,964 | Federal National Mortgage Association Pool AH2899, 4.500%, 30 Year, 01/01/2041 | 1,366,923 | |
| 1,084,857 | Federal National Mortgage Association Pool AL4168, 2.500%, 15 Year, 09/01/2028 | 1,090,203 | |
| 2,114,081 | Federal National Mortgage Association Pool AO7977, 3.000%, 15 Year, 06/01/2027 | 2,159,874 | |
| 44,866 | Federal National Mortgage Association Pool AO8829, 3.500%, 30 Year, 07/01/2042 | 46,335 | |
| 1,094,772 | Federal National Mortgage Association Pool AS2979, 3.000%, 15 Year, 08/01/2029 | 1,117,460 | |
| 1,456,682 | Federal National Mortgage Association Pool AS4314, 2.500%, 15 Year, 01/01/2030 | 1,459,764 | |
| 2,247,292 | Federal National Mortgage Association Pool AS5102, 3.000%, 15 Year, 06/01/2030 | 2,293,162 | |
| 2,984,515 | Federal National Mortgage Association Pool AS5693, 3.000%, 30 Year, 08/01/2045 | 2,991,638 | |
| 3,492,441 | Federal National Mortgage Association Pool AS6222, 4.000%, 30 Year, 11/01/2045 | 3,663,863 | |
| 2,213,531 | Federal National Mortgage Association Pool AS7375, 3.000%, 30 Year, 06/01/2046 | 2,216,738 | |
| 2,597,457 | Federal National Mortgage Association Pool AS7492, 4.000%, 30 Year, 07/01/2046 | 2,719,674 | |
| 1,303,136 | Federal National Mortgage Association Pool AS7510, 4.000%, 30 Year, 07/01/2046 | 1,364,451 | |
| 1,793,203 | Federal National Mortgage Association Pool AS7582, 3.000%, 30 Year, 07/01/2046 | 1,795,802 | |
| 1,724,135 | Federal National Mortgage Association Pool AS7698, 2.500%, 15 Year, 08/01/2031 | 1,722,935 | |
| 1,808,444 | Federal National Mortgage Association Pool AS7796, 3.000%, 30 Year, 08/01/2046 | 1,811,064 | |
| 1,311,090 | Federal National Mortgage Association Pool AX0833, 3.500%, 30 Year, 09/01/2044 | 1,354,433 | |
| 3,109,393 | Federal National Mortgage Association Pool AZ9565, 3.500%, 30 Year, 12/01/2045 | 3,196,152 | |
| 3,774,435 | Federal National Mortgage Association Pool BA3989, 3.500%, 30 Year, 02/01/2046 | 3,879,751 | |
| 1,699,089 | Federal National Mortgage Association Pool BC5622, 3.500%, 30 Year, 05/01/2046 | 1,745,701 | |
| 2,404,346 | Federal National Mortgage Association Pool BC5660, 3.500%, 30 Year, 07/01/2046 | 2,470,305 | |
| 1,314,525 | Federal National Mortgage Association Pool BC6063, 2.500%, 15 Year, 06/01/2031 | 1,313,610 | |
| 1,753,813 | Federal National Mortgage Association Pool BC8059, 3.500%, 30 Year, 05/01/2046 | 1,801,927 | |
| 2,901,255 | Federal National Mortgage Association Pool BC9762, 3.000%, 30 Year, 06/01/2046 | 2,905,459 | |
| 1,607,321 | Federal National Mortgage Association Pool BC9803, 2.500%, 15 Year, 06/01/2031 | 1,606,202 | |
| 1,652,277 | Federal National Mortgage Association Pool BD1880, 2.500%, 15 Year, 06/01/2031 | 1,651,127 | |
| 3,698,777 | Federal National Mortgage Association Pool BE2909, 3.500%, 30 Year, 12/01/2046 | 3,800,248 | |
| 3,668,600 | Federal National Mortgage Association Pool CA0110, 3.500%, 30 Year, 08/01/2047 | 3,774,974 | |
| 1,625,162 | Federal National Mortgage Association Pool MA2644, 2.500%, 15 Year, 06/01/2031 | 1,624,030 |
| Shares, Principal Amount or Contracts | Value | ||
| MORTGAGE-BACKED SECURITIES—continued | |||
| Federal National Mortgage Association—continued | |||
| $1,602,247 | Federal National Mortgage Association Pool MA2684, 3.000%, 15 Year, 07/01/2031 | $1,632,948 | |
| TOTAL | 62,588,852 | ||
| TOTAL MORTGAGE-BACKED SECURITIES (IDENTIFIED COST $100,610,914) | 99,062,289 | ||
| PURCHASED CALL OPTION—0.1% | |||
| 9,000 | CBOE SPX Volatility Index, Notional Amount $9,936,000, Exercise Price $16.00, Expiration Date 1/17/2018 (IDENTIFIED COST $652,500) | 337,500 | |
| PURCHASED PUT OPTIONS—0.2% | |||
| 2,750 | SPDR S&P 500 ETF Trust, Notional Amount $73,386,500, Exercise Price $250.00, Expiration Date 1/19/2018 | 78,375 | |
| 3,450 | SPDR S&P 500 ETF Trust, Notional Amount $92,066,700, Exercise Price $240.00, Expiration Date 6/15/2018 | 1,059,150 | |
| TOTAL PURCHASED PUT OPTIONS (IDENTIFIED COST $2,153,900) | 1,137,525 | ||
| U.S. TREASURY—0.9% | |||
| $5,500,000 | United States Treasury Note, 0.750%, 02/28/2018 (IDENTIFIED COST $5,491,578) | 5,494,844 | |
| INVESTMENT COMPANY—14.8% | |||
| 13,497,668 | 3 | Federated High Income Bond Fund II, Class P (IDENTIFIED COST $87,653,943) | 92,054,094 |
| REPURCHASE AGREEMENT—3.5% | |||
| 21,652,000 | Interest in $950,000,000 joint repurchase agreement 1.42%, dated 12/29/2017 under which Bank of America, N.A. will repurchase securities provided as collateral for $950,149,889 on 1/2/2018. The securities provided as collateral at the end of the period held with BNY Mellon as tri-party agent, were U.S. Government Agency securities maturing on 7/20/2046 and the market value of those underlying securities was $969,152,887. (IDENTIFIED COST $21,652,000) | 21,652,000 | |
| TOTAL INVESTMENT IN SECURITIES—98.1% (IDENTIFIED COST $575,651,207)4 | 609,765,034 | ||
| OTHER ASSETS AND LIABILITIES - NET—1.9%5 | 12,039,160 | ||
| TOTAL NET ASSETS—100% | $621,804,194 |
| Description | Number of Contracts | Notional Value | Expiration Date | Value and Unrealized Appreciation (Depreciation) |
| 1S&P 500 Index Long Futures | 539 | $360,591,000 | March 2018 | $3,515,212 |
| 1United States Treasury Notes 2-Year Long Futures | 100 | $21,410,937 | March 2018 | $(42,403) |
| 1United States Treasury Notes 5-Year Long Futures | 60 | $6,969,844 | March 2018 | $(32,479) |
| 1United States Treasury Long Bond Short Futures | 3 | $459,000 | March 2018 | $392 |
| 1United States Treasury Notes 10-Year Short | 90 | $11,164,219 | March 2018 | $70,231 |
| 1United States Treasury Ultra Bond Short Futures | 65 | $10,897,656 | March 2018 | $(48,707) |
| NET UNREALIZED APPRECIATION ON FUTURES CONTRACTS | $3,462,246 | |||
| Credit Default Swaps | |||||||||
| Counterparty | Reference Entity | Buy/ Sell | Pay/ Receive Fixed Rate | Expiration Date | Implied Credit Spread at 12/31/20176 | Notional Amount | Market Value | Upfront Premiums Paid (Received) | Unrealized Appreciation (Depreciation) |
| OTC Swaps: | |||||||||
| Barclays Capital, Inc. | CDX Index EM Series 28 | Buy | 1.00% | 12/20/2022 | 1.28% | $4,365,000 | $38,848 | $169,792 | $(130,944) |
| Barclays Capital, Inc. | Government of South Korea Bond | Sell | 1.00% | 12/20/2022 | 0.54% | $400,000 | $(8,590) | $(5,601) | $(2,989) |
| Barclays Capital, Inc. | Government of Turkey Bond | Buy | 1.00% | 12/20/2022 | 1.66% | $200,000 | $5,923 | $7,762 | $(1,839) |
| Barclays Capital, Inc. | Republic of South Africa | Buy | 1.00% | 12/20/2022 | 1.59% | $400,000 | $10,549 | $15,698 | $(5,149) |
| TOTAL SWAPS CONTRACTS | $46,730 | $187,651 | $(140,921) | ||||||
| Description | Contracts | Notional Amount | Expiration Date | Exercise Price | Value |
| 1CBOE SPX Volatility Index (Call Option) | 9,000 | $9,936,000 | 1/17/2018 | $20.00 | $(202,500) |
| 1SPDR S&P 500 ETF Trust (Put Option) | 3,450 | $92,066,700 | 6/15/2018 | $210.00 | $(374,325) |
| (PREMIUMS RECEIVED $1,045,639) | $(576,825) | ||||
| 1 | Non-income-producing security. |
| 2 | Floating/adjustable note with current rate and current maturity or next reset date shown. Adjustable rate mortgage security coupons are based on the weighted average note rates of the underlying mortgages less the guarantee and servicing fees. These securities do not indicate an index and spread in their description above. |
| 3 | Affiliated holding. |
| Federated High Income Bond Fund II | |
| Balance of Shares Held 12/31/2016 | 13,177,127 |
| Purchases/Additions | 1,755,042 |
| Sales/Reductions | (1,434,501) |
| Balance of Shares Held 12/31/2017 | 13,497,668 |
| Value | $92,054,094 |
| Change in Unrealized Appreciation/Depreciation | $48,352 |
| Net Realized Gain/(Loss) | $(81,093) |
| Dividend Income | $6,155,289 |
| 4 | The cost of investments for federal tax purposes amounts to $577,732,838. |
| 5 | Assets, other than investments in securities, less liabilities. See Statement of Assets and Liabilities. |
| 6 | Implied credit spreads, represented in absolute terms, utilized in determining the market value of credit default swap agreements serve as an indicator of the current status of the payment/performance risk and represent the likelihood or risk of default for the credit derivative. The implied credit spread of a particular referenced entity reflects the cost of buying/selling protection and may include upfront payments required to be made to enter into the agreement. Wider credit spreads represent a deterioration of the referenced entity's credit soundness and a greater likelihood or risk of default or other credit event occurring as defined under the terms of the agreement. A credit spread identified as “Defaulted” indicates a credit event has occurred for the referenced entity or obligation. |
| Valuation Inputs | ||||
| Level 1— Quoted Prices | Level 2— Other Significant Observable Inputs | Level 3— Significant Unobservable Inputs | Total | |
| Equity Securities: | ||||
| Common Stocks | ||||
| Domestic | $238,978,361 | $— | $— | $238,978,361 |
| International | 11,946,454 | — | — | 11,946,454 |
| Debt Securities: | ||||
| Adjustable Rate Mortgages | — | 11,379 | — | 11,379 |
| Collateralized Mortgage Obligations | — | 15,575,078 | — | 15,575,078 |
| Commercial Mortgage-Backed Securities | — | 2,610,013 | — | 2,610,013 |
| Corporate Bonds | — | 92,633,882 | — | 92,633,882 |
| Foreign Governments/Agencies | — | 28,271,615 | — | 28,271,615 |
| Mortgage-Backed Securities | — | 99,062,289 | — | 99,062,289 |
| U.S. Treasury | — | 5,494,844 | — | 5,494,844 |
| Purchased Call Option | 337,500 | — | — | 337,500 |
| Purchased Put Options | 1,137,525 | — | — | 1,137,525 |
| Investment Company | 92,054,094 | — | — | 92,054,094 |
| Repurchase Agreement | — | 21,652,000 | — | 21,652,000 |
| TOTAL SECURITIES | $344,453,934 | $265,311,100 | $— | $609,765,034 |
| Other Financial Instruments | ||||
| Assets | ||||
| Futures Contracts | $3,585,835 | $— | $— | $3,585,835 |
| Swaps Contracts | — | 55,320 | — | 55,320 |
| Written Options Contracts | — | — | — | — |
| Liabilities | ||||
| Futures Contracts | (123,589) | — | — | (123,589) |
| Swaps Contracts | — | (8,590) | — | (8,590) |
| Written Options Contracts | (576,825) | — | — | (576,825) |
| TOTAL OTHER FINANCIAL INSTRUMENTS | $2,885,421 | $46,730 | $— | $2,932,151 |
| BKNT | —Bank Notes |
| EMTN | —Euro Medium Term Note |
| ETF | —Exchange-Traded Fund |
| FREMF | —Freddie Mac Multifamily K-Deals |
| GDP | —Gross Domestic Product |
| GMTN | —Global Medium Term Note |
| LIBOR | —London Interbank Offered Rate |
| MTN | —Medium Term Note |
| REIT | —Real Estate Investment Trust |
| REMIC | —Real Estate Mortgage Investment Conduit |
| SPDR | —Standard & Poor's Depositary Receipt |
| Year Ended December 31 | 2017 | 2016 | 2015 | 2014 | 2013 |
| Net Asset Value, Beginning of Period | $9.52 | $9.29 | $10.54 | $11.30 | $9.56 |
| Income From Investment Operations: | |||||
| Net investment income1 | 0.29 | 0.34 | 0.44 | 0.54 | 0.50 |
| Net realized and unrealized gain (loss) on investments, futures contracts, written options, swap contracts and foreign currency transactions | 1.39 | 0.34 | (1.20) | (0.12) | 1.54 |
| TOTAL FROM INVESTMENT OPERATIONS | 1.68 | 0.68 | (0.76) | 0.42 | 2.04 |
| Less Distributions: | |||||
| Distributions from net investment income | (0.40) | (0.45) | (0.44) | (0.38) | (0.30) |
| Distributions from net realized gain on investments, futures contracts, written options, swap contracts and foreign currency transactions | — | — | (0.05) | (0.80) | — |
| TOTAL DISTRIBUTIONS | (0.40) | (0.45) | (0.49) | (1.18) | (0.30) |
| Net Asset Value, End of Period | $10.80 | $9.52 | $9.29 | $10.54 | $11.30 |
| Total Return2 | 18.11% | 7.69% | (7.64)% | 4.01% | 21.74% |
| Ratios to Average Net Assets: | |||||
| Net expenses | 0.83% | 0.79%3 | 0.75%3 | 0.76% | 0.82% |
| Net investment income | 2.91% | 3.72% | 4.38% | 4.99% | 4.80% |
| Expense waiver/reimbursement4 | 0.09% | 0.14% | 0.16% | 0.15% | 0.16% |
| Supplemental Data: | |||||
| Net assets, end of period (000 omitted) | $621,804 | $563,745 | $631,701 | $652,011 | $451,067 |
| Portfolio turnover | 71% | 90% | 97% | 54% | 52% |
| Portfolio turnover (excluding purchases and sales from dollar-roll transactions) | 71% | 90% | 97% | 54% | 52% |
| 1 | Per share numbers have been calculated using the average shares method. |
| 2 | Based on net asset value. Total returns do not reflect any additional fees or expenses that may be imposed by separate accounts of insurance companies or in connection with any variable annuity or variable life insurance contract. |
| 3 | The net expense ratio is calculated without reduction for expense offset arrangements. The net expense ratios are 0.79% and 0.75% for the years ended December 31, 2016 and 2015, respectively, after taking into account these expense reductions. |
| 4 | This expense decrease is reflected in both the net expense and the net investment income ratios shown above. |
| Assets: | ||
| Investment in securities, at value including $92,054,094 of investment in an affiliated holding (identified cost $575,651,207) | $609,765,034 | |
| Cash | 408,495 | |
| Cash denominated in foreign currencies (identified cost $38,939) | 40,558 | |
| Restricted cash (Note 2) | 12,419,745 | |
| Income receivable | 2,146,157 | |
| Swaps, at value (premium paid $193,252) | 55,320 | |
| Receivable for investments sold | 2,610 | |
| Receivable for shares sold | 36,827 | |
| TOTAL ASSETS | 624,874,746 | |
| Liabilities: | ||
| Payable for investments purchased | $461,995 | |
| Payable for shares redeemed | 455,496 | |
| Written options outstanding (premium $1,045,639), at value | 576,825 | |
| Payable for daily variation margin on futures contracts | 1,337,760 | |
| Swaps, at value (premium received $5,601) | 8,590 | |
| Payable for periodic payments to swap contracts | 1,788 | |
| Payable to adviser (Note 5) | 33,962 | |
| Payable for administrative fees (Note 5) | 5,143 | |
| Payable for portfolio accounting fees | 122,881 | |
| Accrued expenses (Note 5) | 66,112 | |
| TOTAL LIABILITIES | 3,070,552 | |
| Net assets for 57,585,175 shares outstanding | $621,804,194 | |
| Net Assets Consist of: | ||
| Paid-in capital | $577,523,136 | |
| Net unrealized appreciation of investments, futures contracts, written options, swap contracts and translation of assets and liabilities in foreign currency | 37,905,585 | |
| Accumulated net realized loss on investments, futures contracts, written options, swap contracts and foreign currency transactions | (11,073,824) | |
| Undistributed net investment income | 17,449,297 | |
| TOTAL NET ASSETS | $621,804,194 | |
| Net Asset Value, Offering Price and Redemption Proceeds Per Share: | ||
| $621,804,194 ÷ 57,585,175 shares outstanding, no par value, unlimited shares authorized | $10.80 |
| Investment Income: | |||
| Dividends (including $6,155,289 received from an affiliated holding, see footnotes to Portfolio of Investments and net of foreign taxes withheld of $20,526) | $12,646,740 | ||
| Interest | 9,340,282 | ||
| TOTAL INCOME | 21,987,022 | ||
| Expenses: | |||
| Investment adviser fee (Note 5) | $4,410,235 | ||
| Administrative fee (Note 5) | 590,598 | ||
| Custodian fees | 58,045 | ||
| Transfer agent fee | 44,266 | ||
| Directors'/Trustees' fees (Note 5) | 6,148 | ||
| Auditing fees | 33,399 | ||
| Legal fees | 10,393 | ||
| Portfolio accounting fees | 180,401 | ||
| Printing and postage | 86,241 | ||
| Miscellaneous (Note 5) | 35,396 | ||
| TOTAL EXPENSES | 5,455,122 | ||
| Reimbursements: | |||
| Reimbursement of investment adviser fee (Note 5) | $(551,807) | ||
| Reimbursement of other operating expenses (Note 2) | (5,952) | ||
| TOTAL REIMBURSEMENTS | (557,759) | ||
| Net expenses | 4,897,363 | ||
| Net investment income | 17,089,659 | ||
| Realized and Unrealized Gain (Loss) on Investments, Futures Contracts, Written Options, Swap Contracts and Foreign Currency Transactions: | |||
| Net realized gain on investments (including net realized gain (loss) of $(81,093) on sales of investments in an affiliated holding) | 3,729,443 | ||
| Net realized gain on foreign currency transactions | 84 | ||
| Net realized gain on futures contracts | 58,632,852 | ||
| Net realized gain on written options | 4,307,657 | ||
| Net realized gain (loss) on swap contracts | (170,766) | ||
| Net change in unrealized appreciation of investments (including net change in unrealized appreciation of $48,352 on investments in an affiliated holding) | 11,538,823 | ||
| Net change in unrealized appreciation/depreciation of translation of assets and liabilities in foreign currency | 2,877 | ||
| Net change in unrealized appreciation of futures contracts | 2,544,065 | ||
| Net change in unrealized appreciation of written options | 384,781 | ||
| Net change in unrealized appreciation of swap contracts | (145,563) | ||
| Net realized and unrealized gain on investments, futures contracts, written options, swap contracts and foreign currency transactions | 80,824,253 | ||
| Change in net assets resulting from operations | $97,913,912 |
| Year Ended December 31 | 2017 | 2016 |
| Increase (Decrease) in Net Assets | ||
| Operations: | ||
| Net investment income | $17,089,659 | $22,133,165 |
| Net realized gain (loss) on investments, futures contracts, written options, swap contracts, foreign exchange contracts and foreign currency transactions | 66,499,270 | (19,131,364) |
| Net change in unrealized appreciation/depreciation of investments, futures contracts, written options, swap contracts, foreign exchange contracts and translation of assets and liabilities in foreign currency | 14,324,983 | 39,613,681 |
| CHANGE IN NET ASSETS RESULTING FROM OPERATIONS | 97,913,912 | 42,615,482 |
| Distributions to Shareholders: | ||
| Distributions from net investment income | (22,796,040) | (29,859,782) |
| Share Transactions: | ||
| Proceeds from sale of shares | 61,126,884 | 65,300,190 |
| Net asset value of shares issued to shareholders in payment of distributions declared | 22,796,040 | 29,859,782 |
| Cost of shares redeemed | (100,981,610) | (175,871,264) |
| CHANGE IN NET ASSETS RESULTING FROM SHARE TRANSACTIONS | (17,058,686) | (80,711,292) |
| Change in net assets | 58,059,186 | (67,955,592) |
| Net Assets: | ||
| Beginning of period | 563,745,008 | 631,700,600 |
| End of period (including undistributed net investment income of $17,449,297 and $22,776,038, respectively) | $621,804,194 | $563,745,008 |
| ■ | Equity securities listed on an exchange or traded through a regulated market system are valued at their last reported sale price or official closing price in their principal exchange or market. |
| ■ | Fixed-income securities are fair valued using price evaluations provided by a pricing service approved by the Fund's Board of Trustees (the “Trustees”). |
| ■ | Shares of other mutual funds or non-exchange-traded investment companies are valued based upon their reported NAVs. |
| ■ | Derivative contracts listed on exchanges are valued at their reported settlement or closing price, except that options are valued at the mean of closing bid and asked quotations. |
| ■ | Over-the-counter (OTC) derivative contracts are fair valued using price evaluations provided by a pricing service approved by the Trustees. |
| ■ | For securities that are fair valued in accordance with procedures established by and under the general supervision of the Trustees, certain factors may be considered such as: the last traded or purchase price of the security, information obtained by contacting the issuer or dealers, analysis of the issuer's financial statements or other available documents, fundamental analytical data, the nature and duration of restrictions on disposition, the movement of the market in which the security is normally traded, public trading in similar securities or derivative contracts of the issuer or comparable issuers, movement of a relevant index, or other factors including but not limited to industry changes and relevant government actions. |
| ■ | With respect to securities traded principally in foreign markets, significant trends in U.S. equity markets or in the trading of foreign securities index futures contracts; |
| ■ | Political or other developments affecting the economy or markets in which an issuer conducts its operations or its securities are traded; |
| ■ | Announcements concerning matters such as acquisitions, recapitalizations, litigation developments, or a natural disaster affecting the issuer's operations or regulatory changes or market developments affecting the issuer's industry. |
| Fair Value of Derivative Instruments | ||||
| Asset | Liability | |||
| Statement of Assets and Liabilities Location | Fair Value | Statement of Assets and Liabilities Location | Fair Value | |
| Derivatives not accounted for as hedging instruments under ASC Topic 815 | ||||
| Interest rate contracts | $— | Payable for daily variation margin on futures contracts | $52,966* | |
| Equity contracts | $— | Written option contracts outstanding, at value | $576,825 | |
| Total investments in securities at value-options | $1,475,025 | $— | ||
| $— | Payable for daily variation margin on futures contracts | $(3,515,212)* | ||
| Credit contracts | Swaps, at value | $55,320 | Swaps, at value | $8,590 |
| Total derivatives not accounted for as hedging instruments under ASC Topic 815 | $1,530,345 | $(2,876,831) | ||
| * | Includes cumulative appreciation/depreciation of futures contracts as reported in the footnotes to the Portfolio of Investments. Only the current day's variation margin is reported within the Statement of Assets and Liabilities. |
| Amount of Realized Gain or (Loss) on Derivatives Recognized in Income | |||||
| Credit Default Swaps | Futures Contracts | Purchased Option Contracts1 | Written Option Contracts | Total | |
| Interest rate contracts | $— | $(762,158) | $— | $— | $(762,158) |
| Credit contracts | $(170,766) | $— | $— | $— | $(170,766) |
| Equity contracts | $— | $59,395,010 | $(14,746,246) | $4,307,657 | $48,956,421 |
| TOTAL | $(170,766) | $58,632,852 | $(14,746,246) | $4,307,657 | $48,023,497 |
| Change in Unrealized Appreciation or (Depreciation) on Derivatives Recognized in Income | |||||
| Credit Default Swaps | Futures Contracts | Purchased Option Contracts2 | Written Option Contracts | Total | |
| Interest rate contracts | $— | $(285,673) | $— | $— | $(285,673) |
| Credit contracts | $(145,563) | $— | $— | $— | $(145,563) |
| Equity contracts | $— | $2,829,738 | $(1,112,391) | $384,781 | $2,102,128 |
| TOTAL | $(145,563) | $2,544,065 | $(1,112,391) | $384,781 | $1,670,892 |
| 1 | The net realized gain (loss) on Purchased Option Contracts is found within the Net realized gain on investments on the Statement of Operations. |
| 2 | The net change in unrealized appreciation/depreciation of Purchased Option Contracts is found within the Net change in unrealized appreciation of investments on the Statement of Operations. |
| Year Ended December 31 | 2017 | 2016 |
| Shares sold | 6,093,908 | 7,258,508 |
| Shares issued to shareholders in payment of distributions declared | 2,357,398 | 3,404,764 |
| Shares redeemed | (10,085,603) | (19,435,105) |
| NET CHANGE RESULTING FROM FUND SHARE TRANSACTIONS | (1,634,297) | (8,771,833) |
| Increase (Decrease) | ||
| Paid-In Capital | Undistributed Net Investment Income (Loss) | Accumulated Net Realized Gain (Loss) |
| $(1,181,382) | $379,640 | $801,742 |
| 2017 | 2016 | |
| Ordinary income | $22,796,040 | $29,859,782 |
| Undistributed ordinary income | $17,241,037 |
| Capital loss carryforwards | $(5,604,437) |
| Net unrealized appreciation | $32,644,458 |
| Short-Term | Long-Term | Total |
| $5,604,437 | $— | $5,604,437 |
| Administrative Fee | Average Daily Net Assets of the Investment Complex |
| 0.100% | on assets up to $50 billion |
| 0.075% | on assets over $50 billion |
| Administrative Fee | Average Daily Net Assets of the Investment Complex |
| 0.150% | on the first $5 billion |
| 0.125% | on the next $5 billion |
| 0.100% | on the next $10 billion |
| 0.075% | on assets in excess of $20 billion |
| Purchases | $391,345,347 |
| Sales | $363,787,711 |
| Country | Percentage of Net Assets |
| United States | 81.6% |
| Mexico | 1.4% |
| China | 1.3% |
| Other1 | 13.8% |
| 1 | Countries representing less than 1.0% have been aggregated under the designation “Other.” |
February 14, 2018
| Beginning Account Value 7/1/2017 | Ending Account Value 12/31/2017 | Expenses Paid During Period1 | |
| Actual | $1,000 | $1,092.00 | $4.38 |
| Hypothetical (assuming a 5% return before expenses) | $1,000 | $1,021.00 | $4.23 |
| 1 | Expenses are equal to the Fund's annualized net expense ratio of 0.83%, multiplied by the average account value over the period, multiplied by 184/365 (to reflect the one-half-year period). The expenses shown in the table do not include the charges and expenses imposed by the insurance company under the variable insurance product contract. Please refer to the variable insurance product prospectus for a complete listing of these expenses. |
| Name Birth Date Positions Held with Trust Date Service Began | Principal Occupation(s) for Past Five Years, Other Directorships Held and Previous Position(s) |
| J. Christopher Donahue* Birth Date: April 11, 1949 Trustee Indefinite Term Began serving: September 1993 | Principal Occupations: Principal Executive Officer and President of certain of the Funds in the Federated Fund Family; Director or Trustee of the Funds in the Federated Fund Family; President, Chief Executive Officer and Director, Federated Investors, Inc.; Chairman and Trustee, Federated Investment Management Company; Trustee, Federated Investment Counseling; Chairman and Director, Federated Global Investment Management Corp.; Chairman and Trustee, Federated Equity Management Company of Pennsylvania; Trustee, Federated Shareholder Services Company; Director, Federated Services Company. Previous Positions: President, Federated Investment Counseling; President and Chief Executive Officer, Federated Investment Management Company, Federated Global Investment Management Corp. and Passport Research, Ltd; Chairman, Passport Research, Ltd. |
| Thomas R. Donahue* Birth Date: October 20, 1958 Trustee Indefinite Term Began serving: May 2016 | Principal Occupations: Director or Trustee of certain of the funds in the Federated Fund Family; Chief Financial Officer, Treasurer, Vice President and Assistant Secretary, Federated Investors, Inc.; Chairman and Trustee, Federated Administrative Services; Chairman and Director, Federated Administrative Services, Inc.; Trustee and Treasurer, Federated Advisory Services Company; Director or Trustee and Treasurer, Federated Equity Management Company of Pennsylvania, Federated Global Investment Management Corp., Federated Investment Counseling, and Federated Investment Management Company; Director, MDTA LLC; Director, Executive Vice President and Assistant Secretary, Federated Securities Corp.; Director or Trustee and Chairman, Federated Services Company and Federated Shareholder Services Company; and Director and President, FII Holdings, Inc. Previous Positions: Director, Federated Investors, Inc.; Assistant Secretary, Federated Investment Management Company, Federated Global Investment Management Company and Passport Research, LTD; Treasurer, Passport Research, LTD; Executive Vice President, Federated Securities Corp.; and Treasurer, FII Holdings, Inc. |
| * | Family relationships and reasons for “interested” status: J. Christopher Donahue and Thomas R. Donahue are brothers. Both are “interested” due to their beneficial ownership of shares of Federated Investors, Inc. and the positions they hold with Federated and its subsidiaries. |
| Name Birth Date Positions Held with Trust Date Service Began | Principal Occupation(s) for Past Five Years, Other Directorships Held, Previous Position(s) and Qualifications |
| John T. Collins Birth Date: January 24, 1947 Trustee Indefinite Term Began serving: October 2013 | Principal Occupations: Director or Trustee of the Federated Fund Family; formerly, Chairman and CEO, The Collins Group, Inc. (a private equity firm) (Retired). Other Directorships Held: Director, Current Chair of the Compensation Committee, KLX Corp. Qualifications: Mr. Collins has served in several business and financial management roles and directorship positions throughout his career. Mr. Collins previously served as Chairman and CEO, The Collins Group, Inc. (a private equity firm). Mr. Collins serves as Chairman Emeriti, Bentley University. Mr. Collins previously served as Director and Audit Committee Member, Bank of America Corp.; Director, FleetBoston Financial Corp.; and Director, Beth Israel Deaconess Medical Center (Harvard University Affiliate Hospital). |
| G. Thomas Hough Birth Date: February 28, 1955 Trustee Indefinite Term Began serving: August 2015 | Principal Occupations: Director or Trustee of the Federated Fund Family; formerly, Vice Chair, Ernst & Young LLP (public accounting firm) (Retired). Other Directorships Held: Director, Chair of the Audit Committee, Governance Committee, Publix Super Markets, Inc.; Director, Member of the Audit Committee and Technology Committee of Equifax, Inc. Qualifications: Mr. Hough has served in accounting, business management and directorship positions throughout his career. Mr. Hough most recently held the position of Americas Vice Chair of Assurance with Ernst & Young LLP (public accounting firm). Mr. Hough is an Executive Committee member of the United States Golf Association, he serves on the President's Cabinet and Business School Board of Visitors for the University of Alabama and is on the Business School Board of Visitors for Wake Forest University. |
| Name Birth Date Positions Held with Trust Date Service Began | Principal Occupation(s) for Past Five Years, Other Directorships Held, Previous Position(s) and Qualifications |
| Maureen Lally-Green Birth Date: July 5, 1949 Trustee Indefinite Term Began serving: August 2009 | Principal Occupations: Director or Trustee of the Federated Fund Family; Dean of the Duquesne University School of Law; Professor and Adjunct Professor of Law, Duquesne University School of Law; formerly, Interim Dean of the Duquesne University School of Law; Associate General Secretary and Director, Office of Church Relations, Diocese of Pittsburgh. Other Directorships Held: Director, CNX Resources Corporation (formerly known as CONSOL Energy Inc.). Qualifications: Judge Lally-Green has served in various legal and business roles and directorship positions throughout her career. Judge Lally-Green previously served as: Associate General Secretary, Diocese of Pittsburgh; a member of the Superior Court of Pennsylvania; and as a Professor of Law, Duquesne University School of Law. Judge Lally-Green also currently holds the positions on either a public or not for profit Board of Directors as follows: Director and Chair, UPMC Mercy Hospital; Director and Vice Chair, Our Campaign for the Church Alive!, Inc.; Director, Saint Vincent College; Member, Pennsylvania State Board of Education (public); and Director CNX Resources Corporation (formerly known as CONSOL Energy Inc.), where she currently serves as a member of the Compensation, Nominating and Corporate Governance Committee (Chair) and the Health, Safety and Environmental Committee. Judge Lally-Green has held the positions of: Director, Auberle; Director, Epilepsy Foundation of Western and Central Pennsylvania; Director, Ireland Institute of Pittsburgh; Director, Saint Thomas More Society; Director and Chair, Catholic High Schools of the Diocese of Pittsburgh, Inc.; Director, Pennsylvania Bar Institute; Regent, St. Vincent Seminary; and Director and Chair, Cardinal Wuerl North Catholic High School, Inc. |
| Charles F. Mansfield, Jr. Birth Date: April 10, 1945 Trustee Indefinite Term Began serving: September 1999 | Principal Occupations: Director or Trustee of the Federated Fund Family; Management Consultant. Other Directorships Held: None. Qualifications: Mr. Mansfield has served as a Marine Corps officer and in several banking, business management, educational roles and directorship positions throughout his long career. He remains active as a Management Consultant. |
| Thomas M. O'Neill Birth Date: June 14, 1951 Trustee Indefinite Term Began serving: August 2006 | Principal Occupations: Director or Trustee, Chair of the Audit Committee of the Federated Fund Family; Sole Proprietor, Navigator Management Company (investment and strategic consulting). Other Directorships Held: None. Qualifications: Mr. O'Neill has served in several business, mutual fund and financial management roles and directorship positions throughout his career. Mr. O'Neill serves as Director, Medicines for Humanity and Director, The Golisano Children's Museum of Naples, Florida. Mr. O'Neill previously served as Chief Executive Officer and President, Managing Director and Chief Investment Officer, Fleet Investment Advisors; President and Chief Executive Officer, Aeltus Investment Management, Inc.; General Partner, Hellman, Jordan Management Co., Boston, MA; Chief Investment Officer, The Putnam Companies, Boston, MA; Credit Analyst and Lending Officer, Fleet Bank; Director and Consultant, EZE Castle Software (investment order management software); and Director, Midway Pacific (lumber). |
| P. Jerome Richey Birth Date: February 23, 1949 Trustee Indefinite Term Began serving: October 2013 | Principal Occupations: Director or Trustee of the Federated Fund Family; Management Consultant; formerly, Senior Vice Chancellor and Chief Legal Officer, University of Pittsburgh and Executive Vice President and Chief Legal Officer, CNX Resources Corporation (formerly known as CONSOL Energy Inc.) Other Directorships Held: None. Qualifications: Mr. Richey has served in several business and legal management roles and directorship positions throughout his career. Mr. Richey most recently held the positions of Senior Vice Chancellor and Chief Legal Officer, University of Pittsburgh. Mr. Richey previously served as Chairman of the Board, Epilepsy Foundation of Western Pennsylvania and Chairman of the Board, World Affairs Council of Pittsburgh. Mr. Richey previously served as Chief Legal Officer and Executive Vice President, CNX Resources Corporation (formerly known as CONSOL Energy Inc.); and Board Member, Ethics Counsel and Shareholder, Buchanan Ingersoll & Rooney PC (a law firm). |
| John S. Walsh Birth Date: November 28, 1957 Trustee Indefinite Term Began serving: January 1999 | Principal Occupations: Director or Trustee, and Chair of the Board of Directors or Trustees, of the Federated Fund Family; President and Director, Heat Wagon, Inc. (manufacturer of construction temporary heaters); President and Director, Manufacturers Products, Inc. (distributor of portable construction heaters); President, Portable Heater Parts, a division of Manufacturers Products, Inc. Other Directorships Held: None. Qualifications: Mr. Walsh has served in several business management roles and directorship positions throughout his career. Mr. Walsh previously served as Vice President, Walsh & Kelly, Inc. (paving contractors). |
| Name Birth Date Address Positions Held with Trust Date Service Began | Principal Occupation(s) for Past Five Years and Previous Position(s) |
| Lori A. Hensler Birth Date: January 6, 1967 TREASURER Officer since: April 2013 | Principal Occupations: Principal Financial Officer and Treasurer of the Federated Fund Family; Senior Vice President, Federated Administrative Services; Financial and Operations Principal for Federated Securities Corp. and Edgewood Services, Inc.; and Assistant Treasurer, Federated Investors Trust Company. Ms. Hensler has received the Certified Public Accountant designation. Previous Positions: Controller of Federated Investors, Inc.; Senior Vice President and Assistant Treasurer, Federated Investors Management Company; Treasurer, Federated Investors Trust Company; Assistant Treasurer, Federated Administrative Services, Federated Administrative Services, Inc., Federated Securities Corp., Edgewood Services, Inc., Federated Advisory Services Company, Federated Equity Management Company of Pennsylvania, Federated Global Investment Management Corp., Federated Investment Counseling, Federated Investment Management Company, Passport Research, Ltd., and Federated MDTA, LLC; Financial and Operations Principal for Federated Securities Corp., Edgewood Services, Inc. and Southpointe Distribution Services, Inc. |
| Peter J. Germain Birth Date: September 3, 1959 CHIEF LEGAL OFFICER, SECRETARY and EXECUTIVE VICE PRESIDENT Officer since: January 2005 | Principal Occupations: Mr. Germain is Chief Legal Officer, Secretary and Executive Vice President of the Federated Fund Family. He is General Counsel, Chief Legal Officer, Secretary and Executive Vice President, Federated Investors, Inc.; Trustee and Senior Vice President, Federated Investors Management Company; Trustee and President, Federated Administrative Services; Director and President, Federated Administrative Services, Inc.; Director and Vice President, Federated Securities Corp.; Director and Secretary, Federated Private Asset Management, Inc.; Secretary, Federated Shareholder Services Company; and Secretary, Retirement Plan Service Company of America. Mr. Germain joined Federated in 1984 and is a member of the Pennsylvania Bar Association. Previous Positions: Deputy General Counsel, Special Counsel, Managing Director of Mutual Fund Services, Federated Investors, Inc.; Senior Vice President, Federated Services Company; and Senior Corporate Counsel, Federated Investors, Inc. |
| Richard B. Fisher Birth Date: May 17, 1923 Vice President Officer since: September 1993 | Principal Occupations: Vice Chairman or Vice President of some of the Funds in the Federated Fund Family; Vice Chairman, Federated Investors, Inc.; Chairman, Federated Securities Corp. Previous Positions: President and Director or Trustee of some of the Funds in the Federated Fund Family; Executive Vice President, Federated Investors, Inc.; Director and Chief Executive Officer, Federated Securities Corp. |
| John B. Fisher Birth Date: May 16, 1956 President Officer since: November 2004 | Principal Occupations: Principal Executive Officer and President of certain of the Funds in the Federated Fund Family; Director or Trustee of certain of the Funds in the Federated Fund Family; Vice President, Federated Investors, Inc.; President, Director/Trustee and CEO, Federated Advisory Services Company, Federated Equity Management Company of Pennsylvania, Federated Global Investment Management Corp., Federated Investment Counseling, Federated Investment Management Company; President and CEO of Passport Research, Ltd.; President of some of the Funds in the Federated Fund Complex and Director, Federated Investors Trust Company. Previous Positions: President and Director of the Institutional Sales Division of Federated Securities Corp.; President and Director of Federated Investment Counseling; Director, Edgewood Securities Corp.; Director, Federated Services Company; Director, Federated Investors, Inc.; Chairman and Director, Southpointe Distribution Services, Inc. and President, Technology, Federated Services Company. |
| Stephen Van Meter Birth Date: June 5, 1975 CHIEF COMPLIANCE OFFICER AND SENIOR VICE PRESIDENT Officer since: July 2015 | Principal Occupations: Senior Vice President and Chief Compliance Officer of the Federated Fund Family; Vice President and Chief Compliance Officer of Federated Investors, Inc. and Chief Compliance Officer of certain of its subsidiaries. Mr. Van Meter joined Federated in October 2011. He holds FINRA licenses under Series 3, 7, 24 and 66. Previous Positions: Mr. Van Meter previously held the position of Compliance Operating Officer, Federated Investors, Inc. Prior to joining Federated, Mr. Van Meter served at the United States Securities and Exchange Commission in the positions of Senior Counsel, Office of Chief Counsel, Division of Investment Management and Senior Counsel, Division of Enforcement. |
| Stephen F. Auth Birth Date: September 13, 1956 101 Park Avenue 41st Floor New York, NY 10178 CHIEF INVESTMENT OFFICER Officer since: November 2002 | Principal Occupations: Stephen F. Auth is Chief Investment Officer of various Funds in the Federated Fund Family; Executive Vice President, Federated Investment Counseling, Federated Global Investment Management Corp. and Federated Equity Management Company of Pennsylvania. Previous Positions: Executive Vice President, Federated Investment Management Company and Passport Research, Ltd. (investment advisory subsidiary of Federated); Senior Vice President, Global Portfolio Management Services Division; Senior Vice President, Federated Investment Management Company and Passport Research, Ltd.; Senior Managing Director and Portfolio Manager, Prudential Investments. |
| Robert J. Ostrowski Birth Date: April 26, 1963 Chief Investment Officer Officer since: May 2004 | Principal Occupations: Robert J. Ostrowski joined Federated in 1987 as an Investment Analyst and became a Portfolio Manager in 1990. He was named Chief Investment Officer of Federated's taxable fixed-income products in 2004 and also serves as a Senior Portfolio Manager. Mr. Ostrowski became an Executive Vice President of the Fund's Adviser in 2009 and served as a Senior Vice President of the Fund's Adviser from 1997 to 2009. Mr. Ostrowski has received the Chartered Financial Analyst designation. He received his M.S. in Industrial Administration from Carnegie Mellon University. |
| Deborah A. Cunningham Birth Date: September 15, 1959 Chief Investment Officer Officer since: June 2012 | Principal Occupations: Deborah A. Cunningham was named Chief Investment Officer of Federated's money market products in 2004. She joined Federated in 1981 and has been a Senior Portfolio Manager since 1997 and an Executive Vice President of the Fund's Adviser since 2009. Ms. Cunningham has received the Chartered Financial Analyst designation and holds an M.S.B.A. in Finance from Robert Morris College. |
Federated Investors Funds
4000 Ericsson Drive
Warrendale, PA 15086-7561
or call 1-800-341-7400.
2018 ©Federated Investors, Inc.
| Share Class | Primary | Service |
| 1 | Please see the footnotes to the line graphs below for definitions of, and further information about, the BBHY2%ICI. |
| 2 | Please see the footnotes to the line graphs below for definitions of, and further information about, the LVHYFA. |
| 3 | High-yield, lower-rated securities generally entail greater market, credit and liquidity risks than investment-grade securities and may include higher volatility and a higher risk of default. |
| 4 | The Bloomberg Barclays U.S. Aggregate Bond Index is a broad-based index that measures the investment grade, U.S. dollar-denominated, fixed-rate taxable bond market.* |
| 5 | Bond prices are sensitive to changes in interest rates, and a rise in interest rates can cause a decline in their prices. |
| 6 | Credit Suisse High Yield Bond Index serves as a benchmark to evaluate the performance of low-quality bonds. Low-quality is defined as those bonds in the range from “BB” to “CCC” and defaults.* |
| * | The index is unmanaged, and it is not possible to invest directly in an index. |
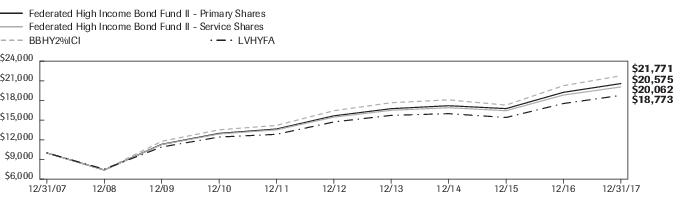
| Federated High Income Bond Fund II - | Primary Shares | Service Shares | BBHY2%ICI | LVHYFA |
| F | F | I | I | |
| 12/31/2007 | 10,000 | 10,000 | 10,000 | 10,000 |
| 12/31/2008 | 7,401 | 7,391 | 7,412 | 7,526 |
| 12/31/2009 | 11,312 | 11,269 | 11,767 | 10,905 |
| 12/31/2010 | 12,978 | 12,889 | 13,525 | 12,422 |
| 12/31/2011 | 13,649 | 13,524 | 14,196 | 12,840 |
| 12/31/2012 | 15,655 | 15,459 | 16,435 | 14,724 |
| 12/31/2013 | 16,748 | 16,499 | 17,658 | 15,730 |
| 12/31/2014 | 17,199 | 16,898 | 18,092 | 15,990 |
| 12/31/2015 | 16,757 | 16,438 | 17,290 | 15,400 |
| 12/31/2016 | 19,240 | 18,826 | 20,252 | 17,534 |
| 12/31/2017 | 20,575 | 20,062 | 21,771 | 18,773 |
| 1 Year | 5 Years | 10 Years | |
| Primary Shares | 6.94% | 5.62% | 7.48% |
| Service Shares | 6.56% | 5.35% | 7.21% |
| BBHY2%ICI | 7.50% | 5.78% | 8.09% |
| LVHYFA | 6.49% | 4.74% | 6.46% |
| 1 | The Fund's performance assumes the reinvestment of all dividends and distributions. The BBHY2%ICI and the LVHYFA have been adjusted to reflect reinvestment of dividends on securities in the index and average. |
| 2 | The BBHY2%ICI is an issuer-constrained version of the Bloomberg Barclays U.S. Corporate High Yield Index that measures the market of USD-denominated, noninvestment-grade, fixed-rate, taxable corporate bonds. The index follows the same rules as the uncapped index but limits the exposure of each issuer to 2% of the total market value and redistributes any excess market value index-wide on a pro-rata basis. The BBHY2%ICI is not adjusted to reflect sales charges, expenses or other fees that the Securities and Exchange Commission (SEC) requires to be reflected in the Fund's performance. The index is unmanaged and unlike the Fund, is not affected by cash flows. It is not possible to invest directly in an index. |
| 3 | Lipper figures represent the average of the total returns reported by all funds designated by Lipper, Inc., as falling into the respective category and is not adjusted to reflect any sales charges. The Lipper figures in the Growth of $10,000 line graph are based on historical return information published by Lipper and reflect the return of the funds comprising the category in the year of publication. Because the funds designated by Lipper as falling into the category can change over time, the Lipper figures in the line graph may not match the Lipper figures in the Average Annual Total Returns table, which reflect the return of the funds that currently comprise the category. |
| Index Classification | Percentage of Total Net Assets |
| Health Care | 10.5% |
| Technology | 9.5% |
| Cable Satellite | 7.8% |
| Packaging | 6.3% |
| Independent Energy | 5.8% |
| Midstream | 5.7% |
| Media Entertainment | 5.6% |
| Wireless Communications | 4.2% |
| Gaming | 4.1% |
| Pharmaceuticals | 3.9% |
| Other2 | 32.2% |
| Cash Equivalents3 | 2.9% |
| Other Assets and Liabilities—Net4 | 1.5% |
| TOTAL | 100.0% |
| 1 | Index classifications are based upon, and individual portfolio securities are assigned to, the classifications and sub-classifications of the Bloomberg Barclays U.S. Corporate High Yield 2% Issuer Capped Index (BBHY2%ICI). Individual portfolio securities that are not included in the BBHY2%ICI are assigned to an index classification by the Fund's Adviser. |
| 2 | For purposes of this table, index classifications which constitute less than 3.5% of the Fund's total net assets have been aggregated under the designation “Other.” |
| 3 | Cash Equivalents include any investments in money market mutual funds and/or overnight repurchase agreements. |
| 4 | Assets, other than investments in securities, less liabilities. See Statement of Assets and Liabilities. |
| Principal Amount | Value | ||
| CORPORATE BONDS—95.6% | |||
| Aerospace/Defense—1.1% | |||
| $450,000 | Engility Corp., Sr. Unsecd. Note, 8.875%, 9/1/2024 | $482,625 | |
| 825,000 | TransDigm, Inc., Sr. Sub. Note, 6.00%, 7/15/2022 | 845,625 | |
| 675,000 | TransDigm, Inc., Sr. Sub. Note, 6.50%, 7/15/2024 | 693,563 | |
| 450,000 | TransDigm, Inc., Sr. Sub. Note, 6.50%, 5/15/2025 | 461,250 | |
| 200,000 | TransDigm, Inc., Sr. Sub., 6.375%, 6/15/2026 | 203,250 | |
| TOTAL | 2,686,313 | ||
| Automotive—2.2% | |||
| 600,000 | Adient Global Holdings Ltd., Sr. Unsecd. Note, Series 144A, 4.875%, 8/15/2026 | 619,500 | |
| 225,000 | Allison Transmission, Inc., Sr. Unsecd. Note, Series 144A, 5.00%, 10/1/2024 | 232,594 | |
| 725,000 | American Axle & Manufacturing, Inc., Sr. Unsecd. Note, Series 144A, 6.50%, 4/1/2027 | 769,406 | |
| 525,000 | BCD Acquisition, Inc., Series 144A, 9.625%, 9/15/2023 | 578,812 | |
| 725,000 | Dana Financing Lux Sarl, Series 144A, 6.50%, 6/1/2026 | 787,531 | |
| 450,000 | Goodyear Tire & Rubber Co., Sr. Unsecd. Note, 4.875%, 3/15/2027 | 461,813 | |
| 200,000 | Goodyear Tire & Rubber Co., Sr. Unsecd. Note, 5.00%, 5/31/2026 | 206,970 | |
| 180,000 | J.B. Poindexter & Co., Inc., Sr. Unsecd. Note, Series 144A, 9.00%, 4/1/2022 | 187,200 | |
| 200,000 | Schaeffler Verwaltung Zw, Series 144A, 4.50%, 9/15/2023 | 204,376 | |
| 1,025,000 | Schaeffler Verwaltung Zw, Series 144A, 4.75%, 9/15/2026 | 1,042,937 | |
| 281,000 | TI Group Auto Systems LLC, Sr. Unsecd. Note, Series 144A, 8.75%, 7/15/2023 | 302,778 | |
| TOTAL | 5,393,917 | ||
| Banking—0.8% | |||
| 1,475,000 | Ally Financial, Inc., Sr. Sub. Note, 5.75%, 11/20/2025 | 1,613,281 | |
| 200,000 | Ally Financial, Inc., Sr. Unsecd. Note, 4.625%, 5/19/2022 | 208,500 | |
| TOTAL | 1,821,781 | ||
| Building Materials—2.1% | |||
| 180,000 | American Builders & Contractors Supply Co., Inc., Series 144A, 5.625%, 4/15/2021 | 184,050 | |
| 75,000 | American Builders & Contractors Supply Co., Inc., Sr. Unsecd. Note, Series 144A, 5.75%, 12/15/2023 | 79,125 | |
| 250,000 | Beacon Roofing Supply, Inc., Sr. Unsecd. Note, Series 144A, 4.875%, 11/1/2025 | 252,188 | |
| 375,000 | Building Materials Corp. of America, Sr. Unsecd. Note, Series 144A, 6.00%, 10/15/2025 | 402,187 | |
| 250,000 | CD&R Waterworks Merger Sub LLC, Sr. Unsecd. Note, Series 144A, 6.125%, 8/15/2025 | 254,375 | |
| 300,000 | HD Supply, Inc., Sr. Unsecd. Note, Series 144A, 5.75%, 4/15/2024 | 319,500 | |
| 75,000 | Jeld-Wen, Inc., Sr. Unsecd. Note, Series 144A, 4.625%, 12/15/2025 | 75,750 | |
| 75,000 | Jeld-Wen, Inc., Sr. Unsecd. Note, Series 144A, 4.875%, 12/15/2027 | 75,938 | |
| 475,000 | Masonite International Corp., Sr. Unsecd. Note, Series 144A, 5.625%, 3/15/2023 | 498,892 | |
| 275,000 | NCI Building System, Inc., Sr. Unsecd. Note, Series 144A, 8.25%, 1/15/2023 | 291,844 | |
| 325,000 | Ply Gem Industries, Inc., 6.50%, 2/1/2022 | 337,188 | |
| 825,000 | RSI Home Products, Inc., Series 144A, 6.50%, 3/15/2023 | 868,312 | |
| 1,000,000 | Standard Industries, Inc., Sr. Unsecd. Note, Series 144A, 5.00%, 2/15/2027 | 1,025,000 | |
| 350,000 | USG Corp., Sr. Unsecd. Note, Series 144A, 4.875%, 6/1/2027 | 363,667 | |
| TOTAL | 5,028,016 | ||
| Cable Satellite—7.8% | |||
| 375,000 | Altice US Finance I Corp., Series 144A, 5.375%, 7/15/2023 | 385,313 | |
| 225,000 | Altice US Finance I Corp., Series 144A, 5.50%, 5/15/2026 | 229,781 | |
| 225,000 | Altice US Finance I Corp., Sr. Unsecd. Note, Series 144A, 7.75%, 7/15/2025 | 241,875 | |
| 175,000 | CCO Holdings LLC/Cap Corp., 5.25%, 9/30/2022 | 179,703 | |
| 775,000 | CCO Holdings LLC/Cap Corp., 5.75%, 9/1/2023 | 796,313 | |
| 175,000 | CCO Holdings LLC/Cap Corp., Series 144A, 5.375%, 5/1/2025 | 180,744 | |
| 500,000 | CCO Holdings LLC/Cap Corp., Series 144A, 5.75%, 2/15/2026 | 520,625 |
| Principal Amount | Value | ||
| CORPORATE BONDS—continued | |||
| Cable Satellite—continued | |||
| $650,000 | CCO Holdings LLC/Cap Corp., Sr. Unsecd. Note, Series 144A, 5.00%, 2/1/2028 | $635,375 | |
| 500,000 | CCO Holdings LLC/Cap Corp., Sr. Unsecd. Note, Series 144A, 5.125%, 5/1/2027 | 493,750 | |
| 400,000 | CCO Holdings LLC/Cap Corp., Sr. Unsecd. Note, Series 144A, 5.875%, 5/1/2027 | 412,000 | |
| 450,000 | CSC Holdings, Inc., Sr. Unsecd. Note, 5.25%, 6/1/2024 | 442,125 | |
| 600,000 | CSC Holdings, Inc., Sr. Unsecd. Note, Series 144A, 5.50%, 4/15/2027 | 613,500 | |
| 625,000 | Cablevision Systems Corp., Sr. Unsecd. Note, 5.875%, 9/15/2022 | 617,188 | |
| 1,225,000 | Cequel Communications Holdings, Sr. Unsecd. Note, Series 144A, 5.125%, 12/15/2021 | 1,231,125 | |
| 650,000 | Charter Communications Holdings II, 5.75%, 1/15/2024 | 671,125 | |
| 100,000 | DISH DBS Corp., 5.00%, 3/15/2023 | 95,375 | |
| 775,000 | DISH DBS Corp., 5.875%, 7/15/2022 | 781,781 | |
| 950,000 | DISH DBS Corp., Sr. Unsecd. Note, 5.875%, 11/15/2024 | 927,437 | |
| 50,000 | DISH DBS Corp., Sr. Unsecd. Note, 7.75%, 7/1/2026 | 52,750 | |
| 300,000 | Intelsat Jackson Holdings S.A., Series 144A, 8.00%, 2/15/2024 | 316,500 | |
| 1,025,000 | Intelsat Jackson Holdings S.A., Sr. Unsecd. Note, 5.50%, 8/1/2023 | 840,500 | |
| 925,000 | Intelsat Jackson Holdings S.A., Sr. Unsecd. Note, 7.50%, 4/1/2021 | 846,375 | |
| 300,000 | Intelsat Jackson Holdings S.A., Sr. Unsecd. Note, Series 144A, 9.75%, 7/15/2025 | 289,500 | |
| 275,000 | Neptune Finco Corp., Sr. Unsecd. Note, Series 144A, 10.125%, 1/15/2023 | 310,406 | |
| 450,000 | Neptune Finco Corp., Sr. Unsecd. Note, Series 144A, 6.625%, 10/15/2025 | 488,241 | |
| 125,000 | Sirius XM Radio, Inc., Series 144A, 4.625%, 5/15/2023 | 127,969 | |
| 400,000 | Sirius XM Radio, Inc., Series 144A, 6.00%, 7/15/2024 | 424,000 | |
| 100,000 | Sirius XM Radio, Inc., Sr. Unsecd. Note, Series 144A, 5.00%, 8/1/2027 | 100,750 | |
| 675,000 | Sirius XM Radio, Inc., Sr. Unsecd. Note, Series 144A, 5.375%, 4/15/2025 | 704,531 | |
| 675,000 | Sirius XM Radio, Inc., Sr. Unsecd. Note, Series 144A, 5.375%, 7/15/2026 | 701,156 | |
| 1,200,000 | Telenet Finance Luxembourg, Sec. Fac. Bond, Series 144A, 5.50%, 3/1/2028 | 1,200,000 | |
| 275,000 | Unitymedia KabelBW GmbH, Series 144A, 6.125%, 1/15/2025 | 291,500 | |
| 375,000 | Virgin Media Secured Finance PLC, Series 144A, 5.25%, 1/15/2026 | 380,156 | |
| 200,000 | Virgin Media Secured Finance PLC, Series 144A, 5.50%, 8/15/2026 | 205,500 | |
| 700,000 | Virgin Media Secured Finance PLC, Series 144A, 6.375%, 4/15/2023 | 725,375 | |
| 275,000 | Virgin Media, Inc., Sr. Unsecd. Note, Series 144A, 5.75%, 1/15/2025 | 281,531 | |
| 775,000 | Ziggo Finance BV, Sec. Fac. Bond, Series 144A, 5.50%, 1/15/2027 | 775,969 | |
| 300,000 | Ziggo Finance BV, Sr. Unsecd. Note, Series 144A, 5.875%, 1/15/2025 | 297,000 | |
| 200,000 | Ziggo Finance BV, Sr. Unsecd. Note, Series 144A, 6.00%, 1/15/2027 | 195,500 | |
| TOTAL | 19,010,344 | ||
| Chemicals—2.0% | |||
| 625,000 | Alpha 3 BV, Sr. Unsecd. Note, Series 144A, 6.25%, 2/1/2025 | 643,750 | |
| 675,000 | Compass Minerals International, Inc., Series 144A, 4.875%, 7/15/2024 | 668,250 | |
| 875,000 | Hexion U.S. Finance Corp., 6.625%, 4/15/2020 | 789,688 | |
| 300,000 | Koppers, Inc., Sr. Unsecd. Note, Series 144A, 6.00%, 2/15/2025 | 318,750 | |
| 200,000 | PQ Corp., Series 144A, 6.75%, 11/15/2022 | 214,250 | |
| 100,000 | PQ Corp., Sr. Unsecd. Note, Series 144A, 5.75%, 12/15/2025 | 102,000 | |
| 100,000 | Platform Specialty Products Corp., Sr. Unsecd. Note, Series 144A, 5.875%, 12/1/2025 | 99,375 | |
| 1,850,000 | Platform Specialty Products Corp., Sr. Unsecd. Note, Series 144A, 6.50%, 2/1/2022 | 1,914,750 | |
| 150,000 | Versum Materials, Inc., Sr. Unsecd. Note, Series 144A, 5.50%, 9/30/2024 | 160,875 | |
| TOTAL | 4,911,688 | ||
| Construction Machinery—0.7% | |||
| 175,000 | Ritchie Bros. Auctioneers, Inc., Sr. Unsecd. Note, Series 144A, 5.375%, 1/15/2025 | 181,125 | |
| 550,000 | United Rentals North America, Inc., Sr. Unsecd. Note, 4.875%, 1/15/2028 | 554,125 | |
| 525,000 | United Rentals, Inc., Sr. Unsecd. Note, 5.50%, 5/15/2027 | 553,875 | |
| 450,000 | United Rentals, Inc., Sr. Unsecd. Note, 5.875%, 9/15/2026 | 483,188 | |
| TOTAL | 1,772,313 |
| Principal Amount | Value | ||
| CORPORATE BONDS—continued | |||
| Consumer Cyclical Services—0.6% | |||
| $525,000 | GW Honos Security Corp., Sr. Unsecd. Note, Series 144A, 8.75%, 5/15/2025 | $565,688 | |
| 250,000 | Matthews International Corp., Sr. Unsecd. Note, Series 144A, 5.25%, 12/1/2025 | 253,125 | |
| 250,000 | ServiceMaster Co. LLC, Sr. Unsecd. Note, 7.45%, 8/15/2027 | 271,875 | |
| 400,000 | ServiceMaster Co. LLC, Sr. Unsecd. Note, Series 144A, 5.125%, 11/15/2024 | 406,000 | |
| TOTAL | 1,496,688 | ||
| Consumer Products—1.7% | |||
| 375,000 | FGI Operating Co. LLC/FGI Finance, Inc., 7.875%, 5/1/2020 | 85,313 | |
| 1,150,000 | First Quality Finance Co., Inc., Series 144A, 4.625%, 5/15/2021 | 1,164,375 | |
| 75,000 | First Quality Finance Co., Inc., Sr. Unsecd. Note, Series 144A, 5.00%, 7/1/2025 | 76,688 | |
| 1,225,000 | Prestige Brands Holdings, Inc., Series 144A, 5.375%, 12/15/2021 | 1,251,031 | |
| 450,000 | Prestige Brands, Inc., Sr. Unsecd. Note, Series 144A, 6.375%, 3/1/2024 | 468,562 | |
| 50,000 | Scotts Miracle-Gro Co., Sr. Unsecd. Note, 5.25%, 12/15/2026 | 52,500 | |
| 550,000 | Spectrum Brands, Inc., 5.75%, 7/15/2025 | 581,625 | |
| 125,000 | Spectrum Brands, Inc., 6.125%, 12/15/2024 | 132,969 | |
| 215,000 | Springs Industries, Inc., 6.25%, 6/1/2021 | 219,837 | |
| TOTAL | 4,032,900 | ||
| Diversified Manufacturing—1.5% | |||
| 700,000 | Entegris, Inc., Sr. Unsecd. Note, Series 144A, 4.625%, 2/10/2026 | 714,000 | |
| 1,225,000 | Gates Global LLC, Series 144A, 6.00%, 7/15/2022 | 1,258,687 | |
| 350,000 | JPW Industries Holding Corp., Sr. Secd. Note, Series 144A, 9.00%, 10/1/2024 | 366,625 | |
| 1,225,000 | WESCO Distribution, Inc., Sr. Unsecd. Note, 5.375%, 12/15/2021 | 1,260,219 | |
| TOTAL | 3,599,531 | ||
| Environmental—0.4% | |||
| 550,000 | Tervita Escrow Corp., Series 144A, 7.625%, 12/1/2021 | 554,125 | |
| 325,000 | Wrangler Buyer Corp., Sr. Unsecd. Note, Series 144A, 6.00%, 10/1/2025 | 336,375 | |
| TOTAL | 890,500 | ||
| Finance Companies—2.1% | |||
| 150,000 | Navient Corp., Sr. Unsecd. Note, 5.50%, 1/25/2023 | 150,188 | |
| 1,225,000 | Navient Corp., Sr. Unsecd. Note, 5.875%, 10/25/2024 | 1,221,937 | |
| 100,000 | Navient Corp., Sr. Unsecd. Note, 6.75%, 6/25/2025 | 103,000 | |
| 225,000 | Navient Corp., Sr. Unsecd. Note, 7.25%, 9/25/2023 | 240,750 | |
| 125,000 | Navient Corp., Sr. Unsecd. Note, Series MTN, 6.125%, 3/25/2024 | 127,188 | |
| 150,000 | Park Aerospace Holdings Ltd., Sr. Unsecd. Note, Series 144A, 4.50%, 3/15/2023 | 143,625 | |
| 125,000 | Park Aerospace Holdings Ltd., Sr. Unsecd. Note, Series 144A, 5.25%, 8/15/2022 | 124,688 | |
| 1,525,000 | Park Aerospace Holdings Ltd., Sr. Unsecd. Note, Series 144A, 5.50%, 2/15/2024 | 1,517,375 | |
| 1,250,000 | Quicken Loans, Inc., Series 144A, 5.75%, 5/1/2025 | 1,300,012 | |
| 225,000 | Quicken Loans, Inc., Sr. Unsecd. Note, Series 144A, 5.25%, 1/15/2028 | 222,682 | |
| TOTAL | 5,151,445 | ||
| Food & Beverage—2.4% | |||
| 800,000 | Anna Merger Sub, Inc., Series 144A, 7.75%, 10/1/2022 | 588,000 | |
| 525,000 | Aramark Services, Inc., Sr. Unsecd. Note, 5.125%, 1/15/2024 | 552,300 | |
| 425,000 | Aramark Services, Inc., Sr. Unsecd. Note, Series 144A, 5.00%, 4/1/2025 | 449,990 | |
| 625,000 | Hearthside Group Holdings LLC, Series 144A, 6.50%, 5/1/2022 | 641,406 | |
| 375,000 | Lamb Weston Holdings, Inc., Sr. Unsub., Series 144A, 4.875%, 11/1/2026 | 392,813 | |
| 750,000 | Post Holdings, Inc., Sr. Unsecd. Note, Series 144A, 5.00%, 8/15/2026 | 739,687 | |
| 400,000 | Post Holdings, Inc., Sr. Unsecd. Note, Series 144A, 5.50%, 3/1/2025 | 415,000 | |
| 200,000 | Post Holdings, Inc., Sr. Unsecd. Note, Series 144A, 5.625%, 1/15/2028 | 201,000 | |
| 900,000 | Post Holdings, Inc., Sr. Unsecd. Note, Series 144A, 5.75%, 3/1/2027 | 918,000 | |
| 775,000 | U.S. Foodservice, Inc., Sr. Unsecd. Note, Series 144A, 5.875%, 6/15/2024 | 817,625 | |
| TOTAL | 5,715,821 |
| Principal Amount | Value | ||
| CORPORATE BONDS—continued | |||
| Gaming—4.1% | |||
| $200,000 | Boyd Gaming Corp., Sr. Unsecd. Note, 6.375%, 4/1/2026 | $216,000 | |
| 800,000 | Boyd Gaming Corp., Sr. Unsecd. Note, 6.875%, 5/15/2023 | 851,000 | |
| 1,275,000 | Crc Escrow Issuer LLC, Sr. Unsecd. Note, Series 144A, 5.25%, 10/15/2025 | 1,291,320 | |
| 550,000 | Eldorado Resorts, Inc., Sr. Unsecd. Note, 6.00%, 4/1/2025 | 577,500 | |
| 175,000 | GLP Capital LP/GLP Financing II, Inc., Sr. Unsecd. Note, 5.375%, 4/15/2026 | 188,125 | |
| 100,000 | MGM Growth Properties LLC, Sr. Unsecd. Note, 5.625%, 5/1/2024 | 107,000 | |
| 400,000 | MGM Mirage, Inc., 7.75%, 3/15/2022 | 457,000 | |
| 675,000 | MGM Resorts International, 6.00%, 3/15/2023 | 730,687 | |
| 150,000 | MGM Resorts International, Sr. Unsecd. Note, 4.625%, 9/1/2026 | 152,250 | |
| 725,000 | Mohegan Tribal Gaming Authority, Sr. Unsecd. Note, Series 144A, 7.875%, 10/15/2024 | 745,844 | |
| 350,000 | Penn National Gaming, Inc., Sr. Unsecd. Note, Series 144A, 5.625%, 1/15/2027 | 364,000 | |
| 700,000 | Pinnacle Entertainment, Inc., Sr. Unsecd. Note, 5.625%, 5/1/2024 | 752,500 | |
| 575,000 | Rivers Pittsburgh LP, Series 144A, 6.125%, 8/15/2021 | 572,125 | |
| 1,225,000 | Seminole Hard Rock Entertainment, Inc./Seminole Hard Rock International LLC, Series 144A, 5.875%, 5/15/2021 | 1,249,500 | |
| 310,000 | Seminole Tribe of Florida, Inc., Bond, Series 144A, 7.804%, 10/1/2020 | 314,650 | |
| 475,000 | Station Casinos, Inc., Sr. Unsecd. Note, Series 144A, 5.00%, 10/1/2025 | 478,562 | |
| 425,000 | Sugarhouse HSP Gaming Finance Corp., Sec. Fac. Bond, Series 144A, 5.875%, 5/15/2025 | 404,813 | |
| 375,000 | Wynn Las Vegas LLC, Sr. Unsecd. Note, Series 144A, 5.25%, 5/15/2027 | 380,625 | |
| TOTAL | 9,833,501 | ||
| Health Care—10.5% | |||
| 350,000 | Acadia Healthcare Co., Inc., Sr. Unsecd. Note, 5.625%, 2/15/2023 | 357,000 | |
| 625,000 | Acadia Healthcare Co., Inc., Sr. Unsecd. Note, 6.50%, 3/1/2024 | 653,125 | |
| 1,025,000 | Air Medical Group Holdings, Inc., Sr. Unsecd. Note, Series 144A, 6.375%, 5/15/2023 | 989,125 | |
| 350,000 | Amsurg Corp., Sr. Unsecd. Note, 5.625%, 7/15/2022 | 355,250 | |
| 250,000 | Avantor, Inc., Series 144A, 6.00%, 10/1/2024 | 249,688 | |
| 575,000 | Avantor, Inc., Sr. Unsecd. Note, Series 144A, 9.00%, 10/1/2025 | 567,813 | |
| 250,000 | CHS/Community Health Systems, Inc., 5.125%, 8/1/2021 | 226,250 | |
| 500,000 | CHS/Community Health Systems, Inc., 6.25%, 3/31/2023 | 452,500 | |
| 925,000 | CHS/Community Health Systems, Inc., Sr. Unsecd. Note, 6.875%, 2/1/2022 | 536,500 | |
| 725,000 | Envision Healthcare Holdings, Inc., Series 144A, 5.125%, 7/1/2022 | 706,875 | |
| 1,350,000 | HCA, Inc., 5.00%, 3/15/2024 | 1,407,375 | |
| 200,000 | HCA, Inc., 5.875%, 5/1/2023 | 214,000 | |
| 525,000 | HCA, Inc., 5.875%, 2/15/2026 | 556,500 | |
| 725,000 | HCA, Inc., Sr. Secd. Note, 5.25%, 4/15/2025 | 768,500 | |
| 2,025,000 | HCA, Inc., Sr. Unsecd. Note, 5.375%, 2/1/2025 | 2,100,937 | |
| 75,000 | Hologic, Inc., Sr. Unsecd. Note, Series 144A, 4.375%, 10/15/2025 | 76,313 | |
| 400,000 | IMS Health, Inc., Sr. Unsecd. Note, Series 144A, 5.00%, 10/15/2026 | 411,500 | |
| 200,000 | LifePoint Health, Inc., 5.875%, 12/1/2023 | 202,750 | |
| 225,000 | LifePoint Health, Inc., Sr. Unsecd. Note, 5.50%, 12/1/2021 | 230,344 | |
| 200,000 | MEDNAX, Inc., Sr. Unsecd. Note, Series 144A, 5.25%, 12/1/2023 | 204,000 | |
| 1,725,000 | MPH Acquisition Holdings LLC, Series 144A, 7.125%, 6/1/2024 | 1,841,437 | |
| 575,000 | New Amethyst Corp., Sr. Unsecd. Note, Series 144A, 6.25%, 12/1/2024 | 595,125 | |
| 2,250,000 | Ortho-Clinical Diagnostics, Inc., Series 144A, 6.625%, 5/15/2022 | 2,272,500 | |
| 500,000 | Polaris Intermediate Corp., Sr. Unsecd. Note, Series 144A, 8.50%, 12/1/2022 | 520,000 | |
| 1,350,000 | SteriGenics—Nordion Holdings LLC, Sr. Unsecd. Note, Series 144A, 6.50%, 5/15/2023 | 1,410,750 | |
| 575,000 | SteriGenics Nordion Topc, Sr. Unsecd. Note, Series 144A, 8.125%, 11/1/2021 | 582,187 | |
| 825,000 | Surgery Center Holdings, Inc., Sr. Unsecd. Note, Series 144A, 6.75%, 7/1/2025 | 783,750 | |
| 1,500,000 | Team Health Holdings, Inc., Sr. Unsecd. Note, Series 144A, 6.375%, 2/1/2025 | 1,346,250 | |
| 50,000 | Teleflex, Inc., Sr. Unsecd. Note, 4.625%, 11/15/2027 | 50,615 | |
| 675,000 | Teleflex, Inc., Sr. Unsecd. Note, 5.25%, 6/15/2024 | 707,062 |
| Principal Amount | Value | ||
| CORPORATE BONDS—continued | |||
| Health Care—continued | |||
| $250,000 | Tenet Healthcare Corp., 8.125%, 4/1/2022 | $255,313 | |
| 300,000 | Tenet Healthcare Corp., Note, 4.375%, 10/1/2021 | 300,750 | |
| 675,000 | Tenet Healthcare Corp., Series 144A, 5.125%, 5/1/2025 | 660,656 | |
| 125,000 | Tenet Healthcare Corp., Series 144A, 7.50%, 1/1/2022 | 131,719 | |
| 275,000 | Tenet Healthcare Corp., Sr. Secd. Note, Series 144A, 4.625%, 7/15/2024 | 269,156 | |
| 925,000 | Tenet Healthcare Corp., Sr. Unsecd. Note, 6.75%, 6/15/2023 | 900,719 | |
| 175,000 | Tenet Healthcare Corp., Sr. Unsecd. Note, Series 144A, 7.00%, 8/1/2025 | 165,156 | |
| 875,000 | Vizient, Inc., Sr. Unsecd. Note, Series 144A, 10.375%, 3/1/2024 | 986,562 | |
| 450,000 | West Street Merger Sub, Inc., Sr. Unsecd. Note, Series 144A, 6.375%, 9/1/2025 | 453,375 | |
| TOTAL | 25,499,427 | ||
| Independent Energy—5.8% | |||
| 750,000 | Antero Resources Corp., Sr. Unsecd. Note, 5.00%, 3/1/2025 | 768,750 | |
| 50,000 | Antero Resources Finance Corp., 5.375%, 11/1/2021 | 51,438 | |
| 600,000 | Ascent Resources Utica Holdings LLC/ARU Finance Corp., Sr. Unsecd. Note, Series 144A, 10.00%, 4/1/2022 | 646,500 | |
| 469,000 | Callon Petroleum Corp., Sr. Unsecd. Note, 6.125%, 10/1/2024 | 485,415 | |
| 300,000 | Carrizo Oil & Gas, Inc., Sr. Unsecd. Note, 7.50%, 9/15/2020 | 306,000 | |
| 400,000 | Carrizo Oil & Gas, Inc., Sr. Unsecd. Note, 8.25%, 7/15/2025 | 441,500 | |
| 254,000 | Chesapeake Energy Corp., Series 144A, 8.00%, 12/15/2022 | 274,955 | |
| 125,000 | Chesapeake Energy Corp., Sr. Unsecd. Note, Series 144A, 8.00%, 1/15/2025 | 126,406 | |
| 725,000 | Chesapeake Energy Corp., Sr. Unsecd. Note, Series 144A, 8.00%, 6/15/2027 | 697,812 | |
| 375,000 | Continental Resources, Inc., 4.50%, 4/15/2023 | 383,437 | |
| 775,000 | Crownrock LP/Crownrock F, Series 144A, 5.625%, 10/15/2025 | 780,812 | |
| 125,000 | Diamondback Energy, Inc., Sr. Unsecd. Note, 4.75%, 11/1/2024 | 126,094 | |
| 375,000 | EP Energy LLC/Everest Acquisition Finance, Inc., Sec. Fac. Bond, Series 144A, 8.00%, 11/29/2024 | 389,062 | |
| 250,000 | Endeavor Energy Resources LP, Sr. Unsecd. Note, Series 144A, 5.75%, 1/30/2028 | 257,688 | |
| 350,000 | Gulfport Energy Corp., Sr. Unsecd. Note, 6.00%, 10/15/2024 | 351,750 | |
| 325,000 | Gulfport Energy Corp., Sr. Unsecd. Note, 6.375%, 5/15/2025 | 327,844 | |
| 75,000 | Gulfport Energy Corp., Sr. Unsecd. Note, 6.625%, 5/1/2023 | 76,875 | |
| 125,000 | Gulfport Energy Corp., Sr. Unsecd. Note, Series 144A, 6.375%, 1/15/2026 | 126,250 | |
| 75,000 | Laredo Petroleum, 5.625%, 1/15/2022 | 76,125 | |
| 225,000 | Laredo Petroleum, Sr. Unsecd. Note, 6.25%, 3/15/2023 | 234,068 | |
| 225,000 | Oasis Petroleum, Inc., 6.875%, 1/15/2023 | 230,906 | |
| 475,000 | Oasis Petroleum, Inc., Company Guarantee, 6.50%, 11/1/2021 | 486,281 | |
| 175,000 | PDC Energy, Inc., Sr. Unsecd. Note, 6.125%, 9/15/2024 | 182,000 | |
| 225,000 | PDC Energy, Inc., Sr. Unsecd. Note, Series 144A, 5.75%, 5/15/2026 | 230,906 | |
| 100,000 | Parsley Energy LLC/Parsley Finance Corp., Series 144A, 6.25%, 6/1/2024 | 105,750 | |
| 125,000 | Parsley Energy LLC/Parsley Finance Corp., Sr. Unsecd. Note, Series 144A, 5.25%, 8/15/2025 | 125,938 | |
| 125,000 | Parsley Energy LLC/Parsley Finance Corp., Sr. Unsecd. Note, Series 144A, 5.375%, 1/15/2025 | 126,875 | |
| 375,000 | Parsley Energy LLC/Parsley Finance Corp., Sr. Unsecd. Note, Series 144A, 5.625%, 10/15/2027 | 384,375 | |
| 200,000 | QEP Resources, Inc., Sr. Unsecd. Note, 5.25%, 5/1/2023 | 203,372 | |
| 200,000 | QEP Resources, Inc., Sr. Unsecd. Note, 5.625%, 3/1/2026 | 203,500 | |
| 250,000 | RSP Permian, Inc., Sr. Unsecd. Note, 5.25%, 1/15/2025 | 257,500 | |
| 200,000 | RSP Permian, Inc., Sr. Unsecd. Note, 6.625%, 10/1/2022 | 210,250 | |
| 425,000 | Range Resources Corp., Sr. Unsecd. Note, 4.875%, 5/15/2025 | 412,250 | |
| 150,000 | Range Resources Corp., Sr. Unsecd. Note, 5.00%, 8/15/2022 | 150,000 | |
| 50,000 | Range Resources Corp., Sr. Unsecd. Note, 5.00%, 3/15/2023 | 50,000 | |
| 250,000 | SM Energy Co., Sr. Unsecd. Note, 5.00%, 1/15/2024 | 242,344 | |
| 150,000 | SM Energy Co., Sr. Unsecd. Note, 5.625%, 6/1/2025 | 146,250 | |
| 50,000 | SM Energy Co., Sr. Unsecd. Note, 6.50%, 1/1/2023 | 51,250 | |
| 175,000 | SM Energy Co., Sr. Unsecd. Note, 6.75%, 9/15/2026 | 181,125 |
| Principal Amount | Value | ||
| CORPORATE BONDS—continued | |||
| Independent Energy—continued | |||
| $425,000 | SRC Energy, Inc., Sr. Unsecd. Note, Series 144A, 6.25%, 12/1/2025 | $436,687 | |
| 325,000 | Southwestern Energy Co., Sr. Unsecd. Note, 4.10%, 3/15/2022 | 320,938 | |
| 100,000 | Southwestern Energy Co., Sr. Unsecd. Note, 7.50%, 4/1/2026 | 106,375 | |
| 525,000 | Southwestern Energy Co., Sr. Unsecd. Note, 7.75%, 10/1/2027 | 561,094 | |
| 125,000 | Ultra Resources, Inc., Sr. Unsecd. Note, Series 144A, 6.875%, 4/15/2022 | 125,781 | |
| 375,000 | Ultra Resources, Inc., Sr. Unsecd. Note, Series 144A, 7.125%, 4/15/2025 | 375,469 | |
| 375,000 | WPX Energy, Inc., Sr. Unsecd. Note, 5.25%, 9/15/2024 | 375,581 | |
| 125,000 | WPX Energy, Inc., Sr. Unsecd. Note, 6.00%, 1/15/2022 | 131,250 | |
| 150,000 | WPX Energy, Inc., Sr. Unsecd. Note, 8.25%, 8/1/2023 | 171,000 | |
| 475,000 | Whiting Petroleum Corp., Sr. Unsecd. Note, 6.25%, 4/1/2023 | 488,062 | |
| 150,000 | Whiting Petroleum Corp., Sr. Unsecd. Note, Series 144A, 6.625%, 1/15/2026 | 153,188 | |
| TOTAL | 14,155,078 | ||
| Industrial - Other—1.2% | |||
| 275,000 | Anixter, Inc., 5.50%, 3/1/2023 | 297,083 | |
| 900,000 | Belden, Inc., Sr. Sub., Series 144A, 5.25%, 7/15/2024 | 931,500 | |
| 1,125,000 | Hillman Group, Inc., Unsecd. Note, Series 144A, 6.375%, 7/15/2022 | 1,127,812 | |
| 450,000 | KAR Auction Services, Inc., Sr. Unsecd. Note, Series 144A, 5.125%, 6/1/2025 | 462,375 | |
| TOTAL | 2,818,770 | ||
| Insurance - P&C—2.4% | |||
| 575,000 | Acrisure LLC, Sr. Unsecd. Note, Series 144A, 7.00%, 11/15/2025 | 555,600 | |
| 725,000 | AssuredPartners, Inc., Sr. Unsecd. Note, Series 144A, 7.00%, 8/15/2025 | 723,188 | |
| 400,000 | Hub Holdings LLC/Hub Hol, Sr. Unsecd. Note, Series 144A, 8.125%, 7/15/2019 | 401,000 | |
| 1,725,000 | Hub International Ltd., Sr. Unsecd. Note, Series 144A, 7.875%, 10/1/2021 | 1,798,312 | |
| 650,000 | Kirs Midco 3 PLC, Sec. Fac. Bond, Series 144A, 8.625%, 7/15/2023 | 676,000 | |
| 750,000 | NFP Corp., Sr. Unsecd. Note, Series 144A, 6.875%, 7/15/2025 | 757,500 | |
| 825,000 | USIS Merger Sub, Inc., Sr. Unsecd. Note, Series 144A, 6.875%, 5/1/2025 | 835,312 | |
| TOTAL | 5,746,912 | ||
| Leisure—1.0% | |||
| 275,000 | AMC Entertainment Holdings, Inc., Sr. Sub. Note, 5.875%, 11/15/2026 | 272,250 | |
| 50,000 | AMC Entertainment Holdings, Inc., Sr. Sub. Note, 6.125%, 5/15/2027 | 49,875 | |
| 250,000 | Cedar Fair LP/Canada's Wonderland Co./Magnum Management Corp./Millennium Op, Sr. Unsecd. Note, Series 144A, 5.375%, 4/15/2027 | 263,125 | |
| 175,000 | Live Nation Entertainment, Inc., Sr. Unsecd. Note, Series 144A, 4.875%, 11/1/2024 | 179,813 | |
| 350,000 | Regal Cinemas, Inc., 5.75%, 2/1/2025 | 360,500 | |
| 275,000 | Six Flags Entertainment Corp., Sr. Unsecd. Note, Series 144A, 4.875%, 7/31/2024 | 279,813 | |
| 1,025,000 | Six Flags Entertainment Corp., Sr. Unsecd. Note, Series 144A, 5.50%, 4/15/2027 | 1,063,437 | |
| TOTAL | 2,468,813 | ||
| Lodging—0.2% | |||
| 375,000 | Hilton Worldwide Finance LLC, Sr. Unsecd. Note, 4.625%, 4/1/2025 | 386,250 | |
| 150,000 | RHP Hotel Property/RHP Finance Corp., Sr. Unsecd. Note, 5.00%, 4/15/2023 | 154,125 | |
| TOTAL | 540,375 | ||
| Media Entertainment—5.6% | |||
| 275,000 | AMC Networks, Inc., Sr. Unsecd. Note, 4.75%, 8/1/2025 | 273,281 | |
| 700,000 | AMC Networks, Inc., Sr. Unsecd. Note, 5.00%, 4/1/2024 | 710,500 | |
| 475,000 | CBS Radio, Inc., Sr. Unsecd. Note, Series 144A, 7.25%, 11/1/2024 | 503,203 | |
| 750,000 | Clear Channel Communications, Inc., Company Guarantee, 9.00%, 3/1/2021 | 540,000 | |
| 275,000 | Clear Channel Worldwide, Series A, 6.50%, 11/15/2022 | 279,125 | |
| 600,000 | Clear Channel Worldwide, Series B, 6.50%, 11/15/2022 | 612,750 | |
| 125,000 | E.W. Scripps Co., Sr. Unsecd. Note, Series 144A, 5.125%, 5/15/2025 | 124,688 | |
| 650,000 | EMI Music Publishing Group North America Holdings, Inc., Series 144A, 7.625%, 6/15/2024 | 716,625 |
| Principal Amount | Value | ||
| CORPORATE BONDS—continued | |||
| Media Entertainment—continued | |||
| $600,000 | Gannett Co., Inc., 6.375%, 10/15/2023 | $630,750 | |
| 100,000 | Gannett Co., Inc., Sr. Unsecd. Note, Series 144A, 5.50%, 9/15/2024 | 105,250 | |
| 375,000 | Gray Television, Inc., Sr. Unsecd. Note, Series 144A, 5.125%, 10/15/2024 | 375,000 | |
| 500,000 | Gray Television, Inc., Sr. Unsecd. Note, Series 144A, 5.875%, 7/15/2026 | 513,750 | |
| 1,050,000 | Lin Television Corp., Sr. Unsecd. Note, 5.875%, 11/15/2022 | 1,097,250 | |
| 200,000 | Match Group, Inc., Sr. Unsecd. Note, 6.375%, 6/1/2024 | 217,500 | |
| 325,000 | Match Group, Inc., Sr. Unsecd. Note, Series 144A, 5.00%, 12/15/2027 | 330,688 | |
| 650,000 | Nexstar Escrow Corp., Sr. Unsecd. Note, Series 144A, 5.625%, 8/1/2024 | 672,750 | |
| 900,000 | Nielsen Finance LLC/Nielsen Finance Co., Series 144A, 5.00%, 4/15/2022 | 928,125 | |
| 625,000 | Nielsen Finance LLC/Nielsen Finance Co., Sr. Unsecd. Note, Series 144A, 5.00%, 2/1/2025 | 650,000 | |
| 150,000 | Outfront Americas Capital LLC/Outfront Media Capital Corp., Sr. Unsecd. Note, 5.625%, 2/15/2024 | 159,188 | |
| 275,000 | Outfront Americas Capital LLC/Outfront Media Capital Corp., Sr. Unsecd. Note, 5.875%, 3/15/2025 | 291,844 | |
| 775,000 | Sinclair Television Group, Series 144A, 5.625%, 8/1/2024 | 801,156 | |
| 75,000 | Sinclair Television Group, Sr. Unsecd. Note, Series 144A, 5.125%, 2/15/2027 | 74,719 | |
| 675,000 | Sinclair Television Group, Sr. Unsecd. Note, Series 144A, 5.875%, 3/15/2026 | 704,531 | |
| 975,000 | Tribune Media Co., Sr. Unsecd. Note, 5.875%, 7/15/2022 | 1,006,687 | |
| 500,000 | Urban One, Inc., Series 144A, 7.375%, 4/15/2022 | 501,250 | |
| 550,000 | Urban One, Inc., Series 144A, 9.25%, 2/15/2020 | 519,750 | |
| 150,000 | WMG Acquisition Corp., Sec. Fac. Bond, Series 144A, 4.875%, 11/1/2024 | 155,250 | |
| 75,000 | WMG Acquisition Corp., Series 144A, 5.00%, 8/1/2023 | 77,906 | |
| TOTAL | 13,573,516 | ||
| Metals & Mining—2.6% | |||
| 475,000 | Alliance Resource Operating Partners LP/Alliance Resource Finance Corp., Sr. Unsecd. Note, Series 144A, 7.50%, 5/1/2025 | 506,469 | |
| 550,000 | Coeur Mining, Inc., Sr. Unsecd. Note, 5.875%, 6/1/2024 | 545,187 | |
| 775,000 | Freeport-McMoRan, Inc., Sr. Unsecd. Note, 3.875%, 3/15/2023 | 775,000 | |
| 1,150,000 | Freeport-McMoRan, Inc., Sr. Unsecd. Note, 5.40%, 11/14/2034 | 1,175,875 | |
| 175,000 | HudBay Minerals, Inc., Sr. Unsecd. Note, Series 144A, 7.25%, 1/15/2023 | 186,375 | |
| 325,000 | HudBay Minerals, Inc., Sr. Unsecd. Note, Series 144A, 7.625%, 1/15/2025 | 357,500 | |
| 100,000 | Peabody Securities Finance Corp., Sec. Fac. Bond, Series 144A, 6.00%, 3/31/2022 | 104,125 | |
| 450,000 | Peabody Securities Finance Corp., Sec. Fac. Bond, Series 144A, 6.375%, 3/31/2025 | 469,687 | |
| 100,000 | Steel Dynamics, Inc., Sr. Unsecd. Note, 5.25%, 4/15/2023 | 103,500 | |
| 875,000 | Steel Dynamics, Inc., Sr. Unsecd. Note, 5.50%, 10/1/2024 | 931,875 | |
| 275,000 | Teck Resources Ltd., Sr. Unsecd. Note, 6.00%, 8/15/2040 | 307,313 | |
| 450,000 | Teck Resources Ltd., Sr. Unsecd. Note, 6.125%, 10/1/2035 | 506,250 | |
| 50,000 | Teck Resources Ltd., Sr. Unsecd. Note, 6.25%, 7/15/2041 | 57,500 | |
| 300,000 | Teck Resources Ltd., Sr. Unsecd. Note, Series 144A, 8.50%, 6/1/2024 | 339,750 | |
| TOTAL | 6,366,406 | ||
| Midstream—5.7% | |||
| 100,000 | Access Midstream Partners LP, Sr. Unsecd. Note, 4.875%, 3/15/2024 | 104,750 | |
| 350,000 | AmeriGas Partners LP, Sr. Unsecd. Note, 5.50%, 5/20/2025 | 355,250 | |
| 125,000 | AmeriGas Partners LP, Sr. Unsecd. Note, 5.625%, 5/20/2024 | 130,625 | |
| 525,000 | AmeriGas Partners LP, Sr. Unsecd. Note, 5.75%, 5/20/2027 | 532,875 | |
| 550,000 | AmeriGas Partners LP, Sr. Unsecd. Note, 5.875%, 8/20/2026 | 569,250 | |
| 550,000 | Antero Midstream Partners LP, Sr. Unsecd. Note, 5.375%, 9/15/2024 | 569,250 | |
| 500,000 | Atlas Pipeline Partners LP, 5.875%, 8/1/2023 | 503,750 | |
| 150,000 | Cheniere Corpus Christi Holdings LLC, 5.125%, 6/30/2027 | 155,535 | |
| 600,000 | Cheniere Corpus Christi Holdings LLC, Sr. Secd. Note, 5.875%, 3/31/2025 | 651,375 | |
| 375,000 | Cheniere Corpus Christi Holdings LLC, Sr. Secd. Note, 7.00%, 6/30/2024 | 427,500 | |
| 875,000 | Cheniere Energy Partners, LP, Sr. Unsecd. Note, Series 144A, 5.25%, 10/1/2025 | 892,500 | |
| 1,075,000 | Energy Transfer Equity LP, 5.875%, 1/15/2024 | 1,134,125 |
| Principal Amount | Value | ||
| CORPORATE BONDS—continued | |||
| Midstream—continued | |||
| $300,000 | Ferrellgas LP/Ferrellgas Finance Corp., Sr. Unsecd. Note, 6.75%, 6/15/2023 | $276,750 | |
| 500,000 | Ferrellgas, L.P., Sr. Unsecd. Note, 6.50%, 5/1/2021 | 470,625 | |
| 825,000 | Ferrellgas, L.P., Sr. Unsecd. Note, 6.75%, 1/15/2022 | 767,250 | |
| 750,000 | Holly Energy Partners LP, Series 144A, 6.00%, 8/1/2024 | 785,625 | |
| 75,000 | NGPL PipeCo LLC, Sr. Unsecd. Note, Series 144A, 4.875%, 8/15/2027 | 78,094 | |
| 650,000 | NuStar Logistics, L.P., Sr. Unsecd. Note, 5.625%, 4/28/2027 | 663,000 | |
| 550,000 | Suburban Propane Partners LP, 5.50%, 6/1/2024 | 547,250 | |
| 275,000 | Suburban Propane Partners LP, Sr. Unsecd. Note, 5.75%, 3/1/2025 | 272,938 | |
| 550,000 | Suburban Propane Partners LP, Sr. Unsecd. Note, 5.875%, 3/1/2027 | 540,375 | |
| 925,000 | Summit Midstream Holdings LLC, 5.50%, 8/15/2022 | 929,625 | |
| 475,000 | Summit Midstream Holdings LLC, Sr. Unsecd. Note, 5.75%, 4/15/2025 | 481,360 | |
| 350,000 | Targa Resources Partners LP/Targa Resources Partners Finance Corp., Sr. Unsecd. Note, Series 144A, 5.00%, 1/15/2028 | 350,437 | |
| 125,000 | Targa Resources Partners LP/Targa Resources Partners Finance Corp., Sr. Unsecd. Note, Series 144A, 5.125%, 2/1/2025 | 128,438 | |
| 375,000 | Targa Resources Partners LP/Targa Resources Partners Finance Corp., Sr. Unsecd. Note, Series 144A, 5.375%, 2/1/2027 | 386,250 | |
| 175,000 | Tesoro Logistics LP, Sr. Unsecd. Note, 5.25%, 1/15/2025 | 184,266 | |
| 177,000 | Tesoro Logistics LP, Sr. Unsecd. Note, 6.25%, 10/15/2022 | 188,013 | |
| 325,000 | Tesoro Logistics LP, Sr. Unsecd. Note, 6.375%, 5/1/2024 | 353,031 | |
| 275,000 | Williams Cos., Inc., Sr. Unsecd. Note, 4.55%, 6/24/2024 | 286,687 | |
| TOTAL | 13,716,799 | ||
| Oil Field Services—0.9% | |||
| 136,000 | Precision Drilling Corp., Sr. Unsecd. Note, 6.50%, 12/15/2021 | 139,230 | |
| 250,000 | Precision Drilling Corp., Sr. Unsecd. Note, 7.75%, 12/15/2023 | 263,750 | |
| 200,000 | Precision Drilling Corp., Sr. Unsecd. Note, Series 144A, 7.125%, 1/15/2026 | 204,500 | |
| 75,000 | Sesi LLC, 7.125%, 12/15/2021 | 76,969 | |
| 650,000 | Sesi LLC, Sr. Unsecd. Note, Series 144A, 7.75%, 9/15/2024 | 692,250 | |
| 350,000 | Weatherford International Ltd., 7.00%, 3/15/2038 | 295,750 | |
| 475,000 | Weatherford International Ltd., Sr. Unsecd. Note, 8.25%, 6/15/2023 | 480,937 | |
| 150,000 | Weatherford International, Inc., Sr. Unsecd. Note, 6.80%, 6/15/2037 | 125,250 | |
| TOTAL | 2,278,636 | ||
| Packaging—6.3% | |||
| 475,000 | ARD Finance SA, Sec. Fac. Bond, 7.125%, 9/15/2023 | 497,563 | |
| 300,000 | Ardagh Packaging Finance PLC/Ardagh Holdings, Sr. Unsecd. Note, Series 144A, 6.00%, 6/30/2021 | 309,000 | |
| 750,000 | Ardagh Packaging Finance PLC/Ardagh Holdings, Sr. Unsecd. Note, Series 144A, 6.00%, 2/15/2025 | 791,250 | |
| 1,350,000 | Ardagh Packaging Finance PLC/Ardagh Holdings, Sr. Unsecd. Note, Series 144A, 7.25%, 5/15/2024 | 1,474,875 | |
| 850,000 | Berry Plastics Corp., 5.125%, 7/15/2023 | 887,187 | |
| 750,000 | Berry Plastics Corp., 5.50%, 5/15/2022 | 773,438 | |
| 150,000 | Berry Plastics Corp., 6.00%, 10/15/2022 | 157,688 | |
| 675,000 | Bway Holding Co., Sec. Fac. Bond, Series 144A, 5.50%, 4/15/2024 | 703,688 | |
| 1,475,000 | Bway Holding Co., Sr. Unsecd. Note, Series 144A, 7.25%, 4/15/2025 | 1,526,625 | |
| 1,425,000 | Flex Acquisition Co., Inc., Sr. Unsecd. Note, Series 144A, 6.875%, 1/15/2025 | 1,478,402 | |
| 950,000 | Multi-Color Corp., Series 144A, 6.125%, 12/1/2022 | 996,312 | |
| 125,000 | Multi-Color Corp., Sr. Unsecd. Note, Series 144A, 4.875%, 11/1/2025 | 125,781 | |
| 750,000 | Owens-Brockway Glass Container, Inc., Series 144A, 5.375%, 1/15/2025 | 794,062 | |
| 200,000 | Owens-Brockway Glass Container, Inc., Series 144A, 6.375%, 8/15/2025 | 223,875 | |
| 823,742 | Reynolds Group Issuer, Inc./LLC/LU, 5.75%, 10/15/2020 | 837,127 | |
| 625,000 | Reynolds Group Issuer, Inc./LLC/LU, Series 144A, 7.00%, 7/15/2024 | 670,547 | |
| 300,000 | Reynolds Group, Sr. Unsecd. Note, 7.95%, 12/15/2025 | 341,250 | |
| 525,000 | Sealed Air Corp., Series 144A, 5.25%, 4/1/2023 | 561,750 | |
| 250,000 | Sealed Air Corp., Sr. Unsecd. Note, Series 144A, 5.125%, 12/1/2024 | 268,750 | |
| 1,250,000 | Signode Industrial Group, Series 144A, 6.375%, 5/1/2022 | 1,310,937 |
| Principal Amount | Value | ||
| CORPORATE BONDS—continued | |||
| Packaging—continued | |||
| $500,000 | Trident Merger Sub, Inc., Sr. Unsecd. Note, Series 144A, 6.625%, 11/1/2025 | $500,000 | |
| TOTAL | 15,230,107 | ||
| Paper—0.5% | |||
| 250,000 | Clearwater Paper Corp., Sr. Note, 4.50%, 2/1/2023 | 248,438 | |
| 825,000 | Clearwater Paper Corp., Sr. Unsecd. Note, Series 144A, 5.375%, 2/1/2025 | 833,250 | |
| TOTAL | 1,081,688 | ||
| Pharmaceuticals—3.9% | |||
| 325,000 | Eagle Holding Co., Sr. Unsecd. Note, Series 144A, 7.625%, 5/15/2022 | 331,500 | |
| 875,000 | Endo Dac/Endo Finance LLC/Endo Finco, Inc., Sr. Unsecd. Note, Series 144A, 6.00%, 7/15/2023 | 691,250 | |
| 600,000 | Endo Finance LLC/Endo Finco, Inc., Sr. Unsecd. Note, Series 144A, 6.00%, 2/1/2025 | 468,000 | |
| 1,825,000 | Jaguar Holding Co. II/Pharmaceutical Product Development LLC, Sr. Unsecd. Note, Series 144A, 6.375%, 8/1/2023 | 1,847,812 | |
| 1,125,000 | Mallinckrodt International Finance SA/Mallinckrodt CB LLC, Sr. Unsecd. Note, 4.75%, 4/15/2023 | 888,750 | |
| 675,000 | Mallinckrodt International Finance SA/Mallinckrodt CB LLC, Sr. Unsecd. Note, Series 144A, 5.50%, 4/15/2025 | 553,500 | |
| 225,000 | Mallinckrodt International Finance SA/Mallinckrodt CB LLC, Sr. Unsecd. Note, Series 144A, 5.625%, 10/15/2023 | 192,375 | |
| 200,000 | Valeant Pharmaceuticals International, Inc., Sec. Fac. Bond, Series 144A, 5.50%, 11/1/2025 | 204,500 | |
| 300,000 | Valeant Pharmaceuticals International, Inc., Series 144A, 5.625%, 12/1/2021 | 294,375 | |
| 375,000 | Valeant Pharmaceuticals International, Inc., Series 144A, 7.50%, 7/15/2021 | 382,969 | |
| 100,000 | Valeant Pharmaceuticals International, Inc., Sr. Secd. Note, Series 144A, 6.50%, 3/15/2022 | 105,250 | |
| 275,000 | Valeant Pharmaceuticals International, Inc., Sr. Secd. Note, Series 144A, 7.00%, 3/15/2024 | 294,938 | |
| 425,000 | Valeant Pharmaceuticals International, Inc., Sr. Unsecd. Note, Series 144A, 5.50%, 3/1/2023 | 391,000 | |
| 1,425,000 | Valeant Pharmaceuticals International, Inc., Sr. Unsecd. Note, Series 144A, 6.125%, 4/15/2025 | 1,309,219 | |
| 375,000 | Valeant Pharmaceuticals International, Inc., Sr. Unsecd. Note, Series 144A, 9.00%, 12/15/2025 | 391,762 | |
| 1,150,000 | Vrx Escrow Corp., Series 144A, 5.875%, 5/15/2023 | 1,068,062 | |
| TOTAL | 9,415,262 | ||
| Refining—0.4% | |||
| 975,000 | CVR Refining LLC/Coffeyville Finance, Inc., 6.50%, 11/1/2022 | 1,009,125 | |
| Restaurants—0.9% | |||
| 1,050,000 | 1011778 BC Unltd. Liability Co./New Red Finance, Inc., Series 144A, 5.00%, 10/15/2025 | 1,063,125 | |
| 125,000 | 1011778 BC Unltd. Liability Co./New Red Finance, Inc., Sr. Secd. Note, Series 144A, 4.25%, 5/15/2024 | 125,000 | |
| 150,000 | KFC Holding Co./Pizza Hut Holdings LLC/Taco Bell of America LLC, Sr. Unsecd. Note, Series 144A, 4.75%, 6/1/2027 | 153,750 | |
| 125,000 | Performance Food Group, Inc., Series 144A, 5.50%, 6/1/2024 | 129,375 | |
| 250,000 | Yum! Brands, Inc., Sr. Unsecd. Note, Series 144A, 5.00%, 6/1/2024 | 258,438 | |
| 500,000 | Yum! Brands, Inc., Sr. Unsecd. Note, Series 144A, 5.25%, 6/1/2026 | 527,500 | |
| TOTAL | 2,257,188 | ||
| Retailers—1.3% | |||
| 1,250,000 | Argos Merger Sub, Inc., Sr. Unsecd. Note, Series 144A, 7.125%, 3/15/2023 | 746,875 | |
| 350,000 | Hanesbrands, Inc., Sr. Unsecd. Note, Series 144A, 4.875%, 5/15/2026 | 360,500 | |
| 725,000 | Party City Holdings, Inc., Sr. Unsecd. Note, Series 144A, 6.125%, 8/15/2023 | 752,187 | |
| 275,000 | PetSmart, Inc., Sr. Unsecd. Note, Series 144A, 8.875%, 6/1/2025 | 167,063 | |
| 625,000 | Rite Aid Corp., Sr. Unsecd. Note, Series 144A, 6.125%, 4/1/2023 | 566,406 | |
| 625,000 | Sally Holdings LLC/Sally Capital, Inc., 5.625%, 12/1/2025 | 625,000 | |
| TOTAL | 3,218,031 | ||
| Supermarkets—0.5% | |||
| 550,000 | Albertsons Cos. LLC/SAFEW, Sr. Unsecd. Note, 5.75%, 3/15/2025 | 499,125 | |
| 625,000 | Albertsons Cos. LLC/SAFEW, Sr. Unsecd. Note, 6.625%, 6/15/2024 | 600,000 | |
| TOTAL | 1,099,125 | ||
| Technology—9.5% | |||
| 1,150,000 | BMC Software, Inc., Series 144A, 8.125%, 7/15/2021 | 1,162,937 | |
| 50,000 | CDW LLC/CDW Finance, Sr. Unsecd. Note, 5.00%, 9/1/2025 | 52,000 | |
| 800,000 | CDW LLC/CDW Finance, Sr. Unsecd. Note, 5.50%, 12/1/2024 | 874,000 |
| Principal Amount | Value | ||
| CORPORATE BONDS—continued | |||
| Technology—continued | |||
| $725,000 | CommScope Technologies Finance LLC, Series 144A, 6.00%, 6/15/2025 | $773,937 | |
| 175,000 | Diamond 1 Finance Corp./Diamond 2 Finance Corp., Sr. Secd. Note, Series 144A, 5.875%, 6/15/2021 | 182,000 | |
| 800,000 | Diamond 1 Finance Corp./Diamond 2 Finance Corp., Sr. Unsecd. Note, Series 144A, 7.125%, 6/15/2024 | 876,194 | |
| 1,050,000 | Ensemble S Merger Sub, Inc., Sr. Unsecd. Note, Series 144A, 9.00%, 9/30/2023 | 1,115,625 | |
| 100,000 | First Data Corp., Series 144A, 5.00%, 1/15/2024 | 103,250 | |
| 550,000 | First Data Corp., Series 144A, 5.375%, 8/15/2023 | 573,870 | |
| 1,850,000 | First Data Corp., Series 144A, 5.75%, 1/15/2024 | 1,928,162 | |
| 475,000 | First Data Corp., Sr. Unsecd. Note, Series 144A, 7.00%, 12/1/2023 | 503,500 | |
| 250,000 | Gartner, Inc., Sr. Unsecd. Note, Series 144A, 5.125%, 4/1/2025 | 261,875 | |
| 1,175,000 | Inception Merger Sub, Inc., Sr. Unsecd. Note, Series 144A, 8.625%, 11/15/2024 | 1,257,250 | |
| 1,300,000 | Infor Software Parent, Inc., Series 144A, 7.125%, 5/1/2021 | 1,335,750 | |
| 1,300,000 | Infor US, Inc., 6.50%, 5/15/2022 | 1,352,000 | |
| 825,000 | Italics Merger Sub, Inc., Sr. Unsecd. Note, Series 144A, 7.125%, 7/15/2023 | 847,687 | |
| 850,000 | JDA Escrow LLC/JDA Bond Finance, Inc., Series 144A, 7.375%, 10/15/2024 | 892,500 | |
| 450,000 | MSCI, Inc., Series 144A, 5.75%, 8/15/2025 | 485,438 | |
| 50,000 | Micron Technology, Inc., Sr. Unsecd. Note, Series 144A, 5.25%, 1/15/2024 | 52,188 | |
| 475,000 | NCR Corp., 6.375%, 12/15/2023 | 498,750 | |
| 475,000 | NCR Corp., Sr. Unsecd. Note, 5.00%, 7/15/2022 | 485,687 | |
| 175,000 | NCR Corp., Sr. Unsecd. Note, 5.875%, 12/15/2021 | 180,031 | |
| 375,000 | Nuance Communications, Inc., Series 144A, 5.375%, 8/15/2020 | 381,094 | |
| 825,000 | Nuance Communications, Inc., Sr. Unsecd. Note, 5.625%, 12/15/2026 | 863,156 | |
| 150,000 | Qorvo, Inc., Sr. Unsecd. Note, 7.00%, 12/1/2025 | 168,188 | |
| 850,000 | Riverbed Technology, Inc., Sr. Unsecd. Note, Series 144A, 8.875%, 3/1/2023 | 805,375 | |
| 450,000 | SS&C Technologies Holdings, Inc., 5.875%, 7/15/2023 | 477,000 | |
| 375,000 | Sabre GLBL, Inc., Series 144A, 5.375%, 4/15/2023 | 388,125 | |
| 225,000 | Sensata Technologies B.V., Series 144A, 5.625%, 11/1/2024 | 248,063 | |
| 225,000 | Sensata Technologies UK Financing Co. PLC, Sr. Unsecd. Note, Series 144A, 6.25%, 2/15/2026 | 245,813 | |
| 1,125,000 | Solera LLC/Solera Finance, Inc., Series 144A, 10.50%, 3/1/2024 | 1,271,227 | |
| 225,000 | Symantec Corp., Sr. Unsecd. Note, Series 144A, 5.00%, 4/15/2025 | 234,563 | |
| 500,000 | TTM Technologies, Sr. Unsecd. Note, Series 144A, 5.625%, 10/1/2025 | 513,750 | |
| 1,100,000 | Tempo Acquisition LLC, Sr. Unsecd. Note, Series 144A, 6.75%, 6/1/2025 | 1,122,000 | |
| 200,000 | Vantiv LLC, Sr. Unsecd. Note, Series 144A, 4.375%, 11/15/2025 | 203,036 | |
| 350,000 | Verisign, Inc., Sr. Unsecd. Note, 4.75%, 7/15/2027 | 359,625 | |
| TOTAL | 23,075,646 | ||
| Transportation Services—0.6% | |||
| 75,000 | Avis Budget Group, Inc., Sr. Unsecd. Note, Series 144A, 5.25%, 3/15/2025 | 74,531 | |
| 675,000 | Avis Budget Group, Inc., Sr. Unsecd. Note, Series 144A, 6.375%, 4/1/2024 | 705,578 | |
| 300,000 | HDTFS, Inc., 6.25%, 10/15/2022 | 291,000 | |
| 350,000 | Hertz Corp., Series 144A, 7.625%, 6/1/2022 | 367,500 | |
| 100,000 | Hertz Corp., Sr. Unsecd. Note, Series 144A, 5.50%, 10/15/2024 | 90,750 | |
| TOTAL | 1,529,359 | ||
| Utility - Electric—2.1% | |||
| 1,450,000 | Calpine Corp., 5.75%, 1/15/2025 | 1,382,937 | |
| 150,000 | Calpine Corp., Series 144A, 5.25%, 6/1/2026 | 147,564 | |
| 825,000 | Enviva Partners LP/Enviva Partners Finance Corp., Sr. Unsecd. Note, 8.50%, 11/1/2021 | 881,719 | |
| 650,000 | NRG Energy, Inc., 6.25%, 5/1/2024 | 684,125 | |
| 525,000 | NRG Energy, Inc., Sr. Unsecd. Note, 6.625%, 1/15/2027 | 557,812 | |
| 375,000 | NRG Energy, Inc., Sr. Unsecd. Note, 7.25%, 5/15/2026 | 410,153 | |
| 50,000 | NRG Energy, Inc., Sr. Unsecd. Note, Series 144A, 5.75%, 1/15/2028 | 50,625 | |
| 50,000 | TerraForm Power Operating LLC, Sr. Unsecd. Note, Series 144A, 4.25%, 1/31/2023 | 49,688 |
| Principal Amount | Value | ||
| CORPORATE BONDS—continued | |||
| Utility - Electric—continued | |||
| $775,000 | TerraForm Power Operating LLC, Sr. Unsecd. Note, Series 144A, 5.00%, 1/31/2028 | $768,219 | |
| 200,000 | TerraForm Power Operating LLC, Sr. Unsecd. Note, Series 144A, 6.625%, 6/15/2025 | 218,750 | |
| TOTAL | 5,151,592 | ||
| Wireless Communications—4.2% | |||
| 225,000 | Altice Luxembourg SA, Series 144A, 7.75%, 5/15/2022 | 220,781 | |
| 975,000 | Altice Luxembourg SA, Sr. Unsecd. Note, Series 144A, 7.625%, 2/15/2025 | 937,219 | |
| 275,000 | Digicel Ltd., Sr. Unsecd. Note, Series 144A, 8.25%, 9/30/2020 | 271,233 | |
| 225,000 | MetroPCS Wireless, Inc., 6.125%, 1/15/2022 | 232,650 | |
| 825,000 | MetroPCS Wireless, Inc., Sr. Note, 6.836%, 4/28/2023 | 866,250 | |
| 1,875,000 | Numericable-SFR SAS, Series 144A, 7.375%, 5/1/2026 | 1,938,281 | |
| 525,000 | Sprint Capital Corp., Company Guarantee, 6.875%, 11/15/2028 | 529,594 | |
| 925,000 | Sprint Corp., 7.125%, 6/15/2024 | 943,500 | |
| 1,350,000 | Sprint Corp., 7.875%, 9/15/2023 | 1,441,125 | |
| 475,000 | Sprint Corp., Sr. Unsecd. Note, 7.625%, 2/15/2025 | 498,750 | |
| 725,000 | Sprint Nextel Corp., Sr. Unsecd. Note, 6.00%, 11/15/2022 | 726,812 | |
| 375,000 | T-Mobile USA, Inc., 6.625%, 4/1/2023 | 391,875 | |
| 275,000 | T-Mobile USA, Inc., Sr. Unsecd. Note, 6.00%, 3/1/2023 | 288,612 | |
| 225,000 | T-Mobile USA, Inc., Sr. Unsecd. Note, 6.375%, 3/1/2025 | 241,313 | |
| 375,000 | T-Mobile USA, Inc., Sr. Unsecd. Note, 6.50%, 1/15/2024 | 398,437 | |
| 325,000 | T-Mobile USA, Inc., Sr. Unsecd. Note, 6.50%, 1/15/2026 | 355,469 | |
| TOTAL | 10,281,901 | ||
| TOTAL CORPORATE BONDS (IDENTIFIED COST $228,349,278) | 231,858,514 | ||
| REPURCHASE AGREEMENT—2.9% | |||
| Finance - Banking—2.9% | |||
| 7,045,000 | Interest in $950,000,000 joint repurchase agreement 1.42%, dated 12/29/2017 under which Bank of America, N.A. will repurchase securities provided as collateral for $950,149,889 on 1/2/2018. The securities provided as collateral at the end of the period held with BNY Mellon as tri-party agent, were U.S. Government Agency securities maturing on 7/20/2046 and the market value of those underlying securities was $969,152,887. (IDENTIFIED COST $7,045,000) | 7,045,000 | |
| TOTAL INVESTMENT IN SECURITIES—98.5% (IDENTIFIED COST $235,394,278)1 | 238,903,514 | ||
| OTHER ASSETS AND LIABILITIES - NET—1.5%2 | 3,574,932 | ||
| TOTAL NET ASSETS—100% | $242,478,446 |
| 1 | The cost of investments for federal tax purposes amounts to $235,607,473. |
| 2 | Assets, other than investments in securities, less liabilities. See Statement of Assets and Liabilities. |
| MTN | —Medium Term Note |
| Year Ended December 31 | 2017 | 2016 | 2015 | 2014 | 2013 |
| Net Asset Value, Beginning of Period | $6.84 | $6.36 | $6.91 | $7.15 | $7.17 |
| Income From Investment Operations: | |||||
| Net investment income1 | 0.36 | 0.37 | 0.37 | 0.39 | 0.44 |
| Net realized and unrealized gain (loss) on investments | 0.09 | 0.53 | (0.53) | (0.20) | 0.04 |
| TOTAL FROM INVESTMENT OPERATIONS | 0.45 | 0.90 | (0.16) | 0.19 | 0.48 |
| Less Distributions: | |||||
| Distributions from net investment income | (0.47) | (0.42) | (0.39) | (0.43) | (0.50) |
| Net Asset Value, End of Period | $6.82 | $6.84 | $6.36 | $6.91 | $7.15 |
| Total Return2 | 6.94% | 14.82% | (2.57)% | 2.69% | 6.99% |
| Ratios to Average Net Assets: | |||||
| Net expenses | 0.78% | 0.72% | 0.77% | 0.77% | 0.79% |
| Net investment income | 5.26% | 5.74% | 5.55% | 5.60% | 6.21% |
| Expense waiver/reimbursement3 | 0.00%4 | 0.06% | —% | —% | —% |
| Supplemental Data: | |||||
| Net assets, end of period (000 omitted) | $192,194 | $190,070 | $267,448 | $287,649 | $246,994 |
| Portfolio turnover | 32% | 26% | 33% | 33% | 32% |
| 1 | Per share numbers have been calculated using the average shares method. |
| 2 | Based on net asset value. Total returns do not reflect any additional fees or expenses that may be imposed by separate accounts of insurance companies or in connection with any variable annuity or variable life insurance contract. |
| 3 | This expense decrease is reflected in both the net expense and the net investment income ratios shown above. |
| 4 | Represents less than 0.01%. |
| Year Ended December 31 | 2017 | 2016 | 2015 | 2014 | 2013 |
| Net Asset Value, Beginning of Period | $6.81 | $6.33 | $6.87 | $7.11 | $7.13 |
| Income From Investment Operations: | |||||
| Net investment income1 | 0.34 | 0.35 | 0.35 | 0.38 | 0.42 |
| Net realized and unrealized gain (loss) on investments | 0.09 | 0.53 | (0.52) | (0.21) | 0.04 |
| TOTAL FROM INVESTMENT OPERATIONS | 0.43 | 0.88 | (0.17) | 0.17 | 0.46 |
| Less Distributions: | |||||
| Distributions from net investment income | (0.46) | (0.40) | (0.37) | (0.41) | (0.48) |
| Net Asset Value, End of Period | $6.78 | $6.81 | $6.33 | $6.87 | $7.11 |
| Total Return2 | 6.56% | 14.53% | (2.72)% | 2.42% | 6.73% |
| Ratios to Average Net Assets: | |||||
| Net expenses | 1.03% | 0.96% | 1.01% | 1.02% | 1.04% |
| Net investment income | 5.01% | 5.48% | 5.29% | 5.35% | 5.97% |
| Expense waiver/reimbursement3 | 0.00%4 | 0.08% | —% | —% | —% |
| Supplemental Data: | |||||
| Net assets, end of period (000 omitted) | $50,284 | $49,183 | $44,179 | $57,999 | $64,085 |
| Portfolio turnover | 32% | 26% | 33% | 33% | 32% |
| 1 | Per share numbers have been calculated using the average shares method. |
| 2 | Based on net asset value. Total returns do not reflect any additional fees or expenses that may be imposed by separate accounts of insurance companies or in connection with any variable annuity or variable life insurance contract. |
| 3 | This expense decrease is reflected in both the net expense and the net investment income ratios shown above. |
| 4 | Represents less than 0.01%. |
| Assets: | ||
| Investment in securities, at value (identified cost $235,394,278) | $238,903,514 | |
| Cash | 635 | |
| Income receivable | 3,749,874 | |
| Receivable for shares sold | 1,952 | |
| TOTAL ASSETS | 242,655,975 | |
| Liabilities: | ||
| Payable for shares redeemed | $56,566 | |
| Payable to adviser (Note 5) | 11,955 | |
| Payable for administrative fees (Note 5) | 1,598 | |
| Payable for custodian fees | 6,232 | |
| Payable for transfer agent fee | 4,294 | |
| Payable for portfolio accounting fees | 69,919 | |
| Payable for distribution services fee (Note 5) | 10,779 | |
| Payable for printing and postage | 10,779 | |
| Accrued expenses (Note 5) | 5,407 | |
| TOTAL LIABILITIES | 177,529 | |
| Net assets for 35,606,172 shares outstanding | $242,478,446 | |
| Net Assets Consist of: | ||
| Paid-in capital | $247,335,092 | |
| Net unrealized appreciation of investments | 3,509,236 | |
| Accumulated net realized loss on investments | (21,272,970) | |
| Undistributed net investment income | 12,907,088 | |
| TOTAL NET ASSETS | $242,478,446 | |
| Net Asset Value, Offering Price and Redemption Proceeds Per Share | ||
| Primary Shares: | ||
| Net asset value per share ($192,194,098 ÷ 28,192,824 shares outstanding), no par value, unlimited shares authorized | $6.82 | |
| Service Shares: | ||
| Net asset value per share ($50,284,348 ÷ 7,413,348 shares outstanding), no par value, unlimited shares authorized | $6.78 |
| Investment Income: | |||
| Interest | $14,766,039 | ||
| Expenses: | |||
| Investment adviser fee (Note 5) | $1,467,962 | ||
| Administrative fee (Note 5) | 193,681 | ||
| Custodian fees | 15,474 | ||
| Transfer agent fee | 22,835 | ||
| Directors'/Trustees' fees (Note 5) | 3,251 | ||
| Auditing fees | 31,740 | ||
| Legal fees | 8,583 | ||
| Portfolio accounting fees | 82,642 | ||
| Distribution services fee (Note 5) | 130,729 | ||
| Printing and postage | 57,301 | ||
| Miscellaneous (Note 5) | 25,152 | ||
| TOTAL EXPENSES | 2,039,350 | ||
| Reimbursement of other operating expenses (Note 2) | (8,594) | ||
| Net expenses | 2,030,756 | ||
| Net investment income | 12,735,283 | ||
| Realized and Unrealized Gain (Loss) on Investments: | |||
| Net realized gain on investments | 489,655 | ||
| Net change in unrealized appreciation of investments | 2,785,595 | ||
| Net realized and unrealized gain on investments | 3,275,250 | ||
| Change in net assets resulting from operations | $16,010,533 |
| Year Ended December 31 | 2017 | 2016 |
| Increase (Decrease) in Net Assets | ||
| Operations: | ||
| Net investment income | $12,735,283 | $15,607,561 |
| Net realized gain (loss) on investments | 489,655 | (8,204,574) |
| Net change in unrealized appreciation/depreciation of investments | 2,785,595 | 31,500,381 |
| CHANGE IN NET ASSETS RESULTING FROM OPERATIONS | 16,010,533 | 38,903,368 |
| Distributions to Shareholders: | ||
| Distributions from net investment income | ||
| Primary Shares | (12,712,214) | (17,147,041) |
| Service Shares | (3,340,067) | (2,684,113) |
| CHANGE IN NET ASSETS RESULTING FROM DISTRIBUTIONS TO SHAREHOLDERS | (16,052,281) | (19,831,154) |
| Share Transactions: | ||
| Proceeds from sale of shares | 50,852,267 | 49,995,887 |
| Net asset value of shares issued to shareholders in payment of distributions declared | 16,052,274 | 19,831,154 |
| Cost of shares redeemed | (63,637,069) | (161,273,539) |
| CHANGE IN NET ASSETS RESULTING FROM SHARE TRANSACTIONS | 3,267,472 | (91,446,498) |
| Change in net assets | 3,225,724 | (72,374,284) |
| Net Assets: | ||
| Beginning of period | 239,252,722 | 311,627,006 |
| End of period (including undistributed net investment income of $12,907,088 and $16,043,567, respectively) | $242,478,446 | $239,252,722 |
| ■ | Fixed-income securities are fair valued using price evaluations provided by a pricing service approved by the Fund's Board of Trustees (the “Trustees”). |
| ■ | Equity securities listed on an exchange or traded through a regulated market system are valued at their last reported sale price or official closing price in their principal exchange or market. |
| ■ | Shares of other mutual funds or non-exchange-traded investment companies are valued based upon their reported NAVs. |
| ■ | Derivative contracts listed on exchanges are valued at their reported settlement or closing price, except that options are valued at the mean of closing bid and asked quotations. |
| ■ | Over-the-counter (OTC) derivative contracts are fair valued using price evaluations provided by a pricing service approved by the Trustees. |
| ■ | For securities that are fair valued in accordance with procedures established by and under the general supervision of the Trustees, certain factors may be considered, such as: the last traded or purchase price of the security, information obtained by contacting the issuer or dealers, analysis of the issuer's financial statements or other available documents, fundamental analytical data, the nature and duration of restrictions on disposition, the movement of the market in which the security is normally traded, public trading in similar securities or derivative contracts of the issuer or comparable issuers, movement of a relevant index, or other factors including but not limited to industry changes and relevant government actions. |
| ■ | With respect to securities traded principally in foreign markets, significant trends in U.S. equity markets or in the trading of foreign securities index futures contracts; |
| ■ | Political or other developments affecting the economy or markets in which an issuer conducts its operations or its securities are traded; |
| ■ | Announcements concerning matters such as acquisitions, recapitalizations, litigation developments, or a natural disaster affecting the issuer's operations or regulatory changes or market developments affecting the issuer's industry. |
| Year Ended December 31 | 2017 | 2016 | ||
| Primary Shares: | Shares | Amount | Shares | Amount |
| Shares sold | 6,176,728 | $41,996,711 | 5,623,772 | $36,762,619 |
| Shares issued to shareholders in payment of distributions declared | 1,958,739 | 12,712,214 | 2,770,120 | 17,147,041 |
| Shares redeemed | (7,715,309) | (52,592,213) | (22,695,504) | (146,842,193) |
| NET CHANGE RESULTING FROM PRIMARY SHARE TRANSACTIONS | 420,158 | $2,116,712 | (14,301,612) | $(92,932,533) |
| Year Ended December 31 | 2017 | 2016 | ||
| Service Shares: | Shares | Amount | Shares | Amount |
| Shares sold | 1,313,486 | $8,855,556 | 2,046,961 | $13,233,268 |
| Shares issued to shareholders in payment of distributions declared | 516,238 | 3,340,060 | 435,026 | 2,684,113 |
| Shares redeemed | (1,636,129) | (11,044,856) | (2,247,018) | (14,431,346) |
| NET CHANGE RESULTING FROM SERVICE SHARE TRANSACTIONS | 193,595 | $1,150,760 | 234,969 | $1,486,035 |
| NET CHANGE RESULTING FROM TOTAL FUND SHARE TRANSACTIONS | 613,753 | $3,267,472 | (14,066,643) | $(91,446,498) |
| Increase (Decrease) | ||
| Paid-In Capital | Undistributed Net Investment Income (Loss) | Accumulated Net Realized Gain (Loss) |
| $(9,764,712) | $180,519 | $9,584,193 |
| 2017 | 2016 | |
| Ordinary income | $16,052,281 | $19,831,154 |
| Undistributed ordinary income | $12,952,328 |
| Net unrealized appreciation | $3,296,041 |
| Capital loss carryforwards | $(21,105,015) |
| Expiration Year | Short-Term | Long-Term | Total |
| No Expiration | $— | $12,171,611 | $12,171,611 |
| 2018 | $8,933,404 | NA | $8,933,404 |
| Administrative Fee | Average Daily Net Assets of the Investment Complex |
| 0.100% | on assets up to $50 billion |
| 0.075% | on assets over $50 billion |
| Administrative Fee | Average Daily Net Assets of the Investment Complex |
| 0.150% | on the first $5 billion |
| 0.125% | on the next $5 billion |
| 0.100% | on the next $10 billion |
| 0.075% | on assets in excess of $20 billion |
| Distribution Services Fees Incurred | |
| Service Shares | $130,729 |
| Purchases | $74,837,843 |
| Sales | $77,253,882 |
February 14, 2018
| Beginning Account Value 7/1/2017 | Ending Account Value 12/31/2017 | Expenses Paid During Period1 | |
| Actual: | |||
| Primary Shares | $1,000 | $1,017.90 | $3.87 |
| Service Shares | $1,000 | $1,016.50 | $5.13 |
| Hypothetical (assuming a 5% return before expenses): | |||
| Primary Shares | $1,000 | $1,021.40 | $3.87 |
| Service Shares | $1,000 | $1,020.10 | $5.14 |
| 1 | Expenses are equal to the Fund's annualized net expense ratios, multiplied by the average account value over the period, multiplied by 184/365 (to reflect the one-half-year period). The expenses shown in the table do not include the charges and expenses imposed by the insurance company under the variable insurance product contract. Please refer to the variable insurance product prospectus for a complete listing of these expenses. The annualized net expense ratios are as follows: |
| Primary Shares | 0.76% |
| Service Shares | 1.01% |
| Name Birth Date Positions Held with Trust Date Service Began | Principal Occupation(s) for Past Five Years, Other Directorships Held and Previous Position(s) |
| J. Christopher Donahue* Birth Date: April 11, 1949 Trustee Indefinite Term Began serving: September 1993 | Principal Occupations: Principal Executive Officer and President of certain of the Funds in the Federated Fund Family; Director or Trustee of the Funds in the Federated Fund Family; President, Chief Executive Officer and Director, Federated Investors, Inc.; Chairman and Trustee, Federated Investment Management Company; Trustee, Federated Investment Counseling; Chairman and Director, Federated Global Investment Management Corp.; Chairman and Trustee, Federated Equity Management Company of Pennsylvania; Trustee, Federated Shareholder Services Company; Director, Federated Services Company. Previous Positions: President, Federated Investment Counseling; President and Chief Executive Officer, Federated Investment Management Company, Federated Global Investment Management Corp. and Passport Research, Ltd; Chairman, Passport Research, Ltd. |
| Thomas R. Donahue* Birth Date: October 20, 1958 Trustee Indefinite Term Began serving: May 2016 | Principal Occupations: Director or Trustee of certain of the funds in the Federated Fund Family; Chief Financial Officer, Treasurer, Vice President and Assistant Secretary, Federated Investors, Inc.; Chairman and Trustee, Federated Administrative Services; Chairman and Director, Federated Administrative Services, Inc.; Trustee and Treasurer, Federated Advisory Services Company; Director or Trustee and Treasurer, Federated Equity Management Company of Pennsylvania, Federated Global Investment Management Corp., Federated Investment Counseling, and Federated Investment Management Company; Director, MDTA LLC; Director, Executive Vice President and Assistant Secretary, Federated Securities Corp.; Director or Trustee and Chairman, Federated Services Company and Federated Shareholder Services Company; and Director and President, FII Holdings, Inc. Previous Positions: Director, Federated Investors, Inc.; Assistant Secretary, Federated Investment Management Company, Federated Global Investment Management Company and Passport Research, LTD; Treasurer, Passport Research, LTD; Executive Vice President, Federated Securities Corp.; and Treasurer, FII Holdings, Inc. |
| * | Family relationships and reasons for “interested” status: J. Christopher Donahue and Thomas R. Donahue are brothers. Both are “interested” due to their beneficial ownership of shares of Federated Investors, Inc. and the positions they hold with Federated and its subsidiaries. |
| Name Birth Date Positions Held with Trust Date Service Began | Principal Occupation(s) for Past Five Years, Other Directorships Held, Previous Position(s) and Qualifications |
| John T. Collins Birth Date: January 24, 1947 Trustee Indefinite Term Began serving: October 2013 | Principal Occupations: Director or Trustee of the Federated Fund Family; formerly, Chairman and CEO, The Collins Group, Inc. (a private equity firm) (Retired). Other Directorships Held: Director, Current Chair of the Compensation Committee, KLX Corp. Qualifications: Mr. Collins has served in several business and financial management roles and directorship positions throughout his career. Mr. Collins previously served as Chairman and CEO, The Collins Group, Inc. (a private equity firm). Mr. Collins serves as Chairman Emeriti, Bentley University. Mr. Collins previously served as Director and Audit Committee Member, Bank of America Corp.; Director, FleetBoston Financial Corp.; and Director, Beth Israel Deaconess Medical Center (Harvard University Affiliate Hospital). |
| G. Thomas Hough Birth Date: February 28, 1955 Trustee Indefinite Term Began serving: August 2015 | Principal Occupations: Director or Trustee of the Federated Fund Family; formerly, Vice Chair, Ernst & Young LLP (public accounting firm) (Retired). Other Directorships Held: Director, Chair of the Audit Committee, Governance Committee, Publix Super Markets, Inc.; Director, Member of the Audit Committee and Technology Committee of Equifax, Inc. Qualifications: Mr. Hough has served in accounting, business management and directorship positions throughout his career. Mr. Hough most recently held the position of Americas Vice Chair of Assurance with Ernst & Young LLP (public accounting firm). Mr. Hough is an Executive Committee member of the United States Golf Association, he serves on the President's Cabinet and Business School Board of Visitors for the University of Alabama and is on the Business School Board of Visitors for Wake Forest University. |
| Name Birth Date Positions Held with Trust Date Service Began | Principal Occupation(s) for Past Five Years, Other Directorships Held, Previous Position(s) and Qualifications |
| Maureen Lally-Green Birth Date: July 5, 1949 Trustee Indefinite Term Began serving: August 2009 | Principal Occupations: Director or Trustee of the Federated Fund Family; Dean of the Duquesne University School of Law; Professor and Adjunct Professor of Law, Duquesne University School of Law; formerly, Interim Dean of the Duquesne University School of Law; Associate General Secretary and Director, Office of Church Relations, Diocese of Pittsburgh. Other Directorships Held: Director, CNX Resources Corporation (formerly known as CONSOL Energy Inc.). Qualifications: Judge Lally-Green has served in various legal and business roles and directorship positions throughout her career. Judge Lally-Green previously served as: Associate General Secretary, Diocese of Pittsburgh; a member of the Superior Court of Pennsylvania; and as a Professor of Law, Duquesne University School of Law. Judge Lally-Green also currently holds the positions on either a public or not for profit Board of Directors as follows: Director and Chair, UPMC Mercy Hospital; Director and Vice Chair, Our Campaign for the Church Alive!, Inc.; Director, Saint Vincent College; Member, Pennsylvania State Board of Education (public); and Director CNX Resources Corporation (formerly known as CONSOL Energy Inc.), where she currently serves as a member of the Compensation, Nominating and Corporate Governance Committee (Chair) and the Health, Safety and Environmental Committee. Judge Lally-Green has held the positions of: Director, Auberle; Director, Epilepsy Foundation of Western and Central Pennsylvania; Director, Ireland Institute of Pittsburgh; Director, Saint Thomas More Society; Director and Chair, Catholic High Schools of the Diocese of Pittsburgh, Inc.; Director, Pennsylvania Bar Institute; Regent, St. Vincent Seminary; and Director and Chair, Cardinal Wuerl North Catholic High School, Inc. |
| Charles F. Mansfield, Jr. Birth Date: April 10, 1945 Trustee Indefinite Term Began serving: September 1999 | Principal Occupations: Director or Trustee of the Federated Fund Family; Management Consultant. Other Directorships Held: None. Qualifications: Mr. Mansfield has served as a Marine Corps officer and in several banking, business management, educational roles and directorship positions throughout his long career. He remains active as a Management Consultant. |
| Thomas M. O'Neill Birth Date: June 14, 1951 Trustee Indefinite Term Began serving: August 2006 | Principal Occupations: Director or Trustee, Chair of the Audit Committee of the Federated Fund Family; Sole Proprietor, Navigator Management Company (investment and strategic consulting). Other Directorships Held: None. Qualifications: Mr. O'Neill has served in several business, mutual fund and financial management roles and directorship positions throughout his career. Mr. O'Neill serves as Director, Medicines for Humanity and Director, The Golisano Children's Museum of Naples, Florida. Mr. O'Neill previously served as Chief Executive Officer and President, Managing Director and Chief Investment Officer, Fleet Investment Advisors; President and Chief Executive Officer, Aeltus Investment Management, Inc.; General Partner, Hellman, Jordan Management Co., Boston, MA; Chief Investment Officer, The Putnam Companies, Boston, MA; Credit Analyst and Lending Officer, Fleet Bank; Director and Consultant, EZE Castle Software (investment order management software); and Director, Midway Pacific (lumber). |
| P. Jerome Richey Birth Date: February 23, 1949 Trustee Indefinite Term Began serving: October 2013 | Principal Occupations: Director or Trustee of the Federated Fund Family; Management Consultant; formerly, Senior Vice Chancellor and Chief Legal Officer, University of Pittsburgh and Executive Vice President and Chief Legal Officer, CNX Resources Corporation (formerly known as CONSOL Energy Inc.) Other Directorships Held: None. Qualifications: Mr. Richey has served in several business and legal management roles and directorship positions throughout his career. Mr. Richey most recently held the positions of Senior Vice Chancellor and Chief Legal Officer, University of Pittsburgh. Mr. Richey previously served as Chairman of the Board, Epilepsy Foundation of Western Pennsylvania and Chairman of the Board, World Affairs Council of Pittsburgh. Mr. Richey previously served as Chief Legal Officer and Executive Vice President, CNX Resources Corporation (formerly known as CONSOL Energy Inc.); and Board Member, Ethics Counsel and Shareholder, Buchanan Ingersoll & Rooney PC (a law firm). |
| John S. Walsh Birth Date: November 28, 1957 Trustee Indefinite Term Began serving: January 1999 | Principal Occupations: Director or Trustee, and Chair of the Board of Directors or Trustees, of the Federated Fund Family; President and Director, Heat Wagon, Inc. (manufacturer of construction temporary heaters); President and Director, Manufacturers Products, Inc. (distributor of portable construction heaters); President, Portable Heater Parts, a division of Manufacturers Products, Inc. Other Directorships Held: None. Qualifications: Mr. Walsh has served in several business management roles and directorship positions throughout his career. Mr. Walsh previously served as Vice President, Walsh & Kelly, Inc. (paving contractors). |
| Name Birth Date Address Positions Held with Trust Date Service Began | Principal Occupation(s) for Past Five Years and Previous Position(s) |
| Lori A. Hensler Birth Date: January 6, 1967 TREASURER Officer since: April 2013 | Principal Occupations: Principal Financial Officer and Treasurer of the Federated Fund Family; Senior Vice President, Federated Administrative Services; Financial and Operations Principal for Federated Securities Corp. and Edgewood Services, Inc.; and Assistant Treasurer, Federated Investors Trust Company. Ms. Hensler has received the Certified Public Accountant designation. Previous Positions: Controller of Federated Investors, Inc.; Senior Vice President and Assistant Treasurer, Federated Investors Management Company; Treasurer, Federated Investors Trust Company; Assistant Treasurer, Federated Administrative Services, Federated Administrative Services, Inc., Federated Securities Corp., Edgewood Services, Inc., Federated Advisory Services Company, Federated Equity Management Company of Pennsylvania, Federated Global Investment Management Corp., Federated Investment Counseling, Federated Investment Management Company, Passport Research, Ltd., and Federated MDTA, LLC; Financial and Operations Principal for Federated Securities Corp., Edgewood Services, Inc. and Southpointe Distribution Services, Inc. |
| Peter J. Germain Birth Date: September 3, 1959 CHIEF LEGAL OFFICER, SECRETARY and EXECUTIVE VICE PRESIDENT Officer since: January 2005 | Principal Occupations: Mr. Germain is Chief Legal Officer, Secretary and Executive Vice President of the Federated Fund Family. He is General Counsel, Chief Legal Officer, Secretary and Executive Vice President, Federated Investors, Inc.; Trustee and Senior Vice President, Federated Investors Management Company; Trustee and President, Federated Administrative Services; Director and President, Federated Administrative Services, Inc.; Director and Vice President, Federated Securities Corp.; Director and Secretary, Federated Private Asset Management, Inc.; Secretary, Federated Shareholder Services Company; and Secretary, Retirement Plan Service Company of America. Mr. Germain joined Federated in 1984 and is a member of the Pennsylvania Bar Association. Previous Positions: Deputy General Counsel, Special Counsel, Managing Director of Mutual Fund Services, Federated Investors, Inc.; Senior Vice President, Federated Services Company; and Senior Corporate Counsel, Federated Investors, Inc. |
| Richard B. Fisher Birth Date: May 17, 1923 VICE PRESIDENT Officer since: September 1993 | Principal Occupations: Vice Chairman or Vice President of some of the Funds in the Federated Fund Family; Vice Chairman, Federated Investors, Inc.; Chairman, Federated Securities Corp. Previous Positions: President and Director or Trustee of some of the Funds in the Federated Fund Family; Executive Vice President, Federated Investors, Inc.; Director and Chief Executive Officer, Federated Securities Corp. |
| John B. Fisher Birth Date: May 16, 1956 PRESIDENT Officer since: November 2004 | Principal Occupations: Principal Executive Officer and President of certain of the Funds in the Federated Fund Family; Director or Trustee of certain of the Funds in the Federated Fund Family; Vice President, Federated Investors, Inc.; President, Director/Trustee and CEO, Federated Advisory Services Company, Federated Equity Management Company of Pennsylvania, Federated Global Investment Management Corp., Federated Investment Counseling, Federated Investment Management Company; President and CEO of Passport Research, Ltd.; President of some of the Funds in the Federated Fund Complex and Director, Federated Investors Trust Company. Previous Positions: President and Director of the Institutional Sales Division of Federated Securities Corp.; President and Director of Federated Investment Counseling; Director, Edgewood Securities Corp.; Director, Federated Services Company; Director, Federated Investors, Inc.; Chairman and Director, Southpointe Distribution Services, Inc. and President, Technology, Federated Services Company. |
| Stephen Van Meter Birth Date: June 5, 1975 CHIEF COMPLIANCE OFFICER AND SENIOR VICE PRESIDENT Officer since: July 2015 | Principal Occupations: Senior Vice President and Chief Compliance Officer of the Federated Fund Family; Vice President and Chief Compliance Officer of Federated Investors, Inc. and Chief Compliance Officer of certain of its subsidiaries. Mr. Van Meter joined Federated in October 2011. He holds FINRA licenses under Series 3, 7, 24 and 66. Previous Positions: Mr. Van Meter previously held the position of Compliance Operating Officer, Federated Investors, Inc. Prior to joining Federated, Mr. Van Meter served at the United States Securities and Exchange Commission in the positions of Senior Counsel, Office of Chief Counsel, Division of Investment Management and Senior Counsel, Division of Enforcement. |
| Stephen F. Auth Birth Date: September 13, 1956 101 Park Avenue 41st Floor New York, NY 10178 CHIEF INVESTMENT OFFICER Officer since: November 2002 | Principal Occupations: Stephen F. Auth is Chief Investment Officer of various Funds in the Federated Fund Family; Executive Vice President, Federated Investment Counseling, Federated Global Investment Management Corp. and Federated Equity Management Company of Pennsylvania. Previous Positions: Executive Vice President, Federated Investment Management Company and Passport Research, Ltd. (investment advisory subsidiary of Federated); Senior Vice President, Global Portfolio Management Services Division; Senior Vice President, Federated Investment Management Company and Passport Research, Ltd.; Senior Managing Director and Portfolio Manager, Prudential Investments. |
| Robert J. Ostrowski Birth Date: April 26, 1963 Chief Investment Officer Officer since: May 2004 | Principal Occupations: Robert J. Ostrowski joined Federated in 1987 as an Investment Analyst and became a Portfolio Manager in 1990. He was named Chief Investment Officer of Federated's taxable fixed-income products in 2004 and also serves as a Senior Portfolio Manager. Mr. Ostrowski became an Executive Vice President of the Fund's Adviser in 2009 and served as a Senior Vice President of the Fund's Adviser from 1997 to 2009. Mr. Ostrowski has received the Chartered Financial Analyst designation. He received his M.S. in Industrial Administration from Carnegie Mellon University. |
| Deborah A. Cunningham Birth Date: September 15, 1959 Chief Investment Officer Officer since: June 2012 | Principal Occupations: Deborah A. Cunningham was named Chief Investment Officer of Federated's money market products in 2004. She joined Federated in 1981 and has been a Senior Portfolio Manager since 1997 and an Executive Vice President of the Fund's Adviser since 2009. Ms. Cunningham has received the Chartered Financial Analyst designation and holds an M.S.B.A. in Finance from Robert Morris College. |
Federated Investors Funds
4000 Ericsson Drive
Warrendale, PA 15086-7561
or call 1-800-341-7400.
CUSIP 313916843
2018 ©Federated Investors, Inc.
| Share Class | Primary | Service |
| 1 | Please see the footnotes to the line graphs below for definitions of, and further information about, the RMCGI. |
| 2 | Please see the footnotes to the line graphs below for definitions of, and further information about, the MIMCGFA. |
| 3 | The S&P 500 is a capitalization-weighted index of 500 stocks designed to measure performance of the broad domestic economy through changes in the aggregate market value of 500 stocks representing all major industries.* |
| 4 | The Russell 1000® Index measures the performance of the small-cap segment of the U.S. equity universe. It includes approximately 1000 of the smallest securities based on a combination of their market cap and current index membership.* |
| 5 | The Russell Midcap® Index measures the performance of the mid-cap segment of the U.S. equity universe. The Russell Midcap® Index is a subset of the Russell 1000® Index. It includes approximately 800 of the smallest securities based on a combination of their market cap and current index membership.* |
| 6 | The Russell 2000® Index measures the performance of the small-cap segment of the U.S. equity universe. It includes approximately 2000 of the smallest securities based on a combination of their market cap and current index membership.* |
| 7 | The Russell Midcap® Value Index measures the performance of the mid-cap value segment of the U.S. equity universe. It includes those Russell Midcap Index companies with lower price-to-book ratios and lower forecasted growth values.* |
| 8 | International investing involves special risks including currency risk, increased volatility, political risks and differences in auditing and other financial standards. |
| * | The index is unmanaged, and it is not possible to invest directly in an index. |
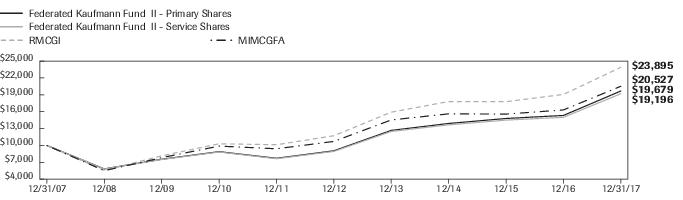
| Federated Kaufmann Fund II - | Primary Shares | Service Shares | NA | RMCGI | MIMCGFA |
| F | F | NA | I | I | |
| 12/31/2007 | 10,000 | 10,000 | 10,000 | 10,000 | |
| 12/31/2008 | 5,821 | 5,809 | 5,568 | 5,512 | |
| 12/31/2009 | 7,538 | 7,500 | 8,145 | 7,821 | |
| 12/31/2010 | 8,894 | 8,831 | 10,294 | 9,885 | |
| 12/31/2011 | 7,713 | 7,640 | 10,124 | 9,405 | |
| 12/31/2012 | 9,046 | 8,939 | 11,724 | 10,714 | |
| 12/31/2013 | 12,676 | 12,486 | 15,914 | 14,537 | |
| 12/31/2014 | 13,907 | 13,664 | 17,809 | 15,616 | |
| 12/31/2015 | 14,794 | 14,505 | 17,773 | 15,575 | |
| 12/31/2016 | 15,335 | 15,000 | 19,075 | 16,315 | |
| 12/31/2017 | 19,679 | 19,196 | 23,895 | 20,527 |
| 1 Year | 5 Years | 10 Years | |
| Primary Shares | 28.33% | 16.82% | 7.00% |
| Service Shares | 27.97% | 16.51% | 6.74% |
| RMCGI | 25.27% | 15.30% | 9.10% |
| MIMCGFA | 25.81% | 13.89% | 7.46% |
| 1 | The Fund's performance assumes the reinvestment of all dividends and distributions. The RMCGI and MIMCGFA have been adjusted to reflect reinvestment of dividends on securities in the index and average. |
| 2 | The RMCGI measures the performance of the mid-cap growth segment of the U.S. equity universe. It includes those Russell Midcap® Index companies with higher price-to-book ratios and higher forecasted growth values. The RMCGI is constructed to provide a comprehensive and unbiased barometer of the mid-cap growth market. The RMCGI is completely reconstituted annually to ensure larger stocks do not distort the performance and characteristics of the true mid-cap growth market. The RMCGI is not adjusted to reflect sales charges, expenses or other fees that the Securities and Exchange Commission requires to be reflected in the Fund's performance. The index is unmanaged and unlike the Fund, is not affected by cash flows. It is not possible to invest directly in an index. |
| 3 | Morningstar figures represent the average of the total returns reported by all the funds designated by Morningstar as falling into the respective category indicated. They do not reflect sales charges. The Morningstar figures in the Growth of $10,000 line graph are based on historical return information published by Morningstar and reflect the return of the funds comprising the category in the year of publication. Because the funds designated by Morningstar as falling into the category can change over time, the Morningstar figures in the line graph may not match the Morningstar figures in the Average Annual Total Returns table, which reflect the return of the funds that currently comprise the category. |
| Sector Composition | Percentage of Total Net Assets |
| Health Care | 30.2% |
| Information Technology | 24.0% |
| Industrials | 9.3% |
| Consumer Discretionary | 8.9% |
| Financials | 6.4% |
| Materials | 4.9% |
| Real Estate | 1.8% |
| Consumer Staples | 0.8% |
| Energy | 0.7% |
| Derivative Contracts2,3 | 0.0% |
| Securities Lending Collateral4 | 1.7% |
| Cash Equivalents5 | 12.9% |
| Other Assets and Liabilities—Net6 | (1.6)% |
| TOTAL | 100.0% |
| 1 | Except for Securities Lending Collateral, Cash Equivalents and Other Assets and Liabilities, sector classifications are based upon, and individual portfolio securities are assigned to, the classifications of the Global Industry Classification Standard (GICS), except that the Adviser assigns a classification to securities not classified by the GICS and to securities for which the Adviser does not have access to the classification made by the GICS. |
| 2 | Represents less than 0.1%. |
| 3 | Based upon net unrealized appreciation (depreciation) or value of the derivative contracts as applicable. Derivative contracts may consist of futures, forwards, options and swaps. The impact of a derivative contract on the Fund's performance may be larger than its unrealized appreciation (depreciation) or value may indicate. In many cases, the notional value or amount of a derivative contract may provide a better indication of the contract's significance to the portfolio. More complete information regarding the Fund's direct investments in derivative contracts, including unrealized appreciation (depreciation), value and notional values or amounts of such contracts, can be found in the table at the end of the Portfolio of Investments included in this Report. |
| 4 | Cash collateral received from lending portfolio securities which is invested in short-term investments such as repurchase agreements or money market mutual funds. |
| 5 | Cash Equivalents include any investments in money market mutual funds and/or overnight repurchase agreements other than those representing securities lending collateral. |
| 6 | Assets, other than investments in securities and derivative contracts, less liabilities. See Statement of Assets and Liabilities. |
| Principal Amount or Shares | Value | ||
| COMMON STOCKS—87.0% | |||
| Consumer Discretionary—8.9% | |||
| 1,395 | 1 | Amazon.com, Inc. | $1,631,411 |
| 5,530 | Ctrip.com International Ltd., ADR | 243,873 | |
| 34,900 | 1 | Floor & Decor Holdings, Inc. | 1,698,932 |
| 10,445 | Hilton Worldwide Holdings, Inc. | 834,138 | |
| 10,900 | 1 | JD.com, Inc., ADR | 451,478 |
| 18,880 | Las Vegas Sands Corp. | 1,311,971 | |
| 3,600 | 1 | Mohawk Industries, Inc. | 993,240 |
| 11,000 | Moncler S.p.A | 343,668 | |
| 1,024,477 | NagaCorp Limited | 791,170 | |
| 253 | 1 | Priceline.com, Inc. | 439,648 |
| 100,000 | Samsonite International SA | 459,348 | |
| 12,700 | Six Flags Entertainment Corp. | 845,439 | |
| 15,895 | Starbucks Corp. | 912,850 | |
| 3,255 | Vail Resorts, Inc. | 691,590 | |
| 15,100 | 2 | Wingstop, Inc. | 588,598 |
| 16,000 | 1,2 | Yoox Net-A-Porter Group | 558,457 |
| TOTAL | 12,795,811 | ||
| Consumer Staples—0.8% | |||
| 8,800 | 1 | Blue Buffalo Pet Products, Inc. | 288,552 |
| 3,500 | Constellation Brands, Inc., Class A | 799,995 | |
| TOTAL | 1,088,547 | ||
| Energy—0.7% | |||
| 33,050 | US Silica Holdings, Inc. | 1,076,108 | |
| Financials—6.4% | |||
| 5,570 | Affiliated Managers Group | 1,143,243 | |
| 6,470 | BlackRock, Inc. | 3,323,704 | |
| 16,500 | CIT Group Holdings, Inc. | 812,295 | |
| 28,900 | Chimera Investment Corp. | 534,072 | |
| 152,600 | FinecoBank Banca Fineco SPA | 1,559,749 | |
| 21,900 | 3 | Hamilton Lane, Inc. | 775,041 |
| 68,300 | Mediobanca Spa | 773,536 | |
| 20,200 | 1,2 | Qudian, Inc., ADR | 253,308 |
| TOTAL | 9,174,948 | ||
| Health Care—30.2% | |||
| 7,500 | Agilent Technologies, Inc. | 502,275 | |
| 4,800 | 1 | Align Technology, Inc. | 1,066,512 |
| 5,900 | 1 | Alnylam Pharmaceuticals, Inc. | 749,595 |
| 21,100 | 1 | Amphastar Pharmaceuticals, Inc. | 405,964 |
| 6,685 | 1 | AnaptysBio, Inc. | 673,313 |
| 45,023 | 1,3 | arGEN-x N.V. | 2,833,434 |
| 17,450 | 1 | Argenx SE, ADR | 1,101,793 |
| 142,420 | 1,4 | BioNano Genomics, Inc. | 0 |
| 23,800 | 1 | Boston Scientific Corp. | 590,002 |
| 3,721 | 1 | CRISPR Therapeutics AG | 87,369 |
| 13,800 | 1 | Clementia Pharmaceuticals, Inc. | 261,924 |
| 130,000 | 1,3 | ContraFect Corp. | 131,300 |
| Principal Amount or Shares | Value | ||
| COMMON STOCKS—continued | |||
| Health Care—continued | |||
| 3,000 | Cooper Cos., Inc. | $653,640 | |
| 296,737 | 1,3 | Corcept Therapeutics, Inc. | 5,359,070 |
| 22,100 | Danaher Corp. | 2,051,322 | |
| 220,470 | 1,3,4 | Dyax Corp. | 531,333 |
| 47,400 | 1 | Dynavax Technologies Corp. | 886,380 |
| 6,500 | 1 | Edwards Lifesciences Corp. | 732,615 |
| 6,400 | 1 | GW Pharmaceuticals PLC, ADR | 844,864 |
| 12,700 | 1 | Galapagos NV | 1,203,108 |
| 21,500 | 1 | Galapagos NV, ADR | 2,015,840 |
| 10,300 | 1 | Genmab A/S | 1,707,987 |
| 9,278 | 1 | Glaukos Corp. | 237,981 |
| 120,194 | 1 | Horizon Discovery Group PLC | 388,570 |
| 3,600 | 1 | IDEXX Laboratories, Inc. | 562,968 |
| 4,500 | 1 | Insulet Corp. | 310,500 |
| 8,550 | 1 | Intellia Therapeutics, Inc. | 164,331 |
| 23,200 | 1 | Intersect ENT, Inc. | 751,680 |
| 155,287 | 1,3 | Minerva Neurosciences, Inc. | 939,486 |
| 3,775 | 1 | Myokardia, Inc. | 158,927 |
| 25,400 | 1 | Nektar Therapeutics | 1,516,888 |
| 5,900 | 1 | Nevro Corp. | 407,336 |
| 7,960 | 1 | PRA Health Sciences, Inc. | 724,917 |
| 10,200 | 1 | Penumbra, Inc. | 959,820 |
| 22,220 | 1,2 | Poxel SA | 174,509 |
| 247,662 | 1,3 | Progenics Pharmaceuticals, Inc. | 1,473,589 |
| 3,321 | 1,2 | Protalix Biotherapeutics, Inc. | 2,196 |
| 17,700 | 1 | Repligen Corp. | 642,156 |
| 83,400 | 1,2,3 | SCYNEXIS, Inc. | 193,488 |
| 28,340 | 1,2 | Seres Therapeutics, Inc. | 287,367 |
| 39,800 | 1,2 | Spark Therapeutics, Inc. | 2,046,516 |
| 28,534 | 1,3,5 | SteadyMed Ltd. | 105,576 |
| 2,945 | 1,3,5 | SteadyMed Ltd. | 9,218 |
| 59,406 | 1,3 | SteadyMed Ltd. | 221,481 |
| 4,400 | Stryker Corp. | 681,296 | |
| 4,584 | 1 | Tesaro, Inc. | 379,876 |
| 22,800 | 1 | Ultragenyx Pharmaceutical, Inc. | 1,057,464 |
| 63,500 | 1 | Veeva Systems, Inc. | 3,510,280 |
| 30,933 | 1 | Zogenix, Inc. | 1,238,867 |
| TOTAL | 43,536,923 | ||
| Industrials—9.3% | |||
| 42,600 | Air Lease Corp. | 2,048,634 | |
| 9,500 | Alaska Air Group, Inc. | 698,345 | |
| 25,200 | 1 | Azul S.A., ADR | 600,516 |
| 5,800 | Fortive Corp. | 419,630 | |
| 10,300 | Heico Corp. | 971,805 | |
| 13,124 | KAR Auction Services, Inc. | 662,893 | |
| 10,500 | Osram Licht AG | 940,101 | |
| 25,000 | REV Group, Inc. | 813,250 | |
| 3,800 | Raytheon Co. | 713,830 | |
| 8,400 | Roper Technologies, Inc. | 2,175,600 |
| Principal Amount or Shares | Value | ||
| COMMON STOCKS—continued | |||
| Industrials—continued | |||
| 8,800 | 1 | Verisk Analytics, Inc. | $844,800 |
| 5,733 | 1 | WageWorks, Inc. | 355,446 |
| 22,910 | 1 | XPO Logistics, Inc. | 2,098,327 |
| TOTAL | 13,343,177 | ||
| Technology—24.0% | |||
| 3,000 | 1 | Adobe Systems, Inc. | 525,720 |
| 95,000 | 1 | Advanced Micro Devices, Inc. | 976,600 |
| 8,745 | 1 | Alibaba Group Holding Ltd., ADR | 1,507,900 |
| 15,700 | Amadeus IT Group S.A. | 1,130,034 | |
| 6,100 | Broadcom Ltd. | 1,567,090 | |
| 11,150 | Cognex Corp. | 681,934 | |
| 6,145 | 1 | CoStar Group, Inc. | 1,824,758 |
| 30,000 | 1 | Coupa Software, Inc. | 936,600 |
| 195,235 | Evry AS | 773,222 | |
| 82,600 | 1 | GDS Holdings Ltd., ADR | 1,860,978 |
| 27,200 | 1 | GoDaddy, Inc. | 1,367,616 |
| 18,770 | 1 | GrubHub, Inc. | 1,347,686 |
| 37,100 | Marvell Technology Group Ltd. | 796,537 | |
| 33,100 | 1 | Microsemi Corp. | 1,709,615 |
| 10,970 | 1 | MindBody, Inc. | 334,036 |
| 16,545 | 1 | Q2 Holdings, Inc. | 609,683 |
| 35,550 | 1 | RADWARE Ltd. | 689,670 |
| 13,880 | 1 | RealPage, Inc. | 614,884 |
| 4,500 | 1 | Red Hat, Inc. | 540,450 |
| 16,914 | STMicroelectronics N.V., ADR | 369,402 | |
| 11,400 | 1 | Salesforce.com, Inc. | 1,165,422 |
| 25,410 | 1 | ServiceNow, Inc. | 3,313,210 |
| 9,000 | 1 | Shopify, Inc. | 909,000 |
| 34,920 | 1 | Splunk, Inc. | 2,892,773 |
| 10,500 | 1 | Tyler Technologies, Inc. | 1,859,025 |
| 16,825 | 1 | Vantiv, Inc. | 1,237,479 |
| 23,715 | 1 | Workday, Inc. | 2,412,764 |
| 14,995 | 1,2 | Zillow Group, Inc. | 613,595 |
| TOTAL | 34,567,683 | ||
| Materials—4.9% | |||
| 7,840 | Albemarle Corp. | 1,002,657 | |
| 3,900 | Eagle Materials, Inc. | 441,870 | |
| 10,200 | 1 | Ingevity Corp. | 718,794 |
| 5,000 | Martin Marietta Materials | 1,105,200 | |
| 6,370 | Sherwin-Williams Co. | 2,611,955 | |
| 11,700 | Westlake Chemical Corp. | 1,246,401 | |
| TOTAL | 7,126,877 | ||
| Real Estate—1.8% | |||
| 7,300 | 1 | CBRE Group, Inc. | 316,163 |
| 9,470 | Crown Castle International Corp. | 1,051,265 | |
| 10,935 | MGM Growth Properties LLC | 318,755 | |
| 13,900 | Ryman Hospitality Properties | 959,378 | |
| TOTAL | 2,645,561 | ||
| TOTAL COMMON STOCKS (IDENTIFIED COST $74,164,336) | 125,355,635 |
| Principal Amount or Shares | Value | ||
| WARRANTS—0.0% | |||
| Health Care—0.0% | |||
| 42,500 | 1,3 | ContraFect Corp., Warrants | $14,684 |
| 87,500 | 1,3 | ContraFect Corp., Warrants | 24,649 |
| 21,060 | 1,3 | SCYNEXIS, Inc., Warrants | 23,922 |
| TOTAL WARRANTS (IDENTIFIED COST $1,300) | 63,255 | ||
| REPURCHASE AGREEMENT—14.6% | |||
| $18,584,000 | Interest in $950,000,000 joint repurchase agreement 1.42%, dated 12/29/2017 under which Bank of America, N.A. will repurchase securities provided as collateral for $950,149,889 on 1/2/2018. The securities provided as collateral at the end of the period held with BNY Mellon as tri-party agent, were U.S. Government Agency securities maturing on 7/20/2046 and the market value of those underlying securities was $969,152,887. | 18,584,000 | |
| 2,377,411 | Interest in $950,000,000 joint repurchase agreement 1.42%, dated 12/29/2017 under which Bank of America, N.A. will repurchase securities provided as collateral for $950,149,889 on 1/2/2018. The securities provided as collateral at the end of the period held with BNY Mellon as tri-party agent, were U.S. Government Agency securities maturing on 7/20/2046 and the market value of those underlying securities was $969,152,887. (purchased with proceeds from securities lending collateral). | 2,377,411 | |
| TOTAL REPURCHASE AGREEMENTS (AT COST) | 20,961,411 | ||
| TOTAL INVESTMENT IN SECURITIES—101.6% (IDENTIFIED COST $95,127,047)6 | 146,380,301 | ||
| OTHER ASSETS AND LIABILITIES-NET—(1.6)%7 | (2,358,248) | ||
| TOTAL NET ASSETS—100% | $144,022,053 |
| Description | Number of Contracts | Notional Value | Expiration Date | Value and Unrealized Depreciation |
| 1S&P 500 E-Mini Index Short Futures | 16 | $2,140,800 | March 2018 | $(14,872) |
| 1 | Non-income-producing security. |
| 2 | All or a portion of these securities are temporarily on loan to unaffiliated broker/dealers. |
| 3 | Affiliated companies. |
| Balance of Shares Held 12/31/2016 | Purchases/ Additions | Sales/ Reductions | Balance of Shares Held 12/31/2017 | Value | Change in Unrealized Appreciation/ Depreciation | Net Realized Gain/(Loss) | Dividend Income | |
| arGEN-x | 34,394 | 10,629 | (—) | 45,023 | $2,833,434 | $2,081,400 | $— | $— |
| ContraFect Corp. | 42,500 | 87,500 | (—) | 130,000 | $131,300 | $(51,575) | $— | $— |
| ContraFect Corp., Warrants | 42,500 | — | (—) | 42,500 | $14,684 | $(24,306) | $— | $— |
| ContraFect Corp., Warrants | — | 87,500 | (—) | 87,500 | $24,649 | $23,774 | $— | $— |
| Corcept Therapeutics, Inc. | 303,000 | 54,082 | (60,345) | 296,737 | $5,359,070 | $2,817,885 | $412,089 | $— |
| Dyax Corp. | 220,470 | — | (—) | 220,470 | $531,333 | $286,611 | $— | $— |
| *Dynavax Technologies Corp. | 56,654 | — | (9,254) | 47,400 | $886,380 | $913,005 | $(143,514) | $— |
| Hamilton Lane, Inc. | — | 21,900 | (—) | 21,900 | $775,041 | $372,223 | $— | $11,167 |
| Minerva Neurosciences, Inc. | 122,882 | 32,405 | (—) | 155,287 | $939,486 | $(753,227) | $— | $— |
| Progenics Pharmaceuticals, Inc. | 275,600 | 10,567 | (38,505) | 247,662 | $1,473,589 | $(657,787) | $(35,471) | $— |
| *Protalix Biotherapeutics, Inc. | 38,203 | — | (34,882) | 3,321 | $2,196 | $11,218 | $(4,046) | $— |
| SCYNEXIS, Inc. | 66,360 | 17,040 | (—) | 83,400 | $193,488 | $(48,084) | $— | $— |
| SCYNEXIS, Inc. Warrants | 21,060 | — | (—) | 21,060 | $23,922 | $(14,805) | $— | $— |
| SteadyMed Ltd. | 28,534 | — | (—) | 28,534 | $105,576 | $29,961 | $— | $— |
| SteadyMed Ltd. | 2,945 | — | (—) | 2,945 | $9,218 | $6,967 | $— | $— |
| SteadyMed Ltd. | 27,200 | 32,206 | (—) | 59,406 | $221,481 | $29,164 | $— | $— |
| *Zogenix, Inc. | 31,400 | 7,133 | (7,600) | 30,933 | $1,238,867 | $711,474 | $(59,189) | $— |
| Affiliated issuers no longer in the portfolio at period end | 316,184 | — | (316,184) | — | $— | $49,535 | $(836,521) | $— |
| TOTAL OF AFFILIATED TRANSACTIONS | 1,629,886 | 360,962 | (466,770) | 1,524,078 | $14,763,714 | $5,783,433 | $(666,652) | $11,167 |
| * | At December 31, 2017, the Fund no longer has ownership of at least 5% of the voting shares. |
| 4 | Market quotations and price evaluations are not available. Fair value determined using significant unobservable inputs in accordance with procedures established by and under the general supervision of the Fund's Board of Trustees (the “Trustees”). |
| 5 | Denotes a restricted security that either: (a) cannot be offered for public sale without first being registered, or availing of an exemption from registration, under the Securities Act of 1933; or (b) is subject to a contractual restriction on public sales. At December 31, 2017, these restricted securities amounted to $114,794, which represented 0.1% of total net assets. |
| 6 | The cost of investments for federal tax purposes amounts to $95,470,944. |
| 7 | Assets, other than investments in securities, less liabilities. See Statement of Assets and Liabilities. |
| Valuation Inputs | ||||
| Level 1— Quoted Prices | Level 2— Other Significant Observable Inputs | Level 3— Significant Unobservable Inputs | Total | |
| Equity Securities: | ||||
| Common Stocks | ||||
| Domestic | $97,289,592 | $— | $531,333 | $97,820,925 |
| International | 13,897,817 | 13,636,893 | — | 27,534,710 |
| Debt Securities: | ||||
| Warrants | — | 63,255 | — | 63,255 |
| Repurchase Agreements | — | 20,961,411 | — | 20,961,411 |
| TOTAL SECURITIES | $111,187,409 | $34,661,559 | $531,333 | $146,380,301 |
| Other Financial Instruments1 | ||||
| Liabilities | $(14,872) | $— | $— | $(14,872) |
| TOTAL OTHER FINANCIAL INSTRUMENTS | $(14,872) | $— | $— | $(14,872) |
| 1 | Other financial instruments include futures contracts. |
| ADR | —American Depositary Receipt |
| Year Ended December 31 | 2017 | 2016 | 2015 | 2014 | 2013 |
| Net Asset Value, Beginning of Period | $16.70 | $17.42 | $18.92 | $19.22 | $15.06 |
| Income From Investment Operations: | |||||
| Net investment income (loss) | (0.14)1 | (0.11)1 | (0.15)1 | (0.15)1 | (0.12)1 |
| Net realized and unrealized gain on investments, futures contracts and foreign currency transactions | 4.54 | 0.56 | 1.44 | 1.91 | 5.76 |
| TOTAL FROM INVESTMENT OPERATIONS | 4.40 | 0.45 | 1.29 | 1.76 | 5.64 |
| Less Distributions: | |||||
| Distributions from net realized gain on investments, futures contracts and foreign currency transactions | (1.94) | (1.17) | (2.79) | (2.06) | (1.48) |
| Net Asset Value, End of Period | $19.16 | $16.70 | $17.42 | $18.92 | $19.22 |
| Total Return2 | 28.33% | 3.66% | 6.37% | 9.71% | 40.12% |
| Ratios to Average Net Assets: | |||||
| Net expenses | 1.54% | 1.54%3 | 1.53%3 | 1.53%3 | 1.53%3 |
| Net investment income (loss) | (0.77)% | (0.67)% | (0.84)% | (0.83)% | (0.75)% |
| Expense waiver/reimbursement4 | —% | 0.03% | 0.00%5 | 0.09% | 0.25% |
| Supplemental Data: | |||||
| Net assets, end of period (000 omitted) | $47,985 | $42,122 | $46,450 | $49,425 | $53,392 |
| Portfolio turnover | 44% | 59% | 60% | 51% | 71% |
| 1 | Per share numbers have been calculated using the average shares method. |
| 2 | Based on net asset value. Total returns do not reflect any additional fees or expenses that may be imposed by separate accounts of insurance companies or in connection with any variable annuity or variable life insurance contract. |
| 3 | The net expense ratio is calculated without reduction for expense offset arrangements. The net expense ratios are 1.54%, 1.53%, 1.53% and 1.53% for the years ended December 31, 2016, 2015, 2014 and 2013, respectively, after taking into account these expense reductions. |
| 4 | This expense decrease is reflected in both the net expense and the net investment income (loss) ratios shown above. |
| 5 | Represents less than 0.01%. |
| Year Ended December 31 | 2017 | 2016 | 2015 | 2014 | 2013 |
| Net Asset Value, Beginning of Period | $16.04 | $16.82 | $18.39 | $18.78 | $14.79 |
| Income From Investment Operations: | |||||
| Net investment income (loss) | (0.17)1 | (0.14)1 | (0.19)1 | (0.19)1 | (0.16)1 |
| Net realized and unrealized gain on investments, futures contracts and foreign currency transactions | 4.33 | 0.53 | 1.41 | 1.86 | 5.63 |
| TOTAL FROM INVESTMENT OPERATIONS | 4.16 | 0.39 | 1.22 | 1.67 | 5.47 |
| Less Distributions: | |||||
| Distributions from net realized gain on investments, futures contracts and foreign currency transactions | (1.94) | (1.17) | (2.79) | (2.06) | (1.48) |
| Net Asset Value, End of Period | $18.26 | $16.04 | $16.82 | $18.39 | $18.78 |
| Total Return2 | 27.97% | 3.42% | 6.15% | 9.43% | 39.67% |
| Ratios to Average Net Assets: | |||||
| Net expenses | 1.79% | 1.79%3 | 1.78%3 | 1.78%3 | 1.78%3 |
| Net investment income (loss) | (1.02)% | (0.92)% | (1.07)% | (1.08)% | (1.00)% |
| Expense waiver/reimbursement4 | —% | 0.03% | 0.00%5 | 0.09% | 0.25% |
| Supplemental Data: | |||||
| Net assets, end of period (000 omitted) | $96,037 | $78,870 | $91,458 | $69,369 | $70,159 |
| Portfolio turnover | 44% | 59% | 60% | 51% | 71% |
| 1 | Per share numbers have been calculated using the average shares method. |
| 2 | Based on net asset value. Total returns do not reflect any additional fees or expenses that may be imposed by separate accounts of insurance companies or in connection with any variable annuity or variable life insurance contract. |
| 3 | The net expense ratio is calculated without reduction for expense offset arrangements. The net expense ratios are 1.79%, 1.78%, 1.78% and 1.78% for the years ended December 31, 2016, 2015, 2014 and 2013, respectively, after taking into account these expense reductions. |
| 4 | This expense decrease is reflected in both the net expense and the net investment income (loss) ratios shown above. |
| 5 | Represents less than 0.01%. |
| Assets: | ||
| Investment in repurchase agreements | $20,961,411 | |
| Investment in securities | 125,418,890 | |
| Investment in securities, at value including $2,267,520 of securities loaned (Note 2) and including $12,636,271 of investment in affiliated companies (identified cost $95,127,047) | $146,380,301 | |
| Cash | 595 | |
| Restricted cash (Note 2) | 72,000 | |
| Income receivable | 63,000 | |
| Receivable for investments sold | 4,199 | |
| Receivable for shares sold | 300,227 | |
| TOTAL ASSETS | 146,820,322 | |
| Liabilities: | ||
| Payable for investments purchased | 99,980 | |
| Payable for shares redeemed | 175,342 | |
| Payable for daily variation margin on futures contracts | 28,953 | |
| Payable for collateral due to broker for securities lending | 2,377,411 | |
| Payable to adviser (Note 5) | 15,454 | |
| Payable for administrative fees (Note 5) | 953 | |
| Payable for distribution services fee (Note 5) | 20,083 | |
| Accrued expenses (Note 5) | 80,093 | |
| TOTAL LIABILITIES | 2,798,269 | |
| Net assets for 7,764,138 shares outstanding | $144,022,053 | |
| Net Assets Consist of: | ||
| Paid-in capital | $81,756,415 | |
| Net unrealized appreciation of investments, futures contracts and translation of assets and liabilities in foreign currency | 51,238,375 | |
| Accumulated net realized gain on investments, futures contracts and foreign currency transactions | 11,228,009 | |
| Accumulated net investment income (loss) | (200,746) | |
| TOTAL NET ASSETS | $144,022,053 | |
| Net Asset Value, Offering Price and Redemption Proceeds Per Share | ||
| Primary Shares: | ||
| Net asset value per share ($47,984,567 ÷ 2,504,671 shares outstanding), no par value, unlimited shares authorized | $19.16 | |
| Service Shares: | ||
| Net asset value per share ($96,037,486 ÷ 5,259,467 shares outstanding), no par value, unlimited shares authorized | $18.26 |
| Investment Income: | ||
| Dividends (including $11,167 received from affiliated companies, see footnotes to Portfolio of Investments and net of foreign taxes withheld of $15,376) | $802,671 | |
| Interest | 168,288 | |
| Net income on securities loaned | 52,110 | |
| TOTAL INCOME | 1,023,069 | |
| Expenses: | ||
| Investment adviser fee (Note 5) | $1,730,320 | |
| Administrative fee (Note 5) | 105,404 | |
| Custodian fees | 27,199 | |
| Transfer agent fee | 14,050 | |
| Directors'/Trustees' fees (Note 5) | 2,244 | |
| Auditing fees | 33,400 | |
| Legal fees | 5,630 | |
| Portfolio accounting fees | 65,958 | |
| Distribution services fee (Note 5) | 219,414 | |
| Printing and postage | 37,325 | |
| Miscellaneous (Note 5) | 29,108 | |
| TOTAL EXPENSES | 2,270,052 | |
| Net investment income (loss) | (1,246,983) | |
| Realized and Unrealized Gain (Loss) on Investments, Futures Contracts and Foreign Currency Transactions: | ||
| Net realized gain on investments (including net realized loss of $666,652 on sales of investments in affiliated companies) | 12,563,097 | |
| Net realized gain on foreign currency transactions | 824 | |
| Net realized loss on futures contracts | (149,899) | |
| Net change in unrealized appreciation of investments (including net change in unrealized appreciation of $5,783,433 on investments in affiliated companies) | 21,581,778 | |
| Net change in unrealized appreciation/depreciation of translation of assets and liabilities in foreign currency | (274) | |
| Net change in unrealized appreciation of futures contracts | (21,823) | |
| Net realized and unrealized gain on investments, futures contracts and foreign currency transactions | 33,973,703 | |
| Change in net assets resulting from operations | $32,726,720 |
| Year Ended December 31 | 2017 | 2016 |
| Increase (Decrease) in Net Assets | ||
| Operations: | ||
| Net investment income (loss) | $(1,246,983) | $(1,035,272) |
| Net realized gain on investments, futures contracts and foreign currency transactions | 12,414,022 | 14,317,142 |
| Net change in unrealized appreciation/depreciation of investments, futures contracts and translation of assets and liabilities in foreign currency | 21,559,681 | (9,799,042) |
| CHANGE IN NET ASSETS RESULTING FROM OPERATIONS | 32,726,720 | 3,482,828 |
| Distributions to Shareholders: | ||
| Distributions from net realized gain on investments, futures contracts and foreign currency transactions | ||
| Primary Shares | (4,734,296) | (3,022,416) |
| Service Shares | (9,289,863) | (6,304,411) |
| CHANGE IN NET ASSETS RESULTING FROM DISTRIBUTIONS TO SHAREHOLDERS | (14,024,159) | (9,326,827) |
| Share Transactions: | ||
| Proceeds from sale of shares | 18,372,467 | 16,376,937 |
| Net asset value of shares issued to shareholders in payment of distributions declared | 14,024,145 | 9,326,827 |
| Cost of shares redeemed | (28,069,059) | (36,775,523) |
| CHANGE IN NET ASSETS RESULTING FROM SHARE TRANSACTIONS | 4,327,553 | (11,071,759) |
| Change in net assets | 23,030,114 | (16,915,758) |
| Net Assets: | ||
| Beginning of period | 120,991,939 | 137,907,697 |
| End of period (including accumulated net investment income (loss) of $(200,746) and $(192,101), respectively) | $144,022,053 | $120,991,939 |
| ■ | Equity securities listed on an exchange or traded through a regulated market system are valued at their last reported sale price or official closing price in their principal exchange or market. |
| ■ | Fixed-income securities are fair valued using price evaluations provided by a pricing service approved by the Trustees. |
| ■ | Shares of other mutual funds or non-exchange-traded investment companies are valued based upon their reported NAVs. |
| ■ | Derivative contracts listed on exchanges are valued at their reported settlement or closing price, except that options are valued at the mean of closing bid and asked quotations. |
| ■ | Over-the-counter (OTC) derivative contracts are fair valued using price evaluations provided by a pricing service approved by the Trustees. |
| ■ | For securities that are fair valued in accordance with procedures established by and under the general supervision of the Trustees, certain factors may be considered such as: the last traded or purchase price of the security, information obtained by contacting the issuer or dealers, analysis of the issuer's financial statements or other available documents, fundamental analytical data, the nature and duration of restrictions on disposition, the movement of the market in which the security is normally traded, public trading in similar securities or derivative contracts of the issuer or comparable issuers, movement of a relevant index, or other factors including but not limited to industry changes and relevant government actions. |
| ■ | With respect to securities traded principally in foreign markets, significant trends in U.S. equity markets or in the trading of foreign securities index futures contracts; |
| ■ | Political or other developments affecting the economy or markets in which an issuer conducts its operations or its securities are traded; |
| ■ | Announcements concerning matters such as acquisitions, recapitalizations, litigation developments, or a natural disaster affecting the issuer's operations or regulatory changes or market developments affecting the issuer's industry. |
| Market Value of Securities Loaned | Market Value of Collateral |
| $2,267,520 | $2,377,411 |
| Security | Acquisition Date | Cost | Market Value |
| SteadyMed Ltd. | 7/29/2016 | $89,311 | $105,576 |
| SteadyMed Ltd. | 1/26/2015 | $17,008 | $9,218 |
| Fair Value of Derivative Instruments | ||
| Liability | ||
| Statement of Assets and Liabilities Location | Fair Value | |
| Derivatives not accounted for as hedging instruments under ASC Topic 815 | ||
| Equity contracts | Payable for daily variation margin on futures contracts | $14,872* |
| * | Includes cumulative depreciation of futures contracts as reported in the footnotes to the Portfolio of Investments. Only the current day's variation margin is reported within the Statement of Assets and Liabilities. |
| Amount of Realized Gain or (Loss) on Derivatives Recognized in Income | |
| Futures | |
| Equity contracts | $(149,899) |
| Change in Unrealized Appreciation or (Depreciation) on Derivatives Recognized in Income | |
| Futures | |
| Equity contracts | $(21,823) |
| Year Ended December 31 | 2017 | 2016 | ||
| Primary Shares: | Shares | Amount | Shares | Amount |
| Shares sold | 195,640 | $3,425,347 | 172,747 | $2,727,161 |
| Shares issued to shareholders in payment of distributions declared | 289,029 | 4,734,294 | 209,164 | 3,022,416 |
| Shares redeemed | (502,213) | (8,803,914) | (526,403) | (8,309,116) |
| NET CHANGE RESULTING FROM PRIMARY SHARE TRANSACTIONS | (17,544) | $(644,273) | (144,492) | $(2,559,539) |
| Year Ended December 31 | 2017 | 2016 | ||
| Service Shares: | Shares | Amount | Shares | Amount |
| Shares sold | 890,081 | $14,947,120 | 894,648 | $13,649,776 |
| Shares issued to shareholders in payment of distributions declared | 593,980 | 9,289,851 | 453,229 | 6,304,411 |
| Shares redeemed | (1,142,552) | (19,265,145) | (1,868,028) | (28,466,407) |
| NET CHANGE RESULTING FROM SERVICE SHARE TRANSACTIONS | 341,509 | $4,971,826 | (520,151) | $(8,512,220) |
| NET CHANGE RESULTING FROM TOTAL FUND SHARE TRANSACTIONS | 323,965 | $4,327,553 | (664,643) | $(11,071,759) |
| Increase (Decrease) | ||
| Paid-In Capital | Undistributed Net Investment Income (Loss) | Accumulated Net Realized Gain (Loss) |
| $(302,141) | $1,238,338 | $(936,197) |
| 2017 | 2016 | |
| Long-term capital gains | $14,024,159 | $9,326,827 |
| Net unrealized appreciation | $50,909,350 |
| Undistributed long-term capital gains | $11,356,288 |
| Administrative Fee | Average Daily Net Assets of the Investment Complex |
| 0.100% | on assets up to $50 billion |
| 0.075% | on assets over $50 billion |
| Administrative Fee | Average Daily Net Assets of the Investment Complex |
| 0.150% | on the first $5 billion |
| 0.125% | on the next $5 billion |
| 0.100% | on the next $10 billion |
| 0.075% | on assets in excess of $20 billion |
| Share Class Name | Percentage of Average Daily Net Assets of Class |
| Primary Shares | 0.25% |
| Service Shares | 0.25% |
| Distribution Services Fees Incurred | |
| Service Shares | $219,414 |
| Purchases | $50,367,602 |
| Sales | $59,805,236 |
| Country | Percentage of Net Assets |
| United States | 82.5% |
| China | 3.0% |
| Netherland | 2.7% |
| Italy | 2.3% |
| Belgium | 2.2% |
| Denmark | 1.2% |
| Singapore | 1.1% |
| Other1 | 6.6% |
| 1 | Countries representing less than 1.0% have been aggregated under the designation “Other.” |
February 14, 2018
| Beginning Account Value 7/1/2017 | Ending Account Value 12/31/2017 | Expenses Paid During Period1 | |
| Actual: | |||
| Primary Shares | $1,000 | $1,117.90 | $8.22 |
| Service Shares | $1,000 | $1,116.10 | $9.55 |
| Hypothetical (assuming a 5% return before expenses): | |||
| Primary Shares | $1,000 | $1,017.40 | $7.83 |
| Service Shares | $1,000 | $1,016.20 | $9.10 |
| 1 | Expenses are equal to the Fund's annualized net expense ratios, multiplied by the average account value over the period, multiplied by 184/365 (to reflect the one-half-year period). The annualized net expense ratios are as follows: |
| Primary Shares | 1.54% |
| Service Shares | 1.79% |
| Name Birth Date Positions Held with Trust Date Service Began | Principal Occupation(s) for Past Five Years, Other Directorships Held and Previous Position(s) |
| J. Christopher Donahue* Birth Date: April 11, 1949 Trustee Indefinite Term Began serving: September 1993 | Principal Occupations: Principal Executive Officer and President of certain of the Funds in the Federated Fund Family; Director or Trustee of the Funds in the Federated Fund Family; President, Chief Executive Officer and Director, Federated Investors, Inc.; Chairman and Trustee, Federated Investment Management Company; Trustee, Federated Investment Counseling; Chairman and Director, Federated Global Investment Management Corp.; Chairman and Trustee, Federated Equity Management Company of Pennsylvania; Trustee, Federated Shareholder Services Company; Director, Federated Services Company. Previous Positions: President, Federated Investment Counseling; President and Chief Executive Officer, Federated Investment Management Company, Federated Global Investment Management Corp. and Passport Research, Ltd; Chairman, Passport Research, Ltd. |
| Thomas R. Donahue* Birth Date: October 20, 1958 Trustee Indefinite Term Began serving: May 2016 | Principal Occupations: Director or Trustee of certain of the funds in the Federated Fund Family; Chief Financial Officer, Treasurer, Vice President and Assistant Secretary, Federated Investors, Inc.; Chairman and Trustee, Federated Administrative Services; Chairman and Director, Federated Administrative Services, Inc.; Trustee and Treasurer, Federated Advisory Services Company; Director or Trustee and Treasurer, Federated Equity Management Company of Pennsylvania, Federated Global Investment Management Corp., Federated Investment Counseling, and Federated Investment Management Company; Director, MDTA LLC; Director, Executive Vice President and Assistant Secretary, Federated Securities Corp.; Director or Trustee and Chairman, Federated Services Company and Federated Shareholder Services Company; and Director and President, FII Holdings, Inc. Previous Positions: Director, Federated Investors, Inc.; Assistant Secretary, Federated Investment Management Company, Federated Global Investment Management Company and Passport Research, LTD; Treasurer, Passport Research, LTD; Executive Vice President, Federated Securities Corp.; and Treasurer, FII Holdings, Inc. |
| * | Family relationships and reasons for “interested” status: J. Christopher Donahue and Thomas R. Donahue are brothers. Both are “interested” due to their beneficial ownership of shares of Federated Investors, Inc. and the positions they hold with Federated and its subsidiaries. |
| Name Birth Date Positions Held with Trust Date Service Began | Principal Occupation(s) for Past Five Years, Other Directorships Held, Previous Position(s) and Qualifications |
| John T. Collins Birth Date: January 24, 1947 Trustee Indefinite Term Began serving: October 2013 | Principal Occupations: Director or Trustee of the Federated Fund Family; formerly, Chairman and CEO, The Collins Group, Inc. (a private equity firm) (Retired). Other Directorships Held: Director, Current Chair of the Compensation Committee, KLX Corp. Qualifications: Mr. Collins has served in several business and financial management roles and directorship positions throughout his career. Mr. Collins previously served as Chairman and CEO, The Collins Group, Inc. (a private equity firm). Mr. Collins serves as Chairman Emeriti, Bentley University. Mr. Collins previously served as Director and Audit Committee Member, Bank of America Corp.; Director, FleetBoston Financial Corp.; and Director, Beth Israel Deaconess Medical Center (Harvard University Affiliate Hospital). |
| G. Thomas Hough Birth Date: February 28, 1955 Trustee Indefinite Term Began serving: August 2015 | Principal Occupations: Director or Trustee of the Federated Fund Family; formerly, Vice Chair, Ernst & Young LLP (public accounting firm) (Retired). Other Directorships Held: Director, Chair of the Audit Committee, Governance Committee, Publix Super Markets, Inc.; Director, Member of the Audit Committee and Technology Committee of Equifax, Inc. Qualifications: Mr. Hough has served in accounting, business management and directorship positions throughout his career. Mr. Hough most recently held the position of Americas Vice Chair of Assurance with Ernst & Young LLP (public accounting firm). Mr. Hough is an Executive Committee member of the United States Golf Association, he serves on the President's Cabinet and Business School Board of Visitors for the University of Alabama and is on the Business School Board of Visitors for Wake Forest University. |
| Name Birth Date Positions Held with Trust Date Service Began | Principal Occupation(s) for Past Five Years, Other Directorships Held, Previous Position(s) and Qualifications |
| Maureen Lally-Green Birth Date: July 5, 1949 Trustee Indefinite Term Began serving: August 2009 | Principal Occupations: Director or Trustee of the Federated Fund Family; Dean of the Duquesne University School of Law; Professor and Adjunct Professor of Law, Duquesne University School of Law; formerly, Interim Dean of the Duquesne University School of Law; Associate General Secretary and Director, Office of Church Relations, Diocese of Pittsburgh. Other Directorships Held: Director, CNX Resources Corporation (formerly known as CONSOL Energy Inc.). Qualifications: Judge Lally-Green has served in various legal and business roles and directorship positions throughout her career. Judge Lally-Green previously served as: Associate General Secretary, Diocese of Pittsburgh; a member of the Superior Court of Pennsylvania; and as a Professor of Law, Duquesne University School of Law. Judge Lally-Green also currently holds the positions on either a public or not for profit Board of Directors as follows: Director and Chair, UPMC Mercy Hospital; Director and Vice Chair, Our Campaign for the Church Alive!, Inc.; Director, Saint Vincent College; Member, Pennsylvania State Board of Education (public); and Director CNX Resources Corporation (formerly known as CONSOL Energy Inc.), where she currently serves as a member of the Compensation, Nominating and Corporate Governance Committee (Chair) and the Health, Safety and Environmental Committee. Judge Lally-Green has held the positions of: Director, Auberle; Director, Epilepsy Foundation of Western and Central Pennsylvania; Director, Ireland Institute of Pittsburgh; Director, Saint Thomas More Society; Director and Chair, Catholic High Schools of the Diocese of Pittsburgh, Inc.; Director, Pennsylvania Bar Institute; Regent, St. Vincent Seminary; and Director and Chair, Cardinal Wuerl North Catholic High School, Inc. |
| Charles F. Mansfield, Jr. Birth Date: April 10, 1945 Trustee Indefinite Term Began serving: September 1999 | Principal Occupations: Director or Trustee of the Federated Fund Family; Management Consultant. Other Directorships Held: None. Qualifications: Mr. Mansfield has served as a Marine Corps officer and in several banking, business management, educational roles and directorship positions throughout his long career. He remains active as a Management Consultant. |
| Thomas M. O'Neill Birth Date: June 14, 1951 Trustee Indefinite Term Began serving: August 2006 | Principal Occupations: Director or Trustee, Chair of the Audit Committee of the Federated Fund Family; Sole Proprietor, Navigator Management Company (investment and strategic consulting). Other Directorships Held: None. Qualifications: Mr. O'Neill has served in several business, mutual fund and financial management roles and directorship positions throughout his career. Mr. O'Neill serves as Director, Medicines for Humanity and Director, The Golisano Children's Museum of Naples, Florida. Mr. O'Neill previously served as Chief Executive Officer and President, Managing Director and Chief Investment Officer, Fleet Investment Advisors; President and Chief Executive Officer, Aeltus Investment Management, Inc.; General Partner, Hellman, Jordan Management Co., Boston, MA; Chief Investment Officer, The Putnam Companies, Boston, MA; Credit Analyst and Lending Officer, Fleet Bank; Director and Consultant, EZE Castle Software (investment order management software); and Director, Midway Pacific (lumber). |
| P. Jerome Richey Birth Date: February 23, 1949 Trustee Indefinite Term Began serving: October 2013 | Principal Occupations: Director or Trustee of the Federated Fund Family; Management Consultant; formerly, Senior Vice Chancellor and Chief Legal Officer, University of Pittsburgh and Executive Vice President and Chief Legal Officer, CNX Resources Corporation (formerly known as CONSOL Energy Inc.) Other Directorships Held: None. Qualifications: Mr. Richey has served in several business and legal management roles and directorship positions throughout his career. Mr. Richey most recently held the positions of Senior Vice Chancellor and Chief Legal Officer, University of Pittsburgh. Mr. Richey previously served as Chairman of the Board, Epilepsy Foundation of Western Pennsylvania and Chairman of the Board, World Affairs Council of Pittsburgh. Mr. Richey previously served as Chief Legal Officer and Executive Vice President, CNX Resources Corporation (formerly known as CONSOL Energy Inc.); and Board Member, Ethics Counsel and Shareholder, Buchanan Ingersoll & Rooney PC (a law firm). |
| John S. Walsh Birth Date: November 28, 1957 Trustee Indefinite Term Began serving: January 1999 | Principal Occupations: Director or Trustee, and Chair of the Board of Directors or Trustees, of the Federated Fund Family; President and Director, Heat Wagon, Inc. (manufacturer of construction temporary heaters); President and Director, Manufacturers Products, Inc. (distributor of portable construction heaters); President, Portable Heater Parts, a division of Manufacturers Products, Inc. Other Directorships Held: None. Qualifications: Mr. Walsh has served in several business management roles and directorship positions throughout his career. Mr. Walsh previously served as Vice President, Walsh & Kelly, Inc. (paving contractors). |
| Name Birth Date Address Positions Held with Trust Date Service Began | Principal Occupation(s) for Past Five Years and Previous Position(s) |
| Lori A. Hensler Birth Date: January 6, 1967 TREASURER Officer since: April 2013 | Principal Occupations: Principal Financial Officer and Treasurer of the Federated Fund Family; Senior Vice President, Federated Administrative Services; Financial and Operations Principal for Federated Securities Corp. and Edgewood Services, Inc.; and Assistant Treasurer, Federated Investors Trust Company. Ms. Hensler has received the Certified Public Accountant designation. Previous Positions: Controller of Federated Investors, Inc.; Senior Vice President and Assistant Treasurer, Federated Investors Management Company; Treasurer, Federated Investors Trust Company; Assistant Treasurer, Federated Administrative Services, Federated Administrative Services, Inc., Federated Securities Corp., Edgewood Services, Inc., Federated Advisory Services Company, Federated Equity Management Company of Pennsylvania, Federated Global Investment Management Corp., Federated Investment Counseling, Federated Investment Management Company, Passport Research, Ltd., and Federated MDTA, LLC; Financial and Operations Principal for Federated Securities Corp., Edgewood Services, Inc. and Southpointe Distribution Services, Inc. |
| Peter J. Germain Birth Date: September 3, 1959 CHIEF LEGAL OFFICER, SECRETARY and EXECUTIVE VICE PRESIDENT Officer since: January 2005 | Principal Occupations: Mr. Germain is Chief Legal Officer, Secretary and Executive Vice President of the Federated Fund Family. He is General Counsel, Chief Legal Officer, Secretary and Executive Vice President, Federated Investors, Inc.; Trustee and Senior Vice President, Federated Investors Management Company; Trustee and President, Federated Administrative Services; Director and President, Federated Administrative Services, Inc.; Director and Vice President, Federated Securities Corp.; Director and Secretary, Federated Private Asset Management, Inc.; Secretary, Federated Shareholder Services Company; and Secretary, Retirement Plan Service Company of America. Mr. Germain joined Federated in 1984 and is a member of the Pennsylvania Bar Association. Previous Positions: Deputy General Counsel, Special Counsel, Managing Director of Mutual Fund Services, Federated Investors, Inc.; Senior Vice President, Federated Services Company; and Senior Corporate Counsel, Federated Investors, Inc. |
| Richard B. Fisher Birth Date: May 17, 1923 VICE PRESIDENT Officer since: September 1993 | Principal Occupations: Vice Chairman or Vice President of some of the Funds in the Federated Fund Family; Vice Chairman, Federated Investors, Inc.; Chairman, Federated Securities Corp. Previous Positions: President and Director or Trustee of some of the Funds in the Federated Fund Family; Executive Vice President, Federated Investors, Inc.; Director and Chief Executive Officer, Federated Securities Corp. |
| John B. Fisher Birth Date: May 16, 1956 PRESIDENT Officer since: November 2004 | Principal Occupations: Principal Executive Officer and President of certain of the Funds in the Federated Fund Family; Director or Trustee of certain of the Funds in the Federated Fund Family; Vice President, Federated Investors, Inc.; President, Director/Trustee and CEO, Federated Advisory Services Company, Federated Equity Management Company of Pennsylvania, Federated Global Investment Management Corp., Federated Investment Counseling, Federated Investment Management Company; President and CEO of Passport Research, Ltd.; President of some of the Funds in the Federated Fund Complex and Director, Federated Investors Trust Company. Previous Positions: President and Director of the Institutional Sales Division of Federated Securities Corp.; President and Director of Federated Investment Counseling; Director, Edgewood Securities Corp.; Director, Federated Services Company; Director, Federated Investors, Inc.; Chairman and Director, Southpointe Distribution Services, Inc. and President, Technology, Federated Services Company. |
| Stephen Van Meter Birth Date: June 5, 1975 CHIEF COMPLIANCE OFFICER AND SENIOR VICE PRESIDENT Officer since: July 2015 | Principal Occupations: Senior Vice President and Chief Compliance Officer of the Federated Fund Family; Vice President and Chief Compliance Officer of Federated Investors, Inc. and Chief Compliance Officer of certain of its subsidiaries. Mr. Van Meter joined Federated in October 2011. He holds FINRA licenses under Series 3, 7, 24 and 66. Previous Positions: Mr. Van Meter previously held the position of Compliance Operating Officer, Federated Investors, Inc. Prior to joining Federated, Mr. Van Meter served at the United States Securities and Exchange Commission in the positions of Senior Counsel, Office of Chief Counsel, Division of Investment Management and Senior Counsel, Division of Enforcement. |
| Stephen F. Auth Birth Date: September 13, 1956 101 Park Avenue 41st Floor New York, NY 10178 CHIEF INVESTMENT OFFICER Officer since: November 2002 | Principal Occupations: Stephen F. Auth is Chief Investment Officer of various Funds in the Federated Fund Family; Executive Vice President, Federated Investment Counseling, Federated Global Investment Management Corp. and Federated Equity Management Company of Pennsylvania. Previous Positions: Executive Vice President, Federated Investment Management Company and Passport Research, Ltd. (investment advisory subsidiary of Federated); Senior Vice President, Global Portfolio Management Services Division; Senior Vice President, Federated Investment Management Company and Passport Research, Ltd.; Senior Managing Director and Portfolio Manager, Prudential Investments. |
| Robert J. Ostrowski Birth Date: April 26, 1963 Chief Investment Officer Officer since: May 2004 | Principal Occupations: Robert J. Ostrowski joined Federated in 1987 as an Investment Analyst and became a Portfolio Manager in 1990. He was named Chief Investment Officer of Federated's taxable fixed-income products in 2004 and also serves as a Senior Portfolio Manager. Mr. Ostrowski became an Executive Vice President of the Fund's Adviser in 2009 and served as a Senior Vice President of the Fund's Adviser from 1997 to 2009. Mr. Ostrowski has received the Chartered Financial Analyst designation. He received his M.S. in Industrial Administration from Carnegie Mellon University. |
| Deborah A. Cunningham Birth Date: September 15, 1959 Chief Investment Officer Officer since: June 2012 | Principal Occupations: Deborah A. Cunningham was named Chief Investment Officer of Federated's money market products in 2004. She joined Federated in 1981 and has been a Senior Portfolio Manager since 1997 and an Executive Vice President of the Fund's Adviser since 2009. Ms. Cunningham has received the Chartered Financial Analyst designation and holds an M.S.B.A. in Finance from Robert Morris College. |
Federated Investors Funds
4000 Ericsson Drive
Warrendale, PA 15086-7561
or call 1-800-341-7400.
CUSIP 313916777
2018 ©Federated Investors, Inc.
| Share Class | Primary | Service |
| Security Type | Percentage of Total Net Assets |
| U.S. Government Agency Securities | 42.7% |
| U.S. Treasury Securities | 0.3% |
| Repurchase Agreements | 55.5% |
| Other Assets and Liabilities—Net2 | 1.5% |
| TOTAL | 100.0% |
| Securities With an Effective Maturity of: | Percentage of Total Net Assets |
| 1-7 Days | 60.0% |
| 8-30 Days | 20.1% |
| 31-90 Days | 8.6% |
| 91-180 Days | 2.9% |
| 181 Days or more | 6.9% |
| Other Assets and Liabilities—Net2 | 1.5% |
| TOTAL | 100.0% |
| 1 | See the Fund's Prospectus and Statement of Additional Information for a description of the types of securities in which the Fund invests. |
| 2 | Assets, other than investments in securities, less liabilities. See Statement of Assets and Liabilities. |
| 3 | Effective maturity is determined in accordance with the requirements of Rule 2a-7 under the Investment Company Act of 1940, which regulates money market mutual funds. |
| Principal Amount | Value | ||
| GOVERNMENT AGENCIES—42.7% | |||
| $750,000 | 1 | Federal Farm Credit System Discount Notes, 1.190% - 1.240%, 4/11/2018 - 8/15/2018 | $745,875 |
| 500,000 | 2 | Federal Farm Credit System Floating Rate Notes, 1.276% (1-month USLIBOR -0.085%), 1/1/2018 | 499,980 |
| 300,000 | 2 | Federal Farm Credit System Floating Rate Notes, 1.312% (1-month USLIBOR -0.060%), 1/4/2018 | 299,985 |
| 200,000 | 2 | Federal Farm Credit System Floating Rate Notes, 1.351% (1-month USLIBOR -0.041%), 1/6/2018 | 200,000 |
| 500,000 | 2 | Federal Farm Credit System Floating Rate Notes, 1.379% - 1.504% (1-month USLIBOR -0.065%), 1/12/2018 - 1/29/2018 | 499,984 |
| 250,000 | 2 | Federal Farm Credit System Floating Rate Notes, 1.380% (1-month USLIBOR -0.080%), 1/13/2018 | 249,977 |
| 250,000 | 2 | Federal Farm Credit System Floating Rate Notes, 1.417% (1-month USLIBOR -0.135%), 1/25/2018 | 250,000 |
| 750,000 | 2 | Federal Farm Credit System Floating Rate Notes, 1.420% (1-month USLIBOR -0.040%), 1/13/2018 | 749,982 |
| 250,000 | 2 | Federal Farm Credit System Floating Rate Notes, 1.466% (1-month USLIBOR -0.045%), 1/21/2018 | 249,995 |
| 500,000 | 2 | Federal Farm Credit System Floating Rate Notes, 1.511% (1-month USLIBOR +0.150%), 1/1/2018 | 501,124 |
| 1,000,000 | 2 | Federal Farm Credit System Floating Rate Notes, 1.570% (1-month USLIBOR +0.059%), 1/21/2018 | 1,000,000 |
| 200,000 | 2 | Federal Farm Credit System Floating Rate Notes, 1.705% (3-month USLIBOR +0.170%), 1/22/2018 | 200,612 |
| 1,635,000 | Federal Farm Credit System, 0.950% - 4.670%, 2/27/2018 - 9/15/2018 | 1,641,004 | |
| 2,250,000 | 1 | Federal Home Loan Bank System Discount Notes, 1.250% - 1.800%, 1/24/2018 - 1/2/2019 | 2,240,101 |
| 250,000 | 2 | Federal Home Loan Bank System Floating Rate Notes, 1.007% (3-month USLIBOR -0.360%), 1/25/2018 | 250,000 |
| 750,000 | 2 | Federal Home Loan Bank System Floating Rate Notes, 1.013% (3-month USLIBOR -0.340%), 1/17/2018 | 750,000 |
| 500,000 | 2 | Federal Home Loan Bank System Floating Rate Notes, 1.065% (3-month USLIBOR -0.300%), 1/24/2018 | 500,000 |
| 500,000 | 2 | Federal Home Loan Bank System Floating Rate Notes, 1.152% (3-month USLIBOR -0.245%), 2/8/2018 | 500,000 |
| 250,000 | 2 | Federal Home Loan Bank System Floating Rate Notes, 1.225% (3-month USLIBOR -0.185%), 2/10/2018 | 250,000 |
| 500,000 | 2 | Federal Home Loan Bank System Floating Rate Notes, 1.249% (3-month USLIBOR -0.205%), 2/23/2018 | 500,000 |
| 1,000,000 | 2 | Federal Home Loan Bank System Floating Rate Notes, 1.294% - 1.308% (3-month USLIBOR -0.160%), 2/24/2018 - 2/28/2018 | 999,915 |
| 1,000,000 | 2 | Federal Home Loan Bank System Floating Rate Notes, 1.306% - 1.313% (3-month USLIBOR -0.030%), 1/4/2018 - 1/5/2018 | 1,000,000 |
| 1,500,000 | 2 | Federal Home Loan Bank System Floating Rate Notes, 1.316% - 1.507% (1-month USLIBOR -0.045%), 1/1/2018 - 1/25/2018 | 1,499,944 |
| 250,000 | 2 | Federal Home Loan Bank System Floating Rate Notes, 1.317% (1-month USLIBOR -0.155%), 1/12/2018 | 250,000 |
| 2,000,000 | 2 | Federal Home Loan Bank System Floating Rate Notes, 1.327% - 1.402% (1-month USLIBOR -0.150%), 1/15/2018 - 1/23/2018 | 2,000,000 |
| 250,000 | 2 | Federal Home Loan Bank System Floating Rate Notes, 1.329% (1-month USLIBOR -0.050%), 1/5/2018 | 250,000 |
| 250,000 | 2 | Federal Home Loan Bank System Floating Rate Notes, 1.342% (1-month USLIBOR -0.090%), 1/9/2018 | 250,000 |
| 500,000 | 2 | Federal Home Loan Bank System Floating Rate Notes, 1.348% (1-month USLIBOR -0.143%), 1/18/2018 | 500,000 |
| 1,100,000 | 2 | Federal Home Loan Bank System Floating Rate Notes, 1.351% (1-month USLIBOR -0.140%), 1/16/2018 | 1,100,000 |
| 1,500,000 | 2 | Federal Home Loan Bank System Floating Rate Notes, 1.371% (1-month USLIBOR -0.120%), 1/16/2018 - 1/17/2018 | 1,500,000 |
| 750,000 | 2 | Federal Home Loan Bank System Floating Rate Notes, 1.372% - 1.431% (1-month USLIBOR -0.060%), 1/11/2018 - 1/18/2018 | 750,000 |
| 1,000,000 | 2 | Federal Home Loan Bank System Floating Rate Notes, 1.376% - 1.386% (1-month USLIBOR -0.125%), 1/20/2018 - 1/21/2018 | 1,000,000 |
| 1,750,000 | 2 | Federal Home Loan Bank System Floating Rate Notes, 1.392% - 1.404% (1-month USLIBOR -0.160%), 1/25/2018 - 1/28/2018 | 1,750,000 |
| 750,000 | 2 | Federal Home Loan Bank System Floating Rate Notes, 1.415% - 1.421% (1-month USLIBOR -0.080%), 1/19/2018 - 1/20/2018 | 750,042 |
| 700,000 | 2 | Federal Home Loan Bank System Floating Rate Notes, 1.420% (1-month USLIBOR -0.115%), 1/22/2018 | 700,000 |
| 200,000 | 2 | Federal Home Loan Bank System Floating Rate Notes, 1.421% (1-month USLIBOR -0.070%), 1/18/2018 | 200,000 |
| 500,000 | 2 | Federal Home Loan Bank System Floating Rate Notes, 1.436% (3-month USLIBOR -0.250%), 3/28/2018 | 500,000 |
| 250,000 | 2 | Federal Home Loan Bank System Floating Rate Notes, 1.446% (1-month USLIBOR -0.055%), 1/20/2018 | 250,000 |
| 250,000 | 2 | Federal Home Loan Bank System Floating Rate Notes, 1.473% (3-month USLIBOR -0.140%), 3/19/2018 | 250,000 |
| 250,000 | 2 | Federal Home Loan Bank System Floating Rate Notes, 1.495% (1-month USLIBOR -0.040%), 1/22/2018 | 250,000 |
| 250,000 | 2 | Federal Home Loan Bank System Floating Rate Notes, 1.517% (1-month USLIBOR -0.035%), 1/23/2018 | 250,051 |
| 3,525,000 | Federal Home Loan Bank System, 0.625% - 2.750%, 6/8/2018 - 9/17/2018 | 3,525,103 | |
| 500,000 | 2 | Federal Home Loan Mortgage Corp. Floating Rate Notes, 1.117% (3-month USLIBOR -0.250%), 1/25/2018 | 500,000 |
| 1,000,000 | 2 | Federal Home Loan Mortgage Corp. Floating Rate Notes, 1.241% (1-month USLIBOR -0.120%), 1/1/2018 | 1,000,000 |
| 2,000,000 | 2 | Federal Home Loan Mortgage Corp. Floating Rate Notes, 1.543% (3-month USLIBOR +0.020%), 3/8/2018 | 2,000,000 |
| 3,693,000 | Federal Home Loan Mortgage Corp., 0.875% - 1.250%, 2/26/2018 - 12/14/2018 | 3,687,616 | |
| 700,000 | 2 | Federal National Mortgage Association Floating Rate Notes, 1.326% (3-month USLIBOR -0.030%), 1/11/2018 | 700,000 |
| 170,000 | Federal National Mortgage Association, 0.750%, 7/27/2018 | 169,501 |
| Principal Amount | Value | ||
| GOVERNMENT AGENCIES—continued | |||
| $388,000 | Tennessee Valley Authority, 1.750%, 10/15/2018 | $389,201 | |
| TOTAL GOVERNMENT AGENCIES | 40,049,992 | ||
| U.S. TREASURY—0.3% | |||
| U.S. Treasury Notes—0.3% | |||
| 250,000 | United States Treasury Notes, 2.625%, 1/31/2018 | 250,355 | |
| REPURCHASE AGREEMENTS—55.5% | |||
| 20,000,000 | Interest in $250,000,000 joint repurchase agreement 1.41%, dated 12/29/2017 under which ABN Amro Bank N.V., Netherlands will repurchase securities provided as collateral for $250,039,167 on 1/2/2018. The securities provided as collateral at the end of the period held with BNY Mellon as tri-party agent, were U.S. Government Agency and U.S. Treasury securities with various maturities to 7/1/2047 and the market value of those underlying securities was $255,535,791. | 20,000,000 | |
| 10,000,000 | Interest in $750,000,000 joint repurchase agreement 1.40%, dated 12/29/2017 under which BNP Paribas S.A. will repurchase securities provided as collateral for $750,116,667 on 1/2/2018. The securities provided as collateral at the end of the period were U.S. Treasury securities with various maturities to 4/15/2018 and the market value of those underlying securities was $764,535,793. | 10,000,000 | |
| 2,000,000 | Interest in $4,000,000,000 joint repurchase agreement 1.36%, dated 12/29/2017 under which Barclays Bank PLC will repurchase securities provided as collateral for $4,000,604,444 on 1/2/2018. The securities provided as collateral at the end of the period held with BNY Mellon as tri-party agent, were U.S. Treasury securities with various maturities to 8/15/2047 and the market value of those underlying securities was $4,080,616,607. | 2,000,000 | |
| 20,000,000 | Interest in $450,000,000 joint repurchase agreement 1.44%, dated 12/29/2017 under which J.P. Morgan Securities LLC will repurchase securities provided as collateral for $450,072,000 on 1/2/2018. The securities provided as collateral at the end of the period held with JPMorgan Chase as tri-party agent, were U.S. Government Agency securities with various maturities to 1/15/2054 and the market value of those underlying securities was $463,500,419. | 20,000,000 | |
| TOTAL REPURCHASE AGREEMENTS | 52,000,000 | ||
| TOTAL INVESTMENT IN SECURITIES—98.5% (AT AMORTIZED COST)3 | 92,300,347 | ||
| OTHER ASSETS AND LIABILITIES - NET—1.5%4 | 1,418,719 | ||
| TOTAL NET ASSETS—100% | $93,719,066 |
| 1 | Discount rate(s) at time of purchase. |
| 2 | Floating/variable note with current rate and current maturity or next reset date shown. |
| 3 | Also represents cost for federal tax purposes. |
| 4 | Assets, other than investments in securities, less liabilities. See Statement of Assets and Liabilities. |
| LIBOR | —London Interbank Offered Rate |
| Year Ended 12/31/2017 | Period Ended 12/31/20161 | |
| Net Asset Value, Beginning of Period | $1.00 | $1.00 |
| Income From Investment Operations: | ||
| Net investment income | 0.002 | 0.0002 |
| Net realized gain on investments | 0.004 | — |
| TOTAL FROM INVESTMENT OPERATIONS | 0.006 | 0.0002 |
| Less Distributions: | ||
| Distributions from net investment income | (0.006) | (0.000)2 |
| TOTAL DISTRIBUTIONS | (0.006) | (0.000)2 |
| Net Asset Value, End of Period | $1.00 | $1.00 |
| Total Return3 | 0.56% | 0.06% |
| Ratios to Average Net Assets: | ||
| Net expenses | 0.38% | —% |
| Net investment income | 0.17% | 0.02%4 |
| Expense waiver/reimbursement | —% | —% |
| Supplemental Data: | ||
| Net assets, end of period (000 omitted) | $05 | $05 |
| 1 | Reflects operations for the period from April 29, 2016 (date of initial investment) to December 31, 2016. |
| 2 | Represents less than $0.001. |
| 3 | Based on net asset value. Total returns do not reflect any additional fees or expenses that may be imposed by separate accounts of insurance companies or in connection with any variable annuity or variable life insurance contract. |
| 4 | Computed on an annualized basis. |
| 5 | Represents less than $1,000. |
| Year Ended December 31 | 2017 | 2016 | 2015 | 2014 | 2013 |
| Net Asset Value, Beginning of Period | $1.00 | $1.00 | $1.00 | $1.00 | $1.00 |
| Income From Investment Operations: | |||||
| Net investment income | 0.003 | 0.0001 | — | — | — |
| Net realized gain (loss) on investments | 0.0001 | (0.000)1 | 0.0001 | 0.0001 | 0.0001 |
| TOTAL FROM INVESTMENT OPERATIONS | 0.003 | (0.000)1 | 0.0001 | 0.0001 | 0.0001 |
| Less Distributions: | |||||
| Distributions from net investment income | (0.003) | (0.000)1 | — | — | — |
| Distributions from net realized gain on investments | — | — | (0.000)1 | — | — |
| TOTAL DISTRIBUTIONS | (0.003) | (0.000)1 | (0.000)1 | — | — |
| Net Asset Value, End of Period | $1.00 | $1.00 | $1.00 | $1.00 | $1.00 |
| Total Return2 | 0.31% | 0.00% | 0.00% | 0.00% | 0.00% |
| Ratios to Average Net Assets: | |||||
| Net expenses | 0.63% | 0.49% | 0.34% | 0.26% | 0.27% |
| Net investment income | 0.30% | 0.00%3 | 0.00% | 0.00% | 0.00% |
| Expense waiver/reimbursement4 | 0.07% | 0.19% | 0.40% | 0.42% | 0.41% |
| Supplemental Data: | |||||
| Net assets, end of period (000 omitted) | $93,719 | $112,214 | $139,170 | $132,678 | $154,973 |
| 1 | Represents less than $0.001. |
| 2 | Based on net asset value. Total returns do not reflect any additional fees or expenses that may be imposed by separate accounts of insurance companies or in connection with any variable annuity or variable life insurance contract. Total returns for periods of less than one year are not annualized. |
| 3 | Represents less than 0.01%. |
| 4 | This expense decrease is reflected in both the net expense and the net investment income ratios shown above. |
| Assets: | ||
| Investment in repurchase agreements | $52,000,000 | |
| Investment in securities | 40,300,347 | |
| Investment in securities, at amortized cost and fair value | $92,300,347 | |
| Cash | 813,589 | |
| Receivable for investments sold | 1,000,000 | |
| Income receivable | 88,580 | |
| Receivable for shares sold | 3,557 | |
| TOTAL ASSETS | 94,206,073 | |
| Liabilities: | ||
| Payable for investments purchased | $294,540 | |
| Payable for shares redeemed | 110,652 | |
| Payable to adviser (Note 5) | 857 | |
| Payable for administrative fees (Note 5) | 618 | |
| Payable for portfolio accounting fees | 31,808 | |
| Payable for other service fees (Notes 2 and 5) | 20,287 | |
| Payable for printing and postage | 19,425 | |
| Accrued expenses (Note 5) | 8,820 | |
| TOTAL LIABILITIES | 487,007 | |
| Net assets for 93,720,432 shares outstanding | $93,719,066 | |
| Net Assets Consist of: | ||
| Paid-in capital | $93,719,981 | |
| Accumulated net realized loss on investments | (942) | |
| Undistributed net investment income | 27 | |
| TOTAL NET ASSETS | $93,719,066 | |
| Net Asset Value, Offering Price and Redemption Proceeds Per Share | ||
| Primary Shares: | ||
| $100 ÷ 100 shares outstanding, no par value, unlimited shares authorized | $1.00 | |
| Service Shares: | ||
| $93,718,966 ÷ 93,720,332 shares outstanding, no par value, unlimited shares authorized | $1.00 |
| Investment Income: | |||
| Interest | $933,177 | ||
| Expenses: | |||
| Investment adviser fee (Note 5) | $199,518 | ||
| Administrative fee (Note 5) | 78,947 | ||
| Custodian fees | 9,366 | ||
| Transfer agent fee | 5,183 | ||
| Directors'/Trustees' fees (Note 5) | 2,057 | ||
| Auditing fees | 23,429 | ||
| Legal fees | 8,834 | ||
| Portfolio accounting fees | 77,555 | ||
| Other service fees (Notes 2 and 5) | 246,524 | ||
| Printing and postage | 48,016 | ||
| Miscellaneous (Note 5) | 5,276 | ||
| TOTAL EXPENSES | 704,705 | ||
| Waiver and Reimbursement: | |||
| Waiver of investment adviser fee (Note 5) | $(74,208) | ||
| Reimbursement of other operating expenses (Notes 2 and 5) | (144) | ||
| TOTAL WAIVER AND REIMBURSEMENT | (74,352) | ||
| Net expenses | 630,353 | ||
| Net investment income | 302,824 | ||
| Net realized gain on investments | 7 | ||
| Change in net assets resulting from operations | $302,831 |
| Year Ended December 31 | 2017 | 2016 |
| Increase (Decrease) in Net Assets | ||
| Operations: | ||
| Net investment income | $302,824 | $105 |
| Net realized gain (loss) on investments | 7 | (949) |
| CHANGE IN NET ASSETS RESULTING FROM OPERATIONS | 302,831 | (844) |
| Distributions to Shareholders: | ||
| Distributions from net investment income | ||
| Service Shares | (302,805) | (96) |
| Primary Shares | (1) | (0)1 |
| CHANGE IN NET ASSETS RESULTING FROM DISTRIBUTIONS TO SHAREHOLDERS | (302,806) | (96) |
| Share Transactions: | ||
| Proceeds from sale of shares | 40,826,268 | 65,231,701 |
| Net asset value of shares issued to shareholders in payment of distributions declared | 302,806 | 96 |
| Cost of shares redeemed | (59,624,139) | (92,186,339) |
| CHANGE IN NET ASSETS RESULTING FROM SHARE TRANSACTIONS | (18,495,065) | (26,954,542) |
| Change in net assets | (18,495,040) | (26,955,482) |
| Net Assets: | ||
| Beginning of period | 112,214,106 | 139,169,588 |
| End of period (including undistributed net investment income of $27 and $9, respectively) | $93,719,066 | $112,214,106 |
| 1 | Represents less than $1. |
| Other Service Fees Incurred | Other Service Fees Reimbursed | |
| Service Shares | $246,524 | $(144) |
| Year Ended 12/31/2017 | Period Ended 12/31/20161 | |||
| Primary Shares: | Shares | Amount | Shares | Amount |
| Shares sold | — | $— | 100 | $100 |
| NET CHANGE RESULTING FROM PRIMARY SHARE TRANSACTIONS | — | $— | 100 | $100 |
| Year Ended December 31 | 2017 | 2016 | ||
| Service Shares:2 | Shares | Amount | Shares | Amount |
| Shares sold | 40,826,268 | $40,826,268 | 65,231,601 | $65,231,601 |
| Shares issued to shareholders in payment of distributions declared | 302,806 | 302,806 | 96 | 96 |
| Shares redeemed | (59,624,139) | (59,624,139) | (92,186,339) | (92,186,339) |
| NET CHANGE RESULTING FROM SERVICE SHARE TRANSACTIONS | (18,495,065) | $(18,495,065) | (26,954,642) | $(26,954,642) |
| NET CHANGE RESULTING FROM TOTAL FUND SHARE TRANSACTIONS | (18,495,065) | $(18,495,065) | (26,954,542) | $(26,954,542) |
| 1 | Reflects operations for the period from April 29, 2016 (date of initial investment) to December 31, 2016. |
| 2 | Effective April 29, 2016, the Fund's original shares were redesignated as Service Shares. |
| 2017 | 2016 | |
| Ordinary income | $302,806 | $96 |
| Undistributed ordinary income | $27 |
| Capital loss carryforwards | $(942) |
| Short-Term | Long-Term | Total |
| $444 | $498 | $942 |
| Administrative Fee | Average Daily Net Assets of the Investment Complex |
| 0.100% | on assets up to $50 billion |
| 0.075% | on assets over $50 billion |
| Administrative Fee | Average Daily Net Assets of the Investment Complex |
| 0.150% | on the first $5 billion |
| 0.125% | on the next $5 billion |
| 0.100% | on the next $10 billion |
| 0.075% | on assets in excess of $20 billion |
| Share Class Name | Percentage of Average Daily Net Assets of Class |
| Primary Shares | 0.25% |
February 14, 2018
| Beginning Account Value 7/1/2017 | Ending Account Value 12/31/2017 | Expenses Paid During Period1 | |
| Actual: | |||
| Primary Shares | $1,000 | $1,003.70 | $1.92 |
| Service Shares | $1,000 | $1,002.40 | $3.18 |
| Hypothetical (assuming a 5% return before expenses): | |||
| Primary Shares | $1,000 | $1,023.30 | $1.94 |
| Service Shares | $1,000 | $1,022.00 | $3.21 |
| 1 | Expenses are equal to the Fund's annualized net expense ratios, multiplied by the average account value over the period, multiplied by 184/365 (to reflect the one-half-year period). The expenses shown in the table do not include the charges and expenses imposed by the insurance company under the variable insurance product contract. Please refer to the variable insurance product prospectus for a complete listing of these expenses. The annualized net expense ratios are as follows: |
| Primary Shares | 0.38% |
| Service Shares | 0.63% |
| Name Birth Date Positions Held with Trust Date Service Began | Principal Occupation(s) for Past Five Years, Other Directorships Held and Previous Position(s) |
| J. Christopher Donahue* Birth Date: April 11, 1949 Trustee Indefinite Term Began serving: September 1993 | Principal Occupations: Principal Executive Officer and President of certain of the Funds in the Federated Fund Family; Director or Trustee of the Funds in the Federated Fund Family; President, Chief Executive Officer and Director, Federated Investors, Inc.; Chairman and Trustee, Federated Investment Management Company; Trustee, Federated Investment Counseling; Chairman and Director, Federated Global Investment Management Corp.; Chairman and Trustee, Federated Equity Management Company of Pennsylvania; Trustee, Federated Shareholder Services Company; Director, Federated Services Company. Previous Positions: President, Federated Investment Counseling; President and Chief Executive Officer, Federated Investment Management Company, Federated Global Investment Management Corp. and Passport Research, Ltd; Chairman, Passport Research, Ltd. |
| Thomas R. Donahue* Birth Date: October 20, 1958 Trustee Indefinite Term Began serving: May 2016 | Principal Occupations: Director or Trustee of certain of the funds in the Federated Fund Family; Chief Financial Officer, Treasurer, Vice President and Assistant Secretary, Federated Investors, Inc.; Chairman and Trustee, Federated Administrative Services; Chairman and Director, Federated Administrative Services, Inc.; Trustee and Treasurer, Federated Advisory Services Company; Director or Trustee and Treasurer, Federated Equity Management Company of Pennsylvania, Federated Global Investment Management Corp., Federated Investment Counseling, and Federated Investment Management Company; Director, MDTA LLC; Director, Executive Vice President and Assistant Secretary, Federated Securities Corp.; Director or Trustee and Chairman, Federated Services Company and Federated Shareholder Services Company; and Director and President, FII Holdings, Inc. Previous Positions: Director, Federated Investors, Inc.; Assistant Secretary, Federated Investment Management Company, Federated Global Investment Management Company and Passport Research, LTD; Treasurer, Passport Research, LTD; Executive Vice President, Federated Securities Corp.; and Treasurer, FII Holdings, Inc. |
| * | Family relationships and reasons for “interested” status: J. Christopher Donahue and Thomas R. Donahue are brothers. Both are “interested” due to their beneficial ownership of shares of Federated Investors, Inc. and the positions they hold with Federated and its subsidiaries. |
| Name Birth Date Positions Held with Trust Date Service Began | Principal Occupation(s) for Past Five Years, Other Directorships Held, Previous Position(s) and Qualifications |
| John T. Collins Birth Date: January 24, 1947 Trustee Indefinite Term Began serving: October 2013 | Principal Occupations: Director or Trustee of the Federated Fund Family; formerly, Chairman and CEO, The Collins Group, Inc. (a private equity firm) (Retired). Other Directorships Held: Director, Current Chair of the Compensation Committee, KLX Corp. Qualifications: Mr. Collins has served in several business and financial management roles and directorship positions throughout his career. Mr. Collins previously served as Chairman and CEO, The Collins Group, Inc. (a private equity firm). Mr. Collins serves as Chairman Emeriti, Bentley University. Mr. Collins previously served as Director and Audit Committee Member, Bank of America Corp.; Director, FleetBoston Financial Corp.; and Director, Beth Israel Deaconess Medical Center (Harvard University Affiliate Hospital). |
| G. Thomas Hough Birth Date: February 28, 1955 Trustee Indefinite Term Began serving: August 2015 | Principal Occupations: Director or Trustee of the Federated Fund Family; formerly, Vice Chair, Ernst & Young LLP (public accounting firm) (Retired). Other Directorships Held: Director, Chair of the Audit Committee, Governance Committee, Publix Super Markets, Inc.; Director, Member of the Audit Committee and Technology Committee of Equifax, Inc. Qualifications: Mr. Hough has served in accounting, business management and directorship positions throughout his career. Mr. Hough most recently held the position of Americas Vice Chair of Assurance with Ernst & Young LLP (public accounting firm). Mr. Hough is an Executive Committee member of the United States Golf Association, he serves on the President's Cabinet and Business School Board of Visitors for the University of Alabama and is on the Business School Board of Visitors for Wake Forest University. |
| Name Birth Date Positions Held with Trust Date Service Began | Principal Occupation(s) for Past Five Years, Other Directorships Held, Previous Position(s) and Qualifications |
| Maureen Lally-Green Birth Date: July 5, 1949 Trustee Indefinite Term Began serving: August 2009 | Principal Occupations: Director or Trustee of the Federated Fund Family; Dean of the Duquesne University School of Law; Professor and Adjunct Professor of Law, Duquesne University School of Law; formerly, Interim Dean of the Duquesne University School of Law; Associate General Secretary and Director, Office of Church Relations, Diocese of Pittsburgh. Other Directorships Held: Director, CNX Resources Corporation (formerly known as CONSOL Energy Inc.). Qualifications: Judge Lally-Green has served in various legal and business roles and directorship positions throughout her career. Judge Lally-Green previously served as: Associate General Secretary, Diocese of Pittsburgh; a member of the Superior Court of Pennsylvania; and as a Professor of Law, Duquesne University School of Law. Judge Lally-Green also currently holds the positions on either a public or not for profit Board of Directors as follows: Director and Chair, UPMC Mercy Hospital; Director and Vice Chair, Our Campaign for the Church Alive!, Inc.; Director, Saint Vincent College; Member, Pennsylvania State Board of Education (public); and Director CNX Resources Corporation (formerly known as CONSOL Energy Inc.), where she currently serves as a member of the Compensation, Nominating and Corporate Governance Committee (Chair) and the Health, Safety and Environmental Committee. Judge Lally-Green has held the positions of: Director, Auberle; Director, Epilepsy Foundation of Western and Central Pennsylvania; Director, Ireland Institute of Pittsburgh; Director, Saint Thomas More Society; Director and Chair, Catholic High Schools of the Diocese of Pittsburgh, Inc.; Director, Pennsylvania Bar Institute; Regent, St. Vincent Seminary; and Director and Chair, Cardinal Wuerl North Catholic High School, Inc. |
| Charles F. Mansfield, Jr. Birth Date: April 10, 1945 Trustee Indefinite Term Began serving: September 1999 | Principal Occupations: Director or Trustee of the Federated Fund Family; Management Consultant. Other Directorships Held: None. Qualifications: Mr. Mansfield has served as a Marine Corps officer and in several banking, business management, educational roles and directorship positions throughout his long career. He remains active as a Management Consultant. |
| Thomas M. O'Neill Birth Date: June 14, 1951 Trustee Indefinite Term Began serving: August 2006 | Principal Occupations: Director or Trustee, Chair of the Audit Committee of the Federated Fund Family; Sole Proprietor, Navigator Management Company (investment and strategic consulting). Other Directorships Held: None. Qualifications: Mr. O'Neill has served in several business, mutual fund and financial management roles and directorship positions throughout his career. Mr. O'Neill serves as Director, Medicines for Humanity and Director, The Golisano Children's Museum of Naples, Florida. Mr. O'Neill previously served as Chief Executive Officer and President, Managing Director and Chief Investment Officer, Fleet Investment Advisors; President and Chief Executive Officer, Aeltus Investment Management, Inc.; General Partner, Hellman, Jordan Management Co., Boston, MA; Chief Investment Officer, The Putnam Companies, Boston, MA; Credit Analyst and Lending Officer, Fleet Bank; Director and Consultant, EZE Castle Software (investment order management software); and Director, Midway Pacific (lumber). |
| P. Jerome Richey Birth Date: February 23, 1949 Trustee Indefinite Term Began serving: October 2013 | Principal Occupations: Director or Trustee of the Federated Fund Family; Management Consultant; formerly, Senior Vice Chancellor and Chief Legal Officer, University of Pittsburgh and Executive Vice President and Chief Legal Officer, CNX Resources Corporation (formerly known as CONSOL Energy Inc.) Other Directorships Held: None. Qualifications: Mr. Richey has served in several business and legal management roles and directorship positions throughout his career. Mr. Richey most recently held the positions of Senior Vice Chancellor and Chief Legal Officer, University of Pittsburgh. Mr. Richey previously served as Chairman of the Board, Epilepsy Foundation of Western Pennsylvania and Chairman of the Board, World Affairs Council of Pittsburgh. Mr. Richey previously served as Chief Legal Officer and Executive Vice President, CNX Resources Corporation (formerly known as CONSOL Energy Inc.); and Board Member, Ethics Counsel and Shareholder, Buchanan Ingersoll & Rooney PC (a law firm). |
| John S. Walsh Birth Date: November 28, 1957 Trustee Indefinite Term Began serving: January 1999 | Principal Occupations: Director or Trustee, and Chair of the Board of Directors or Trustees, of the Federated Fund Family; President and Director, Heat Wagon, Inc. (manufacturer of construction temporary heaters); President and Director, Manufacturers Products, Inc. (distributor of portable construction heaters); President, Portable Heater Parts, a division of Manufacturers Products, Inc. Other Directorships Held: None. Qualifications: Mr. Walsh has served in several business management roles and directorship positions throughout his career. Mr. Walsh previously served as Vice President, Walsh & Kelly, Inc. (paving contractors). |
| Name Birth Date Address Positions Held with Trust Date Service Began | Principal Occupation(s) for Past Five Years and Previous Position(s) |
| Lori A. Hensler Birth Date: January 6, 1967 TREASURER Officer since: April 2013 | Principal Occupations: Principal Financial Officer and Treasurer of the Federated Fund Family; Senior Vice President, Federated Administrative Services; Financial and Operations Principal for Federated Securities Corp. and Edgewood Services, Inc.; and Assistant Treasurer, Federated Investors Trust Company. Ms. Hensler has received the Certified Public Accountant designation. Previous Positions: Controller of Federated Investors, Inc.; Senior Vice President and Assistant Treasurer, Federated Investors Management Company; Treasurer, Federated Investors Trust Company; Assistant Treasurer, Federated Administrative Services, Federated Administrative Services, Inc., Federated Securities Corp., Edgewood Services, Inc., Federated Advisory Services Company, Federated Equity Management Company of Pennsylvania, Federated Global Investment Management Corp., Federated Investment Counseling, Federated Investment Management Company, Passport Research, Ltd., and Federated MDTA, LLC; Financial and Operations Principal for Federated Securities Corp., Edgewood Services, Inc. and Southpointe Distribution Services, Inc. |
| Peter J. Germain Birth Date: September 3, 1959 CHIEF LEGAL OFFICER, SECRETARY and EXECUTIVE VICE PRESIDENT Officer since: January 2005 | Principal Occupations: Mr. Germain is Chief Legal Officer, Secretary and Executive Vice President of the Federated Fund Family. He is General Counsel, Chief Legal Officer, Secretary and Executive Vice President, Federated Investors, Inc.; Trustee and Senior Vice President, Federated Investors Management Company; Trustee and President, Federated Administrative Services; Director and President, Federated Administrative Services, Inc.; Director and Vice President, Federated Securities Corp.; Director and Secretary, Federated Private Asset Management, Inc.; Secretary, Federated Shareholder Services Company; and Secretary, Retirement Plan Service Company of America. Mr. Germain joined Federated in 1984 and is a member of the Pennsylvania Bar Association. Previous Positions: Deputy General Counsel, Special Counsel, Managing Director of Mutual Fund Services, Federated Investors, Inc.; Senior Vice President, Federated Services Company; and Senior Corporate Counsel, Federated Investors, Inc. |
| Richard B. Fisher Birth Date: May 17, 1923 VICE PRESIDENT Officer since: September 1993 | Principal Occupations: Vice Chairman or Vice President of some of the Funds in the Federated Fund Family; Vice Chairman, Federated Investors, Inc.; Chairman, Federated Securities Corp. Previous Positions: President and Director or Trustee of some of the Funds in the Federated Fund Family; Executive Vice President, Federated Investors, Inc.; Director and Chief Executive Officer, Federated Securities Corp. |
| John B. Fisher Birth Date: May 16, 1956 PRESIDENT Officer since: November 2004 | Principal Occupations: Principal Executive Officer and President of certain of the Funds in the Federated Fund Family; Director or Trustee of certain of the Funds in the Federated Fund Family; Vice President, Federated Investors, Inc.; President, Director/Trustee and CEO, Federated Advisory Services Company, Federated Equity Management Company of Pennsylvania, Federated Global Investment Management Corp., Federated Investment Counseling, Federated Investment Management Company; President and CEO of Passport Research, Ltd.; President of some of the Funds in the Federated Fund Complex and Director, Federated Investors Trust Company. Previous Positions: President and Director of the Institutional Sales Division of Federated Securities Corp.; President and Director of Federated Investment Counseling; Director, Edgewood Securities Corp.; Director, Federated Services Company; Director, Federated Investors, Inc.; Chairman and Director, Southpointe Distribution Services, Inc. and President, Technology, Federated Services Company. |
| Stephen Van Meter Birth Date: June 5, 1975 CHIEF COMPLIANCE OFFICER AND SENIOR VICE PRESIDENT Officer since: July 2015 | Principal Occupations: Senior Vice President and Chief Compliance Officer of the Federated Fund Family; Vice President and Chief Compliance Officer of Federated Investors, Inc. and Chief Compliance Officer of certain of its subsidiaries. Mr. Van Meter joined Federated in October 2011. He holds FINRA licenses under Series 3, 7, 24 and 66. Previous Positions: Mr. Van Meter previously held the position of Compliance Operating Officer, Federated Investors, Inc. Prior to joining Federated, Mr. Van Meter served at the United States Securities and Exchange Commission in the positions of Senior Counsel, Office of Chief Counsel, Division of Investment Management and Senior Counsel, Division of Enforcement. |
| Stephen F. Auth Birth Date: September 13, 1956 101 Park Avenue 41st Floor New York, NY 10178 CHIEF INVESTMENT OFFICER Officer since: November 2002 | Principal Occupations: Stephen F. Auth is Chief Investment Officer of various Funds in the Federated Fund Family; Executive Vice President, Federated Investment Counseling, Federated Global Investment Management Corp. and Federated Equity Management Company of Pennsylvania. Previous Positions: Executive Vice President, Federated Investment Management Company and Passport Research, Ltd. (investment advisory subsidiary of Federated); Senior Vice President, Global Portfolio Management Services Division; Senior Vice President, Federated Investment Management Company and Passport Research, Ltd.; Senior Managing Director and Portfolio Manager, Prudential Investments. |
| Robert J. Ostrowski Birth Date: April 26, 1963 Chief Investment Officer Officer since: May 2004 | Principal Occupations: Robert J. Ostrowski joined Federated in 1987 as an Investment Analyst and became a Portfolio Manager in 1990. He was named Chief Investment Officer of Federated's taxable fixed-income products in 2004 and also serves as a Senior Portfolio Manager. Mr. Ostrowski became an Executive Vice President of the Fund's Adviser in 2009 and served as a Senior Vice President of the Fund's Adviser from 1997 to 2009. Mr. Ostrowski has received the Chartered Financial Analyst designation. He received his M.S. in Industrial Administration from Carnegie Mellon University. |
| Deborah A. Cunningham Birth Date: September 15, 1959 Chief Investment Officer Officer since: June 2012 | Principal Occupations: Deborah A. Cunningham was named Chief Investment Officer of Federated's money market products in 2004. She joined Federated in 1981 and has been a Senior Portfolio Manager since 1997 and an Executive Vice President of the Fund's Adviser since 2009. Ms. Cunningham has received the Chartered Financial Analyst designation and holds an M.S.B.A. in Finance from Robert Morris College. |
Federated Investors Funds
4000 Ericsson Drive
Warrendale, PA 15086-7561
or call 1-800-341-7400.
CUSIP 313916504
2018 ©Federated Investors, Inc.
| Share Class | Primary | Service |
| 1 | Please see the footnotes to the line graphs under “Fund Performance and Growth of a $10,000 Investment” below for the definition of, and more information about, the BBICI. |
| 2 | Duration is a measure of a security's price sensitivity to changes in interest rates. Securities with longer durations are more sensitive to changes in interest rates than securities of shorter durations. |
| 3 | Volatility is a statistical measurement of the frequency and level of changes in the value of an asset, index or instrument without regard to the direction of those changes. Volatility may result from rapid and dramatic price swings. |
| 4 | Investment-grade securities are securities that are rated at least “BBB- (minus)” or unrated securities of a comparable quality. Noninvestment-grade securities are securities that are not rated at least “BBB- (minus)” or unrated securities of a comparable quality. Credit ratings are an indication of the risk that a security will default. They do not protect a security from credit risk. Lower-rated bonds typically offer higher yields to help compensate investors for the increased risk associated with them. Among these risks are lower credit-worthiness, greater price volatility, more risk to principal and income than with higher-rated securities and increased possibilities of default. |
| 5 | Bond prices are sensitive to changes in interest rates, and a rise in interest rates can cause a decline in their prices. |
| 6 | The Fund's use of derivative instruments involves risks different from, or possibly greater than, the risks associated with investing directly in securities and other traditional instruments. |
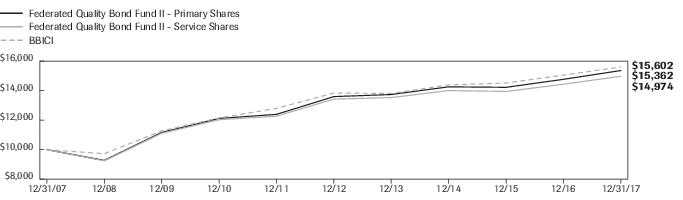
| Federated Quality Bond Fund II - | Primary Shares | Service Shares | NA | BBICI |
| F | F | NA | I | |
| 12/31/2007 | 10,000 | 10,000 | 10,000 | |
| 12/31/2008 | 9,271 | 9,245 | 9,724 | |
| 12/31/2009 | 11,166 | 11,108 | 11,272 | |
| 12/31/2010 | 12,115 | 12,028 | 12,146 | |
| 12/31/2011 | 12,391 | 12,267 | 12,799 | |
| 12/31/2012 | 13,595 | 13,426 | 13,836 | |
| 12/31/2013 | 13,736 | 13,527 | 13,812 | |
| 12/31/2014 | 14,257 | 14,002 | 14,387 | |
| 12/31/2015 | 14,222 | 13,941 | 14,516 | |
| 12/31/2016 | 14,766 | 14,433 | 15,050 | |
| 12/31/2017 | 15,362 | 14,974 | 15,602 |
| 1 Year | 5 Years | 10 Years | |
| Primary Shares | 4.04% | 2.47% | 4.39% |
| Service Shares | 3.75% | 2.21% | 4.12% |
| BBICI | 3.67% | 2.43% | 4.55% |
| 1 | The Fund's performance assumes the reinvestment of all dividends and distributions. The BBICI has been adjusted to reflect reinvestment of dividends on securities in the index. |
| 2 | The BBICI measures the investment-grade, U.S. dollar-denominated, fixed-rate, taxable corporate and government-related bond markets. The index only includes securities with maturity between one and ten years. It is composed of the Bloomberg Barclays U.S. Corporate Index and a non-corporate component that includes foreign agencies, sovereigns, supranationals and local authorities. The index is not adjusted to reflect sales loads, expenses or other fees that the Securities and Exchange Commission requires to be reflected in the Fund's performance. The index is unmanaged and, unlike the Fund, is not affected by cash flows. It is not possible to invest directly in an index. |
| Security Type | Percentage of Total Net Assets |
| Corporate Debt Securities | 96.7% |
| Foreign Government Debt Securities | 0.6% |
| Municipal Bond | 0.2% |
| Collateralized Mortgage Obligation | 0.1% |
| Mortgage-Backed Securities2 | 0.1% |
| Derivative Contracts3,4 | (0.0)% |
| Cash Equivalents5 | 1.3% |
| Other Assets and Liabilities—Net6 | 1.0% |
| TOTAL | 100.0% |
| 1 | See the Fund's Prospectus and Statement of Additional Information for a description of these security types. |
| 2 | For purposes of this table, Mortgage-Backed Securities include mortgage-backed securities guaranteed by Government-Sponsored Enterprises. |
| 3 | Represents less than 0.1%. |
| 4 | Based upon net unrealized appreciation (depreciation) or value of the derivative contracts as applicable. Derivative contracts may consist of futures, forwards, options and swaps. The impact of a derivative contract on the Fund's performance may be larger than its unrealized appreciation (depreciation) or value may indicate. In many cases, the notional value or amount of a derivative contract may provide a better indication of the contract's significance to the portfolio. More complete information regarding the Fund's direct investments in derivative contracts, including unrealized appreciation (depreciation), value and notional values or amounts of such contracts, can be found in the table at the end of the Portfolio of Investments included in this Report. |
| 5 | Cash Equivalents include any investments in money market mutual funds and/or overnight repurchase agreements. |
| 6 | Assets, other than investments in securities and derivative contracts, less liabilities. See Statement of Assets and Liabilities. |
| Principal Amount | Value | ||
| CORPORATE BONDS—96.7% | |||
| Basic Industry - Chemicals—1.1% | |||
| $640,000 | FMC Corp., Sr. Unsecd. Note, 3.95%, 2/1/2022 | $648,537 | |
| 800,000 | Incitec Pivot Finance LLC, Company Guarantee, Series 144A, 6.00%, 12/10/2019 | 847,725 | |
| 790,000 | RPM International, Inc., 6.50%, 2/15/2018 | 794,086 | |
| TOTAL | 2,290,348 | ||
| Basic Industry - Metals & Mining—2.3% | |||
| 230,000 | Carpenter Technology Corp., Sr. Unsecd. Note, 4.45%, 3/1/2023 | 234,712 | |
| 650,000 | Carpenter Technology Corp., Sr. Unsecd. Note, 5.20%, 7/15/2021 | 678,459 | |
| 520,000 | Gerdau S.A., Company Guarantee, Series 144A, 5.75%, 1/30/2021 | 556,400 | |
| 470,000 | Newcrest Finance Property Ltd., Sr. Unsecd. Note, Series 144A, 4.20%, 10/1/2022 | 489,971 | |
| 1,200,000 | Reliance Steel & Aluminum Co., Sr. Unsecd. Note, 4.50%, 4/15/2023 | 1,266,161 | |
| 320,000 | Southern Copper Corp., Sr. Unsecd. Note, 3.50%, 11/8/2022 | 329,444 | |
| 1,080,000 | Worthington Industries, Inc., Sr. Unsecd. Note, 6.50%, 4/15/2020 | 1,169,890 | |
| TOTAL | 4,725,037 | ||
| Capital Goods - Aerospace & Defense—2.1% | |||
| 600,000 | Airbus Group SE, Sr. Unsecd. Note, Series 144A, 3.15%, 4/10/2027 | 602,426 | |
| 270,000 | BAE Systems Holdings, Inc., Sr. Unsecd. Note, Series 144A, 2.85%, 12/15/2020 | 271,379 | |
| 280,000 | BAE Systems Holdings, Inc., Sr. Unsecd. Note, Series 144A, 3.85%, 12/15/2025 | 290,788 | |
| 519,000 | Embraer Overseas Ltd., Sr. Unsecd. Note, Series 144A, 5.696%, 9/16/2023 | 569,602 | |
| 410,000 | Huntington Ingalls Industries, Inc., Sr. Unsecd. Note, Series 144A, 3.483%, 12/1/2027 | 409,487 | |
| 270,000 | Lockheed Martin Corp., Sr. Unsecd. Note, 2.50%, 11/23/2020 | 271,888 | |
| 260,000 | Lockheed Martin Corp., Sr. Unsecd. Note, 3.55%, 1/15/2026 | 270,369 | |
| 300,000 | Northrop Grumman Corp., Sr. Unsecd. Note, 2.55%, 10/15/2022 | 298,155 | |
| 320,000 | Rockwell Collins, Inc., Sr. Unsecd. Note, 3.10%, 11/15/2021 | 324,594 | |
| 910,000 | 1 | Textron Financial Corp., Jr. Sub. Note, Series 144A, 3.151%, (3-month USLIBOR +1.735%), 2/15/2042 | 805,350 |
| 295,000 | Textron, Inc., Sr. Unsecd. Note, 4.30%, 3/1/2024 | 312,312 | |
| TOTAL | 4,426,350 | ||
| Capital Goods - Building Materials—0.7% | |||
| 800,000 | Allegion US Holdings Co., Inc., Sr. Unsecd. Note, 3.20%, 10/1/2024 | 792,600 | |
| 300,000 | Masco Corp., Sr. Unsecd. Note, 3.50%, 11/15/2027 | 296,270 | |
| 80,000 | Masco Corp., Sr. Unsecd. Note, 7.125%, 3/15/2020 | 87,634 | |
| 275,000 | Masco Corp., Unsecd. Note, 4.45%, 4/1/2025 | 292,958 | |
| TOTAL | 1,469,462 | ||
| Capital Goods - Construction Machinery—0.5% | |||
| 510,000 | AGCO Corp., Sr. Unsecd. Note, 5.875%, 12/1/2021 | 550,960 | |
| 250,000 | CNH Industrial Capital LLC, Sr. Unsecd. Note, 4.375%, 4/5/2022 | 259,618 | |
| 300,000 | CNH Industrial NV, Sr. Unsecd. Note, Series MTN, 3.85%, 11/15/2027 | 299,681 | |
| TOTAL | 1,110,259 | ||
| Capital Goods - Diversified Manufacturing—2.2% | |||
| 750,000 | CK Hutchison Holdings Ltd., Sr. Unsecd. Note, Series 144A, 2.75%, 3/29/2023 | 735,843 | |
| 430,000 | General Electric Capital Corp., Sr. Unsecd. Note, Series GMTN, 4.625%, 1/7/2021 | 456,318 | |
| 600,000 | General Electric Capital Corp., Sub. Note, 5.30%, 2/11/2021 | 648,097 | |
| 800,000 | Lennox International, Inc., Sr. Unsecd. Note, 3.00%, 11/15/2023 | 790,874 | |
| 650,000 | Parker-Hannifin Corp., Sr. Unsecd. Note, 3.25%, 3/1/2027 | 656,305 | |
| 600,000 | Roper Technologies, Inc., Sr. Unsecd. Note, 3.00%, 12/15/2020 | 607,511 | |
| 210,000 | Roper Technologies, Inc., Sr. Unsecd. Note, 3.80%, 12/15/2026 | 216,905 | |
| 341,000 | Valmont Industries, Inc., Sr. Unsecd. Note, 6.625%, 4/20/2020 | 371,182 | |
| TOTAL | 4,483,035 |
| Principal Amount | Value | ||
| CORPORATE BONDS—continued | |||
| Capital Goods - Packaging—0.1% | |||
| $75,000 | WestRock Co., 7.65%, 3/15/2020 | $76,943 | |
| 100,000 | WestRock Co., Sr. Deb., 7.50%, 6/15/2027 | 101,890 | |
| TOTAL | 178,833 | ||
| Communications - Cable & Satellite—2.2% | |||
| 940,000 | CCO Safari II LLC, 3.579%, 7/23/2020 | 958,025 | |
| 567,000 | CCO Safari II LLC, 4.464%, 7/23/2022 | 592,095 | |
| 600,000 | Comcast Corp., Sr. Unsecd. Note, 1.625%, 1/15/2022 | 580,489 | |
| 480,000 | Comcast Corp., Sr. Unsecd. Note, 2.75%, 3/1/2023 | 482,556 | |
| 1,290,000 | NBC Universal, Inc., Sr. Unsecd. Note, 5.15%, 4/30/2020 | 1,374,759 | |
| 400,000 | Time Warner Cable, Inc., Sr. Unsecd. Note, 8.375%, 3/15/2023 | 486,115 | |
| TOTAL | 4,474,039 | ||
| Communications - Media & Entertainment—1.4% | |||
| 300,000 | British Sky Broadcasting Group PLC, Series 144A, 3.75%, 9/16/2024 | 313,282 | |
| 750,000 | CBS Corp., 3.70%, 8/15/2024 | 772,667 | |
| 500,000 | Discovery Communications LLC, Sr. Unsecd. Note, 2.95%, 3/20/2023 | 495,359 | |
| 250,000 | Discovery Communications LLC, Sr. Unsecd. Note, 3.95%, 3/20/2028 | 249,106 | |
| 595,000 | Omnicom Group, Inc., Sr. Unsecd. Note, 3.625%, 5/1/2022 | 614,792 | |
| 500,000 | S&P Global, Inc., Sr. Unsecd. Note, 3.30%, 8/14/2020 | 509,576 | |
| TOTAL | 2,954,782 | ||
| Communications - Telecom Wireless—0.2% | |||
| 360,000 | Crown Castle International Corp., Sr. Unsecd. Note, 2.25%, 9/1/2021 | 354,198 | |
| Communications - Telecom Wirelines—3.1% | |||
| 700,000 | AT&T, Inc., Sr. Unsecd. Note, 2.45%, 6/30/2020 | 699,609 | |
| 610,000 | AT&T, Inc., Sr. Unsecd. Note, 2.85%, 2/14/2023 | 613,045 | |
| 450,000 | AT&T, Inc., Sr. Unsecd. Note, 3.40%, 5/15/2025 | 443,027 | |
| 800,000 | AT&T, Inc., Sr. Unsecd. Note, 3.90%, 8/14/2027 | 806,685 | |
| 1,090,000 | AT&T, Inc., Sr. Unsecd. Note, 5.00%, 3/1/2021 | 1,168,025 | |
| 500,000 | CenturyLink, Inc., Sr. Note, Series Q, 6.15%, 9/15/2019 | 518,750 | |
| 450,000 | Telefonica Emisiones SAU, Company Guarantee, 5.462%, 2/16/2021 | 487,078 | |
| 250,000 | Telefonica SA, Company Guarantee, 7.045%, 6/20/2036 | 336,153 | |
| 600,000 | Verizon Communications, Inc., Sr. Unsecd. Note, 4.15%, 3/15/2024 | 631,784 | |
| 735,000 | Verizon Communications, Inc., Sr. Unsecd. Note, 5.15%, 9/15/2023 | 818,688 | |
| TOTAL | 6,522,844 | ||
| Consumer Cyclical - Automotive—3.8% | |||
| 600,000 | American Honda Finance Corp., Sr. Unsecd. Note, Series MTN, 2.00%, 2/14/2020 | 597,077 | |
| 700,000 | Daimler Finance NA LLC, Sr. Unsecd. Note, Series 144A, 2.30%, 1/6/2020 | 698,590 | |
| 500,000 | Daimler Finance NA LLC, Sr. Unsecd. Note, Series 144A, 3.25%, 8/1/2024 | 510,473 | |
| 650,000 | Ford Motor Credit Co. LLC, Sr. Unsecd. Note, 2.021%, 5/3/2019 | 647,210 | |
| 600,000 | Ford Motor Credit Co. LLC, Sr. Unsecd. Note, 2.681%, 1/9/2020 | 601,709 | |
| 500,000 | Ford Motor Credit Co. LLC, Sr. Unsecd. Note, 3.336%, 3/18/2021 | 508,155 | |
| 670,000 | General Motors Co., Sr. Unsecd. Note, 4.00%, 4/1/2025 | 688,974 | |
| 300,000 | General Motors Financial Co., Inc., 3.15%, 6/30/2022 | 300,040 | |
| 550,000 | General Motors Financial Co., Inc., Sr. Unsecd. Note, 2.40%, 5/9/2019 | 550,269 | |
| 500,000 | General Motors Financial Co., Inc., Sr. Unsecd. Note, 3.20%, 7/6/2021 | 505,238 | |
| 750,000 | Nissan Motor Acceptance Corp., Sr. Unsecd. Note, Series 144A, 2.25%, 1/13/2020 | 748,832 | |
| 475,000 | Nissan Motor Acceptance Corp., Sr. Unsecd. Note, Series 144A, 2.65%, 7/13/2022 | 471,299 | |
| 1,000,000 | RCI Banque SA, Sr. Unsecd. Note, Series 144A, 3.50%, 4/3/2018 | 1,003,511 | |
| TOTAL | 7,831,377 | ||
| Consumer Cyclical - Leisure—0.5% | |||
| 1,000,000 | Football Trust V, Pass Thru Cert., Series 144A, 5.35%, 10/5/2020 | 1,064,983 |
| Principal Amount | Value | ||
| CORPORATE BONDS—continued | |||
| Consumer Cyclical - Lodging—0.2% | |||
| $450,000 | Choice Hotels International, Inc., Company Guarantee, 5.70%, 8/28/2020 | $483,187 | |
| Consumer Cyclical - Retailers—1.0% | |||
| 610,000 | AutoZone, Inc., Sr. Secd. Note, 1.625%, 4/21/2019 | 605,067 | |
| 460,000 | AutoZone, Inc., Sr. Unsecd. Note, 3.75%, 6/1/2027 | 467,628 | |
| 600,000 | CVS Health Corp., Sr. Unsecd. Note, 2.80%, 7/20/2020 | 602,817 | |
| 500,000 | Home Depot, Inc., Sr. Unsecd. Note, 2.125%, 9/15/2026 | 468,546 | |
| TOTAL | 2,144,058 | ||
| Consumer Cyclical - Services—1.6% | |||
| 500,000 | Alibaba Group Holding Ltd., Sr. Unsecd. Note, 3.40%, 12/6/2027 | 500,348 | |
| 500,000 | Amazon.com, Inc., Sr. Unsecd. Note, Series 144A, 2.40%, 2/22/2023 | 495,330 | |
| 170,000 | Amazon.com, Inc., Sr. Unsecd. Note, Series 144A, 3.15%, 8/22/2027 | 170,550 | |
| 350,000 | Expedia, Inc., Company Guarantee, 5.95%, 8/15/2020 | 376,765 | |
| 370,000 | University of Southern California, Sr. Unsecd. Note, 5.25%, 10/1/2111 | 468,079 | |
| 1,000,000 | Visa, Inc., Sr. Unsecd. Note, 2.80%, 12/14/2022 | 1,015,190 | |
| 280,000 | Visa, Inc., Sr. Unsecd. Note, 3.15%, 12/14/2025 | 286,464 | |
| TOTAL | 3,312,726 | ||
| Consumer Non-Cyclical - Food/Beverage—7.0% | |||
| 750,000 | Anheuser-Busch InBev Finance, Inc., 1.90%, 2/1/2019 | 748,592 | |
| 500,000 | Anheuser-Busch InBev Finance, Inc., 2.65%, 2/1/2021 | 502,825 | |
| 1,100,000 | Anheuser-Busch InBev Finance, Inc., 3.65%, 2/1/2026 | 1,136,820 | |
| 500,000 | Anheuser-Busch InBev Finance, Inc., Sr. Unsecd. Note, 3.30%, 2/1/2023 | 512,154 | |
| 210,000 | Bacardi Ltd., Sr. Unsecd. Note, Series 144A, 2.75%, 7/15/2026 | 202,112 | |
| 500,000 | Coca-Cola Femsa S.A.B de C.V., Sr. Unsecd. Note, 3.875%, 11/26/2023 | 523,903 | |
| 900,000 | Coca-Cola Femsa S.A.B de C.V., Sr. Unsecd. Note, 4.625%, 2/15/2020 | 943,599 | |
| 750,000 | Danone SA, Sr. Unsecd. Note, Series 144A, 2.077%, 11/2/2021 | 734,239 | |
| 340,000 | Danone SA, Sr. Unsecd. Note, Series 144A, 2.947%, 11/2/2026 | 331,603 | |
| 380,000 | Flowers Foods, Inc., Sr. Unsecd. Note, 3.50%, 10/1/2026 | 373,274 | |
| 500,000 | Grupo Bimbo SAB de CV, Sr. Unsecd. Note, Series 144A, 3.875%, 6/27/2024 | 517,010 | |
| 660,000 | Grupo Bimbo SAB de CV, Sr. Unsecd. Note, Series 144A, 4.50%, 1/25/2022 | 697,346 | |
| 270,000 | Heineken NV, Sr. Unsecd. Note, Series 144A, 3.50%, 1/29/2028 | 275,942 | |
| 1,050,000 | Kerry Group Financial Services, Sr. Unsecd. Note, Series 144A, 3.20%, 4/9/2023 | 1,058,515 | |
| 300,000 | Kraft Heinz Foods Co., Sr. Unsecd. Note, 3.00%, 6/1/2026 | 289,137 | |
| 410,000 | McCormick & Co., Inc., Sr. Unsecd. Note, 2.70%, 8/15/2022 | 410,077 | |
| 500,000 | McCormick & Co., Inc., Sr. Unsecd. Note, 3.15%, 8/15/2024 | 503,267 | |
| 600,000 | Mead Johnson Nutrition Co., Sr. Unsecd. Note, 3.00%, 11/15/2020 | 609,192 | |
| 540,000 | Molson Coors Brewing Co., Sr. Unsecd. Note, 2.10%, 7/15/2021 | 529,663 | |
| 520,000 | Mondelez International Holdings Netherlands BV, Sr. Unsecd. Note, Series 144A, 2.00%, 10/28/2021 | 506,294 | |
| 750,000 | PepsiCo, Inc., 2.75%, 3/5/2022 | 759,292 | |
| 500,000 | PepsiCo, Inc., Sr. Unsecd. Note, 2.00%, 4/15/2021 | 494,499 | |
| 600,000 | PepsiCo, Inc., Sr. Unsecd. Note, 3.125%, 11/1/2020 | 615,873 | |
| 380,000 | Smithfield Foods, Inc., Sr. Unsecd. Note, Series 144A, 2.65%, 10/3/2021 | 375,122 | |
| 240,000 | Smithfield Foods, Inc., Sr. Unsecd. Note, Series 144A, 3.35%, 2/1/2022 | 240,683 | |
| 60,000 | Smithfield Foods, Inc., Sr. Unsecd. Note, Series 144A, 4.25%, 2/1/2027 | 61,668 | |
| 500,000 | Tyson Foods, Inc., Sr. Unsecd. Note, 4.50%, 6/15/2022 | 534,506 | |
| TOTAL | 14,487,207 | ||
| Consumer Non-Cyclical - Health Care—2.7% | |||
| 420,000 | Agilent Technologies, Inc., Sr. Unsecd. Note, 3.200%, 10/1/2022 | 423,956 | |
| 940,000 | Agilent Technologies, Inc., Sr. Unsecd. Note, 3.875%, 7/15/2023 | 974,601 | |
| 890,000 | Bayer US Finance LLC, Unsecd. Note, Series 144A, 2.375%, 10/8/2019 | 890,625 | |
| 500,000 | Becton Dickinson & Co., Sr. Unsecd. Note, 2.894%, 6/6/2022 | 497,322 |
| Principal Amount | Value | ||
| CORPORATE BONDS—continued | |||
| Consumer Non-Cyclical - Health Care—continued | |||
| $740,000 | Becton Dickinson & Co., Sr. Unsecd. Note, 3.734%, 12/15/2024 | $758,859 | |
| 220,000 | Becton Dickinson & Co., Sr. Unsecd. Note, Series 144A, 3.000%, 5/15/2026 | 216,449 | |
| 670,000 | Medtronic Global Holdings SCA, Sr. Unsecd. Note, 3.35%, 4/1/2027 | 688,069 | |
| 340,000 | Stryker Corp., Sr. Unsecd. Note, 2.00%, 3/8/2019 | 339,548 | |
| 250,000 | Thermo Fisher Scientific, Inc., Sr. Unsecd. Note, 2.95%, 9/19/2026 | 243,322 | |
| 500,000 | Thermo Fisher Scientific, Inc., Sr. Unsecd. Note, 3.00%, 4/15/2023 | 503,604 | |
| TOTAL | 5,536,355 | ||
| Consumer Non-Cyclical - Pharmaceuticals—3.2% | |||
| 300,000 | Abbott Laboratories, Sr. Unsecd. Note, 2.90%, 11/30/2021 | 303,713 | |
| 800,000 | Abbott Laboratories, Sr. Unsecd. Note, 3.75%, 11/30/2026 | 822,785 | |
| 475,000 | AbbVie, Inc., Sr. Unsecd. Note, 2.50%, 5/14/2020 | 476,698 | |
| 300,000 | AbbVie, Inc., Sr. Unsecd. Note, 3.60%, 5/14/2025 | 308,834 | |
| 67,000 | Actavis Funding SCS, Sr. Unsecd. Note, 4.75%, 3/15/2045 | 71,540 | |
| 605,000 | AstraZeneca PLC, Sr. Unsecd. Note, 2.375%, 6/12/2022 | 598,374 | |
| 180,000 | Biogen Idec, Inc., Sr. Unsecd. Note, 2.90%, 9/15/2020 | 182,557 | |
| 500,000 | Celgene Corp., Sr. Unsecd. Note, 2.875%, 8/15/2020 | 504,942 | |
| 340,000 | Celgene Corp., Sr. Unsecd. Note, 3.875%, 8/15/2025 | 352,410 | |
| 200,000 | Celgene Corp., Sr. Unsecd. Note, 5.00%, 8/15/2045 | 227,606 | |
| 330,000 | Gilead Sciences, Inc., Sr. Unsecd. Note, 3.50%, 2/1/2025 | 341,524 | |
| 220,000 | Gilead Sciences, Inc., Sr. Unsecd. Note, 3.65%, 3/1/2026 | 228,405 | |
| 330,000 | Shire Acquisitions Investments Ireland DAC, Sr. Unsecd. Note, 2.40%, 9/23/2021 | 325,058 | |
| 640,000 | Shire Acquisitions Investments Ireland DAC, Sr. Unsecd. Note, 3.20%, 9/23/2026 | 626,768 | |
| 900,000 | Teva Pharmaceutical Finance III BV, Sr. Unsecd. Note, 2.20%, 7/21/2021 | 822,727 | |
| 600,000 | Teva Pharmaceutical Finance III BV, Sr. Unsecd. Note, 3.15%, 10/1/2026 | 496,167 | |
| TOTAL | 6,690,108 | ||
| Consumer Non-Cyclical - Products—1.0% | |||
| 575,000 | Church and Dwight, Inc., Sr. Unsecd. Note, 2.45%, 8/1/2022 | 568,494 | |
| 250,000 | Newell Rubbermaid, Inc., Sr. Unsecd. Note, 3.15%, 4/1/2021 | 252,963 | |
| 1,250,000 | Reckitt Benckiser Treasury Services PLC, Sr. Unsecd. Note, Series 144A, 2.375%, 6/24/2022 | 1,226,100 | |
| TOTAL | 2,047,557 | ||
| Consumer Non-Cyclical - Supermarkets—0.4% | |||
| 610,000 | Kroger Co., Bond, 6.90%, 4/15/2038 | 790,416 | |
| Consumer Non-Cyclical - Tobacco—0.6% | |||
| 290,000 | BAT International Finance PLC, Sr. Unsecd. Note, Series 144A, 3.95%, 6/15/2025 | 302,518 | |
| 500,000 | Bat Capital Corp., Sr. Unsecd. Note, Series 144A, 2.297%, 8/14/2020 | 497,529 | |
| 360,000 | Reynolds American, Inc., Sr. Unsecd. Note, 7.00%, 8/4/2041 | 488,396 | |
| TOTAL | 1,288,443 | ||
| Energy - Independent—1.1% | |||
| 600,000 | Anadarko Petroleum Corp., Sr. Unsecd. Note, 3.45%, 7/15/2024 | 598,257 | |
| 232,000 | Apache Corp., Sr. Unsecd. Note, 3.25%, 4/15/2022 | 233,945 | |
| 420,000 | Canadian Natural Resources Ltd., Sr. Unsecd. Note, 2.95%, 1/15/2023 | 418,545 | |
| 500,000 | Cimarex Energy Co., Sr. Unsecd. Note, 3.90%, 5/15/2027 | 512,093 | |
| 475,000 | Marathon Oil Corp., Sr. Unsecd. Note, 3.85%, 6/1/2025 | 484,182 | |
| TOTAL | 2,247,022 | ||
| Energy - Integrated—2.5% | |||
| 500,000 | BP Capital Markets PLC, 2.50%, 11/6/2022 | 497,690 | |
| 500,000 | BP Capital Markets PLC, Sr. Unsecd. Note, 2.315%, 2/13/2020 | 501,342 | |
| 500,000 | BP Capital Markets PLC, Sr. Unsecd. Note, 2.75%, 5/10/2023 | 500,501 | |
| 500,000 | BP Capital Markets PLC, Sr. Unsecd. Note, 3.994%, 9/26/2023 | 532,084 | |
| 530,000 | CNPC Hong Kong Overseas Capital Ltd., Company Guarantee, Series 144A, 5.95%, 4/28/2041 | 685,882 |
| Principal Amount | Value | ||
| CORPORATE BONDS—continued | |||
| Energy - Integrated—continued | |||
| $585,000 | Husky Energy, Inc., 4.00%, 4/15/2024 | $611,799 | |
| 800,000 | Petroleos Mexicanos, Company Guarantee, 5.50%, 1/21/2021 | 849,800 | |
| 175,000 | Petroleos Mexicanos, Sr. Unsecd. Note, 4.875%, 1/18/2024 | 181,729 | |
| 525,000 | Shell International Finance B.V., Sr. Unsecd. Note, 1.875%, 5/10/2021 | 517,479 | |
| 325,000 | Shell International Finance B.V., Sr. Unsecd. Note, 2.875%, 5/10/2026 | 325,274 | |
| TOTAL | 5,203,580 | ||
| Energy - Midstream—3.2% | |||
| 500,000 | Andeavor Logistics LP, Sr. Unsecd. Note, 3.50%, 12/1/2022 | 499,542 | |
| 350,000 | Columbia Pipeline Group, Inc., 3.30%, 6/1/2020 | 355,176 | |
| 200,000 | Columbia Pipeline Group, Inc., Sr. Unsecd. Note, 4.50%, 6/1/2025 | 213,227 | |
| 565,000 | Energy Transfer Partners LP, Sr. Unsecd. Note, 4.90%, 2/1/2024 | 598,135 | |
| 460,000 | Enterprise Products Operating LLC, 3.90%, 2/15/2024 | 479,856 | |
| 200,000 | Enterprise Products Operating LLC, Sr. Unsecd. Note, 3.95%, 2/15/2027 | 208,205 | |
| 280,000 | Florida Gas Transmission Co. LLC, Sr. Unsecd. Note, Series 144A, 5.45%, 7/15/2020 | 298,795 | |
| 1,600,000 | Kinder Morgan Energy Partners LP, Sr. Unsecd. Note, 5.30%, 9/15/2020 | 1,706,293 | |
| 395,000 | MPLX LP, Sr. Unsecd. Note, 4.125%, 3/1/2027 | 405,215 | |
| 345,000 | ONEOK, Inc., Sr. Unsecd. Note, 4.00%, 7/13/2027 | 350,242 | |
| 540,000 | Texas Eastern Transmission LP, Sr. Unsecd. Note, Series 144A, 2.80%, 10/15/2022 | 537,071 | |
| 610,000 | Williams Partners LP, 5.25%, 3/15/2020 | 644,657 | |
| 380,000 | Williams Partners LP, Sr. Unsecd. Note, 4.125%, 11/15/2020 | 394,806 | |
| TOTAL | 6,691,220 | ||
| Energy - Oil Field Services—0.6% | |||
| 500,000 | Nabors Industries, Inc., Sr. Unsecd. Note, 5.50%, 1/15/2023 | 486,250 | |
| 52,000 | Noble Holding International Ltd., Company Guarantee, 4.90%, 8/1/2020 | 50,180 | |
| 300,000 | Schlumberger Holdings Corp., Sr. Unsecd. Note, Series 144A, 3.00%, 12/21/2020 | 304,055 | |
| 300,000 | Schlumberger Holdings Corp., Sr. Unsecd. Note, Series 144A, 4.00%, 12/21/2025 | 315,699 | |
| TOTAL | 1,156,184 | ||
| Energy - Refining—0.5% | |||
| 215,000 | Valero Energy Corp., 7.50%, 4/15/2032 | 290,333 | |
| 635,000 | Valero Energy Corp., Sr. Unsecd. Note, 6.625%, 6/15/2037 | 838,839 | |
| TOTAL | 1,129,172 | ||
| Financial Institution - Banking—21.6% | |||
| 500,000 | American Express Credit Corp., Sr. Unsecd. Note, Series MTN, 2.70%, 3/3/2022 | 501,852 | |
| 450,000 | Associated Banc-Corp., Sub. Note, 4.25%, 1/15/2025 | 463,923 | |
| 500,000 | BB&T Corp., Sr. Unsecd. Note, Series MTN, 2.25%, 2/1/2019 | 500,903 | |
| 245,000 | BB&T Corp., Sr. Unsecd. Note, Series MTN, 2.75%, 4/1/2022 | 246,856 | |
| 1,000,000 | Bank of America Corp., Series L, 2.65%, 4/1/2019 | 1,005,783 | |
| 500,000 | 1 | Bank of America Corp., Sr. Unsecd. Note, 3.705%, (3-month USLIBOR +1.512%), 4/24/2028 | 513,653 |
| 2,200,000 | 1 | Bank of America Corp., Sr. Unsecd. Note, Series GMTN, 2.816%, (3-month USLIBOR +0.930%), 7/21/2023 | 2,196,816 |
| 500,000 | Bank of America Corp., Sr. Unsecd. Note, Series MTN, 3.248%, 10/21/2027 | 496,628 | |
| 700,000 | Bank of New York Mellon Corp., Sr. Unsecd. Note, Series MTN, 2.30%, 9/11/2019 | 701,919 | |
| 300,000 | 1 | Bank of New York Mellon Corp., Sr. Unsecd. Note, Series MTN, 2.661%, (3-month USLIBOR +0.634%), 5/16/2023 | 299,986 |
| 550,000 | Bank of New York Mellon Corp., Sr. Unsecd. Note, Series MTN, 3.25%, 9/11/2024 | 561,929 | |
| 340,000 | Capital One Financial Corp., Sr. Unsecd. Note, 2.45%, 4/24/2019 | 340,870 | |
| 600,000 | Capital One Financial Corp., Sr. Unsecd. Note, 3.05%, 3/9/2022 | 604,713 | |
| 500,000 | Citigroup, Inc., 4.125%, 7/25/2028 | 516,267 | |
| 1,000,000 | Citigroup, Inc., Sr. Note, 5.375%, 8/9/2020 | 1,073,116 | |
| 750,000 | 1 | Citigroup, Inc., Sr. Unsecd. Note, 2.876%, (3-month USLIBOR +0.950%), 7/24/2023 | 746,937 |
| 480,000 | Citigroup, Inc., Sr. Unsecd. Note, 3.40%, 5/1/2026 | 483,610 | |
| 500,000 | Citigroup, Inc., Sr. Unsecd. Note, 3.70%, 1/12/2026 | 515,515 |
| Principal Amount | Value | ||
| CORPORATE BONDS—continued | |||
| Financial Institution - Banking—continued | |||
| $150,000 | Citigroup, Inc., Sr. Unsecd. Note, 4.50%, 1/14/2022 | $159,694 | |
| 1,160,000 | Citizens Financial Group, Inc., Sub. Note, Series 144A, 4.15%, 9/28/2022 | 1,204,123 | |
| 480,000 | City National Corp., Sr. Unsecd. Note, 5.25%, 9/15/2020 | 514,839 | |
| 300,000 | Comerica, Inc., 3.80%, 7/22/2026 | 304,822 | |
| 400,000 | Compass Bank, Birmingham, Sr. Unsecd. Note, Series BKNT, 2.75%, 9/29/2019 | 401,226 | |
| 500,000 | Compass Bank, Birmingham, Sub. Note, Series BKNT, 3.875%, 4/10/2025 | 502,259 | |
| 445,000 | Fifth Third Bancorp, Sr. Unsecd. Note, 2.875%, 7/27/2020 | 449,942 | |
| 630,000 | Goldman Sachs Group, Inc., Sr. Unsecd. Note, 2.35%, 11/15/2021 | 620,948 | |
| 1,000,000 | Goldman Sachs Group, Inc., Sr. Unsecd. Note, 2.60%, 12/27/2020 | 1,000,526 | |
| 500,000 | Goldman Sachs Group, Inc., Sr. Unsecd. Note, 3.00%, 4/26/2022 | 502,148 | |
| 1,000,000 | Goldman Sachs Group, Inc., Sr. Unsecd. Note, 3.50%, 11/16/2026 | 1,006,632 | |
| 500,000 | Goldman Sachs Group, Inc., Sub. Note, 4.25%, 10/21/2025 | 522,957 | |
| 500,000 | HSBC Bank USA, N.A., Sub. Note, Series BKNT, 4.875%, 8/24/2020 | 528,931 | |
| 1,341,000 | HSBC USA, Inc., Sr. Unsecd. Note, 2.75%, 8/7/2020 | 1,348,766 | |
| 500,000 | HSBC USA, Inc., Sr. Unsecd. Note, 3.50%, 6/23/2024 | 513,757 | |
| 1,130,000 | Huntington Bancshares, Inc., Sr. Unsecd. Note, 2.30%, 1/14/2022 | 1,112,736 | |
| 500,000 | Huntington National Bank, Sr. Unsecd. Note, 2.375%, 3/10/2020 | 499,474 | |
| 500,000 | JPMorgan Chase & Co., Sr. Unsecd. Note, 2.25%, 1/23/2020 | 499,788 | |
| 250,000 | JPMorgan Chase & Co., Sr. Unsecd. Note, 2.35%, 1/28/2019 | 250,514 | |
| 500,000 | 1 | JPMorgan Chase & Co., Sr. Unsecd. Note, 3.782%, (3-month USLIBOR +1.337%), 2/1/2028 | 518,575 |
| 1,000,000 | JPMorgan Chase & Co., Sr. Unsecd. Note, 4.50%, 1/24/2022 | 1,070,527 | |
| 1,000,000 | JPMorgan Chase & Co., Sub. Note, 3.375%, 5/1/2023 | 1,017,051 | |
| 1,000,000 | JPMorgan Chase & Co., Sub. Note, 3.875%, 9/10/2024 | 1,043,818 | |
| 510,000 | MUFG Americas Holdings Corp., Sr. Unsecd. Note, 3.00%, 2/10/2025 | 503,899 | |
| 250,000 | MUFG Americas Holdings Corp., Sr. Unsecd. Note, 3.50%, 6/18/2022 | 256,392 | |
| 410,000 | MUFG Union Bank, N.A., Sr. Unsecd. Note, 2.25%, 5/6/2019 | 409,520 | |
| 2,440,000 | 1 | Manufacturers & Traders Trust Co., Sub. Note, Series BKNT, 2.121%, (3-month USLIBOR +0.640%), 12/1/2021 | 2,427,904 |
| 750,000 | Morgan Stanley, Sec. Fac. Bond, 2.75%, 5/19/2022 | 747,613 | |
| 500,000 | Morgan Stanley, Sr. Unsecd. Note, 3.625%, 1/20/2027 | 512,173 | |
| 970,000 | Morgan Stanley, Sr. Unsecd. Note, 5.75%, 1/25/2021 | 1,057,400 | |
| 500,000 | Morgan Stanley, Sr. Unsecd. Note, Series GMTN, 5.50%, 7/24/2020 | 536,377 | |
| 250,000 | Morgan Stanley, Sub. Note, 5.00%, 11/24/2025 | 273,944 | |
| 1,000,000 | Morgan Stanley, Sub. Note, Series MTN, 4.10%, 5/22/2023 | 1,042,944 | |
| 890,000 | Regions Financial Corp., Sr. Unsecd. Note, 3.20%, 2/8/2021 | 906,108 | |
| 250,000 | 1 | State Street Corp., Sr. Unsecd. Note, 2.653%, (3-month USLIBOR +0.635%), 5/15/2023 | 250,195 |
| 700,000 | State Street Corp., Sr. Unsecd. Note, 3.30%, 12/16/2024 | 723,523 | |
| 200,000 | SunTrust Bank, Sub. Note, 3.30%, 5/15/2026 | 198,385 | |
| 530,000 | SunTrust Bank, Inc., Sr. Unsecd. Note, 2.50%, 5/1/2019 | 532,109 | |
| 750,000 | U.S. Bancorp, Sr. Unsecd. Note, Series V, 2.625%, 1/24/2022 | 754,645 | |
| 500,000 | Wells Fargo & Co., Series MTN, 3.50%, 3/8/2022 | 516,519 | |
| 620,000 | Wells Fargo & Co., Sr. Unsecd. Note, 3.00%, 10/23/2026 | 608,225 | |
| 1,500,000 | Wells Fargo & Co., Sr. Unsecd. Note, 3.069%, 1/24/2023 | 1,511,942 | |
| 500,000 | Wells Fargo & Co., Sr. Unsecd. Note, Series MTN, 2.55%, 12/7/2020 | 502,198 | |
| 1,175,000 | Westpac Banking Corp., Sr. Unsecd. Note, 4.875%, 11/19/2019 | 1,231,956 | |
| 1,900,000 | Wilmington Trust Corp., Sub. Note, 8.50%, 4/2/2018 | 1,930,212 | |
| TOTAL | 44,799,512 | ||
| Financial Institution - Broker/Asset Mgr/Exchange—1.8% | |||
| 170,000 | Cantor Fitzgerald LP, Bond, 7.875%, Series 144A, 10/15/2019 | 184,073 | |
| 370,000 | Eaton Vance Corp., Sr. Unsecd. Note, 3.625%, 6/15/2023 | 381,835 | |
| 350,000 | Franklin Resources, Inc., Sr. Unsecd. Note, 4.625%, 5/20/2020 | 367,790 |
| Principal Amount | Value | ||
| CORPORATE BONDS—continued | |||
| Financial Institution - Broker/Asset Mgr/Exchange—continued | |||
| $220,000 | Invesco Finance PLC, Sr. Unsecd. Note, 3.75%, 1/15/2026 | $227,615 | |
| 590,000 | Jefferies Group LLC, Sr. Unsecd. Note, 5.125%, 1/20/2023 | 640,071 | |
| 200,000 | Jefferies Group LLC, Sr. Unsecd. Note, 6.50%, 1/20/2043 | 236,527 | |
| 193,000 | Raymond James Financial, Inc., Sr. Unsecd. Note, 5.625%, 4/1/2024 | 219,057 | |
| 390,000 | Stifel Financial Corp., 4.25%, 7/18/2024 | 399,969 | |
| 190,000 | Stifel Financial Corp., Sr. Unsecd. Note, 3.50%, 12/1/2020 | 191,610 | |
| 500,000 | TD Ameritrade Holding Corp., Sr. Unsecd. Note, 3.625%, 4/1/2025 | 517,984 | |
| 450,000 | TIAA Asset Management Finance Co. LLC, Sr. Unsecd. Note, Series 144A, 2.95%, 11/1/2019 | 454,452 | |
| TOTAL | 3,820,983 | ||
| Financial Institution - Finance Companies—2.1% | |||
| 463,000 | Discover Bank, Sub. Note, Series BKNT, 8.70%, 11/18/2019 | 509,268 | |
| 500,000 | Discover Financial Services, Sr. Unsecd. Note, 4.10%, 2/9/2027 | 512,974 | |
| 1,966,000 | GE Capital International Funding Co., Sr. Unsecd. Note, 2.342%, 11/15/2020 | 1,957,598 | |
| 375,000 | HSBC Finance Corp., Sr. Sub. Note, 6.676%, 1/15/2021 | 417,181 | |
| 960,000 | Macquarie Group Ltd., Sr. Unsecd. Note, Series 144A, 6.00%, 1/14/2020 | 1,023,200 | |
| TOTAL | 4,420,221 | ||
| Financial Institution - Insurance - Health—0.6% | |||
| 750,000 | UnitedHealth Group, Inc., Sr. Unsecd. Note, 2.70%, 7/15/2020 | 758,899 | |
| 405,000 | UnitedHealth Group, Inc., Sr. Unsecd. Note, 3.75%, 7/15/2025 | 427,197 | |
| TOTAL | 1,186,096 | ||
| Financial Institution - Insurance - Life—2.2% | |||
| 800,000 | American International Group, Inc., Sr. Unsecd. Note, 4.125%, 2/15/2024 | 846,258 | |
| 500,000 | Lincoln National Corp., Sr. Secd. Note, 8.75%, 7/1/2019 | 546,068 | |
| 290,000 | Lincoln National Corp., Sr. Unsecd. Note, 4.20%, 3/15/2022 | 305,655 | |
| 172,000 | Massachusetts Mutual Life Insurance Co., Sub. Note, Series 144A, 8.875%, 6/1/2039 | 285,359 | |
| 800,000 | MetLife, Inc., Sr. Unsecd. Note, 4.75%, 2/8/2021 | 856,816 | |
| 500,000 | New York Life Global Funding, Sec. Fac. Bond, Series 144A, 2.00%, 4/9/2020 | 496,953 | |
| 350,000 | Penn Mutual Life Insurance Co., Sr. Note, Series 144A, 7.625%, 6/15/2040 | 489,542 | |
| 235,000 | Principal Life Global Funding II, Series 144A, 2.20%, 4/8/2020 | 234,168 | |
| 400,000 | Prudential Financial, Inc., Sr. Unsecd. Note, Series MTN, 4.60%, 5/15/2044 | 455,585 | |
| TOTAL | 4,516,404 | ||
| Financial Institution - Insurance - P&C—1.5% | |||
| 200,000 | Berkshire Hathaway, Inc., Sr. Unsecd. Note, 2.20%, 3/15/2021 | 199,446 | |
| 680,000 | CNA Financial Corp., Sr. Unsecd. Note, 5.875%, 8/15/2020 | 735,938 | |
| 250,000 | Chubb INA Holdings, Inc., 2.30%, 11/3/2020 | 249,685 | |
| 300,000 | Chubb INA Holdings, Inc., Sr. Unsecd. Note, 3.35%, 5/15/2024 | 309,201 | |
| 500,000 | Liberty Mutual Group, Inc., Series 144A, 4.85%, 8/1/2044 | 557,369 | |
| 600,000 | Nationwide Mutual Insurance Co., Sub. Note, Series 144A, 9.375%, 8/15/2039 | 1,022,798 | |
| TOTAL | 3,074,437 | ||
| Financial Institution - REIT - Apartment—0.7% | |||
| 395,000 | Avalonbay Communities, Inc., Sr. Unsecd. Note, Series MTN, 3.35%, 5/15/2027 | 398,407 | |
| 550,000 | Post Apartment Homes LP, Sr. Unsecd. Note, 3.375%, 12/1/2022 | 558,089 | |
| 300,000 | UDR, Inc., Company Guarantee, Series 0001, 4.625%, 1/10/2022 | 318,423 | |
| 200,000 | UDR, Inc., Sr. Unsecd. Note, Series MTN, 2.95%, 9/1/2026 | 192,525 | |
| TOTAL | 1,467,444 | ||
| Financial Institution - REIT - Healthcare—0.9% | |||
| 960,000 | Health Care REIT, Inc., Sr. Unsecd. Note, 6.125%, 4/15/2020 | 1,037,418 | |
| 500,000 | Healthcare Trust of America, 3.70%, 4/15/2023 | 511,711 | |
| 310,000 | Physicians Realty Trust, Sr. Unsecd. Note, 4.30%, 3/15/2027 | 315,913 | |
| TOTAL | 1,865,042 |
| Principal Amount | Value | ||
| CORPORATE BONDS—continued | |||
| Financial Institution - REIT - Office—0.7% | |||
| $500,000 | Alexandria Real Estate Equities, Inc., 2.75%, 1/15/2020 | $502,318 | |
| 450,000 | Alexandria Real Estate Equities, Inc., Sr. Unsecd. Note, 4.60%, 4/1/2022 | 478,229 | |
| 480,000 | Boston Properties LP, Sr. Unsecd. Note, 3.20%, 1/15/2025 | 479,105 | |
| TOTAL | 1,459,652 | ||
| Financial Institution - REIT - Other—0.4% | |||
| 300,000 | ProLogis LP, Sr. Unsecd. Note, 4.25%, 8/15/2023 | 321,514 | |
| 450,000 | WP Carey, Inc., Sr. Unsecd. Note, 4.60%, 4/1/2024 | 470,620 | |
| TOTAL | 792,134 | ||
| Financial Institution - REIT - Retail—0.7% | |||
| 396,000 | Kimco Realty Corp., Sr. Unsecd. Note, 3.20%, 5/1/2021 | 402,849 | |
| 100,000 | Kimco Realty Corp., Sr. Unsecd. Note, 3.40%, 11/1/2022 | 102,077 | |
| 450,000 | Regency Centers Corp., Sr. Unsecd. Note, 3.75%, 11/15/2022 | 461,431 | |
| 421,000 | Regency Centers LP, Company Guarantee, 4.80%, 4/15/2021 | 445,014 | |
| TOTAL | 1,411,371 | ||
| Municipal Services—0.9% | |||
| 872,930 | Army Hawaii Family Housing, Series 144A, 5.524%, 6/15/2050 | 1,002,625 | |
| 740,000 | Camp Pendleton & Quantico Housing LLC, Series 144A, 5.572%, 10/1/2050 | 823,064 | |
| TOTAL | 1,825,689 | ||
| Sovereign—0.5% | |||
| 320,000 | Corp Andina De Fomento, Sr. Unsecd. Note, 4.375%, 6/15/2022 | 341,725 | |
| 510,000 | Inter-American Development Bank, Series MTN, 6.75%, 7/15/2027 | 664,876 | |
| TOTAL | 1,006,601 | ||
| Technology—6.2% | |||
| 500,000 | Adobe Systems, Inc., Sr. Unsecd. Note, 3.25%, 2/1/2025 | 513,845 | |
| 500,000 | Apple, Inc., Sr. Unsecd. Note, 2.10%, 9/12/2022 | 490,870 | |
| 650,000 | Apple, Inc., Sr. Unsecd. Note, 2.40%, 5/3/2023 | 643,693 | |
| 400,000 | Apple, Inc., Sr. Unsecd. Note, 3.20%, 5/13/2025 | 408,376 | |
| 125,000 | Apple, Inc., Sr. Unsecd. Note, 4.45%, 5/6/2044 | 143,002 | |
| 340,000 | Automatic Data Processing, Inc., 3.375%, 9/15/2025 | 351,192 | |
| 800,000 | BMC Software, Inc., 7.25%, 6/1/2018 | 814,000 | |
| 230,000 | Broadcom Corp., Sr. Unsecd. Note, Series 144A, 3.625%, 1/15/2024 | 228,969 | |
| 280,000 | Broadcom Corp., Sr. Unsecd. Note, Series 144A, 3.875%, 1/15/2027 | 275,976 | |
| 400,000 | Diamond 1 Finance Corp./Diamond 2 Finance Corp., Term Loan—1st Lien, Series 144A, 4.42%, 6/15/2021 | 417,093 | |
| 400,000 | Diamond 1 Finance Corp./Diamond 2 Finance Corp., Term Loan—1st Lien, Series 144A, 6.02%, 6/15/2026 | 441,662 | |
| 345,000 | Equifax, Inc., Sr. Unsecd. Note, 2.30%, 6/1/2021 | 336,996 | |
| 83,000 | Fidelity National Information Services, Inc., Sr. Unsecd. Note, 3.875%, 6/5/2024 | 86,741 | |
| 130,000 | Flextronics International Ltd., Sr. Unsecd. Note, 4.75%, 6/15/2025 | 139,267 | |
| 300,000 | Hewlett Packard Enterprise Co., Sr. Unsecd. Note, 2.85%, 10/5/2018 | 301,500 | |
| 670,000 | Ingram Micro, Inc., Sr. Unsecd. Note, 5.00%, 8/10/2022 | 657,455 | |
| 250,000 | Intel Corp., Sr. Unsecd. Note, 2.45%, 7/29/2020 | 252,801 | |
| 500,000 | Intel Corp., Sr. Unsecd. Note, 3.70%, 7/29/2025 | 528,744 | |
| 460,000 | Keysight Technologies, Inc., 4.55%, 10/30/2024 | 488,610 | |
| 1,500,000 | Microsoft Corp., Sr. Unsecd. Note, 1.55%, 8/8/2021 | 1,461,115 | |
| 750,000 | Microsoft Corp., Sr. Unsecd. Note, 2.40%, 8/8/2026 | 723,904 | |
| 300,000 | Molex Electronics Technologies LLC, Sr. Unsecd. Note, Series 144A, 2.878%, 4/15/2020 | 300,212 | |
| 190,000 | Molex Electronics Technologies LLC, Unsecd. Note, Series 144A, 3.90%, 4/15/2025 | 193,987 | |
| 250,000 | Oracle Corp., Sr. Unsecd. Note, 2.80%, 7/8/2021 | 253,777 | |
| 750,000 | Oracle Corp., Sr. Unsecd. Note, 3.40%, 7/8/2024 | 778,188 | |
| 190,000 | Qualcomm, Inc., Sr. Unsecd. Note, 2.10%, 5/20/2020 | 189,255 | |
| 310,000 | Qualcomm, Inc., Sr. Unsecd. Note, 2.60%, 1/30/2023 | 302,549 |
| Principal Amount | Value | ||
| CORPORATE BONDS—continued | |||
| Technology—continued | |||
| $350,000 | Total System Services, Inc., Sr. Unsecd. Note, 3.80%, 4/1/2021 | $358,972 | |
| 195,000 | Verisk Analytics, Inc., Sr. Unsecd. Note, 4.125%, 9/12/2022 | 203,768 | |
| 670,000 | Verisk Analytics, Inc., Sr. Unsecd. Note, 4.875%, 1/15/2019 | 686,203 | |
| TOTAL | 12,972,722 | ||
| Transportation - Airlines—0.0% | |||
| 99,842 | 2 | Continental Airlines, Inc., Equip. Trust, Series 991A, 6.545%, 2/2/2019 | 102,338 |
| Transportation - Railroads—1.0% | |||
| 43,952 | Burlington Northern Santa Fe Corp., Pass Thru Cert., Series 99-2, 7.57%, 1/2/2021 | 46,105 | |
| 1,100,000 | Burlington Northern Santa Fe Corp., Sr. Unsecd. Note, 3.45%, 9/15/2021 | 1,136,983 | |
| 850,000 | Kansas City Southern Industries, Inc., Sr. Unsecd. Note, 3.00%, 5/15/2023 | 843,545 | |
| TOTAL | 2,026,633 | ||
| Transportation - Services—0.5% | |||
| 500,000 | Penske Truck Leasing Co. LP & PTL Finance Corp., Sr. Unsecd. Note, Series 144A, 3.375%, 2/1/2022 | 509,769 | |
| 125,000 | Ryder System, Inc., Sr. Unsecd. Note, Series MTN, 2.25%, 9/1/2021 | 123,159 | |
| 280,000 | Ryder System, Inc., Sr. Unsecd. Note, Series MTN, 2.80%, 3/1/2022 | 279,579 | |
| 150,000 | Ryder System, Inc., Sr. Unsecd. Note, Series MTN, 3.45%, 11/15/2021 | 153,940 | |
| TOTAL | 1,066,447 | ||
| Utility - Electric—6.6% | |||
| 310,000 | AEP Texas, Inc., Sr. Unsecd. Note, 3.85%, 10/1/2025 | 324,173 | |
| 420,000 | Ameren Corp., Sr. Unsecd. Note, 2.70%, 11/15/2020 | 421,636 | |
| 880,000 | American Electric Power Co., Inc., Sr. Unsecd. Note, Series F, 2.95%, 12/15/2022 | 893,380 | |
| 500,000 | Berkshire Hathaway Energy Co., 3.50%, 2/1/2025 | 516,180 | |
| 1,016,295 | Bruce Mansfield Unit 1 2, Pass Thru Cert., 6.85%, 6/1/2034 | 345,540 | |
| 210,000 | Consolidated Edison Co., Sr. Unsecd. Note, 2.00%, 5/15/2021 | 206,939 | |
| 250,000 | Duke Energy Corp., Sr. Unsecd. Note, 1.80%, 9/1/2021 | 243,351 | |
| 750,000 | Duke Energy Corp., Sr. Unsecd. Note, 2.40%, 8/15/2022 | 737,571 | |
| 500,000 | EDP Finance BV, Sr. Unsecd. Note, Series 144A, 3.625%, 7/15/2024 | 503,956 | |
| 1,000,000 | 1 | Electricite de France SA, Jr. Sub. Note, Series 144A, 5.625%, 7/22/2066 | 1,036,250 |
| 180,000 | Emera US Finance LP, Sr. Unsecd. Note, 2.70%, 6/15/2021 | 179,691 | |
| 470,000 | Enel Finance International NV, Sr. Unsecd. Note, Series 144A, 2.875%, 5/25/2022 | 469,144 | |
| 270,000 | Fortis, Inc., Sr. Unsecd. Note, 2.10%, 10/4/2021 | 263,760 | |
| 240,000 | Fortis, Inc., Sr. Unsecd. Note, 3.055%, 10/4/2026 | 232,106 | |
| 235,000 | Great Plains Energy, Inc., Note, 4.85%, 6/1/2021 | 249,064 | |
| 600,000 | National Rural Utilities Cooperative Finance Corp., Sec. Fac. Bond, 2.40%, 4/25/2022 | 596,881 | |
| 140,000 | National Rural Utilities Cooperative Finance Corp., Sr. Unsecd. Note, 2.95%, 2/7/2024 | 141,135 | |
| 900,000 | NextEra Energy Capital Holdings, Inc., Sr. Unsecd. Note, 2.40%, 9/15/2019 | 902,577 | |
| 366,000 | NextEra Energy Capital Holdings, Inc., Sr. Unsecd. Note, 2.70%, 9/15/2019 | 368,347 | |
| 300,000 | NextEra Energy Capital Holdings, Inc., Sr. Unsecd. Note, 3.55%, 5/1/2027 | 306,097 | |
| 110,000 | NiSource Finance Corp., Sr. Unsecd. Note, 2.65%, 11/17/2022 | 109,279 | |
| 500,000 | NiSource Finance Corp., Sr. Unsecd. Note, 3.49%, 5/15/2027 | 509,765 | |
| 500,000 | Northeast Utilities, Sr. Unsecd. Note, 1.60%, 1/15/2018 | 499,901 | |
| 590,000 | PPL Capital Funding, Inc., Sr. Unsecd. Note, 4.20%, 6/15/2022 | 623,962 | |
| 425,000 | PSEG Power LLC, Sr. Unsecd. Note, 4.15%, 9/15/2021 | 443,537 | |
| 250,000 | Public Service Enterprises Group, Inc., Sr. Unsecd. Note, 2.00%, 11/15/2021 | 244,259 | |
| 530,000 | Southern Co., Sr. Unsecd. Note, 1.85%, 7/1/2019 | 526,937 | |
| 250,000 | Southern Co., Sr. Unsecd. Note, 3.25%, 7/1/2026 | 245,565 | |
| 230,000 | TECO Finance, Inc., Company Guarantee, 5.15%, 3/15/2020 | 242,181 | |
| 800,000 | UIL Holdings Corp., Sr. Unsecd. Note, 4.625%, 10/1/2020 | 838,194 | |
| 450,000 | Wisconsin Energy Corp., Sr. Unsecd. Note, 3.55%, 6/15/2025 | 460,698 | |
| TOTAL | 13,682,056 |
| Principal Amount | Value | ||
| CORPORATE BONDS—continued | |||
| Utility - Natural Gas—1.8% | |||
| $250,000 | Atmos Energy Corp., Sr. Unsecd. Note, 3.00%, 6/15/2027 | $248,979 | |
| 1,000,000 | Enbridge Energy Partners LP, Sr. Unsecd. Note, 4.20%, 9/15/2021 | 1,040,222 | |
| 1,100,000 | National Fuel Gas Co., Sr. Unsecd. Note, 3.75%, 3/1/2023 | 1,115,562 | |
| 600,000 | Sempra Energy, Sr. Unsecd. Note, 1.625%, 10/7/2019 | 592,714 | |
| 300,000 | Southeast Supply Header LLC, Sr. Unsecd. Note, Series 144A, 4.25%, 6/15/2024 | 310,588 | |
| 500,000 | TransCanada PipeLines Ltd., Sr. Unsecd. Note, 2.125%, 11/15/2019 | 498,359 | |
| TOTAL | 3,806,424 | ||
| Utility - Natural Gas Distributor—0.2% | |||
| 450,000 | Southern Co. Gas Capital, Sr. Unsecd. Note, 2.45%, 10/1/2023 | 436,006 | |
| TOTAL CORPORATE BONDS (IDENTIFIED COST $197,078,703) | 200,830,994 | ||
| MORTGAGE-BACKED SECURITIES—0.1% | |||
| Federal Home Loan Mortgage Corporation—0.0% | |||
| 921 | Federal Home Loan Mortgage Corp., Pool C01051, 8.00%, 9/1/2030 | 1,087 | |
| Federal National Mortgage Association—0.0% | |||
| 29 | Federal National Mortgage Association, Pool 50276, 9.50%, 2/1/2020 | 30 | |
| Government National Mortgage Association—0.1% | |||
| 2,654 | Government National Mortgage Association, Pool 1512, 7.50%, 12/20/2023 | 2,949 | |
| 3,011 | Government National Mortgage Association, Pool 2630, 6.50%, 8/20/2028 | 3,416 | |
| 4,112 | Government National Mortgage Association, Pool 2631, 7.00%, 8/20/2028 | 4,732 | |
| 6,116 | Government National Mortgage Association, Pool 2658, 6.50%, 10/20/2028 | 6,948 | |
| 9,232 | Government National Mortgage Association, Pool 2701, 6.50%, 1/20/2029 | 10,493 | |
| 368 | Government National Mortgage Association, Pool 276337, 10.00%, 8/15/2019 | 385 | |
| 6,389 | Government National Mortgage Association, Pool 2796, 7.00%, 8/20/2029 | 7,391 | |
| 1,586 | Government National Mortgage Association, Pool 3039, 6.50%, 2/20/2031 | 1,818 | |
| 4,110 | Government National Mortgage Association, Pool 3040, 7.00%, 2/20/2031 | 4,777 | |
| 14,547 | Government National Mortgage Association, Pool 3188, 6.50%, 1/20/2032 | 16,769 | |
| 11,079 | Government National Mortgage Association, Pool 3239, 6.50%, 5/20/2032 | 12,753 | |
| 22,473 | Government National Mortgage Association, Pool 3261, 6.50%, 7/20/2032 | 25,908 | |
| 1,177 | Government National Mortgage Association, Pool 493514, 8.00%, 9/15/2030 | 1,321 | |
| 5,124 | Government National Mortgage Association, Pool 516688, 8.00%, 8/15/2029 | 6,134 | |
| TOTAL | 105,794 | ||
| TOTAL MORTGAGE-BACKED SECURITIES (IDENTIFIED COST $93,018) | 106,911 | ||
| MUNICIPAL BOND—0.2% | |||
| Municipal Services—0.2% | |||
| 410,000 | Chicago, IL, Taxable Project and Refunding Series 2012B GO Bonds, 5.432%, 1/1/2042 (IDENTIFIED COST $410,000) | 394,834 | |
| FOREIGN GOVERNMENTS/AGENCIES—0.6% | |||
| Sovereign—0.6% | |||
| 225,000 | Colombia, Government of, Sr. Unsecd. Note, 4.375%, 7/12/2021 | 237,263 | |
| 900,000 | Qatar, Government of, Series 144A, 5.25%, 1/20/2020 | 944,989 | |
| TOTAL FOREIGN GOVERNMENTS/AGENCIES (IDENTIFIED COST $1,124,098) | 1,182,252 | ||
| COLLATERALIZED MORTGAGE OBLIGATION—0.1% | |||
| Commercial Mortgage—0.1% | |||
| 193,974 | TIAA Seasoned Commercial Mortgage Trust 2007-C4, Class AJ, 5.476%, 8/15/2039 (IDENTIFIED COST $192,464) | 193,535 |
| Principal Amount | Value | ||
| REPURCHASE AGREEMENT—1.3% | |||
| $2,803,000 | Interest in $950,000,000 joint repurchase agreement 1.42%, dated 12/29/2017 under which Bank of America, N.A. will repurchase securities provided as collateral for $950,149,889 on 1/2/2018. The securities provided as collateral at the end of the period held with BNY Mellon as tri-party agent, were U.S. Government Agency securities maturing on 7/20/2046 and the market value of those underlying securities was $969,152,887. (IDENTIFIED COST $2,803,000) | $2,803,000 | |
| TOTAL INVESTMENT IN SECURITIES—99.0% (IDENTIFIED COST $201,701,283)3 | 205,511,526 | ||
| OTHER ASSETS AND LIABILITIES - NET—1.0%4 | 2,110,982 | ||
| TOTAL NET ASSETS—100% | $207,622,508 |
| Description | Number of Contracts | Notional Value | Expiration Date | Value and Unrealized Appreciation (Depreciation) |
| 5U.S. Treasury Note 10-Year Long Futures | 100 | $12,404,688 | March 2018 | $(67,745) |
| 5U.S. Treasury Long Bond Short Futures | 45 | $6,885,000 | March 2018 | $5,875 |
| 5U.S. Treasury Note 2-Year Short Futures | 15 | $3,211,641 | March 2018 | $5,638 |
| 5U.S. Treasury Ultra Bond Short Futures | 14 | $2,347,188 | March 2018 | $(10,491) |
| NET UNREALIZED DEPRECIATION ON FUTURES CONTRACTS | $(66,723) | |||
| 1 | Floating/variable note with current rate and current maturity or next reset date shown. Certain variable rate securities are not based on a published reference rate and spread but are determined by the issuer or agent and are based on current market conditions. These securities do not indicate a reference rate and spread in their description above. |
| 2 | Market quotations and price evaluations are not available. Fair value determined using significant unobservable inputs in accordance with procedures established by and under the general supervision of the Fund's Board of Trustees (the “Trustees”). |
| 3 | The cost of investments for federal tax purposes amounts to $201,701,431. |
| 4 | Assets, other than investments in securities, less liabilities. See Statement of Assets and Liabilities. |
| 5 | Non-income-producing security. |
| Valuation Inputs | ||||
| Level 1— Quoted Prices | Level 2— Other Significant Observable Inputs | Level 3— Significant Unobservable Inputs | Total | |
| Debt Securities: | ||||
| Corporate Bonds | $— | $200,728,656 | $102,338 | $200,830,994 |
| Mortgage-Backed Securities | — | 106,911 | — | 106,911 |
| Municipal Bond | — | 394,834 | — | 394,834 |
| Foreign Governments/Agencies | — | 1,182,252 | — | 1,182,252 |
| Collateralized Mortgage Obligations | — | 193,535 | — | 193,535 |
| Repurchase Agreement | — | 2,803,000 | — | 2,803,000 |
| TOTAL SECURITIES | $— | $205,409,188 | $102,338 | $205,511,526 |
| Other Financial Instruments | ||||
| Assets | ||||
| Futures | $11,513 | $— | $— | $11,513 |
| Liabilities | ||||
| Futures | (78,236) | — | — | (78,236) |
| TOTAL OTHER FINANCIAL INSTRUMENTS | $(66,723) | $— | $— | $(66,723) |
| BKNT | —Bank Note |
| GMTN | —Global Medium Term Note |
| GO | —General Obligation |
| LIBOR | —London Interbank Offered Rate |
| MTN | —Medium Term Note |
| REIT | —Real Estate Investment Trust |
| Year Ended December 31 | 2017 | 2016 | 2015 | 2014 | 2013 |
| Net Asset Value, Beginning of Period | $10.98 | $10.97 | $11.42 | $11.43 | $11.80 |
| Income From Investment Operations: | |||||
| Net investment income1 | 0.31 | 0.34 | 0.37 | 0.40 | 0.41 |
| Net realized and unrealized gain (loss) on investments and futures contracts | 0.12 | 0.07 | (0.39) | 0.03 | (0.29) |
| TOTAL FROM INVESTMENT OPERATIONS | 0.43 | 0.41 | (0.02) | 0.43 | 0.12 |
| Less Distributions: | |||||
| Distributions from net investment income | (0.36) | (0.40) | (0.43) | (0.44) | (0.49) |
| Net Asset Value, End of Period | $11.05 | $10.98 | $10.97 | $11.42 | $11.43 |
| Total Return2 | 4.04% | 3.82% | (0.24)% | 3.79% | 1.04% |
| Ratios to Average Net Assets: | |||||
| Net expenses | 0.74% | 0.73% | 0.73% | 0.73% | 0.73% |
| Net investment income | 2.81% | 3.10% | 3.30% | 3.53% | 3.55% |
| Expense waiver/reimbursement3 | 0.06% | 0.07% | 0.05% | 0.04% | 0.06% |
| Supplemental Data: | |||||
| Net assets, end of period (000 omitted) | $185,026 | $188,831 | $198,990 | $220,355 | $230,647 |
| Portfolio turnover | 27% | 26% | 17% | 18% | 23% |
| 1 | Per share numbers have been calculated using the average shares method. |
| 2 | Based on net asset value. Total returns do not reflect any additional fees or expenses that may be imposed by separate accounts of insurance companies or in connection with any variable annuity or variable life insurance contract. |
| 3 | This expense decrease is reflected in both the net expense and the net investment income ratios shown above. |
| Year Ended December 31 | 2017 | 2016 | 2015 | 2014 | 2013 |
| Net Asset Value, Beginning of Period | $10.94 | $10.93 | $11.37 | $11.38 | $11.75 |
| Income From Investment Operations: | |||||
| Net investment income1 | 0.28 | 0.31 | 0.34 | 0.38 | 0.38 |
| Net realized and unrealized gain (loss) on investments and futures contracts | 0.12 | 0.07 | (0.38) | 0.01 | (0.29) |
| TOTAL FROM INVESTMENT OPERATIONS | 0.40 | 0.38 | (0.04) | 0.39 | 0.09 |
| Less Distributions: | |||||
| Distributions from net investment income | (0.33) | (0.37) | (0.40) | (0.40) | (0.46) |
| Net Asset Value, End of Period | $11.01 | $10.94 | $10.93 | $11.37 | $11.38 |
| Total Return2 | 3.75% | 3.53% | (0.44)% | 3.51% | 0.75% |
| Ratios to Average Net Assets: | |||||
| Net expenses | 0.99% | 0.98% | 0.98% | 0.98% | 0.98% |
| Net investment income | 2.56% | 2.86% | 3.04% | 3.29% | 3.29% |
| Expense waiver/reimbursement3 | 0.06% | 0.07% | 0.05% | 0.04% | 0.06% |
| Supplemental Data: | |||||
| Net assets, end of period (000 omitted) | $22,596 | $23,920 | $27,977 | $33,857 | $38,536 |
| Portfolio turnover | 27% | 26% | 17% | 18% | 23% |
| 1 | Per share numbers have been calculated using the average shares method. |
| 2 | Based on net asset value. Total returns do not reflect any additional fees or expenses that may be imposed by separate accounts of insurance companies or in connection with any variable annuity or variable life insurance contract. |
| 3 | This expense decrease is reflected in both the net expense and the net investment income ratios shown above. |
| Assets: | ||
| Investment in securities, at value (identified cost $201,701,283) | $205,511,526 | |
| Cash | 1,692 | |
| Restricted cash (Note 2) | 100,250 | |
| Income receivable | 2,046,969 | |
| Receivable for shares sold | 161,342 | |
| Receivable for daily variation margin on futures contracts | 1,393 | |
| TOTAL ASSETS | 207,823,172 | |
| Liabilities: | ||
| Payable for shares redeemed | $79,210 | |
| Payable to adviser (Note 5) | 9,017 | |
| Payable for administrative fees (Note 5) | 1,367 | |
| Payable for custodian fees | 5,057 | |
| Payable for transfer agent fee | 3,800 | |
| Payable for auditing fees | 22,030 | |
| Payable for portfolio accounting fees | 63,423 | |
| Payable for distribution services fee (Note 5) | 4,864 | |
| Payable for insurance premiums | 3,921 | |
| Accrued expenses (Note 5) | 7,975 | |
| TOTAL LIABILITIES | 200,664 | |
| Net assets for 18,801,171 shares outstanding | $207,622,508 | |
| Net Assets Consist of: | ||
| Paid-in capital | $197,929,819 | |
| Net unrealized appreciation of investments and futures contracts | 3,743,520 | |
| Accumulated net realized gain on investments and futures contracts | 66,575 | |
| Undistributed net investment income | 5,882,594 | |
| TOTAL NET ASSETS | $207,622,508 | |
| Net Asset Value, Offering Price and Redemption Proceeds Per Share | ||
| Primary Shares: | ||
| Net asset value per share ($185,026,124 ÷ 16,749,403 shares outstanding), no par value, unlimited shares authorized | $11.05 | |
| Service Shares: | ||
| Net asset value per share ($22,596,384 ÷ 2,051,768 shares outstanding), no par value, unlimited shares authorized | $11.01 |
| Investment Income: | ||
| Interest | $7,513,965 | |
| Expenses: | ||
| Investment adviser fee (Note 5) | $1,269,713 | |
| Administrative fee (Note 5) | 167,510 | |
| Custodian fees | 11,657 | |
| Transfer agent fee | 20,525 | |
| Directors'/Trustees' fees (Note 5) | 3,002 | |
| Auditing fees | 25,920 | |
| Legal fees | 8,583 | |
| Portfolio accounting fees | 79,444 | |
| Distribution services fee (Note 5) | 59,562 | |
| Printing and postage | 77,983 | |
| Miscellaneous (Note 5) | 26,099 | |
| TOTAL EXPENSES | 1,749,998 | |
| Waiver: | ||
| Waiver of investment adviser fee (Note 5) | $(119,617) | |
| Net expenses | 1,630,381 | |
| Net investment income | 5,883,584 | |
| Realized and Unrealized Gain (Loss) on Investments and Futures Contracts: | ||
| Net realized gain on investments | 1,404,861 | |
| Net realized loss on futures contracts | (424,430) | |
| Net change in unrealized appreciation of investments | 1,516,509 | |
| Net change in unrealized depreciation of futures contracts | (64,615) | |
| Net realized and unrealized gain on investments and futures contracts | 2,432,325 | |
| Change in net assets resulting from operations | $8,315,909 |
| Year Ended December 31 | 2017 | 2016 |
| Increase (Decrease) in Net Assets | ||
| Operations: | ||
| Net investment income | $5,883,584 | $6,854,788 |
| Net realized gain on investments and futures contracts | 980,431 | 754,359 |
| Net change in unrealized appreciation/depreciation of investments and futures contracts | 1,451,894 | 932,107 |
| CHANGE IN NET ASSETS RESULTING FROM OPERATIONS | 8,315,909 | 8,541,254 |
| Distributions to Shareholders: | ||
| Distributions from net investment income | ||
| Primary Shares | (6,150,393) | (7,034,809) |
| Service Shares | (704,143) | (909,198) |
| CHANGE IN NET ASSETS RESULTING FROM DISTRIBUTIONS TO SHAREHOLDERS | (6,854,536) | (7,944,007) |
| Share Transactions: | ||
| Proceeds from sale of shares | 14,911,393 | 15,156,631 |
| Net asset value of shares issued to shareholders in payment of distributions declared | 6,854,533 | 7,944,007 |
| Cost of shares redeemed | (28,355,851) | (37,913,109) |
| CHANGE IN NET ASSETS RESULTING FROM SHARE TRANSACTIONS | (6,589,925) | (14,812,471) |
| Change in net assets | (5,128,552) | (14,215,224) |
| Net Assets: | ||
| Beginning of period | 212,751,060 | 226,966,284 |
| End of period (including undistributed net investment income of $5,882,594 and $6,853,546, respectively) | $207,622,508 | $212,751,060 |
| ■ | Fixed-income securities are fair valued using price evaluations provided by a pricing service approved by the Trustees. |
| ■ | Derivative contracts listed on exchanges are valued at their reported settlement or closing price, except that options are valued at the mean of closing bid and asked quotations. |
| ■ | Over-the-counter (OTC) derivative contracts are fair valued using price evaluations provided by a pricing service approved by the Trustees. |
| ■ | Shares of other mutual funds or non-exchange-traded investment companies are valued based upon their reported NAVs. |
| ■ | For securities that are fair valued in accordance with procedures established by and under the general supervision of the Trustees, certain factors may be considered, such as: the last traded or purchase price of the security, information obtained by contacting the issuer or dealers, analysis of the issuer's financial statements or other available documents, fundamental analytical data, the nature and duration of restrictions on disposition, the movement of the market in which the security is normally traded, public trading in similar securities or derivative contracts of the issuer or comparable issuers, movement of a relevant index, or other factors including but not limited to industry changes and relevant government actions. |
| ■ | With respect to securities traded principally in foreign markets, significant trends in U.S. equity markets or in the trading of foreign securities index futures contracts; |
| ■ | Political or other developments affecting the economy or markets in which an issuer conducts its operations or its securities are traded; |
| ■ | Announcements concerning matters such as acquisitions, recapitalizations, litigation developments, or a natural disaster affecting the issuer's operations or regulatory changes or market developments affecting the issuer's industry. |
| Asset | ||
| Statement of Assets and Liabilities Location | Fair Value | |
| Derivatives not accounted for as hedging instruments under ASC Topic 815 | ||
| Interest rate contracts | Receivable for daily variation margin on futures contracts | $(66,723)* |
| * | Includes cumulative depreciation of futures contracts as reported in the footnotes to the Portfolio of Investments. Only the current day's variation margin is reported within the Statement of Assets and Liabilities. |
| Amount of Realized Gain or (Loss) on Derivatives Recognized in Income | |
| Futures Contracts | |
| Interest rate contracts | $(424,430) |
| Change in Unrealized Appreciation or (Depreciation) on Derivatives Recognized in Income | |
| Futures Contracts | |
| Interest rate contracts | $(64,615) |
| Year Ended December 31 | 2017 | 2016 | ||
| Primary Shares: | Shares | Amount | Shares | Amount |
| Shares sold | 1,108,844 | $12,178,568 | 1,301,003 | $14,280,877 |
| Shares issued to shareholders in payment of distributions declared | 572,662 | 6,150,393 | 656,233 | 7,034,809 |
| Shares redeemed | (2,130,443) | (23,413,689) | (2,901,973) | (31,983,988) |
| NET CHANGE RESULTING FROM PRIMARY SHARE TRANSACTIONS | (448,937) | $(5,084,728) | (944,737) | $(10,668,302) |
| Year Ended December 31 | 2017 | 2016 | ||
| Service Shares: | Shares | Amount | Shares | Amount |
| Shares sold | 250,406 | $2,732,825 | 79,596 | $875,754 |
| Shares issued to shareholders in payment of distributions declared | 65,623 | 704,140 | 84,892 | 909,198 |
| Shares redeemed | (450,145) | (4,942,162) | (538,703) | (5,929,121) |
| NET CHANGE RESULTING FROM SERVICE SHARE TRANSACTIONS | (134,116) | $(1,505,197) | (374,215) | $(4,144,169) |
| NET CHANGE RESULTING FROM TOTAL FUND SHARE TRANSACTIONS | (583,053) | $(6,589,925) | (1,318,952) | $(14,812,471) |
| Increase (Decrease) | |
| Paid-In Capital | Accumulated Net Realized Gain (Loss) |
| $(371,956) | $371,956 |
| 2017 | 2016 | |
| Ordinary income | $6,854,536 | $7,944,007 |
| Undistributed ordinary income | $5,882,594 |
| Net unrealized appreciation | $3,810,095 |
| Administrative Fee | Average Daily Net Assets of the Investment Complex |
| 0.100% | on assets up to $50 billion |
| 0.075% | on assets over $50 billion |
| Administrative Fee | Average Daily Net Assets of the Investment Complex |
| 0.150% | on the first $5 billion |
| 0.125% | on the next $5 billion |
| 0.100% | on the next $10 billion |
| 0.075% | on assets in excess of $20 billion |
| Share Class Name | Percentage of Average Daily Net Assets of Class |
| Primary Shares | 0.25% |
| Service Shares | 0.25% |
| Distribution Services Fees Incurred | |
| Service Shares | $59,562 |
| Purchases | $56,071,173 |
| Sales | $60,718,832 |
February 14, 2018
| Beginning Account Value 7/1/2017 | Ending Account Value 12/31/2017 | Expenses Paid During Period1 | |
| Actual: | |||
| Primary Shares | $1,000 | $1,010.10 | $3.70 |
| Service Shares | $1,000 | $1,008.20 | $4.96 |
| Hypothetical (assuming a 5% return before expenses): | |||
| Primary Shares | $1,000 | $1,021.50 | $3.72 |
| Service Shares | $1,000 | $1,020.30 | $4.99 |
| 1 | Expenses are equal to the Fund's annualized net expense ratios, multiplied by the average account value over the period, multiplied by 184/365 (to reflect the one-half-year period). The expenses shown in the table do not include the charges and expenses imposed by the insurance company under the variable insurance product contract. Please refer to the variable insurance product prospectus for a complete listing of these expenses. The annualized net expense ratios are as follows: |
| Primary Shares | 0.73% |
| Service Shares | 0.98% |
| Name Birth Date Positions Held with Trust Date Service Began | Principal Occupation(s) for Past Five Years, Other Directorships Held and Previous Position(s) |
| J. Christopher Donahue* Birth Date: April 11, 1949 Trustee Indefinite Term Began serving: September 1993 | Principal Occupations: Principal Executive Officer and President of certain of the Funds in the Federated Fund Family; Director or Trustee of the Funds in the Federated Fund Family; President, Chief Executive Officer and Director, Federated Investors, Inc.; Chairman and Trustee, Federated Investment Management Company; Trustee, Federated Investment Counseling; Chairman and Director, Federated Global Investment Management Corp.; Chairman and Trustee, Federated Equity Management Company of Pennsylvania; Trustee, Federated Shareholder Services Company; Director, Federated Services Company. Previous Positions: President, Federated Investment Counseling; President and Chief Executive Officer, Federated Investment Management Company, Federated Global Investment Management Corp. and Passport Research, Ltd; Chairman, Passport Research, Ltd. |
| Thomas R. Donahue* Birth Date: October 20, 1958 Trustee Indefinite Term Began serving: May 2016 | Principal Occupations: Director or Trustee of certain of the funds in the Federated Fund Family; Chief Financial Officer, Treasurer, Vice President and Assistant Secretary, Federated Investors, Inc.; Chairman and Trustee, Federated Administrative Services; Chairman and Director, Federated Administrative Services, Inc.; Trustee and Treasurer, Federated Advisory Services Company; Director or Trustee and Treasurer, Federated Equity Management Company of Pennsylvania, Federated Global Investment Management Corp., Federated Investment Counseling, and Federated Investment Management Company; Director, MDTA LLC; Director, Executive Vice President and Assistant Secretary, Federated Securities Corp.; Director or Trustee and Chairman, Federated Services Company and Federated Shareholder Services Company; and Director and President, FII Holdings, Inc. Previous Positions: Director, Federated Investors, Inc.; Assistant Secretary, Federated Investment Management Company, Federated Global Investment Management Company and Passport Research, LTD; Treasurer, Passport Research, LTD; Executive Vice President, Federated Securities Corp.; and Treasurer, FII Holdings, Inc. |
| * | Family relationships and reasons for “interested” status: J. Christopher Donahue and Thomas R. Donahue are brothers. Both are “interested” due to their beneficial ownership of shares of Federated Investors, Inc. and the positions they hold with Federated and its subsidiaries. |
| Name Birth Date Positions Held with Trust Date Service Began | Principal Occupation(s) for Past Five Years, Other Directorships Held, Previous Position(s) and Qualifications |
| John T. Collins Birth Date: January 24, 1947 Trustee Indefinite Term Began serving: October 2013 | Principal Occupations: Director or Trustee of the Federated Fund Family; formerly, Chairman and CEO, The Collins Group, Inc. (a private equity firm) (Retired). Other Directorships Held: Director, Current Chair of the Compensation Committee, KLX Corp. Qualifications: Mr. Collins has served in several business and financial management roles and directorship positions throughout his career. Mr. Collins previously served as Chairman and CEO, The Collins Group, Inc. (a private equity firm). Mr. Collins serves as Chairman Emeriti, Bentley University. Mr. Collins previously served as Director and Audit Committee Member, Bank of America Corp.; Director, FleetBoston Financial Corp.; and Director, Beth Israel Deaconess Medical Center (Harvard University Affiliate Hospital). |
| G. Thomas Hough Birth Date: February 28, 1955 Trustee Indefinite Term Began serving: August 2015 | Principal Occupations: Director or Trustee of the Federated Fund Family; formerly, Vice Chair, Ernst & Young LLP (public accounting firm) (Retired). Other Directorships Held: Director, Chair of the Audit Committee, Governance Committee, Publix Super Markets, Inc.; Director, Member of the Audit Committee and Technology Committee of Equifax, Inc. Qualifications: Mr. Hough has served in accounting, business management and directorship positions throughout his career. Mr. Hough most recently held the position of Americas Vice Chair of Assurance with Ernst & Young LLP (public accounting firm). Mr. Hough is an Executive Committee member of the United States Golf Association, he serves on the President's Cabinet and Business School Board of Visitors for the University of Alabama and is on the Business School Board of Visitors for Wake Forest University. |
| Name Birth Date Positions Held with Trust Date Service Began | Principal Occupation(s) for Past Five Years, Other Directorships Held, Previous Position(s) and Qualifications |
| Maureen Lally-Green Birth Date: July 5, 1949 Trustee Indefinite Term Began serving: August 2009 | Principal Occupations: Director or Trustee of the Federated Fund Family; Dean of the Duquesne University School of Law; Professor and Adjunct Professor of Law, Duquesne University School of Law; formerly, Interim Dean of the Duquesne University School of Law; Associate General Secretary and Director, Office of Church Relations, Diocese of Pittsburgh. Other Directorships Held: Director, CNX Resources Corporation (formerly known as CONSOL Energy Inc.). Qualifications: Judge Lally-Green has served in various legal and business roles and directorship positions throughout her career. Judge Lally-Green previously served as: Associate General Secretary, Diocese of Pittsburgh; a member of the Superior Court of Pennsylvania; and as a Professor of Law, Duquesne University School of Law. Judge Lally-Green also currently holds the positions on either a public or not for profit Board of Directors as follows: Director and Chair, UPMC Mercy Hospital; Director and Vice Chair, Our Campaign for the Church Alive!, Inc.; Director, Saint Vincent College; Member, Pennsylvania State Board of Education (public); and Director CNX Resources Corporation (formerly known as CONSOL Energy Inc.), where she currently serves as a member of the Compensation, Nominating and Corporate Governance Committee (Chair) and the Health, Safety and Environmental Committee. Judge Lally-Green has held the positions of: Director, Auberle; Director, Epilepsy Foundation of Western and Central Pennsylvania; Director, Ireland Institute of Pittsburgh; Director, Saint Thomas More Society; Director and Chair, Catholic High Schools of the Diocese of Pittsburgh, Inc.; Director, Pennsylvania Bar Institute; Regent, St. Vincent Seminary; and Director and Chair, Cardinal Wuerl North Catholic High School, Inc. |
| Charles F. Mansfield, Jr. Birth Date: April 10, 1945 Trustee Indefinite Term Began serving: September 1999 | Principal Occupations: Director or Trustee of the Federated Fund Family; Management Consultant. Other Directorships Held: None. Qualifications: Mr. Mansfield has served as a Marine Corps officer and in several banking, business management, educational roles and directorship positions throughout his long career. He remains active as a Management Consultant. |
| Thomas M. O'Neill Birth Date: June 14, 1951 Trustee Indefinite Term Began serving: August 2006 | Principal Occupations: Director or Trustee, Chair of the Audit Committee of the Federated Fund Family; Sole Proprietor, Navigator Management Company (investment and strategic consulting). Other Directorships Held: None. Qualifications: Mr. O'Neill has served in several business, mutual fund and financial management roles and directorship positions throughout his career. Mr. O'Neill serves as Director, Medicines for Humanity and Director, The Golisano Children's Museum of Naples, Florida. Mr. O'Neill previously served as Chief Executive Officer and President, Managing Director and Chief Investment Officer, Fleet Investment Advisors; President and Chief Executive Officer, Aeltus Investment Management, Inc.; General Partner, Hellman, Jordan Management Co., Boston, MA; Chief Investment Officer, The Putnam Companies, Boston, MA; Credit Analyst and Lending Officer, Fleet Bank; Director and Consultant, EZE Castle Software (investment order management software); and Director, Midway Pacific (lumber). |
| P. Jerome Richey Birth Date: February 23, 1949 Trustee Indefinite Term Began serving: October 2013 | Principal Occupations: Director or Trustee of the Federated Fund Family; Management Consultant; formerly, Senior Vice Chancellor and Chief Legal Officer, University of Pittsburgh and Executive Vice President and Chief Legal Officer, CNX Resources Corporation (formerly known as CONSOL Energy Inc.) Other Directorships Held: None. Qualifications: Mr. Richey has served in several business and legal management roles and directorship positions throughout his career. Mr. Richey most recently held the positions of Senior Vice Chancellor and Chief Legal Officer, University of Pittsburgh. Mr. Richey previously served as Chairman of the Board, Epilepsy Foundation of Western Pennsylvania and Chairman of the Board, World Affairs Council of Pittsburgh. Mr. Richey previously served as Chief Legal Officer and Executive Vice President, CNX Resources Corporation (formerly known as CONSOL Energy Inc.); and Board Member, Ethics Counsel and Shareholder, Buchanan Ingersoll & Rooney PC (a law firm). |
| John S. Walsh Birth Date: November 28, 1957 Trustee Indefinite Term Began serving: January 1999 | Principal Occupations: Director or Trustee, and Chair of the Board of Directors or Trustees, of the Federated Fund Family; President and Director, Heat Wagon, Inc. (manufacturer of construction temporary heaters); President and Director, Manufacturers Products, Inc. (distributor of portable construction heaters); President, Portable Heater Parts, a division of Manufacturers Products, Inc. Other Directorships Held: None. Qualifications: Mr. Walsh has served in several business management roles and directorship positions throughout his career. Mr. Walsh previously served as Vice President, Walsh & Kelly, Inc. (paving contractors). |
| Name Birth Date Address Positions Held with Trust Date Service Began | Principal Occupation(s) for Past Five Years and Previous Position(s) |
| Lori A. Hensler Birth Date: January 6, 1967 TREASURER Officer since: April 2013 | Principal Occupations: Principal Financial Officer and Treasurer of the Federated Fund Family; Senior Vice President, Federated Administrative Services; Financial and Operations Principal for Federated Securities Corp. and Edgewood Services, Inc.; and Assistant Treasurer, Federated Investors Trust Company. Ms. Hensler has received the Certified Public Accountant designation. Previous Positions: Controller of Federated Investors, Inc.; Senior Vice President and Assistant Treasurer, Federated Investors Management Company; Treasurer, Federated Investors Trust Company; Assistant Treasurer, Federated Administrative Services, Federated Administrative Services, Inc., Federated Securities Corp., Edgewood Services, Inc., Federated Advisory Services Company, Federated Equity Management Company of Pennsylvania, Federated Global Investment Management Corp., Federated Investment Counseling, Federated Investment Management Company, Passport Research, Ltd., and Federated MDTA, LLC; Financial and Operations Principal for Federated Securities Corp., Edgewood Services, Inc. and Southpointe Distribution Services, Inc. |
| Peter J. Germain Birth Date: September 3, 1959 CHIEF LEGAL OFFICER, SECRETARY and EXECUTIVE VICE PRESIDENT Officer since: January 2005 | Principal Occupations: Mr. Germain is Chief Legal Officer, Secretary and Executive Vice President of the Federated Fund Family. He is General Counsel, Chief Legal Officer, Secretary and Executive Vice President, Federated Investors, Inc.; Trustee and Senior Vice President, Federated Investors Management Company; Trustee and President, Federated Administrative Services; Director and President, Federated Administrative Services, Inc.; Director and Vice President, Federated Securities Corp.; Director and Secretary, Federated Private Asset Management, Inc.; Secretary, Federated Shareholder Services Company; and Secretary, Retirement Plan Service Company of America. Mr. Germain joined Federated in 1984 and is a member of the Pennsylvania Bar Association. Previous Positions: Deputy General Counsel, Special Counsel, Managing Director of Mutual Fund Services, Federated Investors, Inc.; Senior Vice President, Federated Services Company; and Senior Corporate Counsel, Federated Investors, Inc. |
| Richard B. Fisher Birth Date: May 17, 1923 VICE PRESIDENT Officer since: September 1993 | Principal Occupations: Vice Chairman or Vice President of some of the Funds in the Federated Fund Family; Vice Chairman, Federated Investors, Inc.; Chairman, Federated Securities Corp. Previous Positions: President and Director or Trustee of some of the Funds in the Federated Fund Family; Executive Vice President, Federated Investors, Inc.; Director and Chief Executive Officer, Federated Securities Corp. |
| John B. Fisher Birth Date: May 16, 1956 PRESIDENT Officer since: November 2004 | Principal Occupations: Principal Executive Officer and President of certain of the Funds in the Federated Fund Family; Director or Trustee of certain of the Funds in the Federated Fund Family; Vice President, Federated Investors, Inc.; President, Director/Trustee and CEO, Federated Advisory Services Company, Federated Equity Management Company of Pennsylvania, Federated Global Investment Management Corp., Federated Investment Counseling, Federated Investment Management Company; President and CEO of Passport Research, Ltd.; President of some of the Funds in the Federated Fund Complex and Director, Federated Investors Trust Company. Previous Positions: President and Director of the Institutional Sales Division of Federated Securities Corp.; President and Director of Federated Investment Counseling; Director, Edgewood Securities Corp.; Director, Federated Services Company; Director, Federated Investors, Inc.; Chairman and Director, Southpointe Distribution Services, Inc. and President, Technology, Federated Services Company. |
| Stephen Van Meter Birth Date: June 5, 1975 CHIEF COMPLIANCE OFFICER AND SENIOR VICE PRESIDENT Officer since: July 2015 | Principal Occupations: Senior Vice President and Chief Compliance Officer of the Federated Fund Family; Vice President and Chief Compliance Officer of Federated Investors, Inc. and Chief Compliance Officer of certain of its subsidiaries. Mr. Van Meter joined Federated in October 2011. He holds FINRA licenses under Series 3, 7, 24 and 66. Previous Positions: Mr. Van Meter previously held the position of Compliance Operating Officer, Federated Investors, Inc. Prior to joining Federated, Mr. Van Meter served at the United States Securities and Exchange Commission in the positions of Senior Counsel, Office of Chief Counsel, Division of Investment Management and Senior Counsel, Division of Enforcement. |
| Stephen F. Auth Birth Date: September 13, 1956 101 Park Avenue 41st Floor New York, NY 10178 CHIEF INVESTMENT OFFICER Officer since: November 2002 | Principal Occupations: Stephen F. Auth is Chief Investment Officer of various Funds in the Federated Fund Family; Executive Vice President, Federated Investment Counseling, Federated Global Investment Management Corp. and Federated Equity Management Company of Pennsylvania. Previous Positions: Executive Vice President, Federated Investment Management Company and Passport Research, Ltd. (investment advisory subsidiary of Federated); Senior Vice President, Global Portfolio Management Services Division; Senior Vice President, Federated Investment Management Company and Passport Research, Ltd.; Senior Managing Director and Portfolio Manager, Prudential Investments. |
| Robert J. Ostrowski Birth Date: April 26, 1963 Chief Investment Officer Officer since: May 2004 | Principal Occupations: Robert J. Ostrowski joined Federated in 1987 as an Investment Analyst and became a Portfolio Manager in 1990. He was named Chief Investment Officer of Federated's taxable fixed-income products in 2004 and also serves as a Senior Portfolio Manager. Mr. Ostrowski became an Executive Vice President of the Fund's Adviser in 2009 and served as a Senior Vice President of the Fund's Adviser from 1997 to 2009. Mr. Ostrowski has received the Chartered Financial Analyst designation. He received his M.S. in Industrial Administration from Carnegie Mellon University. |
| Deborah A. Cunningham Birth Date: September 15, 1959 Chief Investment Officer Officer since: June 2012 | Principal Occupations: Deborah A. Cunningham was named Chief Investment Officer of Federated's money market products in 2004. She joined Federated in 1981 and has been a Senior Portfolio Manager since 1997 and an Executive Vice President of the Fund's Adviser since 2009. Ms. Cunningham has received the Chartered Financial Analyst designation and holds an M.S.B.A. in Finance from Robert Morris College. |
Federated Investors Funds
4000 Ericsson Drive
Warrendale, PA 15086-7561
or call 1-800-341-7400.
CUSIP 313916785
2018 ©Federated Investors, Inc.
| 1 | The Bloomberg Barclays U.S. Mortgage Backed Securities Index (BBMBS) and Bloomberg Barclays U.S. Government Bond Index returned 2.47% and 2.30%, respectively. The Blended Index is being used for comparison purposes because, although it is not the Fund's broad-based securities market index, the Fund's Adviser believes it more closely reflects the market sectors in which the Fund invests. The Fund's broad-based securities market index is the BBMBS. Please see the footnotes to the line graph under “Fund Performance and Growth of a $10,000 Investment” below for the definition of, and more information about, the Blended Index. |
| 2 | Duration measures the price sensitivity of a fixed-income security to changes in interest rates. Securities with longer durations are more sensitive to changes in interest rates than securities of shorter durations. |
| 3 | Investment-grade securities are securities that are rated at least “BBB- (minus)” or unrated securities of a comparable quality. Noninvestment-grade securities are securities that are not rated at least “BBB- (minus)” or unrated securities of a comparable quality. Credit ratings are an indication of the risk that a security will default. They do not protect a security from credit risk. Lower-rated bonds typically offer higher yields to help compensate investors for the increased risk associated with them. Among these risks are lower credit-worthiness, greater price volatility, more risk to principal and income than with higher-rated securities and increased possibilities of default. |
| 4 | The value of some mortgage-backed securities may be particularly sensitive to changes in prevailing interest rates, and although the securities are generally supported by some form of government or private insurance, there is no assurance that private guarantors or insurers will meet their obligations. |
| 5 | Bond prices are sensitive to changes in interest rates, and a rise in interest rates can cause a decline in their prices. |
| 6 | The Fund's use of derivative instruments involves risks different from, or possibly greater than, the risks associated with investing directly in securities and other traditional instruments. |

| Federated Fund for U.S. Government Securities II | NA | BBMBS | BBGI | Blended Index | |
| F | NA | I | I | I | |
| 12/31/2007 | 10,000 | 10,000 | 10,000 | 10,000 | |
| 12/31/2008 | 10,428 | 10,834 | 11,239 | 10,967 | |
| 12/31/2009 | 10,971 | 11,472 | 10,992 | 11,314 | |
| 12/31/2010 | 11,538 | 12,088 | 11,599 | 11,928 | |
| 12/31/2011 | 12,204 | 12,841 | 12,645 | 12,781 | |
| 12/31/2012 | 12,568 | 13,174 | 12,900 | 13,089 | |
| 12/31/2013 | 12,310 | 12,988 | 12,565 | 12,852 | |
| 12/31/2014 | 12,879 | 13,777 | 13,183 | 13,585 | |
| 12/31/2015 | 12,945 | 13,985 | 13,296 | 13,761 | |
| 12/31/2016 | 13,153 | 14,219 | 13,435 | 13,964 | |
| 12/31/2017 | 13,407 | 14,571 | 13,744 | 14,301 |
| 1 Year | 5 Years | 10 Years | |
| Fund | 1.92% | 1.30% | 2.97% |
| BBMBS | 2.47% | 2.04% | 3.84% |
| BBGI | 2.30% | 1.28% | 3.23% |
| Blended Index | 2.41% | 1.79% | 3.64% |
| 1 | The Fund's performance assumes the reinvestment of all dividends and distributions. The BBMBS, BBGI and Blended Index have been adjusted to reflect reinvestment of dividends on securities in the indexes. |
| 2 | The BBMBS covers agency mortgage-backed pass-through securities (both fixed-rate and hybrid ARM) issued by Ginnie Mae (GNMA), Fannie Mae (FNMA) and Freddie Mac (FHLMC). The index is not adjusted to reflect sales loads, expenses or other fees that the Securities and Exchange Commission (SEC) requires to be reflected in the Fund's performance. The index is unmanaged and, unlike the Fund, is not affected by cash flows. It is not possible to invest directly in an index. |
| 3 | The BBGI is a market value weighted index of U.S. government and government agency securities (other than mortgage securities) with maturities of one year or more. The index is not adjusted to reflect sales loads, expenses or other fees that the SEC requires to be reflected in the Fund's performance. The index is unmanaged and, unlike the Fund, is not affected by cash flows. It is not possible to invest directly in an index. |
| Type of Investments | Percentage of Total Net Assets |
| U.S. Government Agency Mortgage-Backed Securities | 43.9% |
| U.S. Treasury Securities | 26.1% |
| U.S. Government Agency Commercial Mortgage-Backed Securities | 13.9% |
| U.S. Government Agency Securities | 6.4% |
| Repurchase Agreements | 3.5% |
| Asset-Backed Securities | 3.4% |
| Non-Agency Mortgage-Backed Securities | 2.6% |
| Other Assets and Liabilities—Net2 | 0.2% |
| TOTAL | 100.0% |
| 1 | See the Fund's Prospectus and Statement of Additional Information for a description of the types of securities in which the Fund invests. |
| 2 | Assets, other than investments in securities, less liabilities. See Statement of Assets and Liabilities. |
| Principal Amount | Value | ||
| U.S. TREASURY—26.1% | |||
| U.S. Treasury Bonds—5.2% | |||
| $500,000 | 2.250%, 8/15/2046 | $451,016 | |
| 750,000 | 2.500%, 2/15/2045 | 715,137 | |
| 1,000,000 | 2.750%, 8/15/2042 | 1,007,109 | |
| 1,200,000 | 2.875%, 8/15/2045 | 1,230,844 | |
| 1,250,000 | 3.000%, 11/15/2044 | 1,313,281 | |
| 500,000 | 3.000%, 11/15/2045 | 525,117 | |
| 400,000 | 3.500%, 2/15/2039 | 456,750 | |
| 950,000 | 4.750%, 2/15/2037 | 1,265,578 | |
| TOTAL | 6,964,832 | ||
| U.S. Treasury Notes—20.9% | |||
| 2,000,000 | 1.125%, 7/31/2021 | 1,934,375 | |
| 2,000,000 | 1.375%, 4/30/2020 | 1,975,350 | |
| 3,000,000 | 1.375%, 9/30/2020 | 2,954,048 | |
| 1,250,000 | 1.500%, 8/15/2026 | 1,163,889 | |
| 1,750,000 | 1.625%, 7/31/2020 | 1,736,364 | |
| 1,000,000 | 1.625%, 10/31/2023 | 965,508 | |
| 3,500,000 | 1.750%, 11/30/2021 | 3,451,326 | |
| 1,000,000 | 1.750%, 5/31/2022 | 982,539 | |
| 1,500,000 | 1.875%, 1/31/2022 | 1,484,531 | |
| 1,000,000 | 1.875%, 2/28/2022 | 989,141 | |
| 2,000,000 | 1.875%, 3/31/2022 | 1,977,187 | |
| 1,000,000 | 2.000%, 8/31/2021 | 996,624 | |
| 3,500,000 | 2.000%, 2/15/2023 | 3,463,906 | |
| 550,000 | 2.250%, 8/15/2027 | 542,597 | |
| 3,000,000 | 3.125%, 5/15/2021 | 3,104,553 | |
| TOTAL | 27,721,938 | ||
| TOTAL U.S. TREASURY (IDENTIFIED COST $34,669,138) | 34,686,770 | ||
| ASSET-BACKED SECURITIES—3.4% | |||
| Auto Receivables—2.5% | |||
| 1,223,000 | Capital Auto Receivables Asset Trust 2015-2, Class D, 3.160%, 11/20/2020 | 1,234,413 | |
| 2,030,000 | Santander Drive Auto Receivables Trust 2015-2, Class D, 3.020%, 4/15/2021 | 2,050,882 | |
| TOTAL | 3,285,295 | ||
| Other—0.9% | |||
| 370,579 | Sofi Consumer Loan Program Trust 2016-1, Class A, 3.260%, 8/25/2025 | 373,079 | |
| 531,462 | Sofi Consumer Loan Program Trust 2016-2, Class A, 3.090%, 10/27/2025 | 534,451 | |
| 360,218 | Sofi Consumer Loan Program Trust 2016-3, Class A, 3.050%, 12/26/2025 | 362,203 | |
| TOTAL | 1,269,733 | ||
| TOTAL ASSET-BACKED SECURITIES (IDENTIFIED COST $4,514,010) | 4,555,028 | ||
| GOVERNMENT AGENCIES—6.4% | |||
| Federal Farm Credit System—0.9% | |||
| 1,000,000 | 5.750%, 12/7/2028 | 1,274,744 | |
| Federal Home Loan Bank System—1.2% | |||
| 1,100,000 | 7.125%, 2/15/2030 | 1,557,462 | |
| Federal Home Loan Mortgage Corporation—0.1% | |||
| 72,000 | 6.750%, 9/15/2029 | 100,341 |
| Principal Amount | Value | ||
| GOVERNMENT AGENCIES—continued | |||
| Federal National Mortgage Association—1.1% | |||
| $1,500,000 | 2.125%, 4/24/2026 | $1,453,712 | |
| Tennessee Valley Authority Bonds—3.1% | |||
| 1,700,000 | 2.875%, 2/1/2027 | 1,737,523 | |
| 2,000,000 | 4.650%, 6/15/2035 | 2,449,689 | |
| TOTAL | 4,187,212 | ||
| TOTAL GOVERNMENT AGENCIES (IDENTIFIED COST $7,327,411) | 8,573,471 | ||
| MORTGAGE-BACKED SECURITIES—43.9% | |||
| Federal Home Loan Mortgage Corporation—15.8% | |||
| 1,663,078 | 3.000%, 8/1/2043 | 1,672,828 | |
| 816,808 | 3.000%, 5/1/2045 | 819,045 | |
| 2,830,401 | 3.000%, 1/1/2047 | 2,832,844 | |
| 1,122,934 | 3.500%, 4/1/2042 | 1,161,197 | |
| 887,993 | 3.500%, 7/1/2042 | 918,251 | |
| 1,703,631 | 3.500%, 9/1/2043 | 1,759,019 | |
| 3,005,395 | 4.000%, 12/1/2041 | 3,167,469 | |
| 312,268 | 4.000%, 1/1/2042 | 329,108 | |
| 106,013 | 4.500%, 6/1/2019 | 107,401 | |
| 67,175 | 4.500%, 10/1/2020 | 68,819 | |
| 511,875 | 4.500%, 8/1/2040 | 549,170 | |
| 1,077,916 | 4.500%, 12/1/2040 | 1,156,116 | |
| 1,535,031 | 4.500%, 4/1/2041 | 1,646,393 | |
| 57,660 | 5.000%, 7/1/2019 | 58,431 | |
| 61,304 | 5.000%, 2/1/2021 | 63,260 | |
| 579,311 | 5.000%, 1/1/2034 | 628,234 | |
| 152,016 | 5.000%, 5/1/2034 | 164,878 | |
| 142,374 | 5.000%, 4/1/2036 | 154,668 | |
| 42,014 | 5.000%, 5/1/2036 | 45,594 | |
| 30,211 | 5.000%, 6/1/2036 | 32,821 | |
| 279,308 | 5.000%, 6/1/2040 | 302,780 | |
| 23,042 | 5.500%, 12/1/2020 | 23,885 | |
| 897,544 | 5.500%, 5/1/2034 | 993,240 | |
| 15,033 | 5.500%, 12/1/2035 | 16,669 | |
| 189,804 | 5.500%, 2/1/2036 | 210,619 | |
| 60,232 | 5.500%, 5/1/2036 | 67,293 | |
| 11,871 | 5.500%, 5/1/2036 | 13,164 | |
| 19,550 | 5.500%, 5/1/2036 | 21,658 | |
| 8,406 | 5.500%, 6/1/2036 | 9,326 | |
| 4,420 | 5.500%, 6/1/2036 | 4,902 | |
| 154,090 | 5.500%, 11/1/2037 | 171,077 | |
| 311,537 | 5.500%, 1/1/2038 | 345,880 | |
| 269,438 | 5.500%, 3/1/2040 | 298,804 | |
| 6,150 | 6.000%, 1/1/2032 | 6,947 | |
| 6,657 | 6.000%, 1/1/2032 | 7,539 | |
| 43,389 | 6.000%, 2/1/2032 | 48,936 | |
| 183,216 | 6.000%, 4/1/2036 | 207,260 | |
| 41,003 | 6.000%, 5/1/2036 | 46,304 | |
| 281,280 | 6.000%, 6/1/2037 | 317,216 | |
| 34,255 | 6.000%, 7/1/2037 | 38,594 | |
| 35,330 | 6.500%, 6/1/2022 | 38,846 |
| Principal Amount | Value | ||
| MORTGAGE-BACKED SECURITIES—continued | |||
| Federal Home Loan Mortgage Corporation—continued | |||
| $1,539 | 6.500%, 5/1/2024 | $1,686 | |
| 13,039 | 6.500%, 3/1/2029 | 14,744 | |
| 5,665 | 6.500%, 6/1/2029 | 6,412 | |
| 4,449 | 6.500%, 7/1/2029 | 5,036 | |
| 733 | 6.500%, 9/1/2029 | 822 | |
| 81,921 | 6.500%, 5/1/2031 | 92,259 | |
| 3,040 | 7.000%, 12/1/2029 | 3,498 | |
| 1,235 | 7.000%, 6/1/2030 | 1,413 | |
| 268 | 7.000%, 11/1/2030 | 311 | |
| 197,924 | 7.000%, 4/1/2032 | 230,679 | |
| 20,057 | 7.500%, 12/1/2030 | 23,541 | |
| 16,751 | 7.500%, 1/1/2031 | 19,603 | |
| 5,497 | 8.500%, 5/1/2030 | 6,572 | |
| 1,350 | 9.000%, 2/1/2025 | 1,534 | |
| 1,222 | 9.000%, 5/1/2025 | 1,399 | |
| TOTAL | 20,935,994 | ||
| Federal National Mortgage Association—13.7% | |||
| 3,606,291 | 3.500%, 8/1/2042 | 3,730,581 | |
| 1,307,074 | 3.500%, 9/1/2042 | 1,349,876 | |
| 1,908,860 | 3.500%, 2/1/2047 | 1,961,376 | |
| 559,660 | 4.000%, 2/1/2041 | 590,016 | |
| 336,122 | 4.000%, 12/1/2041 | 354,774 | |
| 1,492,019 | 4.000%, 12/1/2041 | 1,572,946 | |
| 866,969 | 4.500%, 1/1/2042 | 928,612 | |
| 1,185,966 | 4.000%, 4/1/2042 | 1,250,293 | |
| 49,309 | 4.500%, 12/1/2019 | 49,970 | |
| 490,238 | 4.500%, 10/1/2041 | 525,094 | |
| 2,648,111 | 4.500%, 2/1/2042 | 2,834,741 | |
| 429,506 | 5.000%, 7/1/2034 | 465,149 | |
| 46,101 | 5.000%, 11/1/2035 | 49,972 | |
| 365,512 | 5.000%, 7/1/2040 | 395,244 | |
| 48,713 | 5.500%, 11/1/2021 | 50,952 | |
| 203,807 | 5.500%, 9/1/2034 | 225,903 | |
| 100,785 | 5.500%, 8/1/2035 | 111,761 | |
| 108,372 | 5.500%, 1/1/2036 | 120,102 | |
| 127,659 | 5.500%, 4/1/2036 | 141,447 | |
| 72,134 | 6.000%, 8/1/2021 | 75,487 | |
| 6,133 | 6.000%, 7/1/2029 | 6,819 | |
| 3,196 | 6.000%, 5/1/2031 | 3,588 | |
| 19,971 | 6.000%, 5/1/2036 | 22,519 | |
| 226,935 | 6.000%, 7/1/2036 | 256,397 | |
| 10,207 | 6.000%, 7/1/2036 | 11,524 | |
| 71,950 | 6.000%, 9/1/2037 | 81,000 | |
| 186,964 | 6.000%, 11/1/2037 | 210,663 | |
| 106,385 | 6.000%, 12/1/2037 | 114,094 | |
| 325,175 | 6.000%, 3/1/2038 | 367,121 | |
| 2,084 | 6.500%, 6/1/2029 | 2,375 | |
| 6,955 | 6.500%, 6/1/2029 | 7,910 | |
| 753 | 6.500%, 6/1/2029 | 857 | |
| 381 | 6.500%, 7/1/2029 | 432 |
| Principal Amount | Value | ||
| MORTGAGE-BACKED SECURITIES—continued | |||
| Federal National Mortgage Association—continued | |||
| $798 | 6.500%, 7/1/2029 | $852 | |
| 270 | 6.500%, 7/1/2029 | 306 | |
| 7,445 | 6.500%, 7/1/2029 | 8,484 | |
| 31 | 6.500%, 7/1/2029 | 35 | |
| 369 | 6.500%, 7/1/2029 | 418 | |
| 460 | 6.500%, 8/1/2029 | 519 | |
| 10,153 | 6.500%, 9/1/2030 | 11,570 | |
| 25 | 6.500%, 5/1/2031 | 26 | |
| 31,430 | 6.500%, 6/1/2031 | 35,594 | |
| 26,519 | 6.500%, 4/1/2032 | 30,231 | |
| 11,111 | 6.500%, 11/1/2035 | 12,604 | |
| 3,465 | 7.000%, 2/1/2024 | 3,800 | |
| 4,975 | 7.000%, 10/1/2029 | 5,704 | |
| 14,654 | 7.000%, 10/1/2029 | 16,948 | |
| 4,786 | 7.000%, 11/1/2030 | 5,568 | |
| 105,733 | 7.000%, 4/1/2031 | 122,692 | |
| 96,314 | 7.000%, 4/1/2032 | 112,156 | |
| 2,448 | 7.500%, 8/1/2028 | 2,818 | |
| 378 | 7.500%, 9/1/2028 | 439 | |
| 4,175 | 7.500%, 2/1/2030 | 4,883 | |
| 8,714 | 8.000%, 7/1/2030 | 10,341 | |
| 2,002 | 8.000%, 7/1/2030 | 2,383 | |
| TOTAL | 18,257,966 | ||
| Government Agency—0.7% | |||
| 930,545 | FDIC Trust 2013-R2, Class A, 1.250%, 3/25/2033 | 919,180 | |
| Government National Mortgage Association—13.7% | |||
| 4,000,000 | 3.000%, 5/20/2047 | 4,040,434 | |
| 4,240,800 | 3.500%, 6/20/2046 | 4,388,840 | |
| 1,481,024 | 3.500%, 8/20/2047 | 1,539,435 | |
| 2,985,580 | 3.500%, 9/20/2047 | 3,091,202 | |
| 806,355 | 4.500%, 6/20/2039 | 866,712 | |
| 713,788 | 4.500%, 10/15/2039 | 767,216 | |
| 931,347 | 4.500%, 8/20/2040 | 1,001,059 | |
| 440,937 | 5.000%, 7/15/2034 | 486,067 | |
| 41,940 | 6.000%, 4/15/2032 | 47,424 | |
| 80,045 | 6.000%, 5/15/2032 | 91,546 | |
| 150,774 | 6.000%, 4/15/2036 | 173,215 | |
| 303,969 | 6.000%, 5/15/2036 | 346,493 | |
| 307,715 | 6.000%, 5/15/2036 | 354,164 | |
| 55,324 | 6.000%, 5/20/2037 | 63,086 | |
| 58,872 | 6.000%, 7/20/2036 | 67,009 | |
| 320,418 | 6.000%, 7/20/2038 | 364,515 | |
| 8,569 | 6.500%, 12/15/2023 | 9,309 | |
| 16,310 | 6.500%, 5/15/2024 | 17,791 | |
| 3,218 | 6.500%, 6/15/2029 | 3,685 | |
| 9,518 | 6.500%, 7/15/2029 | 10,950 | |
| 5,904 | 6.500%, 6/15/2031 | 6,809 | |
| 7,014 | 6.500%, 7/20/2031 | 8,078 | |
| 6,787 | 6.500%, 8/20/2031 | 7,814 | |
| 51,058 | 6.500%, 10/15/2031 | 58,593 |
| Principal Amount | Value | ||
| MORTGAGE-BACKED SECURITIES—continued | |||
| Government National Mortgage Association—continued | |||
| $67,500 | 6.500%, 12/15/2031 | $77,779 | |
| 9,187 | 6.500%, 4/15/2032 | 10,530 | |
| 32,746 | 6.500%, 5/15/2032 | 37,562 | |
| 223,535 | 6.500%, 5/15/2032 | 258,457 | |
| 1,904 | 7.500%, 10/15/2029 | 2,236 | |
| 1,159 | 7.500%, 10/15/2029 | 1,361 | |
| 6,654 | 7.500%, 3/20/2030 | 7,774 | |
| 1,121 | 8.000%, 4/15/2030 | 1,354 | |
| TOTAL | 18,208,499 | ||
| TOTAL MORTGAGE-BACKED SECURITIES (IDENTIFIED COST $56,548,934) | 58,321,639 | ||
| COLLATERALIZED MORTGAGE OBLIGATIONS—2.6% | |||
| Non-Agency Mortgage-Backed Securities—2.6% | |||
| 151,726 | Credit Suisse Mortgage Trust 2007-4, Class 4A2, 5.500%, 6/25/2037 | 115,611 | |
| 385,500 | Credit Suisse Mortgage Trust 2014-WIN2, Class A2, 3.500%, 10/25/2044 | 391,739 | |
| 887,202 | Credit Suisse Mortgage Trust 2015-WIN1, Class A6, 3.500%, 12/25/2044 | 899,455 | |
| 124,429 | Sequoia Mortgage Trust 2012-1, Class 2A1, 3.474%, 1/25/2042 | 126,389 | |
| 503,241 | Sequoia Mortgage Trust 2014-1, Class 2A5, 4.000%, 4/25/2044 | 521,258 | |
| 1,344,883 | Sequoia Mortgage Trust 2014-4, Class A5, 3.500%, 11/25/2044 | 1,367,596 | |
| TOTAL COLLATERALIZED MORTGAGE OBLIGATIONS (IDENTIFIED COST $3,438,198) | 3,422,048 | ||
| COMMERCIAL MORTGAGE-BACKED SECURITIES—13.9% | |||
| Agency Commercial Mortgage-Backed Securities—13.9% | |||
| 2,256,875 | FHLMC REMIC K720 A1, 2.316%, 11/25/2021 | 2,255,591 | |
| 1,800,000 | FHLMC REMIC K504 A2, 2.566%, 9/25/2020 | 1,812,198 | |
| 1,250,000 | FHLMC REMIC K054 A2, 2.745%, 1/25/2026 | 1,244,438 | |
| 2,570,554 | FHLMC REMIC K050 A1, 2.802%, 1/25/2025 | 2,583,882 | |
| 2,741,382 | FHLMC REMIC K060 A1, 2.958%, 7/25/2026 | 2,782,825 | |
| 3,721,402 | FHLMC REMIC K703 A2, 2.699%, 5/25/2018 | 3,723,435 | |
| 1,930,122 | FHLMC REMIC K704 A2, 2.412%, 8/25/2018 | 1,932,913 | |
| 2,127,925 | FNMA REMIC 2011-M7 A2, 2.578%, 9/25/2018 | 2,129,263 | |
| TOTAL COMMERCIAL MORTGAGE-BACKED SECURITIES (IDENTIFIED COST $18,707,747) | 18,464,545 | ||
| REPURCHASE AGREEMENT—3.5% | |||
| 4,672,000 | Interest in $950,000,000 joint repurchase agreement 1.42%, dated 12/29/2017 under which Bank of America, N.A. will repurchase securities provided as collateral for $950,149,889 on 1/2/2018. The securities provided as collateral at the end of the period held with BNY Mellon as tri-party agent, were U.S. Government Agency securities maturing on 7/20/2046 and the market value of those underlying securities was $969,152,887. (IDENTIFIED COST $4,672,000) | 4,672,000 | |
| TOTAL INVESTMENT IN SECURITIES—99.8% (IDENTIFIED COST $129,877,438)1 | 132,695,501 | ||
| OTHER ASSETS AND LIABILITIES - NET—0.2%2 | 262,430 | ||
| TOTAL NET ASSETS—100% | $132,957,931 |
| 1 | The cost of investments for federal tax purposes amounts to $129,832,510. |
| 2 | Assets, other than investments in securities, less liabilities. See Statement of Assets and Liabilities. |
| FDIC | —Federal Deposit Insurance Corporation |
| FHLMC | —Federal Home Loan Mortgage Corporation |
| FNMA | —Federal National Mortgage Association |
| REMIC | —Real Estate Mortgage Investment Conduit |
| Year Ended December 31 | 2017 | 2016 | 2015 | 2014 | 2013 |
| Net Asset Value, Beginning of Period | $10.78 | $10.88 | $11.12 | $10.95 | $11.55 |
| Income From Investment Operations: | |||||
| Net investment income | 0.231 | 0.231 | 0.251 | 0.271 | 0.261 |
| Net realized and unrealized gain (loss) on investments | (0.03) | (0.06) | (0.19) | 0.23 | (0.49) |
| TOTAL FROM INVESTMENT OPERATIONS | 0.20 | 0.17 | 0.06 | 0.50 | (0.23) |
| Less Distributions: | |||||
| Distributions from net investment income | (0.25) | (0.27) | (0.30) | (0.33) | (0.37) |
| Net Asset Value, End of Period | $10.73 | $10.78 | $10.88 | $11.12 | $10.95 |
| Total Return2 | 1.92% | 1.61% | 0.52% | 4.62% | (2.05)% |
| Ratios to Average Net Assets: | |||||
| Net expenses | 0.78% | 0.76% | 0.76% | 0.76% | 0.76% |
| Net investment income | 2.13% | 2.12% | 2.25% | 2.45% | 2.34% |
| Expense waiver/reimbursement3 | 0.07% | 0.06% | 0.03% | 0.04% | 0.03% |
| Supplemental Data: | |||||
| Net assets, end of period (000 omitted) | $132,958 | $152,795 | $168,742 | $187,012 | $201,117 |
| Portfolio turnover | 24% | 53% | 34% | 51% | 94% |
| Portfolio turnover (excluding purchases and sales from dollar-roll transactions) | 24% | 41% | 27% | 26% | 38% |
| 1 | Per share numbers have been calculated using the average shares method. |
| 2 | Based on net asset value. Total returns do not reflect any additional fees or expenses that may be imposed by separate accounts of insurance companies or in connection with any variable annuity or variable life insurance contract. |
| 3 | This expense decrease is reflected in both the net expense and the net investment income ratios shown above. |
| Assets: | ||
| Investment in securities, at value (identified cost $129,877,438) | $132,695,501 | |
| Cash | 69 | |
| Income receivable | 500,648 | |
| Receivable for shares sold | 18,145 | |
| TOTAL ASSETS | 133,214,363 | |
| Liabilities: | ||
| Payable for shares redeemed | $163,200 | |
| Payable to adviser (Note 5) | 5,620 | |
| Payable for administrative fees (Note 5) | 876 | |
| Payable for portfolio accounting fees | 59,038 | |
| Payable for printing and postage | 15,310 | |
| Accrued expenses (Note 5) | 12,388 | |
| TOTAL LIABILITIES | 256,432 | |
| Net assets for 12,395,172 shares outstanding | $132,957,931 | |
| Net Assets Consist of: | ||
| Paid-in capital | $127,716,927 | |
| Net unrealized appreciation of investments | 2,818,063 | |
| Accumulated net realized loss on investments | (648,411) | |
| Undistributed net investment income | 3,071,352 | |
| TOTAL NET ASSETS | $132,957,931 | |
| Net Asset Value, Offering Price and Redemption Proceeds Per Share: | ||
| $132,957,931 ÷ 12,395,172 shares outstanding, no par value, unlimited shares authorized | $10.73 |
| Investment Income: | ||
| Interest | $4,165,915 | |
| Net income on securities loaned | 246 | |
| TOTAL INCOME | 4,166,161 | |
| Expenses: | ||
| Investment adviser fee (Note 5) | $861,311 | |
| Administrative fee (Note 5) | 113,592 | |
| Custodian fees | 16,914 | |
| Transfer agent fee | 13,979 | |
| Directors'/Trustees' fees (Note 5) | 2,444 | |
| Auditing fees | 24,500 | |
| Legal fees | 8,638 | |
| Portfolio accounting fees | 105,092 | |
| Printing and postage | 45,529 | |
| Miscellaneous (Note 5) | 20,751 | |
| TOTAL EXPENSES | 1,212,750 | |
| Waiver of investment adviser fee (Note 5) | (99,183) | |
| Net expenses | 1,113,567 | |
| Net investment income | 3,052,594 | |
| Realized and Unrealized Gain (Loss) on Investments: | ||
| Net realized loss on investments | (44,101) | |
| Net change in unrealized appreciation of investments | (149,444) | |
| Net realized and unrealized loss on investments | (193,545) | |
| Change in net assets resulting from operations | $2,859,049 |
| Year Ended December 31 | 2017 | 2016 |
| Increase (Decrease) in Net Assets | ||
| Operations: | ||
| Net investment income | $3,052,594 | $3,457,240 |
| Net realized gain (loss) on investments and futures contracts | (44,101) | 180,091 |
| Net change in unrealized appreciation/depreciation of investments | (149,444) | (906,896) |
| CHANGE IN NET ASSETS RESULTING FROM OPERATIONS | 2,859,049 | 2,730,435 |
| Distributions to Shareholders: | ||
| Distributions from net investment income | (3,508,674) | (4,161,172) |
| Share Transactions: | ||
| Proceeds from sale of shares | 10,604,671 | 29,512,173 |
| Net asset value of shares issued to shareholders in payment of distributions declared | 3,508,674 | 4,161,172 |
| Cost of shares redeemed | (33,301,113) | (48,188,993) |
| CHANGE IN NET ASSETS RESULTING FROM SHARE TRANSACTIONS | (19,187,768) | (14,515,648) |
| Change in net assets | (19,837,393) | (15,946,385) |
| Net Assets: | ||
| Beginning of period | 152,795,324 | 168,741,709 |
| End of period (including undistributed net investment income of $3,071,352 and $3,507,201, respectively) | $132,957,931 | $152,795,324 |
| ■ | Fixed-income securities are fair valued using price evaluations provided by a pricing service approved by the Fund's Board of Trustees (the “Trustees”). |
| ■ | Derivative contracts listed on exchanges are valued at their reported settlement or closing price, except that options are valued at the mean of closing bid and asked quotations. |
| ■ | Over-the-counter (OTC) derivative contracts are fair valued using price evaluations provided by a pricing service approved by the Trustees. |
| ■ | Shares of other mutual funds or non-exchange-traded investment companies are valued based upon their reported NAVs. |
| ■ | For securities that are fair valued in accordance with procedures established by and under the general supervision of the Trustees, certain factors may be considered such as: the last traded or purchase price of the security, information obtained by contacting the issuer or dealers, analysis of the issuer's financial statements or other available documents, fundamental analytical data, the nature and duration of restrictions on disposition, the movement of the market in which the security is normally traded, public trading in similar securities or derivative contracts of the issuer or comparable issuers, movement of a relevant index, or other factors including but not limited to industry changes and relevant government actions. |
| Year Ended December 31 | 2017 | 2016 |
| Shares sold | 987,615 | 2,694,329 |
| Shares issued to shareholders in payment of distributions declared | 332,891 | 386,367 |
| Shares redeemed | (3,105,366) | (4,406,170) |
| NET CHANGE RESULTING FROM FUND SHARE TRANSACTIONS | (1,784,860) | (1,325,474) |
| Increase (Decrease) | ||
| Paid-In Capital | Undistributed Net Investment Income (Loss) | Accumulated Net Realized Gain (Loss) |
| $(98,280) | $20,231 | $78,049 |
| 2017 | 2016 | |
| Ordinary income | $3,508,674 | $4,161,172 |
| Undistributed ordinary income | $3,071,352 |
| Net unrealized appreciation | $2,727,034 |
| Capital loss carry forwards | $(557,382) |
| Short-Term | Long-Term | Total |
| $324,844 | $232,538 | $557,382 |
| Administrative Fee | Average Daily Net Assets of the Investment Complex |
| 0.100% | on assets up to $50 billion |
| 0.075% | on assets over $50 billion |
| Administrative Fee | Average Daily Net Assets of the Investment Complex |
| 0.150% | on the first $5 billion |
| 0.125% | on the next $5 billion |
| 0.100% | on the next $10 billion |
| 0.075% | on assets in excess of $20 billion |
| Purchases | $— |
| Sales | $16,777,246 |
February 14, 2018
| Beginning Account Value 7/1/2017 | Ending Account Value 12/31/2017 | Expenses Paid During Period1 | |
| Actual | $1,000 | $1,004.70 | $3.94 |
| Hypothetical (assuming a 5% return before expenses) | $1,000 | $1,021.30 | $3.97 |
| 1 | Expenses are equal to the Fund's annualized net expense ratio of 0.78%, multiplied by the average account value over the period, multiplied by 184/365 (to reflect the one-half-year period). The expenses shown in the table do not include the charges and expenses imposed by the insurance company under the variable insurance product contract. Please refer to the variable insurance product prospectus for a complete listing of these expenses. |
| Name Birth Date Positions Held with Trust Date Service Began | Principal Occupation(s) for Past Five Years, Other Directorships Held and Previous Position(s) |
| J. Christopher Donahue* Birth Date: April 11, 1949 Trustee Indefinite Term Began serving: September 1993 | Principal Occupations: Principal Executive Officer and President of certain of the Funds in the Federated Fund Family; Director or Trustee of the Funds in the Federated Fund Family; President, Chief Executive Officer and Director, Federated Investors, Inc.; Chairman and Trustee, Federated Investment Management Company; Trustee, Federated Investment Counseling; Chairman and Director, Federated Global Investment Management Corp.; Chairman and Trustee, Federated Equity Management Company of Pennsylvania; Trustee, Federated Shareholder Services Company; Director, Federated Services Company. Previous Positions: President, Federated Investment Counseling; President and Chief Executive Officer, Federated Investment Management Company, Federated Global Investment Management Corp. and Passport Research, Ltd; Chairman, Passport Research, Ltd. |
| Thomas R. Donahue* Birth Date: October 20, 1958 Trustee Indefinite Term Began serving: May 2016 | Principal Occupations: Director or Trustee of certain of the funds in the Federated Fund Family; Chief Financial Officer, Treasurer, Vice President and Assistant Secretary, Federated Investors, Inc.; Chairman and Trustee, Federated Administrative Services; Chairman and Director, Federated Administrative Services, Inc.; Trustee and Treasurer, Federated Advisory Services Company; Director or Trustee and Treasurer, Federated Equity Management Company of Pennsylvania, Federated Global Investment Management Corp., Federated Investment Counseling, and Federated Investment Management Company; Director, MDTA LLC; Director, Executive Vice President and Assistant Secretary, Federated Securities Corp.; Director or Trustee and Chairman, Federated Services Company and Federated Shareholder Services Company; and Director and President, FII Holdings, Inc. Previous Positions: Director, Federated Investors, Inc.; Assistant Secretary, Federated Investment Management Company, Federated Global Investment Management Company and Passport Research, LTD; Treasurer, Passport Research, LTD; Executive Vice President, Federated Securities Corp.; and Treasurer, FII Holdings, Inc. |
| * | Family relationships and reasons for “interested” status: J. Christopher Donahue and Thomas R. Donahue are brothers. Both are “interested” due to their beneficial ownership of shares of Federated Investors, Inc. and the positions they hold with Federated and its subsidiaries. |
| Name Birth Date Positions Held with Trust Date Service Began | Principal Occupation(s) for Past Five Years, Other Directorships Held, Previous Position(s) and Qualifications |
| John T. Collins Birth Date: January 24, 1947 Trustee Indefinite Term Began serving: October 2013 | Principal Occupations: Director or Trustee of the Federated Fund Family; formerly, Chairman and CEO, The Collins Group, Inc. (a private equity firm) (Retired). Other Directorships Held: Director, Current Chair of the Compensation Committee, KLX Corp. Qualifications: Mr. Collins has served in several business and financial management roles and directorship positions throughout his career. Mr. Collins previously served as Chairman and CEO, The Collins Group, Inc. (a private equity firm). Mr. Collins serves as Chairman Emeriti, Bentley University. Mr. Collins previously served as Director and Audit Committee Member, Bank of America Corp.; Director, FleetBoston Financial Corp.; and Director, Beth Israel Deaconess Medical Center (Harvard University Affiliate Hospital). |
| G. Thomas Hough Birth Date: February 28, 1955 Trustee Indefinite Term Began serving: August 2015 | Principal Occupations: Director or Trustee of the Federated Fund Family; formerly, Vice Chair, Ernst & Young LLP (public accounting firm) (Retired). Other Directorships Held: Director, Chair of the Audit Committee, Governance Committee, Publix Super Markets, Inc.; Director, Member of the Audit Committee and Technology Committee of Equifax, Inc. Qualifications: Mr. Hough has served in accounting, business management and directorship positions throughout his career. Mr. Hough most recently held the position of Americas Vice Chair of Assurance with Ernst & Young LLP (public accounting firm). Mr. Hough is an Executive Committee member of the United States Golf Association, he serves on the President's Cabinet and Business School Board of Visitors for the University of Alabama and is on the Business School Board of Visitors for Wake Forest University. |
| Name Birth Date Positions Held with Trust Date Service Began | Principal Occupation(s) for Past Five Years, Other Directorships Held, Previous Position(s) and Qualifications |
| Maureen Lally-Green Birth Date: July 5, 1949 Trustee Indefinite Term Began serving: August 2009 | Principal Occupations: Director or Trustee of the Federated Fund Family; Dean of the Duquesne University School of Law; Professor and Adjunct Professor of Law, Duquesne University School of Law; formerly, Interim Dean of the Duquesne University School of Law; Associate General Secretary and Director, Office of Church Relations, Diocese of Pittsburgh. Other Directorships Held: Director, CNX Resources Corporation (formerly known as CONSOL Energy Inc.). Qualifications: Judge Lally-Green has served in various legal and business roles and directorship positions throughout her career. Judge Lally-Green previously served as: Associate General Secretary, Diocese of Pittsburgh; a member of the Superior Court of Pennsylvania; and as a Professor of Law, Duquesne University School of Law. Judge Lally-Green also currently holds the positions on either a public or not for profit Board of Directors as follows: Director and Chair, UPMC Mercy Hospital; Director and Vice Chair, Our Campaign for the Church Alive!, Inc.; Director, Saint Vincent College; Member, Pennsylvania State Board of Education (public); and Director CNX Resources Corporation (formerly known as CONSOL Energy Inc.), where she currently serves as a member of the Compensation, Nominating and Corporate Governance Committee (Chair) and the Health, Safety and Environmental Committee. Judge Lally-Green has held the positions of: Director, Auberle; Director, Epilepsy Foundation of Western and Central Pennsylvania; Director, Ireland Institute of Pittsburgh; Director, Saint Thomas More Society; Director and Chair, Catholic High Schools of the Diocese of Pittsburgh, Inc.; Director, Pennsylvania Bar Institute; Regent, St. Vincent Seminary; and Director and Chair, Cardinal Wuerl North Catholic High School, Inc. |
| Charles F. Mansfield, Jr. Birth Date: April 10, 1945 Trustee Indefinite Term Began serving: September 1999 | Principal Occupations: Director or Trustee of the Federated Fund Family; Management Consultant. Other Directorships Held: None. Qualifications: Mr. Mansfield has served as a Marine Corps officer and in several banking, business management, educational roles and directorship positions throughout his long career. He remains active as a Management Consultant. |
| Thomas M. O'Neill Birth Date: June 14, 1951 Trustee Indefinite Term Began serving: August 2006 | Principal Occupations: Director or Trustee, Chair of the Audit Committee of the Federated Fund Family; Sole Proprietor, Navigator Management Company (investment and strategic consulting). Other Directorships Held: None. Qualifications: Mr. O'Neill has served in several business, mutual fund and financial management roles and directorship positions throughout his career. Mr. O'Neill serves as Director, Medicines for Humanity and Director, The Golisano Children's Museum of Naples, Florida. Mr. O'Neill previously served as Chief Executive Officer and President, Managing Director and Chief Investment Officer, Fleet Investment Advisors; President and Chief Executive Officer, Aeltus Investment Management, Inc.; General Partner, Hellman, Jordan Management Co., Boston, MA; Chief Investment Officer, The Putnam Companies, Boston, MA; Credit Analyst and Lending Officer, Fleet Bank; Director and Consultant, EZE Castle Software (investment order management software); and Director, Midway Pacific (lumber). |
| P. Jerome Richey Birth Date: February 23, 1949 Trustee Indefinite Term Began serving: October 2013 | Principal Occupations: Director or Trustee of the Federated Fund Family; Management Consultant; formerly, Senior Vice Chancellor and Chief Legal Officer, University of Pittsburgh and Executive Vice President and Chief Legal Officer, CNX Resources Corporation (formerly known as CONSOL Energy Inc.) Other Directorships Held: None. Qualifications: Mr. Richey has served in several business and legal management roles and directorship positions throughout his career. Mr. Richey most recently held the positions of Senior Vice Chancellor and Chief Legal Officer, University of Pittsburgh. Mr. Richey previously served as Chairman of the Board, Epilepsy Foundation of Western Pennsylvania and Chairman of the Board, World Affairs Council of Pittsburgh. Mr. Richey previously served as Chief Legal Officer and Executive Vice President, CNX Resources Corporation (formerly known as CONSOL Energy Inc.); and Board Member, Ethics Counsel and Shareholder, Buchanan Ingersoll & Rooney PC (a law firm). |
| John S. Walsh Birth Date: November 28, 1957 Trustee Indefinite Term Began serving: January 1999 | Principal Occupations: Director or Trustee, and Chair of the Board of Directors or Trustees, of the Federated Fund Family; President and Director, Heat Wagon, Inc. (manufacturer of construction temporary heaters); President and Director, Manufacturers Products, Inc. (distributor of portable construction heaters); President, Portable Heater Parts, a division of Manufacturers Products, Inc. Other Directorships Held: None. Qualifications: Mr. Walsh has served in several business management roles and directorship positions throughout his career. Mr. Walsh previously served as Vice President, Walsh & Kelly, Inc. (paving contractors). |
| Name Birth Date Address Positions Held with Trust Date Service Began | Principal Occupation(s) for Past Five Years and Previous Position(s) |
| Lori A. Hensler Birth Date: January 6, 1967 TREASURER Officer since: April 2013 | Principal Occupations: Principal Financial Officer and Treasurer of the Federated Fund Family; Senior Vice President, Federated Administrative Services; Financial and Operations Principal for Federated Securities Corp. and Edgewood Services, Inc.; and Assistant Treasurer, Federated Investors Trust Company. Ms. Hensler has received the Certified Public Accountant designation. Previous Positions: Controller of Federated Investors, Inc.; Senior Vice President and Assistant Treasurer, Federated Investors Management Company; Treasurer, Federated Investors Trust Company; Assistant Treasurer, Federated Administrative Services, Federated Administrative Services, Inc., Federated Securities Corp., Edgewood Services, Inc., Federated Advisory Services Company, Federated Equity Management Company of Pennsylvania, Federated Global Investment Management Corp., Federated Investment Counseling, Federated Investment Management Company, Passport Research, Ltd., and Federated MDTA, LLC; Financial and Operations Principal for Federated Securities Corp., Edgewood Services, Inc. and Southpointe Distribution Services, Inc. |
| Peter J. Germain Birth Date: September 3, 1959 CHIEF LEGAL OFFICER, SECRETARY and EXECUTIVE VICE PRESIDENT Officer since: January 2005 | Principal Occupations: Mr. Germain is Chief Legal Officer, Secretary and Executive Vice President of the Federated Fund Family. He is General Counsel, Chief Legal Officer, Secretary and Executive Vice President, Federated Investors, Inc.; Trustee and Senior Vice President, Federated Investors Management Company; Trustee and President, Federated Administrative Services; Director and President, Federated Administrative Services, Inc.; Director and Vice President, Federated Securities Corp.; Director and Secretary, Federated Private Asset Management, Inc.; Secretary, Federated Shareholder Services Company; and Secretary, Retirement Plan Service Company of America. Mr. Germain joined Federated in 1984 and is a member of the Pennsylvania Bar Association. Previous Positions: Deputy General Counsel, Special Counsel, Managing Director of Mutual Fund Services, Federated Investors, Inc.; Senior Vice President, Federated Services Company; and Senior Corporate Counsel, Federated Investors, Inc. |
| Richard B. Fisher Birth Date: May 17, 1923 VICE PRESIDENT Officer since: September 1993 | Principal Occupations: Vice Chairman or Vice President of some of the Funds in the Federated Fund Family; Vice Chairman, Federated Investors, Inc.; Chairman, Federated Securities Corp. Previous Positions: President and Director or Trustee of some of the Funds in the Federated Fund Family; Executive Vice President, Federated Investors, Inc.; Director and Chief Executive Officer, Federated Securities Corp. |
| John B. Fisher Birth Date: May 16, 1956 PRESIDENT Officer since: November 2004 | Principal Occupations: Principal Executive Officer and President of certain of the Funds in the Federated Fund Family; Director or Trustee of certain of the Funds in the Federated Fund Family; Vice President, Federated Investors, Inc.; President, Director/Trustee and CEO, Federated Advisory Services Company, Federated Equity Management Company of Pennsylvania, Federated Global Investment Management Corp., Federated Investment Counseling, Federated Investment Management Company; President and CEO of Passport Research, Ltd.; President of some of the Funds in the Federated Fund Complex and Director, Federated Investors Trust Company. Previous Positions: President and Director of the Institutional Sales Division of Federated Securities Corp.; President and Director of Federated Investment Counseling; Director, Edgewood Securities Corp.; Director, Federated Services Company; Director, Federated Investors, Inc.; Chairman and Director, Southpointe Distribution Services, Inc. and President, Technology, Federated Services Company. |
| Stephen Van Meter Birth Date: June 5, 1975 CHIEF COMPLIANCE OFFICER AND SENIOR VICE PRESIDENT Officer since: July 2015 | Principal Occupations: Senior Vice President and Chief Compliance Officer of the Federated Fund Family; Vice President and Chief Compliance Officer of Federated Investors, Inc. and Chief Compliance Officer of certain of its subsidiaries. Mr. Van Meter joined Federated in October 2011. He holds FINRA licenses under Series 3, 7, 24 and 66. Previous Positions: Mr. Van Meter previously held the position of Compliance Operating Officer, Federated Investors, Inc. Prior to joining Federated, Mr. Van Meter served at the United States Securities and Exchange Commission in the positions of Senior Counsel, Office of Chief Counsel, Division of Investment Management and Senior Counsel, Division of Enforcement. |
| Stephen F. Auth Birth Date: September 13, 1956 101 Park Avenue 41st Floor New York, NY 10178 CHIEF INVESTMENT OFFICER Officer since: November 2002 | Principal Occupations: Stephen F. Auth is Chief Investment Officer of various Funds in the Federated Fund Family; Executive Vice President, Federated Investment Counseling, Federated Global Investment Management Corp. and Federated Equity Management Company of Pennsylvania. Previous Positions: Executive Vice President, Federated Investment Management Company and Passport Research, Ltd. (investment advisory subsidiary of Federated); Senior Vice President, Global Portfolio Management Services Division; Senior Vice President, Federated Investment Management Company and Passport Research, Ltd.; Senior Managing Director and Portfolio Manager, Prudential Investments. |
| Robert J. Ostrowski Birth Date: April 26, 1963 Chief Investment Officer Officer since: May 2004 | Principal Occupations: Robert J. Ostrowski joined Federated in 1987 as an Investment Analyst and became a Portfolio Manager in 1990. He was named Chief Investment Officer of Federated's taxable fixed-income products in 2004 and also serves as a Senior Portfolio Manager. Mr. Ostrowski became an Executive Vice President of the Fund's Adviser in 2009 and served as a Senior Vice President of the Fund's Adviser from 1997 to 2009. Mr. Ostrowski has received the Chartered Financial Analyst designation. He received his M.S. in Industrial Administration from Carnegie Mellon University. |
| Deborah A. Cunningham Birth Date: September 15, 1959 Chief Investment Officer Officer since: June 2012 | Principal Occupations: Deborah A. Cunningham was named Chief Investment Officer of Federated's money market products in 2004. She joined Federated in 1981 and has been a Senior Portfolio Manager since 1997 and an Executive Vice President of the Fund's Adviser since 2009. Ms. Cunningham has received the Chartered Financial Analyst designation and holds an M.S.B.A. in Finance from Robert Morris College. |
Federated Investors Funds
4000 Ericsson Drive
Warrendale, PA 15086-7561
or call 1-800-341-7400.
2018 ©Federated Investors, Inc.
| Item 2. | Code of Ethics |
(a) As of the end of the period covered by this report, the registrant has adopted a code of ethics (the "Section 406 Standards for Investment Companies - Ethical Standards for Principal Executive and Financial Officers") that applies to the registrant's Principal Executive Officer and Principal Financial Officer; the registrant's Principal Financial Officer also serves as the Principal Accounting Officer.
(c) There was no amendment to the registrant’s code of ethics described in Item 2(a) above during the period covered by the report.
(d) There was no waiver granted, either actual or implicit, from a provision to the registrant’s code of ethics described in Item 2(a) above during the period covered by the report.
(e) Not Applicable
(f)(3) The registrant hereby undertakes to provide any person, without charge, upon request, a copy of the code of ethics. To request a copy of the code of ethics, contact the registrant at 1-800-341-7400, and ask for a copy of the Section 406 Standards for Investment Companies - Ethical Standards for Principal Executive and Financial Officers.
Item 3. Audit Committee Financial Expert
The registrant's Board has determined that each of the following members of the Board's Audit Committee is an “audit committee financial expert,” and is "independent," for purposes of this Item: John T. Collins, G. Thomas Hough and Thomas M. O'Neill.
| Item 4. | Principal Accountant Fees and Services |
(a) Audit Fees billed to the registrant for the two most recent fiscal years:
Fiscal year ended 2017 - $204,590
Fiscal year ended 2016 - $197,640
(b) Audit-Related Fees billed to the registrant for the two most recent fiscal years:
Fiscal year ended 2017 - $0
Fiscal year ended 2016 - $0
Amount requiring approval of the registrant’s audit committee pursuant to paragraph (c)(7)(ii) of Rule 2-01 of Regulation S-X, $0 and $0 respectively.
(c) Tax Fees billed to the registrant for the two most recent fiscal years:
Fiscal year ended 2017 - $0
Fiscal year ended 2016 - $0
Amount requiring approval of the registrant’s audit committee pursuant to paragraph (c)(7)(ii) of Rule 2-01 of Regulation S-X, $0 and $0 respectively.
(d) All Other Fees billed to the registrant for the two most recent fiscal years:
Fiscal year ended 2017 - $0
Fiscal year ended 2016 - $0
Amount requiring approval of the registrant’s audit committee pursuant to paragraph (c)(7)(ii) of Rule 2-01 of Regulation S-X, $0 and $0 respectively.
(e)(1) Audit Committee Policies regarding Pre-approval of Services.
The Audit Committee is required to pre-approve audit and non-audit services performed by the independent auditor in order to assure that the provision of such services do not impair the auditor’s independence. Unless a type of service to be provided by the independent auditor has received general pre-approval, it will require specific pre-approval by the Audit Committee. Any proposed services exceeding pre-approved cost levels will require specific pre-approval by the Audit Committee.
Certain services have the general pre-approval of the Audit Committee. The term of the general pre-approval is 12 months from the date of pre-approval, unless the Audit Committee specifically provides for a different period. The Audit Committee will annually review the services that may be provided by the independent auditor without obtaining specific pre-approval from the Audit Committee and may grant general pre-approval for such services. The Audit Committee will revise the list of general pre-approved services from time to time, based on subsequent determinations. The Audit Committee will not delegate its responsibilities to pre-approve services performed by the independent auditor to management.
The Audit Committee has delegated pre-approval authority to its Chairman. The Chairman will report any pre-approval decisions to the Audit Committee at its next scheduled meeting. The Committee will designate another member with such pre-approval authority when the Chairman is unavailable.
AUDIT SERVICES
The annual Audit services engagement terms and fees will be subject to the specific pre-approval of the Audit Committee. The Audit Committee must approve any changes in terms, conditions and fees resulting from changes in audit scope, registered investment company (RIC) structure or other matters.
In addition to the annual Audit services engagement specifically approved by the Audit Committee, the Audit Committee may grant general pre-approval for other Audit Services, which are those services that only the independent auditor reasonably can provide. The Audit Committee has pre-approved certain Audit services, all other Audit services must be specifically pre-approved by the Audit Committee.
AUDIT-RELATED SERVICES
Audit-related services are assurance and related services that are reasonably related to the performance of the audit or review of the Company’s financial statements or that are traditionally performed by the independent auditor. The Audit Committee believes that the provision of Audit-related services does not impair the independence of the auditor, and has pre-approved certain Audit-related services, all other Audit-related services must be specifically pre-approved by the Audit Committee.
TAX SERVICES
The Audit Committee believes that the independent auditor can provide Tax services to the Company such as tax compliance, tax planning and tax advice without impairing the auditor’s independence. However, the Audit Committee will not permit the retention of the independent auditor in connection with a transaction initially recommended by the independent auditor, the purpose of which may be tax avoidance and the tax treatment of which may not be supported in the Internal Revenue Code and related regulations. The Audit Committee has pre-approved certain Tax services, all Tax services involving large and complex transactions must be specifically pre-approved by the Audit Committee.
ALL OTHER SERVICES
With respect to the provision of services other than audit, review or attest services the pre-approval requirement is waived if:
| (1) | The aggregate amount of all such services provided constitutes no more than five percent of the total amount of revenues paid by the registrant, the registrant’s adviser (not including any sub-adviser whose role is primarily portfolio management and is subcontracted with or overseen by another investment adviser), and any entity controlling, controlled by, or under common control with the investment adviser that provides ongoing services to the registrant to its accountant during the fiscal year in which the services are provided; |
| (2) | Such services were not recognized by the registrant, the registrant’s adviser (not including any sub-adviser whose role is primarily portfolio management and is subcontracted with or overseen by another investment adviser), and any entity controlling, controlled by, or under common control with the investment adviser that provides ongoing services to the registrant at the time of the engagement to be non-audit services; and |
| (3) | Such services are promptly brought to the attention of the Audit Committee of the issuer and approved prior to the completion of the audit by the Audit Committee or by one or more members of the Audit Committee who are members of the board of directors to whom authority to grant such approvals has been delegated by the Audit Committee. |
The Audit Committee may grant general pre-approval to those permissible non-audit services classified as All Other services that it believes are routine and recurring services, and would not impair the independence of the auditor.
The SEC’s rules and relevant guidance should be consulted to determine the precise definitions of prohibited non-audit services and the applicability of exceptions to certain of the prohibitions.
PRE-APPROVAL FEE LEVELS
Pre-approval fee levels for all services to be provided by the independent auditor will be established annually by the Audit Committee. Any proposed services exceeding these levels will require specific pre-approval by the Audit Committee.
PROCEDURES
Requests or applications to provide services that require specific approval by the Audit Committee will be submitted to the Audit Committee by both the independent auditor and the Principal Accounting Officer and/or Internal Auditor, and must include a joint statement as to whether, in their view, the request or application is consistent with the SEC’s rules on auditor independence.
(e)(2) Percentage of services identified in items 4(b) through 4(d) that were approved by the registrants audit committee pursuant to paragraph (c)(7)(i)(C) of Rule 2-01 of Regulation S-X:
4(b)
Fiscal year ended 2017 – 0%
Fiscal year ended 2016 - 0%
Percentage of services provided to the registrants investment adviser and any entity controlling, controlled by, or under common control with the investment adviser that provides ongoing services to the registrant that were approved by the registrants audit committee pursuant to paragraph (c)(7)(i)(C) of Rule 2-01 of Regulation S-X, 0% and 0% respectively.
4(c)
Fiscal year ended 2017 – 0%
Fiscal year ended 2016 – 0%
Percentage of services provided to the registrants investment adviser and any entity controlling, controlled by, or under common control with the investment adviser that provides ongoing services to the registrant that were approved by the registrants audit committee pursuant to paragraph (c)(7)(i)(C) of Rule 2-01 of Regulation S-X, 0% and 0% respectively.
4(d)
Fiscal year ended 2017 – 0%
Fiscal year ended 2016 – 0%
Percentage of services provided to the registrants investment adviser and any entity controlling, controlled by, or under common control with the investment adviser that provides ongoing services to the registrant that were approved by the registrants audit committee pursuant to paragraph (c)(7)(i)(C) of Rule 2-01 of Regulation S-X, 0% and 0% respectively.
| (f) | NA |
| (g) | Non-Audit Fees billed to the registrant, the registrant’s investment adviser, and certain entities controlling, controlled by or under common control with the investment adviser: |
Fiscal year ended 2017 - $22,091
Fiscal year ended 2016 - $5,827
| (h) | The registrant’s Audit Committee has considered that the provision of non-audit services that were rendered to the registrant’s adviser (not including any sub-adviser whose role is primarily portfolio management and is subcontracted with or overseen by another investment adviser), and any entity controlling, controlled by, or under common control with the investment adviser that provides ongoing services to the registrant that were not pre-approved pursuant to paragraph (c)(7)(ii) of Rule 2-01 of Regulation S-X is compatible with maintaining the principal accountant’s independence. |
In its required communications to the Audit Committee of the registrant’s Board, KPMG LLP (“KPMG”), the registrant’s independent public accountant, informed the Audit Committee that KPMG and/or covered person professionals within KPMG maintain lending relationships with certain owners of greater than 10% of the shares of the registrant and/or certain investment companies within the “investment company complex” as defined under Rule 2-01(f)(14) of Regulation S-X, which are affiliates of the registrant. KPMG has advised the Audit Committee that these lending relationships implicate Rule 2-01(c)(1)(ii)(A) of Regulation S-X (referred to as the “Loan Rule”). The Loan Rule prohibits an independent public accountant, or covered person professionals at such firm, from having a financial relationship (such as a loan) with a lender that is a record or beneficial owner of more than 10% of an audit client’s equity securities. For purposes of the Loan Rule, audit clients include the registrant, as well as all registered investment companies audited by KPMG (collectively, the “KPMG Funds”).
KPMG informed the Audit Committee that KPMG believes that these lending relationships described above do not and will not impair KPMG’s ability to exercise objective and impartial judgment in connection with financial statement audits of the registrant and a reasonable investor with knowledge of all relevant facts and circumstances would conclude that KPMG has been and is capable of objective and impartial judgment on all issues encompassed within KPMG’s audits.
On June 20, 2016, the Division of Investment Management of the Securities and Exchange Commission (“SEC”) issued a no-action letter to another mutual fund complex (see Fidelity Management & Research Company et al., No-Action Letter) related to similar Loan Rule matters as those described above (the “Letter). In the Letter, the SEC Staff confirmed that it would not recommend enforcement action against an investment company that relied on the audit services performed by an independent public accountant where the Loan Rule was implicated in certain specified circumstances provided that: (1) the auditor has complied with PCAOB Rule 3526(b)(1) and 3526(b)(2); (2) the Loan Rule is implicated because of lending relationships; and (3) notwithstanding such lending relationships that implicate the Loan Rule, the auditor has concluded that it is objective and impartial with respect to the issues encompassed within its engagement as auditor of the funds. The circumstances described in the Letter are substantially similar to the circumstances that implicated the Loan Rule with respect to KPMG and the registrant. On September 22, 2017, the SEC issued another no-action letter to Fidelity Management & Research Company et al extending the expiration of the Letter until the effectiveness of any amendments to the Loan Rule designed to address the concerns in the Letter (the “Letters”).
If it were to be determined that the relief available under the Letters was improperly relied upon, or that the independence requirements under the federal securities laws were not otherwise complied with regarding the registrant, for certain periods, any of the registrant’s filings with the SEC which contain financial statements of the registrant for such periods may not comply with applicable federal securities laws, the registrant’s ability to offer shares under its current registration statement may be impacted, and certain financial reporting and/or other covenants with, and representations and warranties to, the registrant’s lender under its committed line of credit may be impacted. Such events could have a material adverse effect on the registrant and the KPMG Funds.
| Item 5. | Audit Committee of Listed Registrants |
Not Applicable
| Item 6. | Schedule of Investments |
(a) The registrant’s Schedule of Investments is included as part of the Report to Stockholders filed under Item 1 of this form.
(b) Not Applicable; Fund had no divestments during the reporting period covered since the previous Form N-CSR filing.
| Item 7. | Disclosure of Proxy Voting Policies and Procedures for Closed-End Management Investment Companies |
Not Applicable
| Item 8. | Portfolio Managers of Closed-End Management Investment Companies |
Not Applicable
| Item 9. | Purchases of Equity Securities by Closed-End Management Investment Company and Affiliated Purchasers |
Not Applicable
| Item 10. | Submission of Matters to a Vote of Security Holders |
No Changes to Report
| Item 11. | Controls and Procedures |
(a) The registrant’s President and Treasurer have concluded that the
registrant’s disclosure controls and procedures (as defined in rule 30a-3(c) under the Act) are effective in design and operation and are sufficient to form the basis of the certifications required by Rule 30a-(2) under the Act, based on their evaluation of these disclosure controls and procedures within 90 days of the filing date of this report on Form N-CSR.
(b) There were no changes in the registrant’s internal control over financial reporting (as defined in rule 30a-3(d) under the Act) during the second fiscal quarter of the period covered by this report that have materially affected, or are reasonably likely to materially affect, the registrant’s internal control over financial reporting.
| Item 12. | Disclosure of Securities Lending Activities for Closed-End Management Investment Companies |
Not Applicable
| Item 13. | Exhibits |
(a)(1) Code of Ethics- Not Applicable to this Report.
(a)(2) Certifications of Principal Executive Officer and Principal Financial Officer.
(a)(3) Not Applicable.
(b) Certifications pursuant to 18 U.S.C. Section 1350.
SIGNATURES
Pursuant to the requirements of the Securities Exchange Act of 1934 and the Investment Company Act of 1940, the registrant has duly caused this report to be signed on its behalf by the undersigned, thereunto duly authorized.
Registrant Federated Insurance Series
By /S/ Lori A. Hensler
Lori A. Hensler, Principal Financial Officer
Date February 14, 2018
Pursuant to the requirements of the Securities Exchange Act of 1934 and the Investment Company Act of 1940, this report has been signed below by the following persons on behalf of the registrant and in the capacities and on the dates indicated.
By /S/ John B. Fisher
John B. Fisher, Principal Executive Officer
Date February 14, 2018
By /S/ Lori A. Hensler
Lori A. Hensler, Principal Financial Officer
Date February 14, 2018