MAA
Mid-America Apartment Communities, Inc.
Capital Markets Update
May 2010
Strong Public Company Platform MAA Sky View Ranch, Phoenix, AZ Grand Courtyards, Dallas, TX• Sixteen Year Record of Success Top Tier Performance for Shareholders Strong Operator; Sophisticated Platform Included in S&P Small-Cap 600 Strong Corporate GovernanceDisciplined Capital Deployment – Value Investor Extensive Network & Deal Flow Proven Success with Joint Ventures High Quality Multifamily Portfolio High Growth Sunbelt Region Focus Young Portfolio Unique Two-Tier Market Strategy Strong Balance Sheet Capacity to Pursue Opportunities Superior Ratios Dividend Payout Leverage Fixed Charge
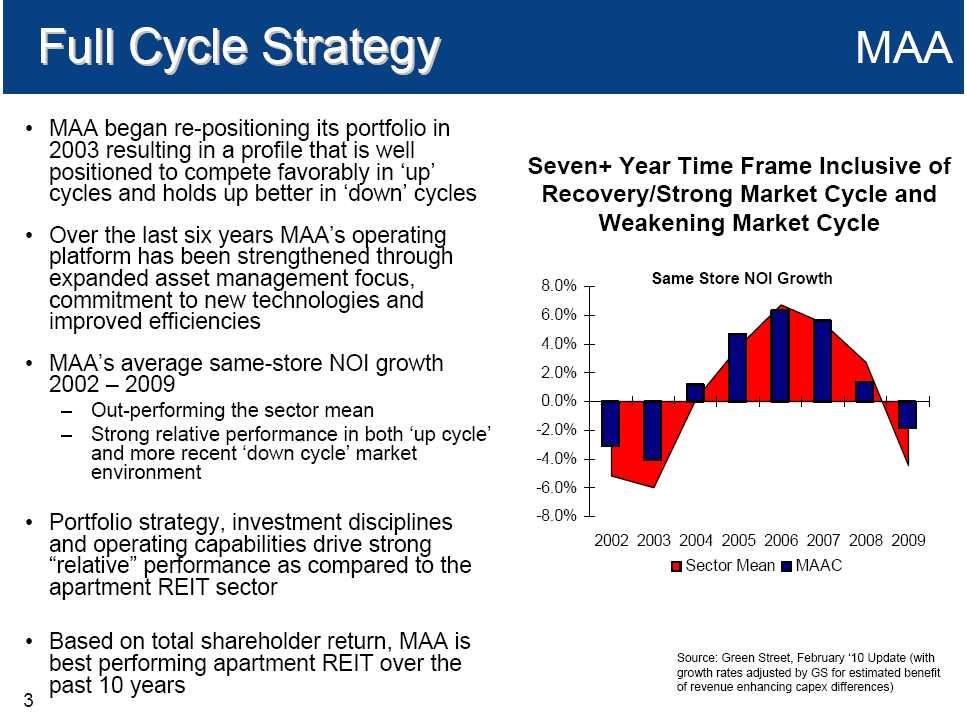
Full Cycle Strategy• MAA began re-positioning its portfolio in 2003 resulting in a profile that is well positioned to compete favorably in ‘up’ cycles and holds up better in ‘down’ cycles Over the last six years MAA’s operating platform has been strengthened through expanded asset management focus, commitment to new technologies and improved efficiencies MAA’s average same-store NOI growth 2002 – 2009 Out-performing the sector mean Strong relative performance in both ‘up cycle’ and more recent ‘down cycle’ market environment Portfolio strategy, investment disciplines and operating capabilities drive strong “relative” performance as compared to the apartment REIT sector Based on total shareholder return, MAA is best performing apartment REIT over the past 10 years Seven+ Year Time Frame Inclusive of Recovery/Strong Market Cycle and Weakening Market Cycle Same Store NOI Growth
Focus on High Growth Region
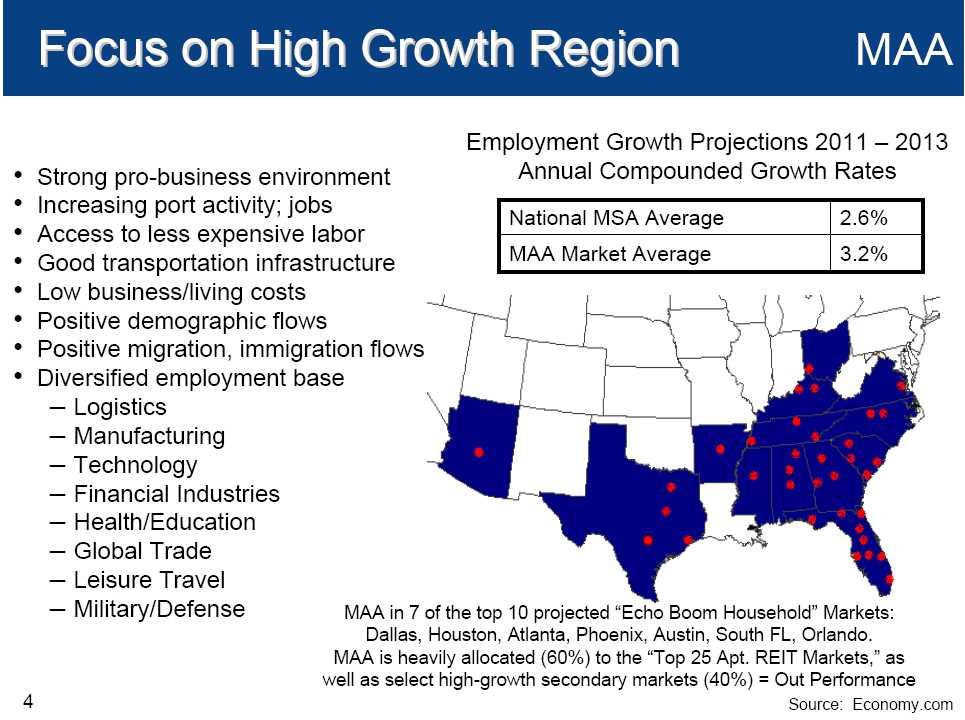
• Strong pro-business environment Increasing port activity; jobs Access to less expensive labor Good transportation infrastructure Low business/living costs Positive demographic flows Positive migration, immigration flows Diversified employment base Logistics Manufacturing Technology Financial Industries Health/Education Global Trade Leisure Travel Military/Defense
Employment Growth Projections 2011 – 2013 Annual Compounded Growth Rates National MSA Average MAA Market Average 2.6% 3.2% MAA in 7 of the top 10 projected “Echo Boom Household” Markets: Dallas, Houston, Atlanta, Phoenix, Austin, South FL, Orlando. MAA is heavily allocated (60%) to the “Top 25 Apt. REIT Markets,” as well as select high-growth secondary markets (40%) = Out Performance Source: Economy.com
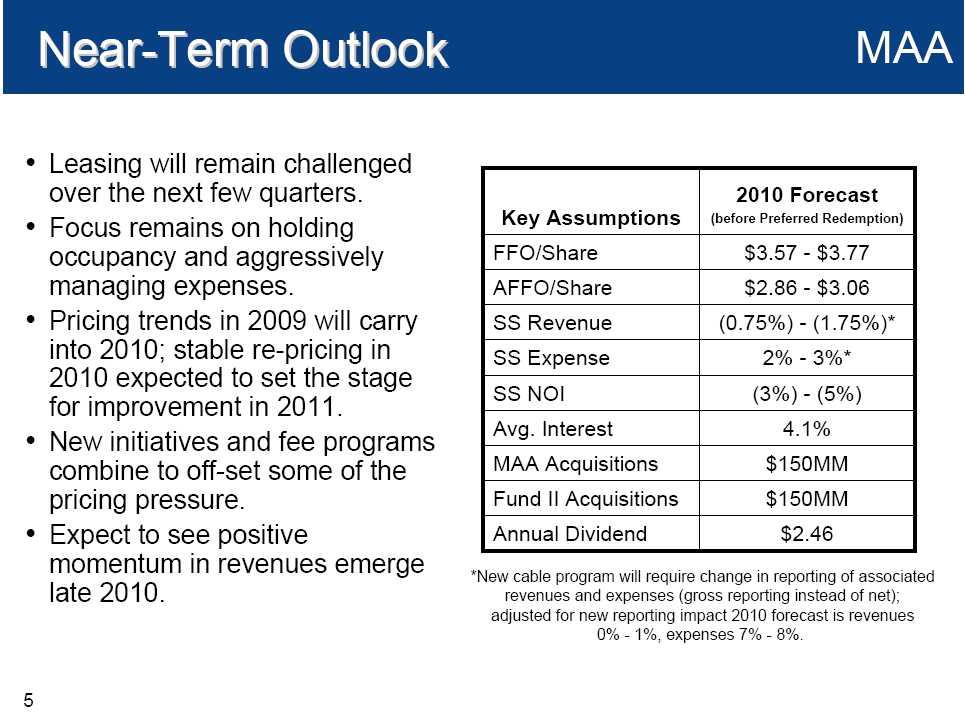
Near-Term Outlook Leasing will remain challenged over the next few quarters. Focus remains on holding occupancy and aggressively managing expenses. Pricing trends in 2009 will carry into 2010; stable re-pricing in 2010 expected to set the stage for improvement in 2011. New initiatives and fee programs combine to off-set some of the pricing pressure. Expect to see positive momentum in revenues emerge late 2010. *New cable program will require change in reporting of associated revenues and expenses (gross reporting instead of net);adjusted for new reporting impact 2010 forecast is revenues 0% - - 1%, expenses 7% - 8%. Key Assumptions 2010 Forecast (before Preferred Redemption) SS Expense Annual Dividend FFO/Share AFFO/Share SS Revenue SS NOI Avg. Interest MAA Acquisitions Fund II Acquisitions$3.57 - $3.77$2.86 - $3.06 (0.75%) - (1.75%)* 2% - 3%* (3%) - - (5%) 4.1% $150MM $150MM $2.46

Strong Long-Term Outlook
• Eventual recovery in employment trends will generate a rapid recovery in NOI – Pent-up demand; Significant growth of prime rental demographic New apartment starts are predicted to hit a post-WW II low Lack of financing; Investment returns insufficient
Single family home ownership likely to remain relatively constrained Higher down-payments; Tighter credit; Higher mortgage interest rates Home ownership currently 67.5% of households Peaked at 69.5%; May revert to more sustainable 30 year level of 64.5% or lower Each 1% movement is 1.1 million households Recovery begins in late 2010 and outlook very strong thereafter
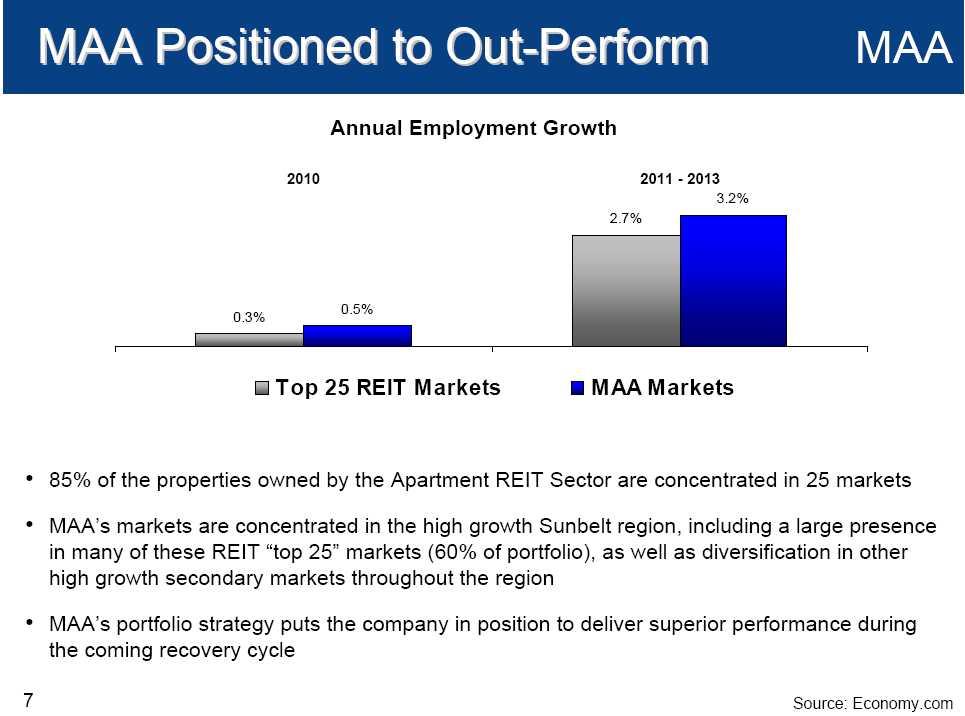
MAA Positioned to Out-Perform MMAAnnual Employment Growth 2010 2011 - 2013 Top 25 REIT Markets 0.3% 2.7% MAA Markets 0.5% 3.2% 85% of the properties owned by the Apartment REIT Sector are concentrated in 25 markets MAA’s markets are concentrated in the high growth Sunbelt region, including a large presence in many of these REIT “top 25” markets (60% of portfolio), as well as diversification in other high growth secondary markets throughout the region MAA’s portfolio strategy puts the company in position to deliver superior performance during the coming recovery cycle Source: Economy.com
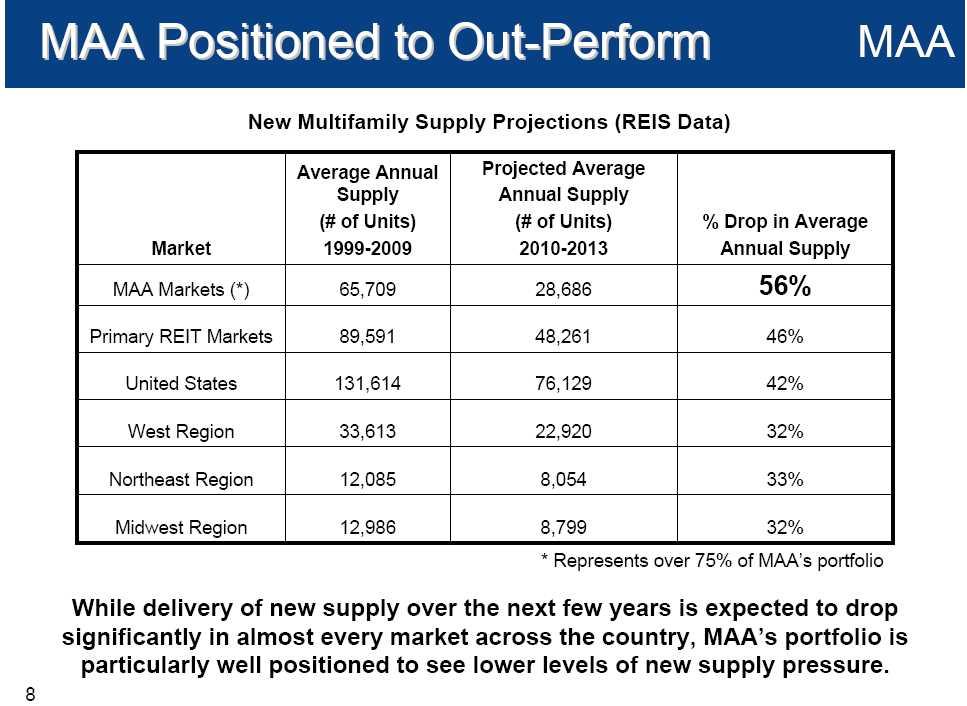
MAA Positioned to Out-Perform MMA New Multifamily Supply Projections (REIS Data) Market Average Annual Supply (# of Units) 1999-2009 Projected Average Annual Supply (# of Units) 2010-2013 % Drop in Average Annual Supply MAA Markets (*) 65,709 28,686 56% Primary REIT Markets 89,591 48,261 46% United States 131,614 76,129 42% West Region 33,613 22,920 32% Northeast Region 12,085 8,054 33% Midwest Region 12,986 8,799 32% * Represents over 75% of MAA’s portfolio While delivery of new supply over the next few years is expected to drop significantly in almost every market across the country, MAA’s portfolio is particularly well positioned to see lower levels of new supply pressure.

Strong Balance Sheet Position Leverage and ratios at historically strong levels Plenty of capacity > $175 MM unused No remaining 2010 maturities Agency loan maturities well laddered over 2011 – 2018 After Preferred Redemption Debt Preferred Common Capital Structure 50.0% 6.0% 44.0% MAA Sector Fixed Charge Coverage 2.83 2.23 FFO Payout 2010 67% 71%* Debt/Gross Assets 49% 53% Sources: SNL Financial Research and Barclays Capital Research as of 4/31/2010.*Sector Median impacted by stock dividends and
dividend reductions
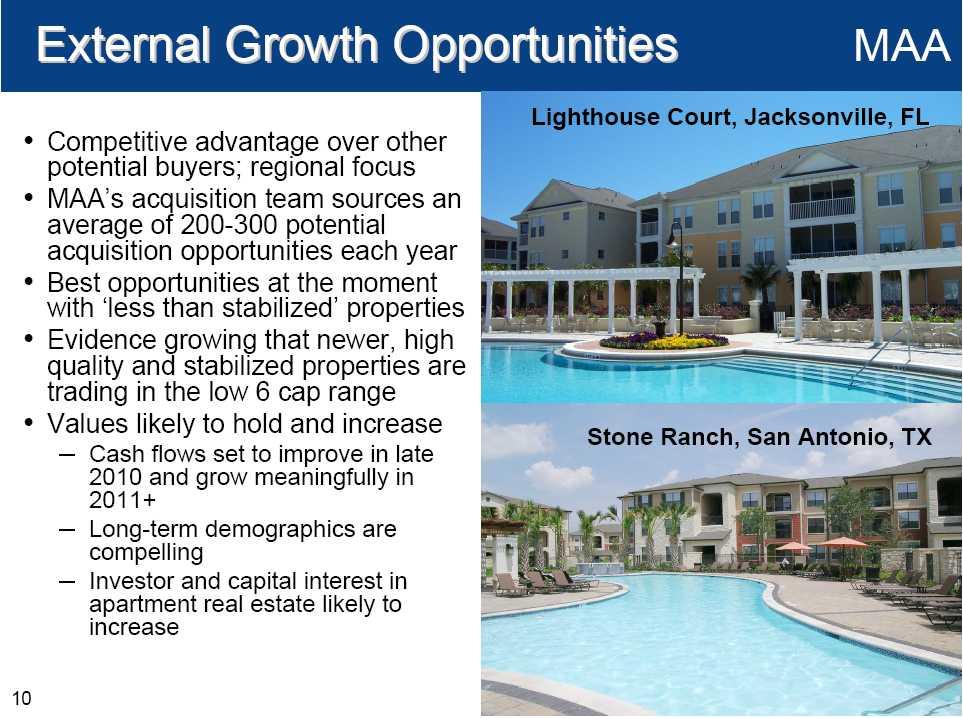
External Growth Opportunities MAA Competitive advantage over other potential buyers; regional focus MAA’s acquisition team sources an average of 200-300 potential acquisition opportunities each year Best opportunities at the moment with ‘less than stabilized’ properties Evidence growing that newer, high quality and stabilized properties are trading in the low 6 cap range Values likely to hold and increase Cash flows set to improve in late 2010 and grow meaningfully in 2011+Long-term demographics are compelling
Investor and capital interest in apartment real estate likely to increase Lighthouse Court, Jacksonville, FL Stone Ranch, San Antonio, TX
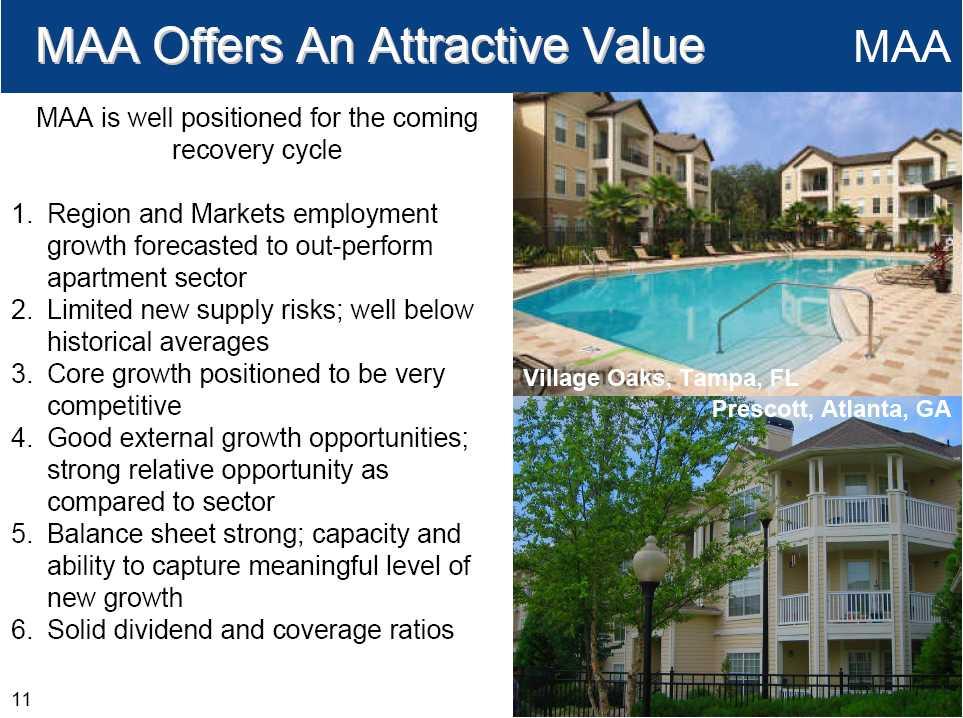
MAA Offers An Attractive Value MAA is well positioned for the coming recovery cycle 1. Region and Markets employment growth forecasted to out-perform apartment sector 2. Limited new supply risks; well below historical averages 3. Core growth positioned to be very competitive 4. Good external growth opportunities; strong relative opportunity as compared to sector 5. Balance sheet strong; capacity and ability to capture meaningful level of new growth 6. Solid dividend and coverage ratios Village Oaks, Tampa, FL Prescott, Atlanta, GA
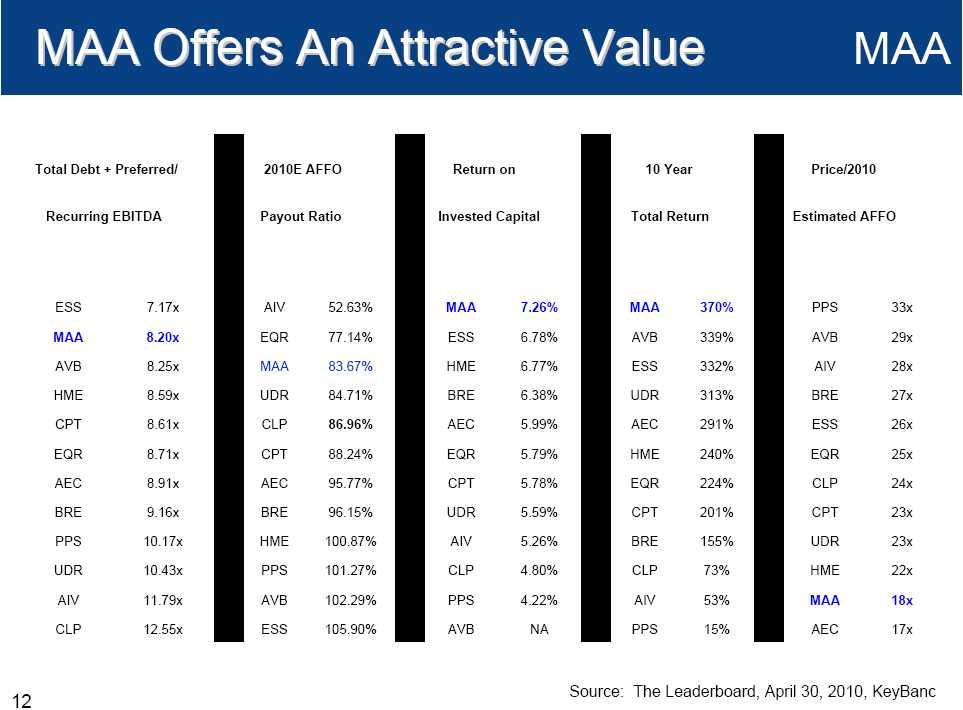
MAA Offers An Attractive Value Total Debt + Preferred/ 2010E AFFO Return on 10 Year Price/2010 Recurring EBITDA Payout Ratio Invested Capital Total Return Estimated AFFO ESS 7.17x AIV 52.63% MAA 7.26% MAA 370% PPS 33x MAA 8.20x EQR 77.14% ESS 6.78% AVB 339% AVB 29x AVB 8.25x MAA 83.67% HME 6.77% ESS 332% AIV 28x HME 8.59x UDR 84.71% BRE 6.38% UDR 313% BRE 27x CPT 8.61x CLP 86.96% AEC 5.99% AEC 291% ESS 26x EQR 8.71x CPT 88.24% EQR 5.79% HME 240% EQR 25x AEC 8.91x AEC 95.77% CPT 5.78% EQR 224% CLP 24x BRE 9.16x BRE 96.15% UDR 5.59% CPT 201% CPT 23x PPS 10.17x HME 100.87% AIV 5.26% BRE 155% UDR 23x UDR 10.43x PPS 101.27% CLP 4.80% CLP 73% HME 22x AIV 11.79x AVB 102.29% PPS 4.22% AIV 53% MAA 18xCLP 12.55x ES5.90% AVB NA PPS 15% AEC 17x Source: The Leaderboard, April 30, 2010, KeyBanc

Safe Harbor Disclosure MMA Statements contained in this presentation, which are not historical facts, are forward-looking statements, as the term is defined in the Private Securities Litigation Reform Act of 1995. Such forward-looking statements are subject to risks and uncertainties which can cause actual results to differ materially from those currently anticipated, due to a number of factors, which include, but are not limited to, unfavorable changes in the apartment market, changing economic conditions, the impact of competition, acquisitions which may not achieve anticipated results and other risk factors discussed in documents filed with the Securities and Exchange Commission from time to time including the Company’s Annual Report on Form 10-K and the Company’s Quarterly Report on Form 10-Q. The statements in this presentation are made based upon information currently known to management and the company assumes no obligation to update or revise any of its forward-looking statements. Watermark, Dallas, TX
