UNITED STATES
SECURITIES AND EXCHANGE COMMISSION
Washington, D.C. 20549
FORM N-CSR
CERTIFIED SHAREHOLDER REPORT OF REGISTERED MANAGEMENT INVESTMENT COMPANIES
Investment Company Act file number 811-08104
Touchstone Funds Group Trust
(Exact name of registrant as specified in charter)
303 Broadway, Suite 1100
Cincinnati, Ohio 45202-4203
(Address of principal executive offices) (Zip code)
Jill T. McGruder
303 Broadway, Suite 1100
Cincinnati, Ohio 45202-4203
(Name and address of agent for service)
Registrant's telephone number, including area code: 800-638-8194
Date of fiscal year end: September 30
Date of reporting period: September 30, 2014
Form N-CSR is to be used by management investment companies to file reports with the Commission not later than 10 days after the transmission to stockholders of any report that is required to be transmitted to stockholders under Rule 30e-1 under the Investment Company Act of 1940 (17 CFR 270.30e-1). The Commission may use the information provided on Form N-CSR in its regulatory, disclosure review, inspection, and policymaking roles.
A registrant is required to disclose the information specified by Form N-CSR, and the Commission will make this information public. A registrant is not required to respond to the collection of information contained in Form N-CSR unless the Form displays a currently valid Office of Management and Budget ("OMB") control number. Please direct comments concerning the accuracy of the information collection burden estimate and any suggestions for reducing the burden to Secretary, Securities and Exchange Commission, 100 F Street, NE, Washington, DC 20549. The OMB has reviewed this collection of information under the clearance requirements of 44 U.S.C. § 3507.
Item 1. Reports to Stockholders.
The Report to Shareholders is attached herewith.
September 30, 2014
Annual Report
Touchstone Funds Group Trust
Touchstone Arbitrage Fund
Touchstone Emerging Markets Equity Fund
Touchstone Global Real Estate Fund
Touchstone International Fixed Income Fund
Touchstone Merger Arbitrage Fund
Touchstone Mid Cap Fund
Touchstone Mid Cap Value Fund
Touchstone Premium Yield Equity Fund
Touchstone Sands Capital Select Growth Fund
Touchstone Small Cap Core Fund
Touchstone Small Cap Value Fund
Touchstone Total Return Bond Fund
Touchstone Ultra Short Duration Fixed Income Fund

Table of Contents
This report identifies the Funds' investments on September 30, 2014. These holdings are subject to change. Not all investments in each Fund performed the same, nor is there any guarantee that these investments will perform as well in the future. Market forecasts provided in this report may not occur.
| 2 |
Dear Fellow Shareholder:
We are pleased to provide you with the Touchstone Funds Group Trust Annual Report. Inside you will find key financial information, as well as manager commentaries, for the 12 months ended September 30, 2014.
Over the course of the fiscal year, U.S. economic activity regained momentum. The U.S. Federal Reserve Board continued to take a measured approach to monetary tightening. Data for manufacturing, housing, employment, consumer confidence and consumption improved overall, despite a contraction in the first quarter of 2014 due to a weather-induced slump. Abroad, growth for the fiscal year was generally tepid in the eurozone and Japan and mixed in emerging economies. Faced with slowing growth, central bankers weighed limited options for further monetary easing. Additional influences on global economic activity included a strengthening U.S. dollar, falling commodity prices, credit worries and continued geopolitical tensions.
Much of the fiscal year was unusually calm for financial markets and, with the exception of a sell-off in January in both U.S. and international markets, generally positive. U.S. stock market volatility by and large remained benign, hitting a 52-week low in July, before trending upward for the last six weeks of the period.
U.S. equity markets overall registered solid advances in the fiscal year, outperforming both developed and emerging markets. Performance supported both U.S. growth equities and U.S. value equities. From a market capitalization perspective, large cap equities led the way, followed by mid cap. High yield bonds outpaced U.S. Treasuries and the overall bond market. Real estate performed well.
We believe that focusing on the long-term composition of your investment portfolio is essential to balancing risk and return. We recommend that you work with your financial professional on a regular basis to assess and adjust your asset allocation and diversification strategy as needed to help keep your financial goals on track.
We greatly appreciate your continued support. Thank you for including Touchstone as part of your investment plan.
Sincerely,

Jill T. McGruder
President
Touchstone Funds Group Trust
| 3 |
Management's Discussion of Fund Performance (Unaudited)
Touchstone Arbitrage Fund
Sub-Advised by Longfellow Investment Management Co.
Investment Philosophy
The Touchstone Arbitrage Fund seeks to achieve positive absolute returns regardless of market conditions over the long term by investing primarily in securities of companies that are involved in publicly announced mergers, takeovers, tender offers, debt restructurings, minority purchases, leveraged buyouts, spin-offs, liquidations and other corporate reorganizations.
Fund Performance
The Touchstone Arbitrage Fund (Class A Shares) underperformed its benchmark, the BofA Merrill Lynch 3-Month U.S. Treasury Bill Index, for the 12-month period ended September 30, 2014. The Fund’s total return was -1.30 percent (excluding the maximum sales charge) while the benchmark’s total return was 0.05 percent.
Market Environment
For the period, U.S. equity markets posted strong returns, partially due to a two-year budget deal approved in December 2013 as well as increased clarity about the U.S. Federal Reserve Board’s intentions regarding monetary policy. Overall, the markets were able to move past geopolitical headline events, including political protests in Hong Kong, military activities in the Ukraine and renewed conflicts in the Middle East, all of which failed to reverse the upward trend of U.S. equity markets.
The topic of tax-inversion-motivated mergers and acquisitions (M&A) attracted the attention of politicians as well as the Internal Revenue Service and the U.S. Treasury. The U.S. Treasury acted unilaterally in an attempt to make inversions, in which a U.S. company reincorporates overseas after merging with a foreign business, less economically attractive. New rules reduced the financial benefits by making it more difficult for profits earned abroad to be repatriated to the U.S. without being taxed.
M&A activity continued across a variety of sectors. As belief in the economic recovery gained traction, an increasing number of companies sought to consolidate, with M&A activity reaching its fastest pace since 2007. This attracted significant investor attention and brought the opportunity set for attractive investment returns to limited levels. The lack of volatility also contributed to an increase in investors’ perceived risk appetite. The combination of investor sentiment and the increased appetite for risk led to a difficult environment for a merger arbitrage investment strategy.
Activity in regional banking securities increased, as regulatory pressures were catalysts for consolidation. Specialty finance companies also combined at a rapid pace. Later in the period, financial services and regional banks took a breather from consolidation efforts, as the market digested the abundant deals recently completed and those still pending. Deals in the Energy sector slowed.
Health care providers and medical device manufacturers also accounted for a significant portion of M&A activity. Technology, telecommunications, chemicals and materials companies were all active in completing deals as well.
Portfolio Review
The investment opportunity for M&A was small which left little margin for error. Spreads began to widen over the final weeks of the fiscal period.
For the 12-month period, several deals detracted from performance. Apollo Tyre Ltd.’s attempted acquisition of Cooper Tire and Rubber Co. encountered a number of obstacles and was ultimately terminated. Liberty Media Corp. abandoned its bid for Sirius XM Holdings Inc. in favor of a share class recapitalization, NuPathe
| 4 |
Management's Discussion of Fund Performance (Unaudited) (Continued)
Inc. failed to receive an increased bid, all of which negatively impacted the Fund. A security-specific strategy designed to benefit Noble Corp.’s spin-off of Paragon Offshore PLC in addition to National Oilwell Varco Inc.’s spin-off of its distribution business, Distribution NOW, detracted from Fund performance. A drop in oil prices affected both deals.
The largest detractor resulted from Hillshire Brands Co.’s intent to acquire Pinnacle Foods Inc. and subsequent bidding by Pilgrim’s Pride Corp. and Tyson Foods Inc. to acquire Hillshire Brands. The Hillshire Brands/Pinnacle Foods deal fell apart. With the attention on Hillshire Brands, Pinnacle Foods’ stock price fell to its pre-deal-announcement price. The Fund held a long position in Pinnacle Foods and a short position in Hillshire Brands which negatively affected performance. After the Pinnacle Foods and Hillshire Brands deal fell apart, the Fund took a long position in Hillshire Brands as Tyson Foods became the acquirer which contributed to performance. The broken Omnicom Group Inc./Publicis Groupe deal did not have as negative an impact on the Fund, and both positions were sold without a loss on the target or the acquirer.
As has historically been the case, many positions contributed about equally to Fund performance during the 12-month period. Spin-off positions which included Dover Corp.’s spin-off of Knowles Corp., its communication technology division, and Penn National Gaming’s spin-off of Gaming and Leisure Properties Inc. both contributed to performance. The acquisition of Bally Technologies Inc. by Scientific Games Corp. also contributed to performance. Private equity firm Thoma Bravo LLC agreed to acquire Compuware Corp. in September. Northstar Realty Finance Corp. successfully spun out its asset management business, Northstar Asset Management Inc., and contributed positively to overall performance.
GMAC Capital Trust preferred stock and a traditional merger arbitrage position, UNS Energy Corp., also contributed to Fund performance. The Fund’s long position in BRE Properties Inc., in tandem with a hedged short position in Essex Property Trust, positively impacted performance.
Outlook
Historically, low short-term interest rates have acted as a headwind to the merger arbitrage strategy. We believe that when risk re-emerges as a material investment variable, the opportunity set will improve. The markets experienced severe volatility during the last week of the fiscal period, but it has yet to be consistent. Weakness in the domestic economy continues to be our greatest area of concern. Our other concerns include weak economic performance in the eurozone and increasing geopolitical risks.
Merger investments continue to comprise a dominant portion of the Fund. We believe merger opportunities of companies in the Financials, Information Technology and Telecommunication Services sectors will continue to offer the greatest opportunities. The pipeline of announced spin-offs is at its highest level in more than a decade. However, we believe most of the spin-offs driven by value-creating situations seem to have already been announced or completed. Less attractive opportunities make up the bulk of the current opportunity set and it appears that the environment is in the late stages of the current spin-off cycle. Also, we believe increased volatility in the fixed income market has created pockets of investment opportunities in the corporate bond market. Lastly, management teams are increasingly pursuing recapitalization initiatives as they pursue innovative methods of returning capital to shareholders absent clear paths to organic growth.
We continue to believe that the Fund offers an attractive risk reward/profile and serves as a valuable diversification tool. Its portfolio continues to be well diversified by industry, market capitalization and transaction type. The Fund seeks to be fully invested while holding positions in liquid securities in order to have the flexibility to react quickly to new opportunities and unexpected events and invest tactically. We believe the distinctive nature of each holding combined with the various strategies employed, provides low overall correlation to the broad equity and fixed income markets.
| 5 |
Management's Discussion of Fund Performance (Unaudited) (Continued)
Comparison of the Change in Value of a $10,000 Investment in the
Touchstone Arbitrage Fund - Class A* and the BofA Merrill Lynch 3-Month U.S. Treasury Bill Index
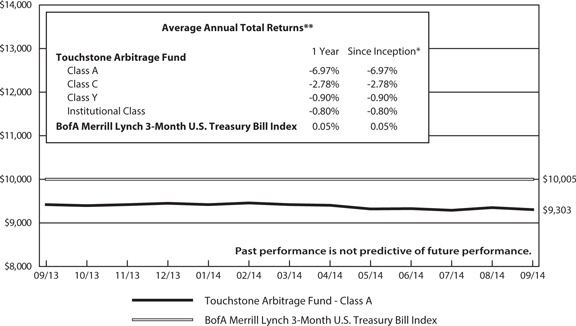
| * | The chart above represents performance for Class A shares only, which will vary from the performance of Class C shares, Class Y shares and Institutional Class shares based on the differences in loads and fees paid by shareholders in the different classes. The inception date of the Fund was September 30, 2013. The BofA Merrill Lynch 3-Month U.S. Treasury Bill Index's returns are based on the inception date of the Fund. |
| ** | The average annual total returns shown above are adjusted for maximum applicable sales charges, if applicable. The maximum offering price per share of Class A shares is equal to the net assets value (“NAV”) per share plus a sales load equal to 6.10% of the NAV (or 5.75% of the offering price). Class C shares are subject to a contingent deferred sales charge (“CDSC”) of 1.00%. The CDSC will be assessed on an amount equal to the lesser of (1) the NAV at the time of purchase of the shares being redeemed or (2) the NAV of such shares being redeemed if redeemed within a one-year period from the date of purchase. Class Y shares and Institutional Class shares are not subject to sales charges. |
The performance of the above Fund does not reflect the deduction of taxes that a shareholder would pay on Fund distributions or the redemption of Fund shares.
Note To Chart
The BofA Merrill Lynch 3-Month U.S. Treasury Bill Index is an unmanaged index of Treasury securities maturing in 90 days that assumes reinvestment of all income.
| 6 |
Management's Discussion of Fund Performance (Unaudited)
Touchstone Emerging Markets Equity Fund
Sub-Advised by AGF Investments America, Inc.
Investment Philosophy
The Touchstone Emerging Markets Equity Fund seeks capital appreciation by primarily investing in equity securities of companies located in emerging markets. It seeks to invest in businesses believed to be mispriced by the market and that are expected to generate positive and sustainable earnings growth.
Fund Performance
The Touchstone Emerging Markets Equity Fund (Class A Shares) underperformed its benchmark, the MSCI Emerging Markets Index, for the 12-month period ended September 30, 2014. The Fund’s total return was 1.61 percent (excluding the maximum sales charge) while the total return of the benchmark was 4.30 percent.
Market Environment
Emerging Markets (EM) posted positive performance for the one-year period. Although Asian markets were up strongly, markets in the EMEA (Europe, Middle East and Africa) and Latin America regions declined, with varying individual market returns, as emerging market economic activity decelerated. The U.S. Federal Reserve Board (Fed) greatly reduced the monthly pace of its quantitative easing program and indicated the program was expected to end soon. U.S. equity markets repeatedly reached record highs as measured by the S&P 500 Index, supported by a continued expansion of economic activity. European economic activity was expansionary in the earlier part of the year but demonstrated weakness later on.
In Asia, China’s economy slowed but showed some signs of a pickup during the period. A number of targeted mini-stimulus programs were announced during the third quarter, including changes to the hukou (urban registration) system, targeted easing in the financial system and a pilot program for state-owned enterprise (SOE) reform. In May, Narendra Modi, a leader of the Bharatiya Janata Party (BJP), was elected Prime Minister of India, defeating the Gandhi political dynasty that has largely guided the country’s politics since it was founded. The BJP and its allies obtained a majority and the Gandhi-led bloc posted its worst result since the party’s inception. Consequently, Indian stocks experienced strong gains as investors were optimistic that a majority government would help spur change and growth in the world’s most populous democracy.Thailand experienced some stability after a military coup was carried out, which helped to improve domestic demand. Joko Widodo (Jokowi) won Indonesia’s presidential election, which we believe encouraged foreign investment that had been held back by the political uncertainty.
Latin American economies displayed varied momentum during the period. Brazil’s economy faced a recession for the first time in five years, following an economic contraction in the second quarter that was largely attributable to lower investment. Mexico on the other hand, expanded in the second quarter, bolstered by strong industrial activity and domestic demand. The government also pushed through secondary legislation for telecommunications reform, and we believe the reduction of interconnection rates and the elimination of national long distance could bring down headline inflation. Peru’s central bank recently cut the benchmark interest rate, which highlighted weaker-than-expected economic activity.
In EMEA, South African domestic growth remained weak, particularly as platinum production has not recovered. The Reserve Bank’s Governor, Gill Marcus, also announced she would step down at the end of her term in November. Turkey reported second quarter year-over-year gross domestic product (GDP) growth that was weaker than expected by consensus and contracted on a quarterly basis.
| 7 |
Management's Discussion of Fund Performance (Unaudited) (Continued)
Portfolio Review
For the period, the Information Technology and Industrials sectors detracted from performance, while the Consumer Discretionary and Energy sectors contributed.
The Information Technology sector detracted from performance, particularly due to zero exposure to companies Tencent Holdings Ltd., Hon Hai Precision Industry Co. Ltd. and SK Hynix Inc. During the year, a position was initially purchased in TPK Holding Co. Ltd., the world’s largest touch panel vendor in terms of revenue and capacity. The purchase was based on several factors including its touch capacity, technological edge, industry-leading yield rate in notebook touch (providing wide operating margins) and attractive valuations. The position was sold due to a change in industry dynamics, which showed lower than anticipated penetration for notebooks, fierce price competition and the company’s delays in expanding capacity, which we believe was critical for TPK to compete in the price-sensitive lower-end market. The position detracted from performance, but this was partially mitigated by a smaller position than a typical initiation position of one percent in the Fund, given our assessment of the risk inTPK’s strategy. ASM Pacific Technology Ltd. is a leading provider of semiconductor surface-mounting technology equipment to developed markets. ASM Pacific was sold, as we were skeptical on the success of their flip chip technology, which is the faster growing portion of the back end equipment category, and we lost confidence in their ability to grow their surface mounting business.
For the period, the Industrials sector detracted from performance.The holding in ALL-America Latina Logistica S.A., one of the largest logistics companies in Latin America, was sold early in the first quarter on mounting legal and regulatory challenges in Brazil. Truck manufacturer Weichai Power Co. Ltd. detracted from performance as manufacturing activity in China decelerated, and despite reporting solid first-half profits with strong improvement year-over-year on its investment gain in Kion Group. We continue to remain optimistic on Weichai, which we believe is a leader in its truck engine markets.
In the Consumer Discretionary sector, Indian equities were the strongest performers, particularly Bharat Forge Ltd. and Mahindra & Mahindra Ltd. Bharat Forge contributed throughout the period, after announcing strong fiscal first quarter results. The auto manufacturer experienced strong performance in its non-auto steel forging business, which far outpaced growth in its domestic auto business. Mahindra & Mahindra also contributed after it beat consensus estimates for its fiscal first quarter results. Margins were well ahead of estimates, helped by a better sales mix that was boosted by its utility vehicles segment. Taiwan bicycle manufacturer Giant Manufacturing Co. Ltd. benefited from an improved product mix in its fiscal second quarter, with operating profits rising substantially on profit margin expansion. Consequently, management revised up its margin target for the year. Hankook Tire Co. Ltd. detracted from performance. Recent quarterly sales were marginally below consensus estimates, and a strong Korean won was also detrimental to results. The tire manufacturer was also affected by lower raw material prices that allowed its lower-priced competitors to cut prices. We continue to be optimistic on Hankook, as it has strong margins, and we believe it is likely to continue to take market share from its competitors. The Fund’s position in Lojas Renner S.A. was sold during the period. This was based on several factors, including its high operating leverage and dividend cut, which signaled more potential under performance ahead. It was also based on a broader decision to reduce direct exposure to retailers in the region.
In the Energy sector, zero exposure to several Russian energy producers contributed to performance. Oil & Natural Gas Corp. Ltd. (ONGC) contributed to performance during the period, as the Indian government worked to implement domestic gas prices that will be linked to international benchmarks. ONGC also reported a series of good quarterly results; however, the company’s contribution to returns was offset by under performance of the Fund’s other Energy companies, including Petròleo Brasileiro Petrobras S.A., CNOOC Ltd., Thai Oil PCL and PTT Exploration & Production PCL.
In Asia, India and Indonesia contributed to performance, while China/Hong Kong (combined) detracted for the period. Latin America detracted due to weak performance in Brazil and Mexico, while Chile and Peru
| 8 |
Management's Discussion of Fund Performance (Unaudited) (Continued)
contributed. In the EMEA region, exposure to South Africa detracted, while zero exposure to Russia contributed. During the year, the Fund had its largest overweights in the Consumer Discretionary and Consumer Staples sectors, and the largest underweights in the Information Technology and Industrials sectors. Country and sector positioning were a residual of security selection.
Outlook
A deceleration of economic activity in developed and emerging markets was not beneficial for the global economy. We believe the sluggish growth environment is likely to continue even though emerging markets such as China are focused on reforms, and policy-makers are intent on providing incremental stimulus. China is striding forward with its reforms, such as a loosening of regulations on the property market, with a pilot program in place to privatize and overhaul the SOEs, which we believe should be beneficial for the economy in the long term. India benefitted on continued optimism around expectations for Prime Minister Modi’s pro-business agenda and growth revival, but execution on reforms remains essential.
We believe fears of Ebola in Africa and a potential global outbreak, in addition to conflict in the Middle East with the Islamic State, are likely to continue weighing on equity markets. We also believe decelerating economic activity in the core European countries continues to pose a risk to global growth. However, the European Central Bank also made a few incremental cuts to its benchmark rate and is set to help the economy going forward through expansion of its balance sheet, which may help offset the economic deceleration in the region and deflationary concerns.
Sluggish economic growth in emerging markets may be offset by reforms in countries such as China and India, which we believe will likely be positive for growth over the long term, but are accompanied by policy risk. With fewer upcoming elections, election risk is also diminishing, which should help reduce volatility. We remain focused on the Fund’s investment philosophy that seeks to identify emerging market companies that are believed to have the ability or potential ability to generate returns in excess of their cost of capital, creating economic value for investors. We remain optimistic on companies that can benefit from the secular growth of consumer and enterprise demand.
| 9 |
Management's Discussion of Fund Performance (Unaudited) (Continued)
Comparison of the Change in Value of a $10,000 Investment in the
Touchstone Emerging Markets Equity Fund - Class A* and the MSCI Emerging Markets Index
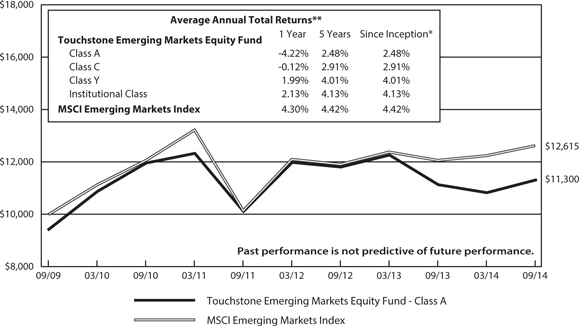
| * | The chart above represents performance for Class A shares only, which will vary from the performance of Class C shares, Class Y shares and Institutional Class shares based on the differences in loads and fees paid by shareholders in the different classes. The inception date of the Fund was September 30, 2009. The MSCI Emerging Markets Index's returns are based on the inception date of the Fund. |
| ** | The average annual total returns shown above are adjusted for maximum applicable sales charges, if applicable. The maximum offering price per share of Class A shares is equal to the net assets value (“NAV”) per share plus a sales load equal to 6.10% of the NAV (or 5.75% of the offering price). Class C shares are subject to a contingent deferred sales charge (“CDSC”) of 1.00% . The CDSC will be assessed on an amount equal to the lesser of (1) the NAV at the time of purchase of the shares being redeemed or (2) the NAV of such shares being redeemed if redeemed within a one-year period from the date of purchase. Class Y shares and Institutional Class shares are not subject to sales charges. |
The performance of the above Fund does not reflect the deduction of taxes that a shareholder would pay on Fund distributions or the redemption of Fund shares.
Note To Chart
The MSCI Emerging Markets Index is a free float-adjusted market capitalization index that is designed to measure equity market performance of emerging markets.
Source: MSCI. MSCI makes no express or implied warranties or representations and shall have no liability whatsoever with respect to any MSCI data contained herein. The MSCI data may not be further redistributed or used to create indices or financial products. This report is not approved or produced by MSCI.
| 10 |
Management's Discussion of Fund Performance (Unaudited)
Touchstone Global Real Estate Fund
Sub-Advised by Forum Securities Limited
Investment Philosophy
The Fund seeks capital appreciation by investing primarily in common stocks and other equity securities of U.S. and foreign real estate companies without regard to market capitalization.
Fund Performance
The Touchstone Global Real Estate Fund (Class A Shares) outperformed its benchmark, the FTSE EPRA/NAREIT Developed Index, for the 12-month period ended September 30, 2014. The Fund’s total return was 9.49 percent (excluding the maximum sales charge) while the benchmark’s total return was 6.71 percent.
Market Environment
Real estate securities delivered solid returns over the past 12 months and outperformed global bonds, but did not match the returns of equities, which rallied strongly as global economic recovery appeared more tangible, particularly in the U.S. and UK.
A backdrop of low interest rates globally provided a driver behind the appetite for the asset class and its performance. Assets in key global gateway cities and dominant locations enjoyed transactional capitalization rates (i.e., “cap rate,” the rate of return on a real estate investment property as measured by the ratio of property net operating income to current market value) close to levels seen before the 2008 global financial crisis. Whether or not the change in cap rates was a cyclical phenomenon or has some structural underpinning is unknown. Pricing in the debt market suggested that inflationary expectations were low and interest rate movements were unlikely to be rapid or significant in terms of magnitude. Prolonged slow global growth and prevailing overall deflationary pressures could comprise another argument for structurally changed cap rates.
Geopolitical conflicts failed to derail market performance during the period. While market volatility registered short-term spikes in response to such conflicts, it remained relatively subdued for most of the period. Access to capital was abundant. Companies contracted the lowest cost of capital in a decade, which resulted in buoyant activity in the acquisition and disposition areas as well as in merger and acquisition (M&A) activity, corporate reorganizations and spin-offs and initial public offerings.
Looking across regions, the Americas delivered the strongest returns during the period, followed by Europe. Asia lagged with a negative return. In terms of markets, the UK was the best performing while Japan experienced a sell-off. From a sector perspective, Hotels, Specialty and Residential companies delivered the strongest absolute returns, while Diversified companies and Homebuilders produced negative returns.
Portfolio Review
The Fund outperformed over the 12-month period due to strong region and sector allocation and strong stock selection. Because the U.S. dollar (USD) appreciated against most currencies, from a foreign exchange perspective, non-USD denominated exposure detracted from performance. An underweight allocation to Japan, and in particular to underperforming Japanese developers, combined with strong stock selection in the Japanese Real Estate Investment Trust (i.e., “J-REIT,” a company in Japan that owns and in most cases operates income-producing real estate) universe and other parts of Asia ex-Pacific, contributed to performance. Stock selection in Europe and the UK also contributed to performance. The stock selection process in the U.S., where exposure to Preferred equities lagged returns generated by common stocks, detracted from performance, as did exposure to South Africa, which underperformed globally.
| 11 |
Management's Discussion of Fund Performance (Unaudited) (Continued)
On a sector allocation basis, strongest performance came from the Fund’s underweight to the Diversified sector and overweight to the Health Care sector. Underweights to the strong Residential and Retail sectors detracted from performance.
Japanese REITs, Kenedix Office Investment Corp., ORIXJREIT Inc. and Invincible Investment Corp. J-REIT, and North American health care companies, Aviv REIT, Inc., Leisureworld Senior Care Corp., Omega Healthcare Investors, Inc. and Sabra Health Care REIT, Inc., outperformed. However, U.S. Preferreds, Glimcher Realty Trust, Sunstone Hotel Investors, Inc. and Ashford Hospitality Trust, Inc., and a U.S. student housing company, Campus Crest Communities, Inc., underperformed.
Geographically, as North America outperformed, the Fund reduced exposure to the region resulting in a greater underweight to the U.S. than 12 months ago. The Fund’s overweight to Canada also was reduced. Similarly, as Europe delivered strong performance, the Fund’s position went from an overweight to an underweight over the past year. As Asia and emerging markets underperformed the Fund sought greater positioning in these regions as potential returns appeared more attractive on a regional basis. A significant underweight to Japan was reduced and an underweight position in Hong Kong/China shifted to an overweight as stocks there emerged as deep value opportunities. The Fund also had larger exposures to Latin America (Mexico) and the Association of Southeast Asian Nations (ASEAN) than 12 months before.
The Fund benefitted from its underweight position in the Diversified sector, which underperformed. The magnitude of that underweight was reduced over time. Similarly, the Fund’s overweight position in the Health Care sector was beneficial and also was reduced over time. As the global economy showed signs of slow recovery, the Fund’s underweight in the Office sector was reduced. The Fund also established a small position in the Residential sector in China, which created a small overweight bias toward Homebuilders. Also, an overweight exposure to the Specialty sector was enhanced. Because of potential negative effects from e-commerce globally and relatively rich retail valuations, the Fund currently has a greater underweight to retail than it did 12 months ago.
Outlook
The world economy tells two tales: one of gradually recovering U.S. and UK economies with stronger Gross Domestic Product growth and improving unemployment statistics; the other of a deflationary world in the eurozone and Japan, and slowing economies in emerging markets, in particular China and Brazil. A global recovery has been underway with corporate earnings rising, albeit at a relatively slow pace. This gradual improvement has led to benign monetary policy in most parts of the world. It is exactly this combination of slow recovery with low interest rates (in fact, negative real interest rates in many parts of the world) that has been conducive to the strong performance of global real estate securities.
Given differentiated performance among the regions as well as diverging outlooks for monetary policy in the different parts of the world, the Fund seeks positions in previous regional underperformers and overweights regions with more benign monetary policy. In tangible terms that means underweight to the U.S. and UK and overweight to Asia. The Fund currently has a neutral positioning in Western Europe and seeks exposure to specific emerging market names. About one-third of the names are off-benchmark exposures.
| 12 |
Management's Discussion of Fund Performance (Unaudited) (Continued)
Comparison of the Change in Value of a $10,000 Investment in the
Touchstone Global Real Estate Fund - Class A* and the FTSE EPRA/NAREIT Developed Index

| * | The chart above represents performance for Class A shares only, which will vary from the performance of Class C shares, Class Y shares and Institutional Class shares based on the differences in loads and fees paid by shareholders in the different classes. The inception date of the Fund was September 30, 2009. The FTSE EPRA/NAREIT Developed Index's returns are based on the inception date of the Fund. |
| ** | The average annual total returns shown above are adjusted for maximum applicable sales charges, if applicable. The maximum offering price per share of Class A shares is equal to the net assets value (“NAV”) per share plus a sales load equal to 6.10% of the NAV (or 5.75% of the offering price). Class C shares are subject to a contingent deferred sales charge (“CDSC”) of 1.00%. The CDSC will be assessed on an amount equal to the lesser of (1) the NAV at the time of purchase of the shares being redeemed or (2) the NAV of such shares being redeemed if redeemed within a one-year period from the date of purchase. Class Y shares and Institutional Class shares are not subject to sales charges. |
The performance of the above Fund does not reflect the deduction of taxes that a shareholder would pay on Fund distributions or the redemption of Fund shares.
Note To Chart
The FTSE EPRA/NAREIT Developed Index measures the general trends in eligible real estate equities worldwide. Relevant real estate activities are defined as the ownership, disposure and development of income-producing real estate.
| 13 |
Management's Discussion of Fund Performance (Unaudited)
Touchstone International Fixed Income Fund
Sub-Advised by GAM International Management Ltd.
Investment Philosophy
The Touchstone International Fixed Income Fund seeks total return by investing primarily in fixed income securities of issuers located outside the United States. Fund management selects foreign country and currency compositions based on an evaluation of various macroeconomic factors including but not limited to relative interest rates, exchange rates, monetary and fiscal policies, trade and current account balances.
Fund Performance
The Touchstone International Fixed Income Fund (Class A Shares) outperformed its benchmark, the Citigroup World Government Bond Index ex-U.S. for the 12-month period ended September 30, 2014. The Fund’s total return was 0.48 percent (excluding the maximum sales charge) while the benchmark’s total return was -0.99 percent.
Market Environment
The decision of the European Central Bank (ECB) to cut its primary refinancing rate in December 2013 bolstered demand for European government bonds, and troubled sovereigns such as Greece, Portugal and Ireland during the early months of the reporting period. For the past 12 months, speculative bonds (ratings below BB+ or Ba+) and currencies contributed to performance.
During the first half of the period, signs of economic improvement in the U.S. and expectations that the U.S. Federal Reserve Board’s (Fed) asset purchasing program would end in 2014, saw demand for U.S. Treasury assets decline as investors increased their exposure to corporate credit and Emerging Market (EM) securities. As the year progressed, questions arose regarding liquidity in an era devoid of central bank stimulus, which led to a reduction in demand for Emerging Market securities, while rising geopolitical uncertainty saw broader risk appetite diminish as the conflicts in Ukraine and Syria escalated and Ebola continued to spread throughout Africa. This was most evident during the third quarter of 2014 when sub-investment grade debt in the UK, U.S. and eurozone declined against higher (credit) quality assets, and the U.S. dollar strengthened against most developed and EM currencies.
Foreign exchange markets were more balanced over the 12-month period. The Indian rupee, Argentine peso and Egyptian pound were the strongest performing currencies against the U.S. dollar, while the Czech koruna, Chilean peso and Russian ruble were the worst performing currencies.
Portfolio Review
During the fiscal year, the Fund outperformed versus its benchmark, largely as a result of strong relative performance during the third-quarter of 2014. An overweight to peripheral and speculative issuers in the eurozone contributed to performance. The Fund’s off-benchmark exposure to Portugal and overweight to Ireland were the largest contributors to performance for the period. The Fund’s exposure to the eurozone was reduced specifically in Germany, France and the Netherlands.
We increased the exposure to the emerging world where, despite concerns regarding currency volatility, we consider yields to be attractive on a relative basis. The Fund remains well underweight Japan in terms of bond exposure, but the foreign exchange underweight was removed, given the significant underperformance of this market over the period, relative to the U.S. dollar.
The Fund’s off-benchmark exposure to corporate bonds added value over the year. This segment of the Fund’s portfolio contributed to performance, with the majority coming from the (non-convertible) investment grade segment. At fiscal year end, convertible debt was the Fund’s largest position in the segment, followed by investment grade corporate bonds, and high-yield represented a small amount.
The Fund’s currency management was a significant driver of outperformance against the benchmark, in particular a short position in the euro (versus the U.S. dollar), and a hedged emerging market strategy and long position in the Chilean peso versus the Australian dollar.
| 14 |
Management's Discussion of Fund Performance (Unaudited) (Continued)
As of September 30, 2014, the Fund had a duration of 3.9 years, versus the benchmark’s duration of 7.7 years.
Developed market yield curves generally flattened during the period and detracted from performance, given the Fund’s underweight duration and limited exposure to longer-dated fixed-income securities versus the benchmark, although country allocation and the Fund’s off-benchmark exposure to corporate credit compensated for the underperformance. The Fund’s primary investment thesis remains for developed market yield curves to steepen and EM yield curves to flatten, as we believe the Fund should benefit from such an environment.
Outlook
We continue to believe the greatest investment opportunities will be found in EM bonds and currencies as well as convertible bonds. Credit has historically benefited from improvements in the economic environment, although we question whether current valuations are sustainable. Consequently, our approach to traditional investment and sub-investment-grade corporate bonds can be described as diversified, and in the case of high yield, cautious.
The situation during the summer of 2013 was a near worst-case scenario for the Fund’s strategy, when safe-haven and more speculative assets sold off in unison. In this instance, weakness was driven by the market’s over-reaction to comments by the Fed and, while it is impossible to say that will not be repeated, we believe central banks will be more careful going forward. We believe the introduction of forward guidance is evidence of this. The guidelines of the Fund’s process were recently amended to allow greater exposure to emerging and convertible bonds, as well as to permit the use of exchange-traded derivatives. We believe the latter will enable us to better manage interest-rate risk and allow for a wider variety of long-short and relative value strategies. Weakness in the third quarter of 2014 was a result of the U.S. dollar strength against the vast majority of developed and emerging market currencies featured within the Fund’s benchmark which means that this risk will be difficult to avoid. However, it is worth noting that, historically, moves of the magnitude of those seen during the third-quarter are rare.
We believe the Fund’s new guidelines discussed above will enable us to better reflect our view on the emerging world economies, help shield capital from the threat of rising interest rates and will seek to exploit growing economic and interest-rate divergences in the world’s developed economies.
We have maintained a shorter-than-benchmark duration given our expectation for rising interest rates in the developed world. We believe diverging economies, as well as diverging central bank policies will create opportunities, but think a cautious approach to fixed-income markets is appropriate in the current environment. A significant proportion of the Fund’s underweight duration comes from a reduced exposure to Europe and detracted from performance for the period. It is important to note that we do not believe the ECB will lift interest rates any time soon; instead we believe that current yields reflect a scenario that we consider possible, although not necessarily probable. However, any move by the ECB to include sovereign debt within its recently announced asset-purchase plan could have an impact on the market and we are watching this carefully.
| 15 |
Management's Discussion of Fund Performance (Unaudited) (Continued)
Comparison of the Change in Value of a $10,000 Investment in the Touchstone
International Fixed Income Fund - Class A* and the
Citigroup World Government Bond Index ex-U.S.

| * | The chart above represents performance for Class A shares only, which will vary from the performance of Class C shares, Class Y shares and Institutional Class shares based on the differences in loads and fees paid by shareholders in the different classes. The inception date of the Fund was September 30, 2009. The Citigroup World Government Bond Index ex-U.S.'s returns are based on the inception date of the Fund |
| ** | The average annual total returns shown above are adjusted for maximum applicable sales charges, if applicable. The maximum offering price per share of Class A shares is equal to the net assets value (“NAV”) per share plus a sales load equal to 4.99% of the NAV (or 4.75% of the offering price). Class C shares are subject to a contingent deferred sales charge (“CDSC”) of 1.00%. The CDSC will be assessed on an amount equal to the lesser of (1) the NAV at the time of purchase of the shares being redeemed or (2) the NAV of such shares being redeemed if redeemed within a one-year period from the date of purchase. Class Y shares and Institutional Class shares are not subject to sales charges. |
The performance of the above Fund does not reflect the deduction of taxes that a shareholder would pay on Fund distributions or the redemption of Fund shares.
Note To Chart
The Citigroup World Government Bond Index ex-U.S. measures the performance of the most significant and liquid government bond markets globally that carry at least an investment grade rating. Currently, the index includes bonds issued by the governments of 21 developed countries.
| 16 |
Management's Discussion of Fund Performance (Unaudited)
Touchstone Merger Arbitrage Fund
Sub-Advised by Longfellow Investment Management Co.
Investment Philosophy
The Touchstone Merger Arbitrage Fund seeks to achieve positive absolute returns regardless of market conditions over the long term by investing primarily in securities of companies that are involved in publicly announced mergers and other corporate reorganizations. Merger arbitrage is an investment strategy that seeks to capture the “arbitrage spread” represented by the difference between the market price of the securities of the company being purchased and the value that is offered for these securities by the acquiring company. The Fund selects securities based on proposed financing terms, the size of the transaction, anti-trust concerns, regulatory approvals and shareholder voting requirements.
Fund Performance
The Touchstone Merger Arbitrage Fund (Class A Shares) underperformed its benchmark, the BofA Merrill Lynch 3-Month U.S. Treasury Bill Index, for the 12-month period ended September 30, 2014. The Fund’s total return was -1.75 percent (excluding the maximum sales charge) while the benchmark’s total return was 0.05 percent.
Market Environment
For the period, U.S. equity markets posted strong returns, partially due to a two-year budget deal approved in December 2013 as well as increased clarity about the U.S. Federal Reserve Board’s intentions regarding monetary policy. Overall, the markets were able to move past geopolitical headline events, including political protests in Hong Kong, military activities in the Ukraine and renewed conflicts in the Middle East, all of which failed to reverse the upward trend of U.S. equity markets.
The topic of tax-inversion-motivated mergers and acquisitions (M&A) attracted the attention of politicians as well as the Internal Revenue Service and the U.S. Treasury. The U.S. Treasury acted unilaterally in an attempt to make inversions, in which a U.S. company reincorporates overseas after merging with a foreign business, less economically attractive. New rules reduced the financial benefits by making it more difficult for profits earned abroad to be repatriated to the U.S. without being taxed.
M&A activity continued across a variety of sectors. As belief in the economic recovery gained traction, an increasing number of companies sought to consolidate, with M&A activity reaching its fastest pace since 2007. This attracted significant investor attention and brought the opportunity set for attractive investment returns to limited levels. The lack of volatility also contributed to an increase in investors’ perceived risk appetite. The combination of investor sentiment and the increased appetite for risk led to a difficult environment for a merger arbitrage investment strategy.
Activity in regional banking securities increased, as regulatory pressures were catalysts for consolidation. Specialty finance companies also combined at a rapid pace. Later in the period, financial services and regional banks took a breather from consolidation efforts, as the market digested the abundant deals recently completed and those still pending. Deals in the Energy sector slowed.
Health care providers and medical device manufacturers also accounted for a significant portion of M&A activity. Technology, telecommunications, chemicals and materials companies were all active in completing deals as well.
| 17 |
Management's Discussion of Fund Performance (Unaudited) (Continued)
Portfolio Review
The investment opportunity for M&A was small which left little margin for error. Spreads began to widen over the final weeks of the fiscal period.
For the 12-month period, several deals detracted from performance. Apollo Tyre Ltd.’s attempted acquisition of Cooper Tire and Rubber Co. encountered a number of obstacles and was ultimately terminated. Liberty Media Corp. abandoned its bid for Sirius XM Holdings Inc. in favor of a share class recapitalization, NuPathe Inc. failed to receive an increased bid, and Nicholas Financial Inc. terminated its announced acquisition by Prospect Capital Corp., all of which negatively impacted the Fund. A security-specific strategy designed to benefit Noble Corp.’s spin-off of Paragon Offshore PLC in addition to National Oilwell Varco Inc.’s spin-off of its distribution business, DistributionNOW, detracted from Fund performance. A drop in oil prices affected both deals.
The largest detractor resulted from Hillshire Brands Co.’s intent to acquire Pinnacle Foods Inc. and subsequent bidding by Pilgrim’s Pride Corp. and Tyson Foods Inc. to acquire Hillshire Brands. The Hillshire Brands/Pinnacle Foods deal fell apart. With the attention on Hillshire Brands, Pinnacle Foods’ stock price fell to its pre-deal-announcement price. The Fund held a long position in Pinnacle Foods and a short position in Hillshire Brands which negatively affected performance. After the Pinnacle Foods and Hillshire Brands deal fell apart, the Fund took a long position in Hillshire Brands as Tyson Foods became the acquirer which both contributed to performance. The broken Omnicom Group Inc./Publicis Groupe deal did not have as negative an impact on the Fund, and both positions were sold without a loss on the target or the acquirer.
As has historically been the case, many positions contributed about equally to Fund performance during the 12-month period. Spin-off positions which included Dover Corp.’s spin-off of Knowles Corp., its communication technology division, and Penn National Gaming’s spin-off of Gaming and Leisure Properties Inc. both contributed to performance. The acquisition of Bally Technologies Inc. by Scientific Games Corp. also contributed to performance. Private equity firm Thoma Bravo LLC agreed to acquire Compuware Corp. in September. Northstar Realty Finance Corp. successfully spun out its asset management business, Northstar Asset Management Inc., and contributed positively to overall performance.
GMAC Capital Trust preferred stock and a traditional merger arbitrage position, UNS Energy Corp., positively impacted performance.The Fund’s long position in BRE Properties Inc., in tandem with a hedged short position in Essex Property Trust, contributed to performance, as did the Fund’s participation in Outerwall’s Dutch tender offer.
Outlook
Historically, low short-term interest rates have acted as a headwind to the merger arbitrage strategy. We believe that when risk re-emerges as a material investment variable, the opportunity set will improve. The markets experienced severe volatility during the last week of the fiscal period, but it has yet to be consistent. Weakness in the domestic economy continues to be our greatest area of concern. Our other concerns include weak economic performance in the eurozone and increasing geopolitical risks.
Merger investments continue to comprise a dominant portion of the Fund. We believe merger opportunities of companies in the Financials, Information Technology and Telecommunication Services sectors will continue to offer the greatest opportunities. The pipeline of announced spin-offs is at its highest level in more than a decade. However, we believe most of the spin-offs driven by value-creating situations seem to have already been announced or completed. Less attractive opportunities make up the bulk of the current opportunity set and it appears that the environment is in the late stages of the current spin-off cycle. Also, we believe increased volatility in the fixed income market has created pockets of investment opportunities in the corporate bond
| 18 |
Management's Discussion of Fund Performance (Unaudited) (Continued)
market. Lastly, management teams are increasingly pursuing recapitalization initiatives as they pursue innovative methods of returning capital to shareholders absent clear paths to organic growth.
We continue to believe that the Fund offers an attractive risk reward/profile and serves as a valuable diversification tool. Its portfolio continues to be well diversified by industry, market capitalization and transaction type. The Fund seeks to be fully invested while holding positions in liquid securities in order to have the flexibility to react quickly to new opportunities and unexpected events and invest tactically. We believe the distinctive nature of each holding combined with the various strategies employed, provides low overall correlation to the broad equity and fixed income markets.
| 19 |
Management's Discussion of Fund Performance (Unaudited) (Continued)
Comparison of the Change in Value of a $10,000 Investment in the Touchstone Merger
Arbitrage Fund - Class A* and the BofA Merrill Lynch 3-Month U.S. Treasury Bill Index

| * | The chart above represents performance for Class A shares only, which will vary from the performance of Class C shares, Class Y shares and Institutional Class shares based on the differences in loads and fees paid by shareholders in the different classes. The inception date of the Fund was August 9, 2011. The BofA Merrill Lynch 3-Month U.S. Treasury Bill Index's returns are based on the inception date of the Fund. |
| ** | The average annual total returns shown above are adjusted for maximum applicable sales charges. The maximum offering price per share of Class A shares is equal to the net assets value (“NAV”) per share plus a sales load equal to 6.10% of the NAV (or 5.75% of the offering price). Class C shares are subject to a contingent deferred sales charge (“CDSC”) of 1.00%. The CDSC will be assessed on an amount equal to the lesser of (1) the NAV at the time of purchase of the shares being redeemed or (2) the NAV of such shares being redeemed if redeemed within a one-year period from the date of purchase. Class Y shares and Institutional Class shares are not subject to sales charges. |
The performance of the above Fund does not reflect the deduction of taxes that a shareholder would pay on Fund distributions or the redemption of Fund shares.
Note to Chart
The BofA Merrill Lynch 3-Month U.S. Treasury Bill Index is an unmanaged index of Treasury securities maturing in 90 days that assumes reinvestment of all income.
| 20 |
Management's Discussion of Fund Performance (Unaudited)
Touchstone Mid Cap Fund
Sub-Advised by The London Company
Investment Philosophy
The Touchstone Mid Cap Fund seeks long-term capital growth by investing primarily in common stocks of mid-cap U.S. listed companies. The Fund utilizes a bottom-up security selection process that screens potential investments against a proprietary quantitative model for return on capital, earnings to enterprise value ratio, and free cash flow yield. Its goal is to purchase financially stable companies that consistently generate high returns on unleveraged operating capital, are run by shareholder-oriented managements and are trading at a discount to their respective private market values.
Fund Performance
The Touchstone Mid Cap Fund (Class A Shares) underperformed its benchmark, the Russell Midcap® Index, for the 12-month period ended September 30, 2014. The Fund’s total return was 13.57 percent (excluding the maximum sales charge) while the benchmark’s total return was 15.83 percent.
Market Environment
From a macroeconomic perspective, the U.S. economy strengthened due to stronger durable goods orders, stable/improving housing and rising consumer confidence. These factors helped drive the market higher. In recent years, corporate America excelled in maximizing productivity per worker and increasing profitability margins. Balance sheets were strong and the low interest rate environment provided a once-in-a- lifetime opportunity for many companies to improve their capital structure for the benefit of shareholders. While valuations were not cheap, we remained optimistic due to the strength of corporate balance sheets, low dividend payout ratios, acceleration in mergers and acquisitions (M&A) activity and the low cost of debt.
Structural headwinds of a lower quality, cyclical market existed for mid-cap stocks but were somewhere offset by a more active M&A market. Well-positioned for such activity, many mid-cap stocks carried premiums based on acquisition speculation.
For the trailing 12-month period, mid caps were led higher by the Telecommunication Services and Health Care sectors while the Energy and Consumer Discretionary sectors detracted from performance.
Portfolio Review
Positive stock selection for the period was not enough to offset the negative impact sector allocation had on relative performance. At the sector level, the Fund’s underweight to the Health Care sector and overweight to the Consumer Discretionary sector had a negative impact on relative performance, partially offset by the positive impact of the Fund’s overweight to the Consumer Staples sector and the Fund’s underweight to the Financials and Information Technology sectors. The Fund’s holdings in the Industrials sector added the most value but were offset by the performance of the Fund’s holdings in the Financials sector.
The Fund’s top contributors to performance included Deckers Outdoor Corp. (Consumer Discretionary sector), Cintas Corp. (Industrials sector), Tenet Healthcare Corp. (Health Care sector), Old Dominion Freight Lines (Industrials sector) and NewMarket Corp. (Materials sector). Deckers performed well with strong sales and impressive inventory management. Its UGG brand continued to grow and both retailers and consumers were excited about new products. Cintas rallied late in the year after posting better than expected results. Organic sales growth improved significantly and operating margins continued to improve. We remain attracted to the potential high returns on capital generated by the company’s dominant position in the uniform rental market. Tenet Healthcare continued its strong performance as hospitals rallied reflecting the positive impact of Medicaid expansion on the uninsured population. This led to greater patient volume and a significant reduction in bad
| 21 |
Management's Discussion of Fund Performance (Unaudited) (Continued)
debt expense. These factors contributed to the company reporting better than expected results and raised its earnings guidance. Old Dominion Freight Lines steadily increased as the company continued to post strong results driven by its service-focused model. Margins continued to improve and the balance sheet remained strong. NewMarket rallied early in the year after posting strong volume growth. We were attracted to the potential high returns on capital in this rational oligopoly with a shareholder-oriented, highly-vested management team.
Among the largest detractors to performance for the period were Atwood Oceanics Inc. (Energy sector), Nu Skin Enterprises Inc. (Consumer Staples sector), Ablemarle Corp. (Materials sector), MBIA Inc. (Financials sector) and Cabela’s Inc. (Consumer Discretionary sector). Atwood Oceanics declined due to weakness in offshore drilling rig day rates. We believe Atwood can weather the cycle due to the recent modernization of its rig fleet, strength of its relationships with end-users and a disciplined and shareholder-oriented management team. Nu Skin declined reflecting concerns about its business in China. After the company reported a weaker than expected second quarter of 2014 with no insider buying from management or share repurchase from the company, we decided to exit the Fund’s holding. Albemarle traded lower following the announcement of its plans to acquire Rockwood Holdings Inc. The company also lowered its near-term earnings guidance. We remain attracted to the barriers to entry and high returns on capital in its bromine franchise. MBIA’s stock price declined as concern around the company’s exposure to Puerto Rico impacted the stock. While the potential effect could be material, we believe the company has excess reserves to cover any potential negative impact. Also, MBIA’s national business is now free to underwrite municipal bond insurance, thus providing an additional revenue source. We remain attracted to its significant discount to adjusted book value. Cabela’s declined as same store sales continued to face pressure from a slowdown in guns and ammunition sales. The rest of the company’s business has performed well and we remain attracted to the strong store format and significant room for new store growth across the country.
Over the past 12 months, the Fund initiated new positions in Dollar Tree Stores Inc. (Consumer Discretionary sector), AlliantTechsystems Inc. (Industrials sector), PulteGroup Inc. (Consumer Discretionary sector), Symantec Corp. (Information Technology sector) and NetApp Inc. (Information Technology sector).
To fund purchases, the Fund sold its positions in Staples Inc. (Consumer Discretionary sector), Hatteras Financial Corp. (Financials sector), MeadWestvaco Corp. (Materials sector), The Hershey Co. (Consumer Staples sector), Alexander & Baldwin Inc. (Financials sector), Matson Inc. (Industrials sector), White Mountains Insurance Group Ltd. (Financials sector), Eaton Vance Corp. (Financials sector) and Nu Skin Enterprises Inc. (Consumer Staples sector). While Staples appears inexpensive based on the strength of its balance sheet, we are disappointed with management’s reluctance to close retail stores at a faster pace and focus on return on capital; management is more focused on sales. The Hatteras sale reflected our concern around its leverage and inability to withstand interest rate risk. While MeadWestvaco has undertaken recent actions to create shareholder value including selling its timberland assets and restructuring its packaging business, persistent weakness in the lower return on capital packaging business caused us to sell the stock. Hershey has done well and was approaching our estimate of intrinsic value. Alexander & Baldwin and Matson were small positions; we decided to reallocate the funds to higher conviction ideas. Eaton Vance was a smaller, low conviction weighting.
Outlook
Our investment focus is at a company-specific level, not from a top-down approach. While we do not attempt to forecast the future, we remain fairly optimistic. Corporate America is in good shape with high operating margins and strong balance sheets. The economic recovery continued with improvement in employment, capital investment and a generally benign interest rate and inflation outlook. We expect the slow growth environment to continue and believe stocks could be more volatile in the future. Our approach is to own companies with strong returns on capital and flexibility to enhance shareholder value using the balance sheet. We believe the Fund is positioned well for a wide array of environments.
| 22 |
Management's Discussion of Fund Performance (Unaudited) (Continued)
Organic growth remains challenging, and we are seeing more companies resort to M&A as a use of excess cash. In a slow growth, low-financing cost world, more transactions have made better economic sense and have been able to deliver accretion to more of the merged entity’s results. In addition, positive response by the market only validates the strategy where transactions begat more transactions, providing a powerful corporate impetus to jump on the bandwagon. While there is action occurring across the board, activity has clustered in those industries with some shared traits of maturing business models generating high free cash-flow but with diminishing growth prospects in the global economy.
Low interest rates and relatively high equity risk premiums enable companies to increase shareholder value by adjusting the capital structure of the company. Separately, with elevated cash levels on corporate balance sheets and dividend payout ratios near historic lows, we expect investors to reward companies that wisely deploy capital including higher dividends, share repurchases and M&A transactions. We believe the Fund is conservatively positioned for a slow growth environment that rewards strong capital allocation and we expect it to participate in its share of deals going forward.
| 23 |
Management's Discussion of Fund Performance (Unaudited) (Continued)
Comparison of the Change in Value of a $10,000 Investment in the Touchstone
Mid Cap Fund - Class A* and the Russell Midcap® Index
��

| * | The chart above represents performance for the Class A shares only, which will vary from the performance of Class C shares, Class Y shares, Class Z shares and Institutional Class shares based on the differences in loads and fees paid by shareholders in the different classes. The initial public offering of the Class Y shares commenced on January 2, 2003. The initial public offering of Class A shares and Class C commenced on May 14, 2007. The initial public offering of Class Z shares commenced on April 24, 2006 and the initial public offering of Institutional Class shares commenced on January 27, 2012. Class A and Class C shares performance information is calculated using the historical performance of Class Y shares for the periods prior to May 14, 2007. Class Z shares performance information is calculated using the historical performance of Y shares for the periods prior to April 24, 2006 and Institutional Class performance information is calculated using the historical performance of Y shares for the periods prior to January 27, 2012. The returns have been restated for sales charges and for fees applicable to Class A, Class C and Class Z shares. Russell Midcap® Index's returns are based on the inception date of the Fund. |
| ** | The average annual total returns shown above are adjusted for maximum applicable sales charges, if applicable. The maximum offering price per share of Class A shares is equal to the net assets value (“NAV”) per share plus a sales load equal to 6.10% of the NAV (or 5.75% of the offering price). Class C shares are subject to a contingent deferred sales charge (“CDSC”) of 1.00%. The CDSC will be assessed on an amount equal to the lesser of (1) the NAV at the time of purchase of the shares being redeemed or (2) the NAV of such shares being redeemed if redeemed within a one-year period from the date of purchase. Class Y shares, Class Z shares and Institutional Class Shares are not subject to sales charges. |
The performance of the above Fund does not reflect the deduction of taxes that a shareholder would pay on Fund distributions or the redemption of Fund shares.
Note to Chart
The Russell Midcap® Index measures the performance of the 800 smallest companies in the Russell 1000® Index.
The Frank Russell Company (FRC) is the source and owner of the Index data contained or reflected in this material and all trademarks and copyrights related thereto. The material may contain confidential information and unauthorized use, disclosure, copying, dissemination or redistribution is strictly prohibited. This is a Touchstone Investments presentation of the data, and FRC is not responsible for the formatting or configuration of this material or for any inaccuracy in the presentation thereof.
| 24 |
Management's Discussion of Fund Performance (Unaudited)
Touchstone Mid Cap Value Fund
Sub-Advised by Lee Munder Capital Group LLC
Investment Philosophy
The Touchstone Mid Cap Value Fund seeks capital appreciation by investing primarily in common stocks of mid-cap companies. The Fund seeks to identify companies believed to be selling at a discount to their inherent value.
Fund Performance
The Touchstone Mid Cap Value Fund (Class A Shares) underperformed its benchmark, the Russell Midcap® Value Index, for the 12-month period ended September 30, 2014. The Fund’s total return was 12.49 percent (excluding the maximum sales charge) while the benchmark’s total return was 17.46 percent.
Market Environment
Economic signals showed clear softening early this fiscal year, especially across headline indicators for employment growth, manufacturing, housing and retail. The market’s reset turned out to be short-lived. Strong corporate earnings season was a key factor, global economies showed improvement and many investors seemed to discount weaker consumer data in the U.S. as temporary. Despite the volatility for the period, most U.S. benchmarks managed modest gains early in the calendar year, and global equity markets continued higher. In the U.S., labor statistics continued to signal improvement, notably healthy payroll gains and lower weekly jobless claims. Strong manufacturing data was offset by weather induced consumer weakness. European equities, and emerging markets in particular, gained as questions surrounding Russia’s next move in Ukraine abated.
Most recently, global equity markets were broadly lower, as a weaker macro backdrop was headlined by clear signs of a slowdown in the eurozone in particular. Japan and China signaled additional weakness in economic activity, and domestically the fear was any slowdown would also spread to the U.S. With the return of tensions in Ukraine, the independence vote in Scotland and the escalation of unrest in the Middle East, geopolitics also added a level of uncertainty, volatility and market weakness at the end of the period. While key U.S. economic reports – second quarter Gross Domestic Product (GDP), recent job numbers and the manufacturing sector in particular – have continued to improve, the dimmer economic picture globally and the harsh weather earlier in the year challenged U.S. equity investors for most of 2014, especially in recent months. For most of the period, the relationship between market cap size and returns for U.S. equities has been direct and essentially linear, with large-cap stocks outperforming mid-cap stocks, and mid cap stocks outperforming small-cap stocks.
Portfolio Review
For the 12-month period, poor stock selection within the Information Technology, Consumer Discretionary, Consumer Staples and Health Care sectors detracted from performance, which was slightly offset by favorable sector weights.
In the Financials sector, the Fund’s ongoing underexposure to real estate investment trusts (REITs) contributed to performance, along with favorable stock selection in REITs, commercial banks and capital markets. The Fund was meaningfully underweight REITs based on valuations, although Cole Real Estate Investments Inc. (Financials sector) was a key individual contributor that was acquired at a premium in the fourth quarter of 2013.The Fund has a meaningful weight in Ameriprise Financial Inc. (Financials sector), which also contributed to performance.
Newfield Exploration Co, a Houston-based exploration and production company and Nabors Industries Ltd, which provides drilling and rig services, were key contributors to performance in the Energy sector. Newfield reported a stronger-than-expected reserve report, growing appreciation for the potential of the company’s position in the Anadarko basin and the sale of its international business, a move appreciated by the market. Nabors benefited from increasing rig demand in an improving land drilling market, and the stock responded to the company’s stronger results across both its domestic and international operations. In the Utilities sector, a combination
| 25 |
Management's Discussion of Fund Performance (Unaudited) (Continued)
of the Fund’s underweight to the sector and stock selection in Electric Utilities (Edison International in particular) drove sector performance.
Stock selection in the Health Care sector detracted from performance, primarily because the Fund did not own the more momentum-oriented pharmaceutical names within the sector. Of the Fund’s holdings, Quest Diagnostics Inc., one of the largest clinical laboratory services and diagnostic testing companies, declined as reimbursement pressure and lack of volume growth weighed on the stock. Long term, we continue to like the company as Quest is aggressively cutting costs and we believe volumes will ultimately improve due to company initiatives, healthcare reform and demographics. Patterson Companies Inc. also detracted from performance, as the company failed to meet expectations and lowered forward guidance.
Specialty retailers including PetSmart Inc., Cabela’s Inc., Bed Bath & Beyond Inc. and Sally Beauty Holdings Inc. in the Consumer Discretionary sector all detracted from performance. All four companies faced a difficult combination of harsh weather, weak traffic and a tough competitive environment. The latter was particularly true for Bed Bath & Beyond and PetSmart. We continue to have conviction in these stocks and believe the management teams are taking the necessary steps to correct company-specific issues.
Outlook
The Fund’s strategy utilizes a classic value-driven philosophy based on the belief that leading businesses selling at a discount to fair value have the potential to generate excess returns. The strategy focuses on stocks that are temporarily out of favor in the market; specifically, companies with higher returns on capital, free cash flow and strong balance sheets. Emphasis is placed on those companies having the cash flow characteristics as well as the balance sheet strength necessary to buffer the company from any prolonged weakness. Companies in the Fund’s portfolio often dominate a particular industry niche and generally have significant barriers to entry. As a result, they are able to perpetuate a higher return on capital over time.The entire process utilizes fundamental bottom-up security selection, while risk control measures ensure security and sector diversification.
In recent history, the market has rewarded momentum and lower quality companies. Concurrently, we believe the market has been short-term focused regarding companies dealing with transitory negative events. High-quality and undervalued stocks began to appreciate recently, which is a supportive backdrop to our investment approach. We remain disciplined to our philosophy of buying quality companies trading with favorable risk/reward dynamics so that the Fund is well positioned as our style returns to favor. We continue to find what we believe to be attractively valued investment opportunities with favorable risk/reward profiles. We believe these investments should outperform the market over the longer term.
Our greatest concern is that the market environment will revert back to creating a headwind for our investment philosophy. For the majority of the period, specific to the benchmark, high beta1 and non-earning companies generated the strongest performance, while lower quality companies and momentum continued to lead the market. We hope that the more recent emphasis on quality and value will continue.
1 Beta is a measure of the volatility of a portfolio relative to its benchmark.
| 26 |
Management's Discussion of Fund Performance (Unaudited) (Continued)
Comparison of the Change in Value of a $10,000 Investment in the
Touchstone Mid Cap Value Fund - Class A* and the Russell Midcap® Value Index

| * | The chart above represents performance for Class A shares only, which will vary from the performance of Class C shares, Class Y shares and Institutional Class shares based on the differences in loads and fees paid by shareholders in the different classes. The inception date of the Fund was September 30, 2009. Russell Midcap® Value Index's returns are based on the inception date of the fund. |
| ** | The average annual total returns shown above are adjusted for maximum applicable sales charges, if applicable. The maximum offering price per share of Class A shares is equal to the net assets value (“NAV”) per share plus a sales load equal to 6.10% of the NAV (or 5.75% of the offering price). Class C shares are subject to a contingent deferred sales charge (“CDSC”) of 1.00%. The CDSC will be assessed on an amount equal to the lesser of (1) the NAV at the time of purchase of the shares being redeemed or (2) the NAV of such shares being redeemed if redeemed within a one-year period from the date of purchase. Class Y shares and Institutional Class shares are not subject to sales charges. |
The performance of the above Fund does not reflect the deduction of taxes that a shareholder would pay on Fund distributions or the redemption of Fund shares.
Note to Chart
The Russell Midcap® Value Index measures the performance of those Russell Midcap companies with lower price-to-book ratios and lower forecasted growth values.
The Frank Russell Company (FRC) is the source and owner of the data contained or reflected in this material and all trademarks and copyrights related thereto. The material may contain confidential information and unauthorized use, disclosure, copying, dissemination or redistribution is strictly prohibited. This is a Touchstone Investments presentation of the data, and FRC is not responsible for the formatting or configuration of this material or for any inaccuracy in the presentation thereof.
| 27 |
Management's Discussion of Fund Performance (Unaudited)
Touchstone Premium Yield Equity Fund
Sub-Advised by Miller/Howard Investments, Inc.
Investment Philosophy
The Touchstone Premium Yield Equity Fund seeks long-term growth of capital and high current income by focusing on dividend-paying equity securities of U.S. companies and foreign companies believed to possess attractive long-term return potential primarily due to lower than average valuations and improving business outlooks.
Fund Performance
The Touchstone Premium Yield Equity Fund (Class A Shares) underperformed its first benchmark, the Russell 3000© Value Index, and outperformed its second benchmark, the Dow Jones U.S. Select Dividend Index for the 12-month period ended September 30, 2014. The Fund’s total return was 16.79 percent (excluding the maximum sales charge) while the returns of its first and second benchmarks were 17.66 percent and 15.34 percent, respectively.
Market Environment
The U.S. economy continued its progress during the last twelve months, emboldening the U.S. Federal Reserve Board (Fed) to continue to “taper” its quantitative easing program. Early in this process, investors expected that “tapering” would mean noticeably higher long-term interest rates, however as time went by, investors began to agree with our expectation that that might not be so. The muted domestic economic growth, however, has helped corporate profitability and free cash flow, because the slower growth has not demanded much capital spending for capacity expansion. This cash flow has increased already large cash balances, allowing managements to reduce financial leverage and increase dividends.
Portfolio Review
For the fiscal year, strong stock selection in the Energy and Utilities sector contributed to performance. An overweight exposure to the InformationTechnology sector as well as stock selection contributed. The Financials, Telecommunication Services and Health Care sectors were the largest detractors primarily due to unfavorable stock selection.
Among the stocks that contributed to Fund performance for the period included: Intel Corp. (Information Technology sector), and Williams Companies Inc. and Kinder Morgan Inc. (both Energy sector). Intel, a manufacturer of digital technology platforms, gained market share after it announced several new products for smart phone and tablet mobile computing. The company also benefitted from a generally improved outlook in the personal computer business after guiding its gross margins and revenues higher for the fiscal year 2014. Declining PC sales appear to have bottomed in the U.S. and are in the process of doing so globally, which alleviated two of the biggest concerns investors were experiencing. Williams Companies, an energy infrastructure company, increased its dividend and beat its earnings-per-share (EPS) estimates during the second quarter, which sent the stock higher. The company continued to experience strong dividend growth during the period, as it benefitted from faster cash flow growth, generated by the transition as a general partner for their pipeline Master Limited Partnership (MLP). Kinder Morgan Inc. announced plans to acquire Kinder Morgan Energy Partners LP, Kinder Morgan Management LLC and El Paso Pipeline Partners LP, which helped the stock and, we believe, should raise the dividend going forward.
Among the stocks that detracted for the period were: Seadrill Ltd. and Ensco PLC (both Energy sector) and GlaxoSmithKline PLC (Health Care sector). Seadrill and Ensco are both companies that lease ocean-going oil drilling rigs and drill ships. Both suffered declines because of weakness in the drillship leasing market. This
| 28 |
Management's Discussion of Fund Performance (Unaudited) (Continued)
was due in part to the large number of newly built ships and rigs entering service, just as oil companies began to rethink their offshore drilling programs in favor of onshore prospects. We believe these companies’ strong dividends should be secure over the next 6 to 12 months due to the companies’ existing contracts. GlaxoSmithKline suffered recently when sales for its new respiratory drug experienced a slower than expected start. In addition, GlaxoSmithKline, a British company, was negatively affected as the UK stock market lagged the U.S. stock market in both U.S. dollar and UK pound terms. Overall, we remain optimistic about the company’s new drug pipeline and its moves to combine its consumer and vaccine businesses with that of Novartis AG. We believe it can continue to grow its dividend as well.
Outlook
Our research suggests that if rising rates are a function of improving earnings and growth expectations, dividend stocks should do well, both in absolute terms and relative to non-dividend-paying stocks. Today, with the Fed in full control of the forward curve and inflation nonexistent, it is hard to envision a scenario where interest rates rise without this recovery coming to pass. If the most likely thing driving interest rates higher in the future is excess earnings growth, we believe the Fund is well-positioned. Raging inflation is a different force that drives interest rates higher and would not be positive for any category of stocks, but we believe in the months to come that market participants are more likely to turn their attention to deflation. Low interest rates are not a positive sign for the economy, and we believe the longer they persist, the more likely the structural drags on growth may become chronic.
We remain positive about dividend growth prospects as, given the lack of other income sources, many investors are seeking more dividends from companies and, in the intermediate to long-term, rewarding the stock prices of companies that can and do increase their dividends. In addition, corporate earnings growth has been good, companies are flush with cash and dividend payout ratios are currently low. We continue to seek companies with monopolistic assets, repeatable business models and recurring revenues that pay a stable dividend and have the potential to increase that dividend over time. We believe the key is to keep a long-term compounding vision in mind.
Dividend-paying investments may not experience the same price appreciation as non-dividend paying instruments, dividend-issuing companies may choose not to pay a dividend, or the dividend may be less than what is anticipated.
| 29 |
Management's Discussion of Fund Performance (Unaudited) (Continued)
Comparison of the Change in Value of a $10,000 Investment in the
Touchstone Premium Yield Equity Fund - Class A* , the Russell 3000® Value Index and the Dow Jones U.S. Select Dividend Index

| * | The chart above represents performance for Class A shares only, which will vary from the performance of Class C shares and Class Y shares based on the differences in loads and fees paid by shareholders in the different classes. The initial public offering of Class A shares and Class C shares commenced on December 3, 2007. The initial public offering of Class Y shares commenced on August 12, 2008. The Class Y performance information is calculated using the historical performance of Class A for periods prior to August 12, 2008. The returns have been restated for sales charges and for fees applicable to Class Y shares. Russell 3000® Value Index and Dow Jones U.S. Select Dividend Index's returns are based on the inception date of the Fund. |
| ** | The average annual total returns shown above are adjusted for maximum applicable sales charges, if applicable. The maximum offering price per share of Class A shares is equal to the Net Asset Value per share plus a sales load equal to 6.10% of the NAV (or 5.75% of the offering price). Class C shares of the Funds are subject to a contingent deferred sales charge (“CDSC”) of 1.00%. The CDSC will be assessed on an amount equal to the lesser of (1) the NAV at the time of purchase of the shares being redeemed or (2) the NAV of such shares being redeemed if redeemed within a one-year period from the date of purchase. Class Y shares are not subject to sales charges. |
The performance of the above Fund does not reflect the deduction of taxes that a shareholder would pay on Fund distributions or the redemption of Fund shares.
Note to Chart
The Russell 3000® Value Index measures the performance of those Russell 3000 companies with lower price-to-book ratios and lower forecasted growth values.
The Dow Jones U.S. Select Dividend Index measures 100 leading U.S. dividend-paying companies.
The Frank Russell Company (FRC) is the source and owner of the data contained or reflected in this material and all trademarks and copyrights related thereto. The material may contain confidential information and unauthorized use, disclosure, copying, dissemination or redistribution is strictly prohibited. This is a Touchstone Investments presentation of the data, and FRC is not responsible for the formatting or configuration of this material or for any inaccuracy in the presentation thereof.
| 30 |
Management's Discussion of Fund Performance (Unaudited)
Touchstone Sands Capital Select Growth Fund
Sub-Advised by Sands Capital Management, LLC
Investment Philosophy
The Touchstone Sands Capital Select Growth Fund seeks long term capital appreciation. The Fund primarily invests in common stocks of large capitalization U.S. companies that are believed to have above-average potential for revenue or earnings growth. The Fund typically invests in 25 to 30 companies. Sands Capital generally seeks stocks with sustainable above average earnings growth and with capital appreciation potential. In addition, Sands Capital looks for companies that have a significant competitive advantage, a leadership position or proprietary niche, a clear mission in an understandable business, financial strength, and are valued rationally in relation to comparable companies, the market and the business prospects for that particular company.
Fund Performance
The Touchstone Sands Capital Select Growth Fund (Class A Shares) underperformed its benchmark, the Russell 1000® Growth Index, for the 12-month period ended September 30, 2014. The Fund’s total return was 13.73 percent (excluding the maximum sales charge) while the total return of the benchmark was 19.15 percent.
Market Environment
Rising markets drove valuations higher in 2013. Valuations of those in the hyper-growth companies often found in the technology and biotechnology sectors were particularly high. Although 2014 started strong, the trend reversed in February as investors, concerned about stretched valuations, began to take profits. High-growth, high-beta1, high-P/E (price-to-earnings) stocks declined.
Portfolio Review
The technology and biotechnology businesses held in the Fund’s portfolio were not resistant to the profit taking. Through the sell-off, we retained conviction in the growth prospects of these businesses and continued to believe their valuations were rational when viewed through the lens of the strategy’s five-year investment horizon. We believe the Fund’s technology companies continued to benefit from powerful secular drivers, such as the ongoing exponential growth of the Semiconductor industry and the adoption of cloud computing.The biotechnology businesses in the Fund have developed deep pipelines of multiple drugs that we believe, if successful, could sustain earnings growth for years to come. As a result of our conviction, we did not eliminate any of these companies, and took the opportunity to increase weights in positions where we thought there were compelling opportunities.
Although the Fund underperformed its benchmark for the fiscal year during the most recent earnings period, each company held demonstrated strong business results. These business results are our primary focus (rather than stock price movements) and we remain confident in each company’s fundamentals over time and believe each is well-positioned to generate above-average earnings growth.
On a relative basis, the top contributors for the period were Chipotle Mexican Grill Inc., Baidu Inc., Facebook Inc., Google Inc. and Alexion Pharmaceuticals Inc. For example, Alexion’s growth continues to be driven by Soliris, its platform drug for the treatment of adult and pediatric patients with a typical hemolytic uremic syndrome (aHUS). It was approved for two indications and is in Phase 3 trials for four additional indications.The company has a robust pipeline of developmental drugs that we believe have the potential to materially contribute to growth. For instance, it filed Asfotase Alfa for the treatment of hypophosphatasia, an ultra-rare bone disorder, for approval with the FDA. We expect it will be approved in early 2015. Alexion also has three additional molecules in early stages of development on which we expect to receive updates over the next 12 to 18 months.
| 31 |
Management's Discussion of Fund Performance (Unaudited) (Continued)
Driven by the ongoing launch of new indications for Soliris and its robust pipeline, we believe Alexion can sustain above-average growth for years to come.
Ulta Salon Cosmetics & Fragrances Inc., ARM Holdings PLC, ASML Holding N.V., Whole Foods Market Inc. and Allergan Inc. detracted from performance for the period. For example, ASML Holding, earlier this year announced it would be delaying delivery of its next-generation Extreme Ultraviolet Lithography (EUV) production tools. This is due to what we believe are temporary supply chain issues such as global competition or consumer demand. While disappointing, this near-term setback does not impact our long-term investment case. We still expect EUV tools will become the new standard in the semiconductor fabrication process, and continue to believe ASML is one of the more compelling businesses in the technology space given its growing competitive advantages and position in the semiconductor industry.
We diligently monitor and continually evaluate the long-term growth prospects for portfolio companies while simultaneously seeking opportunities to add compelling new businesses. In the past year, we initiated positions in four companies: Alibaba Group Holding Ltd., the world’s largest e-commerce company; Adobe Systems Inc., a leader in both the content creation and editing market and the emerging digital marketing software space; Twenty-First Century Fox Inc., a global leader in sports, news and entertainment programming and Whole Foods Market Inc., a leading retailer of natural and organic foods. Over the same time period, we eliminated four positions: Allergan Inc., Intuitive Surgical Inc., Starbucks Corp. and Ulta Salon Cosmetics & Fragrance Inc.
While its core business continued to perform well, Allergan recently encountered some product development delays and regulatory changes that we believe may impair its long-term growth potential. The increased risks and challenges to growth presented by these setbacks, and our belief that Allergan’s core business is beginning to mature, have reduced our conviction in the company’s fit with our six investment criteria. As a result, Allergan was sold.
Starbucks was sold because we believe it is unlikely to meaningfully outperform the market over the Fund’s investment horizon. The Fund has owned the company for nearly 13 years. Over that time it has grown, while more than doubling its store base via expansion across the U.S. and penetration of global geographies. Concurrently, it made a number of promising acquisitions and grew its consumer packaged goods business with products like Starbucks-branded K-Cups and Starbucks Refreshers. While we expect the company will continue to grow for years to come, we do not believe the pace will be as rapid as in the past. When we compare Starbucks to other opportunities, we believe there are others earlier in their growth lifecycle with better risk-return profiles. As a result, we sold Starbucks from the Fund.
We sold Intuitive Surgical, the leader in robotic surgical systems because we believe the company’s core business is maturing and cannot sustain above-average earnings growth over the Fund’s five-year investment horizon. Slowing procedure growth in its core business and lack of conviction in its development of meaningful future growth drivers led to the decision to sell Intuitive from the Fund.
Ulta was sold because we determined there were more attractive opportunities elsewhere, among both current holdings and new opportunities. Additionally, we no longer think Ulta’s characteristics are strong enough to deserve a position in our conviction-weighted and concentrated portfolio.
Outlook
While we certainly pay attention to the markets and the economy, our approach to investing is not influenced by market momentum or economic forecasts. Instead, we continue to focus on identifying leading growth businesses that are often the beneficiaries of key secular trends. We believe secular trends stand out among the many factors driving long-term, above-average earnings growth. These trends, which are distinct from cyclical
| 32 |
Management's Discussion of Fund Performance (Unaudited) (Continued)
economic factors, provide select industries and businesses with powerful structural tailwinds that may enhance the sustainability of the businesses’ growth and last for five or more years. This is one of the reasons we believe maintaining an investment horizon that looks out five years, as opposed to focusing on short-term stock price movements, is vital to our process.
While understanding the factors that influence the short-term performance of the Fund’s holdings is important, we believe it is critical that we maintain conviction in the long-term growth drivers for the entire portfolio and to ensure that each business continues to meet our six investment criteria. As truly active investors, we build the Fund’s portfolio one business at a time and expect stock selection, as opposed to tactical adjustments or sector allocation, to remain the primary source of value-add over complete market cycles.
The Fund’s sector allocations are a residual of our bottom-up, fundamental approach that typically lead us to innovative businesses that are creating new or disrupting existing markets, and/or benefiting from powerful secular tailwinds. Our approach to investment research, portfolio construction and risk management results in a Fund that we believe is diversified across industries and businesses at different stages of the growth lifecycle. We expect to continue to be overweight key growth sectors, including consumer, life sciences and technology, and underweight highly-cyclical sectors such as energy, materials and financials.
1 Beta is a measure of the volatility of a portfolio relative to its benchmark.
| 33 |
Management's Discussion of Fund Performance (Unaudited) (Continued)
Comparison of the Change in Value of a $10,000 Investment in the
Touchstone Sands Capital Select Growth Fund - Class A* and the Russell 1000® Growth Index
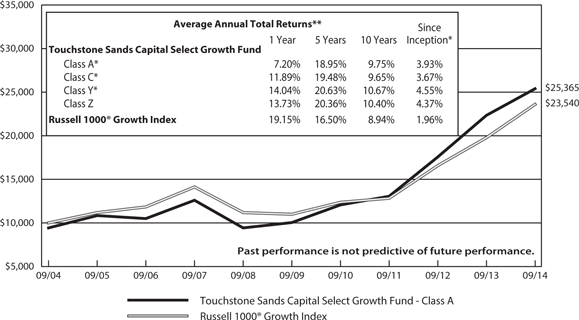
| * | The chart above represents performance for the Class A shares only, which will vary from the performance of Class C shares, Class Y shares and Class Z shares based on the differences in loads and fees paid by shareholders in the different classes. The initial public offering of the Class Z shares commenced on August 11, 2000. The initial public offering of Class Y shares commenced operations on August 27, 2004 and the initial public offering of Class A shares and Class C commenced on November 15, 2010. Class A and Class C shares performance information is calculated using the historical performance of Class Z shares for the periods prior to November 15, 2010 and Class Y shares performance information is calculated using the historical performance of Z shares for the periods prior to August 27, 2004. The returns have been restated for sales charges and for fees applicable to Class A, Class C and Class Y shares. The Russell 1000® Growth Index's returns are based on the inception date of the Fund. |
| ** | The average annual total returns shown above are adjusted for maximum applicable sales charges, if applicable. The maximum offering price per share of Class A shares is equal to the net asset value (“NAV”) per share plus a sales load equal to 6.10% of the NAV (or 5.75% of the offering price). Class C shares are subject to a contingent deferred sales charge (“CDSC”) of 1.00%. The CDSC will be assessed on an amount equal to the lesser of (1) the NAV at the time of purchase of the shares being redeemed or (2) the NAV of such shares being redeemed if redeemed within a one-year period from date of purchase. Class Y shares and Class Z shares are not subject to sales charges. |
The performance of the above Fund does not reflect the deduction of taxes that a shareholder would pay on Fund distributions or the redemption of Fund shares.
Note to Chart
The Russell 1000® Growth Index measures the performance of those Russell 1000 companies with higher price-to-book ratios and higher forecasted growth values.
The Frank Russell Company (FRC) is the source and owner of the data contained or reflected in this material and all trademarks and copyrights related thereto. The material may contain confidential information and unauthorized use, disclosure, copying, dissemination or redistribution is strictly prohibited. This is a Touchstone Investments presentation of the data, and FRC is not responsible for the formatting or configuration of this material or for any inaccuracy in the presentation thereof.
| 34 |
Management's Discussion of Fund Performance (Unaudited)
Touchstone Small Cap Core Fund
Sub-Advised by The London Company
Investment Philosophy
The Touchstone Small Cap Core Fund seeks capital appreciation by investing primarily in common stocks of U.S. companies with small market capitalizations. The Fund utilizes a bottom-up security selection process that screens potential investments against a proprietary quantitative model for return on capital, earnings to enterprise value ratio, and free cash flow yield. The goal is to purchase financially stable companies that are believed to consistently generate high returns on unleveraged operating capital, are run by shareholder-oriented management and are trading at a discount to their respective private market values.
Fund Performance
The Touchstone Small Cap Core Fund (Class A Shares) outperformed its benchmark, the Russell 2000® Index, for the 12-month period ended September 30, 2014. The Fund’s total return was 8.80 percent (excluding the maximum sales charge) while the benchmark’s total return was 3.93 percent.
Market Environment
Over the past 12 months, the equity markets posted positive results with stocks of large-capitalization companies outperforming the stocks of small-capitalization companies. We surmise this was the result of a confluence of factors including the narrowing of valuation differentials between small- and large-cap stocks and greater incremental profit margin improvement within the large caps. In general, large-cap, lower quality, lower beta1 cyclical and value-oriented styles were all negative attributes which negatively influenced the trailing 12-month return of small cap stocks. Small caps exhibited similar patterns at times, but overall were tilted toward the defensive pockets of the market, as investors sought to avoid risk. Market leadership varied substantially over the period as well.
From a macroeconomic perspective, the U.S. economy strengthened due to stronger durable goods orders, stable/improving housing and rising consumer confidence. These factors helped drive the market higher. In recent years, corporate America excelled in maximizing productivity per worker and increasing profitability margins. Balance sheets are strong and the low interest rate environment provides an opportunity for many companies to improve their capital structure for the benefit of shareholders. While valuations are not cheap, we remain optimistic due to the strength of corporate balance sheets, low dividend payout ratios, acceleration in mergers and acquisitions (M&A) activity and the low cost of debt.
For the trailing 12-month period, small caps were led higher by the more defensive Utilities and Health Care sectors while the more cyclical Energy and Consumer Discretionary sectors detracted from performance.
Portfolio Review
Over the 12-month period, the Fund’s relative outperformance was driven entirely by positive stock selection. Sector allocation was negative with the Fund’s overweight to the Consumer Discretionary sector and underweight to the Health Care sector detracting the most. From a stock-specific perspective, the Fund’s holdings in the Consumer Discretionary, Industrials, Materials, Information Technology and Health Care sectors contributed to performance. The Fund’s holdings in the Financials and Energy sectors slightly offset these gains.
The Fund’s top performing stocks relative to the benchmark for the period were Old Dominion Freight Line, Inc. (Industrials sector), Tenet Healthcare Corp. (Health Care sector), NewMarket Corp. (Materials sector), Deckers Outdoor Corp. (Consumer Discretionary sector) and Conversant, Inc. (Information Technology sector). Old Dominion Freight steadily increased as the company continued to post strong results driven by its service-focused model. Margins continued to improve and the balance sheet remained strong. Tenet Healthcare continued its
| 35 |
Management's Discussion of Fund Performance (Unaudited) (Continued)
strong performance as hospital shares rallied reflecting the positive impact of Medicaid expansion on the uninsured population. This led to greater patient volume and a significant reduction in bad debt expense. These factors contributed to the company reporting better than expected quarterly results and raising its guidance for the year. NewMarket rallied early in the year after posting strong volume growth. We were attracted to the potential high returns on capital in this rational oligopoly with a shareholder-oriented, highly-vested management team. Deckers performed well with strong sales and impressive inventory management. The UGG brand continued to grow and both retailers and consumers were excited about new products. Conversant announced it was being acquired by Alliance Data Systems at a premium to where it had been trading.
The largest detractors to performance included Atwood Oceanics Inc. (Energy sector), MRC Global, Inc. (Industrials sector), Sturm Ruger & Co., Inc. (Consumer Discretionary sector), Cabela’s, Inc. (Consumer Discretionary sector) and Pricesmart, Inc. (Consumer Staples sector). Atwood Oceanics declined due to weakness in offshore drilling rig day rates. We believe Atwood can weather the cycle due to its recent modernization of its rig fleet, strength of its relationships with end users and a disciplined, shareholder-oriented management team. MRC Global declined following weaker than expected near-term guidance due to weaker line pipe pricing. In addition, the decrease in oil prices also negatively impacted the stock. We remain attracted to the company’s leading position in the industry and diversified end markets. Sturm Ruger declined as investors reacted to a slowdown in gun sales after significant strength in recent years. Sturm Ruger is a leading operator with high returns and operating margins. Cabela’s underperformed with the near-term volatility of gun and ammunition sales. After strong demand last year, the gun and ammunition category normalized, which resulted in negative comparables for the company. We are attracted to the differentiated store format, significant room for store growth and attractive credit business. Pricesmart detracted from performance as its price reflected concerns about slowing same store sales and a slight decline in the membership renewal rate. We believe the company’s differentiated store format has room to increase the number of stores from about 35 to more than 100 across Latin America and the Caribbean. We believe the stores’ atmosphere and low prices should lead to a strong renewal rate.
Over the past 12 months, the Fund initiated new positions in Olin Corp. (Materials sector), MRC Global, Inc.(Industrials sector), Orbital Sciences Corp. (Industrials sector) and Dana Holding Corp. (Consumer Discretionary sector).
To fund purchases, the Fund sold its positions in Alleghany Corp. (Financials sector), Nu Skin Enterprises Inc. (Consumer Staples sector), Energizer Holdings, Inc. (Consumer Staples sector), Hatteras Financial Corp. (Financials sector) and Martin Marietta Materials, Inc. (Materials sector). Alleghany, Nu Skin and Energizer sales reflected the growth in market cap over the years. Hatteras was sold due to our lack of conviction in downside protection for the stock if interest rates rise significantly. The Martin Marietta sale followed the recent rally in the stock leading to a market cap of close to $6B. It is too large for the Fund’s portfolio, in our view. The Fund had a roughly 1% position in the stock and we were not comfortable taking it to a full position. We trimmed the Fund’s positions in Eaton Vance Corp. (Financials sector), Deckers Outdoor Corp. (Consumer Discretionary sector) and Ablemarle Corp. (Materials sector) to make room for a high conviction idea.
Outlook
Our investment focus is at a company-specific level and not from a top-down approach. While we do not attempt to forecast the future, we remain fairly optimistic. Corporate America is in good shape with high operating margins and strong balance sheets.The economic recovery continued with improvement in employment, capital investment, and a generally benign interest rate and inflation outlook. We expect the slow growth environment to continue and believe stocks could be more volatile in the future. Our approach is to own companies with strong returns on capital and flexibility to enhance shareholder value using the balance sheet. We believe the Fund is positioned well for a wide variety of environments.
| 36 |
Management's Discussion of Fund Performance (Unaudited) (Continued)
Organic growth remains challenging, and we are seeing more companies resort to M&A as a use of excess cash. In a slow growth, low-financing cost world, more transactions have made better economic sense and actually have been able to deliver accretion to more of the merged entity’s results. In addition, positive response by the market only validates the strategy where transactions begat more transactions, providing a powerful corporate impetus to jump on the bandwagon. While there is action occurring across the board, activity has clustered in those industries with some shared traits of maturing business models generating high free cash-flow but with diminishing growth prospects in the global economy.
Low interest rates and relatively high equity risk premiums enable companies to increase shareholder value by adjusting the capital structure of the company. Separately, with elevated cash levels on corporate balance sheets and dividend payout ratios near historic lows, we expect investors to reward companies that wisely deploy capital including higher dividends, share repurchases and M&A transactions. We believe the Fund is conservatively positioned for a slow growth environment that rewards strong capital allocation and we expect to participate in its share of deals going forward.
1 Beta is a measure of the volatility of a portfolio relative to its benchmark.
| 37 |
Management's Discussion of Fund Performance (Unaudited) (Continued)
Comparison of the Change in Value of a $10,000 Investment in the
Touchstone Small Cap Core Fund - Class A* and the Russell 2000® Index
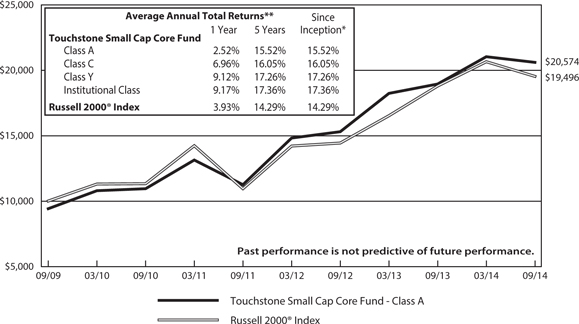
| * | The chart above represents performance for Class A shares only, which will vary from the performance of Class C shares, Class Y shares and Institutional Class shares based on the differences in loads and fees paid by shareholders in the different classes. The inception date of the Fund was September 30, 2009. Russell 2000® Index's returns are based on the inception date of the Fund. |
| ** | The average annual total returns shown above are adjusted for maximum applicable sales charges, if applicable. The maximum offering price per share of Class A shares is equal to the net assets value (“NAV”) per share plus a sales load equal to 6.10% of the NAV (or 5.75% of the offering price). Class C shares of the Funds are subject to a contingent deferred sales charge (“CDSC”) of 1.00%. The CDSC will be assessed on an amount equal to the lesser of (1) the NAV at the time of purchase of the shares being redeemed or (2) the NAV of such shares being redeemed if redeemed within a one-year period from the date of purchase. Class Y shares and Institutional Class Shares are not subject to sales charges. |
The performance of the above Fund does not reflect the deduction of taxes that a shareholder would pay on Fund distributions or the redemption of Fund shares.
Note to Chart
The Russell 2000® Index measures the performance of the small-cap segment of the U.S. equity universe.
The Frank Russell Company (FRC) is the source and owner of the data contained or reflected in this material and all trademarks and copyrights related thereto. The material may contain confidential information and unauthorized use, disclosure, copying, dissemination or redistribution is strictly prohibited. This is a Touchstone Investments presentation of the data, and FRC is not responsible for the formatting or configuration of this material or for any inaccuracy in the presentation thereof.
| 38 |
Management's Discussion of Fund Performance (Unaudited)
Touchstone Small Cap Value Fund
Sub-Advised by DePrince, Race & Zollo, Inc.
Investment Philosophy
The Touchstone Small Cap Value Fund seeks long-term capital growth by investing primarily in common stocks of small-cap companies that appear to be trading below their intrinsic value and have the potential for growth. The Fund utilizes a bottom-up security selection process that consists of three factors: dividend yield, low valuation, and a fundamental catalyst.
Fund Performance
The Touchstone Small Cap Value Fund (Class A Shares) underperformed its benchmark, the Russell 2000® Value Index, for the 12-month period ended September 30, 2014. The Fund’s total return was 3.19 percent (excluding the maximum sales charge) while the benchmark’s total return was 4.13 percent.
Market Environment
After two consecutive years of double-digit returns for U.S. small-cap equities, performance for the asset class was muted during the period. Volatility returned to the forefront as investors grappled with the gradually improving domestic economy and the geopolitical turmoil overseas. For the first three quarters of the period, the benchmark reflected the same speculation and excessive risk-taking that dominated the markets over the previous two years. Dividend-paying stocks lagged as speculative stocks sharply rallied toward the end of June. Beginning in July 2014, we saw investors “de-risk” due to worries about historically high valuations, slowing global economies and the upcoming potential end to the U.S. Federal Reserve Board’s accommodative monetary policy. As a result, speculative, non-dividend paying stocks experienced a complete reversal in market leadership, underperforming their higher-quality, dividend-paying counterparts during the fourth quarter.
Portfolio Review
Stock selection in the Information Technology sector was the largest contributor to relative performance. Hittite Microwave Corp., Tessera Technologies Inc., Blackbaud, Inc. and Micrel Inc. were among the top performing stocks. Hittite, a high performance integrated circuit manufacturer, was a strong performer after accepting a premium takeover offer. Tessera reported a long awaited patent license pact with Micron Technology Inc. which boosted the stock. Blackbaud, a software provider to non-profit organizations, exceeded earnings expectations due to organic revenue growth. Blackbaud’s management raised its forward guidance and remained focused on operational execution and growth investments. Micrel, a manufacturer of analog power integrated circuits used in a wide variety of electronics, benefited from increased research and development spending and its new product momentum, particularly within the automotive industry, which translated into outsized earnings growth. Half of Micrel’s business is also tied to industrial end markets, which have benefited from improving U.S. manufacturing.
Stock selection within the Energy sector also contributed to performance. Delek US Holdings Inc. and Western Refining Inc. were two of the top performing stocks during the period. These U.S. refiners benefited from more favorable trading due to higher inventories of shale oil, which improved their profitability. Management also unlocked shareholder value through share repurchase programs, dividend growth and transferring assets to a Master Limited Partnership structure.
During the period, interest rates declined and negatively impacted the Fund’s bank holdings, such as Susquehanna Bancshares Inc. and detracted from performance. This Pennsylvania-based bank traded lower on weaker net interest margin and higher operating expenses earlier in the year. However, management is focused on improving balance sheet liquidity and optimizing the loan portfolio mix by increasing commercial & industrial and small business loans. The Fund’s underweight to real estate investment trusts (REITs) also hurt relative performance as these securities benefited from lower interest rates. We are comfortable with the positioning as REITs continue to trade at lofty valuations. The Fund’s bottom-up fundamental research and valuation methodology continue to favor high-quality regional banks and thrifts with healthy balance sheets.
| 39 |
Management's Discussion of Fund Performance (Unaudited) (Continued)
Stock selection in the Consumer Discretionary sector detracted from performance despite strong results from Abercrombie & Fitch Co. and Men’s Wearhouse. American Eagle Outfitters was negatively impacted by harsh winter weather and a highly promotional environment. However, the teen retailer recently reported better than expected earnings driven by improved gross margins. Management reported right-sizing its product lineup, reducing costs and closing underperforming stores. The stock reached our relative valuation target and we sold the stock from the Fund’s portfolio. Ethan Allen Interiors Inc., a residential furniture manufacturer/retailer, underperformed on disappointing orders in a challenging retail environment. Management continued to focus on ways to increase in-store and on-line traffic through new marketing initiatives, such as the Ethan Allen Express line and its new “On-Demand” initiative, which reduces delivery times to buyers. The Fund continues to hold the stock as we believe the company’s vertical integration should also lead to increased operating leverage and earnings growth as sales improve.
Several stocks from a variety of sectors also detracted from performance. GulfMark Offshore Inc. and Tidewater Inc. (both from the Energy sector), providers of marine support services to the offshore energy exploration industry, underperformed. We expect to see a ramp in offshore oil rig deliveries later this year, which should result in substantial earnings power for both companies in 2015. Dean Foods Co. (Consumer Staples sector), the leading producer of dairy products, underperformed as milk-related commodity prices remained unseasonably high. While the company continued to focus on cost cutting initiatives and market share gains, we believe milk and butter prices should reverse in coming months and drive profitability. General Cable Corp. (Industrials sector), a leading global wire and cable manufacturer, underperformed due to reduced earnings guidance and weakness in metals pricing. While management remains focused on aggressive restructuring efforts and pursuing strategic alternatives, we are opportunistically reducing the Fund’s position given recent disappointments.
The Fund has maintained a cyclical positioning throughout the year. While we executed our discipline and took profits in several cyclical stocks as they outperformed, we replaced them with other cyclical companies that we believed were undervalued. We continue to find what we believe are attractive opportunities in the Industrials and Financials sectors. The Fund maintains little exposure to defensive sectors, such as Health Care and Utilities.
Outlook
We believe the recent pressure on commodity prices, particularly oil, should provide a more favorable environment for consumer spending and the overall U.S. economy. We expect this to have a positive effect on the Fund’s overweight positions in banks, retail and industrial holdings. As bottom-up investors, we will continue to examine company-specific exposures to oil and gas along with a geographical sales mix.
Concerns of higher interest rates and their impact on small-cap stocks drove valuations lower in September, yet they still remain elevated. If rates rise because the economy is improving, we believe the Fund’s bank holdings and cyclical bias are positioned properly. While a strong dollar creates a less favorable export environment, 80% of small-cap revenues are derived domestically. Therefore, the Fund may not be greatly impacted.
Looking ahead, our commitment to undervalued, dividend-paying companies with improving fundamentals should prove rewarding in an environment of more normalized rates of return as investors focus on third quarter corporate earnings reports and a healthy U.S. economy. While we remain cautiously optimistic on small-cap valuations, we believe the portfolio is well positioned to benefit from a growing U.S. economy and strengthening corporate fundamentals.
Dividend-paying investments may not experience the same price appreciation as non-dividend paying instruments, dividend-issuing companies may choose not to pay a dividend, or the dividend may be less than what is anticipated.
| 40 |
Management's Discussion of Fund Performance (Unaudited) (Continued)
Comparison of the Change in Value of a $10,000 Investment in the
Touchstone Small Cap Value Fund - Class A* and the
Russell 2000® Value Index
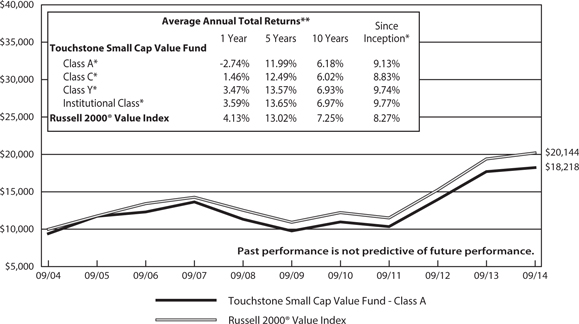
| * | The chart above represents performance for the Class A shares only, which will vary from the performance of Class C shares, Class Y shares and Institutional Class shares based on the differences in loads and fees paid by shareholders in the different classes. The initial public offering of Class Z shares commenced on March 4, 2002. On June 10, 2011, Class Z shares were converted to Class A shares and performance for periods prior to the date of conversion represents the performance of Class Z shares. The initial public offering of the Class C, Class Y, and Institutional Class shares commenced on March 1, 2011. The Class A shares performance information is calculated using the historical performance of Class Z shares for periods prior to June 10, 2011 and Class C, Class Y and Institutional Class shares performance information is calculated using the historical performance of Class Z shares for periods prior to March 1, 2011. The returns have been restated for sales charges and for fees applicable for Class A, Class C, Class Y and Institutional Class shares. Russell 2000® Value Index's returns are based on the inception date of the Fund. |
| ** | The average annual total returns shown above are adjusted for maximum applicable sales charges, if applicable. The maximum offering price per share of Class A shares is equal to the net assets value (“NAV”) per share plus a sales load equal to 6.10% of the NAV (or 5.75% of the offering price). Class C shares of the Funds are subject to a contingent deferred sales charge (“CDSC”) of 1.00%. The CDSC will be assessed on an amount equal to the lesser of (1) the NAV at the time of purchase of the shares being redeemed or (2) the NAV of such shares being redeemed if redeemed within a one-year period from the date of purchase. Class Y shares and Institutional Class Shares are not subject to sales charges. |
The performance of the above Fund does not reflect the deduction of taxes that a shareholder would pay on Fund distributions or the redemption of Fund shares.
Note to Chart
The Russell 2000® Value Index measures the performance of those Russell 2000 companies with lower price-to-book ratios and lower forecasted growth values.
The Frank Russell Company (FRC) is the source and owner of the data contained or reflected in this material and all trademarks and copyrights related thereto. The material may contain confidential information and unauthorized use, disclosure, copying, dissemination or redistribution is strictly prohibited. This is a Touchstone Investments presentation of the data, and FRC is not responsible for the formatting or configuration of this material or for any inaccuracy in the presentation thereof.
| 41 |
Management's Discussion of Fund Performance (Unaudited)
Touchstone Total Return Bond Fund
Sub-Advised by EARNEST Partners LLC
Investment Philosophy
The Touchstone Total Return Bond Fund seeks current income. Capital appreciation is a secondary goal. The Fund invests primarily in fixed income securities or sectors that are considered undervalued for their risk characteristics.
Fund Performance
The Touchstone Total Return Bond Fund (Class A Shares) outperformed its benchmark, the Barclays U.S. Aggregate Bond Index for the 12-month period ended September 30, 2014. The Fund’s total return was 4.53 percent (excluding the maximum sales charge) while the benchmark’s total return was 3.96 percent.
Market Environment
During the past year, economic growth in the U.S. strengthened and real growth seems to be underway. The unemployment rate fell and consumer confidence rose. Home prices increased during the period as well. Inflation remained a muted concern, staying under the U.S. Federal Reserve Board’s (Fed) goal. These macroeconomic forces in aggregate resulted in the Fed’s announcement to end its quantitative easing program.
Despite the consensus calling for a rise in rates during 2014, long-term interest rates declined during the period. The best performing sectors within the fixed income universe have been long-term U.S. Treasury securities and high yield corporate credits.
Five years of low rates in the U.S. have led to an investor base that is starved for yield. Investors responded by aggressively purchasing non-Treasury securities, resulting in excess returns across nearly every sector. The need to reinvest coupons, the Fed’s continued market presence in addition to refinancing efforts by corporations helped bolster demand for and drive performance.
Portfolio Review
It was a good period to be invested in non-Treasury securities, and the Fund’s performance reflects this positioning. As macroeconomic events helped drive long rates lower, investors reached for yield in the same sectors in which the Fund was overweight.
To the extent the Fund invested in Treasuries, it was invested in the portion of the curve that rallied the most. The Fund used long-term U.S.Treasury SeparateTrading of Registered Interest and Principal Securities (STRIPS) for exposure to the longer-end of the yield curve. This position was the Fund’s strongest performer. Investments in corporate bonds, Title XI, structured settlements, municipal bonds and other agencies such as the Tennessee Valley Authority also contributed to performance. Mortgage-Backed Securities (MBS) in both the single- and multi-family spaces, and rate reduction bonds contributed to performance as well. The Fund’s allocation to Small Business Administration Development Company Participation Certificates underperformed.
Outlook
The Fund’s investment in high-quality non-Treasury securities seeks to provide additional yield, which may help overall performance in times of high volatility. Geopolitical and anticipated Fed-driven activities could add volatility to the market. Persistent low rates in places such as Europe and Japan could drive demand for the higher yielding products in which the Fund invests. A rapid increase in yields of non-Treasury securities versus U.S. Treasuries remains our greatest concern however, the Fund’s allocation to high-quality bonds with features such as government guarantees could help to offset this potential risk. We believe the Fund is positioned well for this environment.
| 42 |
Management's Discussion of Fund Performance (Unaudited) (Continued)
We continue to make selective additions to the Fund’s portfolio and remain bottom-up, fundamentally driven bond investors seeking securities which offer a yield advantage without sacrificing quality. By remaining duration and yield curve neutral, we believe that earning the additional yield offered by these bonds may be a consistent and repeatable way to generate consistent returns over the investment cycle.
| 43 |
Management's Discussion of Fund Performance (Unaudited) (Continued)
Comparison of the Change in Value of a $10,000 Investment in the
Touchstone Total Return Bond Fund - Class A* and the
Barclays U.S. Aggregate Bond Index

| * | The chart above represents performance for Class A shares only, which will vary from the performance of Class C shares, Class Y shares and Institutional Class shares based on the differences in loads and fees paid by shareholders in the different classes. Class Y shares began operations on November 15, 1991, Class A shares began operations on August 16, 2010, and Class C and Institutional Class shares began operations on August 1, 2011. The Class A shares performance information is calculated using the historical performance of Class Y for periods prior to August 16, 2010 and Class C and Institutional Class shares performance information is calculated using the historical performance of Class Y for periods prior to August 1, 2011. The returns have been restated for sales charges and for fees applicable to Class A, Class C and Institutional Class shares. The Barclays U.S. Aggregate Bond Index's returns are based on the inception date of the Fund. |
| ** | The average annual total returns shown above are adjusted for maximum applicable sales charges, if applicable. The maximum offering price per share of Class A shares is equal to the net asset value (“NAV”) per share plus a sales load equal to 4.99% of the NAV (or 4.75% of the offering price). Class C shares are subject to a contingent deferred sales charge (“CDSC”) of 1.00%. The CDSC will be assessed on an amount equal to the lesser of (1) the NAV at the time of purchase of the shares being redeemed or (2) the NAV of such shares being redeemed if redeemed within a one-year period from date of purchase. Class Y shares and Institutional Class shares are not subject to sales charges. |
The performance of the above Fund does not reflect the deduction of taxes that a shareholder would pay on Fund distributions or the redemption of Fund shares.
Note to Chart
The Barclays U.S. Aggregate Bond Index is an unmanaged index comprised of U.S. investment grade, fixed rate bond market securities, including government, government agency, corporate and mortgage-backed securities between one and ten years.
| 44 |
Management's Discussion of Fund Performance (Unaudited)
Touchstone Ultra Short Duration Fixed Income Fund
Sub-Advised by Fort Washington Investment Advisors, Inc.
Investment Philosophy
The Ultra Short Duration Fixed Income Fund seeks maximum total return consistent with the preservation of capital by primarily investing in a diversified portfolio of fixed income securities of different maturities, including U.S.Treasury securities, U.S. government agency and U.S. government-sponsored enterprise securities, corporate bonds, mortgage-backed securities, commercial mortgage-backed securities, asset-backed securities and municipal bonds and cash equivalent securities including repurchase agreements and commercial paper. While the Fund may invest in securities of any maturity or duration, interest rate risk is managed by maintaining an effective duration of one year or less under normal market conditions.
Fund Performance
The Touchstone Ultra Short Duration Fixed Income Fund (Class A Shares) outperformed its benchmarks, the BofA Merrill Lynch 3-Month U.S. Treasury Bill Index and the BofA Merrill Lynch 1-Year U.S. Treasury Note Index for the 12-month period ended September 30, 2014. The Fund’s total return was 0.92 percent (excluding the maximum sales charge) while the total returns of its benchmarks were 0.05 percent and 0.26 percent, respectively.
Market Environment
The Fund’s fiscal year was characterized by economic uncertainty domestically and abroad. Slow economic growth in the first quarter was attributed to poor weather. The second quarter rebounded giving way to stronger third quarter economic growth fueled by business capital spending.
Improvement in U.S. economic activity is apparent from indicators for the manufacturing and services sectors and for the labor market, where the unemployment rate has fallen since the beginning of the year. Recent weakness in Europe and Asia, and fears of an Ebola pandemic weighed heavily on the markets.
We expect the economy will continue to grow and the U.S. Federal Reserve Board (Fed) will commence tightening monetary policy in mid- to late-2015. The Fed indicated it would look at a host of labor market indicators in making its determination, as well as taking inflation into account.
The Treasury curve flattened significantly against this backdrop with long-term interest rates moving down and intermediate rates upward.This reaction was consistent with a market believing growth to be strong enough to encourage the Fed to remove a measure of accommodation, but not strong enough to trigger inflation. Risk premiums performed well with spreads on all non-Treasury sectors of fixed income tightening meaningfully.
Portfolio Review
The Fund remains moderately underweight duration and overweight non-Treasury sectors. We recognize that weakness in Europe has dragged yields to record lows there and is likely to constrain the rise in U.S. yields. Growth strong enough to allow the Fed to begin removing accommodative monetary policies, but not strong enough to ignite inflation fears, provided a favorable environment for short duration, risk-oriented assets. Spread tightening in all non-Treasury sectors was a significant driver of excess returns for the Fund.
Sector allocations saw moderate changes during the year. Agency Residential Mortgage Backed Securities (RMBS) exposure continued to decline to a historic low point, reflecting the volatility associated with the Fed’s quantitative easing program and the generally poor relative value in the sector. We continue to find value in Asset Backed Securities (ABS) and as a result, the Fund’s exposure has increased. Commercial Mortgage Backed Securities (CMBS) exposure continues to decline as attractive opportunities have been limited.
Portfolio duration at the end of the 12-month period was in line with our target duration. While very short-term rates were largely unchanged, anchored by a low Fed funds rate, yields in the 2-5 year part of the curve climbed. Exposure to longer key rate durations likely experienced increased price volatility. During the period, we worked to reduce nominal duration and price sensitivity to changing spreads in an effort to further reduce the Fund’s
| 45 |
Management's Discussion of Fund Performance (Unaudited) (Continued)
risk profile. To that end, the Fund has been moving away from a more bar-belled maturity profile to a more bell-shaped maturity distribution. The Fund performed well in a gradual, but consistently rising, interest rate environment.
Outlook
Evidence of a pickup in economic activity has been supported by indicators for the manufacturing and services sectors and for the labor market, where weekly jobless claims recently have fallen below pre-crisis levels. We believe the Fed will commence tightening monetary policy around the middle of 2015. Against this backdrop, we believe the Fund is well positioned given its strategy of targeting a shorter duration with a concentrated maturity distribution, and overweighting non-government securities, with exposure to select ABS sectors.
The Fund employs a strategy that places greater emphasis on structured securities (CMBS, ABS, agency Mortgage Backed Securities [MBS] and non-agency MBS). The strategy seeks to generate excess returns by investing a portion of its assets in high-quality, higher-yielding sectors. Its focus on low duration securities helps to mitigate the higher volatility of these sectors.
We believe that by reducing the Fund’s exposure to longer-duration securities and increasing its exposure to floating rate securities, the Fund’s sensitivity to changing rates would decrease and position the portfolio for a rising interest rate environment. However, exposure to securities with higher liquidity premiums, which tend to experience greater volatility, has increased. We believe the potential increase in volatility is mitigated by lower spread durations. We believe that taking liquidity risk in securities maturing in less than one year is a better strategy compared to taking credit risk in a similar duration security.
| 46 |
Management's Discussion of Fund Performance (Unaudited) (Continued)
Comparison of the Change in Value of a $10,000 Investment in the
Touchstone Ultra Short Duration Fixed Income Fund - Class A*,
the BofA Merrill Lynch 3-Month U.S. Treasury Bill Index
and the BofA Merrill Lynch 1-Year U.S. Treasury Note Index
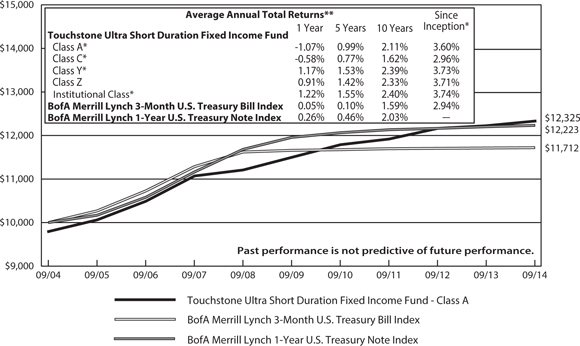
| * | The chart above represents performance for the Class A shares only, which will vary from the performance of Class C shares, Class Y shares, Institutional Class shares and Class Z shares based on the differences in loads and fees paid by shareholders in the different classes. The initial public offering of the Class Z shares commenced on March 1, 1994. The initial public offering of Class A, Class C , Class Y and Institutional Class shares commenced on April 16, 2012. Class A, Class C, Class Y and Institutional Class shares performance information is calculated using the historical performance of Class Z shares for the periods prior to April 16, 2012. The returns have been restated for sales charges and for fees applicable to Class A, Class C, Class Y and Institutional Class. The Bank of America Merrill Lynch 3-month U.S. Treasury Bill Index returns are based on the inception date of the Fund. |
| ** | The average annual total returns shown above are adjusted for maximum applicable sales charges, if applicable. The maximum offering price per share of Class A shares is equal to the net asset value (“NAV”) per share plus a sales load equal to 2.04% of the NAV (or 2.00% of the offering price). Class C shares are subject to a contingent deferred sales charge (“CDSC”) of 1.00%. The CDSC will be assessed on an amount equal to the lesser of (1) the NAV at the time of purchase of the shares being redeemed or (2) the NAV of such shares being redeemed if redeemed within a one-year period from date of purchase. Class Y shares, Class Z shares, and Institutional Class shares are not subject to sales charges. |
The performance of the above Fund does not reflect the deduction of taxes that a shareholder would pay on Fund distributions or the redemption of Fund shares.
Note to Chart
The BofA Merrill Lynch 3-Month U.S. Treasury Bill Index is an unmanaged index of Treasury securities maturing in 90 days that assumes reinvestment of all income.
BofA Merrill Lynch 1-Year U.S. Treasury Note Index is an unmanaged index comprised of a single issue purchased at the beginning of the month and held for a full month. The issue selected at each month-end rebalancing is the outstanding two-year Treasury Note Bill that matures closest to, but, not beyond one year from the rebalancing date.
| 47 |
Tabular Presentation of Portfolios of Investments (Unaudited)
September 30, 2014
| Touchstone Arbitrage Fund | ||||
| Sector Allocation* | (% of Net Assets) | |||
| Long Positions | ||||
| Common Stocks | ||||
| Information Technology | 18.5 | % | ||
| Consumer Discretionary | 15.7 | |||
| Financials | 14.9 | |||
| Industrials | 8.8 | |||
| Telecommunication Services | 7.1 | |||
| Health Care | 7.0 | |||
| Materials | 4.5 | |||
| Utilities | 4.3 | |||
| Energy | 4.1 | |||
| Consumer Staples | 1.8 | |||
| Preferred Stock | 1.6 | |||
| Exchange Traded Funds | 1.5 | |||
| Fixed Income Securities | 6.7 | |||
| Investment Fund | 7.3 | |||
| Cash Collateral for Securities Sold | 36.0 | |||
| Short and Written Options | ||||
| Other Assets/Liabilities (Net) | (2.4 | ) | ||
| 137.4 | ||||
| Short Positions | ||||
| Common Stocks | ||||
| Information Technology | (8.1 | ) | ||
| Financials | (7.5 | ) | ||
| Consumer Discretionary | (6.6 | ) | ||
| Telecommunication Services | (4.6 | ) | ||
| Health Care | (4.5 | ) | ||
| Energy | (2.2 | ) | ||
| Industrials | (1.6 | ) | ||
| Materials | (1.2 | ) | ||
| Utilities | (0.7 | ) | ||
| Exchange Traded Fund | (0.3 | ) | ||
| Written Options | (0.1 | ) | ||
| (37.4 | ) | |||
| Total | 100.0 | % | ||
| Touchstone Emerging Markets Equity Fund | ||||
| Sector Allocation* | (% of Net Assets) | |||
| Financials | 24.0 | % | ||
| Consumer Discretionary | 16.3 | |||
| Energy | 12.2 | |||
| Consumer Staples | 12.0 | |||
| Information Technology | 11.4 | |||
| Materials | 7.2 | |||
| Telecommunication Services | 6.5 | |||
| Health Care | 4.2 | |||
| Industrials | 3.5 | |||
| Utilities | 1.6 | |||
| Investment Funds | 1.8 | |||
| Other Assets/Liabilities (Net) | (0.7 | ) | ||
| Total | 100.0 | % | ||
| Touchstone Global Real Estate Fund | ||||
| Sector Allocation* | (% of Net Assets) | |||
| Diversified | 20.8 | % | ||
| Retail | 17.2 | |||
| Specialized | 13.6 | |||
| Office | 13.3 | |||
| Industrial | 10.7 | |||
| Residential | 4.5 | |||
| Mortgage | 4.5 | |||
| Real Estate Operating Companies | 4.4 | |||
| Diversified Financial Services | 3.6 | |||
| Hotels, Resorts & Cruise Lines | 2.1 | |||
| Diversified Real Estate Activities | 1.7 | |||
| Health Care Facilities | 1.6 | |||
| Real Estate Development | 1.0 | |||
| Advertising | 0.8 | |||
| Investment Funds | 5.5 | |||
| Other Assets/Liabilities (Net) | (5.3 | ) | ||
| Total | 100.0 | % | ||
* Sector Classifications are based upon the Global Industry Classification Standard (GICS®).
| 48 |
Tabular Presentation of Portfolios of Investments (Unaudited) (Continued)
| Touchstone International Fixed Income Fund | ||||
| Credit Quality* | (% of Investment Securities) | |||
| AAA/Aaa | 25.9 | % | ||
| AA/Aa | 16.2 | |||
| A/A | 8.7 | |||
| BBB/Baa | 30.7 | |||
| BB/Ba | 7.1 | |||
| B/B | 0.2 | |||
| Not Rated | 11.2 | |||
| Total | 100.0 | % | ||
| Touchstone Merger Arbitrage Fund | ||||
| Sector Allocation** | (% of Net Assets) | |||
| Long Positions | ||||
| Common Stocks | ||||
| Financials | 22.3 | % | ||
| Information Technology | 15.3 | |||
| Consumer Discretionary | 12.5 | |||
| Industrials | 9.1 | |||
| Health Care | 7.3 | |||
| Telecommunication Services | 5.8 | |||
| Materials | 4.5 | |||
| Energy | 4.3 | |||
| Utilities | 3.6 | |||
| Consumer Staples | 1.3 | |||
| Preferred Stock | 1.5 | |||
| Fixed Income Securities | 8.5 | |||
| Exchange Traded Funds | 1.7 | |||
| Investment Fund | 7.9 | |||
| Cash Collateral for Securities Sold | 29.5 | |||
| Short and Written Options | ||||
| Other Assets/Liabilities (Net) | (0.2 | ) | ||
| 134.9 | ||||
| Short Positions | ||||
| Common Stocks | ||||
| Financials | (10.5 | ) | ||
| Information Technology | (7.4 | ) | ||
| Consumer Discretionary | (5.5 | ) | ||
| Health Care | (3.4 | ) | ||
| Telecommunication Services | (3.1 | ) | ||
| Energy | (1.9 | ) | ||
| Industrials | (1.1 | ) | ||
| Materials | (0.9 | ) | ||
| Utilities | (0.5 | ) | ||
| Exchange Traded Fund | (0.5 | ) | ||
| Written Options | (0.1 | ) | ||
| (34.9 | ) | |||
| Total | 100.0 | % | ||
* Credit quality may be rated by Standard & Poor's, Moody's and Fitch. If all three agencies rate the bond, the middle or common rating is used; if two of the agencies rate the bond, the lower rating is used; if one agency rates the bond, that rating is used; if none of the agencies rate the bond, the bond will be classified as not-rated.
** Sector Classifications are based upon the Global Industry Classification Standard (GICS®).
| 49 |
Tabular Presentation of Portfolios of Investments (Unaudited) (Continued)
| Touchstone Mid Cap Fund | ||||
| Sector Allocation* | (% of Net Assets) | |||
| Consumer Discretionary | 29.1 | % | ||
| Information Technology | 14.5 | |||
| Consumer Staples | 12.3 | |||
| Industrials | 11.0 | |||
| Financials | 10.7 | |||
| Materials | 10.0 | |||
| Energy | 6.8 | |||
| Health Care | 4.2 | |||
| Investment Funds | 7.9 | |||
| Other Assets/Liabilities (Net) | (6.5 | ) | ||
| Total | 100.0 | % | ||
| Touchstone Mid Cap Value Fund | ||||
| Sector Allocation* | (% of Net Assets) | |||
| Financials | 23.6 | % | ||
| Consumer Discretionary | 12.0 | |||
| Information Technology | 11.8 | |||
| Industrials | 10.5 | |||
| Health Care | 10.1 | |||
| Consumer Staples | 8.9 | |||
| Utilities | 8.1 | |||
| Energy | 6.7 | |||
| Materials | 6.3 | |||
| Investment Funds | 4.1 | |||
| Exchange Traded Fund | 0.5 | |||
| Other Assets/Liabilities (Net) | (2.6 | ) | ||
| Total | 100.0 | % | ||
| Touchstone Premium Yield Equity Fund | ||||
| Sector Allocation* | (% of Net Assets) | |||
| Energy | 19.7 | % | ||
| Financials | 18.0 | |||
| Health Care | 16.4 | |||
| Information Technology | 15.4 | |||
| Utilities | 10.3 | |||
| Telecommunication Services | 5.4 | |||
| Industrials | 5.1 | |||
| Consumer Discretionary | 4.4 | |||
| Materials | 1.9 | |||
| Investment Fund | 2.1 | |||
| Other Assets/Liabilities (Net) | 1.3 | |||
| Total | 100.0 | % | ||
| Touchstone Sands Capital Select Growth Fund | ||||
| Sector Allocation* | (% of Net Assets) | |||
| Information Technology | 38.0 | % | ||
| Consumer Discretionary | 21.5 | |||
| Health Care | 18.1 | |||
| Energy | 10.6 | |||
| Materials | 3.4 | |||
| Financials | 2.8 | |||
| Consumer Staples | 1.9 | |||
| Investment Funds | 6.1 | |||
| Other Assets/Liabilities (Net) | (2.4 | ) | ||
| Total | 100.0 | % | ||
* Sector Classifications are based upon the Global Industry Classification Standard (GICS®).
| 50 |
Tabular Presentation of Portfolios of Investments (Unaudited) (Continued)
| Touchstone Small Cap Core Fund | ||||
| Sector Allocation* | (% of Net Assets) | |||
| Consumer Discretionary | 26.3 | % | ||
| Financials | 20.1 | |||
| Industrials | 19.3 | |||
| Materials | 14.3 | |||
| Health Care | 5.6 | |||
| Energy | 4.6 | |||
| Information Technology | 4.5 | |||
| Consumer Staples | 3.9 | |||
| Investment Funds | 10.4 | |||
| Other Assets/Liabilities (Net) | (9.0 | ) | ||
| Total | 100.0 | % | ||
| Touchstone Small Cap Value Fund | ||||
| Sector Allocation* | (% of Net Assets) | |||
| Financials | 38.3 | % | ||
| Industrials | 20.7 | |||
| Information Technology | 10.0 | |||
| Consumer Discretionary | 7.5 | |||
| Consumer Staples | 6.8 | |||
| Materials | 6.5 | |||
| Energy | 6.0 | |||
| Utilities | 3.2 | |||
| Health Care | 2.0 | |||
| Investment Funds | 9.4 | |||
| Other Assets/Liabilities (Net) | (10.4 | ) | ||
| Total | 100.0 | % | ||
| Touchstone Total Return Bond Fund | ||||
| Credit Quality** | (% of Investment Securities) | |||
| Aaa | 55.3 | % | ||
| Aa | 5.9 | |||
| A | 12.7 | |||
| Baa | 19.8 | |||
| Ba | 2.7 | |||
| B | 1.3 | |||
| Not Rated | 2.3 | |||
| Total | 100.0 | % | ||
| Touchstone Ultra Short Duration Fixed Income Fund | ||||
| Credit Quality** | (% of Investment Securities) | |||
| AAA | 31.7 | % | ||
| AA | 19.6 | |||
| A | 18.5 | |||
| BBB | 16.6 | |||
| B | 0.1 | |||
| CCC | 0.2 | |||
| Not Rated | 13.3 | |||
| Total | 100.0 | % | ||
* Sector Classifications are based upon the Global Industry Classification Standard (GICS®).
** Credit quality may be rated by Standard & Poor's, Moody's and Fitch. If all three agencies rate the bond, the middle or common rating is used; if two of the agencies rate the bond, the lower rating is used; if one agency rates the bond, that rating is used; if none of the agencies rate the bond, the bond will be classified as not-rated.
| 51 |
Touchstone Arbitrage Fund – September 30, 2014
| Market | ||||||||
| Shares | Value | |||||||
| Common Stocks — 86.7% | ||||||||
| Information Technology — 18.5% | ||||||||
| Compuware Corp.† | 250,000 | $ | 2,652,500 | |||||
| Concur Technologies, Inc.* | 50,000 | 6,341,000 | ||||||
| International Rectifier Corp.* | 151,640 | 5,950,354 | ||||||
| Measurement Specialties, Inc.* | 57,065 | 4,885,335 | ||||||
| Peregrine Semiconductor Corp.* | 106,145 | 1,313,014 | ||||||
| Tokyo Electron Ltd. ADR | 395,817 | 6,451,817 | ||||||
| TriQuint Semiconductor, Inc.* | 468,915 | 8,942,209 | ||||||
| 36,536,229 | ||||||||
| Consumer Discretionary — 15.7% | ||||||||
| Bally Technologies, Inc.* | 75,820 | 6,118,674 | ||||||
| DIRECTV*† | 72,830 | 6,301,252 | ||||||
| Liberty Interactive Corp. - Class A*† | 54,300 | 1,548,636 | ||||||
| LIN Media LLC - Class A* | 62,060 | 1,377,732 | ||||||
| Outerwall, Inc.*† | 39,955 | 2,241,476 | ||||||
| Time Warner Cable, Inc.† | 50,380 | 7,229,026 | ||||||
| TRW Automotive Holdings Corp.* | 61,340 | 6,210,675 | ||||||
| 31,027,471 | ||||||||
| Financials — 14.9% | ||||||||
| American Realty Capital Healthcare Trust, Inc. REIT | 794,439 | 8,325,720 | ||||||
| Glimcher Realty Trust REIT | 58,600 | 793,444 | ||||||
| Hudson City Bancorp, Inc. | 692,800 | 6,734,016 | ||||||
| National Interstate Corp.† | 88,866 | 2,479,361 | ||||||
| NorthStar Asset Management Group, Inc.* | 73,057 | 1,345,710 | ||||||
| NorthStar Realty Finance Corp. REIT | 73,057 | 1,290,917 | ||||||
| Protective Life Corp.† | 119,820 | 8,316,706 | ||||||
| 29,285,874 | ||||||||
| Industrials — 8.8% | ||||||||
| Foster Wheeler AG (Switzerland)† | 273,529 | 8,648,987 | ||||||
| Pike Corp.* | 111,378 | 1,324,284 | ||||||
| URS Corp. | 128,570 | 7,406,918 | ||||||
| 17,380,189 | ||||||||
| Telecommunication Services — 7.1% | ||||||||
| tw telecom, Inc.* | 178,408 | 7,423,557 | ||||||
| Ziggo N.V. (Netherlands), (Netherlands) | 140,000 | 6,558,550 | ||||||
| 13,982,107 | ||||||||
| Health Care — 7.0% | ||||||||
| Covidien PLC (Ireland)† | 77,800 | 6,730,478 | ||||||
| Shire PLC ADR† | 27,000 | 6,994,350 | ||||||
| 13,724,828 | ||||||||
| Materials — 4.5% | ||||||||
| Ainsworth Lumber Co. Ltd. (Canada), (Canada)* | 900,000 | 2,177,776 | ||||||
| Rockwood Holdings, Inc. | 87,000 | 6,651,150 | ||||||
| 8,828,926 | ||||||||
| Utilities — 4.3% | ||||||||
| Integrys Energy Group, Inc. | 26,810 | 1,737,824 | ||||||
| Pepco Holdings, Inc. | 252,930 | 6,768,407 | ||||||
| 8,506,231 | ||||||||
| Energy — 4.1% | ||||||||
| Dresser-Rand Group, Inc.* | 58,000 | 4,771,080 | ||||||
| National Oilwell Varco, Inc.† | 30,800 | 2,343,880 | ||||||
| Noble Energy, Inc. | 13,350 | 912,606 | ||||||
| 8,027,566 | ||||||||
| Consumer Staples — 1.8% | ||||||||
| Safeway, Inc.† | 104,275 | 3,576,632 | ||||||
| Total Common Stocks | $ | 170,876,053 | ||||||
| Preferred Stock — 1.6% | ||||||||
| Financials — 1.6% | ||||||||
| GMAC Capital Trust I, 8.13%(A) | 120,887 | 3,216,803 | ||||||
| Exchange Traded Funds — 1.5% | ||||||||
| PowerShares Senior Loan Portfolio† | 82,363 | 1,999,774 | ||||||
| SPDR Barclays Short Term High Yield Bond ETF† | 33,845 | 1,012,981 | ||||||
| Total Exchange Traded Funds | $ | 3,012,755 | ||||||
| Principal | ||||||||
| Amount | ||||||||
| Asset-Backed Security — 0.3% | ||||||||
| $ | 500,000 | Taxable Newman Capital Trust, Ser | ||||||
| 2000-1, Class A, 144a, | ||||||||
| 7.000%, 7/5/17 | 516,400 | |||||||
| Corporate Bonds — 6.4% | ||||||||
| Financials — 1.8% | ||||||||
| 2,000,000 | Nuveen Investments, Inc., | |||||||
| 5.500%, 9/15/15 | 2,060,000 | |||||||
| 1,620,000 | PNC Preferred Funding Trust II, 144a, | |||||||
| 1.457%, 3/29/49(A) | 1,557,225 | |||||||
| 3,617,225 | ||||||||
| Energy — 1.6% | ||||||||
| 2,500,000 | Kodiak Oil & Gas Corp., | |||||||
| 8.125%, 12/1/19 | 2,681,250 | |||||||
| 500,000 | Newfield Exploration Co., | |||||||
| 7.125%, 5/15/18 | 513,312 | |||||||
| 3,194,562 | ||||||||
| Consumer Staples — 1.2% | ||||||||
| 2,125,000 | US Foods, Inc., 8.500%, 6/30/19 | 2,253,031 | ||||||
| Industrial — 0.8% | ||||||||
| 1,525,000 | Sealed Air Corp., 144a, | |||||||
| 8.125%, 9/15/19 | 1,647,000 | |||||||
| Consumer Discretionary — 0.5% | ||||||||
| 975,000 | Wynn Las Vegas LLC / Wynn Las Vegas | |||||||
| Capital Corp., 7.750%, 8/15/20 | 1,034,719 | |||||||
| 52 |
Touchstone Arbitrage Fund (Continued)
| Principal | Market | |||||||
| Amount | Value | |||||||
| Corporate Bonds — 6.4% (Continued) | ||||||||
| Utilities — 0.5% | ||||||||
| $ | 975,000 | AES Corp. VA, 3.234%, 6/1/19(A) | $ | 960,375 | ||||
| Total Corporate Bonds | $ | 12,706,912 | ||||||
| Number | ||||||||
| of | ||||||||
| Contracts | ||||||||
| Purchased Call Option — 0.0% | ||||||||
| OPRA Noble Equity Option, Strike @40.00, Exp 01/15 | 340 | 1,700 | ||||||
| Total Purchased Options | 1,700 | |||||||
| Shares | ||||||||
| Investment Fund — 7.3% | ||||||||
| Touchstone Institutional Money Market Fund, 0.01%^∞Ω | 14,297,511 | 14,297,511 | ||||||
| Total Long Positions | ||||||||
| (Cost $201,947,473) | $ | 204,628,134 | ||||||
| Shares | ||||||||
| Securities Sold Short —(37.3%) | ||||||||
| Common Stocks — (37.0%) | ||||||||
| Information Technology — (8.1%) | ||||||||
| Applied Materials, Inc. | (321,544 | ) | $ | (6,948,566 | ) | |||
| RF Micro Devices, Inc.* | (785,432 | ) | (9,063,885 | ) | ||||
| (16,012,451 | ) | |||||||
| Financials — (7.5%) | ||||||||
| M&T Bank Corp. | (58,218 | ) | (7,177,697 | ) | ||||
| Ventas, Inc., REIT | (120,674 | ) | (7,475,754 | ) | ||||
| Washington Prime Group, Inc., REIT | (11,655 | ) | (203,729 | ) | ||||
| (14,857,180 | ) | |||||||
| Consumer Discretionary — (6.6%) | ||||||||
| Comcast Corp. - Class A | (144,842 | ) | (7,789,603 | ) | ||||
| Liberty Global PLC - Class A, (United Kingdom)* | (31,948 | ) | (1,359,068 | ) | ||||
| Liberty Global PLC - Series C, (United Kingdom)* | (78,820 | ) | (3,232,802 | ) | ||||
| Media General, Inc.* | (45,675 | ) | (598,799 | ) | ||||
| (12,980,272 | ) | |||||||
| Telecommunication Services — (4.6%) | ||||||||
| AT&T, Inc. | (94,679 | ) | (3,336,488 | ) | ||||
| Level 3 Communications, Inc.* | (124,886 | ) | (5,711,037 | ) | ||||
| (9,047,525 | ) | |||||||
| Health Care — (4.5%) | ||||||||
| AbbVie, Inc. | (72,576 | ) | (4,191,990 | ) | ||||
| Medtronic, Inc. | (74,376 | ) | (4,607,593 | ) | ||||
| (8,799,583 | ) | |||||||
| Energy — (2.2%) | ||||||||
| Amec PLC (United Kingdom) | (246,120 | ) | (4,404,905 | ) | ||||
| Industrials — (1.6%) | ||||||||
| AECOM Technology Corp.* | (94,369 | ) | (3,184,954 | ) | ||||
| Materials — (1.2%) | ||||||||
| Albemarle Corp. | (41,785 | ) | (2,461,136 | ) | ||||
| Utilities — (0.7%) | ||||||||
| Wisconsin Energy Corp. | (30,240 | ) | (1,300,321 | ) | ||||
| Total Common Stocks | $ | (73,048,327 | ) | |||||
| Exchange Traded Fund — (0.3%) | ||||||||
| Energy Select Sector SPDR Fund | (5,492 | ) | (497,685 | ) | ||||
| Total Securities Sold Short | ||||||||
| (Proceeds $68,841,916) | $ | (73,546,012 | ) | |||||
| Written Call Options — 0.0% | ||||||||
| OPRA Noble Equity Option, Strike @45.00, Exp 01/15 | (340 | ) | (5,100 | ) | ||||
| Written Put Options — (0.1%) | ||||||||
| National Oilwell VARCO, Inc., Strike @60.00, Exp 01/15 | (35 | ) | (1,715 | ) | ||||
| OPRA Noble Equity Option, Strike @30.00, Exp 01/15 | (340 | ) | (238,000 | ) | ||||
| Total Written Put Option | $ | (239,715 | ) | |||||
| Total Written Options | ||||||||
| (Proceeds $114,795) | $ | (244,815 | ) | |||||
| Total—66.4% | $ | 130,837,307 | ||||||
| Cash Collateral for Securities | ||||||||
| Sold Short and Written Options — 36.0% | 71,007,137 | |||||||
| Liabilities in Excess of Other Assets — (2.4%) | (4,654,988 | ) | ||||||
| Net Assets — 100.0% | $ | 197,189,456 | ||||||
| (A) | Variable rate security - Rate reflected is the rate in effect as of September 30, 2014. |
| * | Non-income producing security. |
| ^ | Affiliated Fund. See Note 4 in Notes to Financial Statements. |
| † | All or a portion of these securities are held as collateral for securities sold short and written options. The total value of the securities held as collateral as of September 30, 2014 was $62,349,481. |
| ∞ | Open-End Fund |
| Ω | Represents the 7-day SEC yield as of September 30, 2014. |
| 53 |
Touchstone Arbitrage Fund (Continued)
Portfolio Abbreviations:
ADR - American Depositary Receipt
EUR - Euro
PLC - Public Limited Company
REIT - Real Estate Investment Trust
USD - United States Dollar
144a - This is a restricted security that was sold in a transaction qualifying for the exemption under Rule 144A of the Securities Act of 1933. This security may be sold in transactions exempt from registration, normally to qualified institutional buyers. At September 30, 2014, these securities were valued at $3,720,625 or 1.9% of net assets. These securities were deemed liquid pursuant to procedures approved by the Board of Trustees.
Other Information:
The inputs or methodology used for valuing securities may not be an indication of the risk associated with investing in those securities. For more information on valuation inputs, and their aggregation into the levels used in the table below, please refer to the security valuation section in the accompanying Notes to Financial Statements.
Valuation inputs at Reporting Date:
| Description | Level 1 | Level 2 | Level 3 | Total | ||||||||||||
| Assets: | ||||||||||||||||
| Common Stocks | $ | 170,876,053 | $ | — | $ | — | $ | 170,876,053 | ||||||||
| Preferred Stock | 3,216,803 | — | — | 3,216,803 | ||||||||||||
| Exchange Traded Funds | 3,012,755 | — | — | 3,012,755 | ||||||||||||
| Asset-Backed Security | — | 516,400 | — | 516,400 | ||||||||||||
| Corporate Bonds | — | 12,706,912 | — | 12,706,912 | ||||||||||||
| Purchased Options Equity Contracts | 1,700 | — | — | 1,700 | ||||||||||||
| Investment Fund | 14,297,511 | — | — | 14,297,511 | ||||||||||||
| $ | 204,628,134 | |||||||||||||||
Valuation inputs at Reporting Date:
| Description | Level 1 | Level 2 | Level 3 | Total | ||||||||||||
| Liabilities: | ||||||||||||||||
| Securities Sold Short | ||||||||||||||||
| Common Stocks | $ | (73,048,327 | ) | $ | — | $ | — | $ | (73,048,327 | ) | ||||||
| Exchange Traded Fund | (497,685 | ) | — | — | (497,685 | ) | ||||||||||
| $ | (73,546,012 | ) | ||||||||||||||
| Other Financial Instruments** | ||||||||||||||||
| Assets: | ||||||||||||||||
| Forward Foreign Currency Contracts | $ | — | $ | 87,990 | $ | — | $ | 87,990 | ||||||||
| Liabilities: | ||||||||||||||||
| Written Options Equity Contracts | (244,815 | ) | — | — | (244,815 | ) | ||||||||||
** Other Financial Instruments are derivative instruments not reflected in total investments. Amounts shown for forward currency contracts represent unrealized appreciation (depreciation).
Transactions in written options for the year ended September 30, 2014.
| Number of | ||||||||
| Contracts | Proceeds | |||||||
| Beginning of Period, September 30, 2013 | — | $ | — | |||||
| Call Options Written | 375 | 41,764 | ||||||
| Put Options Written | 413 | 92,444 | ||||||
| Call Options Closed | (35 | ) | (17,078 | ) | ||||
| Put Options Expired | (38 | ) | (2,335 | ) | ||||
| September 30, 2014 | 715 | $ | 114,795 | |||||
| 54 |
Touchstone Arbitrage Fund (Continued)
Forward Foreign Currency Exchange Contracts
| Contract to | Unrealized | |||||||||||||
| Counterparty | Expiration Date | Receive | Deliver | Appreciation | ||||||||||
| Brown Brothers Harriman | 10/31/2014 | EUR | 880,000 | USD | 1,179,728 | $ | 68,006 | |||||||
| Brown Brothers Harriman | 10/31/2014 | EUR | 660,000 | USD | 853,776 | 19,984 | ||||||||
| $ | 87,990 | |||||||||||||
See accompanying Notes to Financial Statements.
| 55 |
Touchstone Emerging Markets Equity Fund – September 30, 2014
| Market | ||||||||
| Shares | Value | |||||||
| Common Stocks — 98.9% | ||||||||
| India — 12.6% | ||||||||
| Consumer Discretionary — 3.3% | ||||||||
| Bharat Forge Ltd. | 491,771 | $ | 6,555,620 | |||||
| Mahindra & Mahindra Ltd. | 224,737 | 4,951,783 | ||||||
| Consumer Staples — 2.0% | ||||||||
| ITC Ltd. | 1,129,351 | 6,769,524 | ||||||
| Energy — 2.9% | ||||||||
| Oil & Natural Gas Corp. Ltd. | 756,517 | 5,004,453 | ||||||
| Reliance Industries Ltd. | 330,751 | 5,064,625 | ||||||
| Health Care — 1.6% | ||||||||
| Lupin Ltd. | 238,408 | 5,713,531 | ||||||
| Information Technology — 1.1% | ||||||||
| HCL Technologies Ltd. | 143,100 | 3,973,134 | ||||||
| Materials — 0.7% | ||||||||
| UPL Ltd. | 447,292 | 2,476,908 | ||||||
| Telecommunication Services — 1.0% | ||||||||
| Bharti Airtel Ltd. | 522,095 | 3,425,403 | ||||||
| Total India | 43,934,981 | |||||||
| Korea — 10.9% | ||||||||
| Consumer Discretionary — 1.8% | ||||||||
| Kia Motors Corp. | 121,709 | 6,193,578 | ||||||
| Financials — 4.2% | ||||||||
| BS Financial Group, Inc. | 501,729 | 8,035,271 | ||||||
| Shinhan Financial Group Co. Ltd. | 144,087 | 6,635,990 | ||||||
| Information Technology — 3.9% | ||||||||
| Samsung Electronics Co. Ltd. | 12,010 | 13,475,328 | ||||||
| Materials — 1.0% | ||||||||
| POSCO | 11,560 | 3,598,635 | ||||||
| Total Korea | 37,938,802 | |||||||
| Brazil — 10.2% | ||||||||
| Consumer Discretionary — 1.6% | ||||||||
| Lojas Americanas SA (Preference) | 957,685 | 5,430,566 | ||||||
| Energy — 0.8% | ||||||||
| Petroleo Brasileiro SA (Preference) | 395,019 | 2,937,124 | ||||||
| Financials — 1.8% | ||||||||
| Banco Bradesco SA (Preference) | 449,830 | 6,432,050 | ||||||
| Health Care — 1.7% | ||||||||
| Odontoprev SA | 1,603,293 | 5,803,361 | ||||||
| Industrials — 0.9% | ||||||||
| Localiza Rent A Car SA | 215,678 | 3,099,807 | ||||||
| Information Technology — 1.5% | ||||||||
| Totvs SA | 338,093 | 5,131,306 | ||||||
| Materials — 1.9% | ||||||||
| Gerdau SA (Preference) | 473,028 | 2,274,554 | ||||||
| Vale SA ADR† | 142,056 | 1,564,037 | ||||||
| Vale SA (Preference) | 294,467 | 2,860,761 | ||||||
| Total Brazil | 35,533,566 | |||||||
| Mexico — 7.6% | ||||||||
| Consumer Staples — 4.4% | ||||||||
| Fomento Economico Mexicano SAB de CV ADR | 53,632 | 4,936,826 | ||||||
| Kimberly-Clark de Mexico SAB de CV - Class A | 1,418,094 | 3,346,070 | ||||||
| Wal-Mart de Mexico SAB de CV - Class A | 2,764,755 | 6,957,948 | ||||||
| Financials — 1.9% | ||||||||
| Grupo Financiero Banorte SAB de CV - Class O | 1,028,238 | 6,584,919 | ||||||
| Telecommunication Services — 1.3% | ||||||||
| America Movil SAB de CV, Series L ADR | 184,475 | 4,648,770 | ||||||
| Total Mexico | 26,474,533 | |||||||
| China — 6.5% | ||||||||
| Energy — 1.1% | ||||||||
| PetroChina Co. Ltd. - Class H | 3,035,448 | 3,889,670 | ||||||
| Financials — 2.6% | ||||||||
| Industrial & Commercial Bank of | ||||||||
| China - Class H | 14,374,861 | 8,960,164 | ||||||
| Industrials — 2.0% | ||||||||
| Weichai Power Co. Ltd. - Class H | 1,878,946 | 6,787,566 | ||||||
| Materials — 0.8% | ||||||||
| China BlueChemical Ltd. | 6,607,931 | 2,867,889 | ||||||
| Total China | 22,505,289 | |||||||
| South Africa — 5.7% | ||||||||
| Consumer Discretionary — 3.4% | ||||||||
| Foschini Group Ltd. | 561,775 | 5,835,459 | ||||||
| Woolworths Holdings Ltd. | 961,889 | 5,960,042 | ||||||
| Industrials — 0.6% | ||||||||
| Aveng Ltd.* | 1,015,404 | 1,999,714 | ||||||
| Telecommunication Services — 1.7% | ||||||||
| MTN Group Ltd. | 282,995 | 5,977,565 | ||||||
| Total South Africa | 19,772,780 | |||||||
| 56 |
Touchstone Emerging Markets Equity Fund (Continued)
| Market | ||||||||
| Shares | Value | |||||||
| Common Stocks — 98.9% (Continued) | ||||||||
| Taiwan — 5.7% | ||||||||
| Consumer Discretionary — 3.0% | ||||||||
| Eclat Textile Co. Ltd. | 299,996 | $ | 2,726,833 | |||||
| Giant Manufacturing Co. Ltd. | 981,330 | 7,645,596 | ||||||
| Information Technology — 2.7% | ||||||||
| Taiwan Semiconductor | ||||||||
| Manufacturing Co. Ltd. | 2,364,055 | 9,325,814 | ||||||
| Total Taiwan | 19,698,243 | |||||||
| Hong Kong — 5.5% | ||||||||
| Energy — 2.0% | ||||||||
| CNOOC Ltd. | 4,028,677 | 6,910,884 | ||||||
| Financials — 3.5% | ||||||||
| China Overseas Land & Investment Ltd. | 2,632,859 | 6,774,699 | ||||||
| Wharf Holdings Ltd. | 782,996 | 5,566,286 | ||||||
| Total Hong Kong | 19,251,869 | |||||||
| Bermuda — 5.4% | ||||||||
| Financials — 3.4% | ||||||||
| Credicorp Ltd. | 51,108 | 7,839,456 | ||||||
| First Pacific Co. Ltd. | 3,706,464 | 3,861,671 | ||||||
| Information Technology — 2.0% | ||||||||
| VTech Holdings Ltd. | 580,677 | 7,164,189 | ||||||
| Total Bermuda | 18,865,316 | |||||||
| Thailand — 4.6% | ||||||||
| Energy — 2.7% | ||||||||
| PTT Exploration & Production PCL | 1,304,669 | 6,437,842 | ||||||
| Thai Oil PCL | 1,849,551 | 2,937,606 | ||||||
| Financials — 1.1% | ||||||||
| Kasikornbank PCL | 523,716 | 3,779,477 | ||||||
| Materials — 0.8% | ||||||||
| Siam Cement PCL | 100,712 | 1,397,699 | ||||||
| Siam Cement PCL (Non- Voting) | 106,925 | 1,483,924 | ||||||
| Total Thailand | 16,036,548 | |||||||
| Malaysia — 3.2% | ||||||||
| Consumer Staples — 2.1% | ||||||||
| British American Tobacco Malaysia Bhd | 338,003 | 7,263,896 | ||||||
| Financials — 1.1% | ||||||||
| CIMB Group Holdings Bhd | 1,750,893 | 3,752,104 | ||||||
| Total Malaysia | 11,016,000 | |||||||
| United Kingdom — 2.6% | ||||||||
| Consumer Staples — 2.6% | ||||||||
| SABMiller PLC | 161,895 | 8,996,939 | ||||||
| Indonesia — 2.5% | ||||||||
| Financials — 0.9% | ||||||||
| Bank Mandiri Persero Tbk PT | 3,831,520 | 3,168,040 | ||||||
| Telecommunication Services — 1.6% | ||||||||
| Telekomunikasi Indonesia Persero Tbk PT | 22,653,370 | 5,419,333 | ||||||
| Total Indonesia | 8,587,373 | |||||||
| Luxembourg — 2.3% | ||||||||
| Energy — 2.3% | ||||||||
| Tenaris SA ADR | 171,682 | 7,820,115 | ||||||
| Cayman Islands — 2.2% | ||||||||
| Consumer Discretionary — 1.1% | ||||||||
| Daphne International Holdings Ltd.† | 7,634,070 | 3,863,809 | ||||||
| Consumer Staples — 0.9% | ||||||||
| Tingyi Cayman Islands Holding Corp. | 1,172,400 | 3,080,157 | ||||||
| Information Technology — 0.2% | ||||||||
| ASM Pacific Technology Ltd. | 84,843 | 839,705 | ||||||
| Total Cayman Islands | 7,783,671 | |||||||
| Turkey — 2.2% | ||||||||
| Energy — 0.4% | ||||||||
| Tupras Turkiye Petrol Rafine | 59,499 | 1,195,704 | ||||||
| Financials — 0.9% | ||||||||
| Turkiye Garanti Bankasi AS | 922,379 | 3,241,322 | ||||||
| Telecommunication Services — 0.9% | ||||||||
| Turkcell Iletisim Hizmetleri AS* | 624,628 | 3,265,060 | ||||||
| Total Turkey | 7,702,086 | |||||||
| South Korea — 2.1% | ||||||||
| Consumer Discretionary — 2.1% | ||||||||
| Hankook Tire Co. Ltd. | 146,028 | 7,126,692 | ||||||
| Chile — 1.6% | ||||||||
| Utilities — 1.6% | ||||||||
| Enersis SA | 17,908,665 | 5,684,787 | ||||||
| Czech Republic — 1.6% | ||||||||
| Financials — 1.6% | ||||||||
| Komercni Banka A/S | 23,474 | 5,585,414 | ||||||
| Jersey — 1.2% | ||||||||
| Materials — 1.2% | ||||||||
| Randgold Resources Ltd. ADR | 62,319 | 4,212,141 | ||||||
| Singapore — 1.0% | ||||||||
| Financials — 1.0% | ||||||||
| Keppel Land Ltd. | 1,275,189 | 3,498,598 | ||||||
| 57 |
Touchstone Emerging Markets Equity Fund (Continued)
| Market | ||||||||
| Shares | Value | |||||||
| Common Stocks — 98.9% (Continued) | ||||||||
| Israel — 0.9% | ||||||||
| Health Care — 0.9% | ||||||||
| Teva Pharmaceutical Industries Ltd. ADR | 57,665 | $ | 3,099,494 | |||||
| Canada — 0.5% | ||||||||
| Materials — 0.5% | ||||||||
| Eldorado Gold Corp. | 272,202 | 1,835,015 | ||||||
| United States — 0.3% | ||||||||
| Materials — 0.3% | ||||||||
| Southern Copper Corp. | 36,670 | 1,087,266 | ||||||
| Total Common Stocks | $ | 344,047,518 | ||||||
| Investment Funds — 1.8% | ||||||||
| Invesco Government & Agency Portfolio, Institutional Class, 0.01%**∞Ω | 3,864,165 | 3,864,165 | ||||||
| Touchstone Institutional Money Market Fund, 0.01%^∞Ω | 2,403,518 | 2,403,518 | ||||||
| Total Investment Funds | $ | 6,267,683 | ||||||
| Total Investment Securities —100.7% | ||||||||
| (Cost $342,583,614) | $ | 350,315,201 | ||||||
| Liabilities in Excess of Other Assets — (0.7%) | (2,474,922 | ) | ||||||
| Net Assets — 100.0% | $ | 347,840,279 | ||||||
| * | Non-income producing security. |
| ** | Represents collateral for securities loaned. |
| ^ | Affiliated Fund. See Note 4 in Notes to Financial Statements. |
| † | All or a portion of the security is on loan. The total market value of the securities on loan as of September 30, 2014 was $3,651,350. |
| ∞ | Open-End Fund |
| Ω | Represents the 7-day SEC yield as of September 30, 2014. |
Portfolio Abbreviations:
ADR - American Depositary Receipt
PCL - Public Company Limited
PLC - Public Limited Company
Other Information:
The inputs or methodology used for valuing securities may not be an indication of the risk associated with investing in those securities. For more information on valuation inputs, and their aggregation into the levels used in the table below, please refer to the security valuation section in the accompanying Notes to Financial Statements.
Valuation inputs at Reporting Date:
| Description | Level 1 | Level 2 | Level 3 | Total | ||||||||||||
| Common Stocks | $ | 344,047,518 | $ | — | $ | — | $ | 344,047,518 | ||||||||
| Investment Funds | 6,267,683 | — | — | 6,267,683 | ||||||||||||
| $ | 350,315,201 | |||||||||||||||
See accompanying Notes to Financial Statements.
| 58 |
Touchstone Global Real Estate Fund – September 30, 2014
| Market | ||||||||
| Shares | Value | |||||||
| Common Stocks — 90.4% | ||||||||
| United States — 30.4% | ||||||||
| Advertising — 0.8% | ||||||||
| CBS Outdoor Americas, Inc. | 3,900 | $ | 116,766 | |||||
| Diversified — 4.2% | ||||||||
| EPR Properties REIT | 5,497 | 278,588 | ||||||
| Spirit Realty Capital, Inc. REIT | 21,445 | 235,252 | ||||||
| Washington Real Estate Investment Trust REIT | 3,340 | 84,769 | ||||||
| Industrial — 2.8% | ||||||||
| ProLogis, Inc. REIT | 1,729 | 65,183 | ||||||
| STAG Industrial, Inc. REIT | 9,031 | 187,032 | ||||||
| Terreno Realty Corp. REIT | 7,428 | 139,869 | ||||||
| Mortgage — 4.5% | ||||||||
| Apollo Commercial Real Estate Finance, Inc. REIT | 18,725 | 294,170 | ||||||
| Starwood Property Trust, Inc. REIT | 15,417 | 338,557 | ||||||
| Office — 6.3% | ||||||||
| Boston Properties, Inc. REIT | 816 | 94,460 | ||||||
| Digital Realty Trust, Inc. REIT† | 3,625 | 226,128 | ||||||
| Douglas Emmett, Inc. REIT | 1,442 | 37,016 | ||||||
| Kilroy Realty Corp. REIT | 685 | 40,716 | ||||||
| Mack-Cali Realty Corp. REIT | 13,806 | 263,833 | ||||||
| QTS Realty Trust, Inc. - Class A REIT† | 4,800 | 145,680 | ||||||
| SL Green Realty Corp. REIT | 762 | 77,206 | ||||||
| Residential — 3.0% | ||||||||
| AvalonBay Communities, Inc. REIT | 442 | 62,309 | ||||||
| Campus Crest Communities, Inc. REIT | 42,389 | 271,290 | ||||||
| Equity Residential REIT | 632 | 38,919 | ||||||
| Essex Property Trust, Inc. REIT | 318 | 56,842 | ||||||
| Retail — 2.2% | ||||||||
| General Growth Properties, Inc. REIT | 2,240 | 52,752 | ||||||
| Macerich Co. (The) REIT | 650 | 41,490 | ||||||
| Retail Opportunity Investments Corp. REIT | 3,763 | 55,316 | ||||||
| Simon Property Group, Inc. REIT | 664 | 109,175 | ||||||
| Taubman Centers, Inc. REIT | 775 | 56,575 | ||||||
| Specialized — 6.6% | ||||||||
| Aviv REIT, Inc. REIT | 12,232 | 322,313 | ||||||
| Chatham Lodging Trust REIT | 6,640 | 153,251 | ||||||
| Extra Space Storage, Inc. REIT | 887 | 45,743 | ||||||
| HCP, Inc. REIT | 1,136 | 45,111 | ||||||
| Omega Healthcare Investors, Inc. REIT† | 3,754 | 128,349 | ||||||
| Public Storage REIT | 399 | 66,170 | ||||||
| Sabra Health Care REIT, Inc. REIT | 7,181 | 174,642 | ||||||
| Total United States | 4,305,472 | |||||||
| Japan — 10.4% | ||||||||
| Diversified — 4.1% | ||||||||
| Kenedix Realty Investment Corp. REIT | 58 | 311,484 | ||||||
| Premier Investment Corp. REIT | 60 | 268,065 | ||||||
| Diversified Real Estate Activities — 1.3% | ||||||||
| Mitsubishi Estate Co. Ltd. | 8,000 | 180,059 | ||||||
| Office — 1.8% | ||||||||
| Nippon Building Fund, Inc. REIT | 13 | 68,393 | ||||||
| Orix JREIT, Inc. REIT | 146 | 183,573 | ||||||
| Real Estate Operating Companies — 0.3% | ||||||||
| Aeon Mall Co. Ltd. | 2,590 | 49,427 | ||||||
| Residential — 1.5% | ||||||||
| Invincible Investment Corp. REIT | 343 | 110,398 | ||||||
| Kenedix Residential Investment Corp. REIT | 43 | 109,936 | ||||||
| Retail — 1.4% | ||||||||
| Japan Retail Fund Investment Corp. REIT | 97 | 195,459 | ||||||
| Total Japan | 1,476,794 | |||||||
| Singapore — 8.6% | ||||||||
| Diversified Financial Services — 1.8% | ||||||||
| Religare Health Trust | 339,000 | 252,450 | ||||||
| Industrial — 2.1% | ||||||||
| AIMS AMP Capital Industrial REIT | 119,000 | 133,860 | ||||||
| Mapletree Logistics Trust REIT | 180,000 | 162,969 | ||||||
| Office — 1.1% | ||||||||
| Keppel REIT | 166,000 | 154,848 | ||||||
| Retail — 3.6% | ||||||||
| CapitaRetail China Trust REIT | 94,640 | 116,473 | ||||||
| Mapletree Commercial Trust REIT | 198,000 | 218,845 | ||||||
| Mapletree Greater China Commercial Trust REIT | 200,000 | 141,883 | ||||||
| Suntec Real Estate Investment Trust REIT | 32,000 | 44,148 | ||||||
| Total Singapore | 1,225,476 | |||||||
| Australia — 7.9% | ||||||||
| Diversified — 2.5% | ||||||||
| Dexus Property Group REIT | 39,149 | 38,047 | ||||||
| GPT Group REIT | 17,032 | 57,711 | ||||||
| Stockland REIT | 74,603 | 258,008 | ||||||
| Diversified Financial Services — 1.8% | ||||||||
| Scentre Group* | 90,371 | 259,528 | ||||||
| Industrial — 0.6% | ||||||||
| Australian Industrial REIT | 45,000 | 82,739 | ||||||
| Office — 1.3% | ||||||||
| Cromwell Property Group REIT | 221,685 | 184,391 | ||||||
| 59 |
Touchstone Global Real Estate Fund (Continued)
| Market | ||||||||
| Shares | Value | |||||||
| Common Stocks — 90.4% (Continued) | ||||||||
| Australia — (Continued) | ||||||||
| Retail — 1.7% | ||||||||
| Charter Hall Retail REIT | 72,616 | $ | 241,600 | |||||
| Total Australia | 1,122,024 | |||||||
| Hong Kong — 6.4% | ||||||||
| Diversified — 1.3% | ||||||||
| Hui Xian Real Estate Investment Trust REIT | 321,000 | 180,904 | ||||||
| Diversified Real Estate Activities — 0.4% | ||||||||
| Hang Lung Properties Ltd. | 22,000 | 62,616 | ||||||
| Office — 1.3% | ||||||||
| Prosperity REIT | 575,000 | 178,464 | ||||||
| Real Estate Operating Companies — 0.5% | ||||||||
| Hysan Development Co. Ltd. | 15,000 | 69,351 | ||||||
| Retail — 1.5% | ||||||||
| Link REIT (The) REIT | 11,500 | 66,276 | ||||||
| Yuexiu Real Estate Investment Trust REIT | 313,000 | 149,146 | ||||||
| Specialized — 1.4% | ||||||||
| Langham Hospitality Investments and Langham Hospitality Investments Ltd. | 482,000 | 206,088 | ||||||
| Total Hong Kong | 912,845 | |||||||
| United Kingdom — 5.7% | ||||||||
| Diversified — 3.3% | ||||||||
| British Land Co. PLC REIT | 28,057 | 319,527 | ||||||
| Land Securities Group PLC REIT | 4,170 | 70,239 | ||||||
| Londonmetric Property PLC REIT | 32,166 | 72,482 | ||||||
| Industrial — 1.5% | ||||||||
| Segro PLC REIT | 35,188 | 207,129 | ||||||
| Specialized — 0.9% | ||||||||
| Primary Health Properties PLC REIT | 24,742 | 132,965 | ||||||
| Total United Kingdom | 802,342 | |||||||
| Canada — 4.4% | ||||||||
| Diversified — 0.4% | ||||||||
| Crombie Real Estate Investment Trust REIT | 5,221 | 60,370 | ||||||
| Health Care Facilities — 1.6% | ||||||||
| Leisureworld Senior Care Corp.† | 19,513 | 233,644 | ||||||
| Retail — 0.3% | ||||||||
| RioCan Real Estate Investment Trust REIT | 1,800 | 41,257 | ||||||
| Specialized — 2.1% | ||||||||
| InnVest Real Estate Investment Trust REIT | 62,261 | 295,197 | ||||||
| Total Canada | 630,468 | |||||||
| Germany — 3.3% | ||||||||
| Diversified — 1.5% | ||||||||
| Hamborner Reit AG | 20,690 | 212,093 | ||||||
| Office — 1.5% | ||||||||
| Alstria Office REIT-AG | 17,065 | 209,074 | ||||||
| Real Estate Operating Companies — 0.3% | ||||||||
| LEG Immobilien AG | 598 | 41,444 | ||||||
| Total Germany | 462,611 | |||||||
| France — 2.8% | ||||||||
| Diversified — 0.5% | ||||||||
| Unibail-Rodamco SE REIT | 272 | 69,981 | ||||||
| Retail — 2.3% | ||||||||
| Altarea REIT | 1,061 | 176,023 | ||||||
| Mercialys SA REIT | 7,040 | 153,519 | ||||||
| Total France | 399,523 | |||||||
| Mexico — 2.4% | ||||||||
| Industrial — 2.4% | ||||||||
| Mexico Real Estate Management SA de CV REIT | 150,519 | 265,612 | ||||||
| Prologis Property Mexico SA de CV REIT | 34,326 | 71,819 | ||||||
| Total Mexico | 337,431 | |||||||
| South Africa — 1.3% | ||||||||
| Diversified — 1.3% | ||||||||
| Redefine Properties Ltd. REIT | 214,451 | 184,748 | ||||||
| Finland — 1.2% | ||||||||
| Real Estate Operating Companies — 1.2% | ||||||||
| Citycon OYJ | 51,225 | 171,455 | ||||||
| Sweden — 1.1% | ||||||||
| Diversified — 0.8% | ||||||||
| Akelius Residential AB | 2,502 | 115,461 | ||||||
| Real Estate Operating Companies — 0.3% | ||||||||
| Hufvudstaden AB - Class A | 3,231 | 40,253 | ||||||
| Total Sweden | 155,714 | |||||||
| Thailand — 1.0% | ||||||||
| Real Estate Development — 1.0% | ||||||||
| Ticon Industrial Connection PCL | 241,360 | 135,474 | ||||||
| 60 |
Touchstone Global Real Estate Fund (Continued)
| Market | ||||||||
| Shares | Value | |||||||
| Common Stocks — 90.4% (Continued) | ||||||||
| New Zealand — 0.9% | ||||||||
| Diversified — 0.9% | ||||||||
| Kiwi Income Property Trust REIT | 132,953 | $ | 120,915 | |||||
| Netherlands — 0.8% | ||||||||
| Retail — 0.8% | ||||||||
| Eurocommercial Properties NV REIT | 2,525 | 111,208 | ||||||
| Jersey — 0.7% | ||||||||
| Real Estate Operating Companies — 0.7% | ||||||||
| Atrium European Real Estate Ltd. | 20,119 | 104,695 | ||||||
| China — 0.6% | ||||||||
| Real Estate Operating Companies — 0.6% | ||||||||
| Guangzhou R&F Properties Co. Ltd. | 79,062 | 79,929 | ||||||
| Bermuda — 0.5% | ||||||||
| Real Estate Operating Companies — 0.5% | ||||||||
| Hongkong Land Holdings Ltd. | 11,000 | 74,800 | ||||||
| Total Common Stocks | $ | 12,813,924 | ||||||
| Preferred Stocks — 9.4% | ||||||||
| Retail — 3.4% | ||||||||
| Glimcher Realty Trust, 2.38% | 18,874 | 478,078 | ||||||
| Specialized — 2.6% | ||||||||
| Ashford Hospitality Trust, Inc. REIT, 6.25% | 13,550 | 367,747 | ||||||
| Hotels, Resorts & Cruise Lines — 2.1% | ||||||||
| Sunstone Hotel Investors, Inc., 6.63% | 11,338 | 302,838 | ||||||
| Industrial — 1.3% | ||||||||
| STAG Industrial, Inc. REIT, 4.75% | 4,413 | 119,725 | ||||||
| Terreno Realty Corp. REIT, 3.40% | 2,357 | 62,814 | ||||||
| 182,539 | ||||||||
| Total Preferred Stocks | $ | 1,331,202 | ||||||
| Investment Funds — 5.5% | ||||||||
| Invesco Government & Agency Portfolio, Institutional Class, 0.01%**∞Ω | 669,430 | 669,430 | ||||||
| Touchstone Institutional Money Market Fund, 0.01%^∞Ω | 109,965 | 109,965 | ||||||
| Total Investment Funds | $ | 779,395 | ||||||
| Total Investment Securities —105.3% | ||||||||
| (Cost $15,048,894) | $ | 14,924,521 | ||||||
| Liabilities in Excess of Other Assets — (5.3%) | (747,157 | ) | ||||||
| Net Assets — 100.0% | $ | 14,177,364 | ||||||
| * | Non-income producing security. |
| ** | Represents collateral for securities loaned. |
| ^ | Affiliated Fund. See Note 4 in Notes to Financial Statements. |
| † | All or a portion of the security is on loan. The total market value of the securities on loan as of September 30, 2014 was $648,399. |
| ∞ | Open-End Fund |
| Ω | Represents the 7-day SEC yield as of September 30, 2014. |
Portfolio Abbreviations:
PCL - Public Company Limited
PLC - Public Limited Company
REIT - Real Estate Investment Trust
Other Information:
The inputs or methodology used for valuing securities may not be an indication of the risk associated with investing in those securities. For more information on valuation inputs, and their aggregation into the levels used in the table below, please refer to the security valuation section in the accompanying Notes to Financial Statements.
Valuation inputs at Reporting Date:
| Description | Level 1 | Level 2 | Level 3 | Total | ||||||||||||
| Common Stocks | $ | 12,813,924 | $ | — | $ | — | $ | 12,813,924 | ||||||||
| Preferred Stocks | 1,331,202 | — | — | 1,331,202 | ||||||||||||
| Investment Funds | 779,395 | — | — | 779,395 | ||||||||||||
| $ | 14,924,521 | |||||||||||||||
At September 30, 2014, an equity security valued at $82,739 was transferred from Level 2 to Level 1. Transfer from level 2 to 1 is due to the security price at September 30, 2014 which is based on a quoted price in an active market.
See accompanying Notes to Financial Statements.
| 61 |
Touchstone International Fixed Income Fund – September 30, 2014
| Principal | Market | |||||||
| Amount | Value | |||||||
| Sovereign Government Obligations — 64.8% | ||||||||
| New Zealand — 6.7% | ||||||||
| 700,000 | New Zealand Government Bond | |||||||
| (NZD), 6.000%, 4/15/15 | $ | 553,571 | ||||||
| 2,200,000 | New Zealand Government Bond | |||||||
| (NZD), 6.000%, 5/15/21 | 1,905,511 | |||||||
| Total New Zealand | 2,459,082 | |||||||
| Brazil — 6.6% | ||||||||
| 1,000,000 | Brazil Notas do Tesouro Nacional | |||||||
| Serie B (BRL), 6.000%, 5/15/17 | 1,023,543 | |||||||
| 1,000,000 | Brazil Notas do Tesouro Nacional | |||||||
| Serie B (BRL), 6.000%, 8/15/22 | 1,016,093 | |||||||
| 1,000,000 | Brazil Notas do Tesouro Nacional | |||||||
| Serie F (BRL), 10.000%, 1/1/19 | 378,296 | |||||||
| Total Brazil | 2,417,932 | |||||||
| Italy — 5.8% | ||||||||
| 500,000 | Italy Buoni Poliennali Del Tesoro | |||||||
| (EUR), 3.750%, 3/1/21 | 718,427 | |||||||
| 1,000,000 | Italy Buoni Poliennali Del Tesoro | |||||||
| (EUR), 4.750%, 5/1/17 | 1,398,179 | |||||||
| Total Italy | 2,116,606 | |||||||
| Canada — 5.4% | ||||||||
| 400,000 | Canada Government International | |||||||
| Bond (EUR), 3.500%, 1/13/20 | 590,575 | |||||||
| 600,000 | Canadian Government Bond (CAD), | |||||||
| 1.000%, 11/1/14 | 535,695 | |||||||
| 300,000 | Canadian Government Bond (CAD), | |||||||
| 3.250%, 6/1/21 | 292,569 | |||||||
| 580,000 | Canadian Government Bond (CAD), | |||||||
| 4.000%, 6/1/16 | 542,578 | |||||||
| Total Canada | 1,961,417 | |||||||
| Mexico — 4.8% | ||||||||
| 9,430,000 | Mexican Bonos, Ser M20 (MXN), | |||||||
| 5.000%, 6/15/17 | 712,861 | |||||||
| 9,000,000 | Mexican Bonos, Ser M20 (MXN), | |||||||
| 6.500%, 6/9/22 | 693,748 | |||||||
| 3,500,000 | Mexican Bonos, Ser M20 (MXN), | |||||||
| 10.000%, 12/5/24 | 336,491 | |||||||
| Total Mexico | 1,743,100 | |||||||
| Spain — 4.7% | ||||||||
| 1,300,000 | Spain Government Bond (EUR), | |||||||
| 2.100%, 4/30/17 | 1,710,664 | |||||||
| Ireland — 4.6% | ||||||||
| 250,000 | Ireland Government Bond (EUR), | |||||||
| 3.400%, 3/18/24 | 363,453 | |||||||
| 360,000 | Ireland Government Bond (EUR), | |||||||
| 4.500%, 4/18/20 | 547,961 | |||||||
| 450,000 | Ireland Government Bond (EUR), | |||||||
| 5.400%, 3/13/25 | 757,133 | |||||||
| Total Ireland | 1,668,547 | |||||||
| Portugal — 4.6% | ||||||||
| 700,000 | Portugal Obrigacoes do Tesouro OT | |||||||
| (EUR), 144a, 4.200%, 10/15/16 | 950,521 | |||||||
| 500,000 | Portugal Obrigacoes do Tesouro OT | |||||||
| (EUR), 144a, 4.750%, 6/14/19 | 716,494 | |||||||
| Total Portugal | 1,667,015 | |||||||
| Australia — 4.3% | ||||||||
| 600,000 | Australia Government Bond (AUD), | |||||||
| 4.750%, 6/15/16 | 544,141 | |||||||
| 1,000,000 | Australia Government Bond (AUD), | |||||||
| 5.750%, 7/15/22 | 1,020,216 | |||||||
| Total Australia | 1,564,357 | |||||||
| South Africa — 4.1% | ||||||||
| 2,000,000 | South Africa Government Bond | |||||||
| (ZAR), 6.750%, 3/31/21 | 167,018 | |||||||
| 15,000,000 | South Africa Government Bond | |||||||
| (ZAR), 8.000%, 12/21/18 | 1,351,359 | |||||||
| Total South Africa | 1,518,377 | |||||||
| United Kingdom — 2.8% | ||||||||
| 250,000 | United Kingdom Gilt (GBP), | |||||||
| 8.000%, 12/7/15 | 441,019 | |||||||
| 330,000 | United Kingdom Gilt (GBP), | |||||||
| 3.750%, 9/7/19 | 585,382 | |||||||
| Total United Kingdom | 1,026,401 | |||||||
| Sweden — 2.2% | ||||||||
| 5,600,000 | Sweden Government Bond, Ser | |||||||
| 1049 (SEK), 4.500%, 8/12/15 | 804,826 | |||||||
| France — 1.9% | ||||||||
| 450,000 | France Government Bond OAT | |||||||
| (EUR), 3.750%, 4/25/21 | 683,642 | |||||||
| Japan — 1.5% | ||||||||
| 60,000,000 | Japan Finance Organization for | |||||||
| Municipalities (JPY), | ||||||||
| 2.000%, 5/9/16 | 563,327 | |||||||
| Denmark — 1.4% | ||||||||
| 2,500,000 | Denmark Government Bond (DKK), | |||||||
| 4.000%, 11/15/19 | 505,179 | |||||||
| Belgium — 1.2% | ||||||||
| 300,000 | Belgium Government Bond (EUR), | |||||||
| 144a, 2.600%, 6/22/24 | 426,498 | |||||||
| Turkey — 1.1% | ||||||||
| 1,000,000 | Turkey Government Bond (TRY), | |||||||
| 8.500%, 9/14/22 | 407,634 | |||||||
| Germany — 1.1% | ||||||||
| 300,000 | Bundesrepublik Deutschland (EUR), | |||||||
| 1.500%, 9/4/22 | 404,790 | |||||||
| Total Sovereign Government Obligations | $ | 23,649,394 | ||||||
| 62 |
Touchstone International Fixed Income Fund (Continued)
| Principal | Market | |||||||
| Amount | Value | |||||||
| Corporate Bonds — 22.6% | ||||||||
| Germany — 5.5% | ||||||||
| Financials — 5.5% | ||||||||
| 500,000 | KFW (EUR), 3.375%, 1/18/21 | $ | 745,170 | |||||
| 120,000,000 | KFW (JPY), 2.050%, 2/16/26 | 1,269,119 | ||||||
| Total Germany | 2,014,289 | |||||||
| United Kingdom — 4.3% | ||||||||
| Financials — 4.3% | ||||||||
| 200,000 | HSBC Bank PLC (USD), 144a, | |||||||
| 1.500%, 5/15/18 | 197,235 | |||||||
| 300,000 | LCR Finance PLC (GBP), | |||||||
| 4.500%, 12/7/28 | 568,952 | |||||||
| 300,000 | Northern Rock Asset Management | |||||||
| PLC (EUR), 3.875%, 11/16/20 | 450,214 | |||||||
| 250,000 | Northern Rock Asset Management | |||||||
| PLC (EUR), 4.125%, 3/27/17 | 346,115 | |||||||
| Total United Kingdom | 1,562,516 | |||||||
| Jersey — 3.3% | ||||||||
| Financials — 2.5% | ||||||||
| 200,000 | Derwent London Capital Jersey Ltd. | |||||||
| (GBP), 2.750%, 7/15/16 | 404,637 | |||||||
| 200,000 | Great Portland Estates Capital | |||||||
| Jersey Ltd. (GBP), | ||||||||
| 1.000%, 9/10/18 | 340,439 | |||||||
| 100,000 | INTU Jersey Ltd, REIT. (GBP), | |||||||
| 2.500%, 10/4/18 | 169,328 | |||||||
| Industrials — 0.8% | ||||||||
| 200,000 | Balfour Beatty Finance No.2 Ltd. | |||||||
| (GBP), 1.875%, 12/3/18 | 276,729 | |||||||
| Total Jersey | 1,191,133 | |||||||
| Supranational — 2.4% | ||||||||
| Financials — 2.4% | ||||||||
| 300,000 | Asian Development Bank MTN | |||||||
| (NOK), 2.000%, 8/29/17 | 47,091 | |||||||
| 37,000 | European Investment Bank (GBP), | |||||||
| 6.000%, 12/7/28 | 80,537 | |||||||
| 40,000,000 | European Investment Bank (JPY), | |||||||
| 1.900%, 1/26/26 | 414,041 | |||||||
| 2,200,000 | Nordic Investment Bank (NOK), | |||||||
| 2.125%, 8/9/17 | 347,322 | |||||||
| Total Supranational | 888,991 | |||||||
| France — 1.3% | ||||||||
| Financials — 1.3% | ||||||||
| 50,000,000 | Caisse Francaise de Financement | |||||||
| Local (JPY), 1.800%, 5/9/17 | 468,541 | |||||||
| Spain — 1.2% | ||||||||
| Consumer Discretionary — 0.9% | ||||||||
| 200,000 | International Consolidated Airlines | |||||||
| Group SA (EUR), 1.750%, 5/31/18 | 324,757 | |||||||
| Financials — 0.3% | ||||||||
| 100,000 | Caixabank SA MTN (EUR), | |||||||
| 4.500%, 11/22/16 | 124,790 | |||||||
| Total Spain | 449,547 | |||||||
| Ireland — 1.1% | ||||||||
| Financials — 1.1% | ||||||||
| 300,000 | German Postal Pensions | |||||||
| Securitisation PLC (EUR), | ||||||||
| 3.375%, 1/18/16 | 394,995 | |||||||
| United Arab Emirates — 0.8% | ||||||||
| Financials — 0.8% | ||||||||
| 200,000 | Aabar Investments PJSC (EUR), | |||||||
| 4.000%, 5/27/16 | 283,304 | |||||||
| Netherlands — 0.7% | ||||||||
| Industrials — 0.7% | ||||||||
| 250,000 | Siemens Financieringsmaatschappij | |||||||
| N.V. (USD), 1.050%, 8/16/17 | 269,625 | |||||||
| Cayman Islands — 0.7% | ||||||||
| Technology — 0.7% | ||||||||
| 2,000,000 | ASM Pacific Technology Ltd. (HKD), | |||||||
| 2.000%, 3/28/19 | 266,908 | |||||||
| Italy — 0.7% | ||||||||
| Energy — 0.7% | ||||||||
| 200,000 | Eni SpA (EUR), 0.250%, 11/30/15 | 255,088 | ||||||
| Hungary — 0.4% | ||||||||
| Financials — 0.4% | ||||||||
| 100,000 | Magyar Nemzeti Vagyonkezelo Zrt | |||||||
| (EUR), 3.375%, 4/2/19 | 131,194 | |||||||
| Australia — 0.2% | ||||||||
| Materials — 0.2% | ||||||||
| 100,000 | Barminco Finance Pty Ltd. (USD), | |||||||
| 144a, 9.000%, 6/1/18 | 86,500 | |||||||
| Total Corporate Bonds | $ | 8,262,631 | ||||||
| 63 |
Touchstone International Fixed Income Fund (Continued)
| Market | ||||||||
| Shares | Value | |||||||
| Investment Fund — 7.3% | ||||||||
| 2,670,624 | Touchstone Institutional Money Market Fund, 0.01%^∞Ω | $ | 2,670,624 | |||||
| Total Investment Securities —94.7% | ||||||||
| (Cost $36,165,440) | $ | 34,582,649 | ||||||
| Other Assets in Excess of | ||||||||
| Liabilities — 5.3% | 1,925,905 | |||||||
| Net Assets — 100.0% | $ | 36,508,554 | ||||||
| ^ | Affiliated Fund. See Note 4 in Notes to Financial Statements. |
| ∞ | Open-End Fund |
| Ω | Represents the 7-day SEC yield as of September 30, 2014. |
Portfolio Abbreviations:
AUD - Australian Dollar
BRL - Brazil Real
CAD - Canadian Dollar
CLP - Chilean Peso
CSK - Czechoslovakia Koruna
DKK - Danish Krone
EUR - Euro
GBP - British Pound
HKD - Hong Kong Dollar
JPY - Japanese Yen
MTN - Medium Term Note
MXN - Mexican Peso
NOK - Norwegian Krone
NZD - New Zealand Dollar
PLC - Public Limited Company
REIT - Real Estate Investment
SEK - Swedish Krona
TRY - Turkey Lira
USD - United States Dollar
ZAR - South African Rand
144a - This is a restricted security that was sold in a transaction qualifying for the exemption under Rule 144A of the Securities Act of 1933. This security may be sold in transactions exempt from registration, normally to qualified institutional buyers. At September 30, 2014, these securities were valued at $2,377,248 or 6.5% of net assets. These securities were deemed liquid pursuant to procedures approved by the Board of Trustees.
Other Information:
The inputs or methodology used for valuing securities may not be an indication of the risk associated with investing in those securities. For more information on valuation inputs, and their aggregation into the levels used in the table below, please refer to the security valuation section in the accompanying Notes to Financial Statements.
Valuation inputs at Reporting Date:
| Description | Level 1 | Level 2 | Level 3 | Total | ||||||||||||
| Assets: | ||||||||||||||||
| Sovereign Government Obligations | $ | — | $ | 23,649,394 | $ | — | $ | 23,649,394 | ||||||||
| Corporate Bonds | — | 8,262,631 | — | 8,262,631 | ||||||||||||
| Investment Fund | 2,670,624 | — | — | 2,670,624 | ||||||||||||
| $ | 34,582,649 | |||||||||||||||
| Other Financial Instruments* | ||||||||||||||||
| Assets: | ||||||||||||||||
| Forward Foreign Currency Contracts | $ | — | $ | 1,682,933 | $ | — | $ | 1,682,933 | ||||||||
| Liabilities: | ||||||||||||||||
| Forward Foreign Currency Contracts | — | (1,201,480 | ) | — | (1,201,480 | ) | ||||||||||
* Other Financial Instruments are derivative instruments not reflected in total investments. Amounts shown represent unrealized appreciation (depreciation).
| 64 |
Touchstone International Fixed Income Fund (Continued)
Forward Foreign Currency Exchange Contracts
| Unrealized | ||||||||||||||
| Contract to | Appreciation/ | |||||||||||||
| Counterparty | Expiration Date | Receive | Deliver | (Depreciation) | ||||||||||
| UBS AG | 10/02/2014 | BRL | 2,179,639 | EUR | 703,972 | $ | 785 | |||||||
| UBS AG | 10/02/2014 | BRL | 2,161,950 | EUR | 700,000 | (1,421 | ) | |||||||
| UBS AG | 10/02/2014 | EUR | 700,000 | BRL | 2,179,639 | (5,802 | ) | |||||||
| UBS AG | 10/02/2014 | EUR | 698,259 | BRL | 2,161,950 | (778 | ) | |||||||
| UBS AG | 10/14/2014 | EUR | 500,000 | JPY | 69,535,700 | (2,494 | ) | |||||||
| UBS AG | 10/14/2014 | EUR | 1,408,000 | USD | 1,880,595 | (102,044 | ) | |||||||
| UBS AG | 10/14/2014 | GBP | 584,314 | USD | 1,000,000 | (52,861 | ) | |||||||
| UBS AG | 10/14/2014 | JPY | 832,404,000 | USD | 8,175,090 | (584,572 | ) | |||||||
| UBS AG | 10/14/2014 | JPY | 319,813,500 | USD | 3,000,000 | (83,688 | ) | |||||||
| UBS AG | 10/14/2014 | JPY | 262,091,000 | USD | 2,581,948 | (191,995 | ) | |||||||
| UBS AG | 10/14/2014 | JPY | 165,652,000 | USD | 1,629,280 | (118,734 | ) | |||||||
| UBS AG | 10/14/2014 | USD | 1,664,169 | AUD | 1,804,500 | 85,902 | ||||||||
| UBS AG | 10/14/2014 | USD | 544,554 | DKK | 2,973,500 | 39,982 | ||||||||
| UBS AG | 10/14/2014 | USD | 9,197,258 | EUR | 6,735,500 | 689,137 | ||||||||
| UBS AG | 10/14/2014 | USD | 1,525,935 | EUR | 1,117,500 | 114,336 | ||||||||
| UBS AG | 10/14/2014 | USD | 1,045,329 | EUR | 767,000 | 76,473 | ||||||||
| UBS AG | 10/14/2014 | USD | 492,942 | EUR | 361,000 | 36,935 | ||||||||
| UBS AG | 10/14/2014 | USD | 1,000,000 | GBP | 590,589 | 42,689 | ||||||||
| UBS AG | 10/14/2014 | USD | 800,159 | HKD | 6,202,500 | 1,396 | ||||||||
| UBS AG | 10/14/2014 | USD | 2,500,000 | JPY | 256,762,500 | 158,636 | ||||||||
| UBS AG | 10/14/2014 | USD | 1,582,756 | JPY | 161,199,000 | 112,817 | ||||||||
| UBS AG | 10/14/2014 | USD | 749,194 | MXN | 9,784,500 | 21,424 | ||||||||
| UBS AG | 10/14/2014 | USD | 1,452,959 | NZD | 1,664,500 | 155,488 | ||||||||
| UBS AG | 10/14/2014 | USD | 675,134 | NZD | 777,500 | 69,076 | ||||||||
| UBS AG | 10/14/2014 | USD | 1,593,421 | ZAR | 17,414,500 | 53,729 | ||||||||
| UBS AG | 10/14/2014 | USD | 192,556 | ZAR | 2,110,000 | 6,002 | ||||||||
| UBS AG | 10/15/2014 | CLP | 410,960,000 | AUD | 800,000 | (13,545 | ) | |||||||
| UBS AG | 10/15/2014 | EUR | 200,000 | USD | 270,912 | (18,275 | ) | |||||||
| UBS AG | 12/02/2014 | BRL | 1,691,200 | USD | 700,000 | (21,092 | ) | |||||||
| UBS AG | 12/02/2014 | EUR | 700,000 | BRL | 2,198,980 | 1,781 | ||||||||
| UBS AG | 01/16/2015 | JPY | 65,000,000 | NZD | 773,971 | (4,179 | ) | |||||||
| UBS AG | 01/16/2015 | USD | 700,000 | CSK | 14,976,500 | 11,026 | ||||||||
| UBS AG | 01/16/2015 | USD | 700,000 | JPY | 76,097,000 | 5,319 | ||||||||
| $ | 481,453 | |||||||||||||
See accompanying Notes to Financial Statements.
| 65 |
Touchstone Merger Arbitrage Fund – September 30, 2014
| Market | ||||||||
| Shares | Value | |||||||
| Common Stocks — 86.0% | ||||||||
| Financials — 22.3% | ||||||||
| American Realty Capital Healthcare Trust, Inc. REIT | 1,335,804 | $ | 13,999,225 | |||||
| Fortegra Financial Corp.* | 602,533 | 5,959,051 | ||||||
| Glimcher Realty Trust REIT | 513,165 | 6,948,254 | ||||||
| Hudson City Bancorp, Inc.† | 1,514,600 | 14,721,912 | ||||||
| National Interstate Corp.† | 225,332 | 6,286,763 | ||||||
| Nicholas Financial, Inc. | 304,086 | 3,524,357 | ||||||
| North Valley Bancorp* | 246,188 | 5,312,737 | ||||||
| NorthStar Asset Management Group, Inc.* | 172,781 | 3,182,626 | ||||||
| NorthStar Realty Finance Corp. REIT | 172,781 | 3,053,040 | ||||||
| OmniAmerican Bancorp, Inc. | 474,775 | 12,339,402 | ||||||
| Protective Life Corp.† | 244,565 | 16,975,257 | ||||||
| SWS Group, Inc.* | 548,094 | 3,776,368 | ||||||
| TF Financial Corp. | 2,560 | 106,163 | ||||||
| 96,185,155 | ||||||||
| Information Technology — 15.3% | ||||||||
| Compuware Corp.† | 618,000 | 6,556,980 | ||||||
| Concur Technologies, Inc.* | 75,755 | 9,607,249 | ||||||
| International Rectifier Corp.* | 237,300 | 9,311,652 | ||||||
| Measurement Specialties, Inc.* | 92,216 | 7,894,612 | ||||||
| Peregrine Semiconductor Corp.* | 162,430 | 2,009,259 | ||||||
| Tokyo Electron Ltd. ADR | 896,378 | 14,610,961 | ||||||
| TriQuint Semiconductor, Inc.*† | 826,380 | 15,759,067 | ||||||
| 65,749,780 | ||||||||
| Consumer Discretionary — 12.5% | ||||||||
| Bally Technologies, Inc.* | 118,650 | 9,575,055 | ||||||
| DIRECTV*† | 121,905 | 10,547,221 | ||||||
| Liberty Interactive Corp. - Class A*† | 167,385 | 4,773,820 | ||||||
| LIN Media LLC - Class A* | 87,545 | 1,943,499 | ||||||
| Outerwall, Inc.*† | 106,035 | 5,948,564 | ||||||
| Time Warner Cable, Inc.† | 81,150 | 11,644,214 | ||||||
| TRW Automotive Holdings Corp.* | 93,930 | 9,510,412 | ||||||
| 53,942,785 | ||||||||
| Industrials — 9.1% | ||||||||
| Foster Wheeler AG (Switzerland)† | 503,115 | 15,908,496 | ||||||
| Pike Corp.* | 177,201 | 2,106,920 | ||||||
| URS Corp. | 199,480 | 11,492,043 | ||||||
| Vacon Oyj, (Finland) | 225,000 | 9,577,130 | ||||||
| 39,084,589 | ||||||||
| Health Care — 7.3% | ||||||||
| Covidien PLC† | 126,510 | 10,944,380 | ||||||
| Medical Action Industries, Inc.* | 631,941 | 8,708,147 | ||||||
| Shire PLC ADR† | 45,905 | 11,891,690 | ||||||
| 31,544,217 | ||||||||
| Telecommunication Services — 5.8% | ||||||||
| Enventis Corp. | 10,725 | 194,980 | ||||||
| tw telecom, Inc.* | 236,699 | 9,849,045 | ||||||
| Ziggo NV, (Netherlands) | 320,000 | 14,990,971 | ||||||
| 25,034,996 | ||||||||
| Materials — 4.5% | ||||||||
| Ainsworth Lumber Co. Ltd., (Canada)* | 3,500,000 | 8,469,128 | ||||||
| Rockwood Holdings, Inc. | 142,150 | 10,867,368 | ||||||
| 19,336,496 | ||||||||
| Energy — 4.3% | ||||||||
| Dresser-Rand Group, Inc.* | 108,670 | 8,939,194 | ||||||
| National Oilwell Varco, Inc.† | 74,500 | 5,669,450 | ||||||
| Noble Energy, Inc.† | 54,205 | 3,705,454 | ||||||
| 18,314,098 | ||||||||
| Utilities — 3.6% | ||||||||
| Integrys Energy Group, Inc. | 45,110 | 2,924,030 | ||||||
| Pepco Holdings, Inc.† | 477,255 | 12,771,344 | ||||||
| 15,695,374 | ||||||||
| Consumer Staples — 1.3% | ||||||||
| Safeway, Inc.† | 164,005 | 5,625,372 | ||||||
| Total Common Stocks | $ | 370,512,862 | ||||||
| Preferred Stock — 1.5% | ||||||||
| Financials — 1.5% | ||||||||
| GMAC Capital Trust I, 8.13%(A) | 249,600 | 6,641,856 | ||||||
| Principal | ||||||||
| Amount | ||||||||
| Corporate Bonds — 8.5% | ||||||||
| Financials — 4.4% | ||||||||
| $ | 6,160,000 | Cantor Fitzgerald LP, 144a, | ||||||
| 6.375%, 6/26/15 | 6,344,800 | |||||||
| 3,700,000 | Nuveen Investments, Inc., | |||||||
| 5.500%, 9/15/15 | 3,811,000 | |||||||
| 1,785,000 | Omega Healthcare Investors, Inc., | |||||||
| 6.750%, 10/15/22 | 1,896,562 | |||||||
| 3,845,000 | PNC Preferred Funding Trust II, 144a, | |||||||
| 1.457%, 3/29/49(A) | 3,696,006 | |||||||
| 3,000,000 | Royal Bank of Scotland Group PLC, | |||||||
| 5.000%, 10/1/14 | 3,000,000 | |||||||
| 18,748,368 | ||||||||
| Energy — 1.9% | ||||||||
| 5,450,000 | Kodiak Oil & Gas Corp., | |||||||
| 8.125%, 12/1/19 | 5,845,125 | |||||||
| 1,628,000 | Newfield Exploration Co., | |||||||
| 7.125%, 5/15/18 | 1,671,346 | |||||||
| 700,000 | Plains Exploration & Production Co., | |||||||
| 8.625%, 10/15/19 | 734,196 | |||||||
| 8,250,667 | ||||||||
| Consumer Staples — 1.1% | ||||||||
| 4,650,000 | US Foods, Inc., 8.500%, 6/30/19 | 4,930,163 | ||||||
| Industrials — 0.7% | ||||||||
| 2,725,000 | Sealed Air Corp., 144a, | |||||||
| 8.125%, 9/15/19 | 2,943,000 | |||||||
| 66 |
Touchstone Merger Arbitrage Fund (Continued)
| Principal | Market | |||||||
| Amount | Value | |||||||
| Corporate Bonds — 8.5% (Continued) | ||||||||
| Consumer Discretionary — 0.4% | ||||||||
| $ | 1,485,000 | Wynn Las Vegas LLC / Wynn Las Vegas Capital Corp., 7.750%, 8/15/20 | $ | 1,575,956 | ||||
| Total Corporate Bonds | $ | 36,448,154 | ||||||
| Shares | ||||||||
| Exchange Traded Funds — 1.7% | ||||||||
| PowerShares Senior Loan Portfolio† | 206,030 | 5,002,408 | ||||||
| SPDR Barclays Short Term High Yield Bond ETF† | 76,105 | 2,277,823 | ||||||
| Total Exchange Traded Funds | $ | 7,280,231 | ||||||
| Number | ||||||||
| of | ||||||||
| Contracts | ||||||||
| Purchased Call Option — 0.0% | ||||||||
| Ne1, Strike @ 40.00 Exp 01/15 | 971 | 4,855 | ||||||
| Shares | ||||||||
| Investment Fund — 7.9% | ||||||||
| Touchstone Institutional Money Market Fund, 0.01%^∞Ω | 34,031,031 | 34,031,031 | ||||||
| Total Long Positions | ||||||||
| (Cost $452,604,102) | $ | 454,918,989 | ||||||
| Shares | ||||||||
| Securities Sold Short —(34.8%) | ||||||||
| Common Stocks — (34.3%) | ||||||||
| Financials — (10.5%) | ||||||||
| Hilltop Holdings, Inc.* | (136,905 | ) | (2,744,945 | ) | ||||
| M&T Bank Corp. | (127,262 | ) | (15,690,132 | ) | ||||
| National Penn Bancshares, Inc. | (6,483 | ) | (62,950 | ) | ||||
| Southside Bancshares, Inc. | (211,705 | ) | (7,039,191 | ) | ||||
| Trico Bancshares | (232,232 | ) | (5,253,088 | ) | ||||
| Ventas, Inc., REIT | (202,777 | ) | (12,562,035 | ) | ||||
| Washington Prime Group, Inc., REIT | (102,072 | ) | (1,784,219 | ) | ||||
| (45,136,560 | ) | |||||||
| Information Technology — (7.4%) | ||||||||
| Applied Materials, Inc. | (728,231 | ) | (15,737,072 | ) | ||||
| RF Micro Devices, Inc.* | (1,384,186 | ) | (15,973,506 | ) | ||||
| (31,710,578 | ) | |||||||
| Consumer Discretionary — (5.5%) | ||||||||
| Comcast Corp. - Class A | (233,309 | ) | (12,547,358 | ) | ||||
| Liberty Global PLC - Class A, (United Kingdom)* | (73,024 | ) | (3,106,441 | ) | ||||
| Liberty Global PLC - Series C, (United Kingdom)* | (180,160 | ) | (7,389,262 | ) | ||||
| Media General, Inc.* | (64,491 | ) | $ | (845,477 | ) | |||
| (23,888,538 | ) | |||||||
| Health Care — (3.4%) | ||||||||
| AbbVie, Inc. | (123,395 | ) | (7,127,295 | ) | ||||
| Medtronic, Inc. | (120,946 | ) | (7,492,606 | ) | ||||
| (14,619,901 | ) | |||||||
| Telecommunication Services — (3.1%) | ||||||||
| AT&T, Inc. | (158,477 | ) | (5,584,729 | ) | ||||
| Consolidated Communications Holdings, Inc. | (7,994 | ) | (200,250 | ) | ||||
| Level 3 Communications, Inc.* | (165,690 | ) | (7,577,004 | ) | ||||
| (13,361,983 | ) | |||||||
| Energy — (1.9%) | ||||||||
| AMEC PLC, (United Kingdom) | (451,624 | ) | (8,082,889 | ) | ||||
| Industrials — (1.1%) | ||||||||
| AECOM Technology Corp.* | (142,750 | ) | (4,817,812 | ) | ||||
| Materials — (0.9%) | ||||||||
| Albemarle Corp. | (68,277 | ) | (4,021,515 | ) | ||||
| Utilities — (0.5%) | ||||||||
| Wisconsin Energy Corp. | (50,855 | ) | (2,186,765 | ) | ||||
| Total Common Stocks | $ | (147,826,541 | ) | |||||
| Exchange Traded Fund — (0.5%) | ||||||||
| Energy Select Sector SPDR Fund | (22,351 | ) | (2,025,448 | ) | ||||
| Total Securities Sold Short | ||||||||
| (Proceeds $139,557,143) | $ | (149,851,989 | ) | |||||
| Number | ||||||||
| of | ||||||||
| Contracts | ||||||||
| Written Options — (0.1%) | ||||||||
| Written Call Options — 0.0% | ||||||||
| Ne1, Strike @ 45.00 | ||||||||
| Exp 01/15 | (971 | ) | (14,565 | ) | ||||
| Written Put Options — (0.1%) | ||||||||
| Ne1, Strike @ 30.00 | ||||||||
| Exp 01/15 | (971 | ) | (679,700 | ) | ||||
| National Oilwell Varco, Inc. | ||||||||
| Strike @ 60.00 | ||||||||
| Exp 01/15 | (585 | ) | (28,665 | ) | ||||
| $ | (708,365 | ) | ||||||
| Total Written Options | ||||||||
| (Proceeds $597,434) | $ | (722,930 | ) | |||||
| 67 |
Touchstone Merger Arbitrage Fund (Continued)
| Market | ||||
| Value | ||||
| Total —70.7% | $ | 304,344,070 | ||
| Cash Collateral for Securities | ||||
| Sold Short and Written Options — 29.5% | 126,934,320 | |||
| Liabilities in Excess of Other Assets — (0.2%) | (593,312 | ) | ||
| Net Assets — 100.0% | $ | 430,685,078 | ||
| (A) | Variable rate security - Rate reflected is the rate in effect as of September 30, 2014. |
| * | Non-income producing security. |
| ^ | Affiliated Fund. See Note 4 in Notes to Financial Statements. |
| † | All or a portion of these securities are held as collateral for securities sold short and written options. The total value of the securities held as collateral as of September 30, 2014 was $165,186,342. |
| ∞ | Open-End Fund |
| Ω | Represents the 7-day SEC yield as of September 30, 2014. |
Portfolio Abbreviations:
ADR - American Depositary Receipt
ETF - Exchange Traded Funds
EUR - Euro
PLC - Public Limited Company
REIT - Real Estate Investment Trust
144a - This is a restricted security that was sold in a transaction qualifying for the exemption under Rule 144A of the Securities Act of 1933. This security may be sold in transactions exempt from registration, normally to qualified institutional buyers. At September 30, 2014, these securities were valued at $12,983,806 or 3.0% of net assets. These securities were deemed liquid pursuant to procedures approved by the Board of Trustees.
Other Information:
The inputs or methodology used for valuing securities may not be an indication of the risk associated with investing in those securities. For more information on valuation inputs, and their aggregation into the levels used in the table below, please refer to the security valuation section in the accompanying Notes to Financial Statements.
Valuation inputs at Reporting Date:
| Description | Level 1 | Level 2 | Level 3 | Total | ||||||||||||
| Assets: | ||||||||||||||||
| Common Stocks | $ | 370,512,862 | $ | — | $ | — | $ | 370,512,862 | ||||||||
| Preferred Stock | 6,641,856 | — | — | 6,641,856 | ||||||||||||
| Corporate Bonds | — | 36,448,154 | — | 36,448,154 | ||||||||||||
| Exchange Traded Funds | 7,280,231 | — | — | 7,280,231 | ||||||||||||
| Investment Fund | 34,031,031 | — | — | 34,031,031 | ||||||||||||
| Purchased Options Equity Contracts | 4,855 | — | — | 4,855 | ||||||||||||
| $ | 454,918,989 | |||||||||||||||
| Liabilities: | ||||||||||||||||
| Securities Sold Short | ||||||||||||||||
| Common Stocks | (147,826,541 | ) | — | — | (147,826,541 | ) | ||||||||||
| Exchange Traded Fund | (2,025,448 | ) | — | — | (2,025,448 | ) | ||||||||||
| $ | (149,851,989 | ) | ||||||||||||||
| Other Financial Instruments** | ||||||||||||||||
| Assets: | ||||||||||||||||
| Forward Foreign Currency Contracts | $ | — | $ | 508,348 | $ | — | $ | 508,348 | ||||||||
| Liabilities: | ||||||||||||||||
| Written Options Equity Contracts | (722,930 | ) | — | — | (722,930 | ) | ||||||||||
** Other Financial Instruments are derivative instruments not reflected in total investments. Amounts shown for forward currency contracts represent unrealized appreciation.
| 68 |
Touchstone Merger Arbitrage Fund (Continued)
Transactions in written options for the year ended
September 30, 2014.
| Number of | ||||||||
| Contracts | Proceeds | |||||||
| Beginning of Period, September 30, 2013 | 100 | $ | 21,500 | |||||
| Call Options Written | 1,506 | 493,047 | ||||||
| Put Options Written | 1,712 | 381,002 | ||||||
| Call Options Closed | (585 | ) | (285,454 | ) | ||||
| Put Options Expired | (206 | ) | (12,661 | ) | ||||
| September 30, 2014 | 2,527 | $ | 597,434 | |||||
Forward Foreign Currency Exchange Contracts
| Contract to | Unrealized | |||||||||||||
| Counterparty | Expiration Date | Receive | Deliver | Appreciation | ||||||||||
| Brown Brothers Harriman | 10/31/2014 | USD | 4,718,912 | EUR | 3,520,000 | $ | 272,022 | |||||||
| Brown BrothersHarriman | 12/31/2014 | USD | 9,905,220 | EUR | 7,650,000 | 236,326 | ||||||||
| $ | 508,348 | |||||||||||||
See accompanying Notes to Financial Statements.
| 69 |
Touchstone Mid Cap Fund – September 30, 2014
| Market | ||||||||
| Shares | Value | |||||||
| Common Stocks — 98.6% | ||||||||
| Consumer Discretionary — 29.1% | ||||||||
| Cabela's, Inc.*† | 193,852 | $ | 11,417,883 | |||||
| CarMax, Inc.* | 330,189 | 15,337,279 | ||||||
| Deckers Outdoor Corp.* | 145,460 | 14,135,803 | ||||||
| Dollar Tree, Inc.* | 421,930 | 23,657,615 | ||||||
| Hasbro, Inc. | 211,753 | 11,645,356 | ||||||
| PulteGroup, Inc. | 903,180 | 15,950,159 | ||||||
| Service Corp. International | 320,659 | 6,778,731 | ||||||
| Tempur Sealy International, Inc.* | 296,070 | 16,630,252 | ||||||
| Whirlpool Corp. | 95,921 | 13,970,894 | ||||||
| 129,523,972 | ||||||||
| Information Technology — 14.5% | ||||||||
| Amphenol Corp. - Class A | 187,296 | 18,703,379 | ||||||
| NetApp, Inc. | 334,440 | 14,367,542 | ||||||
| Paychex, Inc. | 373,058 | 16,489,164 | ||||||
| Symantec Corp. | 647,130 | 15,214,026 | ||||||
| 64,774,111 | ||||||||
| Consumer Staples — 12.3% | ||||||||
| Brown-Forman Corp. - Class B | 155,727 | 14,049,690 | ||||||
| Energizer Holdings, Inc. | 160,497 | 19,774,835 | ||||||
| Lorillard, Inc. | 229,988 | 13,778,581 | ||||||
| Pricesmart, Inc. | 81,823 | 7,007,322 | ||||||
| 54,610,428 | ||||||||
| Industrials — 11.0% | ||||||||
| Alliant Techsystems, Inc. | 76,670 | 9,786,159 | ||||||
| Cintas Corp. | 352,105 | 24,855,092 | ||||||
| Old Dominion Freight Line, Inc.* | 202,385 | 14,296,476 | ||||||
| 48,937,727 | ||||||||
| Financials — 10.7% | ||||||||
| Alleghany Corp.* | 42,483 | 17,764,266 | ||||||
| M&T Bank Corp.† | 151,871 | 18,724,176 | ||||||
| MBIA, Inc.* | 1,231,069 | 11,301,213 | ||||||
| 47,789,655 | ||||||||
| Materials — 10.0% | ||||||||
| Albemarle Corp. | 233,372 | 13,745,611 | ||||||
| NewMarket Corp. | 54,940 | 20,933,239 | ||||||
| Vulcan Materials Co. | 166,575 | 10,032,812 | ||||||
| 44,711,662 | ||||||||
| Energy — 6.8% | ||||||||
| Atwood Oceanics, Inc.* | 316,871 | 13,844,095 | ||||||
| Kinder Morgan Management LLC* | 176,054 | 16,575,499 | ||||||
| 30,419,594 | ||||||||
| Health Care — 4.2% | ||||||||
| Tenet Healthcare Corp.* | 317,873 | 18,878,477 | ||||||
| Total Common Stocks | $ | 439,645,626 | ||||||
| Investment Funds — 7.9% | ||||||||
| Invesco Government & Agency | ||||||||
| Portfolio, Institutional Class, 0.01%**∞Ω | 30,511,526 | 30,511,526 | ||||||
| Touchstone Institutional Money Market Fund, 0.01%^∞Ω | 4,902,428 | 4,902,428 | ||||||
| Total Investment Funds | $ | 35,413,954 | ||||||
| Total Investment Securities —106.5% | ||||||||
| (Cost $413,125,354) | $ | 475,059,580 | ||||||
| Liabilities in Excess of Other Assets — (6.5%) | (29,076,389 | ) | ||||||
| Net Assets — 100.0% | $ | 445,983,191 | ||||||
| * | Non-income producing security. |
| ** | Represents collateral for securities loaned. |
| ^ | Affiliated Fund. See Note 4 in Notes to Financial Statements. |
| † | All or a portion of the security is on loan. The total market value of the securities on loan as of September 30, 2014 was $29,812,639. |
| ∞ | Open-End Fund |
| Ω | Represents the 7-day SEC yield as of September 30, 2014. |
Portfolio Abbreviations:
LLC - Limited Liability Company
Other Information:
The inputs or methodology used for valuing securities may not be an indication of the risk associated with investing in those securities. For more information on valuation inputs, and their aggregation into the levels used in the table below, please refer to the security valuation section in the accompanying Notes to Financial Statements.
Valuation inputs at Reporting Date:
| Description | Level 1 | Level 2 | Level 3 | Total | ||||||||||||
| Common Stocks | $ | 439,645,626 | $ | — | $ | — | $ | 439,645,626 | ||||||||
| Investment Funds | 35,413,954 | — | — | 35,413,954 | ||||||||||||
| $ | 475,059,580 | |||||||||||||||
See accompanying Notes to Financial Statements.
| 70 |
Touchstone Mid Cap Value Fund – September 30, 2014
| Market | ||||||||
| Shares | Value | |||||||
| Common Stocks — 98.0% | ||||||||
| Financials — 23.6% | ||||||||
| Alexandria Real Estate Equities, Inc., REIT | 74,656 | $ | 5,505,879 | |||||
| Allstate Corp. (The) | 62,115 | 3,811,998 | ||||||
| American Campus Communities, Inc., REIT | 152,532 | 5,559,791 | ||||||
| Ameriprise Financial, Inc. | 38,429 | 4,741,370 | ||||||
| Brixmor Property Group, Inc., REIT | 205,135 | 4,566,305 | ||||||
| Endurance Specialty Holdings Ltd. | 76,582 | 4,225,795 | ||||||
| Fifth Third Bancorp | 305,740 | 6,120,915 | ||||||
| Hancock Holding Co. | 120,896 | 3,874,717 | ||||||
| Hanover Insurance Group, Inc. (The) | 76,779 | 4,715,766 | ||||||
| Hartford Financial Services Group, Inc. | 155,033 | 5,774,979 | ||||||
| Host Hotels & Resorts, Inc., REIT | 244,122 | 5,207,122 | ||||||
| Investors Bancorp, Inc. | 451,337 | 4,572,044 | ||||||
| Reinsurance Group of America, Inc. | 45,144 | 3,617,389 | ||||||
| SunTrust Banks, Inc. | 151,134 | 5,747,626 | ||||||
| TCF Financial Corp. | 302,210 | 4,693,321 | ||||||
| Unum Group | 155,841 | 5,357,814 | ||||||
| Willis Group Holdings PLC | 85,039 | 3,520,615 | ||||||
| Zions Bancorporation | 145,296 | 4,222,302 | ||||||
| 85,835,748 | ||||||||
| Consumer Discretionary — 12.0% | ||||||||
| American Eagle Outfitters, Inc.† | 316,663 | 4,597,947 | ||||||
| Bed Bath & Beyond, Inc.* | 69,407 | 4,569,063 | ||||||
| Cabela's, Inc.*† | 99,080 | 5,835,811 | ||||||
| Dollar General Corp.* | 59,464 | 3,633,845 | ||||||
| Harley-Davidson, Inc. | 55,585 | 3,235,047 | ||||||
| Hasbro, Inc. | 68,818 | 3,784,646 | ||||||
| Interpublic Group of Cos, Inc. (The) | 174,092 | 3,189,365 | ||||||
| Newell Rubbermaid, Inc. | 144,892 | 4,985,734 | ||||||
| PetSmart, Inc. | 63,811 | 4,472,513 | ||||||
| Sally Beauty Holdings, Inc.* | 200,720 | 5,493,706 | ||||||
| 43,797,677 | ||||||||
| Information Technology — 11.8% | ||||||||
| Cadence Design Systems, Inc.* | 338,448 | 5,824,690 | ||||||
| Citrix Systems, Inc.* | 82,243 | 5,867,216 | ||||||
| Diebold, Inc. | 85,661 | 3,025,547 | ||||||
| Fidelity National Information Services, Inc. | 106,370 | 5,988,631 | ||||||
| IAC/InterActiveCorp. | 68,634 | 4,522,981 | ||||||
| Juniper Networks, Inc. | 167,055 | 3,700,268 | ||||||
| Microchip Technology, Inc.† | 116,788 | 5,515,897 | ||||||
| Solera Holdings, Inc. | 36,121 | 2,035,780 | ||||||
| Synopsys, Inc.* | 166,305 | 6,601,477 | ||||||
| 43,082,487 | ||||||||
| Industrials — 10.5% | ||||||||
| Cintas Corp. | 82,005 | 5,788,733 | ||||||
| Clean Harbors, Inc.* | 85,258 | 4,597,111 | ||||||
| Dover Corp. | 59,208 | 4,756,179 | ||||||
| Fluor Corp. | 57,870 | 3,865,137 | ||||||
| Parker Hannifin Corp. | 45,086 | 5,146,567 | ||||||
| Regal-Beloit Corp. | 64,630 | 4,152,478 | ||||||
| Stanley Black & Decker, Inc. | 64,849 | 5,757,943 | ||||||
| Xylem, Inc. | 110,778 | 3,931,511 | ||||||
| 37,995,659 | ||||||||
| Health Care — 10.1% | ||||||||
| AmerisourceBergen Corp. | 53,520 | 4,137,095 | ||||||
| CareFusion Corp.* | 131,902 | 5,968,566 | ||||||
| Charles River Laboratories International, Inc.* | 86,550 | 5,170,497 | ||||||
| Cooper Cos, Inc. (The) | 37,002 | 5,763,062 | ||||||
| DENTSPLY International, Inc. | 96,911 | 4,419,142 | ||||||
| Patterson Cos., Inc. | 153,118 | 6,343,679 | ||||||
| Quest Diagnostics, Inc. | 81,797 | 4,963,442 | ||||||
| 36,765,483 | ||||||||
| Consumer Staples — 8.9% | ||||||||
| Coca-Cola Enterprises, Inc. | 78,082 | 3,463,718 | ||||||
| Darling International, Inc.* | 172,247 | 3,155,565 | ||||||
| Ingredion, Inc. | 36,456 | 2,763,000 | ||||||
| JM Smucker Co. (The) | 63,269 | 6,262,998 | ||||||
| Kroger Co. (The) | 111,770 | 5,812,039 | ||||||
| Molson Coors Brewing Co. - Class B | 73,040 | 5,437,098 | ||||||
| Sysco Corp. | 145,770 | 5,531,972 | ||||||
| 32,426,390 | ||||||||
| Utilities — 8.1% | ||||||||
| AGL Resources, Inc. | 97,649 | 5,013,300 | ||||||
| Edison International | 77,939 | 4,358,349 | ||||||
| Great Plains Energy, Inc. | 208,103 | 5,029,850 | ||||||
| Portland General Electric Co.† | 166,605 | 5,351,353 | ||||||
| SCANA Corp. | 85,616 | 4,247,410 | ||||||
| Xcel Energy, Inc. | 179,492 | 5,456,557 | ||||||
| 29,456,819 | ||||||||
| Energy — 6.7% | ||||||||
| EQT Corp. | 57,719 | 5,283,597 | ||||||
| Nabors Industries Ltd. | 72,302 | 1,645,594 | ||||||
| Newfield Exploration Co.* | 88,661 | 3,286,663 | ||||||
| Oasis Petroleum, Inc.* | 98,699 | 4,126,605 | ||||||
| Pioneer Natural Resources Co. | 25,877 | 5,096,993 | ||||||
| Range Resources Corp. | 20,778 | 1,408,956 | ||||||
| Spectra Energy Corp. | 90,911 | 3,569,166 | ||||||
| 24,417,574 | ||||||||
| Materials — 6.3% | ||||||||
| Air Products & Chemicals, Inc. | 32,603 | 4,244,259 | ||||||
| Albemarle Corp. | 89,988 | 5,300,293 | ||||||
| Allegheny Technologies, Inc. | 123,572 | 4,584,521 | ||||||
| Greif, Inc. - Class A | 69,600 | 3,049,175 | ||||||
| Nucor Corp. | 40,933 | 2,221,843 | ||||||
| Silgan Holdings, Inc. | 71,852 | 3,377,043 | ||||||
| 22,777,134 | ||||||||
| Total Common Stocks | $ | 356,554,971 | ||||||
| Exchange Traded Fund — 0.5% | ||||||||
| iShares Russell Midcap Value Index Fund∞ | 25,851 | 1,809,569 | ||||||
| 71 |
Touchstone Mid Cap Value Fund (Continued)
| Market | ||||||||
| Shares | Value | |||||||
| Investment Funds — 4.1% | ||||||||
| Invesco Government & Agency Portfolio, Institutional Class, 0.01%**∞Ω | 10,356,915 | $ | 10,356,915 | |||||
| Touchstone Institutional Money Market Fund, 0.01%^∞Ω | 4,512,194 | 4,512,194 | ||||||
| Total Investment Funds | $ | 14,869,109 | ||||||
| Total Investment Securities —102.6% | ||||||||
| (Cost $338,773,120) | $ | 373,233,649 | ||||||
| Liabilities in Excess of Other Assets — (2.6)% | (9,539,007 | ) | ||||||
| Net Assets — 100.0% | $ | 363,694,642 | ||||||
| * | Non-income producing security. |
| ** | Represents collateral for securities loaned. |
| ^ | Affiliated Fund. See Note 4 in Notes to Financial Statements. |
| † | All or a portion of the security is on loan. The total market value of the securities on loan as of September 30, 2014 was $10,091,629. |
| ∞ | Open-End Fund |
| Ω | Represents the 7-day SEC yield as of September 30, 2014. |
Portfolio Abbreviations:
PLC - Public Limited Company
REIT - Real Estate Investment Trust
Other Information:
The inputs or methodology used for valuing securities may not be an indication of the risk associated with investing in those securities. For more information on valuation inputs, and their aggregation into the levels used in the table below, please refer to the security valuation section in the accompanying Notes to Financial Statements.
Valuation inputs at Reporting Date:
| Description | Level 1 | Level 2 | Level 3 | Total | ||||||||||||
| Common Stocks | $ | 356,554,971 | $ | — | $ | — | $ | 356,554,971 | ||||||||
| Exchanged Traded Fund | 1,809,569 | — | — | 1,809,569 | ||||||||||||
| Investment Funds | 14,869,109 | — | — | 14,869,109 | ||||||||||||
| $ | 373,233,649 | |||||||||||||||
See accompanying Notes to Financial Statements.
| 72 |
Touchstone Premium Yield Equity Fund – September 30, 2014
| Market | ||||||||
| Shares | Value | |||||||
| Common Stocks — 96.6% | ||||||||
| Energy — 19.7% | ||||||||
| Ensco PLC- Class A (United Kingdom) | 45,630 | $ | 1,884,975 | |||||
| Golar Lng Ltd. (Bermuda) | 40,123 | 2,664,167 | ||||||
| Kinder Morgan Management LLC* | 3 | 292 | ||||||
| Kinder Morgan, Inc. Delaware | 284,930 | 10,924,216 | ||||||
| LinnCo LLC | 104,241 | 3,017,777 | ||||||
| Pembina Pipeline Corp. (Canada) | 55,071 | 2,320,692 | ||||||
| Seadrill Ltd. (Bermuda) | 73,101 | 1,956,183 | ||||||
| Spectra Energy Corp. | 128,237 | 5,034,585 | ||||||
| Williams Cos., Inc. (The) | 157,808 | 8,734,673 | ||||||
| 36,537,560 | ||||||||
| Financials — 18.0% | ||||||||
| Ares Capital Corp. | 106,208 | 1,716,321 | ||||||
| Bank of Montreal (Canada) | 49,564 | 3,648,902 | ||||||
| CME Group, Inc. IL | 60,185 | 4,812,092 | ||||||
| Digital Realty Trust, Inc., REIT | 71,592 | 4,465,910 | ||||||
| HCP, Inc., REIT | 110,929 | 4,404,991 | ||||||
| Hospitality Properties Trust, REIT | 126,270 | 3,390,350 | ||||||
| Omega Healthcare Investors, Inc., REIT | 49,170 | 1,681,122 | ||||||
| People's United Financial, Inc. | 168,360 | 2,436,169 | ||||||
| Senior Housing Properties Trust, REIT | 71,592 | 1,497,705 | ||||||
| Ventas, Inc., REIT | 55,858 | 3,460,403 | ||||||
| Weyerhaeuser Co., REIT | 57,824 | 1,842,273 | ||||||
| 33,356,238 | ||||||||
| Health Care — 16.4% | ||||||||
| AbbVie, Inc. | 68,839 | 3,976,141 | ||||||
| Baxter International, Inc. | 46,024 | 3,303,142 | ||||||
| GlaxoSmithKline PLC, ADR | 84,573 | 3,887,821 | ||||||
| Johnson & Johnson | 55,071 | 5,870,018 | ||||||
| Merck & Co., Inc. | 106,995 | 6,342,664 | ||||||
| Novartis AG, ADR | 40,910 | 3,850,858 | ||||||
| Pfizer, Inc. | 105,422 | 3,117,329 | ||||||
| 30,347,973 | ||||||||
| Information Technology — 15.4% | ||||||||
| Cisco Systems, Inc. | 147,905 | 3,722,769 | ||||||
| Intel Corp. | 255,794 | 8,906,747 | ||||||
| Maxim Integrated Products, Inc. | 90,080 | 2,724,019 | ||||||
| Microchip Technology, Inc. | 90,474 | 4,273,087 | ||||||
| Microsoft Corp. | 112,895 | 5,233,812 | ||||||
| Seagate Technology PLC (Ireland) | 64,905 | 3,717,109 | ||||||
| 28,577,543 | ||||||||
| Utilities — 10.3% | ||||||||
| American Water Works Co., Inc. | 139,251 | 6,716,076 | ||||||
| NiSource, Inc. | 119,189 | 4,884,365 | ||||||
| ONE Gas, Inc. | 28,282 | 968,658 | ||||||
| ONEOK, Inc. | 100,308 | 6,575,189 | ||||||
| 19,144,288 | ||||||||
| Telecommunication Services — 5.4% | ||||||||
| AT&T, Inc. | 93,227 | 3,285,319 | ||||||
| BCE, Inc. (Canada) | 33,829 | 1,446,528 | ||||||
| Verizon Communications, Inc. | 44,450 | 2,222,056 | ||||||
| Vodafone Group PLC, ADR | 92,441 | 3,040,384 | ||||||
| 9,994,287 | ||||||||
| Industrials — 5.1% | ||||||||
| Eaton Corp. PLC (Ireland) | 47,990 | 3,041,126 | ||||||
| General Electric Co. | 254,113 | 6,510,375 | ||||||
| 9,551,501 | ||||||||
| Consumer Discretionary — 4.4% | ||||||||
| Darden Restaurants, Inc. | 63,725 | 3,279,288 | ||||||
| Lamar Advertising Co. | 71,986 | 3,545,310 | ||||||
| Mattel, Inc. | 44,450 | 1,362,392 | ||||||
| 8,186,990 | ||||||||
| Materials — 1.9% | ||||||||
| Potash Corp. of Saskatchewan, Inc. (Canada) | 102,947 | 3,557,848 | ||||||
| Total Common Stocks | $ | 179,254,228 | ||||||
| Investment Fund — 2.1% | ||||||||
| Touchstone Institutional Money Market Fund, 0.01%^∞Ω | 3,920,442 | 3,920,442 | ||||||
| Total Investment Securities —98.7% | ||||||||
| (Cost $153,528,919) | $ | 183,174,670 | ||||||
| Other Assets in Excess of Liabilities — 1.3% | 2,340,144 | |||||||
| Net Assets — 100.0% | $ | 185,514,814 | ||||||
| * | Non-income producing security. |
| ^ | Affiliated Fund. See Note 4 in Notes to Financial Statements. |
| ∞ | Open-End Fund |
| Ω | Represents the 7-day SEC yield as of September 30, 2014. |
Portfolio Abbreviations:
ADR - American Depositary Receipt
LLC - Limited Liability Company
PLC - Public Limited Company
REIT - Real Estate Investment Trust
| 73 |
Touchstone Premium Yield Equity Fund (Continued)
Other Information:
The inputs or methodology used for valuing securities may not be an indication of the risk associated with investing in those securities. For more information on valuation inputs, and their aggregation into the levels used in the table below, please refer to the security valuation section in the accompanying Notes to Financial Statements.
Valuation inputs at Reporting Date:
| Description | Level 1 | Level 2 | Level 3 | Total | ||||||||||||
| Common Stocks | $ | 179,254,228 | $ | — | $ | — | $ | 179,254,228 | ||||||||
| Investment Fund | 3,920,442 | — | — | 3,920,442 | ||||||||||||
| $ | 183,174,670 | |||||||||||||||
See accompanying Notes to Financial Statements.
| 74 |
Touchstone Sands Capital Select Growth Fund – September 30, 2014
| Market | ||||||||
| Shares | Value | |||||||
| Common Stocks — 96.3% | ||||||||
| Information Technology — 38.0% | ||||||||
| Adobe Systems, Inc.* | 1,260,000 | $ | 87,179,400 | |||||
| Alibaba Group Holding Ltd. ADR* | 957,244 | 85,051,129 | ||||||
| ARM Holdings PLC ADR | 3,895,000 | 170,172,550 | ||||||
| ASML Holding NV† | 1,554,000 | 153,566,280 | ||||||
| Baidu, Inc. ADR* | 1,286,000 | 280,643,780 | ||||||
| Facebook, Inc. - Class A* | 3,235,000 | 255,694,400 | ||||||
| Google, Inc. - Class C* | 220,000 | 127,019,200 | ||||||
| Google, Inc. - Class A* | 316,000 | 185,937,560 | ||||||
| LinkedIn Corp. - Class A* | 1,114,000 | 231,478,060 | ||||||
| Salesforce.com, Inc.* | 3,878,000 | 223,101,340 | ||||||
| Splunk, Inc.* | 2,504,000 | 138,621,440 | ||||||
| Visa, Inc. - Class A | 2,087,000 | 445,303,190 | ||||||
| 2,383,768,329 | ||||||||
| Consumer Discretionary — 21.5% | ||||||||
| Amazon.com, Inc.* | 1,095,000 | 353,071,800 | ||||||
| Chipotle Mexican Grill, Inc.* | 402,000 | 267,969,180 | ||||||
| Las Vegas Sands Corp. | 2,447,000 | 152,227,870 | ||||||
| NIKE, Inc. - Class B | 2,636,000 | 235,131,200 | ||||||
| Priceline Group, Inc. (The)* | 191,000 | 221,288,780 | ||||||
| Twenty-First Century Fox, Inc., Class A | 3,398,000 | 116,517,420 | ||||||
| 1,346,206,250 | ||||||||
| Health Care — 18.1% | ||||||||
| Alexion Pharmaceuticals, Inc.* | 1,067,000 | 176,929,940 | ||||||
| athenahealth, Inc.*† | 952,000 | 125,368,880 | ||||||
| Biogen Idec, Inc.* | 754,000 | 249,430,740 | ||||||
| BioMarin Pharmaceutical, Inc.* | 1,759,000 | 126,929,440 | ||||||
| Cerner Corp.* | 2,831,000 | 168,642,670 | ||||||
| Regeneron Pharmaceuticals, Inc.* | 798,000 | 287,694,960 | ||||||
| 1,134,996,630 | ||||||||
| Energy — 10.6% | ||||||||
| FMC Technologies, Inc.* | 2,763,000 | 150,058,530 | ||||||
| National Oilwell Varco, Inc. | 2,151,000 | 163,691,100 | ||||||
| Schlumberger Ltd. (Curacao) | 1,974,000 | 200,736,060 | ||||||
| Southwestern Energy Co.* | 4,378,000 | 153,011,100 | ||||||
| 667,496,790 | ||||||||
| Materials — 3.4% | ||||||||
| Monsanto Co. | 1,893,000 | 212,981,430 | ||||||
| Financials — 2.8% | ||||||||
| Charles Schwab Corp. (The) | 5,861,000 | 172,254,790 | ||||||
| Consumer Staples — 1.9% | ||||||||
| Whole Foods Market, Inc. | 3,173,000 | 120,923,030 | ||||||
| Total Common Stocks | $ | 6,038,627,249 | ||||||
| Investment Funds — 6.1% | ||||||||
| Invesco Government & Agency | ||||||||
| Portfolio, Institutional Class, 0.01%**∞Ω | 147,741,989 | 147,741,989 | ||||||
| Touchstone Institutional Money Market Fund, 0.01%^∞Ω | 234,335,221 | 234,335,221 | ||||||
| Total Investment Funds | $ | 382,077,210 | ||||||
| Total Investment Securities —102.4% | ||||||||
| (Cost $4,201,693,980) | $ | 6,420,704,459 | ||||||
| Liabilities in Excess of Other Assets — (2.4%) | (151,634,850 | ) | ||||||
| Net Assets — 100.0% | $ | 6,269,069,609 | ||||||
| * | Non-income producing security. |
| ** | Represents collateral for securities loaned. |
| ^ | Affiliated Fund. See Note 4 in Notes to Financial Statements. |
| † | All or a portion of the security is on loan. The total market value of the securities on loan as of September 30, 2014 was $143,412,285. |
| ∞ | Open-End Fund |
| Ω | Represents the 7-day SEC yield as of September 30, 2014. |
Portfolio Abbreviation:
ADR - American Depositary Receipt
PLC - Public Limited Company
Other Information:
The inputs or methodology used for valuing securities may not be an indication of the risk associated with investing in those securities. For more information on valuation inputs, and their aggregation into the levels used in the table below, please refer to the security valuation section in the accompanying Notes to Financial Statements.
Valuation inputs at Reporting Date:
| Description | Level 1 | Level 2 | Level 3 | Total | ||||||||||||
| Common Stocks | $ | 6,038,627,249 | $ | — | $ | — | $ | 6,038,627,249 | ||||||||
| Investment Funds | 382,077,210 | — | — | 382,077,210 | ||||||||||||
| $ | 6,420,704,459 | |||||||||||||||
See accompanying Notes to Financial Statements.
| 75 |
Touchstone Small Cap Core Fund – September 30, 2014
| Market | ||||||||
| Shares | Value | |||||||
| Common Stocks — 98.6% | ||||||||
| Consumer Discretionary — 26.3% | ||||||||
| American Eagle Outfitters, Inc.† | 693,219 | $ | 10,065,540 | |||||
| Cabela's, Inc.*† | 600,266 | 35,355,667 | ||||||
| Columbia Sportswear Co.† | 496,662 | 17,770,566 | ||||||
| Dana Holding Corp. | 1,089,990 | 20,895,108 | ||||||
| Deckers Outdoor Corp.* | 337,550 | 32,803,109 | ||||||
| Service Corp. International | 1,943,970 | 41,095,526 | ||||||
| Sturm Ruger & Co., Inc.† | 362,782 | 17,663,856 | ||||||
| Tempur Sealy International, Inc.* | 568,380 | 31,925,905 | ||||||
| 207,575,277 | ||||||||
| Financials — 20.1% | ||||||||
| Alexander & Baldwin, Inc. | 553,578 | 19,912,201 | ||||||
| Corrections Corp. of America REIT | 916,370 | 31,486,473 | ||||||
| Eaton Vance Corp. | 442,489 | 16,695,110 | ||||||
| First Industrial Realty Trust, Inc. REIT | 1,474,361 | 24,931,445 | ||||||
| MBIA, Inc.* | 1,737,434 | 15,949,644 | ||||||
| Montpelier Re Holdings Ltd. (Bermuda) | 567,952 | 17,657,628 | ||||||
| Tejon Ranch Co.* | 394,221 | 11,053,957 | ||||||
| White Mountains Insurance Group Ltd. (Bermuda) | 32,929 | 20,747,575 | ||||||
| 158,434,033 | ||||||||
| Industrials — 19.3% | ||||||||
| Alliant Techsystems, Inc. | 192,660 | 24,591,122 | ||||||
| Kaman Corp. | 255,038 | 10,022,993 | ||||||
| Matson, Inc. | 582,945 | 14,591,113 | ||||||
| MRC Global, Inc.* | 874,130 | 20,384,712 | ||||||
| Old Dominion Freight Line, Inc.* | 805,754 | 56,918,463 | ||||||
| Orbital Sciences Corp.* | 605,780 | 16,840,683 | ||||||
| Ritchie Bros Auctioneers, Inc. (Canada)† | 411,285 | 9,208,671 | ||||||
| 152,557,757 | ||||||||
| Materials — 14.3% | ||||||||
| Albemarle Corp. | 493,136 | 29,045,710 | ||||||
| NewMarket Corp. | 124,443 | 47,415,272 | ||||||
| Olin Corp. | 1,157,630 | 29,230,158 | ||||||
| Tredegar Corp. | 403,300 | 7,424,752 | ||||||
| 113,115,892 | ||||||||
| Health Care — 5.6% | ||||||||
| Tenet Healthcare Corp.* | 738,857 | 43,880,717 | ||||||
| Energy — 4.6% | ||||||||
| Atwood Oceanics, Inc.* | 604,016 | 26,389,459 | ||||||
| Kinder Morgan Management LLC* | 2 | 211 | ||||||
| World Fuel Services Corp. | 259,914 | 10,375,767 | ||||||
| 36,765,437 | ||||||||
| Information Technology — 4.5% | ||||||||
| Advent Software, Inc. | 536,535 | 16,933,045 | ||||||
| Conversant, Inc.* | 546,315 | 18,711,289 | ||||||
| 35,644,334 | ||||||||
| Consumer Staples — 3.9% | ||||||||
| Pricesmart, Inc. | 363,245 | 31,108,302 | ||||||
| Total Common Stocks | $ | 779,081,749 | ||||||
| Warrants — 0.0% | ||||||||
| Financials — 0.0% | ||||||||
| Tejon Ranch Co., Expiration 08/31/16* | 69,345 | 139,384 | ||||||
| Investment Funds — 10.4% | ||||||||
| Invesco Government & Agency | ||||||||
| Portfolio, Institutional Class, 0.01%**∞Ω | 71,468,812 | 71,468,812 | ||||||
| Touchstone Institutional Money Market Fund, 0.01%^∞Ω | 10,288,621 | 10,288,621 | ||||||
| Total Investment Funds | $ | 81,757,433 | ||||||
| Total Investment Securities —109.0% | ||||||||
| (Cost $673,276,175) | $ | 860,978,566 | ||||||
| Liabilities in Excess of Other Assets — (9.0%) | (70,974,214 | ) | ||||||
| Net Assets — 100.0% | $ | 790,004,352 |
| * | Non-income producing security. |
| ** | Represents collateral for securities loaned. |
| ^ | Affiliated Fund. See Note 4 in Notes to Financial Statements. |
| † | All or a portion of the security is on loan. The total market value of the securities on loan as of September 30, 2014 was $69,629,173. |
| ∞ | Open-End Fund |
| Ω | Represents the 7-day SEC yield as of September 30, 2014. |
Portfolio Abbreviations:
LLC- Limited Liability Company
REIT - Real Estate Investment Trust
| 76 |
Touchstone Small Cap Core Fund (Continued)
Other Information:
The inputs or methodology used for valuing securities may not be an indication of the risk associated with investing in those securities. For more information on valuation inputs, and their aggregation into the levels used in the table below, please refer to the security valuation section in the accompanying Notes to Financial Statements.
Valuation inputs at Reporting Date:
| Description | Level 1 | Level 2 | Level 3 | Total | ||||||||||||
| Common Stocks | $ | 779,081,749 | $ | — | $ | — | $ | 779,081,749 | ||||||||
| Warrants | 139,384 | — | — | 139,384 | ||||||||||||
| Investment Funds | 81,757,433 | — | — | 81,757,433 | ||||||||||||
| $ | 860,978,566 | |||||||||||||||
See accompanying Notes to Financial Statements.
| 77 |
Touchstone Small Cap Value Fund – September 30, 2014
| Market | ||||||||
| Shares | Value | |||||||
| Common Stocks — 101.0% | ||||||||
| Financials — 38.3% | ||||||||
| Astoria Financial Corp. | 84,770 | $ | 1,050,300 | |||||
| Brookline Bancorp, Inc. | 146,850 | 1,255,568 | ||||||
| Capitol Federal Financial, Inc. | 98,647 | 1,166,008 | ||||||
| Chemical Financial Corp. | 46,460 | 1,249,309 | ||||||
| Columbia Banking System, Inc. | 44,100 | 1,094,121 | ||||||
| CVB Financial Corp. | 44,440 | 637,714 | ||||||
| First Financial Bancorp | 87,799 | 1,389,858 | ||||||
| First Merchants Corp. | 15,920 | 321,743 | ||||||
| FNB Corp. | 112,175 | 1,344,978 | ||||||
| Hancock Holding Co. | 49,783 | 1,595,545 | ||||||
| Healthcare Realty Trust, Inc. REIT | 31,500 | 745,920 | ||||||
| Iberiabank Corp. | 17,366 | 1,085,549 | ||||||
| Infinity Property & Casualty Corp. | 33,987 | 2,175,508 | ||||||
| MB Financial, Inc. | 35,180 | 973,782 | ||||||
| National Bank Holdings Corp. - Class A | 88,680 | 1,695,562 | ||||||
| National Penn Bancshares, Inc. | 141,775 | 1,376,635 | ||||||
| New Residential Investment Corp., REIT | 209,658 | 1,222,306 | ||||||
| Northfield Bancorp, Inc. | 33,570 | 457,223 | ||||||
| Northwest Bancshares, Inc. | 152,100 | 1,840,410 | ||||||
| Old National Bancorp. | 81,440 | 1,056,277 | ||||||
| Susquehanna Bancshares, Inc. | 108,530 | 1,085,300 | ||||||
| Trustmark Corp. | 33,700 | 776,280 | ||||||
| Washington Federal, Inc. | 34,065 | 693,563 | ||||||
| Westamerica Bancorporation† | 34,715 | 1,614,942 | ||||||
| 27,904,401 | ||||||||
| Industrials — 20.7% | ||||||||
| ABM Industries, Inc. | 51,285 | 1,317,512 | ||||||
| Acacia Research Corp.† | 82,976 | 1,284,468 | ||||||
| Astec Industries, Inc. | 22,790 | 831,151 | ||||||
| Briggs & Stratton Corp. | 70,430 | 1,269,149 | ||||||
| Forward Air Corp. | 25,390 | 1,138,234 | ||||||
| General Cable Corp. | 35,670 | 537,904 | ||||||
| Granite Construction, Inc. | 60,480 | 1,923,869 | ||||||
| Harsco Corp. | 58,425 | 1,250,879 | ||||||
| Herman Miller, Inc. | 40,480 | 1,208,328 | ||||||
| Knoll, Inc. | 107,300 | 1,857,363 | ||||||
| McGrath RentCorp | 6,350 | 217,170 | ||||||
| Resources Connection, Inc. | 82,245 | 1,146,495 | ||||||
| Simpson Manufacturing Co., Inc. | 35,840 | 1,044,736 | ||||||
| Watsco, Inc. | 500 | 43,089 | ||||||
| 15,070,347 | ||||||||
| Information Technology — 10.0% | ||||||||
| ADTRAN, Inc. | 59,950 | 1,230,774 | ||||||
| Blackbaud, Inc. | 55,950 | 2,198,276 | ||||||
| Cohu, Inc. | 64,046 | 766,631 | ||||||
| Diebold, Inc. | 31,875 | 1,125,825 | ||||||
| Micrel, Inc. | 109,121 | 1,312,726 | ||||||
| Tessera Technologies, Inc. | 25,255 | 671,278 | ||||||
| 7,305,510 | ||||||||
| Consumer Discretionary — 7.5% | ||||||||
| Abercrombie & Fitch Co. - Class A | 3,500 | 127,189 | ||||||
| Ethan Allen Interiors, Inc. | 57,135 | 1,302,678 | ||||||
| Guess?, Inc. | 20,070 | 440,938 | ||||||
| MDC Holdings, Inc.† | 35,645 | 902,531 | ||||||
| Meredith Corp. | 27,575 | 1,180,210 | ||||||
| Pier 1 Imports, Inc. | 41,130 | 489,036 | ||||||
| Sotheby's | 4,570 | 163,240 | ||||||
| Stage Stores, Inc. | 49,010 | 838,561 | ||||||
| 5,444,383 | ||||||||
| Consumer Staples — 6.8% | ||||||||
| Dean Foods Co.† | 168,215 | 2,228,849 | ||||||
| Snyder's-Lance, Inc. | 54,520 | 1,444,780 | ||||||
| Universal Corp.† | 28,730 | 1,275,325 | ||||||
| 4,948,954 | ||||||||
| Materials — 6.5% | ||||||||
| Greif, Inc. - Class A | 26,280 | 1,151,327 | ||||||
| Haynes International, Inc. | 14,960 | 688,010 | ||||||
| Kronos Worldwide, Inc. | 146,740 | 2,022,077 | ||||||
| Schnitzer Steel Industries, Inc.- Class A | 37,425 | 900,071 | ||||||
| 4,761,485 | ||||||||
| Energy — 6.0% | ||||||||
| Gulfmark Offshore, Inc. - Class A | 57,360 | 1,798,236 | ||||||
| PBF Energy, Inc. - Class A | 55,805 | 1,339,320 | ||||||
| Tidewater, Inc. | 22,950 | 895,738 | ||||||
| Tsakos Energy Navigation Ltd. (Bermuda) | 55,600 | 354,728 | ||||||
| 4,388,022 | ||||||||
| Utilities — 3.2% | ||||||||
| California Water Service Group | 102,220 | 2,293,817 | ||||||
| Health Care — 2.0% | ||||||||
| Techne Corp. | 15,765 | 1,474,816 | ||||||
| Total Common Stocks | $ | 73,591,735 | ||||||
| Investment Funds — 9.4% | ||||||||
| Invesco Government & Agency | ||||||||
| Portfolio, Institutional Class, 0.01%**∞Ω | 6,717,511 | 6,717,511 | ||||||
| Touchstone Institutional Money Market Fund, 0.01%^∞Ω | 126,728 | 126,728 | ||||||
| Total Investment Funds | $ | 6,844,239 | ||||||
| Total Investment Securities —110.4% | ||||||||
| (Cost $83,802,820) | 80,435,974 | |||||||
| Liabilities in Excess of Other Assets — (10.4%) | (7,566,415 | ) | ||||||
| Net Assets — 100.0% | $ | 72,869,559 | ||||||
| 78 |
Touchstone Small Cap Value Fund (Continued)
| ** | Represents collateral for securities loaned. |
| ^ | Affiliated Fund. See Note 4 in Notes to Financial Statements. |
| † | All or a portion of the security is on loan. The total market value of the securities on loan as of September 30, 2014 was $6,513,533. |
| ∞ | Open-End Fund |
| Ω | Represents the 7-day SEC yield as of September 30, 2014. |
Portfolio Abbreviations:
REIT - Real Estate Investment Trust
Other Information:
The inputs or methodology used for valuing securities may not be an indication of the risk associated with investing in those securities. For more information on valuation inputs, and their aggregation into the levels used in the table below, please refer to the security valuation section in the accompanying Notes to Financial Statements.
Valuation inputs at Reporting Date:
| Description | Level 1 | Level 2 | Level 3 | Total | ||||||||||||
| Common Stocks | $ | 73,591,735 | $ | — | $ | — | $ | 73,591,735 | ||||||||
| Investment Funds | 6,844,239 | — | — | 6,844,239 | ||||||||||||
| $ | 80,435,974 | |||||||||||||||
See accompanying Notes to Financial Statements.
| 79 |
Touchstone Total Return Bond Fund – September 30, 2014
| Principal | Market | |||||||
| Amount | Value | |||||||
| Corporate Bonds — 37.7% | ||||||||
| Industrials — 11.1% | ||||||||
| $ | 49,298 | Astro Offshore Corp., | ||||||
| 6.000%, 12/20/19 | $ | 52,356 | ||||||
| 82,892 | Burlington Northern and Santa Fe | |||||||
| Railway Co. 1998-C Pass Through | ||||||||
| Trust, 6.230%, 7/2/18 | 87,780 | |||||||
| 115,607 | Burlington Northern and Santa Fe | |||||||
| Railway Co. 2004-1 Pass Through | ||||||||
| Trust, 4.575%, 1/15/21 | 124,040 | |||||||
| 434,391 | Burlington Northern and Santa Fe | |||||||
| Railway Co. 2005-3 Pass Through | ||||||||
| Trust, 4.830%, 1/15/23 | 473,903 | |||||||
| 857,981 | Burlington Northern and Santa Fe | |||||||
| Railway Co. 2005-4 Pass Through | ||||||||
| Trust, 4.967%, 4/1/23 | 934,039 | |||||||
| 363,000 | Canal Barge Co., Inc., 4.500%, 11/12/34 | 413,832 | ||||||
| 1,791,587 | Continental Airlines 2000-2 Class A-1 | |||||||
| Pass Through Trust, 7.707%, 4/2/21 | 2,017,685 | |||||||
| 637,926 | CSX Transportation, Inc., | |||||||
| 6.251%, 1/15/23 | 751,157 | |||||||
| 1,243,549 | Delta Air Lines 2010-2 Class A Pass | |||||||
| Through Trust, 4.950%, 5/23/19 | 1,336,815 | |||||||
| 1,332,505 | Federal Express Corp. 1998 Pass | |||||||
| Through Trust, 6.845%, 1/15/19 | 1,479,080 | |||||||
| 345,756 | Federal Express Corp. 1999 Pass | |||||||
| Through Trust, 7.650%, 1/15/22 | 414,907 | |||||||
| 176,000 | Matson Navigation Co., Inc., | |||||||
| 5.337%, 9/4/28 | 196,298 | |||||||
| 1,027,000 | Republic Services, Inc., | |||||||
| 5.250%, 11/15/21 | 1,163,659 | |||||||
| 1,190,607 | Southwest Airlines Co. 2007-1 Pass | |||||||
| Through Trust, 6.150%, 8/1/22 | 1,367,412 | |||||||
| 135,930 | Sterling Equipment, 6.125%, 9/28/19 | 150,903 | ||||||
| 83,696 | Union Pacific Railroad Co. 2001 Pass | |||||||
| Through Trust, 6.630%, 1/27/22 | 94,301 | |||||||
| 938,308 | Union Pacific Railroad Co. 2003 Pass | |||||||
| Through Trust, 4.698%, 1/2/24 | 1,023,536 | |||||||
| 533,801 | Union Pacific Railroad Co. 2006 Pass | |||||||
| Through Trust, 5.866%, 7/2/30 | 632,171 | |||||||
| 1,325,000 | United Rentals North America, Inc., | |||||||
| 5.750%, 11/15/24 | 1,341,562 | |||||||
| 1,587,000 | Vessel Management Services, Inc., | |||||||
| 5.125%, 4/16/35 | 1,814,350 | |||||||
| $ | 15,869,786 | |||||||
| Financials — 11.0% | ||||||||
| 1,885,000 | American Express Co., | |||||||
| 2.650%, 12/2/22 | 1,817,207 | |||||||
| 1,216,000 | Delphi Financial Group, Inc., | |||||||
| 7.875%, 1/31/20 | 1,455,635 | |||||||
| 667,965 | EJM Airport LLC, 6.271%, 5/15/20 | 756,135 | ||||||
| 2,000,000 | Fishers Lane Associates LLC, 144a, | |||||||
| 3.666%, 8/5/30 | 1,966,312 | |||||||
| 1,350,000 | Ford Motor Credit Co. LLC, | |||||||
| 4.375%, 8/6/23 | 1,414,723 | |||||||
| 1,604,000 | General Electric Capital Corp. MTN, | |||||||
| 5.625%, 5/1/18 | 1,813,385 | |||||||
| 1,500,000 | Provident Cos., Inc., 7.000%, 7/15/18 | 1,726,221 | ||||||
| 1,000,000 | Torchmark Corp., 3.800%, 9/15/22 | 1,024,995 | ||||||
| 2,000,000 | USB Capital IX, 3.500%, 10/29/49(A) | 1,700,000 | ||||||
| 2,000,000 | Wachovia Capital Trust III, | |||||||
| 5.570%, 3/29/49(A) | 1,937,500 | |||||||
| $ | 15,612,113 | |||||||
| Utilities — 7.5% | ||||||||
| 1,576,966 | Bruce Mansfield Unit, 6.850%, 6/1/34 | 1,729,989 | ||||||
| 450,000 | California Water Service Co., | |||||||
| 5.500%, 12/1/40 | 546,035 | |||||||
| 800,000 | Commonwealth Edison Co., | |||||||
| 5.900%, 3/15/36 | 999,630 | |||||||
| 1,780,000 | Dominion Resources, Inc., | |||||||
| 2.533%, 9/30/66(A) | 1,645,334 | |||||||
| 1,700,000 | Entergy Louisiana LLC, | |||||||
| 4.440%, 1/15/26 | 1,848,226 | |||||||
| 2,000,000 | NextEra Energy Capital Holdings, Inc., | |||||||
| 6.350%, 10/1/66(A) | 2,000,000 | |||||||
| 1,800,000 | South Carolina Electric & Gas Co., | |||||||
| 4.600%, 6/15/43 | 1,893,285 | |||||||
| $ | 10,662,499 | |||||||
| Energy — 3.2% | ||||||||
| 1,253,000 | Chesapeake Energy Corp., | |||||||
| 6.625%, 8/15/20 | 1,382,059 | |||||||
| 1,551,000 | Petrobras International Finance Co. - | |||||||
| Pifco, 3.500%, 2/6/17 | 1,577,956 | |||||||
| 1,500,000 | Petroleos Mexicanos (Mexico), | |||||||
| 4.875%, 1/24/22 | 1,593,750 | |||||||
| $ | 4,553,765 | |||||||
| Consumer Staples — 2.1% | ||||||||
| 1,225,308 | American Airlines 2011-1 Class B Pass | |||||||
| Through Trust, 144a, | ||||||||
| 7.000%, 1/31/18 | 1,311,080 | |||||||
| 1,475,671 | CVS Pass-Through Trust, | |||||||
| 6.036%, 12/10/28 | 1,706,626 | |||||||
| $ | 3,017,706 | |||||||
| Telecommunication Services — 1.2% | ||||||||
| 1,500,000 | Verizon Communications, Inc., | |||||||
| 6.000%, 4/1/41 | 1,747,260 | |||||||
| Transportation — 0.8% | ||||||||
| 1,056,000 | Totem Ocean Trailer Express, Inc., | |||||||
| 6.365%, 4/15/28 | 1,199,183 | |||||||
| Health Care — 0.8% | ||||||||
| 1,075,000 | HCA, Inc., 7.250%, 9/15/20 | 1,128,750 | ||||||
| Total Corporate Bonds | $ | 53,791,062 | ||||||
| 80 |
Touchstone Total Return Bond Fund (Continued)
| Principal | Market | |||||||
| Amount | Value | |||||||
| Asset-Backed Securities — 21.3% | ||||||||
| $ | 1,319,633 | 321 Henderson Receivables I LLC, Ser | ||||||
| 2012-1A, Class A, 144a, | ||||||||
| 4.210%, 2/16/65 | $ | 1,387,813 | ||||||
| 1,264,517 | 321 Henderson Receivables I LLC, Ser | |||||||
| 2012-2A, Class A, 144a, | ||||||||
| 3.840%, 10/15/59 | 1,292,835 | |||||||
| 575,000 | FPL Recovery Funding LLC, Ser | |||||||
| 2007-A, Class A4, 5.256%, 8/1/21 | 629,946 | |||||||
| 1,325,000 | JCP&L Transition Funding LLC, Ser | |||||||
| 2006-A, Class A4, 5.610%, 6/5/23 | 1,523,231 | |||||||
| 55,213 | Small Business Administration | |||||||
| Participation Certificates, Ser | ||||||||
| 2001-20A, Class 1, 6.290%, 1/1/21 | 59,511 | |||||||
| 283,117 | Small Business Administration | |||||||
| Participation Certificates, Ser | ||||||||
| 2002-20H, Class 1, 5.310%, 8/1/22 | 303,760 | |||||||
| 268,362 | Small Business Administration | |||||||
| Participation Certificates, Ser | ||||||||
| 2003-20B, Class 1, 4.840%, 2/1/23 | 287,509 | |||||||
| 88,289 | Small Business Administration | |||||||
| Participation Certificates, Ser | ||||||||
| 2003-20D, Class 1, 4.760%, 4/1/23 | 94,643 | |||||||
| 68,210 | Small Business Administration | |||||||
| Participation Certificates, Ser | ||||||||
| 2004-20D, Class 1, 4.770%, 4/1/24 | 72,094 | |||||||
| 581,748 | Small Business Administration | |||||||
| Participation Certificates, Ser | ||||||||
| 2004-20K, Class 1, 4.880%, 11/1/24 | 623,809 | |||||||
| 27,691 | Small Business Administration | |||||||
| Participation Certificates, Ser | ||||||||
| 2005-10E, Class 1, 4.540%, 9/1/15 | 28,102 | |||||||
| 327,828 | Small Business Administration | |||||||
| Participation Certificates, Ser | ||||||||
| 2005-20B, Class 1, 4.625%, 2/1/25 | 346,087 | |||||||
| 301,876 | Small Business Administration | |||||||
| Participation Certificates, Ser | ||||||||
| 2005-20H, Class 1, 5.110%, 8/1/25 | 326,152 | |||||||
| 1,473,643 | Small Business Administration | |||||||
| Participation Certificates, Ser | ||||||||
| 2006-20B, Class 1, 5.350%, 2/1/26 | 1,584,679 | |||||||
| 525,591 | Small Business Administration | |||||||
| Participation Certificates, Ser | ||||||||
| 2006-20H, Class 1, 5.700%, 8/1/26 | 580,297 | |||||||
| 1,293,788 | Small Business Administration | |||||||
| Participation Certificates, Ser | ||||||||
| 2006-20K, Class 1, 5.360%, 11/1/26 | 1,393,579 | |||||||
| 997,724 | Small Business Administration | |||||||
| Participation Certificates, Ser | ||||||||
| 2006-20L, Class 1, 5.120%, 12/1/26 | 1,082,030 | |||||||
| 1,125,857 | Small Business Administration | |||||||
| Participation Certificates, Ser | ||||||||
| 2007-20A, Class 1, 5.320%, 1/1/27 | 1,247,313 | |||||||
| 1,441,190 | Small Business Administration | |||||||
| Participation Certificates, Ser | ||||||||
| 2007-20E, Class 1, 5.310%, 5/1/27 | 1,596,635 | |||||||
| 572,393 | Small Business Administration | |||||||
| Participation Certificates, Ser | ||||||||
| 2007-20F, Class 1, 5.710%, 6/1/27 | 637,678 | |||||||
| 1,300,114 | Small Business Administration | |||||||
| Participation Certificates, Ser | ||||||||
| 2007-20L, Class 1, 5.290%, 12/1/27 | 1,440,075 | |||||||
| 771,607 | Small Business Administration | |||||||
| Participation Certificates, Ser | ||||||||
| 2008-20A, Class 1, 5.170%, 1/1/28 | 847,104 | |||||||
| 930,966 | Small Business Administration | |||||||
| Participation Certificates, Ser | ||||||||
| 2008-20K, Class 1, 6.770%, 11/1/28 | 1,058,151 | |||||||
| 1,099,818 | Small Business Administration | |||||||
| Participation Certificates, Ser | ||||||||
| 2009-20B, Class 1, 4.760%, 2/1/29 | 1,207,898 | |||||||
| 1,094,960 | Small Business Administration | |||||||
| Participation Certificates, Ser | ||||||||
| 2009-20C, Class 1, 4.660%, 3/1/29 | 1,200,589 | |||||||
| 295,124 | Small Business Administration | |||||||
| Participation Certificates, Ser | ||||||||
| 2009-20D, Class 1, 4.310%, 4/1/29 | 317,518 | |||||||
| 1,419,613 | Small Business Administration | |||||||
| Participation Certificates, Ser | ||||||||
| 2009-20E, Class 1, 4.430%, 5/1/29 | 1,529,247 | |||||||
| 945,986 | Small Business Administration | |||||||
| Participation Certificates, Ser | ||||||||
| 2009-20F, Class 1, 4.950%, 6/1/29 | 1,046,123 | |||||||
| 1,431,483 | Small Business Administration | |||||||
| Participation Certificates, Ser | ||||||||
| 2009-20J, Class 1, 3.920%, 10/1/29 | 1,499,071 | |||||||
| 1,375,891 | Small Business Administration | |||||||
| Participation Certificates, Ser | ||||||||
| 2010-20F, Class 1, 3.880%, 6/1/30 | 1,455,958 | |||||||
| 2,071,719 | Small Business Administration | |||||||
| Participation Certificates, Ser | ||||||||
| 2010-20I, Class 1, 3.210%, 9/1/30 | 2,115,751 | |||||||
| 1,566,624 | Small Business Administration | |||||||
| Participation Certificates, Ser | ||||||||
| 2012-10C, Class 1, 1.240%, 5/1/22 | 1,526,580 | |||||||
| Total Asset-Backed Securities | $ | 30,341,768 | ||||||
| U.S. Government Mortgage-Backed Obligations — 15.9% | ||||||||
| 350,107 | FHLMC, Pool #A89148, | |||||||
| 4.000%, 10/1/39 | 369,098 | |||||||
| 225,034 | FNMA, Pool #465711, 4.680%, 8/1/28 | 251,242 | ||||||
| 1,619,828 | FNMA, Pool #469616, 3.500%, 11/1/21 | 1,701,480 | ||||||
| 1,700,000 | FNMA, Pool #469667, 3.540%, 12/1/21 | 1,788,906 | ||||||
| 116,138 | FNMA, Pool #874210, 5.260%, 1/1/25 | 134,512 | ||||||
| 107,895 | FNMA, Pool #888829, 5.832%, 6/1/37 | 124,079 | ||||||
| 170,159 | FNMA, Pool #958736, 4.940%, 5/1/19 | 188,831 | ||||||
| 284,571 | FNMA, Pool #AB1152, 4.000%, 6/1/25 | 303,751 | ||||||
| 438,744 | FNMA, Pool #AD0101, 4.880%, 7/1/19 | 487,790 | ||||||
| 422,190 | FNMA, Pool #AD0166, 4.864%, 8/1/19 | 469,651 | ||||||
| 151,104 | FNMA, Pool #AD0342, 4.670%, 10/1/19 | 164,945 | ||||||
| 447,380 | FNMA, Pool #AD0786, 4.501%, 1/1/20 | 488,364 | ||||||
| 520,650 | FNMA, Pool #AD0910, 4.603%, 4/1/20 | 573,000 | ||||||
| 81 |
Touchstone Total Return Bond Fund (Continued)
| Principal | Market | |||||||
| Amount | Value | |||||||
| U.S. Government Mortgage-Backed Obligations — 15.9% (Continued) | ||||||||
| $ | 89,215 | FNMA, Pool #AD1608, 4.000%, 2/1/25 | $ | 95,177 | ||||
| 542,970 | FNMA, Pool #AE0209, 4.331%, 6/1/20 | 592,971 | ||||||
| 1,399,169 | FNMA, Pool #AE0446, 4.085%, 9/1/20 | 1,513,386 | ||||||
| 781,982 | FNMA, Pool #AE2771, 3.500%, 8/1/26 | 825,138 | ||||||
| 521,851 | FNMA, Pool #AE8886, 3.500%, 12/1/25 | 549,165 | ||||||
| 325,237 | FNMA, Pool #AH1519, 3.500%, 12/1/25 | 342,628 | ||||||
| 362,623 | FNMA, Pool #AH8854, 4.500%, 4/1/41 | 392,563 | ||||||
| 585,307 | FNMA, Pool #AI1856, 4.500%, 5/1/41 | 637,446 | ||||||
| 323,870 | FNMA, Pool #AL0247, 4.000%, 4/1/41 | 343,453 | ||||||
| 1,961,282 | FNMA, Pool #AM0566, 1.940%, 9/1/19 | 1,946,420 | ||||||
| 1,366,879 | FNMA, Pool #AT0924, 2.000%, 3/1/28 | 1,328,994 | ||||||
| 1,720,307 | GNMA, Pool #5276, 3.000%, 1/20/27 | 1,793,940 | ||||||
| 1,986,943 | GNMA, Pool #710077, 4.700%, 5/20/61 | 2,141,813 | ||||||
| 350,032 | GNMA, Pool #751408, 4.826%, 6/20/61 | 386,202 | ||||||
| 784,358 | GNMA, Pool #751409, 4.626%, 7/20/61 | 845,657 | ||||||
| 463,881 | GNMA, Pool #752631, | |||||||
| 4.500%, 10/20/40 | 509,515 | |||||||
| 712,977 | GNMA, Pool #756686, 4.697%, 9/20/61 | 772,061 | ||||||
| 536,118 | GNMA, Pool #757327, 4.295%, 7/20/61 | 576,119 | ||||||
| Total U.S. Government Mortgage-Backed Obligations | $ | 22,638,297 | ||||||
| Agency Collateralized Mortgage Obligations — 7.3% | ||||||||
| 1,000,000 | FREMF Mortgage Trust, Ser 2011-K702, | |||||||
| Class B, 144a, 4.936%, 4/25/44(A) | 1,063,704 | |||||||
| 1,000,000 | FREMF Mortgage Trust, Ser 2012-K19, | |||||||
| Class B, 144a, 4.176%, 5/25/45(A) | 1,025,885 | |||||||
| 1,035,000 | FREMF Mortgage Trust, Ser 2012-K710, | |||||||
| Class B, 144a, 3.949%, 6/25/47(A) | 1,062,090 | |||||||
| 34,417 | GNMA, Ser 2009-86, Class A, | |||||||
| 3.536%, 9/16/35 | 34,678 | |||||||
| 219,159 | GNMA, Ser 2010-49, Class A, | |||||||
| 2.870%, 3/16/51 | 221,077 | |||||||
| 648,096 | GNMA, Ser 2011-1, Class B, | |||||||
| 4.344%, 6/16/41(A) | 659,286 | |||||||
| 931,321 | GNMA, Ser 2011-147, Class A, | |||||||
| 2.174%, 7/16/38 | 932,827 | |||||||
| 716,466 | GNMA, Ser 2011-31, Class A, | |||||||
| 2.210%, 12/16/35 | 720,432 | |||||||
| 242,290 | GNMA, Ser 2011-47, Class A, | |||||||
| 2.070%, 4/16/32 | 242,539 | |||||||
| 437,224 | GNMA, Ser 2012-22, Class AB, | |||||||
| 1.661%, 3/16/33 | 437,516 | |||||||
| 2,336,296 | GNMA, Ser 2012-53, Class AC, | |||||||
| 2.381%, 12/16/43 | 2,296,892 | |||||||
| 1,685,765 | GNMA, Ser 2013-40, Class AC, | |||||||
| 1.584%, 1/16/46 | 1,644,116 | |||||||
| Total Agency Collateralized Mortgage Obligations | $ | 10,341,042 | ||||||
| Commercial Mortgage-Backed Securities — 4.7% | ||||||||
| 1,675,000 | Citigroup Commercial Mortgage Trust, | |||||||
| Ser 2007-C6, Class A4, | ||||||||
| 5.899%, 12/10/49(A) | 1,837,458 | |||||||
| 505,000 | Citigroup/Deutsche Bank Commercial | |||||||
| Mortgage Trust, Ser 2006-CD3, | ||||||||
| Class AJ, 5.688%, 10/15/48 | 484,621 | |||||||
| 1,190,750 | Commercial Mortgage Trust, Ser | |||||||
| 2005-GG5, Class A5, | ||||||||
| 5.224%, 4/10/37(A) | 1,219,454 | |||||||
| 1,292,432 | GS Mortgage Securities Corp. II, Ser | |||||||
| 2007-GG10, Class A4, | ||||||||
| 5.991%, 8/10/45(A) | 1,411,466 | |||||||
| 200,000 | JP Morgan Chase Commercial | |||||||
| Mortgage Securities Corp., Ser | ||||||||
| 2005-LDP4, Class AM, | ||||||||
| 4.999%, 10/15/42(A) | 206,315 | |||||||
| 92,607 | JP Morgan Chase Commercial | |||||||
| Mortgage Securities Corp., Ser | ||||||||
| 2006-CB17, Class A3, | ||||||||
| 5.450%, 12/12/43 | 92,471 | |||||||
| 1,400,000 | ML-CFC Commercial Mortgage Trust, | |||||||
| Ser 2006-3, Class AM, | ||||||||
| 5.456%, 7/12/46(A) | 1,498,896 | |||||||
| Total Commercial Mortgage-Backed Securities | $ | 6,750,681 | ||||||
| Municipal Bonds — 4.7% | ||||||||
| California — 0.9% | ||||||||
| 1,264,102 | CA State HFA Residential Mortgage | |||||||
| Rev, Ser A, 2.900%, 2/1/42 | 1,252,156 | |||||||
| Florida — 1.0% | ||||||||
| 1,447,081 | FL State HFC Rev, Homeownership | |||||||
| Mortgage Special Project, | ||||||||
| 2.800%, 7/1/41 | 1,411,396 | |||||||
| Missouri — 1.0% | ||||||||
| 1,420,000 | MO State Housing Development | |||||||
| Commission, Special | ||||||||
| Homeownership Loan Program, Ser | ||||||||
| C, 2.650%, 11/1/40 | 1,368,198 | |||||||
| Texas — 0.9% | ||||||||
| 1,325,000 | TX State Dept of Housing, Ser A, | |||||||
| 2.800%, 3/1/36 | 1,302,422 | |||||||
| Virginia — 0.9% | ||||||||
| 1,397,536 | VA State Housing Development | |||||||
| Authority, Pass Thru Ser C, | ||||||||
| 2.750%, 4/25/42 | 1,323,900 | |||||||
| Total Municipal Bonds | $ | 6,658,072 | ||||||
| U.S. Treasury Obligations — 2.6% | ||||||||
| 3,385,000 | U.S. Treasury Strip, Principal, | |||||||
| 0.000%, 5/15/40# | 1,478,724 | |||||||
| 5,650,000 | U.S. Treasury Strip, Principal, | |||||||
| 0.000%, 5/15/43# | 2,175,137 | |||||||
| Total U.S. Treasury Obligations | $ | 3,653,861 | ||||||
| 82 |
Touchstone Total Return Bond Fund (Continued)
| Principal | Market | |||||||
| Amount | Value | |||||||
| U.S. Government Agency Obligations — 1.4% | ||||||||
| $ | 24,128 | FHA USGI, 7.430%, 8/1/23 | $ | 24,128 | ||||
| 26,405 | Small Business Administration | |||||||
| Participation Certificates, | ||||||||
| 6.150%, 2/1/18 | 27,546 | |||||||
| 104,685 | Small Business Administration | |||||||
| Participation Certificates, Ser | ||||||||
| 2001-20K, Class 1, 5.340%, 11/1/21 | 112,260 | |||||||
| 1,650,000 | Tennessee Valley Authority, | |||||||
| 4.650%, 6/15/35 | 1,856,562 | |||||||
| Total U.S. Government Agency Obligations | $ | 2,020,496 | ||||||
| Sovereign Government Obligations — 1.3% | ||||||||
| 4,878 | Ecuador Government AID Bond, | |||||||
| 7.050%, 5/1/15 | 4,982 | |||||||
| 1,505,000 | Israel Government AID Bond, | |||||||
| 5.500%, 9/18/33 | 1,916,070 | |||||||
| Total Sovereign Government Obligations | $ | 1,921,052 | ||||||
| Shares | ||||||||
| Investment Fund — 2.3% | ||||||||
| 3,288,138 | Touchstone Institutional Money | |||||||
| Market Fund, 0.01%^∞Ω | 3,288,138 | |||||||
| Total Investment Securities —99.2% | ||||||||
| (Cost $140,095,792) | $ | 141,404,469 | ||||||
| Other Assets in Excess of | ||||||||
| Liabilities — 0.8% | 1,174,063 | |||||||
| Net Assets — 100.0% | $ | 142,578,532 | ||||||
| # | Strip Security - Separate trading of Registered Interest and Principal. Holders of a principal strip security are entitled to the portion of the payment representing principal only. |
| (A) | Variable rate security - Rate reflected is the rate in effect as of September 30, 2014. |
| ^ | Affiliated Fund. See Note 4 in Notes to Financial Statements. |
| ∞ | Open-End Fund |
| Ω | Represents the 7-day SEC yield as of September 30, 2014. |
Portfolio Abbreviations:
AID - Agency for International Development
FHA - Federal Housing Administration
FHLMC - Federal Home Loan Mortgage Corporation
FNMA - Federal National Mortgage Association
FREMF - Finnish Real Estate Management Federation
GNMA - Government National Mortgage Association
HFA - Housing Finance Authority/Agency
HFC - Housing Finance Corporation
LLC - Limited Liability Company
MTN - Medium Term Note
| 144a - | This is a restricted security that was sold in a transaction qualifying for the exemption under Rule 144A of the Securities Act of 1933. This security may be sold in transactions exempt from registration, normally to qualified institutional buyers. At September 30, 2014, these securities were valued at $9,109,719 or 6.4% of net assets. These securities were deemed liquid pursuant to procedures approved by the Board of Trustees. |
| 83 |
Touchstone Total Return Bond Fund (Continued)
Other Information:
The inputs or methodology used for valuing securities may not be an indication of the risk associated with investing in those securities. For more information on valuation inputs, and their aggregation into the levels used in the table below, please refer to the security valuation section in the accompanying Notes to Financial Statements.
Valuation inputs at Reporting Date:
| Description | Level 1 | Level 2 | Level 3 | Total | ||||||||||||
| Corporate Bonds | $ | — | $ | 53,791,062 | $ | — | $ | 53,791,062 | ||||||||
| Asset-Backed Securities | — | 30,341,768 | — | 30,341,768 | ||||||||||||
| U.S. Government Mortgage-Backed Obligations | — | 22,638,297 | — | 22,638,297 | ||||||||||||
| Agency Collateralized Mortgage Obligations | — | 10,341,042 | — | 10,341,042 | ||||||||||||
| Commercial Mortgage-Backed Securities | — | 6,750,681 | — | 6,750,681 | ||||||||||||
| Municipal Bonds | — | 6,658,072 | — | 6,658,072 | ||||||||||||
| U.S. Treasury Obligations | — | 3,653,861 | — | 3,653,861 | ||||||||||||
| U.S. Government Agency Obligations | — | 2,020,496 | — | 2,020,496 | ||||||||||||
| Sovereign Government Obligations | — | 1,921,052 | — | 1,921,052 | ||||||||||||
| Investment Fund | 3,288,138 | — | — | 3,288,138 | ||||||||||||
| $ | 141,404,469 | |||||||||||||||
See accompanying Notes to Financial Statements.
| 84 |
Touchstone Ultra Short Duration Fixed Income Fund – September 30, 2014
| Principal | Market | |||||||
| Amount | Value | |||||||
| Corporate Bonds — 26.1% | ||||||||
| Financials — 9.5% | ||||||||
| $ | 3,750,000 | Arden Realty LP, 5.250%, 3/1/15 | $ | 3,779,032 | ||||
| 4,700,000 | Bank of America Corp., | |||||||
| 5.000%, 1/15/15 | 4,760,860 | |||||||
| 540,000 | Bank of Montreal MTN, | |||||||
| 0.800%, 11/6/15 | 541,489 | |||||||
| 2,200,000 | Bank of Nova Scotia (The), | |||||||
| 2.050%, 10/7/15 | 2,235,268 | |||||||
| 1,750,000 | Canadian Imperial Bank of | |||||||
| Commerce/Canada, | ||||||||
| 2.350%, 12/11/15 | 1,785,136 | |||||||
| 4,800,000 | Credit Suisse/New York (Switzerland) | |||||||
| MTN, 0.725%, 5/26/17(A) | 4,816,339 | |||||||
| 5,200,000 | Duke Realty LP, 7.375%, 2/15/15 | 5,327,535 | ||||||
| 5,150,000 | Ford Motor Credit Co. LLC, | |||||||
| 1.483%, 5/9/16(A) | 5,220,684 | |||||||
| 4,653,000 | General Electric Capital Corp., | |||||||
| 1.000%, 12/11/15 | 4,678,447 | |||||||
| 2,015,000 | General Electric Capital Corp., | |||||||
| 2.250%, 11/9/15 | 2,050,466 | |||||||
| 9,500,000 | JPMorgan Chase & Co., | |||||||
| 2.600%, 1/15/16 | 9,701,628 | |||||||
| 2,300,000 | JPMorgan Chase & Co., 4.750%, 3/1/15 | 2,341,354 | ||||||
| 7,200,000 | Kayne Anderson MLP Investment Co., | |||||||
| 1.484%, 8/19/16(A) | 7,213,327 | |||||||
| 555,000 | KeyBank NA/Cleveland OH, | |||||||
| 7.413%, 5/6/15 | 577,232 | |||||||
| 1,000,000 | Mack-Cali Realty LP, REIT, | |||||||
| 5.125%, 1/15/15 | 1,012,299 | |||||||
| 600,000 | Mellon Funding Corp., | |||||||
| 5.000%, 12/1/14 | 604,747 | |||||||
| 3,000,000 | MetLife Institutional Funding II, 144a, | |||||||
| 0.602%, 1/6/15(A) | 3,002,910 | |||||||
| 1,450,000 | Morgan Stanley, 4.200%, 11/20/14 | 1,450,851 | ||||||
| 1,000,000 | Morgan Stanley, 5.375%, 10/15/15 | 1,047,292 | ||||||
| 1,000,000 | Morgan Stanley MTN, 4.100%, 1/26/15 | 1,011,259 | ||||||
| 337,500 | Prudential Covered Trust, 144a, | |||||||
| 2.997%, 9/30/15 | 344,517 | |||||||
| 2,000,000 | Royal Bank of Canada MTN, | |||||||
| 0.850%, 3/8/16 | 2,001,836 | |||||||
| 840,000 | Royal Bank of Canada MTN, | |||||||
| 2.625%, 12/15/15 | 859,887 | |||||||
| 775,000 | SunTrust Bank/Atlanta GA, | |||||||
| 0.535%, 4/1/15(A) | 774,885 | |||||||
| 500,000 | UBS AG/Stamford CT (Switzerland), | |||||||
| 3.875%, 1/15/15 | 505,218 | |||||||
| 500,000 | Vornado Realty LP, 4.250%, 4/1/15 | 504,578 | ||||||
| 143,020 | WHC-IRS Trust, 6.980%, 5/15/15 | 145,594 | ||||||
| 68,294,670 | ||||||||
| Utilities — 4.0% | ||||||||
| 3,500,000 | AGL Capital Corp., 4.950%, 1/15/15 | 3,542,266 | ||||||
| 600,000 | Alabama Power Co., 0.550%, 10/15/15 | 599,743 | ||||||
| 5,000,000 | Alliant Energy Corp., 4.000%, 10/15/14 | 5,006,005 | ||||||
| 1,000,000 | Niagara Mohawk Power Corp., 144a, | |||||||
| 3.553%, 10/1/14 | 999,999 | |||||||
| 1,100,000 | OGE Energy Corp., 5.000%, 11/15/14 | 1,104,513 | ||||||
| 3,700,000 | Oncor Electric Delivery Co. LLC, | |||||||
| 6.375%, 1/15/15 | 3,760,695 | |||||||
| 7,290,000 | Scottish Power Ltd. (United Kingdom), | |||||||
| 5.375%, 3/15/15 | 7,438,439 | |||||||
| 3,120,000 | Southern Power Co., 4.875%, 7/15/15 | 3,227,219 | ||||||
| 2,879,000 | Trans-Allegheny Interstate Line Co., | |||||||
| 144a, 4.000%, 1/15/15 | 2,906,307 | |||||||
| 28,585,186 | ||||||||
| Energy — 3.6% | ||||||||
| 4,300,000 | Continental Resources, Inc./OK, | |||||||
| 7.125%, 4/1/21 | 4,767,625 | |||||||
| 1,900,000 | Enterprise Products Operating LLC, | |||||||
| 5.600%, 10/15/14 | 1,903,591 | |||||||
| 6,900,000 | Nexen Energy ULC, 5.200%, 3/10/15 | 7,042,147 | ||||||
| 2,400,000 | PC Financial Partnership, | |||||||
| 5.000%, 11/15/14 | 2,413,097 | |||||||
| 2,000,000 | Petrobras Global Finance BV, | |||||||
| 3.250%, 3/17/17 | 2,023,940 | |||||||
| 4,253,000 | Petrobras International Finance Co. | |||||||
| (Cayman Islands), 2.875%, 2/6/15 | 4,279,241 | |||||||
| 3,176,000 | Plains Exploration & Production Co., | |||||||
| 6.625%, 5/1/21 | 3,477,720 | |||||||
| 25,907,361 | ||||||||
| Materials — 2.9% | ||||||||
| 1,000,000 | EI du Pont DE Nemours & Co., | |||||||
| 2.750%, 4/1/16 | 1,031,307 | |||||||
| 1,900,000 | Glencore Canada Corp., | |||||||
| 6.000%, 10/15/15 | 1,992,709 | |||||||
| 3,300,000 | Rio Tinto Finance USA PLC (United | |||||||
| Kingdom), 1.075%, 6/17/16(A) | 3,331,040 | |||||||
| 2,600,000 | Vale Overseas Ltd. (Cayman Islands), | |||||||
| 6.250%, 1/11/16 | 2,760,498 | |||||||
| 4,500,000 | Xstrata Finance Canada Ltd., 144a, | |||||||
| 2.050%, 10/23/15 | 4,550,296 | |||||||
| 4,800,000 | Xstrata Finance Canada Ltd., 144a, | |||||||
| 5.800%, 11/15/16 | 5,227,632 | |||||||
| 1,800,000 | Yara International ASA (Norway), 144a, | |||||||
| 5.250%, 12/15/14 | 1,816,708 | |||||||
| 20,710,190 | ||||||||
| Consumer Discretionary — 2.5% | ||||||||
| 5,675,000 | Daimler Finance North America LLC, | |||||||
| 144a, 1.650%, 4/10/15 | 5,708,176 | |||||||
| 8,000,000 | SABMiller Holdings, Inc., 144a, | |||||||
| 1.850%, 1/15/15 | 8,031,384 | |||||||
| 4,500,000 | Toyota Motor Credit Corp. MTN, | |||||||
| 0.750%, 3/3/17(B) | 4,469,454 | |||||||
| 18,209,014 | ||||||||
| Industrials — 1.2% | ||||||||
| 7,642,000 | Dun & Bradstreet Corp. (The), | |||||||
| 3.250%, 12/1/17 | 7,901,262 | |||||||
| 300,000 | Equifax, Inc., 4.450%, 12/1/14 | 300,440 | ||||||
| 45,009 | Petrodrill Five Ltd. ((Virgin Islands), | |||||||
| 4.390%, 4/15/16 | 46,114 | |||||||
| 85 |
Touchstone Ultra Short Duration Fixed Income Fund (Continued)
| Principal | Market | |||||||
| Amount | Value | |||||||
| Corporate Bonds — 26.1% (Continued) | ||||||||
| Industrials — (Continued) | ||||||||
| $ | 43,763 | Petrodrill Four Ltd. (Virgin Islands), | ||||||
| 4.240%, 1/15/16 | $ | 44,627 | ||||||
| 8,292,443 | ||||||||
| Health Care — 1.1% | ||||||||
| 4,800,000 | Amgen, Inc., 0.615%, 5/22/17(A) | 4,811,270 | ||||||
| 3,200,000 | Ventas Realty LP, 1.550%, 9/26/16 | 3,221,994 | ||||||
| 8,033,264 | ||||||||
| Telecommunication Services — 0.9% | ||||||||
| 5,500,000 | America Movil SAB DE CV, | |||||||
| 2.375%, 9/8/16 | 5,617,535 | |||||||
| 62,500 | BellSouth Telecommunications, Inc., | |||||||
| 6.300%, 12/15/15 | 62,904 | |||||||
| 600,000 | SBA Tower Trust, 144a, | |||||||
| 4.254%, 4/15/15 | 611,194 | |||||||
| 6,291,633 | ||||||||
| Information Technology — 0.4% | ||||||||
| 3,198,000 | Amphenol Corp., 4.750%, 11/15/14 | 3,213,840 | ||||||
| Total Corporate Bonds | $ | 187,537,601 | ||||||
| Asset-Backed Securities — 33.7% | ||||||||
| 6,000,000 | Ally Auto Receivables, Ser 2012-1, | |||||||
| Class B, 144a, 1.840%, 11/15/16 | 6,053,448 | |||||||
| 630,000 | Ally Auto Receivables Trust, Ser | |||||||
| 2010-5, Class B, 144a, | ||||||||
| 2.450%, 6/15/16 | 631,596 | |||||||
| 5,445,000 | Ally Auto Receivables Trust, Ser | |||||||
| 2011-2, Class D, 144a, | ||||||||
| 3.380%, 9/15/17 | 5,476,140 | |||||||
| 2,200,000 | Ally Auto Receivables Trust, Ser | |||||||
| 2012-2, Class C, 144a, | ||||||||
| 2.260%, 7/16/18 | 2,228,743 | |||||||
| 6,506,378 | Ally Auto Receivables Trust, Ser | |||||||
| 2013-SN1, Class A3, | ||||||||
| 0.720%, 5/20/16 | 6,511,128 | |||||||
| 1,747,320 | American Credit Acceptance | |||||||
| Receivables Trust, Ser 2012-3, Class | ||||||||
| A, 144a, 1.640%, 11/15/16 | 1,749,924 | |||||||
| 1,700,000 | AmeriCredit Automobile Receivables, | |||||||
| Ser 2010-4, Class D, 4.200%, 11/8/16 | 1,726,398 | |||||||
| 2,690,744 | AmeriCredit Automobile Receivables, | |||||||
| Ser 2011-2, Class C, | ||||||||
| 3.190%, 10/12/16 | 2,708,688 | |||||||
| 627,064 | AmeriCredit Automobile Receivables | |||||||
| Trust, Ser 2010-3, Class C, | ||||||||
| 3.340%, 4/8/16 | 630,673 | |||||||
| 4,765,299 | AmeriCredit Automobile Receivables | |||||||
| Trust, Ser 2011-1, Class C, | ||||||||
| 2.850%, 8/8/16 | 4,790,011 | |||||||
| 42,107 | AmeriCredit Automobile Receivables | |||||||
| Trust, Ser 2011-3, Class B, | ||||||||
| 2.280%, 6/8/16 | 42,124 | |||||||
| 3,063,273 | AmeriCredit Automobile Receivables | |||||||
| Trust, Ser 2011-4, Class B, | ||||||||
| 2.260%, 9/8/16 | 3,071,106 | |||||||
| 3,000,000 | AmeriCredit Automobile Receivables | |||||||
| Trust, Ser 2011-5, Class C, | ||||||||
| 3.440%, 10/8/17 | 3,065,088 | |||||||
| 285,000 | AmeriCredit Automobile Receivables | |||||||
| Trust, Ser 2012-1, Class B, | ||||||||
| 1.730%, 2/8/17 | 285,949 | |||||||
| 1,720,000 | AmeriCredit Automobile Receivables | |||||||
| Trust, Ser 2012-2, Class B, | ||||||||
| 1.780%, 3/8/17 | 1,729,723 | |||||||
| 343,959 | AmeriCredit Automobile Receivables | |||||||
| Trust, Ser 2012-3, Class A3, | ||||||||
| 0.960%, 1/9/17 | 344,356 | |||||||
| 1,325,000 | AmeriCredit Automobile Receivables | |||||||
| Trust, Ser 2012-3, Class B, | ||||||||
| 1.590%, 7/10/17 | 1,332,843 | |||||||
| 469,023 | AmeriCredit Automobile Receivables | |||||||
| Trust, Ser 2012-4, Class A3, | ||||||||
| 0.670%, 6/8/17 | 469,242 | |||||||
| 7,000,000 | Ammc Vii Ltd., Ser 2006-7A, Class B, | |||||||
| 144a, 0.604%, 12/19/19(A) | 6,998,040 | |||||||
| 967,372 | Ascentium Equipment Receivables | |||||||
| LLC, Ser 2012-1A, Class A, 144a, | ||||||||
| 1.830%, 9/15/19 | 967,116 | |||||||
| 5,750,000 | Ascentium Equipment Receivables | |||||||
| LLC, Ser 2014-1A, Class A2, 144a, | ||||||||
| 1.040%, 1/10/17 | 5,751,363 | |||||||
| 3,046,639 | AXIS Equipment Finance Receivables | |||||||
| II LLC, Ser 2013-1A, Class A, 144a, | ||||||||
| 1.750%, 3/20/17 | 3,046,465 | |||||||
| 7,535,952 | Bayview Financial Acquisition Trust, | |||||||
| Ser 2004-D, Class M1, | ||||||||
| 0.782%, 8/28/44(A) | 7,530,021 | |||||||
| 1,679,317 | California Republic Auto Receivables | |||||||
| Trust, Ser 2012-1, Class A, 144a, | ||||||||
| 1.180%, 8/15/17 | 1,686,168 | |||||||
| 585,000 | Capital Auto Receivables Asset Trust, | |||||||
| Ser 2013-1, Class A3, | ||||||||
| 0.790%, 6/20/17 | 585,846 | |||||||
| 81,281 | CarMax Auto Owner Trust, Ser 2012-1, | |||||||
| Class A3, 0.890%, 9/15/16 | 81,416 | |||||||
| 1,291,912 | CarNow Auto Receivables Trust, Ser | |||||||
| 2013-1A, Class A, 144a, | ||||||||
| 1.160%, 10/16/17 | 1,292,309 | |||||||
| 3,800,000 | Carnow Auto Receivables Trust, Ser | |||||||
| 2014-1A, Class A, 144a, | ||||||||
| 0.960%, 1/17/17 | 3,798,887 | |||||||
| 3,734,999 | CFC 2012-1 LLC, Ser 2014-1A, Class A, | |||||||
| 144a, 1.460%, 12/17/18 | 3,741,583 | |||||||
| 1,457,133 | CFC 2013-1 LLC, Ser 2013-1A, Class A, | |||||||
| 144a, 1.650%, 7/17/17 | 1,460,507 | |||||||
| 6,523,557 | CFC 2013-2 LLC, Ser 2013-2A, Class A, | |||||||
| 144a, 1.750%, 11/15/17 | 6,546,507 | |||||||
| 86 |
Touchstone Ultra Short Duration Fixed Income Fund (Continued)
| Principal | Market | |||||||
| Amount | Value | |||||||
| Asset-Backed Securities — 33.7% (Continued) | ||||||||
| $ | 83,548 | CNH Equipment Trust, Ser 2011-C, | ||||||
| Class A3, 1.190%, 12/15/16 | $ | 83,614 | ||||||
| 77,351 | College & University Facility Loan | |||||||
| Trust, Ser 2 Class D, 4.000%, 6/1/18 | 77,971 | |||||||
| 1,298,467 | Countrywide Asset-Backed | |||||||
| Certificates, Ser 2005-6, Class M1, | ||||||||
| 0.645%, 12/25/35(A) | 1,292,920 | |||||||
| 2,300,000 | Dell Equipment Finance Trust, Ser | |||||||
| 2014-1, Class B, 144a, | ||||||||
| 1.360%, 6/22/20 | 2,298,684 | |||||||
| 5,747,105 | DT Auto Owner Trust, Ser 2013-2A, | |||||||
| Class A, 144a, 0.810%, 9/15/16 | 5,750,525 | |||||||
| 151,413 | Entergy Texas Restoration Funding | |||||||
| LLC, Ser 2009-A, Class A1, | ||||||||
| 2.120%, 2/1/16 | 152,229 | |||||||
| 3,051,601 | Exeter Automobile Receivables Trust, | |||||||
| Ser 2013-1A, Class A, 144a, | ||||||||
| 1.290%, 10/16/17 | 3,056,484 | |||||||
| 1,652,400 | Exeter Automobile Receivables Trust, | |||||||
| Ser 2013-2A, Class A, 144a, | ||||||||
| 1.490%, 11/15/17 | 1,657,905 | |||||||
| 3,262,376 | Exeter Automobile Receivables Trust, | |||||||
| Ser 2014-2A, Class A, 144a, | ||||||||
| 1.060%, 8/15/18 | 3,263,120 | |||||||
| 1,938,396 | Fairway Loan Funding Co., Ser | |||||||
| 2006-1A, Class A2L, 144a, | ||||||||
| 0.603%, 10/17/18(A) | 1,936,417 | |||||||
| 3,630,055 | First Investors Auto Owner Trust, Ser | |||||||
| 2013-3A, Class A2, 144a, | ||||||||
| 0.890%, 9/15/17 | 3,634,861 | |||||||
| 2,087,290 | Ford Credit Auto Owner Trust, Ser | |||||||
| 2010-B, Class B, 2.540%, 2/15/16 | 2,093,550 | |||||||
| 430,000 | GE Capital Credit Card Master Note | |||||||
| Trust, Ser 2012-1, Class A, | ||||||||
| 1.030%, 1/15/18 | 430,701 | |||||||
| 525,000 | Great America Leasing Receivables, | |||||||
| Ser 2013-1, Class A3, 144a, | ||||||||
| 0.780%, 6/15/16 | 525,646 | |||||||
| 345,202 | Harley-Davidson Motorcycle Trust, Ser | |||||||
| 2011-1, Class A4, 1.310%, 3/15/17 | 346,220 | |||||||
| 73,616 | Honda Auto Receivables Owner Trust, | |||||||
| Ser 2011-3, Class A3, | ||||||||
| 0.880%, 9/21/15 | 73,654 | |||||||
| 3,171,490 | Jersey Street CLO Ltd., Ser 2006-1A, | |||||||
| Class A, 144a, 0.484%, 10/20/18(A) | 3,166,171 | |||||||
| 2,913,271 | Madison Avenue Manufactured | |||||||
| Housing Contract, Ser 2002-A, Class | ||||||||
| M2, 2.405%, 3/25/32(A) | 2,911,634 | |||||||
| 3,702,822 | Marriott Vacation Club Owner Trust, | |||||||
| Ser 2009-2A, Class A, 144a, | ||||||||
| 4.809%, 7/20/31 | 3,753,673 | |||||||
| 268,604 | MMAF Equipment Finance LLC, Ser | |||||||
| 2009-AA, Class A4, 144a, | ||||||||
| 3.510%, 1/15/30 | 272,603 | |||||||
| 4,948 | MMAF Equipment Finance LLC, Ser | |||||||
| 2011-AA, Class A3, 144a, | ||||||||
| 1.270%, 9/15/15 | 4,950 | |||||||
| 2,886,414 | Navitas Equipment Receivables LLC, | |||||||
| Ser 2013-1, Class A, 144a, | ||||||||
| 1.950%, 11/15/16 | 2,886,348 | |||||||
| 1,888,062 | NovaStar Mortgage Funding Trust, Ser | |||||||
| 2005-1, Class M2, 0.875%, 6/25/35(A) | 1,888,020 | |||||||
| 5,805,845 | Orange Lake Timeshare Trust, Ser | |||||||
| 2012-AA, Class A, 144a, | ||||||||
| 3.450%, 3/10/27 | 5,979,962 | |||||||
| 782,995 | RAMP Trust, Ser 2003-RZ3, Class A6, | |||||||
| 3.900%, 3/25/33(B) | 799,302 | |||||||
| 2,165,914 | Santander Drive Auto Receivables | |||||||
| Trust, Ser 2010-2, Class C, | ||||||||
| 3.890%, 7/17/17 | 2,168,771 | |||||||
| 6,815,923 | Santander Drive Auto Receivables | |||||||
| Trust, Ser 2010-3, Class C, | ||||||||
| 3.060%, 11/15/17 | 6,915,312 | |||||||
| 32,906 | Santander Drive Auto Receivables | |||||||
| Trust, Ser 2010-B, Class C, 144a, | ||||||||
| 3.020%, 10/17/16 | 32,939 | |||||||
| 1,642,697 | Santander Drive Auto Receivables | |||||||
| Trust, Ser 2011-1, Class C, | ||||||||
| 3.110%, 5/16/16 | 1,650,552 | |||||||
| 1,749,339 | Santander Drive Auto Receivables | |||||||
| Trust, Ser 2011-3, Class C, | ||||||||
| 3.090%, 5/15/17 | 1,765,571 | |||||||
| 4,731,923 | Santander Drive Auto Receivables | |||||||
| Trust, Ser 2012-2, Class B, | ||||||||
| 2.090%, 8/15/16 | 4,741,893 | |||||||
| 4,709,228 | Santander Drive Auto Receivables | |||||||
| Trust, Ser 2012-3, Class B, | ||||||||
| 1.940%, 12/15/16 | 4,726,435 | |||||||
| 4,790,000 | Santander Drive Auto Receivables | |||||||
| Trust, Ser 2012-4, Class B, | ||||||||
| 1.830%, 3/15/17 | 4,809,376 | |||||||
| 4,000,000 | Santander Drive Auto Receivables | |||||||
| Trust, Ser 2012-5, Class B, | ||||||||
| 1.560%, 8/15/18 | 4,021,040 | |||||||
| 10,535,000 | Santander Drive Auto Receivables | |||||||
| Trust, Ser 2012-6, Class B, | ||||||||
| 1.330%, 5/15/17 | 10,564,171 | |||||||
| 821,105 | Sierra Timeshare Receivables Funding | |||||||
| LLC, Ser 2011-1A, Class A, 144a, | ||||||||
| 3.350%, 4/20/26 | 842,229 | |||||||
| 2,803,665 | Sierra Timeshare Receivables Funding | |||||||
| LLC, Ser 2011-2A, Class A, 144a, | ||||||||
| 3.260%, 5/20/28 | 2,860,442 | |||||||
| 1,589,103 | Sierra Timeshare Receivables Funding | |||||||
| LLC, Ser 2012-1A, Class A, 144a, | ||||||||
| 2.840%, 11/20/28 | 1,618,247 | |||||||
| 87 |
Touchstone Ultra Short Duration Fixed Income Fund (Continued)
| Principal | Market | |||||||
| Amount | Value | |||||||
| Asset-Backed Securities — 33.7% (Continued) | ||||||||
| $ | 291,642 | Sierra Timeshare Receivables Funding | ||||||
| LLC, Ser 2012-3A, Class A, 144a, | ||||||||
| 1.870%, 8/20/29 | $ | 293,148 | ||||||
| 2,707,876 | Sierra Timeshare Receivables Funding | |||||||
| LLC, Ser 2013-1A, Class A, 144a, | ||||||||
| 1.590%, 11/20/29 | 2,709,731 | |||||||
| 167,571 | SNAAC Auto Receivables Trust, Ser | |||||||
| 2012-1A, Class B, 144a, | ||||||||
| 3.110%, 6/15/17 | 167,738 | |||||||
| 3,950,000 | SNAAC Auto Receivables Trust, Ser | |||||||
| 2012-1A, Class C, 144a, | ||||||||
| 4.380%, 6/15/17 | 3,982,753 | |||||||
| 6,020,000 | SpringCastle America Funding LLC, | |||||||
| Ser 2014-AA, Class A, 144a, | ||||||||
| 2.700%, 5/25/23 | 6,019,398 | |||||||
| 6,705,252 | Structured Asset Investment Loan | |||||||
| Trust, Ser 2005-5, Class M1, | ||||||||
| 0.785%, 6/25/35(A) | 6,707,096 | |||||||
| 1,336,510 | Tidewater Auto Receivables Trust, Ser | |||||||
| 2014-AA, Class A1, 144a, | ||||||||
| 0.400%, 6/15/15 | 1,336,510 | |||||||
| 2,800,000 | Tidewater Auto Receivables Trust, Ser | |||||||
| 2014-AA, Class A2, 144a, | ||||||||
| 0.960%, 7/15/17 | 2,800,552 | |||||||
| 7,713,506 | United Auto Credit Securitization | |||||||
| Trust, Ser 2012-1, Class C, 144a, | ||||||||
| 2.520%, 3/15/16 | 7,733,707 | |||||||
| 464,168 | United Auto Credit Securitization | |||||||
| Trust, Ser 2013-1, Class A2, 144a, | ||||||||
| 0.950%, 9/15/15 | 464,241 | |||||||
| 2,300,000 | United Auto Credit Securitization | |||||||
| Trust, Ser 2013-1, Class D, 144a, | ||||||||
| 2.900%, 12/15/17 | 2,326,080 | |||||||
| 253,983 | Volkswagen Auto Lease Trust, Ser | |||||||
| 2012-A, Class A3, 0.870%, 7/20/15 | 254,053 | |||||||
| 350,383 | Volkswagen Auto Loan Enhanced | |||||||
| Trust, Ser 2012-1, Class A3, | ||||||||
| 0.850%, 8/22/16 | 351,006 | |||||||
| 323,333 | Volvo Financial Equipment LLC, Ser | |||||||
| 2012-1A, Class A4, 144a, | ||||||||
| 1.090%, 8/15/17 | 323,918 | |||||||
| 4,146,446 | Welk Resorts LLC, Ser 2013-AA, Class | |||||||
| A, 144a, 3.100%, 3/15/29 | 4,176,201 | |||||||
| 2,478,326 | Westgate Resorts LLC, Ser 2012-2A, | |||||||
| Class A, 144a, 3.000%, 1/20/25 | 2,497,690 | |||||||
| 2,162,658 | Westgate Resorts LLC, Ser 2012-3A, | |||||||
| Class A, 144a, 2.500%, 3/20/25 | 2,174,148 | |||||||
| 3,945,700 | Westgate Resorts LLC, Ser 2012-3A, | |||||||
| Class B, 144a, 4.500%, 3/20/25 | 4,007,351 | |||||||
| 5,376,719 | Westgate Resorts LLC, Ser 2013-1A, | |||||||
| Class A, 144a, 2.250%, 8/20/25 | 5,386,800 | |||||||
| 4,834,064 | Westlake Automobile Receivables | |||||||
| Trust, Ser 2013-1A, Class A2, 144a, | ||||||||
| 1.120%, 1/15/18 | 4,845,361 | |||||||
| 2,705,791 | Westlake Automobile Receivables | |||||||
| Trust, Ser 2014-1A, Class A1, 144a, | ||||||||
| 0.350%, 6/15/15 | 2,705,791 | |||||||
| Total Asset-Backed Securities | $ | 242,650,823 | ||||||
| Commercial Mortgage-Backed Securities — 13.8% | ||||||||
| 1,623,261 | Banc of America Commercial | |||||||
| Mortgage Trust, Ser 2007-2, Class | ||||||||
| A2, 5.634%, 4/10/49(A) | 1,622,422 | |||||||
| 7,099,957 | Banc of America Merrill Lynch | |||||||
| Commercial Mortgage, Inc., Ser | ||||||||
| 2004-2, Class F, 144a, | ||||||||
| 4.992%, 11/10/38(A) | 7,314,220 | |||||||
| 126,166 | Banc of America Merrill Lynch | |||||||
| Commercial Mortgage, Inc., Ser | ||||||||
| 2005-1, Class A4, | ||||||||
| 5.347%, 11/10/42(A) | 126,116 | |||||||
| 8,320,332 | Banc of America Merrill Lynch | |||||||
| Commercial Mortgage, Inc., Ser | ||||||||
| 2005-2, Class A5, 4.857%, 7/10/43(A) | 8,415,891 | |||||||
| 317,599 | Banc of America Merrill Lynch | |||||||
| Commercial Mortgage, Inc., Ser | ||||||||
| 2005-4, Class ASB, 4.867%, 7/10/45 | 317,876 | |||||||
| 37,352 | Banc of America Merrill Lynch | |||||||
| Commercial Mortgage, Inc., Ser | ||||||||
| 2006-4, Class A4, 5.634%, 7/10/46 | 39,502 | |||||||
| 6,491,170 | Bear Stearns Commercial Mortgage | |||||||
| Securities, Ser 2005-PWR8, Class A4, | ||||||||
| 4.674%, 6/11/41†† | 6,580,482 | |||||||
| 1,302,699 | Bear Stearns Commercial Mortgage | |||||||
| Securities Trust, Ser 2007-T28, Class | ||||||||
| AAB, 5.746%, 9/11/42†† | 1,315,942 | |||||||
| 6,693,000 | COMM Mortgage Trust, Ser | |||||||
| 2014-SAVA, Class A, 144a, | ||||||||
| 1.304%, 6/15/34(A) | 6,695,510 | |||||||
| 3,811,047 | Commercial Mortgage Pass Through | |||||||
| Certificates, Ser 2012-FL2, Class A, | ||||||||
| 144a, 2.281%, 9/17/29(A) | 3,838,094 | |||||||
| 1,762,643 | Commercial Mortgage Trust, Ser | |||||||
| 2005-GG3, Class A4, | ||||||||
| 4.799%, 8/10/42(A) | 1,766,068 | |||||||
| 9,821 | Commercial Mortgage Trust, Ser | |||||||
| 2007-C2, Class A2, | ||||||||
| 5.448%, 1/15/49(A) | 9,741 | |||||||
| 1,135,000 | Credit Suisse First Boston Mortgage | |||||||
| Securities Corp., Ser 2004-C5, Class | ||||||||
| B, 4.929%, 11/15/37(A) | 1,137,853 | |||||||
| 5,450,000 | Credit Suisse First Boston Mortgage | |||||||
| Securities Corp., Ser 2005-C2, Class | ||||||||
| A4, 4.832%, 4/15/37 | 5,516,125 | |||||||
| 1,781,294 | DBUBS Mortgage Trust, Ser | |||||||
| 2011-LC2A, Class A1FL, 144a, | ||||||||
| 1.504%, 7/12/44(A) | 1,820,811 | |||||||
| 88 |
Touchstone Ultra Short Duration Fixed Income Fund (Continued)
| Principal | Market | |||||||
| Amount | Value | |||||||
| Commercial Mortgage-Backed Securities — 13.8% (Continued) | ||||||||
| $ | 274,985 | DBUBS Mortgage Trust, Ser | ||||||
| 2011-LC3A, Class A1, | ||||||||
| 2.238%, 8/10/44 | $ | 278,081 | ||||||
| 70,327 | FDIC Structured Sale Guaranteed | |||||||
| Notes, Ser 2010-C1, Class A, 144a, | ||||||||
| 2.980%, 12/6/20 | 72,475 | |||||||
| 2,940,114 | First Union Commercial Mortgage | |||||||
| Trust, Ser 1999-C1, Class F, 144a, | ||||||||
| 5.350%, 10/15/35 | 2,971,288 | |||||||
| 3,140,000 | GE Capital Commercial Mortgage | |||||||
| Corp., Ser 2005-C2, Class C, | ||||||||
| 5.133%, 5/10/43(A) | 3,197,873 | |||||||
| 5,789,464 | JP Morgan Chase Commercial | |||||||
| Mortgage Securities Trust, Ser | ||||||||
| 2005-CB11, Class A4, | ||||||||
| 5.335%, 8/12/37(A) | 5,852,917 | |||||||
| 1,800,000 | JP Morgan Chase Commercial | |||||||
| Mortgage Securities Trust, Ser | ||||||||
| 2005-CB11, Class AJ, | ||||||||
| 5.560%, 8/12/37(A) | 1,833,381 | |||||||
| 608,562 | JP Morgan Chase Commercial | |||||||
| Mortgage Securities Trust, Ser | ||||||||
| 2005-CB12, Class A3A2, | ||||||||
| 4.928%, 9/12/37 | 608,667 | |||||||
| 2,577,987 | JP Morgan Chase Commercial | |||||||
| Mortgage Securities Trust, Ser | ||||||||
| 2005-LDP1, Class A4, | ||||||||
| 5.038%, 3/15/46(A) | 2,584,166 | |||||||
| 111,759 | JP Morgan Chase Commercial | |||||||
| Mortgage Securities Trust, Ser | ||||||||
| 2005-LDP2, Class A3A, | ||||||||
| 4.678%, 7/15/42 | 111,850 | |||||||
| 5,862,045 | JP Morgan Chase Commercial | |||||||
| Mortgage Securities Trust, Ser | ||||||||
| 2005-LDP3, Class A4A, | ||||||||
| 4.936%, 8/15/42(A) | 5,991,930 | |||||||
| 935,647 | JP Morgan Chase Commercial | |||||||
| Mortgage Securities Trust, Ser | ||||||||
| 2007-CB19, Class A3, | ||||||||
| 5.891%, 2/12/49(A) | 942,743 | |||||||
| 3,050,000 | JP Morgan Chase Commercial | |||||||
| Mortgage Securities Trust, Ser | ||||||||
| 2014-FBLU, Class B, 144a, | ||||||||
| 1.654%, 12/15/28(A) | 3,051,589 | |||||||
| 2,210,000 | LB-UBS Commercial Mortgage Trust, | |||||||
| Ser 2004-C7, Class H, 144a, | ||||||||
| 5.344%, 10/15/36(A) | 2,294,734 | |||||||
| 4,026 | LB-UBS Commercial Mortgage Trust, | |||||||
| Ser 2005-C7, Class AAB, | ||||||||
| 5.170%, 11/15/30†† | 4,024 | |||||||
| 152,651 | Merrill Lynch Mortgage Investors | |||||||
| Trust, Ser 1998-C1, Class A3, | ||||||||
| 6.720%, 11/15/26(A) | 160,428 | |||||||
| 567,913 | Merrill Lynch Mortgage Trust, Ser | |||||||
| 2005-CIP1, Class ASB, | ||||||||
| 5.022%, 7/12/38(A) | 571,432 | |||||||
| 8,866,560 | Merrill Lynch Mortgage Trust, Ser | |||||||
| 2005-MCP1, Class A4, | ||||||||
| 4.747%, 6/12/43(A) | 8,981,178 | |||||||
| 524,028 | Morgan Stanley Capital I Trust, Ser | |||||||
| 2004-IQ8, Class C, | ||||||||
| 5.300%, 6/15/40(A) | 528,087 | |||||||
| 2,328,796 | Morgan Stanley Capital I Trust, Ser | |||||||
| 2007-HQ12, Class A2, | ||||||||
| 5.773%, 4/12/49(A) | 2,360,321 | |||||||
| 4,775,820 | PFP III 2014-1 Ltd., Ser 2014-1, Class A, | |||||||
| 144a, 1.324%, 6/14/31(A) | 4,785,257 | |||||||
| 407,158 | Wachovia Bank Commercial Mortgage | |||||||
| Trust, Ser 2005-C20, Class A7, | ||||||||
| 5.118%, 7/15/42(A) | 414,807 | |||||||
| 5,000,000 | Wells Fargo Commercial Mortgage | |||||||
| Trust, Ser 2014-TISH, Class B, 144a, | ||||||||
| 1.504%, 2/15/27(A) | 5,000,000 | |||||||
| Total Commercial Mortgage-Backed Securities | $ | 99,113,881 | ||||||
| U.S. Government Mortgage-Backed Obligations — 6.3% | ||||||||
| 319,292 | FHLMC, Pool #1B1580, | |||||||
| 2.533%, 3/1/34(A) | 333,926 | |||||||
| 218,115 | FHLMC, Pool #1B2629, | |||||||
| 2.375%, 11/1/34(A) | 232,091 | |||||||
| 772,194 | FHLMC, Pool #1B7189, | |||||||
| 3.045%, 3/1/36(A) | 841,667 | |||||||
| 237,886 | FHLMC, Pool #1G1471, | |||||||
| 2.268%, 1/1/37(A) | 253,564 | |||||||
| 1,125,647 | FHLMC, Pool #1H1354, | |||||||
| 2.375%, 11/1/36(A) | 1,207,570 | |||||||
| 153,026 | FHLMC, Pool #1H2524, | |||||||
| 2.375%, 8/1/35(A) | 163,277 | |||||||
| 599,164 | FHLMC, Pool #1J1813, | |||||||
| 2.425%, 8/1/37(A) | 642,193 | |||||||
| 585,061 | FHLMC, Pool #1K1238, | |||||||
| 2.375%, 7/1/36(A) | 624,772 | |||||||
| 306,629 | FHLMC, Pool #1L0087, | |||||||
| 2.375%, 6/1/35(A) | 326,811 | |||||||
| 549,608 | FHLMC, Pool #1L0147, | |||||||
| 2.415%, 7/1/35(A) | 588,410 | |||||||
| 411,753 | FHLMC, Pool #1L1288, | |||||||
| 2.375%, 5/1/36(A) | 440,077 | |||||||
| 391,360 | FHLMC, Pool #1Q0080, | |||||||
| 2.217%, 1/1/36(A) | 415,930 | |||||||
| 746,522 | FHLMC, Pool #1Q0119, | |||||||
| 2.356%, 9/1/36(A) | 801,473 | |||||||
| 1,596,618 | FHLMC, Pool #1Q0187, | |||||||
| 2.341%, 12/1/36(A) | 1,709,306 | |||||||
| 862,021 | FHLMC, Pool #1Q0339, | |||||||
| 2.534%, 4/1/37(A) | 926,121 | |||||||
| 282,826 | FHLMC, Pool #1Q0669, | |||||||
| 2.311%, 11/1/37(A) | 302,359 | |||||||
| 1,004,158 | FHLMC, Pool #1Q1303, | |||||||
| 2.375%, 11/1/36(A) | 1,076,364 | |||||||
| 89 |
Touchstone Ultra Short Duration Fixed Income Fund (Continued)
| Principal | Market | |||||||
| Amount | Value | |||||||
| U.S. Government Mortgage-Backed Obligations — 6.3% (Continued) | ||||||||
| $ | 1,223,395 | FHLMC, Pool #781515, | ||||||
| 2.375%, 4/1/34(A) | $ | 1,309,346 | ||||||
| 433,482 | FHLMC, Pool #782760, | |||||||
| 2.375%, 11/1/36(A) | 464,517 | |||||||
| 391,561 | FHLMC, Pool #847795, | |||||||
| 2.402%, 4/1/35(A) | 418,501 | |||||||
| 275,619 | FHLMC, Pool #848088, | |||||||
| 2.370%, 4/1/35(A) | 296,043 | |||||||
| 1,007,695 | FHLMC, Pool #848539, | |||||||
| 4.343%, 4/1/37(A) | 1,052,730 | |||||||
| 2,241,424 | FHLMC, Pool #848583, | |||||||
| 2.421%, 1/1/36(A) | 2,411,898 | |||||||
| 32,718 | FHLMC, Pool #A92646, 5.500%, 6/1/40 | 36,926 | ||||||
| 32,836 | FHLMC, Pool #C03505, 5.500%, 6/1/40 | 36,557 | ||||||
| 75,877 | FHLMC, Pool #C66916, 7.000%, 5/1/32 | 86,976 | ||||||
| 24,043 | FHLMC, Pool #D94598, 6.500%, 4/1/21 | 27,185 | ||||||
| 111,438 | FHLMC, Pool #G01840, 5.000%, 7/1/35 | 123,221 | ||||||
| 11,117 | FHLMC, Pool #G11072, | |||||||
| 7.500%, 12/1/15 | 11,350 | |||||||
| 1,708,020 | FHLMC, Pool #G11769, | |||||||
| 5.000%, 10/1/20 | 1,827,959 | |||||||
| 1,088,886 | FHLMC, Pool #G11773, | |||||||
| 5.000%, 10/1/20 | 1,164,973 | |||||||
| 27,685 | FHLMC, Pool #G30085, | |||||||
| 7.500%, 10/1/17 | 29,177 | |||||||
| 577,686 | FHLMC, Pool #J10895, | |||||||
| 4.000%, 10/1/19 | 610,800 | |||||||
| 340,397 | FNMA, Pool #254868, 5.000%, 9/1/33 | 376,525 | ||||||
| 168,014 | FNMA, Pool #256272, 5.500%, 6/1/26 | 187,981 | ||||||
| 266,330 | FNMA, Pool #256852, 6.000%, 8/1/27 | 301,342 | ||||||
| 54,185 | FNMA, Pool #323832, 7.500%, 7/1/29 | 64,657 | ||||||
| 4,053 | FNMA, Pool #334593, 7.000%, 5/1/24 | 4,512 | ||||||
| 1,035 | FNMA, Pool #534851, 7.500%, 4/1/15 | 1,039 | ||||||
| 960 | FNMA, Pool #535219, 7.500%, 3/1/15 | 966 | ||||||
| 352,112 | FNMA, Pool #555380, | |||||||
| 2.254%, 4/1/33(A) | 375,600 | |||||||
| 14,938 | FNMA, Pool #555646, 7.500%, 9/1/16 | 15,046 | ||||||
| 107,542 | FNMA, Pool #665773, 7.500%, 6/1/31 | 119,818 | ||||||
| 173,536 | FNMA, Pool #679742, | |||||||
| 2.790%, 1/1/40(A) | 176,135 | |||||||
| 91,570 | FNMA, Pool #681842, | |||||||
| 2.250%, 2/1/33(A) | 92,618 | |||||||
| 360,234 | FNMA, Pool #681898, | |||||||
| 2.250%, 4/1/33(A) | 386,569 | |||||||
| 345,913 | FNMA, Pool #725245, | |||||||
| 2.280%, 2/1/34(A) | 370,206 | |||||||
| 376,614 | FNMA, Pool #725424, 5.500%, 4/1/34 | 422,801 | ||||||
| 2,015,398 | FNMA, Pool #725490, | |||||||
| 2.165%, 4/1/34(A) | 2,143,826 | |||||||
| 641,246 | FNMA, Pool #735439, 6.000%, 9/1/19 | 674,109 | ||||||
| 210,266 | FNMA, Pool #735539, | |||||||
| 2.338%, 4/1/35(A) | 224,218 | |||||||
| 140,332 | FNMA, Pool #743207, | |||||||
| 2.145%, 10/1/33(A) | 149,208 | |||||||
| 106,986 | FNMA, Pool #745467, | |||||||
| 2.535%, 4/1/36(A) | 114,498 | |||||||
| 197,570 | FNMA, Pool #745790, | |||||||
| 2.194%, 8/1/36(A) | 210,868 | |||||||
| 1,235,171 | FNMA, Pool #761411, 4.500%, 5/1/19 | 1,306,485 | ||||||
| 209,920 | FNMA, Pool #784365, | |||||||
| 1.925%, 5/1/34(A) | 220,384 | |||||||
| 365,022 | FNMA, Pool #791978, | |||||||
| 1.892%, 9/1/34(A) | 382,582 | |||||||
| 135,790 | FNMA, Pool #804001, | |||||||
| 2.310%, 10/1/34(A) | 137,433 | |||||||
| 123,469 | FNMA, Pool #809897, | |||||||
| 2.266%, 3/1/35(A) | 132,791 | |||||||
| 324,387 | FNMA, Pool #813170, | |||||||
| 2.232%, 1/1/35(A) | 348,451 | |||||||
| 395,131 | FNMA, Pool #820364, | |||||||
| 1.602%, 4/1/35(A) | 417,151 | |||||||
| 1,264,221 | FNMA, Pool #827787, | |||||||
| 1.925%, 5/1/35(A) | 1,347,692 | |||||||
| 147,133 | FNMA, Pool #828480, | |||||||
| 2.355%, 6/1/35(A) | 156,234 | |||||||
| 324,377 | FNMA, Pool #839239, | |||||||
| 2.295%, 9/1/35(A) | 341,980 | |||||||
| 218,714 | FNMA, Pool #888179, | |||||||
| 2.437%, 2/1/37(A) | 234,797 | |||||||
| 120,835 | FNMA, Pool #888548, | |||||||
| 2.353%, 5/1/35(A) | 129,610 | |||||||
| 244,881 | FNMA, Pool #889060, 6.000%, 1/1/38 | 280,012 | ||||||
| 234,484 | FNMA, Pool #889061, 6.000%, 1/1/38 | 269,516 | ||||||
| 14,877 | FNMA, Pool #889382, 5.500%, 4/1/38 | 16,849 | ||||||
| 747,012 | FNMA, Pool #922674, | |||||||
| 2.502%, 4/1/36(A) | 797,042 | |||||||
| 823,726 | FNMA, Pool #931676, 5.500%, 1/1/19 | 872,537 | ||||||
| 242,994 | FNMA, Pool #950385, | |||||||
| 1.329%, 8/1/37(A) | 248,645 | |||||||
| 154,863 | FNMA, Pool #960376, 5.500%, 12/1/37 | 172,315 | ||||||
| 200,099 | FNMA, Pool #995284, 5.500%, 3/1/20 | 211,760 | ||||||
| 1,379,460 | FNMA, Pool #AA1150, 4.000%, 4/1/23 | 1,462,432 | ||||||
| 18,377 | FNMA, Pool #AD0941, 5.500%, 4/1/40 | 20,886 | ||||||
| 167,348 | FNMA, Pool #AE0363, 5.000%, 7/1/37 | 185,076 | ||||||
| 1,031,576 | FNMA, Pool #AE0727, 4.000%, 10/1/20 | 1,092,937 | ||||||
| 260,002 | FNMA, Pool #AE5441, 5.000%, 10/1/40 | 288,190 | ||||||
| 373,899 | FNMA, Pool #AI6588, 4.000%, 7/1/26 | 399,089 | ||||||
| 361,397 | FNMA, Pool #AI8506, 4.000%, 8/1/26 | 385,753 | ||||||
| 358,929 | FNMA, Pool #AL0211, 5.000%, 4/1/41 | 398,042 | ||||||
| 75,625 | FNMA, Pool #AL0302, 5.000%, 4/1/24 | 82,160 | ||||||
| 1,969,199 | FNMA, Pool #AL0478, | |||||||
| 2.408%, 4/1/36(A) | 2,104,751 | |||||||
| 636,736 | FNMA, Pool #AL0543, 5.000%, 7/1/41 | 706,660 | ||||||
| 371,732 | FNMA, Pool #AL1105, 4.500%, 12/1/40 | 404,229 | ||||||
| 229,359 | FNMA, Pool #AL2591, 5.500%, 5/1/38 | 248,126 | ||||||
| 28,202 | GNMA, Pool #344233, 8.000%, 2/15/23 | 31,254 | ||||||
| 77,744 | GNMA, Pool #345123, | |||||||
| 8.000%, 12/15/23 | 86,538 | |||||||
| 9,356 | GNMA, Pool #569337, 6.500%, 4/15/22 | 10,607 | ||||||
| 30,402 | GNMA, Pool #578189, 6.000%, 2/15/32 | 34,314 | ||||||
| 90 |
Touchstone Ultra Short Duration Fixed Income Fund (Continued)
| Principal | Market | |||||||
| Amount | Value | |||||||
| U.S. Government Mortgage-Backed Obligations — 6.3% (Continued) | ||||||||
| $ | 27,904 | GNMA, Pool #780322, | ||||||
| 8.000%, 11/15/22 | $ | 32,264 | ||||||
| 5,216 | GNMA, Pool #780327, | |||||||
| 8.000%, 11/15/17 | 5,571 | |||||||
| 827,427 | GNMA, Pool #80826, | |||||||
| 1.625%, 2/20/34(A) | 857,886 | |||||||
| 478,098 | GNMA, Pool #80889, | |||||||
| 1.625%, 4/20/34(A) | 495,244 | |||||||
| 721,802 | GNMA, Pool #81016, | |||||||
| 1.625%, 8/20/34(A) | 750,304 | |||||||
| 14,524 | GNMA, Pool #814, 8.000%, 8/20/17 | 15,236 | ||||||
| 5,198 | GNMA, Pool #8426, | |||||||
| 3.000%, 11/20/18(A) | 5,370 | |||||||
| 125,918 | GNMA, Pool #894160, | |||||||
| 2.015%, 6/20/61(A) | 133,037 | |||||||
| Total U.S. Government Mortgage-Backed Obligations | $ | 45,466,834 | ||||||
| Municipal Bonds — 3.2% | ||||||||
| Connecticut — 0.1% | ||||||||
| 425,000 | State of Connecticut, Ser A, UTGO, | |||||||
| 0.960%, 5/15/18(A) | 434,206 | |||||||
| Florida — 0.2% | ||||||||
| 1,700,000 | Citizens Property Insurance Corp., Pers | |||||||
| &Coml Lines, 1.290%, 6/1/15(A) | 1,710,217 | |||||||
| Indiana — 0.3% | ||||||||
| 2,330,000 | IN St Bond Bank Rev, Sch Severance | |||||||
| Funding, 0.489%, 1/15/15 | 2,330,256 | |||||||
| Louisiana — 0.0% | ||||||||
| 288,603 | LA St Local Govt Envrnm Facs & | |||||||
| Cmnty Dev Auth, Tranches A-1, A-2, | ||||||||
| 1.520%, 2/1/18 | 290,315 | |||||||
| Massachusetts — 0.1% | ||||||||
| 1,000,000 | MA St Dev Fin Agy R, Waste | |||||||
| Management Inc Proj Ser B, 2.125%, | ||||||||
| 12/1/29(A) | 1,020,429 | |||||||
| New Jersey — 0.6% | ||||||||
| 2,100,000 | NJ St Econ Dev Auth Rev, Sch Facs | |||||||
| Constr, Ser E, 1.740%, 2/1/16(A) | 2,121,357 | |||||||
| 2,000,000 | NJ St Econ Dev Auth Rev, Sch Facs | |||||||
| Constr, Ser OO, 0.857%, 3/1/15 | 2,002,640 | |||||||
| 4,123,997 | ||||||||
| New Mexico — 0.0% | ||||||||
| 200,000 | NM St Edl Assistan, Libor Fltg Ser A 2, | |||||||
| 0.884%, 12/1/28(A) | 200,195 | |||||||
| New York — 0.6% | ||||||||
| 4,200,000 | Brookhaven NY Indl Dev Agy, Variable | |||||||
| Intercounty Asso, (LOC: Capital One | ||||||||
| NA), 0.370%, 1/1/25(A) | 4,200,000 | |||||||
| Ohio — 0.5% | ||||||||
| 885,000 | Akron OH COP, Muni Baseball | |||||||
| Stadium, 1.300%, 12/1/15 | 889,177 | |||||||
| 1,540,000 | Akron OH COP, Muni Baseball | |||||||
| Stadium, 1.750%, 12/1/16 | 1,549,132 | |||||||
| 500,000 | American Muni Pwr-Ohio, Inc. OH, | |||||||
| Hydroelec Projs Ser A, 3.944%, | ||||||||
| 2/15/15 | 505,779 | |||||||
| 870,000 | Medina Co OH IDR, Mack Inds Proj, | |||||||
| (LOC: JP Morgan Chase Bank NA), | ||||||||
| 0.200%, 7/1/16(A) | 869,999 | |||||||
| 3,814,087 | ||||||||
| Pennsylvania — 0.4% | ||||||||
| 2,500,000 | PA St Econ Dev Fing, Waste Mgmt Proj, | |||||||
| 1.750%, 12/1/33(A) | 2,534,950 | |||||||
| Texas — 0.4% | ||||||||
| 1,000,000 | TX St Muni Gas Acquisition, 5.000%, | |||||||
| 12/15/14 | 1,008,599 | |||||||
| 1,500,000 | TX St Muni Gas Acquisition, 5.000%, | |||||||
| 12/15/15 | 1,574,145 | |||||||
| 2,582,744 | ||||||||
| Total Municipal Bonds | $ | 23,241,396 | ||||||
| Agency Collateralized Mortgage Obligations — 1.6% | ||||||||
| 91,726 | FHLMC REMIC, Ser 2510 Class TA, | |||||||
| 4.000%, 6/15/32 | 95,711 | |||||||
| 775,873 | FHLMC REMIC, Ser 2770 Class FH, | |||||||
| 0.554%, 3/15/34(A) | 780,836 | |||||||
| 170,226 | FHLMC REMIC, Ser 2778 Class BR, | |||||||
| 5.000%, 6/15/33 | 171,434 | |||||||
| 395,298 | FHLMC REMIC, Ser 3414 Class MB, | |||||||
| 4.250%, 12/15/19 | 413,712 | |||||||
| 88,748,500 | FHLMC REMIC, Ser K003 Class AX1, | |||||||
| 0.626%, 5/25/19(A)(C) | 1,735,921 | |||||||
| 69,767 | FNMA, 5.000%, 5/1/35 | 77,178 | ||||||
| 830,860 | FNMA REMIC, Ser 2003-106, Class WE, | |||||||
| 4.500%, 11/25/22 | 839,242 | |||||||
| 485,119 | FNMA REMIC, Ser 2003-119, Class PU, | |||||||
| 4.000%, 11/25/33 | 499,543 | |||||||
| 35,836 | FNMA REMIC, Ser 2003-19, Class ME, | |||||||
| 4.000%, 1/25/33 | 36,408 | |||||||
| 152,886 | FNMA REMIC, Ser 2003-33, Class AM, | |||||||
| 4.250%, 5/25/33 | 163,263 | |||||||
| 143,956 | FNMA REMIC, Ser 2003-42, Class CA, | |||||||
| 4.000%, 5/25/33 | 150,744 | |||||||
| 16,654 | FNMA REMIC, Ser 2003-66, Class AP, | |||||||
| 3.500%, 11/25/32 | 16,953 | |||||||
| 665,923 | FNMA REMIC, Ser 2003-81, Class FE, | |||||||
| 0.655%, 9/25/33(A) | 672,382 | |||||||
| 399,376 | FNMA REMIC, Ser 2008-35, Class IO, | |||||||
| 4.500%, 4/25/23(C) | 20,282 | |||||||
| 394,999 | FNMA REMIC, Ser 2009-80, Class EJ, | |||||||
| 4.500%, 3/25/27 | 398,175 | |||||||
| 91 |
Touchstone Ultra Short Duration Fixed Income Fund (Continued)
| Principal | Market | |||||||
| Amount | Value | |||||||
| Agency Collateralized Mortgage Obligations — 1.6% (Continued) | ||||||||
| $ | 362,636 | FNMA REMIC, Ser 2010-13, Class WD, | ||||||
| 4.250%, 3/25/25 | $ | 381,514 | ||||||
| 254,698 | FNMA REMIC, Ser 2010-54, Class NA, | |||||||
| 4.500%, 10/25/39 | 267,783 | |||||||
| 383,361 | FNMA REMIC, Ser 2011-52, Class AH, | |||||||
| 2.750%, 10/25/18 | 392,749 | |||||||
| 651,018 | FNMA REMIC, Ser 2012-102, Class NA, | |||||||
| 1.500%, 9/25/27 | 627,399 | |||||||
| 142,031 | FNMA REMIC Trust, Ser 2001-W4, Class | |||||||
| AF5, 6.114%, 2/25/32(B) | 162,013 | |||||||
| 235,530 | GNMA, Ser 2002-72, Class AB, | |||||||
| 4.500%, 10/20/32 | 253,043 | |||||||
| 344,595 | GNMA, Ser 2011-161, Class A, | |||||||
| 1.738%, 1/16/34 | 344,971 | |||||||
| 241,423 | GNMA, Ser 2011-57, Class BA, | |||||||
| 3.000%, 5/20/40 | 247,942 | |||||||
| 418,957 | GNMA, Ser 2011-78, Class AB, | |||||||
| 2.450%, 2/16/39 | 423,192 | |||||||
| 11,459,050 | GNMA, Ser 2011-78, Class IX, | |||||||
| 1.006%, 8/16/46(A)(C) | 617,425 | |||||||
| 321,643 | GNMA, Ser 2012-27, Class A, | |||||||
| 1.614%, 7/16/39 | 315,528 | |||||||
| 31,236,576 | GNMA, Ser 2013-121, Class KX, | |||||||
| 0.838%, 10/16/44(A)(C) | 1,292,944 | |||||||
| Total Agency Collateralized Mortgage Obligations | $ | 11,398,287 | ||||||
| Non-Agency Collateralized Mortgage Obligations — 2.8% | ||||||||
| 628,137 | Bear Stearns ARM Trust, Ser 2004-1, | |||||||
| Class 13A3, 2.738%, 4/25/34(A)†† | 610,386 | |||||||
| 389,592 | Bear Stearns Asset Backed Securities | |||||||
| Trust, Ser 2003-AC7, Class A2, | ||||||||
| 5.750%, 1/25/34(B)†† | 406,238 | |||||||
| 175,851 | Community Program Loan Trust, Ser | |||||||
| 1987-A, Class A5, 4.500%, 4/1/29 | 177,392 | |||||||
| 167,479 | FDIC Structured Sale Guaranteed | |||||||
| Notes, Ser 2010-S3, Class A, 144a, | ||||||||
| 2.740%, 12/3/20 | 169,999 | |||||||
| 314,231 | JP Morgan Mortgage Trust, Ser | |||||||
| 2006-A4, Class 2A2, | ||||||||
| 2.367%, 6/25/36(A) | 284,876 | |||||||
| 26,448 | Merrill Lynch Mortgage Investors | |||||||
| Trust, Ser 2003-A1, Class 2A, | ||||||||
| 2.188%, 12/25/32(A) | 27,261 | |||||||
| 527,979 | Merrill Lynch Mortgage Investors | |||||||
| Trust, Ser 2004-1, Class 1A, | ||||||||
| 2.132%, 12/25/34(A) | 526,899 | |||||||
| 241,317 | RALI Trust, Ser 2003-QS10, Class A7, | |||||||
| 5.500%, 5/25/33 | 248,716 | |||||||
| 1,352,146 | RFMSI Trust, Ser 2007-SA1, Class 1A1, | |||||||
| 3.013%, 2/25/37(A) | 1,177,306 | |||||||
| 13,228,932 | Springleaf Mortgage Loan Trust, Ser | |||||||
| 2012-2A, Class A, 144a, | ||||||||
| 2.220%, 10/25/57(A) | 13,422,207 | |||||||
| 2,170,050 | Springleaf Mortgage Loan Trust, Ser | |||||||
| 2012-3A, Class A, 144a, | ||||||||
| 1.570%, 12/25/59(A) | 2,168,811 | |||||||
| 328,096 | Wells Fargo Mortgage Backed | |||||||
| Securities Trust, Ser 2003-G, Class | ||||||||
| A1, 2.490%, 6/25/33(A) | 333,180 | |||||||
| 860,281 | Wells Fargo Mortgage Backed | |||||||
| Securities Trust, Ser 2003-M, Class | ||||||||
| A1, 2.619%, 12/25/33(A) | 867,166 | |||||||
| Total Non-Agency Collateralized Mortgage Obligations | $ | 20,420,437 | ||||||
| Commercial Paper — 13.4% | ||||||||
| 10,000,000 | Apache Corp. | 9,999,889 | ||||||
| 9,200,000 | Centennial Energy Holdings | 9,199,928 | ||||||
| 10,000,000 | Edison International | 9,999,944 | ||||||
| 11,000,000 | Louisville Gas & Electric Co. | 10,999,878 | ||||||
| 12,000,000 | Marriot International | 11,997,613 | ||||||
| 10,000,000 | National Grid USA | 9,999,889 | ||||||
| 10,000,000 | Noble Corp. | 9,999,667 | ||||||
| 10,000,000 | Northeast Utilities | 9,999,125 | ||||||
| 14,000,000 | Spectra Energy Cap LLC | 13,998,015 | ||||||
| Total Commercial Paper | $ | 96,193,948 | ||||||
| U.S. Government Agency Obligations — 0.7% | ||||||||
| 955,000 | Government Trust Certificate, | |||||||
| 0.431%, 5/15/15# | 949,167 | |||||||
| 583,000 | Government Trust Certificate, | |||||||
| 0.665%, 10/1/16# | 567,472 | |||||||
| 1,750,000 | Overseas Private Investment Corp., | |||||||
| 0.110%, 3/15/17(A) | 1,750,000 | |||||||
| 1,010,000 | Overseas Private Investment Corp., | |||||||
| 0.631%, 4/30/15# | 1,024,685 | |||||||
| 63,527 | Small Business Administration | |||||||
| Participation Certificates, Ser | ||||||||
| 2002-20A, Class 1, 6.140%, 1/1/22 | 68,670 | |||||||
| 85,027 | Small Business Administration | |||||||
| Participation Certificates, Ser | ||||||||
| 2003-20E, Class 1, 4.640%, 5/1/23 | 90,620 | |||||||
| 44,319 | Small Business Administration Pools, | |||||||
| 507442, 3.625%, 5/25/16(A) | 44,569 | |||||||
| 278,334 | Small Business Administration Pools, | |||||||
| 507682, 0.650%, 1/25/26(A) | 278,524 | |||||||
| 229,975 | Small Business Administration Pools, | |||||||
| 508374, 0.750%, 4/25/28(A) | 230,778 | |||||||
| 34,833 | United States Small Business Adminis- | |||||||
| tration, Ser 2005-P10A, Class 1, | ||||||||
| 4.638%, 2/10/15 | 35,321 | |||||||
| Total U.S. Government Agency Obligations | $ | 5,039,806 | ||||||
| 92 |
Touchstone Ultra Short Duration Fixed Income Fund (Continued)
| Market | ||||||||
| Shares | Value | |||||||
| Investment Fund — 0.1% | ||||||||
| 576,615 | Touchstone Institutional Money Market Fund, 0.01%^∞Ω | $ | 576,615 | |||||
| Total Investment Securities —101.7% | ||||||||
| (Cost $732,931,587) | $ | 731,639,628 | ||||||
| Liabilities in Excess of Other Assets — (1.7%) | (12,183,132 | ) | ||||||
| Net Assets — 100.0% | $ | 719,456,496 | ||||||
| (A) | Variable rate security - Rate reflected is the rate in effect as of September 30, 2014. |
| (B) | Step Bond - A bond that pays an initial interest rate for the first period and then a higher interest rate for the following periods until maturity. The interest rate shown reflects the rate in effect at September 30, 2014. |
| (C) | Interest rate security. This type of security represents the right to receive the monthly interest payments on an underlying pool of mortgages. Payments of principal on the pool reduce the value of the “interest only” holding. |
| # | Zero coupon bond - Rate shown reflects effective yield to maturity at time of purchase. |
| ^ | Affiliated Fund. See Note 4 in Notes to Financial Statements. |
| †† | The issuers and/or sponsors of certain mortgage-backed securities may no longer exist; however, the securities held by the Fund are separate legal entities organized as trusts and publicly traded. The Fund receives principal and interest payments directly from these trusts. |
| ∞ | Open-End Fund |
| Ω | Represents the 7-day SEC yield as of September 30, 2014. |
Portfolio Abbreviations:
ARM - Adjustable Rate Mortgage
COP - Certificate of Participation
CLO - Collateralized Loan Obligations
FDIC - Federal Deposit Insurance Corporation
FHLMC - Federal Home Loan Mortgage Corporation
FNMA - Federal National Mortgage Association
GNMA - Government National Mortgage Association
IDR - Industrial Development Revenue
LLC - Limited Liability Company
LOC - Letter of Credit
LP - Limited Partnership
MLP - Master Limited Partnership
MTN - Medium Term Note
PLC - Public Limited Company
REIT - Real Estate Investment Trust
REMIC - Real Estate Mortgage Investment Conduit
| 93 |
Touchstone Ultra Short Duration Fixed Income Fund (Continued)
Other Information:
The inputs or methodology used for valuing securities may not be an indication of the risk associated with investing in those securities. For more information on valuation inputs, and their aggregation into the levels used in the table below, please refer to the security valuation section in the accompanying Notes to Financial Statements.
Valuation inputs at Reporting Date:
| Description | Level 1 | Level 2 | Level 3 | Total | ||||||||||||
| Corporate Bonds | $ | — | $ | 187,537,601 | $ | — | $ | 187,537,601 | ||||||||
| Asset-Backed Securities | — | 242,650,823 | — | 242,650,823 | ||||||||||||
| Commercial Mortgage-Backed Securities | — | 99,113,881 | — | 99,113,881 | ||||||||||||
| U.S. Government Mortgage-Backed Obligations | — | 45,466,834 | — | 45,466,834 | ||||||||||||
| Municipal Bonds | — | 23,241,396 | — | 23,241,396 | ||||||||||||
| Agency Collateralized Mortgage Obligations | — | 11,398,287 | — | 11,398,287 | ||||||||||||
| Non-Agency Collateralized Mortgage Obligations | — | 20,420,437 | — | 20,420,437 | ||||||||||||
| Commercial Paper | — | 96,193,948 | — | 96,193,948 | ||||||||||||
| U.S. Government Agency Obligations | — | 5,039,806 | — | 5,039,806 | ||||||||||||
| Investment Fund | 576,615 | — | — | 576,615 | ||||||||||||
| $ | 731,639,628 | |||||||||||||||
See accompanying Notes to Financial Statements.
| 94 |
This page intentionally left blank.
| 95 |
| Statements of Assets and Liabilities |
| September 30, 2014 |
| Touchstone | Touchstone | Touchstone | ||||||||||||||
| Touchstone | Emerging | Global | International | |||||||||||||
| Arbitrage | Markets Equity | Real Estate | Fixed Income | |||||||||||||
| Fund | Fund | Fund | Fund | |||||||||||||
| Assets | ||||||||||||||||
| Investments, at cost | $ | 201,947,473 | $ | 342,583,614 | $ | 15,048,894 | $ | 36,165,440 | ||||||||
| Affiliated securities, at market value | $ | 14,297,511 | $ | 2,403,518 | $ | 109,965 | $ | 2,670,624 | ||||||||
| Non-affiliated securities, at market value | 190,330,623 | 347,911,683 | 14,814,556 | 31,912,025 | ||||||||||||
| Investments, at market value (A) | $ | 204,628,134 | $ | 350,315,201 | $ | 14,924,521 | $ | 34,582,649 | ||||||||
| Cash | 142,439 | — | — | — | ||||||||||||
| Foreign Currency (B) | 84 | 1,268,850 | 446 | 973,685 | ||||||||||||
| Cash collateral for securities sold short and written options | 71,007,137 | — | — | — | ||||||||||||
| Unrealized appreciation on forward foreign currency contracts | 87,990 | — | — | 1,682,933 | ||||||||||||
| Dividends and interest receivable | 214,337 | 258,484 | 99,258 | 454,396 | ||||||||||||
| Receivable for capital shares sold | 609,409 | 175,896 | 9 | 110,200 | ||||||||||||
| Receivable for investments sold | 2,767,200 | 972,212 | — | — | ||||||||||||
| Receivable for securities lending income | — | 4,032 | 160 | — | ||||||||||||
| Tax reclaim receivable | 2,896 | 70,850 | 4,830 | 1,102 | ||||||||||||
| Other assets | 16,177 | 26,874 | 5,941 | 6,450 | ||||||||||||
| Total Assets | 279,475,803 | 353,092,399 | 15,035,165 | 37,811,415 | ||||||||||||
| Liabilities | ||||||||||||||||
| Written options at market value(C) | 244,815 | — | — | — | ||||||||||||
| Securities sold short(D) | 73,546,012 | — | — | — | ||||||||||||
| Dividends payable for securities sold short | 41,112 | — | — | — | ||||||||||||
| Unrealized depreciation on forward foreign currency contracts | — | — | — | 1,201,480 | ||||||||||||
| Payable for return of collateral for securities on loan | — | 3,864,165 | 669,430 | — | ||||||||||||
| Payable for capital shares redeemed | 668,252 | 824,985 | 21,330 | 46,154 | ||||||||||||
| Payable for investments purchased | 6,474,850 | 35,806 | 102,739 | — | ||||||||||||
| Payable for securities sold short | 1,004,617 | — | — | — | ||||||||||||
| Payable to Investment Advisor | 176,113 | 313,855 | 1,434 | 4,372 | ||||||||||||
| Payable to other affiliates | 42,276 | 70,909 | 423 | 423 | ||||||||||||
| Payable to Trustees | 3,051 | 3,051 | 3,051 | 3,051 | ||||||||||||
| Payable for professional services | 23,647 | 34,648 | 32,266 | 23,241 | ||||||||||||
| Payable to Transfer Agent | 23,296 | 33,113 | 1,816 | 1,412 | ||||||||||||
| Payable for reports to shareholders | 21,954 | 19,468 | 15,175 | 14,905 | ||||||||||||
| Other accrued expenses and liabilities | 16,352 | 52,120 | 10,137 | 7,823 | ||||||||||||
| Total Liabilities | 82,286,347 | 5,252,120 | 857,801 | 1,302,861 | ||||||||||||
| Net Assets | $ | 197,189,456 | $ | 347,840,279 | $ | 14,177,364 | $ | 36,508,554 | ||||||||
| Net assets consist of: | ||||||||||||||||
| Par value | $ | 199,175 | $ | 299,049 | $ | 13,245 | $ | 35,338 | ||||||||
| Paid-in capital | 199,293,324 | 377,797,708 | 14,622,271 | 36,832,686 | ||||||||||||
| Accumulated net investment income (loss) | (474,401 | ) | 3,088,745 | 4,106 | (258,109 | ) | ||||||||||
| Accumulated net realized gains (losses) on investments, foreign currency transactions, written options and securities sold short | 236,823 | (41,042,020 | ) | (337,269 | ) | 1,073,789 | ||||||||||
| Net unrealized appreciation (depreciation) on investments, foreign currency transactions, written options and securities sold short | (2,065,465 | ) | 7,696,797 | (124,989 | ) | (1,175,150 | ) | |||||||||
| Net Assets | $ | 197,189,456 | $ | 347,840,279 | $ | 14,177,364 | $ | 36,508,554 | ||||||||
| (A) Includes market value of securities on loan of: | $ | — | $ | 3,651,350 | $ | 648,399 | $ | — | ||||||||
| (B) Cost of foreign currency: | $ | 84 | $ | 1,284,356 | $ | 446 | $ | 1,019,897 | ||||||||
| (C) Proceeds from written options: | $ | 114,795 | $ | — | $ | — | $ | — | ||||||||
| (D) Proceeds received for securities sold short: | $ | 68,841,916 | $ | — | $ | — | $ | — | ||||||||
See accompanying Notes to Financial Statements.
| 96 |
| Statements of Assets and Liabilities (Continued) |
| Touchstone | Touchstone | Touchstone | ||||||||
| Merger | Mid | Mid Cap | ||||||||
| Arbitrage | Cap | Value | ||||||||
| Fund | Fund | Fund | ||||||||
| $ | 452,604,102 | $ | 413,125,354 | $ | 338,773,120 | |||||
| $ | 34,031,031 | $ | 4,902,428 | $ | 4,512,194 | |||||
| 420,887,958 | 470,157,152 | 368,721,455 | ||||||||
| $ | 454,918,989 | $ | 475,059,580 | $ | 373,233,649 | |||||
| 232,806 | — | — | ||||||||
| 105 | — | — | ||||||||
| 126,934,320 | — | — | ||||||||
| 508,348 | �� | — | — | |||||||
| 729,240 | 264,771 | 528,460 | ||||||||
| 1,044,202 | 2,482,321 | 559,998 | ||||||||
| 4,873,342 | — | 2,792,582 | ||||||||
| — | 1,885 | 965 | ||||||||
| 12,183 | — | 172 | ||||||||
| 20,459 | 28,878 | 21,897 | ||||||||
| 589,273,994 | 477,837,435 | 377,137,723 | ||||||||
| 722,930 | — | — | ||||||||
| 149,851,989 | — | — | ||||||||
| 164,941 | — | — | ||||||||
| — | — | — | ||||||||
| — | 30,511,526 | 10,356,915 | ||||||||
| 4,275,585 | 837,222 | 691,508 | ||||||||
| 406,489 | — | 2,037,561 | ||||||||
| 2,511,513 | — | — | ||||||||
| 410,295 | 295,318 | 237,538 | ||||||||
| 112,843 | 73,131 | 14,923 | ||||||||
| 3,051 | 3,051 | 3,051 | ||||||||
| 26,705 | 20,180 | 18,177 | ||||||||
| 63,596 | 77,953 | 52,422 | ||||||||
| 27,736 | 28,673 | 22,417 | ||||||||
| 11,243 | 7,190 | 8,569 | ||||||||
| 158,588,916 | 31,854,244 | 13,443,081 | ||||||||
| $ | 430,685,078 | $ | 445,983,191 | $ | 363,694,642 | |||||
| $ | 409,509 | $ | 187,912 | $ | 217,949 | |||||
| 439,290,632 | 520,000,003 | 317,274,303 | ||||||||
| (2,877,875 | ) | 362,459 | 148,217 | |||||||
| 1,459,919 | (136,501,409 | ) | 11,593,644 | |||||||
| (7,597,107 | ) | 61,934,226 | 34,460,529 | |||||||
| $ | 430,685,078 | $ | 445,983,191 | $ | 363,694,642 | |||||
| $ | — | $ | 29,812,639 | $ | 10,091,629 | |||||
| $ | 105 | $ | — | $ | — | |||||
| $ | 597,434 | $ | — | $ | — | |||||
| $ | 139,557,143 | $ | — | $ | — | |||||
| 97 |
| Statements of Assets and Liabilities (Continued) |
| Touchstone | ||||||||||||||||
| Emerging | Touchstone | Touchstone | ||||||||||||||
| Touchstone | Markets | Global | International | |||||||||||||
| Arbitrage | Equity | Real Estate | Fixed Income | |||||||||||||
| Fund | Fund | Fund | Fund | |||||||||||||
| Pricing of Class A Shares | ||||||||||||||||
| Net assets applicable to Class A shares | $ | 22,724,540 | $ | 5,306,900 | $ | 1,374,560 | $ | 912,477 | ||||||||
| Shares of beneficial interest outstanding (unlimited number of shares authorized, $0.01 par value) | 2,301,590 | 454,657 | 131,072 | 88,744 | ||||||||||||
| Net asset value price per share* | $ | 9.87 | $ | 11.67 | $ | 10.49 | $ | 10.28 | ||||||||
| Maximum sales charge - Class A shares | 5.75 | % | 5.75 | % | 5.75 | % | 4.75 | % | ||||||||
| Maximum offering price per share (100%/(100%-maximum sales charge) of net asset value adjusted to the nearest cent) per share - Class A shares | $ | 10.47 | $ | 12.38 | $ | 11.13 | $ | 10.79 | ||||||||
| Pricing of Class C Shares | ||||||||||||||||
| Net assets applicable to Class C shares | $ | 11,112,519 | $ | 2,873,572 | $ | 523,991 | $ | 231,467 | ||||||||
| Shares of beneficial interest outstanding (unlimited number of shares authorized, $0.01 par value) | 1,132,039 | 251,455 | 49,798 | 22,797 | ||||||||||||
| Net asset value, offering price per share** | $ | 9.82 | $ | 11.43 | $ | 10.52 | $ | 10.15 | ||||||||
| Pricing of Class Y Shares | ||||||||||||||||
| Net assets applicable to Class Y shares | $ | 117,589,032 | $ | 105,640,927 | $ | 580,030 | $ | 318,198 | ||||||||
| Shares of beneficial interest outstanding (unlimited number of shares authorized, $0.01 par value) | 11,869,904 | 9,086,676 | 54,633 | 30,877 | ||||||||||||
| Net asset value, offering price and redemption price per share | $ | 9.91 | $ | 11.63 | $ | 10.62 | $ | 10.31 | ||||||||
| Pricing of Class Z Shares | ||||||||||||||||
| Net assets applicable to Class Z shares | $ | — | $ | — | $ | — | $ | — | ||||||||
| Shares of beneficial interest outstanding (unlimited number of shares authorized, $0.01 par value) | — | — | — | — | ||||||||||||
| Net asset value, offering price and redemption price per share | $ | — | $ | — | $ | — | $ | — | ||||||||
| Pricing of Institutional Class Shares | ||||||||||||||||
| Net assets applicable to Institutional Class Shares | $ | 45,763,365 | $ | 234,018,880 | $ | 11,698,783 | $ | 35,046,412 | ||||||||
| Shares of beneficial interest outstanding (unlimited number of shares authorized, $0.01 par value) | 4,613,946 | 20,112,064 | 1,088,947 | 3,391,399 | ||||||||||||
| Net asset value, offering price and redemption price per share | $ | 9.92 | $ | 11.64 | $ | 10.74 | $ | 10.33 | ||||||||
* There is no sales load on subscriptions of $1 million or more. Redemptions that were part of a no-load $1 million or more subscription may be subject to a contingent deferred sales load if redeemed within a one-year period from the date of purchase.
** Redemption price per share varies by length of time shares are held.
See accompanying Notes to Financial Statements.
| 98 |
| Statements of Assets and Liabilities (Continued) |
| Touchstone | Touchstone | Touchstone | ||||||||
| Merger | Mid | Mid Cap | ||||||||
| Arbitrage | Cap | Value | ||||||||
| Fund | Fund | Fund | ||||||||
| $ | 96,915,835 | $ | 35,512,718 | $ | 14,029,130 | |||||
| 9,237,750 | 1,499,585 | 845,180 | ||||||||
| $ | 10.49 | $ | 23.68 | $ | 16.60 | |||||
| 5.75 | % | 5.75 | % | 5.75 | % | |||||
| $ | 11.13 | $ | 25.12 | $ | 17.61 | |||||
| $ | 35,737,081 | $ | 41,433,440 | $ | 2,002,145 | |||||
| 3,482,204 | 1,804,156 | 121,939 | ||||||||
| $ | 10.26 | $ | 22.97 | $ | 16.42 | |||||
| $ | 178,304,722 | $ | 266,445,971 | $ | 213,403,950 | |||||
| 16,902,580 | 11,179,687 | 12,803,754 | ||||||||
| $ | 10.55 | $ | 23.83 | $ | 16.67 | |||||
| $ | — | $ | 11,593,143 | $ | — | |||||
| — | 492,562 | — | ||||||||
| $ | — | $ | 23.54 | $ | — | |||||
| $ | 119,727,440 | $ | 90,997,919 | $ | 134,259,417 | |||||
| 11,328,406 | 3,815,247 | 8,024,063 | ||||||||
| $ | 10.57 | $ | 23.85 | $ | 16.73 | |||||
| 99 |
| Statements of Assets and Liabilities (Continued) |
| Touchstone | Touchstone | Touchstone | Touchstone | |||||||||||||
| Premium | Sands Capital | Small | Small | |||||||||||||
| Yield Equity | Select Growth | Cap Core | Cap Value | |||||||||||||
| Fund | Fund | Fund | Fund | |||||||||||||
| Assets | ||||||||||||||||
| Investments, at cost | $ | 153,528,919 | $ | 4,201,693,980 | $ | 673,276,175 | $ | 83,802,820 | ||||||||
| Affiliated securities, at market value | $ | 3,920,442 | $ | 234,335,221 | $ | 10,288,621 | $ | 126,728 | ||||||||
| Non-affiliated securities, at market value | 179,254,228 | 6,186,369,238 | 850,689,945 | 80,309,246 | ||||||||||||
| Investments, at market value (A) | $ | 183,174,670 | $ | 6,420,704,459 | $ | 860,978,566 | $ | 80,435,974 | ||||||||
| Cash | — | — | — | 142,654 | ||||||||||||
| Dividends and interest receivable | 227,326 | 2,737,097 | 1,249,326 | 104,776 | ||||||||||||
| Receivable for capital shares sold | 2,825,775 | 16,782,045 | 837,052 | 50,689 | ||||||||||||
| Receivable for investments sold | — | — | — | 175,135 | ||||||||||||
| Receivable from securities lending income | — | 10,861 | 59,113 | 656 | ||||||||||||
| Tax reclaim receivable | 13,352 | — | 1,117 | — | ||||||||||||
| Other assets | 11,114 | 65,162 | 17,973 | 10,905 | ||||||||||||
| Total Assets | 186,252,237 | 6,440,299,624 | 863,143,147 | 80,920,789 | ||||||||||||
| Liabilities | ||||||||||||||||
| Bank overdrafts | 32 | — | — | — | ||||||||||||
| Dividends payable | 430 | — | — | — | ||||||||||||
| Payable for return of collateral for securities on loan | — | 147,741,989 | 71,468,812 | 6,717,511 | ||||||||||||
| Payable for capital shares redeemed | 499,848 | 14,072,221 | 805,912 | 786,482 | ||||||||||||
| Payable for investments purchased | — | — | — | 401,467 | ||||||||||||
| Payable to Investment Advisor | 96,434 | 3,899,098 | 571,434 | 63,249 | ||||||||||||
| Payable to other affiliates | 60,471 | 4,001,593 | 159,623 | 9,708 | ||||||||||||
| Payable to Trustees | 3,051 | 3,051 | 3,051 | 3,051 | ||||||||||||
| Payable for professional services | 18,924 | 63,633 | 24,531 | 19,089 | ||||||||||||
| Payable to Transfer Agent | 36,915 | 1,128,842 | 73,471 | 23,933 | ||||||||||||
| Payable for reports to shareholders | 16,251 | 223,914 | 26,351 | 18,942 | ||||||||||||
| Other accrued expenses and liabilities | 5,067 | 95,674 | 5,610 | 7,798 | ||||||||||||
| Total Liabilities | 737,423 | 171,230,015 | 73,138,795 | 8,051,230 | ||||||||||||
| Net Assets | $ | 185,514,814 | $ | 6,269,069,609 | $ | 790,004,352 | $ | 72,869,559 | ||||||||
| Net assets consist of: | ||||||||||||||||
| Par value | $ | 186,068 | $ | 3,410,046 | $ | 382,169 | $ | 31,371 | ||||||||
| Paid-in capital | 147,105,300 | 3,809,453,081 | 546,379,698 | 79,713,695 | ||||||||||||
| Accumulated net investment income (loss) | 402,109 | (10,152,161 | ) | — | 18,730 | |||||||||||
| Accumulated net realized gains (losses) on investments | 8,175,586 | 247,348,164 | 55,540,094 | (3,527,391 | ) | |||||||||||
| Net unrealized appreciation (depreciation) on investments | 29,645,751 | 2,219,010,479 | 187,702,391 | (3,366,846 | ) | |||||||||||
| Net Assets | $ | 185,514,814 | $ | 6,269,069,609 | $ | 790,004,352 | $ | 72,869,559 | ||||||||
| (A) Includes market value of securities on loan of: | $ | — | $ | 143,412,285 | $ | 69,629,173 | $ | 6,513,533 | ||||||||
See accompanying Notes to Financial Statements.
| 100 |
| Statements of Assets and Liabilities (Continued) |
| Touchstone | ||||||
| Touchstone | Ultra Short | |||||
| Total Return | Duration Fixed | |||||
| Bond Fund | Income Fund | |||||
| $ | 140,095,792 | $ | 732,931,587 | |||
| $ | 3,288,138 | $ | 576,615 | |||
| 138,116,331 | 731,063,013 | |||||
| $ | 141,404,469 | $ | 731,639,628 | |||
| — | — | |||||
| 1,215,430 | 2,499,172 | |||||
| 114,113 | 7,242,810 | |||||
| — | 8,554,376 | |||||
| — | — | |||||
| — | — | |||||
| 17,241 | 40,477 | |||||
| 142,751,253 | 749,976,463 | |||||
| — | 7,399,977 | |||||
| — | 151,053 | |||||
| — | — | |||||
| 64,539 | 2,934,939 | |||||
| — | 19,188,460 | |||||
| 36,931 | 145,245 | |||||
| 13,123 | 521,471 | |||||
| 3,051 | 3,051 | |||||
| 20,178 | 25,449 | |||||
| 8,684 | 86,620 | |||||
| 15,894 | 35,263 | |||||
| 10,321 | 28,439 | |||||
| 172,721 | 30,519,967 | |||||
| $ | 142,578,532 | $ | 719,456,496 | |||
| $ | 139,287 | $ | 764,488 | |||
| 142,213,763 | 741,078,641 | |||||
| 16,110 | 687,324 | |||||
| (1,099,305 | ) | (21,781,998 | ) | |||
| 1,308,677 | (1,291,959 | ) | ||||
| $ | 142,578,532 | $ | 719,456,496 | |||
| $ | — | $ | — | |||
| 101 |
| Statements of Assets and Liabilities (Continued) |
| Touchstone | Touchstone | Touchstone | Touchstone | |||||||||||||
| Premium | Sands Capital | Small | Small | |||||||||||||
| Yield Equity | Select Growth | Cap Core | Cap Value | |||||||||||||
| Fund | Fund | Fund | Fund | |||||||||||||
| Pricing of Class A Shares | ||||||||||||||||
| Net assets applicable to Class A shares | $ | 45,123,815 | $ | 289,505,771 | $ | 60,246,100 | $ | 31,773,265 | ||||||||
| Shares of beneficial interest outstanding (unlimited number of shares authorized, $0.01 par value) | 4,521,079 | 15,949,558 | 2,931,722 | 1,367,947 | ||||||||||||
| Net asset value price per share* | $ | 9.98 | $ | 18.15 | $ | 20.55 | $ | 23.23 | ||||||||
| Maximum sales charge - Class A shares | 5.75 | % | 5.75 | % | 5.75 | % | 5.75 | % | ||||||||
| Maximum offering price per share (100%/(100%-maximum sales charge) of net asset value adjusted to the nearest cent) per share - Class A shares | $ | 10.59 | $ | 19.26 | $ | 21.80 | $ | 24.65 | ||||||||
| Pricing of Class C Shares | ||||||||||||||||
| Net assets applicable to Class C shares | $ | 31,189,774 | $ | 203,865,244 | $ | 27,104,373 | $ | 2,168,514 | ||||||||
| Shares of beneficial interest outstanding (unlimited number of shares authorized, $0.01 par value) | 3,127,514 | 11,567,007 | 1,350,190 | 94,269 | ||||||||||||
| Net asset value, offering price per share** | $ | 9.97 | $ | 17.62 | $ | 20.07 | $ | 23.00 | ||||||||
| Pricing of Class Y Shares | ||||||||||||||||
| Net assets applicable to Class Y shares | $ | 109,201,225 | $ | 3,473,661,009 | $ | 309,366,706 | $ | 9,096,575 | ||||||||
| Shares of beneficial interest outstanding (unlimited number of shares authorized, $0.01 par value) | 10,958,231 | 186,675,757 | 14,930,407 | 391,318 | ||||||||||||
| Net asset value, offering price and redemption price per share | $ | 9.97 | $ | 18.61 | $ | 20.72 | $ | 23.25 | ||||||||
| Pricing of Class Z Shares | ||||||||||||||||
| Net assets applicable to Class Z shares | $ | — | $ | 2,302,037,585 | $ | — | $ | — | ||||||||
| Shares of beneficial interest outstanding (unlimited number of shares authorized, $0.01 par value) | — | 126,812,296 | — | — | ||||||||||||
| Net asset value, offering price and redemption price per share | $ | — | $ | 18.15 | $ | — | $ | — | ||||||||
| Pricing of Institutional Class Shares | ||||||||||||||||
| Net assets applicable to Institutional Class Shares | $ | — | $ | — | $ | 393,287,173 | $ | 29,831,205 | ||||||||
| Shares of beneficial interest outstanding (unlimited number of shares authorized, $0.01 par value) | — | — | 19,004,628 | 1,283,604 | ||||||||||||
| Net asset value, offering price and redemption price per share | $ | — | $ | — | $ | 20.69 | $ | 23.24 | ||||||||
* There is no sales load on subscriptions of $1 million or more. Redemptions that were part of a no-load $1 million or more subscription may be subject to a contingent deferred sales load if redeemed within a one-year period from the date of purchase.
** Redemption price per share varies by length of time shares are held.
See accompanying Notes to Financial Statements.
| 102 |
| Statements of Assets and Liabilities (Continued) |
| Touchstone | ||||||
| Touchstone | Ultra Short | |||||
| Total Return | Duration Fixed | |||||
| Fund | Income Fund | |||||
| $ | 5,144,239 | $ | 10,595,894 | |||
| 503,038 | 1,126,014 | |||||
| $ | 10.23 | $ | 9.41 | |||
| 4.75 | % | 2.00 | % | |||
| $ | 10.74 | $ | 9.60 | |||
| $ | 1,633,739 | $ | 11,271,630 | |||
| 159,983 | 1,197,603 | |||||
| $ | 10.21 | $ | 9.41 | |||
| $ | 19,396,525 | $ | 244,885,170 | |||
| 1,893,966 | 26,021,838 | |||||
| $ | 10.24 | $ | 9.41 | |||
| $ | — | $ | 401,850,842 | |||
| — | 42,699,235 | |||||
| $ | — | $ | 9.41 | |||
| $ | 116,404,029 | $ | 50,852,960 | |||
| 11,371,733 | 5,404,075 | |||||
| $ | 10.24 | $ | 9.41 | |||
| 103 |
| Statements of Operations |
| For the Year Ended September 30, 2014 |
| Touchstone | Touchstone | Touchstone | ||||||||||||||
| Touchstone | Emerging | Global | International | |||||||||||||
| Arbitrage | Markets Equity | Real Estate | Fixed Income | |||||||||||||
| Fund(B) | Fund | Fund | Fund | |||||||||||||
| Investment Income | ||||||||||||||||
| Dividends from affiliated securities | $ | 2,230 | $ | 1,027 | $ | 8 | $ | 298 | ||||||||
| Dividends from non-affiliated securities(A) | 2,298,011 | 8,858,538 | 851,313 | 4,056 | ||||||||||||
| Interest | 278,262 | — | — | 885,939 | ||||||||||||
| Income from securities loaned | — | 57,866 | 8,304 | — | ||||||||||||
| Total Investment Income | 2,578,503 | 8,917,431 | 859,625 | 890,293 | ||||||||||||
| Expenses | ||||||||||||||||
| Investment advisory fees | 1,811,565 | 3,757,871 | 116,893 | 190,783 | ||||||||||||
| Administration fees | 276,566 | 588,070 | 23,494 | 55,727 | ||||||||||||
| Compliance fees and expenses | 1,681 | 1,681 | 1,681 | 1,681 | ||||||||||||
| Custody fees | 27,778 | 242,255 | 12,667 | 11,589 | ||||||||||||
| Professional fees | 30,655 | 58,327 | 42,578 | 31,345 | ||||||||||||
| Transfer Agent fees, Class A | 40,219 | 27,436 | 1,315 | 1,529 | ||||||||||||
| Transfer Agent fees, Class C | 2,307 | 6,168 | 635 | 252 | ||||||||||||
| Transfer Agent fees, Class Y | 47,498 | 84,759 | 159 | 225 | ||||||||||||
| Transfer Agent fees, Class Z | — | — | — | — | ||||||||||||
| Transfer Agent fees, Institutional Class | 368 | 21,977 | 100 | 70 | ||||||||||||
| Registration Fees, Class A | 6,141 | 16,305 | 4,545 | 8,077 | ||||||||||||
| Registration Fees, Class C | 600 | 10,713 | 2,897 | 6,138 | ||||||||||||
| Registration Fees, Class Y | 3,197 | 18,204 | 2,980 | 5,009 | ||||||||||||
| Registration Fees, Class Z | — | — | — | — | ||||||||||||
| Registration Fees, Institutional Class | 247 | 22,940 | 2,897 | 3,070 | ||||||||||||
| Dividend expense on securities sold short | 1,441,159 | — | — | — | ||||||||||||
| Reports to Shareholders, Class A | 14,499 | 6,675 | 6,194 | 6,432 | ||||||||||||
| Reports to Shareholders, Class C | 8,199 | 6,629 | 6,278 | 6,114 | ||||||||||||
| Reports to Shareholders, Class Y | 14,496 | 13,034 | 6,156 | 6,111 | ||||||||||||
| Reports to Shareholders, Class Z | — | — | — | — | ||||||||||||
| Reports to Shareholders, Institutional Class | 7,758 | 7,609 | 6,170 | 7,278 | ||||||||||||
| Shareholder servicing fees, Class Z | — | — | — | — | ||||||||||||
| Distribution expenses, Class A | 101,793 | 18,930 | 1,769 | 2,392 | ||||||||||||
| Distribution expenses, Class C | 60,848 | 31,766 | 4,305 | 2,393 | ||||||||||||
| Trustee fees | 12,216 | 12,148 | 12,233 | 12,231 | ||||||||||||
| Other expenses | 24,210 | 45,415 | 28,256 | 21,239 | ||||||||||||
| Total Expenses | 3,934,000 | 4,998,912 | 284,202 | 379,685 | ||||||||||||
| Fees waived and/or reimbursed by the Advisor and/or Affiliates(C) | (2,497 | ) | (104,673 | ) | (131,290 | ) | (133,186 | ) | ||||||||
| Fees recouped by the Advisor(C) | — | — | — | — | ||||||||||||
| Net Expenses | 3,931,503 | 4,894,239 | 152,912 | 246,499 | ||||||||||||
| Net Investment Income (Loss) | (1,353,000 | ) | 4,023,192 | 706,713 | 643,794 | |||||||||||
| Realized and Unrealized Gains (Losses) on Investments | ||||||||||||||||
| Net realized gains (losses) from non-affiliated securities | 2,778,521 | (3,464,892 | ) | (77,302 | ) | 1,332,630 | ||||||||||
| Net realized gains (losses) on foreign currency transactions | 185,384 | (382,393 | ) | (10,123 | ) | (729,777 | ) | |||||||||
| Net realized gains on written options | 2,335 | — | — | — | ||||||||||||
| Net realized losses on securities sold short | (1,850,818 | ) | — | — | — | |||||||||||
| Net change in unrealized appreciation (depreciation) on investments(D) | 2,680,661 | 12,003,279 | 790,055 | (1,711,319 | ) | |||||||||||
| Net change in unrealized appreciation (depreciation) on foreign currency transactions | 87,990 | (18,534 | ) | (2,073 | ) | 756,113 | ||||||||||
| Net change in unrealized appreciation (depreciation) on written options | (130,020 | ) | — | — | — | |||||||||||
| Net change in unrealized appreciation (depreciation) on securities sold short | (4,704,096 | ) | — | — | — | |||||||||||
| Net Realized and Unrealized Gains (Losses) on Investments | (950,043 | ) | 8,137,460 | 700,557 | (352,353 | ) | ||||||||||
| Change in Net Assets Resulting from Operations | $ | (2,303,043 | ) | $ | 12,160,652 | $ | 1,407,270 | $ | 291,441 | |||||||
| (A) Net of foreign tax withholding of: | $ | 12,307 | $ | 775,806 | $ | 40,990 | $ | 4,832 | ||||||||
| (B) Represents the period from commencement of operations (October 1, 2013) through September 30, 2014. | ||||||||||||||||
| (C) See Note 4 in Notes to Financial Statements. | ||||||||||||||||
| (D) Change in unrealized appreciation does not include net unrealized appreciation of $8,366,217 for the Mid Cap Value Fund in connection with the Fund's merger. See Note 11 in the Notes to Financial Statements. | ||||||||||||||||
See accompanying Notes to Financial Statements.
| 104 |
| Statements of Operations (Continued) |
| Touchstone | Touchstone | Touchstone | ||||||||
| Merger | Mid | Mid Cap | ||||||||
| Arbitrage | Cap | Value | ||||||||
| Fund | Fund | Fund | ||||||||
| $ | 10,658 | $ | 621 | $ | 469 | |||||
| 7,070,397 | 5,188,260 | 3,818,097 | ||||||||
| 664,650 | — | — | ||||||||
| — | 23,433 | 7,181 | ||||||||
| 7,745,705 | 5,212,314 | 3,825,747 | ||||||||
| 6,422,890 | 3,370,468 | 1,851,195 | ||||||||
| 984,189 | 676,957 | 361,926 | ||||||||
| 1,681 | 1,682 | 1,681 | ||||||||
| 53,446 | 11,057 | 10,854 | ||||||||
| 43,482 | 27,210 | 26,212 | ||||||||
| 111,626 | 54,181 | 14,433 | ||||||||
| 34,467 | 38,231 | 1,837 | ||||||||
| 42,775 | 138,020 | 60,669 | ||||||||
| — | 16,977 | — | ||||||||
| 4,377 | 5,758 | 5,656 | ||||||||
| 36,237 | 19,698 | 12,242 | ||||||||
| 13,353 | 14,447 | 7,303 | ||||||||
| 37,633 | 23,842 | 14,482 | ||||||||
| — | 19,263 | — | ||||||||
| 8,643 | 7,822 | 13,270 | ||||||||
| 5,787,167 | — | — | ||||||||
| 17,430 | 12,798 | 7,995 | ||||||||
| 9,966 | 11,032 | 6,572 | ||||||||
| 24,330 | 21,306 | 14,486 | ||||||||
| — | 8,313 | — | ||||||||
| 8,122 | 6,970 | 9,758 | ||||||||
| — | 35,680 | — | ||||||||
| 531,957 | 133,286 | 28,103 | ||||||||
| 451,592 | 360,876 | 15,227 | ||||||||
| 12,101 | 12,166 | 12,206 | ||||||||
| 55,101 | 44,498 | 38,249 | ||||||||
| 14,692,565 | 5,072,538 | 2,514,356 | ||||||||
| — | (467,705 | ) | (359,416 | ) | ||||||
| 20,195 | — | 26,887 | ||||||||
| 14,712,760 | 4,604,833 | 2,181,827 | ||||||||
| (6,967,055 | ) | 607,481 | 1,643,920 | |||||||
| 11,588,319 | 10,224,597 | 13,549,055 | ||||||||
| 478,644 | — | — | ||||||||
| 12,661 | — | — | ||||||||
| (4,587,821 | ) | — | — | |||||||
| (13,219,204 | ) | 39,529,023 | 4,289,764 | |||||||
| 564,022 | — | — | ||||||||
| (124,796 | ) | — | — | |||||||
| 3,616,717 | — | — | ||||||||
| (1,671,458 | ) | 49,753,620 | 17,838,819 | |||||||
| $ | (8,638,513 | ) | $ | 50,361,101 | $ | 19,482,739 | ||||
| $ | 64,597 | $ | — | $ | — | |||||
| 105 |
| Statements of Operations (Continued) |
| Touchstone | Touchstone | Touchstone | Touchstone | |||||||||||||
| Premium Yield | Sands Capital | Small Cap | Small Cap | |||||||||||||
| Equity | Select Growth | Core | Value | |||||||||||||
| Fund | Fund | Fund | Fund | |||||||||||||
| Investment Income | ||||||||||||||||
| Dividends from affiliated securities | $ | 414 | $ | 12,634 | $ | 1,090 | $ | 131 | ||||||||
| Dividends from non-affiliated securities(A) | 8,906,326 | 24,225,144 | 4,688,922 | 1,758,423 | ||||||||||||
| Interest | — | — | — | — | ||||||||||||
| Income from securities loaned | — | 69,374 | 3,152,984 | 12,029 | ||||||||||||
| Total Investment Income | 8,906,740 | 24,307,152 | 7,842,996 | 1,770,583 | ||||||||||||
| Expenses | ||||||||||||||||
| Investment advisory fees | 1,115,182 | 48,650,087 | 7,318,982 | 555,080 | ||||||||||||
| Administration fees | 263,394 | 9,655,647 | 1,384,341 | 99,095 | ||||||||||||
| Compliance fees and expenses | 1,682 | 1,681 | 1,681 | 1,682 | ||||||||||||
| Custody fees | 4,008 | 82,320 | 15,356 | 11,304 | ||||||||||||
| Professional fees | 21,357 | 165,797 | 38,870 | 21,901 | ||||||||||||
| Transfer Agent fees, Class A | 58,509 | 319,567 | 140,941 | 44,134 | ||||||||||||
| Transfer Agent fees, Class C | 19,049 | 162,546 | 21,132 | 2,373 | ||||||||||||
| Transfer Agent fees, Class Y | 43,268 | 1,230,907 | 129,076 | 5,151 | ||||||||||||
| Transfer Agent fees, Class Z | — | 2,449,027 | — | — | ||||||||||||
| Transfer Agent fees, Institutional Class | — | — | 25,323 | 137 | ||||||||||||
| Registration Fees, Class A | 22,337 | 33,423 | 23,554 | 13,820 | ||||||||||||
| Registration Fees, Class C | 11,465 | 19,946 | 13,938 | 7,252 | ||||||||||||
| Registration Fees, Class Y | 15,074 | 154,248 | 19,228 | 8,549 | ||||||||||||
| Registration Fees, Class Z | — | 65,757 | — | — | ||||||||||||
| Registration Fees, Institutional Class | — | — | 15,919 | 5,139 | ||||||||||||
| Reports to Shareholders, Class A | 12,710 | 59,079 | 16,955 | 15,588 | ||||||||||||
| Reports to Shareholders, Class C | 8,144 | 43,037 | 8,771 | 6,840 | ||||||||||||
| Reports to Shareholders, Class Y | 9,335 | 209,232 | 17,657 | 6,911 | ||||||||||||
| Reports to Shareholders, Class Z | — | 254,848 | — | — | ||||||||||||
| Reports to Shareholders, Institutional Class | — | — | 9,171 | 9,440 | ||||||||||||
| Shareholder servicing fees, Class Z | — | 5,689,462 | — | — | ||||||||||||
| Distribution expenses, Class A | 143,609 | 1,053,691 | 289,316 | 91,284 | ||||||||||||
| Distribution expenses, Class C | 267,127 | 2,097,474 | 294,838 | 16,039 | ||||||||||||
| Trustee fees | 12,198 | 11,171 | 12,066 | 12,229 | ||||||||||||
| Other expenses | 20,722 | 245,257 | 52,232 | 52,224 | ||||||||||||
| Total Expenses | 2,049,170 | 72,654,204 | 9,849,347 | 986,172 | ||||||||||||
| Fees waived and/or reimbursed by the Advisor and/or Affiliates(B) | (82,007 | ) | (1,033,092 | ) | (293,082 | ) | (181,500 | ) | ||||||||
| Fees recouped by the Advisor(B) | — | 889,047 | — | — | ||||||||||||
| Net Expenses | 1,967,163 | 72,510,159 | 9,556,265 | 804,672 | ||||||||||||
| Net Investment Income (Loss) | 6,939,577 | (48,203,007 | ) | (1,713,269 | ) | 965,911 | ||||||||||
| Realized and Unrealized Gains (Losses) on Investments | ||||||||||||||||
| Net realized gains (losses) on investments | 10,080,991 | 370,507,684 | 60,635,559 | 6,848,831 | ||||||||||||
| Net change in unrealized appreciation (depreciation) on investments(C) | 7,915,835 | 414,249,592 | 16,994,276 | (9,011,029 | ) | |||||||||||
| Net Realized and Unrealized Gains (Losses) on Investments | 17,996,826 | 784,757,276 | 77,629,835 | (2,162,198 | ) | |||||||||||
| Change in Net Assets Resulting from Operations | $ | 24,936,403 | $ | 736,554,269 | $ | 75,916,566 | $ | (1,196,287 | ) | |||||||
| (A) Net of foreign tax withholding of: | $ | 106,586 | $ | 373,131 | $ | 36,837 | $ | 1,216 | ||||||||
| (B) | See Note 4 in Notes to Financial Statements. |
| (C) | Change in unrealized appreciation does not include net unrealized appreciation of $2,463,630 for the Small Cap Value Fund in connection with the Fund's merger. See Note 11 in the Notes to Financial Statements. |
See accompanying Notes to Financial Statements.
| 106 |
| Statements of Operations (Continued) |
| Touchstone | ||||||
| Touchstone | Ultra Short | |||||
| Total Return | Duration | |||||
| Bond | Fixed Income | |||||
| Fund | Fund | |||||
| $ | 219 | $ | 3,280 | |||
| — | — | |||||
| 4,895,659 | 10,396,072 | |||||
| — | — | |||||
| 4,895,878 | 10,399,352 | |||||
| 531,579 | 1,760,825 | |||||
| 244,294 | 1,132,456 | |||||
| 1,681 | 1,681 | |||||
| 13,571 | 22,997 | |||||
| 22,664 | 33,868 | |||||
| 12,318 | 12,957 | |||||
| 2,057 | 8,043 | |||||
| 5,206 | 91,616 | |||||
| — | 203,967 | |||||
| 8,163 | 587 | |||||
| 13,813 | 16,060 | |||||
| 9,160 | 14,980 | |||||
| 9,427 | 17,254 | |||||
| — | 32,571 | |||||
| 21,392 | 14,083 | |||||
| 6,803 | 7,017 | |||||
| 6,170 | 6,755 | |||||
| 6,356 | 12,421 | |||||
| — | 38,939 | |||||
| 6,846 | 6,264 | |||||
| — | 959,298 | |||||
| 18,897 | 37,963 | |||||
| 19,387 | 90,625 | |||||
| 12,199 | 12,083 | |||||
| 37,829 | 134,398 | |||||
| 1,009,812 | 4,669,708 | |||||
| (176,962 | ) | (509,400 | ) | |||
| — | — | |||||
| 832,850 | 4,160,308 | |||||
| 4,063,028 | 6,239,044 | |||||
| (86,471 | ) | 1,454,719 | ||||
| 3,229,980 | (643,012 | ) | ||||
| 3,143,509 | 811,707 | |||||
| $ | 7,206,537 | $ | 7,050,751 | |||
| $ | — | $ | — | |||
| 107 |
| Statements of Changes in Net Assets |
| Touchstone | Touchstone | |||||||||||
| Arbitrage | Emerging Markets | |||||||||||
| Fund | Equity Fund | |||||||||||
| For the | For the | For the | ||||||||||
| Year Ended | Year Ended | Year Ended | ||||||||||
| September 30, | September 30, | September 30, | ||||||||||
| 2014(A) | 2014 | 2013 | ||||||||||
| From Operations | ||||||||||||
| Net investment income (loss) | $ | (1,353,000 | ) | $ | 4,023,192 | $ | 5,331,941 | |||||
| Net realized gains (losses) on investments, foreign currency transactions, written options and securities sold short | 1,115,422 | (3,847,285 | ) | (29,636,263 | ) | |||||||
| Net change in unrealized appreciation (depreciation) on investments, foreign currency transactions, written options and securities sold short | (2,065,465 | ) | 11,984,745 | (5,045,535 | ) | |||||||
| Change in Net Assets from Operations | (2,303,043 | ) | 12,160,652 | (29,349,857 | ) | |||||||
| Distributions to Shareholders from: | ||||||||||||
| Net investment income, Class A | — | (25,019 | ) | (13,779 | ) | |||||||
| Net investment income, Class C | — | — | — | |||||||||
| Net investment income, Class Y | — | (1,423,044 | ) | (849,219 | ) | |||||||
| Net investment income, Institutional Class | — | (2,744,620 | ) | (1,292,834 | ) | |||||||
| Net realized gains, Class A | — | — | — | |||||||||
| Net realized gains, Class C | — | — | — | |||||||||
| Net realized gains, Class Y | — | — | — | |||||||||
| Net realized gains, Institutional Class | — | — | — | |||||||||
| Total Distributions | — | (4,192,683 | ) | (2,155,832 | ) | |||||||
| Net Increase (Decrease) from Share Transactions(B) | 199,492,499 | (30,664,199 | ) | (128,132,786 | ) | |||||||
| Total Increase (Decrease) in Net Assets | 197,189,456 | (22,696,230 | ) | (159,638,475 | ) | |||||||
| Net Assets | ||||||||||||
| Beginning of period | — | 370,536,509 | 530,174,984 | |||||||||
| End of period | $ | 197,189,456 | $ | 347,840,279 | $ | 370,536,509 | ||||||
| Accumulated Net Investment Income (Loss) | $ | (474,401 | ) | $ | 3,088,745 | $ | 3,640,629 | |||||
| (A) | Represents the period from commencement of operations (October 1, 2013) through September 30, 2014. |
| (B) | For details on share transactions by class, see Statements of Changes in Net Assets - Capital Stock Activity in pages 114-117. |
See accompanying Notes to Financial Statements.
| 108 |
| Statements of Changes in Net Assets (Continued) |
| Touchstone | Touchstone | Touchstone | ||||||||||||||||||||
| Global Real Estate | International Fixed Income | Merger Arbitrage | ||||||||||||||||||||
| Fund | Fund | Fund | ||||||||||||||||||||
| For the | For the | For the | For the | For the | For the | |||||||||||||||||
| Year Ended | Year Ended | Year Ended | Year Ended | Year Ended | Year Ended | |||||||||||||||||
| September 30, | September 30, | September 30, | September 30, | September 30, | September 30, | |||||||||||||||||
| 2014 | 2013 | 2014 | 2013 | 2014 | 2013 | |||||||||||||||||
| $ | 706,713 | $ | 600,809 | $ | 643,794 | $ | 401,245 | $ | (6,967,055 | ) | $ | 3,538,840 | ||||||||||
| (87,425 | ) | 2,607,920 | 602,853 | (24,499 | ) | 7,491,803 | 19,927,864 | |||||||||||||||
| 787,982 | (1,421,733 | ) | (955,206 | ) | (733,700 | ) | (9,163,261 | ) | (1,220,807 | ) | ||||||||||||
| 1,407,270 | 1,786,996 | 291,441 | (356,954 | ) | (8,638,513 | ) | 22,245,897 | |||||||||||||||
| (49,075 | ) | (27,807 | ) | (6,819 | ) | (4,103 | ) | (1,133,607 | ) | — | ||||||||||||
| (25,115 | ) | (12,932 | ) | (1,294 | ) | (75 | ) | — | — | |||||||||||||
| (21,354 | ) | (10,544 | ) | (2,845 | ) | (1,374 | ) | (1,487,742 | ) | — | ||||||||||||
| (878,015 | ) | (1,019,621 | ) | (252,050 | ) | (90,058 | ) | (1,216,543 | ) | — | ||||||||||||
| (91,730 | ) | (4,182 | ) | (13,011 | ) | (7,395 | ) | (7,622,004 | ) | (1,776,952 | ) | |||||||||||
| (56,232 | ) | (1,893 | ) | (3,243 | ) | (1,544 | ) | (1,468,984 | ) | (319,821 | ) | |||||||||||
| (40,405 | ) | (1,243 | ) | (4,908 | ) | (1,910 | ) | (6,316,580 | ) | (952,569 | ) | |||||||||||
| (1,918,096 | ) | (182,424 | ) | (361,675 | ) | (111,301 | ) | (4,856,576 | ) | (940,829 | ) | |||||||||||
| (3,080,022 | ) | (1,260,646 | ) | (645,845 | ) | (217,760 | ) | (24,102,036 | ) | (3,990,171 | ) | |||||||||||
| (1,188,269 | ) | (7,548,878 | ) | 6,104,419 | (846,807 | ) | (225,458,912 | ) | 324,836,650 | |||||||||||||
| (2,861,021 | ) | (7,022,528 | ) | 5,750,015 | (1,421,521 | ) | (258,199,461 | ) | 343,092,376 | |||||||||||||
| 17,038,385 | 24,060,913 | 30,758,539 | 32,180,060 | 688,884,539 | 345,792,163 | |||||||||||||||||
| $ | 14,177,364 | $ | 17,038,385 | $ | 36,508,554 | $ | 30,758,539 | $ | 430,685,078 | $ | 688,884,539 | |||||||||||
| $ | 4,106 | $ | 144,524 | $ | (258,109 | ) | $ | (151,096 | ) | $ | (2,877,875 | ) | $ | 3,880,468 | ||||||||
| 109 |
Statements of Changes in Net Assets (Continued)
| Touchstone | Touchstone | |||||||||||||||
| Mid Cap | Mid Cap Value | |||||||||||||||
| Fund | Fund | |||||||||||||||
| For the | For the | For the | For the | |||||||||||||
| Year Ended | Year Ended | Year Ended | Year Ended | |||||||||||||
| September 30, | September 30, | September 30, | September 30, | |||||||||||||
| 2014 | 2013 | 2014 | 2013 | |||||||||||||
| From Operations | ||||||||||||||||
| Net investment income (loss) | $ | 607,481 | $ | 1,247,243 | $ | 1,643,920 | $ | 1,363,525 | ||||||||
| Net realized gains on investments | 10,224,597 | 7,906,186 | 13,549,055 | 13,412,475 | ||||||||||||
| Net change in unrealized appreciation (depreciation) on investments | 39,529,023 | 15,462,245 | 4,289,764 | 15,731,819 | ||||||||||||
| Change in Net Assets from Operations | 50,361,101 | 24,615,674 | 19,482,739 | 30,507,819 | ||||||||||||
| Distributions to Shareholders from: | ||||||||||||||||
| Net investment income, Class A | (55,665 | ) | (48,159 | ) | (38,804 | ) | (31,331 | ) | ||||||||
| Net investment income, Class C | — | (20,002 | ) | — | (175 | ) | ||||||||||
| Net investment income, Class Y | (499,864 | ) | (864,201 | ) | (593,150 | ) | (144,380 | ) | ||||||||
| Net investment income, Class Z | (3,557 | ) | (65,114 | ) | — | — | ||||||||||
| Net investment income, Institutional Class | (188,068 | ) | (226,908 | ) | (947,640 | ) | (1,189,996 | ) | ||||||||
| Net realized gains, Class A | — | — | (358,204 | ) | (41,174 | ) | ||||||||||
| Net realized gains, Class C | — | — | (70,196 | ) | (3,413 | ) | ||||||||||
| Net realized gains, Class Y | — | — | (1,353,853 | ) | (161,899 | ) | ||||||||||
| Net realized gains, Class Z | — | — | — | — | ||||||||||||
| Net realized gains, Institutional Class | — | — | (12,333,363 | ) | (973,379 | ) | ||||||||||
| Total Distributions | (747,154 | ) | (1,224,384 | ) | (15,695,210 | ) | (2,545,747 | ) | ||||||||
| Net Increase (Decrease) from Share Transactions(A) | 59,436,231 | 251,756,812 | 193,135,111 | 46,083,223 | ||||||||||||
| Total Increase in Net Assets | 109,050,178 | 275,148,102 | 196,922,640 | 74,045,295 | ||||||||||||
| Net Assets | ||||||||||||||||
| Beginning of period | 336,933,013 | 61,784,911 | 166,772,002 | 92,726,707 | ||||||||||||
| End of period | $ | 445,983,191 | $ | 336,933,013 | $ | 363,694,642 | $ | 166,772,002 | ||||||||
| Accumulated Net Investment Income (Loss) | $ | 362,459 | $ | 502,132 | $ | 148,217 | $ | 51,280 | ||||||||
| (A) | For details on share transactions by class, see Statements of Changes in Net Assets - Capital Stock Activity on pages 117-119. |
See accompanying Notes to Financial Statements.
| 110 |
| Statements of Changes in Net Assets (Continued) |
| Touchstone | ||||||||||||||
| Touchstone | Sands Capital | |||||||||||||
| Premium Yield | Select Growth | |||||||||||||
| Equity Fund | Fund | |||||||||||||
| For the | For the | For the | For the | |||||||||||
| Year Ended | Year Ended | Year Ended | Year Ended | |||||||||||
| September 30, | September 30, | September 30, | September 30, | |||||||||||
| 2014 | 2013 | 2014 | 2013 | |||||||||||
| $ | 6,939,577 | $ | 4,157,850 | $ | (48,203,007 | ) | $ | (22,780,284 | ) | |||||
| 10,080,991 | 5,407,695 | 370,507,684 | 98,941,091 | |||||||||||
| 7,915,835 | 8,349,888 | 414,249,592 | 1,053,951,091 | |||||||||||
| 24,936,403 | 17,915,433 | 736,554,269 | 1,130,111,898 | |||||||||||
| (2,538,944 | ) | (2,147,371 | ) | — | — | |||||||||
| (910,643 | ) | (383,163 | ) | — | — | |||||||||
| (3,422,480 | ) | (1,479,717 | ) | — | — | |||||||||
| — | — | — | — | |||||||||||
| — | — | — | — | |||||||||||
| — | — | (3,338,561 | ) | — | ||||||||||
| — | — | (1,618,597 | ) | — | ||||||||||
| — | — | (20,484,118 | ) | — | ||||||||||
| — | — | (16,954,589 | ) | — | ||||||||||
| — | — | — | — | |||||||||||
| (6,872,067 | ) | (4,010,251 | ) | (42,395,865 | ) | — | ||||||||
| (9,373,472 | ) | 45,274,313 | 134,315,820 | 983,088,443 | ||||||||||
| 8,690,864 | 59,179,495 | 828,474,224 | 2,113,200,341 | |||||||||||
| 176,823,950 | 117,644,455 | 5,440,595,385 | 3,327,395,044 | |||||||||||
| $ | 185,514,814 | $ | 176,823,950 | $ | 6,269,069,609 | $ | 5,440,595,385 | |||||||
| $ | 402,109 | $ | 257,385 | $ | (10,152,161 | ) | $ | (24,531,763 | ) | |||||
| 111 |
| Statements of Changes in Net Assets (Continued) |
| Touchstone | Touchstone | |||||||||||||||
| Small Cap | Small Cap | |||||||||||||||
| Core Fund | Value Fund | |||||||||||||||
| For the | For the | For the | For the | |||||||||||||
| Year Ended | Year Ended | Year Ended | Year Ended | |||||||||||||
| September 30, | September 30, | September 30, | September 30, | |||||||||||||
| 2014 | 2013 | 2014 | 2013 | |||||||||||||
| From Operations | ||||||||||||||||
| Net investment income (loss) | $ | (1,713,269 | ) | $ | 18,286,539 | $ | 965,911 | $ | 728,685 | |||||||
| Net realized gains (losses) on investments | 60,635,559 | 12,189,370 | 6,848,831 | 5,690,013 | ||||||||||||
| Net change in unrealized appreciation (depreciation) on investments | 16,994,276 | 104,824,025 | (9,011,029 | ) | 2,193,049 | |||||||||||
| Change in Net Assets from Operations | 75,916,566 | 135,299,934 | (1,196,287 | ) | 8,611,747 | |||||||||||
| Distributions to Shareholders from: | ||||||||||||||||
| Net investment income, Class A | (1,986,763 | ) | (942,115 | ) | (471,862 | ) | (647,077 | ) | ||||||||
| Net investment income, Class C | (238,421 | ) | (121,769 | ) | (12,264 | ) | (5,841 | ) | ||||||||
| Net investment income, Class Y | (4,569,477 | ) | (2,366,301 | ) | (88,877 | ) | (11,057 | ) | ||||||||
| Net investment income, Class Z | — | — | — | — | ||||||||||||
| Net investment income, Institutional Class | (8,066,410 | ) | (3,846,773 | ) | (380,917 | ) | (55,956 | ) | ||||||||
| Net realized gains, Class A | (1,883,497 | ) | (630,183 | ) | — | — | ||||||||||
| Net realized gains, Class C | (436,531 | ) | (187,197 | ) | — | — | ||||||||||
| Net realized gains, Class Y | (3,655,120 | ) | (1,285,170 | ) | — | — | ||||||||||
| Net realized gains, Institutional Class | (6,236,216 | ) | (1,967,687 | ) | — | — | ||||||||||
| Total Distributions | (27,072,435 | ) | (11,347,195 | ) | (953,920 | ) | (719,931 | ) | ||||||||
| Net Increase (Decrease) from Share Transactions(A) | (63,711,351 | ) | 155,238,416 | 35,918,484 | (2,391,599 | ) | ||||||||||
| Total Increase (Decrease) in Net Assets | (14,867,220 | ) | 279,191,155 | 33,768,277 | 5,500,217 | |||||||||||
| Net Assets | ||||||||||||||||
| Beginning of period | 804,871,572 | 525,680,417 | 39,101,282 | 33,601,065 | ||||||||||||
| End of period | $ | 790,004,352 | $ | 804,871,572 | $ | 72,869,559 | $ | 39,101,282 | ||||||||
| Accumulated Net Investment Income | $ | — | $ | 12,732,836 | $ | 18,730 | $ | — | ||||||||
| (A) | For details on share transactions by class, see Statements of Changes in Net Assets - Capital Stock Activity on pages 120-123. |
See accompanying Notes to Financial Statements.
| 112 |
| Statements of Changes in Net Assets (Continued) |
| Touchstone | ||||||||||||||
| Touchstone | Ultra Short | |||||||||||||
| Total Return | Duration Fixed | |||||||||||||
| Bond Fund | Income Fund | |||||||||||||
| For the | For the | For the | For the | |||||||||||
| Year Ended | Year Ended | Year Ended | Year Ended | |||||||||||
| September 30, | September 30, | September 30, | September 30, | |||||||||||
| 2014 | 2013 | 2014 | 2013 | |||||||||||
| $ | 4,063,028 | $ | 4,184,919 | $ | 6,239,044 | $ | 6,025,594 | |||||||
| (86,471 | ) | 759,500 | 1,454,719 | 558,129 | ||||||||||
| 3,229,980 | (6,889,987 | ) | (643,012 | ) | (2,931,388 | ) | ||||||||
| 7,206,537 | (1,945,568 | ) | 7,050,751 | 3,652,335 | ||||||||||
| (206,484 | ) | (347,583 | ) | (211,746 | ) | (487,305 | ) | |||||||
| (40,162 | ) | (68,454 | ) | (102,390 | ) | (148,936 | ) | |||||||
| (613,793 | ) | (812,532 | ) | (3,782,121 | ) | (3,995,021 | ) | |||||||
| — | — | (5,101,470 | ) | (5,742,283 | ) | |||||||||
| (4,011,329 | ) | (3,915,650 | ) | (900,708 | ) | (519,400 | ) | |||||||
| — | (7,165 | ) | — | — | ||||||||||
| — | (2,608 | ) | — | — | ||||||||||
| — | (15,600 | ) | — | — | ||||||||||
| — | (82,399 | ) | — | — | ||||||||||
| (4,871,768 | ) | (5,251,991 | ) | (10,098,435 | ) | (10,892,945 | ) | |||||||
| (27,064,186 | ) | (17,018,551 | ) | (13,617,210 | ) | 161,736,572 | ||||||||
| (24,729,417 | ) | (24,216,110 | ) | (16,664,894 | ) | 154,495,962 | ||||||||
| 167,307,949 | 191,524,059 | 736,121,390 | 581,625,428 | |||||||||||
| $ | 142,578,532 | $ | 167,307,949 | $ | 719,456,496 | $ | 736,121,390 | |||||||
| $ | 16,110 | $ | 19,128 | $ | 687,324 | $ | 483,808 | |||||||
| 113 |
| Statements of Changes in Net Assets - Capital Stock Activity |
| Touchstone Arbitrage Fund | ||||||||
| For the Year | ||||||||
| Ended | ||||||||
| September 30, 2014(A) | ||||||||
| Shares | Dollars | |||||||
| Class A | ||||||||
| Proceeds from Shares issued | 9,950,955 | $ | 99,281,747 | |||||
| Reinvestment of distributions | — | — | ||||||
| Cost of Shares redeemed | (7,649,365 | ) | (75,910,986 | ) | ||||
| Change from Class A Share Transactions | 2,301,590 | 23,370,761 | ||||||
| Class C | ||||||||
| Proceeds from Shares issued | 1,168,934 | 11,647,230 | ||||||
| Reinvestment of distributions | — | — | ||||||
| Cost of Shares redeemed | (36,895 | ) | (364,881 | ) | ||||
| Change from Class C Share Transactions | 1,132,039 | 11,282,349 | ||||||
| Class Y | ||||||||
| Proceeds from Shares issued | 15,352,300 | 153,248,950 | ||||||
| Reinvestment of distributions | — | — | ||||||
| Cost of Shares redeemed | (3,482,396 | ) | (34,581,935 | ) | ||||
| Change from Class Y Share Transactions | 11,869,904 | 118,667,015 | ||||||
| Institutional Class | ||||||||
| Proceeds from Shares issued | 5,485,908 | 54,843,892 | ||||||
| Reinvestment of distributions | — | — | ||||||
| Cost of Shares redeemed | (871,962 | ) | (8,671,518 | ) | ||||
| Change from Institutional Class Share Transactions | 4,613,946 | 46,172,374 | ||||||
| Change from Share Transactions | 19,917,479 | $ | 199,492,499 | |||||
| (A) | Represents the period from commencement of operations (October 1, 2013) through September 30, 2014. |
See accompanying Notes to Financial Statements.
| 114 |
| Statements of Changes in Net Assets - Capital Stock Activity (Continued) |
| Touchstone Emerging Markets Equity Fund | Touchstone Global Real Estate Fund | |||||||||||||||||||||||||||||
| For the Year | For the Year | For the Year | For the Year | |||||||||||||||||||||||||||
| Ended | Ended | Ended | Ended | |||||||||||||||||||||||||||
| September 30, 2014 | September 30, 2013 | September 30, 2014 | September 30, 2013 | |||||||||||||||||||||||||||
| Shares | Dollars | Shares | Dollars | Shares | Dollars | Shares | Dollars | |||||||||||||||||||||||
| 349,399 | $ | 4,146,928 | 567,760 | $ | 7,165,296 | 76,285 | $ | 845,552 | 16,018 | $ | 203,002 | |||||||||||||||||||
| 1,822 | 20,389 | 859 | 11,038 | 12,669 | 129,331 | 2,434 | 29,394 | |||||||||||||||||||||||
| (751,096 | ) | (8,760,914 | ) | (2,521,816 | ) | (30,327,887 | ) | (11,552 | ) | (126,540 | ) | (5,770 | ) | (70,612 | ) | |||||||||||||||
| (399,875 | ) | (4,593,597 | ) | (1,953,197 | ) | (23,151,553 | ) | 77,402 | 848,343 | 12,682 | 161,784 | |||||||||||||||||||
| 42,073 | 476,030 | 63,004 | 772,978 | 17,395 | 191,715 | 15,027 | 195,729 | |||||||||||||||||||||||
| — | — | — | — | 7,938 | 81,077 | 1,227 | 14,825 | |||||||||||||||||||||||
| (118,966 | ) | (1,322,746 | ) | (139,031 | ) | (1,681,976 | ) | (8,800 | ) | (96,687 | ) | (1,753 | ) | (21,164 | ) | |||||||||||||||
| (76,893 | ) | (846,716 | ) | (76,027 | ) | (908,998 | ) | 16,533 | 176,105 | 14,501 | 189,390 | |||||||||||||||||||
| 2,450,097 | 27,330,935 | 5,554,259 | 69,147,852 | 31,559 | 354,367 | 10,262 | 131,613 | |||||||||||||||||||||||
| 127,955 | 1,422,862 | 66,139 | 849,219 | 5,690 | 58,651 | 968 | 11,787 | |||||||||||||||||||||||
| (5,490,496 | ) | (63,225,764 | ) | (11,533,129 | ) | (134,802,684 | ) | (5,322 | ) | (55,823 | ) | (1,082 | ) | (13,362 | ) | |||||||||||||||
| (2,912,444 | ) | (34,471,967 | ) | (5,912,731 | ) | (64,805,613 | ) | 31,927 | 357,195 | 10,148 | 130,038 | |||||||||||||||||||
| 10,770,410 | 119,377,600 | 5,547,305 | 69,038,192 | 22,314 | 258,716 | 58,011 | 729,514 | |||||||||||||||||||||||
| 245,616 | 2,731,248 | 97,567 | 1,253,736 | 268,374 | 2,796,111 | 97,482 | 1,202,045 | |||||||||||||||||||||||
| (9,818,030 | ) | (112,860,767 | ) | (8,808,133 | ) | (109,558,550 | ) | (484,042 | ) | (5,624,739 | ) | (794,809 | ) | (9,961,649 | ) | |||||||||||||||
| 1,197,996 | 9,248,081 | (3,163,261 | ) | (39,266,622 | ) | (193,354 | ) | (2,569,912 | ) | (639,316 | ) | (8,030,090 | ) | |||||||||||||||||
| (2,191,216 | ) | $ | (30,664,199 | ) | (11,105,216 | ) | $ | (128,132,786 | ) | (67,492 | ) | $ | (1,188,269 | ) | (601,985 | ) | $ | (7,548,878 | ) | |||||||||||
| 115 |
Statements of Changes in Net Assets - Capital Stock Activity (Continued)
| Touchstone International Fixed Income Fund | ||||||||||||||||
| For the Year | For the Year | |||||||||||||||
| Ended | Ended | |||||||||||||||
| September 30, 2014 | September 30, 2013 | |||||||||||||||
| Shares | Dollars | Shares | Dollars | |||||||||||||
| Class A | ||||||||||||||||
| Proceeds from Shares issued | 12,293 | $ | 130,596 | 16,493 | $ | 173,082 | ||||||||||
| Reinvestment of distributions | 1,588 | 16,322 | 978 | 10,369 | ||||||||||||
| Cost of Shares redeemed | (20,015 | ) | (208,848 | ) | (103,704 | ) | (1,079,738 | ) | ||||||||
| Change from Class A Share Transactions | (6,134 | ) | (61,930 | ) | (86,233 | ) | (896,287 | ) | ||||||||
| Class C | ||||||||||||||||
| Proceeds from Shares issued | 138 | 1,444 | 82 | 860 | ||||||||||||
| Reinvestment of distributions | 418 | 4,261 | 106 | 1,118 | ||||||||||||
| Cost of Shares redeemed | (338 | ) | (3,511 | ) | (18,069 | ) | (187,934 | ) | ||||||||
| Change from Class C Share Transactions | 218 | 2,194 | (17,881 | ) | (185,956 | ) | ||||||||||
| Class Y | ||||||||||||||||
| Proceeds from Shares issued | 2,338 | 25,000 | 6,268 | 65,563 | ||||||||||||
| Reinvestment of distributions | 754 | 7,753 | 310 | 3,284 | ||||||||||||
| Cost of Shares redeemed | (8,147 | ) | (84,116 | ) | (19,170 | ) | (200,021 | ) | ||||||||
| Change from Class Y Share Transactions | (5,055 | ) | (51,363 | ) | (12,592 | ) | (131,174 | ) | ||||||||
| Class Z | ||||||||||||||||
| Proceeds from Shares issued | — | — | — | — | ||||||||||||
| Reinvestment of distributions | — | — | — | — | ||||||||||||
| Cost of Shares redeemed | — | — | — | — | ||||||||||||
| Change from Class Z Share Transactions | — | — | — | — | ||||||||||||
| Institutional Class | ||||||||||||||||
| Proceeds from Shares issued | 1,668,761 | 17,481,749 | 724,214 | 7,530,588 | ||||||||||||
| Reinvestment of distributions | 39,876 | 410,356 | 18,025 | 190,893 | ||||||||||||
| Cost of Shares redeemed | (1,102,296 | ) | (11,676,587 | ) | (703,755 | ) | (7,354,871 | ) | ||||||||
| Change from Institutional Class Share Transactions | 606,341 | 6,215,518 | 38,484 | 366,610 | ||||||||||||
| Change from Share Transactions | 595,370 | $ | 6,104,419 | (78,222 | ) | $ | (846,807 | ) | ||||||||
See accompanying Notes to Financial Statements.
| 116 |
Statements of Changes in Net Assets - Capital Stock Activity (Continued)
| Touchstone Merger Arbitrage Fund | Touchstone Mid Cap Fund | |||||||||||||||||||||||||||||
| For the Year | For the Year | For the Year | For the Year | |||||||||||||||||||||||||||
| Ended | Ended | Ended | Ended | |||||||||||||||||||||||||||
| September 30, 2014 | September 30, 2013 | September 30, 2014 | September 30, 2013 | |||||||||||||||||||||||||||
| Shares | Dollars | Shares | Dollars | Shares | Dollars | Shares | Dollars | |||||||||||||||||||||||
| 3,878,209 | $ | 42,296,612 | 16,476,339 | $ | 178,699,582 | 1,607,880 | $ | 35,975,560 | 2,934,407 | $ | 58,979,293 | |||||||||||||||||||
| 799,051 | 8,581,806 | 161,374 | 1,713,795 | 2,129 | 48,558 | 2,767 | 46,590 | |||||||||||||||||||||||
| (20,412,258 | ) | (218,274,531 | ) | (5,764,946 | ) | (62,544,443 | ) | (2,200,002 | ) | (50,866,081 | ) | (902,309 | ) | (18,229,011 | ) | |||||||||||||||
| (15,734,998 | ) | (167,396,113 | ) | 10,872,767 | 117,868,934 | (589,993 | ) | (14,841,963 | ) | 2,034,865 | 40,796,872 | |||||||||||||||||||
| 243,767 | 2,595,260 | 2,652,836 | 28,292,506 | 785,197 | 17,197,751 | 1,184,308 | 23,474,769 | |||||||||||||||||||||||
| 138,877 | 1,462,374 | 28,038 | 294,398 | — | — | 1,188 | 19,628 | |||||||||||||||||||||||
| (1,508,097 | ) | (15,791,020 | ) | (514,087 | ) | (5,508,524 | ) | (209,079 | ) | (4,696,977 | ) | (16,836 | ) | (332,893 | ) | |||||||||||||||
| (1,125,453 | ) | (11,733,386 | ) | 2,166,787 | 23,078,380 | 576,118 | 12,500,774 | 1,168,660 | 23,161,504 | |||||||||||||||||||||
| 10,667,004 | 115,257,589 | 13,887,040 | 151,953,961 | 6,434,227 | 146,829,608 | 7,222,794 | 147,839,291 | |||||||||||||||||||||||
| 689,761 | 7,445,499 | 84,113 | 895,808 | 10,996 | 251,910 | 10,452 | 176,644 | |||||||||||||||||||||||
| (11,756,123 | ) | (126,058,926 | ) | (5,168,052 | ) | (56,098,247 | ) | (3,906,835 | ) | (89,013,478 | ) | (1,448,133 | ) | (28,048,940 | ) | |||||||||||||||
| (399,358 | ) | (3,355,838 | ) | 8,803,101 | 96,751,522 | 2,538,388 | 58,068,040 | 5,785,113 | 119,966,995 | |||||||||||||||||||||
| — | — | — | — | 423,307 | 9,357,895 | 1,075,444 | 20,667,154 | |||||||||||||||||||||||
| — | — | — | — | 157 | 3,557 | 3,892 | 65,114 | |||||||||||||||||||||||
| — | — | — | — | (551,283 | ) | (12,364,897 | ) | (475,176 | ) | (9,552,639 | ) | |||||||||||||||||||
| — | — | — | — | (127,819 | ) | (3,003,445 | ) | 604,160 | 11,179,629 | |||||||||||||||||||||
| 4,951,127 | 53,306,003 | 10,203,758 | 111,782,109 | 1,648,145 | 37,556,817 | 4,283,359 | 86,776,327 | |||||||||||||||||||||||
| 531,575 | 5,752,897 | 82,741 | 882,847 | 4,442 | 101,755 | 13,426 | 226,908 | |||||||||||||||||||||||
| (9,517,077 | ) | (102,032,475 | ) | (2,330,984 | ) | (25,527,142 | ) | (1,371,685 | ) | (30,945,747 | ) | (1,498,715 | ) | (30,351,423 | ) | |||||||||||||||
| (4,034,375 | ) | (42,973,575 | ) | 7,955,515 | 87,137,814 | 280,902 | 6,712,825 | 2,798,070 | 56,651,812 | |||||||||||||||||||||
| (21,294,184 | ) | $ | (225,458,912 | ) | 29,798,170 | $ | 324,836,650 | 2,677,596 | $ | 59,436,231 | 12,390,868 | $ | 251,756,812 | |||||||||||||||||
| 117 |
Statements of Changes in Net Assets - Capital Stock Activity (Continued)
| Touchstone Mid Cap Value Fund | ||||||||||||||||
| For the Year | For the Year | |||||||||||||||
| Ended | Ended | |||||||||||||||
| September 30, 2014 | September 30, 2013 | |||||||||||||||
| Shares | Dollars | Shares | Dollars | |||||||||||||
| Class A | ||||||||||||||||
| Proceeds from Shares issued | 324,500 | $ | 5,381,879 | 196,834 | $ | 2,921,752 | ||||||||||
| Proceeds from Shares issued in connection with merger(A) | 913,005 | 14,967,633 | — | — | ||||||||||||
| Reinvestment of distributions | 25,012 | 387,892 | 5,289 | 71,903 | ||||||||||||
| Cost of Shares redeemed | (747,164 | ) | (12,458,550 | ) | (134,837 | ) | (2,070,096 | ) | ||||||||
| Change from Class A Share Transactions | 515,353 | 8,278,854 | 67,286 | 923,559 | ||||||||||||
| Class C | ||||||||||||||||
| Proceeds from Shares issued | 23,980 | 391,285 | 28,883 | 430,243 | ||||||||||||
| Proceeds from Shares issued in connection with merger(A) | 75,102 | 1,220,480 | — | — | ||||||||||||
| Reinvestment of distributions | 4,492 | 68,682 | 274 | 3,539 | ||||||||||||
| Cost of Shares redeemed | (26,575 | ) | (437,861 | ) | (6,831 | ) | (99,683 | ) | ||||||||
| Change from Class C Share Transactions | 76,999 | 1,242,586 | 22,326 | 334,099 | ||||||||||||
| Class Y | ||||||||||||||||
| Proceeds from Shares issued | 6,542,963 | 111,989,634 | 662,196 | 9,650,959 | ||||||||||||
| Proceeds from Shares issued in connection with merger(A) | 6,892,271 | 113,504,503 | — | — | ||||||||||||
| Reinvestment of distributions | 119,461 | 1,892,632 | 21,720 | 297,372 | ||||||||||||
| Cost of Shares redeemed | (1,728,316 | ) | (28,855,210 | ) | (764,510 | ) | (11,720,968 | ) | ||||||||
| Change from Class Y Share Transactions | 11,826,379 | 198,531,559 | (80,594 | ) | (1,772,637 | ) | ||||||||||
| Class Z | ||||||||||||||||
| Proceeds from Shares issued | — | — | — | — | ||||||||||||
| Reinvestment of distributions | — | — | — | — | ||||||||||||
| Cost of Shares redeemed | — | — | — | — | ||||||||||||
| Change from Class Z Share Transactions | — | — | — | — | ||||||||||||
| Institutional Class | ||||||||||||||||
| Proceeds from Shares issued | 4,545,432 | 75,400,128 | 4,177,025 | 61,381,798 | ||||||||||||
| Proceeds from Shares issued in connection with merger(A) | 1,714,774 | 28,350,276 | — | — | ||||||||||||
| Reinvestment of distributions | 841,759 | 13,125,594 | 153,077 | 2,137,665 | ||||||||||||
| Cost of Shares redeemed | (8,026,469 | ) | (131,793,886 | ) | (1,138,182 | ) | (16,921,261 | ) | ||||||||
| Change from Institutional Class Share Transactions | (924,504 | ) | (14,917,888 | ) | 3,191,920 | 46,598,202 | ||||||||||
| Change from Share Transactions | 11,494,227 | $ | 193,135,111 | 3,200,938 | $ | 46,083,223 | ||||||||||
(A) See Note 11 in the Notes to Financial Statements.
See accompanying Notes to Financial Statements.
| 118 |
Statements of Changes in Net Assets - Capital Stock Activity (Continued)
| Touchstone Premium Yield Equity Fund | Touchstone Sands Capital Select Growth Fund | |||||||||||||||||||||||||||||
| For the Year | For the Year | For the Year | For the Year | |||||||||||||||||||||||||||
| Ended | Ended | Ended | Ended | |||||||||||||||||||||||||||
| September 30, 2014 | September 30, 2013 | September 30, 2014 | September 30, 2013 | |||||||||||||||||||||||||||
| Shares | Dollars | Shares | Dollars | Shares | Dollars | Shares | Dollars | |||||||||||||||||||||||
| 2,063,274 | $ | 19,884,099 | 4,062,564 | $ | 34,214,680 | 6,373,482 | $ | 110,334,538 | 19,056,484 | $ | 253,243,980 | |||||||||||||||||||
| — | — | — | — | — | — | — | — | |||||||||||||||||||||||
| 251,310 | 2,362,109 | 239,077 | 2,024,290 | 160,574 | 2,694,434 | — | — | |||||||||||||||||||||||
| (7,456,862 | ) | (70,214,159 | ) | (3,114,647 | ) | (26,815,297 | ) | (16,479,495 | ) | (288,364,437 | ) | (7,899,233 | ) | (106,636,148 | ) | |||||||||||||||
| (5,142,278 | ) | (47,967,951 | ) | 1,186,994 | 9,423,673 | (9,945,439 | ) | (175,335,465 | ) | 11,157,251 | 146,607,832 | |||||||||||||||||||
| 908,611 | 8,805,613 | 971,989 | 8,312,998 | 984,805 | 16,621,353 | 6,698,538 | 85,620,167 | |||||||||||||||||||||||
| — | — | — | — | — | — | — | — | |||||||||||||||||||||||
| 82,247 | 774,646 | 38,028 | 321,605 | 71,038 | 1,164,306 | — | — | |||||||||||||||||||||||
| (559,961 | ) | (5,291,191 | ) | (248,618 | ) | (2,143,028 | ) | (2,109,370 | ) | (35,791,274 | ) | (1,210,228 | ) | (16,144,024 | ) | |||||||||||||||
| 430,897 | 4,289,068 | 761,399 | 6,491,575 | (1,053,527 | ) | (18,005,615 | ) | 5,488,310 | 69,476,143 | |||||||||||||||||||||
| 6,488,873 | 62,999,341 | 6,489,004 | 56,050,352 | 79,243,960 | 1,412,688,866 | 114,796,231 | 1,575,407,334 | |||||||||||||||||||||||
| — | — | — | — | — | — | — | — | |||||||||||||||||||||||
| 315,597 | 2,995,329 | 142,090 | 1,221,320 | 782,694 | 13,438,856 | — | — | |||||||||||||||||||||||
| (3,331,773 | ) | (31,689,259 | ) | (3,242,622 | ) | (27,912,607 | ) | (56,640,205 | ) | (990,118,898 | ) | (45,712,525 | ) | (638,267,348 | ) | |||||||||||||||
| 3,472,697 | 34,305,411 | 3,388,472 | 29,359,065 | 23,386,449 | 436,008,824 | 69,083,706 | 937,139,986 | |||||||||||||||||||||||
| — | — | — | — | 28,862,264 | 500,750,877 | 78,173,861 | 1,025,556,852 | |||||||||||||||||||||||
| — | — | — | — | 1,005,601 | 16,873,992 | — | — | |||||||||||||||||||||||
| — | — | — | — | (36,175,701 | ) | (625,976,793 | ) | (90,283,128 | ) | (1,195,692,370 | ) | |||||||||||||||||||
| — | — | — | — | (6,307,836 | ) | (108,351,924 | ) | (12,109,267 | ) | (170,135,518 | ) | |||||||||||||||||||
| — | — | — | — | — | — | — | — | |||||||||||||||||||||||
| — | — | — | — | — | — | — | — | |||||||||||||||||||||||
| — | — | — | — | — | — | — | — | |||||||||||||||||||||||
| — | — | — | — | — | — | — | — | |||||||||||||||||||||||
| — | — | — | — | — | — | — | — | |||||||||||||||||||||||
| (1,238,684 | ) | $ | (9,373,472 | ) | 5,336,865 | $ | 45,274,313 | 6,079,647 | $ | 134,315,820 | 73,620,000 | $ | 983,088,443 | |||||||||||||||||
| 119 |
Statements of Changes in Net Assets - Capital Stock Activity (Continued)
| Touchstone Small Cap Core Fund | ||||||||||||||||
| For the Year | For the Year | |||||||||||||||
| Ended | Ended | |||||||||||||||
| September 30, 2014 | September 30, 2013 | |||||||||||||||
| Shares | Dollars | Shares | Dollars | |||||||||||||
| Class A | ||||||||||||||||
| Proceeds from Shares issued | 1,137,776 | $ | 23,406,870 | 2,755,214 | $ | 49,649,792 | ||||||||||
| Proceeds from Shares issued in connection with merger(A) | — | — | — | — | ||||||||||||
| Reinvestment of distributions | 179,857 | 3,724,471 | 93,286 | 1,512,949 | ||||||||||||
| Cost of Shares redeemed | (4,682,878 | ) | (97,669,839 | ) | (1,829,055 | ) | (32,986,610 | ) | ||||||||
| Change from Class A Share Transactions | (3,365,245 | ) | (70,538,498 | ) | 1,019,445 | 18,176,131 | ||||||||||
| Class C | ||||||||||||||||
| Proceeds from Shares issued | 42,416 | 855,387 | 125,334 | 2,194,830 | ||||||||||||
| Proceeds from Shares issued in connection with merger(A) | — | — | — | — | ||||||||||||
| Reinvestment of distributions | 28,666 | 578,774 | 16,268 | 259,899 | ||||||||||||
| Cost of Shares redeemed | (230,065 | ) | (4,680,435 | ) | (179,780 | ) | (3,150,506 | ) | ||||||||
| Change from Class C Share Transactions | (158,983 | ) | (3,246,274 | ) | (38,178 | ) | (695,777 | ) | ||||||||
| Class Y | ||||||||||||||||
| Proceeds from Shares issued | 5,304,875 | 110,996,257 | 5,608,051 | 102,414,124 | ||||||||||||
| Proceeds from Shares issued in connection with merger(A) | — | — | — | — | ||||||||||||
| Reinvestment of distributions | 325,231 | 6,788,917 | 187,973 | 3,063,207 | ||||||||||||
| Cost of Shares redeemed | (3,873,708 | ) | (80,927,924 | ) | (3,098,592 | ) | (54,941,383 | ) | ||||||||
| Change from Class Y Share Transactions | 1,756,398 | 36,857,250 | 2,697,432 | 50,535,948 | ||||||||||||
| Institutional Class | ||||||||||||||||
| Proceeds from Shares issued(B) | 5,823,585 | 121,353,906 | 8,137,090 | 148,321,119 | ||||||||||||
| Proceeds from Shares issued in connection with merger(A) | — | — | — | — | ||||||||||||
| Reinvestment of distributions | 382,417 | 7,971,468 | 231,422 | 3,764,027 | ||||||||||||
| Cost of Shares redeemed | (7,427,639 | ) | (156,109,203 | ) | (3,526,004 | ) | (64,863,032 | ) | ||||||||
| Change from Institutional Class Share Transactions | (1,221,637 | ) | (26,783,829 | ) | 4,842,508 | 87,222,114 | ||||||||||
| Change from Share Transactions | (2,989,467 | ) | $ | (63,711,351 | ) | 8,521,207 | $ | 155,238,416 | ||||||||
(A) See Note 11 in the Notes to Financial Statements.
See accompanying Notes to Financial Statements.
| 120 |
Statements of Changes in Net Assets - Capital Stock Activity (Continued)
| Touchstone Small Cap Value Fund | ||||||||||||||
| For the Year | For the Year | |||||||||||||
| Ended | Ended | |||||||||||||
| September 30, 2014 | September 30, 2013 | |||||||||||||
| Shares | Dollars | Shares | Dollars | |||||||||||
| 187,663 | $ | 4,638,930 | 145,731 | $ | 2,992,876 | |||||||||
| 100,358 | 2,549,878 | — | — | |||||||||||
| 18,458 | 456,503 | 30,906 | 626,985 | |||||||||||
| (466,686 | ) | (11,448,628 | ) | (400,091 | ) | (8,086,608 | ) | |||||||
| (160,207 | ) | (3,803,317 | ) | (223,454 | ) | (4,466,747 | ) | |||||||
| 24,281 | 591,537 | 37,591 | 776,680 | |||||||||||
| 59,836 | 1,506,072 | — | — | |||||||||||
| 314 | 7,732 | 279 | 5,797 | |||||||||||
| (27,353 | ) | (660,561 | ) | (6,389 | ) | (139,799 | ) | |||||||
| 57,078 | 1,444,780 | 31,481 | 642,678 | |||||||||||
| 154,794 | 3,859,535 | 22,783 | 464,463 | |||||||||||
| 269,342 | 6,856,609 | — | — | |||||||||||
| 2,269 | 55,553 | 527 | 11,057 | |||||||||||
| (68,791 | ) | (1,714,797 | ) | (1,690 | ) | (33,553 | ) | |||||||
| 357,614 | 9,056,900 | 21,620 | 441,967 | |||||||||||
| 1,053,391 | 26,269,962 | 56,619 | 1,050,016 | |||||||||||
| 233,106 | 5,932,909 | — | — | |||||||||||
| 15,448 | 380,917 | 2,734 | 55,956 | |||||||||||
| (135,191 | ) | (3,363,667 | ) | (5,740 | ) | (115,469 | ) | |||||||
| 1,166,754 | 29,220,121 | 53,613 | 990,503 | |||||||||||
| 1,421,239 | $ | 35,918,484 | (116,740 | ) | $ | (2,391,599 | ) | |||||||
| 121 |
Statements of Changes in Net Assets - Capital Stock Activity (Continued)
| Touchstone Total Return Bond Fund | ||||||||||||||||
| For the Year | For the Year | |||||||||||||||
| Ended | Ended | |||||||||||||||
| September 30, 2014 | September 30, 2013 | |||||||||||||||
| Shares | Dollars | Shares | Dollars | |||||||||||||
| Class A | ||||||||||||||||
| Proceeds from Shares issued | 114,274 | $ | 1,162,191 | 766,912 | $ | 8,024,153 | ||||||||||
| Reinvestment of distributions | 18,766 | 190,466 | 32,356 | 334,720 | ||||||||||||
| Cost of Shares redeemed | (838,745 | ) | (8,488,953 | ) | (562,703 | ) | (5,800,575 | ) | ||||||||
| Change from Class A Share Transactions | (705,705 | ) | (7,136,296 | ) | 236,565 | 2,558,298 | ||||||||||
| Class C | ||||||||||||||||
| Proceeds from Shares issued | 17,872 | 180,777 | 164,043 | 1,728,220 | ||||||||||||
| Reinvestment of distributions | 3,760 | 38,169 | 6,072 | 62,918 | ||||||||||||
| Cost of Shares redeemed | (105,839 | ) | (1,071,393 | ) | (236,519 | ) | (2,432,808 | ) | ||||||||
| Change from Class C Share Transactions | (84,207 | ) | (852,447 | ) | (66,404 | ) | (641,670 | ) | ||||||||
| Class Y | ||||||||||||||||
| Proceeds from Shares issued | 1,297,006 | 13,228,636 | 875,029 | 9,164,218 | ||||||||||||
| Proceeds from Shares issued in connection with merger(A) | — | — | — | — | ||||||||||||
| Reinvestment of distributions | 59,444 | 605,211 | 79,074 | 820,696 | ||||||||||||
| Cost of Shares redeemed | (1,410,172 | ) | (14,348,740 | ) | (1,831,838 | ) | (18,762,033 | ) | ||||||||
| Change from Class Y Share Transactions | (53,722 | ) | (514,893 | ) | (877,735 | ) | (8,777,119 | ) | ||||||||
| Class Z | ||||||||||||||||
| Proceeds from Shares issued | — | — | — | — | ||||||||||||
| Proceeds from Shares issued in connection with merger(A) | — | — | — | — | ||||||||||||
| Reinvestment of distributions | — | — | — | — | ||||||||||||
| Cost of Shares redeemed | — | — | — | — | ||||||||||||
| Change from Class Z Share Transactions | — | — | — | — | ||||||||||||
| Institutional Class | ||||||||||||||||
| Proceeds from Shares issued | 1,911,209 | 19,401,033 | 3,244,273 | 33,351,984 | ||||||||||||
| Reinvestment of distributions | 394,031 | 4,011,246 | 375,704 | 3,889,399 | ||||||||||||
| Cost of Shares redeemed | (4,138,214 | ) | (41,972,829 | ) | (4,525,810 | ) | (47,399,443 | ) | ||||||||
| Change from Institutional Class Share Transactions | (1,832,974 | ) | (18,560,550 | ) | (905,833 | ) | (10,158,060 | ) | ||||||||
| Change from Share Transactions | (2,676,608 | ) | $ | (27,064,186 | ) | (1,613,407 | ) | $ | (17,018,551 | ) | ||||||
(A) See Note 11 in the Notes to Financial Statements.
See accompanying Notes to Financial Statements.
| 122 |
Statements of Changes in Net Assets - Capital Stock Activity (Continued)
| Touchstone Ultra Short Duration Fixed Income Fund | ||||||||||||||
| For the Year | For the Year | |||||||||||||
| Ended | Ended | |||||||||||||
| September 30, 2014 | September 30, 2013 | |||||||||||||
| Shares | Dollars | Shares | Dollars | |||||||||||
| 733,323 | $ | 6,920,969 | 3,764,497 | $ | 35,791,356 | |||||||||
| 19,343 | 182,582 | 46,701 | 444,277 | |||||||||||
| (3,021,468 | ) | (28,540,488 | ) | (3,996,637 | ) | (38,041,490 | ) | |||||||
| (2,268,802 | ) | (21,436,937 | ) | (185,439 | ) | (1,805,857 | ) | |||||||
| 155,445 | 1,466,933 | 796,167 | 7,583,595 | |||||||||||
| 7,105 | 67,050 | 8,991 | 85,496 | |||||||||||
| (400,339 | ) | (3,779,651 | ) | (574,438 | ) | (5,469,480 | ) | |||||||
| (237,789 | ) | (2,245,668 | ) | 230,720 | 2,199,611 | |||||||||
| 12,370,816 | 116,716,577 | 14,488,359 | 137,674,950 | |||||||||||
| — | — | 5,701,547 | 54,224,138 | |||||||||||
| 210,176 | 1,983,191 | 245,503 | 2,334,564 | |||||||||||
| (12,930,381 | ) | (122,034,351 | ) | (13,993,887 | ) | (132,971,124 | ) | |||||||
| (349,389 | ) | (3,334,583 | ) | 6,441,522 | 61,262,528 | |||||||||
| 24,253,460 | 228,890,297 | 32,594,401 | 309,984,691 | |||||||||||
| — | — | 3,383,059 | 32,175,399 | |||||||||||
| 532,096 | 5,020,759 | 542,072 | 5,154,193 | |||||||||||
| (22,452,531 | ) | (211,938,045 | ) | (31,578,863 | ) | (300,620,937 | ) | |||||||
| 2,333,025 | 21,973,011 | 4,940,669 | 46,693,346 | |||||||||||
| 3,004,848 | 28,350,313 | 7,427,372 | 70,628,165 | |||||||||||
| 87,264 | 823,459 | 49,119 | 465,418 | |||||||||||
| (4,000,850 | ) | (37,746,805 | ) | (1,864,515 | ) | (17,706,639 | ) | |||||||
| (908,738 | ) | (8,573,033 | ) | 5,611,976 | 53,386,944 | |||||||||
| (1,431,693 | ) | $ | (13,617,210 | ) | 17,039,448 | $ | 161,736,572 | |||||||
| 123 |
Touchstone Arbitrage Fund—Class A
Selected Data for a Share Outstanding Throughout Each Period
| Year Ended | ||||
| September | ||||
| 30, | ||||
| 2014(A) | ||||
| Net asset value at beginning of period | $ | 10.00 | ||
| Income (loss) from investments operations: | ||||
| Net investment loss(B) | (0.10 | ) | ||
| Net realized and unrealized losses on investments | (0.03 | ) | ||
| Total from investment operations | (0.13 | ) | ||
| Net asset value at end of period | $ | 9.87 | ||
| Total return(C) | (1.30 | )% | ||
| Ratios and supplemental data: | ||||
| Net assets at end of period (000's) | $ | 22,725 | ||
| Ratio to average net assets: | ||||
| Net expenses (including dividend expense on securities sold short)(D) | 2.51 | % | ||
| Gross expenses (including dividend expense on securities sold short)(E) | 2.51 | % | ||
| Net investment loss | (1.01 | )% | ||
| Portfolio turnover rate | 293 | % | ||
Touchstone Arbitrage Fund—Class C
Selected Data for a Share Outstanding Throughout Each Period
| Year Ended | ||||
| September | ||||
| 30, | ||||
| 2014(A) | ||||
| Net asset value at beginning of period | $ | 10.00 | ||
| Income (loss) from investments operations: | ||||
| Net investments loss(B) | (0.17 | ) | ||
| Net realized and unrealized losses on investments | (0.01 | ) | ||
| Total from investment operations | (0.18 | ) | ||
| Net asset value at end of period | $ | 9.82 | ||
| Total return(C) | (1.80 | )% | ||
| Ratios and supplemental data: | ||||
| Net assets at end of period (000's) | $ | 11,113 | ||
| Ratio to average net assets: | ||||
| Net expenses (including dividend expense on securities sold short)(D) | 3.27 | % | ||
| Gross expenses (including dividend expense on securities sold short)(E) | 3.29 | % | ||
| Net investment loss | (1.77 | )% | ||
| Portfolio turnover rate | 293 | % | ||
(A) Represents the period from commencement of operations (October 1, 2013) through September 30, 2014.
(B) The net investment loss per share is based on average shares outstanding for the period.
(C) Total returns shown exclude the effect of applicable sales loads. If these charges were included, the returns would be lower.
(D) The ratio of net expenses to average net assets excluding dividend expense on securities sold short for Class A is 1.67% and for Class C is 2.43% for the year ended September 30, 2014.
(E) The ratio of gross expenses to average net assets excluding dividend expense on securities sold short for Class A is 1.67% and for Class C is 2.45% for the year ended September 30, 2014.
See accompanying Notes to Financial Statements.
| 124 |
Financial Highlights (Continued)
| Touchstone Arbitrage Fund—Class Y | ||||
| Selected Data for a Share Outstanding Throughout Each Period | ||||
| Year Ended | ||||
| September | ||||
| 30, | ||||
| 2014 (A) | ||||
| Net asset value at beginning of period | $ | 10.00 | ||
| Income (loss) from investment operations: | ||||
| Net investment loss(B) | (0.07 | ) | ||
| Net realized and unrealized losses on investments | (0.02 | ) | ||
| Total from investment operations | (0.09 | ) | ||
| Net asset value at end of period | $ | 9.91 | ||
| Total return | (0.90 | )% | ||
| Ratios and supplemental data: | ||||
| Net assets at end of period (000's) | $ | 117,589 | ||
| Ratio to average net assets: | ||||
| Net expenses (including dividend expense on securities sold short)(C) | 2.19 | % | ||
| Gross expenses (including dividend expense on securities sold short(D) | 2.19 | % | ||
| Net investment loss | (0.69 | )% | ||
| Portfolio turnover rate | 293 | % | ||
| Touchstone Arbitrage Fund—Institutional Class | ||||
| Selected Data for a Share Outstanding Throughout Each Period | ||||
| Year Ended | ||||
| September | ||||
| 30, | ||||
| 2014(A) | ||||
| Net asset value at beginning of period | $ | 10.00 | ||
| Income (loss) from investment operations: | ||||
| Net investment loss(B) | (0.06 | ) | ||
| Net realized and unrealized losses on investments | (0.02 | ) | ||
| Total from investment operations | (0.08 | ) | ||
| Net asset value at end of period | $ | 9.92 | ||
| Total return | (0.80 | )% | ||
| Ratios and supplemental data: | ||||
| Net assets at end of period (000's) | $ | 47,763 | ||
| Ratio to average net assets: | ||||
| Net expenses (including dividend expense on securities sold short)(C) | 2.12 | % | ||
| Gross expenses (including dividend expense on securities sold short)(D) | 2.12 | % | ||
| Net investment loss | (0.62 | )% | ||
| Portfolio turnover rate | 293 | % | ||
(A) Represents the period from commencement of operations (October 1, 2013) through September 30, 2014.
(B) The net investment loss per share is based on average shares outstanding for the period.
(C) The ratio of net expenses to average net assets excluding dividend expense on securities sold short for Class Y is 1.35% and for Institutional Class is 1.28% for the year ended September 30, 2014.
(D) The ratio of gross expenses to average net assets excluding dividend expense on securities sold short for Class Y is 1.35% and for Institutional Class is 1.28% for the year ended September 30, 2014.
See accompanying Notes to Financial Statements.
| 125 |
Financial Highlights (Continued)
Touchstone Emerging Markets Equity Fund—Class A
Selected Data for a Share Outstanding Throughout Each Period
| Year Ended September 30, | ||||||||||||||||||||
| 2014 | 2013 | 2012 | 2011 | 2010(A) | ||||||||||||||||
| Net asset value at beginning of period | $ | 11.52 | $ | 12.24 | $ | 10.69 | $ | 12.68 | $ | 10.00 | ||||||||||
| Income (loss) from investment operations: | ||||||||||||||||||||
| Net investment income | 0.09 | (B) | 0.09 | (B) | 0.11 | 0.10 | 0.03 | |||||||||||||
| Net realized and unrealized gains (losses) on investments | 0.09 | (0.80 | ) | 1.68 | (2.05 | ) | 2.65 | |||||||||||||
| Total from investment operations | 0.18 | (0.71 | ) | 1.79 | (1.95 | ) | 2.68 | |||||||||||||
| Distributions from: | ||||||||||||||||||||
| Net investment income | (0.03 | ) | (0.01 | ) | (0.15 | ) | (0.02 | ) | — | |||||||||||
| Realized capital gains | — | — | (0.09 | ) | (0.02 | ) | — | |||||||||||||
| Total distributions | (0.03 | ) | (0.01 | ) | (0.24 | ) | (0.04 | ) | — | |||||||||||
| Net asset value at end of period | $ | 11.67 | $ | 11.52 | $ | 12.24 | $ | 10.69 | $ | 12.68 | ||||||||||
| Total return(C) | 1.61 | % | (5.69 | )% | 16.71 | % | (15.45 | )% | 26.80 | % | ||||||||||
| Ratios and supplemental data: | ||||||||||||||||||||
| Net assets at end of period (000's) | $ | 5,307 | $ | 9,843 | $ | 34,369 | $ | 26,592 | $ | 10,343 | ||||||||||
| Ratio to average net assets: | ||||||||||||||||||||
| Net expenses | 1.69 | % | 1.69 | % | 1.72 | % | 1.74 | % | 1.74 | % | ||||||||||
| Gross expenses | 2.20 | % | 1.93 | % | 1.99 | % | 1.95 | % | 2.25 | % | ||||||||||
| Net investment income | 0.75 | % | 0.71 | % | 0.94 | % | 0.98 | % | 0.76 | % | ||||||||||
| Portfolio turnover rate | 38 | % | 25 | % | 33 | %(D) | 18 | % | 8 | % | ||||||||||
Touchstone Emerging Markets Equity Fund—Class C
Selected Data for a Share Outstanding Throughout Each Period
| Year Ended September 30, | ||||||||||||||||||||
| 2014 | 2013 | 2012 | 2011 | 2010(A) | ||||||||||||||||
| Net asset value at beginning of period | $ | 11.33 | $ | 12.13 | $ | 10.54 | $ | 12.58 | $ | 10.00 | ||||||||||
| Income (loss) from investment operations: | ||||||||||||||||||||
| Net investment income (loss) | (—) | (B)(E) | (—) | (B)(E) | 0.04 | 0.03 | — | (E) | ||||||||||||
| Net realized and unrealized gains (losses) on investments | 0.10 | (0.80 | ) | 1.64 | (2.05 | ) | 2.58 | |||||||||||||
| Total from investment operations | 0.10 | (0.80 | ) | 1.68 | (2.02 | ) | 2.58 | |||||||||||||
| Distributions from: | ||||||||||||||||||||
| Net investment income | — | — | — | (E) | — | — | ||||||||||||||
| Realized capital gains | — | — | (0.09 | ) | (0.02 | ) | — | |||||||||||||
| Total distributions | — | — | (0.09 | ) | (0.02 | ) | — | |||||||||||||
| Net asset value at end of period | $ | 11.43 | $ | 11.33 | $ | 12.13 | $ | 10.54 | $ | 12.58 | ||||||||||
| Total return(C) | 0.88 | % | (6.44 | )% | 15.84 | % | (16.07 | )% | 25.80 | % | ||||||||||
| Ratios and supplemental data: | ||||||||||||||||||||
| Net assets at end of period (000's) | $ | 2,874 | $ | 3,719 | $ | 4,903 | $ | 5,417 | $ | 3,590 | ||||||||||
| Ratio to average net assets: | ||||||||||||||||||||
| Net expenses | 2.44 | % | 2.44 | % | 2.47 | % | 2.49 | % | 2.49 | % | ||||||||||
| Gross expenses | 3.03 | % | 2.84 | % | 2.85 | % | 2.82 | % | 2.99 | % | ||||||||||
| Net investment income (loss) | (0.00 | )%(E) | (0.04 | )% | 0.19 | % | 0.21 | % | (0.03 | )% | ||||||||||
| Portfolio turnover rate | 38 | % | 25 | % | 33 | %(D) | 18 | % | 8 | % | ||||||||||
| (A) | Represents the period from commencement of operations (October 1, 2009) through September 30, 2010. |
| (B) | The net investment income (loss) per share is based on average shares outstanding for the period. |
| (C) | Total returns shown exclude the effect of applicable sales loads. If these charges were included, the returns would be lower. |
| (D) | Portfolio turnover excludes the purchases and sales of the Touchstone Emerging Markets Equity Fund II acquired on September 17, 2012. If these transactions were included, portfolio turnover would have been higher. |
| (E) | Amount rounds to less than $0.005 per share or 0.005%. |
See accompanying Notes to Financial Statements.
| 126 |
Financial Highlights (Continued)
Touchstone Emerging Markets Equity Fund—Class Y
Selected Data for a Share Outstanding Throughout Each Period
| Year Ended September 30, | ||||||||||||||||||||
| 2014 | 2013 | 2012 | 2011 | 2010(A) | ||||||||||||||||
| Net asset value at beginning of period | $ | 11.54 | $ | 12.27 | $ | 10.74 | $ | 12.72 | $ | 10.00 | ||||||||||
| Income (loss) from investment operations: | ||||||||||||||||||||
| Net investment income | 0.12 | (B) | 0.13 | (B) | 0.14 | 0.11 | 0.01 | |||||||||||||
| Net realized and unrealized gains (losses) on investments | 0.10 | (0.81 | ) | 1.70 | (2.05 | ) | 2.71 | |||||||||||||
| Total from investment operations | 0.22 | (0.68 | ) | 1.84 | (1.94 | ) | 2.72 | |||||||||||||
| Distributions from: | ||||||||||||||||||||
| Net investment income | (0.13 | ) | (0.05 | ) | (0.22 | ) | (0.02 | ) | — | |||||||||||
| Realized capital gains | — | — | (0.09 | ) | (0.02 | ) | — | |||||||||||||
| Total distributions | (0.13 | ) | (0.05 | ) | (0.31 | ) | (0.04 | ) | — | |||||||||||
| Net asset value at end of period | $ | 11.63 | $ | 11.54 | $ | 12.27 | $ | 10.74 | $ | 12.72 | ||||||||||
| Total return | 1.99 | % | (5.45 | )% | 17.12 | % | (15.21 | )% | 27.10 | % | ||||||||||
| Ratios and supplemental data: | ||||||||||||||||||||
| Net assets at end of period (000's) | $ | 105,641 | $ | 138,451 | $ | 219,717 | $ | 151,532 | $ | 13,597 | ||||||||||
| Ratio to average net assets: | ||||||||||||||||||||
| Net expenses | 1.38 | % | 1.37 | % | 1.41 | % | 1.48 | % | 1.49 | % | ||||||||||
| Gross expenses | 1.38 | % | 1.35 | % | 1.44 | % | 1.48 | % | 2.10 | % | ||||||||||
| Net investment income | 1.06 | % | 1.04 | % | 1.25 | % | 1.50 | % | 0.86 | % | ||||||||||
| Portfolio turnover rate | 38 | % | 25 | % | 33 | %(C) | 18 | % | 8 | % | ||||||||||
Touchstone Emerging Markets Equity Fund—Institutional Class
Selected Data for a Share Outstanding Throughout Each Period
| Year Ended September 30, | ||||||||||||||||||||
| 2014 | 2013 | 2012 | 2011 | 2010(A) | ||||||||||||||||
| Net asset value at beginning of period | $ | 11.55 | $ | 12.28 | $ | 10.76 | $ | 12.74 | $ | 10.00 | ||||||||||
| Income (loss) from investment operations: | ||||||||||||||||||||
| Net investment income | 0.13 | (B) | 0.14 | (B) | 0.18 | 0.13 | 0.05 | |||||||||||||
| Net realized and unrealized gains (losses) on investments | 0.11 | (0.81 | ) | 1.67 | (2.06 | ) | 2.69 | |||||||||||||
| Total from investment operations | 0.24 | (0.67 | ) | 1.85 | (1.93 | ) | 2.74 | |||||||||||||
| Distributions from: | ||||||||||||||||||||
| Net investment income | (0.15 | ) | (0.06 | ) | (0.24 | ) | (0.03 | ) | — | |||||||||||
| Realized capital gains | — | — | (0.09 | ) | (0.02 | ) | — | |||||||||||||
| Total distributions | (0.15 | ) | (0.06 | ) | (0.33 | ) | (0.05 | ) | — | |||||||||||
| Net asset value at end of period | $ | 11.64 | $ | 11.55 | $ | 12.28 | $ | 10.76 | $ | 12.74 | ||||||||||
| Total return | 2.13 | % | (5.43 | )% | 17.28 | % | (15.18 | )% | 27.40 | % | ||||||||||
| Ratios and supplemental data: | ||||||||||||||||||||
| Net assets at end of period (000's) | $ | 234,019 | $ | 218,523 | $ | 271,186 | $ | 244,657 | $ | 125,414 | ||||||||||
| Ratio to average net assets: | ||||||||||||||||||||
| Net expenses | 1.29 | % | 1.29 | % | 1.32 | % | 1.34 | % | 1.34 | % | ||||||||||
| Gross expenses | 1.31 | % | 1.29 | % | �� | 1.37 | % | 1.43 | % | 1.74 | % | |||||||||
| Net investment income | 1.15 | % | 1.11 | % | 1.34 | % | 1.51 | % | 1.26 | % | ||||||||||
| Portfolio turnover rate | 38 | % | 25 | % | 33 | %(C) | 18 | % | 8 | % | ||||||||||
| (A) | Represents the period from commencement of operations (October 1, 2009) through September 30, 2010. |
| (B) | The net investment income per share is based on average shares outstanding for the period. |
| (C) | Portfolio turnover excludes the purchases and sales of the Touchstone Emerging Markets Equity Fund II acquired on September 17, 2012. If these transactions were included, portfolio turnover would have been higher. |
See accompanying Notes to Financial Statements.
| 127 |
Financial Highlights (Continued)
Touchstone Global Real Estate Fund—Class A
Selected Data for a Share Outstanding Throughout Each Period
| Year Ended September 30, | ||||||||||||||||||||
| 2014 | 2013 | 2012 | 2011 | 2010(A) | ||||||||||||||||
| Net asset value at beginning of period | $ | 12.03 | $ | 11.86 | $ | 9.76 | $ | 11.46 | $ | 10.00 | ||||||||||
| Income (loss) from investment operations: | ||||||||||||||||||||
| Net investment income | 0.52 | 0.30 | (B) | 0.20 | (B) | 0.35 | 0.36 | |||||||||||||
| Net realized and unrealized gains (losses) on investments | 0.40 | 0.55 | 2.51 | (1.10 | ) | 1.45 | ||||||||||||||
| Total from investment operations | 0.92 | 0.85 | 2.71 | (0.75 | ) | 1.81 | ||||||||||||||
| Distributions from: | ||||||||||||||||||||
| Net investment income | (0.69 | ) | (0.58 | ) | (0.16 | ) | (0.48 | ) | (0.35 | ) | ||||||||||
| Realized capital gains | (1.77 | ) | (0.10 | ) | (0.45 | ) | (0.47 | ) | — | |||||||||||
| Total distributions | (2.46 | ) | (0.68 | ) | (0.61 | ) | (0.95 | ) | (0.35 | ) | ||||||||||
| Net asset value at end of period | $ | 10.49 | $ | 12.03 | $ | 11.86 | $ | 9.76 | $ | 11.46 | ||||||||||
| Total return(C) | 9.49 | % | 7.22 | % | 29.15 | % | (7.47 | )% | 18.54 | % | ||||||||||
| Ratios and supplemental data: | ||||||||||||||||||||
| Net assets at end of period (000's) | $ | 1,375 | $ | 645 | $ | 486 | $ | 2,038 | $ | 881 | ||||||||||
| Ratio to average net assets: | ||||||||||||||||||||
| Net expenses | 1.39 | % | 1.39 | % | 1.39 | % | 1.39 | % | 1.39 | % | ||||||||||
| Gross expenses | 3.58 | % | 3.73 | % | 3.27 | % | 3.55 | % | 4.27 | % | ||||||||||
| Net investment income | 4.49 | % | 2.42 | % | 1.87 | % | 2.30 | % | 2.94 | % | ||||||||||
| Portfolio turnover rate | 53 | % | 159 | % | 94 | % | 85 | % | 107 | % | ||||||||||
Touchstone Global Real Estate Fund—Class C
Selected Data for a Share Outstanding Throughout Each Period
| Year Ended September 30, | ||||||||||||||||||||
| 2014 | 2013 | 2012 | 2011 | 2010(A) | ||||||||||||||||
| Net asset value at beginning of period | $ | 12.06 | $ | 11.90 | $ | 9.80 | $ | 11.50 | $ | 10.00 | ||||||||||
| Income (loss) from investment operations: | ||||||||||||||||||||
| Net investment income | 0.41 | 0.21 | (B) | 0.12 | (B) | 0.20 | 0.17 | |||||||||||||
| Net realized and unrealized gains (losses) on investments | 0.43 | 0.54 | 2.52 | (1.05 | ) | 1.58 | ||||||||||||||
| Total from investment operations | 0.84 | 0.75 | 2.64 | (0.85 | ) | 1.75 | ||||||||||||||
| Distributions from: | ||||||||||||||||||||
| Net investment income | (0.61 | ) | (0.49 | ) | (0.09 | ) | (0.38 | ) | (0.25 | ) | ||||||||||
| Realized capital gains | (1.77 | ) | (0.10 | ) | (0.45 | ) | (0.47 | ) | — | |||||||||||
| Total distributions | (2.38 | ) | (0.59 | ) | (0.54 | ) | (0.85 | ) | (0.25 | ) | ||||||||||
| Net asset value at end of period | $ | 10.52 | $ | 12.06 | $ | 11.90 | $ | 9.80 | $ | 11.50 | ||||||||||
| Total return(C) | 8.67 | % | 6.35 | % | 28.19 | % | (8.20 | )% | 17.75 | % | ||||||||||
| Ratios and supplemental data: | ||||||||||||||||||||
| Net assets at end of period (000's) | $ | 524 | $ | 401 | $ | 223 | $ | 116 | $ | 123 | ||||||||||
| Ratio to average net assets: | ||||||||||||||||||||
| Net expenses | 2.14 | % | 2.14 | % | 2.14 | % | 2.14 | % | 2.14 | % | ||||||||||
| Gross expenses | 4.91 | % | 5.54 | % | 7.79 | % | 11.08 | % | 4.60 | % | ||||||||||
| Net investment income | 3.74 | % | 1.67 | % | 1.12 | % | 1.58 | % | 1.60 | % | ||||||||||
| Portfolio turnover rate | 53 | % | 159 | % | 94 | % | 85 | % | 107 | % | ||||||||||
| (A) | Represents the period from commencement of operations (October 1, 2009) through September 30, 2010. |
| (B) | The net investment income per share is based on average shares outstanding for the period. |
| (C) | Total returns shown exclude the effect of applicable sales loads. If these charges were included, the returns would be lower. |
See accompanying Notes to Financial Statements.
| 128 |
Financial Highlights (Continued)
Touchstone Global Real Estate Fund—Class Y
Selected Data for a Share Outstanding Throughout Each Period
| Year Ended September 30, | ||||||||||||||||||||
| 2014 | 2013 | 2012 | 2011 | 2010(A) | ||||||||||||||||
| Net asset value at beginning of period | $ | 12.14 | $ | 11.97 | $ | 9.84 | $ | 11.53 | $ | 10.00 | ||||||||||
| Income (loss) from investment operations: | ||||||||||||||||||||
| Net investment income | 0.56 | 0.34 | (B) | 0.23 | (B) | 0.32 | 0.28 | |||||||||||||
| Net realized and unrealized gains (losses) on investments | 0.40 | 0.54 | 2.54 | (1.06 | ) | 1.58 | ||||||||||||||
| Total from investment operations | 0.96 | 0.88 | 2.77 | (0.74 | ) | 1.86 | ||||||||||||||
| Distributions from: | ||||||||||||||||||||
| Net investment income | (0.71 | ) | (0.61 | ) | (0.19 | ) | (0.48 | ) | (0.33 | ) | ||||||||||
| Realized capital gains | (1.77 | ) | (0.10 | ) | (0.45 | ) | (0.47 | ) | — | |||||||||||
| Total distributions | (2.48 | ) | (0.71 | ) | (0.64 | ) | (0.95 | ) | (0.33 | ) | ||||||||||
| Net asset value at end of period | $ | 10.62 | $ | 12.14 | $ | 11.97 | $ | 9.84 | $ | 11.53 | ||||||||||
| Total return | 9.80 | % | 7.42 | % | 29.53 | % | (7.27 | )% | 18.90 | % | ||||||||||
| Ratios and supplemental data: | ||||||||||||||||||||
| Net assets at end of period (000's) | $ | 580 | $ | 276 | $ | 150 | $ | 118 | $ | 129 | ||||||||||
| Ratio to average net assets: | ||||||||||||||||||||
| Net expenses | 1.14 | % | 1.14 | % | 1.14 | % | 1.14 | % | 1.14 | % | ||||||||||
| Gross expenses | 4.59 | % | 5.95 | % | 7.29 | % | 9.49 | % | 3.62 | % | ||||||||||
| Net investment income | 4.74 | % | 2.67 | % | 2.12 | % | 2.59 | % | 2.61 | % | ||||||||||
| Portfolio turnover rate | 53 | % | 159 | % | 94 | % | 85 | % | 107 | % | ||||||||||
Touchstone Global Real Estate Fund—Institutional Class
Selected Data for a Share Outstanding Throughout Each Period
| Year Ended September 30, | ||||||||||||||||||||
| 2014 | 2013 | 2012 | 2011 | 2010(A) | ||||||||||||||||
| Net asset value at beginning of period | $ | 12.26 | $ | 12.07 | $ | 9.92 | $ | 11.61 | $ | 10.00 | ||||||||||
| Income (loss) from investment operations: | ||||||||||||||||||||
| Net investment income | 0.53 | 0.36 | (B) | 0.26 | (B) | 0.33 | 0.29 | |||||||||||||
| Net realized and unrealized gains (losses) on investments | 0.45 | 0.56 | 2.55 | (1.07 | ) | 1.59 | ||||||||||||||
| Total from investment operations | 0.98 | 0.92 | 2.81 | (0.74 | ) | 1.88 | ||||||||||||||
| Distributions from: | ||||||||||||||||||||
| Net investment income | (0.73 | ) | (0.63 | ) | (0.21 | ) | (0.48 | ) | (0.27 | ) | ||||||||||
| Realized capital gains | (1.77 | ) | (0.10 | ) | (0.45 | ) | (0.47 | ) | — | |||||||||||
| Total distributions | (2.50 | ) | (0.73 | ) | (0.66 | ) | (0.95 | ) | (0.27 | ) | ||||||||||
| Net asset value at end of period | $ | 10.74 | $ | 12.26 | $ | 12.07 | $ | 9.92 | $ | 11.61 | ||||||||||
| Total return | 9.85 | % | 7.67 | % | 29.68 | % | (7.21 | )% | 19.12 | % | ||||||||||
| Ratios and supplemental data: | ||||||||||||||||||||
| Net assets at end of period (000's) | $ | 11,699 | $ | 15,716 | $ | 23,201 | $ | 2,994 | $ | 3,232 | ||||||||||
| Ratio to average net assets: | ||||||||||||||||||||
| Net expenses | 0.99 | % | 0.99 | % | 0.99 | % | 0.99 | % | 0.99 | % | ||||||||||
| Gross expenses | 1.70 | % | 1.54 | % | 2.09 | % | 3.15 | % | 3.34 | % | ||||||||||
| Net investment income | 4.89 | % | 2.82 | % | 2.27 | % | 2.73 | % | 2.75 | % | ||||||||||
| Portfolio turnover rate | 53 | % | 159 | % | 94 | % | 85 | % | 107 | % | ||||||||||
| (A) | Represents the period from commencement of operations (October 1, 2009) through September 30, 2010. |
| (B) | The net investment income per share is based on average shares outstanding for the period. |
See accompanying Notes to Financial Statements.
| 129 |
Financial Highlights (Continued)
Touchstone International Fixed Income Fund—Class A
Selected Data for a Share Outstanding Throughout Each Period
| Year Ended September 30, | ||||||||||||||||||||
| 2014 | 2013 | 2012 | 2011 | 2010(A) | ||||||||||||||||
| Net asset value at beginning of period | $ | 10.45 | $ | 10.68 | $ | 10.49 | $ | 11.38 | $ | 10.00 | ||||||||||
| Income (loss) from investment operations: | ||||||||||||||||||||
| Net investment income | 0.16 | 0.10 | 0.14 | (B) | 0.14 | 0.12 | ||||||||||||||
| Net realized and unrealized gains (losses) on investments | (0.11 | ) | (0.27 | ) | 0.47 | 0.02 | 1.38 | |||||||||||||
| Total from investment operations | 0.05 | (0.17 | ) | 0.61 | 0.16 | 1.50 | ||||||||||||||
| Distributions from: | ||||||||||||||||||||
| Net investment income | (0.08 | ) | (0.02 | ) | (0.38 | ) | (1.00 | ) | (0.12 | ) | ||||||||||
| Realized capital gains | (0.14 | ) | (0.04 | ) | (0.04 | ) | (0.05 | ) | — | |||||||||||
| Total distributions | (0.22 | ) | (0.06 | ) | (0.42 | ) | (1.05 | ) | (0.12 | ) | ||||||||||
| Net asset value at end of period | $ | 10.28 | $ | 10.45 | $ | 10.68 | $ | 10.49 | $ | 11.38 | ||||||||||
| Total return(C) | 0.48 | % | (1.66 | )% | 6.24 | % | 1.67 | % | 15.15 | % | ||||||||||
| Ratios and supplemental data: | ||||||||||||||||||||
| Net assets at end of period (000's) | $ | 912 | $ | 991 | $ | 1,934 | $ | 2,555 | $ | 1,319 | ||||||||||
| Ratio to average net assets: | ||||||||||||||||||||
| Net expenses | 1.09 | % | 1.09 | % | 1.09 | % | 1.09 | % | 1.09 | % | ||||||||||
| Gross expenses | 2.86 | % | 2.47 | % | 1.97 | % | 2.18 | % | 2.47 | % | ||||||||||
| Net investment income | 1.48 | % | 0.96 | % | 1.36 | % | 2.06 | % | 1.39 | % | ||||||||||
| Portfolio turnover rate | 82 | % | 59 | % | 56 | % | 64 | % | 160 | % | ||||||||||
Touchstone International Fixed Income Fund—Class C
Selected Data for a Share Outstanding Throughout Each Period
| Year Ended September 30, | ||||||||||||||||||||
| 2014 | 2013 | 2012 | 2011 | 2010(A) | ||||||||||||||||
| Net asset value at beginning of period | $ | 10.38 | $ | 10.67 | $ | 10.48 | $ | 11.37 | $ | 10.00 | ||||||||||
| Income (loss) from investment operations: | ||||||||||||||||||||
| Net investment income | 0.08 | 0.01 | 0.06 | (B) | 0.13 | 0.05 | ||||||||||||||
| Net realized and unrealized gains (losses) on investments | (0.11 | ) | (0.26 | ) | 0.47 | (0.05 | ) | 1.37 | ||||||||||||
| Total from investment operations | (0.03 | ) | (0.25 | ) | 0.53 | 0.08 | 1.42 | |||||||||||||
| Distributions from: | ||||||||||||||||||||
| Net investment income | (0.06 | ) | (—) | (D) | (0.30 | ) | (0.92 | ) | (0.05 | ) | ||||||||||
| Realized capital gains | (0.14 | ) | (0.04 | ) | (0.04 | ) | (0.05 | ) | — | |||||||||||
| Total distributions | (0.20 | ) | (0.04 | ) | (0.34 | ) | (0.97 | ) | (0.05 | ) | ||||||||||
| Net asset value at end of period | $ | 10.15 | $ | 10.38 | $ | 10.67 | $ | 10.48 | $ | 11.37 | ||||||||||
| Total return(C) | (0.29 | )% | (2.32 | )% | 5.37 | % | 0.94 | % | 14.29 | % | ||||||||||
| Ratios and supplemental data: | ||||||||||||||||||||
| Net assets at end of period (000's) | $ | 231 | $ | 234 | $ | 432 | $ | 581 | $ | 407 | ||||||||||
| Ratio to average net assets: | ||||||||||||||||||||
| Net expenses | 1.84 | % | 1.84 | % | 1.84 | % | 1.84 | % | 1.84 | % | ||||||||||
| Gross expenses | 7.16 | % | 6.15 | % | 4.73 | % | 4.53 | % | 3.16 | % | ||||||||||
| Net investment income | 0.73 | % | 0.21 | % | 0.61 | % | 1.14 | % | 0.59 | % | ||||||||||
| Portfolio turnover rate | 82 | % | 59 | % | 56 | % | 64 | % | 160 | % | ||||||||||
| (A) | Represents the period from commencement of operations (October 1, 2009) through September 30, 2010. |
| (B) | The net investment income per share is based on average shares outstanding for the period. |
| (C) | Total returns shown exclude the effect of applicable sales loads. If these charges were included, the returns would be lower. |
| (D) | Less than $0.005 per share. |
See accompanying Notes to Financial Statements.
| 130 |
Financial Highlights (Continued)
Touchstone International Fixed Income Fund—Class Y
Selected Data for a Share Outstanding Throughout Each Period
| Year Ended September 30, | ||||||||||||||||||||
| 2014 | 2013 | 2012 | 2011 | 2010(A) | ||||||||||||||||
| Net asset value at beginning of period | $ | 10.45 | $ | 10.66 | $ | 10.48 | $ | 11.37 | $ | 10.00 | ||||||||||
| Income (loss) from investment operations: | ||||||||||||||||||||
| Net investment income | 0.16 | 0.14 | 0.17 | (B) | 0.20 | (B) | 0.16 | |||||||||||||
| Net realized and unrealized gains (losses) on investments | (0.08 | ) | (0.28 | ) | 0.46 | (0.01 | ) | 1.37 | ||||||||||||
| Total from investment operations | 0.08 | (0.14 | ) | 0.63 | 0.19 | 1.53 | ||||||||||||||
| Distributions from: | ||||||||||||||||||||
| Net investment income | (0.08 | ) | (0.03 | ) | (0.41 | ) | (1.03 | ) | (0.16 | ) | ||||||||||
| Realized capital gains | (0.14 | ) | (0.04 | ) | (0.04 | ) | (0.05 | ) | — | |||||||||||
| Total distributions | (0.22 | ) | (0.07 | ) | (0.45 | ) | (1.08 | ) | (0.16 | ) | ||||||||||
| Net asset value at end of period | $ | 10.31 | $ | 10.45 | $ | 10.66 | $ | 10.48 | $ | 11.37 | ||||||||||
| Total return | 0.74 | % | (1.41 | )% | 6.42 | % | 1.97 | % | 15.41 | % | ||||||||||
| Ratios and supplemental data: | ||||||||||||||||||||
| Net assets at end of period (000's) | $ | 318 | $ | 376 | $ | 517 | $ | 721 | $ | 193 | ||||||||||
| Ratio to average net assets: | ||||||||||||||||||||
| Net expenses | 0.84 | % | 0.84 | % | 0.84 | % | 0.84 | % | 0.84 | % | ||||||||||
| Gross expenses | 4.40 | % | 3.61 | % | 2.91 | % | 2.91 | % | 2.50 | % | ||||||||||
| Net investment income | 1.73 | % | 1.21 | % | 1.61 | % | 1.92 | % | 1.52 | % | ||||||||||
| Portfolio turnover rate | 82 | % | 59 | % | 56 | % | 64 | % | 160 | % | ||||||||||
Touchstone International Fixed Income Fund—Institutional Class
Selected Data for a Share Outstanding Throughout Each Period
| Year Ended September 30, | ||||||||||||||||||||
| 2014 | 2013 | 2012 | 2011 | 2010(A) | ||||||||||||||||
| Net asset value at beginning of period | $ | 10.47 | $ | 10.67 | $ | 10.48 | $ | 11.37 | $ | 10.00 | ||||||||||
| Income (loss) from investment operations: | ||||||||||||||||||||
| Net investment income | 0.21 | 0.14 | 0.18 | (B) | 0.23 | 0.17 | ||||||||||||||
| Net realized and unrealized gains (losses) on investments | (0.12 | ) | (0.27 | ) | 0.47 | (0.02 | ) | 1.37 | ||||||||||||
| Total from investment operations | 0.09 | (0.13 | ) | 0.65 | 0.21 | 1.54 | ||||||||||||||
| Distributions from: | ||||||||||||||||||||
| Net investment income | (0.09 | ) | (0.03 | ) | (0.42 | ) | (1.05 | ) | (0.17 | ) | ||||||||||
| Realized capital gains | (0.14 | ) | (0.04 | ) | (0.04 | ) | (0.05 | ) | — | |||||||||||
| Total distributions | (0.23 | ) | (0.07 | ) | (0.46 | ) | (1.10 | ) | (0.17 | ) | ||||||||||
| Net asset value at end of period | $ | 10.33 | $ | 10.47 | $ | 10.67 | $ | 10.48 | $ | 11.37 | ||||||||||
| Total return | 0.88 | % | (1.28 | )% | 6.69 | % | 2.11 | % | 15.59 | % | ||||||||||
| Ratios and supplemental data: | ||||||||||||||||||||
| Net assets at end of period (000's) | $ | 35,046 | $ | 29,157 | $ | 29,297 | $ | 7,931 | $ | 7,746 | ||||||||||
| Ratio to average net assets: | ||||||||||||||||||||
| Net expenses | 0.69 | % | 0.69 | % | 0.69 | % | 0.69 | % | 0.69 | % | ||||||||||
| Gross expenses | 0.97 | % | 1.02 | % | 1.03 | % | 1.41 | % | 1.64 | % | ||||||||||
| Net investment income | 1.88 | % | 1.36 | % | 1.76 | % | 2.25 | % | 1.67 | % | ||||||||||
| Portfolio turnover rate | 82 | % | 59 | % | 56 | % | 64 | % | 160 | % | ||||||||||
| (A) | Represents the period from commencement of operations (October 1, 2009) through September 30, 2010. |
| (B) | The net investment income per share is based on average shares outstanding for the period. |
See accompanying Notes to Financial Statements.
| 131 |
Financial Highlights (Continued)
Touchstone Merger Arbitrage Fund—Class A
Selected Data for a Share Outstanding Throughout Each Period
| Period | ||||||||||||||||
| Ended | ||||||||||||||||
| September | ||||||||||||||||
| Year Ended September 30, | 30, | |||||||||||||||
| 2014 | 2013 | 2012 | 2011(A) | |||||||||||||
| Net asset value at beginning of period | $ | 11.05 | $ | 10.65 | $ | 10.02 | $ | 10.00 | ||||||||
| Income (loss) from investment operations: | ||||||||||||||||
| Net investment income (loss) | (0.13 | )(B) | 0.07 | (B) | (0.09 | )(B) | — | (C) | ||||||||
| Net realized and unrealized gains (losses) on investments | (0.05 | ) | 0.44 | 0.73 | 0.02 | |||||||||||
| Total from investment operations | (0.18 | ) | 0.51 | 0.64 | 0.02 | |||||||||||
| Distributions from: | ||||||||||||||||
| Net investment income | (0.05 | ) | — | — | (C) | — | ||||||||||
| Realized capital gains | (0.33 | ) | (0.11 | ) | (0.01 | ) | — | |||||||||
| Total distributions | (0.38 | ) | (0.11 | ) | (0.01 | ) | — | |||||||||
| Net asset value at end of period | $ | 10.49 | $ | 11.05 | $ | 10.65 | $ | 10.02 | ||||||||
| Total return(D) | (1.75 | )% | 4.84 | % | 6.35 | % | 0.30 | %(E) | ||||||||
| Ratios and supplemental data: | ||||||||||||||||
| Net assets at end of period (000's) | $ | 96,916 | $ | 275,858 | $ | 150,148 | $ | 260 | ||||||||
| Ratio to average net assets: | ||||||||||||||||
| Net expenses (including dividend expense on securities sold short)(F) | 2.52 | % | 2.27 | % | 1.96 | % | 3.33 | %(G) | ||||||||
| Gross expenses (including dividend expense on securities sold short)(H) | 2.52 | % | 2.27 | % | 1.97 | % | 28.67 | %(G) | ||||||||
| Net investment income (loss) | (1.25 | )% | 0.65 | % | (0.90 | )% | (1.97 | )%(G) | ||||||||
| Portfolio turnover rate | 271 | % | 288 | % | 307 | % | 311 | %(E) | ||||||||
| (A) | Represents the period from commencement of operations (August 9, 2011) through September 30, 2011. |
| (B) | The net investment income (loss) per share is based on average shares outstanding for the period. |
| (C) | Less than $0.005 per share. |
| (D) | Total returns shown exclude the effect of applicable sales loads. If these charges were included, the returns would be lower. |
| (E) | Not annualized. |
| (F) | The ratio of net expenses to average net assets excluding dividend and interest expense on securities sold short is 1.57%, 1.64%, 1.65% and 1.69% for the years ended September 2014, 2013, 2012 and for the period ended September 2011, respectively. |
| (G) | Annualized. |
| (H) | The ratio of gross expenses to average net assets excluding dividend and interest expense on securities sold short is 1.57%, 1.64%, 1.66% and 27.03% for the years ended September 2014, 2013, 2012 and for the period ended September 2011, respectively. |
See accompanying Notes to Financial Statements.
| 132 |
Financial Highlights (Continued)
Touchstone Merger Arbitrage Fund—Class C
Selected Data for a Share Outstanding Throughout Each Period
| Period | ||||||||||||||||
| Ended | ||||||||||||||||
| Year Ended | September | |||||||||||||||
| September 30, | 30, | |||||||||||||||
| 2014 | 2013 | 2012 | 2011(A) | |||||||||||||
| Net asset value at beginning of period | $ | 10.85 | $ | 10.54 | $ | 10.01 | $ | 10.00 | ||||||||
| Income (loss) from investment operations: | ||||||||||||||||
| Net investment loss | (0.22 | )(B) | (0.01 | )(B) | (0.17 | )(B) | (0.01 | ) | ||||||||
| Net realized and unrealized gains (losses) on investments | (0.04 | ) | 0.43 | 0.71 | 0.02 | |||||||||||
| Total from investment operations | (0.26 | ) | 0.42 | 0.54 | 0.01 | |||||||||||
| Distributions from: | ||||||||||||||||
| Net investment income | — | — | — | (C) | — | |||||||||||
| Realized capital gains | (0.33 | ) | (0.11 | ) | (0.01 | ) | — | |||||||||
| Total distributions | (0.33 | ) | (0.11 | ) | (0.01 | ) | — | |||||||||
| Net asset value at end of period | $ | 10.26 | $ | 10.85 | $ | 10.54 | $ | 10.01 | ||||||||
| Total return(D) | (2.51 | )% | 3.93 | % | 5.56 | % | 0.10 | %(E) | ||||||||
| Ratios and supplemental data: | ||||||||||||||||
| Net assets at end of period (000's) | $ | 35,737 | $ | 50,001 | $ | 25,739 | $ | 254 | ||||||||
| Ratio to average net assets: | ||||||||||||||||
| Net expenses (including dividend expense on securities sold short)(F) | 3.32 | % | 3.05 | % | 2.74 | % | 4.23 | %(G) | ||||||||
| Gross expenses (including dividend expense on securities sold short)(H) | 3.32 | % | 3.05 | % | 2.75 | % | 29.58 | %(G) | ||||||||
| Net investment loss | (2.05 | )% | (0.13 | )% | (1.68 | )% | (2.74 | )%(G) | ||||||||
| Portfolio turnover rate | 271 | % | 288 | % | 307 | % | 311 | %(E) | ||||||||
| (A) | Represents the period from commencement of operations (August 9, 2011) through September 30, 2011. |
| (B) | The net investment loss per share is based on average shares outstanding for the period. |
| (C) | Less than $0.005 per share. |
| (D) | Total returns shown exclude the effect of applicable sales loads. If these charges were included, the returns would be lower. |
| (E) | Not annualized. |
| (F) | The ratio of net expenses to average net assets excluding dividend and interest expense on securities sold short is 2.37%, 2.42%, 2.43% and 2.43% years ended September 2014, 2013, 2012 and for the period ended September 2011, respectively. |
| (G) | Annualized. |
| (H) | The ratio of gross expenses to average net assets excluding dividend and interest expense on securities sold short is 2.37%, 2.42%, 2.44% and 27.78% for the years ended September 2014, 2013, 2012 and for the period ended September 2011, respectively. |
See accompanying Notes to Financial Statements.
| 133 |
Financial Highlights (Continued)
Touchstone Merger Arbitrage Fund—Class Y
Selected Data for a Share Outstanding Throughout Each Period
| Period | ||||||||||||||||
| Ended | ||||||||||||||||
| Year Ended | September | |||||||||||||||
| September 30, | 30, | |||||||||||||||
| 2014 | 2013 | 2012 | 2011(A) | |||||||||||||
| Net asset value at beginning of period | $ | 11.10 | $ | 10.68 | $ | 10.02 | $ | 10.00 | ||||||||
| Income (loss) from investment operations: | ||||||||||||||||
| Net investment income (loss) | (0.10 | )(B) | 0.10 | (B) | (0.07 | )(B) | (0.01 | ) | ||||||||
| Net realized and unrealized gains (losses) on investments | (0.05 | ) | 0.43 | 0.74 | 0.03 | |||||||||||
| Total from investment operations | (0.15 | ) | 0.53 | 0.67 | 0.02 | |||||||||||
| Distributions from: | ||||||||||||||||
| Net investment income | (0.07 | ) | — | — | (C) | — | ||||||||||
| Realized capital gains | (0.33 | ) | (0.11 | ) | (0.01 | ) | — | |||||||||
| Total distributions | (0.40 | ) | (0.11 | ) | (0.01 | ) | — | |||||||||
| Net asset value at end of period | $ | 10.55 | $ | 11.10 | $ | 10.68 | $ | 10.02 | ||||||||
| Total return | (1.41 | )% | 5.01 | % | 6.75 | % | 0.20 | %(D) | ||||||||
| Net assets at end of period (000's) | $ | 178,305 | $ | 192,095 | $ | 90,741 | $ | 1,160 | ||||||||
| Ratio to average net assets: | ||||||||||||||||
| Net expenses (including dividend expense on securities sold short)(E) | 2.24 | % | 2.02 | % | 1.68 | % | 2.74 | %(F) | ||||||||
| Gross expenses (including dividend expense on securities sold short)(G) | 2.24 | % | 2.01 | % | 1.70 | % | 8.22 | %(F) | ||||||||
| Net investment income (loss) | (0.97 | )% | 0.90 | % | (0.62 | )% | (1.65 | )%(F) | ||||||||
| Portfolio turnover rate | 271 | % | 288 | % | 307 | % | 311 | %(D) | ||||||||
| (A) | Represents the period from commencement of operations (August 9, 2011) through September 30, 2011. |
| (B) | The net investment income (loss) per share is based on average shares outstanding for the period. |
| (C) | Less than $0.005 per share. |
| (D) | Not annualized. |
| (E) | The ratio of net expenses to average net assets excluding dividend and interest expense on securities sold short is 1.29%, 1.39%, 1.37% and 1.43% for the years ended September 2014, 2013, 2012 and for the period ended 2011, respectively. |
| (F) | Annualized. |
| (G) | The ratio of gross expenses to average net assets excluding dividend and interest expense on securities sold short is 1.29%, 1.38%, 1.39% and 6.91% for the years ended September 2014, 2013, 2012 and for the period ended September 2011, respectively. |
See accompanying Notes to Financial Statements.
| 134 |
Financial Highlights (Continued)
Touchstone Merger Arbitrage Fund—Institutional Class
Selected Data for a Share Outstanding Throughout Each Period
| Period | ||||||||||||||||
| Ended | ||||||||||||||||
| Year Ended | September | |||||||||||||||
| September 30, | 30, | |||||||||||||||
| 2014 | 2013 | 2012 | 2011(A) | |||||||||||||
| Net asset value at beginning of period | $ | 11.13 | $ | 10.69 | $ | 10.03 | $ | 10.00 | ||||||||
| Income (loss) from investment operations: | ||||||||||||||||
| Net investment income (loss) | (0.10 | )(B) | 0.11 | (B) | (0.06 | )(B) | (0.02 | ) | ||||||||
| Net realized and unrealized gains (losses) on investments | (0.05 | ) | 0.44 | 0.73 | 0.05 | |||||||||||
| Total from investment operations | (0.15 | ) | 0.55 | 0.67 | 0.03 | |||||||||||
| Distributions from: | ||||||||||||||||
| Net investment income | (0.08 | ) | — | — | (C) | — | ||||||||||
| Realized capital gains | (0.33 | ) | (0.11 | ) | (0.01 | ) | — | |||||||||
| Total distributions | (0.41 | ) | (0.11 | ) | (0.01 | ) | — | |||||||||
| Net asset value at end of period | $ | 10.57 | $ | 11.13 | $ | 10.69 | $ | 10.03 | ||||||||
| Total return | (1.44 | )% | 5.20 | % | 6.75 | % | 0.30 | %(D) | ||||||||
| Net assets at end of period (000's) | $ | 119,727 | $ | 170,930 | $ | 79,164 | $ | 5,016 | ||||||||
| Ratio to average net assets: | ||||||||||||||||
| Net expenses (including dividend expense on securities sold short)(E) | 2.21 | % | 1.91 | % | 1.59 | % | 1.86 | %(F) | ||||||||
| Gross expenses (including dividend expense on securities sold short)(G) | 2.20 | % | 1.92 | % | 1.62 | % | 4.83 | %(F) | ||||||||
| Net investment income (loss) | (0.94 | )% | 1.01 | % | (0.53 | )% | (1.13 | )%(F) | ||||||||
| Portfolio turnover rate | 271 | % | 288 | % | 307 | % | 311 | %(D) | ||||||||
| (A) | Represents the period from commencement of operations (August 9, 2011) through September 30, 2011. |
| (B) | The net investment income (loss) per share is based on average shares outstanding for the period. |
| (C) | Less than $0.005 per share. |
| (D) | Not annualized. |
| (E) | The ratio of net expenses to average net assets excluding dividend and interest expense on securities sold short is 1.26%, 1.28%, 1.28% and 1.28% for the years ended September 2014, 2013, 2012 and for the period ended September 2011, respectively. |
| (F) | Annualized. |
| (G) | The ratio of gross expenses to average net assets excluding dividend and interest expense on securities sold short is 1.25%, 1.29%, 1.31% and 4.25% for the years ended September 2014, 2013, 2012 and for the period ended September 2011, respectively. |
See accompanying Notes to Financial Statements.
| 135 |
Financial Highlights (Continued)
| Touchstone Mid Cap Fund—Class A |
| Selected Data for a Share Outstanding Throughout Each Period |
| Year Ended September 30, | ||||||||||||||||||||
| 2014 | 2013 | 2012 | 2011 | 2010 | ||||||||||||||||
| Net asset value at beginning of period | $ | 20.87 | $ | 16.55 | $ | 13.16 | $ | 12.67 | $ | 11.20 | ||||||||||
| Income (loss) from investment operations: | ||||||||||||||||||||
| Net investment income (loss) | — | (A) | 0.12 | (B) | 0.10 | (B) | (0.02 | ) | 0.29 | |||||||||||
| Net realized and unrealized gains on investments | 2.83 | 4.51 | 3.31 | 0.51 | 1.24 | |||||||||||||||
| Total from investment operations | 2.83 | 4.63 | 3.41 | 0.49 | 1.53 | |||||||||||||||
| Distributions from: | ||||||||||||||||||||
| Net investment income | (0.02 | ) | (0.31 | ) | (0.02 | ) | — | (0.06 | ) | |||||||||||
| Net asset value at end of period | $ | 23.68 | $ | 20.87 | $ | 16.55 | $ | 13.16 | $ | 12.67 | ||||||||||
| Total return(C) | 13.57 | % | 28.43 | % | 25.95 | % | 3.87 | % | 13.72 | % | ||||||||||
| Ratios and supplemental data: | ||||||||||||||||||||
| Net assets at end of period (000’s) | $ | 35,513 | $ | 43,611 | $ | 905 | $ | 698 | $ | 685 | ||||||||||
| Ratio to average net assets: | ||||||||||||||||||||
| Net expenses | 1.23 | % | 1.21 | % | 1.21 | % | 1.21 | % | 1.21 | % | ||||||||||
| Gross expenses | 1.40 | % | 1.50 | % | 3.50 | % | 3.05 | % | 2.84 | % | ||||||||||
| Net investment income (loss) | 0.01 | % | 0.61 | % | 0.66 | % | (0.02 | )% | 0.34 | % | ||||||||||
| Portfolio turnover rate | 26 | % | 20 | % | 152 | % | 97 | % | 132 | % | ||||||||||
| Touchstone Mid Cap Fund—Class C |
| Selected Data for a Share Outstanding Throughout Each Period |
| Year Ended September 30, | ||||||||||||||||||||
| 2014 | 2013 | 2012 | 2011 | 2010 | ||||||||||||||||
| Net asset value at beginning of period | $ | 20.37 | $ | 16.21 | $ | 12.96 | $ | 12.58 | $ | 11.19 | ||||||||||
| Income (loss) from investment operations: | ||||||||||||||||||||
| Net investment loss | (0.15 | ) | (0.03 | )(B) | (0.01 | )(B) | (0.07 | ) | (0.04 | ) | ||||||||||
| Net realized and unrealized gains on investments | 2.75 | 4.42 | 3.26 | 0.45 | 1.43 | |||||||||||||||
| Total from investment operations | 2.60 | 4.39 | 3.25 | 0.38 | 1.39 | |||||||||||||||
| Distributions from: | ||||||||||||||||||||
| Net investment income | — | (0.23 | ) | — | — | — | ||||||||||||||
| Net asset value at end of period | $ | 22.97 | $ | 20.37 | $ | 16.21 | $ | 12.96 | $ | 12.58 | ||||||||||
| Total return(C) | 12.76 | % | 27.43 | % | 25.08 | % | 3.02 | % | 12.42 | % | ||||||||||
| Ratios and supplemental data: | ||||||||||||||||||||
| Net assets at end of period (000’s) | $ | 41,433 | $ | 25,018 | $ | 962 | $ | 476 | $ | 249 | ||||||||||
| Ratio to average net assets: | ||||||||||||||||||||
| Net expenses | 1.98 | % | 1.96 | % | 1.96 | % | 1.96 | % | 1.94 | % | ||||||||||
| Gross expenses | 2.16 | % | 2.37 | % | 4.62 | % | 4.95 | % | 4.57 | % | ||||||||||
| Net investment loss | (0.75 | )% | (0.14 | )% | (0.09 | )% | (0.80 | )% | (0.40 | )% | ||||||||||
| Portfolio turnover rate | 26 | % | 20 | % | 152 | % | 97 | % | 132 | % | ||||||||||
| (A) | Less than $0.005 per share. |
| (B) | The net investment income (loss) per share is based on average shares outstanding for the period. |
| (C) | Total return shown exclude the effect of applicable sales loads. If these charges were included, the returns would be lower. |
See accompanying Notes to Financial Statements.
| 136 |
Financial Highlights (Continued)
| Touchstone Mid Cap Fund—Class Y |
| Selected Data for a Share Outstanding Throughout Each Period |
| Year Ended September 30, | ||||||||||||||||||||
| 2014 | 2013 | 2012 | 2011 | 2010 | ||||||||||||||||
| Net asset value at beginning of period | $ | 20.98 | $ | 16.60 | $ | 13.17 | $ | 12.68 | $ | 11.25 | ||||||||||
| Income from investment operations: | ||||||||||||||||||||
| Net investment income | 0.06 | 0.17 | (A) | 0.15 | (A) | 0.05 | 0.08 | |||||||||||||
| Net realized and unrealized gains on investments | 2.84 | 4.53 | 3.31 | 0.47 | 1.44 | |||||||||||||||
| Total from investment operations | 2.90 | 4.70 | 3.46 | 0.52 | 1.52 | |||||||||||||||
| Distributions from: | ||||||||||||||||||||
| Net investment income | (0.05 | ) | (0.32 | ) | (0.03 | ) | (0.03 | ) | (0.09 | ) | ||||||||||
| Net asset value at end of period | $ | 23.83 | $ | 20.98 | $ | 16.60 | $ | 13.17 | $ | 12.68 | ||||||||||
| Total return | 13.83 | % | 28.78 | % | 26.29 | % | 4.10 | % | 13.58 | % | ||||||||||
| Ratios and supplemental data: | ||||||||||||||||||||
| Net assets at end of period (000’s) | $ | 266,446 | $ | 181,276 | $ | 47,419 | $ | 77,785 | $ | 123,493 | ||||||||||
| Ratio to average net assets: | ||||||||||||||||||||
| Net expenses | 0.98 | % | 0.95 | % | 0.92 | % | 0.96 | % | 0.94 | % | ||||||||||
| Gross expenses | 1.06 | % | 1.09 | % | 1.08 | % | 1.06 | % | 1.07 | % | ||||||||||
| Net investment income | 0.26 | % | 0.87 | % | 0.95 | % | 0.26 | % | 0.71 | % | ||||||||||
| Portfolio turnover rate | 26 | % | 20 | % | 152 | % | 97 | % | 132 | % | ||||||||||
| Touchstone Mid Cap Fund—Class Z |
| Selected Data for a Share Outstanding Throughout Each Period |
| Year Ended September 30, | ||||||||||||||||||||
| 2014 | 2013 | 2012 | 2011 | 2010 | ||||||||||||||||
| Net asset value at beginning of period | $ | 20.73 | $ | 16.45 | $ | 13.08 | $ | 12.59 | $ | 11.18 | ||||||||||
| Income (loss) from investment operations: | ||||||||||||||||||||
| Net investment income (loss) | 0.01 | 0.12 | (A) | 0.10 | (A) | (— | )(B) | 0.02 | ||||||||||||
| Net realized and unrealized gains on investments | 2.81 | 4.48 | 3.28 | 0.49 | 1.45 | |||||||||||||||
| Total from investment operations | 2.82 | 4.60 | 3.38 | 0.49 | 1.47 | |||||||||||||||
| Distributions from: | ||||||||||||||||||||
| Net investment income | (0.01 | ) | (0.32 | ) | (0.01 | ) | — | (0.06 | ) | |||||||||||
| Net asset value at end of period | $ | 23.54 | $ | 20.73 | $ | 16.45 | $ | 13.08 | $ | 12.59 | ||||||||||
| Total return | 13.58 | % | 28.45 | % | 25.89 | % | 3.89 | % | 13.20 | % | ||||||||||
| Ratios and supplemental data: | ||||||||||||||||||||
| Net assets at end of period (000’s) | $ | 11,593 | $ | 12,858 | $ | 267 | $ | 934 | $ | 652 | ||||||||||
| Ratio to average net assets: | ||||||||||||||||||||
| Net expenses | 1.23 | % | 1.21 | % | 1.21 | % | 1.21 | % | 1.19 | % | ||||||||||
| Gross expenses | 1.55 | % | 1.55 | % | 3.67 | % | 3.68 | % | 2.14 | % | ||||||||||
| Net investment income (loss) | 0.01 | % | 0.61 | % | 0.66 | % | (0.09 | )% | 0.45 | % | ||||||||||
| Portfolio turnover rate | 26 | % | 20 | % | 152 | % | 97 | % | 132 | % | ||||||||||
| (A) | The net investment income per share is based on average shares outstanding for the period. |
| (B) | Less than $0.005 per share. |
See accompanying Notes to Financial Statements.
| 137 |
Financial Highlights (Continued)
| Touchstone Mid Cap Fund—Institutional Class |
| Selected Data for a Share Outstanding Throughout The Period |
| Period | ||||||||||||
| Ended | ||||||||||||
| Year Ended | September | |||||||||||
| September 30, | 30, | |||||||||||
| 2014 | 2013 | 2012(A) | ||||||||||
| Net asset value at beginning of period | $ | 20.99 | $ | 16.61 | $ | 15.36 | ||||||
| Income from investment operations: | ||||||||||||
| Net investment income | 0.08 | 0.19 | (B) | 0.10 | (B) | |||||||
| Net realized and unrealized gains on investments | 2.84 | 4.52 | 1.15 | |||||||||
| Total from investment operations | 2.92 | 4.71 | 1.25 | |||||||||
| Distributions from: | ||||||||||||
| Net investment income | (0.06 | ) | (0.33 | ) | — | |||||||
| Net asset value at end of period | $ | 23.85 | $ | 20.99 | $ | 16.61 | ||||||
| Total return | 13.91 | % | 28.85 | % | 8.14 | %(C) | ||||||
| Ratios and supplemental data: | ||||||||||||
| Net assets at end of period (000’s) | $ | 90,998 | $ | 74,170 | $ | 12,231 | ||||||
| Ratio to average net assets: | ||||||||||||
| Net expenses | 0.91 | % | 0.89 | % | 0.89 | %(D) | ||||||
| Gross expenses | 1.01 | % | 1.07 | % | 1.38 | %(D) | ||||||
| Net investment income | 0.33 | % | 0.93 | % | 0.98 | %(D) | ||||||
| Portfolio turnover rate | 26 | % | 20 | % | 152 | % | ||||||
| (A) | Represents the period from commencement of operations (January 27, 2012) through September 30, 2012. |
| (B) | The net investment income per share is based on average shares outstanding for the period. |
| (C) | Not annualized. |
| (D) | Annualized. |
See accompanying Notes to Financial Statements.
| 138 |
Financial Highlights (Continued)
| Touchstone Mid Cap Value Fund—Class A |
| Selected Data for a Share Outstanding Throughout Each Period |
| Year Ended September 30, | ||||||||||||||||||||
| 2014 | 2013 | 2012 | 2011 | 2010(A) | ||||||||||||||||
| Net asset value at beginning of period | $ | 16.09 | $ | 12.98 | $ | 10.86 | $ | 11.76 | $ | 10.00 | ||||||||||
| Income (loss) from investment operations: | ||||||||||||||||||||
| Net investment income | 0.05 | 0.10 | 0.09 | 0.09 | 0.12 | |||||||||||||||
| Net realized and unrealized gains (losses) on investments | 1.85 | 3.26 | 2.78 | (0.72 | ) | 1.74 | ||||||||||||||
| Total from investment operations | 1.90 | 3.36 | 2.87 | (0.63 | ) | 1.86 | ||||||||||||||
| Distributions from: | ||||||||||||||||||||
| Net investment income | (0.05 | ) | (0.10 | ) | (0.09 | ) | (0.11 | ) | (0.10 | ) | ||||||||||
| Realized capital gains | (1.34 | ) | (0.15 | ) | (0.66 | ) | (0.16 | ) | — | |||||||||||
| Total distributions | (1.39 | ) | (0.25 | ) | (0.75 | ) | (0.27 | ) | (0.10 | ) | ||||||||||
| Net asset value at end of period | $ | 16.60 | $ | 16.09 | $ | 12.98 | $ | 10.86 | $ | 11.76 | ||||||||||
| Total return(B) | 12.49 | % | 26.26 | % | 27.55 | % | (5.72 | )% | 18.70 | % | ||||||||||
| Ratios and supplemental data: | ||||||||||||||||||||
| Net assets at end of period (000’s) | $ | 14,029 | $ | 5,307 | $ | 3,409 | $ | 2,364 | $ | 345 | ||||||||||
| Ratio to average net assets: | ||||||||||||||||||||
| Net expenses | 1.29 | % | 1.29 | % | 1.29 | % | 1.29 | % | 1.29 | % | ||||||||||
| Gross expenses | 1.58 | % | 1.75 | % | 1.97 | % | 2.07 | % | 3.07 | % | ||||||||||
| Net investment income | 0.41 | % | 0.73 | % | 0.77 | % | 0.86 | % | 1.07 | % | ||||||||||
| Portfolio turnover rate | 85 | %(C) | 68 | % | 42 | % | 59 | % | 45 | % | ||||||||||
| Touchstone Mid Cap Value Fund—Class C |
| Selected Data for a Share Outstanding Throughout Each Period |
| Year Ended September 30, | ||||||||||||||||||||
| 2014 | 2013 | 2012 | 2011 | 2010(A) | ||||||||||||||||
| Net asset value at beginning of period | $ | 16.00 | $ | 12.92 | $ | 10.82 | $ | 11.74 | $ | 10.00 | ||||||||||
| Income (loss) from investment operations: | ||||||||||||||||||||
| Net investment income (loss) | (0.04 | ) | (— | )(D) | — | (D) | 0.03 | 0.03 | ||||||||||||
| Net realized and unrealized gains (losses) on investments | 1.80 | 3.24 | 2.77 | (0.75 | ) | 1.75 | ||||||||||||||
| Total from investment operations | 1.76 | 3.24 | 2.77 | (0.72 | ) | 1.78 | ||||||||||||||
| Distributions from: | ||||||||||||||||||||
| Net investment income (loss) | — | (0.01 | ) | (0.01 | ) | (0.04 | ) | (0.04 | ) | |||||||||||
| Realized capital gains | (1.34 | ) | (0.15 | ) | (0.66 | ) | (0.16 | ) | — | |||||||||||
| Total distributions | (1.34 | ) | (0.16 | ) | (0.67 | ) | (0.20 | ) | (0.04 | ) | ||||||||||
| Net asset value at end of period | $ | 16.42 | $ | 16.00 | $ | 12.92 | $ | 10.82 | $ | 11.74 | ||||||||||
| Total return(B) | 11.62 | % | 25.32 | % | 26.64 | % | (6.45 | )% | 17.88 | % | ||||||||||
| Ratios and supplemental data: | ||||||||||||||||||||
| Net assets at end of period (000’s) | $ | 2,002 | $ | 719 | $ | 292 | $ | 204 | $ | 132 | ||||||||||
| Ratio to average net assets: | ||||||||||||||||||||
| Net expenses | 2.04 | % | 2.04 | % | 2.04 | % | 2.04 | % | 2.04 | % | ||||||||||
| Gross expenses | 3.05 | % | 4.17 | % | 7.90 | % | 7.74 | % | 3.86 | % | ||||||||||
| Net investment income (loss) | (0.34 | )% | (0.02 | )% | 0.02 | % | 0.10 | % | 0.27 | % | ||||||||||
| Portfolio turnover rate | 85 | %(C) | 68 | % | 42 | % | 59 | % | 45 | % | ||||||||||
| (A) | Represents the period from commencement of operations (October 1, 2009) through September 30, 2010. |
| (B) | Total returns shown exclude the effect of applicable sales loads. If these charges were included, the returns would be lower. |
| (C) | Portfolio turnover excludes the purchases and sales of the Touchstone Mid Cap Value Opportunities Fund (see Note 11). If these transactions were included, portfolio turnover would have been higher. |
| (D) | Less than $0.005 per share. |
See accompanying Notes to Financial Statements.
| 139 |
Financial Highlights (Continued)
| Touchstone Mid Cap Value Fund—Class Y |
| Selected Data for a Share Outstanding Throughout Each Period |
| Year Ended September 30, | ||||||||||||||||||||
| 2014 | 2013 | 2012 | 2011 | 2010(A) | ||||||||||||||||
| Net asset value at beginning of period | $ | 16.15 | $ | 13.03 | $ | 10.89 | $ | 11.79 | $ | 10.00 | ||||||||||
| Income (loss) from investment operations: | ||||||||||||||||||||
| Net investment income | 0.07 | 0.15 | 0.11 | 0.12 | 0.14 | |||||||||||||||
| Net realized and unrealized gains (losses) on investments | 1.88 | 3.26 | 2.81 | (0.72 | ) | 1.76 | ||||||||||||||
| Total from investment operations | 1.95 | 3.41 | 2.92 | (0.60 | ) | 1.90 | ||||||||||||||
| Distributions from: | ||||||||||||||||||||
| Net investment income | (0.09 | ) | (0.14 | ) | (0.12 | ) | (0.14 | ) | (0.11 | ) | ||||||||||
| Realized capital gains | (1.34 | ) | (0.15 | ) | (0.66 | ) | (0.16 | ) | — | |||||||||||
| Total distributions | (1.43 | ) | (0.29 | ) | (0.78 | ) | (0.30 | ) | (0.11 | ) | ||||||||||
| Net asset value at end of period | $ | 16.67 | $ | 16.15 | $ | 13.03 | $ | 10.89 | $ | 11.79 | ||||||||||
| Total return | 12.77 | % | 26.53 | % | 27.97 | % | (5.51 | )% | 19.07 | % | ||||||||||
| Ratios and supplemental data: | ||||||||||||||||||||
| Net assets at end of period (000’s) | $ | 213,404 | $ | 15,782 | $ | 13,785 | $ | 4,685 | $ | 589 | ||||||||||
| Ratio to average net assets: | ||||||||||||||||||||
| Net expenses | 1.04 | % | 1.04 | % | 1.04 | % | 1.04 | % | 1.04 | % | ||||||||||
| Gross expenses | 1.14 | % | 1.37 | % | 1.46 | % | 1.58 | % | 3.19 | % | ||||||||||
| Net investment income | 0.66 | % | 0.98 | % | 1.02 | % | 1.20 | % | 1.40 | % | ||||||||||
| Portfolio turnover rate | 85 | %(B) | 68 | % | 42 | % | 59 | % | 45 | % | ||||||||||
| Touchstone Mid Cap Value Fund—Institutional Class |
| Selected Data for a Share Outstanding Throughout Each Period |
| Year Ended September 30, | ||||||||||||||||||||
| 2014 | 2013 | 2012 | 2011 | 2010(A) | ||||||||||||||||
| Net asset value at beginning of period | $ | 16.20 | $ | 13.07 | $ | 10.92 | $ | 11.83 | $ | 10.00 | ||||||||||
| Income (loss) from investment operations: | ||||||||||||||||||||
| Net investment income | 0.13 | 0.16 | 0.13 | 0.16 | 0.10 | |||||||||||||||
| Net realized and unrealized gains (losses) on investments | 1.85 | 3.28 | 2.82 | (0.75 | ) | 1.82 | ||||||||||||||
| Total from investment operations | 1.98 | 3.44 | 2.95 | (0.59 | ) | 1.92 | ||||||||||||||
| Distributions from: | ||||||||||||||||||||
| Net investment income | (0.11 | ) | (0.16 | ) | (0.14 | ) | (0.16 | ) | (0.09 | ) | ||||||||||
| Realized capital gains | (1.34 | ) | (0.15 | ) | (0.66 | ) | (0.16 | ) | — | |||||||||||
| Total distributions | (1.45 | ) | (0.31 | ) | (0.80 | ) | (0.32 | ) | (0.09 | ) | ||||||||||
| Net asset value at end of period | $ | 16.73 | $ | 16.20 | $ | 13.07 | $ | 10.92 | $ | 11.83 | ||||||||||
| Total return | 12.90 | % | 26.71 | % | 28.17 | % | (5.41 | )% | 19.25 | % | ||||||||||
| Ratios and supplemental data: | ||||||||||||||||||||
| Net assets at end of period (000’s) | $ | 134,259 | $ | 144,965 | $ | 75,240 | $ | 39,808 | $ | 39,509 | ||||||||||
| Ratio to average net assets: | ||||||||||||||||||||
| Net expenses | 0.89 | % | 0.89 | % | 0.89 | % | 0.89 | % | 0.89 | % | ||||||||||
| Gross expenses | 1.04 | % | 1.09 | % | 1.12 | % | 1.15 | % | 1.93 | % | ||||||||||
| Net investment income | 0.81 | % | 1.13 | % | 1.17 | % | 1.21 | % | 1.66 | % | ||||||||||
| Portfolio turnover rate | 85 | %(B) | 68 | % | 42 | % | 59 | % | 45 | % | ||||||||||
| (A) | Represents the period from commencement of operations (October 1, 2009) through September 30, 2010. |
| (B) | Portfolio turnover excludes the purchases and sales of the Touchstone Mid Cap Value Opportunities Fund (see Note 11). If these transactions were included, portfolio turnover would have been higher. |
See accompanying Notes to Financial Statements.
| 140 |
Financial Highlights (Continued)
| Touchstone Premium Yield Equity Fund—Class A |
| Selected Data for a Share Outstanding Throughout Each Period |
| Year Ended September 30, | ||||||||||||||||||||
| 2014 | 2013 | 2012 | 2011 | 2010 | ||||||||||||||||
| Net asset value at beginning of period | $ | 8.92 | $ | 8.11 | $ | 6.76 | $ | 6.48 | $ | 5.93 | ||||||||||
| Income from investment operations: | ||||||||||||||||||||
| Net investment income | 0.40 | (A) | 0.24 | 0.24 | 0.21 | 0.21 | ||||||||||||||
| Net realized and unrealized gains on investments | 1.07 | 0.80 | 1.36 | 0.28 | 0.54 | |||||||||||||||
| Total from investment operations | 1.47 | 1.04 | 1.60 | 0.49 | 0.75 | |||||||||||||||
| Distributions from: | ||||||||||||||||||||
| Net investment income | (0.41 | ) | (0.23 | ) | (0.24 | ) | (0.21 | ) | (0.20 | ) | ||||||||||
| Return of capital | — | — | (0.01 | ) | — | — | ||||||||||||||
| Total distributions | (0.41 | ) | (0.23 | ) | (0.25 | ) | (0.21 | ) | (0.20 | ) | ||||||||||
| Net asset value at end of period | $ | 9.98 | $ | 8.92 | $ | 8.11 | $ | 6.76 | $ | 6.48 | ||||||||||
| Total return(B) | 16.79 | % | 12.97 | % | 23.98 | % | 7.43 | % | 12.82 | % | ||||||||||
| Ratios and supplemental data: | ||||||||||||||||||||
| Net assets at end of period (000’s) | $ | 45,124 | $ | 86,171 | $ | 68,780 | $ | 28,739 | $ | 22,441 | ||||||||||
| Ratio to average net assets: | ||||||||||||||||||||
| Net expenses | 1.20 | % | 1.20 | % | 1.20 | % | 1.20 | % | 1.20 | % | ||||||||||
| Gross expenses | 1.29 | % | 1.29 | % | 1.30 | % | 1.35 | % | 1.40 | % | ||||||||||
| Net investment income | 4.24 | %(A) | 2.74 | % | 3.26 | % | 3.02 | % | 3.30 | % | ||||||||||
| Portfolio turnover rate | 26 | % | 56 | % | 16 | % | 54 | % | 29 | % | ||||||||||
| Touchstone Premium Yield Equity Fund—Class C |
| Selected Data for a Share Outstanding Throughout Each Period |
| Year Ended September 30, | ||||||||||||||||||||
| 2014 | 2013 | 2012 | 2011 | 2010 | ||||||||||||||||
| Net asset value at beginning of period | $ | 8.90 | $ | 8.10 | $ | 6.76 | $ | 6.49 | $ | 5.93 | ||||||||||
| Income from investment operations: | ||||||||||||||||||||
| Net investment income | 0.33 | (A) | 0.16 | 0.18 | 0.16 | 0.16 | ||||||||||||||
| Net realized and unrealized gains on investments | 1.07 | 0.80 | 1.35 | 0.27 | 0.55 | |||||||||||||||
| Total from investment operations | 1.40 | 0.96 | 1.53 | 0.43 | 0.71 | |||||||||||||||
| Distributions from: | ||||||||||||||||||||
| Net investment income | (0.33 | ) | (0.16 | ) | (0.18 | ) | (0.16 | ) | (0.15 | ) | ||||||||||
| Return of capital | — | — | (0.01 | ) | — | — | ||||||||||||||
| Total distributions | (0.33 | ) | (0.16 | ) | (0.19 | ) | (0.16 | ) | (0.15 | ) | ||||||||||
| Net asset value at end of period | $ | 9.97 | $ | 8.90 | $ | 8.10 | $ | 6.76 | $ | 6.49 | ||||||||||
| Total return(B) | 15.99 | % | 12.03 | % | 22.93 | % | 6.60 | % | 12.11 | % | ||||||||||
| Ratios and supplemental data: | ||||||||||||||||||||
| Net assets at end of period (000’s) | $ | 31,190 | $ | 24,009 | $ | 15,680 | $ | 7,499 | $ | 6,870 | ||||||||||
| Ratio to average net assets: | ||||||||||||||||||||
| Net expenses | 1.95 | % | 1.95 | % | 1.95 | % | 1.95 | % | 1.95 | % | ||||||||||
| Gross expenses | 2.02 | % | 2.08 | % | 2.14 | % | 2.28 | % | 2.23 | % | ||||||||||
| Net investment income | 3.49 | %(A) | 1.99 | % | 2.51 | % | 2.27 | % | 2.60 | % | ||||||||||
| Portfolio turnover rate | 26 | % | 56 | % | 16 | % | 54 | % | 29 | % | ||||||||||
| (A) | Reflects the impact of a corporate action event that resulted in a one-time increase to net investment income. If the corporate action event had not occurred, the Class A and Class C net investment income per share and ratio of net investment income to average net assets would have been lower by $0.16 and 1.70%, respectively. |
| (B) | Total returns shown exclude the effect of applicable sales loads. If these charges were included, the returns would be lower. |
See accompanying Notes to Financial Statements.
| 141 |
Financial Highlights (Continued)
| Touchstone Premium Yield Equity Fund—Class Y |
| Selected Data for a Share Outstanding Throughout Each Period |
| Year Ended September 30, | ||||||||||||||||||||
| 2014 | 2013 | 2012 | 2011 | 2010 | ||||||||||||||||
| Net asset value at beginning of period | $ | 8.90 | $ | 8.10 | $ | 6.75 | $ | 6.47 | $ | 5.92 | ||||||||||
| Income from investment operations: | ||||||||||||||||||||
| Net investment income | 0.43 | (A) | 0.25 | 0.27 | 0.20 | 0.22 | ||||||||||||||
| Net realized and unrealized gains on investments | 1.07 | 0.80 | 1.35 | 0.30 | 0.54 | |||||||||||||||
| Total from investment operations | 1.50 | 1.05 | 1.62 | 0.50 | 0.76 | |||||||||||||||
| Distributions from: | ||||||||||||||||||||
| Net investment income | (0.43 | ) | (0.25 | ) | (0.26 | ) | (0.22 | ) | (0.21 | ) | ||||||||||
| Return of capital | — | — | (0.01 | ) | — | — | ||||||||||||||
| Total distributions | (0.43 | ) | (0.25 | ) | (0.27 | ) | (0.22 | ) | (0.21 | ) | ||||||||||
| Net asset value at end of period | $ | 9.97 | $ | 8.90 | $ | 8.10 | $ | 6.75 | $ | 6.47 | ||||||||||
| Total return | 17.13 | % | 13.14 | % | 24.31 | % | 7.67 | % | 13.14 | % | ||||||||||
| Ratios and supplemental data: | ||||||||||||||||||||
| Net assets at end of period (000’s) | $ | 109,201 | $ | 66,644 | $ | 33,185 | $ | 3,980 | $ | 11,540 | ||||||||||
| Ratio to average net assets: | ||||||||||||||||||||
| Net expenses | 0.95 | % | 0.95 | % | 0.95 | % | 0.95 | % | 0.95 | % | ||||||||||
| Gross expenses | 0.96 | % | 1.04 | % | 1.18 | % | 1.25 | % | 1.53 | % | ||||||||||
| Net investment income | 4.49 | %(A) | 2.99 | % | 3.51 | % | 3.16 | % | 3.77 | % | ||||||||||
| Portfolio turnover rate | 26 | % | 56 | % | 16 | % | 54 | % | 29 | % | ||||||||||
| (A) | Reflects the impact of a corporate action event that resulted in a one-time increase to net investment income. If the corporate action event had not occurred, the Class Y net investment income per share and ratio of net investment income to average net assets would have been lower by $0.16 and 1.70%, respectively. |
See accompanying Notes to Financial Statements.
| 142 |
Financial Highlights (Continued)
| Touchstone Sands Capital Select Growth Fund—Class A |
| Selected Data for a Share Outstanding |
| Period | ||||||||||||||||
| Ended | ||||||||||||||||
| Year Ended | September | |||||||||||||||
| September 30, | 30, | |||||||||||||||
| 2014 | 2013 | 2012 | 2011(A) | |||||||||||||
| Net asset value at beginning of period | $ | 16.08 | $ | 12.65 | $ | 9.39 | $ | 9.39 | ||||||||
| Income (loss) from investment operations: | ||||||||||||||||
| Net investment loss | (0.29 | ) | (0.05 | ) | (0.09 | )(B) | (0.03 | ) | ||||||||
| Net realized and unrealized gains on investments | 2.49 | 3.48 | 3.35 | 0.03 | ||||||||||||
| Total from investment operations | 2.20 | 3.43 | 3.26 | — | ||||||||||||
| Distributions from: | ||||||||||||||||
| Realized capital gains | (0.13 | ) | — | — | — | |||||||||||
| Net asset value at end of period | $ | 18.15 | $ | 16.08 | $ | 12.65 | $ | 9.39 | ||||||||
| Total return(C) | 13.73 | % | 27.11 | % | 34.72 | % | 0.00 | %(D) | ||||||||
| Ratios and supplemental data: | ||||||||||||||||
| Net assets at end of period (000’s) | $ | 289,506 | $ | 416,396 | $ | 186,384 | $ | 21,211 | ||||||||
| Ratio to average net assets: | ||||||||||||||||
| Net expenses | 1.31 | % | 1.28 | % | 1.37 | % | 1.45 | %(E) | ||||||||
| Gross expenses | 1.33 | % | 1.37 | % | 1.47 | % | 1.64 | %(E) | ||||||||
| Net investment loss | (0.91 | )% | (0.62 | )% | (0.74 | )% | (0.94 | )%(E) | ||||||||
| Portfolio turnover rate | 30 | % | 37 | % | 19 | % | 19 | %(D) | ||||||||
| Touchstone Sands Capital Select Growth Fund—Class C |
| Selected Data for a Share Outstanding |
| Period | ||||||||||||||||
| Ended | ||||||||||||||||
| Year Ended | September | |||||||||||||||
| September 30, | 30, | |||||||||||||||
| 2014 | 2013 | 2012 | 2011(A) | |||||||||||||
| Net asset value at beginning of period | $ | 15.74 | $ | 12.47 | $ | 9.33 | $ | 9.39 | ||||||||
| Income (loss) from investment operations: | ||||||||||||||||
| Net investment loss | (0.32 | ) | (0.13 | ) | (0.17 | )(B) | (0.06 | ) | ||||||||
| Net realized and unrealized gains on investments | 2.33 | 3.40 | 3.31 | — | (F) | |||||||||||
| Total from investment operations | 2.01 | 3.27 | 3.14 | (0.06 | ) | |||||||||||
| Distributions from: | ||||||||||||||||
| Realized capital gains | (0.13 | ) | — | — | — | |||||||||||
| Net asset value at end of period | $ | 17.62 | $ | 15.74 | $ | 12.47 | $ | 9.33 | ||||||||
| Total return(C) | 12.89 | % | 26.14 | % | 33.66 | % | (0.64 | )%(D) | ||||||||
| Ratios and supplemental data: | ||||||||||||||||
| Net assets at end of period (000’s) | $ | 203,865 | $ | 198,584 | $ | 88,931 | $ | 8,660 | ||||||||
| Ratio to average net assets: | ||||||||||||||||
| Net expenses | 2.06 | % | 2.03 | % | 2.12 | % | 2.20 | %(E) | ||||||||
| Gross expenses | 2.09 | % | 2.14 | % | 2.22 | % | 2.56 | %(E) | ||||||||
| Net investment loss | (1.65 | )% | (1.37 | )% | (1.49 | )% | (1.69 | )%(E) | ||||||||
| Portfolio turnover rate | 30 | % | 37 | % | 19 | % | 19 | %(D) | ||||||||
| (A) | Represents the period from commencement of operations (November 15, 2010) through September 30, 2011. |
| (B) | The net investment loss per share is based on average shares outstanding for the period. |
| (C) | Total returns shown exclude the effect of applicable sales loads. If these charges were included, the returns would be lower. |
| (D) | Not annualized. |
| (E) | Annualized. |
| (F) | Less than $0.005 per share. |
See accompanying Notes to Financial Statements.
| 143 |
Financial Highlights (Continued)
| Touchstone Sands Capital Select Growth Fund—Class Y |
| Selected Data for a Share Outstanding Throughout Each Period |
| Year Ended September 30, | ||||||||||||||||||||
| 2014 | 2013 | 2012 | 2011 | 2010 | ||||||||||||||||
| Net asset value at beginning of period | $ | 16.44 | $ | 12.90 | $ | 9.56 | $ | 8.83 | $ | 7.34 | ||||||||||
| Income (loss) from investment operations: | ||||||||||||||||||||
| Net investment loss | (0.10 | ) | (0.02 | ) | (0.06 | )(A) | (0.14 | ) | (0.07 | ) | ||||||||||
| Net realized and unrealized gains on investments | 2.40 | 3.56 | 3.40 | 0.87 | 1.56 | |||||||||||||||
| Total from investment operations | 2.30 | 3.54 | 3.34 | 0.73 | 1.49 | |||||||||||||||
| Distributions from: | ||||||||||||||||||||
| Realized capital gains | (0.13 | ) | — | — | — | — | ||||||||||||||
| Net asset value at end of period | $ | 18.61 | $ | 16.44 | $ | 12.90 | $ | 9.56 | $ | 8.83 | ||||||||||
| Total return | 14.04 | % | 27.44 | % | 34.94 | % | 8.14 | % | 20.44 | % | ||||||||||
| Ratios and supplemental data: | ||||||||||||||||||||
| Net assets at end of period (000’s) | $ | 3,473,661 | $ | 2,684,731 | $ | 1,215,124 | $ | 392,464 | $ | 120,333 | ||||||||||
| Ratio to average net assets: | ||||||||||||||||||||
| Net expenses | 1.06 | % | 1.03 | % | 1.11 | % | 1.20 | % | 1.22 | % | ||||||||||
| Gross expenses | 1.03 | % | 1.06 | % | 1.18 | % | 1.23 | % | 1.28 | % | ||||||||||
| Net investment loss | (0.66 | )% | (0.37 | )% | (0.49 | )% | (0.68 | )% | (0.52 | )% | ||||||||||
| Portfolio turnover rate | 30 | % | 37 | % | 19 | % | 19 | % | 27 | % | ||||||||||
| Touchstone Sands Capital Select Growth Fund—Class Z |
| Selected Data for a Share Outstanding Throughout Each Period |
| Year Ended September 30, | ||||||||||||||||||||
| 2014 | 2013 | 2012 | 2011 | 2010 | ||||||||||||||||
| Net asset value at beginning of period | $ | 16.08 | $ | 12.65 | $ | 9.39 | $ | 8.70 | $ | 7.24 | ||||||||||
| Income (loss) from investment operations: | ||||||||||||||||||||
| Net investment loss | (0.17 | ) | (0.10 | ) | (0.08 | )(A) | (0.07 | ) | (0.04 | ) | ||||||||||
| Net realized and unrealized gains on investments | 2.37 | 3.53 | 3.34 | 0.76 | 1.50 | |||||||||||||||
| Total from investment operations | 2.20 | 3.43 | 3.26 | 0.69 | 1.46 | |||||||||||||||
| Distributions from: | ||||||||||||||||||||
| Realized capital gains | (0.13 | ) | — | — | — | — | ||||||||||||||
| Net asset value at end of period | $ | 18.15 | $ | 16.08 | $ | 12.65 | $ | 9.39 | $ | 8.70 | ||||||||||
| Total return | 13.73 | % | 27.11 | % | 34.72 | % | 7.93 | % | 20.17 | % | ||||||||||
| Ratios and supplemental data: | ||||||||||||||||||||
| Net assets at end of period (000’s) | $ | 2,302,038 | $ | 2,140,884 | $ | 1,836,957 | $ | 911,849 | $ | 540,329 | ||||||||||
| Ratio to average net assets: | ||||||||||||||||||||
| Net expenses | 1.31 | % | 1.28 | % | 1.32 | % | 1.42 | % | 1.47 | % | ||||||||||
| Gross expenses | 1.35 | % | 1.37 | % | 1.39 | % | 1.52 | % | 1.53 | % | ||||||||||
| Net investment loss | (0.90 | )% | (0.62 | )% | (0.70 | )% | (0.93 | )% | (0.79 | )% | ||||||||||
| Portfolio turnover rate | 30 | % | 37 | % | 19 | % | 19 | % | 27 | % | ||||||||||
| (A) | The net investment loss per share is based on average shares outstanding for the period. |
See accompanying Notes to Financial Statements.
| 144 |
Financial Highlights (Continued)
| Touchstone Small Cap Core Fund—Class A |
| Selected Data for a Share Outstanding Throughout Each Period |
| Year Ended September 30, | ||||||||||||||||||||
| 2014 | 2013 | 2012 | 2011 | 2010(A) | ||||||||||||||||
| Net asset value at beginning of period | $ | 19.44 | $ | 16.02 | $ | 11.94 | $ | 11.62 | $ | 10.00 | ||||||||||
| Income (loss) from investment operations: | ||||||||||||||||||||
| Net investment income (loss) | (0.09 | )(B) | 0.44 | 0.05 | (0.02 | ) | 0.02 | |||||||||||||
| Net realized and unrealized gains on investments | 1.80 | 3.28 | 4.20 | 0.35 | 1.60 | |||||||||||||||
| Total from investment operations | 1.71 | 3.72 | 4.25 | 0.33 | 1.62 | |||||||||||||||
| Distributions from: | ||||||||||||||||||||
| Net investment income | (0.31 | ) | (0.18 | ) | (— | )(C) | (0.01 | ) | — | |||||||||||
| Realized capital gains | (0.29 | ) | (0.12 | ) | (0.17 | ) | (— | )(C) | — | |||||||||||
| Total distributions | (0.60 | ) | (0.30 | ) | (0.17 | ) | (0.01 | ) | — | |||||||||||
| Net asset value at end of period | $ | 20.55 | $ | 19.44 | $ | 16.02 | $ | 11.94 | $ | 11.62 | ||||||||||
| Total return(D) | 8.80 | % | 23.60 | % | 35.86 | % | 2.82 | % | 16.20 | % | ||||||||||
| Ratios and supplemental data: | ||||||||||||||||||||
| Net assets at end of period (000’s) | $ | 60,246 | $ | 122,394 | $ | 84,539 | $ | 43,074 | $ | 50,110 | ||||||||||
| Ratio to average net assets: | ||||||||||||||||||||
| Net expenses | 1.36 | % | 1.34 | % | 1.34 | % | 1.34 | % | 1.34 | % | ||||||||||
| Gross expenses | 1.43 | % | 1.53 | % | 1.58 | % | 1.79 | % | 1.55 | % | ||||||||||
| Net investment income (loss) | (0.45 | )% | 2.47 | % | 0.37 | % | (0.10 | )% | 0.32 | % | ||||||||||
| Portfolio turnover rate | 17 | % | 15 | % | 11 | % | 37 | % | 29 | % | ||||||||||
| Touchstone Small Cap Core Fund—Class C |
| Selected Data for a Share Outstanding Throughout Each Period |
| Year Ended September 30, | ||||||||||||||||||||
| 2014 | 2013 | 2012 | 2011 | 2010(A) | ||||||||||||||||
| Net asset value at beginning of period | $ | 19.01 | $ | 15.69 | $ | 11.79 | $ | 11.55 | $ | 10.00 | ||||||||||
| Income (loss) from investment operations: | ||||||||||||||||||||
| Net investment income (loss) | (0.24 | )(B) | 0.30 | (0.01 | ) | (0.08 | ) | (0.02 | ) | |||||||||||
| Net realized and unrealized gains on investments | 1.75 | 3.22 | 4.08 | 0.32 | 1.57 | |||||||||||||||
| Total from investment operations | 1.51 | 3.52 | 4.07 | 0.24 | 1.55 | |||||||||||||||
| Distributions from: | ||||||||||||||||||||
| Net investment income | (0.16 | ) | (0.08 | ) | (— | )(C) | (— | )(C) | — | |||||||||||
| Realized capital gains | (0.29 | ) | (0.12 | ) | (0.17 | ) | (— | )(C) | — | |||||||||||
| Total distributions | (0.45 | ) | (0.20 | ) | (0.17 | ) | (— | )(C) | — | |||||||||||
| Net asset value at end of period | $ | 20.07 | $ | 19.01 | $ | 15.69 | $ | 11.79 | $ | 11.55 | ||||||||||
| Total return(D) | 7.96 | % | 22.69 | % | 34.78 | % | 2.08 | % | 15.50 | % | ||||||||||
| Ratios and supplemental data: | ||||||||||||||||||||
| Net assets at end of period (000’s) | $ | 27,104 | $ | 28,685 | $ | 24,278 | $ | 11,739 | $ | 5,245 | ||||||||||
| Ratio to average net assets: | ||||||||||||||||||||
| Net expenses | 2.12 | % | 2.09 | % | 2.09 | % | 2.09 | % | 2.09 | % | ||||||||||
| Gross expenses | 2.17 | % | 2.24 | % | 2.30 | % | 2.51 | % | 2.57 | % | ||||||||||
| Net investment income (loss) | (1.20 | )% | 1.72 | % | (0.38 | )% | (0.80 | )% | (0.43 | )% | ||||||||||
| Portfolio turnover rate | 17 | % | 15 | % | 11 | % | 37 | % | 29 | % | ||||||||||
| (A) | Represents the period from commencement of operations (October 1, 2009) through September 30, 2010. |
| (B) | The net investment loss per share is based on average shares outstanding for the period. |
| (C) | Less than $0.005 per share. |
| (D) | Total returns shown exclude the effect of applicable sales loads. If these charges were included, the returns would be lower. |
See accompanying Notes to Financial Statements.
| 145 |
Financial Highlights (Continued)
| Touchstone Small Cap Core Fund—Class Y |
| Selected Data for a Share Outstanding Throughout Each Period |
| Year Ended September 30, | ||||||||||||||||||||
| 2014 | 2013 | 2012 | 2011 | 2010(A) | ||||||||||||||||
| Net asset value at beginning of period | $ | 19.59 | $ | 16.13 | $ | 12.00 | $ | 11.67 | $ | 10.00 | ||||||||||
| Income (loss) from investment operations: | ||||||||||||||||||||
| Net investment income (loss) | (0.03 | )(B) | 0.46 | 0.07 | 0.02 | 0.03 | ||||||||||||||
| Net realized and unrealized gains on investments | 1.81 | 3.34 | 4.24 | 0.34 | 1.64 | |||||||||||||||
| Total from investment operations | 1.78 | 3.80 | 4.31 | 0.36 | 1.67 | |||||||||||||||
| Distributions from: | ||||||||||||||||||||
| Net investment income (loss) | (0.36 | ) | (0.22 | ) | (0.01 | ) | (0.03 | ) | — | |||||||||||
| Realized capital gains | (0.29 | ) | (0.12 | ) | (0.17 | ) | (— | )(C) | — | |||||||||||
| Total distributions | (0.65 | ) | (0.34 | ) | (0.18 | ) | (0.03 | ) | — | |||||||||||
| Net asset value at end of period | $ | 20.72 | $ | 19.59 | $ | 16.13 | $ | 12.00 | $ | 11.67 | ||||||||||
| Total return | 9.12 | % | 24.01 | % | 36.23 | % | 3.05 | % | 16.70 | % | ||||||||||
| Ratios and supplemental data: | ||||||||||||||||||||
| Net assets at end of period (000’s) | $ | 309,367 | $ | 258,024 | $ | 168,987 | $ | 58,164 | $ | 33,536 | ||||||||||
| Ratio to average net assets: | ||||||||||||||||||||
| Net expenses | 1.06 | % | 1.03 | % | 1.04 | % | 1.09 | % | 1.09 | % | ||||||||||
| Gross expenses | 1.08 | % | 1.14 | % | 1.17 | % | 1.21 | % | 1.31 | % | ||||||||||
| Net investment income (loss) | (0.15 | )% | 2.78 | % | 0.66 | % | 0.21 | % | 0.61 | % | ||||||||||
| Portfolio turnover rate | 17 | % | 15 | % | 11 | % | 37 | % | 29 | % | ||||||||||
| Touchstone Small Cap Core Fund—Institutional Class |
| Selected Data for a Share Outstanding Throughout Each Period |
| Year Ended September 30, | ||||||||||||||||||||
| 2014 | 2013 | 2012 | 2011 | 2010(A) | ||||||||||||||||
| Net asset value at beginning of period | $ | 19.57 | $ | 16.11 | $ | 11.99 | $ | 11.65 | $ | 10.00 | ||||||||||
| Income from investment operations: | ||||||||||||||||||||
| Net investment income (loss) | (0.02 | )(B) | 0.49 | 0.06 | 0.03 | 0.06 | ||||||||||||||
| Net realized and unrealized gains on investments | 1.81 | 3.32 | 4.26 | 0.35 | 1.61 | |||||||||||||||
| Total from investment operations | 1.79 | 3.81 | 4.32 | 0.38 | 1.67 | |||||||||||||||
| Distributions from: | ||||||||||||||||||||
| Net investment income (loss) | (0.38 | ) | (0.23 | ) | (0.03 | ) | (0.04 | ) | (0.02 | ) | ||||||||||
| Realized capital gains | (0.29 | ) | (0.12 | ) | (0.17 | ) | (— | )(C) | — | |||||||||||
| Total distributions | (0.67 | ) | (0.35 | ) | (0.20 | ) | (0.04 | ) | (0.02 | ) | ||||||||||
| Net asset value at end of period | $ | 20.69 | $ | 19.57 | $ | 16.11 | $ | 11.99 | $ | 11.65 | ||||||||||
| Total return | 9.17 | % | 24.13 | % | 36.32 | % | 3.24 | % | 16.74 | % | ||||||||||
| Ratios and supplemental data: | ||||||||||||||||||||
| Net assets at end of period (000’s) | $ | 393,287 | $ | 395,770 | $ | 247,876 | $ | 43,035 | $ | 10,386 | ||||||||||
| Ratio to average net assets: | ||||||||||||||||||||
| Net expenses | 1.01 | % | 0.94 | % | 0.94 | % | 0.94 | % | 0.94 | % | ||||||||||
| Gross expenses | 1.04 | % | 1.07 | % | 1.09 | % | 1.16 | % | 1.32 | % | ||||||||||
| Net investment income (loss) | (0.10 | )% | 2.87 | % | 0.77 | % | 0.36 | % | 0.66 | % | ||||||||||
| Portfolio turnover rate | 17 | % | 15 | % | 11 | % | 37 | % | 29 | % | ||||||||||
| (A) | Represents the period from commencement of operations (October 1, 2009) through September 30, 2010. |
| (B) | The net investment loss per share is based on average shares outstanding for the period. |
| (C) | Less than $0.005 per share. |
See accompanying Notes to Financial Statements.
| 146 |
Financial Highlights (Continued)
| Touchstone Small Cap Value Fund—Class A |
| Selected Data for a Share Outstanding Throughout Each Period |
| Period | ||||||||||||||||
| Ended | ||||||||||||||||
| September | ||||||||||||||||
| Year Ended September 30, | 30, | |||||||||||||||
| 2014 | 2013 | 2012 | 2011(A)(B) | |||||||||||||
| Net asset value at beginning of period | $ | 22.79 | $ | 18.33 | $ | 13.85 | $ | 17.36 | ||||||||
| Income (loss) from investment operations: | ||||||||||||||||
| Net investment income | 0.36 | 0.41 | 0.21 | (C) | 0.22 | |||||||||||
| Net realized and unrealized gains (losses) on investments | 0.39 | 4.45 | 4.60 | (3.57 | ) | |||||||||||
| Total from investment operations | 0.75 | 4.86 | 4.81 | (3.35 | ) | |||||||||||
| Distributions from: | ||||||||||||||||
| Net investment income | (0.31 | ) | (0.40 | ) | (0.33 | ) | (0.16 | ) | ||||||||
| Net asset value at end of period | $ | 23.23 | $ | 22.79 | $ | 18.33 | $ | 13.85 | ||||||||
| Total return(D) | 3.19 | % | 26.82 | % | 34.87 | % | (19.37 | )%(E) | ||||||||
| Ratios and supplemental data: | ||||||||||||||||
| Net assets at end of period (000’s) | $ | 31,773 | $ | 34,826 | $ | 32,115 | $ | 37,385 | ||||||||
| Ratio to average net assets: | ||||||||||||||||
| Net expenses | 1.43 | % | 1.43 | % | 1.43 | % | 1.43 | %(F) | ||||||||
| Gross expenses | 1.67 | % | 1.78 | % | 1.77 | % | 1.72 | %(F) | ||||||||
| Net investment income | 1.44 | % | 1.98 | % | 1.26 | % | 1.97 | %(F) | ||||||||
| Portfolio turnover rate | 100 | %(G)(H) | 98 | % | 109 | % | 206 | %(E) | ||||||||
| Touchstone Small Cap Value Fund—Class C |
| Selected Data for a Share Outstanding Throughout Each Period |
| Period | ||||||||||||||||
| Ended | ||||||||||||||||
| September | ||||||||||||||||
| Year Ended September 30, | 30, | |||||||||||||||
| 2014 | 2013 | 2012 | 2011(A) | |||||||||||||
| Net asset value at beginning of period | $ | 22.61 | $ | 18.23 | $ | 13.82 | $ | 17.36 | ||||||||
| Income (loss) from investment operations: | ||||||||||||||||
| Net investment income | 0.16 | 0.29 | 0.09 | (C) | 0.09 | |||||||||||
| Net realized and unrealized gains (losses) on investments | 0.40 | 4.39 | 4.58 | (3.50 | ) | |||||||||||
| Total from investment operations | 0.56 | 4.68 | 4.67 | (3.41 | ) | |||||||||||
| Distributions from: | ||||||||||||||||
| Net investment income | (0.17 | ) | (0.30 | ) | (0.26 | ) | (0.13 | ) | ||||||||
| Net asset value at end of period | $ | 23.00 | $ | 22.61 | $ | 18.23 | $ | 13.82 | ||||||||
| Total return(D) | 2.46 | % | 25.90 | % | 33.95 | % | (19.77 | )%(E) | ||||||||
| Ratios and supplemental data: | ||||||||||||||||
| Net assets at end of period (000’s) | $ | 2,169 | $ | 841 | $ | 104 | $ | 2 | ||||||||
| Ratio to average net assets: | ||||||||||||||||
| Net expenses | 2.18 | % | 2.18 | % | 2.18 | % | 2.18 | %(F) | ||||||||
| Gross expenses | 3.25 | % | 5.19 | % | 28.35 | % | 342.41 | %(F) | ||||||||
| Net investment income | 0.69 | % | 1.23 | % | 0.51 | % | 0.95 | %(F) | ||||||||
| Portfolio turnover rate | 100 | %(G)(H) | 98 | % | 109 | % | 206 | %(E) | ||||||||
| (A) | Represents the period from commencement of operations (March 1, 2011) through September 30, 2011. |
| (B) | Effective June 10, 2011, Class Z shares converted to Class A shares. |
| (C) | The net investment income per share is based on average shares outstanding for the period. |
| (D) | Total returns shown exclude the effect of applicable sales loads. If these charges were included, the returns would be lower. |
| (E) | Not annualized. |
| (F) | Annualized. |
| (G) | Portfolio turnover excludes the purchases and sales of the Touchstone Small Company Value Fund (see Note 11). If these transactions were included, portfolio turnover would have been higher. |
| (H) | Portfolio turnover rate excludes securities received from a subscription-in-kind. |
See accompanying Notes to Financial Statements.
| 147 |
Financial Highlights (Continued)
| Touchstone Small Cap Value Fund—Class Y |
| Selected Data for a Share Outstanding Throughout Each Period |
| Period | ||||||||||||||||
| Ended | ||||||||||||||||
| September | ||||||||||||||||
| Year Ended September 30, | 30, | |||||||||||||||
| 2014 | 2013 | 2012 | 2011(A) | |||||||||||||
| Net asset value at beginning of period | $ | 22.82 | $ | 18.36 | $ | 13.89 | $ | 17.36 | ||||||||
| Income (loss) from investment operations: | ||||||||||||||||
| Net investment income | 0.35 | 0.48 | 0.26 | (B) | 0.71 | |||||||||||
| Net realized and unrealized gains (losses) on investments | 0.46 | 4.44 | 4.59 | (4.00 | ) | |||||||||||
| Total from investment operations | 0.81 | 4.92 | 4.85 | (3.29 | ) | |||||||||||
| Distributions from: | ||||||||||||||||
| Net investment income | (0.38 | ) | (0.46 | ) | (0.38 | ) | (0.18 | ) | ||||||||
| Net asset value at end of period | $ | 23.25 | $ | 22.82 | $ | 18.36 | $ | 13.89 | ||||||||
| Total return | 3.47 | % | 27.11 | % | 35.19 | % | (19.10 | )%(C) | ||||||||
| Ratios and supplemental data: | ||||||||||||||||
| Net assets at end of period (000’s) | $ | 9,097 | $ | 769 | $ | 222 | $ | 2 | ||||||||
| Ratio to average net assets: | ||||||||||||||||
| Net expenses | 1.18 | % | 1.18 | % | 1.18 | % | 1.18 | %(D) | ||||||||
| Gross expenses | 1.65 | % | 3.45 | % | 22.47 | % | 70.29 | %(D) | ||||||||
| Net investment income | 1.70 | % | 2.23 | % | 1.51 | % | 2.05 | %(D) | ||||||||
| Portfolio turnover rate | 100 | %(E)(F) | 98 | % | 109 | % | 206 | %(C) | ||||||||
| Touchstone Small Cap Value Fund—Institutional Class |
| Selected Data for a Share Outstanding Throughout Each Period |
| Period | ||||||||||||||||
| Ended | ||||||||||||||||
| September | ||||||||||||||||
| Year Ended September 30, | 30, | |||||||||||||||
| 2014 | 2013 | 2012 | 2011(A) | |||||||||||||
| Net asset value at beginning of period | $ | 22.81 | $ | 18.35 | $ | 13.86 | $ | 17.36 | ||||||||
| Income (loss) from investment operations: | ||||||||||||||||
| Net investment income | 0.40 | 0.48 | 0.29 | (B) | 0.20 | |||||||||||
| Net realized and unrealized gains (losses) on investments | 0.44 | 4.47 | 4.60 | (3.51 | ) | |||||||||||
| Total from investment operations | 0.84 | 4.95 | 4.89 | (3.31 | ) | |||||||||||
| Distributions from: | ||||||||||||||||
| Net investment income | (0.41 | ) | (0.49 | ) | (0.40 | ) | (0.19 | ) | ||||||||
| Net asset value at end of period | $ | 23.24 | $ | 22.81 | $ | 18.35 | $ | 13.86 | ||||||||
| Total return | 3.59 | % | 27.30 | % | 35.56 | % | (19.23 | )%(C) | ||||||||
| Ratios and supplemental data: | ||||||||||||||||
| Net assets at end of period (000’s) | $ | 29,831 | $ | 2,665 | $ | 1,160 | $ | 741 | ||||||||
| Ratio to average net assets: | ||||||||||||||||
| Net expenses | 1.03 | % | 1.03 | % | 1.03 | % | 1.03 | %(D) | ||||||||
| Gross expenses | 1.30 | % | 1.83 | % | 1.87 | % | 3.59 | %(D) | ||||||||
| Net investment income | 1.84 | % | 2.38 | % | 1.66 | % | 2.12 | %(D) | ||||||||
| Portfolio turnover rate | 100 | %(E)(F) | 98 | % | 109 | % | 206 | %(C) | ||||||||
| (A) | Represents the period from commencement of operations (March 1, 2011) through September 30, 2011. |
| (B) | The net investment income per share is based on average shares outstanding for the period. |
| (C) | Not annualized. |
| (D) | Annualized. |
| (E) | Portfolio turnover excludes the purchases and sales of the Touchstone Small Company Value Fund (see Note 11). If these transactions were included, portfolio turnover would have been higher. |
| (F) | Portfolio turnover rate excludes securities received from a subscription-in-kind. |
See accompanying Notes to Financial Statements.
| 148 |
Financial Highlights (Continued)
| Touchstone Total Return Bond Fund—Class A† |
| Selected Data for a Share Outstanding Throughout Each Period†† |
| Year Ended September 30, | Period Ended September 30, | Period Ended March 31, | ||||||||||||||||||
| 2014 | 2013 | 2012 | 2011(A) | 2011(B) | ||||||||||||||||
| Net asset value at beginning of period | $ | 10.07 | $ | 10.50 | $ | 10.13 | $ | 9.90 | $ | 10.15 | ||||||||||
| Income (loss) from investment operations: | ||||||||||||||||||||
| Net investment income | 0.23 | 0.21 | 0.23 | 0.24 | 0.28 | |||||||||||||||
| Net realized and unrealized gains (losses) on investments | 0.22 | (0.36 | ) | 0.41 | 0.24 | (0.14 | )(C) | |||||||||||||
| Total from investment operations | 0.45 | (0.15 | ) | 0.64 | 0.48 | 0.14 | ||||||||||||||
| Distributions from: | ||||||||||||||||||||
| Net investment income | (0.29 | ) | (0.27 | ) | (0.27 | ) | (0.25 | ) | (0.39 | ) | ||||||||||
| Realized capital gains | — | (0.01 | ) | — | — | — | ||||||||||||||
| Total distributions | (0.29 | ) | (0.28 | ) | (0.27 | ) | (0.25 | ) | (0.39 | ) | ||||||||||
| Net asset value at end of period | $ | 10.23 | $ | 10.07 | $ | 10.50 | $ | 10.13 | $ | 9.90 | ||||||||||
| Total return(D) | 4.53 | % | (1.48 | )% | 6.42 | % | 5.02 | %(E) | 1.31 | %(E)(F) | ||||||||||
| Ratios and supplemental data: | ||||||||||||||||||||
| Net assets at end of period (000’s) | $ | 5,144 | $ | 12,167 | $ | 10,210 | $ | 4,737 | $ | 7 | ||||||||||
| Ratio to average net assets: | ||||||||||||||||||||
Net expenses | 0.90 | % | 0.90 | % | 0.90 | % | 0.90 | %(G) | 0.65 | %(G) | ||||||||||
| Gross expenses | 1.25 | % | 1.10 | % | 1.22 | % | 1.69 | %(G) | 1.75 | %(G) | ||||||||||
| Net investment income | 2.32 | % | 2.07 | % | 2.26 | % | 4.40 | %(G) | 4.16 | %(G) | ||||||||||
| Portfolio turnover rate | 5 | % | 35 | % | 79 | %(H) | 7 | %(E) | 27 | %(E) | ||||||||||
| † | Touchstone Total Return Bond Fund acquired all of the assets and liabilities of EARNEST Partners Fixed Income Trust (“Predecessor Fund”) in a reorganization on August 1, 2011. The Predecessor Fund’s performance and financial history have been adopted by Touchstone Total Return Bond and will be used going forward. As a result, the information prior to August 1, 2011 reflects that of the Predecessor Fund. |
| †† | Per share data prior to August 1, 2011, reflects a 1.01491:1 stock split. All per share amounts prior to that date have been adjusted to reflect the stock split. |
| (A) | Effective August 1, 2011, the Fund changed its fiscal year end from March 31 to September 30 and Investor Class shares were renamed Class A shares. |
| (B) | Represents the period from commencement of operations (August 16, 2010) through March 31, 2011. |
| (C) | This amount per share is a loss for the Class A shares because of the short time period since the Commencement of Operations on August 16, 2010 relative to the full fiscal year in which the Class Y shares were in operation. The loss during this period is offset by the gain in the Class Y shares during the full fiscal year to create a gain in the Net Realized and Unrealized Gain on Investments in the other classes. |
| (D) | Total returns shown exclude the effect of applicable sales loads. If these charges were included, the returns would be lower. |
| (E) | Not annualized. |
| (F) | Includes adjustments in accordance with U.S. generally accepted accounting principles and, consequently, the net asset value for financial reporting purposes and the returns based upon those net asset values may differ from the net asset values and returns for shareholder transactions. |
| (G) | Annualized. |
| (H) | Portfolio turnover excludes the purchases and sales of the Old Mutual Barrow Hanley Core Bond Fund acquired on April 16, 2012. If these transactions were included, portfolio turnover would have been higher. |
See accompanying Notes to Financial Statements.
| 149 |
Financial Highlights (Continued)
| Touchstone Total Return Bond Fund—Class C |
| Selected Data for a Share Outstanding Throughout Each Period |
| Period | ||||||||||||||||
| Ended | ||||||||||||||||
| Year Ended | September | |||||||||||||||
| September 30, | 30, | |||||||||||||||
| 2014 | 2013 | 2012 | 2011(A) | |||||||||||||
| Net asset value at beginning of period | $ | 10.05 | $ | 10.49 | $ | 10.12 | $ | 10.04 | ||||||||
| Income (loss) from investment operations: | ||||||||||||||||
| Net investment income | 0.15 | 0.11 | 0.14 | 0.06 | ||||||||||||
| Net realized and unrealized gains (losses) on investments | 0.22 | (0.35 | ) | 0.42 | 0.09 | |||||||||||
| Total from investment operations | 0.37 | (0.24 | ) | 0.56 | 0.15 | |||||||||||
| Distributions from: | ||||||||||||||||
| Net investment income | (0.21 | ) | (0.19 | ) | (0.19 | ) | (0.07 | ) | ||||||||
| Realized capital gains | — | (0.01 | ) | — | — | |||||||||||
| Total distributions | (0.21 | ) | (0.20 | ) | (0.19 | ) | (0.07 | ) | ||||||||
| Net asset value at end of period | $ | 10.21 | $ | 10.05 | $ | 10.49 | $ | 10.12 | ||||||||
| Total return(B) | 3.75 | % | (2.33 | )% | 5.63 | % | 1.51 | %(C) | ||||||||
| Ratios and supplemental data: | ||||||||||||||||
| Net assets at end of period (000��s) | $ | 1,634 | $ | 2,455 | $ | 3,257 | $ | 2,587 | ||||||||
| Ratio to average net assets: | ||||||||||||||||
| Net expenses | 1.65 | % | 1.65 | % | 1.65 | % | 1.65 | %(D) | ||||||||
| Gross expenses | 2.47 | % | 2.10 | % | 2.03 | % | 2.55 | %(D) | ||||||||
| Net investment income | 1.57 | % | 1.32 | % | 1.51 | % | 3.75 | %(D) | ||||||||
| Portfolio turnover rate | 5 | % | 35 | % | 79 | %(E) | 7 | %(C) | ||||||||
| (A) | Represents the period from commencement of operations (August 1, 2011) through September 30, 2011. |
| (B) | Total returns shown exclude the effect of applicable sales loads. If these charges were included, the returns would be lower. |
| (C) | Not annualized. |
| (D) | Annualized. |
| (E) | Portfolio turnover excludes the purchases and sales of the Old Mutual Barrow Hanley Core Bond Fund acquired on April 16, 2012. If these transactions were included, portfolio turnover would have been higher. |
See accompanying Notes to Financial Statements.
| 150 |
Financial Highlights (Continued)
| Touchstone Total Return Bond Fund—Class Y† |
| Selected Data for a Share Outstanding Throughout Each Period†† |
| Period | ||||||||||||||||||||||||
| Ended | ||||||||||||||||||||||||
| Year Ended | September | Year Ended | ||||||||||||||||||||||
| September 30, | 30, | March 31, | ||||||||||||||||||||||
| 2014 | 2013 | 2012 | 2011(A) | 2011 | 2010 | |||||||||||||||||||
| Net asset value at beginning of period | $ | 10.08 | $ | 10.52 | $ | 10.15 | $ | 9.86 | $ | 9.66 | $ | 8.48 | ||||||||||||
| Income (loss) from investment operations: | ||||||||||||||||||||||||
| Net investment income | 0.26 | 0.23 | 0.25 | 0.24 | 0.45 | 0.48 | ||||||||||||||||||
| Net realized and unrealized gains (losses) on investments | 0.22 | (0.36 | ) | 0.42 | 0.30 | 0.21 | 1.21 | |||||||||||||||||
| Total from investment operations | 0.48 | (0.13 | ) | 0.67 | 0.54 | 0.66 | 1.69 | |||||||||||||||||
| Distributions from: | ||||||||||||||||||||||||
| Net investment income | (0.32 | ) | (0.30 | ) | (0.30 | ) | (0.25 | ) | (0.46 | ) | (0.51 | ) | ||||||||||||
| Realized capital gains | — | (0.01 | ) | — | — | — | — | |||||||||||||||||
| Total distributions | (0.32 | ) | (0.31 | ) | (0.30 | ) | (0.25 | ) | (0.46 | ) | (0.51 | ) | ||||||||||||
| Net asset value at end of period | $ | 10.24 | $ | 10.08 | $ | 10.52 | $ | 10.15 | $ | 9.86 | $ | 9.66 | ||||||||||||
| Total return | 4.84 | % | (1.32 | )% | 6.72 | % | 5.29 | %(B) | 6.97 | %(C) | 20.28 | %(C) | ||||||||||||
| Ratios and supplemental data: | ||||||||||||||||||||||||
| Net assets at end of period (000’s) | $ | 19,397 | $ | 19,635 | $ | 29,716 | $ | 17,810 | $ | 16,512 | $ | 16,877 | ||||||||||||
| Ratio to average net assets: | ||||||||||||||||||||||||
| Net expenses | 0.61 | % | 0.62 | % | 0.58 | % | 0.48 | %(D) | 0.40 | % | 0.40 | % | ||||||||||||
| Gross expenses | 0.68 | % | 0.71 | % | 0.70 | % | 1.13 | %(D) | 1.62 | % | 1.56 | % | ||||||||||||
| Net investment income | 2.61 | % | 2.34 | % | 2.59 | % | 4.35 | %(D) | 4.46 | % | 5.10 | % | ||||||||||||
| Portfolio turnover rate | 5 | % | 35 | % | 79 | %(E) | 7 | %(B) | 27 | % | 29 | % | ||||||||||||
| † | Touchstone Total Return Bond Fund acquired all of the assets and liabilities of EARNEST Partners Fixed Income Trust (“Predecessor Fund”) in a reorganization on August 1, 2011. The Predecessor Fund’s performance and financial history have been adopted by Touchstone Total Return Bond and will be used going forward. As a result, the information prior to August 1, 2011 reflects that of the Predecessor Fund. |
| †† | Per share data prior to August 1, 2011, reflects a 0.87567:1 stock split. All per share amounts prior to that date have been adjusted to reflect the stock split. |
| (A) | Effective August 1, 2011, the Fund changed its fiscal year end from March 31 to September 30 and Institutional Class shares were renamed Class Y shares. |
| (B) | Not annualized. |
| (C) | Includes adjustments in accordance with U.S. generally accepted accounting principles and, consequently, the net asset value for financial reporting purposes and the returns based upon those net asset values may differ from the net asset values and returns for shareholder transactions. |
| (D) | Annualized. |
| (E) | Portfolio turnover excludes the purchases and sales of the Old Mutual Barrow Hanley Core Bond Fund acquired on April 16, 2012. If these transactions were included, portfolio turnover would have been higher. |
See accompanying Notes to Financial Statements.
| 151 |
Financial Highlights (Continued)
| Touchstone Total Return Bond Fund—Institutional Class |
| Selected Data for a Share Outstanding Throughout Each Period |
| Period | ||||||||||||||||
| Ended | ||||||||||||||||
| Year Ended | September | |||||||||||||||
| September 30, | 30, | |||||||||||||||
| 2014 | 2013 | 2012 | 2011(A) | |||||||||||||
| Net asset value at beginning of period | $ | 10.08 | $ | 10.51 | $ | 10.14 | $ | 10.06 | ||||||||
| Income from investment operations: | ||||||||||||||||
| Net investment income | 0.27 | 0.25 | 0.22 | 0.08 | ||||||||||||
| Net realized and unrealized gains (losses) on investments | 0.22 | (0.36 | ) | 0.46 | 0.09 | |||||||||||
| Total from investment operations | 0.49 | (0.11 | ) | 0.68 | 0.17 | |||||||||||
| Distributions from: | ||||||||||||||||
| Net investment income | (0.33 | ) | (0.31 | ) | (0.31 | ) | (0.09 | ) | ||||||||
| Realized capital gains | — | (0.01 | ) | — | — | |||||||||||
| Total distributions | (0.33 | ) | (0.32 | ) | (0.31 | ) | (0.09 | ) | ||||||||
| Net asset value at end of period | $ | 10.24 | $ | 10.08 | $ | 10.51 | $ | 10.14 | ||||||||
| Total return | 4.96 | % | (1.09 | )% | 6.81 | % | 1.70 | %(B) | ||||||||
| Ratios and supplemental data: | ||||||||||||||||
| Net assets at end of period (000’s) | $ | 116,404 | $ | 133,051 | $ | 148,341 | $ | 6,386 | ||||||||
| Ratio to average net assets: | ||||||||||||||||
| Net expenses | 0.50 | % | 0.50 | % | 0.50 | % | 0.50 | %(C) | ||||||||
| Gross expenses | 0.60 | % | 0.60 | % | 0.67 | % | 1.21 | %(C) | ||||||||
| Net investment income | 2.72 | % | 2.47 | % | 2.66 | % | 4.89 | %(C) | ||||||||
| Portfolio turnover rate | 5 | % | 35 | % | 79 | %(D) | 7 | %(B) | ||||||||
| (A) | Represents the period from commencement of operations (August 1, 2011) through September 30, 2011. |
| (B) | Not annualized. |
| (C) | Annualized. |
| (D) | Portfolio turnover excludes the purchases and sales of the Old Mutual Barrow Hanley Core Bond Fund acquired on April 16, 2012. If these transactions were included, portfolio turnover would have been higher. |
See accompanying Notes to Financial Statements.
| 152 |
Financial Highlights (Continued)
| Touchstone Ultra Short Duration Fixed Income Fund—Class A |
| Selected Data for a Share Outstanding Throughout Each Period |
| Period | ||||||||||||
| Ended | ||||||||||||
| September | ||||||||||||
| Year Ended September 30, | 30, | |||||||||||
| 2014 | 2013 | 2012(A) | ||||||||||
| Net asset value at beginning of period | $ | 9.45 | $ | 9.56 | $ | 9.57 | ||||||
| Income (loss) from investment operations: | ||||||||||||
| Net investment income | 0.06 | 0.09 | 0.09 | |||||||||
| Net realized and unrealized gains (losses) on investments | 0.03 | (0.04 | ) | (0.01 | ) | |||||||
| Total from investment operations | 0.09 | 0.05 | 0.08 | |||||||||
| Distributions from: | ||||||||||||
| Net investment income | (0.13 | ) | (0.16 | ) | (0.09 | ) | ||||||
| Net asset value at end of period | $ | 9.41 | $ | 9.45 | $ | 9.56 | ||||||
| Total return(B) | 0.92 | % | 0.48 | % | 0.85 | %(C) | ||||||
| Ratios and supplemental data: | ||||||||||||
| Net assets at end of period (000’s) | $ | 10,596 | $ | 32,088 | $ | 34,228 | ||||||
| Ratio to average net assets: | ||||||||||||
| Net expenses | 0.69 | % | 0.69 | % | 0.69 | %(D) | ||||||
| Gross expenses | 0.93 | % | 0.83 | % | 1.19 | %(D) | ||||||
| Net investment income | 0.79 | % | 0.85 | % | 1.40 | %(D) | ||||||
| Portfolio turnover rate | 142 | % | 107 | %(E) | 169 | %(F) | ||||||
| Touchstone Ultra Short Duration Fixed Income Fund—Class C |
| Selected Data for a Share Outstanding Throughout Each Period |
| Period | ||||||||||||
| Ended | ||||||||||||
| September | ||||||||||||
| Year Ended September 30, | 30, | |||||||||||
| 2014 | 2013 | 2012(A) | ||||||||||
| Net asset value at beginning of period | $ | 9.45 | $ | 9.56 | $ | 9.57 | ||||||
| Income (loss) from investment operations: | ||||||||||||
| Net investment income | 0.02 | 0.04 | 0.05 | |||||||||
| Net realized and unrealized gains (losses) on investments | 0.02 | (0.04 | ) | 0.01 | ||||||||
| Total from investment operations | 0.04 | — | 0.06 | |||||||||
| Distributions from: | ||||||||||||
| Net investment income | (0.08 | ) | (0.11 | ) | (0.07 | ) | ||||||
| Net asset value at end of period | $ | 9.41 | $ | 9.45 | $ | 9.56 | ||||||
| Total return(B) | 0.42 | % | (0.02 | )% | 0.62 | %(C) | ||||||
| Ratios and supplemental data: | ||||||||||||
| Net assets at end of period (000’s) | $ | 11,272 | $ | 13,568 | $ | 11,517 | ||||||
| Ratio to average net assets: | ||||||||||||
| Net expenses | 1.19 | % | 1.19 | % | 1.19 | %(D) | ||||||
| Gross expenses | 1.44 | % | 1.39 | % | 1.68 | %(D) | ||||||
| Net investment income | 0.29 | % | 0.35 | % | 0.90 | %(D) | ||||||
| Portfolio turnover rate | 142 | % | 107 | %(E) | 169 | %(F) | ||||||
| (A) | Represents the period from commencement of operations (April 16, 2012) through September 30, 2012. |
| (B) | Total returns shown exclude the effect of applicable sales loads. If these charges were included, the returns would be lower. |
| (C) | Not annualized. |
| (D) | Annualized. |
| (E) | Portfolio turnover excludes the purchases and sales of the Touchstone Short Duration Fixed Income Fund (see Note 11). If these transactions were included, portfolio turnover would have been higher. |
| (F) | Portfolio turnover excludes the purchases and sales of the Old Mutual Dwight Short Term Fixed Income Fund and Fifth Third Short Term Bond Fund acquired on April 16, 2012 and September 10, 2012, respectively. If these transactions were included, portfolio turnover would have been higher. |
See accompanying Notes to Financial Statements.
| 153 |
Financial Highlights (Continued)
| Touchstone Ultra Short Duration Fixed Income Fund—Class Y |
| Selected Data for a Share Outstanding Throughout Each Period |
| Period | ||||||||||||
| Ended | ||||||||||||
| September | ||||||||||||
| Year Ended September 30, | 30, | |||||||||||
| 2014 | 2013 | 2012(A) | ||||||||||
| Net asset value at beginning of period | $ | 9.45 | $ | 9.56 | $ | 9.57 | ||||||
| Income (loss) from investment operations: | ||||||||||||
| Net investment income | 0.10 | 0.12 | 0.08 | |||||||||
| Net realized and unrealized gains (losses) on investments | 0.01 | (0.05 | ) | 0.01 | ||||||||
| Total from investment operations | 0.11 | 0.07 | 0.09 | |||||||||
| Distributions from: | ||||||||||||
| Net investment income | (0.15 | ) | (0.18 | ) | (0.10 | ) | ||||||
| Net asset value at end of period | $ | 9.41 | $ | 9.45 | $ | 9.56 | ||||||
| Total return | 1.17 | % | 0.74 | % | 0.97 | %(B) | ||||||
| Ratios and supplemental data: | ||||||||||||
| Net assets at end of period (000’s) | $ | 244,885 | $ | 249,250 | $ | 190,515 | ||||||
| Ratio to average net assets: | ||||||||||||
| Net expenses | 0.44 | % | 0.44 | % | 0.44 | %(C) | ||||||
| Gross expenses | 0.49 | % | 0.51 | % | 0.55 | %(C) | ||||||
| Net investment income | 1.04 | % | 1.10 | % | 1.65 | %(C) | ||||||
| Portfolio turnover rate | 142 | % | 107 | %(D) | 169 | %(E) | ||||||
| Touchstone Ultra Short Duration Fixed Income Fund—Class Z |
| Selected Data for a Share Outstanding Throughout Each Period |
| Year Ended September 30, | ||||||||||||||||||||
| 2014 | 2013 | 2012 | 2011 | 2010 | ||||||||||||||||
| Net asset value at beginning of period | $ | 9.45 | $ | 9.56 | $ | 9.58 | $ | 9.68 | $ | 9.66 | ||||||||||
| Income (loss) from investment operations: | ||||||||||||||||||||
| Net investment income | 0.08 | 0.09 | 0.14 | 0.15 | 0.18 | |||||||||||||||
| Net realized and unrealized gains (losses) on investment | 0.01 | (0.04 | ) | 0.06 | (0.04 | ) | 0.06 | |||||||||||||
| Total from investment operations | 0.09 | 0.05 | 0.20 | 0.11 | 0.24 | |||||||||||||||
| Distributions from: | ||||||||||||||||||||
| Net investment income | (0.13 | ) | (0.16 | ) | (0.22 | ) | (0.21 | ) | (0.22 | ) | ||||||||||
| Net asset value at end of period | $ | 9.41 | $ | 9.45 | $ | 9.56 | $ | 9.58 | $ | 9.68 | ||||||||||
| Total return | 0.91 | % | 0.52 | % | 2.10 | % | 1.12 | % | 2.49 | % | ||||||||||
| Ratios and supplemental data: | ||||||||||||||||||||
| Net assets at end of period (000’s) | $ | 401,851 | $ | 381,554 | $ | 338,669 | $ | 346,131 | $ | 236,650 | ||||||||||
| Ratio to average net assets: | ||||||||||||||||||||
| Net expenses | 0.69 | % | 0.65 | % | 0.64 | % | 0.69 | % | 0.69 | % | ||||||||||
| Gross expenses | 0.76 | % | 0.73 | % | 0.73 | % | 0.78 | % | 0.81 | % | ||||||||||
| Net Investment Income | 0.79 | % | 0.89 | % | 1.45 | % | 1.39 | % | 1.69 | % | ||||||||||
| Portfolio turnover rate | 142 | % | 107 | %(D) | 169 | %(E) | 144 | % | 119 | % | ||||||||||
| (A) | Represents the period from commencement of operations (April 16, 2012) through September 30, 2012. |
| (B) | Not annualized. |
| (C) | Annualized. |
| (D) | Portfolio turnover excludes the purchases and sales of the Touchstone Short Duration Fixed Income Fund (see Note 11). If these transactions were included, portfolio turnover would have been higher. |
| (E) | Portfolio turnover excludes the purchases and sales of the Old Mutual Dwight Short Term Fixed Income Fund and Fifth Third Short Term Bond Fund acquired on April 16, 2012 and September 10, 2012, respectively. If these transactions were included, portfolio turnover would have been higher. |
See accompanying Notes to Financial Statements.
| 154 |
Financial Highlights (Continued)
| Touchstone Ultra Short Duration Fixed Income Fund—Institutional Class |
| Selected Data for a Share Outstanding Throughout Each Period |
| Period | ||||||||||||
| Ended | ||||||||||||
| September | ||||||||||||
| Year Ended September 30, | 30, | |||||||||||
| 2014 | 2013 | 2012(A) | ||||||||||
| Net asset value at beginning of period | $ | 9.45 | $ | 9.56 | $ | 9.57 | ||||||
| Income (loss) from investment operations: | ||||||||||||
| Net investment income | 0.10 | 0.14 | 0.09 | |||||||||
| Net realized and unrealized gains (losses) on investments | 0.01 | (0.07 | ) | — | (B) | |||||||
| Total from investment operations | 0.11 | 0.07 | 0.09 | |||||||||
| Distributions from: | ||||||||||||
| Net investment income | (0.15 | ) | (0.18 | ) | (0.10 | ) | ||||||
| Net asset value at end of period | $ | 9.41 | $ | 9.45 | $ | 9.56 | ||||||
| Total return | 1.22 | % | 0.78 | % | 0.99 | %(C) | ||||||
| Ratios and supplemental data: | ||||||||||||
| Net assets at end of period (000’s) | $ | 50,853 | $ | 59,662 | $ | 6,697 | ||||||
| Ratio to average net assets: | ||||||||||||
| Net expenses | 0.39 | % | 0.39 | % | 0.39 | %(D) | ||||||
| Gross expenses | 0.48 | % | 0.52 | % | 1.23 | %(D) | ||||||
| Net investment income | 1.09 | % | 1.15 | % | 1.70 | %(D) | ||||||
| Portfolio turnover rate | 142 | % | 107 | %(E) | 169 | %(F) | ||||||
| (A) | Represents the period from commencement of operations (April 16, 2012) through September 30, 2012. |
| (B) | Less than $0.005 per share. |
| (C) | Not annualized. |
| (D) | Annualized. |
| (E) | Portfolio turnover excludes the purchases and sales of the Touchstone Short Duration Fixed Income Fund (see Note 11). If these transactions were included, portfolio turnover would have been higher. |
| (F) | Portfolio turnover excludes the purchases and sales of the Old Mutual Dwight Short Term Fixed Income Fund and Fifth Third Short Term Bond Fund acquired on April 16, 2012 and September 10, 2012, respectively. If these transactions were included, portfolio turnover would have been higher. |
See accompanying Notes to Financial Statements.
| 155 |
September 30, 2014
1. Organization
The Touchstone Funds Group Trust (the “Trust”) is registered under the Investment Company Act of 1940, as amended (the “1940 Act”), as an open-end management investment company. The Trust was established as a Delaware statutory trust pursuant to a Declaration of Trust dated October 25, 1993. The Trust consists of the following thirteen funds (individually, a “Fund,” and collectively, the “Funds”):
Touchstone Arbitrage Fund (“Arbitrage Fund”)
Touchstone Emerging Markets Equity Fund (“Emerging Markets Equity Fund”)
Touchstone Global Real Estate Fund (“Global Real Estate Fund”)
Touchstone International Fixed Income Fund (“International Fixed Income Fund”)
Touchstone Merger Arbitrage Fund (“Merger Arbitrage Fund”)
Touchstone Mid Cap Fund (“Mid Cap Fund”)
Touchstone Mid Cap Value Fund (“Mid Cap Value Fund”)
Touchstone Premium Yield Equity Fund (“Premium Yield Equity Fund”)
Touchstone Sands Capital Select Growth Fund (“Sands Capital Select Growth Fund”)
Touchstone Small Cap Core Fund (“Small Cap Core Fund”)
Touchstone Small Cap Value Fund (“Small Cap Value Fund”)
Touchstone Total Return Bond Fund (“Total Return Bond Fund”)
Touchstone Ultra Short Duration Fixed Income Fund (“Ultra Short Duration Fixed Income Fund”)
Each Fund is diversified, with the exception of the Arbitrage Fund, Global Real Estate Fund, International Fixed Income Fund, Merger Arbitrage Fund, Sands Capital Select Growth Fund and Small Cap Core Fund, each of which is non-diversified.
The Declaration of Trust permits the Trust to issue an unlimited number of shares of beneficial interest of each Fund. The table below indicates the classes of shares that each Fund is registered to offer:
| Institutional | ||||||||||
| Class A | Class C | Class Y | Class Z | Class | ||||||
| Arbitrage Fund | X | X | X | X | ||||||
| Emerging Markets Equity Fund | X | X | X | X | ||||||
| Global Real Estate Fund | X | X | X | X | ||||||
| International Fixed Income Fund | X | X | X | X | ||||||
| Merger Arbitrage Fund | X | X | X | X | ||||||
| Mid Cap Fund | X | X | X | X | X | |||||
| Mid Cap Value Fund | X | X | X | X | ||||||
| Premium Yield Equity Fund | X | X | X | |||||||
| Sands Capital Select Growth Fund | X | X | X | X | ||||||
| Small Cap Core Fund | X | X | X | X | ||||||
| Small Cap Value Fund | X | X | X | X | ||||||
| Total Return Bond Fund | X | X | X | X | ||||||
| Ultra Short Duration Fixed Income Fund | X | X | X | X | X |
The assets of each Fund are segregated, and a shareholder’s interest is limited to the Fund in which shares are held. The Funds’ prospectus provides a description of each Fund’s investment goals, policies, and strategies along with information on the classes of shares currently being offered.
| 156 |
Notes to Financial Statements (Continued)
2. Significant Accounting Policies
The following is a summary of the Funds’ significant accounting policies:
Security valuation and fair value measurements — Generally accepted accounting principles in the United States (“U.S. GAAP”) defines fair value as the price the Funds would receive to sell an asset or pay to transfer a liability in an orderly transaction between market participants at the measurement date. All investments in securities are recorded at their estimated fair value. The Fund defines the term “market value”, as used throughout this report, as the estimated fair value. The Fund uses various methods to measure fair value of its portfolio securities on a recurring basis. U.S. GAAP fair value measurement standards require disclosure of a hierarchy that prioritizes inputs to valuation methods. These inputs are summarized in the three broad levels listed below:
| • | Level 1 – | quoted prices in active markets for identical securities |
| • | Level 2 – | other significant observable inputs (including quoted prices for similar securities, interest rates, prepayment speeds, credit risk, etc.) |
| • | Level 3 – | significant unobservable inputs (including a Fund’s own assumptions in determining the fair value of investments) |
The inputs or methodology used for valuing securities are not necessarily an indication of the risk associated with investing in those securities. For example, money market instruments are valued using amortized cost, in accordance with rules under the 1940 Act. Generally, amortized cost approximates the current fair value of a security, but since the value is not obtained from a quoted price in an active market, such securities are reflected as Level 2.
The aggregate value by input level, as of September 30, 2014, for the Fund’s investments, as well as a reconciliation of assets for which significant unobservable inputs (Level 3) were used in determining value, if applicable, is included in the Fund’s Portfolio of Investments, which also includes a breakdown of the Fund’s investments by geographic, portfolio, or sector allocation. The Funds did not hold any Level 3 categorized securities during the year ended September 30, 2014.
Changes in valuation techniques may result in transfers into or out of an investment’s assigned level within the hierarchy. All transfers in and out of the levels are recognized at the value at the end of the period. During the year ended September 30, 2014, there were no transfers between Levels 1, 2 and 3 for all Funds, except as shown in the Portfolio of Investments for the Global Real Estate Fund.
The Funds’ portfolio securities are valued as of the close of the regular session of trading on the New York Stock Exchange (“NYSE”) (currently 4:00 p.m., Eastern Time). Portfolio securities traded on stock exchanges are valued at the last reported sale price, official close price, or last bid price if no sales are reported. Portfolio securities quoted by NASDAQ are valued at the NASDAQ Official Closing Price (“NOCP”) or from the primary exchange on which the security trades. To the extent these securities are actively traded, they are categorized in Level 1 of the fair value hierarchy. Shares of options are valued at the mean between the last bid and ask prices at the close of the options market in which the options trade. An option for which there is no mean price is valued at the last bid (long position) or ask (short positions) price and categorized in Level 1. Shares of open-end mutual funds in which the Funds invest are valued at their respective net asset values (“NAV”) as reported by the underlying funds and are categorized in Level 1.
Debt securities held by the Funds are valued at their most recent evaluated bid by an independent pricing service or at their last broker-quoted bid prices as obtained from one or more of the major market makers for such securities. Independent pricing services use information provided by market makers or estimates of market values through accepted market modeling conventions. Inputs to the models may include prepayment speeds,
| 157 |
Notes to Financial Statements (Continued)
pricing spread, yield, trade information, dealer quotes, market color, cash flow models, the securities’ terms and conditions, among others, and are generally categorized in Level 2. Money market instruments and other debt securities with a remaining maturity of less than 60 days are valued at amortized cost, which approximates market value and are categorized in Level 2. While this method provides consistency in valuation (and may only be used if it approximates market value), it may result in periods during which value, as determined by amortized cost, is higher or lower than the price that would be received if the Fund sold the investment.
Foreign currency exchange contracts are valued at the mean between the bid and ask prices and are determined as of the close of regular trading on the NYSE. Interpolated values are derived when the settlement date of the contract is an interim date for which quotations are not available and categorized in Level 2.
Securities mainly traded on a non-U.S. exchange or denominated in foreign currency are generally valued according to the preceding closing values on that exchange, translated to U.S. dollars using currency exchange rates as of the close of regular trading on the NYSE, and generally categorized in Level 1. However, if an event that may change the value of a security occurs after the time that the closing value on the non-U.S. exchange was determined, but before the close of regular trading on the NYSE, the security may be priced based on fair value and generally categorized in Level 2. This may cause the value of the security, if held on the books of the Fund to be different from the closing value on the non-U.S. exchange and may affect the calculation of that Fund’s NAV. The Fund may use fair value pricing under the following circumstances, among others.
| • | If the value of a security has been materially affected by events occurring before the Funds’ pricing time but after the close of the primary markets on which the security is traded. |
| • | If the exchange on which a portfolio security is principally traded closes early or if trading in a particular portfolio security was halted during the day and did not resume prior to the Funds’ NAV calculation. |
| • | If a security is so thinly traded that reliable market quotations are unavailable due to infrequent trading. |
| • | If the validity of market quotations is not reliable. |
Securities held by the Fund that do not have readily available market quotations, significant observable inputs, or securities for which the available market quotations are not reliable, are priced at their estimated fair value using procedures approved by the Fund’s Board of Trustees and are generally categorized in Level 3.
Investment companies — Certain Funds may invest in securities of other investment companies, including exchange-traded funds (“ETFs”), open-end funds and closed-end funds. Open-end funds are investment companies that issue new shares continuously and redeem shares daily. Closed-end funds are investment companies that typically issue a fixed number of shares that trade on a securities exchange or over-the-counter. An ETF is an investment company that typically seeks to track the performance of an index by holding in its portfolio shares of all the companies, or a representative sample of the companies, that are components of a particular index. ETFs are traded on a securities exchange based on their market value. The risks of investment in other investment companies typically reflect the risks of the types of securities in which investment companies invest. Investments in ETFs and closed-end funds are subject to the additional risk that their shares may trade at a premium or discount to their NAV. When a Fund invests in another investment company, shareholders of the Fund indirectly bear their proportionate share of the other investment company’s fees and expenses, including operating, registration, trustee, licensing, and marketing, as well as their share of the Fund’s fees and expenses.
Securities sold short — The Funds periodically engage in selling securities short, which obligates a Fund to replace a security borrowed by purchasing the same security at the current market value. A Fund would incur a loss if the price of the security increases between the date of the short sale and the date on which the Fund replaces the borrowed security. A Fund would realize a gain if the price of the security declines between those dates. As of September 30, 2014, the Arbitrage Fund and Merger Arbitrage Fund held securities sold short with a fair value of $73,546,012 and $149,851,989 and had securities with a fair value of $62,349,481
| 158 |
Notes to Financial Statements (Continued)
and $165,186,342 held as collateral and cash collateral of $71,007,137 and $126,934,320 for both securities sold short and written options, respectively.
Options — The Funds may write or purchase financial option contracts primarily to hedge against changes in the value of equity securities (or securities that the Funds intend to purchase), against fluctuations in fair value caused by changes in prevailing market interest rates or foreign currency exchange rates and against changes in overall equity market volatility. In addition, the Funds may utilize options in an attempt to generate gains from option premiums or to reduce overall portfolio risk. The Funds’ option strategy primarily focuses on the use of writing call options on equity indexes. When the Funds write or purchase an option, an amount equal to the premium received or paid by the Funds is recorded as a liability or an asset and is subsequently adjusted to the current market value of the option written or purchased. Premiums received or paid from writing or purchasing options which expire unexercised are treated by the Funds on the expiration date as realized gains or losses. The difference between the premium and the amount paid or received on effecting a closing purchase or sale transaction, including brokerage commissions, is also treated as a realized gain or loss. If an option is exercised, the premium paid or received is added to the cost of the purchase or proceeds from the sale in determining whether the Funds have realized a gain or loss on investment transactions. The Funds, as writers of an option, may have no control over whether the underlying securities may be sold (call) or purchased (put) and as a result bear the market risk of an unfavorable change in the price of the security underlying the written option. The Funds, as purchasers of an option, bear the risk that the counterparties to the option may not have the ability to meet the terms of the option contracts. There is minimal counterparty credit risk involved in entering into option contracts since they are exchange-traded instruments and the exchange’s clearinghouse, as counterparty to all exchange-traded options, guarantees the options against default. Options are valued at the last quoted sales price. If there is no such reported sale on the valuation date, long option positions are valued at the most recent bid price, and short option positions are valued at the most recent ask price. As of September 30, 2014, the Arbitrage Fund and Merger Arbitrage Fund held written options with a fair value of $244,815 and $722,930 and had securities with a fair value of $62,349,481 and $165,186,342 held as collateral and cash collateral of $71,007,137 and $126,934,320 for both securities sold short and written options, respectively. The Arbitrage and Merger Arbitrage Fund also held purchased options with a fair value of $1,700 and $4,855, respectively, as of September 30, 2014.
Warrants — The Funds can invest in warrants and stock purchase rights of companies of any market capitalization. A warrant gives the company the right to buy stock, typically from the issuer. The warrant specifies the amount of underlying stock, the purchase (or “exercise”) price, and the date the warrant expires. Certain warrants may permit, without legal obligation, net settlement for stock or cash. The Funds have no obligation to exercise the warrant and buy the stock.
Foreign currency translation — The books and records of the Funds are maintained in U.S. dollars and translated into U.S. dollars on the following basis:
(1) market value of investment securities, assets and liabilities at the current rate of exchange on the valuation date; and
(2) purchases and sales of investment securities, income, and expenses at the relevant rates of exchange prevailing on the respective dates of such transactions.
The Funds do not isolate that portion of gains and losses on investments in equity securities that is due to changes in the foreign exchange rates from that which is due to changes in market prices of equity securities.
Forward foreign currency contracts — A forward foreign currency contract is an agreement between two parties to buy and sell a specific currency at a price that is set on the date of the contract. The forward contract calls for delivery of the currency on a future date that is specified in the contract. Risks related to the use of forwards
| 159 |
Notes to Financial Statements (Continued)
include the possible failure of counterparties to meet the terms of the forward agreement, the failure of the counterparties to timely post collateral, the risk that currency movements will not occur thereby reducing the Fund’s total return, and the potential for losses in excess of the Fund’s initial investment.
The market value of a forward foreign currency contract fluctuates with changes in foreign currency exchange rates. Forward foreign currency contracts are marked to market daily and the change in value is recorded by a Fund as an unrealized gain or loss. Realized gains or losses, equal to the difference between the value of the contract at the time it was opened and the value at the time it was closed, are recorded upon delivery or receipt of the currency.
During the year ended September 30, 2014, the Arbitrage Fund, the International Fixed Income Fund, and the Merger Arbitrage Fund used forward foreign currency contracts to enhance potential gains, hedge against anticipated currency exchange rates, maintain diversity and liquidity of the portfolio and adjust exposure to foreign currencies.
Real Estate Investment Trusts – The Funds may invest in real estate investment trusts (“REITs”) that involve risks not associated with investing in stocks. Risks include declines in the value of real estate, general and economic conditions, changes in the value of the underlying property and defaults by borrowers. The value of assets in the real estate industry may go through cycles of relative underperformance and outperformance in comparison to equity securities markets in general. Dividend income is recorded using management’s estimate of the income included in distributions received from REIT investments. The actual amounts of income, return of capital and capital gains are only determined by each REIT after its fiscal year-end and may differ from the estimated amount. Estimates of income are adjusted in the Funds to the actual amounts when the amounts are determined.
Derivative instruments and hedging activities — In order to better define its contractual rights and to secure rights that will help a Funds mitigate their counterparty risk, the Fund may enter into an International Swaps and Derivatives Associations, Inc. Master Agreement (“ISDA Master Agreement” or “MNA”) or similar agreement with certain counterparties. An ISDA Master Agreement is a bilateral agreement between a Fund and a counterparty that governs over-the-counter (“OTC”) derivatives and foreign exchange contracts, and typically contains, among other things, collateral posting terms and master netting provisions in the event of a default or termination. Under an ISDA Master Agreement, a party may, under certain circumstances, offset with the counterparty certain derivative financial instrument’s payables or receivables with collateral held or posted and create one single net payment. The provisions of the ISDA Master Agreement typically permit a single net payment in the event of default (close-out netting). These default events include bankruptcy or insolvency of the counterparty. Note, however, that bankruptcy or insolvency laws of a particular jurisdiction may impose restrictions on or prohibitions against the right of offset.
When entering into a derivative transaction, a Fund may be required to post and maintain collateral or margin (including both initial and maintenance margin). Collateral and margin requirements differ by type of derivative. Margin requirements are established by the broker or clearing house for exchange traded and centrally cleared derivatives (financial futures contracts, options, and centrally cleared swaps). Brokers can ask for margining in excess of the clearing house’s minimum in certain circumstances. Collateral terms are contract specific for OTC derivatives (foreign currency exchange contracts, options, and swaps). For derivatives traded under an ISDA Master Agreement, the collateral requirements are typically calculated by netting the marked-to-market amount for each transaction under such agreement and comparing that amount to the value of any collateral currently pledged by the Fund and the counterparty. For financial reporting purposes, cash collateral that has been pledged to cover obligations of the Fund and cash collateral received from the counterparty, if any, is reported separately on the Statements of Assets and Liabilities as cash pledged as collateral and cash received as collateral, respectively. Non-cash collateral pledged by the Fund, if any, is noted in the Portfolio of Investments. To the extent amounts
| 160 |
Notes to Financial Statements (Continued)
due to the Fund from its counterparties are not fully collateralized, contractually or otherwise, the Fund bears the risk of loss from counterparty non-performance. A Fund attempts to mitigate counterparty risk by only entering into agreements with counterparties that it believes have the financial resources to honor their obligations and by monitoring the financial stability of those counterparties.
Certain ISDA Master Agreements allow counterparties to OTC derivatives transactions to terminate derivative contracts prior to maturity in the event the Fund’s net assets decline by a stated percentage or the Fund fails to meet the terms of its ISDA Master Agreement, which would cause the Fund to accelerate payment of any net liability owed to the counterparty.
For financial reporting purposes, the Funds do not offset derivative assets and derivative liabilities that are subject to netting arrangements in the Statements of Assets and Liabilities.
As of September 30, 2014, the derivative assets and liabilities (by type) on a gross basis were as follows:
| Assets | Liabilities | |||||||
| Arbitrage Fund | ||||||||
| Written Options | $ | — | $ | 244,815 | ||||
| Merger Arbitrage Fund | ||||||||
| Forward Foreign Currency Contracts | 508,348 | — | ||||||
| Written Options | — | 722,930 | ||||||
The following table presents the Merger Arbitrage Fund’s derivative assets net of amounts available for offset under a MNA and net of the related collateral pledged to the Fund as of September 30, 2014:
| Gross | ||||||||||||||||||||
| Amount of | Gross Amount Available | Non-Cash | Cash | |||||||||||||||||
| Recognized | for Offset in Statement | Collateral | Collateral | |||||||||||||||||
| Assets | of Assets and Liabilities | Pledged | Pledged | Net Amount(A) | ||||||||||||||||
| Merger Arbitrage Fund | ||||||||||||||||||||
| Forward Foreign Currency Contracts(B) | $ | 508,348 | $ | — | $ | — | $ | — | $ | 508,348 | ||||||||||
The following table presents the Arbitrage Fund and Merger Arbitrage Fund’s derivative liabilities net of amounts available for offset under a MNA and net of the related collateral pledged by the Fund as of September 30, 2014:
| Gross | ||||||||||||||||||||
| Amount of | Gross Amount Available | Non-Cash | Cash | |||||||||||||||||
| Recognized | for Offset in Statement | Collateral | Collateral | |||||||||||||||||
| Liabilities | of Assets and Liabilities | Pledged | Pledged | Net Amount(C) | ||||||||||||||||
| Arbitrage Fund Written Options(D) | $ | 244,815 | $ | — | $ | (9,235 | ) | $ | (235,580 | ) | $ | — | ||||||||
| Merger Arbitrage Fund Written Options(D) | 722,930 | — | (113,502 | ) | (609,428 | ) | — | |||||||||||||
(A) Net amount represents the net amount receivable from the counterparty in the event of default.
(B) Brown Brothers Harriman is the counterparty.
(C) Net amount represents the net amount payable due to the counterparty in the event of default.
(D) BTIG is the counterparty.
| 161 |
Notes to Financial Statements (Continued)
The following table sets forth the fair value of the Funds’ derivative financial instruments by primary risk exposure as of September 30, 2014:
| Fair Value of Derivative Investments | ||||||||||
| As of September 30, 2014 | ||||||||||
| Derivatives not accounted for as hedging | Asset | Liability | ||||||||
| Fund | instruments under ASC 815 | Derivatives | Derivatives | |||||||
| Arbitrage Fund | Forward-Foreign Currency Exchange Contracts* | $ | 87,990 | $ | — | |||||
| Purchased Options-Equity Contracts** | 1,700 | — | ||||||||
| Written Options-Equity Contracts*** | — | 244,815 | ||||||||
| International Fixed Income Fund | Forward-Foreign Currency Exchange Contracts* | 1,682,933 | 1,201,480 | |||||||
| Merger Arbitrage Fund | Forward-Foreign Currency Exchange Contracts* | 508,348 | — | |||||||
| Purchased Options-Equity Contracts** | 4,855 | — | ||||||||
| Written Options-Equity Contracts*** | — | 722,930 | ||||||||
* Statements of Assets and Liabilities Location: Unrealized appreciation on forward foreign currency contracts and unrealized depreciation on forward foreign currency contracts, respectively.
** Statements of Assets and Liabilities Location: Non-affiliated securities, at market value.
*** Statements of Assets and Assets and Liabilities Location: Written options at market value.
The following table sets forth the operations of the Funds’ derivative financial instruments by primary risk exposure as of September 30, 2014:
| The Effect of Derivative Investments on the Statement of Operations | ||||||||||
| for the Year Ended September 30, 2014 | ||||||||||
| Change in | ||||||||||
| Unrealized | ||||||||||
| Realized Gain | Appreciation | |||||||||
| Derivatives not accounted for as hedging | (Loss) | (Depreciation) | ||||||||
| Fund | instruments under ASC 815 | on Derivatives | on Derivatives | |||||||
| Arbitrage Fund | Forward-Foreign Currency Exchange Contracts* | $ | 185,384 | $ | 87,990 | |||||
| Purchased Options-Equity Contracts** | (110,909 | ) | (53,238 | ) | ||||||
| Written Options-Equity Contracts*** | 2,335 | (130,020 | ) | |||||||
| International Fixed Income Fund | Forward-Foreign Currency Exchange Contracts* | (322,892 | ) | 839,681 | ||||||
| Merger Arbitrage Fund | Forward-Foreign Currency Exchange Contracts* | 705,101 | 564,022 | |||||||
| Purchased Options-Equity Contracts** | (365,488 | ) | (387,217 | ) | ||||||
| Written Options-Equity Contracts*** | 12,661 | (124,796 | ) | |||||||
* Statements of Operations Location: Net realized gains (losses) on foreign currency transactions and net change in unrealized appreciation (depreciation) on foreign currency transactions, respectively.
** Statements of Operations Location: Net realized gains (losses) from non-affiliated securities and net change in unrealized appreciation (depreciation) on investments, respectively.
*** Statements of Operations Location: Net realized gains (losses) on written options and net change in unrealized appreciation (depreciation) on written options, respectively.
| 162 |
Notes to Financial Statements (Continued)
For the year ended September 30, 2014, the average quarterly balances of outstanding derivative financial instruments were as follows:
| International | Merger | |||||||||||
| Arbitrage | Fixed Income | Arbitrage | ||||||||||
| Fund | Fund | Fund | Fund | |||||||||
| Equity contracts: | ||||||||||||
| Purchased Options - Cost | $ | 76,104 | $ | — | $ | 558,851 | ||||||
| Written Options - Proceeds | $ | 84,370 | $ | — | $ | 598,961 | ||||||
| Forward Foreign currency exchange contracts: | ||||||||||||
| Average number of contracts | 6 | 13 | 6 | |||||||||
| Average U.S. dollar amount purchased | $ | 4,934,651 | $ | 17,422,171 | $ | 26,108,503 | ||||||
| Average U.S. dollar amount sold | $ | 733,782 | $ | 14,733,870 | $ | 1,863,636 | ||||||
Portfolio securities loaned — Each Fund may lend its portfolio securities. Lending portfolio securities exposes a Fund to the risk that the borrower may fail to return the loaned securities or may not be able to provide additional collateral or that the Funds may experience delays in recovery of the loaned securities or loss of rights in the collateral if the borrower fails financially. To minimize these risks, the borrower must agree to maintain cash collateral with the Funds’ custodian. The loaned securities are secured by collateral valued at least equal, at all times, to the market value of the loaned securities plus accrued interest, if any. When the collateral falls below specified amounts, the lending agent will use its best effort to obtain additional collateral on the next business day to meet required amounts under the security lending agreement. The cash collateral is reinvested by the Funds’ custodian into an approved investment vehicle. The approved investment vehicle is subject to market risk.
As of September 30, 2014, the following Funds loaned securities and received collateral as follows:
| Market Value of | Market Value of | |||||||
| Securities | Collateral | |||||||
| Fund | Loaned | Received | ||||||
| Emerging Markets Equity Fund | $ | 3,651,350 | $ | 3,864,165 | ||||
| Global Real Estate Fund | 648,399 | 669,430 | ||||||
| Mid Cap Fund | 29,812,639 | 30,511,526 | ||||||
| Mid Cap Value Fund | 10,091,629 | 10,356,915 | ||||||
| Sands Capital Select Growth Fund | 143,412,285 | 147,741,989 | ||||||
| Small Cap Core Fund | 69,629,173 | 71,468,812 | ||||||
| Small Cap Value Fund | 6,513,533 | 6,717,511 | ||||||
All cash collateral is received, held, and administered by the Funds’ custodian for the benefit of the lending Fund in its custody account or other account established for the purpose of holding collateral.
Funds participating in securities lending receive compensation in the form of fees. Securities lending income is derived from lending long securities from the Funds to creditworthy approved borrowers at rates that are determined based on daily trading volumes, float, short-term interest rates and market liquidity. A lending Fund retains the interest or dividends on the investment of any cash received as collateral. The lending Fund continues to receive interest or dividends on the loaned securities.
Unrealized gain or loss on the market value of the loaned securities that may occur during the term of the loan is recognized by the lending Fund. The lending Fund has the right under the lending agreement to recover the securities from the borrower on demand.
When-issued or delayed delivery transactions — Each Fund may purchase or sell securities on a when-issued or delayed delivery basis. These transactions involve a commitment by the Fund to purchase or sell securities for a predetermined price or yield, with payment and delivery taking place beyond the customary settlement period. When delayed delivery purchases are outstanding, the Fund will set aside liquid assets in an amount
| 163 |
Notes to Financial Statements (Continued)
sufficient to meet the purchase price. When purchasing a security on a delayed delivery basis, the Fund assumes the rights and risks of ownership of the security, including the risk of price and yield fluctuations, and takes such fluctuations into account when determining NAV. The Fund may dispose of or renegotiate a delayed delivery transaction after it is entered into, and may sell when-issued securities before they are delivered, which may result in a capital gain or loss. When the Fund has sold a security on a delayed delivery basis, the Fund does not participate in future gains and losses with respect to the security.
Share valuation — The NAV per share of each class of shares of each Fund is calculated daily by dividing the total value of a Fund’s assets attributable to that class, less liabilities attributable to that class, by the number of outstanding shares of that class.
The maximum offering price per share of Class A shares of the Funds (except the International Fixed Income Fund, Total Return Bond Fund and Ultra Short Duration Fixed Income Fund) is equal to the NAV per share plus a sales load equal to 6.10% of the NAV (or 5.75% of the offering price). The maximum offering price per share of Class A shares of the International Fixed Income Fund and Total Return Bond Fund is equal to the NAV per share plus a sales load equal to 4.99% of the NAV (or 4.75% of the offering price). The maximum offering price per share of Class A shares of the Ultra Short Duration Fixed Income Fund is equal to the NAV per share plus sales load equal to 2.04% of the NAV (or 2.00% of the offering price). There is no sales load on purchases of $1 million or more of Class A shares. The maximum offering price per share of Classes C, Y, Z, and Institutional Class shares of the Funds is equal to the NAV per share.
The redemption price per share of each class of shares of the Funds is generally equal to the NAV per share. However, Class A redemptions that were part of a no-load $1 million subscription may be subject to a contingent deferred sales charge (“CDSC”) of up to 1.00% if redeemed within a one-year period from the date of purchase. Additionally, purchases of Class C shares of the Funds are subject to a CDSC of 1.00%. The CDSC will be assessed on an amount equal to the lesser of (1) the NAV at the time of purchase of the shares being redeemed or (2) the NAV of such shares being redeemed if redeemed within a one-year period from the date of purchase.
Investment income — Dividend income from securities is recognized on the ex-dividend date, net of foreign withholding taxes, if any, which are reduced by any amounts reclaimable by the Funds, where applicable. Interest income from securities is recorded on the basis of interest accrued, premium amortized and discount accreted. Realized gains and losses resulting from principal paydowns on mortgage-backed and asset-backed securities are included in interest income. Market discounts, original issue discount (“OID”) and market premiums on debt securities are accreted/amortized to interest income over the life of the security with a corresponding adjustment in the cost basis of that security. In addition, it is the Funds’ policy to accrue for foreign capital gains taxes, if applicable, on certain foreign securities held by the Funds. An estimated foreign capital gains tax is recorded daily on net unrealized gains on these securities and is payable upon the sale of such securities when a gain is realized.
Distributions to shareholders — Each Fund intends to distribute to its shareholders substantially all of its income and capital gains. The Arbitrage Fund, Emerging Markets Equity Fund, Merger Arbitrage Fund, Mid Cap Fund, and Small Cap Core Fund distribute their income, if any, annually, as a dividend to shareholders. The Global Real Estate Fund, Mid Cap Value Fund, Sands Capital Select Growth Fund, and Small Cap Value Fund declare and distribute their income, if any, quarterly, as a dividend to shareholders. The International Fixed Income Fund, Premium Yield Equity Fund, and Total Return Bond Fund declare and distribute their income, if any, monthly, as a dividend to shareholders. The Ultra Short Duration Fixed Income Fund declares its income, if any, daily, and distributes such income monthly, as a dividend to shareholders. Each Fund makes distributions of capital gains, if any, at least annually, net of applicable capital loss carryforwards. Income distributions and capital gain distributions are determined in accordance with income tax regulations. Recognition of the
| 164 |
Notes to Financial Statements (Continued)
Funds’ net investment income that invest in underlying funds is affected by the timing of dividend declarations by those underlying funds.
Allocations — Investment income earned, realized capital gains and losses, and unrealized appreciation and depreciation for a Fund are allocated daily to each class of shares based upon its proportionate share of total net assets of the Fund. Class-specific expenses are charged directly to the class incurring the expense. Common expenses, which are not attributable to a specific class, are allocated daily to each class of shares based upon their proportionate share of total net assets of the Fund. Expenses not directly billed to a Fund are allocated proportionally among all the Funds in the Trust, and, if applicable, Touchstone Investment Trust, Touchstone Strategic Trust, Touchstone Variable Series Trust, Touchstone Institutional Funds Trust and Touchstone Tax-Free Trust (collectively with the Trust, “Touchstone Fund Complex”), daily in relation to net assets of each Fund or another reasonable measure.
Security transactions — Security transactions are reflected for financial reporting purposes as of the trade date. Realized gains and losses on sales of portfolio securities are calculated using the identified cost basis.
Estimates — The preparation of financial statements in conformity with U.S. GAAP requires management to make estimates and assumptions that affect the reported amounts of assets and liabilities and disclosure of contingent assets and liabilities at the date of the financial statements and the reported amounts of income and expenses during the reporting period. Actual results could differ from those estimates.
3. Investment Transactions
Investment transactions (excluding short-term investments and U.S. Government securities) were as follows for the year ended September 30, 2014:
| Emerging | Global | International | Merger | |||||||||||||||||
| Arbitrage | Markets Equity | Real Estate | Fixed Income | Arbitrage | ||||||||||||||||
| Fund | Fund | Fund | Fund | Fund | ||||||||||||||||
| Purchases of investment securities | $ | 615,475,548 | $ | 134,479,935 | $ | 7,726,511 | $ | 30,927,545 | $ | 1,451,559,846 | ||||||||||
| Proceeds from sales and maturities | $ | 429,734,941 | $ | 160,348,741 | $ | 8,997,491 | $ | 25,058,539 | $ | 1,689,837,076 | ||||||||||
| Mid Cap | Premium Yield | Sands Capital | ||||||||||||||
| Mid Cap | Value | Equity | Select Growth | |||||||||||||
| Fund | Fund* | Fund | Fund | |||||||||||||
| Purchases of investment securities | $ | 165,532,237 | $ | 215,498,664 | $ | 61,026,191 | $ | 1,765,808,213 | ||||||||
| Proceeds from sales and maturities | $ | 107,821,342 | $ | 194,385,348 | $ | 41,221,354 | $ | 1,816,899,486 | ||||||||
| Small Cap | Small Cap | Total Return | Ultra Short | |||||||||||||
| Core | Value | Bond | Duration Fixed | |||||||||||||
| Fund | Fund** | Fund | Income Fund | |||||||||||||
| Purchases of investment securities | $ | 143,943,571 | $ | 59,993,080 | $ | 6,047,853 | $ | 813,722,084 | ||||||||
| Proceeds from sales and maturities | $ | 229,093,426 | $ | 64,221,889 | $ | 25,023,768 | $ | 899,500,332 | ||||||||
* The cost of purchases and proceeds from sales on the Mid Cap Value Fund excludes the purchases and sales of the Acquired Fund (See Note 11). If these transactions were included, purchases and sales would have been higher.
** The Small Cap Value Fund had a subscription-in-kind on March 21, 2014, which resulted in a subscription into the Fund of $24,800,570 and is excluded from the Purchases of Investment Securities. The subscription was comprised of securities and cash in the amounts of $24,652,457 and $148,113, respectively. The cost of purchases and proceeds from sales on the Small Cap Value Fund excludes the purchases and sales of the Acquired Fund (See Note 11). If these transactions were included, purchases and sales would have been higher.
For the year ended September 30, 2014, purchases and proceeds from sales and maturities in U.S. Government Securities were $0 and $214,563 for the International Fixed Income Fund, $1,083,949 and $12,333,922 for
| 165 |
Notes to Financial Statements (Continued)
the Total Return Bond Fund and $71,746,498 and $95,470,294 for the Ultra Short Duration Fixed Income Fund, respectively.
4. Transactions with Affiliates and Other Related Parties
Certain officers of the Trust are also officers of Touchstone Advisors, Inc. (the “Advisor”), Touchstone Securities, Inc. (the “Underwriter”), or BNY Mellon Investment Servicing (U.S.) Inc. (“BNY Mellon”), the Sub-Administrator and Transfer Agent to the Funds. Such officers receive no compensation from the Trust. The Advisor and the Underwriter are each wholly-owned, indirect subsidiaries of Western & Southern Financial Group, Inc. (“Western & Southern”).
On behalf of the Funds, the Advisor pays each Independent Trustee a quarterly retainer plus additional retainers to the Lead Independent Trustee and the chairs of each standing committee. Interested Trustees do not receive compensation from the Funds. Each Independent Trustee will also receive compensation for each board meeting and committee meeting attended. Each standing committee chair will receive additional compensation for each committee meeting that he or she oversees. The Advisor is reimbursed by the Funds for the Independent Trustees’ compensation and out-of-pocket expenses relating to their services. The Funds accrued Trustee-related expenses of $157,247 for the year ended September 30, 2014.
MANAGEMENT & EXPENSE LIMITATION AGREEMENTS
The Advisor provides general investment supervisory services for the Funds, under terms of an advisory agreement (the “Advisory Agreement”). Under the Advisory Agreement, each Fund pays the Advisor a fee, which is computed and accrued daily and paid monthly, at an annual rate based on average daily net assets of each Fund as shown in the table below.
| Arbitrage Fund | 1.05% on the first $500 million |
| 1.00% on the next $500 million | |
| 0.95% of such assets in excess of $1 billion | |
| Emerging Markets Equity Fund | 1.05% on the first $200 million |
| 1.00% on the next $200 million | |
| 0.90% of such assets in excess of $400 million | |
| Global Real Estate Fund | 0.80% |
| International Fixed Income Fund | 0.55% on the first $100 million |
| 0.50% on the next $150 million | |
| 0.45% of such assets in excess of $250 million | |
| Merger Arbitrage Fund | 1.05% |
| Mid Cap Fund | 0.80% on the first $500 million |
| 0.75% on the next $500 million | |
| 0.70% of such assets in excess of $1 billion |
| 166 |
Notes to Financial Statements (Continued)
| Mid Cap Value Fund | 0.85% on the first $100 million |
| 0.80% on the next $300 million | |
| 0.75% of such assets in excess of $400 million | |
| Premium Yield Equity Fund | 0.70% on the first $100 million |
| 0.65% of such assets in excess of $100 million | |
| Sands Capital Select Growth Fund | 0.85% on the first $1 billion |
| 0.80% on the next $500 million | |
| 0.75% on the next $500 million | |
| 0.70% of such assets in excess of $2 billion | |
| Small Cap Core Fund | 0.85% |
| Small Cap Value Fund | 0.90% |
| Total Return Bond Fund | 0.35% |
| Ultra Short Duration Fixed Income Fund | 0.25% |
In addition to the base advisory fee shown above for the Sands Capital Select Growth Fund, a performance fee adjustment will be added to or subtracted from the base advisory fee depending on the performance of the Fund in relation to the investment performance of the Fund’s benchmark index, for the preceding twelve month period, as follows:
| Annual | Highest / Lowest | |||||||||||||
| Benchmark | Benchmark | Adjustment | Possible Advisory | |||||||||||
| Index | Threshold | Rate | Fee | |||||||||||
| Sands Capital Select Growth Fund | Russell 1000 Growth Index | +/-2.50% | +/-0.15% | 1.00% / 0.55% |
For the year ended September 30, 2014, the Advisor’s base fee was increased by $4,345,643 as a result of the performance fee adjustment.
The Advisor has entered into investment sub-advisory agreements with the following parties (each, a “Sub-Advisor”):
| AGF Investments America, Inc. | GAM International Management Limited |
| Emerging Markets Equity Fund | International Fixed Income Fund |
| Forum Securities Limited | Lee Munder Capital Group LLC |
| Global Real Estate Fund | Mid Cap Value Fund |
| DePrince, Race & Zollo, Inc. | The London Company |
| Small Cap Value Fund | Small Cap Core Fund |
| Mid Cap Fund | |
| EARNEST Partners LLC | Longfellow Investment Management Co. |
| Total Return Bond Fund | Arbitrage Fund |
| Merger Arbitrage Fund | |
| Fort Washington Investment Advisors, Inc.* | Miller/Howard Investments, Inc. |
| Ultra Short Duration Fixed Income Fund | Premium Yield Equity Fund |
| Sands Capital Management, LLC | |
| Sands Capital Select Growth Fund |
*Affiliate of the Advisor and wholly-owned indirect subsidiary of Western & Southern.
The Advisor, not the Funds, pays sub-advisory fees to each Sub-Advisor.
| 167 |
Notes to Financial Statements (Continued)
The Advisor entered into an expense limitation agreement (the “Expense Limitation Agreement”) to contractually limit operating expenses of the Funds, excluding: dividend and interest expenses on short sales; interest; taxes; brokerage commissions; other expenditures which are capitalized in accordance with GAAP; the cost of “Acquired Fund Fees and Expenses”, if any; and other extraordinary expenses not incurred in the ordinary course of business. The maximum operating expense limit in any year with respect to the Funds is based on a percentage of the average daily net assets of the Funds. The Advisor has agreed to separately waive class-level expenses, advisory fees administration fees, and to reimburse expenses in order to maintain the following expense limitations for the Funds:
| Institutional | ||||||||||||||||||||
| Class A | Class C | Class Y | Class Z | Class | ||||||||||||||||
| Arbitrage Fund | 1.68 | % | 2.43 | % | 1.43 | % | — | 1.28 | % | |||||||||||
| Emerging Markets Equity Fund | 1.69 | % | 2.44 | % | 1.44 | % | — | 1.29 | % | |||||||||||
| Global Real Estate Fund | 1.39 | % | 2.14 | % | 1.14 | % | — | 0.99 | % | |||||||||||
| International Fixed Income Fund | 1.09 | % | 1.84 | % | 0.84 | % | — | 0.69 | % | |||||||||||
| Merger Arbitrage Fund | 1.68 | % | 2.43 | % | 1.43 | % | — | 1.28 | % | |||||||||||
| Mid Cap Fund | 1.24 | % | 1.99 | % | 0.99 | % | 1.24 | % | 0.92 | % | ||||||||||
| Mid Cap Value Fund | 1.29 | % | 2.04 | % | 1.04 | % | — | 0.89 | % | |||||||||||
| Premium Yield Equity Fund | 1.20 | % | 1.95 | % | 0.95 | % | — | — | ||||||||||||
| Small Cap Core Fund | 1.38 | % | 2.13 | % | 1.13 | % | — | 1.05 | % | |||||||||||
| Small Cap Value Fund | 1.38 | % | 2.13 | % | 1.13 | % | — | 0.98 | % | |||||||||||
| Total Return Bond Fund | 0.90 | % | 1.65 | % | 0.65 | % | — | 0.50 | % | |||||||||||
| Ultra Short Duration Fixed Income Fund | 0.69 | % | 1.19 | % | 0.44 | % | 0.69 | % | 0.39 | % | ||||||||||
These expense limitations will remain in effect for all Funds through at least January 29, 2015 except for Mid Cap Value Fund and Small Cap Value Fund, which will remain in effect until at least March 23, 2015.
Prior to January 29, 2014 for the Mid Cap Fund and Small Cap Core Fund, and prior to November 29, 2013 for the Small Cap Value Fund, the expense limitations were as follows:
| Institutional | ||||||||||||||||||||
| Class A | Class C | Class Y | Class Z | Class | ||||||||||||||||
| Mid Cap Fund | 1.21 | % | 1.96 | % | 0.96 | % | 1.21 | % | 0.89 | % | ||||||||||
| Small Cap Core | 1.34 | % | 2.09 | % | 1.09 | % | — | 0.94 | % | |||||||||||
| Small Cap Value Fund | 1.43 | % | 2.18 | % | 1.18 | % | — | 1.03 | % | |||||||||||
The Advisor has agreed to limit certain Funds’ other operating expenses (“Other Expenses”) to the following levels which will remain in effect though at least January 29, 2015.
| Class A | Class C | Class Y | Class Z | |||||||||||||
| Sands Capital Select Growth Fund | 0.25 | % | 0.25 | % | 0.25 | % | 0.25 | % | ||||||||
| 168 |
Notes to Financial Statements (Continued)
During the year ended September 30, 2014, the Advisor or its affiliates waived investment advisory fees and administration fees or reimbursed expenses, including distribution fees of the Funds as follows:
| Investment | Other | |||||||||||||||
| Advisory | Administration | Operating | ||||||||||||||
| Fees | Fees | Expenses | ||||||||||||||
| Waived | Waived | Reimbursed | Total | |||||||||||||
| Arbitrage Fund | $ | — | $ | — | $ | 2,497 | $ | 2,497 | ||||||||
| Emerging Markets Equity Fund | — | 9,285 | 95,388 | 104,673 | ||||||||||||
| Global Real Estate Fund | 70,058 | 23,494 | 37,738 | 131,290 | ||||||||||||
| International Fixed Income Fund | 29,485 | 55,727 | 47,974 | 133,186 | ||||||||||||
| Mid Cap Fund | — | 305,678 | 162,027 | 467,705 | ||||||||||||
| Mid Cap Value Fund | — | 301,330 | 58,086 | 359,416 | ||||||||||||
| Premium Yield Equity Fund | — | — | 82,007 | 82,007 | ||||||||||||
| Sands Capital Select Growth Fund | — | — | 1,033,092 | 1,033,092 | ||||||||||||
| Small Cap Core Fund | — | 243,573 | 49,509 | 293,082 | ||||||||||||
| Small Cap Value Fund | 21,575 | 99,095 | 60,830 | 181,500 | ||||||||||||
| Total Return Bond Fund | — | 104,694 | 72,268 | 176,962 | ||||||||||||
| Ultra Short Duration Fixed Income Fund | — | 352,488 | 156,912 | 509,400 | ||||||||||||
Under the terms of the Expense Limitations Agreement, the Advisor is entitled to recover, subject to approval by the Funds’ Board, such amounts waived or reimbursed for a period of up to three years from the year in which the Advisor reduced its compensation or assumed expenses for the Funds. No recoupment will occur unless a Fund’s operating expenses are below the expense limitation amount in effect at the time of the waiver or reimbursement.
As of September 30, 2014, the Advisor may seek recoupment of previously waived fees and reimbursed expenses as follows:
| Expiration | Expiration | Expiration | ||||||||||||||
| September | September | September | ||||||||||||||
| 30, | 30, | 30, | ||||||||||||||
| Fund | 2015 | 2016 | 2017 | Total | ||||||||||||
| Arbitrage Fund | $ | — | $ | — | $ | 1,355 | $ | 1,355 | ||||||||
| Emerging Markets Equity Fund | 97,952 | — | 67,176 | 165,128 | ||||||||||||
| Global Real Estate Fund | 67,941 | 143,253 | 125,217 | 336,411 | ||||||||||||
| International Fixed Income Fund | 34,638 | 131,781 | 128,401 | 294,820 | ||||||||||||
| Mid Cap Fund | 90,758 | 256,834 | 380,034 | 727,626 | ||||||||||||
| Mid Cap Value Fund | 113,957 | 263,536 | 328,349 | 705,842 | ||||||||||||
| Premium Yield Equity Fund | 32,094 | 45,482 | 10,470 | 88,046 | ||||||||||||
| Sands Capital Select Growth Fund | 375,482 | 1,634,944 | 1,033,092 | 3,043,518 | ||||||||||||
| Small Cap Core Fund | 313,523 | 789,388 | 243,573 | 1,346,484 | ||||||||||||
| Small Cap Value Fund | 87,517 | 130,886 | 148,793 | 367,196 | ||||||||||||
| Total Return Bond Fund | $ | 126,307 | $ | 163,756 | $ | 143,600 | $ | 433,663 | ||||||||
| Ultra Short Duration Fixed Income Fund | 300,036 | 470,719 | 456,994 | 1,227,749 | ||||||||||||
For the year ended September 30, 2014, the Advisor recouped previously waived fees or reimbursed expenses from the Merger Arbitrage Fund, Mid Cap Value Fund and Sands Capital Select Growth Fund of $20,195, $26,887 and $889,047, respectively.
ADMINISTRATION AGREEMENT
The Advisor entered into an Administration Agreement with the Trust, whereby the Advisor is responsible for: supplying executive and regulatory compliance services; supervising the preparation of tax returns; coordinating the preparation of reports to shareholders and reports to, and filings with, the Securities and Exchange Commission (the “SEC”) and state securities authorities, as well as materials for meetings of the Board; calculating the daily
| 169 |
Notes to Financial Statements (Continued)
NAV per share; and maintaining the financial books and records of each Fund. For its services, the Advisor receives an annual fee of 0.20% on the first $6 billion of the aggregate average daily net assets of the Touchstone Fund Complex (excluding Touchstone Institutional Money Market Fund, Touchstone Institutional Funds Trust, and Touchstone Variable Series Trust); 0.16% of the next $4 billion of aggregate average daily net assets; and 0.12% of the aggregate average daily net assets over $10 billion. The fee is allocated among the funds of the Touchstone Fund Complex (excluding Touchstone Institutional Money Market Fund, Touchstone Institutional Funds Trust, and Touchstone Variable Series Trust) on the basis of relative daily net assets.
The Advisor has engaged BNY Mellon as the Sub-Administrator to the Trust. BNY Mellon provides administrative and accounting services to the Trust and is compensated directly by the Advisor, not the Trust.
TRANSFER AGENT AGREEMENT
Under the terms of the Transfer Agent Agreement between the Trust and BNY Mellon, BNY Mellon maintains the records of each shareholder’s account, answers shareholders’ inquiries concerning their accounts, processes purchases and redemptions of each Fund’s shares, acts as dividend and distribution disbursing agent, and performs other shareholder service functions. For these services, BNY Mellon receives a monthly fee per shareholder account from each Fund. In addition, each Fund pays out-of-pocket expenses incurred by BNY Mellon, including, but not limited to, postage and supplies.
The Funds may reimburse the Advisor for fees paid to intermediaries such as banks, broker-dealers, financial advisors or other financial institutions for sub-transfer agency, sub-administration and other services provided to investors whose shares of record are held in omnibus, other group accounts, retirement plans or accounts traded through registered securities clearing agents. These fees may vary based on, for example, the nature of services provided, but generally range up to 0.15% of the assets of the class serviced or maintained by the intermediary or up to $17 per sub-account maintained by the intermediary.The Funds currently only reimburse the Advisor up to $17 per sub-account maintained by the intermediary.
PLANS OF DISTRIBUTION AND SHAREHOLDERS SERVICING FEE ARRANGEMENTS
The Trust has adopted distribution plans pursuant to Rule 12b-1 under the 1940 Act for each class of shares it offers that is subject to 12b-1 distribution fees. The plans allow each Fund to pay distribution and other fees for the sale and distribution of its shares and for services provided to shareholders. The fees charged to the Funds are limited to the actual expenses incurred. Under the Class A plan, each Fund offering Class A shares pays an annual fee of up to 0.25% of average daily net assets that are attributable to Class A shares. Under the Class C plan, each Fund (except the Ultra Short Duration Fixed Income Fund) pays an annual fee of up to 1.00% of average daily net assets that are attributable to Class C shares (of which up to 0.75% is a distribution fee and up to 0.25% is a shareholder servicing fee). The Ultra Short Duration Fixed Income Fund intends to limit the amount of the 12b-1 fees for Class C shares to 0.75% of average daily net assets for at least one year from January 30, 2014. Under the Class Z plan, each Fund offering Class Z shares pays an annual shareholder servicing fee of up to 0.25% of average daily net assets that are attributed to Class Z shares.
| 170 |
Notes to Financial Statements (Continued)
UNDERWRITING AGREEMENT
The Underwriter is the Funds’ principal underwriter and, as such, acts as exclusive agent for distribution of the Funds’ shares. Under the terms of the Underwriting Agreement between the Trust and the Underwriter, the Underwriter earned the following from underwriting and broker commissions on the sale of Class A shares of the Funds listed below during the year ended September 30, 2014:
| Fund | Amount | |||
| Arbitrage Fund | $ | 193,380 | ||
| Emerging Markets Equity Fund | 1,760 | |||
| Global Real Estate Fund | 2,759 | |||
| International Fixed Income Fund | 61 | |||
| Merger Arbitrage Fund | 1,591 | |||
| Mid Cap Fund | 31,296 | |||
| Mid Cap Value Fund | 9,109 | |||
| Premium Yield Equity Fund | 19,001 | |||
| Sands Capital Select Growth Fund | 37,402 | |||
| Small Cap Core Fund | 2,338 | |||
| Small Cap Value Fund | 1,286 | |||
| Total Return Bond Fund | 1,394 | |||
| Ultra Short Duration Fixed Income Fund | 653 | |||
In addition, the Underwriter collected CDSC on the redemption of Class Y shares for the Merger Arbitrage Fund of $10 and collected CDSC on the redemption of Class C shares of the Funds listed below during the year ended September 30, 2014:
| Fund | Amount | |||
| Arbitrage Fund | $ | 758 | ||
| Emerging Markets Equity Fund | 101 | |||
| Merger Arbitrage Fund | 1,249 | |||
| Mid Cap Fund | 2,601 | |||
| Mid Cap Value Fund | 95 | |||
| Premium Yield Equity Fund | 1,388 | |||
| Sands Capital Select Growth Fund | 3,974 | |||
| Small Cap Core Fund | 129 | |||
| Small Cap Value Fund | 400 | |||
| Total Return Bond Fund | 42 | |||
| Ultra Short Duration Fixed Income Fund | 13 | |||
AFFILIATED INVESTMENTS
Each Fund may invest in the Touchstone Institutional Money Market Fund, subject to compliance with several conditions set forth in an exemptive order received by the Trust from the SEC. To the extent that the Funds are invested in the Touchstone Institutional Money Market Fund, the Advisor and Administrator will be paid additional fees from the Touchstone Institutional Money Market Fund that will not be waived or reimbursed.
| 171 |
Notes to Financial Statements (Continued)
A summary of each Fund’s investment, as applicable, in the Touchstone Institutional Money Market Fund for the year ended September 30, 2014, is as follows:
| Share Activity | ||||||||||||||||||||||||
| Balance | Balance | Value | ||||||||||||||||||||||
| 09/30/13 | Purchases | Sales | 09/30/14 | Dividends | 09/30/14 | |||||||||||||||||||
| Arbitrage Fund | — | 439,838,331 | (425,540,820 | ) | 14,297,511 | $ | 2,230 | $ | 14,297,511 | |||||||||||||||
| Emerging Markets Equity Fund | 37 | 131,468,699 | (129,065,218 | ) | 2,403,518 | 1,027 | 2,403,518 | |||||||||||||||||
| Global Real Estate Fund | 284,605 | 5,009,200 | (5,183,840 | ) | 109,965 | 8 | 109,965 | |||||||||||||||||
| International Fixed Income Fund | 2,884,332 | 22,532,358 | (22,746,066 | ) | 2,670,624 | 298 | 2,670,624 | |||||||||||||||||
| Merger Arbitrage Fund | 49,682,768 | 1,009,037,354 | (1,024,689,091 | ) | 34,031,031 | 10,658 | 34,031,031 | |||||||||||||||||
| Mid Cap Fund | 6,589,029 | 137,819,973 | (139,506,574 | ) | 4,902,428 | 621 | 4,902,428 | |||||||||||||||||
| Mid Cap Value Fund | 1,574,222 | 227,987,894 | (225,049,922 | ) | 4,512,194 | 469 | 4,512,194 | |||||||||||||||||
| Premium Yield Equity Fund | 1,806,138 | 79,860,011 | (77,745,707 | ) | 3,920,442 | 414 | 3,920,442 | |||||||||||||||||
| Sands Capital Select Growth Fund | 107,983,851 | 1,558,416,687 | (1,432,065,317 | ) | 234,335,221 | 12,634 | 234,335,221 | |||||||||||||||||
| Small Cap Core Fund | 10,153,738 | 190,451,997 | (190,317,114 | ) | 10,288,621 | 1,090 | 10,288,621 | |||||||||||||||||
| Small Cap Value Fund | 578,313 | 28,050,875 | (28,502,460 | ) | 126,728 | 131 | 126,728 | |||||||||||||||||
| Total Return Bond Fund | 43,862 | 39,963,737 | (36,719,461 | ) | 3,288,138 | 219 | 3,288,138 | |||||||||||||||||
| Ultra Short Duration Fixed Income Fund | 22,462,434 | 1,330,745,808 | (1,352,631,627 | ) | 576,615 | 3,280 | 576,615 | |||||||||||||||||
5. Federal Tax Information
Federal income tax — It is each Fund’s policy to continue to comply with the special provisions of the Internal Revenue Code applicable to regulated investment companies. As provided therein, in any fiscal year in which a Fund so qualifies and distributes at least 90% of its investment company taxable income, the Fund (but not the shareholders) will be relieved of federal income tax on the income distributed. It is each Fund’s policy to distribute all of its taxable income and accordingly, no provision for income taxes has been made.
In order to avoid imposition of the excise tax applicable to regulated investment companies, it is also each Fund’s intention to declare and pay as dividends in each calendar year at least 98% of its investment company taxable income (earned during the calendar year) and 98.2% of its net realized capital gains (earned during the twelve months ending October 31) plus undistributed amounts from prior years.
The tax character of distributions paid for the years ended September 30, 2014 and 2013 was as follows:
| Emerging Markets | Global Real | International Fixed | ||||||||||||||||||||||
| Equity Fund | Estate Fund | Income Fund | ||||||||||||||||||||||
| Year Ended | Year Ended | Year Ended | Year Ended | Year Ended | Year Ended | |||||||||||||||||||
| September 30, | September 30, | September 30, | September 30, | September 30, | September 30, | |||||||||||||||||||
| 2014 | 2013 | 2014 | 2013 | 2014 | 2013 | |||||||||||||||||||
| From ordinary income | $ | 4,192,683 | $ | 2,155,832 | $ | 2,399,277 | $ | 1,130,389 | $ | 309,325 | $ | 160,195 | ||||||||||||
| From long-term capital gains | — | — | 680,745 | 130,257 | 336,520 | 57,565 | ||||||||||||||||||
| $ | 4,192,683 | $ | 2,155,832 | $ | 3,080,022 | $ | 1,260,646 | $ | 645,845 | $ | 217,760 | |||||||||||||
| Merger Arbitrage | Mid Cap | Mid Cap | ||||||||||||||||||||||
| Fund | Fund | Value Fund | ||||||||||||||||||||||
| Year Ended | Year Ended | Year Ended | Year Ended | Year Ended | Year Ended | |||||||||||||||||||
| September 30, | September 30, | September 30, | September 30, | September 30, | September 30, | |||||||||||||||||||
| 2014 | 2013 | 2014 | 2013 | 2014 | 2013 | |||||||||||||||||||
| From ordinary income | $ | 24,102,036 | $ | 3,990,135 | $ | 747,154 | $ | 1,224,384 | $ | 6,818,543 | $ | 1,756,707 | ||||||||||||
| From long-term capital gains | — | 36 | — | — | 8,876,667 | 789,040 | ||||||||||||||||||
| $ | 24,102,036 | $ | 3,990,171 | $ | 747,154 | $ | 1,224,384 | $ | 15,695,210 | $ | 2,545,747 | |||||||||||||
| 172 |
Notes to Financial Statements (Continued)
| Premium Yield | Sands Capital | Small Cap | ||||||||||||||||||||||
| Equity Fund | Select Growth Fund | Core Fund | ||||||||||||||||||||||
| Year Ended | Year Ended | Year Ended | Year Ended | Year Ended | Year Ended | |||||||||||||||||||
| September 30, | September 30, | September 30, | September 30, | September 30, | September 30, | |||||||||||||||||||
| 2014 | 2013 | 2014 | 2013 | 2014 | 2013 | |||||||||||||||||||
| From ordinary income | $ | 6,872,067 | $ | 4,010,251 | $ | 13,643,843 | $ | — | $ | 14,861,071 | $ | 7,220,554 | ||||||||||||
| From long-term capital gains | — | — | 28,752,022 | — | 12,211,364 | 4,126,641 | ||||||||||||||||||
| $ | 6,872,067 | $ | 4,010,251 | $ | 42,395,865 | $ | — | $ | 27,072,435 | $ | 11,347,195 | |||||||||||||
| Small Cap | Total Return | Ultra Short Duration | ||||||||||||||||||||||
| Value Fund | Bond Fund | Fixed Income Fund | ||||||||||||||||||||||
| Year Ended | Year Ended | Year Ended | Year Ended | Year Ended | Year Ended | |||||||||||||||||||
| September 30, | September 30, | September 30, | September 30, | September 30, | September 30, | |||||||||||||||||||
| 2014 | 2013 | 2014 | 2013 | 2014 | 2013 | |||||||||||||||||||
| From ordinary income | $ | 953,920 | $ | 719,931 | $ | 4,871,768 | $ | 5,144,219 | $ | 10,124,310 | $ | 10,888,038 | ||||||||||||
| From long-term capital gains | — | — | — | 107,772 | — | — | ||||||||||||||||||
| $ | 953,920 | $ | 719,931 | $ | 4,871,768 | $ | 5,251,991 | $ | 10,124,310 | $ | 10,888,038 | |||||||||||||
The following information is computed on a tax basis for each item as of September 30, 2014:
| Emerging | Global | International | ||||||||||||||||||
| Arbitrage | Markets Equity | Real Estate | Fixed Income | Merger | ||||||||||||||||
| Fund | Fund | Fund | Fund | Arbitrage Fund | ||||||||||||||||
| Tax cost of portfolio investments | $ | 201,955,278 | $ | 352,351,829 | $ | 15,381,664 | $ | 36,165,440 | $ | 452,653,776 | ||||||||||
| Gross unrealized appreciation | 6,565,443 | 31,048,216 | 652,547 | 489,104 | 15,795,364 | |||||||||||||||
| Gross unrealized depreciation | (3,892,587 | ) | (33,084,844 | ) | (1,109,690 | ) | (2,071,895 | ) | (13,530,151 | ) | ||||||||||
| Net unrealized appreciation (depreciation) on investments | 2,672,856 | (2,036,628 | ) | (457,143 | ) | (1,582,791 | ) | 2,265,213 | ||||||||||||
| Net unrealized appreciation (depreciation) on written options | (130,020 | ) | — | — | — | (125,496 | ) | |||||||||||||
| Net unrealized appreciation (depreciation) on securities sold short | (4,704,096 | ) | — | — | — | (10,294,846 | ) | |||||||||||||
| Net unrealized appreciation (depreciation) on foreign currency transactions | — | (34,790 | ) | (616 | ) | (94,168 | ) | — | ||||||||||||
| Accumulated capital losses | — | (31,273,805 | ) | (206,567 | ) | — | — | |||||||||||||
| Qualified late-year losses | (430,199 | ) | — | — | — | (2,425,764 | ) | |||||||||||||
| Other temporary differences | — | (4,627 | ) | — | (269,200 | ) | — | |||||||||||||
| Undistributed ordinary income | — | 3,093,372 | 206,174 | 799,400 | — | |||||||||||||||
| Undistributed capital gains | 288,416 | — | — | 787,289 | 1,565,830 | |||||||||||||||
| Accumulated earnings (deficit) | $ | (2,303,043 | ) | $ | (30,256,478 | ) | $ | (458,152 | ) | $ | (359,470 | ) | $ | (9,015,063 | ) | |||||
| Premium | Sands Capital | |||||||||||||||
| Mid Cap Value | Yield Equity | Select Growth | ||||||||||||||
| Mid Cap Fund | Fund | Fund | Fund | |||||||||||||
| Tax cost of portfolio investments | $ | 413,184,803 | $ | 340,595,074 | $ | 153,843,821 | $ | 4,249,861,996 | ||||||||
| Gross unrealized appreciation | 71,795,937 | 37,297,708 | 35,051,711 | 2,248,105,314 | ||||||||||||
| Gross unrealized depreciation | (9,921,160 | ) | (4,659,134 | ) | (5,720,860 | ) | (77,262,851 | ) | ||||||||
| Net unrealized appreciation (depreciation) on investments | 61,874,777 | 32,638,574 | 29,330,851 | 2,170,842,463 | ||||||||||||
| Accumulated capital losses | (136,441,960 | ) | — | — | — | |||||||||||
| Qualified late-year losses | — | — | — | (10,152,161 | ) | |||||||||||
| Undistributed ordinary income | 362,459 | 8,689,701 | 35,689 | — | ||||||||||||
| Undistributed capital gains | — | 4,874,115 | 8,856,906 | 295,516,180 | ||||||||||||
| Accumulated earnings (deficit) | $ | (74,204,724 | ) | $ | 46,202,390 | $ | 38,223,446 | $ | 2,456,206,482 | |||||||
| 173 |
Notes to Financial Statements (Continued)
| Ultra Short | ||||||||||||||||
| Total | Duration | |||||||||||||||
| Small Cap Core | Small Cap Value | Return Bond | Fixed Income | |||||||||||||
| Fund | Fund | Fund | Fund | |||||||||||||
| Tax cost of portfolio investments | $ | 673,838,091 | $ | 84,288,759 | $ | 140,096,095 | $ | 732,931,226 | ||||||||
| Gross unrealized appreciation | 204,173,840 | 1,954,687 | 2,653,351 | 2,041,007 | ||||||||||||
| Gross unrealized depreciation | (17,033,365 | ) | (5,807,472 | ) | (1,344,977 | ) | (3,332,605 | ) | ||||||||
| Net unrealized appreciation (depreciation) on investments | 187,140,475 | (3,852,785 | ) | 1,308,374 | (1,291,598 | ) | ||||||||||
| Accumulated capital losses | — | (5,851,728 | ) | (1,099,002 | ) | (21,782,359 | ) | |||||||||
| Qualified late-year losses | — | — | — | — | ||||||||||||
| Undistributed ordinary income | 4,376,510 | 16,837 | 16,110 | 838,377 | ||||||||||||
| Undistributed capital gains | 51,725,500 | 2,812,169 | — | — | ||||||||||||
| Other temporary differences | — | — | — | (151,053 | ) | |||||||||||
| Accumulated earnings (deficit) | $ | 243,242,485 | $ | (6,875,507 | ) | $ | 225,482 | $ | (22,386,633 | ) | ||||||
The difference between the tax cost of portfolio investments and the financial statement cost is primarily due to wash sale loss deferrals, investments in passive foreign investment company (“PFIC”) adjustments, regulated investment companies, and real estate investment trusts.
As of September 30, 2014, the Funds had the following capital loss carryforwards for federal income tax purposes:
| Short Term Expiring On | No Expiration | No Expiration | ||||||||||||||||||||||||||||||
| 2015 | 2016 | 2017 | 2018 | 2019 | Short Term* | Long Term* | Total | |||||||||||||||||||||||||
| Emerging Markets Equity Fund | $ | — | $ | — | $ | — | $ | — | $ | — | $ | 5,505,800 | $ | 25,768,005 | $ | 31,273,805 | ||||||||||||||||
| Global Real Estate Fund | — | — | — | — | — | 206,567 | — | 206,567 | ||||||||||||||||||||||||
| Mid Cap Fund | — | — | 65,641,168 | 70,800,792 | — | — | — | 136,441,960 | ||||||||||||||||||||||||
| Small Cap Value Fund** | — | — | — | 5,851,728 | — | — | — | 5,851,728 | ||||||||||||||||||||||||
| Total Return Bond Fund | — | — | — | — | — | 348,708 | 750,294 | 1,099,002 | ||||||||||||||||||||||||
| Ultra Short Duration Fixed Income Fund** | 460,138 | 1,769,310 | 3,231,117 | 3,336,624 | 933,830 | 5,610,590 | 6,440,750 | 21,782,359 | ||||||||||||||||||||||||
* The Regulated Investment Company Modernization Act of 2010 (the “Act”) was enacted on December 22, 2010. The Act made changes to several tax rules impacting the Funds. The provisions of the Act were effective for the Funds’ fiscal year ending September 30, 2012. Although the Act provides several benefits, including the unlimited carryover of future capital losses, there may be a greater likelihood that all or a portion of each Fund’s pre-enactment capital loss carryovers may expire without being utilized due to the fact that post-enactment capital losses must be utilized before pre-enactment capital loss carryovers may be utilized. Under the Act, new capital losses may now be carried forward indefinitely, and retain the character of the original loss as compared with pre-enactment law, where capital losses could be carried forward for up to eight years, and carried forward as short-term capital losses, irrespective of the character of the original loss.
** May be subject to limitation.
The capital loss carryforwards may be utilized in future years to offset net realized capital gains, if any, prior to distributing such gains to shareholders.
The following Funds had capital losses expiring in the current year as follows:
| Fund | Amount | |||
| Small Cap Value Fund | $ | 12,232,585 | ||
| Ultra Short Duration Fixed Income Fund | 1,223,321 | |||
| 174 |
Notes to Financial Statements (Continued)
During the year ended September 30, 2014, the following Funds utilized capital loss carryforwards:
| Fund | Amount | |||
| Mid Cap Fund | $ | 9,883,013 | ||
| Mid Cap Value Fund | 1,604 | |||
| Premium Yield Equity Fund | 997,681 | |||
| Small Cap Value Fund | 3,911,536 | |||
Under current laws, certain capital losses realized after October 31 and ordinary losses realized after December 31 may be deferred (and certain ordinary losses after October and/or December 31 may be deferred) and treated as occurring on the first day of the following fiscal year. For the year ended September 30, 2014, the Funds elected to defer the following losses:
| Realized | Realized | |||||||||||
| Short-Term | Long-Term | |||||||||||
| Capital | Capital | Ordinary | ||||||||||
| Fund | Losses | Losses | Losses | |||||||||
| Arbitrage Fund | $ | — | $ | — | $ | 430,199 | ||||||
| Merger Arbitrage Fund | — | — | 2,425,764 | |||||||||
| Sands Capital Select Growth Fund | — | — | 10,152,161 | |||||||||
The Funds have analyzed their tax positions taken on federal income tax returns for all open tax years (tax years ended September 30, 2011 through 2014) and have concluded that no provision for income tax is required in their financial statements.
Certain reclassifications, the result of permanent differences between financial statement and income tax reporting requirements, have been made to the components of capital. These reclassifications have no impact on the net assets or NAV per share of the Funds and are designed to present the Funds’ capital accounts on a tax basis. The following reclassifications, which are primarily attributed to the tax treatment of net investment losses, foreign currency gains/losses, gains/losses and dividend expenses on short sales, paydown gains/losses on mortgage backed securities, gains/losses on passive foreign investment companies, gains/losses on real estate investment trusts, reclassification of distributions, expiration of prior year capital loss carryovers and carryovers of temporary differences due to mergers have been made to the following Funds for the year ended September 30, 2014:
| Accumulated | Accumulated | |||||||||||
| Paid-In | Net Investment | Net Realized | ||||||||||
| Fund | Capital | Income(Loss) | Gains(Losses) | |||||||||
| Arbitrage Fund | $ | — | $ | 878,599 | $ | (879,599 | ) | |||||
| Emerging Markets Equity Fund | — | (382,393 | ) | 382,393 | ||||||||
| Global Real Estate Fund | — | 126,428 | (126,428 | ) | ||||||||
| International Fixed Income Fund | — | (487,799 | ) | 487,799 | ||||||||
| Merger Arbitrage Fund | — | 4,046,604 | (4,046,604 | ) | ||||||||
| Mid Cap Value Fund | 315,045 | 32,611 | (347,656 | ) | ||||||||
| Premium Yield Equity Fund | (56,005 | ) | 77,214 | (21,209 | ) | |||||||
| Sands Capital Select Growth Fund | (24,531,763 | ) | 62,582,609 | (38,050,846 | ) | |||||||
| Small Cap Core Fund | — | 3,841,504 | (3,841,504 | ) | ||||||||
| Small Cap Value Fund | (12,111,155 | ) | 6,739 | 12,104,416 | ||||||||
| Total Return Bond Fund | — | 805,722 | (805,722 | ) | ||||||||
| Ultra Short Duration Fixed Income Fund | (1,223,321 | ) | 4,062,907 | (2,839,586 | ) | |||||||
6. Commitments and Contingencies
The Funds indemnify theTrust’s officers andTrustees for certain liabilities that might arise from their performance of their duties to the Funds. Additionally, in the normal course of business, the Funds enter into contracts that contain a variety of representations and warranties and which provide general indemnifications. The Funds’
| 175 |
Notes to Financial Statements (Continued)
maximum exposure under these arrangements is unknown, as this would involve future claims that may be made against the Funds. However, based on experience, the Funds expect the risk of loss to be remote.
7. Risk Associated with Foreign Investments
Some of the Funds may invest in the securities of foreign issuers. Investing in securities issued by companies whose principal business activities are outside the U.S. may involve significant risks not present in domestic investments. For example, there is generally less publicly available information about foreign companies, particularly those not subject to the disclosure and reporting requirements of the U.S. securities laws. Foreign issuers are generally not bound by uniform accounting, auditing, and financial reporting requirements and standards of practice comparable to those applicable to domestic issuers. Investments in foreign securities also involve the risk of possible adverse changes in investment or exchange control regulations, expropriation or confiscatory taxation, limitations on the removal of funds or other assets of the Fund, political or financial instability or diplomatic and other developments which could affect such investments. Foreign stock markets, while growing in volume and sophistication, are generally not as developed as those in the U.S., and securities of some foreign issuers (particularly those located in developing countries) may be less liquid and more volatile than securities of comparable U.S. companies. In general, there is less overall governmental supervision and regulation of foreign securities markets, broker-dealers, and issuers than in the U.S.
8. Risk Associated with Concentration
Certain Funds invest a high percentage of their assets in specific sectors of the market in order to achieve a potentially greater investment return. As a result, these Funds may be more susceptible to economic, political, and regulatory developments in a particular sector of the market, positive or negative, and may experience increased volatility on the Funds’ NAVs and magnified effect on the total return.
9. Risks Associated with Credit
An issuer may be unable to make timely payments of either principal or interest. This may cause the issuer’s securities to decline in value. Credit risk is particularly relevant to those Funds that invest a significant amount of their assets in junk bonds or lower-rated securities.
10. Risks Associated with Interest Rate Changes
As interest rates rise, the value of fixed-income securities a Fund owns will likely decrease. The price of debt securities is generally linked to the prevailing market interest rates. In general, when interest rates rise, the price of debt securities falls, and when interest rates fall, the price of debt securities rises. The price volatility of a debt security also depends on its maturity. Longer-term securities are generally more volatile, so the longer the average maturity or duration of these securities, the greater their price risk. Duration is a measure of the expected life, taking into account any prepayment or call features of the security, that is used to determine the price sensitivity of the security for a given change in interest rates. Specifically, duration is the change in the value of a fixed-income security that will result from a 1% change in interest rates, and generally is stated in years. For example, as a general rule a 1% rise in interest rates means a 1% fall in value for every year of duration. Maturity, on the other hand, is the date on which a fixed-income security becomes due for payment of principal. There may be less governmental intervention in the securities markets in the near future. The negative impact on fixed income securities if interest rates increase as a result could negatively impact a Fund’s net asset value.
| 176 |
Notes to Financial Statements (Continued)
11. Fund Mergers
Ultra Short Duration Fixed Income Fund:
At a meeting held on February 21, 2013, the Board of Trustees of the Trust approved an Agreement and Plan of Reorganization providing for the transfer of all assets and liabilities of the Touchstone Short Duration Fixed Income Fund to the Touchstone Ultra Short Duration Fixed Income Fund. The tax-free merger took place on May 17, 2013.
The following is a summary of shares outstanding, net assets, net asset value per share and unrealized appreciation immediately before and after the reorganization.
| Before Reorganization | After Reorganization | |||||||||||
| Touchstone | Touchstone | |||||||||||
| Touchstone | Ultra Short | Ultra Short | ||||||||||
| Short Duration | Duration Fixed | Duration Fixed | ||||||||||
| Fixed Income | Income | Income | ||||||||||
| Fund | Fund | Fund | ||||||||||
| Class A | ||||||||||||
| Shares | — | 3,063,023 | 3,063,023 | |||||||||
| Net Assets | $ | — | $ | 29,132,648 | $ | 29,132,648 | ||||||
| Net Asset Value | $ | — | $ | 9.51 | $ | 9.51 | ||||||
| Class C | ||||||||||||
| Shares | — | 1,368,854 | 1,368,854 | |||||||||
| Net Assets | $ | — | $ | 13,019,007 | $ | 13,019,007 | ||||||
| Net Asset Value | $ | — | $ | 9.51 | $ | 9.51 | ||||||
| Class Y | ||||||||||||
| Shares | 5,701,547 | (A) | 24,121,448 | 29,822,995 | ||||||||
| Net Assets | $ | 54,224,138 | $ | 229,404,605 | $ | 283,628,743 | ||||||
| Net Asset Value | $ | 9.51 | (A) | $ | 9.51 | $ | 9.51 | |||||
| Class Z | ||||||||||||
| Shares | 3,383,059 | (B) | 30,860,998 | 34,244,057 | ||||||||
| Net Assets | $ | 32,175,399 | $ | 293,510,258 | $ | 325,685,657 | ||||||
| Net Asset Value | $ | 9.51 | (B) | $ | 9.51 | $ | 9.51 | |||||
| Institutional Class | ||||||||||||
| Shares | — | 1,594,529 | 1,594,529 | |||||||||
| Net Assets | $ | — | $ | 15,157,886 | $ | 15,157,886 | ||||||
| Net Asset Value | $ | — | $ | 9.51 | $ | 9.51 | ||||||
| Fund Total | ||||||||||||
| Shares Outstanding | 8,850,001 | 61,008,852 | 70,093,458 | |||||||||
| Net Assets | $ | 86,399,537 | $ | 580,224,404 | $ | 666,623,941 | ||||||
| Unrealized Appreciation (Depreciation) | $ | 532,720 | $ | 1,038,890 | $ | 1,571,610 | ||||||
(A) Reflects a 1.0264:1 reverse stock split which occurred on the date of reorganization, May 17, 2013.
(B) Reflects a 1.0268:1 reverse stock split which occurred on the date of reorganization, May 17, 2013.
Assuming the reorganization had been completed on October 1, 2012, the Ultra Short Duration Fixed Income Fund results of operations for the year ended September 30, 2013 would have been as follows:
| Net investment income | $ | 7,043,481 | ||
| Net realized and unrealized losses on investments | (2,385,142 | ) | ||
| Net increase in net assets from operations | $ | 4,658,339 |
| 177 |
Notes to Financial Statements (Continued)
Because the combined investment portfolios have been managed as a single portfolio since the reorganization was completed, it is not practical to separate the amounts of revenue and earnings to the Ultra Short Duration Fixed Income Fund that have been included in its statement of operations since the reorganization.
Mid Cap Value Fund:
At a meeting held on November 21, 2013, the Board approved an Agreement and Plan of Reorganization providing for the transfer of all assets and liabilities of the Touchstone Mid Cap Value Opportunities Fund to the Touchstone Mid Cap Value Fund. The tax-free merger took place on March 21, 2014.
The following is a summary of shares outstanding, net assets, net asset value per share and unrealized appreciation immediately before and after the reorganization.
| Before Reorganization | After Reorganization | |||||||||||
| Touchstone | ||||||||||||
| Mid Cap Value | Touchstone | Touchstone | ||||||||||
| Opportunities | Mid Cap Value | Mid Cap Value | ||||||||||
| Fund | Fund | Fund | ||||||||||
| Class A | ||||||||||||
| Shares | 913,005 | (A) | 299,971 | 1,212,976 | ||||||||
| Net Assets | $ | 14,967,633 | $ | 4,917,666 | $ | 19,885,299 | ||||||
| Net Asset Value | $ | 16.39 | (A) | $ | 16.39 | $ | 16.39 | |||||
| Class C | ||||||||||||
| Shares | 75,102 | (B) | 59,134 | 134,236 | ||||||||
| Net Assets | $ | 1,220,480 | $ | 960,982 | $ | 2,181,462 | ||||||
| Net Asset Value | $ | 16.25 | (B) | $ | 16.25 | $ | 16.25 | |||||
| Class Y | ||||||||||||
| Shares | 6,892,271 | (C) | 1,016,962 | 7,909,233 | ||||||||
| Net Assets | $ | 113,504,503 | $ | 16,747,761 | $ | 130,252,264 | ||||||
| Net Asset Value | $ | 16.47 | (C) | $ | 16.47 | $ | 16.47 | |||||
| Institutional Class | ||||||||||||
| Shares | 1,714,774 | (D) | 6,203,932 | 7,918,706 | ||||||||
| Net Assets | $ | 28,350,276 | $ | 102,569,628 | $ | 130,919,904 | ||||||
| Net Asset Value | $ | 16.53 | (D) | $ | 16.53 | $ | 16.53 | |||||
| Fund Total | ||||||||||||
| Shares Outstanding | 18,645,593 | 7,579,999 | 17,175,151 | |||||||||
| Net Assets | $ | 158,042,892 | $ | 125,196,037 | $ | 283,238,929 | ||||||
| Unrealized Appreciation (Depreciation) | $ | 8,366,217 | $ | 27,879,439 | $ | 36,245,656 | ||||||
(A) Reflects a 0.5137:1 stock split which occurred on the date of reorganization, March 21, 2014.
(B) Reflects a 0.5117:1 stock split which occurred on the date of reorganization, March 21, 2014.
(C) Reflects a 0.5152:1 stock split which occurred on the date of reorganization, March 21, 2014.
(D) Reflects a 0.5128:1 stock split which occurred on the date of reorganization, March 21, 2014.
| 178 |
Notes to Financial Statements (Continued)
Assuming the reorganization had been completed on October 1, 2013, the Mid Cap Value Fund results of operations for the year ended September 30, 2014 would have been as follows:
| Net investment income | $ | 2,123,962 | ||
| Net realized and unrealized gains on investments | 39,656,887 | |||
| Net increase in net assets from operations | $ | 41,780,849 |
Because the combined investment portfolios have been managed as a single portfolio since the reorganization was completed, it is not practical to separate the amounts of revenue and earnings to the Mid Cap Value Fund that have been included in its statement of operations since the reorganization.
Small Cap Value Fund:
At a meeting held on November 21, 2013, the Board approved an Agreement and Plan of Reorganization providing for the transfer of all assets and liabilities of the Touchstone Small Company Value Fund to the Touchstone Small Cap Value Fund. The tax-free merger took place on March 21, 2014.
The following is a summary of shares outstanding, net assets, net asset value per share and unrealized appreciation (depreciation) immediately before and after the reorganization.
| Before Reorganization | After Reorganization | |||||||||||
| Touchstone | Touchstone | Touchstone | ||||||||||
| Small Company | Small Cap Value | Small Cap Value | ||||||||||
| Value Fund | Fund | Fund | ||||||||||
| Class A | ||||||||||||
| Shares | 100,358 | (A) | 1,405,942 | 1,506,300 | ||||||||
| Net Assets | $ | 2,549,878 | $ | 35,722,061 | $ | 38,271,939 | ||||||
| Net Asset Value | $ | 25.41 | (A) | $ | 25.41 | $ | 25.41 | |||||
| Class C | ||||||||||||
| Shares | 59,836 | (B) | 30,879 | 90,715 | ||||||||
| Net Assets | $ | 1,506,072 | $ | 777,242 | $ | 2,283,314 | ||||||
| Net Asset Value | $ | 25.17 | (B) | $ | 25.17 | $ | 25.17 | |||||
| Class Y | ||||||||||||
| Shares | 269,342 | (C) | 42,705 | 312,047 | ||||||||
| Net Assets | $ | 6,856,609 | $ | 1,087,134 | $ | 7,943,743 | ||||||
| Net Asset Value | $ | 25.46 | (C) | $ | 25.46 | $ | 25.46 | |||||
| Institutional Class | ||||||||||||
| Shares | 233,106 | (D) | 1,112,220 | 1,345,326 | ||||||||
| Net Assets | $ | 5,932,909 | $ | 28,307,741 | $ | 34,240,650 | ||||||
| Net Asset Value | $ | 25.45 | (D) | $ | 25.45 | $ | 25.45 | |||||
| Fund Total | ||||||||||||
| Shares Outstanding | 939,783 | 2,591,746 | 3,254,388 | |||||||||
| Net Assets | $ | 16,845,468 | $ | 65,894,178 | $ | 82,739,646 | ||||||
| Unrealized Appreciation (Depreciation) | $ | 2,463,630 | $ | 5,238,516 | $ | 7,702,146 | ||||||
(A) Reflects a 0.7013:1 stock split which occurred on the date of reorganization, March 21, 2014.
(B) Reflects a 0.6497:1 stock split which occurred on the date of reorganization, March 21, 2014.
(C) Reflects a 0.7129:1 stock split which occurred on the date of reorganization, March 21, 2014.
(D) Reflects a 0.7133:1 stock split which occurred on the date of reorganization, March 21, 2014.
| 179 |
Notes to Financial Statements (Continued)
Assuming this reorganization had been completed on October 1, 2013, the Small Cap Value Fund results of operations for the year ended September 30, 2014 would have been as follows:
| Net investment income | $ | 1,305,913 | ||
| Net realized and unrealized gains on investments | 4,164,012 | |||
| Net increase in net assets from operations | $ | 5,469,925 |
Because the combined investment portfolios have been managed as a single portfolio since the reorganization was completed, it is not practical to separate the amounts of revenue and earnings to the Small Cap Value Fund that have been included in its statement of operations since the reorganization.
12. Litigation
In January 2012, the Old Mutual Mid-Cap Fund (which reorganized into the TS&W Mid-Cap Value Fund in March 2009, the Touchstone Mid Cap Value Opportunities Fund in April 2012 and the Touchstone Mid Cap Value Fund in March 2014) was served with a summons and complaint in an action brought by Edward S.Weisfelner, asTrustee of the LB CreditorTrust, in the case captioned Weisfelner v. Fund 1(U.S. Bankr. S.D.N.Y. Adv. Pro. No. 10-4609) (the “Action”). The Action alleges that, under state law, all payments made to shareholders in the December 2007 leveraged buyout of Lyondell Chemical Company were made, by means of intentional and constructive fraudulent transfer and seeks to recover all those payments. The amount sought to be disgorged is $3,784,800, which is what the Fund received in payments in connection with the leveraged buyout. The Fund (along with thousands of other defendants) has filed a joinder to the currently pending motion to dismiss and awaits the court’s ruling on that motion. The path the litigation will follow (including whether it will proceed at all) depends on the outcome of that ruling; however, it is uncertain when that ruling will come down. At this nascent stage of the litigation, it is not possible to assess the likely outcome. The Fund is currently assessing the case and has not yet determined the potential effect, if any, on its net asset value.
13. Subsequent Events
Subsequent events occurring after the date of this report have been evaluated for potential impact to this report through the date the financial statements were issued. There were no subsequent events that necessitated recognition or disclosure on the Funds’ financial statements.
| 180 |
Report of Independent Registered Public Accounting Firm
To the Board of Trustees and Shareholders of Touchstone Funds Group Trust
We have audited the accompanying statements of assets and liabilities, including the portfolios of investments, of Touchstone Funds Group Trust (comprising, respectively, the Touchstone Arbitrage, Touchstone Emerging Markets Equity, Touchstone Global Real Estate, Touchstone International Fixed Income, Touchstone Merger Arbitrage, Touchstone Mid Cap, Touchstone Mid Cap Value, Touchstone Premium Yield Equity, Touchstone Sands Capital Select Growth, Touchstone Small Cap Core, Touchstone Small Cap Value, Touchstone Total Return Bond, and Touchstone Ultra Short Duration Fixed Income Funds) (the “Funds”) as of September 30, 2014, and the related statements of operations for the year then ended and the statements of changes in net assets and the financial highlights for each of the years or periods indicated therein, except as noted below for Touchstone Total Return Bond Fund. These financial statements and financial highlights are the responsibility of the Funds’ management. Our responsibility is to express an opinion on these financial statements and financial highlights based on our audits. The financial highlights for each of the periods presented through March 31, 2011 of Touchstone Total Return Bond Fund were audited by other auditors whose report dated May 31, 2011, expressed an unqualified opinion on those financial highlights.
We conducted our audits in accordance with the standards of the Public Company Accounting Oversight Board (United States). Those standards require that we plan and perform the audits to obtain reasonable assurance about whether the financial statements are free of material misstatement. We were not engaged to perform an audit of the Funds’ internal control over financial reporting. Our audits included consideration of internal control over financial reporting as a basis for designing audit procedures that are appropriate in the circumstances, but not for the purpose of expressing an opinion on the effectiveness of the Funds’ internal control over financial reporting. Accordingly, we express no such opinion. An audit also includes examining, on a test basis, evidence supporting the amounts and disclosures in the financial statements, assessing the accounting principles used and significant estimates made by management, and evaluating the overall financial statement presentation. Our procedures included confirmation of securities owned as of September 30, 2014, by correspondence with the custodian, transfer agent, and brokers or by other appropriate auditing procedures where replies from brokers were not received. We believe that our audits provide a reasonable basis for our opinion.
In our opinion, the financial statements and financial highlights referred to above present fairly, in all material respects, the financial position of each of the respective funds constituting the Touchstone Funds Group Trust at September 30, 2014, the results of their operations for the year then ended and the changes in their net assets and the financial highlights for each of the years or periods indicated therein, except as noted above for Touchstone Total Return Bond Fund, in conformity with U.S generally accepted accounting principles.

Cincinnati, Ohio
November 21, 2014
| 181 |
Qualified Dividend Income
Under the Jobs and Growth Tax Relief Reconciliation Act of 2003 (the “Act”), the following percentages of ordinary dividends paid during the fiscal year ended September 30, 2014 are designated as “qualified dividend income,” as defined in the Act, and are subject to reduced tax rates. The Funds intend to pass through the maximum allowable percentage for 1099s.
| Emerging Markets Equity Fund | 100.00 | % | ||
| Global Real Estate Fund | 22.02 | % | ||
| Merger Arbitrage Fund | 29.19 | % | ||
| Mid Cap Fund | 100.00 | % | ||
| Mid Cap Value Fund | 32.99 | % | ||
| Premium Yield Equity Fund | 100.00 | % | ||
| Sands Capital Select Growth Fund | 100.00 | % | ||
| Small Cap Core Fund | 46.74 | % | ||
| Small Cap Value Fund | 100.00 | % |
Dividend Received Deduction
For corporate shareholders, the following ordinary distributions paid during the current fiscal year ended September 30, 2014 qualify for the corporate dividends received deduction.The Funds intend to pass through the maximum allowable percentage for 1099s.
| Emerging Markets Equity Fund | 0.52 | % | ||
| Global Real Estate Fund | 0.65 | % | ||
| Merger Arbitrage Fund | 36.51 | % | ||
| Mid Cap Fund | 100.00 | % | ||
| Mid Cap Value Fund | 31.14 | % | ||
| Premium Yield Equity Fund | 57.22 | % | ||
| Sands Capital Select Growth Fund | 100.00 | % | ||
| Small Cap Core Fund | 61.06 | % | ||
| Small Cap Value Fund | 100.00 | % |
For the fiscal year ended September 30, 2014, the Arbitrage Fund, International Fixed Income Fund, Merger Arbitrage Fund, Mid Cap Value Fund, Premium Yield Equity Fund, Sands Capital Select Growth Fund, Small Cap Core Fund and Small Cap Value Fund designated $288,416, $802,971, $1,565,830, $8,876,667, $8,856,906, $306,774,013, $51,731,660 and $2,812,169 respectively, as long-term capital gains.
Foreign Tax Income & Foreign Tax Credit
Emerging Markets Equity Fund, Global Real Estate Fund, and International Fixed Income Fund intend to pass through a foreign tax credit to the shareholders. For the fiscal year ended September 30, 2014, the total amount of foreign source income is $9,627,210 or $0.32 per share, $555,744 or $0.42, and $894,591 or $0.25 per share, respectively. The total amount of foreign taxes to be paid is $535,451 or $0.02 per share, $18,024 or $0.01 per share, and $4,832 or $0.001 per share, respectively. Your allocable share of the foreign tax credit will be reported on Form 1099 Div.
Proxy Voting Guidelines and Proxy Voting Records
The Sub-Advisors are responsible for exercising the voting rights associated with the securities purchased and held by the Funds. A description of the policies and procedures that the Sub-Advisors use in fulfilling this responsibility is available as an appendix to the most recent Statement of Additional Information, which can
| 182 |
Other Items (Unaudited) (Continued)
be obtained without charge by calling toll free 1.800.543.0407 or by visiting the Touchstone website at www.touchstoneinvestments.com or on the Securities and Exchange Commission’s (the “Commission”) website www.sec.gov. Information regarding how those proxies were voted during the most recent twelve-month period ended June 30 is also available without charge by calling toll free 1.800.543.0407 or on the Commission’s website at www.sec.gov.
Quarterly Portfolio Disclosure
The Trust files a complete listing of portfolio holdings for each Fund as of the end of the first and third quarters of each fiscal year on Form N-Q. The complete listing (i) is available on the Commission’s website; (ii) may be reviewed and copied at the Commission’s Public Reference Room in Washington, DC; and (iii) will be made available to shareholders upon request by calling 1.800.543.0407; or (iv) can be obtained in the Touchstone website at www.touchstoneinvestments.com. Information on the operation of the Public Reference Room may be obtained by calling 1.800.SEC.0330.
Schedule of Shareholder Expenses
As a shareholder of the Funds, you incur two types of costs: (1) transaction costs, including reinvested dividends or other distributions; and (2) ongoing costs, including investment advisory fees; distribution (12b-1) fees; and other Fund expenses. This example is intended to help you understand your ongoing costs (in dollars) of investing in the Funds and to compare these costs with the ongoing costs of investing in other mutual funds. The example is based on an investment of $1,000 invested at the beginning of the period and held for the entire period (April 1, 2014 through September 30, 2014).
Actual Expenses
The first line for each share class of a Fund in the table below provides information about actual account values and actual expenses. You may use the information in this line, together with the amount you invested, to estimate the expenses that you paid over the period. Simply divide your account value by $1,000 (for example, an $8,600 account value divided by $1,000 = 8.6), then multiply the result by the number in the first line under the heading entitled “Expenses Paid During the Six Months Ended September 30, 2014” to estimate the expenses you paid on your account during this period.
Hypothetical Example for Comparison Purposes
The second line for each share class of a Fund in the table below provides information about hypothetical account values and hypothetical expenses based on the Funds’ actual expense ratio and an assumed rate of return of 5% per year before expenses, which is not the Funds’ actual return. The hypothetical account values and expenses may not be used to estimate the actual ending account balance or expenses you paid for the period. You may use this information to compare the ongoing costs of investing in the Funds and other funds. To do so, compare this 5% hypothetical example with the 5% hypothetical examples that appear in the shareholder reports of the other funds.
Please note that the expenses shown in the table below are meant to highlight your ongoing costs only and do not reflect any transactional costs, such as sales charges (loads), redemption fees, or exchange fees. Therefore, the second line for each share class of a Fund in the table below is useful in comparing ongoing costs only, and will not help you determine the relative total costs of owning different funds. In addition, if these transactional costs were included, your costs would have been higher.
| 183 |
Other Items (Unaudited) (Continued)
Schedule of Shareholder Expenses (Continued)
| Expenses | ||||||||||||||||||
| Net Expense | Beginning | Ending | Paid During | |||||||||||||||
| Ratio | Account | Account | the Six Months | |||||||||||||||
| Annualized | Value | Value | Ended | |||||||||||||||
| September 30, | April 1, | September 30, | September 30, | |||||||||||||||
| 2014 | 2014 | 2014 | 2014* | |||||||||||||||
| Touchstone Arbitrage Fund | ||||||||||||||||||
| Class A | Actual | 2.45 | % | $ | 1,000.00 | $ | 987.00 | $ | 12.20 | ** | ||||||||
| Class A | Hypothetical | 2.45 | % | $ | 1,000.00 | $ | 1,012.78 | $ | 12.36 | ** | ||||||||
| Class C | Actual | 3.19 | % | $ | 1,000.00 | $ | 985.00 | $ | 15.87 | ** | ||||||||
| Class C | Hypothetical | 3.19 | % | $ | 1,000.00 | $ | 1,009.07 | $ | 16.07 | ** | ||||||||
| Class Y | Actual | 2.12 | % | $ | 1,000.00 | $ | 990.00 | $ | 10.58 | ** | ||||||||
| Class Y | Hypothetical | 2.12 | % | $ | 1,000.00 | $ | 1,014.44 | $ | 10.71 | ** | ||||||||
| Institutional Class | Actual | 2.04 | % | $ | 1,000.00 | $ | 990.00 | $ | 10.18 | ** | ||||||||
| Institutional Class | Hypothetical | 2.04 | % | $ | 1,000.00 | $ | 1,014.84 | $ | 10.30 | ** | ||||||||
| Touchstone Emerging Markets Equity Fund | ||||||||||||||||||
| Class A | Actual | 1.69 | % | $ | 1,000.00 | $ | 1,044.80 | $ | 8.66 | |||||||||
| Class A | Hypothetical | 1.69 | % | $ | 1,000.00 | $ | 1,016.60 | $ | 8.54 | |||||||||
| Class C | Actual | 2.44 | % | $ | 1,000.00 | $ | 1,041.00 | $ | 12.48 | |||||||||
| Class C | Hypothetical | 2.44 | % | $ | 1,000.00 | $ | 1,012.84 | $ | 12.31 | |||||||||
| Class Y | Actual | 1.38 | % | $ | 1,000.00 | $ | 1,046.80 | $ | 7.08 | |||||||||
| Class Y | Hypothetical | 1.38 | % | $ | 1,000.00 | $ | 1,018.15 | $ | 6.98 | |||||||||
| Institutional Class | Actual | 1.29 | % | $ | 1,000.00 | $ | 1,046.80 | $ | 6.62 | |||||||||
| Institutional Class | Hypothetical | 1.29 | % | $ | 1,000.00 | $ | 1,018.60 | $ | 6.53 | |||||||||
| Touchstone Global Real Estate Fund | ||||||||||||||||||
| Class A | Actual | 1.39 | % | $ | 1,000.00 | $ | 1,034.10 | $ | 7.09 | |||||||||
| Class A | Hypothetical | 1.39 | % | $ | 1,000.00 | $ | 1,018.10 | $ | 7.03 | |||||||||
| Class C | Actual | 2.14 | % | $ | 1,000.00 | $ | 1,030.20 | $ | 10.89 | |||||||||
| Class C | Hypothetical | 2.14 | % | $ | 1,000.00 | $ | 1,014.34 | $ | 10.81 | |||||||||
| Class Y | Actual | 1.14 | % | $ | 1,000.00 | $ | 1,035.60 | $ | 5.82 | |||||||||
| Class Y | Hypothetical | 1.14 | % | $ | 1,000.00 | $ | 1,019.35 | $ | 5.77 | |||||||||
| Institutional Class | Actual | 0.99 | % | $ | 1,000.00 | $ | 1,035.80 | $ | 5.05 | |||||||||
| Institutional Class | Hypothetical | 0.99 | % | $ | 1,000.00 | $ | 1,020.10 | $ | 5.01 | |||||||||
| Touchstone International Fixed Income Fund | ||||||||||||||||||
| Class A | Actual | 1.09 | % | $ | 1,000.00 | $ | 979.00 | $ | 5.41 | |||||||||
| Class A | Hypothetical | 1.09 | % | $ | 1,000.00 | $ | 1,019.60 | $ | 5.52 | |||||||||
| Class C | Actual | 1.84 | % | $ | 1,000.00 | $ | 975.00 | $ | 9.11 | |||||||||
| Class C | Hypothetical | 1.84 | % | $ | 1,000.00 | $ | 1,015.84 | $ | 9.30 | |||||||||
| Class Y | Actual | 0.84 | % | $ | 1,000.00 | $ | 979.10 | $ | 4.17 | |||||||||
| Class Y | Hypothetical | 0.84 | % | $ | 1,000.00 | $ | 1,020.86 | $ | 4.26 | |||||||||
| Institutional Class | Actual | 0.69 | % | $ | 1,000.00 | $ | 980.10 | $ | 3.43 | |||||||||
| Institutional Class | Hypothetical | 0.69 | % | $ | 1,000.00 | $ | 1,021.61 | $ | 3.50 | |||||||||
| 184 |
Other Items (Unaudited) (Continued)
Schedule of Shareholder Expenses (Continued)
| Expenses | ||||||||||||||||||
| Net Expense | Beginning | Ending | Paid During | |||||||||||||||
| Ratio | Account | Account | the Six Months | |||||||||||||||
| Annualized | Value | Value | Ended | |||||||||||||||
| September 30, | April 1, | September 30, | September 30, | |||||||||||||||
| 2014 | 2014 | 2014 | 2014* | |||||||||||||||
| Touchstone Merger Arbitrage Fund | ||||||||||||||||||
| Class A | Actual | 2.47 | % | $ | 1,000.00 | $ | 981.30 | $ | 12.27 | *** | ||||||||
| Class A | Hypothetical | 2.47 | % | $ | 1,000.00 | $ | 1,012.68 | $ | 12.46 | *** | ||||||||
| Class C | Actual | 3.30 | % | $ | 1,000.00 | $ | 997.10 | $ | 16.36 | *** | ||||||||
| Class C | Hypothetical | 3.30 | % | $ | 1,000.00 | $ | 1,008.52 | $ | 16.62 | *** | ||||||||
| Class Y | Actual | 2.23 | % | $ | 1,000.00 | $ | 982.30 | $ | 11.08 | *** | ||||||||
| Class Y | Hypothetical | 2.23 | % | $ | 1,000.00 | $ | 1,013.89 | $ | 11.26 | *** | ||||||||
| Institutional Class | Actual | 2.19 | % | $ | 1,000.00 | $ | 983.20 | $ | 10.89 | *** | ||||||||
| Institutional Class | Hypothetical | 2.19 | % | $ | 1,000.00 | $ | 1,014.09 | $ | 11.06 | *** | ||||||||
| Touchstone Mid Cap Fund | ||||||||||||||||||
| Class A | Actual | 1.24 | % | $ | 1,000.00 | $ | 1,028.70 | $ | 6.31 | |||||||||
| Class A | Hypothetical | 1.24 | % | $ | 1,000.00 | $ | 1,018.85 | $ | 6.28 | |||||||||
| Class C | Actual | 1.99 | % | $ | 1,000.00 | $ | 1,025.00 | $ | 10.10 | |||||||||
| Class C | Hypothetical | 1.99 | % | $ | 1,000.00 | $ | 1,015.09 | $ | 10.05 | |||||||||
| Class Y | Actual | 1.00 | % | $ | 1,000.00 | $ | 1,029.80 | $ | 5.09 | |||||||||
| Class Y | Hypothetical | 1.00 | % | $ | 1,000.00 | $ | 1,020.05 | $ | 5.06 | |||||||||
| Class Z | Actual | 1.24 | % | $ | 1,000.00 | $ | 1,028.80 | $ | 6.31 | |||||||||
| Class Z | Hypothetical | 1.24 | % | $ | 1,000.00 | $ | 1,018.85 | $ | 6.28 | |||||||||
| Institutional Class | Actual | 0.92 | % | $ | 1,000.00 | $ | 1,030.30 | $ | 4.68 | |||||||||
| Institutional Class | Hypothetical | 0.92 | % | $ | 1,000.00 | $ | 1,020.46 | $ | 4.66 | |||||||||
| Touchstone Mid Cap Value Fund | ||||||||||||||||||
| Class A | Actual | 1.29 | % | $ | 1,000.00 | $ | 1,012.20 | $ | 6.51 | |||||||||
| Class A | Hypothetical | 1.29 | % | $ | 1,000.00 | $ | 1,018.60 | $ | 6.53 | |||||||||
| Class C | Actual | 2.04 | % | $ | 1,000.00 | $ | 1,008.60 | $ | 10.27 | |||||||||
| Class C | Hypothetical | 2.04 | % | $ | 1,000.00 | $ | 1,014.84 | $ | 10.30 | |||||||||
| Class Y | Actual | 1.04 | % | $ | 1,000.00 | $ | 1,013.70 | $ | 5.25 | |||||||||
| Class Y | Hypothetical | 1.04 | % | $ | 1,000.00 | $ | 1,019.85 | $ | 5.27 | |||||||||
| Institutional Class | Actual | 0.89 | % | $ | 1,000.00 | $ | 1,014.30 | $ | 4.49 | |||||||||
| Institutional Class | Hypothetical | 0.89 | % | $ | 1,000.00 | $ | 1,020.61 | $ | 4.51 | |||||||||
| Touchstone Premium Yield Equity Fund | ||||||||||||||||||
| Class A | Actual | 1.20 | % | $ | 1,000.00 | $ | 1,074.40 | $ | 6.24 | |||||||||
| Class A | Hypothetical | 1.20 | % | $ | 1,000.00 | $ | 1,019.05 | $ | 6.07 | |||||||||
| Class C | Actual | 1.95 | % | $ | 1,000.00 | $ | 1,069.60 | $ | 10.12 | |||||||||
| Class C | Hypothetical | 1.95 | % | $ | 1,000.00 | $ | 1,015.29 | $ | 9.85 | |||||||||
| Class Y | Actual | 0.95 | % | $ | 1,000.00 | $ | 1,074.90 | $ | 4.94 | |||||||||
| Class Y | Hypothetical | 0.95 | % | $ | 1,000.00 | $ | 1,020.31 | $ | 4.81 | |||||||||
| 185 |
Other Items (Unaudited) (Continued)
Schedule of Shareholder Expenses (Continued)
| Expenses | ||||||||||||||||||
| Net Expense | Beginning | Ending | Paid During | |||||||||||||||
| Ratio | Account | Account | the Six Months | |||||||||||||||
| Annualized | Value | Value | Ended | |||||||||||||||
| September 30, | April 1, | September 30, | September 30, | |||||||||||||||
| 2014 | 2014 | 2014 | 2014* | |||||||||||||||
| Touchstone Sands Capital Select Growth Fund | ||||||||||||||||||
| Class A | Actual | 1.26 | % | $ | 1,000.00 | $ | 1,034.80 | $ | 6.43 | |||||||||
| Class A | Hypothetical | 1.26 | % | $ | 1,000.00 | $ | 1,018.75 | $ | 6.38 | |||||||||
| Class C | Actual | 2.01 | % | $ | 1,000.00 | $ | 1,030.40 | $ | 10.23 | |||||||||
| Class C | Hypothetical | 2.01 | % | $ | 1,000.00 | $ | 1,014.99 | $ | 10.15 | |||||||||
| Class Y | Actual | 1.01 | % | $ | 1,000.00 | $ | 1,036.20 | $ | 5.16 | |||||||||
| Class Y | Hypothetical | 1.01 | % | $ | 1,000.00 | $ | 1,020.00 | $ | 5.11 | |||||||||
| Class Z | Actual | 1.26 | % | $ | 1,000.00 | $ | 1,034.80 | $ | 6.43 | |||||||||
| Class Z | Hypothetical | 1.26 | % | $ | 1,000.00 | $ | 1,018.75 | $ | 6.38 | |||||||||
| Touchstone Small Cap Core Fund | ||||||||||||||||||
| Class A | Actual | 1.38 | % | $ | 1,000.00 | $ | 979.50 | $ | 6.85 | |||||||||
| Class A | Hypothetical | 1.38 | % | $ | 1,000.00 | $ | 1,018.15 | $ | 6.98 | |||||||||
| Class C | Actual | 2.13 | % | $ | 1,000.00 | $ | 975.20 | $ | 10.55 | |||||||||
| Class C | Hypothetical | 2.13 | % | $ | 1,000.00 | $ | 1,014.39 | $ | 10.76 | |||||||||
| Class Y | Actual | 1.08 | % | $ | 1,000.00 | $ | 980.60 | $ | 5.36 | |||||||||
| Class Y | Hypothetical | 1.08 | % | $ | 1,000.00 | $ | 1,019.65 | $ | 5.47 | |||||||||
| Institutional Class | Actual | 1.04 | % | $ | 1,000.00 | $ | 980.60 | $ | 5.16 | |||||||||
| Institutional Class | Hypothetical | 1.04 | % | $ | 1,000.00 | $ | 1,019.85 | $ | 5.27 | |||||||||
| Touchstone Small Cap Value Fund | ||||||||||||||||||
| Class A | Actual | 1.42 | % | $ | 1,000.00 | $ | 927.70 | $ | 6.86 | |||||||||
| Class A | Hypothetical | 1.42 | % | $ | 1,000.00 | $ | 1,017.95 | $ | 7.18 | |||||||||
| Class C | Actual | 2.17 | % | $ | 1,000.00 | $ | 924.40 | $ | 10.47 | |||||||||
| Class C | Hypothetical | 2.17 | % | $ | 1,000.00 | $ | 1,014.19 | $ | 10.96 | |||||||||
| Class Y | Actual | 1.17 | % | $ | 1,000.00 | $ | 929.00 | $ | 5.66 | |||||||||
| Class Y | Hypothetical | 1.17 | % | $ | 1,000.00 | $ | 1,019.20 | $ | 5.92 | |||||||||
| Institutional Class | Actual | 1.02 | % | $ | 1,000.00 | $ | 929.60 | $ | 4.93 | |||||||||
| Institutional Class | Hypothetical | 1.02 | % | $ | 1,000.00 | $ | 1,019.95 | $ | 5.16 | |||||||||
| Touchstone Total Return Bond Fund | ||||||||||||||||||
| Class A | Actual | 0.90 | % | $ | 1,000.00 | $ | 1,023.30 | $ | 4.56 | |||||||||
| Class A | Hypothetical | 0.90 | % | $ | 1,000.00 | $ | 1,020.56 | $ | 4.56 | |||||||||
| Class C | Actual | 1.65 | % | $ | 1,000.00 | $ | 1,019.40 | $ | 8.35 | |||||||||
| Class C | Hypothetical | 1.65 | % | $ | 1,000.00 | $ | 1,016.80 | $ | 8.34 | |||||||||
| Class Y | Actual | 0.60 | % | $ | 1,000.00 | $ | 1,024.80 | $ | 3.05 | |||||||||
| Class Y | Hypothetical | 0.60 | % | $ | 1,000.00 | $ | 1,022.06 | $ | 3.04 | |||||||||
| Institutional Class | Actual | 0.50 | % | $ | 1,000.00 | $ | 1,025.30 | $ | 2.54 | |||||||||
| Institutional Class | Hypothetical | 0.50 | % | $ | 1,000.00 | $ | 1,022.56 | $ | 2.54 | |||||||||
| 186 |
Other Items (Unaudited) (Continued)
Schedule of Shareholder Expenses (Continued)
| Expenses | ||||||||||||||||||
| Net Expense | Beginning | Ending | Paid During | |||||||||||||||
| Ratio | Account | Account | the Six Months | |||||||||||||||
| Annualized | Value | Value | Ended | |||||||||||||||
| September 30, | April 1, | September 30, | September 30, | |||||||||||||||
| 2014 | 2014 | 2014 | 2014* | |||||||||||||||
| Touchstone Ultra Short Duration Fixed Income Fund | ||||||||||||||||||
| Class A | Actual | 0.69 | % | $ | 1,000.00 | $ | 1,004.00 | $ | 3.47 | |||||||||
| Class A | Hypothetical | 0.69 | % | $ | 1,000.00 | $ | 1,021.61 | $ | 3.50 | |||||||||
| Class C | Actual | 1.19 | % | $ | 1,000.00 | $ | 1,000.40 | $ | 5.97 | |||||||||
| Class C | Hypothetical | 1.19 | % | $ | 1,000.00 | $ | 1,019.10 | $ | 6.02 | |||||||||
| Class Y | Actual | 0.44 | % | $ | 1,000.00 | $ | 1,004.20 | $ | 2.21 | |||||||||
| Class Y | Hypothetical | 0.44 | % | $ | 1,000.00 | $ | 1,022.86 | $ | 2.23 | |||||||||
| Class Z | Actual | 0.69 | % | $ | 1,000.00 | $ | 1,002.90 | $ | 3.46 | |||||||||
| Class Z | Hypothetical | 0.69 | % | $ | 1,000.00 | $ | 1,021.61 | $ | 3.50 | |||||||||
| Institutional Class | Actual | 0.39 | % | $ | 1,000.00 | $ | 1,004.40 | $ | 1.96 | |||||||||
| Institutional Class | Hypothetical | 0.39 | % | $ | 1,000.00 | $ | 1,023.11 | $ | 1.98 | |||||||||
| * | Expenses are equal to the Fund's annualized expense ratio, multiplied by the average account value over the period, multiplied by [183/365] (to reflect one-half year period). |
| ** | Excluding interest and dividend expenses on securities sold short, your actual cost of investment in Class A, Class C, Class Y and Institutional Class would be $8.42, $12.09, $6.78 and $6.39, respectively, and your hypothetical cost of investment in Class A, Class C, Class Y and Institutional Class would be $8.54,$12.26, $6.88, and $6.48, respectively. |
| *** | Excluding interest and dividend expenses on securities sold short, your actual cost of investment in Class A, Class C, Class Y and Institutional Class would be $7.65, $11.75, $6.46 and $6.26, respectively, and your hypothetical cost of investment in Class A, Class C, Class Y and Institutional Class would be $7.79,$11.96, $6.58, and $6.38, respectively. |
| 187 |
Management of the Trust (Unaudited)
Listed below is required information regarding the Trustees and principal officers of the Trust. The Trust’s Statement of Additional Information includes additional information about the Trustees and is available, without charge, upon request by calling 1.800.543.0407 or by visiting the Touchstone website at www.touchstoneinvestments.com.
| Interested Trustees1: | ||||||||||
| Number | ||||||||||
| of Funds | ||||||||||
| Overseen | ||||||||||
| Term of | in the | |||||||||
| Name | Position(s) | Office And | Touchstone | Other | ||||||
| Address | Held with | Length of | Principal Occupation(s) | Fund | Directorships | |||||
| Age | Trust | Time Served | During Past 5 Years | Complex3 | Held During the Past 5 Years4 | |||||
| Jill T. McGruder Touchstone Advisors, Inc 303 Broadway Suite 1100 Cincinnati, OH 45202 Year of Birth: 1955 | Trustee and President | Until retirement at age 75 or until she resigns or is removed Trustee since 1999 | President and CEO of IFS Financial Services, Inc. (a holding company) from 1999 to the present. | 49 | Director of LaRosa’s, Inc. (a restaurant chain) from 1999 to the present, IFS Financial Services, Inc. (a holding company) from 1999 to the present, Integrity and National Integrity Life Insurance Co. from 2005 to the present, Touchstone Securities (the Trust’s distributor) from 1999 to the present, Touchstone Advisors (the Trust’s investment advisor and administrator) from 1999 to the present, W&S Brokerage Services ( a brokerage company) from 1999 to the present and W&S Financial Group Distributors (a distribution company) from 1999 to the present. | |||||
| Independent Trustees: | �� | |||||||||
| Phillip R. Cox c/o Touchstone Advisors, Inc. 303 Broadway Suite 1100 Cincinnati, OH 45202 Year of Birth: 1947 | Trustee | Until retirement at age 75 or until he resigns or is removed Trustee since 1999 | President and Chief Executive Officer of Cox Financial Corp. (a financial services company) from 1971 to the present. | 49 | Director of Cincinnati Bell (a communications company) from 1994 to the present, Bethesda Inc. (a hospital) from 2005 to the present, Timken Co. (a manufacturing company) from 2004 to the present, Diebold, Inc. (a technology solutions company) from 2004 to the present, and Duke Energy (energy holding company) from 1994 until 2008. | |||||
| William C. Gale c/o Touchstone Advisors, Inc. 303 Broadway Suite 1100 Cincinnati, OH 45202 Year of Birth: 1952 | Trustee | Until retirement at age 75 or until he resigns or is removed Trustee since 2013 | Senior Vice President (from 2003 to the present) and Chief Financial Officer (from 1995 to the present) of Cintas Corporation (a business services company). | 49 | None. | |||||
| Susan J. Hickenlooper, CFA c/o Touchstone Advisors, Inc. 303 Broadway Suite 1100 Cincinnati, OH 45202 Year of Birth: 1946 | Trustee | Until retirement at age 75 or until she resigns or is removed Trustee since 2009 | Financial Analyst for Impact 100 (Charitable Organization) from 2012 to present. | 49 | Trustee of Gateway Trust (a mutual fund) from 2006-2009, Cincinnati Parks Foundation (a charitable organization) from 2000 to present and Trustee of Episcopal Retirement Homes Foundation from 1998-2011. | |||||
| 188 |
Management of the Trust (Unaudited) (Continued)
| Independent Trustees (Continued): | ||||||||||
| Number | ||||||||||
| of Funds | ||||||||||
| Overseen | ||||||||||
| Term of | in the | |||||||||
| Name | Position(s) | Office And | Touchstone | Other | ||||||
| Address | Held with | Length of | Principal Occupation(s) | Fund | Directorships | |||||
| Age | Trust | Time Served | During Past 5 Years | Complex3 | Held During the Past 5 Years4 | |||||
| Kevin A. Robie c/o Touchstone Advisors, Inc. 303 Broadway Suite 1100 Cincinnati, OH 45202 Year of Birth: 1956 | Trustee | Until retirement at age 75 or until he resigns or is removed Trustee since 2013 | Vice President of Portfolio Management at Soin International LLC (a multinational holding company) from 2004 to the present. | 49 | Director of Buckeye EcoCare, Inc. (a lawn care company) from 2013 to the present, Trustee of Dayton Region New Market Fund, LLC (a private fund) from 2010 to present, Trustee of the Entrepreneurs Center, Inc. (a small business incubator) from 2006 to the present and Director of Interventional Imaging, Inc. (a medical device company) from 2004 to 2011. | |||||
| Edward J. VonderBrink c/o Touchstone Advisors, Inc. 303 Broadway Suite 1100 Cincinnati, OH 45202 Year of Birth: 1944 | Trustee | Until retirement at age 75 or until he resigns or is removed Trustee since 2013 | Consultant, VonderBrink Consulting LLC from 2000 to the present. | 49 | Director of Streamline Health Solutions, Inc. (healthcare IT) from 2006 to the present, BASCO shower Enclosures (a design and manufacturing company) from 2010 to the present, Mercy Health Foundation from 2008 to the present and Pelican Sound Golf and River Club from 2012 to the present. | |||||
| 1 | Ms. McGruder, as a director of the Advisor and the Trust's Distributor, and an officer of affiliates of the Advisor and the Trust's Distributor, is an “interested person” of the Trust within the meaning of Section 2(a)(19) of the 1940 Act. |
| 2 | As of September 30, 2014, the Touchstone Fund Complex consisted of 10 variable annuity series of the Variable Series Trust, 3 series of Touchstone Tax-Free Trust, 1 series of Touchstone Institutional Funds Trust, 4 series of Touchstone Investment Trust, 18 series of Touchstone Strategic Trust, and 13 series of Touchstone Funds Group Trust. |
| 3 | Each Trustee is also a Trustee of Touchstone Variable Series Trust, Touchstone Institutional Funds Trust, Touchstone Investment Trust, Touchstone Strategic Trust, and Touchstone Tax-Free Trust. |
| 189 |
Management of the Trust (Unaudited) (Continued)
The following is a list of the Officers of the Trusts, the length of time served and principal occupations for the past five years.
| Principal Officers: | ||||||
| Term of | ||||||
| Name | Position(s) | Office And | ||||
| Address | Held with | Length of | Principal Occupation(s) | |||
| Age | Trust3 | Time Served | During the Past 5 Years | |||
| Jill T. McGruder1 Year of Birth: 1955 | President and Trustee | Until resignation, removal or disqualification President since 2006 | See biography above. | |||
| Steven M. Graziano1 Year of Birth: 1954 | Vice President | Until resignation, removal or disqualification Vice President since 2009 | President of Touchstone Advisors, Inc.; Executive Vice President of Pioneer Investment Management, Head of Retail Distribution and Strategic Marketing 2007- 2008. | |||
| Timothy D. Paulin1 Year of Birth: 1963 | Vice President | Until resignation, removal or disqualification Vice President since 2010 | Senior Vice President of Investment Research and Product Management of Touchstone Advisors, Inc.; Director of Product Design of Klein Decisions, Inc. 2003-2010. | |||
| Timothy S. Stearns1 Year of Birth: 1963 | Chief Compliance Officer | Until resignation, removal or disqualification Chief Compliance Officer since September 2013 | Senior Vice President and Chief Compliance and Ethics Officer of Envestnet Asset Management, Inc. (2009 to 2013) and Chief Compliance Officer, Americas of Franklin Templeton Investments (1997 to 2009). | |||
| Terrie A. Wiedenheft1 Year of Birth: 1962 | Controller and Treasurer | Until resignation, removal or disqualification Controller and Treasurer since 2006 | Senior Vice President, Chief Financial Officer and Chief Operations Officer of IFS Financial Services, Inc. (a holding company). | |||
| Elizabeth R. Freeman2 Year of Birth: 1962 | Secretary | Until resignation, removal or disqualification Secretary since 2011 | Managing Director and Senior Counsel at BNY Mellon Investment Servicing (US) Inc. | |||
| 1 | The address of Touchstone Advisors, Inc. is 303 Broadway, Suite 1100, Cincinnati, OH 45202. |
| 2 | The address of BNY Mellon Investment Servicing (US) Inc. is 201 Washington Street, Boston, MA 02108. |
| 3 | Each officer also holds the same office with Touchstone Funds Variable Series Trust, Touchstone Institutional Funds Trust, Touchstone Investment Trust, Touchstone Strategic Trust, and Touchstone Tax-Free Trust. |
| 190 |
We Respect Your Privacy
Thank you for your decision to invest with us. Touchstone and its affiliates have always placed a high value on the trust and confidence our clients place in us. We believe that confidence must be earned and validated through time. In today’s world, when technology allows the sharing of information at light speeds, trust must be reinforced by our sincere pledge to take the steps necessary to ensure that the information you share with us is treated with respect and confidentiality.
Our Pledge to Our Clients
| • | We collect only the information we need to service your account and administer our business. |
| • | We are committed to keeping your information confidential and we place strict limits and controls on the use and sharing of your information. |
| • | We make every effort to ensure the accuracy of your information. |
We Collect the Following Nonpublic Personal Information About You:
| • | Information we receive from you on or in applications or other forms, correspondence, or conversations, including, but not limited to, your name, address, phone number, social security number, assets, income and date of birth; and |
| • | Information about your transactions with us, our affiliates, or others, including, but not limited to, your account number and balance, payment history, parties to transactions, cost basis information, and other financial information. |
Categories of Information We Disclose and Parties to Whom We Disclose
We do not disclose any nonpublic personal information about our current or former clients to nonaffiliated third parties, except as required or permitted by law.
We Place Strict Limits and Controls on the Use and Sharing of Your Information
| • | We restrict access to nonpublic personal information about you to authorized employees who need the information to administer your business. |
| • | We maintain physical, electronic and procedural safeguards that comply with federal standards to protect this information. |
| • | We do not disclose any nonpublic personal information about our current or former clients to anyone, except as required or permitted by law or as described in this document. |
| • | We will not sell your personal information to anyone. |
We May Provide Information to Service Your Account
Sometimes it is necessary to provide information about you to various companies such as transfer agents, custodians, broker-dealers and marketing service firms to facilitate the servicing of your account.These organizations have a legitimate business need to see some of your personal information in order for us to provide service to you. We may disclose to these various companies the information that we collect as described above. We require that these companies, including our own subsidiaries and affiliates, strictly maintain the confidentiality of this information and abide by all applicable laws. Companies within our corporate family that may receive this information are financial service providers and insurance companies. We do not permit these associated companies to sell the information for their own purposes, and we never sell our customer information.
This policy is applicable to the following affiliated companies: Touchstone Funds Group Trust, Touchstone Investment Trust, Touchstone Strategic Trust, Touchstone Tax-Free Trust, Touchstone Variable Series Trust, Touchstone Institutional Funds Trust, Touchstone Securities, Inc.,* and W&S Brokerage Services, Inc.
* Touchstone Securities, Inc. serves as the underwriter to the Touchstone Funds.
A Member of Western & Southern Financial Group®
The Privacy Protection Policy is not part of the Annual Report.
| 191 |


Go paperless, sign up today at:
www.touchstoneinvestments.com
Touchstone Investments
Distributor
Touchstone Securities, Inc.*
303 Broadway
Cincinnati, Ohio 45202-4203 800.638.8194
www.touchstoneinvestments.com
Investment Advisor
Touchstone Advisors, Inc.*
303 Broadway
Cincinnati, Ohio 45202-4203
Transfer Agent
BNY Mellon Investment Servicing (US) Inc.
4400 Computer Drive
Westborough, MA 01581
Shareholder Service
800.543.0407
* A Member of Western & Southern Financial Group
TSF-56-TFGT-AR-1410
Item 2. Code of Ethics.
| (a) | The registrant, as of the end of the period covered by this report, has adopted a code of ethics that applies to the registrant’s principal executive officer, principal financial officer, principal accounting officer or controller, or persons performing similar functions, regardless of whether these individuals are employed by the registrant or a third party. |
| (c) | There have been no amendments, during the period covered by this report, to a provision of the code of ethics that applies to the registrant’s principal executive officer, principal financial officer, principal accounting officer or controller, or persons performing similar functions, regardless of whether these individuals are employed by the registrant or a third party, and that relates to any element of the code of ethics description. |
| (d) | The registrant has not granted any waivers, including an implicit waiver, from a provision of the code of ethics that applies to the registrant’s principal executive officer, principal financial officer, principal accounting officer or controller, or persons performing similar functions, regardless of whether these individuals are employed by the registrant or a third party, that relates to one or more of the items set forth in paragraph (b) of this item’s instructions. |
Item 3. Audit Committee Financial Expert.
The registrant’s Board of Trustees has determined that the registrant has at least one audit committee financial expert serving on its audit committee. Mr. William Gale is the registrant’s audit committee financial expert and is an independent trustee within the meaning of the Investment Company Act of 1940, as amended (the “1940 Act”).
Item 4. Principal Accountant Fees and Services.
Audit Fees
| (a) | Audit fees for Touchstone Fund Group Trust totaled $190,100 and $174,000 in fiscal 2014 and 2013, respectively, including fees associated with the annual audits and filings of Form N1A and Form N-SAR. Additionally, fees totaled $0 and $4,000 associated with additional filings of Form N-1A in fiscal 2014 and 2013, respectively. |
Audit-Related Fees
| (b) | There were no audit-related fees for the 2014 and 2013 fiscal years. |
Tax Fees
| (c) | The aggregate fees for tax compliance services totaled $84,350 and $83,700 in fiscal 2014 and 2013, respectively. |
| Fees for both 2014 and 2013 relate to the preparation of federal income and excise tax returns, review of capital gains distribution calculations, and tax agent fees. |
All Other Fees
| (d) | The aggregate fees billed in each of the last two fiscal years for products and services provided by the principal accountant, other than the services reported in paragraphs (a) through (c) of this Item are for fiscal years 2014 and 2013 are $11,506.89 and $0, respectively. The fees relate to the PFIC analyzer and Global Withholding Tax Reporter subscriptions. |
| (e)(1) | Disclose the audit committee's pre-approval policies and procedures described in paragraph (c)(7) of Rule 2-01 of Regulation S-X. |
| The Audit Committee’s pre-approval policies describe the types of audit, audit-related, tax and other services that have the general pre-approval of the Audit Committee. The pre-approval policies provide that annual audit service fees, tax services not specifically granted pre-approval, services exceeding pre-approved cost levels and other services that have not received general pre-approval will be subject to specific pre-approval by the Audit Committee. The pre-approval policies further provide that the Committee may grant general pre-approval to other audit services (statutory audits and services associated with SEC registration statements, periodic reports and other documents filed with the SEC or other documents issued in connection with securities offerings), audit-related services (accounting consultations related to accounting, financial reporting or disclosure matters not classified as “audit services,” assistance with understanding and implementing new accounting and financial reporting guidance from rulemaking authorities, agreed-upon or expanded audit procedures related to accounting and/or billing records required to respond to or comply with financial, accounting or regulatory reporting matters and assistance with internal control reporting requirements under Form N-SAR and Form N-CSR), tax services that have historically been provided by the auditor that the Committee believes would not impair the independence of the auditor and are consistent with the SEC’s rules on auditor independence and permissible non-audit services classified as “all other services” that are routine and recurring services. |
| (e)(2) | All of the services described in paragraphs (b) through (d) of Item 4 were approved by the Audit Committee. |
| (f) | The percentage of hours expended on the principal accountant's engagement to audit the registrant's financial statements for the most recent fiscal year that were attributed to work performed by persons other than the principal accountant's full-time, permanent employees was less than fifty percent. |
| (g) | The aggregate non-audit fees billed by the registrant's accountant for services rendered to the registrant, and rendered to the registrant's investment adviser (not including any sub-adviser whose role is primarily portfolio management and is subcontracted with or overseen by another investment adviser), and any entity controlling, controlled by, or under common control with the adviser that provides ongoing services to the registrant for each of the last two fiscal years of the registrant was $95,856.89 for 2014 and $83,700 for 2013. |
| (h) | The registrant's audit committee of the board of trustees has considered whether the provision of non-audit services that were rendered to the registrant's investment adviser (not including any sub-adviser whose role is primarily portfolio management and is subcontracted with or overseen by another investment adviser), and any entity controlling, controlled by, or under common control with the investment adviser that provides ongoing services to the registrant that were not pre-approved pursuant to paragraph (c)(7)(ii) of Rule 2-01 of Regulation S-X is compatible with maintaining the principal accountant's independence. |
Item 5. Audit Committee of Listed Registrants.
Not applicable.
Item 6. Investments.
| (a) | Schedule of Investments in securities of unaffiliated issuers as of the close of the reporting period is included as part of the report to shareholders filed under Item 1 of this form. |
| (b) | Not applicable. |
Item 7. Disclosure of Proxy Voting Policies and Procedures for Closed-End Management Investment Companies.
Not applicable.
Item 8. Portfolio Managers of Closed-End Management Investment Companies.
Not applicable.
Item 9. Purchases of Equity Securities by Closed-End Management Investment Company and Affiliated Purchasers.
Not applicable.
Item 10. Submission of Matters to a Vote of Security Holders.
There have been no material changes to the procedures by which the shareholders may recommend nominees to the registrant’s board of trustees, where those changes were implemented after the registrant last provided disclosure in response to the requirements of Item 407(c)(2)(iv) of Regulation S-K (17 CFR 229.407) (as required by Item 22(b)(15) of Schedule 14A (17 CFR 240.14a-101)), or this Item.
Item 11. Controls and Procedures.
| (a) | The registrant’s principal executive and principal financial officers, or persons performing similar functions, have concluded that the registrant’s disclosure controls and procedures (as defined in Rule 30a-3(c) under the Investment Company Act of 1940, as amended (the “1940 Act”) (17 CFR 270.30a-3(c))) are effective, as of a date within 90 days of the filing date of the report that includes the disclosure required by this paragraph, based on their evaluation of these controls and procedures required by Rule 30a-3(b) under the 1940 Act (17 CFR 270.30a-3(b)) and Rules 13a-15(b) or 15d-15(b) under the Securities Exchange Act of 1934, as amended (17 CFR 240.13a-15(b) or 240.15d-15(b)). |
| (b) | There were no changes in the registrant’s internal control over financial reporting (as defined in Rule 30a-3(d) under the 1940 Act (17 CFR 270.30a-3(d)) that occurred during the registrant’s second fiscal quarter of the period covered by this report that has materially affected, or is reasonably likely to materially affect, the registrant’s internal control over financial reporting. |
Item 12. Exhibits.
| (a)(1) | Code of ethics, or any amendment thereto, that is the subject of disclosure required by Item 2 is attached hereto. |
| (a)(2) | Certifications pursuant to Rule 30a-2(a) under the 1940 Act and Section 302 of the Sarbanes-Oxley Act of 2002 are attached hereto. |
| (a)(3) | Not applicable. |
| (b) | Certifications pursuant to Rule 30a-2(b) under the 1940 Act and Section 906 of the Sarbanes-Oxley Act of 2002 are attached hereto. |
| (12.other) | Not applicable. |
SIGNATURES
Pursuant to the requirements of the Securities Exchange Act of 1934 and the Investment Company Act of 1940, the registrant has duly caused this report to be signed on its behalf by the undersigned, thereunto duly authorized.
| (Registrant) | Touchstone Funds Group Trust |
| By (Signature and Title)* | /s/ Jill T. McGruder |
| Jill T. McGruder, President | |
| (principal executive officer) | |
| Date | 12/03/14 |
Pursuant to the requirements of the Securities Exchange Act of 1934 and the Investment Company Act of 1940, this report has been signed below by the following persons on behalf of the registrant and in the capacities and on the dates indicated.
| By (Signature and Title)* | /s/ Jill T. McGruder |
| Jill T. McGruder, President | |
| (principal executive officer) | |
| Date | 12/03/14 |
| By (Signature and Title)* | /s/ Terrie A. Wiedenheft |
| Terrie A. Wiedenheft, Controller and Treasurer | |
| (principal financial officer) | |
| Date | 12/03/14 |
* Print the name and title of each signing officer under his or her signature.