As filed with the Securities and Exchange Commission on May 30, 2017
File No. 333-
UNITED STATES
SECURITIES AND EXCHANGE COMMISSION
Washington, D.C. 20549
FORM N-14
REGISTRATION STATEMENT UNDER THE SECURITIES ACT OF 1933
¨Pre-Effective Amendment No. __ ¨ Post-Effective Amendment No. __
(Check appropriate box or boxes)
Touchstone Funds Group Trust
(Exact Name of Registrant as Specified in Charter)
(800) 638-8194
(Area Code and Telephone Number)
303 Broadway, Suite 1100
Cincinnati, Ohio 45202
(Address of Principal Executive Offices: Number, Street, City, State, Zip Code)
Jill T. McGruder
303 Broadway, Suite 1100
Cincinnati, Ohio 45202
(Name and Address of Agent for Service)
Copies to:
Deborah Bielicke Eades, Esq.
Vedder Price P.C.
222 North LaSalle Street
Chicago, Illinois 60601
(312) 609-7661
Renee M. Hardt, Esq.
Vedder Price P.C.
222 North LaSalle Street
Chicago, Illinois 60601
(312) 609-7616
Approximate Date of Proposed Public Offering: As soon as practicable after this Registration Statement becomes effective under the Securities Act of 1933, as amended.
Shares of beneficial interest, $0.01 par value per share, of the Touchstone Active Bond Fund and Touchstone Ultra Short Duration Fixed Income Fund, each a series of the Registrant, are being registered. No filing fee is due because Registrant is relying on Section 24(f) of the Investment Company Act of 1940, as amended.
The Registrant hereby amends this Registration Statement on such date or dates as may be necessary to delay its effective date until the Registrant shall file a further amendment which specifically states that this Registration Statement shall thereafter become effective in accordance with Section 8(a) of the Securities Act of 1933 or until this Registration Statement shall become effective on such date as the Securities and Exchange Commission, acting pursuant to said Section 8(a), may determine.
Sentinel GROUP funds, INC.
One National Life Drive
Montpelier, Vermont 05604
800-282-3863
June [•], 2017
Dear Shareholder:
The Board of Directors of Sentinel Group Funds, Inc., a Maryland corporation (“Sentinel Funds”), has called a joint special meeting of shareholders (the “Special Meeting”) of the series of Sentinel Funds listed in the table below under the heading Target Funds (each a “Target Fund” and collectively, the “Target Funds”) to be held at the offices of Sentinel Funds, One National Life Drive, Montpelier, Vermont 05604, on August 23, 2017 at 11:00 a.m., Eastern time. The purpose of the Special Meeting is to vote on an important proposal that affects your investment in your Target Fund.
On April 18, 2017, Sentinel Asset Management, Inc. (“Sentinel”) entered into an agreement to sell its mutual fund asset management business to Touchstone Advisors, Inc. (“Touchstone Advisors”), investment advisor to the Touchstone family of mutual funds and an indirect, wholly-owned subsidiary of Western & Southern Mutual Holding Company (the “Transaction”). Currently, Touchstone Advisors’ retail mutual fund platform includes 35 separate mutual funds that are managed by Touchstone Advisors and sub-advised by various institutional investment managers (the “Touchstone Funds”).
In connection with Sentinel’s decision to exit the mutual fund asset management business, Sentinel recommended and the Board of Directors of Sentinel Funds approved an Agreement and Plan of Reorganization with respect to each Target Fund pursuant to which the Target Fund would be reorganized (each, a “Reorganization” and collectively, the “Reorganizations”) into a corresponding Touchstone Fund as set forth in the table below under the heading Acquiring Funds (each, an “Acquiring Fund” and collectively, the “Acquiring Funds”).
| Target Funds | | Acquiring Funds |
| | | |
| Sentinel Government Securities Fund | | Touchstone Active Bond Fund, a series of Touchstone Funds Group Trust |
| Sentinel Total Return Bond Fund | | Touchstone Active Bond Fund, a series of Touchstone Funds Group Trust |
| Sentinel Low Duration Bond Fund | | Touchstone Ultra Short Duration Fixed Income Fund, a series of Touchstone Funds Group Trust |
| Sentinel Multi-Asset Income Fund | | Touchstone Flexible Income Fund, a series of Touchstone Strategic Trust |
| Sentinel Sustainable Core Opportunities Fund | | Touchstone Sustainability and Impact Equity Fund, a series of Touchstone Strategic Trust |
| Sentinel Balanced Fund | | Touchstone Balanced Fund, a newly created series of Touchstone Strategic Trust |
| Sentinel Common Stock Fund | | Touchstone Large Cap Focused Fund, a newly created series of Touchstone Strategic Trust |
| Sentinel International Equity Fund | | Touchstone International Equity Fund, a newly created series of Touchstone Strategic Trust |
| Sentinel Small Company Fund | | Touchstone Small Company Fund, a newly created series of Touchstone Strategic Trust |
The Board of Directors of Sentinel Funds believes that the proposed Reorganizations are in the best interests of the Target Funds and recommends that you vote FOR the proposed Reorganization of your Target Fund.
We have enclosed a Joint Proxy Statement/Prospectus that describes each Reorganization proposal in greater detail, as well as important information about the Acquiring Funds. Your vote is extremely important, so please read the entire Joint Proxy Statement/Prospectus. Please contact our proxy solicitor, Broadridge Financial Solutions, Inc., at 855-928-4492 with any questions.
Thank you for your consideration of this important proposal.
| | Sincerely, |
| | |
| | Lisa F. Muller
Secretary, Sentinel Group Funds, Inc. |
sentinel GROUP FUNDs, INC.
One National Life Drive
Montpelier, Vermont 05604
800-282-3863
NOTICE OF JOINT SPECIAL MEETING OF SHAREHOLDERS
TO BE HELD ON AUGUST 23, 2017
To the Shareholders:
Notice is hereby given that a joint special meeting of shareholders of the series of Sentinel Group Funds, Inc., a Maryland corporation, identified in the table below (each, a “Target Fund” and collectively, the “Target Funds”) will be held at the offices of Sentinel Group Funds, Inc., One National Life Drive, Montpelier, Vermont 05604, on August 23, 2017 at 11:00 a.m., Eastern time, and any adjournment or postponement thereof (the “Special Meeting”).
At the Special Meeting, shareholders of each Target Fund will be asked to consider a proposal to approve an Agreement and Plan of Reorganization (the “Plan”) between Touchstone Strategic Trust or Touchstone Funds Group Trust, as applicable, on behalf of the applicable series thereof identified in the table below (each, an “Acquiring Fund” and collectively, the “Acquiring Funds”) and Sentinel Group Funds, Inc., on behalf of the applicable Target Fund, providing for (i) the transfer of all the assets of the Target Fund to the Acquiring Fund in exchange solely for shares of the Acquiring Fund as set forth in the table below and the assumption by the Acquiring Fund of the liabilities (other than certain excluded liabilities) of the Target Fund, as described in the Plan; (ii) the pro rata distribution, by class, to the Target Fund’s shareholders of the shares of the Acquiring Fund as set forth in the table below; and (iii) the termination of the Target Fund (each, a “Reorganization” and collectively, the “Reorganizations”).
Target Funds and Share Classes | | Acquiring Funds and Corresponding Share
Classes |
| Sentinel Government Securities Fund | | Touchstone Active Bond Fund |
| Class A | | Class A |
| Class C | | Class C |
| Class I | | Class Y |
| Sentinel Total Return Bond Fund | | Touchstone Active Bond Fund |
| Class A | | Class A |
| Class C | | Class C |
| Class I | | Class Y |
| Class R3 | | Class A |
| Class R6 | | Class Y |
| Sentinel Low Duration Bond Fund | | Touchstone Ultra Short Duration Fixed Income Fund |
| Class A | | Class A |
| Class I | | Class Y |
| Class S | | Class S |
| Sentinel Multi-Asset Income Fund | | Touchstone Flexible Income Fund |
| Class A | | Class A |
| Class C | | Class C |
| Class I | | Class Y |
Target Funds and Share Classes | | Acquiring Funds and Corresponding Share
Classes |
| Sentinel Sustainable Core Opportunities Fund | | Touchstone Sustainability and Impact Equity Fund |
| Class A | | Class A |
| Class I | | Class Y |
| Sentinel Balanced Fund | | Touchstone Balanced Fund |
| Class A | | Class A |
| Class C | | Class C |
| Class I | | Class Y |
| Sentinel Common Stock Fund | | Touchstone Large Cap Focused Fund |
| Class A | | Class A |
| Class C | | Class C |
| Class I | | Class Y |
| Class R6 | | Institutional Class |
| Sentinel International Equity Fund | | Touchstone International Equity Fund |
| Class A | | Class A |
| Class C | | Class C |
| Class I | | Class Y |
| Sentinel Small Company Fund | | Touchstone Small Company Fund |
| Class A | | Class A |
| Class C | | Class C |
| Class I | | Class Y |
| Class R6 | | Class R6 |
The Board of Directors of Sentinel Group Funds, Inc. has fixed the close of business on June 21, 2017 as the record date for determination of shareholders entitled to notice of and eligible to vote at the Special Meeting.
Please complete, sign, date and return your proxy card in the postage paid return envelope or otherwise vote promptly regardless of the number of shares owned.
Even if you expect to attend the Special Meeting, shareholders are requested to complete, sign, date and return the enclosed proxy card in the enclosed envelope, which needs no postage if mailed in the United States. Shareholders may also authorize a proxy by telephone or via the Internet. Instructions for the proper execution of the proxy card are set forth immediately following this notice or, with respect to telephone or Internet voting, on the proxy card. It is important that you vote promptly.
Important Notice Regarding the Availability of Proxy Materials for the Special Meeting to be held on August 23, 2017: The Notice of Joint Special Meeting of Shareholders, Joint Proxy Statement/Prospectus, annual and semi-annual reports and form of proxy are available on the Internet at www.sentinelinvestments.com. For more information, shareholders may contact Sentinel Funds at P.O. Box 55929-5929, Boston, Massachusetts 02205 or 1-800-282-3863.
| | Sincerely, |
| | |
| | Lisa F. Muller
Secretary, Sentinel Group Funds, Inc. |
INSTRUCTIONS FOR SIGNING PROXY CARDS
The following general rules for signing proxy cards may be of assistance to you and avoid the time and expense in validating your vote if you fail to sign your proxy card properly.
1. Individual Accounts: Sign your name exactly as it appears in the registration on the proxy card.
2. Joint Accounts: Either party may sign, but the name of the party signing should conform exactly to the name shown in the registration on the proxy card.
3. All Other Accounts: The capacity of the individual signing the proxy card should be indicated unless it is reflected in the form of registration. For example:
Registration | | Valid Signature |
| Corporate Accounts | | |
| (1) ABC Corp. | | ABC Corp. |
| (2) ABC Corp | | John Doe, Treasurer |
| (3) ABC Corp. c/o John Doe, Treasurer | | John Doe |
| (4) ABC Corp. Profit Sharing Plan | | John Doe, Trustee |
| Trust Accounts | | |
| (1) ABC Trust | | Jane B. Doe, Trustee |
| (2) Jane B. Doe, Trustee u/t/d 12/28/78 | | Jane B. Doe |
| Custodial or Estate Accounts | | |
| (1) John B. Smith, Cust. f/b/o John B. Smith, Jr. UGMA | | John B. Smith |
| (2) Estate of John B. Smith | | John B. Smith, Jr., Executor |
Every shareholder’s vote is important!
Please complete, sign, date and return your
proxy card today!
Your proxy vote is important!
The information contained in this Joint Proxy Statement/Prospectus is not complete and may be changed. We may not sell these securities until the registration statement filed with the Securities and Exchange Commission is effective. This Joint Proxy Statement/Prospectus is not an offer to sell these securities, and it is not a solicitation of an offer to buy these securities, in any jurisdiction where the offer or sale is not permitted.
SUBJECT TO COMPLETION,
DATED MAY 30, 2017
joint PROXY STATEMENT
of
Sentinel GROUP funds, INC.
One National Life Drive
Montpelier, Vermont 05604
800-282-3863
and
JOINT PROSPECTUS
OF
TOUCHSTONE STRATEGIC TRUST
and
TOUCHSTONE FUNDS GROUP TRUST
303 Broadway, Suite 1100
Cincinnati, Ohio 45202
800.543.0407
June [•], 2017
This Joint Proxy Statement/Prospectus is being furnished to shareholders of the series of Sentinel Group Funds, Inc., a Maryland corporation (“Sentinel Funds”), listed below (each a “Target Fund” and collectively, the “Target Funds”). The Board of Directors of Sentinel Funds (the “Sentinel Funds Board”) has called a joint special meeting of shareholders of the Target Funds to be held at the offices of Sentinel Funds, One National Life Drive, Montpelier, Vermont 05604, on August 23, 2017 at 11:00 a.m., Eastern time, and any adjournment or postponement thereof (the “Special Meeting”). This Joint Proxy Statement/Prospectus and the enclosed proxy are first being sent to shareholders of the Target Funds on or about [•], 2017.
Shareholders of record of each Target Fund as of the close of business on June 21, 2017 (the “Record Date”) are entitled to notice of and eligible to vote at the Special Meeting. At the Special Meeting, shareholders of each Target Fund will be asked to consider a proposal to approve an Agreement and Plan of Reorganization (the “Plan”) between Touchstone Strategic Trust or Touchstone Funds Group Trust, as applicable, on behalf of the applicable series thereof identified in the table below (each, an “Acquiring Fund” and collectively, the “Acquiring Funds”), and Sentinel Funds, on behalf of the applicable Target Fund, providing for (i) the transfer of all the assets of the Target Fund to the Acquiring Fund in exchange solely for shares of the Acquiring Fund as set forth in the table below and the assumption by the Acquiring Fund of the liabilities (other than certain excluded liabilities) of the Target Fund, as described in the Plan; (ii) the pro rata distribution, by class, to the Target Fund’s shareholders of such shares of the Acquiring Fund; and (iii) the termination of the Target Fund (each, a “Reorganization” and collectively, the “Reorganizations”).
The following table shows each Target Fund and the corresponding Acquiring Fund, as well as the share class of the Acquiring Fund that will be issued to holders of each share class of the Target Fund.
Target Funds and Share Classes | | Acquiring Funds and Corresponding Share
Classes |
| Sentinel Government Securities Fund | | Touchstone Active Bond Fund, a series of Touchstone Funds Group Trust |
| Class A | | Class A |
| Class C | | Class C |
| Class I | | Class Y |
| Sentinel Total Return Bond Fund | | Touchstone Active Bond Fund, a series of Touchstone Funds Group Trust |
| Class A | | Class A |
| Class C | | Class C |
| Class I | | Class Y |
| Class R3 | | Class A |
| Class R6 | | Class Y |
| Sentinel Low Duration Bond Fund | | Touchstone Ultra Short Duration Fixed Income Fund, a series of Touchstone Funds Group Trust |
| Class A | | Class A |
| Class I | | Class Y |
| Class S | | Class S |
| Sentinel Multi-Asset Income Fund | | Touchstone Flexible Income Fund, a series of Touchstone Strategic Trust |
| Class A | | Class A |
| Class C | | Class C |
| Class I | | Class Y |
| Sentinel Sustainable Core Opportunities Fund | | Touchstone Sustainability and Impact Equity Fund, a series of Touchstone Strategic Trust |
| Class A | | Class A |
| Class I | | Class Y |
| Sentinel Balanced Fund | | Touchstone Balanced Fund, a newly created series of Touchstone Strategic Trust |
| Class A | | Class A |
| Class C | | Class C |
| Class I | | Class Y |
| Sentinel Common Stock Fund | | Touchstone Large Cap Focused Fund, a newly created series of Touchstone Strategic Trust |
| Class A | | Class A |
| Class C | | Class C |
| Class I | | Class Y |
| Class R6 | | Institutional Class |
| Sentinel International Equity Fund | | Touchstone International Equity Fund, a newly created series of Touchstone Strategic Trust |
| Class A | | Class A |
| Class C | | Class C |
| Class I | | Class Y |
Target Funds and Share Classes | | Acquiring Funds and Corresponding Share
Classes |
| Sentinel Small Company Fund | | Touchstone Small Company Fund, a newly created series of Touchstone Strategic Trust |
| Class A | | Class A |
| Class C | | Class C |
| Class I | | Class Y |
| Class R6 | | Class R6 |
The Reorganizations are expected to be completed on October 13, 2017, or as soon as practicable thereafter.
Each Target Fund and each Acquiring Fund is a series of a registered open-end management investment company (mutual funds). The following Acquiring Funds are each currently operating mutual funds: Touchstone Active Bond Fund, Touchstone Ultra Short Duration Fixed Income Fund, Touchstone Flexible Income Fund and Touchstone Sustainability and Impact Equity Fund (each, an “Operating Fund” and collectively, the “Operating Funds”). Touchstone Balanced Fund, Touchstone Large Cap Focused Fund, Touchstone International Equity Fund and Touchstone Small Company Fund (each, a “Shell Fund” and collectively, the “Shell Funds”) are each newly organized series of Touchstone Strategic Trust that have been created solely for the purpose of completing the applicable Reorganization and will not commence operations prior to the closing of the Reorganization. Touchstone Strategic Trust and Touchstone Funds Group Trust are sometimes referred to in this Joint Proxy Statement/Prospectus individually as an “Acquiring Trust” and collectively as the “Acquiring Trusts.” The Board of Trustees of each Acquiring Trust is comprised of the same individual board members (the “Touchstone Funds Board”). The Target Funds and the Acquiring Funds are sometimes referred to in this Joint Proxy Statement/Prospectus individually as a “Fund” and collectively as the “Funds.”
This Joint Proxy Statement/Prospectus, which you should read carefully and retain for future reference, presents the information that you should know about the Funds and the Reorganizations. This document also serves as a prospectus for the offering and issuance of the shares of each Acquiring Fund to be issued in the Reorganizations. Statements of Additional Information (“SAIs”) dated [•], 2017 relating to this Joint Proxy Statement/Prospectus and the Reorganizations have been filed with the U.S. Securities and Exchange Commission (the “SEC”) and are incorporated by reference into this Joint Proxy Statement/Prospectus (meaning that they are legally considered to be part of this Joint Proxy Statement/Prospectus).
Additional information concerning the Target Funds and the Operating Funds is contained in the documents described below, all of which have been filed with the SEC. Each document is incorporated by reference into this Joint Proxy Statement/Prospectus only insofar as it relates to the Target Funds and the Operating Funds. No other parts of such documents are incorporated by reference herein. Because the Shell Funds have not yet commenced operations as of the date of this Joint Proxy Statement/Prospectus, no prospectuses, SAIs or annual or semi-annual reports are available for the Shell Funds at this time.
Information About the Target Funds: | | How to Obtain this Information: |
| Prospectus, dated March 30, 2017, as supplemented through the date of this Joint Proxy Statement/Prospectus (File Nos. 811-00214; 002-10685) | | On file with the SEC (www.sec.gov) (Accession No. 0001144204-17-017719 filed March 30, 2017) |
| Statement of Additional Information, March 30, 2017, as supplemented through the date of this Joint Proxy Statement/Prospectus (File Nos. 811-00214; 002-10685) | | On file with the SEC (www.sec.gov) (Accession No. 0001144204-17-017719 filed March 30, 2017) |
| Annual Report for Sentinel Group Funds, Inc., for the fiscal year ended November 30, 2016 (File Nos. 811-00214; 002-10685) | | On file with the SEC (www.sec.gov) (Accession No. 0001144204-17-006110 filed February 6, 2017) |
Information About the Operating Funds: | | How to Obtain this Information: |
| Prospectus for Touchstone Strategic Trust, dated July 30, 2016, as supplemented through the date of this Joint Proxy Statement/Prospectus (File Nos. 811-03651; 002-80859) | | On file with the SEC (www.sec.gov) (Accession No. 0000711080-16-000093 filed July 28, 2016) |
| Statement of Additional Information for Touchstone Strategic Trust, dated July 30, 2016, as supplemented through the date of this Joint Proxy Statement/Prospectus (File Nos. 811-03651; 002-80859) | | On file with the SEC (www.sec.gov) (Accession No. 0000711080-16-000093 filed July 28, 2016) |
| Annual Report for Touchstone Strategic Trust, for the fiscal year ended March 31, 2017 (File Nos. 811-03651; 002-80859) | | On file with the SEC (www.sec.gov) (Accession No.__________) |
| Prospectus for Touchstone Funds Group Trust, dated January 30, 2017, as supplemented through the date of this Joint Proxy Statement/Prospectus (File Nos. 811-08104; 033-70958) | | On file with the SEC (www.sec.gov) (Accession No. 0000914243-17-000005 filed January 27, 2017) |
| Statement of Additional Information for Touchstone Funds Group Trust, dated January 30, 2017, as supplemented through the date of this Joint Proxy Statement/Prospectus (File Nos. 811-08104; 033-70958) | | On file with the SEC (www.sec.gov) (Accession No. 0000914243-17-000005 filed January 27, 2017) |
| Annual Report for Touchstone Funds Group Trust, for the fiscal year ended September 30, 2016 (File Nos. 811-08104; 033-70958) | | On file with the SEC (www.sec.gov) (Accession No. 0001144204-16-137153 filed November 30, 2016) |
| Semi-Annual Report for Touchstone Funds Group Trust, for the period ended March 31, 2017 (File Nos. 811-08104; 033-70958) | | On file with the SEC (www.sec.gov) (Accession No.__________) |
| Annual Report for Touchstone Investment Trust for the fiscal year ended September 30, 2016 (File Nos. 811-02538; 002-52242 | | On file with the SEC (www.sec.gov) (Accession No. 0001144204-16-137138 filed November 30, 2016) |
You can also obtain copies of any of the above-referenced documents without charge on the EDGAR database on the SEC’s Internet site at http://www.sec.gov. Copies are available for a fee by electronic request at the following e-mail address: publicinfo@sec.gov, or from the Public Reference Section, Securities and Exchange Commission, Washington, D.C. 20549-1520. Copies of above-referenced documents relating to the Target Funds may also be obtained upon oral or written request without charge by calling 800.282.3863, on the Target Funds’ website at www.sentinelinvestments.com or by writing to Sentinel Investments at P.O. Box 55929, Boston, Massachusetts 02205. Copies of above-referenced documents relating to the Acquiring Funds may also be obtained upon oral or written request without charge by calling 800.543.0407, on the Acquiring Funds’ website at TouchstoneInvestments.com or by writing to Touchstone Strategic Trust or Touchstone Funds Group Trust, as applicable, at P.O. Box 9878, Providence, Rhode Island 02940.
THE SECURITIES AND EXCHANGE COMMISSION HAS NOT DETERMINED THAT THE INFORMATION IN THIS JOINT PROXY STATEMENT/PROSPECTUS IS ACCURATE OR ADEQUATE, NOR HAS IT APPROVED OR DISAPPROVED THESE SECURITIES. ANYONE WHO TELLS YOU OTHERWISE IS COMMITTING A CRIMINAL OFFENSE.
An investment in the Acquiring Funds:
| · | is not a deposit of, or guaranteed by, any bank |
| · | is not insured by the FDIC, the Federal Reserve Board or any other government agency |
| · | is not endorsed by any bank or government agency |
| · | involves investment risk, including possible loss of your original investment |
TABLE OF CONTENTS
TABLE OF CONTENTS
(continued)
Synopsis: Background and General Summary
These questions and answers provide a brief overview of the key features of the Reorganizations and other matters typically of concern to shareholders considering a proposed combination of mutual funds. These questions and answers are qualified in their entirety by the more detailed information contained in the remainder of this Joint Proxy Statement/Prospectus, which you should read carefully and retain for future reference. The description of the Reorganizations is qualified by reference to the full texts of the Agreements and Plans of Reorganization. A form of Agreement and Plan of Reorganization is attached as Exhibit A to this Joint Proxy Statement/Prospectus.
| Q. | What is being proposed? |
| A. | Sentinel Asset Management, Inc. (“Sentinel”), the current investor advisor of your Fund, informed the Sentinel Funds Board of its intent to exit the mutual fund advisory business. Sentinel engaged an investment bank to help identify parties interested in acquiring Sentinel’s mutual fund advisory business. As a result of that search, Sentinel entered into an agreement to sell its mutual fund advisory business to Touchstone Advisors, Inc. (“Touchstone Advisors”), investment advisor to the Touchstone family of mutual funds (the “Transaction”). In connection with the Transaction, Sentinel recommended and the Sentinel Funds Board approved the integration of each of the Target Funds into the Touchstone family of mutual funds (the “Touchstone Funds”). At the Joint Special Meeting of Shareholders, shareholders of each Target Fund are being asked to vote on a proposal to reorganize their Fund into a Touchstone Fund with a similar investment goal and principal investment policies (each, a “Reorganization” and collectively, the “Reorganizations”). |
| Q. | What is the recommendation of the Sentinel Funds Board? |
| A. | At a meeting held on April 24, 2017, the Sentinel Funds Board determined that each Reorganization was in the best interests of the applicable Target Fund and its shareholders. Based on information provided by Sentinel and Touchstone Advisors, the Sentinel Funds Board believes that the Reorganizations will provide shareholders with access to a larger and more diverse family of mutual funds managed by Touchstone Advisors and that the larger distribution platform of the Touchstone family of funds may provide opportunities for asset growth. If realized, these asset growth opportunities may result in greater efficiencies and economies of scale, which in turn could lead to lower overall costs over time. In addition, each Reorganization will provide Target Fund shareholders with an opportunity to continue their investment in a Touchstone Fund with an investment goal and principal investment policies similar to those of the Target Fund through a tax-free reorganization of the Target Fund into the corresponding Acquiring Fund. The Board of Directors of Sentinel Funds recommends that shareholders of each Target Fund approve the Reorganization of their Fund. |
See “Information About the Reorganizations—Sentinel Funds Board Approval of the Reorganizations” for additional information regarding the Sentinel Funds Board’s considerations.
| Q. | How do the fees and expenses of the Funds compare? |
| A. | Touchstone Advisors has contractually agreed to waive fees and reimburse expenses in order to maintain the total annual operating expense ratio for each class of shares of each Acquiring Fund offered hereby to an amount no greater than the total annual operating expense ratio of the corresponding class of shares of the corresponding Target Fund for the fiscal year ended November 30, 2016 (after giving effect to any expense limitation in effect for the Target Fund). This contractual expense limitation will remain in place for a period of at least two years from the closing date of the Reorganization. Absent this expense limitation, and after giving effect to existing Touchstone expense limitation arrangements, the pro forma total annual fund operating expense ratio of certain classes of the Acquiring Funds in the Reorganizations involving each of Sentinel Sustainable Core Opportunities Fund, Sentinel Balanced Fund, Sentinel Common Stock Fund, Sentinel International Equity Fund and Sentinel Small Company Fund would be higher than the total annual fund operating expense ratio before any waivers and reimbursements of the corresponding class of the corresponding Target Fund. Additional information regarding the pro forma fees and expenses for the Funds involved in each Reorganization can be found under the Synopsis for your |
Target Fund’s Reorganization. Additional information regarding expense limitation agreements can be found under “The Funds’ Management—Expense Limitation Agreement.”
| Q. | How do the Funds’ investment goals and principal investment strategies compare? |
| A. | Although each Target Fund and the corresponding Acquiring Fund have similar investment goals and principal investment strategies, there are some differences. In addition, the analytical tools, techniques and investment selection process used by the sub-advisors of the Acquiring Funds to select investments may be different from those used by Sentinel. The section of this Joint Proxy Statement/Prospectus entitled “Synopsis” for your Target Fund’s Reorganization describes in detail the differences between the investment goals and principal investment strategies of each Target Fund and the corresponding Acquiring Fund. |
| Q. | Who will manage the Acquiring Funds after the Reorganizations? |
| A. | Touchstone Advisors currently serves as investment advisor to the existing Touchstone Funds and will serve as the investment advisor to each Acquiring Fund. With respect to each Acquiring Fund, Touchstone Advisors will employ a sub-advisor to provide portfolio management services. The sub-advisors are overseen by Touchstone Advisors and by the Touchstone Funds Board. The Target Funds are managed by Sentinel and do not employ sub-advisors. With respect to the Acquiring Funds into which the Sentinel International Equity Fund and Sentinel Small Company Fund will be reorganized, Fort Washington Investment Advisors, Inc. (“Fort Washington”), an affiliate of Touchstone Advisors, has been appointed as sub-advisor, and the current portfolio management teams of those Target Funds are expected to remain in place after the Reorganizations as employees of Fort Washington. For all other Reorganizations, the portfolio management team of the Acquiring Fund will differ from the current portfolio manager(s) of the applicable Target Fund. For more information on Touchstone Advisors and each of the sub-advisors, please see the sections of the Joint Proxy Statement/Prospectus entitled “Synopsis” for your Target Fund’s Reorganization and “The Funds’ Management.” |
| Q. | What will happen to my existing shares? |
| A. | At the closing, your Target Fund will transfer all of its assets to the Acquiring Fund in exchange for (i) the Acquiring Fund’s assumption of the liabilities (other than certain excluded liabilities) of the Target Fund, as described in the Plan, and (ii) newly issued shares of the Acquiring Fund having a value equal to the aggregate net assets of the Target Fund. Immediately after the Reorganization of your Target Fund, you will own shares of the corresponding Acquiring Fund with an aggregate net asset value equal to the aggregate net asset value of the shares of the Target Fund that you held immediately prior to the closing of the Reorganization (although the number of shares and the net asset value per share may be different). |
| Q. | Will I have to pay federal income taxes as a result of my Target Fund’s Reorganization? |
| A. | Each Reorganization is intended to qualify as a tax-free reorganization for federal income tax purposes. Accordingly, shareholders are not expected to recognize any gain or loss for federal income tax purposes as a direct result of the exchange of their Target Fund shares for shares of the corresponding Acquiring Fund in their Target Fund’s Reorganization. However, shareholders may receive a higher level of taxable distributions as a result of the Reorganization. Prior to the closing of each Reorganization, the Target Fund may distribute all of its net investment income and net capital gains, if any. All or a portion of such distribution may be taxable to the shareholders of such Target Fund and will generally be taxed as ordinary income or capital gains for federal income tax purposes, unless the shareholders are tax-advantaged accounts such as an individual retirement account or 401(k) plan (in which case the owners of such accounts may be taxed upon withdrawal of their investment from such accounts). The tax character of such distributions will be the same regardless of whether they are paid in cash or reinvested in additional shares. |
| | |
2
In addition, a significant portion of the portfolio securities of each Target Fund, other than Sentinel International Equity Fund and Sentinel Small Company Fund, are expected to be sold following the Reorganization. To the extent that portfolio investments received by an Acquiring Fund from a Target Fund in a Reorganization are sold after the Reorganization, the Acquiring Fund may recognize gains or losses, which may result in taxable distributions to shareholders holding shares of the Acquiring Fund (including former Target Fund shareholders who hold shares of the Acquiring Fund following the Reorganization). The section of this Joint Proxy Statement/Prospectus entitled “Information About the Reorganizations—Material Federal Income Tax Consequences” provides additional information regarding the federal income tax consequences of the Reorganizations.
| Q. | Will I have to pay any sales load, commission or other similar fee in connection with the Reorganization? |
| A. | No, you will not pay any sales load, commission or other similar fee in connection with the receipt of Acquiring Fund shares in the Reorganization of your Target Fund, and otherwise applicable investment minimums will not apply with regard to your receipt of Acquiring Fund shares in a Reorganization. If you hold Target Fund shares that are subject to contingent deferred sales charges (certain load-waived Class A shares or Class C shares), the Acquiring Funds will look to the date of purchase of your Target Fund shares for purposes of assessing such contingent deferred sales charges. |
| Q. | What if I redeem my shares before the Reorganization of my Target Fund takes place? |
| A. | If you choose to redeem your Target Fund shares before the Reorganization takes place, then the redemption will be treated as a normal sale of shares and, generally, will be a taxable transaction and may be subject to any applicable redemption fee applied by your Target Fund. |
| Q. | How do the distribution policies of the Funds compare? |
| A. | Like the Target Funds, the Acquiring Funds intend to distribute substantially all of their income and capital gains to their shareholders annually. After the Reorganizations, any income and capital gains will be reinvested in the class of shares of the Acquiring Fund you receive in your Target Fund’s Reorganization or, if you have so elected, distributed in cash. For more information, see the section entitled “Share Classes of the Target Funds and Acquiring Funds—Distribution Policy.” |
| Q. | How do I purchase, exchange and redeem shares after the Reorganizations? |
| A. | Shares of the Target Funds may currently be purchased and redeemed in accordance with the policies of the Sentinel Funds family of funds (the “Sentinel Funds”), and you may exchange shares of the Target Funds for shares of other series of Sentinel Funds, subject to applicable policies and procedures. In connection with the Reorganizations, you will become a shareholder of a Fund that is part of the Touchstone family of funds. You will be able to purchase and redeem shares of your Fund in accordance with the policies of the Touchstone Funds. You may also exchange shares of your Acquiring Fund for shares of other Touchstone Funds, including the other Acquiring Funds, subject to applicable policies and procedures. For more information, see the section entitled “Share Classes of the Target Funds and Acquiring Funds—Distribution Policy.” The Sentinel Funds’ policies and procedures applicable to purchases, exchanges and redemptions are generally comparable to those of the Touchstone Funds. |
| Q. | Who will pay the costs of the Reorganizations? |
| A. | Touchstone Advisors and Sentinel or their respective affiliates will pay the costs of the Reorganizations (other than transaction costs related to the purchase or sale of portfolio securities), including the costs relating to the Special Meeting and this Joint Proxy Statement/Prospectus. The costs of the Reorganizations (other than transaction costs related to the purchase or sale of portfolio securities) will not be borne by the Funds or their shareholders. |
3
| Q. | What is the required vote to approve each Reorganization? |
| A. | In order to take action at the Special Meeting, a quorum of shareholders of a Target Fund must be present. The presence in person or by proxy of the shareholders entitled to cast one-third of all the votes entitled to be cast at such meeting shall constitute a quorum for the purpose of voting on the proposal to approve each Reorganization. Approval of each Reorganization requires the affirmative vote of the holders of a majority of the outstanding voting securities, as defined under the 1940 Act. Under Section 2(a)(42) of the 1940 Act, the vote of a majority of outstanding voting securities of a Target Fund means the vote, at the special meeting of the shareholders of such Target Fund duly called (A) of 67% or more of the voting securities present or represented by proxy at such meeting, if the holders of more than 50% of the outstanding voting securities of such Target Fund are present in person or by proxy or (B) of more than 50% of the outstanding voting securities of such Target Fund, whichever is less. |
| Q. | What will happen if shareholders of one or more Target Funds do not approve the Reorganization or the Transaction is not completed? |
| A. | If the shareholders of a Target Fund do not approve the Reorganization, or other closing conditions are not satisfied or waived, the Reorganization of that Target Fund will not be completed and the Sentinel Funds Board will consider other possible courses of action for that Target Fund, including continuing to operate the Target Fund as a stand-alone fund, reorganizing the Target Fund into another mutual fund or liquidating the Target Fund. The closing of each Reorganization is subject to the satisfaction or waiver of all conditions under the Plan and with respect to the closing of the Transaction which include, among other conditions, that (i) shareholder approvals be obtained for Reorganizations of Target Funds representing, at closing, at least a specified amount of assets, and (ii) shareholder approvals be obtained for the Reorganizations of the Sentinel Common Stock Fund and the Sentinel Small Company Fund. If these and any other closing conditions are not met, then Touchstone Advisors is not obligated to close the Transaction, and absent a waiver from Touchstone Advisors, none of the Reorganizations would be consummated. In that event, the Sentinel Funds Board will consider other possible courses of action for the Target Funds. |
| Q. | What will happen to my account options, such as my automatic investment plan? |
| A. | Your current election with respect to automatic investment plans and systematic withdrawal plans and distributions will be automatically enacted on your new account at Touchstone Funds. Your current bank instructions on file with Sentinel Funds also will be enacted on your Touchstone Funds account. |
| Q. | For Class A shares, will my NAV purchase privileges (eligibility for sales load waivers) be converted or do I need to re-enroll? |
| A. | For the majority of shareholders with NAV privileges those elections will carry over and no action will be required to maintain that election. There are some isolated circumstances which may result in changes to NAV privileges. If this affects your account you will receive a separate communication alerting you to this change. |
| Q. | When will the Reorganizations occur? |
| A. | The Reorganizations are expected to be completed on October 13, 2017, or as soon as practicable thereafter. |
| Q. | Whom should I contact for more information? |
| A. | You can contact our proxy solicitor, Broadridge Financial Solutions, Inc., at 1-855-928-4492. |
4
Synopsis: Reorganization of Sentinel Government Securities Fund into
Touchstone Active Bond Fund
What class of shares of the Acquiring Fund will I receive in the Reorganization?
Shareholders of the Sentinel Government Securities Fund will receive shares of the Touchstone Active Bond Fund, as follows:
| Sentinel Government Securities Fund | | Touchstone Active Bond Fund |
| Class A | | Class A |
| Class C | | Class C |
| Class I | | Class Y |
How do the fees and expenses of the Target Fund and the Acquiring Fund compare?
The tables below describe the fees and expenses that you pay if you buy and hold shares of your Sentinel Fund and the pro forma fees and expenses that you may pay if you buy and hold shares of the corresponding Touchstone Fund under the following two scenarios: (i) assuming that only the Reorganization of the Sentinel Government Securities Fund into the Touchstone Active Bond Fund takes place and (ii) assuming that both the Reorganization of the Sentinel Government Securities Fund into the Touchstone Active Bond Fund and the Reorganization of the Sentinel Total Return Bond Fund into the Touchstone Active Bond Fund (which is also described in this Joint Proxy Statement Prospectus) take place. The pro forma expense ratios project anticipated expenses of the Acquiring Fund following the Reorganizations, but actual expenses may be greater or less than those shown. Expenses for the Class A, Class C and Class I shares of the Sentinel Government Securities Fund are based on the operating expenses incurred by each class of shares of the Fund for the fiscal year ended November 30, 2016. Expenses for the Class A, Class C and Class Y shares of the Touchstone Active Bond Fund are based on the operating expenses incurred by each class of shares of the Fund for the 12-month period ended March 31, 2017. The pro forma fees and expenses for the Class A, Class C and Class Y shares of the Touchstone Active Bond Fund reflect the fees and expenses of the Acquiring Fund and assume that the Reorganization(s) had been completed at the beginning of the 12-month period ended March 31, 2017.
No sales charge will be imposed on the Class A shares of the Acquiring Fund received in connection with the Reorganization. In addition, you may qualify for sales charge discounts for Class A shares if you and your family invest, or agree to invest in the future, at least $25,000 or more in the Sentinel Funds or $50,000 or more in the Touchstone Funds. For the Target Fund, more information about these and other discounts is available from your financial professional and in the section entitled “Share Classes” on page 82 of the Target Fund’s prospectus and “How to Purchase Shares and Reduce Sales Charges” on page 44 of the Target Fund’s SAI. For the Acquiring Fund, more information about these and other discounts is available from your financial professional and in the section entitled “Investing with Touchstone—Class A Shares—Letter of Intent” on page [•] of this Joint Proxy Statement/Prospectus and in the Acquiring Fund’s SAI on page [•].
SHAREHOLDER FEES
(fees paid directly from your investment)
| | | Maximum Sales
Charge (Load)
Imposed on
Purchases (as a
percentage of
offering price) | | Maximum
Deferred Sales
Charge (load) (as a
percentage of the
lower of original
purchase price or
redemption
proceeds) | | Wire
Redemption
Fee |
| Sentinel Government Securities Fund – Class A Shares | | 2.25% | | None | | None |
| Touchstone Active Bond Fund – Class A Shares | | 4.75% | | None(2) | | up to $15 |
5
| | | Maximum Sales
Charge (Load)
Imposed on
Purchases (as a
percentage of
offering price) | | Maximum
Deferred Sales
Charge (load) (as a
percentage of the
lower of original
purchase price or
redemption
proceeds) | | Wire
Redemption
Fee |
| Touchstone Active Bond Fund – Class A Shares Pro Forma | | 4.75%(1)(2) | | None(2) | | up to $15 |
| | | | | | | |
| Sentinel Government Securities Fund – Class C Shares | | None | | 1.00%(2) | | None |
| Touchstone Active Bond Fund – Class C Shares | | None | | 1.00%(2) | | up to $15 |
| Touchstone Active Bond Fund – Class C Shares Pro Forma | | None | | 1.00%(2) | | up to $15 |
| | | | | | | |
| Sentinel Government Securities Fund – Class I Shares | | None | | None | | None |
| Touchstone Active Bond Fund – Class Y Shares | | None | | None | | up to $15 |
| Touchstone Active Bond Fund – Class Y Shares Pro Forma | | None | | None | | up to $15 |
| (1) | No sales charge will be imposed on the Class A shares of the Acquiring Fund received in connection with the Reorganization. |
| | |
| (2) | A deferred sales charge of 1% applies to certain redemptions of Class A shares made within twelve months of purchase if the shares were purchased without an initial sales charge as part of an investment of $1 million or more. If you hold load-waived Class A shares or Class C shares of the Target Fund, the Acquiring Fund will look to the date of purchase of your Target Fund shares for purposes of assessing deferred sales charges on shares received in the Reorganization. |
ANNUAL FUND OPERATING EXPENSES
(expenses that you pay each year as a percentage of the value of your investment)
| | | Sentinel
Government
Securities Fund
(Class A Shares) | | Touchstone
Active
Bond Fund
(Class A
Shares) | | Touchstone
Active
Bond Fund Pro
Forma
(Class A Shares) | | Touchstone Active
Bond Fund Pro
Forma
(Class A Shares)
(both
Reorganizations)(1) |
| Management Fees | | 0.45% | | 0.40% | | 0.40% | | 0.37% |
| Distribution/Service (12b-1) Fees | | 0.20% | | 0.25% | | 0.25% | | 0.25% |
| Other Expenses | | 0.26% | | 0.52% | | 0.36%(2) | | 0.38%(2) |
| Acquired Fund Fees and Expenses(3) | | 0.01% | | 0.01% | | 0.01%(2) | | 0.01%(2) |
| Total Annual Fund Operating Expenses | | 0.92% | | 1.18% | | 1.02% | | 1.01% |
| Fee Waiver | | None | | (0.27%)(4) | | (0.11%)(4)(5) | | (0.10%)(4)(5) |
| Total Annual Fund Operating Expenses After Fee Waiver | | 0.92% | | 0.91% | | 0.91% | | 0.91% |
6
ANNUAL FUND OPERATING EXPENSES
(expenses that you pay each year as a percentage of the value of your investment)
| | | Sentinel
Government
Securities Fund
(Class C Shares) | | Touchstone
Active
Bond Fund
(Class C
Shares) | | Touchstone
Active
Bond Fund Pro
Forma
(Class C Shares) | | Touchstone Active
Bond Fund Pro
Forma
(Class C Shares)
(both
Reorganizations)(1) |
| Management Fees | | 0.45% | | 0.40% | | 0.40% | | 0.37% |
| Distribution/Service (12b-1) Fees | | 1.00% | | 1.00% | | 1.00% | | 1.00% |
| Other Expenses | | 0.27% | | 0.64% | | 0.38%(2) | | 0.32%(2) |
| Acquired Fund Fees and Expenses(3) | | 0.01% | | 0.01% | | 0.01%(2) | | 0.01%(2) |
| Total Annual Fund Operating Expenses | | 1.73% | | 2.05% | | 1.79% | | 1.70% |
| Fee Waiver | | None | | (0.39%)(4) | | (0.13%)(4)(5) | | (0.04%)(4)(5) |
| Total Annual Fund Operating Expenses After Fee Waiver | | 1.73% | | 1.66% | | 1.66% | | 1.66% |
ANNUAL FUND OPERATING EXPENSES
(expenses that you pay each year as a percentage of the value of your investment)
| | | Sentinel
Government
Securities Fund
(Class I Shares) | | Touchstone
Active
Bond Fund
(Class Y
Shares) | | Touchstone
Active
Bond Fund Pro
Forma
(Class Y Shares) | | Touchstone Active
Bond Fund Pro
Forma
(Class Y Shares)
(both
Reorganizations)(1) |
| Management Fees | | 0.45% | | 0.40% | | 0.40% | | 0.37% |
| Distribution/Service (12b-1) Fees | | None | | None | | None | | None |
| Other Expenses | | 0.23% | | 0.48% | | 0.35%(2) | | 0.32%(2) |
| Acquired Fund Fees and Expenses(3) | | 0.01% | | 0.01% | | 0.01%(2) | | 0.01%(2) |
| Total Annual Fund Operating Expenses | | 0.69% | | 0.89% | | 0.76% | | 0.70% |
| Fee Waiver | | —(6) | | (0.23%)(4) | | (0.10%)(4)(5) | | (0.04%)(4)(5) |
| Total Annual Fund Operating Expenses After Fee Waiver | | 0.69% | | 0.66% | | 0.66% | | 0.66% |
| (1) | Represents Pro Forma information if both Sentinel Government Securities Fund and Sentinel Total Return Bond Fund reorganize into the Touchstone Active Bond Fund. |
| (2) | Other Expenses and Acquired Fund Fees and Expenses are estimated based on fees and expenses of the Acquiring Fund, assuming the Reorganization(s) had been consummated as of the beginning of the 12-month period ended March 31, 2017. |
| (3) | Acquired Fund Fees and Expenses are expenses indirectly incurred by the Fund through its investments in one or more underlying funds, including money market funds. Because these costs are indirect, the Total Annual Fund Operating Expenses do not correlate to the ratio of expenses to average net assets in the Fund’s most recent annual report. |
| (4) | Touchstone Advisors has agreed to waive a portion of its fees or reimburse certain Fund expenses (excluding dividend and interest expenses relating to short sales; interest; taxes; brokerage commissions and other transaction costs; portfolio transactions and investment related expenses; other expenditures which are capitalized in accordance with U.S. generally accepted accounting principles; the cost of “Acquired Fund Fees and Expenses,” if any; and other extraordinary expenses not incurred in the ordinary course of business) in order to limit annual Fund operating expenses to 0.90%, 1.65%, and 0.65% of average daily net assets for Classes A, C, and Y shares, respectively. This contractual expense limitation is effective through January 29, 2018, but can be |
7
terminated by a vote of the Touchstone Funds Board if it deems the termination to be beneficial to the Fund’s shareholders. The terms of the contractual expense limitation agreement provide that Touchstone Advisors is entitled to recoup, subject to approval by the Touchstone Funds Board, such amounts waived or reimbursed for a period of up to three years from the year in which Touchstone Advisors reduced its compensation or assumed expenses for the Fund. No recoupment will occur unless the Fund’s expenses are below the lesser of the expense limitation amount in effect (a) at the time of the waiver, or (b) at the time of the reimbursement. Additional information regarding the expense limit is provided under the section entitled “The Funds’ Management—Expense Limitation Agreement”.
| (5) | Effective upon consummation of the Reorganization(s), Touchstone Advisors has contractually agreed to waive fees and/or reimburse certain expenses in order to limit total annual fund operating expenses of each class of shares of the Acquiring Fund to 0.90%, 1.65%, and 0.65% of average daily net assets for Classes A, C, and Y shares, respectively. The contractual expense limitation agreement will have the terms described above in Footnote 4 and will remain in effect for at least two years following the closing of the Reorganization(s). Additional information regarding the expense limit is provided under the section entitled “The Funds’ Management—Expense Limitation Agreement”. |
| (6) | Sentinel has contractually agreed to reimburse certain expenses paid by the Class I shares of the Target Funds to the extent necessary to prevent the total annual fund operating expense ratio of the Class I shares of the Target Funds, on an annualized basis, from exceeding the total annual fund operating expense ratio of the Class A shares of the same Fund. This agreement will continue through March 31, 2018. This agreement may be terminated upon 90 days’ notice by a majority of the non-interested directors of the Sentinel Funds. Additional information regarding the expense limit is provided under the section entitled “The Funds’ Management—Expense Limitation Agreement”. |
Expense Examples. The examples below are intended to help you compare the cost of investing in the Target Fund with cost of investing the Acquiring Fund under the following two scenarios (i) assuming that only the Reorganization of the Sentinel Government Securities Fund into the Touchstone Active Bond Fund takes place and (ii) assuming that both the Reorganization of Sentinel Government Securities Fund into Touchstone Active Bond Fund and the Reorganization of Sentinel Total Return Bond Fund (which is also described in this Joint Proxy Statement/Prospectus) take place. The examples assume that you invest $10,000 in each Fund and then either (i) sell all of your shares at the end of each period indicated below or (ii) keep all of your shares at the end of each period indicated below. The examples also assume that your investment has a 5% annual return and that operating expenses (before fee waivers and expense reimbursements) remain the same. This example also assumes that the current expense limitation agreement for the Touchstone Active Bond Fund will remain in place for one year in each period and the expense limitation agreement that takes effect upon closing of the Reorganization(s) will be in place for two years following the closing of the Reorganization(s). Although your actual costs may be higher or lower, based on these assumptions, your costs would be:
| If shares are redeemed: | | 1 Year | | 3 Years | | 5 Years | | 10 Years |
| Class A Shares | | | | | | | | | | | | | | | | |
| Sentinel Government Securities Fund | | $ | 317 | | | $ | 512 | | | $ | 723 | | | $ | 1,331 | |
| Touchstone Active Bond Fund | | $ | 563 | | | $ | 806 | | | $ | 1,068 | | | $ | 1,816 | |
| Touchstone Active Bond Fund Pro Forma | | $ | 563 | | | $ | 763 | | | $ | 991 | | | $ | 1,644 | |
| Touchstone Active Bond Fund Pro Forma (both Reorganizations) | | $ | 563 | | | $ | 762 | | | $ | 987 | | | $ | 1,635 | |
| Class C Shares | | | | | | | | | | | | | | | | |
| Sentinel Government Securities Fund | | $ | 276 | | | $ | 545 | | | $ | 939 | | | $ | 2,041 | |
| Touchstone Active Bond Fund | | $ | 269 | | | $ | 605 | | | $ | 1,067 | | | $ | 2,348 | |
| Touchstone Active Bond Fund Pro Forma | | $ | 269 | | | $ | 537 | | | $ | 945 | | | $ | 2,083 | |
| Touchstone Active Bond Fund Pro Forma (both Reorganizations) | | $ | 269 | | | $ | 528 | | | $ | 915 | | | $ | 2,002 | |
| Class I Shares/Class Y Shares | | | | | | | | | | | | | | | | |
| Sentinel Government Securities Fund | | $ | 70 | | | $ | 221 | | | $ | 384 | | | $ | 859 | |
| Touchstone Active Bond Fund | | $ | 67 | | | $ | 261 | | | $ | 471 | | | $ | 1,075 | |
| Touchstone Active Bond Fund Pro Forma | | $ | 67 | | | $ | 222 | | | $ | 402 | | | $ | 923 | |
| Touchstone Active Bond Fund Pro Forma (both Reorganizations) | | $ | 67 | | | $ | 216 | | | $ | 382 | | | $ | 863 | |
8
| If shares are not redeemed:(1) | | 1 Year | | 3 Years | | 5 Years | | 10 Years |
| Class C Shares | | | | | | | | | | | | | | | | |
| Sentinel Government Securities Fund | | $ | 176 | | | $ | 545 | | | $ | 939 | | | $ | 2,041 | |
| Touchstone Active Bond Fund | | $ | 169 | | | $ | 605 | | | $ | 1,067 | | | $ | 2,348 | |
| Touchstone Active Bond Fund Pro Forma | | $ | 169 | | | $ | 537 | | | $ | 945 | | | $ | 2,083 | |
| Touchstone Active Bond Fund Pro Forma (both Reorganizations) | | $ | 169 | | | $ | 528 | | | $ | 915 | | | $ | 2,002 | |
| (1) | For holders of all other classes, the costs are the same as set forth above. |
How do the performance records of the Target Fund and the Acquiring Fund compare?
The bar charts and the performance tables below provide some indication of the risks of an investment in each of the Target Fund and the Acquiring Fund by showing how each Fund’s performance has varied from year to year and by showing how each Fund’s average annual returns compare with a broad measure of market performance. Class A returns of the Target Fund shown are based on the 2.25% maximum sales charge currently in effect and are not adjusted to reflect a maximum 4% sales charge in effect from inception through April 10, 2005 and from June 1, 2006 through July 31, 2010. If historical sales charges were reflected, the returns would be lower. Class I share performance of the Target Fund prior to May 4, 2007 (the inception date for the Class I shares) is based on the Target Fund’s Class A share performance, restated to reflect that Class I shares are offered without a sales charge. Past performance of the Target Fund and the Acquiring Fund, before and after taxes, does not necessarily represent how either Fund will perform in the future. Updated performance information for the Target Fund is available on the Target Fund’s website at www.sentinelinvestments.com or by calling 800.282.3863. Updated performance information for the Acquiring Fund is available on the Acquiring Fund’s website at TouchstoneInvestments.com or by calling 800.543.0407.
Sentinel Government Securities Fund
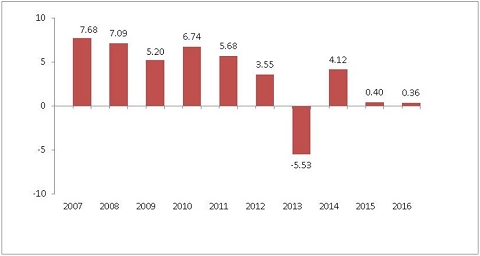
| Best Quarter: 2nd Quarter, 2010 4.13% | Worst Quarter: 2nd Quarter, 2013 (2.88%) |
The Sentinel Government Securities Fund’s calendar year-to-date total return for Class A shares as of March 31, 2017 was 0.41%.
9
Touchstone Active Bond Fund

| Best Quarter: Third Quarter, 2009 7.14% | Worst Quarter: Third Quarter, 2008 (2.68%) |
The Touchstone Active Bond Fund’s calendar year-to-date total return for Class A shares as of March 31, 2017 was 1.11%.
Average Annual Total Returns
For the periods ended December 31, 2016
| Sentinel Government Securities Fund | | Inception
Date | | 1 Year | | 5 Years | | 10 Years |
| Class A (return before taxes) | | 09/02/1986 | | (1.91%) | | 0.06% | | 3.22% |
| Class A (return after taxes on distributions) | | 09/02/1986 | | (2.97%) | | (1.00%) | | 1.78% |
| Class A (return after taxes on distributions and sale of fund shares) | | 09/02/1986 | | (1.07%) | | (0.40%) | | 1.95% |
| Class C (return before taxes) | | 06/01/2006 | | (1.42%) | | (0.28%) | | 2.56% |
| Class I (return before taxes) | | 05/04/2007 | | 0.67% | | 0.77% | | 3.72% |
| Bloomberg Barclays US Government/Mortgage Backed Securities Index(1) (reflects no deduction for fees, expenses or taxes) | | N/A | | 1.31% | | 1.57% | | 4.04% |
| | | | | | | | | |
| Touchstone Active Bond Fund | | Inception
Date | | 1 Year | | 5 Years | | 10 Years |
| Class A (return before taxes) | | 10/03/1994 | | 0.14% | | 1.70% | | 4.10% |
| Class A (return after taxes on distributions) | | 10/03/1994 | | (1.00%) | | 0.36% | | 2.61% |
| Class A (return after taxes on distributions and sale of fund shares) | | 10/03/1994 | | 0.08% | | 0.72% | | 2.57% |
| Class C (return before taxes) | | 10/03/1994 | | 3.32% | | 1.94% | | 3.83% |
| Class Y (return before taxes) | | 04/12/2012 | | 5.28% | | 2.94% | | 4.73% |
| Bloomberg Barclays US Aggregate Bond Index(2) (reflects no deduction for fees, expenses or taxes) | | N/A | | 2.65% | | 2.23% | | 4.34% |
| (1) | The Bloomberg Barclays US Government/Mortgage Backed Securities Index is a is an unmanaged index comprising U.S. Treasuries and agency debentures with maturities of one year or longer and agency mortgage-backed pass-through securities issued by Government National Mortgage Association (GNMA), Federal National Mortgage Association (FNMA), and Federal Home Loan Mortgage Corporation (FHLMC). |
10
| (2) | The Bloomberg Barclays US Aggregate Bond Index measures the U.S. investment grade fixed-rate bond market, with index components for government and corporate securities, mortgage pass-through securities and asset-backed securities. |
After-tax returns are calculated using the historical highest individual federal marginal income tax rates and do not reflect the impact of state and local taxes. Actual after-tax returns depend on an investor’s tax situation and may differ from those shown. The return after taxes on distributions and sale of Fund shares may exceed the return before taxes due to an assumed tax benefit from any losses on a sale of Fund shares at the end of the measurement period. If you hold your Fund shares through a tax-advantaged arrangement, such as an individual retirement account or a 401(k) plan, the after-tax returns do not apply to your situation.
How do the investment goals and principal investment strategies of the Funds compare?
The investment goals and principal investment strategies of the Sentinel Government Securities Fund and the Touchstone Active Bond Fund, along with descriptions of certain differences between the Funds’ investment goals and principal investment policies, are set forth in the table below. Although the Funds have similar investment goals and principal strategies, the analytical tools, techniques and investment selection process used by the sub-advisor to the Acquiring Fund may differ from those used by Sentinel.
| | | Sentinel Government
Securities Fund | | Touchstone Active
Bond Fund | | Differences |
| | | | | | | |
| Investment Goal(s): | | The Fund seeks a high level of current income consistent with the preservation of principal. | | The Fund seeks to provide as high a level of current income as is consistent with the preservation of capital. Capital appreciation is a secondary goal. | | The Acquiring Fund has a secondary investment goal of capital appreciation. |
| | | | | | | |
| Principal Investment Strategy: | | The Fund normally invests at least 80% of its net assets in U.S. government securities and related derivatives. The Fund invests mainly in U.S. government bonds. These bonds include direct obligations of the U.S. Treasury, obligations guaranteed by the U.S. government, and obligations of U.S. government agencies and instrumentalities. | | Under normal circumstances, the Fund invests at least 80% of its assets in bonds. Bonds include mortgage-related securities, asset-backed securities, government securities (both U.S. government securities and foreign sovereign debt), and corporate debt securities. | | The Target Fund focuses on investments in U.S. government securities and related derivatives. The Acquiring Fund may invest broadly in bonds, including both government and corporate debt securities. |
| | | | | | | |
| Credit Quality: | | While the Fund invests mainly in U.S. government bonds, the Fund has no stated credit quality policy. | | Up to 30% of the Fund’s total assets may be invested in non-investment-grade debt securities rated as low as B by a Nationally Recognized Statistical Rating Organization. Non-investment-grade debt securities are often referred to as “junk bonds” and are considered speculative. | | The Acquiring Fund may invest in non-investment-grade debt securities. While the Target Fund has no stated credit quality policy, it generally does not invest in non-investment-grade debt securities. |
11
| | | Sentinel Government
Securities Fund | | Touchstone Active
Bond Fund | | Differences |
| | | | | | | |
| Non-U.S. Investments: | | The Fund does not invest in securities of non-U.S. issuers. | | The Fund may invest up to 20% of its total assets in foreign-issued debt securities denominated in either the U.S. dollar or a foreign currency. Foreign-issued debt securities may include debt securities of emerging market countries. | | The Acquiring Fund has exposure to non-U.S. issuers; the Target Fund does not. |
| | | | | | | |
| Derivatives and Other Investments: | | The Fund may use derivative instruments (e.g., exchange-traded derivatives such as futures and options, and other derivatives such as swap agreements, options on swaps and interest rate caps and floors) for investment purposes, such as replicating permitted investments, as long as such investments do not have the effect of leveraging portfolio risks. | | In order to implement its investment strategy, the Fund may invest in mortgage dollar-roll transactions and reverse repurchase agreements, and in derivatives, including forwards, futures contracts, interest rate and credit default swap agreements, and options. | | While there are certain differences, each Fund may invest in a broad range of derivative instruments. The Target Fund has a stated policy that its use of derivatives may not result in leverage. |
| | | | | | | |
| Hedging: | | The Fund may also use derivative instruments in order to hedge various risks, such as interest rate, credit and currency risk. The Fund is not required to use hedging and may choose not to do so. | | The Fund may use mortgage dollar-roll transactions, reverse repurchase agreements and derivatives to gain or hedge market exposure, to adjust the Fund’s duration, to manage interest rate risk, and for any other purposes consistent with the Fund’s investment strategies and limitations. | | While there are certain differences, each Fund may, but is not required to, hedge risks using a variety of derivatives. |
| | | | | | | |
| Active Trading: | | The Fund utilizes an active trading approach, which is expected to result in portfolio turnover greater than 100%. | | The Fund may engage in frequent and active trading as part of its principal investment strategies. | | — |
Additional Information About the Funds’ Principal Investment Policies
Target Fund. The Target Fund is not required to invest set amounts in any of the various types of U.S. government securities set forth in the table above. The Target Fund’s investment advisor, Sentinel, will choose the types of U.S. government securities that it believes will provide capital preservation and the best return with the least risk in light of its analysis of current market conditions and its outlook for interest rates and the economy.
The Target Fund invests substantially in U.S. government mortgage-backed securities (“MBS”) issued and/or guaranteed by the Federal National Mortgage Association (“FNMA” or “Fannie Mae”), the Federal Home Loan Mortgage Corporation (“FHLMC” or “Freddie Mac”) and the Government National Mortgage Association (“GNMA” or “Ginnie Mae”). The Target Fund may also purchase or sell agency MBS on a “to be announced” or “TBA” basis, where the Target Fund buys or sells agency MBS on a forward commitment basis. In a TBA securities transaction, the seller of the agency MBS agrees on a sale price, but does not specify which particular
12
securities will be delivered to the buyer on settlement day. Instead, only a few basic characteristics of the securities are agreed upon, such as the coupon rate and the face value. The Target Fund may engage in short sales of agency MBS that the Target Fund does not own, primarily as part of a TBA swap transaction. A TBA swap transaction involves an agreement to purchase one agency MBS and a simultaneous agreement to sell a different agency MBS.
The Target Fund may sell a security if the security is overvalued on a relative basis compared to other securities available in the market or for duration management purposes. The Target Fund may also sell a security to meet redemptions.
Acquiring Fund. In deciding what securities to buy and sell for the Acquiring Fund, the Acquiring Fund’s sub-advisor, Fort Washington, analyzes the overall investment opportunities and risks in different sectors of the debt securities markets by focusing on maximizing total return while reducing volatility of the Acquiring Fund’s portfolio. Fort Washington follows a disciplined sector allocation process in order to build a diversified portfolio of investments.
How do the principal risks of investing in the Funds compare?
An investment in each Fund is subject to derivatives risk, fixed-income securities risk and portfolio turnover risk. An investment in the Sentinel Government Securities Fund is also subject to short sales risk and TBA securities risk. An investment in the Touchstone Active Bond Fund is also subject to foreign securities risk including emerging markets risk, leverage risk, management risk and mortgage dollar roll risk, as well as additional fixed-income securities risks including non-investment grade debt securities risk. For more information on the Funds’ principal risks, see “Comparison of Principal Risks.”
Who will be the Advisor, Sub-Advisor and Portfolio Managers of my Fund after the Reorganization?
Sentinel is the investment advisor to Sentinel Government Securities Fund. The portfolio managers of Sentinel Government Securities Fund are Jason Doiron and Peter Hassler.
After the Reorganization, Touchstone Advisors will serve as the investment advisor and Fort Washington will serve as the sub-advisor to Touchstone Active Bond Fund. The portfolio managers of Touchstone Active Bond Fund are Timothy J. Policinski and Daniel J. Carter. For additional information regarding the advisor, sub-advisor and portfolio managers listed above, please see the section entitled “The Funds’ Management—Investment Advisor” and “The Funds’ Management—Sub-Advisors and Portfolio Managers.”
What are the portfolio turnover rates of the Funds?
A Fund pays transaction costs, such as brokerage commissions, when it buys and sells securities (or “turns over” its portfolio). A higher portfolio turnover rate may indicate higher transaction costs and may result in higher taxes when Fund shares are held in a taxable account. These costs, which are not reflected in annual fund operating expenses or in the example, affect a Fund’s performance. During the fiscal year ended November 30, 2016, the Target Fund’s portfolio turnover rate was 59% of the average value of its portfolio. During the fiscal year ended September 30, 2016, the portfolio turnover rate of the Acquiring Fund was 590% of the average value of its portfolio.
Will there be any repositioning of the portfolio after the Reorganization?
It is expected that a significant portion (approximately two-thirds) of the portfolio investments of the Target Fund may be sold by the Acquiring Fund following the Reorganization. However, the timing of any repositioning and its resulting impact on capital gains distributions in 2017 and beyond is uncertain. The amounts per share of any capital gains distributions resulting from the repositioning will depend on a number of factors, including the proportion of portfolio holdings that are actually sold, the timing of portfolio sales, the performance of the bond market in general, the availability of offsetting capital losses and the scale of purchase and redemption activity in the Funds' shares. The timing of portfolio sales will also be subject to market conditions existing after the closing of the Reorganization. Accordingly, the per share amounts of any capital gains distributions resulting from the repositioning cannot be estimated at this time. Touchstone Advisors publishes estimates of capital gains distributions for the Touchstone Funds on its website (https://www.touchstoneinvestments.com/literature-center/taxplanning.htm), generally in October of each year. The Acquiring Fund will also bear brokerage costs in connection with the repositioning. For illustration purposes only, if the Reorganization had been completed as of March 31, 2017 and the Acquiring Fund had sold on a pro rata basis two-thirds of the investments held in the Target Fund's portfolio as of March 31, 2017, the resulting realized capital gains estimate would be expected to total $0.02 per share of the combined fund and the brokerage commissions would be expected to total approximately $145,000 in the aggregate, or $0.005 per share of the combined fund, based on average commission costs of the Acquiring Fund. Under the same circumstances, if only one-third of the investments held in the Target Fund's portfolio had been repositioned as of March 31, 2017, the resulting realized capital gains and brokerage cost estimates would be reduced by half, to $0.01 and $0.003 per share of the combined fund, respectively.
13
Synopsis: Reorganization of Sentinel Total Return Bond Fund into Touchstone Active Bond Fund
What class of shares of the Acquiring Fund will I receive in the Reorganization?
Shareholders of the Sentinel Total Return Bond Fund will receive shares of the Touchstone Active Bond Fund, as follows:
| Sentinel Total Return Bond Fund | | Touchstone Active Bond Fund |
| Class A | | Class A |
| Class C | | Class C |
| Class I | | Class Y |
| Class R3 | | Class A |
| Class R6 | | Class Y |
How do the fees and expenses of the Target Fund and the Acquiring Fund compare?
The tables below describe the fees and expenses that you pay if you buy and hold shares of your Sentinel Fund and the pro forma fees and expenses that you may pay if you buy and hold shares of the corresponding Touchstone Fund under the following two scenarios (i) assuming that only the Reorganization of the Sentinel Total Return Bond Fund into the Touchstone Active Bond Fund takes places and (ii) assuming that both the Reorganization of the Sentinel Total Return Bond Fund into the Touchstone Active Bond Fund and the Reorganization of the Sentinel Government Securities Fund into the Touchstone Active Bond Fund (which is also described in this Joint Proxy Statement/Prospectus) take place. The pro forma expense ratios project anticipated expenses of the Acquiring Fund following Reorganizations, but actual expenses may be greater or less than those shown. Expenses for the Class A, Class C, Class I, Class R3 and Class R6 shares of the Sentinel Total Return Bond Fund are based on the operating expenses incurred by each class of shares of the Fund for the fiscal year ended November 30, 2016. Expenses for the Class A, Class C and Class Y shares of the Touchstone Active Bond Fund are based on the operating expenses incurred by each class of shares of the Fund for the 12-month period ended March 31, 2017. The pro forma fees and expenses for the Class A, Class C and Class Y shares of the Touchstone Active Bond Fund reflect the fees and expenses of the Acquiring Fund and assume that the Reorganization(s) had been completed at the beginning of the 12-month period ended March 31, 2017.
No sales charge will be imposed on the Class A shares of the Acquiring Fund received in connection with the Reorganization. In addition, you may qualify for sales charge discounts for Class A shares if you and your family invest, or agree to invest in the future, at least $25,000 or more in the Sentinel Funds or $50,000 or more in the Touchstone Funds. For the Target Fund, more information about these and other discounts is available from your financial professional and in the section entitled “Share Classes” on page 82 of the Target Fund’s prospectus and “How to Purchase Shares and Reduce Sales Charges” on page 44 of the Target Fund’s SAI. For the Acquiring Fund, more information about these and other discounts is available from your financial professional and in the section entitled “Investing with Touchstone—Class A Shares—Letter of Intent” on page [•] of this Joint Proxy Statement/Prospectus and in the Acquiring Fund’s SAI on page [•].
SHAREHOLDER FEES
(fees paid directly from your investment)
| | | Maximum Sales
Charge (Load)
Imposed on
Purchases (as a
percentage of
offering price) | | Maximum
Deferred Sales
Charge (load) (as a
percentage of the
lower of original
purchase price or
redemption
proceeds) | | Wire
Redemption
Fee |
| Sentinel Total Return Bond Fund – Class A Shares | | 2.25% | | None | | None |
| Touchstone Active Bond Fund – Class A Shares | | 4.75% | | None | | up to $15 |
14
| | | Maximum Sales
Charge (Load)
Imposed on
Purchases (as a
percentage of
offering price) | | Maximum
Deferred Sales
Charge (load) (as a
percentage of the
lower of original
purchase price or
redemption
proceeds) | | Wire
Redemption
Fee |
| Touchstone Active Bond Fund – Class A Shares Pro Forma | | 4.75%(1)(2) | | None | | up to $15 |
| | | | | | | |
| Sentinel Total Return Bond Fund – Class C Shares | | None | | 1.00%(2) | | None |
| Touchstone Active Bond Fund – Class C Shares | | None | | 1.00%(2) | | up to $15 |
| Touchstone Active Bond Fund – Class C Shares Pro Forma | | None | | 1.00%(2) | | up to $15 |
| | | | | | | |
| Sentinel Total Return Bond Fund – Class I Shares | | None | | None | | None |
| Touchstone Active Bond Fund – Class Y Shares | | None | | None | | up to $15 |
| Touchstone Active Bond Fund – Class Y Shares Pro Forma | | None | | None | | up to $15 |
| | | | | | | |
| Sentinel Total Return Bond Fund – Class R3 Shares | | None | | None | | None |
| Touchstone Active Bond Fund – Class A Shares | | 4.75% | | None | | up to $15 |
| Touchstone Active Bond Fund – Class A Shares Pro Forma | | 4.75%(1)(2) | | None | | up to $15 |
| | | | | | | |
| Sentinel Total Return Bond Fund – Class R6 Shares | | None | | None | | None |
| Touchstone Active Bond Fund – Class Y Shares | | None | | None | | up to $15 |
| Touchstone Active Bond Fund – Class Y Shares Pro Forma | | None | | None | | up to $15 |
| (1) | No sales charge will be imposed on the Class A and Class R3 shares of the Acquiring Fund received in connection with the Reorganization. |
| | |
| (2) | A deferred sales charge of 1% applies to certain redemptions of Class A shares made within twelve months of purchase if the shares were purchased without an initial sales charge as part of an investment of $1 million or more. If you hold load-waived Class A shares or Class C shares of the Target Fund, the Acquiring Fund will look to the date of purchase of your Target Fund shares for purposes of assessing deferred sales charges on shares received in the Reorganization. |
ANNUAL FUND OPERATING EXPENSES
(expenses that you pay each year as a percentage of the value of your investment)
| | | Sentinel Total
Return Bond
Fund
(Class A
Shares) | | Touchstone
Active Bond
Fund
(Class A
Shares) | | Touchstone
Active
Bond Fund Pro
Forma
(Class A
Shares) | | Touchstone Active
Bond Fund Pro
Forma
(Class A Shares)
(both
Reorganizations)(1) |
| Management Fees | | 0.53% | | 0.40% | | 0.38% | | 0.37% |
| Distribution/Service (12b-1) Fees | | 0.20% | | 0.25% | | 0.25% | | 0.25% |
| Other Expenses | | 0.37% | | 0.52% | | 0.47%(2) | | 0.38%(2) |
15
| | | Sentinel Total
Return Bond
Fund
(Class A
Shares) | | Touchstone
Active Bond
Fund
(Class A
Shares) | | Touchstone
Active
Bond Fund Pro
Forma
(Class A
Shares) | | Touchstone Active
Bond Fund Pro
Forma
(Class A Shares)
(both
Reorganizations)(1) |
| Acquired Fund Fees and Expenses(3) | | 0.07% | | 0.01% | | 0.01%(2) | | 0.01%(2) |
| Total Annual Fund Operating Expenses | | 1.17%(4) | | 1.18% | | 1.11% | | 1.01% |
| Fee Waiver | | (0.21%)(5) | | (0.27%)(6) | | (0.20%)(6)(7) | | (0.10%)(6)(7) |
| Total Annual Fund Operating Expenses After Fee Waiver | | 0.96% | | 0.91% | | 0.91% | | 0.91% |
ANNUAL FUND OPERATING EXPENSES
(expenses that you pay each year as a percentage of the value of your investment)
| | | Sentinel Total
Return Bond
Fund
(Class C
Shares) | | Touchstone
Active Bond
Fund
(Class C
Shares) | | Touchstone
Active
Bond Fund Pro
Forma
(Class C
Shares) | | Touchstone Active
Bond Fund Pro
Forma
(Class C Shares)
(both
Reorganizations)(1) |
| Management Fees | | 0.53% | | 0.40% | | 0.38% | | 0.37% |
| Distribution/Service (12b-1) Fees | | 1.00% | | 1.00% | | 1.00% | | 1.00% |
| Other Expenses | | 0.23% | | 0.64% | | 0.33%(2) | | 0.32%(2) |
| Acquired Fund Fees and Expenses(3) | | 0.07% | | 0.01% | | 0.01%(2) | | 0.01%(2) |
| Total Annual Fund Operating Expenses | | 1.83%(4) | | 2.05% | | 1.72% | | 1.70% |
| Fee Waiver | | None | | (0.39%)(6) | | (0.06%)(6)(7) | | (0.04%)(6)(7) |
| Total Annual Fund Operating Expenses After Fee Waiver | | 1.83% | | 1.66% | | 1.66% | | 1.66% |
ANNUAL FUND OPERATING EXPENSES
(expenses that you pay each year as a percentage of the value of your investment)
| | | Sentinel Total
Return Bond
Fund
(Class I
Shares) | | Touchstone
Active
Bond Fund
(Class Y
Shares) | | Touchstone
Active
Bond Fund Pro
Forma
(Class Y
Shares) | | Touchstone Active
Bond Fund Pro
Forma
(Class Y Shares)
(both
Reorganizations)(1) |
| Management Fees | | 0.53% | | 0.40% | | 0.38% | | 0.37% |
| Distribution/Service (12b-1) Fees | | None | | None | | None | | None |
| Other Expenses | | 0.24% | | 0.48% | | 0.33%(2) | | 0.32%(2) |
| Acquired Fund Fees and Expenses(3) | | 0.07% | | 0.01% | | 0.01%(2) | | 0.01%(2) |
| Total Annual Fund Operating Expenses | | 0.84%(4) | | 0.89% | | 0.72% | | 0.70% |
| Fee Waiver | | —(8) | | (0.23%)(6) | | (0.06%)(6)(7) | | (0.04%)(6)(7) |
| Total Annual Fund Operating Expenses After Fee Waiver | | 0.84% | | 0.66% | | 0.66% | | 0.66% |
16
ANNUAL FUND OPERATING EXPENSES
(expenses that you pay each year as a percentage of the value of your investment)
| | | Sentinel Total
Return Bond
Fund
(Class R3
Shares) | | Touchstone
Active Bond
Fund
(Class A
Shares) | | Touchstone
Active
Bond Fund Pro
Forma
(Class A
Shares) | | Touchstone Active
Bond Fund Pro
Forma
(Class A Shares)
(both
Reorganizations)(1) |
| Management Fees | | | 0.53 | % | | | 0.40 | % | | | 0.38 | % | | | 0.37 | % |
| Distribution/Service (12b-1) Fees | | | 0.50 | %(9) | | | 0.25 | % | | | 0.25 | % | | | 0.25 | % |
| Other Expenses | | | 2.41 | % | | | 0.52 | % | | | 0.47 | %(2) | | | 0.38 | %(2) |
| Acquired Fund Fees and Expenses(3) | | | 0.07 | % | | | 0.01 | % | | | 0.01 | %(2) | | | 0.01 | %(2) |
| Total Annual Fund Operating Expenses | | | 3.51 | %(4) | | | 1.18 | % | | | 1.11 | % | | | 1.01 | % |
| Fee Waiver | | | (2.25 | %)(5) | | | (0.27 | %)(6) | | | (0.20 | %)(6)(7) | | | (0.10 | %)(6)(7) |
| Total Annual Fund Operating Expenses After Fee Waiver | | | 1.26 | % | | | 0.91 | % | | | 0.91 | % | | | 0.91 | % |
ANNUAL FUND OPERATING EXPENSES
(expenses that you pay each year as a percentage of the value of your investment)
| | | Sentinel
Total Return
Bond Fund
(Class R6
Shares) | | Touchstone
Active Bond
Fund
(Class Y
Shares) | | Touchstone
Active
Bond Fund Pro
Forma
(Class Y
Shares) | | Touchstone Active
Bond Fund Pro
Forma
(Class Y Shares)
(both
Reorganizations)(1) |
| Management Fees | | | 0.53 | % | | | 0.40 | % | | | 0.38 | % | | | 0.37 | % |
| Distribution/Service (12b-1) Fees | | | None | | | | None | | | | None | | | | None | |
| Other Expenses | | | 2.40 | % | | | 0.48 | % | | | 0.33 | %(2) | | | 0.32 | %(2) |
| Acquired Fund Fees and Expenses(3) | | | 0.07 | % | | | 0.01 | % | | | 0.01 | %(2) | | | 0.01 | %(2) |
| Total Annual Fund Operating Expenses | | | 3.00 | %(4) | | | 0.89 | % | | | 0.72 | % | | | 0.70 | % |
| Fee Waiver | | | (2.24 | %)(5) | | | (0.23 | %)(6) | | | (0.06 | %)(6)(7) | | | (0.04 | %)(6)(7) |
| Total Annual Fund Operating Expenses After Fee Waiver | | | 0.76 | % | | | 0.66 | % | | | 0.66 | % | | | 0.66 | % |
| (1) | Represents Pro Forma information if both the Sentinel Government Securities Fund and the Sentinel Total Return Bond Fund reorganize into the Touchstone Active Bond Fund. |
| (2) | Other Expenses and Acquired Fund Fees and Expenses are estimated based on fees and expenses of the Acquiring Fund, assuming the Reorganization(s) had been consummated as of the beginning of the 12-month period ended March 31, 2017. |
17
| (3) | Acquired Fund Fees and Expenses are expenses indirectly incurred by the Fund through its investments in one or more underlying funds, including money market funds. Because these costs are indirect, the Total Annual Fund Operating Expenses do not correlate to the ratio of expenses to average net assets in the Fund’s most recent annual report. |
| (4) | Total Annual Fund Operating Expenses have been restated to reflect current fees. |
| (5) | Sentinel has contractually agreed to waive fees and/or reimburse certain expenses in order to limit Total Annual Fund Operating Expenses. After Fee Waiver and/or Expense Reimbursement for Classes A, R3, and R6 shares on an annualized basis, to 0.89%, 1.19% and 0.69%, respectively of average daily net assets through March 31, 2018. Each of these agreements may be terminated upon 90 days’ notice by a majority of the non-interested directors of the Sentinel Funds. Additional information regarding the expense limit is provided under the section entitled “The Funds’ Management—Expense Limitation Agreement”. |
| (6) | Touchstone Advisors has agreed to waive a portion of its fees or reimburse certain Fund expenses (excluding dividend and interest expenses relating to short sales; interest; taxes; brokerage commissions and other transaction costs; portfolio transactions and investment related expenses; other expenditures which are capitalized in accordance with U.S. generally accepted accounting principles; the cost of “Acquired Fund Fees and Expenses,” if any; and other extraordinary expenses not incurred in the ordinary course of business) in order to limit annual Fund operating expenses to 0.90%, 1.65%, and 0.65% of average daily net assets for Classes A, C, and Y shares, respectively. This contractual expense limitation is effective through January 29, 2018, but can be terminated by a vote of the Touchstone Funds Board if it deems the termination to be beneficial to the Fund’s shareholders. The terms of the contractual expense limitation agreement provide that Touchstone Advisors is entitled to recoup, subject to approval by the Touchstone Funds Board, such amounts waived or reimbursed for a period of up to three years from the year in which Touchstone Advisors reduced its compensation or assumed expenses for the Fund. No recoupment will occur unless the Fund’s expenses are below the lesser of the expense limitation amount in effect (a) at the time of the waiver, or (b) at the time of the reimbursement. Additional information regarding the expense limit is provided under the section entitled “The Funds’ Management—Expense Limitation Agreement”. |
| (7) | Effective upon consummation of the Reorganization(s), Touchstone Advisors has contractually agreed to waive fees and/or reimburse certain expenses in order to limit total annual fund operating expenses of each class of shares of the Acquiring Fund to 0.90%, 1.65%, and 0.65% of average daily net assets for Classes A, C, and Y shares, respectively. The contractual expense limitation agreement will have the terms described above in Footnote 6 and will remain in effect for at least two years following the closing of the Reorganization(s). Additional information regarding the expense limit is provided under the section entitled “The Funds’ Management—Expense Limitation Agreement”. |
| (8) | Sentinel has contractually agreed to reimburse certain expenses paid by the Class I shares of the Target Funds to the extent necessary to prevent the total annual fund operating expense ratio of the Class I shares of the Target Funds, on an annualized basis, from exceeding the total annual fund operating expense ratio of the Class A shares of the same Fund. This agreement will continue through March 31, 2018. This agreement may be terminated upon 90 days’ notice by a majority of the non-interested directors of the Sentinel Funds. Additional information regarding the expense limit is provided under the section entitled “The Funds’ Management—Expense Limitation Agreement”. |
| (9) | Rule 12b-1 fees have been restated from actual fiscal year amounts to reflect the maximum fee payable under the applicable distribution plan for such share class. |
Expense Examples. The examples below are intended to help you compare the cost of investing in the Target Fund with the Acquiring Fund and pro forma cost of investing in the Acquiring Fund under the following two scenarios (i) assuming that only the Reorganization of the Sentinel Total Return Bond Fund into the Touchstone Active Bond Fund takes place and (ii) assuming that both the Reorganization of the Sentinel Total Return Bond Fund into the Touchstone Active Bond Fund and the Reorganization of the Sentinel Government Securities Fund into the Touchstone Active Bond Fund (which is also described in this Joint Proxy Statement/Prospectus) take place. The examples assume that you invest $10,000 in each Fund and then either (i) sell all of your shares at the end of each period indicated below or (ii) keep all of your shares at the end of each period indicated below. The examples also assume that your investment has a 5% annual return and that operating expenses (before fee waivers and expense reimbursements) remain the same. This example also assumes that the current expense limitation agreement for the Touchstone Active Bond Fund will remain in place for one year and the expense limitation agreement that will take effect as of the closing of the Reorganization(s) will remain in place for two years following the closing of the Reorganization(s). Although your actual costs may be higher or lower, based on these assumptions, your costs would be:
| If shares are redeemed: | | 1 Year | | 3 Years | | 5 Years | | 10 Years |
| Class A Shares | | | | | | | | | | | | | | | | |
| Sentinel Total Return Bond Fund | | $ | 321 | | | $ | 568 | | | $ | 834 | | | $ | 1,595 | |
| Touchstone Active Bond Fund | | $ | 563 | | | $ | 806 | | | $ | 1,068 | | | $ | 1,816 | |
| Touchstone Active Bond Fund Pro Forma | | $ | 563 | | | $ | 772 | | | $ | 1,020 | | | $ | 1,727 | |
| Touchstone Active Bond Fund Pro Forma (both Reorganizations) | | $ | 563 | | | $ | 762 | | | $ | 987 | | | $ | 1,635 | |
18
| If shares are redeemed: | | 1 Year | | 3 Years | | 5 Years | | 10 Years |
| Class C Shares | | | | | | | | | | | | | | | | |
| Sentinel Total Return Bond Fund | | $ | 286 | | | $ | 576 | | | $ | 990 | | | $ | 2,148 | |
| Touchstone Active Bond Fund | | $ | 269 | | | $ | 605 | | | $ | 1,067 | | | $ | 2,348 | |
| Touchstone Active Bond Fund Pro Forma | | $ | 269 | | | $ | 530 | | | $ | 922 | | | $ | 2,020 | |
| Touchstone Active Bond Fund Pro Forma (both Reorganizations) | | $ | 269 | | | $ | 528 | | | $ | 915 | | | $ | 2,002 | |
| Class I Shares/Class Y Shares | | | | | | | | | | | | | | | | |
| Sentinel Total Return Bond Fund | | $ | 86 | | | $ | 268 | | | $ | 466 | | | $ | 1,037 | |
| Touchstone Active Bond Fund | | $ | 67 | | | $ | 261 | | | $ | 471 | | | $ | 1,075 | |
| Touchstone Active Bond Fund Pro Forma | | $ | 67 | | | $ | 218 | | | $ | 388 | | | $ | 883 | |
| Touchstone Active Bond Fund Pro Forma (both Reorganizations) | | $ | 67 | | | $ | 216 | | | $ | 382 | | | $ | 863 | |
| Class R3/Class A Shares | | | | | | | | | | | | | | | | |
| Sentinel Total Return Bond Fund | | $ | 128 | | | $ | 868 | | | $ | 1,629 | | | $ | 3,634 | |
| Touchstone Active Bond Fund | | $ | 563 | | | $ | 806 | | | $ | 1,068 | | | $ | 1,816 | |
| Touchstone Active Bond Fund Pro Forma | | $ | 563 | | | $ | 772 | | | $ | 1,020 | | | $ | 1,727 | |
| Touchstone Active Bond Fund Pro Forma (both Reorganizations) | | $ | 563 | | | $ | 762 | | | $ | 987 | | | $ | 1,635 | |
| Class R6/Class Y Shares | | | | | | | | | | | | | | | | |
| Sentinel Total Return Bond Fund | | $ | 78 | | | $ | 716 | | | $ | 1,379 | | | $ | 3,159 | |
| Touchstone Active Bond Fund | | $ | 67 | | | $ | 261 | | | $ | 471 | | | $ | 1,075 | |
| Touchstone Active Bond Fund Pro Forma | | $ | 67 | | | $ | 218 | | | $ | 388 | | | $ | 883 | |
| Touchstone Active Bond Fund Pro Forma (both Reorganizations) | | $ | 67 | | | $ | 216 | | | $ | 382 | | | $ | 863 | |
| | | | | | | | | | | | | | | | | |
| If shares are not redeemed:(1) | | 1 Year | | 3 Years | | 5 Years | | 10 Years |
| Class C Shares | | | | | | | | | | | | | | | | |
| Sentinel Total Return Bond Fund | | $ | 186 | | | $ | 576 | | | $ | 990 | | | $ | 2,148 | |
| Touchstone Active Bond Fund | | $ | 169 | | | $ | 605 | | | $ | 1,067 | | | $ | 2,348 | |
| Touchstone Active Bond Fund Pro Forma | | $ | 169 | | | $ | 530 | | | $ | 922 | | | $ | 2,020 | |
| Touchstone Active Bond Fund Pro Forma (both Reorganizations) | | $ | 169 | | | $ | 528 | | | $ | 915 | | | $ | 2,002 | |
| (1) | For holders of all other classes, the costs are the same as set forth above. |
How do the performance records of the Target Fund and the Acquiring Fund compare?
The bar charts and the performance tables below provide some indication of the risks of an investment in each of the Target Fund and the Acquiring Fund by showing how each Fund’s performance has varied from year to year and by showing how each Fund’s average annual returns compare with a broad measure of market performance. Performance of the Target Fund’s Class R3 shares prior to December 23, 2014 (the inception date for the Class R3 shares) is based on the Fund’s Class A share performance, restated to reflect that Class R3 shares are offered without a sales charge and adjusted for Class R3’s estimated higher expenses. Performance of the Target Fund’s Class R6 shares prior to December 23, 2014 (the inception date for the Class R6 shares) is based on the Target Fund’s Class A share performance, restated to reflect that Class R6 shares are offered without a sales charge. Past performance of the Target Fund and the Acquiring Fund, before and after taxes, does not necessarily represent how either Fund will perform in the future. Updated performance information for the Target Fund is available on the Target Fund’s website at www.sentinelinvestments.com or by calling 800.282.3863. Updated performance information for the Acquiring Fund is available on the Acquiring Fund’s website at TouchstoneInvestments.com or by calling 800.543.0407.
19
Sentinel Total Return Bond Fund

| Best Quarter: Third Quarter, 2012 3.61% | Worst Quarter: Fourth Quarter, 2016 (2.35%) |
The Sentinel Total Return Bond Fund’s calendar year-to-date total return for Class A shares as of March 31, 2017 was 0.72%.
Touchstone Active Bond Fund
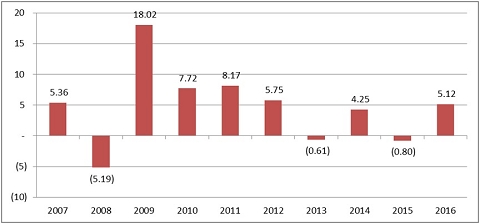
| Best Quarter: Third Quarter, 2009 7.14% | Worst Quarter: Third Quarter, 2008 (2.68%) |
The Touchstone Active Bond Fund’s calendar year-to-date total return for Class A shares as of March 31, 2017 was 1.11%.
Average Annual Total Returns
For the periods ended December 31, 2016
| Sentinel Total Return Bond Fund | | Inception
Date | | 1 Year | | 5 Years | | 10 Years | | Since
Inception |
| Class A (return before taxes) | | 12/17/2010 | | | 0.14 | % | | | 2.83 | % | | N/A | | | 3.40 | % |
| Class A (return after taxes on distributions) | | 12/17/2010 | | | (0.84 | %) | | | 1.62 | % | | N/A | | | 2.10 | % |
20
| Sentinel Total Return Bond Fund | | Inception
Date | | 1 Year | | 5 Years | | 10 Years | | Since
Inception |
| Class A (return after taxes on distributions and sale of fund shares) | | 12/17/2010 | | | 0.08 | % | | | 1.69 | % | | N/A | | | 2.10 | % |
| Class C (return before taxes) | | 12/17/2010 | | | 0.62 | % | | | 2.64 | % | | N/A | | | 3.21 | % |
| Class I (return before taxes) | | 12/17/2010 | | | 2.63 | % | | | 3.46 | % | | N/A | | | 3.94 | % |
| Class R3 (return before taxes) | | 12/23/2014 | | | 2.49 | % | | | 3.02 | % | | N/A | | | 3.49 | % |
| Class R6 (return before taxes) | | 12/23/2014 | | | 2.69 | % | | | 3.40 | % | | N/A | | | 3.87 | % |
| Bloomberg Barclays US Aggregate Bond Index(1) (reflects no deduction for fees, expenses or taxes) | | N/A | | | 2.65 | % | | | 2.23 | % | | N/A | | | 3.31 | % |
| | | | | | | | | | | | | | | | | |
| Touchstone Active Bond Fund | | Inception
Date | | 1 Year | | 5 Years | | 10 Years | | Since
Inception |
| Class A (return before taxes) | | 10/03/1994 | | | 0.14 | % | | | 1.70 | % | | | 4.10 | % | | N/A |
| Class A (return after taxes on distributions) | | 10/03/1994 | | | (1.00 | %) | | | 0.36 | % | | | 2.61 | % | | N/A |
| Class A (return after taxes on distributions and sale of fund shares) | | 10/03/1994 | | | 0.08 | % | | | 0.72 | % | | | 2.57 | % | | N/A |
| Class C (return before taxes) | | 10/03/1994 | | | 3.32 | % | | | 1.94 | % | | | 3.83 | % | | N/A |
| Class Y (return before taxes) | | 04/12/2012 | | | 5.28 | % | | | 2.94 | % | | | 4.73 | % | | N/A |
| Bloomberg Barclays US Aggregate Bond Index(1) (reflects no deduction for fees, expenses or taxes) | | N/A | | | 2.65 | % | | | 2.23 | % | | | 4.34 | % | | N/A |
| (1) | The Bloomberg Barclays US Aggregate Bond Index measures the U.S. investment grade fixed-rate bond market, with index components for government and corporate securities, mortgage pass-through securities and asset-backed securities. |
After-tax returns are calculated using the historical highest individual federal marginal income tax rates and do not reflect the impact of state and local taxes. Actual after-tax returns depend on an investor’s tax situation and may differ from those shown. The return after taxes on distributions and sale of Fund shares may exceed the return before taxes due to an assumed tax benefit from any losses on a sale of Fund shares at the end of the measurement period. If you hold your Fund shares through a tax-advantaged arrangement, such as an individual retirement account or a 401(k) plan, the after-tax returns do not apply to your situation.
How do the investment goals and principal investment policies of the Funds compare?
The investment goals and principal investment policies of the Sentinel Total Return Bond Fund and the Touchstone Active Bond Fund, along with descriptions of certain differences between the Funds’ investment goals and principal investment policies, are set forth in the table below. Although the Funds have similar investment goals and principal policies, the analytical tools, techniques and investment selection process used by the sub-advisor to the Acquiring Fund may differ from those used by Sentinel.
21
| | | Sentinel Total Return
Bond Fund | | Touchstone Active
Bond Fund | | Differences |
| Investment Goal(s): | | The Fund seeks maximum investment return through a combination of current income and capital appreciation. | | The Fund seeks to provide as high a level of current income as is consistent with the preservation of capital. Capital appreciation is a secondary goal. | | Each Fund seeks current income and capital appreciation. For the Acquiring Fund, capital appreciation as a secondary goal. |
| | | | | | | |
| Principal Investment Strategy: | | At least 80% of the Fund’s assets will normally be invested in corporate bonds, government debt securities, including mortgage-backed securities, taxable or tax-exempt municipal securities and derivatives related to such securities. | | Under normal circumstances, the Fund invests at least 80% of its assets in bonds. Bonds include mortgage-related securities, asset-backed securities, government securities, and corporate debt securities. | | Each Fund invests in a broad range of corporate and government bonds, including mortgage-backed securities. The Target Fund’s principal investment strategy includes derivatives related to such securities. |
| | | | | | | |
| Credit Quality: | | The Fund invests primarily in investment-grade bonds. The Fund may invest up to 50% of its assets in below investment-grade bonds. | | The Fund primarily invests in investment-grade debt securities, but may invest up to 30% of the Fund’s total assets in non-investment-grade debt securities rated as low as B by a Nationally Recognized Statistical Rating Organization. | | The Target Fund may invest to a greater degree in non-investment-grade debt securities. |
| | | | | | | |
| Non-U.S. Investments: | | The Fund may invest in debt securities issued by U.S. and non-U.S. private-sector entities denominated in U.S. dollars and foreign currencies. The Fund may also invest in debt securities issued by non-U.S. sovereign and quasi-sovereign entities. | | The Fund may invest up to 20% of its total assets in foreign-issued debt securities denominated in either the U.S. dollar or a foreign currency. Foreign-issued debt securities may include debt securities of emerging market countries. | | Each Fund may invest in non-U.S. debt securities. While the Acquiring Fund has a stated limitation on such investments equal to 20% of its total assets, the Target fund has no such limitation. |
| | | | | | | |
| Sector or Industry Focus: | | Up to 25% of the Fund’s net assets may be invested in securities within a single industry. | | Up to 25% of the Fund’s net assets may be invested in securities within a single industry. | | — |
22
| | | Sentinel Total Return
Bond Fund | | Touchstone Active
Bond Fund | | Differences |
| Derivatives and Other Instruments: | | The Fund may use derivative instruments (e.g., exchange-traded derivatives such as futures and options, and other derivatives such as swap agreements, options on swaps and interest rate caps and floors) for investment purposes, such as replicating permitted investments, as long as such investments do not have the effect of leveraging portfolio risks. | | In order to implement its investment strategy, the Fund may invest in mortgage dollar-roll transactions and reverse repurchase agreements, and in derivatives, including forwards, futures contracts, interest rate and credit default swap agreements, and options. | | While there are certain differences, each Fund may invest in a broad range of derivative instruments. The Target Fund has a stated policy that its use of derivatives may not result in leverage. |
| | | | | | | |
| Hedging: | | The Fund may also use derivative instruments in order to hedge various risks, such as interest rate, credit and currency risk. The Fund is not required to use hedging and may choose not to do so. | | The Fund may use mortgage dollar-roll transactions, reverse repurchase agreements and derivatives to gain or hedge market exposure, to adjust the Fund’s duration, to manage interest rate risk, and for any other purposes consistent with the Fund’s investment strategies and limitations. | | While there are certain differences, each Fund may, but is not required to, hedge risks using a variety of derivatives. |
| | | | | | | |
| Active Trading: | | The Fund utilizes an active trading approach, which is expected to result in portfolio turnover greater than 100%. | | The Fund may engage in frequent and active trading as part of its principal investment strategies. | | — |
Additional Information About the Funds’ Principal Investment Strategies
Target Fund. The Target Fund may invest in exchange-traded funds (“ETFs”) in carrying out its investment strategies. The Fund considers investments in bond ETFs (ETFs whose underlying portfolio consists of debt instruments) as investments in fixed income instruments. At times, the Fund may have considerable exposure to ETFs. The Target Fund may invest in securities of any duration.
The Target Fund may also purchase or sell “to be announced” or “TBA” securities, which usually are transactions in which the Fund buys or sells agency mortgage-backed securities (“MBS”) on a forward commitment basis. In a TBA transaction, the seller of the agency MBS agrees on a sale price, but does not specify which particular securities will be delivered to the buyer on settlement day. Instead, only a few basic characteristics of the securities are agreed upon, such as the coupon rate and the face value. The Fund may engage in short sales of agency MBS that the Fund does not own, primarily as part of a TBA swap transaction. A TBA swap transaction involves an agreement to purchase one agency MBS and a simultaneous agreement to sell a different agency MBS.
The Target Fund may sell a security if the security is overvalued on a relative basis compared to other securities available in the market, if the fundamentals of the company are deteriorating, or for duration management purposes. The Fund may also sell a security to meet redemptions.
23
Acquiring Fund. In deciding what securities to buy and sell for the Fund, the Acquiring Fund’s sub-advisor analyzes the overall investment opportunities and risks in different sectors of the debt securities markets by focusing on maximizing total return while reducing volatility of the Fund’s portfolio. The sub-advisor follows a disciplined sector allocation process in order to build a diversified portfolio of investments.
How do the principal risks of investing in the Funds compare?
An investment in each Fund is subject to derivatives risk, fixed-income securities risk including non-investment-grade debt securities risk, foreign securities risk and portfolio turnover risk. An investment in the Sentinel Total Return Bond Fund is also subject to other investment companies and ETFs risk, short sales risk and TBA securities risk. An investment in the Touchstone Active Bond Fund is also subject to leverage risk, management risk and mortgage dollar roll risk, as well as additional foreign securities risk including emerging markets risk. For more information on the Funds’ principal risks, see “Comparison of Principal Risks.”
Who will be the Advisor, Sub-Advisor and Portfolio Managers of my Fund after the Reorganization?
Sentinel is the investment advisor to Sentinel Total Return Bond Fund. The portfolio manager of Sentinel Total Return Bond Fund is Jason Doiron.
After the Reorganization, Touchstone Advisors will serve as the investment advisor and Fort Washington will serve as the sub-advisor to Touchstone Active Bond Fund. The portfolio managers of Touchstone Active Bond Fund are Timothy J. Policinski and Daniel J. Carter. For additional information regarding the advisor, sub-advisor and portfolio managers listed above, please see the section entitled “The Funds’ Management—Investment Advisor” and “The Funds’ Management—Sub-Advisors and Portfolio Managers.”
What are the portfolio turnover rates of the Funds?
A Fund pays transaction costs, such as brokerage commissions, when it buys and sells securities (or “turns over” its portfolio). A higher portfolio turnover rate may indicate higher transaction costs and may result in higher taxes when Fund shares are held in a taxable account. These costs, which are not reflected in annual fund operating expenses or in the example, affect a Fund’s performance. During the fiscal year ended November 30, 2016, the Target Fund’s portfolio turnover rate was 240% of the average value of its portfolio. During the fiscal year ended September 30, 2016, the portfolio turnover rate of the Acquiring Fund was 590% of the average value of its portfolio.
Will there be any repositioning of the portfolio after the Reorganization?
It is expected that a significant portion (approximately two-thirds) of the portfolio investments of the Target Fund may be sold by the Acquiring Fund following the Reorganization. However, the timing of any repositioning and its resulting impact on capital gains distributions in 2017 and beyond is uncertain. The amounts per share of any capital gains distributions resulting from the repositioning will depend on a number of factors, including the proportion of portfolio holdings that are actually sold, the timing of portfolio sales, the performance of the bond market in general, the availability of offsetting capital losses and the scale of purchase and redemption activity in the Funds' shares. The timing of portfolio sales will also be subject to market conditions existing after the closing of the Reorganization. Accordingly, the per share amounts of any capital gains distributions resulting from the repositioning cannot be estimated at this time. Touchstone Advisors publishes estimates of capital gains distributions for the Touchstone Funds on its website (https://www.touchstoneinvestments.com/literature-center/taxplanning.htm), generally in October of each year. The Acquiring Fund will also bear brokerage costs in connection with the repositioning. For illustration purposes only, if the Reorganization had been completed as of March 31, 2017 and the Acquiring Fund had sold on a pro rata basis two-thirds of the investments held in the Target Fund's portfolio as of March 31, 2017, the resulting realized capital gains estimate would be expected to total $0.02 per share of the combined fund and the brokerage commissions would be expected to total approximately $226,000 in the aggregate, or $0.006 per share of the combined fund, based on average commission costs of the Acquiring Fund. Under the same circumstances, if only one-third of the investments held in the Target Fund's portfolio had been repositioned as of March 31, 2017, the resulting realized capital gains and brokerage cost estimates would be reduced by half, to $0.01 and $0.003 per share of the combined fund, respectively.
24
Synopsis: Reorganization of Sentinel Low Duration Bond Fund into Touchstone Ultra Short Duration Fixed Income Fund
What class of shares of the Acquiring Fund will I receive in the Reorganization?
Shareholders of the Sentinel Low Duration Bond Fund will receive shares of the Touchstone Ultra Short Duration Fixed Income Fund, as follows:
| Sentinel Low Duration Bond Fund | | Touchstone Ultra Short Duration Fixed
Income Fund |
| Class A | | Class A |
| Class I | | Class Y |
| Class S | | Class S |
How do the fees and expenses of the Target Fund and the Acquiring Fund compare?
The tables below describe the fees and expenses that you pay if you buy and hold shares of your Sentinel Fund and the pro forma fees and expenses that you may pay if you buy and hold shares of the corresponding Touchstone Fund after giving effect to the Reorganization. The pro forma expense ratios project anticipated expenses of the Acquiring Fund following the Reorganization, but actual expenses may be greater or less than those shown. Expenses for the Class A, Class I and Class S shares of the Sentinel Low Duration Bond Fund are based on the operating expenses incurred by each class of shares of the Fund for the fiscal year ended November 30, 2016. Expenses for the Class A, Class Y and Class S shares of the Touchstone Ultra Short Duration Fixed Income Fund are based on the operating expenses incurred by each class of shares of the Fund for the 12-month period ended March 31, 2017. The pro forma fees and expenses for the Class A, Class Y and Class S shares of the Touchstone Ultra Short Duration Fixed Income Fund reflect the fees and expenses of the Acquiring Fund and assume that the Reorganization had been completed at the beginning of the 12-month period ended March 31, 2017.
No sales charge will be imposed on the Class A shares of the Acquiring Fund received in connection with the Reorganization. In addition, you may qualify for sales charge discounts for Class A shares if you and your family invest, or agree to invest in the future, at least $25,000 or more in the Sentinel Funds or $50,000 or more in the Touchstone Funds. For the Target Fund, more information about these and other discounts is available from your financial professional and in the section entitled “Share Classes” on page 82 of the Target Fund’s prospectus and “How to Purchase Shares and Reduce Sales Charges” on page 44 of the Target Fund’s SAI. For the Acquiring Fund, more information about these and other discounts is available from your financial professional and in the section entitled “Investing with Touchstone—Class A Shares—Letter of Intent” on page [•] of this Joint Proxy Statement/Prospectus and in the Acquiring Fund’s SAI on page [•].
SHAREHOLDER FEES
(fees paid directly from your investment)
| | | Maximum Sales
Charge (Load)
Imposed on
Purchases (as a
percentage of
offering price) | | Maximum
Deferred Sales
Charge (load) (as
a percentage of
the lower of
original purchase
price or
redemption
proceeds) | | Wire
Redemption
Fee |
| Sentinel Low Duration Bond Fund – Class A Shares | | | 1.00 | % | | None | | None |
| Touchstone Ultra Short Duration Fixed Income Fund – Class A Shares | | | 2.00 | % | | None | | up to $15 |
| Touchstone Ultra Short Duration Fixed Income Fund – Class A Shares Pro Forma | | | 2.00 | %(1)(2) | | None(2) | | up to $15 |
25
| | | Maximum Sales
Charge (Load)
Imposed on
Purchases (as a
percentage of
offering price) | | Maximum
Deferred Sales
Charge (load) (as
a percentage of
the lower of
original purchase
price or
redemption
proceeds) | | Wire
Redemption
Fee |
| Sentinel Low Duration Bond Fund – Class I Shares | | | None | | | None | | None |
| Touchstone Ultra Short Duration Fixed Income Fund – Class Y Shares | | | None | | | None | | up to $15 |
| Touchstone Ultra Short Duration Fixed Income Fund – Class Y Shares Pro Forma | | | None | | | None | | up to $15 |
| | | | | | | | | |
| Sentinel Low Duration Bond Fund – Class S Shares | | | None | | | None | | None |
| Touchstone Ultra Short Duration Fixed Income Fund – Class S Shares | | | None | | | None | | up to $15 |
| Touchstone Ultra Short Duration Fixed Income Fund – Class S Shares Pro Forma | | | None | | | None | | up to $15 |
| (1) | No sales charge will be imposed on the Class A shares of the Acquiring Fund received in connection with the Reorganization. |
| | |
| (2) | A deferred sales charge of 1% applies to certain redemptions of Class A shares made within twelve months of purchase if the shares were purchased without an initial sales charge as part of an investment of $1 million or more. If you hold load-waived Class A shares of the Target Fund, the Acquiring Fund will look to the date of purchase of your Target Fund shares for purposes of assessing deferred sales charges on shares received in the Reorganization. |
ANNUAL FUND OPERATING EXPENSES
(expenses that you pay each year as a percentage of the value of your investment)
| | | Sentinel Low
Duration Bond
Fund
(Class A Shares) | | Touchstone Ultra
Short Duration
Fixed Income
Fund
(Class A Shares) | | Touchstone Ultra
Short Duration
Fixed Income Fund
Pro Forma
(Class A Shares) |
| Management Fees | | | 0.45 | % | | | 0.25 | % | | | 0.25 | % |
| Distribution/Service (12b-1) Fees | | | 0.25 | % | | | 0.25 | % | | | 0.25 | % |
| Other Expenses | | | 0.24 | % | | | 0.41 | %(1) | | | 0.32 | %(1) |
| Acquired Fund Fees and Expenses(2) | | | 0.08 | % | | | 0.00 | % | | | 0.00 | % |
| Total Annual Fund Operating Expenses | | | 1.02 | % | | | 0.91 | % | | | 0.82 | % |
| Fee Waiver | | None | | | (0.22 | %)(3) | | | (0.13 | %)(3)(4) |
| Total Annual Fund Operating Expenses After Fee Waiver | | | 1.02 | % | | | 0.69 | % | | | 0.69 | % |
26
ANNUAL FUND OPERATING EXPENSES
(expenses that you pay each year as a percentage of the value of your investment)
| | | Sentinel Low
Duration Bond
Fund
(Class I Shares) | | Touchstone Ultra
Short Duration
Fixed Income
Fund
(Class Y Shares) | | Touchstone Ultra
Short Duration
Fixed Income Fund
Pro Forma
(Class Y Shares) |
| Management Fees | | | 0.45 | % | | | 0.25 | % | | | 0.25 | % |
| Distribution/Service (12b-1) Fees | | None | | None | | None |
| Other Expenses | | | 0.15 | % | | | 0.28 | %(1) | | | 0.26 | %(1) |
| Acquired Fund Fees and Expenses(2) | | | 0.08 | % | | | 0.00 | % | | | 0.00 | % |
| Total Annual Fund Operating Expenses | | | 0.68 | % | | | 0.53 | % | | | 0.51 | % |
| Fee Waiver | | | — | (5) | | | (0.09 | %)(3) | | | (0.07 | %)(3)(4) |
| Total Annual Fund Operating Expenses After Fee Waiver | | | 0.68 | % | | | 0.44 | % | | | 0.44 | % |
ANNUAL FUND OPERATING EXPENSES
(expenses that you pay each year as a percentage of the value of your investment)
| | | Sentinel Low
Duration Bond
Fund
(Class S Shares) | | Touchstone Ultra
Short Duration
Fixed Income
Fund
(Class S Shares) | | Touchstone Ultra
Short Duration
Fixed Income Fund
Pro Forma
(Class S Shares) |
| Management Fees | | | 0.45 | % | | N/A | | | 0.25 | % |
| Distribution/Service (12b-1) Fees | | | 0.50 | % | | N/A | | | 0.50 | % |
| Other Expenses | | | 0.13 | % | | N/A | | | 0.21 | %(1) |
| Acquired Fund Fees and Expenses(2) | | | 0.08 | % | | N/A | | | 0.00 | % |
| Total Annual Fund Operating Expenses | | | 1.16 | % | | N/A | | | 0.96 | % |
| Fee Waiver | | None | | N/A | | | (0.02 | %)(4) |
| Total Annual Fund Operating Expenses After Fee Waiver | | | 1.16 | % | | N/A | | | 0.94 | % |
| (1) | Other Expenses are estimated based on fees and expenses of the Acquiring Fund, assuming the Reorganization had been consummated as of the beginning of the 12-month period ended March 31, 2017. |
| (2) | Acquired Fund Fees and Expenses are expenses indirectly incurred by the Fund through its investments in one or more underlying funds, including money market funds. Because these costs are indirect, the Total Annual Fund Operating Expenses do not correlate to the ratio of expenses to average net assets in the Fund’s most recent annual report. |
| (3) | Touchstone Advisors has agreed to waive a portion of its fees or reimburse certain Fund expenses (excluding dividend and interest expenses relating to short sales; interest; taxes; brokerage commissions and other transaction costs; portfolio transactions and investment related expenses; other expenditures which are capitalized in accordance with U.S. generally accepted accounting principles; the cost of “Acquired Fund Fees and Expenses,” if any; and other extraordinary expenses not incurred in the ordinary course of business) in order to limit annual Fund operating expenses to 0.69% and 0.44% of average daily net assets for Classes A and Y shares, respectively. This contractual expense limitation is effective through January 29, 2018, but can be terminated by a vote of the Touchstone Funds Board if it deems the termination to be beneficial to the Fund’s shareholders. The terms of the contractual expense limitation agreement provide that Touchstone Advisors is entitled to recoup, subject to approval by the Touchstone Funds Board, such amounts waived or reimbursed for a period of up to three years from the year in which Touchstone Advisors reduced its compensation or assumed expenses for the Fund. No recoupment will occur unless the Fund’s expenses are below the lesser of the expense limitation amount in effect (a) at the time of the waiver, or (b) at the time of the reimbursement. Additional information regarding the expense limit is provided under the section entitled “The Funds’ Management—Expense Limitation Agreement”. |
| (4) | Effective upon consummation of the Reorganization, Touchstone Advisors has contractually agreed to waive fees and/or reimburse certain expenses in order to limit total annual fund operating expenses of each class of shares of the Acquiring Fund to 0.69%, 0.44%, and 0.94% of average daily net assets for Classes A, Y, and S shares, respectively. The contractual expense limitation agreement will have the terms described above in Footnote 3 and will remain in effect for at least two years following the closing of the Reorganization. Class S shares will commence operations upon the closing of the Reorganization. Additional information regarding the expense limit is provided under the section entitled “The Funds' Management --Expense Limitation Agreement”. |
27
| (5) | Sentinel has contractually agreed to reimburse certain expenses paid by the Class I shares of the Target Funds to the extent necessary to prevent the total annual fund operating expense ratio of the Class I shares of the Target Funds, on an annualized basis, from exceeding the total annual fund operating expense ratio of the Class A shares of the same Fund. This agreement will continue through March 31, 2018. This agreement may be terminated upon 90 days’ notice by a majority of the non-interested directors of the Sentinel Funds. Additional information regarding the expense limit is provided under the section entitled “The Funds’ Management—Expense Limitation Agreement”. |
Expense Examples. The examples below are intended to help you compare the cost of investing in the Target Fund with the Acquiring Fund pro forma cost of investing in the Acquiring Fund following the Reorganization. The examples assume that you invest $10,000 in each Fund and then sell all of your shares at the end of each period indicated below or (ii) keep all of your shares at the end of each period indicated below. The examples also assume that your investment has a 5% annual return and that operating expenses (before fee waivers and expense reimbursements) remain the same. This example also assumes that the current expense limitation agreement for the Touchstone Ultra Short Duration Fixed Income Fund will remain in place for one year in each period and the expense limitation agreement that takes effect as of the closing of the Reorganization will be in place for two years following the closing of the Reorganization. Although your actual costs may be higher or lower, based on these assumptions, your costs would be:
| If shares are redeemed:(1) | | 1 Year | | 3 Years | | 5 Years | | 10 Years |
| Class A Shares | | | | | | | | | | | | | | | | |
| Sentinel Low Duration Bond Fund | | $ | 203 | | | $ | 421 | | | $ | 658 | | | $ | 1,335 | |
| Touchstone Ultra Short Duration Fixed Income Fund | | $ | 269 | | | $ | 463 | | | $ | 673 | | | $ | 1,277 | |
| Touchstone Ultra Short Duration Fixed Income Fund Pro Forma | | $ | 269 | | | $ | 430 | | | $ | 620 | | | $ | 1,169 | |
| Class I Shares/Class Y Shares | | | | | | | | | | | | | | | | |
| Sentinel Low Duration Bond Fund | | $ | 69 | | | $ | 218 | | | $ | 379 | | | $ | 847 | |
| Touchstone Ultra Short Duration Fixed Income Fund | | $ | 45 | | | $ | 161 | | | $ | 287 | | | $ | 656 | |
| Touchstone Ultra Short Duration Fixed Income Fund Pro Forma | | $ | 45 | | | $ | 149 | | | $ | 271 | | | $ | 627 | |
| Class S Shares | | | | | | | | | | | | | | | | |
| Sentinel Low Duration Bond Fund | | $ | 118 | | | $ | 368 | | | $ | 638 | | | $ | 1,409 | |
| Touchstone Ultra Short Duration Fixed Income Fund | | | N/A | | | | N/A | | | | N/A | | | | N/A | |
| Touchstone Ultra Short Duration Fixed Income Fund Pro Forma | | $ | 96 | | | $ | 302 | | | $ | 527 | | | $ | 1,174 | |
| (1) | For holders of all classes, costs are the same if you held your shares. |
How do the performance records of the Target Fund and the Acquiring Fund compare?
The bar charts and the performance tables below provide some indication of the risks of an investment in each of the Target Fund and the Acquiring Fund by showing how each Fund’s performance has varied from year to year and by showing how each Fund’s average annual returns compare with a broad measure of market performance. Performance of the Class I shares of the Target Fund prior to January 31, 2014 (the inception date for Class I shares) is based on the Target Fund’s Class A share performance, restated to reflect that Class I shares are offered without a sales charge. Effective January 31, 2014, the Target Fund changed its investment strategies from investing primarily in U.S. government securities to investing in a variety of fixed income instruments. The performance information provided below for periods prior to January 31, 2014 relates to the Target Fund’s investment strategies that were in effect during such periods. Past performance of the Target Fund and the Acquiring Fund, before and after taxes, does not necessarily represent how either Fund will perform in the future. Updated performance information for the Target Fund is available on the Target Fund’s website at www.sentinelinvestments.com or by calling 800.282.3863. Updated performance information for the Acquiring Fund is available on the Acquiring Fund’s website at TouchstoneInvestments.com or by calling 800.543.0407.
28
Sentinel Low Duration Bond Fund

| Best Quarter: Third Quarter, 2007 1.97% | Worst Quarter: Fourth Quarter, 2016 (1.14%) |
The Sentinel Low Duration Bond Fund’s calendar year-to-date total return for Class A shares as of March 31, 2017 was 0.49%.
Touchstone Ultra Short Duration Fixed Income Fund
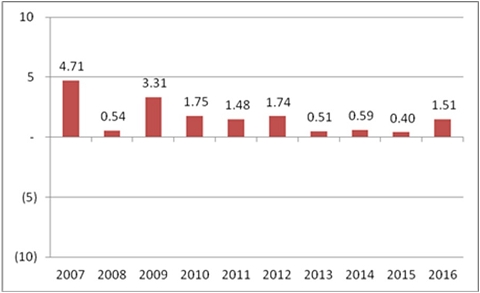
| Best Quarter: Third Quarter, 2012 0.62% | Worst Quarter: Second Quarter, 2013 (0.18%) |
The Touchstone Ultra Short Duration Fixed Income Fund’s calendar year-to-date total return for Class A shares as of March 31, 2017 was 0.34%.
29
Average Annual Total Returns
For the periods ended December 31, 2016
| Sentinel Low Duration Bond Fund | | Inception
Date | | 1 Year | | 5 Years | | 10 Years |
| Class A (return before taxes) | | 03/27/1995 | | | 0.43 | % | | | (0.03 | %) | | | 1.94 | % |
| Class A (return after taxes on distributions) | | 03/27/1995 | | | (0.37 | %) | | | (0.82 | %) | | | 0.93 | % |
| Class A (return after taxes on distributions and sale of fund shares) | | 03/27/1995 | | | 0.24 | % | | | (0.36 | %) | | | 1.11 | % |
| Class I (return before taxes) | | 01/31/2014 | | | 1.91 | % | | | 0.37 | % | | | 2.14 | % |
| Class S (return before taxes) | | 03/04/2005 | | | 1.46 | % | | | (0.01 | %) | | | 1.73 | % |
| Bloomberg Barclays 1-3 Year US Government/Credit Index(1) (reflects no deduction for fees, expenses or taxes) | | N/A | | | 1.28 | % | | | 0.92 | % | | | 2.44 | % |
| | | | | | | | | | | | | | | |
Touchstone Ultra Short Duration Fixed
Income Fund | | Inception
Date | | 1 Year | | 5 Years | | 10 Years |
| Class A (return before taxes) | | 04/12/2012 | | | (0.53 | %) | | | 0.53 | % | | | 1.44 | % |
| Class A (return after taxes on distributions) | | 04/12/2012 | | | (1.08 | %) | | | (0.08 | %) | | | 0.53 | % |
| Class A (return after taxes on distributions and sale of fund shares) | | 04/12/2012 | | | (0.30 | %) | | | 0.14 | % | | | 0.76 | % |
| Class Y (return before taxes) | | 04/12/2012 | | | 1.67 | % | | | 1.17 | % | | | 1.76 | % |
| Class S (return before taxes)(2) | | N/A | | | N/A | | | | N/A | | | | N/A | |
| BofA Merrill Lynch 3-Month U.S. Treasury Bill Index(3) (reflects no deduction for fees, expenses or taxes) | | N/A | | | 0.33 | % | | | 0.12 | % | | | 0.12 | % |
| BofA Merrill Lynch 1-Year U.S. Treasury Note Index(4) (reflects no deduction for taxes or certain expenses) | | N/A | | | 0.76 | % | | | 0.32 | % | | | 0.43 | % |
| (1) | The Bloomberg Barclays 1-3 Year US Government/Credit Index is an index which consists of U.S. government, government agency and investment grade corporate securities with maturities of one to three years. |
| (2) | No returns are included for Class S since the class will commence operations upon the Closing of the Reorganization. |
| (3) | The BofA Merrill Lynch U.S. 3-Month Treasury Bill Index is comprised of a single issue purchased at the beginning of the month and held for a full month. At the end of the month that issue is sold and rolled into a newly selected issue. The issue selected at each month-end rebalancing is the outstanding Treasury Bill that matures closest to, but not beyond, three months from the rebalancing date. To qualify for selection, an issue must have settled on or before the month-end rebalancing date. |
| (4) | The BofA Merrill Lynch 1-Year U.S. Treasury Note Index is an unmanaged index comprised of a single issue purchased at the beginning of the month and held for a full month. At the end of the month that issue is sold and rolled into a newly selected issue. The issue selected at each month-end rebalancing is the outstanding two-year Treasury note that matures closest to, but not beyond, one year from the rebalancing date. To qualify for selection, an issue must have settled on or before the month-end rebalancing date. |
After-tax returns are calculated using the historical highest individual federal marginal income tax rates and do not reflect the impact of state and local taxes. Actual after-tax returns depend on an investor’s tax situation and may differ from those shown. The return after taxes on distributions and sale of Fund shares may exceed the return before taxes due to an assumed tax benefit from any losses on a sale of Fund shares at the end of the measurement period. If you hold your Fund shares through a tax-advantaged arrangement, such as an individual retirement account or a 401(k) plan, the after-tax returns do not apply to your situation.
30
How do the investment goals and principal investment strategies of the Funds compare?
The investment goals and principal investment strategies of the Sentinel Low Duration Bond Fund and the Touchstone Ultra Short Duration Fixed Income Fund, along with descriptions of certain differences between the Funds’ investment goals and principal investment strategies, are set forth in the table below. Although the Funds have similar investment goals and principal strategies, the analytical tools, techniques and investment selection process used by the sub-advisor to the Acquiring Fund may differ from those used by Sentinel.
| | | Sentinel Low Duration
Bond Fund | | Touchstone Ultra Short
Duration Fixed Income
Fund | | Differences |
Investment
Goal(s): | | The Fund seeks high current income and limited fluctuations in principal value. | | The Fund seeks maximum total return consistent with the preservation of capital. | | The Target Fund’s investment goal focuses on current income while the Acquiring Fund’s investment goal focuses on total return. |
| | | | | | | |
| Principal Investment Strategy: | | The Fund normally invests at least 80% of its net assets in fixed income instruments and related derivatives. | | The Fund invests, under normal market conditions, at least 80% of its assets in fixed-income securities.
The Fund invests in a diversified portfolio of securities of different maturities including U.S. Treasury securities, U.S. government agency securities, securities of U.S. government-sponsored enterprises, corporate bonds (including those of foreign issuers), mortgage-backed securities, commercial mortgage-backed securities, asset-backed securities, municipal bonds and cash equivalent securities including repurchase agreements, commercial paper and variable rate demand notes. | | While there are certain differences, each Fund may invest in a broad range of fixed-income securities. The Target Fund may invest in derivatives while the Acquiring Fund does not expect to invest in derivatives. |
31
| | | Sentinel Low Duration
Bond Fund | | Touchstone Ultra Short
Duration Fixed Income
Fund | | Differences |
| Credit Quality: | | Under normal market conditions, the Fund expects to invest no more than 50% of its total assets in below investment-grade debt securities (sometimes called “junk bonds”). | | The Fund invests only in investment-grade debt securities and does not invest in non-investment-grade debt securities. Investment-grade debt securities are those having a rating of BBB-/Baa3 or higher from a nationally recognized statistical rating organization or, if a rating is not available, deemed to be of comparable quality by the Fund’s sub-advisor. Non-investment-grade debt securities are often referred to as “junk bonds” and are considered speculative. | | The Target Fund may invest in non-investment-grade debt securities while the Acquiring Fund does not invest in non-investment-grade debt securities. |
| | | | | | | |
| Duration:(3) | | The Target Fund attempts to manage interest rate risk through its management of the average duration of the securities it holds in its portfolio.
Under normal market conditions, the Fund expects to maintain its average duration range between zero and three years. | | While the Acquiring Fund may invest in securities with any maturity or duration, Fort Washington seeks to maintain an effective duration(4) for the Fund of one year or less under normal market conditions. | | While there are certain differences, both Funds expect to maintain relatively short durations. |
| | | | | | | |
| Non-U.S. Investments: | | The Fund expects to invest in debt securities of U.S. and non-U.S. (including emerging market) issuers denominated in U.S. dollars or foreign currencies. | | — | | The Target Fund expects to invest in debt securities of U.S. and non-U.S. (including emerging market) issuers while the Acquiring Fund has no stated policy regarding investments in non-U.S. securities. |
32
| | | Sentinel Low Duration
Bond Fund | | Touchstone Ultra Short
Duration Fixed Income
Fund | | Differences |
| Derivatives and Hedging: | | The Fund may use derivative instruments in order to hedge various risks and manage the average duration of the Fund’s portfolio.
The Fund’s investments in derivatives include exchange-traded futures on U.S. Treasury notes and bonds and equity indexes, and options on these futures, and other derivatives intended to hedge interest rate risk and credit risk, such as interest rate caps and floors, swaps and options on swaps.
The Fund may use derivative instruments for other investment purposes, such as replicating permitted investments, as long as such investments do not have the effect of leveraging portfolio risks. | | — | | The Target Fund may use derivative instruments for various purposes, including hedging, while the Acquiring Fund has no stated policy regarding use of derivative instruments. |
| | | | | | | |
| Active Trading: | | The Fund utilizes an active trading approach which is expected to result in portfolio turnover greater than 100%. | | The Fund may engage in frequent and active trading of securities as a part of its principal investment strategy. | | — |
| (3) | Duration is a mathematical concept that measures a portfolio’s sensitivity to interest rate changes. The longer a portfolio’s duration, the more sensitive it is to changes in interest rates. The shorter a portfolio’s duration, the less sensitive it is to changes in interest rates. For example, the price of a portfolio with a duration of five years would be expected to fall approximately five percent if interest rates rose by one percentage point and a portfolio with a duration of two years would be expected to fall approximately two percent if interest rates rose by one percentage point.. |
| (4) | Effective duration is a measure of a security’s price volatility or the risk associated with changes in interest rates. |
Additional Information About the Funds’ Principal Investment Strategies
Target Fund. Under normal market conditions, the Fund expects to invest no more than 50% of its total assets in any one or combination of the following types of fixed income securities and other instruments:
| • | Below investment-grade debt securities (sometimes called “junk bonds”); |
| • | Debt securities of non-U.S. (including emerging markets) issuers that are denominated in foreign currencies; |
| • | Senior bank loans, including participations; and |
| • | Convertible securities, including convertible bonds and preferred stocks. |
33
The Target Fund may invest in exchange-traded funds (“ETFs”) and considers investments in bond ETFs (ETFs whose underlying portfolio consists of debt instruments) as investments in fixed income instruments. At times, the Fund may have considerable exposure to ETFs.
The Target Fund may also purchase or sell “to be announced” or “TBA” securities, which usually are transactions in which the Fund buys or sells agency mortgage-backed securities (“MBS”) on a forward commitment basis. In a TBA transaction, the seller of the agency MBS agrees on a sale price, but does not specify which particular securities will be delivered to the buyer on settlement day. Instead, only a few basic characteristics of the securities are agreed upon, such as the coupon rate and the face value. The Fund may engage in short sales of agency MBS that the Fund does not own, primarily as part of a TBA swap transaction. A TBA swap transaction involves an agreement to purchase one agency MBS and a simultaneous agreement to sell a different agency MBS.
The Target Fund may sell a security if it no longer meets the Fund’s investment criteria, or for a variety of other reasons, such as to secure gains, limit losses, maintain its duration, redeploy assets into opportunities believed to be more promising, or satisfy redemption requests, among others.
Acquiring Fund. In selecting investments for the Fund, in addition to considering effective duration, the Fund’s sub-advisor, Fort Washington, chooses fixed-income securities that it believes are attractively priced relative to the market or to similar instruments.
How do the principal risks of investing in the Funds compare?
An investment in each Fund is subject to fixed-income securities risk, foreign securities risk and portfolio turnover risk. An investment in the Sentinel Low Duration Bond Fund is also subject to derivatives risk, inflation-linked investments risk, other investment companies and ETFs risk, short sales risk and TBA securities risk, as well as additional fixed-income securities risks including corporate loan risk and non-investment-grade debt securities risk. An investment in the Touchstone Ultra Short Duration Fixed Income Fund is also subject to management risk and repurchase agreement risk. For more information on the Funds’ principal risks, see “Comparison of Principal Risks.”
Who will be the Advisor, Sub-Advisor and Portfolio Managers of my Fund after the Reorganization?
Sentinel is the investment advisor to Sentinel Low Duration Bond Fund. The portfolio manager of Sentinel Low Duration Bond Fund is Jason Doiron.
After the Reorganization, Touchstone Advisors will serve as the investment advisor and Fort Washington will serve as the sub-advisor to Touchstone Ultra Short Duration Fixed Income Fund. The portfolio managers of Touchstone Ultra Short Duration Fixed Income Fund are Scott D. Weston and Brent A. Miller. For additional information regarding the advisor, sub-advisor and portfolio managers listed above, please see the section entitled “The Funds’ Management—Investment Advisor” and “The Funds’ Management—Sub-Advisors and Portfolio Managers.”
What are the portfolio turnover rates of the Funds?
A Fund pays transaction costs, such as brokerage commissions, when it buys and sells securities (or “turns over” its portfolio). A higher portfolio turnover rate may indicate higher transaction costs and may result in higher taxes when Fund shares are held in a taxable account. These costs, which are not reflected in annual fund operating expenses or in the example, affect a Fund’s performance. During the fiscal year ended November 30, 2016, the Target Fund’s portfolio turnover rate was 117% of the average value of its portfolio. During the fiscal year ended September 30, 2016, the portfolio turnover rate of the Acquiring Fund was 169% of the average value of its portfolio.
Will there be any repositioning of the portfolio after the Reorganization?
It is expected that a significant portion (approximately two-thirds) of the portfolio investments of the Target Fund may be sold by the Acquiring Fund following the Reorganization. However, the timing of any repositioning and its resulting impact on capital gains distributions in 2017 and beyond is uncertain. The amounts per share of any capital gains distributions resulting from the repositioning will depend on a number of factors, including the proportion of portfolio holdings that are actually sold, the timing of portfolio sales, the performance of the bond market in general, the availability of offsetting capital losses and the scale of purchase and redemption activity in the Funds' shares. The timing of portfolio sales will also be subject to market conditions existing after the closing of the Reorganization. Accordingly, the per share amounts of any capital gains distributions resulting from the repositioning cannot be estimated at this time. Touchstone Advisors publishes estimates of capital gains distributions for the Touchstone Funds on its website (https://www.touchstoneinvestments.com/literature-center/taxplanning.htm), generally in October of each year. The Acquiring Fund will also bear brokerage costs in connection with the repositioning. For illustration purposes only, if the Reorganization had been completed as of March 31, 2017 and the Acquiring Fund had sold on a pro rata basis two-thirds of the investments held in the Target Fund's portfolio as of March 31, 2017, the resulting realized capital gains estimate would be expected to total $0.003 per share of the combined fund and the brokerage commissions would be expected to total approximately $471,000 in the aggregate, or $0.005 per share of the combined fund, based on average commission costs of the Acquiring Fund. Under the same circumstances, if only one-third of the investments held in the Target Fund's portfolio had been repositioned as of March 31, 2017, the resulting realized capital gains and brokerage cost estimates would be reduced by half, to $0.002 and $0.002 per share of the combined fund, respectively.
34
Synopsis: Reorganization of Sentinel Multi-Asset Income Fund into
Touchstone Flexible Income Fund
What class of shares of the Acquiring Fund will I receive in the Reorganization?
Shareholders of the Sentinel Multi-Asset Income Fund will receive shares of the Touchstone Flexible Income Fund, as follows:
| Sentinel Multi-Asset Income Fund | | Touchstone Flexible Income Fund |
| Class A | | Class A |
| Class C | | Class C |
| Class I | | Class Y |
How do the fees and expenses of the Target Fund and the Acquiring Fund compare?
The tables below describe the fees and expenses that you pay if you buy and hold shares of your Sentinel Fund and the pro forma fees and expenses that you may pay if you buy and hold shares of the corresponding Touchstone Fund after giving effect to the Reorganization. The pro forma expense ratios project anticipated expenses of the Acquiring Fund following the Reorganization, but actual expenses may be greater or less than those shown. Expenses for the Class A, Class C and Class I shares of the Sentinel Multi-Asset Income Fund are based on the operating expenses incurred by each class of shares of the Fund for the fiscal year ended November 30, 2016. Expenses for the Class A, Class C and Class Y shares of the Touchstone Flexible Income Fund are based on the operating expenses incurred by each class of shares of the Fund for the fiscal year ended March 31, 2017. The pro forma fees and expenses for the Class A, Class C and Class Y shares of the Touchstone Flexible Income Fund reflect the fees and expenses of the Acquiring Fund and assume that the Reorganization had been completed at the beginning of the 12-month period ended March 31, 2017.
No sales charge will be imposed on the Class A shares of the Acquiring Fund received in connection with the Reorganization. In addition, you may qualify for sales charge discounts for Class A shares if you and your family invest, or agree to invest in the future, at least $25,000 or more in the Sentinel Funds or $50,000 or more in the Touchstone Funds. For the Target Fund, more information about these and other discounts is available from your financial professional and in the section entitled “Share Classes” on page 82 of the Target Fund’s prospectus and “How to Purchase Shares and Reduce Sales Charges” on page 44 of the Target Fund’s SAI. For the Acquiring Fund, more information about these and other discounts is available from your financial professional and in the section entitled “Investing with Touchstone—Class A Shares—Letter of Intent” on page [•] of this Joint Proxy Statement/Prospectus and in the Acquiring Fund’s SAI on page [•].
SHAREHOLDER FEES
(fees paid directly from your investment)
| | | Maximum Sales
Charge (Load)
Imposed on
Purchases (as a
percentage of
offering price) | | Maximum Deferred
Sales Charge (load)
(as a percentage of
the lower of original
purchase price or
redemption
proceeds) | | Wire
Redemption
Fee |
| | | | | | | | | |
| Sentinel Multi-Asset Income Fund – Class A Shares | | | 5.00 | % | | None | | None |
| Touchstone Flexible Income Fund – Class A Shares | | | 5.75 | % | | None | | up to $15 |
| Touchstone Flexible Income Fund – Class A Shares Pro Forma | | | 5.75 | %(1)(2) | | None(2) | | up to $15 |
35
| | | Maximum Sales
Charge (Load)
Imposed on
Purchases (as a
percentage of
offering price) | | Maximum Deferred
Sales Charge (load)
(as a percentage of
the lower of original
purchase price or
redemption
proceeds) | | Wire
Redemption
Fee |
| Sentinel Multi-Asset Income Fund – Class C Shares | | | None | | | 1.00%(2) | | None |
| Touchstone Flexible Income Fund – Class C Shares | | | None | | | 1.00%(2) | | up to $15 |
| Touchstone Flexible Income Fund – Class C Shares Pro Forma | | | None | | | 1.00%(2) | | up to $15 |
| | | | | | | | | |
| Sentinel Multi-Asset Income Fund – Class I Shares | | | None | | | None | | None |
| Touchstone Flexible Income Fund – Class Y Shares | | | None | | | None | | up to $15 |
| Touchstone Flexible Income Fund – Class Y Shares Pro Forma | | | None | | | None | | up to $15 |
| (1) | No sales charge will be imposed on the Class A shares of the Acquiring Fund received in connection with the Reorganization. |
| (2) | A deferred sales charge of 1% applies to certain redemptions of Class A shares made within twelve months of purchase if the shares were purchased without an initial sales charge as part of an investment of $1 million or more. If you hold load-waived Class A shares or Class C shares of the Target Fund, the Acquiring Fund will look to the date of purchase of your Target Fund shares for purposes of assessing deferred sales charges on shares received in the Reorganization. |
ANNUAL FUND OPERATING EXPENSES
(expenses that you pay each year as a percentage of the value of your investment)
| | | Sentinel Multi-
Asset Income Fund
(Class A Shares) | | Touchstone
Flexible Income
Fund
(Class A Shares) | | Touchstone Flexible
Income Fund
Pro Forma
(Class A Shares) |
| Management Fees | | | 0.53 | % | | | 0.68 | % | | | 0.55 | %(1) |
| Distribution/Service (12b-1) Fees | | | 0.25 | % | | | 0.25 | % | | | 0.25 | % |
| Dividend and Interest Expenses on Securities Sold Short | | None | | | 0.01 | % | | | 0.01 | %(2) |
| Other Expenses | | | 0.23 | % | | | 0.36 | % | | | 0.31 | %(2) |
| Acquired Fund Fees and Expenses(3) | | | 0.19 | % | | | 0.02 | % | | | 0.02 | %(2) |
| Total Annual Fund Operating Expenses | | | 1.20 | % | | | 1.32 | % | | | 1.14 | % |
| Fee Waiver | | None | | | (0.20 | %)(4) | | | (0.07 | %)(5) |
| Total Annual Fund Operating Expenses After Fee Waiver | | | 1.20 | % | | | 1.12 | % | | | 1.07 | % |
ANNUAL FUND OPERATING EXPENSES
(expenses that you pay each year as a percentage of the value of your investment)
| | | Sentinel Multi-
Asset Income Fund
(Class C Shares) | | Touchstone
Flexible Income
Fund
(Class C Shares) | | Touchstone Flexible
Income Fund
Pro Forma
(Class C Shares) |
| Management Fees | | | 0.53 | % | | | 0.68 | % | | | 0.55 | %(1) |
| Distribution/Service (12b-1) Fees | | | 1.00 | % | | | 1.00 | % | | | 1.00 | % |
36
| | | Sentinel Multi-
Asset Income Fund
(Class C Shares) | | Touchstone
Flexible Income
Fund
(Class C Shares) | | Touchstone Flexible
Income Fund
Pro Forma
(Class C Shares) |
| Dividend and Interest Expenses on Securities Sold Short | | None | | | 0.01 | % | | | 0.01 | %(2) |
| Other Expenses | | | 0.22 | % | | | 0.31 | % | | | 0.29 | %(2) |
| Acquired Fund Fees and Expenses(3) | | | 0.19 | % | | | 0.02 | % | | | 0.02 | %(2) |
| Total Annual Fund Operating Expenses | | | 1.94 | % | | | 2.02 | % | | | 1.87 | % |
| Fee Waiver | | None | | | (0.15 | %)(4) | | | (0.05 | %)(5) |
| Total Annual Fund Operating Expenses After Fee Waiver | | | 1.94 | % | | | 1.87 | % | | | 1.82 | % |
ANNUAL FUND OPERATING EXPENSES
(expenses that you pay each year as a percentage of the value of your investment)
| | | Sentinel Multi-
Asset Income Fund
(Class I Shares) | | Touchstone
Flexible Income
Fund
(Class Y Shares) | | Touchstone Flexible
Income Fund
Pro Forma
(Class Y Shares) |
| Management Fees | | | 0.53 | % | | | 0.68 | % | | | 0.55 | %(1) |
| Distribution/Service (12b-1) Fees | | None | | None | | None |
| Dividend and Interest Expenses on Securities Sold Short | | None | | | 0.01 | % | | | 0.01 | %(2) |
| Other Expenses | | | 0.26 | % | | | 0.31 | % | | | 0.31 | %(2) |
| Acquired Fund Fees and Expenses(3) | | | 0.19 | % | | | 0.02 | % | | | 0.02 | %(2) |
| Total Annual Fund Operating Expenses | | | 0.98 | % | | | 1.02 | % | | | 0.89 | % |
| Fee Waiver | | | — | (6) | | | (0.15 | %)(4) | | | (0.07 | %)(5) |
| Total Annual Fund Operating Expenses After Fee Waiver | | | 0.98 | % | | | 0.87 | % | | | 0.82 | % |
| (1) | Restated to reflect the management fee that will take effect upon consummation of the Reorganization. |
| (2) | Other Expenses, Dividend and Interest Expenses on Securities Sold Short and Acquired Fund Fees and Expenses are estimated based on fees and expenses of the Acquiring Fund, assuming the Reorganization had been consummated as of the beginning of the 12-month period ended March 31, 2017. |
| (3) | Acquired Fund Fees and Expenses are expenses indirectly incurred by the Fund through its investments in one or more underlying funds, including money market funds. Because these costs are indirect, the Total Annual Fund Operating Expenses do not correlate to the ratio of expenses to average net assets in the Fund’s most recent annual report. |
| (4) | Touchstone Advisors has agreed to waive a portion of its fees or reimburse certain Fund expenses (excluding dividend and interest expenses relating to short sales; interest; taxes; brokerage commissions and other transaction costs; portfolio transactions and investment related expenses; other expenditures which are capitalized in accordance with U.S. generally accepted accounting principles; the cost of “Acquired Fund Fees and Expenses,” if any; and other extraordinary expenses not incurred in the ordinary course of business) in order to limit annual Fund operating expenses to 1.09%, 1.84% and 0.84% of average daily net assets for Classes A, C, and Y shares, respectively. This contractual expense limitation is effective through July 29, 2018, but can be terminated by a vote of the Touchstone Funds Board if it deems the termination to be beneficial to the Fund’s shareholders. The terms of the contractual expense limitation agreement provide that Touchstone Advisors is entitled to recoup, subject to approval by the Touchstone Funds Board, such amounts waived or reimbursed for a period of up to three years from the year in which Touchstone Advisors reduced its compensation or assumed expenses for the Fund. No recoupment will occur unless the Fund’s expenses are below the lesser of the expense limitation amount in effect (a) at the time of the waiver, or (b) at the time of the reimbursement. Additional information regarding the expense limit is provided under the section entitled “The Funds’ Management—Expense Limitation Agreement”. |
| (5) | Effective upon consummation of the Reorganization, Touchstone Advisors has contractually agreed to waive fees and/or reimburse certain expenses in order to limit total annual fund operating expenses of each class of shares of the Acquiring Fund to 1.04%, 1.79%, and 0.79% of average daily net assets for Classes A, C, and Y shares, respectively. The contractual expense limitation agreement will have the terms described above in Footnote 4 and will remain in effect for at least two years following the closing of the Reorganization. Additional information regarding the expense limit is provided under the section entitled “The Funds’ Management—Expense Limitation Agreement”. |
37
| (6) | Sentinel has contractually agreed to reimburse certain expenses paid by the Class I shares of the Target Funds to the extent necessary to prevent the total annual fund operating expense ratio of the Class I shares of the Target Funds, on an annualized basis, from exceeding the total annual fund operating expense ratio of the Class A shares of the same Fund. This agreement will continue through March 31, 2018. This agreement may be terminated upon 90 days’ notice by a majority of the non-interested directors of the Sentinel Funds. Additional information regarding the expense limit is provided under the section entitled “The Funds’ Management—Expense Limitation Agreement”. |
Expense Examples. The examples below are intended to help you compare the cost of investing in the Target Fund with the cost of investing in the Acquiring Fund. The examples assume that you invest $10,000 in each Fund and then either (i) sell all of your shares at the end of each period indicated below or (ii) keep all of your shares at the end of each period indicated below. The examples also assume that your investment has a 5% annual return and that operating expenses (before fee waivers and expense reimbursements) remain the same. This example also assumes that the current expense limitation agreement for the Touchstone Flexible Income Fund will remain in place for one year in each period and the expense limitation agreement that will take effect as of the Closing to the Reorganization will be in place for two years following the closing of the Reorganization. Although your actual costs may be higher or lower, based on these assumptions, your costs would be:
| If shares are redeemed: | | 1 Year | | 3 Years | | 5 Years | | 10 Years |
| Class A Shares | | | | | | | | | | | | | | | | |
| Sentinel Multi-Asset Income Fund | | $ | 616 | | | $ | 862 | | | $ | 1,127 | | | $ | 1,882 | |
| Touchstone Flexible Income Fund | | $ | 683 | | | $ | 951 | | | $ | 1,239 | | | $ | 2,057 | |
| Touchstone Flexible Income Fund Pro Forma | | $ | 678 | | | $ | 903 | | | $ | 1,153 | | | $ | 1,869 | |
| Class C Shares | | | | | | | | | | | | | | | | |
| Sentinel Multi-Asset Income Fund | | $ | 297 | | | $ | 609 | | | $ | 1,047 | | | $ | 2,264 | |
| Touchstone Flexible Income Fund | | $ | 290 | | | $ | 619 | | | $ | 1,074 | | | $ | 2,336 | |
| Touchstone Flexible Income Fund Pro Forma | | $ | 285 | | | $ | 578 | | | $ | 1,001 | | | $ | 2,182 | |
| Class I Shares/Class Y Shares | | | | | | | | | | | | | | | | |
| Sentinel Multi-Asset Income Fund | | $ | 100 | | | $ | 312 | | | $ | 542 | | | $ | 1,201 | |
| Touchstone Flexible Income Fund | | $ | 89 | | | $ | 310 | | | $ | 549 | | | $ | 1,234 | |
| Touchstone Flexible Income Fund Pro Forma | | $ | 84 | | | $ | 270 | | | $ | 479 | | | $ | 1,083 | |
| | | | | | | | | | | | | | | | | |
| If shares are not redeemed:(1) | | 1 Year | | 3 Years | | 5 Years | | 10 Years |
| Class C Shares | | | | | | | | | | | | | | | | |
| Sentinel Multi-Asset Income Fund | | $ | 197 | | | $ | 609 | | | $ | 1,047 | | | $ | 2,264 | |
| Touchstone Flexible Income Fund | | $ | 190 | | | $ | 619 | | | $ | 1,074 | | | $ | 2,236 | |
| Touchstone Flexible Income Fund Pro Forma | | $ | 185 | | | $ | 578 | | | $ | 1,001 | | | $ | 2,182 | |
| (1) | For holders of all other classes, the costs are the same as set forth above. |
How do the performance records of the Target Fund and the Acquiring Fund compare?
The bar charts and the performance tables below provide some indication of the risks of an investment in each of the Target Fund and the Acquiring Fund by showing how each Fund’s performance has varied from year to
38
year and by showing how each Fund’s average annual returns compare with a broad measure of market performance. Performance of the Class A shares of the Target Fund prior to June 30, 2012, has not been adjusted to reflect the decrease in the maximum 12b-1 fee from 0.30% to 0.25%. If it had, those returns would be higher. Performance of the Class I shares of the Target Fund prior to December 17, 2010 (the inception date for the Class I shares) is based on the Fund’s Class A share performance, restated to reflect that Class I shares are offered without a sales charge. Effective July 1, 2014, the Target Fund changed its investment strategies. The performance information provided below for periods prior to July 1, 2014 relates to the Target Fund’s investment strategies that were in effect during such periods. Past performance of the Target Fund and the Acquiring Fund, before and after taxes, does not necessarily represent how either Fund will perform in the future. Updated performance information for the Target Fund is available on the Target Fund’s website at www.sentinelinvestments.com or by calling 800.282.3863. Updated performance information for the Acquiring Fund is available on the Acquiring Fund’s website at TouchstoneInvestments.com or by calling 800.543.0407.
Sentinel Multi-Asset Income Fund
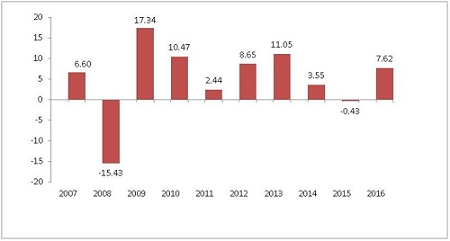
| Best Quarter: Third Quarter, 2009 7.66% | Worst Quarter: Fourth Quarter, 2008 (10.97%) |
The Sentinel Multi-Asset Income Fund’s calendar year-to-date total return for Class A shares as of March 31, 2017 was 1.63%.
Touchstone Flexible Income Fund
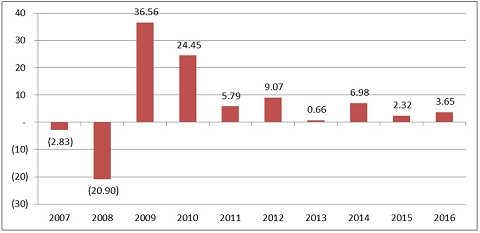
| Best Quarter: Second Quarter, 2009 21.98% | Worst Quarter: Third Quarter, 2008 (18.48%) |
39
The Touchstone Flexible Income Fund’s calendar year-to-date total return for Class A shares as of March 31, 2017 was 1.97%.
Average Annual Total Returns
For the periods ended December 31, 2016
| Sentinel Multi-Asset Income Fund | | Inception
Date | | 1 Year | | 5 Years | | 10 Years |
| | | | | | | | | |
| Class A (return before taxes) | | 03/10/2003 | | | 2.21 | % | | | 4.93 | % | | | 4.29 | % |
| Class A (return after taxes on distributions) | | 03/10/2003 | | | 0.60 | % | | | 3.27 | % | | | 3.03 | % |
| Class A (return after taxes on distributions and sale of fund shares) | | 03/10/2003 | | | 1.33 | % | | | 3.39 | % | | | 3.02 | % |
| Class C (return before taxes) | | 03/10/2003 | | | 5.88 | % | | | 5.24 | % | | | 4.03 | % |
| Class I (return before taxes) | | 12/17/2010 | | | 7.85 | % | | | 6.25 | % | | | 4.95 | % |
| S&P 500® Index(1) (reflects no deduction for fees, expenses or taxes) | | N/A | | | 11.96 | % | | | 14.66 | % | | | 6.95 | % |
| Bloomberg Barclays US Aggregate Bond Index(2) (reflects no deduction for taxes or certain expenses) | | N/A | | | 2.65 | % | | | 2.23 | % | | | 4.34 | % |
| Touchstone Flexible Income Fund | | Inception
Date | | 1 Year | | 5 Years | | 10 Years |
| | | | | | | | | |
| Class A (return before taxes) | | 04/01/2004 | | | (2.23 | %) | | | 3.26 | % | | | 3.90 | % |
| Class A (return after taxes on distributions) | | 04/01/2004 | | | (3.35 | %) | | | 1.80 | % | | | 2.04 | % |
| Class A (return after taxes on distributions and sale of fund shares) | | 04/01/2004 | | | (1.24 | %) | | | 1.96 | % | | | 2.28 | % |
| Class C (return before taxes) | | 10/29/2001 | | | 1.84 | % | | | 3.72 | % | | | 3.74 | % |
| Class Y (return before taxes) | | 09/01/1998 | | | 3.90 | % | | | 4.77 | % | | | 4.77 | % |
| Bloomberg Barclays US Aggregate Bond Index(2) (reflects no deduction for fees, expenses or taxes) | | N/A | | | 2.65 | % | | | 2.23 | % | | | 4.34 | % |
| (1) | The S&P 500® Index consists of approximately 500 widely held U.S. equity securities chosen for market size, liquidity, and industry group representation. |
| (2) | The Bloomberg Barclays US Aggregate Bond Index measures the U.S. investment grade fixed-rate bond market, with index components for government and corporate securities, mortgage pass-through securities and asset-backed securities. |
After-tax returns are calculated using the historical highest individual federal marginal income tax rates and do not reflect the impact of state and local taxes. Actual after-tax returns depend on an investor’s tax situation and may differ from those shown. The return after taxes on distributions and sale of Fund shares may exceed the return before taxes due to an assumed tax benefit from any losses on a sale of Fund shares at the end of the measurement period. If you hold your Fund shares through a tax-advantaged arrangement, such as an individual retirement account or a 401(k) plan, the after-tax returns do not apply to your situation.
How do the investment goals and principal investment strategies of the Funds compare?
The investment goals and principal investment strategies of the Sentinel Multi-Asset Income Fund and the Touchstone Flexible Income Fund, along with descriptions of certain differences between the Funds’ investment goals and principal investment strategies, are set forth in the table below. Although the Funds have similar investment goals and principal strategies, the analytical tools, techniques and investment selection process used by the sub-advisor to the Acquiring Fund may differ from those used by Sentinel.
40
| | | Sentinel Multi-Asset
Income Fund | | Touchstone Flexible
Income Fund | | Differences |
| | | | | | | |
| Investment Goal(s): | | The Fund seeks a high level of current income, with a secondary objective of long-term capital appreciation. | | The Fund seeks a high level of income consistent with reasonable risk. The Fund seeks capital appreciation as a secondary goal. | | While there are certain differences, each Fund seeks a high level of income and has a secondary goal of capital appreciation. |
| | | | | | | |
| Principal Investment Strategy: | | The Fund normally invests in a broad range of debt instruments and equity securities. | | Under normal circumstances, the Fund invests at least 80% of its assets in income-producing securities such as debt securities, common stocks, and preferred stocks. | | While there are certain differences, each Fund may invest in a broad range of debt and equity securities. |
| | | | | | | |
| Credit Quality: | | The debt instruments may be of any credit quality, including high-yield (below investment-grade) bonds (sometimes called “junk bonds”). | | In selecting corporate debt securities for the Fund, the Fund’s sub-advisor intends to invest principally in securities rated Baa or better by Moody’s Investors Service, Inc. (“Moody’s”) (or the equivalent using Standard & Poor’s Ratings Services (“S&P”)), but may invest in non-investment-grade debt securities rated as low as Ba, B, Caa, or Ca by Moody’s, or unrated securities.
The Fund will not invest more than 20% of its assets in either (i) securities rated Ba or lower by Moody’s or (ii) unrated securities which, in the opinion of the Fund’s sub-advisor, are of quality comparable to those rated Ba or lower. Non-investment-grade debt securities are often referred to as “junk bonds” and are considered speculative. | | The Target Fund may invest in non-investment-grade debt securities to a greater degree than the Acquiring Fund. |
| | | | | | | |
| Market Capitalization: | | The Fund may invest in stocks of any size or any market capitalization. | | The Fund normally invests in equity securities of companies with a market capitalization of approximately $400 million or higher. | | The Target Fund may invest in stocks of any market capitalization while the Acquiring Fund normally invests in equity securities of companies with a market capitalization of approximately $400 million or higher. |
41
| | | Sentinel Multi-Asset
Income Fund | | Touchstone Flexible
Income Fund | | Differences |
| | | | | | | |
| Non-U.S. Investments: | | The Fund may invest no more than 70% of its assets in equity securities of non-U.S. companies. Assets in which the Fund invests may be denominated in U.S. dollars or foreign currencies. | | The Fund may invest in both domestic and foreign securities. | | The Target Fund may invest no more than 70% of its assets in equity securities of non-U.S. companies while the Acquiring Fund has no stated limitation on investments in foreign securities. |
| | | | | | | |
| Derivatives and Hedging: | | The Fund may attempt to hedge various risks, such as interest rate, equity, credit and currency risk, using derivative instruments (e.g., exchange-traded futures and options, and other derivatives such as swaps, options on swaps, and interest rate caps and floors), and may use derivative instruments for other investment purposes such as replicating permitted investments, as long as such investments do not have the effect of leveraging portfolio risks. | | In order to efficiently seek certain exposures or to hedge certain risks, the Fund may invest in derivative instruments, such as currency forwards, options, futures contracts or swap agreements. | | While there are certain differences, each Fund may utilize derivatives instruments in order to hedge certain risks and obtain certain exposures. |
| | | | | | | |
| Active Trading: | | The Fund utilizes an active trading approach, which is expected to result in portfolio turnover greater than 100%. | | The Fund may utilize active trading and have portfolio turnover greater than 100%. | | — |
Additional Information About the Funds’ Principal Investment Strategies
Target Fund. Sentinel has broad discretion to allocate assets among asset classes in order to pursue the Target Fund’s investment objective, and may shift the Fund’s investments from one asset class to another based on Sentinel’s analysis of the best opportunities for the Fund in a given market. The Fund may invest up to 100% of its assets in equity securities, including common stocks, preferred stock, utility stocks, publicly-traded real estate investment trusts (“REITs”) securities and other equity trusts and partnership interests, including master limited partnerships. Currently, the Fund expects to invest no more than 40% of its assets in equity securities.
The Target Fund may invest in exchange-traded funds (“ETFs”) in carrying out its investment strategies. At times, the Fund may have considerable exposure to ETFs, potentially a majority of the Fund’s assets may be invested in a combination of different ETFs. The Fund may purchase or sell “to be announced” or “TBA” securities, which usually are transactions in which the Fund buys or sells agency mortgage-backed securities (“MBS”) on a forward commitment basis. In a TBA transaction, the seller of the agency MBS agrees on a sale price, but does not specify which particular securities will be delivered to the buyer on settlement day. Instead, only a few basic characteristics of the securities are agreed upon, such as the coupon rate and the face value. The Fund may engage in short sales of agency MBS that the Fund does not own, primarily as part of a TBA swap transaction. A TBA swap transaction involves an agreement to purchase one agency MBS and a simultaneous agreement to sell a different agency MBS.
The debt instruments in which the Fund may invest may be of any maturity and may include all varieties of fixed and floating rate instruments, including, without limitation, secured and unsecured bonds and mortgage-
42
backed or other asset-backed securities. The Fund may invest up to 100% of its assets in debt instruments, and has the flexibility to invest exclusively in any one type of debt instrument or in any combination of debt instruments.
The Target Fund may sell a security if it no longer meets the Fund’s investment criteria, or for a variety of other reasons, such as to secure gains, limit losses, redeploy assets into opportunities believed to be more promising, or satisfy redemption requests, among others.
Acquiring Fund. The Acquiring Fund’s sub-advisor, ClearArc Capital, Inc. (“ClearArc Capital”), seeks to provide value by investing in asset classes that appear to be attractive based on their risks and in companies with attractive price-to-cash flow ratios. The Fund seeks returns by investing across a broader array of investments than traditional investment-grade fixed-income funds, and the Fund’s sub-advisor believes that a low correlation between various asset classes leads to stability of expected returns. The Acquiring Fund will increase its investment in short-term debt securities during periods when the Fund’s sub-advisor believes interest rates will rise and will increase its investment in long-term debt securities during periods when the sub-advisor believes interest rates will decline. Debt securities in which the Fund may invest may be of any maturity and include, but are not limited to, U.S. government agency securities, variable and floating-rate instruments, and mortgage- and asset-backed securities. Certain of the debt securities and preferred stocks in which the Fund may invest may be convertible into common shares.
The Acquiring Fund’s sub-advisor may consider selling a portfolio holding when it detects deterioration in a company’s strategic position, growth prospects, or financial reporting; an individual security comprises too large a position in the portfolio; a company has declining financial fundamentals and unacceptable risk volatility as determined by the sub-advisor’s credit risk model; a company’s valuations are no longer attractive; or a better opportunity arises.
How do the principal risks of investing in the Funds compare?
An investment in each Fund is subject to derivatives risk, equity securities (stock market) risk, fixed-income securities risk including non-investment-grade securities risk, foreign securities risk, other investment companies and ETFs risk and portfolio turnover risk. An investment in the Sentinel Multi-Asset Income Fund is also subject to asset allocation risk, income risk, sector risk, short sales risk, TBA securities risk and utilities industry risk. An investment in the Touchstone Flexible Income Fund is also subject to convertible securities risk, foreign securities risk and management risk, as well as additional equity securities risks including small cap risk. For more information on the Funds’ principal risks, see “Comparison of Principal Risks.”
Who will be the Advisor, Sub-Advisor and Portfolio Managers of my Fund after the Reorganization?
Sentinel is the investment advisor to Sentinel Multi-Asset Income Fund. The portfolio manager of Sentinel Multi-Asset Income Fund is Jason Doiron.
After the Reorganization, Touchstone Advisors will serve as the investment advisor and ClearArc Capital will serve as the sub-advisor to Touchstone Flexible Income Fund. The portfolio managers of Touchstone Flexible Income Fund are Peter Kwiatkowski, David Withrow, Mitchell Stapley and John Cassady. For additional information regarding the advisor, sub-advisor and portfolio managers listed above, please see the section entitled “The Funds’ Management—Investment Advisor” and “The Funds’ Management—Sub-Advisors and Portfolio Managers.”
What are the portfolio turnover rates of the Funds?
A Fund pays transaction costs, such as brokerage commissions, when it buys and sells securities (or “turns over” its portfolio). A higher portfolio turnover rate may indicate higher transaction costs and may result in higher taxes when Fund shares are held in a taxable account. These costs, which are not reflected in annual fund operating expenses or in the example, affect a Fund’s performance. During the fiscal year ended November 30, 2016, the Target Fund’s portfolio turnover rate was 228% of the average value of its portfolio. During the fiscal year ended March 31, 2017, the portfolio turnover rate of the Acquiring Fund was 127% of the average value of its portfolio.
43
Will there be any repositioning of the portfolio after the Reorganization?
It is expected that a significant portion (approximately two-thirds) of the portfolio investments of the Target Fund may be sold by the Acquiring Fund following the Reorganization. However, the timing of any repositioning and its resulting impact on capital gains distributions in 2017 and beyond is uncertain. The amounts per share of any capital gains distributions resulting from the repositioning will depend on a number of factors, including the proportion of portfolio holdings that are actually sold, the timing of portfolio sales, the performance of the stock and bond markets in general, the availability of offsetting capital losses and the scale of purchase and redemption activity in the Funds' shares. The timing of portfolio sales will also be subject to market conditions existing after the closing of the Reorganization. Accordingly, the per share amounts of any capital gains distributions resulting from the repositioning cannot be estimated at this time. Touchstone Advisors publishes estimates of capital gains distributions for the Touchstone Funds on its website (https://www.touchstoneinvestments.com/literature-center/taxplanning.htm), generally in October of each year. The Acquiring Fund will also bear brokerage costs in connection with the repositioning. For illustration purposes only, if the Reorganization had been completed as of March 31, 2017 and the Acquiring Fund had sold on a pro rata basis two-thirds of the investments held in the Target Fund's portfolio as of March 31, 2017, the resulting realized capital gains estimate would be expected to total $0.03 per share of the combined fund and the brokerage commissions would be expected to total approximately $295,000 in the aggregate, or $0.003 per share of the combined fund, based on average commission costs of the Acquiring Fund. Under the same circumstances, if only one-third of the investments held in the Target Fund's portfolio had been repositioned as of March 31, 2017, the resulting realized capital gains and brokerage cost estimates would be reduced by half, to $0.02 and $0.002 per share of the combined fund, respectively.
44
Synopsis: Reorganization of Sentinel Sustainable Core Opportunities Fund into Touchstone Sustainability and Impact Equity Fund
What class of shares of the Acquiring Fund will I receive in the Reorganization?
Shareholders of the Sentinel Sustainable Core Opportunities Fund will receive shares of the Touchstone Sustainability and Impact Equity Fund, as follows:
Sentinel Sustainable Core
Opportunities Fund | | Touchstone Sustainability and
Impact Equity Fund |
| Class A | | Class A |
| Class I | | Class Y |
How do the fees and expenses of the Target Fund and the Acquiring Fund compare?
The tables below describe the fees and expenses that you pay if you buy and hold shares of your Sentinel Fund and the pro forma fees and expenses that you may pay if you buy and hold shares of the corresponding Touchstone Fund after giving effect to the Reorganization. The pro forma expense ratios project anticipated expenses of the Acquiring Fund following the Reorganization, but actual expenses may be greater or less than those shown. Expenses for the Class A and Class I shares of the Sentinel Sustainable Core Opportunities Fund are based on the operating expenses incurred by each class of shares of the Fund as of the fiscal year ended November 30, 2016. Expenses for the Class A and Class Y shares of the Touchstone Sustainability and Impact Equity Fund are based on the operating expenses incurred by each class of shares of the Fund as of the fiscal year ended March 31, 2017. The pro forma fees and expenses for the Class A and Class Y shares of the Touchstone Sustainability and Impact Equity Fund reflect the fees and expenses of the Acquiring Fund and assume that the Reorganization had been completed at the beginning of the 12-month period ended March 31, 2017.
No sales charge will be imposed on the Class A shares of the Acquiring Fund received in connection with the Reorganization. In addition, you may qualify for sales charge discounts for Class A shares if you and your family invest, or agree to invest in the future, at least $25,000 or more in the Sentinel Funds or $50,000 or more in the Touchstone Funds. For the Target Fund, more information about these and other discounts is available from your financial professional and in the section entitled “Share Classes” on page 82 of the Target Fund’s prospectus and “How to Purchase Shares and Reduce Sales Charges” on page 44 of the Target Fund’s SAI. For the Acquiring Fund, more information about these and other discounts is available from your financial professional and in the section entitled “Investing with Touchstone—Class A Shares—Letter of Intent” on page [•] of this Joint Proxy Statement/Prospectus and in the Acquiring Fund’s SAI on page [•].
SHAREHOLDER FEES
(fees paid directly from your investment)
| | | Maximum
Sales Charge
(Load)
Imposed on
Purchases (as a
percentage of
offering price) | | Maximum
Deferred Sales
Charge (load)
(as a percentage
of the lower of
original
purchase price
or redemption
proceeds) | | Wire
Redemption
Fee |
| Sentinel Sustainable Core Opportunities Fund – Class A Shares | | | 5.00 | % | | | None | | | None |
| Touchstone Sustainability and Impact Equity Fund – Class A Shares | | | 5.75 | % | | | None | | | up to $15 |
| Touchstone Sustainability and Impact Equity Fund – Class A Shares Pro Forma | | | 5.75 | %(1)(2) | | | None | (2) | | up to $15 |
45
| | | Maximum
Sales Charge
(Load)
Imposed on
Purchases (as a
percentage of
offering price) | | Maximum
Deferred Sales
Charge (load)
(as a percentage
of the lower of
original
purchase price
or redemption
proceeds) | | Wire
Redemption
Fee |
| Sentinel Sustainable Core Opportunities Fund – Class I Shares | | | None | | | | None | | | None |
| Touchstone Sustainability and Impact Equity Fund – Class Y Shares | | | None | | | | None | | | up to $15 |
| Touchstone Sustainability and Impact Equity Fund – Class Y Shares Pro Forma | | | None | | | | None | | | up to $15 |
| (1) | No sales charge will be imposed on the Class A shares of the Acquiring Fund received in connection with the Reorganization. |
| (2) | A deferred sales charge of 1% applies to certain redemptions of Class A shares made within twelve months of purchase if the shares were purchased without an initial sales charge as part of an investment of $1 million or more. If you hold load-waived Class A shares of the Target Fund, the Acquiring Fund will look to the date of purchase of your Target Fund shares for purposes of assessing deferred sales charges on shares received in the Reorganization. |
ANNUAL FUND OPERATING EXPENSES
(expenses that you pay each year as a percentage of the value of your investment)
| | | Sentinel Sustainable
Core Opportunities
Fund
(Class A Shares) | | Touchstone
Sustainability and
Impact Equity
Fund
(Class A Shares) | | Touchstone
Sustainability and
Impact Equity Fund
Pro Forma
(Class A Shares) |
| Management Fees | | | 0.70 | % | | | 0.74 | % | | | 0.65 | %(1) |
| Distribution/Service (12b-1) Fees | | | 0.25 | % | | | 0.25 | % | | | 0.25 | % |
| Other Expenses | | | 0.23 | % | | | 0.37 | % | | | 0.33 | %(2) |
| Acquired Fund Fees and Expenses(3) | | | None | | | | 0.01 | % | | | 0.01 | %(2) |
| Total Annual Fund Operating Expenses | | | 1.18 | % | | | 1.37 | % | | | 1.24 | % |
| Fee Waiver | | | None | | | | (0.12 | %)(4) | | | (0.06 | %)(5) |
| Total Annual Fund Operating Expenses After Fee Waiver | | | 1.18 | % | | | 1.25 | % | | | 1.18 | % |
ANNUAL FUND OPERATING EXPENSES
(expenses that you pay each year as a percentage of the value of your investment)
| | | Sentinel Sustainable
Core Opportunities
Fund
(Class I Shares) | | Touchstone
Sustainability and
Impact Equity
Fund
(Class Y Shares) | | Touchstone
Sustainability and
Impact Equity Fund
Pro Forma
(Class Y Shares) |
| Management Fees | | | 0.70 | % | | | 0.74 | % | | | 0.65 | %(1) |
| Distribution/Service (12b-1) Fees | | | None | | | | None | | | | None | |
| Other Expenses | | | 0.21 | % | | | 0.35 | % | | | 0.31 | %(2) |
| Acquired Fund Fees and Expenses(3) | | | None | | | | 0.01 | % | | | 0.01 | %(2) |
| Total Annual Fund Operating Expenses | | | 0.91 | % | | | 1.10 | % | | | 0.97 | % |
| Fee Waiver | | | — | (6) | | | (0.10 | %)(4) | | | (0.06 | %)(5) |
| Total Annual Fund Operating Expenses After Fee Waiver | | | 0.91 | % | | | 1.00 | % | | | 0.91 | % |
46
| (1) | Restated to reflect the management fee that will take effect upon consummation of the Reorganization. |
| (2) | Other Expenses and Acquired Fund Fees and Expenses are estimated based on fees and expenses of the Acquiring Fund, assuming the Reorganization had been consummated as of the beginning of the 12-month period ended March 31, 2017. |
| (3) | Acquired Fund Fees and Expenses are expenses indirectly incurred by the Fund through its investments in one or more underlying funds, including money market funds. Because these costs are indirect, the Total Annual Fund Operating Expenses do not correlate to the ratio of expenses to average net assets in the Fund’s most recent annual report. |
| (4) | Touchstone Advisors has agreed to waive a portion of its fees or reimburse certain Fund expenses (excluding dividend and interest expenses relating to short sales; interest; taxes; brokerage commissions and other transaction costs; portfolio transactions and investment related expenses; other expenditures which are capitalized in accordance with U.S. generally accepted accounting principles; the cost of “Acquired Fund Fees and Expenses,” if any; and other extraordinary expenses not incurred in the ordinary course of business) in order to limit annual Fund operating expenses to 1.24% and 0.99% of average daily net assets for Classes A and Y shares, respectively. This contractual expense limitation is effective through July 29, 2018, but can be terminated by a vote of the Touchstone Funds Board, if it deems the termination to be beneficial to the Fund’s shareholders. The terms of the contractual expense limitation agreement provide that Touchstone Advisors is entitled to recoup, subject to approval by the Touchstone Funds Board, such amounts waived or reimbursed for a period of up to three years from the year in which Touchstone Advisors reduced its compensation or assumed expenses for the Fund. No recoupment will occur unless the Fund’s expenses are below the lesser of the expense limitation amount in effect (a) at the time of the waiver, or (b) at the time of the reimbursement. Additional information regarding the expense limit is provided under the section entitled “The Funds’ Management—Expense Limitation Agreement”. |
| (5) | Effective upon consummation of the Reorganization, Touchstone Advisors has contractually agreed to waive fees and/or reimburse certain expenses in order to limit total annual fund operating expenses of each class of shares of the Acquiring Fund to 1.17% and 0.90% of average daily net assets for Classes A and Y shares, respectively. The contractual expense limitation agreement will have the terms described above in Footnote 4 and will remain in effect for at least two years following the closing of the Reorganization. Additional information regarding the expense limit is provided under the section entitled “The Funds’ Management—Expense Limitation Agreement.” |
| (6) | Sentinel has contractually agreed to reimburse certain expenses paid by the Class I shares of the Target Funds to the extent necessary to prevent the total annual fund operating expense ratio of the Class I shares of the Target Funds, on an annualized basis, from exceeding the total annual fund operating expense ratio of the Class A shares of the same Fund. This agreement will continue through March 31, 2018. This agreement may be terminated upon 90 days’ notice by a majority of the non-interested directors of Sentinel Funds. Additional information regarding the expense limit is provided under the section entitled “The Funds’ Management—Expense Limitation Agreement.” |
Expense Examples. The examples below are intended to help you compare the cost of investing in the Target Fund with Acquiring Fund and with the pro forma cost of investing in the Acquiring Fund. The examples assume that you invest $10,000 in each Fund and then either (i) sell all of your shares at the end of each period indicated below or (ii) keep all of your shares at the end of each period indicated below. The examples also assume that your investment has a 5% annual return and that operating expenses (before fee waivers and expense reimbursements) remain the same. This example also assumes that the current expense limitation agreement for the Touchstone Sustainability and Impact Equity Fund will remain in place for one year and the expense limitation agreement that takes effect as of the closing of the Reorganization will be in place for two years following the closing of the Reorganization. Although your actual costs may be higher or lower, based on these assumptions, your costs would be:
| If shares are redeemed:(1) | | 1 Year | | | 3 Years | | | 5 Years | | | 10 Years | |
| Class A Shares | | | | | | | | | | | | | | | | |
| Sentinel Sustainable Core Opportunities Fund | | | $614 | | | | $856 | | | | $1,117 | | | | $1,860 | |
| Touchstone Sustainability and Impact Equity Fund | | | $695 | | | | $973 | | | | $1,271 | | | | $2,117 | |
| Touchstone Sustainability and Impact Equity Fund Pro Forma | | | $688 | | | | $934 | | | | $1,206 | | | | $1,978 | |
| Class I Shares/Class Y Shares | | | | | | | | | | | | | | | | |
| Sentinel Sustainable Core Opportunities Fund | | | $93 | | | | $290 | | | | $504 | | | | $1,120 | |
| Touchstone Sustainability and Impact Equity Fund | | | $102 | | | | $340 | | | | $597 | | | | $1,331 | |
| Touchstone Sustainability and Impact Equity Fund Pro Forma | | | $93 | | | | $297 | | | | $524 | | | | $1,178 | |
| (1) | For all share classes, the costs are the same if you held your shares. |
47
How do the performance records of the Target Fund and the Acquiring Fund compare?
The bar charts and the performance tables below provide some indication of the risks of an investment in each of the Target Fund and the Acquiring Fund by showing how each Fund’s performance has varied from year to year and by showing how each Fund’s average annual returns compare with a broad measure of market performance. Performance for the Class A shares of the Target Fund from September 24, 2001 to April 4, 2008 is based on the performance of the Standard shares of the predecessor Citizens Value Fund, which was offered without a sales charge and reflects the current maximum sales charge. Performance of the Class A shares of the Target Fund from their inception on April 4, 2008 to June 29, 2012, has not been adjusted to reflect the lower maximum 12b-1 fee in effect prior to April 4, 2008 or the decrease in the maximum 12b-1 fee, effective June 30, 2012, from 0.30% to 0.25%. If it had, those returns would be higher. Performance of the Class I shares of the Target Fund from March 31, 2006 to April 4, 2008 (the inception date for the Class I shares) is based on the performance of the Institutional shares of the Citizens Value Fund, which had different expenses but substantially similar investment risks. Past performance of the Target Fund and the Acquiring Fund, before and after taxes, does not necessarily represent how either Fund will perform in the future. Updated performance information for the Target Fund is available on the Target Fund’s website at www.sentinelinvestments.com or by calling 800.282.3863. Updated performance information for the Acquiring Fund is available on the Acquiring Fund’s website at TouchstoneInvestments.com or by calling 800.543.0407.
Sentinel Sustainable Core Opportunities Fund
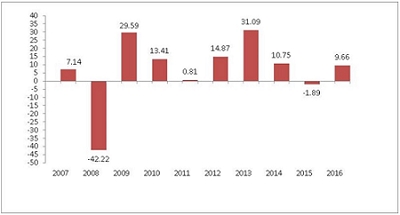
| Best Quarter: Second Quarter, 2009 19.35% | Worst Quarter: Fourth Quarter, 2008 (23.51%) |
The Sentinel Sustainable Core Opportunities Fund’s calendar year-to-date total return for Class A shares as of March 31, 2017 was 6.60%.
48
Touchstone Sustainability and Impact Equity Fund
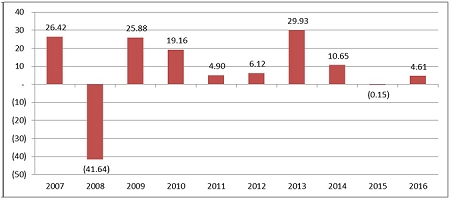
| Best Quarter: Third Quarter, 2009 14.98% | Worst Quarter: Fourth Quarter, 2008 (23.90%) |
The Touchstone Sustainability and Impact Equity Fund’s calendar year-to-date total return for Class A shares as of March 31, 2017 was 6.91%.
Average Annual Total Returns
For the periods ended December 31, 2016
| Sentinel Sustainable Core Opportunities Fund | | Inception
Date | | 1 Year | | 5 Years | | 10 Years |
| | | | | | | | | |
| Class A (return before taxes) | | 06/13/1996 | | | 4.18 | % | | | 11.26 | % | | | 4.57 | % |
| Class A (return after taxes on distributions) | | 06/13/1996 | | | 3.72 | % | | | 10.90 | % | | | 4.37 | % |
| Class A (return after taxes on distributions and sale of fund shares) | | 06/13/1996 | | | 2.75 | % | | | 8.96 | % | | | 3.63 | % |
| Class I (return before taxes) | | 03/31/2006 | | | 10.02 | % | | | 12.71 | % | | | 5.49 | % |
| S&P 500® Index(1) (reflects no deduction for fees, expenses or taxes) | | N/A | | | 11.96 | % | | | 14.66 | % | | | 6.95 | % |
| Touchstone Sustainability and Impact Equity Fund | | Inception
Date | | 1 Year | | 5 Years | | 10 Years |
| | | | | | | | | |
| Class A (return before taxes) | | 12/19/1997 | | | (1.41 | %) | | | 8.47 | % | | | 5.72 | % |
| Class A (return after taxes on distributions) | | 12/19/1997 | | | (1.54 | %) | | | 4.92 | % | | | 3.97 | % |
| Class A (return after taxes on distributions and sale of fund shares) | | 12/19/1997 | | | (0.69 | %) | | | 6.20 | % | | | 4.34 | % |
| Class Y (return before taxes) | | 11/10/2004 | | | 4.86 | % | | | 10.05 | % | | | 6.60 | % |
| MSCI ACWI(2) (reflects no deduction for fees, expenses or taxes) | | N/A | | | 7.86 | % | | | 9.36 | % | | | 3.56 | % |
| (1) | The S&P 500® Index consists of approximately 500 widely held U.S. equity securities chosen for market size, liquidity, and industry group representation. |
| (2) | The Morgan Stanley Capital International (MSCI) All Country World Index (ACWI) is a free float-adjusted market capitalization index designed to measure the combined equity market performance of developed and emerging markets countries. The MSCI ACWI returns disclosed are net of withholding taxes. |
After-tax returns are calculated using the historical highest individual federal marginal income tax rates and do not reflect the impact of state and local taxes. Actual after-tax returns depend on an investor’s tax situation and may differ from those shown. The return after taxes on distributions and sale of Fund shares may exceed the return before taxes due to an assumed tax benefit from any losses on a sale of Fund shares at the end of the measurement period. If you hold your Fund shares through a tax-advantaged arrangement, such as an individual retirement account or a 401(k) plan, the after-tax returns do not apply to your situation.
49
How do the investment goals and principal investment strategies of the Funds compare?
The investment goals and principal investment strategies of the Sentinel Sustainable Core Opportunities Fund and the Touchstone Sustainability and Impact Equity Fund, along with descriptions of certain differences between the Funds’ investment goals and principal investment strategies, are set forth in the table below. Although the Funds have similar investment goals and principal investment strategies, the analytical tools, techniques and investment selection process used by the sub-advisor to the Acquiring Fund may differ from those used by Sentinel.
| | | Sentinel Sustainable Core
Opportunities Fund
(Target Fund) | | Touchstone Sustainability
and Impact Equity Fund
(Acquiring Fund) | | Differences |
| | | | | | | |
| Investment Goal(s): | | The Fund seeks long-term capital appreciation | | The Fund seeks long-term growth of capital. | | — |
| | | | | | | |
| Principal Investment Strategy: | | The Fund normally invests at least 65% of its net assets in stocks of well-established U.S. companies. The Fund employs a process of environmental, social and corporate governance (“ESG”) screening. | | The Fund invests, under normal circumstances, at least 80% of its assets in equity securities of U.S. and non-U.S. companies that meet certain financial and environmental, social, and governance criteria. | | While there are certain differences, each Fund emphasizes equity securities and uses environmental, social, and governance criteria in selecting investments. |
| | | | | | | |
| Issuer Size: | | The Fund typically invests in companies above $5 billion in market capitalization. | | The Fund invests in securities of any size, but generally focuses on larger, more established companies. | | While there are certain differences, each Fund may invest in companies of any size but typically focus on larger companies. |
| | | | | | | |
| Non-U.S. Investments: | | The Fund may invest in foreign securities. | | The Fund invests primarily in securities of U.S. companies and non-U.S. companies domiciled in developed markets, but may invest up to 30% of its net assets in securities of companies domiciled in emerging and frontier markets. | | While there are certain differences, each Fund may invest in non-U.S. companies. |
| | | | | | | |
| Sector or Industry Focus: | | Up to 25% of the Fund’s assets may be invested in securities within a single industry. Although the Fund may invest in any economic sector, at times it may emphasize one or more particular sectors. | | Up to 25% of the Fund’s assets may be invested in securities within a single industry. | | — |
Additional Information About the Funds’ Principal Investment Strategies
Target Fund. Sentinel’s investment philosophy centers on building a diverse portfolio consisting largely of securities of high quality companies with a positive multi-year outlook offered at attractive valuation levels, based on a number of metrics, including value relative to its history, peers and/or the market over time. The Target
50
Fund may also invest in stocks with the potential to provide current income, growth of income and relatively low risk as compared to the stock market as a whole when consistent with the Fund’s investment objective.
The Target Fund employs a process of ESG screening that is overseen by Sentinel’s in-house sustainable research department. While no investment is ever made solely based on the qualitative criteria alone, the Target Fund believes sustainable screening provides a unique and more comprehensive view of the companies it considers for investment. Generally, companies are eliminated from investment consideration if they produce tobacco or tobacco products or alcoholic beverages; generate nuclear power or supply nuclear facilities with industry specific components, as a primary line of business; have material interests in the manufacture of weapons or weapons-specific components; are involved in gambling as a main line of business; and/or lack diversity at the level of the board of directors/senior management. The Target Fund favors companies that publish and enforce codes of conduct and vendor standards; promote equal opportunity, diversity and good employee relations; are sensitive to community concerns; seek alternatives to animal testing when not required by law; and/or have minimal impact on the environment and engage in proactive environmental initiatives. Sentinel may, in its discretion, choose to apply additional screens, modify the application of the screens listed above or vary the application of the screens listed above to the Funds’ investments at any time without shareholder approval.
The Target Fund may sell a security if the fundamentals of the company are deteriorating or the original investment premise is no longer valid, the stock is trading meaningfully higher than what the portfolio manager believes is a fair valuation, to manage the size of the holding or the sector weighting and/or to take advantage of a more attractive investment opportunity, and to meet redemptions. A security will also be sold if it is determined that it no longer meets the environmental, social and/or corporate governance performance criteria.
Acquiring Fund. The Acquiring Fund’s investments in equity securities include common stocks, preferred stocks, convertible securities, depositary receipts such as American Depositary Receipts (“ADRs”), Global Depositary Receipts (“GDRs”) and European Depositary Receipts (“EDRs”), and interests in other investment companies, including exchange-traded funds that invest in equity securities.
The Acquiring Fund may invest in securities of companies domiciled in emerging and frontier markets. Emerging markets are defined as those countries not included in the MSCI World Index, a developed market index. As of April 28, 2017, the countries in the MSCI World Index included: Australia, Austria, Belgium, Canada, Denmark, Finland, France, Germany, Hong Kong, Ireland, Israel, Italy, Japan, the Netherlands, New Zealand, Norway, Portugal, Singapore, Spain, Sweden, Switzerland, the United Kingdom, and the United States. The country composition of the MSCI Emerging Markets Index and the MSCI World Index can change over time. Frontier markets are those emerging market countries that have the smallest, least mature economies and least developed capital markets. Frontier markets are those emerging market countries that have the smallest, least mature economies and least developed capital markets.
The Acquiring Fund’s sub-advisor, Rockefeller & Co., Inc. (“Rockefeller”) applies “bottom-up” security analysis that includes fundamental, sector-based research in seeking to identify businesses that have high or improving returns on capital, barriers to competition, and compelling valuations. The Acquiring Fund’s sub-advisor selects investments for the Fund based on an evaluation of a company’s financial condition and its sustainability and impact practices. The sub-advisor’s sustainability and impact evaluation considers environmental, social, and governance criteria such as corporate governance practices, product quality and safety, workplace diversity practices, environmental impact and sustainability, community investment and development, and human rights record.
How do the principal risks of investing in the Funds compare?
An investment in each Fund is subject to equity securities (stock market) risk, foreign securities risk and sustainable/responsible investing risk. An investment in the Sentinel Sustainable Core Equity Fund is also subject to investment style risk and sector risk. An investment in the Touchstone Sustainability and Impact Equity Fund is also subject to convertible securities risk, management risk and other investment companies and ETFs risk, as well as additional equity securities risks including small cap risk and additional foreign securities risks including emerging markets risk and frontier markets risk. For more information on the Funds’ principal risks, see “Comparison of Principal Risks.”
51
Who will be the Advisor, Sub-Advisor and Portfolio Managers of my Fund after the Reorganization?
Sentinel is the investment advisor to Sentinel Sustainable Core Opportunities Fund. The portfolio manager of Sentinel Sustainable Core Opportunities Fund is Helena Ocampo.
After the Reorganization, Touchstone Advisors will serve as the investment advisor and Rockefeller will serve as the sub-advisor to Touchstone Sustainability and Impact Equity Fund. The portfolio managers of Touchstone Sustainability and Impact Equity Fund are David P. Harris and Jimmy C. Chang. For additional information regarding the advisor, sub-advisor and portfolio managers listed above, please see the section entitled “The Funds’ Management—Investment Advisor” and “The Funds’ Management—Sub-Advisors and Portfolio Managers.”
What are the portfolio turnover rates of the Funds?
A Fund pays transaction costs, such as brokerage commissions, when it buys and sells securities (or “turns over” its portfolio). A higher portfolio turnover rate may indicate higher transaction costs and may result in higher taxes when Fund shares are held in a taxable account. These costs, which are not reflected in annual fund operating expenses or in the example, affect a Fund’s performance. During the fiscal year ended November 30, 2016, the Target Fund’s portfolio turnover rate was 33% of the average value of its portfolio. During the fiscal year ended March 31, 2017, the portfolio turnover rate of the Acquiring Fund was 53% of the average value of its portfolio.
Will there be any repositioning of the portfolio after the Reorganization?
It is expected that a significant portion (approximately two-thirds) of the portfolio investments of the Target Fund may be sold by the Acquiring Fund following the Reorganization. However, the timing of any repositioning and its resulting impact on capital gains distributions in 2017 and beyond is uncertain. To mitigate repositioning-related tax consequences to shareholders holding Fund shares in taxable accounts, Rockefeller intends to take steps including, among other things, executing the repositioning over time across multiple fiscal years and harvesting offsetting capital losses during periods of market volatility. There can be no assurance that these steps will be effective in materially reducing or eliminating the aggregate tax consequences of the repositioning. The amounts per share of any capital gains distributions resulting from the repositioning will depend on a number of factors, including the proportion of portfolio holdings that are actually sold, the timing of portfolio sales, the performance of the stock market in general, the availability of offsetting capital losses and the scale of purchase and redemption activity in the Funds' shares. The timing of portfolio sales will also be subject to market conditions existing after the closing of the Reorganization. Accordingly, the per share amounts of any capital gains distributions resulting from the repositioning cannot be estimated at this time. Touchstone Advisors publishes estimates of capital gains distributions for the Touchstone Funds on its website (https://www.touchstoneinvestments.com/literature-center/taxplanning.htm), generally in October of each year. The Acquiring Fund will also bear brokerage costs in connection with the repositioning. For illustration purposes only, if the Reorganization had been completed as of March 31, 2017 and the Acquiring Fund had sold on a pro rata basis two-thirds of the investments held in the Target Fund's portfolio as of March 31, 2017, the resulting realized capital gains estimate would be expected to total $2.43 per share of the combined fund and the brokerage commissions would be expected to total approximately $342,000 in the aggregate, or $0.01 per share of the combined fund, based on average commission costs of the Acquiring Fund. Under the same circumstances, if only one-third of the investments held in the Target Fund's portfolio had been repositioned as of March 31, 2017, the resulting realized capital gains and brokerage cost estimates would be reduced by half, to $1.21 and $0.005 per share of the combined fund, respectively.
52
Synopsis: Reorganization of Sentinel Balanced Fund into Touchstone Balanced Fund
What class of shares of the Acquiring Fund will I receive in the Reorganization?
Shareholders of the Sentinel Balanced Fund will receive shares of the Touchstone Balanced Fund, as follows:
| Sentinel Balanced Fund | | Touchstone Balanced Fund |
| Class A | | Class A |
| Class C | | Class C |
| Class I | | Class Y |
How do the fees and expenses of the Target Fund and the Acquiring Fund compare?
The tables below describe the fees and expenses that you pay if you buy and hold shares of the Sentinel Balanced Fund and the pro forma fees and expenses that you may pay if you buy and hold shares of the Touchstone Balanced Fund after giving effect to the Reorganization. The pro forma expense ratios project anticipated expenses of the Touchstone Balanced Fund following the Reorganization, but actual expenses may be greater or less than those shown. Touchstone Balanced Fund is newly formed and will commence operations upon the closing of the Reorganization. Fees and expense of Touchstone Balanced Fund are estimated based on the assets of Sentinel Balanced Fund as of November 30, 2016.
No sales charge will be imposed on the Class A shares of the Acquiring Fund received in connection with the Reorganization. In addition, you may qualify for sales charge discounts for Class A shares if you and your family invest, or agree to invest in the future, at least $25,000 or more in the Sentinel Funds or $50,000 or more in the Touchstone Funds. For the Target Fund, more information about these and other discounts is available from your financial professional and in the section entitled “Share Classes” on page 82 of the Target Fund’s prospectus and “How to Purchase Shares and Reduce Sales Charges” on page 44 of the Target Fund’s SAI. For the Acquiring Fund, more information about these and other discounts is available from your financial professional and in the section entitled “Investing with Touchstone—Class A Shares—Letter of Intent” on page [•] of this Joint Proxy Statement/Prospectus and in the Acquiring Fund’s SAI on page [•].
SHAREHOLDER FEES
(fees paid directly from your investment)
| | | Maximum
Sales Charge
(Load)
Imposed on
Purchases (as
a percentage
of offering
price) | | Maximum
Deferred
Sales Charge
(load) (as a
percentage of
the lower of
original
purchase
price or
redemption
proceeds) | | Wire
Redemption
Fee |
| Sentinel Balanced Fund – Class A Shares | | | 5.00 | % | | | None | | | None |
| Touchstone Balanced Fund – Class A Shares Pro Forma | | | 5.75 | %(1)(2) | | | None | (2) | | up to $15 |
| | | | | | | | | | | |
| Sentinel Balanced Fund – Class C Shares | | | None | | | | 1.00% | (2) | | None |
| Touchstone Balanced Fund – Class C Shares Pro Forma | | | None | | | | 1.00% | (2) | | up to $15 |
| | | | | | | | | | | |
| Sentinel Balanced Fund – Class I Shares | | | None | | | | None | | | None |
| Touchstone Balanced Fund – Class Y Shares Pro Forma | | | None | | | | None | | | up to $15 |
53
| (1) | No sales charge will be imposed on the Class A shares of the Acquiring Fund received in connection with the Reorganization. |
| (2) | A deferred sales charge of 1% applies to certain redemptions of Class A shares made within twelve months of purchase if the shares were purchased without an initial sales charge as part of an investment of $1 million or more. If you hold load-waived Class A shares or Class C shares of the Target Fund, the Acquiring Fund will look to the date of purchase of your Target Fund shares for purposes of assessing deferred sales charges on shares received in the Reorganization. |
ANNUAL FUND OPERATING EXPENSES
(expenses that you pay each year as a percentage of the value of your investment)
| | | Sentinel
Balanced Fund
(Class A Shares) | | Touchstone
Balanced Fund
Pro Forma
(Class A Shares) |
| Management Fees | | | 0.53 | % | | | 0.53 | % |
| Distribution/Service (12b-1) Fees | | | 0.25 | % | | | 0.25 | % |
| Other Expenses | | | 0.23 | % | | | 0.32 | %(1) |
| Acquired Fund Fees and Expenses(2) | | | 0.02 | % | | | 0.02 | %(1) |
| Total Annual Fund Operating Expenses | | | 1.03 | % | | | 1.12 | % |
| Fee Waiver | | | None | | | | (0.09 | %) |
| Total Annual Fund Operating Expenses After Fee Waiver | | | 1.03 | % | | | 1.03 | % |
ANNUAL FUND OPERATING EXPENSES
(expenses that you pay each year as a percentage of the value of your investment)
| | | Sentinel
Balanced Fund
(Class C Shares) | | Touchstone
Balanced Fund
Pro Forma
(Class C Shares) |
| Management Fees | | | 0.53 | % | | | 0.53 | % |
| Distribution/Service (12b-1) Fees | | | 1.00 | % | | | 1.00 | % |
| Other Expenses | | | 0.25 | % | | | 0.33 | %(1) |
| Acquired Fund Fees and Expenses(2) | | | 0.02 | % | | | 0.02 | %(1) |
| Total Annual Fund Operating Expenses | | | 1.80 | % | | | 1.88 | % |
| Fee Waiver | | | None | | | | (0.08 | %)(3) |
| Total Annual Fund Operating Expenses After Fee Waiver | | | 1.80 | % | | | 1.80 | % |
ANNUAL FUND OPERATING EXPENSES
(expenses that you pay each year as a percentage of the value of your investment)
| | | Sentinel
Balanced Fund
(Class I Shares) | | Touchstone
Balanced Fund
Pro Forma
(Class Y Shares) |
| Management Fees | | | 0.53 | % | | | 0.53 | % |
| Distribution/Service (12b-1) Fees | | | None | | | | None | |
| Other Expenses | | | 0.28 | % | | | 0.38 | %(1) |
| Acquired Fund Fees and Expenses(2) | | | 0.02 | % | | | 0.02 | %(1) |
| Total Annual Fund Operating Expenses | | | 0.83 | % | | | 0.93 | % |
| Fee Waiver | | | None | (4) | | | (0.10 | %)(3) |
| Total Annual Fund Operating Expenses After Fee Waiver | | | 0.83 | % | | | 0.83 | % |
| (1) | Other Expenses and Acquired Fund Fees and Expenses are estimated based on fees and expenses of the Acquiring Fund, assuming the Reorganization had been consummated as of the beginning of the 12-month period ended November 30, 2016. |
54
| (2) | Acquired Fund Fees and Expenses are expenses indirectly incurred by the Fund through its investments in one or more underlying funds, including money market funds. Because these costs are indirect, the Total Annual Fund Operating Expenses do not correlate to the ratio of expenses to average net assets in the Fund’s most recent annual report. |
| (3) | Effective upon consummation of the Reorganization, Touchstone Advisors has contractually agreed to waive fees and/or reimburse certain expenses as necessary in order to limit total annual fund operating expenses (excluding dividend and interest expenses relating to short sales, interest, taxes, brokerage commissions and other transaction costs, portfolio transactions and investment related expenses, other expenditures which are capitalized in accordance with U.S. generally accepted accounting principles, the cost of “Acquired Fund Fees and Expenses,” if any, and other extraordinary expenses not incurred in the ordinary course of business, on an annualized basis) such that the total operating expense ratio of each class of shares of the Acquiring Fund offered hereby, on an annualized basis), to an amount that does not exceed the total operating expenses of the corresponding class of shares of the Target Fund (net of fee waivers of the Target Fund) for the fiscal year ending November 30, 2016. The agreement will remain in effect for at least two years following the Closing of the Reorganization. Additional information regarding the expense limit is provided under the section entitled “The Funds’ Management—Expense Limitation Agreement.” |
| (4) | Sentinel has contractually agreed to reimburse certain expenses paid by the Class I shares of the Funds to the extent necessary to prevent the total annual fund operating expense ratio of the Class I shares of the Funds, on an annualized basis, from exceeding the total annual fund operating expense ratio of the Class A shares of the same Fund. This agreement will continue through March 31, 2018. This agreement may be terminated upon 90 days’ notice by a majority of the non-interested directors of the Sentinel Funds. Additional information regarding the expense limit is provided under the section entitled “The Funds’ Management—Expense Limitation Agreement.” |
Expense Examples. The examples below are intended to help you compare the cost of investing in the Target Fund with the pro forma cost of investing in the Acquiring Fund following the Reorganization. The examples assume that you invest $10,000 in each Fund and then either (i) sell all of your shares at the end of each period indicated below or (ii) keep all of your shares at the end of each period indicated below. The examples also assume that your investment has a 5% annual return, that operating expenses (before fee waivers and expense reimbursements) remain the same and the expense limitation agreement for the Acquiring Fund will be in place for two years following the closing of the Reorganization. Although your actual costs may be higher or lower, based on these assumptions, your costs would be:
| If shares are redeemed: | | 1 Year | | | 3 Years | | | 5 Years | | | 10 Years | |
| Class A Shares | | | | | | | | | | | | | | | | |
| Sentinel Balanced Fund | | | $600 | | | | $811 | | | | $1,040 | | | | $1,696 | |
| Touchstone Balanced Fund Pro Forma | | | $674 | | | | $893 | | | | $1,140 | | | | $1,844 | |
| Class C Shares | | | | | | | | | | | | | | | | |
| Sentinel Balanced Fund | | | $283 | | | | $566 | | | | $975 | | | | $2,116 | |
| Touchstone Balanced Fund Pro Forma | | | $283 | | | | $575 | | | | $1,001 | | | | $2,188 | |
| Class I Shares/Class Y Shares | | | | | | | | | | | | | | | | |
| Sentinel Balanced Fund | | | $85 | | | | $265 | | | | $460 | | | | $1,025 | |
| Touchstone Balanced Fund Pro Forma | | | $85 | | | | $276 | | | | $495 | | | | $1,124 | |
| | | | | | | | | | | | | | | | | |
| If shares are not redeemed:(1) | | 1 Year | | | 3 Years | | | 5 Years | | | 10 Years | |
| Class C Shares | | | | | | | | | | | | | | | | |
| Sentinel Balanced Fund | | | $183 | | | | $566 | | | | $975 | | | | $2,116 | |
| Touchstone Balanced Fund Pro Forma | | | $183 | | | | $575 | | | | $1,001 | | | | $2,188 | |
| (1) | For holders of all other classes, the costs are the same as set forth above. |
How do the performance records of the Target Fund and the Acquiring Fund compare?
The Acquiring Fund has no performance history. The Target Fund will be the accounting and performance survivor of the Reorganization, and the Acquiring Fund will adopt its performance history. The bar charts and the performance tables below provide some indication of the risks of an investment in the Acquiring Fund by showing how the Target Fund’s performance has varied from year to year and by showing how each Target Fund’s average annual returns compare with a broad measure of market performance. The Target Fund’s past performance, before and after taxes, does not necessarily represent how the corresponding Acquiring Fund will perform in the future. Updated performance information for the Target Fund is available on the Target Fund’s website at www.sentinelinvestments.com or by calling 800.282.3863.
55
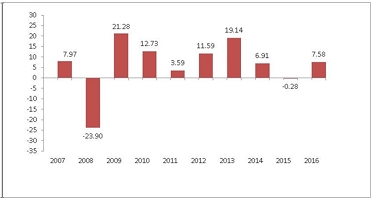
| Best Quarter: Second Quarter, 2009 11.94% | Worst Quarter: Fourth Quarter, 2008 (13.84)% |
The Sentinel Balanced Fund’s calendar year-to-date total return for Class A shares as of March 31, 2017 was 4.46%.
Average Annual Total Returns
For the periods ended December 31, 2016
| Sentinel Balanced Fund | | Inception
Date | | 1 Year | | 5 Years | | 10 Years |
| | | | | | | | | | | | |
| Class A (return before taxes) | | 11/15/1938 | | | 2.22 | % | | | 7.69 | % | | | 5.36 | % |
| Class A (return after taxes on distributions) | | 11/15/1938 | | | 1.74 | % | | | 6.54 | % | | | 4.37 | % |
| Class A (return after taxes on distributions and sale of fund shares) | | 11/15/1938 | | | 1.64 | % | | | 5.99 | % | | | 4.19 | % |
| Class C (return before taxes) | | 05/04/1998 | | | 5.76 | % | | | 7.95 | % | | | 5.01 | % |
| Class I (return before taxes) | | 08/27/2007 | | | 7.73 | % | | | 9.01 | % | | | 5.98 | % |
| S&P 500® Index(1) (reflects no deduction for fees, expenses or taxes) | | N/A | | | 11.96 | % | | | 14.66 | % | | | 6.95 | % |
| Bloomberg Barclays US Aggregate Bond Index(2) (reflects no deduction for taxes or certain expenses) | | N/A | | | 2.65 | % | | | 2.23 | % | | | 4.34 | % |
| (1) | The S&P 500® Index consists of approximately 500 widely held U.S. equity securities chosen for market size, liquidity, and industry group representation. |
| (2) | The Bloomberg Barclays US Aggregate Bond Index measures the U.S. investment grade fixed-rate bond market, with index components for government and corporate securities, mortgage pass-through securities, and asset-backed securities. |
After-tax returns are calculated using the historical highest individual federal marginal income tax rates and do not reflect the impact of state and local taxes. Actual after-tax returns depend on an investor’s tax situation and may differ from those shown. The return after taxes on distributions and sale of Fund shares may exceed the return before taxes due to an assumed tax benefit from any losses on a sale of Fund shares at the end of the measurement period. If you hold your Fund shares through a tax-advantaged arrangement, such as an individual retirement account or a 401(k) plan, the after-tax returns do not apply to your situation.
How do the investment goals and principal investment strategies of the Funds compare?
The investment goals and principal investment strategies of the Sentinel Balanced Fund and the Touchstone Balanced Fund, along with descriptions of certain differences between the Funds’ investment goals and principal investment strategies, are set forth in the table below. Although the Funds have similar investment goals and principal investment strategies, the analytical tools, techniques and investment selection process used by the sub-advisor to the Acquiring Fund may differ from those used by Sentinel.
56
| | | Sentinel Balanced Fund | | Touchstone Balanced Fund | | Differences |
| | | | | | | |
| Investment Goal(s): | | The Fund seeks capital appreciation and current income. | | The Fund seeks capital appreciation and current income. | | — |
| | | | | | | |
| Principal Investment Strategy: | | The Fund normally invests primarily in common stocks and bonds with at least 25% of its assets in bonds and at least 25% of its assets in common stock. When determining this percentage, convertible bonds and/or preferred stocks are considered common stocks, unless these securities are held primarily for income. | | The Fund seeks to achieve its investment goal by investing primarily in a diversified portfolio of fixed-income and equity securities. Under normal circumstances, the Fund generally expects to allocate 40% of its assets to fixed-income securities and 60% of its assets to equity securities. | | The Target Fund invests at least 25% of its assets in bonds and at least 25% of its assets in common stock. The Acquiring Fund expects to allocate 40% of its assets to fixed-income securities and 60% of its assets to equity securities. |
| | | | | | | |
| Credit Quality: | | The bond portion of the Fund may be invested without limitation in bonds in the first through the fourth highest rating categories of Moody’s (Aaa to Baa) and Standard and Poor’s (AAA to BBB). No more than 20% of the Fund’s total assets may be invested in lower-quality bonds (e.g., bonds rated below Baa by Moody’s or BBB by Standard & Poor’s). | | The Fund’s sub-advisor primarily invests in investment-grade debt securities, but may invest up to 30% of the Fund’s fixed-income sleeve in non-investment-grade debt securities rated as low as B by a Nationally Recognized Statistical Rating Organization. Non-investment-grade debt securities are often referred to as “junk bonds” and are considered speculative. | | No more than 20% of the Target Fund’s total assets may be invested in lower-quality bonds, while the Acquiring Fund may invest up to 30% of the Fund’s fixed-income sleeve in non-investment-grade debt securities. |
| | | | | | | |
| Issuer Size: | | The Fund has no stated policy regarding market capitalization. | | With respect to equities, the Fund invests primarily in issuers having a market capitalization, at the time of purchase, above $5 billion. | | The Acquiring Fund primarily invests in issuers having a market capitalization above $5 billion. The Target Fund has no stated policy regarding market capitalization. |
| | | | | | | |
| Non-U.S. Investments: | | The Fund may invest without limitation in foreign securities. Under normal circumstances, the equity securities in which the Fund invests are predominantly those of U.S. companies. | | Up to 35% of the Fund’s equity sleeve may be invested in securities of foreign issuers through the use of ordinary shares or depositary receipts such as American Depositary Receipts (“ADRs”). The Fund may also invest in equity securities of emerging market countries. | | The Target Fund may invest without limitation in foreign securities. The Acquiring Fund may invest up to 35% of its equity sleeve in securities of foreign issuers. |
57
| | | Sentinel Balanced Fund | | Touchstone Balanced Fund | | Differences |
| | | | | | | |
| Sector or Industry Focus: | | The Fund may invest in any economic sector and at times it may emphasize one or more particular sectors. The Fund will not make investments that result in the concentration of its investments in a single industry. | | The Fund will not make investments that result in the concentration of its investments in a single industry. | | While the Target Fund may emphasize one or more particular sectors, each Fund will not concentrate its investments in a single industry. |
| | | | | | | |
| Derivatives and Other Instruments: | | The Fund may use derivative instruments (e.g., exchange-traded derivatives such as futures and options, and other derivatives such as swap agreements, options on swaps and interest rate caps and floors) for investment purposes, such as replicating permitted investments, as long as such investments do not have the effect of leveraging portfolio risks. | | The Fund may invest in derivatives, including forwards, futures contracts, interest rate and credit default swap agreements, and options. These investments may be used to gain market exposure, to adjust the Fund’s duration, to manage interest rate risk, and for any other purposes consistent with the Fund’s investment strategies and limitations.
The Fund may also invest in mortgage dollar-roll transactions and reverse repurchase agreements. | | While there are certain differences, each Fund may invest in a broad range of derivative instruments. The Target Fund has a stated policy that its use of derivatives may not result in leverage. |
| | | | | | | |
| Hedging: | | The Fund may use derivative instruments in order to hedge various risks, such as interest rate, credit and currency risk. The Fund is not required to use hedging and may choose not to do so. | | The Fund may invest in derivatives to hedge market exposure. | | While there are certain differences, each Fund may, but is not required to, hedge risks using a variety of derivatives. |
| | | | | | | |
| Active Trading: | | In managing the fixed-income portion of the portfolio, the Fund utilizes an active trading approach, which is expected to result in portfolio turnover greater than 100%. | | The Fund may engage in frequent and active trading as part of its principal investment strategies. | | While there are certain differences, each Fund may engage in active trading. |
Additional Information About the Funds’ Principal Investment Strategies
Target Fund. Sentinel will divide the Fund’s assets among stocks and bonds based on whether it believes stocks or bonds offer a better value at the time. More bonds normally enhance price stability, and more stocks usually enhance growth potential.
With respect to the Target Fund’s investments in bonds, the Fund may make unlimited investments in U.S. government mortgage-backed securities (“MBS”) issued and/or guaranteed by the Federal National Mortgage Association (“FNMA” or “Fannie Mae”), the Federal Home Loan Mortgage Corporation (“FHLMC” or “Freddie
58
Mac”) and by the Government National Mortgage Association (“GNMA” or “Ginnie Mae”). The Fund may invest in exchange-traded funds (“ETFs”) in carrying out its investment strategies with respect to the fixed-income portion of the portfolio. The Fund considers investments in bond ETFs (ETFs whose underlying portfolio consists of debt instruments) as investments in fixed income instruments. While the original maximum life of a mortgage-backed security considered for this Fund can vary, its average life is likely to be substantially less than the original maturity of the underlying mortgages, because the mortgages in these pools may be prepaid, refinanced, curtailed, or foreclosed. Prepayments are passed through to the mortgage-backed security holder along with regularly scheduled minimum repayments of principal and payments of interest.
With respect to the Target Fund’s investments in equities, Sentinel’s investment philosophy centers on building a diverse portfolio consisting largely of securities of high quality companies with a positive multi-year outlook offered at attractive valuation levels, based on a number of metrics, including value relative to its history, peers and/or the market over time. Sentinel has a preference for companies that earn above-average rates of return on capital and that generate free cash flow. Additionally, earnings revision trends are important.
The Target Fund may also purchase or sell “to be announced” or “TBA” securities, which usually are transactions in which the Fund buys or sells agency mortgage-backed securities (“MBS”) on a forward commitment basis. In a TBA transaction, the seller of the agency MBS agrees on a sale price, but does not specify which particular securities will be delivered to the buyer on settlement day. Instead, only a few basic characteristics of the securities are agreed upon, such as the coupon rate and the face value. The Fund may engage in short sales of agency MBS that the Fund does not own, primarily as part of a TBA swap transaction. A TBA swap transaction involves an agreement to purchase one agency MBS and a simultaneous agreement to sell a different agency MBS.
The Target Fund may sell a security if the fundamentals of the company are deteriorating or the original investment premise is no longer valid, the security is trading meaningfully higher than what the portfolio manager believes is a fair valuation, to manage the size of the holding or the sector weighting and/or to take advantage of a more attractive investment opportunity. The Fund may also sell a security to meet redemptions.
Acquiring Fund. The Acquiring Fund seeks to achieve its investment goal by investing primarily in a diversified portfolio of fixed-income and equity securities. The following table details, under normal circumstances, how the Fund generally expects to allocate its assets among equity and fixed-income, as of the date of this Joint Proxy Statement/Prospectus.
| Allocations | | Approximate
Target Allocation |
| | | |
| Equity | | 60% |
| Fixed-Income | | 40% |
With respect to equities, the Fund invests primarily in issuers having a market capitalization, at the time of purchase, above $5 billion. Equity securities include common stock and preferred stock. These securities may be listed on an exchange or traded over-the-counter. Up to 35% of the Fund’s equity sleeve may be invested in securities of foreign issuers through the use of ordinary shares or depositary receipts such as American Depositary Receipts (“ADRs”). The Fund may also invest in equity securities of emerging market countries.
With respect to fixed-income, the Fund will investment primarily in bonds, including mortgage-related securities, asset-backed securities, government securities (both U.S. government securities and foreign sovereign debt), and corporate debt securities. Fort Washington, the Fund’s sub-advisor, primarily invests in investment-grade debt securities, but may invest up to 30% of the Fund’s fixed-income sleeve in non-investment-grade debt securities rated as low as B by a Nationally Recognized Statistical Rating Organization. Non-investment-grade debt securities are often referred to as “junk bonds” and are considered speculative.
The Fund may engage in frequent and active trading as part of its principal investment strategies. Additionally, in order to implement its investment strategy, the Fund may invest in mortgage dollar-roll transactions and reverse repurchase agreements, and in derivatives, including forwards, futures contracts, interest rate and credit default swap agreements, and options. These investments may be used to gain or hedge market
59
exposure, to adjust the Fund’s duration, to manage interest rate risk, and for any other purposes consistent with the Fund’s investment strategies and limitations.
The sub-advisor, subject to approval by the Fund’s Advisor, may change the Fund’s target allocation to each asset class (or to additional asset classes) without prior approval from or notice to shareholders.
How do the principal risks of investing in the Funds compare?
An investment in each Fund is subject to derivatives risk, equity securities (stock market) risk, fixed-income securities risk including non-investment-grade debt securities risk, foreign securities risk, portfolio turnover risk and sector risk. An investment in the Sentinel Balanced Fund is also subject to asset allocation risk, investment style risk, other investment companies and ETFs risk, short sales risk and TBA securities risk. An investment in the Touchstone Balanced Fund is also subject to leverage risk and management risk, as well as additional fixed-income securities risks including corporate loan risk distressed securities risk and additional foreign securities risks including emerging markets risk. For more information on the Funds’ principal risks, see “Comparison of Principal Risks.”
Who will be the Advisor, Sub-Advisor and Portfolio Managers of my Fund after the Reorganization?
Sentinel is the investment advisor to Sentinel Balanced Fund. The portfolio manager of Sentinel Balanced Fund is Jason Doiron.
After the Reorganization, Touchstone Advisors will serve as the investment advisor and Fort Washington will serve as the sub-advisor to Touchstone Balanced Fund. The portfolio managers of Touchstone Balanced Fund are James Wilhelm, Timothy Policinski and Daniel J. Carter. For additional information regarding the advisor, sub-advisor and portfolio managers listed above, please see the section entitled “The Funds’ Management—Investment Advisor” and “The Funds’ Management—Sub-Advisors and Portfolio Managers.”
What are the portfolio turnover rates of the Funds?
A Fund pays transaction costs, such as brokerage commissions, when it buys and sells securities (or “turns over” its portfolio). A higher portfolio turnover rate may indicate higher transaction costs and may result in higher taxes when Fund shares are held in a taxable account. These costs, which are not reflected in annual fund operating expenses or in the example, affect a Fund’s performance. During the fiscal year ended November 30, 2016, the Target Fund’s portfolio turnover rate was 45% of the average value of its portfolio. The Acquiring Fund will not commence operations until the consummation of the Reorganization. The portfolio turnover rate of the Acquiring Fund may be different from the portfolio turnover rate of the Target Fund due to the Touchstone Balanced Fund having a different portfolio management team and certain differences in investment strategies, as well as expected repositioning of the portfolio following the Reorganization.
Will there be any repositioning of the portfolio after the Reorganization?
It is expected that a significant portion (approximately two-thirds) of the portfolio investments of the Target Fund may be sold by the Acquiring Fund following the Reorganization. However, the timing of any repositioning and its resulting impact on capital gains distributions in 2017 and beyond is uncertain. To mitigate repositioning-related tax consequences to shareholders holding Fund shares in taxable accounts, Fort Washington intends to take steps including, among other things, executing the repositioning over time across multiple fiscal years and harvesting offsetting capital losses during periods of market volatility. There can be no assurance that these steps will be effective in materially reducing or eliminating the aggregate tax consequences of the repositioning. The amounts per share of any capital gains distributions resulting from the repositioning will depend on a number of factors, including the proportion of portfolio holdings that are actually sold, the timing of portfolio sales, the performance of the stock and bond markets in general, the availability of offsetting capital losses and the scale of purchase and redemption activity in Fund shares. The timing of portfolio sales will also be subject to market conditions existing after the closing of the Reorganization. Accordingly, the per share amounts of any capital gains distributions resulting from the repositioning cannot be estimated at this time. Touchstone Advisors publishes estimates of capital gains distributions for the Touchstone Funds on its website (https://www.touchstoneinvestments.com/literature-center/taxplanning.htm), generally in October of each year. The Acquiring Fund will also bear brokerage costs in connection with the repositioning. For illustration purposes only, if the Reorganization had been completed as of March 31, 2017 and the Acquiring Fund had sold on a pro rata basis two-thirds of the investments held in the Target Fund's portfolio as of March 31, 2017, the resulting realized capital gains estimate would be expected to total $4.54 per share and the brokerage commissions would be expected to total approximately $136,000 in the aggregate, or $0.008 per share, based on average commission costs of the Fund. Under the same circumstances, if only one-third of the investments held in the Target Fund's portfolio had been repositioned as of March 31, 2017, the resulting realized capital gains and brokerage cost estimates would be reduced by half, to $2.27 and $0.004 per share, respectively.
60
Synopsis: Reorganization of Sentinel Common Stock Fund into Touchstone Large Cap Focused Fund
What class of shares of the Acquiring Fund will I receive in the Reorganization?
Shareholders of the Sentinel Common Stock Fund will receive shares of the Touchstone Large Cap Focused Fund, as follows:
| Sentinel Common Stock Fund | | Touchstone Large Cap Focused Fund |
| Class A | | Class A |
| Class C | | Class C |
| Class I | | Class Y |
| Class R6 | | Institutional Class |
How do the fees and expenses of the Target Fund and the Acquiring Fund compare?
The tables below describe the fees and expenses that you pay if you buy and hold shares of the Sentinel Common Stock Fund and the pro forma fees and expenses that you may pay if you buy and hold shares of the Touchstone Large Cap Focused Fund after giving effect to the Reorganization. The pro forma expense ratios project anticipated expenses of the Touchstone Large Cap Focused Fund, but actual expenses may be greater or less than those shown. Expenses for the Class A, Class C, Class I and Class R6 shares of the Sentinel Common Stock Fund are based on the operating expenses incurred by each class of shares of the Fund for the fiscal year ended November 30, 2016. Pro Forma Fees and Expenses are estimated for the Touchstone Large Cap Focused Fund based on assets of the Sentinel Fund as of November 30, 2016.
No sales charge will be imposed on the Class A shares of the Acquiring Fund received in connection with the Reorganization. In addition, you may qualify for sales charge discounts for Class A shares if you and your family invest, or agree to invest in the future, at least $25,000 or more in the Sentinel Funds or $50,000 or more in the Touchstone Funds. For the Target Fund, more information about these and other discounts is available from your financial professional and in the section entitled “Share Classes” on page 82 of the Target Fund’s prospectus and “How to Purchase Shares and Reduce Sales Charges” on page 44 of the Target Fund’s SAI. For the Acquiring Fund, more information about these and other discounts is available from your financial professional and in the section entitled “Investing with Touchstone—Class A Shares—Letter of Intent” on page [•] of this Joint Proxy Statement/Prospectus and in the Acquiring Fund’s SAI on page [•].
SHAREHOLDER FEES
(fees paid directly from your investment)
| | | Maximum
Sales Charge
(load)
Imposed on
Purchases (as
a percentage
of offering
price) | | Maximum
Deferred
Sales Charge
(load) (as a
percentage of
the lower of
original
purchase
price or
redemption
proceeds) | | Wire
Redemption
Fee |
| Sentinel Common Stock Fund – Class A | | | 5.00 | % | | | None | | | None |
| Touchstone Large Cap Focused Fund – Class A Pro Forma | | | 5.75 | %(1)(2) | | | None | (2) | | up to $15 |
| Sentinel Common Stock Fund – Class C | | | None | | | | 1.00 | %(2) | | None |
| Touchstone Large Cap Focused Fund – Class C Pro Forma | | | None | | | | 1.00 | %(2) | | up to $15 |
61
| | | Maximum
Sales Charge
(load)
Imposed on
Purchases (as
a percentage
of offering
price) | | Maximum
Deferred
Sales Charge
(load) (as a
percentage of
the lower of
original
purchase
price or
redemption
proceeds) | | Wire
Redemption
Fee |
| Sentinel Common Stock Fund – Class I | | | None | | | | None | | | None |
| Touchstone Large Cap Focused Fund – Class Y Pro Forma | | | None | | | | None | | | up to $15 |
| Sentinel Common Stock Fund – Class R6 | | | None | | | | None | | | None |
| Touchstone Large Cap Focused Fund – Institutional Class Pro Forma | | | None | | | | None | | | up to $15 |
| (1) | No sales charge will be imposed on the Class A shares of the Acquiring Fund received in connection with the Reorganization. |
| (2) | A deferred sales charge of 1% applies to certain redemptions of Class A shares made within twelve months of purchase if the shares were purchased without an initial sales charge as part of an investment of $1 million or more. If you hold load-waived Class A shares or Class C shares of the Target Fund, the Acquiring Fund will look to the date of purchase of your Target Fund shares for purposes of assessing deferred sales charges on shares received in the Reorganization. |
ANNUAL FUND OPERATING EXPENSES
(expenses that you pay each year as a percentage of the value of your investment)
| | | Sentinel Common
Stock Fund
(Class A) | | Touchstone Large
Cap Focused Fund
Pro Forma
(Class A) |
| Management Fees | | | 0.57 | % | | | 0.57 | % |
| Distribution/Service (12b-1) Fees | | | 0.25 | % | | | 0.25 | % |
| Other Expenses | | | 0.18 | % | | | 0.26 | %(1) |
| Total Annual Fund Operating Expenses | | | 1.00 | % | | | 1.08 | % |
| Fee Waiver | | | None | | | | (0.08 | %)(2) |
| Total Annual Fund Operating Expenses After Fee Waiver | | | 1.00 | % | | | 1.00 | % |
ANNUAL FUND OPERATING EXPENSES
(expenses that you pay each year as a percentage of the value of your investment)
| | | Sentinel Common
Stock Fund
(Class C) | | Touchstone Large
Cap Focused Fund
Pro Forma
(Class C) |
| Management Fees | | | 0.57 | % | | | 0.57 | % |
| Distribution/Service (12b-1) Fees | | | 1.00 | % | | | 1.00 | % |
| Other Expenses | | | 0.22 | % | | | 0.30 | %(1) |
| Total Annual Fund Operating Expenses | | | 1.79 | % | | | 1.87 | % |
| Fee Waiver | | | None | | | | (0.08 | %)(2) |
| Total Annual Fund Operating Expenses After Fee Waiver | | | 1.79 | % | | | 1.79 | % |
62
ANNUAL FUND OPERATING EXPENSES
(expenses that you pay each year as a percentage of the value of your investment)
| | | Sentinel Common
Stock Fund
(Class I) | | Touchstone Large
Cap Focused Fund
Pro Forma
(Class Y) |
| Management Fees | | | 0.57 | % | | | 0.57 | % |
| Distribution/Service (12b-1) Fees | | | None | | | | None | |
| Other Expenses | | | 0.15 | % | | | 0.23 | %(1) |
| Total Annual Fund Operating Expenses | | | 0.72 | % | | | 0.80 | % |
| Fee Waiver | | | — | (3) | | | (0.08 | %)(2) |
| Total Annual Fund Operating Expenses After Fee Waiver | | | 0.72 | % | | | 0.72 | % |
ANNUAL FUND OPERATING EXPENSES
(expenses that you pay each year as a percentage of the value of your investment)
| | | Sentinel Common
Stock Fund
(Class R6) | | Touchstone Large
Cap Focused Fund
Pro Forma
(Institutional Class) |
| Management Fees | | | 0.57 | % | | | 0.57 | % |
| Distribution/Service (12b-1) Fees | | | None | | | | None | |
| Other Expenses | | | 0.15 | % | | | 0.23 | %(1) |
| Total Annual Fund Operating Expenses | | | 0.72 | % | | | 0.80 | % |
| Fee Waiver | | | (0.07 | %)(4) | | | (0.15 | %)(2) |
| Total Annual Fund Operating Expenses After Fee Waiver | | | 0.65 | % | | | 0.65 | % |
| (1) | Other Expenses are estimated based on fees and expenses of the Acquiring Fund, assuming the Reorganization had been consummated as of the beginning of the 12-month period ended November 30, 2016. |
| (2) | Effective upon consummation of the Reorganization, Touchstone Advisors has contractually agreed to waive fees and/or reimburse certain expenses as necessary to limit total annual fund operating expenses (excluding dividend and interest expenses relating to short sales, interest, taxes, brokerage commissions and other transaction costs, portfolio transactions and investment related expenses, other expenditures which are capitalized in accordance with U.S. generally accepted accounting principles, the cost of “Acquired Fund Fees and Expenses,” if any, and other extraordinary expenses not incurred in the ordinary course of business) such that the total operating expense ratio of each class of shares of the Acquiring Fund offered hereby, on an annualized basis, does not exceed the total operating expense ratio of the corresponding class of shares of the Target Fund (net of fee waivers) of the Target Fund for the fiscal year ending November 30, 2016. The agreement will remain in effect for at least two years following the closing of the Reorganization. Additional information regarding the expense limit is provided under the section entitled “The Funds’ Management—Expense Limitation Agreement.” |
| (3) | Sentinel has contractually agreed to reimburse certain expenses paid by the Class I shares of the Funds to the extent necessary to prevent the total annual fund operating expense ratio of the Class I shares of the Funds, on an annualized basis, from exceeding the total annual fund operating expense ratio of the Class A shares of the same Fund. This agreement will continue through March 31, 2018. This agreement may be terminated upon 90 days’ notice by a majority of the non-interested directors of Sentinel Funds. Additional information regarding the expense limit is provided under the section entitled “The Funds’ Management—Expense Limitation Agreement.” |
| (4) | Sentinel has contractually agreed to waive fees and/or reimburse certain expenses in order to limit Total Annual Fund Operating Expenses After Fee Waiver and/or Expense Reimbursement for Class R6 shares of the Common Stock Fund, on an annualized basis, to 0.65% of average daily net assets attributable to Class R6 shares through March 31, 2018. This agreement may be terminated upon 90 days’ notice by a majority of the non-interested directors of Sentinel Funds. Additional information regarding the expense limit is provided under the section entitled “The Funds’ Management—Expense Limitation Agreement.” |
Expense Examples. The examples below are intended to help you compare the cost of investing in the Target Fund with the pro forma cost of investing in the Acquiring Fund. The examples assume that you invest $10,000 in each Fund and then either (i) sell all of your shares at the end of each period indicated below or (ii) keep all of your shares at the end of each period indicated below. The examples also assume that your investment has a 5% annual return and that operating expenses (before fee waivers and expense reimbursements) remain the same.
63
This example also assumes that the expense limitation agreement for the Sentinel Common Stock Fund—Class R6 will remain in place for one year and the expense limitation agreement for the Acquiring Fund will be in place for two years following the closing of the Reorganization. Although your actual costs may be higher or lower, based on these assumptions, your costs would be:
| If shares are redeemed: | | 1 Year | | | 3 Years | | | 5 Years | | | 10 Years | |
| Class A Shares | | | | | | | | | | | | | | | | |
| Sentinel Common Stock Fund | | | $597 | | | | $802 | | | | $1,025 | | | | $1,663 | |
| Touchstone Large Cap Focused Fund Pro Forma | | | $671 | | | | $883 | | | | $1,121 | | | | $1,803 | |
| Class C Shares | | | | | | | | | | | | | | | | |
| Sentinel Common Stock Fund | | | $282 | | | | $563 | | | | $970 | | | | $2,105 | |
| Touchstone Large Cap Focused Fund Pro Forma | | | $282 | | | | $572 | | | | $996 | | | | $2,177 | |
| Class I Shares/Class Y Shares | | | | | | | | | | | | | | | | |
| Sentinel Common Stock Fund | | | $74 | | | | $230 | | | | $401 | | | | $894 | |
| Touchstone Large Cap Focused Fund Pro Forma | | | $74 | | | | $239 | | | | $428 | | | | $975 | |
| Class R6 Shares/Institutional Class Shares | | | | | | | | | | | | | | | | |
| Sentinel Common Stock Fund | | | $66 | | | | $223 | | | | $394 | | | | $888 | |
| Touchstone Large Cap Focused Fund Pro Forma | | | $66 | | | | $225 | | | | $414 | | | | $961 | |
| | | | | | | | | | | | | | | | | |
| If shares are not redeemed:(1) | | 1 Year | | | 3 Years | | | 5 Years | | | 10 Years | |
| Class C Shares | | | | | | | | | | | | | | | | |
| Sentinel Common Stock Fund | | | $182 | | | | $563 | | | | $970 | | | | $2,105 | |
| Touchstone Large Cap Focused Fund Pro Forma | | | $182 | | | | $572 | | | | $996 | | | | $2,177 | |
| (1) | For holders of all other classes, the costs are the same as set forth above. |
How do the performance records of the Target Funds and the Acquiring Fund compare?
The Acquiring Fund has no performance history. The Target Fund will be the accounting and performance survivor of the Reorganization. The bar chart and the performance table below provide some indication of the risks of an investment in the Acquiring Fund by showing how the Target Fund’s performance has varied from year to year and by showing how the Target Fund’s average annual returns compare with a broad measure of market performance. The Target Fund’s past performance, before and after taxes, does not necessarily represent how the Acquiring Fund will perform in the future. Updated performance information for the Target Fund is available on the Target Fund’s website at www.sentinelinvestments.com or by calling 800.282.3863.
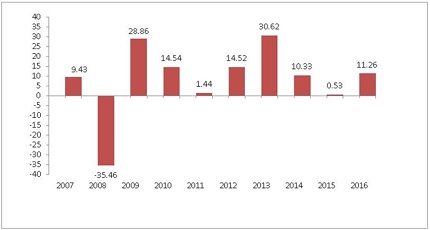
| Best Quarter: Second Quarter, 2009 17.55% | Worst Quarter: Fourth Quarter, 2008 (21.75%) |
The Sentinel Common Stock Fund’s calendar year-to-date total return for Class A shares as of March 31, 2017 was 6.61%.
64
Average Annual Total Returns
For the Periods Ended December 31, 2016
| Sentinel Common Stock Fund | | Inception
Date | | 1 Year | | 5 Years | | 10 Years |
| | | | | | | | | |
| Class A (return before taxes) | | 01/12/1934 | | | 5.70 | % | | | 11.89 | % | | | 6.37 | % |
| Class A (return after taxes on distributions) | | 01/12/1934 | | | 3.97 | % | | | 10.16 | % | | | 5.37 | % |
| Class A (return after taxes on distributions and sale of fund shares) | | 01/12/1934 | | | 4.65 | % | | | 9.39 | % | | | 5.08 | % |
| Class C (return before taxes) | | 05/04/1998 | | | 9.38 | % | | | 12.14 | % | | | 6.01 | % |
| Class I (return before taxes) | | 05/04/2007 | | | 11.58 | % | | | 13.38 | % | | | 7.27 | % |
| Class R6 (return before taxes) | | 12/23/2014 | | | 11.64 | % | | | 13.20 | % | | | 6.99 | % |
| S&P 500® Index(1) (reflects no deduction for fees, expenses or taxes) | | N/A | | | 11.96 | % | | | 14.66 | % | | | 6.95 | % |
| (1) | The S&P 500® Index consists of approximately 500 widely held U.S. equity securities chosen for market size, liquidity, and industry group representation. |
After-tax returns are calculated using the historical highest individual federal marginal income tax rates and do not reflect the impact of state and local taxes. Actual after-tax returns depend on an investor’s tax situation and may differ from those shown. The return after taxes on distributions and sale of Fund shares may exceed the return before taxes due to an assumed tax benefit from any losses on a sale of Fund shares at the end of the measurement period. If you hold your Fund shares through a tax-advantaged arrangement, such as an individual retirement account or a 401(k) plan, the after-tax returns do not apply to your situation.
How do the investment goals and principal investment strategies of the Funds compare?
The investment goals and principal investment strategies of the Sentinel Common Stock Fund and the Touchstone Large Cap Focused Fund, along with descriptions of certain differences between the Funds’ investment goals and principal investment strategies, are set forth in the table below. Although the Funds have similar investment goals and principal investment strategies, the analytical tools, techniques and investment selection process used by the sub-advisor to the Acquiring Fund may differ from those used by Sentinel.
| | | Sentinel Common
Stock Fund | | Touchstone Large Cap
Focused Fund | | Differences |
| | | | | | | |
| Investment Goal(s): | | The Fund seeks a combination of capital appreciation and income. | | The Fund seeks capital appreciation. | | While each Fund’s investment goal includes capital appreciation, the Target Fund’s investment goal also includes income. |
| | | | | | | |
| Principal Investment Strategy: | | The Fund normally invests at least 80% of its net assets in common stocks. | | The Fund invests, under normal market conditions, at least 80% of its net assets in equity securities. | | — |
| | | | | | | |
| Issuer Size: | | The Fund typically invests in common stocks of companies above $5 billion in market capitalization. | | The Fund invests primarily in issuers having a market capitalization, at the time of purchase, above $5 billion. | | — |
65
| | | Sentinel Common
Stock Fund | | Touchstone Large Cap
Focused Fund | | Differences |
| | | | | | | |
| Non-U.S. Investments: | | The Fund may invest without limitation in foreign securities. Under normal circumstances, the Fund invests predominantly in common stocks of U.S. companies. | | The Fund may invest up to 35% of its assets in securities of foreign issuers through the use of ordinary shares or depositary receipts such as American Depositary Receipts (“ADRs”). The Fund may also invest in securities of emerging market countries. | | The Target Fund may invest without limitation in foreign securities, while the Acquiring Fund may invest up to 35% of its assets in securities of foreign issuers. |
| | | | | | | |
| Sector or Industry Focus: | | Up to 25% of the Fund’s assets may be invested in securities within a single industry. Although the Fund may invest in any economic sector, at times it may emphasize one or more particular sectors. The Fund will not make investments that result in the concentration of its investments in a single industry. | | The Fund will not make investments that result in the concentration of its investments in a single industry. | | While the Target Fund may emphasize one or more particular sectors, each Fund will not concentrate its investments in a single industry. |
| | | | | | | |
| Diversification: | | The Fund is classified as diversified under the Investment Company Act of 1940, as amended. | | The Fund is non-diversified and may invest a significant percentage of its assets in the securities of a single company. | | The Acquiring Fund may invest a significant percentage of its assets in the securities of a single company, while the Target Fund may not. |
Additional Information About the Funds’ Principal Investment Strategies
Target Fund. The Target Fund invests mainly in a diverse group of common stocks of well-established companies, many of which historically have paid regular dividends. When appropriate, the Fund also may invest in preferred stocks or debentures convertible into common stocks. Sentinel’s investment philosophy centers on building a diverse portfolio consisting largely of securities of high quality companies with a positive multi-year outlook offered at attractive valuation levels, based on a number of metrics, including value relative to its history, peers and/or the market over time. Sentinel has a preference for companies that earn above-average rates of return on capital and that generate free cash flow. Additionally, earnings revision trends are important.
The Target Fund may sell a security if the fundamentals of the company are deteriorating or the original investment premise is no longer valid, the security is trading meaningfully higher than what the portfolio managers believe is a fair valuation, to manage the size of the holding or the sector weighting and/or to take advantage of a more attractive investment opportunity. A security may also be sold to meet redemptions.
Acquiring Fund. The Acquiring Fund invests, under normal market conditions, at least 80% of its net assets in equity securities. The Fund invests primarily in issuers having a market capitalization, at the time of purchase, above $5 billion. The Fund’s 80% policy is a non-fundamental investment policy that can be changed by the Fund upon 60 days’ prior notice to shareholders. Equity securities include common stock and preferred stock. These securities may be listed on an exchange or traded over-the-counter.
66
In selecting securities for the Fund, the Acquiring Fund’s sub-advisor, Fort Washington, seeks to invest in companies that:
| • | Are trading below its estimate of the companies’ intrinsic value; and |
| • | Have a sustainable competitive advantage or a high barrier to entry in place. The barrier(s) to entry can be created through a cost advantage, economies of scale, high customer loyalty, or a government barrier (e.g., license or subsidy). Fort Washington believes that the strongest barrier to entry is the combination of economies of scale and higher customer loyalty. |
The Acquiring Fund will generally hold 25 to 40 companies, with residual cash and equivalents expected to represent less than 10% of the Fund’s net assets. The Fund may, at times, hold fewer securities and a higher percentage of cash and equivalents when, among other reasons, Fort Washington cannot find a sufficient number of securities that meets its purchase requirements.
The Acquiring Fund may invest up to 35% of its assets in securities of foreign issuers through the use of ordinary shares or depositary receipts such as American Depositary Receipts (“ADRs”). The Fund may also invest in securities of emerging market countries.
The Acquiring Fund will generally sell a security if it reaches Fort Washington’s estimate of fair value, if a more attractive investment opportunity is available, or if a structural change has taken place and Fort Washington cannot reliably estimate the impact of the change on the business fundamentals.
How do the principal risks of investing in the Funds compare?
An investment in each Fund is subject to equity securities (stock market) risk, foreign securities risk and sector risk. An investment in the Sentinel Common Stock Fund is also subject to investment style risk. An investment in the Touchstone Large Cap Focused Fund is also subject to management risk and non-diversification risk, as well as additional foreign securities risks including emerging markets risk. For more information on the Funds’ principal risks, see “Comparison of Principal Risks.”
Who will be the Advisor, Sub-Advisor and Portfolio Managers of my Fund after the Reorganization?
Sentinel is the investment advisor to Sentinel Common Stock Fund. The portfolio manager of Sentinel Common Stock Fund is Hilary Roper.
After the Reorganization, Touchstone Advisors will serve as the investment advisor and Fort Washington will serve as the sub-advisor to Touchstone Large Cap Focused Fund. The portfolio manager of Touchstone Large Cap Focused Fund is James Wilhelm. For additional information regarding the advisor, sub-advisor and portfolio manager listed above, please see the section entitled “The Funds’ Management—Investment Advisor” and “The Funds’ Management—Sub-Advisors and Portfolio Managers.”
What are the portfolio turnover rates of the Funds?
A Fund pays transaction costs, such as brokerage commissions, when it buys and sells securities (or “turns over” its portfolio). A higher portfolio turnover rate may indicate higher transaction costs and may result in higher taxes when Fund shares are held in a taxable account. These costs, which are not reflected in annual fund operating expenses or in the example, affect a Fund’s performance. During the fiscal year ended November 30, 2016, the Target Fund’s portfolio turnover rate was 8% of the average value of its portfolio. The Acquiring Fund will not commence operations until the consummation of the Reorganization. The portfolio turnover rate of the Acquiring Fund may be different from the portfolio turnover rate of the Target Fund due to the Acquiring Fund having a different portfolio manager and certain differences in investment strategies.
Will there be any repositioning of the portfolio after the Reorganization?
It is expected that a significant portion (approximately two-thirds) of the portfolio investments of the Target Fund may be sold by the Acquiring Fund following the Reorganization. However, the timing of any repositioning and its resulting impact on capital gains distributions in 2017 and beyond is uncertain. To mitigate repositioning-related tax consequences to shareholders holding Fund shares in taxable accounts, Fort Washington intends to take steps including, among other things, executing the repositioning over time across multiple fiscal years and harvesting offsetting capital losses during periods of market volatility. There can be no assurance that these steps will be effective in materially reducing or eliminating the aggregate tax consequences of the repositioning. The amounts per share of any capital gains distributions resulting from the repositioning will depend on a number of factors, including the proportion of portfolio holdings that are actually sold, the timing of portfolio sales, the performance of the stock market in general, the availability of offsetting capital losses and the scale of purchase and redemption activity in Fund shares. The timing of portfolio sales will also be subject to market conditions existing after the closing of the Reorganization. Accordingly, the per share amounts of any capital gains distributions resulting from the repositioning cannot be estimated at this time. Touchstone Advisors publishes estimates of capital gains distributions for the Touchstone Funds on its website (https://www.touchstoneinvestments.com/literature-center/taxplanning.htm), generally in October of each year. The Acquiring Fund will also bear brokerage costs in connection with the repositioning. For illustration purposes only, if the Reorganization had been completed as of March 31, 2017 and the Acquiring Fund had sold on a pro rata basis two-thirds of the investments held in the Target Fund's portfolio as of March 31, 2017, the resulting realized capital gains estimate would be expected to total $14.85 and the brokerage commissions would be expected to total approximately $410,000 in the aggregate, or $0.009 per share, based on average commission costs of the Fund. Under the same circumstances, if only one-third of the investments held in the Target Fund's portfolio had been repositioned as of March 31, 2017, the resulting realized capital gains and brokerage cost estimates would be reduced by half, to $7.43 and $0.004 per share, respectively.
67
Synopsis: Reorganization of Sentinel International Equity Fund into Touchstone International Equity Fund
What class of shares of the Acquiring Fund will I receive in the Reorganization?
Shareholders of the Sentinel International Equity Fund will receive shares of the Touchstone International Equity Fund, as follows:
| Sentinel International Equity Fund | | Touchstone International Equity Fund |
| Class A | | Class A |
| Class C | | Class C |
| Class I | | Class Y |
How do the fees and expenses of the Target Fund and the Acquiring Fund compare?
The tables below describe the fees and expenses that you pay if you buy and hold shares of the Sentinel International Equity Fund and the pro forma fees and expenses that you may pay if you buy and hold shares of the Touchstone International Equity Fund after giving effect to the Reorganization. The pro forma expense ratios project anticipated expenses of the Touchstone International Fund following the Reorganization, but actual expenses may be greater or less than those shown. Expenses for the Class A, Class C and Class I shares of the Sentinel International Equity Fund are based on the operating expenses incurred by each class of shares of the Fund for the fiscal year ended November 30, 2016. The pro forma fees and expenses for the Class A, Class C and Class Y shares of the Touchstone International Equity Fund are estimated based on the assets of the Sentinel Fund for the period ended November 30, 2016.
No sales charge will be imposed on the Class A shares of the Acquiring Fund received in connection with the Reorganization. In addition, you may qualify for sales charge discounts for Class A shares if you and your family invest, or agree to invest in the future, at least $25,000 or more in the Sentinel Funds or $50,000 or more in the Touchstone Funds. For the Target Fund, more information about these and other discounts is available from your financial professional and in the section entitled “Share Classes” on page 82 of the Target Fund’s prospectus and “How to Purchase Shares and Reduce Sales Charges” on page 44 of the Target Fund’s SAI. For the Acquiring Fund, more information about these and other discounts is available from your financial professional and in the section entitled “Investing with Touchstone—Class A Shares—Letter of Intent” on page [•] of this Joint Proxy Statement/Prospectus and in the Acquiring Fund’s SAI on page [•].
SHAREHOLDER FEES
(fees paid directly from your investment)
| | | Maximum
Sales Charge
(Load)
Imposed on
Purchases (as
a percentage
of offering
price) | | Maximum
Deferred
Sales Charge
(load) (as a
percentage of
the lower of
original
purchase
price or
redemption
proceeds) | | Wire
Redemption
Fee |
| | | | | | | | | | | |
| Sentinel International Equity Fund – Class A Shares | | | 5.00 | % | | | None | | | None |
| Touchstone International Equity Fund – Class A Shares Pro Forma | | | 5.75 | %(1)(2) | | | None | | | up to $15 |
| | | | | | | | | | | |
| Sentinel International Equity Fund – Class C Shares | | | None | | | | 1.00 | %(2) | | None |
| Touchstone International Equity Fund – Class C Shares Pro Forma | | | None | | | | 1.00 | %(2) | | up to $15 |
68
| | | Maximum
Sales Charge
(Load)
Imposed on
Purchases (as
a percentage
of offering
price) | | Maximum
Deferred
Sales Charge
(load) (as a
percentage of
the lower of
original
purchase
price or
redemption
proceeds) | | Wire
Redemption
Fee |
| | | | | | | | | | | |
| Sentinel International Equity Fund – Class I Shares | | | None | | | | None | | | None |
| Touchstone International Equity Fund – Class Y Shares Pro Forma | | | None | | | | None | | | up to $15 |
| (1) | No sales charge will be imposed on the Class A shares of the Acquiring Fund received in connection with the Reorganization. |
| (2) | A deferred sales charge of 1% applies to certain redemptions of Class A shares made within twelve months of purchase if the shares were purchased without an initial sales charge as part of an investment of $1 million or more. If you hold load-waived Class A shares or Class C shares of the Target Fund, the Acquiring Fund will look to the date of purchase of your Target Fund shares for purposes of assessing deferred sales charges on shares received in the Reorganization. |
ANNUAL FUND OPERATING EXPENSES
(expenses that you pay each year as a percentage of the value of your investment)
| | | Sentinel
International
Equity Fund
Class A | | Touchstone
International
Equity Fund Pro
Forma
Class A |
| Management Fees | | | 0.70 | % | | | 0.70 | % |
| Distribution/Service (12b-1) Fees | | | 0.25 | % | | | 0.25 | % |
| Other Expenses | | | 0.41 | % | | | 0.52 | %(1) |
| Acquired Fund Fees and Expenses(2) | | | 0.01 | % | | | 0.01 | %(1) |
| Total Annual Fund Operating Expenses | | | 1.37 | % | | | 1.48 | % |
| Fee Waiver | | | None | | | | (0.11 | %)(3) |
| Total Annual Fund Operating Expenses After Fee Waiver | | | 1.37 | % | | | 1.37 | % |
ANNUAL FUND OPERATING EXPENSES
(expenses that you pay each year as a percentage of the value of your investment)
| | | Sentinel
International
Equity Fund
Class C | | Touchstone
International
Equity Fund Pro
Forma
Class C |
| Management Fees | | | 0.70 | % | | | 0.70 | % |
| Distribution/Service (12b-1) Fees | | | 1.00 | % | | | 1.00 | % |
| Other Expenses | | | 0.79 | % | | | 0.96 | %(1) |
| Acquired Fund Fees and Expenses(2) | | | 0.01 | % | | | 0.01 | %(1) |
| Total Annual Fund Operating Expenses | | | 2.50 | % | | | 2.67 | % |
| Fee Waiver | | | None | | | | (0.17 | %)(3) |
| Total Annual Fund Operating Expenses After Fee Waiver | | | 2.50 | % | | | 2.50 | % |
69
ANNUAL FUND OPERATING EXPENSES
(expenses that you pay each year as a percentage of the value of your investment)
| | | Sentinel
International
Equity Fund
Class I | | Touchstone
International
Equity Fund Pro
Forma
Class Y |
| Management Fees | | | 0.70 | % | | | 0.70 | % |
| Distribution/Service (12b-1) Fees | | | None | | | | None | |
| Other Expenses | | | 0.29 | % | | | 0.41 | %(1) |
| Acquired Fund Fees and Expenses(2) | | | 0.01 | % | | | 0.01 | %(1) |
| Total Annual Fund Operating Expenses | | | 1.00 | % | | | 1.12 | % |
| Fee Waiver | | | None | (4) | | | (0.12 | %)(3) |
| Total Annual Fund Operating Expenses After Fee Waiver | | | 1.00 | % | | | 1.00 | % |
| (1) | Other Expenses and Acquired Fund Fees and Expenses are estimated based on fees and expenses of the Acquiring Fund, assuming the Reorganization had been consummated as of the beginning of the 12-month period ended November 30, 2016. |
| (2) | Acquired Fund Fees and Expenses are expenses indirectly incurred by the Fund through its investments in one or more underlying funds, including money market funds. Because these costs are indirect, the Total Annual Fund Operating Expenses do not correlate to the ratio of expenses to average net assets in the Fund’s most recent annual report. |
| (3) | Effective upon consummation of the Reorganization, Touchstone Advisors has contractually agreed to waive fees and/or reimburse certain expenses in order to limit Total Annual Fund Operating Expenses (excluding dividend and interest expenses relating to short sales, interest, taxes, brokerage commissions and other transaction costs, portfolio transactions and investment related expenses, other expenditures which are capitalized in accordance with U.S. generally accepted accounting principles, the cost of “Acquired Fund Fees and Expenses,” if any, and other extraordinary expenses not incurred in the ordinary course of business such that the total operating expense ratio of each class of shares of the Acquiring Fund offered hereby, on an annualized basis, does not exceed the total operating expenses of the corresponding class of shares of the Target Fund (net of fee waivers of the Target Fund) for the fiscal year ending November 30, 2016. The agreement will remain in effect for at least two years following the Closing of the Reorganization. Additional information regarding the expense limit is provided under the section entitled “The Funds’ Management—Expense Limitation Agreement.” |
| (4) | Sentinel has contractually agreed to reimburse certain expenses paid by the Class I shares of the Target Funds to the extent necessary to prevent the total annual fund operating expense ratio of the Class I shares of the Target Funds, on an annualized basis, from exceeding the total annual fund operating expense ratio of the Class A shares of the same Fund. This agreement will continue through March 31, 2018. This agreement may be terminated upon 90 days’ notice by a majority of the non-interested directors of Sentinel Funds. Additional information regarding the expense limit is provided under the section entitled “The Funds’ Management—Expense Limitation Agreement.” |
Expense Examples. The examples below are intended to help you compare the cost of investing in the Target Funds with the pro forma cost of investing in the Acquiring Funds. The examples assume that you invest $10,000 in each Fund and then either (i) sell all of your shares at the end of each period indicated below or (ii) keep all of your shares at the end of each period indicated below. The examples also assume that your investment has a 5% annual return, that operating expenses (before fee waivers and expense reimbursements) remain the same and the expense limitation agreement for the Acquiring Fund will be in place for two years following the closing of the Reorganization. Although your actual costs may be higher or lower, based on these assumptions, your costs would be:
| If shares are redeemed: | | 1 Year | | | 3 Years | | | 5 Years | | | 10 Years | |
| Class A Shares | | | | | | | | | | | | | | | | |
| Sentinel International Equity Fund | | | $633 | | | | $912 | | | | $1,212 | | | | $2,064 | |
| Touchstone International Equity Fund Pro Forma | | | $706 | | | | $995 | | | | $1,316 | | | | $2,224 | |
| Class C Shares | | | | | | | | | | | | | | | | |
| Sentinel International Equity Fund | | | $353 | | | | $779 | | | | $1,331 | | | | $2,836 | |
| Touchstone International Equity Fund Pro Forma | | | $353 | | | | $796 | | | | $1,384 | | | | $2,977 | |
70
| If shares are redeemed: | | 1 Year | | | 3 Years | | | 5 Years | | | 10 Years | |
| Class I/Class Y Shares | | | | | | | | | | | | | | | | |
| Sentinel International Equity Fund | | | $102 | | | | $318 | | | | $552 | | | | $1,225 | |
| Touchstone International Equity Fund Pro Forma | | | $102 | | | | $332 | | | | $593 | | | | $1,341 | |
| | | | | | | | | | | | | | | | | |
| If shares are not redeemed:(1) | | 1 Year | | | 3 Years | | | 5 Years | | | 10 Years | |
| Class C Shares | | | | | | | | | | | | | | | | |
| Sentinel International Equity Fund | | | $253 | | | | $779 | | | | $1,331 | | | | $2,836 | |
| Touchstone International Equity Fund Pro Forma | | | $253 | | | | $796 | | | | $1,384 | | | | $2,977 | |
| (1) | For holders of all other classes, the costs are the same as set forth above |
How do the performance records of the Target Funds and the Acquiring Fund compare?
The Acquiring Fund has no performance history. The Target Fund will be the accounting and performance survivor of the Reorganization. The bar charts and the performance tables below provide some indication of the risks of an investment in the Acquiring Fund by showing how the Target Fund’s performance has varied from year to year and by showing how each Target Fund’s average annual returns compare with a broad measure of market performance. The Target Fund’s past performance, before and after taxes, does not necessarily represent how the corresponding Acquiring Fund will perform in the future. Updated performance information for the Target Fund is available on the Target Fund’s website at www.sentinelinvestments.com or by calling 800.282.3863.
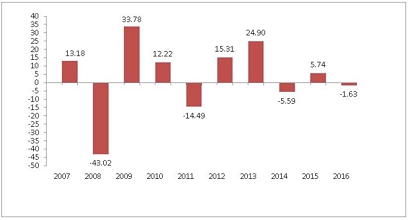
| Best Quarter: Second Quarter, 2009 24.26% | Worst Quarter: Third Quarter, 2011 (21.09%) |
The Sentinel International Equity Fund’s calendar year-to-date total return for Class A shares as of March 31, 2017 was 8.41%.
Average Annual Total Returns
For the Periods Ended December 31, 2016
| Sentinel International Equity Fund | | Inception
Date | | 1 Year | | 5 Years | | 10 Years |
| | | | | | | | | | | | |
| Class A (return before taxes) | | 03/01/1993 | | | (6.54 | %) | | | 6.08 | % | | | 1.07 | % |
| Class A (return after taxes on distributions) | | 03/01/1993 | | | (6.69 | %) | | | 4.89 | % | | | 0.26 | % |
| Class A (return after taxes on distributions and sale of fund shares) | | 03/01/1993 | | | (3.59 | %) | | | 4.73 | % | | | 0.90 | % |
| Class C (return before taxes) | | 05/04/1998 | | | (3.69 | %) | | | 5.69 | % | | | 0.24 | % |
71
| Sentinel International Equity Fund | | Inception
Date | | 1 Year | | 5 Years | | 10 Years |
| | | | | | | | | | | | |
| Class I (return before taxes) | | 08/27/2007 | | | (1.29 | %) | | | 7.67 | % | | | 1.98 | % |
| MSCI EAFE (Morgan Stanley Capital International Europe, Australasia, Far East) Index(1) (reflects no deduction for fees, expenses or taxes) | | N/A | | | 1.00 | % | | | 6.53 | % | | | 0.75 | % |
| (1) | The Morgan Stanley Capital International (MSCI) Europe, Australasia, Far East (EAFE) Index is a free float-adjusted, market capitalization-weighted index that is designed to measure the equity market performance of developed markets, excluding the U.S. and Canada. The Fund uses the net version of the Index, which reflects reinvested dividends which have been subject to the maximum non-U.S. tax rate applicable. |
After-tax returns are calculated using the historical highest individual federal marginal income tax rates and do not reflect the impact of state and local taxes. Actual after-tax returns depend on an investor’s tax situation and may differ from those shown. The return after taxes on distributions and sale of Fund shares may exceed the return before taxes due to an assumed tax benefit from any losses on a sale of Fund shares at the end of the measurement period. If you hold your Fund shares through a tax-advantaged arrangement, such as an individual retirement account or a 401(k) plan, the after-tax returns do not apply to your situation.
How do the investment goals and principal investment strategies of the Funds compare?
The investment goals and principal investment strategies of the Sentinel International Equity Fund and the Touchstone International Equity Fund, along with descriptions of certain differences between the Funds’ investment goals and principal investment strategies, are set forth in the table below.
| | | Sentinel International
Equity Fund | | Touchstone International
Equity Fund | | Differences |
| | | | | | | |
| Investment Goal(s): | | The Fund seeks growth of capital. | | The Fund seeks growth of capital. | | — |
| Principal Investment Strategy: | | The Fund normally invests at least 80% of its net assets in equity securities.
The Fund will normally be invested in ten or more foreign countries and may invest up to 40% of its assets in any one country. | | The Fund normally invests at least 80% of its assets in equity securities.
The Fund will normally be invested in ten or more foreign countries and may invest up to 40% of its assets in any one country. | | — |
| | | | | | | |
| Fixed Income Securities: | | The Fund may invest in convertible or debt securities rated Baa or higher by Moody’s Investors Service, Inc. or BBB or higher by Standard & Poor’s. | | The Fund may invest in convertible or debt securities rated Baa or higher by Moody’s Investors Service, Inc. or BBB or higher by Standard & Poor’s. | | — |
Additional Information About the Funds’ Principal Investment Strategies
Target Fund. Normally, at least 75% of the Target Fund’s total assets are invested in securities of non-U.S. issuers selected by Sentinel mainly for their long-term capital growth prospects. The remaining 25% may be invested in companies organized in the United States that have at least 50% of their assets and/or revenues outside the United States. The Fund focuses its investments on developed foreign countries, but may invest up to 25% of its total assets in emerging markets. It normally will have substantial investments in European countries. The Fund
72
also expects to purchase American Depositary Receipts (ADRs) and Global Depositary Receipts in bearer form, which are designed for use in non-U.S. securities markets.
Sentinel employs a fundamental, bottom up approach to building its international equity portfolio. The process starts with a regular quantitative screening in order to narrow the investable universe. Stocks are then analyzed based on the following five fundamental factors: business quality, valuation, growth, management, and balance sheet strength. Risk is managed through portfolio diversification, by individual issuer, sector and country.
The Target Fund generally may sell a security when there is a deterioration of one or more of the five factors described above or when the portfolio manager identifies a more favorable investment opportunity. The Fund may also sell a security to meet redemptions or for tax management purposes.
Acquiring Fund. The Acquiring Fund normally invests at least 80% of its assets in equity securities. The Fund invests primarily in common stocks of established companies located in or that conduct their business mainly in one or more foreign countries, which may include emerging markets. The Fund will normally be invested in ten or more foreign countries and may invest up to 40% of its assets in any one country if the Fund’s sub-advisor feels that economic and business conditions make it appropriate to do so. The Fund focuses its investments on developed foreign countries, but may invest up to 25% of its total assets in emerging markets. It normally will have substantial investments in European countries. Normally, at least 75% of the Fund’s total assets are invested in securities of non-U.S. issuers selected by the sub-advisor mainly for their long-term capital growth prospects. The remaining 25% may be invested in companies organized in the United States that have at least 50% of their assets and/or revenues outside the United States. The Fund also expects to purchase American Depositary Receipts (“ADRs”) and Global Depositary Receipts (“GDRs”) in bearer form, which are designed for use in non-U.S. securities markets.
The Acquiring Fund also may invest in convertible or debt securities rated Baa or higher by Moody’s Investors Service, Inc. or BBB or higher by Standard & Poor’s.
The Acquiring Fund’s sub-advisor employs a fundamental, bottom up approach to building its international equity portfolio. The process starts with a regular quantitative screening in order to narrow the investable universe. Stocks are then analyzed based on the following five fundamental factors: business quality, valuation, growth, management, and balance sheet strength. Risk is managed through portfolio diversification, by individual issuer, sector and country.
The Acquiring Fund generally may sell a security when there is a deterioration of one or more of the five factors described above or when the portfolio manager identifies a more favorable investment opportunity. The Fund may also sell a security to meet redemptions or for tax management purposes.
How do the principal risks of investing in the Funds compare?
An investment in each Fund is subject to equity securities (stock market) risk, foreign securities risk including emerging markets risk and sector risk. For more information on the Funds’ principal risks, see “Comparison of Principal Risks.”
Who will be the Advisor, Sub-Advisor and Portfolio Managers of my Fund after the Reorganization?
Sentinel is the investment advisor to Sentinel International Equity Fund. The portfolio manager of Sentinel International Equity Fund is Andrew Boczek.
After the Reorganization, Touchstone Advisors will serve as the investment advisor and Fort Washington will serve as the sub-advisor to Touchstone International Equity Fund. Mr. Boczek is expected to continue as the portfolio manager of the Fund as an employee of Fort Washington. For additional information regarding the advisor, sub-advisor and portfolio managers listed above, please see the section entitled “The Funds’ Management—Investment Advisor” and “The Funds’ Management—Sub-Advisors and Portfolio Managers.”
73
What are the portfolio turnover rates of the Funds?
A Fund pays transaction costs, such as brokerage commissions, when it buys and sells securities (or “turns over” its portfolio). A higher portfolio turnover rate may indicate higher transaction costs and may result in higher taxes when Fund shares are held in a taxable account. These costs, which are not reflected in annual fund operating expenses or in the example, affect a Fund’s performance. During the fiscal year ended November 30, 2016, the Target Fund’s portfolio turnover rate was 36% of the average value of its portfolio. The Acquiring Fund will not commence operations until the consummation of the Reorganization but is expected to have a similar portfolio turnover rate in light of the continuity of portfolio management.
Will there be any repositioning of the portfolio after the Reorganization?
In light of the continuity of portfolio management, there is not expected to be any material repositioning of the Fund’s portfolio after the Reorganization (less than 5% of the assets of the Fund). In addition, the Target Fund before the Reorganization and the Acquiring Fund after the Reorganization may buy and sell portfolio securities in the ordinary course consistent with their respective investment strategies.
74
Synopsis: Reorganization of Sentinel Small Company Fund into Touchstone Small Company Fund
What class of shares of the Acquiring Fund will I receive in the Reorganization?
Shareholders of the Sentinel Small Company Fund will receive shares of Touchstone Small Company Fund, as follows:
| Sentinel Small Company Fund | | Touchstone Small Company Fund |
| | | |
| Class A | | Class A |
| Class C | | Class C |
| Class I | | Class Y |
| Class R6 | | Class R6 |
How do the fees and expenses of the Target Fund and the Acquiring Fund compare?
The tables below describe the fees and expenses that you pay if you buy and hold shares of Sentinel Small Company Fund and the pro forma fees and expenses that you may pay if you buy and hold shares of the corresponding Touchstone Small Company Fund after giving effect to the Reorganization. The pro forma expense ratios project anticipated expenses, but actual expenses may be greater or less than those shown. Expenses for the Class A, Class C, Class I and Class R6 shares of the Sentinel Small Company Fund are based on the operating expenses incurred by each class of shares of the Fund as of the fiscal year ended November 30, 2016. The pro forma fees and expenses for the Class A, Class C, Class Y and Class R6 shares of the Touchstone Small Company Fund are estimated based on the assets of the Sentinel Fund as of November 30, 2016
No sales charge will be imposed on the Class A shares of the Acquiring Fund received in connection with the Reorganization. In addition, you may qualify for sales charge discounts for Class A shares if you and your family invest, or agree to invest in the future, at least $25,000 or more in the Sentinel Funds or $50,000 or more in the Touchstone Funds. For the Target Fund, more information about these and other discounts is available from your financial professional and in the section entitled “Share Classes” on page 82 of the Target Fund’s prospectus and “How to Purchase Shares and Reduce Sales Charges” on page 44 of the Target Fund’s SAI. For the Acquiring Fund, more information about these and other discounts is available from your financial professional and in the section entitled “Investing with Touchstone—Class A Shares—Letter of Intent” on page [•] of this Joint Proxy Statement/Prospectus and in the Acquiring Fund’s SAI on page [•].
SHAREHOLDER FEES
(fees paid directly from your investment)
| | | Maximum
Sales Charge
(load)
Imposed on
Purchases (as
a percentage
of offering
price) | | Maximum
Deferred
Sales Charge
(load) (as a
percentage of
the lower of
original
purchase
price or
redemption
proceeds) | | Wire
Redemption
Fee |
| | | | | | | | | | | |
| Sentinel Small Company Fund – Class A | | | 5.00 | % | | | None | | | None |
| Touchstone Small Company Fund – Class A Pro Forma | | | 5.75 | %(1)(2) | | | None | (2) | | up to $15 |
| | | | | | | | | | | |
| Sentinel Small Company Fund – Class C | | | None | | | | 1.00 | %(2) | | None |
75
| | | Maximum
Sales Charge
(load)
Imposed on
Purchases (as
a percentage
of offering
price) | | Maximum
Deferred
Sales Charge
(load) (as a
percentage of
the lower of
original
purchase
price or
redemption
proceeds) | | Wire
Redemption
Fee |
| | | | | | | | | | | |
| Touchstone Small Company Fund – Class C Pro Forma | | | None | | | | 1.00 | %(2) | | up to $15 |
| | | | | | | | | | | |
| Sentinel Small Company Fund – Class I | | | None | | | | None | | | None |
| Touchstone Small Company Fund – Class Y Pro Forma | | | None | | | | None | | | up to $15 |
| | | | | | | | | | | |
| Sentinel Small Company Fund – Class R6 | | | None | | | | None | | | None |
| Touchstone Small Company Fund – Class R6 Pro Forma | | | None | | | | None | | | up to $15 |
| (1) | No sales charge will be imposed on the Class A shares of the Acquiring Fund received in connection with the Reorganization. |
| (2) | A deferred sales charge of 1% applies to certain redemptions of Class A shares made within twelve months of purchase if the shares were purchased without an initial sales charge as part of an investment of $1 million or more. If you hold load-waived Class A shares or Class C shares of the Target Fund, the Acquiring Fund will look to the date of purchase of your Target Fund shares for purposes of assessing deferred sales charges on shares received in the Reorganization. |
ANNUAL FUND OPERATING EXPENSES
(expenses that you pay each year as a percentage of the value of your investment)
| | | Sentinel Small
Company Fund
(Class A) | | Touchstone Small
Company Fund
Pro Forma
(Class A) |
| Management Fees | | | 0.67 | % | | | 0.67 | % |
| Distribution/Service (12b-1) Fees | | | 0.25 | %(1) | | | 0.25 | % |
| Other Expenses | | | 0.30 | % | | | 0.37 | %(2) |
| Acquired Fund Fees and Expenses(3) | | | 0.01 | % | | | 0.01 | %(2) |
| Total Annual Fund Operating Expenses | | | 1.23 | % | | | 1.30 | % |
| Fee Waiver | | | None | | | | (0.07 | %)(4) |
| Total Annual Fund Operating Expenses After Fee Waiver | | | 1.23 | % | | | 1.23 | % |
ANNUAL FUND OPERATING EXPENSES
(expenses that you pay each year as a percentage of the value of your investment)
| | | Sentinel Small
Company Fund
(Class C) | | Touchstone Small
Company Fund
Pro Forma
(Class C) |
| Management Fees | | | 0.67 | % | | | 0.67 | % |
| Distribution/Service (12b-1) Fees | | | 1.00 | % | | | 1.00 | % |
| Other Expenses | | | 0.28 | % | | | 0.35 | %(2) |
| Acquired Fund Fees and Expenses(3) | | | 0.01 | % | | | 0.01 | %(2) |
| Total Annual Fund Operating Expenses | | | 1.96 | % | | | 2.03 | % |
| Fee Waiver | | | None | | | | (0.07 | %)(4) |
| Total Annual Fund Operating Expenses After Fee Waiver | | | 1.96 | % | | | 1.96 | % |
76
ANNUAL FUND OPERATING EXPENSES
(expenses that you pay each year as a percentage of the value of your investment)
| | | Sentinel Small
Company Fund
(Class I) | | Touchstone Small
Company Fund
Pro Forma
(Class Y) |
| Management Fees | | | 0.67 | % | | | 0.67 | % |
| Distribution/Service (12b-1) Fees | | | None | | | | None | |
| Other Expenses | | | 0.22 | % | | | 0.29 | %(2) |
| Acquired Fund Fees and Expenses (3) | | | 0.01 | % | | | 0.01 | %(2) |
| Total Annual Fund Operating Expenses | | | 0.90 | % | | | 0.97 | % |
| Fee Waiver | | | — | (5) | | | (0.07 | %)(4) |
| Total Annual Fund Operating Expenses After Fee Waiver | | | 0.90 | % | | | 0.90 | % |
ANNUAL FUND OPERATING EXPENSES
(expenses that you pay each year as a percentage of the value of your investment)
| | | Sentinel Small
Company Fund
(Class R6) | | Touchstone Small
Company Fund
Pro Forma
(Class R6) |
| Management Fees | | | 0.67 | % | | | 0.67 | % |
| Distribution/Service (12b-1) Fees | | | None | | | | None | |
| Other Expenses | | | 0.32 | % | | | 0.49 | %(2) |
| Acquired Fund Fees and Expenses(3) | | | 0.01 | % | | | 0.01 | %(2) |
| Total Annual Fund Operating Expenses | | | 1.00 | % | | | 1.17 | % |
| Fee Waiver | | | (0.26 | %)(6) | | | (0.43 | %)(4) |
| Total Annual Fund Operating Expenses After Fee Waiver | | | 0.74 | % | | | 0.74 | % |
| (1) | Rule 12b-1 fees have been restated from actual fiscal year amounts to reflect the maximum fee payable under the applicable distribution plan for such share class. |
| (2) | Other Expenses and Acquired Fund Fees and Expenses are estimated based on fees and expenses of the Acquiring Fund, assuming the Reorganization had been consummated as of the beginning of the 12-month period ended November 30, 2016. |
| (3) | Acquired Fund Fees and Expenses are expenses indirectly incurred by the Fund through its investments in one or more underlying funds, including money market funds. Because these costs are indirect, the Total Annual Fund Operating Expenses do not correlate to the ratio of expenses to average net assets in the Fund’s most recent annual report. |
| (4) | Effective upon consummation of the Reorganization, Touchstone Advisors has contractually agreed to waive fees and/or reimburse certain expenses as necessary to limit total annual fund operating expenses (excluding dividend and interest expenses relating to short sales, interest, taxes, brokerage commissions and other transaction costs, portfolio transactions and investment related expenses, other expenditures which are capitalized in accordance with U.S. generally accepted accounting principles, the cost of “Acquired Fund Fees and Expenses,” if any, and other extraordinary expenses not incurred in the ordinary course of business) such that the total operating expense ratio of each class of shares of the Acquiring Fund offered hereby, on an annualized basis, does not exceed the total operating expenses of the corresponding class of shares of the Target Fund (net of fee waivers of the Target Fund) for the fiscal year ending November 30, 2016. The agreement will remain in effect for at least two years following the closing of the Reorganization. Additional information regarding the expense limit is provided under the section entitled “The Funds’ Management—Expense Limitation Agreement.” |
77
| (5) | Sentinel has contractually agreed to reimburse certain expenses paid by the Class I shares of the Target Funds to the extent necessary to prevent the total annual fund operating expense ratio of the Class I shares of the Target Funds, on an annualized basis, from exceeding the total annual fund operating expense ratio of the Class A shares of the same Fund. This agreement will continue through March 31, 2018. This agreement may be terminated upon 90 days’ notice by a majority of the non-interested directors of the Sentinel Funds. Additional information regarding the expense limit is provided under the section entitled “The Funds’ Management—Expense Limitation Agreement.” |
| (6) | Sentinel has contractually agreed to waive fees and/or reimburse certain expenses in order to limit Total Annual Fund Operating Expenses After Fee Waiver and/or Expense Reimbursement for Class R6 shares of the Small Company Fund, on an annualized basis, to 0.73% of average daily net assets attributable to Class R6 shares through March 31, 2018. This agreement may be terminated upon 90 days’ notice by a majority of the non-interested directors of Sentinel Funds. Additional information regarding the expense limit is provided under the section entitled “The Funds’ Management—Expense Limitation Agreement.” |
Expense Examples. The examples below are intended to help you compare the cost of investing in the Target Fund with the pro forma cost of investing in the Acquiring Fund. The examples assume that you invest $10,000 in each Fund and then either (i) sell all of your shares at the end of each period indicated below or (ii) keep all of your shares at the end of each period indicated below. The examples also assume that your investment has a 5% annual return and that operating expenses (before fee waivers and expense reimbursements) remain the same. This example also assumes that the expense limitation agreement for the Sentinel Small Company Fund—Class R6 will remain in place for one year and the expense limitation agreement (if applicable) for the Acquiring Fund will be in place for two years following the closing of the Reorganization. Although your actual costs may be higher or lower, based on these assumptions, your costs would be:
| If shares are redeemed: | | 1 Year | | | 3 Years | | | 5 Years | | | 10 Years | |
| Class A Shares | | | | | | | | | | | | | | | | |
| Sentinel Small Company Fund | | | $619 | | | | $871 | | | | $1,142 | | | | $1,914 | |
| Touchstone Small Company Fund Pro Forma | | | $693 | | | | $950 | | | | $1,234 | | | | $2,041 | |
| Class C Shares | | | | | | | | | | | | | | | | |
| Sentinel Small Company Fund | | | $299 | | | | $615 | | | | $1,057 | | | | $2,285 | |
| Touchstone Small Company Fund Pro Forma | | | $299 | | | | $623 | | | | $1,080 | | | | $2,347 | |
| Class I Shares/Class Y Shares | | | | | | | | | | | | | | | | |
| Sentinel Small Company Fund | | | $92 | | | | $287 | | | | $498 | | | | $1,108 | |
| Touchstone Small Company Fund Pro Forma | | | $92 | | | | $295 | | | | $522 | | | | $1,177 | |
| Class R6 Shares | | | | | | | | | | | | | | | | |
| Sentinel Small Company Fund | | | $76 | | | | $293 | | | | $527 | | | | $1,201 | |
| Touchstone Small Company Fund Pro Forma | | | $76 | | | | $284 | | | | $558 | | | | $1,341 | |
| | | | | | | | | | | | | | | | | |
| If shares are not redeemed:(1) | | 1 Year | | | 3 Years | | | 5 Years | | | 10 Years | |
| Class C Shares | | | | | | | | | | | | | | | | |
| Sentinel Small Company Fund | | | $199 | | | | $615 | | | | $1,057 | | | | $2,285 | |
| Touchstone Small Company Fund Pro Forma | | | $199 | | | | $623 | | | | $1,080 | | | | $2,347 | |
| (1) | For holders of all other classes, the costs are the same as set forth above. |
How do the performance records of the Target Funds and the Acquiring Fund compare?
The Acquiring Fund has no performance history and will adopt the performance history of the Target Fund. The bar charts and the performance tables below provide some indication of the risks of an investment in the Acquiring Fund by showing how the Target Fund’s performance has varied from year to year and by showing how each Target Fund’s average annual returns compare with a broad measure of market performance. The Target Fund’s past performance, before and after taxes, does not necessarily represent how the corresponding Acquiring Fund will perform in the future. Updated performance information for the Target Fund is available on the Target Fund’s website at www.sentinelinvestments.com or by calling 800.282.3863.
78
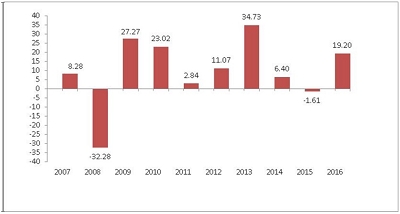
| Best Quarter: Third Quarter, 2009 15.93% | Worst Quarter: Fourth Quarter, 2008 (24.08%) |
The Sentinel Small Company Fund’s calendar year-to-date total return for Class A shares as of March 31, 2017 was 4.33%.
Average Annual Total Returns
For the Periods Ended December 31, 2016
| Sentinel Small Company Fund | | Inception
Date | | 1 Year | | 5 Years | | 10 Years |
| | | | | | | | | |
| Class A (return before taxes) | | 03/01/1993 | | | 13.30 | % | | | 12.16 | % | | | 7.67 | % |
| Class A (return after taxes on distributions) | | 03/01/1993 | | | 11.16 | % | | | 7.57 | % | | | 5.12 | % |
| Class A (return after taxes on distributions and sale of fund shares) | | 03/01/1993 | | | 9.32 | % | | | 9.21 | % | | | 5.95 | % |
| Class C (return before taxes) | | 07/09/2001 | | | 17.51 | % | | | 12.51 | % | | | 7.40 | % |
| Class I (return before taxes) | | 05/04/2007 | | | 19.68 | % | | | 13.69 | % | | | 8.64 | % |
| Class R6 (return before taxes) | | 12/23/2014 | | | 19.74 | % | | | 13.53 | % | | | 8.34 | % |
| Russell 2000® Index(1) (reflects no deduction for fees, expenses or taxes) | | N/A | | | 21.31 | % | | | 14.46 | % | | | 7.07 | % |
| (1) | The Russell 2000® Index measures the performance of 2000 small-cap companies within the U.S. equity universe. |
Performance of the Class A shares prior to June 30, 2012, has not been adjusted to reflect the decrease in the maximum 12b-1 fee from 0.30% to 0.25%. If it had, those returns would be higher. Performance of the Class I shares prior to August 27, 2007 (the inception date for the Class I shares) is based on the Fund’s Class A share performance, restated to reflect that Class I shares are offered without a sales charge. After-tax returns are calculated using the historical highest individual federal marginal income tax rates and do not reflect the impact of state and local taxes. Actual after-tax returns depend on an investor’s tax situation and may differ from those shown. The return after taxes on distributions and sale of Fund shares may exceed the return before taxes due to an assumed tax benefit from any losses on a sale of Fund shares at the end of the measurement period. If you hold your Fund shares through a tax-advantaged arrangement, such as an individual retirement account or a 401(k) plan, the after-tax returns do not apply to your situation.
How do the investment goals and principal investment strategies of the Funds compare?
The investment goals and principal investment strategies of the Sentinel Small Company Fund and the Touchstone Small Company Fund, along with descriptions of certain differences between the Funds’ investment goals and principal investment strategies, are set forth in the table below.
79
| | | Sentinel Small
Company Fund | | Touchstone Small
Company Fund | | Differences |
| | | | | | | |
| Investment Goal(s): | | The Fund seeks growth of capital. | | The Fund seeks growth of capital. | | — |
| | | | | | | |
| Principal Investment Strategy: | | The Fund normally invests at least 80% of its net assets in small-capitalization companies. For this purpose, small capitalization companies are companies that have, at the time of purchase, market capitalizations of less than $4 billion at the time of purchase.
At times the Fund may have less than 80% of its investments in companies with a market cap of less than $4 billion due to market appreciation. | | The Fund normally invests at least 80% of its net assets in small-capitalization companies. For this purpose, small capitalization companies are companies that have, at the time of purchase, market capitalizations of less than $4 billion at the time of purchase.
At times the Fund may have less than 80% of its investments in companies with a market cap of less than $4 billion due to market appreciation. | | — |
| | | | | | | |
| Non-U.S. Investments: | | The Fund may invest without limitation in foreign securities, although only where the securities are trading in the U.S. or Canada and only where trading is denominated in U.S. or Canadian dollars. | | The Fund may invest without limitation in foreign securities, although only where the securities are trading in the U.S. or Canada and only where trading is denominated in U.S. or Canadian dollars. | | — |
| | | | | | | |
| Sector or Industry Focus: | | Up to 25% of the Fund’s assets may be invested in securities within a single industry. The Fund attempts to be well-balanced across major economic sectors. Although the Fund may invest in any economic sector, at times it may emphasize one or more particular sectors. | | Up to 25% of the Fund’s assets may be invested in securities within a single industry. The Fund attempts to be well-balanced across major economic sectors. Although the Fund may invest in any economic sector, at times it may emphasize one or more particular sectors. | | — |
Additional Information About the Funds’ Principal Investment Strategies
Target Fund. The Target Fund seeks to invest primarily in common stocks of small companies that Sentinel believes are high quality, have superior business models, solid management teams, sustainable growth potential and are attractively valued. The Fund would typically sell a security if the portfolio managers believe it is overvalued, if the original investment premise is no longer true, if the holding size exceeds the portfolio managers’ company or sector weighting guidelines and/or to take advantage of a more attractive investment opportunity. The Fund may also sell a partial position in a security in order to manage the size of the position. A security may also be sold to meet redemptions.
Acquiring Fund. The Fund seeks to invest primarily in common stocks of small companies that the sub-advisor believes are high quality, have superior business models, solid management teams, sustainable growth
80
potential and are attractively valued. The Fund may invest without limitation in foreign securities, although only where the securities are trading in the U.S. or Canada and only where trading is denominated in U.S. or Canadian dollars.
Up to 25% of the Acquiring Fund’s assets may be invested in securities within a single industry. The Fund attempts to be well-balanced across major economic sectors. Although the Fund may invest in any economic sector, at times it may emphasize one or more particular sectors.
At times the Acquiring Fund may have less than 80% of its investments in companies with a market cap of less than $4 billion due to market appreciation.
The Acquiring Fund would typically sell a security if the portfolio managers believe it is overvalued, if the original investment premise is no longer true, if the holding size exceeds the portfolio managers’ company or sector weighting guidelines and/or to take advantage of a more attractive investment opportunity. The Fund may also sell a partial position in a security in order to manage the size of the position. A security may also be sold to meet redemptions.
How do the principal risks of investing in the Funds compare?
An investment in each Fund is subject to equity securities (stock market) risk including small cap risk, foreign securities risk and sector risk. An investment in the Sentinel Small Company Fund is also subject to illiquid securities risk and investment style risk. An investment in the Touchstone Small Company Fund is also subject to management risk. For more information on the Funds’ principal risks, see “Comparison of Principal Risks.”
Who will be the Advisor, Sub-Advisor and Portfolio Managers of my Fund after the Reorganization?
Sentinel is the investment advisor to Sentinel Small Company Fund. The portfolio manager of Sentinel Small Company Fund is Jason Ronovech.
After the Reorganization, Touchstone Advisors will serve as the investment advisor and Fort Washington will serve as the sub-advisor to Touchstone Small Company Fund. Mr. Ronovech is expected to remain as the portfolio manager of the Fund as an employee of Fort Washington. For additional information regarding the advisor, sub-advisor and portfolio managers listed above, please see the section entitled “The Funds’ Management—Investment Advisor” and “The Funds’ Management—Sub-Advisors and Portfolio Managers.”
What are the portfolio turnover rate of the Funds?
A Fund pays transaction costs, such as brokerage commissions, when it buys and sells securities (or “turns over” its portfolio). A higher portfolio turnover rate may indicate higher transaction costs and may result in higher taxes when Fund shares are held in a taxable account. These costs, which are not reflected in annual fund operating expenses or in the example, affect a Fund’s performance. During the fiscal year ended November 30, 2016, the Target Fund’s portfolio turnover rate was 61% of the average value of its portfolio. The Acquiring Fund will not commence operations until the consummation of the Reorganization, but its portfolio turnover rate is expected to be similar to the Target Fund in light of the continuity of portfolio management.
Will there be any repositioning of the portfolio after the Reorganization?
In light of the continuity of portfolio management, there is not expected to be any material repositioning of the Fund’s portfolio after the Reorganization (less than 5% of the assets of the Fund). In addition, the Target Fund before the Reorganization and the Acquiring Fund after the Reorganization may buy and sell portfolio securities in the ordinary course consistent with their respective investment strategies.
81
Comparison of Principal Risks
Each Target Fund and corresponding Acquiring Fund have similar, but not identical principal risks. The principal risks applicable to each Fund are summarized below. The Sentinel Funds and Touchstone Funds are separate fund complexes with different historical disclosure practices. Accordingly, certain differences between the Target Funds and Acquiring Funds are attributable primarily to differing historical practices.
| Principal Risk | Sentinel Government Securities | Touchstone Active Bond | Sentinel Total Return Bond | Touchstone Active Bond | Sentinel Low Duration Bond | Touchstone Ultra Short Duration Fixed Income | Sentinel Multi Asset Income | Touchstone Flexible Income | Sentinel Sustainable Core Opportunities | Touchstone Sustainability and Impact Equity | Sentinel Balanced | Touchstone Balanced | Sentinel Common Stock | Touchstone Large Cap Focused | Sentinel International Equity | Touchstone International Equity | Sentinel Small Company | Touchstone Small Company |
| Asset Allocation Risk | | | | | | | ü | | | | ü | | | | | | | |
| Convertible Securities Risk | | | | | | | | ü | | ü | | | | | | | | |
| Derivatives Risk | ü | ü | ü | ü | ü | | ü | ü | | | ü | ü | | | | | | |
| • Forward Currency Exchange Contract Risk | | ü | | ü | | | | ü | | | | | | | | | | |
| • Futures Contract Risk | | ü | | ü | | | | ü | | | | ü | | | | | | |
| • Options Risk | | ü | | ü | | | | ü | | | | ü | | | | | | |
| • Swap Agreements Risk | | ü | | ü | | | | ü | | | | ü | | | | | | |
| Equity Securities (Stock Market) Risk | | | | | | | ü | ü | ü | ü | ü | ü | ü | ü | ü | ü | ü | ü |
| • Large Cap Risk | | | | | | | | ü | | ü | | ü | | ü | | | | |
| • Mid Cap Risk | | | | | | | | ü | | ü | | | | | | | | |
| • Preferred Stock Risk | | | | | | | ü | ü | | ü | | | | | | | | |
| • Real Estate Investment Trust Risk | | | | | | | ü | ü | | | | | | | | | | |
| • Small Cap Risk | | | | | | | | ü | | ü | | | | | | | ü | ü |
| Fixed-Income Securities Risk | ü | ü | ü | ü | ü | ü | ü | ü | | | ü | ü | | | | | | |
| • Asset-Backed Securities Risk | | ü | | ü | | ü | | ü | | | | | | | | | | |
| Bank Loan Risk | | | | | ü | | | | | | | | | | | | | |
| • Corporate Loan/Bank Loan Risk | | | | | ü | | | | | | | ü | | | | | | |
| Principal Risk | Sentinel Government Securities | Touchstone Active Bond | Sentinel Total Return Bond | Touchstone Active Bond | Sentinel Low Duration Bond | Touchstone Ultra Short Duration Fixed Income | Sentinel Multi Asset Income | Touchstone Flexible Income | Sentinel Sustainable Core Opportunities | Touchstone Sustainability and Impact Equity | Sentinel Balanced | Touchstone Balanced | Sentinel Common Stock | Touchstone Large Cap Focused | Sentinel International Equity | Touchstone International Equity | Sentinel Small Company | Touchstone Small Company |
| • Credit Risk | | ü | | ü | | ü | | ü | | | | ü | | | | | | |
| • Distressed Securities Risk | | | | | | | | | | | | ü | | | | | | |
| • Government (including U.S. Government Agency) Securities Risk | ü | ü | ü | ü | ü | ü | | ü | | | | ü | | | | | | |
| • Interest Rate Risk | ü | ü | ü | ü | ü | ü | ü | ü | | | ü | ü | | | | | | |
| • Investment-Grade Debt Securities Risk | ü | ü | ü | ü | ü | ü | ü | ü | | | | | | | | | | |
| • Mortgage-Backed Securities Risk | ü | ü | ü | ü | ü | ü | ü | ü | | | ü | ü | | | | | | |
| • Municipal Securities Risk | | | ü | | ü | ü | | | | | | | | | | | | |
| • Non-Investment-Grade Debt Securities Risk | | ü | ü | ü | ü | | ü | ü | | | ü | ü | | | | | | |
| • Prepayment Risk | | | | | | ü | | | | | | | | | | | | |
| Foreign Securities Risk | | ü | ü | | ü | ü | | ü | ü | ü | ü | ü | ü | ü | ü | ü | ü | ü |
| • Depositary Receipts Risk | | | ü | | ü | | | | ü | ü | ü | ü | ü | ü | ü | ü | | |
| • Emerging Markets Risk | | ü | | | | | | | | ü | | ü | | ü | ü | ü | | |
| • Frontier Markets Risk | | | | | | | | | | ü | | | | | | | | |
| • Sovereign Debt Risk | | ü | | | | | | | | | | | | | | | | |
| Illiquid Securities Risk | | | | | | | | | | | | | | | | | ü | |
| Income Risk | | | | | | | ü | | | | | | | | | | | |
| Inflation-Linked Investments Risk | | | | | ü | | | | | | | | | | | | | |
| Investment Style Risk | | | | | | | | | ü | | ü | | ü | | ü | | ü | |
| Leverage Risk | | ü | | ü | | | | | | | | ü | | | | | | |
| Principal Risk | Sentinel Government Securities | Touchstone Active Bond | Sentinel Total Return Bond | Touchstone Active Bond | Sentinel Low Duration Bond | Touchstone Ultra Short Duration Fixed Income | Sentinel Multi Asset Income | Touchstone Flexible Income | Sentinel Sustainable Core Opportunities | Touchstone Sustainability and Impact Equity | Sentinel Balanced | Touchstone Balanced | Sentinel Common Stock | Touchstone Large Cap Focused | Sentinel International Equity | Touchstone International Equity | Sentinel Small Company | Touchstone Small Company |
| Management Risk | | ü | | ü | | ü | | ü | | ü | | ü | | ü | | ü | | ü |
| Mortgage Dollar Roll Risk | | ü | | ü | | | | | | | | | | | | | | |
| Non-Diversification Risk | | | | | | | | | | | | | | ü | | | | |
| Other Investment Companies and ETFs Risk | | | ü | | ü | | ü | ü | | ü | ü | | | | | | | |
| Portfolio Turnover Risk | ü | ü | ü | ü | ü | ü | ü | ü | | | ü | ü | | | | | | |
| Repurchase Agreement Risk | | | | | | ü | | | | | | | | | | | | |
| Sector Risk | | | | | | | ü | | ü | | ü | ü | ü | ü | ü | ü | ü | ü |
| Short Sales Risk | ü | | ü | | ü | | ü | | | | ü | | | | | | | |
| Sustainable/Responsible Investing Risk | | | | | | | | | ü | ü | | | | | | | | |
| To-Be-Announced (“TBA”) Securities Risk | ü | | ü | | ü | | ü | | | | ü | | | | | | | |
| Utilities Industry Risk | | | | | | | ü | | | | | | | | | | | |
Asset Allocation Risk: The Fund attempts to identify investment allocations that will provide consistent, quality performance for the Fund, but there is no guarantee that the allocations will produce the desired results. It is possible that the managers will focus on an asset class that performs poorly or underperforms other investments under various market conditions.
Convertible Securities Risk: Convertible securities are subject to the risks of both debt securities and equity securities. The values of convertible securities tend to decline as interest rates rise and, due to the conversion feature, tend to vary with fluctuations in the market value of the underlying security.
Derivatives Risk: In general terms, a derivative instrument is one whose value depends on (or is derived from) the value of an underlying asset, interest rate or index. The use of derivatives may expose the Fund to additional risks that it would not be subject to if it invested directly in the securities underlying those derivatives. Risks associated with derivatives may include correlation risk, which is the risk that the derivative does not correlate well with the security, index, or currency to which it relates. Other risks include liquidity risk, which is the risk that the Fund may be unable to sell or close out the derivative due to an illiquid market, counterparty risk, which is the risk that the counterparty to a derivative instrument may be unwilling or unable to make required payments or
otherwise meet its obligations, and leverage risk, which is the risk that a derivative could expose the Fund to magnified losses resulting from leverage. The use of derivatives for hedging purposes may result in losses that partially or completely offset gains in portfolio positions. Using derivatives can increase the volatility of the Fund’s share price. For some derivatives, it is possible for the Fund to lose more than the amount invested in the derivative instrument. Derivatives may, for federal income tax purposes, affect the character of gain and loss realized by the Fund, accelerate recognition of income to the Fund, affect the holding periods for certain of the Fund’s assets and defer recognition of certain of the Fund’s losses. The Fund’s ability to invest in derivatives may be restricted by certain provisions of the federal income tax laws relating to the Fund’s qualification as a regulated investment company (“RIC”). These additional risks could cause the Fund to experience losses to which it would otherwise not be subject.
| · | Forward Currency Exchange Contract Risk: A forward foreign currency exchange contract is an agreement to buy or sell a specific currency at a future date and at a price set at the time of the contract. Forward foreign currency exchange contracts may reduce the risk of loss from a change in value of a currency, but they also limit any potential gains and do not protect against fluctuations in the value of the underlying position and are subject to counterparty risk. The forecasting of currency market movement is extremely difficult, and whether any hedging strategy will be successful is highly uncertain. Moreover, it is impossible to forecast with precision the market value of portfolio securities at the expiration of a forward foreign currency contract. Accordingly, the Fund may be required to buy or sell additional currency on the spot market (and bear the expense of such transaction) if the sub-advisor’s predictions regarding the movement of foreign currency or securities markets prove inaccurate. Because foreign currency forward contracts are privately negotiated transactions, there can be no assurance that the Fund will have flexibility to rollover a forward foreign currency contract upon its expiration if it desires to do so. Additionally, there can be no assurance that the other party to the contract will perform its services under the contract. |
| · | Futures Contracts Risk: Futures contracts provide for the future sale by one party and purchase by another party of a specified amount of a specific security at a specified future time and at a specified price. An option on a futures contract gives the purchaser the right, in exchange for a premium, to assume a position in a futures contract at a specified exercise price during the term of the option. There are risks associated with these activities, including the following: (1) the success of a hedging strategy may depend on an ability to predict movements in the prices of individual securities, fluctuations in markets and movements in interest rates; (2) there may be an imperfect or no correlation between the changes in market value of the securities held by the Fund and the prices of futures and options on futures; (3) there may not be a liquid secondary market for a futures contract or option; (4) trading restrictions or limitations may be imposed by an exchange; and (5) government regulations may restrict trading in futures contracts and futures options. |
| · | Options Risk: Options trading is a highly specialized activity that involves investment techniques and risks different from those associated with ordinary portfolio securities transactions. The value of options can be highly volatile, and their use can result in loss if the sub-advisor is incorrect in its expectation of price fluctuations. The successful use of options for hedging purposes also depends in part on the ability of the sub-advisor to predict future price fluctuations and the degree of correlation between the options and securities markets. When options are purchased over the counter, the Fund bears counterparty risk, which is the risk that the counterparty that wrote the option will be unable or unwilling to perform its obligations under the option contract. Such options may also be illiquid, and in such cases, the Fund may have difficulty closing out its position. |
| · | Swap Agreement Risk: Swap agreements (“swaps”) are individually negotiated and structured to include exposure to a variety of different types of investments or market factors, such as interest rates, foreign currency rates, mortgage securities, corporate borrowing rates, security prices, indexes or inflation rates. Swaps may increase or decrease the overall volatility of the investments of the Fund and its share price. The performance of swaps may be affected by a change in the specific interest rate, currency, or other factors that determine the amounts of payments due to and from the Fund. If a swap calls for payments by the Fund, the Fund must be prepared to make such payments when due. Additionally, if the counterparty’s creditworthiness declines, the value of a swap may decline. If the |
| | | counterparty is unable to meet its obligations under the contract, declares bankruptcy, defaults, or becomes insolvent, the Fund may not be able to recoup the money it expected to receive under the contract. Finally, a swap can be a form of leverage, which can magnify the Fund’s gains or losses. |
Equity Securities (Stock Market) Risk: The Fund is subject to the risk that stock prices will fall over short or extended periods of time. Individual companies may report poor results or be negatively affected by industry and/or economic trends and developments. The prices of securities issued by these companies may decline in response to such developments, which could result in a decline in the value of the Fund’s shares. These factors contribute to price volatility. In addition, common stocks represent a share of ownership in a company, and rank after bonds and preferred stock in their claim on the company’s assets in the event of liquidation.
| · | Large Cap Risk: The Fund is subject to the risk that stocks of larger companies may underperform relative to those of small- and mid-sized companies. Large-cap companies may be unable to respond quickly to new competitive challenges, such as changes in technology and consumer tastes, and also may not be able to attain the high growth rate of successful smaller companies, especially during extended periods of economic expansion. |
| · | Mid Cap Risk: The Fund is subject to the risk that medium capitalization stocks may underperform other types of stocks or the equity markets as a whole. Stocks of mid-sized companies may be subject to more abrupt or erratic market movements than stocks of larger, more established companies. Mid-sized companies may have limited product lines or financial resources, and may be dependent upon a particular niche of the market. |
| · | Preferred Stock Risk: Preferred stock represents an equity interest in an issuer that pays dividends at a specified rate and that has precedence over common stock in the payment of dividends. In the event an issuer is liquidated or declares bankruptcy, the claims of owners of bonds take precedence over the claims of those who own preferred and common stock. If interest rates rise, the fixed dividend on preferred stocks may be less attractive, causing the price of preferred stocks to decline. Preferred stock may have mandatory sinking fund provisions, as well as provisions allowing the stock to be called or redeemed prior to its maturity, both of which can have a negative impact on the stock’s price when interest rates decline. |
| · | Real Estate Investment Trust Risk: Real estate investment trusts (“REITs”) are pooled investment vehicles that primarily invest in commercial real estate or real estate-related loans. REITs are susceptible to the risks associated with direct ownership of real estate, such as declines in property values and rental rates, increases in property taxes, operating expenses, rising interest rates, competition, overbuilding, zoning changes, and losses from casualty or condemnation. REITs typically incur fees that are separate from those of the Fund. Accordingly, the Fund’s investments in REITs will result in the layering of expenses, such that shareholders will indirectly bear a proportionate share of the REITs’ operating expenses in addition to paying their share of the Fund’s fees and expenses. |
| · | Small-Cap Risk: The Fund is subject to the risk that small capitalization stocks may underperform other types of stocks or the equity markets as a whole. Stocks of smaller companies may be subject to more abrupt or erratic market movements than stocks of larger, more established companies. Small companies may have limited product lines or financial resources, or may be dependent upon a small or inexperienced management group. In addition, small-cap stocks typically are traded in lower volume, and their issuers typically are subject to greater degrees of changes in their earnings and prospects. |
Fixed-Income Securities Risk: The market value of fixed-income securities changes in response to fluctuations in interest rates and other factors. During periods of falling interest rates, the values of fixed-income securities generally rise and during periods of rising interest rates, the values of those securities generally fall. While securities with longer maturities tend to produce higher yields, the prices of longer maturity securities are also subject to greater market fluctuations as a result of changes in interest rates. Duration is a measure of the sensitivity of the security’s price to changes in interest rates. Generally, the longer the maturity or duration of the fixed-income securities the Fund owns, the more sensitive the Fund will be to changes in interest rates.
| · | Asset-Backed Securities Risk: Asset-backed securities are fixed-income securities backed by other assets such as credit card, automobile or consumer loan receivables, retail installment loans, or participations in pools of leases. Credit support for these securities may be based on the underlying assets and/or provided through credit enhancements by a third party. Even with a credit enhancement by a third party, there is still risk of loss. There could be inadequate collateral or no collateral for asset-backed securities. The values of these securities are sensitive to changes in the credit quality of the underlying collateral, the credit strength of any credit enhancement feature, changes in interest rates and, at times, the financial condition of the issuer. Some asset-backed securities also may receive prepayments that can change the securities’ effective durations. |
| · | Bank Loan Risk: The market for bank loans in which the Fund may invest may not be highly liquid and, in some cases, the Fund may have to dispose of such securities at a substantial discount from face value. These investments may expose the Fund to the credit risk of the underlying corporate borrower. When interest rates decline, borrowers may pay off bank loans more quickly than originally anticipated, and the Fund may have to invest the proceeds in securities with lower yields. |
| · | Corporate Loan Risk: The corporate loans in which the Fund invests will primarily be rated below investment grade. As a result, even though the corporate loans will typically be secured by a first or second priority lien on the borrower’s assets, such corporate loans will be considered speculative with respect to the borrowers’ ability to make payments of interest and principal and will otherwise generally bear risks similar to those associated with non-investment grade securities. There is a high risk that the Fund could suffer a loss from investments in lower rated corporate loans as a result of a default by the borrower. In addition, there can be no assurance that the liquidation of any collateral securing a corporate loan would satisfy the borrower’s obligation to the Fund in the event of non-payment of interest or principal, whether when due or upon acceleration, or that the collateral could be liquidated, readily or otherwise. In the event of the bankruptcy or insolvency of a borrower, the Fund could experience delays or limitations with respect to its ability to realize the benefits of the collateral, if any, securing a corporate loan, and the collateral securing a corporate loan, if any, may lose all or substantially all of its value in the event of the bankruptcy or insolvency of a borrower. Corporate loans are also subject to a number of risks described elsewhere in this Joint Proxy Statement/Prospectus, including credit risk, interest rate risk and liquidity risk. Each of these risks will be heightened with respect to corporate loans that are subordinated in payment or secured by a second or lower priority lien on the borrower’s assets. |
| · | Credit Risk: The fixed-income securities in the Fund’s portfolio are subject to the possibility that a deterioration, whether sudden or gradual, in the financial condition of an issuer, or a deterioration in general economic conditions, could cause an issuer to fail to make timely payments of principal or interest when due. This may cause the issuer’s securities to decline in value. Credit risk is particularly relevant to those portfolios that invest a significant amount of their assets in non-investment grade (or “junk”) bonds or lower-rated securities. |
| · | Distressed Securities Risk: Distressed securities are speculative and involve significant risks in addition to the risks generally applicable to non-investment grade debt securities. Distressed securities bear a substantial risk of default, and may be in default at the time of investment. The Fund will generally not receive interest payments on distressed securities, and there is a significant risk that principal will not be repaid, in full or at all. The Fund may incur costs to protect its investment in distressed securities, which may include seeking recovery from the issuer in bankruptcy. In any reorganization or liquidation proceeding relating to the issuer of distressed securities, the Fund may lose its entire investment or may be required to accept cash or securities with a value less than its original investment. Distressed securities, and any securities received in exchange for distressed securities, will likely be illiquid and may be subject to restrictions on resale. |
| · | Government (including U.S. Government Agency) Securities Risk: Certain U.S. government agency securities are backed by the right of the issuer to borrow from the U.S. Treasury while others are supported only by the credit of the issuer or instrumentality. While the U.S. government is able to provide financial support to U.S. government-sponsored agencies or instrumentalities, no assurance |
| | | can be given that it will always do so. Such securities are neither issued nor guaranteed by the U.S. Treasury. |
| · | Interest Rate Risk: As interest rates rise, the value of fixed-income securities the Fund owns will likely decrease. The price of debt securities is generally linked to prevailing market interest rates. In general, when interest rates rise, the prices of debt securities fall, and when interest rates fall, the prices of debt securities rise. The price volatility of a debt security also depends on its maturity. Longer-term securities are generally more volatile, so the longer the average maturity or duration of these securities, the greater their price risk. Duration is a measure of the expected life, taking into account any prepayment or call features, of a security that is used to determine the price sensitivity of the security for a given change in interest rates. Specifically, duration is the change in the value of a fixed-income security that will result from a 1% change in interest rates, and generally is stated in years. For example, as a general rule a 1% rise in interest rates means a 1% fall in value for every year of duration. Maturity, on the other hand, is the date on which a fixed-income security becomes due for payment of principal. There may be less governmental intervention in the securities markets in the near future. The negative impact on fixed-income securities if interest rates increase as a result could negatively impact the Fund’s net asset value. |
| · | Investment-Grade Debt Securities Risk: Investment-grade debt securities may be downgraded by a nationally recognized statistical rating organization (“NRSRO”) to below-investment-grade status, which would increase the risk of holding these securities. Investment-grade debt securities rated in the lowest rating category by a NRSRO involve a higher degree of risk than fixed-income securities with higher credit ratings. While such securities are considered investment-grade quality and are deemed to have adequate capacity for payment of principal and interest, such securities lack outstanding investment characteristics and may share certain speculative characteristics with non-investment-grade securities. |
| · | Mortgage-Backed Securities Risk: Mortgage-backed securities are fixed-income securities representing an interest in a pool of underlying mortgage loans. Mortgage-backed securities are sensitive to changes in interest rates, but may respond to these changes differently from other fixed-income securities due to the possibility of prepayment of the underlying mortgage loans. As a result, it may not be possible to determine in advance the actual maturity date or average life of a mortgage-backed security. Rising interest rates tend to discourage refinancing, with the result that the average life and volatility of the security will increase, exacerbating its decrease in market price. When interest rates fall, however, mortgage-backed securities may not gain as much in market value because of the expectation of additional mortgage prepayments that must be reinvested at lower interest rates. Prepayment risk may make it difficult to calculate the average duration of the Fund’s mortgage-backed securities and, therefore, to fully assess the interest rate risk of the Fund. An unexpectedly high rate of defaults on the mortgages held by a mortgage pool may adversely affect the value of mortgage- backed securities and could result in losses to the Fund. The risk of such defaults is generally higher in the cases of mortgage pools that include subprime mortgages. Subprime mortgages refer to loans made to borrowers with weakened credit histories or with lower capacity to make timely payments on their mortgages. In addition, mortgage-backed securities may fluctuate in price based on deterioration in the perceived or actual value of the collateral underlying the pool of mortgage loans, typically residential or commercial real estate, which may result in negative amortization or negative equity, meaning that the value of the collateral would be worth less than the remaining principal amount owed on the mortgages in the pool. |
| · | Non-Investment-Grade Debt Securities Risk: Non-investment-grade debt securities are sometimes referred to as “junk bonds” and are considered speculative with respect to their issuers’ ability to make payments of interest and principal. There is a high risk that the Fund could suffer a loss from investments in non-investment-grade debt securities caused by the default of an issuer of such securities. Part of the reason for this high risk is that non-investment grade debt securities are generally unsecured and therefore, in the event of a default or bankruptcy, holders of non-investment-grade debt securities generally will not receive payments until the holders of all other debt have been paid. In addition, the market for non-investment-grade debt securities has, in the past, had more |
| | | frequent and larger price changes than the markets for other securities. Changes in economic conditions or other circumstances are more likely to lead to a weakened capacity to make principal and interest payments than is the case with higher-grade securities. Non-investment-grade debt securities can also be more difficult to sell for good value. These securities are often thinly traded and can be more difficult to sell and value accurately than investment-grade securities. Because objective pricing data may be less readily available, judgment may play a greater role in the valuation process. |
| · | Prepayment Risk: The risk that a debt security may be paid off and proceeds invested earlier than anticipated. Prepayment impacts both the interest rate sensitivity of the underlying asset, such as an asset-backed or mortgage-backed security and its cash flow projections. Prepayment risk is more prevalent during periods of falling interest rates. When interest rates decline it is more likely that the borrower will refinance the loan that is included in the security. This means the Fund would receive a larger-than-expected cash flow and it must then reinvest the cash received upon prepayment when yields have fallen (i.e., at a rate lower than the rate paid by the previous security). Therefore, prepayment risk may make it difficult to calculate the average duration of the Fund’s asset- or mortgage-backed securities which in turn would make it difficult to assess the interest rate risk of the Fund. |
Foreign Securities Risk: Investing in foreign securities poses additional risks since political and economic events unique in a country or region will affect those markets and their issuers, while such events may not necessarily affect the U.S. economy or issuers located in the United States. In addition, investments in foreign securities are generally denominated in foreign currency. As a result, changes in the value of those currencies compared to the U.S. dollar may affect the value of the Fund’s investments. These currency movements may happen separately from, or in response to, events that do not otherwise affect the value of the security in the issuer’s home country. There is a risk that issuers of foreign securities may not be subject to accounting standards or governmental supervision comparable to those to which U.S. companies are subject and that less public information about their operations may exist. There is risk associated with the clearance and settlement procedures in non-U.S. markets, which may be unable to keep pace with the volume of securities transactions and may cause delays. Foreign markets may be less liquid and more volatile than U.S. markets and offer less protection to investors. Over-the-counter securities may also be less liquid than exchange-traded securities. Investments in securities of foreign issuers may be subject to foreign withholding and other taxes. In addition, it may be more difficult and costly for the Fund to seek recovery from an issuer located outside the United States in the event of a default on a portfolio security or an issuer’s insolvency proceeding. To the extent the Fund focuses its investments in a single country or only a few countries in a particular geographic region, economic, political, regulatory or other conditions affecting such country or region may have a greater impact on Fund performance relative to a more geographically diversified fund.
| · | Depositary Receipts Risk: Foreign receipts, which include American Depositary Receipts (“ADRs”), Global Depositary Receipts, and European Depositary Receipts, are securities that evidence ownership interests in a security or a pool of securities issued by a foreign issuer. The risks of depositary receipts include many risks associated with investing directly in foreign securities, such as individual country risk and liquidity risk. Unsponsored ADRs, which are issued by a depositary bank without the participation or consent of the issuer, involve additional risks because U.S. reporting requirements do not apply, and the issuing bank will recover shareholder distribution costs from movement of share prices and payment of dividends. |
| · | Emerging Markets Risk: Emerging markets may be more likely to experience political turmoil or rapid changes in market or economic conditions than more developed countries. In addition, the financial stability of issuers (including governments) in emerging market countries may be more precarious than that of issuers in other countries. As a result, there will tend to be an increased risk of price volatility associated with the Fund’s investments in securities of issuers located in emerging market countries, which may be magnified by currency fluctuations relative to the U.S. dollar. |
| · | Frontier Markets Risk: Frontier markets have similar risks to emerging markets, except that these risks are often magnified in a frontier market due to its smaller and less developed economy. As a |
| | | result, frontier markets may experience greater changes in market or economic conditions, financial stability, price volatility, currency fluctuations, and other risks inherent in foreign securities. |
| · | Sovereign Debt Risk: The actions of foreign governments concerning their respective economies could have an important effect on their ability or willingness to service their sovereign debt. Such actions could have significant effects on market conditions and on the prices of securities and instruments held by the Fund, including the securities and instruments of foreign private issuers. |
Illiquid Securities Risk: Securities held by the Fund that are not deemed to be illiquid at the time of purchase may become illiquid. The Fund will not be able to readily sell illiquid securities. The inability to sell these securities at the most opportune time may negatively affect the Fund’s net asset value.
Income Risk: Because the Fund can only distribute what it earns, the Fund’s distributions to shareholders may decline when prevailing interest rates fall (or, if the Fund has a negative duration, when prevailing interest rates rise) or when the Fund experiences defaults on debt instruments it holds. The Fund’s income generally declines during periods of falling interest rates because the Fund must reinvest the proceeds it receives from existing investments (upon their maturity, prepayment, amortization, call or buy-back) at a lower rate of interest or return.
Inflation-Linked Investments Risk: The Fund may invest in Treasury Inflation Protected Securities (“TIPS”), which are U.S. government bonds whose principal automatically is adjusted for inflation as measured by the Consumer Price Index for All Urban Consumers (“CPI-U”) and other inflation-indexed securities issued by the U.S. Department of Treasury and non-U.S. sovereign entities. Unlike traditional fixed-income securities, the principal and interest payments of inflation-linked investments are adjusted periodically based on the inflation rate. The value of the Fund’s inflation-linked investments may be vulnerable to changes in expectations of inflation or interest rates, and there is no guarantee that the Fund’s use of these instruments will be successful.
Investment Style Risk: The Sentinel International Equity Fund and Sentinel Small Company Fund tend to focus on “growth” stocks, and target stocks with what the managers consider sustainable, rather than aggressive, growth rates and that are trading at reasonable valuations. The Sentinel Common Stock Fund, the equity portion of the Sentinel Balanced Fund and the Sentinel Sustainable Core Opportunities Fund focus on both “growth” and “value” stocks, or stocks with characteristics of both, commonly called a blend style. Different types of stocks tend to shift into and out of favor with stock market investors depending on market and economic conditions. Growth stocks may be more volatile than other stocks because they are generally more sensitive to investor perceptions of the issuing company’s growth of earnings potential. Also, because growth companies usually invest a high portion of earnings in their business, growth stocks may lack the dividends of value stocks that can cushion stock prices in a falling market. Value stocks may not increase in price or pay dividends, as anticipated by the Fund’s managers, or may decline even further if: other investors fail to recognize the company’s value; other investors favor investing in faster-growing companies; or the factors that the managers believe will increase the price do not occur. The Fund’s performance may at times be better or worse than the performance of funds that focus on other types of stocks or that have a broader investment style.
Leverage Risk: Leverage occurs when the Fund uses borrowings, derivatives (such as futures or options), or similar instruments or techniques to gain exposure to investments in an amount that exceeds the Fund’s initial investment. The use of leverage magnifies changes in the Fund’s net asset value and thus may result in increased portfolio volatility and increased risk of loss. Leverage can create an interest expense that may lower the Fund’s overall returns. There can be no guarantee that a leveraging strategy will be successful.
Management Risk: In managing a Fund’s portfolio, Touchstone Advisors engages one or more sub-advisors to make investment decisions for a portion of or the entire portfolio. There is a risk that the Touchstone Advisors may be unable to identify and retain sub-advisors who achieve superior investment returns relative to other similar sub-advisors. The value of your investment may decrease if the sub-advisor incorrectly judges the attractiveness, value, or market trends affecting a particular security, issuer, industry, or sector.
Mortgage Dollar Roll Risk: Mortgage “dollar rolls” are transactions in which mortgage-backed securities are sold for delivery in the current month and the seller simultaneously contracts to repurchase substantially similar securities on a specified future date. The difference between the sale price and the purchase price (plus any interest earned on the cash proceeds of the sale) is netted against the interest income foregone on the securities sold to arrive
at an implied borrowing rate. Alternatively, the sale and purchase transactions can be executed at the same price, with the Fund being paid a fee as consideration for entering into the commitment to purchase. If the broker-dealer to whom the Fund sells the security becomes insolvent, the Fund’s right to repurchase the security may be restricted. Other risks involved in entering into mortgage dollar rolls include the risk that the value of the security may change adversely over the term of the mortgage dollar roll and that the security the Fund is required to repurchase may be worth less than the security that the Fund originally held.
Non-Diversification Risk: A non-diversified Fund may invest a significant percentage of its assets in the securities of a limited number of issuers, subject to federal income tax restrictions relating to the Fund’s qualification as a regulated investment company. Because a higher percentage of a non-diversified Fund’s holdings may be invested in the securities of a limited number of issuers, the Fund may be more susceptible to risks associated with a single economic, business, political or regulatory event than a diversified fund.
Other Investment Companies and ETFs Risk: The Fund’s investments in other investment companies, such as exchange-traded funds (“ETFs”) and closed-end funds, will be subject to substantially the same risks as those associated with the direct ownership of the securities comprising the portfolios of such investment companies, and the value of the Fund’s investment will fluctuate in response to the performance of such portfolios. The value of the shares of closed-end funds may be lower than the value of the portfolio securities held by the closed-end fund. Also, although many ETFs seek to provide investment results that correspond generally to the price and yield performance of a particular market index, the price movement of an ETF may not track the underlying index. In addition, if the Fund acquires shares of investment companies, shareholders of the Fund will bear both their proportionate share of the fees and expenses of the Fund (including management and advisory fees) and, indirectly, the fees and expenses of the investment companies. There may also not be an active trading market available for shares of some investment companies. Additionally, trading of investment company shares may be halted or delisted by the listing exchange. To the extent the Fund is held by an affiliated fund, the ability of the Fund itself to hold other investment companies may be limited.
Portfolio Turnover Risk: The Fund may sell its portfolio securities, regardless of the length of time that they have been held, if the advisor or sub-advisor, as applicable, determines that it would be in the Fund’s best interest to do so. It may be appropriate to buy or sell portfolio securities due to economic, market, or other factors that are not within the advisor’s or sub-advisor’s control. These transactions will increase the Fund’s “portfolio turnover.” A 100% portfolio turnover rate would occur if all of the securities in the Fund were replaced during a given period. Frequent and active trading may result in greater expenses to the Fund, which may lower the Fund’s performance, and may result in the realization of substantial capital gains, including net short-term capital gains. As a result, portfolio turnover may reduce the Fund’s returns and result in higher taxes when Fund shares are held in a taxable account.
Repurchase Agreement Risk: Under all repurchase agreements entered into by the Fund, the Fund’s custodian or its agent must take possession of the underlying collateral. However, if the counterparty defaults, the Fund could realize a loss on the sale of the underlying security to the extent that the proceeds of sale, including accrued interest, are less than the resale price provided in the agreement including interest. In addition, even though the Bankruptcy Code provides protection for most repurchase agreements, if the seller should be involved in bankruptcy or insolvency proceedings, the Fund may incur delay and costs in selling the underlying security or may suffer a loss of principal and interest if the Fund is treated as an unsecured creditor and is required to return the underlying security to the seller’s estate. Repurchase agreements are considered loans by the Fund.
Sector Risk: The Fund may focus its investments in certain sectors. The Fund that focuses its investments in the securities of a particular market sector is subject to the risk that adverse circumstances will have a greater impact on the fund than a fund that does not focus its investments in a particular sector. It is possible that economic, business or political developments or other changes affecting one security in the sector of focus will affect other securities in that sector of focus in the same manner, thereby increasing the risk of such investments.
Short Sales Risk: A short sale involves the sale by the Fund of a security that it does not own with the hope of purchasing the same security at a later date at a lower price. A Fund may also enter into a short position through a forward commitment or a short derivative position through a futures contract or swap agreement. If the price of the security or derivative has increased during this time, then the Fund will incur a loss equal to the increase in price from the time that the short sale was entered into plus any premiums and interest paid to the third party.
Therefore, short sales involve the risk that the Fund’s losses may be exaggerated (without a limit). By contrast, a loss on a long position arises from decreases in the value of the security and is limited by the fact that a security’s value cannot decrease below zero.
Sustainable/Responsible Investing Risk: The Fund’s environmental, social and corporate governance criteria may cause the Fund to forgo opportunities to buy certain securities, or forgo opportunities to gain exposure to certain industries, sectors, regions and countries. In addition, the Fund may be required to sell a security when it might otherwise be disadvantageous for it to do so.
To-Be-Announced (“TBA”) Securities Risk: In a TBA securities transaction, the Fund commits to purchase certain securities for a fixed price at a future date. TBA securities include when-issued and delayed delivery securities and forward commitments. TBA securities involve the risk that the security the Fund buys will lose value prior to its delivery. There also is the risk that the security will not be issued or that the other party to the transaction will not meet its obligation. If this occurs, the Fund loses both the investment opportunity for the assets it set aside to pay for the security and any gain in the security’s price.
Utilities Industry Risk: Utility company equity securities, to the extent they are purchased for their dividend yield, historically have been sensitive to interest rate movements. In addition, utility companies are subject to state and federal regulation, with respect to both rates and operations, and face the potential for increased costs due to additional regulation and litigation.
Information About the Reorganizations
Reasons for the Reorganizations
Sentinel, the current investment advisor to the Target Funds, entered into an agreement to sell its mutual fund asset management business to Touchstone Advisors, investment advisor to the Touchstone Funds (previously defined as the “Transaction”). Conditions to the closing of the Transaction include that (i) shareholders of the Sentinel Common Stock Fund and Sentinel Small Company Fund approve the Reorganization of their Target Fund and (ii) Target Fund shareholders (including the Sentinel Common Stock Fund and Sentinel Small Company Fund) representing a specified amount of assets under management approve the Reorganization of their Target Fund. By approving the Reorganization of each Target Fund into the applicable Acquiring Fund, shareholders of the Target Fund will have an opportunity to continue their investment in a Fund that will be advised by Touchstone Advisors that will have investment goals and principal investment strategies similar to as those of the Target Fund. The Reorganizations are expected to be tax-free reorganizations for federal income tax purposes.
Sentinel Funds Board Approval of the Reorganizations
The Sentinel Funds Board has determined that the participation by the Target Funds in the Reorganizations is in the best interests of each Target Fund and its shareholders, and has concluded that the interests of shareholders of each Target Fund will not be diluted as a result of the Reorganization of that Fund with the corresponding Acquiring Fund. A fund resulting from a Reorganization is referred to as a “Combined Fund”. The following sets forth in greater detail the steps taken by the Board in arriving at these conclusions.
During the third quarter of 2016, Sentinel advised the Sentinel Funds Board that it was considering various strategic alternatives relating to its mutual fund advisory business. During this discussion, Sentinel reviewed the challenges in managing and expanding its mutual fund advisory business, including investors’ movements to index funds and other passive investments and changes in distribution practices that are impacting the mutual fund industry. Sentinel indicated that no conclusions had been reached but that the review could result in a proposal to restructure the Sentinel Funds or to sell all or a portion of the complex to a third party.
At a meeting of the Sentinel Funds Board held on December 7-8, 2016, Sentinel advised the Sentinel Funds Board regarding developments in its review of strategic alternatives, including its intention to retain an investment banking firm to assist in this review. Sentinel and the members of the Sentinel Funds Board who are not interested persons of the Sentinel Funds within the meaning of the Investment Company Act of 1940 (the “1940 Act”) (such directors being referred to as the “Sentinel Funds Independent Directors”) agreed that any decision by the Sentinel Fund Independent Directors impacting the Sentinel Funds or the relationship between the Sentinel Funds and Sentinel would be subject to review by such directors in terms of whether the action was in the best interests of the Sentinel Funds and their shareholders.
To facilitate the review of actions under consideration by Sentinel, the Sentinel Funds Board agreed at its meeting on December 7-8, 2016 that it would hold regular conference calls with management, so that management could provide updates on its review of various alternative actions. The Sentinel Funds Independent Directors also designated one such Director to take the lead on their behalf in reviewing proposals under consideration by Sentinel. The Sentinel Funds Board conducted a number of such conference calls during January and February, 2017, during which Sentinel and the Sentinel Funds Independent Directors discussed relevant issues relating to potential transactions that had been identified by Sentinel. All requests by the Sentinel Funds Independent Directors to Sentinel for information were promptly satisfied.
At a meeting of the Sentinel Funds Board held on March 8, 2017, Sentinel reported on the process senior management had undertaken in its review of strategic alternatives, the options that had been considered, the bids that had been received and the rationale for management’s focus on the proposal from Touchstone Advisors. At that meeting, the Sentinel Funds Independent Directors determined the process they would undertake in connection with their review of the proposed Transaction with Touchstone Advisors. During the review by the Sentinel Funds Board of the proposed Reorganizations, two Sentinel Funds Independent Directors traveled to meet with Touchstone Advisors at its headquarters in Cincinnati, Ohio, meeting with senior management of Touchstone Advisors, the lead independent director of the Touchstone Funds and the Touchstone Funds’ chief compliance officer. In addition, a
due diligence review was undertaken by independent counsel for the Sentinel Funds, and the results were reported to the Sentinel Funds Board.
On April 7, 2017, a special meeting of the Sentinel Funds Board was held in New York City to meet with senior management of Touchstone Advisors and portfolio management personnel of Touchstone Advisors and Fort Washington, Rockefeller and ClearArc Capital, the proposed sub-advisors to the Target Funds. At that meeting, representatives from Touchstone Advisors reviewed the organization’s history, its current resources, the performance records of the relevant Acquiring Funds, its distribution capabilities, the Touchstone Funds’ relationships with their key service providers, and the structure of the compliance programs of Touchstone Advisors and the Touchstone Funds. Representatives from the sub-advisors reviewed their respective investment strategies, portfolio management personnel, compliance programs and current resources. During an executive session of that meeting, the Sentinel Funds Independent Directors who had met with Touchstone Advisors’ management in Cincinnati reviewed the substance of these meetings and all of the Sentinel Funds Independent Directors discussed the proposed Reorganizations in detail.
At a meeting of the Sentinel Funds Board held in New York City on April 24, 2017, Sentinel recommended that the Board approve the Plans. In connection with its recommendation, Sentinel again provided its rationale for proposing to exit the mutual fund industry, including business and mutual fund industry challenges, and provided an analysis of both its rationale for pursuing the Transaction and the Reorganizations, and the basis for its recommendation that the Sentinel Funds Board approve the Plans. In its recommendation, Sentinel discussed the basis on which it believes the Reorganizations are in the best interests of each Fund and its shareholders. At the conclusion of the meeting, based on its review of all factors deemed relevant, including those described below, the Sentinel Funds Board, including the Sentinel Funds Independent Directors, unanimously determined that the Reorganizations are in the best interests of each Target Fund and its shareholders, and approved the terms and conditions of the Plans.
The Sentinel Funds Independent Directors met separately with the Funds’ independent counsel to review the proposed Reorganizations during the meetings identified above. In connection with their review, the Sentinel Funds Independent Directors requested and received additional information from Touchstone Advisors and Sentinel. The Sentinel Funds Independent Directors also requested and obtained modification or clarification of certain terms and commitments relating to the Reorganizations that they believed were in the best interests of the Target Funds’ shareholders.
In considering the best interests of the Target Funds and their respective shareholders in relation to the proposed Reorganizations, the Sentinel Funds Board carefully considered, among other factors, the following:
| (1) | the reputation, financial strength and resources of Touchstone Advisors and its parent company, Western & Southern Mutual Holding Company, and their express commitment to building their mutual fund advisory business; |
| (2) | the Reorganizations permit shareholders in the Target Funds to be part of a larger complex of mutual funds with additional investment options; |
| (3) | that after the Reorganizations, each Acquiring Fund will be advised by Touchstone Advisors, and will be sub-advised by Fort Washington, Rockefeller, or ClearArc Capital (as described in this Joint Proxy Statement/Prospectus); |
| (4) | that the manager of managers structure of the Touchstone Funds may be beneficial for shareholders of the Target Funds, noting that Touchstone Advisors has indicated that it has and will terminate sub-advisory relationships, including affiliates, when appropriate, and that the ability to do so provides the opportunity to hire new or additional managers when appropriate; |
| (5) | the similarity and differences, if any, in the investment objectives, principal investment strategies and risks of each Target Fund and the corresponding Acquiring Fund; |
| (6) | the past performance of each Operating Fund in comparison to the corresponding Target Fund, including that each of the Operating Funds has a higher Morningstar rating than its corresponding Target Fund and that: |
| (i) | the Touchstone Active Bond Fund has higher one-, three- and five- and 10-year performance than the Sentinel Government Securities Fund; |
| (ii) | the Touchstone Active Bond Fund has higher one- and three-year performance than the Sentinel Total Return Bond Fund (the Sentinel Total Return Bond Fund began operations in 2010, and therefore does not have 10 years of performance); |
| (iii) | the Combined Fund resulting from the Reorganization involving the Sentinel Multi-Asset Income Fund will follow the investment objective, policies and strategies of the Touchstone Flexible Income Fund; it is expected that the Combined Fund will remain in the Touchstone Flexible Income Fund’s current Morningstar category, which is different than the Morningstar category for the Sentinel Multi-Asset Income Fund; the Touchstone Flexible Income Fund, for the one and three-year periods, is ranked by Morningstar in the 14th and 2nd percentiles, respectively, of funds in its Intermediate Term Bond Fund category; |
| (iv) | the Touchstone Ultra Short Duration Fixed Income Fund had better three- and five- year performance than the Sentinel Low Duration Bond Fund; and |
| (v) | while the absolute performance of the Sentinel Sustainable Core Opportunities Fund has been higher for various periods than the Touchstone Sustainability and Impact Equity Fund (the “Touchstone Sustainability Fund”), the Touchstone Sustainability Fund is viewed by Touchstone Advisors as having a solid record, as evidenced by its five star Morningstar rating as compared with the three star rating for the Sentinel Sustainable Fund. In addition, the Board noted that Rockefeller & Co. was named as sub-advisor to the Touchstone Sustainability Fund in May 2015 and began applying its global sustainability and “impact equity” investment strategy in the Fund; |
| (7) | that the existing portfolio management teams of the Sentinel International Equity Fund and the Sentinel Small Company Fund are expected, after the Reorganization, to be responsible for day-to-day management of the respective corresponding Acquiring Fund, as employees of the sub-advisor to such Acquiring Funds; |
| (8) | that the Target Funds’ shareholders will receive the same aggregate dollar value in shares of the Acquiring Fund as their Target Fund shares immediately prior to the Reorganizations and the Reorganizations will not result in any dilution in their interests; |
| (9) | that Target Fund shareholders will receive the same or a similar class of shares as those held in the Target Funds; |
| (10) | that Touchstone Advisors has agreed to provide a two-year contractual expense limitation that will limit the total annual fund operating expenses of each class of shares of each Combined Fund on an annualized basis to an amount that is equal to or lower than the total annual operating expense ratio of the corresponding class of shares of the Target Fund as of November 31, 2016 (after taking into account any Sentinel expense limitation agreement in place at such time). Without these expense limitations (but giving effect to existing Touchstone Advisors expense limitations for the Acquiring Funds), the expense ratios of the successors to 5 Target Funds, Sentinel Sustainable Core Opportunities Fund, Sentinel Balanced Fund, the Sentinel Common Stock Fund, the Sentinel International Equity Fund, and the Sentinel Small Company Fund would be expected to increase following the Reorganizations; |
| (11) | Touchstone Advisors’ distribution capabilities, which are more extensive and have more sales personnel than those available to the Sentinel Funds, may contribute to increased asset levels and potential economies of scale for the Combined Funds after the Reorganizations; |
| (12) | that Sentinel and Touchstone Advisors or their affiliates will pay all direct expenses of the Funds in connection with the Reorganizations; |
| (13) | that each Reorganization is intended to be a tax-free reorganization for federal income tax purposes; |
| (14) | potential conflicts of interest, including the fact that Sentinel will receive financial consideration upon consummation of the Transaction; |
| (15) | alternatives to the Reorganizations for the Sentinel Funds, including alternative acquirors and the potential liquidation of the Sentinel Funds; and |
| (16) | the level of anticipated capital gains that may be realized as a result of portfolio re-positioning. The Sentinel Funds Board recognized that while the capital gains may be significant for certain Target Funds in connection with their Reorganizations and the subsequent repositionings, particularly the Sentinel Common Stock Fund and the Sentinel Balanced Fund, the amounts are consistent with significant levels of gains realized by certain Target Funds in the past. In addition, certain Target Funds have capital-loss carryforwards that may in part offset capital gains. In addition, with respect to the Sentinel Common Stock Fund and the Sentinel Balanced Fund, Touchstone Advisors advised Sentinel that sales of those Funds’ portfolio securities that are part of the repositioning will be effected during calendar years 2017 and 2018 so that shareholders’ tax liability with respect to realized capital gains will be spread over a two-year period. |
The directors of the Sentinel Funds are also trustees of the Sentinel Variable Products Trust (“Sentinel Variable Trust”), a registered investment company the series of which are offered to variable life insurance and variable annuity separate accounts of life insurance companies. Proposals were made to the board of the Sentinel Variable Trust for separate reorganizations of its series into new funds organized by an affiliate of the Touchstone Funds. The Sentinel Funds Board and the board of the Sentinel Variable Trust considered the respective proposed reorganizations at the same meetings. The board of the Sentinel Variable Trust also approved reorganization proposals.
Agreements and Plans of Reorganization
The following summary is qualified in its entirety by reference to the Plans, a form of which is set forth in Exhibit A. Each Plan provides that all the assets of each Target Fund will be transferred to the corresponding Acquiring Fund solely in exchange for shares of the Acquiring Fund and the assumption by the Acquiring Fund of the liabilities (other than certain excluded liabilities) of the Target Fund, as described in the Plan. The Reorganizations are expected to close on October 13, 2017, or such other date as may be agreed upon by the parties (the “Closing Date”).
With respect to each Reorganization of a Target Fund into a Shell Fund, the Plan provides that the initial net asset value of each share class of each Acquiring Fund will be equal to the net asset value of the corresponding class of shares of the corresponding Target Fund as of the close of business on the New York Stock Exchange (“NYSE”) on the Closing Date (the “Valuation Time”). For each Reorganization, the Plan provides that the computation of net asset value will be made in accordance with valuation procedures of the applicable Acquiring Fund as established by the Touchstone Funds Board or such other valuation procedures as may be mutually agreed upon by the parties, and that the parties will use commercially reasonable efforts to resolve any material pricing discrepancies between the practices of the Target Funds and those of the Acquiring Funds prior to the Valuation Time. As of the date of this Joint Proxy Statement/Prospectus, the parties do not expect any material pricing discrepancies to occur. BNY Mellon Investment Servicing (US) Inc., the Acquiring Funds’ accounting agent, will compute the value of each Fund’s investment portfolio.
With respect to each Reorganization, the Plan provides that, immediately after the closing of the Reorganization (the “Closing”), the Target Fund will distribute pro rata to its shareholders of record of each class as of the time of such distribution the full and fractional shares of the corresponding class of the Acquiring Fund received by the Target Fund pursuant to the Plan in complete liquidation of the Target Fund. The distribution and liquidation will be accomplished by the establishment of accounts in the names of the Target Fund’s shareholders on the Acquiring Fund’s share records. Each account will represent the respective pro rata number of full and fractional shares of the applicable Acquiring Fund, by class, due a Target Fund shareholder. All issued and outstanding shares of the Target Fund will be canceled. The Plan provides that Sentinel Funds will take all necessary and appropriate steps to terminate the Target Fund as soon as practicable following the Closing and the making of such distributions.
Each Reorganization is subject to the satisfaction or, to the extent legally permissible, waiver of the conditions set forth in the applicable Plan, including but not limited to the truth and correctness in all material respects of each party’s representations and warranties as set forth in the Plan, delivery of opinions of counsel, effectiveness of the registration statement with respect to the Acquiring Fund shares of which this Joint Proxy Statement/Prospectus is a part, the satisfaction or waiver of the closing conditions to the Transaction and approval of the Plan by shareholders of the Target Fund. A Plan may be terminated (1) by the mutual agreement of the applicable Acquiring Trust, on behalf of the Acquiring Fund, and Sentinel Funds, on behalf of the Target Fund; or (2) at or prior to the Closing by either party (a) because of a breach by the other of any representation, warranty or agreement contained in the Plan to be performed at or prior to the Closing, if not cured within 30 days, or (b) because a condition in the Plan expressed to be precedent to the obligations of the terminating party has not been met and it reasonably appears that it will not or cannot be met. A Plan may be amended, modified or supplemented in such manner as may be mutually agreed upon in writing by the authorized officers of the applicable Acquiring Trust and the Sentinel Funds.
Whether or not a Reorganization is consummated, Touchstone Advisors and Sentinel or their affiliates are obligated under the applicable Plan to pay the direct expenses incurred by the Funds in connection with the Reorganization. The costs of the Reorganizations (other than transaction costs in connection with repositioning of the portfolio) will not be borne by the Funds or their shareholders.
Description of the Securities to be Issued
Shareholders of each Target Fund as of the Closing will receive full and fractional shares of the corresponding class of the applicable Acquiring Fund in accordance with the terms of the applicable Plan. The shares of each Acquiring Fund to be issued in connection with the Reorganizations will be validly issued, fully paid and non-assessable when issued. Shares of the Acquiring Fund to be issued in a Reorganization will have no preemptive or other rights to subscribe for such shares, and no share certificates will be issued.
Material Federal Income Tax Consequences
The following discussion summarizes the material U.S. federal income tax consequences of the Reorganizations that are applicable to you as a Target Fund shareholder. It is based on the Internal Revenue Code of 1986, as amended (the “Code”), applicable U.S. Treasury regulations, judicial authority, and administrative rulings and practice, all as of the date of this Joint Proxy Statement/Prospectus and all of which are subject to change, including changes with retroactive effect. The discussion below does not address any state, local, or foreign tax consequences of the Reorganizations. Your tax treatment may vary depending upon your particular situation. You also may be subject to special rules not discussed below if you are a certain kind of Target Fund shareholder, including, but not limited to: an insurance company; a tax-exempt organization; a financial institution or broker-dealer; a person who is neither a citizen nor resident of the United States or an entity that is not organized under the laws of the United States or a political subdivision thereof; a holder of Target Fund shares as part of a hedge, straddle, or conversion transaction; a person who does not hold Target Fund shares as a capital asset at the time of the Reorganization; or an entity taxable as a partnership for U.S. federal income tax purposes.
Each Reorganization is intended to qualify for federal income tax purposes as a tax-free reorganization under Section 368(a) of the Code. As a condition to the closing of each Reorganization, the Target Fund and the corresponding Acquiring Fund will receive an opinion from the law firm of Vedder Price P.C. substantially to the effect that, on the basis of the existing provisions of the Code, U.S. Treasury regulations issued thereunder, current
administrative rules, pronouncements and court decisions, and certain representations, qualifications, and assumptions, for federal income tax purposes:
(i) The transfer by the Target Fund of its assets to the Acquiring Fund in exchange solely for shares of the Acquiring Fund and the assumption by the Acquiring Fund of the Target Fund’s liabilities, immediately followed by the pro rata, by class, distribution of all the shares of the Acquiring Fund so received by the Target Fund to the Target Fund’s shareholders in complete liquidation of the Target Fund and the termination of the Target Fund as soon as practicable thereafter, will constitute a “reorganization” within the meaning of Section 368(a)(1) of the Code, and the Acquiring Fund and the Target Fund will each be “a party to a reorganization,” within the meaning of Section 368(b) of the Code, with respect to the Reorganization.
(ii) No gain or loss will be recognized by the Acquiring Fund upon the receipt of the assets of the Target Fund solely in exchange for Acquiring Fund shares and the assumption by the Acquiring Fund of the Target Fund’s liabilities.
(iii) No gain or loss will be recognized by the Target Fund upon the transfer of its assets to the Acquiring Fund solely in exchange for Acquiring Fund shares and the assumption by the Acquiring Fund of the Target Fund’s liabilities or upon the distribution (whether actual or constructive) of the Acquiring Fund shares so received to the Target Fund shareholders solely in exchange for such shareholders’ shares of the Target Fund in complete liquidation of the Target Fund.
(iv) No gain or loss will be recognized by the Target Fund shareholders upon the exchange, pursuant to the Reorganization, of all their shares of the Target Fund solely for Acquiring Fund shares.
(v) The aggregate basis of the Acquiring Fund shares received by each Target Fund shareholder pursuant to the Reorganization will be the same as the aggregate basis of the shares of the Target Fund exchanged therefor by such shareholder.
(vi) The holding period of the Acquiring Fund shares received by each Target Fund shareholder in the Reorganization will include the period during which the shares of the Target Fund exchanged therefor were held by such shareholder, provided such shares of the Target Fund were held as capital assets at the effective time of the Reorganization.
(vii) The basis of the assets of the Target Fund received by the Acquiring Fund will be the same as the basis of such assets in the hands of the Target Fund immediately before the effective time of the Reorganization.
(viii) The holding period of the assets of the Target Fund received by the Acquiring Fund will include the period during which such assets were held by the Target Fund.
No opinion will be expressed as to (1) the effect of a Reorganization on an Acquiring Fund, a Target Fund or any Target Fund shareholder with respect to any asset (including without limitation any stock held in a passive foreign investment company as defined in Section 1297(a) of the Code) as to which any unrealized gain or loss is required to be recognized for federal income tax purposes (a) at the end of a taxable year or upon the termination thereof, or (b) upon the transfer of such asset regardless of whether such transfer would otherwise be a non-taxable transaction under the Code, or (2) any other federal tax issues (except those set forth above) and all state, local or foreign tax issues of any kind.
No private ruling will be sought from the Internal Revenue Service (the “IRS”) with respect to the federal income tax consequences of the Reorganizations. Opinions of counsel are not binding upon the IRS or the courts, are not guarantees of the tax results, and do not preclude the IRS from adopting or taking a contrary position, which may be sustained by a court. If a Reorganization is consummated but the IRS or the courts determine that the Reorganization does not qualify as a tax-free reorganization under the Code and, thus, is taxable, the applicable Target Fund would recognize gain or loss on the transfer of its assets to the corresponding Acquiring Fund and each shareholder of the Target Fund would recognize a taxable gain or loss equal to the difference between its tax basis in its Target Fund shares and the fair market value of the shares of the Acquiring Fund it receives.
Prior to the closing of each Reorganization, the Target Fund may declare a distribution to its shareholders, which together with all previous distributions, will have the effect of distributing to shareholders all of the Target Fund’s net investment income and realized net capital gains (after reduction by any available capital loss carryforwards and excluding any net capital gain on which the Target Fund paid federal income tax), if any, through the Closing Date. To the extent distributions are attributable to ordinary taxable income or capital gains, the distribution will be taxable to shareholders for federal income tax purposes and may include net capital gains resulting from the sale of portfolio assets discussed below. Additional distributions may be made if necessary. All dividends and distributions will be reinvested in additional shares of the Target Fund unless a shareholder has made an election to receive dividends and distributions in cash. Dividends and distributions are treated the same for federal income tax purposes whether received in cash or additional shares.
If portfolio investments of a Target Fund are sold prior to that Target Fund’s Reorganization, the tax impact of such sales will depend on the holding periods of such assets and the difference between the price at which such portfolio assets are sold and the Target Fund’s basis in such assets. Any capital gains recognized in these sales on a net basis (after taking into account any capital loss carryforwards) will be distributed to the Target Fund’s shareholders as capital gains (to the extent of net long-term capital gain over any net short-term capital loss) or ordinary dividends (to the extent of net short-term capital gain over any net long-term capital loss) during or with respect to the year of sale, and such distributions will be taxable to shareholders.
After a Reorganization, the Acquiring Fund’s ability to use the corresponding Target Fund’s and Acquiring Fund’s realized and unrealized pre-Reorganization capital losses, if any, may be limited under certain federal income tax rules applicable to reorganizations of this type. Therefore, in certain circumstances, shareholders may pay federal income tax sooner, or may pay more federal income taxes, than they would have had the Reorganization not occurred. The effect of these potential limitations will depend on a number of factors, including the amount of the losses, the amount of gains to be offset, the exact timing of the Reorganization and the amount of unrealized capital gains in the applicable Funds at the time of the Reorganization.
As of November 30, 2016 for the Target Funds, September 30, 2016 for the Touchstone Active Bond Fund and Touchstone Ultra Short Duration Fixed Income Fund and March 31, 2017 for the Touchstone Flexible Income Fund and Touchstone Sustainability and Impact Equity Fund, each Fund had unused capital loss carryforwards available for federal income tax purposes to be applied against capital gains, if any, per the table below.
| | | Capital Losses to
be carried
forward (no
expiration) | | Capital Losses to
be carried
forward with the
Expiration Date | | Expiration Date |
| | | | | | | |
| Sentinel Government Securities Fund | | $58,457,106 | | N/A | | |
| Touchstone Active Bond Fund | | N/A | | $8,427,960 | | 2017 |
| | | | | | | |
| Sentinel Total Return Bond Fund | | $34,311,196 | | N/A | | |
| Touchstone Active Bond Fund | | N/A | | $8,427,960 | | 2017 |
| | | | | | | |
| Sentinel Low Duration Bond Fund | | $76,001,489 | | $2,065,072 | | 2017 |
| | | | | $16,447,278 | | 2018 |
| | | | | $32,731,463 | | 2019 |
| Touchstone Ultra Short Duration Fixed Income Fund | | $17,631,734 | | $3,231,117 | | 2017 |
| | | | | $3,336,624 | | 2018 |
| | | | | $933,830 | | 2019 |
| | | | | | | |
| | | Capital Losses to
be carried
forward (no
expiration) | | Capital Losses to
be carried
forward with the
Expiration Date | | Expiration Date |
| | | | | | | |
| Sentinel Multi-Asset Income Fund | | N/A | | N/A | | |
| Touchstone Flexible Income Fund | | N/A | | $6,355,592 | | 2019 |
| | | | | | | |
| Sentinel Sustainable Core Opportunities Fund | | N/A | | N/A | | |
| Touchstone Sustainability and Impact Equity Fund | | $11,335,434 | | N/A | | |
| | | | | | | |
| Sentinel Balanced Fund | | N/A | | N/A | | |
| Sentinel Common Stock Fund | | N/A | | N/A | | |
| Sentinel International Equity Fund | | $229,675 | | N/A | | |
| Sentinel Small Company Fund | | N/A | | N/A | | |
A Fund is generally able to carryforward net capital losses arising in taxable years beginning after December 22, 2010 (“post-enactment losses”) indefinitely. Net capital losses of the Funds from taxable years beginning on or prior to December 22, 2010, however, are subject to the expiration dates shown above and can be used only after post-enactment losses.
In addition, shareholders of a Target Fund will receive a proportionate share of any taxable income and gains realized by the corresponding Acquiring Fund and not distributed to its shareholders prior to the Reorganization when such income and gains are eventually distributed by the Acquiring Fund. Furthermore, any gain an Acquiring Fund realizes after its Reorganization, including any built-in gain realized on the sale of its the Target Fund’s assets in connection with the repositioning of the portfolio after the Reorganization, may result in taxable distributions to shareholders holding shares of the Acquiring Fund (including former shareholders of the Target Fund who hold shares of the Acquiring Fund following the Reorganization). As a result, shareholders of a Target Fund may receive a greater amount of taxable distributions than they would have had the Reorganizations not occurred.
As of November 30, 2016, for U.S. federal income tax purposes, the Target Funds had net unrealized gains per the table below. With respect to each Target Fund, these figures are likely to change prior to the Closing and do not reflect the impact of the Reorganization, including, in particular, the application of the loss limitation rules discussed herein.
| Target Funds | | Net Unrealized
Gains |
| | | |
| Sentinel Government Securities Fund | | | $1,292,328 | |
| Sentinel Low Duration Bond Fund | | | None | |
| Sentinel Multi-Asset Income Fund | | | None | |
| Sentinel Sustainable Core Opportunities Fund | | | $90,987,279 | |
| Sentinel Total Return Bond Fund | | | $1,075,026 | |
| Sentinel Balanced Fund | | | $96,365,867 | |
| Sentinel Common Stock Fund | | | $959,075,887 | |
| Sentinel International Equity Fund | | | $4,204,172 | |
| Sentinel Small Company Fund | | | $198,358,212 | |
Tracking Your Basis and Holding Period; State and Local Taxes. After the Reorganizations, you will continue to be responsible for tracking the adjusted tax basis and holding period of your shares for federal income tax purposes. However, mutual funds must report cost basis information to you and the IRS when a shareholder sells or exchanges shares acquired on or after January 1, 2012 that are not in a retirement account (“covered
shares”). Cost basis reporting by a mutual fund is not required if the shares were acquired in a reorganization and the basis of the acquired shares is determined from the basis of shares that were not covered shares.
This discussion does not address any state, local or foreign tax issues and is limited to material federal income tax issues. You are urged and advised to consult, and must rely on, your own tax advisors as to the federal, state, local, foreign and other tax consequences of the Reorganizations in light of your individual circumstances, including the applicability and effect of possible changes in any applicable tax laws. This discussion is intended to be only a summary of the material federal income tax consequences of the Reorganizations and should not be considered to be tax advice. There can be no assurance that the IRS will concur on all or any of the issues discussed above.
Pro Forma Capitalization
The following table sets forth, for each Reorganization, the net assets, number of shares outstanding and net asset value (“NAV”) per share, assuming the Reorganization occurred as of March 31, 2017 for the Operating Funds and November 30, 2016 for the Sentinel Funds. This information is generally referred to as the “capitalization” of a Fund. The term “pro forma capitalization” means the expected capitalization of the Acquiring Fund as of March 31, 2017 or November 30, 2016, as applicable after giving effect to the applicable Reorganization. These numbers may differ as of the closing date of the applicable Reorganization.
Capitalization Table as of March 31, 2017 (Unaudited)
Reorganization of Sentinel Government Securities Fund into Touchstone Active Bond Fund
| | | Sentinel
Government
Securities Fund | | | Touchstone
Active Bond
Fund | | | Pro Forma
Adjustments(1) | | | Pro Forma
Combined
Touchstone
Active Bond
Fund | |
| Net Assets (all classes) | | $180,981,046 | | | $103,460,881 | | | — | | | $284,441,927 | |
| Class A | | | | | | | | | | | | |
| Net assets | | $140,159,042 | | | $23,444,475 | | | — | | | $163,603,517 | |
| Shares outstanding | | 14,464,515 | | | 2,264,218 | | | (928,250)(3) | | | 15,800,483 | |
| Net asset value per share | | $9.69 | | | $10.35 | | | — | | | $10.35 | |
| Class C | | | | | | | | | | | | |
| Net assets | | $17,251,841 | | | $5,466,677 | | | — | | | $22,718,518 | |
| Shares outstanding | | 1,777,935 | | | 570,446 | | | 22,289(3) | | | 2,370,670 | |
| Net asset value per share | | $9.70 | | | $9.58 | | | — | | | $9.58 | |
| Class I/Y(2) | | | | | | | | | | | | |
| Net assets | | $23,570,163 | | | $67,760,762 | | | — | | | $91,330,925 | |
| Shares outstanding | | 2,431,719 | | | 6,547,101 | | | (154,350)(3) | | | 8,824,470 | |
| Net asset value per share | | $9.69 | | | $10.35 | | | — | | | $10.35 | |
| Institutional Class | | | | | | | | | | | | |
| Net assets | | | | | $6,788,967 | | | | | | $6,788,967 | |
| Shares outstanding | | | | | 656,297 | | | | | | 656,297 | |
| Net asset value per share | | | | | $10.34 | | | | | | $10.34 | |
| (1) | Touchstone Advisors and Sentinel or their affiliates will bear 100% of the Reorganization expenses. As a result, there are no pro forma adjustments to net assets. |
| (2) | Holders of Class I shares of the Sentinel Government Securities Fund Class I shares will receive Class Y shares of the Touchstone Active Bond Fund upon closing of the Reorganization. |
| (3) | Pro forma shares outstanding have been adjusted for the accumulated change in the number of shares of the Sentinel Government Securities Fund’s shareholder accounts based on the relative value of the Sentinel Government Securities Fund’s and the Touchstone Active Bond Fund’s net asset value per share. |
Capitalization Table as of March 31, 2017 (Unaudited)
Reorganization of Sentinel Total Return Bond Fund into Touchstone Active Bond Fund
| | | Sentinel Total
Return Bond
Fund | | Touchstone
Active Bond
Fund | | Pro Forma
Adjustments(1) | | Pro Forma
Combined
Touchstone
Active Bond
Fund |
| Net Assets (all classes) | | $282,461,412 | | | $103,460,881 | | | — | | | $385,922,293 | |
| Class A | | | | | | | | | | | | |
| Net assets | | $64,109,477 | | | $23,444,475 | | | $609,755 | | | $88,163,707 | |
| Shares outstanding | | 6,240,246 | | | 2,264,218 | | | 10,201 | (5) | | 8,514,665 | |
| Net asset value per share | | $10.27 | | | $10.35 | | | — | | | $10.35 | |
| Class C | | | | | | | | | | | | |
| Net assets | | $23,784,867 | | | $5,466,677 | | | — | | | $29,251,544 | |
| Shares outstanding | | 2,321,707 | | | 570,446 | | | 160,236 | (5) | | 3,052,389 | |
| Net asset value per share | | $10.24 | | | $9.58 | | | — | | | $9.58 | |
| Class I/Y(2) | | | | | | | | | | | | |
| Net assets | | $193,345,163 | | | $67,760,762 | | | $612,150 | | | $261,718,075 | |
| Shares outstanding | | 18,804,288 | | | 6,547,101 | | | (63,972 | )(5) | | 25,287,417 | |
| Net asset value per share | | $10.28 | | | $10.35 | | | — | | | $10.35 | |
| Class R3/A(3) | | | | | | | | | | | | |
| Net assets | | $609,755 | | | — | | | $(609,755 | ) | | — | |
| Shares outstanding | | 59,363 | | | — | | | (59,363 | )(5) | | — | |
| Net asset value per share | | $10.27 | | | — | | | — | | | — | |
| Class R6/Y(4) | | | | | | | | | | | | |
| Net assets | | $612,150 | | | — | | | $(612,150 | ) | | — | |
| Shares outstanding | | 59,537 | | | — | | | (59,537 | )(5) | | — | |
| Net asset value per share | | $10.28 | | | — | | | — | | | — | |
| Institutional Class | | | | | | | | | | | | |
| Net assets | | — | | | $6,788,967 | | | — | | | $6,788,967 | |
| Shares outstanding | | — | | | 656,297 | | | — | | | 656,297 | |
| Net asset value per share | | — | | | $10.34 | | | — | | | $10.34 | |
| (1) | Touchstone and Sentinel will bear 100% of the Reorganization expenses. As a result there are no pro forma adjustments to net assets. |
| (2) | Holders of Class I shares of the Sentinel Total Return Bond Fund will receive Class Y shares of the Touchstone Active Bond Fund upon closing of the Reorganization. |
| (3) | Holders of Class R3 shares of the Sentinel Total Return Bond Fund will receive Class A shares of the Touchstone Active Bond Fund upon closing of the Reorganization. |
| (4) | Holders of Class R6 shares of the Sentinel Total Return Bond Fund will receive Class Y shares of the Touchstone Active Bond Fund upon closing of the Reorganization. |
| (5) | Pro forma shares outstanding have been adjusted for the accumulated change in the number of shares of the Sentinel Total Return Bond Fund’s shareholder accounts based on the relative value of the Sentinel Total Return Bond Fund’s and the Touchstone Active Bond Fund’s net asset value per share. |
Capitalization Table as of March 31, 2017 (Unaudited)
Reorganization of Sentinel Government Securities Fund/Total Return Bond Fund into Touchstone Active Bond Fund
| | | Sentinel
Government
Securities
Fund | | | Sentinel
Total Return
Bond Fund | | | Touchstone
Active Bond
Fund | | | Pro
Forma
Adjustments(1) | | | Pro Forma
Combined
Touchstone
Active Bond
Fund | |
| Net Assets (all classes) | | $180,981,046 | | | $282,461,412 | | | $103,460,881 | | | — | | | $566,903,339 | |
| Class A | | | | | | | | | | | | | | | |
| Net assets | | $140,159,042 | | | $64,109,477 | | | $23,444,475 | | | $609,755 | | | $228,322,749 | |
| Shares outstanding | | 14,464,515 | | | 6,240,246 | | | 2,264,218 | | | (918,049)(5) | | | 22,050,930 | |
| Net asset value per share | | $9.69 | | | $10.27 | | | $10.35 | | | | | | $10.35 | |
| Class C | | | | | | | | | | | | | | | |
| Net assets | | $17,251,841 | | | $23,784,867 | | | $5,466,677 | | | | | | $46,503,385 | |
| Shares outstanding | | 1,777,935 | | | 2,321,707 | | | 570,446 | | | 182,525(5) | | | 4,852,613 | |
| Net asset value per share | | $9.70 | | | $10.24 | | | $9.58 | | | | | | $9.58 | |
| Class I/Y(2) | | | | | | | | | | | | | | | |
| Net assets | | $23,570,163 | | | $193,345,163 | | | $67,760,762 | | | $612,150 | | | $285,288,238 | |
| Shares outstanding | | 2,431,719 | | | 18,804,288 | | | 6,547,101 | | | (218,322)(5) | | | 27,564,786 | |
| Net asset value per share | | $9.69 | | | $10.28 | | | $10.35 | | | | | | $10.35 | |
| Class R3/A(3) | | | | | | | | | | | | | | | |
| Net assets | | — | | | $609,755 | | | | | | $(609,755) | | | | |
| Shares outstanding | | — | | | 59,363 | | | | | | (59,363)(3) | | | | |
| Net asset value per share | | — | | | $10.27 | | | | | | | | | | |
| Class R6/Y(4) | | | | | | | | | | | | | | | |
| Net assets | | — | | | $612,150 | | | | | | $(612,150) | | | | |
| Shares outstanding | | — | | | 59,537 | | | | | | (59,537)(5) | | | | |
| Net asset value per share | | — | | | $10.28 | | | | | | | | | | |
| Institutional Class | | | | | | | | | | | | | | | |
| Net assets | | | | | | | | $6,788,967 | | | | | | $6,788,967 | |
| Shares outstanding | | | | | | | | 656,297 | | | | | | 656,297 | |
| Net asset value per share | | | | | | | | $10.34 | | | | | | $10.34 | |
| (1) | Touchstone Advisors and Sentinel or their affiliates will bear 100% of the Reorganization expenses. As a result, there are no pro forma adjustments to net assets. |
| (2) | Holders of Class I shares of the Sentinel Government Securities Fund and Sentinel Total Return Bond Fund will receive Class Y shares of the Touchstone Active Bond Fund upon closing of the Reorganization. |
| (3) | Holders of Class R3 shares of the Sentinel Total Return Bond Fund will receive Class A shares of the Touchstone Active Bond Fund upon closing of the Reorganization. |
| (4) | Holders of Class R6 shares of the Sentinel Total Return Bond Fund will receive Class Y shares of the Touchstone Active Bond Fund upon closing of the Reorganization. |
| (5) | Pro forma shares outstanding have been adjusted for the accumulated change in the number of shares of the Sentinel Government Securities Fund’s and Sentinel Total Return Bond Fund’s shareholder accounts based on the relative value of the Sentinel Government Securities Fund’s, Sentinel Total Return Bond Fund and the Touchstone Active Bond Fund’s net asset value per share. |
Capitalization Table as of March 31, 2017 (Unaudited)
Reorganization of Sentinel Low Duration Bond Fund into Touchstone Ultra Short Duration Fixed Income Fund
| | | Sentinel Low
Duration Bond
Fund | | | Touchstone
Ultra Short
Duration Fixed
Income Fund | | | Pro Forma
Adjustments(1) | | | Pro Forma
Combined
Touchstone
Ultra Short
Duration Fixed
Income Fund | |
| Net Assets (all classes) | | $313,795,445 | | | $654,116,245 | | | — | | | $967,911,690 | |
| Class A | | | | | | | | | | | | |
| Net assets | | $88,625,791 | | | $12,764,742 | | | — | | | $101,390,533 | |
| Shares outstanding | | 10,514,203 | | | 1,376,890 | | | (954,436)(3) | | | 10,936,657 | |
| Net asset value per share | | $8.43 | | | $9.27 | | | — | | | $9.27 | |
| Class C | | | | | | | | | | | | |
| Net assets | | | | | $7,351,857 | | | — | | | $7,351,857 | |
| Shares outstanding | | | | | 789,123 | | | | | | 789,123 | |
| Net asset value per share | | | | | $9.32 | | | — | | | $9.32 | |
| Class I/Y(2) | | | | | | | | | | | | |
| Net assets | | $18,603,856 | | | $221,705,064 | | | — | | | $240,308,920 | |
| Shares outstanding | | 2,203,470 | | | 23,808,046 | | | (205,674)(3) | | | 25,805,842 | |
| Net asset value per share | | $8.44 | | | $9.31 | | | — | | | $9.31 | |
| Class S(4) | | | | | | | | | | | | |
| Net assets | | $206,565,798 | | | — | | | — | | | $206,565,798 | |
| Shares outstanding | | 24,470,186 | | | — | | | (2,287,887)(3) | | | 22,182,299 | |
| Net asset value per share | | $8.44 | | | — | | | — | | | $9.31 | |
| Class Z | | | | | | | | | | | | |
| Net assets | | | | | $219,212,381 | | | | | | $219,212,381 | |
| Shares outstanding | | | | | 23,577,201 | | | | | | 23,577,201 | |
| Net asset value per share | | | | | $9.30 | | | | | | $9.30 | |
| Institutional Class | | | | | | | | | | | | |
| Net assets | | | | | $193,082,201 | | | | | | $193,082,201 | |
| Shares outstanding | | | | | 20,734,708 | | | | | | 20,734,708 | |
| Net asset value per share | | | | | $9.31 | | | | | | $9.31 | |
| (1) | Touchstone Advisors and Sentinel or their affiliates will bear 100% of the Reorganization expenses. As a result, there are no pro forma adjustments to net assets. |
| (2) | Holders of the Class I shares of Sentinel Low Duration Bond Fund will receive Class Y shares of the Touchstone Ultra Short Duration Fixed Income Fund upon closing of the Reorganization. |
| (3) | Pro forma shares outstanding have been adjusted for the accumulated change in the number of shares of the Sentinel Low Duration Bond Fund’s shareholder accounts based on the relative value of the Sentinel Low Duration Bond Fund’s and the Touchstone Ultra Short Duration Fixed Income Fund’s net asset value per share. |
| (4) | Touchstone Ultra Short Duration Fixed Income Fund will open Class S shares. |
Capitalization Table as of March 31, 2017 (Unaudited)
Reorganization of Sentinel Multi-Asset Income Fund into Touchstone Flexible Income Fund
| | | Sentinel Multi-
Asset Income
Fund | | Touchstone
Flexible Income
Fund | | Pro Forma
Adjustments(1) | | Pro Forma
Combined
Touchstone
Flexible Income
Fund |
| Net Assets (all classes) | | $295,059,203 | | $673,220,321 | | — | | $968,279,524 |
| Class A | | | | | | | | |
| Net assets | | $120,013,881 | | $49,543,735 | | — | | $169,557,616 |
| Shares outstanding | | 9,789,610 | | 4,624,514 | | 1,412,732(3) | | 15,826,856 |
| Net asset value per share | | $12.26 | | $10.71 | | — | | $10.71 |
| Class C | | | | | | | | |
| Net assets | | $95,896,914 | | $55,043,489 | | — | | $150,940,403 |
| Shares outstanding | | 7,867,066 | | 5,207,144 | | 1,204,834(3) | | 14,279,044 |
| Net asset value per share | | $12.19 | | $10.57 | | — | | $10.57 |
| Class I/Y(2) | | | | | | | | |
| Net assets | | $79,148,408 | | $464,002,422 | | — | | $543,150,830 |
| Shares outstanding | | 6,472,743 | | 43,182,530 | | 893,228(3) | | 50,548,501 |
| Net asset value per share | | $12.23 | | $10.75 | | — | | $10.75 |
| Institutional Class | | | | | | | | |
| Net assets | | | | $104,630,675 | | | | $104,630,675 |
| Shares outstanding | | | | 9,740,523 | | | | 9,740,523 |
| Net asset value per share | | | | $10.74 | | | | $10.74 |
| (1) | Touchstone Advisors and Sentinel or their affiliates will bear 100% of the Reorganization expenses. As a result, there are no pro forma adjustments to net assets. |
| (2) | Holders of Class I shares of the Sentinel Multi-Asset Income Fund will receive Class Y shares of the Touchstone Flexible Income Fund upon closing of the Reorganization. |
| (3) | Pro forma shares outstanding have been adjusted for the accumulated change in the number of shares of the Sentinel Multi-Asset Income Fund’s shareholder accounts based on the relative value of the Sentinel Multi-Asset Income Fund’s and the Touchstone Flexible Income Fund’s net asset value per share. |
Capitalization Table as of March 31, 2017 (Unaudited)
Reorganization of Sentinel Sustainable Core Opportunities Fund into Touchstone Sustainability and Impact Equity Fund
| | | Sentinel
Sustainable Core
Opportunities
Fund | | Touchstone
Sustainability and
Impact Equity
Fund | | Pro Forma
Adjustments(1) | | Pro Forma
Combined
Touchstone
Sustainability
and Impact
Equity Fund |
| Net Assets (all classes) | | $380,455,809 | | $303,586,524 | | — | | $684,042,333 |
| Class A | | | | | | | | |
| Net assets | | $351,892,025 | | $113,062,255 | | — | | $464,954,280 |
| Shares outstanding | | 15,668,257 | | 5,254,373 | | 685,317(3) | | 21,607,947 |
| Net asset value per share | | $22.46 | | $21.52 | | — | | $21.52 |
| Class C | | | | | | | | |
| Net assets | | | | $48,055,011 | | — | | $48,055,011 |
| Shares outstanding | | | | 2,580,565 | | | | 2,580,565 |
| Net asset value per share | | | | $18.62 | | — | | $18.62 |
| Class I/Y(2) | | | | | | | | |
| Net assets | | $28,563,784 | | $112,790,042 | | — | | $141,353,826 |
| Shares outstanding | | 1,267,883 | | 5,101,425 | | 24,040(3) | | 6,393,348 |
| Net asset value per share | | $22.53 | | $22.11 | | — | | $22.11 |
| Institutional Class | | | | | | | | |
| Net assets | | | | $29,679,216 | | | | $29,679,216 |
| Shares outstanding | | | | 1,341,133 | | | | 1,341,133 |
| Net asset value per share | | | | $22.13 | | | | $22.13 |
| (1) | Touchstone Advisors and Sentinel or their affiliates will bear 100% of the Reorganization expenses. As a result, there are no pro forma adjustments to net assets. |
| (2) | Holders of the Class I shares of Sentinel Sustainable Core Opportunities Fund will receive Class Y shares of the Touchstone Sustainability and Impact Equity Fund upon closing of the Reorganization. |
| (3) | Pro forma shares outstanding have been adjusted for the accumulated change in the number of shares of the Sentinel Sustainable Core Opportunities Fund’s shareholder accounts based on the relative value of the Sentinel Sustainable Core Opportunities Fund’s and the Touchstone Sustainability and Impact Equity Fund’s net asset value per share. |
Capitalization Table as of November 30, 2016 (Unaudited)
Reorganization of Sentinel Balanced Fund into Touchstone Balanced Fund
| | | Sentinel Balanced
Fund | | Pro Forma
Adjustments(1) | | Pro Forma
Acquiring Fund |
| Net Assets (all classes) | | $322,453,507 | | — | | $322,453,507 |
| Class A | | | | | | |
| Net assets | | $264,910,339 | | — | | $264,910,339 |
| Shares outstanding | | 13,461,269 | | — | | 13,461,269 |
| Net asset value per share | | $19.68 | | — | | $19.68 |
| Class C | | | | | | |
| Net assets | | $43,066,223 | | — | | $43,066,223 |
| Shares outstanding | | 2,182,307 | | — | | 2,182,307 |
| Net asset value per share | | $19.73 | | — | | $19.73 |
| Class I/Y(2) | | | | | | |
| Net assets | | $14,476,945 | | — | | $14,476,945 |
| Shares outstanding | | 739,906 | | — | | 739,906 |
| Net asset value per share | | $19.57 | | — | | $19.57 |
| (1) | Touchstone Advisors and Sentinel or their affiliates will bear 100% of the Reorganization expenses. As a result, there are no pro forma adjustments to net assets. |
| (2) | Holders of the Class I shares of Sentinel Balanced Fund will receive Class Y shares of the Touchstone Balanced Fund upon closing of the Reorganization. |
Capitalization Table as of November 30, 2016 (Unaudited)
Reorganization of Sentinel Common Stock Fund into Touchstone Large Cap Focused Fund
| | | Sentinel Common
Stock Fund | | Pro Forma
Adjustments(1) | | Pro Forma
Acquiring Fund |
| Net Assets (all classes) | | $2,016,643,657 | | — | | $2,016,643,657 |
| Class A | | | | | | |
| Net assets | | $1,350,860,586 | | — | | $1,350,860,586 |
| Shares outstanding | | 31,949,509 | | — | | 31,949,509 |
| Net asset value per share | | $42.28 | | — | | $42.28 |
| Class C | | | | | | |
| Net assets | | $83,245,707 | | — | | $83,245,707 |
| Shares outstanding | | 2,058,538 | | — | | 2,058,538 |
| Net asset value per share | | $40.44 | | — | | $40.44 |
| Class I/Y(2) | | | | | | |
| Net assets | | $552,610,573 | | — | | $552,610,573 |
| Shares outstanding | | 13,076,341 | | | | 13,076,341 |
| Net asset value per share | | $42.26 | | — | | $42.26 |
| Class R6/Institutional Class(3) | | | | | | |
| Net assets | | $29,926,791 | | — | | $29,926,791 |
| Shares outstanding | | 707,129 | | — | | 707,129 |
| Net asset value per share | | $42.32 | | — | | $42.32 |
| (1) | Touchstone Advisors and Sentinel or their affiliates will bear 100% of the Reorganization expenses. As a result, there are no pro forma adjustments to net assets. |
| (2) | Holders of the Class I shares of Sentinel Common Stock Fund will receive Class Y shares of the Touchstone Large Cap Focused Fund upon closing of the Reorganization. |
| (3) | Holders of Class R6 shares of the Sentinel Common Stock Fund will receive Institutional Class shares of the Touchstone Large Cap Focused Fund upon closing of the Reorganization. |
Capitalization Table as of November 30, 2016 (Unaudited)
Reorganization of Sentinel International Equity Fund into Touchstone International Equity Fund
| | | Sentinel
International
Equity Fund | | Pro Forma
Adjustments(1) | | Pro Forma
Acquiring Fund |
| Net Assets (all classes) | | $161,020,363 | | — | | $161,020,363 |
| Class A | | | | | | |
| Net assets | | $114,616,241 | | — | | $114,616,241 |
| Shares outstanding | | 7,382,771 | | — | | 7,382,771 |
| Net asset value per share | | $15.52 | | — | | $15.52 |
| Class C | | | | | | |
| Net assets | | $5,876,112 | | — | | $5,876,112 |
| Shares outstanding | | 400,805 | | — | | 400,805 |
| Net asset value per share | | $14.66 | | — | | $14.66 |
| Class I/Y(2) | | | | | | |
| Net assets | | $40,528,010 | | — | | $40,528,010 |
| Shares outstanding | | 2,631,322 | | — | | 2,631,322 |
| Net asset value per share | | $15.40 | | — | | $15.40 |
| (1) | Touchstone Advisors and Sentinel or their affiliates will bear 100% of the Reorganization expenses. As a result, there are no pro forma adjustments to net assets. |
| (2) | Holders of Class I shares of the Sentinel International Equity Fund will receive Class Y shares of the Touchstone International Equity Fund upon closing of the Reorganization. |
Capitalization Table as of November 30, 2016 (Unaudited)
Reorganization of Sentinel Small Company Fund into Touchstone Small Company Fund
| | | Sentinel Small
Company Fund | | Pro Forma
Adjustments(1) | | Pro Forma
Acquiring Fund |
| Net Assets (all classes) | | $1,067,131,879 | | — | | $1,067,131,879 |
| Class A | | | | | | |
| Net assets | | $685,806,556 | | — | | $685,806,556 |
| Shares outstanding | | 132,266,573 | | — | | 132,266,573 |
| Net asset value per share | | $5.19 | | — | | $5.19 |
| Class C | | | | | | |
| Net assets | | $110,842,167 | | — | | $110,842,167 |
| Shares outstanding | | 32,673,484 | | — | | 32,673,484 |
| Net asset value per share | | $3.39 | | — | | $3.39 |
| Class I/Y(2) | | | | | | |
| Net assets | | $257,483,006 | | — | | $257,483,006 |
| Shares outstanding | | 46,340,118 | | — | | 46,340,118 |
| Net asset value per share | | $5.56 | | — | | $5.56 |
| Class R6 | | | | | | |
| Net assets | | $13,000,150 | | — | | $13,000,150 |
| Shares outstanding | | 2,480,292 | | — | | 2,480,292 |
| Net asset value per share | | $5.24 | | — | | $5.24 |
| (1) | Touchstone Advisors and Sentinel or their affiliates will bear 100% of the Reorganization expenses. As a result, there are no pro forma adjustments to net assets. |
| (2) | Holders of Class I shares of the Sentinel Small Company Fund will receive Class Y shares of the Touchstone Small Company Fund upon closing of the Reorganization. |
The Funds’ Management
Sentinel is the investment advisor to the Target Funds. Touchstone Advisors serves as the investment advisor to the Acquiring Funds. Touchstone Advisors employs a sub-advisor for each Acquiring Fund.
Investment Advisor
Touchstone Advisors, Inc.
303 Broadway, Suite 1100, Cincinnati, Ohio 45202
Touchstone Advisors has been a SEC-registered investment advisor since 1994. As of March 31, 2017, Touchstone Advisors had approximately $14.8 billion in assets under management. As the Acquiring Funds’ investment advisor, Touchstone Advisors reviews, supervises and administers the Acquiring Funds’ investment programs and also ensures compliance with the Acquiring Funds’ investment policies and guidelines.
Touchstone Advisors is responsible for selecting each Acquiring Fund’s sub-advisor(s), subject to approval by the Fund’s Board. Touchstone Advisors selects a sub-advisor that has shown good investment performance in its areas of expertise. Touchstone Advisors considers various factors in evaluating a sub-advisor, including:
| · | level of knowledge and skill; |
| · | performance as compared to its peers or benchmark; |
| · | consistency of performance over 5 years or more; |
| · | level of compliance with investment rules and strategies; |
| · | employees, facilities and financial strength; and |
Touchstone Advisors continually monitors each sub-advisor’s performance through various analyses and through in-person, telephone, and written consultations with the sub-advisor. Touchstone Advisors discusses its expectations for performance with each sub-advisor and provides evaluations and recommendations to the Touchstone Funds Board, including whether or not a sub-advisor’s contract should be renewed, modified, or terminated.
The SEC has granted an exemptive order that permits each Acquiring Trust or Touchstone Advisors, under certain conditions, to select or change unaffiliated sub-advisors, enter into new sub-advisory agreements or amend existing sub-advisory agreements without first obtaining shareholder approval. An Acquiring Fund must still obtain shareholder approval of any sub-advisory agreement with a sub-advisor affiliated with the Acquiring Trust or Touchstone Advisors other than by reason of serving as a sub-advisor to one or more funds in the Touchstone Funds. Shareholders will be notified of any material changes in an Acquiring Fund’s sub-advisory arrangements. After the Reorganizations, Touchstone Advisors and the Acquiring Trusts will continue to rely on this exemptive order.
Two or more sub-advisors may manage an Acquiring Fund from time to time, with each managing a portion of the Acquiring Fund’s assets. If an Acquiring Fund has more than one sub-advisor, Touchstone Advisors allocates how much of the Acquiring Fund’s assets are managed by each sub-advisor. Touchstone Advisors may change these allocations from time to time, often based upon the results of its evaluations of the sub-advisors.
Touchstone Advisors is responsible for the operations of the Acquiring Funds, except those that are subcontracted to a sub-advisor, custodian, transfer agent, sub-administrative agent, or other parties. For its services, Touchstone Advisors receives an investment advisory fee from each Acquiring Fund at an annualized rate based on the average daily net assets of the Acquiring Fund. Touchstone Advisors, and not the Acquiring Funds, pays sub-advisory fees to each sub-advisor from its advisory fee.
Additional Information
The Trustees of the Acquiring Trusts oversee generally the operations of the Acquiring Funds and the Acquiring Trusts. Each Acquiring Trust enters into contractual arrangements with various parties, including, among others, the Acquiring Funds’ investment advisor, custodian, transfer agent, accountants and distributor, who provide services to the Acquiring Funds. Shareholders are not parties to, or intended (or “third-party”) beneficiaries of, any of those contractual arrangements, and those contractual arrangements are not intended to create in any individual shareholder or group of shareholders any right to enforce the terms of the contractual arrangements against the service providers or to seek any remedy under the contractual arrangements against the service providers, either directly or on behalf of the Acquiring Trust.
This Joint Proxy Statement/Prospectus provides information concerning the Acquiring Trusts and the Acquiring Funds that you should consider in determining whether to invest in shares of the Acquiring Funds. The Acquiring Funds may make changes to this information from time to time. Neither this Joint Proxy Statement/Prospectus, the SAIs or any document filed as an exhibit to an Acquiring Trust’s registration statement of which these documents are a part, is intended to, nor does it, give rise to an agreement or contract between the Acquiring Trust or an Acquiring Fund and any shareholder, or give rise to any contract or other rights in any individual shareholder, group of shareholders or other person other than any rights conferred explicitly by federal or state securities laws that may not be waived.
Sub-Advisors and Portfolio Managers
Sub-Advisor: Fort Washington Investment Advisors, Inc., 303 Broadway, Suite 1200, Cincinnati, Ohio 45202
Fort Washington, an affiliate of Touchstone Advisors, serves as sub-advisor to the Acquiring Funds set forth below. As the sub-advisor, Fort Washington makes the daily decisions regarding buying and selling specific securities for each Acquiring Fund, according to the Acquiring Fund’s investment goals and strategies. Fort Washington has been a registered investment advisor since 1990 and provides investment advisory services to individuals, institutions, mutual funds and variable annuity products. As of March 31, 2017, Fort Washington managed approximately $48.5 billion in assets.
Touchstone Active Bond Fund
Timothy J. Policinski, CFA, is the primary manager of the Touchstone Active Bond Fund. Mr. Policinski is a Managing Director and Senior Portfolio Manager. He has worked at Fort Washington and managed the Fund since 2001. Mr. Policinski has over 20 years of fixed income management experience.
Daniel J. Carter, CFA, is the secondary manager of the Touchstone Active Bond Fund. Mr. Carter began as an Assistant Portfolio Manager of Fort Washington in 2000 and has been an Assistant Vice President and Portfolio Manager since 2007. He has managed the Fund since September 2001.
Touchstone Ultra Short Duration Fixed Income Fund
Scott D. Weston, Managing Director and Senior Portfolio Manager, joined Fort Washington in September 1999. He is also Fort Washington’s lead sector specialist in mortgage-backed and asset-backed securities. Mr. Weston is a graduate of the University of Utah with a BS in Political Science and the University of Cincinnati with an MBA in Finance. He has investment experience dating back to 1992 and is jointly and primarily responsible for the management of the Fund.
Brent A. Miller, CFA, Senior Portfolio Manager, joined Fort Washington in June 2001 and is jointly and primarily responsible for the management of the Fund. He became a portfolio manager in 2008 and was an assistant portfolio manager prior to 2008. Mr. Miller graduated Magna Cum Laude from the University of Evansville with a BS in Mathematics. He has investment experience dating back to 1999.
Touchstone Balanced Fund
James Wilhelm, Managing Director, Head of Public Equities, joined Fort Washington in 2002. Mr. Wilhelm has investment experience dating back to 1993. He began as a Senior Equity Analyst in 2002 and was named Portfolio Manager in 2005. He became Assistant Vice President in 2007, Vice President in 2008, Managing Director in 2014, and Head of Public Equities in 2015. He has co-managed the Touchstone Balanced Fund since its inception in 2017.
Timothy J. Policinski, CFA, is a Managing Director and Senior Portfolio Manager. Mr. Policinski has worked at Fort Washington since 2001. Mr. Policinski has over 20 years of fixed income management experience. He has co-managed the Touchstone Balanced Fund since its inception in 2017.
Daniel J. Carter, CFA, began as an Assistant Portfolio Manager of Fort Washington in 2000 and has been an Assistant Vice President and Portfolio Manager since 2007. Mr. Carter has co-managed the Touchstone Balanced Fund since its inception in 2017.
Touchstone Large Cap Focused Fund
James Wilhelm, Managing Director, Head of Public Equities, joined Fort Washington in 2002. He has investment experience dating back to 1993. He began as a Senior Equity Analyst in 2002 and was named Portfolio Manager in 2005. He became Assistant Vice President in 2007, Vice President in 2008, Managing Director in 2014, and Head of Public Equities in 2015. He has managed the Touchstone Large Cap Focused Fund since its inception in 2017.
For a discussion of the “Prior Performance For Similar Accounts Managed by Fort Washington for the Touchstone Large Cap Focused Fund,” see Exhibit D to this Joint Proxy Statement/Prospectus.
Touchstone International Equity Fund
Andrew Boczek, manages the Sentinel International Equity Fund and has been associated with Sentinel and managed or co-managed the Fund since 2012. He is expected to join Fort Washington upon the Closing of the Fund’s Reorganization and manage the Touchstone International Equity Fund thereafter. Prior to joining Sentinel, from 2006 to 2012, Mr. Boczek served as an analyst with Legend Capital Management, LLC. Prior to Legend Capital, Mr. Boczek served as an analyst on the International Value team at Artisan Partners LP from 2002 to 2006.
Touchstone Small Company Fund
Jason Ronovech, is lead manager of the Sentinel Small Company Fund and has co-managed or managed the Fund since 2013. He is expected to join Fort Washington upon the Closing of the Fund’s Reorganization and manage the Touchstone Small Company Fund thereafter.
Sub-Advisor: ClearArc Capital, Inc., 580 Walnut Street, 6th Floor, Cincinnati, Ohio 45202
ClearArc Capital serves as sub-advisor to the Touchstone Flexible Income Fund. As the sub-advisor, ClearArc Capital makes the daily decisions regarding buying and selling specific securities for the Touchstone Flexible Income Fund, according to the Fund’s investment goals and strategies. ClearArc Capital has been a registered investment advisor since 1975 and is a wholly-owned subsidiary of Fifth Third Bank. Fifth Third Bank is a wholly-owned subsidiary of Fifth Third Financial Corporation, which is in turn a wholly-owned subsidiary of Fifth Third Bancorp. ClearArc Capital provides comprehensive advisory services for institutional and personal clients. ClearArc Capital offers a diversified asset management product line utilizing commingled funds, and separate accounts. As of March 31, 2017, ClearArc Capital managed approximately $7 billion in assets. The following team of portfolio managers are jointly and primarily responsible for the management of the Touchstone Flexible Income Fund’s portfolio.
Touchstone Flexible Income Fund
Peter Kwiatkowski, CFA, is the Director of Growth and Income Strategies for ClearArc Capital. He joined ClearArc Capital in 2002 and has 17 years of investment experience. Prior to joining ClearArc Capital, he
worked in Fifth Third Bank’s Treasury Group where his responsibilities included structured finance, investments, balance sheet management, and economic analysis. Prior to that, Mr. Kwiatkowski served as a Portfolio Analyst for Pacific Investment Management Company (PIMCO). His previous experience also includes 7 years in real estate, most recently as the manager of a unit handling defaulted mortgages. He is a member of the Cincinnati Society of Financial Analysts and a volunteer financial counselor. He graduated summa cum laude from California State University at Long Beach with a B.S. in Finance, Real Estate, and Law and is a CFA charterholder.
David Withrow, CFA, is the Deputy Chief Investment Officer and Director of Taxable Fixed Income for ClearArc Capital. He joined ClearArc Capital in 2001 as a Senior Fixed Income Portfolio Manager and has 27 years of investment experience. Prior to that, Mr. Withrow served in a similar capacity for Fifth Third Bank Investment Advisors. He is a member of the Cincinnati Society of Financial Analysts and a Board member for The Cooperative for Education in Cincinnati, Ohio. Mr. Withrow graduated from Anderson University with a BA in Economics and is a CFA charterholder.
Mitchell Stapley, CFA, is the Chief Investment Officer for ClearArc Capital. He joined ClearArc Capital in 2001 and has 32 years of investment experience. Prior to joining ClearArc Capital, Mr. Stapley was the Chief Fixed Income Officer at Lyon Street Asset Management, a subsidiary of Old Kent Bank, which was later acquired by Fifth Third Bank. Previously, he was Manager of Short Term Investments/Foreign Exchange Exposure at Navistar International Corporation in Chicago. While at Navistar, he was responsible for both investment strategy and implementation, and foreign exchange hedging and trading. Prior to that, Mr. Stapley served as a Portfolio Manager for William Wrigley Jr. Company in Chicago. He is on the investment committee for the Western Michigan University Endowment Fund and has served as the President of the CFA Society of West Michigan. He graduated with a BA from Albion College and is a CFA charterholder.
John Cassady, CFA, is a Senior Portfolio Manager for ClearArc Capital. He joined ClearArc Capital in 2001 and has 26 years of investment experience. Prior to joining ClearArc Capital, he held a similar position at Lyon Street Asset Management, a subsidiary of Old Kent Bank, which was acquired by Fifth Third Bank. Previously, he was a fixed income portfolio manager at Atlantic Portfolio Analytics & Management (APAM) which has since been acquired by Semper Capital Management. He is a member of the CFA West Michigan Society. Mr. Cassady graduated from Georgia Institute of Technology with a BS in Industrial Management and is a CFA charterholder.
Sub-Advisor: Rockefeller & Co., Inc. 10 Rockefeller Plaza, Third Floor, New York, New York 10020
Rockefeller serves as sub-advisor to the Touchstone Sustainability and Impact Equity Fund. As the sub-advisor, Rockefeller makes the daily decisions regarding buying and selling specific securities for the Touchstone Sustainability and Impact Equity Fund, according to the Fund’s investment goals and strategies. Rockefeller is a global asset management and investment advisory firm that was founded in 1882 by John D. Rockefeller to manage the Rockefeller Family’s personal and philanthropic interests. Rockefeller was incorporated in 1979 and registered with the U.S. Securities and Exchange Commission in 1980 as an investment advisor. Today, Rockefeller provides investment management services and wealth advice to institutions, foundations and endowments, non-profits, individuals, trusts and families. The Fund’s investment strategy reflects Rockefeller’s Global Sustainability & Impact Equity Strategy, which is managed by two portfolio managers and supported by a team of financial analysts and dedicated sustainability and impact analysts. Rockefeller had approximately $6.4 billion in net assets under management as of March 31, 2017. The following individuals are jointly and primarily responsible for the management of the Touchstone Sustainability and Impact Equity Fund’s portfolio:
Touchstone Sustainability and Impact Equity Fund
David P. Harris, CFA, Chief Investment Officer and Managing Director, joined Rockefeller in 1999 and began managing the Fund in 2015. Prior to joining Rockefeller, Mr. Harris spent over three years with Stein Roe & Farnham, as Portfolio Manager of the Stein Roe International Fund and Stein Roe Emerging Markets Fund. He is a Chartered Financial Analyst charterholder and received an MBA with Distinction in Finance from Cornell University and a BA in Economics from the University of Michigan.
Jimmy C. Chang, CFA, Chief Investment Strategist, Managing Director and Senior Portfolio Manager, joined Rockefeller in 2004 and began managing the Fund in 2015. Prior to joining Rockefeller, Mr. Chang served as a Senior Vice President, Chief Technology Strategist and Senior Technology Analyst at the U.S. Trust Company of
New York, where he led technology equity research and co-managed a technology fund. He is a Chartered Financial Analyst charter holder and received an MBA in Finance/International Business from New York University and a BS (summa cum laude) in Electrical Engineering from The Cooper Union.
Investment Advisory Fees
Pursuant to investment advisory agreements, each of Sentinel and Touchstone Advisors, respectively, is entitled to receive a fee with respect to the average daily net assets of the Funds for which they act as investment advisor, which is paid monthly. The advisory fees payable to Sentinel with respect to the Target Funds and to Touchstone Advisors with respect to the Acquiring Funds are set forth in the table below. For each Acquiring Fund, Touchstone Advisors pays a sub-advisory fee to the applicable sub-advisor from its advisory fee. The following table sets forth each Fund’s advisory fee as a percentage of average daily net assets as of the date of this Joint Proxy Statement/Prospectus.
| Target Fund | | Acquiring Fund |
| | | |
| | Average Daily Net
Assets | | Investment
Advisory Fee
Rate
(Annualized) | | | Average Daily Net
Assets | | Investment
Advisory Fee
Rate
(Annualized) |
| | | | | | | | | |
| Sentinel Government Securities Fund | | Touchstone Active Bond Fund |
| | First $500 million | | 0.45% | | | First $300 million | | 0.40% |
| | Next $500 million | | 0.40% | | | Assets over $300 million | | 0.35% |
| | Next $1 billion | | 0.35% | | | | | |
| | Next $2 billion | | 0.30% | | | | | |
| | In excess of $4 billion | | 0.25% | | | | | |
| | | | | | | | | |
| Sentinel Total Return Bond Fund | | Touchstone Active Bond Fund |
| | First $200 million | | 0.55% | | | First $300 million | | 0.40% |
| | Next $200 million | | 0.50% | | | Assets over $300 million | | 0.35% |
| | Next $600 million | | 0.45% | | | | | |
| | Next $1 billion | | 0.40% | | | | | |
| | In excess of $2 billion | | 0.35% | | | | | |
| | | | | | | | | |
| Sentinel Low Duration Bond Fund | | Touchstone Ultra Short Duration Fixed Income Fund |
| | First $500 million | | 0.45% | | | All assets | | 0.25% |
| | Next $500 million | | 0.40% | | | | | |
| | Next $1 billion | | 0.35% | | | | | |
| | Next $2 billion | | 0.30% | | | | | |
| | In excess of $4 billion | | 0.25% | | | | | |
| Target Fund | | Acquiring Fund |
| | | |
| | Average Daily Net
Assets | | Investment
Advisory Fee
Rate
(Annualized) | | | Average Daily Net
Assets | | Investment
Advisory Fee
Rate
(Annualized) |
| | | | | | | | | |
| Sentinel Multi-Asset Income Fund | | Touchstone Flexible Income Fund |
| | First $200 million | | 0.55% | | | First $500 million | | 0.70% |
| | Next $200 million | | 0.50% | | | Assets over $500 million | | 0.60% |
| | Next $600 million | | 0.45% | | | | | |
| | Next $1 billion | | 0.40% | | | | | |
| | In excess of $2 billion | | 0.35% | | | | | |
| | | | | | | | | |
| Sentinel Sustainable Core Opportunities Fund | | Touchstone Sustainability and Impact Equity Fund |
| | First $500 million | | 0.70% | | | First $200 million | | 0.75% |
| | Next $300 million | | 0.65% | | | Next $800 million | | 0.70% |
| | Next $200 million | | 0.60% | | | Assets over $1 billion | | 0.65% |
| | Next $1 billion | | 0.50% | | | | | |
| | In excess of $2 billion | | 0.40% | | | | | |
| | | | | | | | | |
| Sentinel Balanced Fund | | Touchstone Balanced Fund |
| | First $200 million | | 0.55% | | | First $200 million | | 0.55% |
| | Next $200 million | | 0.50% | | | Next $200 million | | 0.50% |
| | Next $600 million | | 0.45% | | | Next $600 million | | 0.45% |
| | Next $1 billion | | 0.40% | | | Next $1 billion | | 0.40% |
| | In excess of $2 billion | | 0.35% | | | Assets over $2 billion | | 0.35% |
| | | | | | | | | |
| Sentinel Common Stock Fund | | Touchstone Large Cap Focused Fund |
| | First $500 million | | 0.70% | | | First $500 million | | 0.70% |
| | Next $300 million | | 0.65% | | | Next $300 million | | 0.65% |
| | Next $200 million | | 0.60% | | | Next $200 million | | 0.60% |
| | Next $1 billion | | 0.50% | | | Next $1 billion | | 0.50% |
| | In excess of $2 billion | | 0.40% | | | Assets over $2 billion | | 0.40% |
| Target Fund | | Acquiring Fund |
| | | |
| | Average Daily Net
Assets | | Investment
Advisory Fee
Rate
(Annualized) | | | Average Daily Net
Assets | | Investment
Advisory Fee
Rate
(Annualized) |
| | | | | | | | | |
| Sentinel International Equity Fund | | Touchstone International Equity Fund |
| | First $500 million | | 0.70% | | | First $500 million | | 0.70% |
| | Next $300 million | | 0.65% | | | Next $300 million | | 0.65% |
| | Next $200 million | | 0.60% | | | Next $200 million | | 0.60% |
| | Next $1 billion | | 0.50% | | | Next $1 billion | | 0.50% |
| | In excess of $2 billion | | 0.40% | | | Assets over $2 billion | | 0.40% |
| | | | | | | | | |
| Sentinel Small Company Fund | | Touchstone Small Company Fund |
| | First $500 million | | 0.70% | | | First $500 million | | 0.70% |
| | Next $300 million | | 0.65% | | | Next $300 million | | 0.65% |
| | Next $200 million | | 0.60% | | | Next $200 million | | 0.60% |
| | Next $1 billion | | 0.50% | | | Next $1 billion | | 0.50% |
| | In excess of $2 billion | | 0.40% | | | Assets over $2 billion | | 0.40% |
The following table sets forth the advisory fees for Touchstone Flexible Income Fund and Touchstone Sustainability and Impact Fund as a percentage of average daily net assets effective upon the consummation of the Reorganizations.
| | Average Daily Net
Assets | | Investment
Advisory Fee
Rate
(Annualized) | |
| | | | | |
| Touchstone Flexible Income Fund | |
| | First $500 million | | 0.60% | |
| | Assets over $500 million | | 0.50% | |
| | | | | |
| Touchstone Sustainability and Impact Equity Fund | |
| | First $1 billion | | 0.65% | |
| | Assets over $1 billion | | 0.60% | |
The SAI for each Fund provides additional information about the portfolio managers’ method of compensation, other accounts managed by each portfolio manager and, except with respect to Shell Funds, investments in the Fund or Funds that they manage.
Advisory and Sub-Advisory Agreement Approval
A discussion of the basis for the Sentinel Funds Board’s approval of the Target Funds’ advisory agreement is included in the Sentinel Funds’ Annual Report for the fiscal year ended November 30, 2016 for the Target Funds. A discussion of the basis for the Touchstone Funds Board’s approval of the advisory agreement with Touchstone Advisors and sub-advisory agreements with Fort Washington, ClearArc Capital and Rockefeller will be included in the Annual Report for the period ending November 30, 2017 with respect to the Shell Funds, and is included in the Annual Report for the fiscal year ended March 31, 2017 with respect to the Touchstone Flexible Income Fund and Touchstone Sustainability and Impact Equity Fund, and the Semi-Annual Report for the period ending March 31, 2017 with respect to the Touchstone Active Bond Fund and the Touchstone Ultra Short Duration Fixed Income Fund.
Expense Limitation Agreement
Target Funds. Sentinel has contractually agreed, effective March 30, 2017, to reimburse certain expenses paid by the Class I shares of the Target Funds to the extent necessary to prevent the total annual fund operating expense ratio of the Class I shares of the Target Funds, on an annualized basis, from exceeding the total annual fund operating expense ratio of the Class A shares of the same Target Fund. This agreement will continue through March 31, 2018.
Sentinel has contractually agreed, effective March 30, 2017, to waive fees and/or reimburse certain expenses in order to limit Total Annual Fund Operating Expenses After Fee Waiver and/or Expense Reimbursement for Class A shares of the Total Return Bond Fund, on an annualized basis, to 0.89% of average daily net assets attributable to Class A shares through March 31, 2018. In addition, Sentinel has contractually agreed, effective
March 30, 2017, to waive fees and/or reimburse certain expenses in order to limit Total Annual Fund Operating Expenses After Fee Waiver and/or Expense Reimbursement for Class R6 shares, on an annualized basis, to 0.69% of average daily net assets attributable to Class R6 shares through March 31, 2018, and to waive fees and/or reimburse certain expenses in order to limit Total Annual Fund Operating Expenses After Fee Waiver and/or Expense Reimbursement for Class R3 shares, on an annualized basis, to 1.19% of average daily net assets attributable to Class R3 shares through March 31, 2018.
Sentinel has contractually agreed, effective March 30, 2017, to waive fees and/or reimburse certain expenses in order to limit Total Annual Fund Operating Expenses After Fee Waiver and/or Expense Reimbursement for Class R6 shares of the Sentinel Common Stock Fund, on an annualized basis, to 0.65% of average daily net assets attributable to Class R6 shares through March 31, 2018. Sentinel is entitled to recoup from the Sentinel Common Stock Fund any fees waived and/or expenses reimbursed with respect to any class for a three year period following the date of such fee waiver and/or reimbursement if such recoupment does not cause the Total Annual Fund Operating Expenses of a class of the Sentinel Common Stock Fund at the time of such reimbursement to exceed the expense limit in effect at the time of the applicable waiver/reimbursement or the expense limit in effect at the time of the recoupment, whichever is less. Sentinel generally seeks reimbursement on a rolling three year basis whereby the oldest subsidies are recouped first.
Sentinel has contractually agreed, effective March 30, 2017, to waive fees and/or reimburse certain expenses in order to limit Total Annual Fund Operating Expenses After Fee Waiver and/or Expense Reimbursement for Class R6 shares of the Sentinel Small Company Fund, on an annualized basis, to 0.73% of average daily net assets attributable to Class R6 shares through March 31, 2018. Sentinel is entitled to recoup from the Sentinel Small Company Fund any fees waived and/or expenses reimbursed with respect to any class for a three year period following the date of such fee waiver and/or reimbursement if such recoupment does not cause the Total Annual Fund Operating Expenses of a class of the Sentinel Small Company Fund at the time of such reimbursement to exceed the expense limit in effect at the time of the applicable waiver/reimbursement or the expense limit in effect at the time of the recoupment, whichever is less. Sentinel generally seeks reimbursement on a rolling three year basis whereby the oldest subsidies are recouped first.
Each of the Expense Limitation Agreements for the Target Funds discussed above may be terminated upon 90 days’ notice by a majority of the non-interested directors of the Sentinel Funds Board.
Acquiring Funds. Touchstone Advisors has contractually agreed to waive the Acquiring Funds’ fees and reimburse expenses in order to limit the total annual operating expenses (excluding dividend and interest expenses relating to short sales, interest, taxes, brokerage commissions and other transaction costs, portfolio transactions and investment related expenses, other expenditures which are capitalized in accordance with U.S. generally accepted accounting principles, the cost of “Acquired Fund Fees and Expenses,” if any, and other extraordinary expenses not incurred in the ordinary course of business) of each share class of each Acquiring Fund offered hereby, on an annualized basis, to an amount no greater than the net expense amounts of the corresponding class of shares of the corresponding Target Fund as of the fiscal year ended November 30, 2016 for two years following the Reorganization. Absent this expense limitation, the pro forma total annual fund operating expense ratio of certain classes of shares of an Acquiring Fund may be higher than the total annual fund operating expenses before any waivers and reimbursements of the corresponding class of the corresponding Target Fund. Such expense limits are set forth in the table below and will remain in place with respect to each Acquiring Fund for a period of two years from the Closing of the corresponding Target Fund’s Reorganization. The Acquiring Funds’ expenses may be higher following the expiration of the expense limitation agreement.
Target Fund and Share
Class | | Expense Limit | | Corresponding
Acquiring Fund
and Share Class | | Expense Limit |
| | | | | | | |
| Sentinel Government Securities Fund | | | | Touchstone Active Bond Fund | | |
| Class A | | — | | Class A | | 0.90% |
| Class C | | — | | Class C | | 1.65% |
| Class I | | —(1) | | Class Y | | 0.65% |
| | | | | | | |
| Sentinel Total Return Bond Fund | | | | Touchstone Active Bond Fund | | |
| Class A | | 0.89% | | Class A | | 0.90% |
| Class C | | — | | Class C | | 1.65% |
| Class I | | —(1) | | Class Y | | 0.65% |
| Class R3 | | 1.19% | | Class A | | 0.90% |
| Class R6 | | 0.69% | | Class Y | | 0.65% |
| | | | | | | |
| Sentinel Low Duration Bond Fund | | | | Touchstone Ultra Short Duration Fixed Income Fund | | |
| Class A | | — | | Class A | | 0.69% |
| Class I | | —(1) | | Class Y | | 0.44% |
| Class S | | — | | Class S | | 0.94% |
| | | | | | | |
| Sentinel Multi-Asset Income Fund | | | | Touchstone Flexible Income Fund* | | |
| Class A | | — | | Class A | | 1.09% |
| Class C | | — | | Class C | | 1.84% |
| Class I | | — (1) | | Class Y | | 0.84% |
| | | | | | | |
| Sentinel Sustainable Core Opportunities Fund | | | | Touchstone Sustainability and Impact Equity Fund | | |
| Class A | | — | | Class A | | 1.17% |
| Class I | | —(1) | | Class Y | | 0.90% |
| | | | | | | |
| Sentinel Balanced Fund | | | | Touchstone Balanced Fund | | |
| Class A | | — | | Class A | | 1.01% |
| Class C | | — | | Class C | | 1.78% |
| Class I | | —(1) | | Class Y | | 0.81% |
Target Fund and Share
Class | | Expense Limit | | Corresponding
Acquiring Fund
and Share Class | | Expense Limit |
| | | | | | | |
| Sentinel Common Stock Fund | | | | Touchstone Large Cap Focused Fund | | |
| Class A | | — | | Class A | | 1.00% |
| Class C | | — | | Class C | | 1.79% |
| Class I | | —(1) | | Class Y | | 0.72% |
| Class R6 | | 0.69% | | Institutional Class | | 0.65% |
| | | | | | | |
| Sentinel International Equity Fund | | | | Touchstone International Equity Fund | | |
| Class A | | — | | Class A | | 1.36% |
| Class C | | — | | Class C | | 2.49% |
| Class I | | —(1) | | Class Y | | 0.99% |
| | | | | | | |
| Sentinel Small Company Fund | | | | Touchstone Small Company Fund | | |
| Class A | | — | | Class A | | 1.22% |
| Class C | | — | | Class C | | 1.95% |
| Class I | | —(1) | | Class Y | | 0.89% |
| Class R6 | | 0.73% | | Class R6 | | 0.73% |
| * | Effective upon consummation of the Reorganization, Touchstone Advisors has agreed annual Fund operating expenses to 1.04%, 1.79% and 0.79% of average daily net assets for Classes A, C, and Y shares, respectively for two year following the Reorganization. |
| (1) | For each Target Fund, the expense limit for the Target Fund’s Class I shares, on an annualized basis, is equal to the total annual fund operating expense ratio of the Target Fund’s Class A shares. Therefore, the expense limit for each Target Fund’s Class I shares may vary over time depending on the resulting total annual fund operating expense ratio of the Target Fund’s Class A shares. |
Other Service Providers
The Target Funds engage and the Acquiring Funds will engage the service providers set forth in the chart below.
| | | Target Funds’ Service Providers | | Acquiring Funds’
Service Providers |
| | | | | |
| Principal Underwriter | | Sentinel Financial Services Company | | Touchstone Securities, Inc. |
| | | | | |
| Administrator | | Sentinel Administrative Services, Inc. | | Touchstone Advisors, Inc. |
| | | | | |
| Sub-Administrator | | N/A | | BNY Mellon Investment Servicing (US) Inc. |
| | | | | |
| Transfer Agent | | Boston Financial Data Services, Inc. | | BNY Mellon Investment Servicing (US) Inc. |
| | | | | |
| Custodian | | State Street Bank & Trust Company | | Brown Brothers Harriman & Co. |
| | | | | |
| Independent Registered Public Accounting Firm | | PricewaterhouseCoopers LLP | | Ernst & Young LLP |
Share Classes of the Target Funds and Acquiring Funds
Share Class Offerings. The share classes offered by the Target Funds and the corresponding share classes offered by the Acquiring Funds are listed in the table below.
| FUNDS |
| Sentinel Government Securities | Touchstone Active Bond | Sentinel Total Return Bond | Touchstone Active Bond | Sentinel Low Duration Bond | Touchstone Ultra Short Duration Fixed Income | Sentinel Multi Asset Income | Touchstone Flexible Income | Sentinel Sustainable Core Opportunities | Touchstone Sustainability and Impact Equity | Sentinel Balanced | Touchstone Balanced | Sentinel Common Stock | Touchstone Large Cap Focused | Sentinel International Equity | Touchstone International Equity | Sentinel Small Company | Touchstone Small Company |
| A | A | A | A | A | A | A | A | A | A | A | A | A | A | A | A | A | A |
| C | C | C | C | I | Y | C | C | I | Y | C | C | C | C | C | C | C | C |
| I | Y | I | Y | S | S | I | Y | | | I | Y | I | Y | I | Y | I | Y |
| | | R3 | A | | | | | | | | | R6 | Inst | | | R6 | R6 |
| | | R6 | Y | | | | | | | | | | | | | | |
If a Reorganization is consummated, shareholders of the Target Fund will receive shares of the corresponding class of the Acquiring Fund in the Reorganization. Nothing contained herein will be construed as an offer to purchase or otherwise acquire shares of any Acquiring Fund other than in connection with the applicable Reorganization. The Touchstone Funds Board has reserved the right to create and issue additional classes of any Acquiring Fund following the Reorganizations. Each share of a series or class represents an equal proportionate interest in that series or class with each other share of that series or class. Shares of each series or class generally vote together on fund- or trust-wide matters, except when required under federal securities laws to vote separately on matters that only affect a particular series or class, such as the approval of a distribution plan for a particular class.
Buying and Selling Fund Shares
The Target Funds’ and the Acquiring Funds’ minimum investment requirements are set forth in the table below. Each Fund reserves the right to reduce or waive these minimums in certain instances.
| | | Class A and Class C | | Class S | | Class Y |
| | | Initial
Investment(1) | | Subsequent
Investment | | Initial
Investment(1) | | Subsequent
Investment | | Initial
Investment(1) | | Subsequent
Investment |
| | | | | | | | | | | | | |
| Target Funds | | | | | | | | | | | | |
| | | | | | | | | | | | | |
| Regular Account and Individual Retirement Account | | $1,000 | | $50 | | $1,000 | | $50 | | N/A | | N/A |
| | | Class A and Class C | | Class S | | Class Y |
| | | Initial
Investment(1) | | Subsequent
Investment | | Initial
Investment(1) | | Subsequent
Investment | | Initial
Investment(1) | | Subsequent
Investment |
| | | | | | | | | | | | | |
| Institutional Investors Retirement Account | | $1,000 | | None | | $1,000,000 | | None | | N/A | | N/A |
| Automatic Investment Plan | | $50 | | $50 | | $50 | | $50 | | N/A | | N/A |
| Other Accounts(2) | | $1,000 | | None | | $1,000 | | None | | N/A | | N/A |
| | | | | | | | | | | | | |
| Acquiring Funds | | | | | | | | | | | | |
| | | | | | | | | | | | | |
| Regular Account | | $2,500 | | $50 | | $1,000 | | $50 | | $2,500 | | $50 |
| Retirement Account or Custodial Account under the Uniform Gifts/Transfers to Minors Act | | $1,000 | | $50 | | $1,000 | | $50 | | $1,000 | | $50 |
| Automatic Investment Plan | | $100 | | $50 | | $100 | | $50 | | $100 | | $50 |
| (1) | The initial investment minimum will be waived with respect to shareholder accounts opened in connection with the Reorganizations. |
| (2) | For the Target Funds, Other Accounts include retirement plans with omnibus accounts held on the books of the Fund, fee based investment advisory platforms, qualified tuition programs established under Section 529 of the Code, and registered investment companies. |
Class I shares of the Target Funds are only available to institutional investors, with certain limited exceptions. There is a $1 million initial investment minimum for institutional investors, with certain exceptions.
Class R3 shares of the Target Funds are only available to employer sponsored group retirement and group 529 college savings plans. To be eligible, shares must be held through plan administrator level or omnibus accounts held on the books of the Fund.
Class R6 shares of the Target Funds are available to certain employer sponsored group retirement and group 529 college savings plans; registered investment companies; institutions, trusts and foundations with a $1 million initial investment; and certain fee-based advisory programs.
Institutional Class shares of the Touchstone Large Cap Focused Fund are available through Touchstone Securities or your financial intermediary. There is a $500,000 initial investment minimum for Institutional shares.
Class R6 shares of the Touchstone Small Company Fund are generally available only to institutional investors, which include but are not limited to certain employer sponsored group retirement and group 529 college savings plans; registered investment companies; institutions, trusts and foundations; and certain fee-based advisory programs which have entered into agreements with the Distributor or the Fund to offer R6 shares.
You may buy and sell shares in the Acquiring Funds on a day when the NYSE is open for trading. Class A and Class C shares may be purchased and sold directly from Touchstone Securities or through your financial intermediary. Class Y shares are available only through financial intermediaries who have appropriate selling agreements in place with Touchstone Securities. Acquiring Fund shares may be purchased or sold by writing to Touchstone Securities at P.O. Box 9878, Providence, Rhode Island 02940, calling 800.543.0407, or visiting the
Touchstone Funds’ website: TouchstoneInvestments.com. You may only sell shares over the telephone or via the Internet if the value of the shares sold is less than or equal to $100,000. Acquiring Fund shares held in IRA accounts and qualified retirement plans cannot be sold by telephone or via the Internet. If your shares are held by a processing organization or financial intermediary you will need to follow its purchase and redemption procedures.
Regardless the method of payment selected (e.g., check, wire, Automated Clearing House (“ACH”) transaction), payments for redemptions of shares of the Acquiring Funds are sent within seven days (normally within 3 business days) after receipt of a proper redemption request in accordance with the requirements set forth in the “Investing with Touchstone” section below. The Acquiring Funds generally intend to pay all redemptions in cash. However, the Acquiring Funds reserve the right to redeem in kind, under certain unusual circumstances (such as a period of unusually high market volatility), by paying you the proceeds in portfolio securities rather than in cash. In-kind redemptions are taxable to you for federal income tax purposes in the same manner as cash redemptions. For more information about buying and selling shares see “Investing with Touchstone” or call 800.543.0407.
Similarly, regardless the method of payment selected, payments for redemptions of shares of the Target Funds are sent within seven days after receipt of a proper redemption request. If a redemption is paid by check, the Target Funds’ transfer agent will normally mail shareholders a check in payment for their shares within seven days after it receives all documents required to process the redemption. In addition, while the Target Funds generally intend to pay all redemptions in cash, each Target Fund may, at its discretion, redeem its shares in kind. If this occurs, securities received in kind remain at the risk of the market, and the redeeming shareholder may incur brokerage or other transaction costs to convert the securities to cash. If illiquid securities are used to satisfy redemptions in kind, redeeming shareholders may face difficulties in selling the illiquid securities at a fair price.
Financial Intermediary Compensation
If you purchase shares in a Fund through a broker-dealer or other financial intermediary (such as a bank), the Fund and its related companies may pay the intermediary for the sale of Fund shares and related services. These payments may create a conflict of interest by influencing the broker-dealer or other financial intermediary and your salesperson to recommend the Fund over another investment. Ask your salesperson or visit your financial intermediary’s website for more information.
Exchange Privileges of the Funds
The Funds are subject to the exchange privileges listed below.
Target Funds. You may exchange shares of one Sentinel Fund for shares of the same class of another Sentinel Fund, if available, without charge by contacting the Sentinel Fund’s transfer agent. You may also set up your account to exchange automatically a specified number or dollar-value of shares in one of the Sentinel Funds into shares of the same class in another Sentinel Fund at regular intervals. New purchases of any class of shares must remain in an account for 15 days before they can be exchanged to another Sentinel Fund. Sentinel Funds may modify or terminate the exchange privilege in accordance with the rules of the Securities and Exchange Commission (the current rules require 60 days advance notice to shareholders prior to the modification or termination of the exchange privilege).
Acquiring Funds. Shares of a Touchstone Fund may be exchanged into the same share class of another Touchstone Fund at NAV as long as applicable investment minimums and proper selling agreement requirements are met. Touchstone Funds that are closed to new investors may not accept exchanges. You do not have to pay any exchange fee for your exchange, but if you exchange from a fund with a lower load schedule to a fund with a higher load schedule you may be charged the load differential. You may realize a taxable gain if you exchange shares of the Acquiring Fund for shares of another Touchstone Fund.
Distribution Policy
Acquiring Funds. Each Acquiring Fund intends to distribute to its shareholders substantially all of its income and capital gains. The table below outlines when dividends, if any, are declared and paid by each Acquiring Fund:
| Acquiring Fund | | Dividends Declared/Dividends Paid |
| | | |
| Touchstone Active Bond Fund | | Monthly/Monthly |
| Touchstone Ultra Short Duration Fixed Income Fund | | Daily/Monthly |
| Touchstone Flexible Income Fund | | Monthly/Monthly |
| Touchstone Sustainability and Impact Equity Fund | | Annually/Annually |
| Touchstone Balanced Fund | | Annually/Annually |
| Touchstone Large Cap Focused Fund | | Annually/Annually |
| Touchstone International Equity Fund | | Annually/Annually |
| Touchstone Small Company Fund | | Annually/Annually |
Each Acquiring Fund intends to make distributions of capital gains, if any, at least annually. If you own shares on an Acquiring Fund’s distribution record date, you will be entitled to receive the distribution.
You will receive income dividends and distributions of capital gains in the form of additional Acquiring Fund shares unless you elect to receive payment in cash. Shareholders of a Target Fund who currently have their dividends or distributions reinvested will have dividends or distributions received from the corresponding Acquiring Fund reinvested in the corresponding share class of the Acquiring Fund after the Reorganization. Shareholders of a Target Fund who have elected to receive dividends or distributions in cash will receive dividends or distributions from the corresponding Acquiring Fund in cash after the Reorganization, although they may, after the Reorganization, elect to have both dividends and distributions reinvested in additional shares of the Acquiring Fund.
Cash payments will only be made for amounts equal to or exceeding $25. For amounts less than $25, the dividends and distributions will be automatically reinvested in the paying Acquiring Fund and class. To elect cash payments, you must notify the Acquiring Funds in writing or by phone prior to the date of distribution. Your election will be effective for dividends and distributions paid after we receive your notice. To cancel your election, simply send written notice to Touchstone Investments, P.O. Box 9878, Providence, Rhode Island 02940, or by overnight mail to Touchstone Investments, c/o BNY Mellon Investment Servicing (US) Inc., 4400 Computer Drive, Westborough, Massachusetts 01581, or call Touchstone Securities at 800.543.0407. If you hold your shares through a financial institution, you must contact the institution to elect cash payment. If you elect to receive dividends and distributions in cash and the payment (1) is returned and marked as “undeliverable” or (2) is not cashed for six months, your cash election will be changed automatically and future dividends will be reinvested in the Acquiring Fund at the per share NAV determined as of the date of cancellation.
An Acquiring Fund’s dividends and other distributions are taxable to shareholders (other than retirement plans and other tax-exempt investors) whether received in cash or reinvested in additional shares of the Acquiring Fund. A dividend or distribution paid by an Acquiring Fund, has the effect of reducing the NAV per share on the ex-dividend date by the amount of the dividend or distribution. A dividend or distribution declared shortly after a purchase of shares by an investor would, therefore, represent, in substance, a return of capital to the shareholder with respect to such shares even though it would be subject to federal income taxes.
For most shareholders, a statement will be sent to you after the end of each calendar year detailing the federal income tax status of your distributions. Please see “Federal Income Tax Information” below for more information on the federal income tax consequences of dividends and other distributions made by an Acquiring Fund.
Distribution and Shareholder Servicing Arrangements
for the Acquiring Funds
Rule 12b-1 Distribution Plans. Each Acquiring Fund has adopted a distribution plan under Rule 12b-1 of the 1940 Act with respect to its Class A shares and Class C shares. In addition, the Touchstone Ultra Short Duration Fixed Income Fund has adopted a distribution plan under Rule 12b-1 of the 1940 Act with respect to its Class S shares. The plans allow each Acquiring Fund to pay distribution and other fees for the sale and distribution of its shares and for services provided to shareholders. Under the Class A plan, the Acquiring Funds pay an annual fee of up to 0.25% of average daily net assets that are attributable to Class A shares. Under the Class C plan, the Acquiring Funds pay an annual fee of up to 1.00% of average daily net assets that are attributable to Class C shares (of which
up to 0.75% is a distribution fee and up to 0.25% is a shareholder servicing fee). Under the Class S plan, the Touchstone Ultra Short Duration Fixed Income Fund pays an annual fee of up to 0.50% of average daily net assets that are attributable to Class S shares (of which up to 0.25% is a distribution fee and up to 0.25% is a shareholder servicing fee). Because these fees are paid out of an Acquiring Fund’s assets on an ongoing basis, they will increase the cost of your investment and over time may cost you more than paying other types of sales charges.
Additional Compensation to Financial Intermediaries. Touchstone Securities, the Acquiring Trusts’ principal underwriter, at its own expense (from a designated percentage of its income) currently provides additional compensation to certain dealers. Touchstone Securities pursues a focused distribution strategy with a limited number of dealers who have sold shares of the Acquiring Fund or other Touchstone Funds. Touchstone Securities reviews and makes changes to the focused distribution strategy on a periodic basis. These payments are generally based on a pro rata share of a dealer’s sales. Touchstone Securities may also provide compensation in connection with conferences, sales, or training programs for employees, seminars for the public, advertising, and other dealer-sponsored programs.
Touchstone Advisors, at its own expense, may also provide additional compensation to certain affiliated and unaffiliated dealers, financial intermediaries or service providers for certain services including distribution, administrative, sub-accounting, sub-transfer agency or shareholder servicing activities. These additional cash payments to a financial intermediary are payments over and above sales commissions or reallowances, distribution fees or servicing fees (including networking, administration, and sub-transfer agency fees). These additional cash payments also may be made as an expense reimbursement in cases where the financial intermediary bears certain costs in connection with providing shareholder services to Acquiring Fund shareholders. Touchstone Advisors may also reimburse Touchstone Securities for making these payments.
Touchstone Advisors and its affiliates may also pay cash compensation in the form of finders’ fees or referral fees that vary depending on the dollar amount of shares sold. The amount and value of additional cash payments vary for each financial intermediary. The additional cash payment arrangement between a particular financial intermediary and Touchstone Advisors or its affiliates may provide for increased rates of compensation as the dollar value of each Fund’s shares or particular class of shares sold or invested through such financial intermediary increases. The availability of these additional cash payments, the varying fee structure within a particular additional cash payment arrangement and the basis for and manner in which a financial intermediary compensates its sales representatives may create a financial incentive for a particular financial intermediary and its sales representatives to recommend the Acquiring Fund’s shares over the shares of other mutual funds based, at least in part, on the level of compensation paid. You should consult with your financial intermediary and review carefully any disclosure by the financial firm as to compensation received by your financial intermediary. Although the Acquiring Fund may use financial firms that sell the Fund’s shares to effect portfolio transactions for the Fund, the Fund and Touchstone Advisors will not consider the sale of the Fund’s shares as a factor when choosing financial firms to effect those transactions. For more information on payment arrangements, please see the section entitled “Touchstone Securities” in the SAI of the Shell Funds relating to this Joint Proxy Statement/Prospectus and the SAI of the Operating Funds, each of which is incorporated by reference into this Joint Proxy Statement/Prospectus.
Information on Shareholders’ Rights
The following is a comparison of certain important provisions of the governing instruments and governing laws of the Funds, but is not a complete description. Further information about the Target Funds’ governance structure is contained in their SAI and governing documents, which are on file with the SEC. Further information about the Acquiring Funds’ governance structure is contained in the SAIs related to each Acquiring Fund and each Acquiring Fund’s governing documents, which are on file with the SEC.
Organization and Governing Law. The Funds are open-end, management investment companies. Sentinel Group Funds, Inc. is a Maryland corporation. Touchstone Strategic Trust is a Massachusetts business trust. Touchstone Funds Group Trust is a Delaware statutory trust. The Target Funds are series of Sentinel Group Funds, Inc. and the Acquiring Funds consist of series of Touchstone Strategic Trust and series of Touchstone Funds Group Trust. A Fund organized as a Massachusetts business trust is governed by the trust’s declaration of trust and by-laws or similar instruments. The power and authority to manage the Fund and its affairs reside with the trustees, and
shareholder rights are generally limited to those provided to the shareholders in the declaration of trust or similar instrument, rather than by statute. A Fund organized as a Maryland corporation is governed both by the Maryland General Corporation Law (the “MGCL”) and its charter and Bylaws. For a Maryland corporation, unlike a Massachusetts business trust, the MGCL prescribes many aspects of corporate governance. A Fund organized as a Delaware statutory trust is governed by Delaware law and the trust’s declaration of trust and by-laws or similar instruments. The Funds are also governed by applicable federal law. Each Fund and its business and affairs are managed under the supervision of its Board of Directors or Board of Trustees (each a “Board”).
| | | Sentinel Group Funds,
Inc. | | Touchstone Strategic
Trust | | Touchstone Funds
Group Trust |
| | | | | | | |
| Form of Organization: | | Maryland corporation | | Massachusetts business trust | | Delaware statutory trust |
| | | | | | | |
| Preemptive Rights: | | None, other than as the Sentinel Fund Board may establish. | | None | | None |
| | | | | | | |
| Conversion Rights: | | As may be determined by the Sentinel Funds Board, in accordance with applicable law, shares of a particular series or class of stock may be automatically converted into shares of another class of stock of such series based on the relative net asset values of such classes at the time of the conversion, subject to any conditions of conversion imposed by the Sentinel Funds Board. | | Subject to compliance with the requirements of the 1940 Act, the trustees shall have the authority to provide that holders of shares of any series shall have the right to convert said shares into shares of one or more other series of shares in accordance with such requirements and procedures as may be established by the Board. | | The different series shall be established and designated, and the variations in relative rights and preferences as between the different series shall be fixed and determined, by the Board. |
| | | | | | | |
| Annual Meetings: | | The corporation shall not be required to hold an annual meeting of stockholders in any year in which the election of directors is not required to be acted upon under the 1940 Act. In the event that the corporation is required to hold a meeting of stockholders to elect directors under the 1940 Act, such meeting shall be designated the annual meeting of stockholders. | | The Funds are not required to hold annual shareholder meetings under their declaration of trust and bylaws. | | The Funds are not required to hold annual shareholder meetings under their declaration of trust and bylaws. |
| | | Sentinel Group Funds,
Inc. | | Touchstone Strategic
Trust | | Touchstone Funds
Group Trust |
| | | | | | | |
| Right to Call Shareholder Meetings: | | The chairman of the board, president, chief executive officer or the Sentinel Funds Board may call a special meeting of the stockholders. Subject to certain conditions and procedures set forth in Sentinel Funds’ Bylaws, a special meeting of stockholders shall also be called by the secretary of the corporation upon the written request of stockholders entitled to cast not less than 25% of all the votes entitled to be cast at such meeting. | | A meeting of the shareholders of the Trust may be called at any time by the Board or by application of shareholders holding at least 25% of the shares of the Trust or one or more series then outstanding. A special meeting of shareholders shall be called for the purpose of voting on the removal of any trustee upon the written request of the holders of 10% of the shares then outstanding. | | Meetings of the shareholders may be called by the trustees for the purpose of electing trustees and for such other purposes as may be prescribed by law, by the declaration of trust or by the by-laws. A meeting of the shareholders may be called at any time by the Board or by the Chair of the Board or by the President. |
| | | | | | | |
| Notice of Meetings: | | Written or printed notice shall be given by any means permitted by Maryland law at least 10 days, but not more than 90 days, days before each meeting of stockholders. | | Written notice of any meeting of shareholders shall be given or caused to be given by the Trustees by mailing such notice at least seven days before such meeting, postage prepaid, stating the time, place and purpose of the meeting, to each shareholder at the shareholder’s address as it appears on the records of the Trust. | | Written notice of any meeting of shareholders shall be given or caused to be given by the Trustees by mailing such notice at least seven days, but not more than 75 days, before such meeting, postage prepaid, stating the time and place of the meeting, to each shareholder at the shareholder’s address as it appears on the records of the Trust. |
| | | | | | | |
| Record Date for Meetings: | | The Sentinel Funds Board may set, in advance, a record date which shall not be prior to the close of business on the day the record date is fixed and shall be at least 10 days, but not more than 90 days, before the date on which the meeting of stockholders is to be held. | | The trustees may fix a date not more than 60 days prior to the date of any meeting of shareholders. | | The Board may fix in advance a record date at least seven days, but not more than 90 days, before the date of any such meeting. |
| | | Sentinel Group Funds,
Inc. | | Touchstone Strategic
Trust | | Touchstone Funds
Group Trust |
| | | | | | | |
| Quorum for Meetings and Adjournments: | | The presence in person or by proxy of the holders of shares entitled to cast one-third of the votes entitled to be cast (without regard to series or class) shall constitute a quorum at any meeting of the stockholders, except with respect to any matter which, under the 1940 Act or other applicable statutes or regulations or the charter of Sentinel Funds, requires approval by a separate vote of one or more classes of stock, in which case the presence in person or by proxy of the holders of one-third of the shares of stock of each class required to vote as a class on the matter shall constitute a quorum. | | A majority of the shares entitled to vote shall be a quorum for the transaction of business at a shareholders’ meeting, but any lesser number shall be sufficient for adjournments. | | Except when a larger quorum is required by applicable law, by the by-laws or by the declaration of trust, 40% of the shares entitled to vote shall constitute a quorum at a shareholders’ meeting. |
| | | | | | | |
| Shareholder Votes Required for Approval of Matters at Meetings: | | When a quorum is present at any meeting, the affirmative vote of a majority of the votes cast, shall decide any matter properly brought before such meeting, unless a different vote is required under the MGCL, the 1940 Act or other applicable statutes or Sentinel Funds’ charter of the corporation. | | A majority of the shares voted, at a meeting of which a quorum is present, shall decide any questions, except when a different vote is required or permitted by any provision of the 1940 Act or other applicable law or by this declaration of trust or the by-laws. | | When a quorum is present at any meeting, a majority of the shares voted shall decide any questions, except when a larger vote is required by any provision of this declaration of trust or the by-laws or by applicable law. |
| | | | | | | |
| Vote Required for Election of Trustees/Directors: | | When a quorum is present at any meeting, directors may be elected by the affirmative vote of a plurality of the votes cast (i.e., the nominees receiving the greatest number of votes are elected), unless a different vote is required under the 1940 Act or other applicable statutes or regulations or Sentinel Funds’ charter of the corporation. | | A plurality of the shares voted, at a meeting of which a quorum is present, shall elect a trustee, except when a different vote is required or permitted by any provision of the 1940 Act or other applicable law or by this declaration of trust or the by-laws. | | When a quorum is present at any meeting, a plurality of the shares voted shall elect a Trustee, except when a larger vote is required by any provision of this declaration of trust or the by-laws or by applicable law. |
| | | Sentinel Group Funds,
Inc. | | Touchstone Strategic
Trust | | Touchstone Funds
Group Trust |
| | | | | | | |
| Votes Required for Approval of Reorganization: | | Subject to the following sentence, the Funds cannot merge, engage in a share exchange or engage in similar transactions, for itself or on behalf of a series, unless declared advisable by the Sentinel Funds Board and approved by the affirmative vote of stockholders holding at least a majority of the shares entitled to vote on the matter. The Board can authorize the reorganization of any series or all series by a transfer of assets, without the approval of stockholders, except as required by the 1940 Act. | | The declaration of trust provides for the reorganization of the Trust or any series of the Trust by the transfer of the assets of the Trust or such series to another trust or fund, by vote of the trustees of the Trust without the approval of shareholders, unless such approval is required under the 1940 Act. | | The trustees may cause the Trust, its series, or its shares to be merged into, consolidated with, converted into, or exchanged with beneficial interests in another trust or company, as authorized by the vote of a majority of the outstanding Shares so affected. Notwithstanding the above, any Series created on or after August 14, 1998 may (1) consolidate or merge with one or more other trusts, partnerships, associations or corporations, including any series or class thereof, or (2) transfer a substantial portion of its assets to one or more other trusts, partnerships, associations or corporations, including any series or class thereof, without the approval of shareholders of such series if the transaction is authorized by vote of a majority of the trustees. |
| | | | | | | |
| Removal of Directors/Trustees: | | Any director may be removed with or without cause, by a vote of a majority of the shares outstanding. | | Any trustee may be removed with or without cause by two-thirds of the trustees or by a vote of two-thirds of the outstanding shares of the Trust. | | Any trustee may be removed by a vote of two-thirds of the outstanding shares of the Trust. |
| | | Sentinel Group Funds,
Inc. | | Touchstone Strategic
Trust | | Touchstone Funds
Group Trust |
| | | | | | | |
| Personal Liability of Directors/Trustees, Officers and Shareholders: | | The Sentinel Fund’s charter provides that, to the maximum extent that Maryland law permits, no present or former director or officer of the corporation shall be liable to the corporation or its stockholders for money damages, subject to the limitations of the 1940 Act.(1) | | A Trustee shall be liable for his own willful misfeasance, bad faith, gross negligence or reckless disregard of the duties involved in the conduct of the office of Trustee, and for nothing else, and shall not be liable for errors of judgment or mistakes of fact or law. Subject to the foregoing, the Trustees shall not be responsible or liable in any event for any neglect or wrong-doing of any officer, agent, employee, consultant, adviser, administrator, distributor or principal underwriter, custodian or transfer, dividend disbursing, shareholder servicing or accounting agent of the Trust, nor shall any trustee be responsible for the act or omission of any other trustee.
All persons extending credit to, contracting with or having any claim against the Trust shall look only to the assets of the Trust for payment under such credit, contract or claim; and neither the shareholders nor the trustees, nor any of the Trust’s officers, employees or agents, whether past, present or future, shall be personally liable therefor. | | The Trustees shall not be responsible or liable in any event for any neglect or wrong-doing of any officer, agent, employee, investment advisor or principal underwriter of the Trust, nor shall any trustee be responsible for the act or omission of any other trustee.
All persons who have extended credit which has been allocated to a particular series, or who have a claim or contract which has been allocated to any particular series, shall look, and shall be required by contract to look exclusively, to the assets of that particular series for payment of such credit, claim, or contract. |
| | | Sentinel Group Funds,
Inc. | | Touchstone Strategic
Trust | | Touchstone Funds
Group Trust |
| | | | | | | |
| Indemnification of Directors/Trustees | | The Sentinel Funds’ Bylaws generally provide for the indemnification of Sentinel Funds Board members and Sentinel Funds’ officers against all liabilities and expenses incurred by such director or officer in connection with any proceeding in which such person is made a party or otherwise or is threatened to be made a party by reason of being or having held such position with Sentinel Funds to the maximum extent permitted by applicable law, except with respect to any matter arising from his or her own willful misfeasance, bad faith, gross negligence or reckless disregard of the duties involved in the conduct of such person. Such rights to indemnification are not exclusive and do not affect any other rights the director or officer may have, by contract or otherwise by law, including under any liability insurance policy. | | The declaration of trust generally provides for the indemnification of the Trust’s trustees and officers against all liabilities and expenses incurred by any trustee or officer in connection with any proceeding in which such person is made a party or otherwise or is threatened to be made a party by reason of being or having held such position with the Trust, except with respect to any matter arising from his or her own willful misfeasance, bad faith, gross negligence or reckless disregard of the duties involved in the conduct of such person.(2) | | The Trust out of its assets shall indemnify and hold harmless each and every trustee from and against any and all claims and demands whatsoever arising out of or related to their duties as trustees, except with respect to liability to the Trust or any shareholder to which the trustee would otherwise be subject by reason of willful misfeasance, bad faith, gross negligence or reckless disregard of the duties involved in the conduct of his or her office. |
| | | | | | | |
| Rights of Inspection: | | No stockholder shall have any right to inspect any account, book or document of the corporation except as conferred by statute or as authorized by the Board. A stockholder that is otherwise eligible under applicable law to inspect the Corporation’s books of account, stock ledger, or other specified documents of the Corporation shall have no right to make such inspection if the Board of Directors determines that such stockholder has an improper purpose for requesting such inspection. | | The records of the Trust shall be open to inspection by shareholders to the same extent as is permitted stockholders of a Massachusetts business corporation under the Massachusetts Business Corporation Law. | | The declaration of trust and by-laws, as amended and/or restated, minutes, and accounting books shall be open to inspection by shareholders during usual business hours of the Trust for a purpose reasonably related to the holder’s interests as a shareholder or as the holder of a voting trust certificate. |
| | | Sentinel Group Funds,
Inc. | | Touchstone Strategic
Trust | | Touchstone Funds
Group Trust |
| | | | | | | |
| Number of Authorized Shares; Par Value: | | 2,940,000,000 shares of Common Stock; $0.01 par value per share. | | Unlimited; no par value per share. | | Unlimited; $0.01 par value per Share. |
| | | | | | | |
| Number of Votes: | | Each outstanding share, regardless of class shall be entitled to either, in the discretion of the Sentinel Funds Board, (a) if approved by the Sentinel Funds Board and pursuant to an exemptive order from the SEC, one vote for each dollar of net asset value per share or (b) one vote for each share on each matter submitted to a vote at a meeting of stockholders. | | Each shareholder is entitled to one vote for each whole share that they hold and a fractional vote for each fractional share that they hold. The governing instruments do not provide for cumulative voting. | | Each whole share shall be entitled to one vote as to any matter on which it is entitled to vote and each fractional share shall be entitled to a proportionate fractional vote. There shall be no cumulative voting in the election of trustees. |
| | | | | | | |
| Amendment of Governing Instruments: | | The charter may be amended only if such amendment is declared advisable by the Board and approved by the affirmative vote of the holders of not less than a majority of all of the votes entitled to be cast on the matter. The Board has the exclusive power to amend the Bylaws. | | The Board has the right to amend the declaration of trust subject to a vote of a majority of the outstanding shares entitled to vote, except for certain amendments, such as the designation of series or classes, the change in name of the Trust or a series, or to supply any omission or cure an ambiguity. No amendment shall repeal the limitations on personal liability of any shareholder or trustee or repeal the prohibition of assessment upon the shareholders without the express consent of each shareholder or trustee involved. The by-laws may be amended or repealed by a majority of the trustees to the extent that the by-laws do not reserve that right to the shareholders. | | The declaration of trust may be restated and/or amended at any time by an instrument in writing signed by a majority of the then trustees and, if required, by approval of such amendment by shareholders.
The by-laws may be amended or repealed by a majority of the trustees to the extent that the by-laws do not reserve that right to the shareholders. |
| (1) | Maryland law permits a Maryland corporation to include in its charter a provision limiting the liability of its directors and officers to the corporation and its stockholders for money damages except for liability resulting from (a) actual receipt of an improper benefit or profit in money, property or services or (b) active and deliberate dishonesty established by a final judgment as being material to the cause of action. |
| (2) | Such rights to indemnification are not exclusive and do not affect any other rights the Trustee or officer may have, by contract or otherwise by law, including under any liability insurance policy. There is no statutory exclusion under Massachusetts law from liabilities for shareholders of a Massachusetts business trust. Therefore, under certain circumstances, shareholders of a Massachusetts business trust may be deemed liable for the obligations of the trust. |
Shares. When issued and paid for in accordance with the prospectuses, shares of the Funds are fully paid and nonassessable, having no preemptive or subscription rights. Each share of a Fund represents an equal interest in such Fund, although the fees and expenses relating to each class may vary. Shares of each Fund are entitled to receive their pro rata share of distributions of income and capital gains, if any, made with respect to that Fund as are authorized by its Board and declared by the Fund, although such distributions may vary in amount among the classes of a Fund to reflect class-specific expenses. Such distributions may be in cash or in additional Fund shares or in a combination thereof. In any liquidation of a Fund, each shareholder is entitled to receive his or her pro rata share of the net assets of the Fund, after satisfaction of all outstanding liabilities and expenses of the Fund.
Series and Classes. The Target Funds’ Charter and the Acquiring Funds’ respective Declarations of Trust give broad authority to the Directors/Trustees, as the case may be, to establish series and classes in addition to those currently established and to determine the rights and preferences, conversion rights, voting powers, restrictions, limitations, qualifications or terms or conditions of redemptions of the shares of the series and classes.
Right to Vote. The 1940 Act provides that shareholders of each Fund have the power to vote with respect to certain matters: specifically, for the election of Directors/Trustees, the selection of auditors (under certain circumstances), approval of investment advisory agreements and plans of distribution (under certain circumstances), and amendments to fundamental policies, objectives, or restrictions. Shareholders of each Fund also have the right to vote on certain matters affecting the Fund or a particular share class thereof under their governing instruments and applicable state law. For matters on which shareholders of a Fund do not have a right to vote, the Board of the Fund may nonetheless determine to submit the matter to shareholders for approval. Certain votes required by the 1940 Act must be approved by the “vote of a majority of the outstanding shares.” The phrase “vote of a majority of the outstanding shares” means the vote required by the 1940 Act, which is the lesser of (a) 67% or more of the shares present at the meeting, if the holders of more than 50% of the outstanding shares entitled to vote are present or represented by proxy; or (b) more than 50% of the outstanding shares entitled to vote.
Submission of Shareholder Proposals. With respect to the Target Funds, nominations of individuals for election to the Board and the proposal of other business at an annual meeting of stockholders may be made (i) pursuant to the Corporation’s notice of meeting, (ii) by or at the direction of the Board of Directors, or (iii) by any stockholder of the Corporation who was a stockholder of record both at the time of giving of notice by the stockholder and at the time of the annual meeting, who is entitled to vote at the meeting and who has complied with the advance notice provisions of the Bylaws. For nominations or other business to be properly brought before an annual meeting by a stockholder of a Target Fund the stockholder must have given written notice thereof to the secretary of the Corporation not earlier than the 150th day, nor later than 5:00 p.m. Eastern Time on the 120th day, prior to the anniversary of the date of mailing of the notice for the preceding annual meeting. With respect to special meetings of stockholders of a Target Fund, only the business specified in the notice of the meeting may be brought before the meeting. Nominations of individuals for election to the Board of Directors at a special meeting may be made only (i) pursuant to the notice of the meeting, (ii) by or at the direction of the Board of Directors or (iii) provided that the special meeting has been called in accordance with the By-laws for the purpose of electing directors, by a Target Fund stockholder who is a stockholder of record both at the time of giving the advance notice required by the By-laws and at the time of the meeting, who is entitled to vote at the meeting and who has complied with the advance notice provisions of the By-laws. For nominations or other business to be properly brought before an annual meeting by a Target Fund stockholder the stockholder must have given written notice thereof to the secretary of the Corporation not earlier than the 150th day, nor later than 5:00 p.m. Eastern Time on the 120th day, prior to the anniversary of the date of mailing of the notice for the preceding annual meeting. A similar advance notice requirement applies with respect to stockholder nominations at a special meeting called for the purpose of electing one or more individuals to the Board of Directors.
The Acquiring Funds do not have provisions in their respective governing instruments requiring that a shareholder provide notice to the applicable Fund in advance of a shareholder meeting to enable the shareholder to present a proposal at such meeting, although the federal securities laws, which apply to the Funds, require that certain conditions be met to present any proposals at shareholder meetings.
Voting Information Concerning the Joint Special Meeting
Proxies are being solicited by the Sentinel Funds Board on behalf of the Target Funds. The proxies will be voted at the Joint Special Meeting of shareholders of the Target Funds. The cost of the solicitation, including the printing and mailing of proxy materials, will be borne by Touchstone Advisors and Sentinel and/or their respective affiliates.
Broadridge Financial Solutions, Inc., (the “Solicitor”) has been engaged to assist in the solicitation of proxies for the Special Meeting. Solicitor’s fees and costs are expected to be approximately $900,000. Proxies are expected to be solicited principally by mail, but the Target Funds or the Solicitor may also solicit proxies by telephone, through the Internet or otherwise. Any telephonic solicitations will follow procedures reasonably designed to ensure accuracy and prevent fraud, including requiring identifying shareholder information, recording the shareholder’s instructions, and confirming to the shareholders after the fact. Shareholders who communicate proxies by telephone or by other electronic means have the same power and authority to issue, revoke, or otherwise change their voting instructions as shareholders submitting proxies in written form. Although representatives of the Solicitor are permitted to answer questions about the voting process and may read any recommendation set forth in this Joint Proxy Statement/Prospectus, they are not permitted to recommend to shareholders how to vote. Proxies may also be solicited by officers, employees and agents of Sentinel, Touchstone Advisors or their respective affiliates. Such solicitations may be by telephone, through the Internet or otherwise.
Under Maryland law, the only matters that may be acted on at a special meeting of shareholders are those stated in the notice of the special meeting. Accordingly, other than procedural matters relating to the Reorganization proposals, no other business may properly come before the Special Meeting. Under the By-laws of Sentinel Funds, the power to adjourn or conclude the Special Meeting (whether or not a quorum is present) resides with the chairman of the Special Meeting. If, however, any procedural matter requiring a vote of shareholders should arise, the persons named as proxies will vote on such procedural matter in accordance with their discretion.
Only shareholders of record on the Record Date will be entitled to vote at the Special Meeting.
Any person conferring a proxy has the power to revoke it any time prior to its exercise by executing a superseding proxy or by submitting a written notice of revocation to the Secretary of Sentinel Funds. In addition, although mere attendance at the Special Meeting will not revoke a proxy, a shareholder present at the Special Meeting may withdraw his or her proxy by executing a superseding proxy or by submitting a written notice of revocation and voting in person. All properly executed and unrevoked proxies received in time for the Special Meeting will be voted in accordance with the instructions contained in the proxies. If no instruction is given on a properly executed proxy, the persons named as proxies will vote the shares represented thereby in favor of approval of the applicable Plan.
Target Fund shares represented by a properly executed proxy will be voted in accordance with the instructions on the proxy, or, if no instructions are provided, the shares will be voted in favor of the approval of the Target Fund’s Reorganization. For purposes of determining a quorum for transacting business at the Special Meeting, abstentions and broker “non-votes” (that is, proxies from brokers or nominees indicating that such persons have not received instructions from the beneficial owner or other persons entitled to vote shares on a particular matter with respect to which the brokers or nominees do not have discretionary power) will be treated as shares that are present but which have not been voted. For this reason, abstentions and broker non-votes will have the effect of a “no” vote for purposes of obtaining the requisite approval of the applicable Reorganization.
If the necessary quorum to transact business or the vote required to approve the Reorganization proposal is not obtained at the Special Meeting, the chairman of the Special Meeting or the shareholders present in person or by proxy may approve one or more adjournments of the Special Meeting, in accordance with applicable law, to permit the further solicitation of proxies.
Quorum and Required Votes
Shareholders of each Target Fund on the Record Date are entitled to one vote for each dollar of net asset value that they hold in the Target Fund, with holders of fractional dollar amounts entitled to a proportional fractional vote. All classes of a Target Fund will vote together as one class on the Reorganization of the Target Fund. Shareholders
representing one-third of all votes entitled to be cast at the Special Meeting of a Target Fund, present in person or by proxy, constitutes a quorum for the Special Meeting with respect to that Target Fund. Approval of the proposed Reorganization of a Target Fund will require the affirmative vote of the holders of a majority of the outstanding voting securities, as defined under the 1940 Act. Under Section 2(a)(42) of the 1940 Act, the vote of a majority of outstanding voting securities of a Target Fund means the vote, at the special meeting of the security holders of such Target Fund duly called (A) of 67% or more of the voting securities present or represented by proxy at such meeting, if the holders of more than 50% of the outstanding voting securities of such Target Fund are present in person or by proxy; or (B) of more than 50% of the outstanding voting securities of such Target Fund, whichever is less.
For the purposes of determining the presence of a quorum for transacting business at the Special Meeting with respect to a Target Fund, abstentions and broker non-votes (i.e., when are shares held by brokers or nominees as to which (i) the broker or nominee does not have discretionary voting power and (ii) the broker or nominee has not received instructions from the beneficial owner or other person who is entitled to instruct how the shares will be voted) will be treated as shares that are present but which have not been voted. For this reason, abstentions and broker non-votes, if any, will have the effect of a vote against the Reorganization. Any shareholder giving a proxy may revoke it at any time before it is exercised by submitting to the Secretary of Sentinel Funds a written notice of revocation or a later dated proxy or by attending the Special Meeting and voting in person.
If sufficient votes in favor of a Reorganization set forth in the Notice of Special Meeting are not received by the time scheduled for the Special Meeting, the chairman of the Special Meeting, or, if submitted to shareholders, the shareholders by the affirmative vote of a majority of votes cast at such Special Meeting and entitled to vote at the Special Meeting, whether or not sufficient to constitute a quorum, may adjourn the Special Meeting without further notice to a date not more than 120 days after the Record Date for the Special Meeting. Any business that might have been transacted at the Special Meeting originally called may be transacted at any such adjourned meeting at which a quorum is present. By returning the enclosed form of proxy, you are authorizing the persons named on the proxy to vote in their discretion on any matter that properly comes before the Special Meeting. Therefore, whether you instruct a vote for or against the Reorganization or instruct the proxy to abstain from voting on the Reorganization, those persons will be authorized, to vote in favor of an adjournment if sufficient votes in favor of the Reorganization are not received by the time scheduled for the Special Meeting.
Record Date and Outstanding Shares
Only shareholders of record of a Target Fund at the close of business on June 21, 2017 (previously defined as the “Record Date”) are entitled to notice of and to vote at the Special Meeting and at any postponement or adjournment thereof. Shareholders of each Target Fund on the Record Date are entitled to one vote for each dollar of net asset value that they hold in the Target Fund, with holders of fractional dollar amounts entitled to a proportional fractional vote. For each Target Fund, the number of shares outstanding and entitled to vote at the Special Meeting as of the close of business on the Record Date are set forth in Exhibit C to this Joint Proxy Statement/Prospectus.
Shareholder Information. Exhibit C to this Joint Proxy Statement/Prospectus lists the name, address, and percent ownership of each person who, as of the Record Date, to the knowledge of a Target Fund, owned 5% or more of the outstanding shares of a share class of the Target Fund or, to the knowledge of an Acquiring Fund that is an Operating Fund, owned 5% or more of the outstanding shares of a share class of the Acquiring Fund.
Additional Information About the Funds’ Investment Strategies
In addition to the investments and strategies described under “Synopsis” with respect to each Reorganization in this Joint Proxy Statement/Prospectus, the Funds may invest in other securities, use other strategies and engage in other investment practices. With respect to the Shell Funds, these permitted investments and strategies are described in detail in the SAI of the Shell Funds related to this Joint Proxy Statement/Prospectus, which is incorporated herein by reference. The SAIs for the Operating Funds described in this Joint Proxy Statement/Prospectus, which are incorporated herein by reference, describes the additional permitted investments and strategies of the Operating Funds. The SAIs for the Target Funds, which are incorporated herein by reference, describe the additional permitted investments and strategies of the Target Funds.
Investment Goals
Each Fund’s investment goal is described above under the Synopsis for each Reorganization.
Each Acquiring Fund’s investment goal is non-fundamental, and may be changed by the Touchstone Funds Board without shareholder approval. Shareholders will be notified at least 60 days before any change takes effect. With respect to the investment goal of each of the Sentinel Government Securities Fund, Sentinel Total Return Bond Fund, Sentinel Sustainable Core Opportunities Fund, Sentinel Balanced Fund, Sentinel Common Stock Fund and Sentinel International Equity Fund, if the Sentinel Funds Board determines that the Fund’s investment goal should be changed, shareholders of the Fund will be given at least 30 days’ notice before any such change is made. However, the investment goal can be changed without shareholder approval.
The investment goal of each of the Sentinel Low Duration Bond Fund, Sentinel Multi-Asset Income Fund and Sentinel Small Company Fund is a fundamental investment policy of the applicable Fund that cannot be changed without the consent of the holders of a majority of the outstanding shares of the Fund. The term “majority of the outstanding shares” means the vote of (i) 67% or more of a Fund’s shares present at a meeting, if more than 50% of the outstanding shares of the Fund are present or represented by proxy, or (ii) more than 50% of a Fund’s outstanding shares, whichever is less.
Fundamental Investment Limitations
Each Fund has adopted certain fundamental investment limitations. A comparison of the fundamental investment limitations of each Target Fund to the fundamental investment limitations of the corresponding Acquiring Fund are attached as Exhibit B. Each Fund’s fundamental investment limitations cannot be changed without the consent of the holders of a majority of the outstanding shares of the Fund. The term “majority of the outstanding shares” means the vote of (i) 67% or more of a Fund’s shares present at a meeting, if more than 50% of the outstanding shares of the Fund are present or represented by proxy, or (ii) more than 50% of a Fund’s outstanding shares, whichever is less.
Other Investment Policies
Temporary Defensive Investments. The investments and strategies described in this Joint Proxy Statement/Prospectus are those that the Funds use under normal conditions. During unusual economic or market conditions, or for temporary defensive purposes, an Acquiring Fund may invest up to 100% of its assets in cash, repurchase agreements, and short-term obligations (i.e., fixed and variable rate securities and high quality debt securities of corporate and government issuers) that would not ordinarily be consistent with the Acquiring Fund’s objective. This defensive investing may increase the Acquiring Fund’s taxable income. An Acquiring Fund will do so only if the Acquiring Fund’s sub-advisor believes that the risk of loss in using the Acquiring Fund’s normal strategies and investments outweighs the opportunity for gains. Similarly, each Target Fund may invest up to 100% of its assets in cash, commercial paper, high-grade bonds, or cash equivalents for temporary defensive reasons if Sentinel believes that adverse market or other conditions warrant. This is to attempt to protect the Target Fund’s assets from a temporary unacceptable risk of loss. Of course, there can be no guarantee that a Fund will achieve its investment objective.
Portfolio Composition. The Touchstone Large Cap Focused Fund, Touchstone International Equity Fund and Touchstone Small Company Fund, and the Sentinel Government Securities Fund, Sentinel Total Return Bond Fund, Sentinel Low Duration Bond Fund, Sentinel International Equity Fund and Sentinel Small Company Fund, have each adopted a policy to invest, under normal circumstances, at least 80% of the value of their respective “assets” in certain types of investments suggested by their name (a “Names Policy”). The Touchstone Balanced Fund has adopted a policy to invest, under normal circumstances, at least 25% of the value of its “assets” in bonds and at least 25% of the value of its “assets” in common stock. (also a “Names Policy”). For purposes of each Names Policy, the term “assets” means net assets plus the amount of borrowings for investment purposes. Each Fund must comply with its Names Policy at the time the Fund invests its assets. Accordingly, when a Fund no longer meets the requirement of its Names Policy as a result of circumstances beyond its control, such as changes in the value of portfolio holdings, it would not have to sell its holdings but would have to make any new investments in such a way as to comply with its Names Policy. Each Fund’s Names Policy may be changed by the applicable Fund’s Board
applicable without shareholder approval. Shareholders will be notified at least 60 days’ before any change in a Fund’s Names Policy takes effect.
Other Investment Companies. The Acquiring Funds may invest in securities issued by other investment companies to the extent permitted by the 1940 Act, the rules thereunder and applicable SEC staff interpretations thereof, or applicable exemptive relief granted by the SEC. All of the Target Funds may invest in other investment companies, including ETFs, to the extent permitted by the 1940 Act. In addition, each of the Sentinel Total Return Bond Fund, Sentinel Multi-Asset Income Fund, Sentinel Low Duration Bond Fund and Sentinel Balanced Fund may invest in certain ETFs in excess of the limits permitted by the 1940 Act pursuant to an exemptive order obtained by the ETF on which these Target Funds may rely. As with traditional mutual funds, ETFs charge asset-based fees, although these fees tend to be relatively low. ETFs are traded on stock exchanges or on the over-the-counter market. ETFs do not charge initial sales charges or redemption fees and each Fund pays customary brokerage fees to buy and sell ETF shares.
Lending of Portfolio Securities. Each Acquiring Fund may lend its portfolio securities to brokers, dealers and financial institutions under guidelines adopted by the Touchstone Funds Board, including a requirement that the Acquiring Fund must receive collateral equal to no less than 100% of the market value of the securities loaned. Each Target Fund may also participate in a securities lending program under similar guidelines adopted by the Sentinel Funds Board. The risk in lending portfolio securities, as with other extensions of credit, consists of possible loss of rights in the collateral should the borrower fail financially. In determining whether to lend securities, Touchstone Advisors or Sentinel, as applicable will consider all relevant facts and circumstances, including the creditworthiness of the borrower. More information on securities lending is available in each Fund’s SAI, which are each incorporated herein by reference.
Interfund Lending. The Touchstone Funds have obtained an exemptive order permitting them to borrow cash from other participating Touchstone Funds, subject to the condition of the order. Each Touchstone Fund that is permitted to borrow or lend in accordance with the terms of the order may participate in the interfund lending facility.
Investing with Touchstone
Purchasing Your Shares
The Acquiring Funds are offering the following classes of shares pursuant to this Joint Proxy Statement/Prospectus:
| | | Acquiring Funds |
| Share Class | | Touchstone
Active
Bond
Fund | | Touchstone
Ultra Short
Duration
Fixed
Income
Fund | | Touchstone
Flexible
Income
Fund | | Touchstone
Sustainability
and Impact
Equity Fund | | Touchstone
Balanced
Fund | | Touchstone
Large
Cap
Focused
Fund | | Touchstone
International
Equity Fund | | Touchstone
Small
Company
Fund |
| | | | | | | | | | | | | | | | | |
| Class A | | ü | | ü | | ü | | ü | | ü | | ü | | ü | | ü |
| | | | | | | | | | | | | | | | | |
| Class C | | ü | | | | ü | | | | ü | | ü | | ü | | ü |
| Class Y | | ü | | ü | | ü | | ü | | ü | | ü | | ü | | ü |
| Class S | | | | ü | | | | | | | | | | | | |
| Class R6 | | | | | | | | | | | | | | | | ü |
Institutional
Class | | | | | | | | | | | | ü | | | | |
Pursuant to the Plans, upon the Closing of each Reorganization shareholders of the applicable Target Fund will receive shares of the corresponding class of the Acquiring Fund. Nothing contained herein will be construed as an offer to purchase or otherwise acquire shares of an Acquiring Fund other than in connection with the Reorganizations.
Class A Shares
The offering price of Class A shares of each Acquiring Fund is equal to its NAV plus a front-end sales charge that you pay when you buy your shares. The front-end sales charge is generally deducted from the amount of your investment. Class A shares are subject to a Rule 12b-1 distribution fee.
Class A Sales Charge. The following table shows the amount of front-end sales charge you will pay on purchases of Class A shares for the Acquiring Funds, other than the Touchstone Active Bond Fund and Touchstone Ultra Short Duration Fund. The amount of front-end sales charge is shown as a percentage of offering price and the net amount invested after the charge has been subtracted. Note that the front-end sales charge gets lower as your investment amount gets larger. The first table applies to all Acquiring Funds except Touchstone Active Bond Fund and Touchstone Ultra Short Duration Fixed Income Fund. The second and third tables apply to the Touchstone Active Bond Fund and Touchstone Ultra Short Duration Fixed Income Fund, respectively. No sales charge will be imposed on the Class A shares of the Acquiring Fund received in connection with a Reorganization.
Amount of Your Investment | | Sales Charge as %
of Offering Price | | Sales Charge as % of
Net Amount Invested | | Dealer Reallowance
as % of Offering
Price |
| | | | | | | |
| Under $50,000 | | 5.75% | | 6.10% | | 5.00% |
| $50,000 but less than $100,000 | | 4.50% | | 4.71% | | 3.75% |
| $100,000 but less than $250,000 | | 3.50% | | 3.63% | | 2.75% |
| $250,000 but less than $500,000 | | 2.95% | | 3.04% | | 2.25% |
| $500,000 but less than $1 million | | 2.25% | | 2.30% | | 1.75% |
| $1 million or more | | 0.00% | | 0.00% | | None |
Touchstone Active Bond Fund
Amount of Your Investment | | Sales Charge as %
of Offering Price | | Sales Charge as % of
Net Amount Invested | | Dealer Reallowance
as % of Offering
Price |
| | | | | | | |
| Under $50,000 | | 4.75% | | 4.99% | | 4.00% |
| $50,000 but less than $100,000 | | 4.50% | | 4.71% | | 3.75% |
| $100,000 but less than $250,000 | | 3.50% | | 3.63% | | 2.75% |
| $250,000 but less than $500,000 | | 2.95% | | 3.04% | | 2.25% |
| $500,000 but less than $1 million | | 2.25% | | 2.30% | | 1.75% |
| $1 million or more | | 0.00% | | 0.00% | | None |
Touchstone Ultra Short Duration Fixed Income Fund
Amount of Your Investment | | Sales Charge as %
of Offering Price | | Sales Charge as % of
Net Amount Invested | | Dealer Reallowance
as % of Offering
Price |
| | | | | | | |
| Under $50,000 | | 2.00% | | 2.04% | | 1.75% |
| $50,000 but less than $100,000 | | 1.50% | | 1.52% | | 1.25% |
| $100,000 but less than $250,000 | | 1.00% | | 1.01% | | 0.85% |
| $250,000 but less than $500,000 | | 0.50% | | 0.50% | | 0.40% |
| $500,000 or more | | 0.00% | | 0.00% | | None |
Waiver of Class A Sales Charge. There is no front-end sales charge if you invest $1 million or more in any share class of the Touchstone Funds ($500,000 or more for the Touchstone Ultra Short Duration Fixed Income Fund). If you redeem shares that were part of the $1 million breakpoint for all non-Ultra Short Fixed Income Fund purchases within one year of that purchase, you may pay a contingent deferred sales charge (“CDSC”) of up to 1% on the shares redeemed if a commission was paid by Touchstone Securities, Inc. (the “Distributor” or “Touchstone Securities”) to a participating unaffiliated broker-dealer. There is no front-end sales charge on exchanges between Funds with the same load schedule or from a higher load schedule to a lower load schedule. In addition, there is no front-end sales charge on the following purchases:
| | · | Purchases by registered representatives or other employees(1) (and their immediate family members(2)) of financial intermediaries having selling agreements with Touchstone Securities. |
| | | |
| | · | Purchases in accounts as to which a broker-dealer or other financial intermediary charges an asset management fee economically comparable to a sales charge, provided the broker-dealer or other financial intermediary has a selling agreement with Touchstone Securities. |
| | | |
| | · | Purchases by a trust department of any financial intermediary serving in a fiduciary capacity as trustee to any trust over which it has discretionary trading authority. |
| | | |
| | · | Purchases through a financial intermediary that has agreements with Touchstone Securities, or whose programs are available through financial intermediaries that have agreements with Touchstone Securities relating to mutual fund supermarket programs, fee-based wrap or asset allocation programs. |
| | | |
| | · | Purchases by an employee benefit plan having more than 25 eligible employees or a minimum of $250,000 in plan assets. This waiver applies to any investing employee benefit plan meeting the minimum eligibility requirements and whose transactions are executed through a financial intermediary that has entered into an agreement with Touchstone Securities to use the Touchstone Funds in connection with the plan’s accounts. The term “employee benefit plan” applies to qualified pension, profit-sharing, or other employee benefit plans. |
| | | |
| | · | Purchases by an employee benefit plan that is provided administrative services by a third party administrator that has entered into a special service arrangement with Touchstone Securities. |
| | · | Reinvestment of redemption proceeds from Class A shares of any Touchstone Fund if the reinvestment occurs within 90 days of redemption. |
| | | |
| (1) | The term “employee” is deemed to include current and retired employees. |
| | |
| (2) | Immediate family members are defined as the parents, mother-in-law or father-in-law, spouse, brother or sister, brother-in-law or sister-in-law, son-in-law or daughter-in-law, and children of a registered representative or employee, and any other individual to whom the registered representative or employee provides material support. |
In addition, Class A shares of the Acquiring Funds may be purchased with no front-end sales charge through certain mutual fund programs sponsored by qualified intermediaries, such as broker-dealers and investment advisors. In each case, the intermediary has entered into an agreement with Touchstone Securities to include the Touchstone Funds in their program where the intermediary provides investors participating in the program with additional services, including advisory, asset allocation, recordkeeping or other services. You should ask your financial intermediary if it offers and you are eligible to participate in such a mutual fund program and whether participation in the program is consistent with your investment goals. The intermediaries sponsoring or participating in these mutual fund programs may also offer their clients other classes of shares of the Acquiring Funds and investors may receive different levels of services or pay different fees depending upon the class of shares included in the program. Investors should carefully consider any separate transaction fee or other fees charged by these programs in connection with investing in each available share class before selecting a share class.
Sales charge waivers must be satisfied at the time of purchase. For direct purchases through Touchstone Securities you may apply for a waiver by marking the appropriate section on the investment application and completing the “Special Account Options” form. You can obtain the application and form by calling Touchstone Securities at 800.543.0407 or by visiting the Touchstone Funds’ website: TouchstoneInvestments.com. Purchases at NAV may be made for investment only, and the shares may not be resold except through redemption by or on behalf of the Acquiring Fund. At the option of the Acquiring Fund, the front-end sales charge may be included on future purchases.
Reduced Class A Sales Charge. You may also purchase Class A shares of a Touchstone Fund at the reduced sales charges shown in the table above through the Rights of Accumulation Program or by signing a Letter of Intent. The following purchasers (“Qualified Purchasers”) may qualify for a reduced sales charge under the Rights of Accumulation Program or Letter of Intent:
| | · | an individual, an individual’s spouse, an individual’s children under the age of 21; or |
| | | |
| | · | a trustee or other fiduciary purchasing shares for a single fiduciary account although more than one beneficiary is involved. |
The following accounts (“Qualified Accounts”) held in any Touchstone Fund sold with a sales charge may be grouped together to qualify for the reduced sales charge under the Rights of Accumulation Program or Letter of Intent:
| | · | Individual accounts |
| | | |
| | · | Joint tenant with rights of survivorship accounts |
| | | |
| | · | Uniform Gifts/Transfers to Minors Act (“UGTMA”) accounts |
| | | |
| | · | Trust accounts |
| | | |
| | · | Estate accounts |
| | | |
| | · | Guardian/Conservator accounts |
| | · | Individual Retirement Accounts (“IRAs”), including Traditional, Roth, Simplified Employee Pension plans (“SEP”) and Savings Incentive Match Plan for Employees (“SIMPLE”) |
| | | |
| | · | Coverdell Education Savings Accounts (“Education IRAs”) |
Rights of Accumulation Program. Under the Rights of Accumulation Program, you may qualify for a reduced sales charge by aggregating all of your investments held in a Qualified Account. You or your dealer must notify Touchstone Securities at the time of purchase that a purchase qualifies for a reduced sales charge under the Rights of Accumulation Program and must provide either a list of account numbers or copies of account statements verifying your qualification. If your shares are held directly in a Touchstone Fund or through a dealer, you may combine the historical cost or current NAV (whichever is higher) of your existing shares of any Touchstone Fund sold with a sales charge with the amount of your current purchase in order to take advantage of the reduced sales charge. Historical cost is the price you actually paid for the shares you own, plus your reinvested dividends and capital gains. If you are using historical cost to qualify for a reduced sales charge, you should retain any records to substantiate your historical costs since the Acquiring Fund, its transfer agent or your broker-dealer may not maintain this information.
If your shares are held through financial intermediaries you may combine the current NAV of your existing shares of any Touchstone Fund sold with a front-end sales charge with the amount of your current purchase in order to take advantage of the reduced sales charge. You or your financial intermediary must notify Touchstone at the time of purchase that a purchase qualifies for a reduced sales charge under the Rights of Accumulation Program and must provide copies of account statements dated within three months of your current purchase verifying your qualification.
Upon receipt of the above referenced supporting documentation, Touchstone Securities will calculate the combined value of all of the Qualified Purchaser’s Qualified Accounts to determine if the current purchase is eligible for a reduced sales charge. Purchases made for nominee or street name accounts (securities held in the name of a dealer or another nominee such as a bank trust department instead of the customer) may not be aggregated with purchases for other accounts and may not be aggregated with other nominee or street name accounts unless otherwise qualified as described above.
Letter of Intent. If you plan to invest at least $50,000 (excluding any reinvestment of dividends and capital gains distributions) during the next 13 months in Class A shares of any Touchstone Fund sold with a front-end sales charge, you may qualify for a reduced sales charge by completing the Letter of Intent section of your account application. A Letter of Intent indicates your intent to purchase at least $50,000 in Class A shares of any Touchstone Fund sold with a front-end sales charge over the next 13 months in exchange for a reduced sales charge indicated on the above chart. The minimum initial investment under a Letter of Intent is $10,000. You are not obligated to purchase additional shares if you complete a Letter of Intent. If you do not buy enough shares to qualify for the projected level of sales charge by the end of the 13-month period (or when you sell your shares, if earlier), your sales charge will be recalculated to reflect your actual purchase level. During the term of the Letter of Intent, shares representing 5% of your intended purchase will be held in escrow. If you do not purchase enough shares during the 13-month period to qualify for the projected reduced sales charge, the additional sales charge will be deducted from your escrow account. If you have purchased Class A shares of any Touchstone Fund sold with a front-end sales charge within 90 days prior to signing a Letter of Intent, they may be included as part of your intended purchase, however, previous purchase transactions will not be recalculated with the proposed new breakpoint. You must provide either a list of account numbers or copies of account statements verifying your purchases within the past 90 days.
Other Information. Information about sales charges and breakpoints is also available in a clear and prominent format on the Touchstone Funds’ website: TouchstoneInvestments.com. You can access this information by selecting “Sales Charges and Breakpoints” under the “Pricing and Performance” link. For more information about qualifying for a reduced or waived sales charge, contact your financial advisor or contact Touchstone at 800.543.0407.
Class C Shares
Class C shares of the Acquiring Funds are sold at NAV without an initial sales charge so that the full amount of your purchase payment may be immediately invested in the Acquiring Funds. Class C shares are subject to a Rule 12b-1 fee that is higher than the Rule 12b-1 fee applicable to Class A shares. A CDSC of 1.00% will be charged on Class C shares redeemed within 1 year after you purchased them. In most cases it is more advantageous to purchase Class A shares for amounts of $1 million or more ($500,000 or more for the Touchstone Ultra Short Duration Fixed Income Fund). Therefore a request to purchase Class C shares for $1 million or more ($500,000 or more for the Touchstone Ultra Short Duration Fixed Income Fund) will be considered as a purchase request for Class A shares or declined.
Class Y Shares
Class Y shares of the Acquiring Funds are sold at NAV without an initial sales charge so that the full amount of your purchase payment may be immediately invested in the Acquiring Funds. Class Y shares are not subject to a Rule 12b-1 fee or CDSC. In addition, Class Y shares may be purchased through certain mutual fund programs sponsored by qualified intermediaries, such as broker-dealers and investment advisors. In each case, the intermediary has entered into an agreement with Touchstone Securities to include the Touchstone Funds in their program where the intermediary provides investors participating in their program with additional services, including advisory, asset allocation, recordkeeping or other services. You should ask your financial institution if it offers and you are eligible to participate in such a mutual fund program and whether participation in the program is consistent with your investment goals. The intermediaries sponsoring or participating in these mutual fund programs may also offer their clients other classes of shares of the funds and investors may receive different levels of services or pay different fees depending upon the class of shares included in the program. Investors should carefully consider any separate transaction fee or other fees charged by these programs in connection with investing in each available share class before selecting a share class.
Class S Shares
There is no initial sales charge or CDSC on Class S shares. For all purchases of Class S shares of the Touchstone Ultra Short Duration Fixed Income Fund, you pay the current net asset value so that the full amount of your purchase payment may be immediately invested in the Fund. Class S shares of the Touchstone Ultra Short Duration Fixed Income Fund are subject to a Rule 12b-1 fee that is higher than the Rule 12b-1 fee applicable to Class A shares of the Fund. Class S shares never convert to Class A shares. As a result, investments in Class S shares remain subject to higher Rule 12b-1 fees for the entire holding period of the investment.
Class R6 Shares
Class R6 shares of the Acquiring Funds are sold at NAV without an initial sales charge so that the full amount of your purchase payment may be immediately invested in the Fund. R6 shares are not subject to a Rule 12b-1 fee or CDSC.
Class R6 shares of the Touchstone Small Company Fund are generally available only to institutional investors, which include but are not limited to certain employer sponsored group retirement and group 529 college savings plans; registered investment companies; institutions, trusts and foundations; and certain fee-based advisory programs which have entered into agreements with the Distributor or the Fund to offer R6 shares.
Class R6 shares do not offer certain account services available to other classes, such as automatic investment and withdrawal plans.
Institutional Class Shares (All Acquiring Funds, except Touchstone Balanced Fund)
Institutional Class shares of the Acquiring Funds are sold at NAV, without an initial sales charge so that the full amount of your purchase payment may be immediately invested in the Funds. Institutional Class shares are not subject to a Rule 12b-1 fee or CDSC.
Contingent Deferred Sales Charge
If you purchase $1 million or more in Class A shares at NAV and a commission was paid by Touchstone Securities to a participating unaffiliated dealer, a CDSC of up to 1.00% may be charged on redemptions made within 1 year of your purchase. Additionally, when an upfront commission is paid to a participating dealer on transactions of $1 million or more in Class A Shares, the Acquiring Fund will withhold any 12b-1 fee for the first 12 months following the purchase date. If you redeem Class C shares within 12 months of your purchase, a CDSC of 1.00% will be charged.
The CDSC will not apply to redemptions of shares you received through reinvested dividends or capital gains distributions and may be waived under certain circumstances described below. The CDSC will be assessed on the lesser of your shares’ NAV at the time of redemption or the time of purchase. The CDSC is paid to Touchstone Securities to reimburse expenses incurred in providing distribution-related services to the Acquiring Funds.
All sales charges imposed on redemptions are paid to Touchstone Securities. In determining whether the CDSC is payable, it is assumed that shares not subject to the CDSC are the first redeemed followed by other shares held for the longest period of time. The CDSC will not be imposed upon shares representing reinvested dividends or capital gains distributions, or upon amounts representing share appreciation.
No CDSC is applied if:
| | · | The redemption is due to the death or post-purchase disability of a shareholder. Touchstone Securities may require documentation prior to waiver of the charge. |
| | | |
| | · | Any partial or complete redemption following death or disability (as defined in the Code) of a shareholder (including one who owns the shares with his or her spouse as a joint tenant with rights of survivorship) from an account in which the deceased or disabled is named. Touchstone Securities may require documentation prior to waiver of the charge, including death certificates, physicians’ certificates, etc. |
| | | |
| | · | Redemptions from a systematic withdrawal plan. If the systematic withdrawal plan is based on a fixed dollar amount or number of shares, systematic withdrawal redemptions are limited to no more than 10% of your account value or number of shares per year, as of the date the transfer agent receives your request. If the systematic withdrawal plan is based on a fixed percentage of your account value, each redemption is limited to an amount that would not exceed 10% of your annual account value at the time of withdrawal. |
| | | |
| | · | Redemptions from retirement plans qualified under Section 401 of the Code. The CDSC will be waived for benefit payments made by Touchstone Securities directly to plan participants. Benefit payments will include, but are not limited to, payments resulting from death, disability, retirement, separation from service, required minimum distributions (as described under Section 401(a)(9) of the Code), in-service distributions, hardships, loans, and qualified domestic relations orders. The CDSC waiver will not apply in the event of termination of the plan or transfer of the plan to another financial intermediary. |
| | | |
| | · | The redemption is for a mandatory withdrawal from a traditional IRA account after age 70½. |
The above mentioned CDSC waivers do not apply to redemptions made within one year for purchases of $1 million or more in Class A shares of the Touchstone Funds where a commission was paid by Touchstone Securities to a participating broker-dealer.
The SAI relating to this Joint Proxy Statement/Prospectus for the Acquiring Fund corresponding to your Target Fund contains further details about the CDSC and the conditions for waiving the CDSC.
Selling Your Shares
If you elect to receive your redemption proceeds from your non-retirement account in cash, the payment is not cashed for six months and the account remains open, the redemption check will be cancelled and then reinvested in the Acquiring Fund at the per share NAV determined as of the date of cancellation. Otherwise, no action will be taken.
Through Touchstone Securities—By telephone or Internet
| | · | You can sell your shares over the telephone by calling Touchstone Securities at 800.543.0407, unless you have specifically declined this option. If you do not wish to have this ability, you must mark the appropriate section of the investment application. |
| | | |
| | · | You may also sell your shares online via the Touchstone Funds’ website: TouchstoneInvestments.com. |
| | | |
| | · | You may only sell shares over the telephone or via the Internet if the amount is less than or equal to $100,000. |
| | | |
| | · | Shares held in IRA accounts and qualified retirement plans cannot be sold by telephone or via the Internet. |
| | | |
| | · | If we receive your sale request by the close of the regular session of trading on the NYSE, generally 4:00 p.m. Eastern time, on a day when the NYSE is open for regular trading, the sale of your shares will be processed at the next determined NAV on that Business Day. Otherwise it will occur on the next Business Day. |
| | | |
| | · | Interruptions in telephone or Internet service could prevent you from selling your shares when you want to. When you have difficulty making telephone or Internet sales, you should mail to Touchstone Securities (or send by overnight delivery) a written request for the sale of your shares. |
| | | |
| | · | In order to protect your investment, Touchstone Securities will only follow instructions received by telephone that it reasonably believes to be genuine. However, there is no guarantee that the instructions relied upon will always be genuine and Touchstone Securities will not be liable, in those cases. Touchstone Securities has certain procedures to confirm that telephone instructions are genuine. If it does not follow such procedures in a particular case, it may be liable for any losses due to unauthorized or fraudulent instructions. Some of these procedures may include: |
| | · | Requiring personal identification. |
| | | |
| | · | Making checks payable only to the owner(s) of the account shown on Touchstone Securities’ records. |
| | | |
| | · | Mailing checks only to the account address shown on Touchstone Securities’ records. |
| | | |
| | · | Directing wires only to the bank account shown on Touchstone Securities’ records. |
| | | |
| | · | Providing written confirmation for transactions requested by telephone. |
| | | |
| | · | Digitally recording instructions received by telephone. |
Through Touchstone Securities—By mail
| | · | Write to Touchstone Securities, P.O. Box 9878, Providence, Rhode Island 02940. |
| | | |
| | · | Indicate the number of shares or dollar amount to be sold. |
| | · | Include your name and account number. |
| | | |
| | · | Sign your request exactly as your name appears on your investment application. |
| | | |
| | · | You may be required to have your signature guaranteed. (See “Signature Guarantees” below for more information.) |
Through Touchstone Securities—By wire
| | · | Complete the appropriate information on the investment application. |
| | | |
| | · | If your proceeds are $1,000 or more, you may request that Touchstone Securities wire them to your bank account. |
| | | |
| | · | You may be charged a fee of up to $15 by the Acquiring Fund or the Acquiring Fund’s Authorized Processing Organization for wiring redemption proceeds. You may also be charged a fee by your bank. Certain institutional shareholders who trade daily are not charged wire redemption fees. |
| | | |
| | · | Your redemption proceeds may be deposited directly into your bank account through an ACH transaction. There is no fee imposed by the Acquiring Fund for ACH transactions, however, you may be charged a fee by your bank to receive an ACH transaction. Contact Touchstone Securities for more information. |
| | | |
| | · | If you hold your shares directly with Touchstone Securities and have ACH or wire instructions on file for your non-retirement account you may transact through the Touchstone Funds’ website: TouchstoneInvestments.com. |
Through Touchstone Securities—Through a systematic withdrawal plan
| | · | You may elect to receive, or send to a third-party, systematic withdrawals of $50 or more if your account value is at least $5,000. |
| | | |
| | · | Systematic withdrawals can be made monthly, quarterly, semiannually or annually. |
| | | |
| | · | There is no fee for this service. |
| | | |
| | · | There is no minimum account balance required for retirement plans. |
Through your financial intermediary or Authorized Processing Organization
| | · | You may also sell shares by contacting your financial intermediary or Authorized Processing Organization, which may charge you a fee for this service. Shares held in street name must be sold through your financial intermediary or, if applicable, the Authorized Processing Organization. |
| | | |
| | · | Your financial intermediary or Authorized Processing Organization is responsible for making sure that sale requests are transmitted to Touchstone Securities in proper form and in a timely manner. |
| | | |
| | · | Your financial intermediary may charge you a fee for selling your shares. |
| | | |
| | · | Redemption proceeds will only be wired to your account at the financial intermediary. |
Investor Alert: Unless otherwise specified, proceeds will be sent to the record owner at the address shown on Touchstone Securities’ records.
Pricing of Redemptions
Redemption orders received in proper form by Touchstone Securities, an Authorized Processing Organization, or a financial intermediary, by the close of the regular session of trading on the NYSE, generally 4:00 p.m. Eastern time, are processed at that day’s NAV. Redemption orders received after the close of the regular session of trading on the NYSE are processed at the NAV determined on the following business day. It is the responsibility of the financial intermediary or Authorized Processing Organization to transmit orders that will be received by Touchstone Securities in proper form and in a timely manner.
Signature Guarantees
Some circumstances require that your request to sell shares be made in writing accompanied by an original Medallion Signature Guarantee. A Medallion Signature Guarantee helps protect you against fraud. You can obtain one from most banks or securities dealers, but not from a notary public. The Acquiring Fund reserves the right to require a signature guarantee for any request related to your account including, but not limited to:
| | · | Proceeds to be paid when information on your account has been changed within the last 30 days (including a change in your name or your address, or the name or address of a payee). |
| | | |
| | · | Proceeds are being sent to an address other than the address of record. |
| | | |
| | · | Proceeds or shares are being sent/transferred from unlike registrations such as a joint account to an individual’s account. |
| | | |
| | · | Sending proceeds via wire or ACH when bank instructions have been added or changed within 30 days of your redemption request. |
| | | |
| | · | Proceeds or shares are being sent/transferred between accounts with different account registrations. |
Market Timing Policy
Market timing or excessive trading in accounts that you own or control may disrupt portfolio investment strategies, may increase brokerage and administrative costs, and may negatively impact investment returns for all shareholders, including long-term shareholders who do not generate these costs. The Acquiring Funds will take reasonable steps to discourage excessive short-term trading and will not knowingly accommodate frequent purchases and redemptions of Acquiring Fund shares by shareholders. The Touchstone Funds Board has adopted the following policies and procedures with respect to market timing of the Acquiring Funds by shareholders. The Acquiring Funds will monitor selected trades on a daily basis in an effort to deter excessive short-term trading. If an Acquiring Fund has reason to believe that a shareholder has engaged in excessive short-term trading, the Acquiring Fund may ask the shareholder to stop such activities or restrict or refuse to process purchases or exchanges in the shareholder’s accounts. While an Acquiring Fund cannot assure the prevention of all excessive trading and market timing, by making these judgments the Acquiring Fund believes it is acting in a manner that is in the best interests of its shareholders. However, because the Acquiring Funds cannot prevent all market timing, shareholders may be subject to the risks described above.
Generally, a shareholder may be considered a market timer if he or she has (i) requested an exchange or redemption out of any of the Touchstone Funds within 2 weeks of an earlier purchase or exchange request into any Touchstone Fund, or (ii) made more than 2 “round-trip” exchanges within a rolling 90 day period. A “round-trip” exchange occurs when a shareholder exchanges from one Touchstone Fund to another Touchstone Fund and back to the original Touchstone Fund. If a shareholder exceeds these limits, the Touchstone Funds may restrict or suspend that shareholder’s exchange privileges and subsequent exchange requests during the suspension will not be processed. The Touchstone Funds may also restrict or refuse to process purchases by the shareholder. These exchange limits and excessive trading policies generally do not apply to systematic purchases and redemptions.
Financial intermediaries (such as investment advisors and broker-dealers) often establish omnibus accounts in the Touchstone Funds for their customers through which transactions are placed. If an Acquiring Fund identifies excessive trading in such an account, the Acquiring Fund may instruct the intermediary to restrict the investor
responsible for the excessive trading from further trading in the Acquiring Fund. In accordance with Rule 22c-2 under the 1940 Act, the Touchstone Funds have entered into information sharing agreements with certain financial intermediaries. Under these agreements, a financial intermediary is obligated to: (1) enforce, during the term of the agreement, the Touchstone Funds’ market-timing policy; (2) furnish the Touchstone Funds, upon their request, with information regarding customer trading activities in shares of the Touchstone Funds; and (3) enforce the Touchstone Funds’ market-timing policy with respect to customers identified by the Touchstone Funds as having engaged in market timing. When information regarding transactions in the Touchstone Funds’ shares is requested by a Touchstone Fund and such information is in the possession of a person that is itself a financial intermediary to a financial intermediary (an “indirect intermediary”), any financial intermediary with whom the Touchstone Funds have an information sharing agreement is obligated to obtain transaction information from the indirect intermediary or, if directed by the Touchstone Funds, to restrict or prohibit the indirect intermediary from purchasing shares of the Funds on behalf of other persons.
The Touchstone Funds apply these policies and procedures uniformly to all shareholders believed to be engaged in market timing or excessive trading. The Touchstone Funds have no arrangements to permit any investor to trade frequently in shares of the Touchstone Funds, nor will they enter into any such arrangements in the future.
Householding Policy (only applicable for shares held directly through Touchstone Securities)
Each Acquiring Fund will send one copy of its prospectus and shareholder reports to households containing multiple shareholders with the same last name. This process, known as “householding,” reduces costs and provides a convenience to shareholders. If you share the same last name and address with another shareholder and you prefer to receive separate prospectuses and shareholder reports, call Touchstone Investments at 800.543.0407 and we will begin separate mailings to you within 30 days of your request. If you or others in your household invest in the Acquiring Funds through a financial intermediary, you may receive separate prospectuses and shareholder reports, regardless of whether or not you have consented to householding on your investment application.
In addition, eDelivery is available for statements, confirms and regulatory documents (annual and semi-annual reports, prospectuses, information statements and proxy materials). For shareholders holding accounts directly with Touchstone Securities, please contact Shareholder Services at 800.534.0407 for more information. If you hold your account through a broker-dealer or financial intermediary, please contact them directly to inquire about eDelivery opportunities.
Receiving Sale Proceeds
Touchstone Securities will forward the proceeds of your sale to you (or to your financial intermediary) within 7 days (normally within 3 business days) after receipt of a proper request in accordance with the requirements set forth in this “Investing with Touchstone” section.
Proceeds Sent to Financial Intermediaries or Authorized Processing Organizations. Proceeds that are sent to your Authorized Processing Organization or financial intermediary will not usually be reinvested for you unless you provide specific instructions to do so. Therefore, the financial advisor, Authorized Processing Organization or financial intermediary may benefit from the use of your money.
Acquiring Fund Shares Purchased by Check (only applicable for shares held directly through Touchstone Securities). We may delay the processing and payment of redemption proceeds for shares you recently purchased by check until your check clears, which may take up to 15 days. If you believe you may need your money sooner, you should purchase shares by bank wire.
Low Account Balances (only applicable for shares held directly through Touchstone Securities). If your balance falls below the minimum amount required for your account, based on actual amounts you have invested (as opposed to a reduction from market changes), Touchstone Securities may sell your shares and send the proceeds to you. This involuntary sale does not apply to retirement accounts or custodian accounts under the Uniform Gifts/Transfers to Minors Act (“UGTMA”). Touchstone Securities will notify you if your shares are about to be sold and you will have 30 days to increase your account balance to the minimum amount.
Delay of Payment. It is possible that the payment of your sale proceeds could be postponed or your right to sell your shares could be suspended during certain circumstances. These circumstances can occur:
| | · | When the NYSE is closed on days other than customary weekends and holidays; |
| | | |
| | · | When trading on the NYSE is restricted; or |
| | | |
| | · | During any other time when the SEC, by order, permits. |
Redemption in Kind. Under unusual circumstances (such as a market emergency), when the Touchstone Funds Board deems it appropriate, an Acquiring Fund may make payment for shares redeemed in portfolio securities of the Acquiring Fund taken at current value in order to meet redemption requests. Shareholders may incur transaction and brokerage costs when they sell these portfolio securities. Until such time as the shareholder sells the securities they receive in-kind, the securities are subject to market risk. Redemptions in-kind are taxable for federal income tax purposes in the same manner as redemptions for cash.
Pricing of Acquiring Fund Shares
Each Acquiring Fund’s share price (also called “NAV”) and public offering price (NAV plus a sales charge, if applicable) is determined as of the close of regular trading (normally 4:00 p.m. Eastern time) every day the NYSE is open. Each Acquiring Fund calculates its NAV per share for each class, generally using market prices, by dividing the total value of its net assets by the number of shares outstanding.
The Acquiring Funds’ equity investments are valued based on market value or, if no market value is available, based on fair value as determined by the Acquiring Trust Board (or under its direction). The Touchstone Funds may use pricing services to determine market value for investments. Some specific pricing strategies follow:
| | · | All short-term dollar-denominated investments that mature in 60 days or less may be valued on the basis of amortized cost, which the Acquiring Trust Board has determined as fair value. |
| | | |
| | · | Securities mainly traded on a U.S. exchange are valued at the last sale price on that exchange or, if no sales occurred during the day, at the last quoted bid price. |
Any foreign securities held by an Acquiring Fund will be priced as follows:
| | · | All assets and liabilities initially expressed in foreign currency values will be converted into U.S. dollar values. |
| | | |
| | · | Securities mainly traded on a non-U.S. exchange are generally valued according to the preceding closing values on that exchange. However, if an event that may change the value of a security occurs after the time that the closing value on the non-U.S. exchange was determined, but before the close of regular trading on the NYSE, the security may be priced based on fair value. This may cause the value of the security on the books of the Acquiring Fund to be significantly different from the closing value on the non-U.S. exchange and may affect the calculation of the NAV. |
| | | |
| | · | Because portfolio securities that are primarily listed on a non-U.S. exchange may trade on weekends or other days when the Acquiring Fund does not price its shares, the Acquiring Fund’s NAV may change on days when shareholders will not be able to buy or sell shares. |
Securities held by an Acquiring Fund that do not have readily available market quotations are priced at their fair value using procedures approved by the Touchstone Funds Board. Any debt securities held by an Acquiring Fund for which market quotations are not readily available are generally priced at their most recent bid prices as obtained from one or more of the major market makers for such securities. The Acquiring Funds may use fair value pricing under the following circumstances, among others:
| | · | If the value of a security has been materially affected by events occurring before the Acquiring Fund’s pricing time but after the close of the primary markets on which the security is traded. |
| | | |
| | · | If a security is so thinly traded that reliable market quotations are unavailable due to infrequent trading. |
| | | |
| | · | If the exchange on which a portfolio security is principally traded closes early or if trading in a particular portfolio security was halted during the day and did not resume prior to the Acquiring Fund’s NAV calculation. |
| | | |
| | · | If the validity of market quotations is otherwise deemed to be not reliable. |
The use of fair value pricing has the effect of valuing a security based upon the price an Acquiring Fund might reasonably expect to receive if it sold that security but does not guarantee that the security can be sold at the fair value price. The Acquiring Funds have established fair value policies and procedures that delegate fair value responsibilities to Touchstone Advisors. These policies and procedures outline the fair value method for the Advisor. Touchstone Advisors’ determination of a security’s fair value price often involves the consideration of a number of subjective factors established by the Touchstone Funds Board, and is therefore subject to the unavoidable risk that the value that the Acquiring Fund assigns to a security may be higher or lower than the security’s value would be if a reliable market quotation for the security was readily available. With respect to any portion of an Acquiring Fund’s assets that is invested in other mutual funds, that portion of the Acquiring Fund’s NAV is calculated based on the NAV of that mutual fund. The prospectus for the other mutual fund explains the circumstances and effects of fair value pricing for that fund.
Distributions and Taxes
The Acquiring Funds intend to distribute to their shareholders substantially all of their net investment income and capital gains. The Acquiring Funds declare and distribute their income, if any, to shareholders as discussed above in the section entitled “Share Classes of the Target Funds and Acquiring Funds—Distribution Policy.” The Acquiring Funds make distributions of capital gains, if any, at least annually. If you own shares on an Acquiring Fund’s distribution record date, you will be entitled to receive the distribution.
You will receive income dividends and distributions of capital gains in the form of additional Acquiring Fund shares unless you elect to receive payment in cash. Cash payments will only be made for amounts equal to or exceeding $25. For amounts less than $25 the dividends and distributions will be automatically reinvested in Acquiring Fund shares of the class you hold. To elect cash payments, you must notify the Acquiring Funds in writing or by phone prior to the date of distribution. Your election will be effective for dividends and distributions paid after we receive your notice. To cancel your election, simply send written notice to Touchstone Investments, P.O. Box 9878, Providence, Rhode Island 02940, or by overnight mail to Touchstone Investments, c/o BNY Mellon Investment Servicing (US) Inc., 4400 Computer Drive, Westborough, Massachusetts 01581, or call Touchstone Securities at 800.543.0407. If you hold your shares through a financial institution, you must contact the institution to elect cash payment. If you elect to receive dividends and distributions in cash and the payment (1) is returned and marked as “undeliverable” or (2) is not cashed for six months, your cash election will be changed automatically and future dividends will be reinvested in the Acquiring Fund at the per share NAV determined as of the date of cancellation.
An Acquiring Fund’s dividends and other distributions are taxable to shareholders (other than retirement plans and other tax-exempt investors) whether received in cash or reinvested in additional shares of the Acquiring Fund. A dividend or distribution paid by an Acquiring Fund, has the effect of reducing the NAV per share on the ex-dividend date by the amount of the dividend or distribution. A dividend or distribution declared shortly after a purchase of shares by an investor would, therefore, represent, in substance, a return of capital to the shareholder with respect to such shares even though it would be subject to federal income taxes.
For most shareholders, a statement will be sent to you after the end of each calendar year detailing the federal income tax status of your distributions. Please see “Federal Income Tax Information” below for more
information on the federal income tax consequences of dividends and other distributions made by an Acquiring Fund.
Federal Income Tax Information
The federal income tax information in this Joint Proxy Statement/Prospectus is provided only for general information purposes for U.S. taxpayers and should not be considered as tax advice or relied on by a shareholder or prospective investor.
General. The Acquiring Funds intend to qualify annually to be treated as regulated investment companies (“RICs”) under the Code. As such, the Acquiring Funds will not be subject to federal income taxes on the earnings they distribute to shareholders provided they satisfy certain requirements and restrictions of the Code, one of which is to distribute to the Acquiring Fund’s shareholders substantially all of the Acquiring Fund’s net investment income each year. If for any taxable year an Acquiring Fund fails to qualify as a RIC: (1) it will be subject to tax in the same manner as an ordinary corporation and thus will be subject to taxation on a graduated basis at the corporate tax rate; and (2) distributions from its earnings and profits (as determined under federal income tax principles) will be taxable as ordinary dividend income eligible for the dividends-received deduction for corporate shareholders and for “qualified dividend income” treatment for non-corporate shareholders.
Distributions. The Acquiring Funds will make distributions to you that may be taxed as ordinary income or capital gains. The dividends and distributions you receive may be subject to federal, foreign, state and local taxation, depending upon your tax situation. Distributions are taxable whether you reinvest such distributions in additional shares of the Acquiring Fund or choose to receive them in cash. Fund distributions are taxable to a shareholder even if the distributions are paid from income or gains earned by an Acquiring Fund prior to the shareholder’s investment and, thus, were included in the price the shareholder paid for the shares. For example, a shareholder who purchases shares on or just before the record date of an Acquiring Fund distribution will pay full price for the shares and may receive a portion of the investment back as a taxable distribution. Distributions declared by an Acquiring Fund during October, November or December to shareholders of record during such month and paid by January 31 of the following year are treated for federal income tax purposes as if paid by the fund and received by shareholders on December 31 of the year in which the distribution was declared.
Ordinary Income. Net investment income, except for qualified dividend income and income designated as tax-exempt, and short-term capital gains that are distributed to you are taxable as ordinary income for federal income tax purposes regardless of how long you have held your Acquiring Fund shares. Certain dividends distributed to non-corporate shareholders and designated by an Acquiring Fund as “qualified dividend income” are eligible for long-term capital gains rates, provided certain holding period and other requirements are satisfied.
Net Capital Gains. Net capital gains (i.e., the excess of net long-term capital gains over net short-term capital losses) distributed to you, if any, are taxable as long-term capital gains for federal income tax purposes regardless of how long you have held your Acquiring Fund shares.
Sale or Exchange of Shares. It is a taxable event for you if you sell shares of an Acquiring Fund or exchange shares of an Acquiring Fund for shares of another Touchstone Fund. Depending on the purchase price and the sale price of the shares you sell or exchange, you may have a taxable gain or loss on the transaction. Any realized gain will be taxable to you, and, generally, will be capital gain, assuming you held the shares of the Acquiring Fund as a capital asset. The capital gain will be long-term or short-term depending on how long you have held the shares. Sales of shares of the Acquiring Fund that you have held for twelve months or less will be a short-term capital gain or loss and if held for more than twelve months will constitute a long-term capital gain or loss. Any loss realized by a shareholder on a disposition of shares held for six months or less will be treated as a long-term capital loss to the extent of any distributions of capital gain dividends received by the shareholder with respect to such shares. The deductibility of capital losses is subject to limitation.
Returns of Capital. If an Acquiring Fund makes a distribution in excess of its current and accumulated earnings and profits, the excess will be treated as a return of capital to the extent of a shareholder’s basis in his, her or its shares, and thereafter as capital gain. A return of capital is not taxable, but it reduces a shareholder’s basis in his, her or its shares, thus reducing any loss or increasing any gain on a subsequent taxable disposition by the shareholder of such shares.
Backup Withholding. An Acquiring Fund may be required to withhold U.S. federal income tax on all distributions and sales proceeds payable to shareholders who fail to provide their correct taxpayer identification number or to make required certifications, or if the Acquiring Fund or shareholder has been notified by the IRS that the shareholder is subject to backup withholding.
Medicare Tax. An additional 3.8% Medicare tax is imposed on certain net investment income (including dividends and distributions received from an Acquiring Fund and net gains from redemptions or other taxable dispositions of Acquiring Fund shares) of U.S. individuals, estates and trusts to the extent that such person’s “modified adjusted gross income” (in the case of an individual) or “adjusted gross income” (in the case of an estate or trust) exceeds a threshold amount.
Foreign Taxes. Income received by an Acquiring Fund from sources within foreign countries may be subject to foreign withholding and other taxes. If an Acquiring Fund qualifies (by having more than 50% of the value of its total assets at the close of the taxable year consist of stock or securities in foreign corporations or by being a qualified fund of funds) and elects to pass through foreign taxes paid on its investments during the year, such taxes will be reported to you as income. You may, however, be able to claim an offsetting tax credit or deduction on your federal income tax return, depending on your particular circumstances and provided you meet certain holding period and other requirements. Tax-exempt holders of Acquiring Fund shares, such as qualified tax-advantaged retirement plans, will not benefit from such a deduction or credit.
Non-U.S. Shareholders. Non-U.S. shareholders may be subject to U.S. tax as a result of an investment in an Acquiring Fund. This Joint Proxy Statement/Prospectus does not discuss the U.S. or foreign tax consequences of an investment by a non-U.S. shareholder in an Acquiring Fund. Accordingly, non-U.S. shareholders are urged and advised to consult their own tax advisors as to the U.S. and foreign tax consequences of an investment in an Acquiring Fund.
Statements and Notices. You will receive an annual statement outlining the tax status of your distributions. You may also receive written notices of certain foreign taxes paid by an Acquiring Fund during the prior taxable year.
Important Tax Reporting Considerations. The Acquiring Funds are required to report cost basis and holding period information to both the IRS and shareholders for gross proceeds from the sales of shares purchased on or after January 1, 2012 (“covered shares”). This information is reported on Form 1099-B. Cost basis reporting is not required if the shares were acquired in a reorganization and the basis of the acquired shares is determined from the basis of shares that were not covered shares. The average cost method will be used to determine the cost basis of Acquiring Fund shares that are covered shares unless the shareholder instructs an Acquiring Fund in writing that the shareholder wants to use another available method for cost basis reporting (for example, the first in, first out (FIFO), last in, first out (LIFO), specific lot identification (SLID) or high cost, first out (HIFO)). If the shareholder designates SLID as the shareholder’s tax cost basis method, the shareholder will also need to designate a secondary cost basis method (Secondary Method). If a Secondary Method is not provided, an Acquiring Fund will designate FIFO as the Secondary Method and will use the Secondary Method with respect to systematic withdrawals. If you hold shares of an Acquiring Fund through a financial intermediary, the financial intermediary will be responsible for this reporting and the financial intermediary’s default cost basis method may apply. Please consult your tax advisor for additional information regarding cost basis reporting and your situation. Redemptions by S corporations of covered shares are required to be reported to the IRS on Form 1099-B. If a shareholder is a corporation and has not instructed the Acquiring Fund that it is a C corporation in its Account Application or by written instruction, the Acquiring Fund will treat the shareholder as an S corporation and file a Form 1099-B.
This discussion does not address any state, local or foreign tax considerations and is limited to material federal income tax considerations. You are urged and advised to consult your own tax advisors as to the federal, state, local, foreign and other tax consequences of an investment in an Acquiring Fund in light of your individual circumstances, including the applicability and effect of possible changes in any applicable tax laws. This discussion is intended to be only a summary of some important federal income tax considerations that may affect your investment in an Acquiring Fund and should not be considered to be tax advice. There can be no assurance that the IRS will concur on all or any of the issues discussed above. More information regarding these considerations is included in the SAI relating to this Joint Proxy Statement/Prospectus for the Acquiring Fund corresponding to your Target Fund.
Financial Statements and Experts
The Annual Report with respect to the Target Funds has been incorporated by reference into this Joint Proxy Statement/Prospectus in reliance upon the report of PricewaterhouseCoopers LLP, 300 Madison Avenue, New York, New York 10017, the independent registered public accounting firm for the Target Funds, given on their authority as experts in accounting and auditing.
The financial statements of the Touchstone Flexible Income Fund and the Touchstone Sustainability and Impact Equity Fund included in the March 31, 2017 Touchstone Strategic Trust Annual Report were audited by Ernst & Young LLP, an independent registered public accounting firm, as set forth in their report thereon and are included in reliance upon such report given on the authority of such firm as experts in accounting and auditing.
The financial statements of the Touchstone Investment Trust, Touchstone Active Bond Fund and the Touchstone Funds Group Trust, Touchstone Ultra Short Duration Fixed Income Fund in their respective annual reports dated September 30, 2016 were audited by Ernst & Young LLP, an independent registered public accounting firm, as set forth in their report thereon and are included in reliance upon such report given on the authority of such firm as experts in accounting and auditing.
Legal Matters
Certain legal matters in connection with the issuance of Acquiring Fund shares of series of Touchstone Strategic Trust, a Massachusetts business trust, will be passed on by Morgan Lewis & Bockius LLP, Boston, Massachusetts. Certain legal matters in connection with the issuance of Acquiring Fund shares of series of Touchstone Funds Group Trust, a Delaware statutory trust will be passed on by DLA Piper US LLP, Wilmington, Delaware.
Additional Information
The Trusts are subject to the informational requirements of the Securities Exchange Act of 1934 and the 1940 Act, and in accordance therewith file reports and other information including proxy materials, information statements and charter documents with the SEC. These items can be inspected and copied at the Public Reference Facilities maintained by the SEC in Washington, D.C., located at 100 F Street, N.E., Washington, D.C. 20549, and at the SEC’s Regional Offices located at Northeast Regional Office, 3 World Financial Center, Room 4300, New York, New York 10281; Southeast Regional Office, 801 Brickell Avenue, Suite 1800, Miami, Florida 33131; Midwest Regional Office, 175 West Jackson Boulevard, Suite 900, Chicago, Illinois 60604; Central Regional Office, 1801 California Street, Suite 1500, Denver, Colorado 80202; and Pacific Regional Office, 5670 Wilshire Boulevard, 11th Floor, Los Angeles, California 90036. Copies of such materials can also be obtained at prescribed rates from the Public Reference Branch, Office of Consumer Affairs and Information Services, Securities and Exchange Commission, 100 F Street, N.E., Washington, D.C. 20549.
Other Business
Under Maryland law, the only matters that may be acted on at a special meeting of shareholders are those stated in the notice of the special meeting. Accordingly, other than procedural matters relating to the Reorganization proposals, no other business may properly come before the Special Meeting. Under the By-laws of the Sentinel Funds, the power to adjourn or conclude the Special Meeting (whether or not a quorum is present) resides with the chairman of the Special Meeting. If, however, any procedural matter requiring a vote of shareholders should arise, the persons named as proxies will vote on such procedural matter in accordance with their discretion.
THE SENTINEL FUNDS BOARD RECOMMENDS THAT SHAREHOLDERS OF EACH TARGET FUND APPROVE THE AGREEMENT AND PLAN OF REORGANIZATION FOR THEIR TARGET FUND AND ANY PROPERLY EXECUTED BUT UNMARKED PROXY CARDS WILL BE VOTED IN FAVOR OF APPROVAL OF THE AGREEMENT AND PLAN OF REORGANIZATION.
Target Fund Financial Highlights
The financial highlights tables with respect to each Sentinel Fund are intended to help you understand each Target Fund’s financial performance for the periods shown. The information below with respect to each Target Fund has been derived from the Target Funds’ financial statements for the fiscal year ended November 30, 2016, which have been audited by PricewaterhouseCoopers LLP, the Target Funds’ independent registered public accounting firm, whose report, along with the Target Funds’ financial statements, are included in the annual report, which is available upon request. Certain information reflects financial results for a single Fund share. The total returns in the tables represent the rate that an investor would have earned (or lost) on an investment in a Target Fund’s shares (assuming reinvestment of all dividends and other distributions).
| Sentinel Government Securities Fund |
| Selected Data for a Share Outstanding Throughout Each Period | | Year
Ended
November
30, 2016 | | Year
Ended
November
30, 2015 | | Year
Ended
November
30, 2014 | | Year
Ended
November
30, 2013 | | Year
Ended
November
30, 2012 |
| Net asset value, beginning of period | | | | | | | | | | | | | | | | | | | | |
| Class A | | | $9.97 | | | | $10.13 | | | | $10.04 | | | | $10.83 | | | | $10.72 | |
| Class C | | | 9.98 | | | | 10.14 | | | | 10.04 | | | | 10.84 | | | | 10.72 | |
| Class I | | | 9.97 | | | | 10.13 | | | | 10.04 | | | | 10.83 | | | | 10.72 | |
| | | | | | | | | | | | | | | | | | | | | |
| Income from Investment Operations | | | | | | | | | | | | | | | | | | | | |
| Net investment income (loss) | | | | | | | | | | | | | | | | | | | | |
| Class A | | | 0.16 | | | | 0.18 | | | | 0.18 | | | | 0.16 | | | | 0.14 | |
| Class C | | | 0.08 | | | | 0.10 | | | | 0.10 | | | | 0.08 | | | | 0.05 | |
| Class I | | | 0.19 | | | | 0.20 | | | | 0.21 | | | | 0.19 | | | | 0.16 | |
| Net gains or losses on securities (realized and unrealized) | | | | | | | | | | | | | | | | | | | | |
| Class A | | | (0.13 | ) | | | (0.10 | ) | | | 0.17 | | | | (0.66 | ) | | | 0.28 | |
| Class C | | | (0.13 | ) | | | (0.11 | ) | | | 0.17 | | | | (0.68 | ) | | | 0.30 | |
| Class I | | | (0.14 | ) | | | (0.10 | ) | | | 0.16 | | | | (0.67 | ) | | | 0.28 | |
| Total from investment operations | | | | | | | | | | | | | | | | | | | | |
| Class A | | | 0.03 | | | | 0.08 | | | | 0.35 | | | | (0.50 | ) | | | 0.42 | |
| Class C | | | (0.05 | ) | | | (0.01 | ) | | | 0.27 | | | | (0.60 | ) | | | 0.35 | |
| Class I | | | 0.05 | | | | 0.10 | | | | 0.37 | | | | (0.48 | ) | | | 0.44 | |
| | | | | | | | | | | | | | | | | | | | | |
| Less Distributions | | | | | | | | | | | | | | | | | | | | |
| Dividends (from net investment income) | | | | | | | | | | | | | | | | | | | | |
| Class A | | | 0.25 | | | | 0.24 | | | | 0.26 | | | | 0.26 | | | | 0.31 | |
| Class C | | | 0.17 | | | | 0.15 | | | | 0.17 | | | | 0.17 | | | | 0.23 | |
| Class I | | | 0.27 | | | | 0.26 | | | | 0.28 | | | | 0.28 | | | | 0.33 | |
| Distributions (from realized gains) | | | | | | | | | | | | | | | | | | | | |
| Class A | | | 0.00 | | | | 0.00 | | | | 0.00 | | | | 0.03 | | | | 0.00 | |
| Class C | | | 0.00 | | | | 0.00 | | | | 0.00 | | | | 0.03 | | | | 0.00 | |
| Class I | | | 0.00 | | | | 0.00 | | | | 0.00 | | | | 0.03 | | | | 0.00 | |
| Sentinel Government Securities Fund |
| Selected Data for a Share Outstanding Throughout Each Period | | Year
Ended
November
30, 2016 | | Year
Ended
November
30, 2015 | | Year
Ended
November
30, 2014 | | Year
Ended
November
30, 2013 | | Year
Ended
November
30, 2012 |
| Total distributions | | | | | | | | | | | | | | | | | | | | |
| Class A | | | 0.25 | | | | 0.24 | | | | 0.26 | | | | 0.29 | | | | 0.31 | |
| Class C | | | 0.17 | | | | 0.15 | | | | 0.17 | | | | 0.20 | | | | 0.23 | |
| Class I | | | 0.27 | | | | 0.26 | | | | 0.28 | | | | 0.31 | | | | 0.33 | |
| Net asset value, end of period | | | | | | | | | | | | | | | | | | | | |
| Class A | | | 9.75 | | | | 9.97 | | | | 10.13 | | | | 10.04 | | | | 10.83 | |
| Class C | | | 9.76 | | | | 9.98 | | | | 10.14 | | | | 10.04 | | | | 10.84 | |
| Class I | | | 9.75 | | | | 9.97 | | | | 10.13 | | | | 10.04 | | | | 10.83 | |
| | | | | | | | | | | | | | | | | | | | | |
| Ratios/Supplemental Data | | | | | | | | | | | | | | | | | | | | |
| Total return (%)* | | | | | | | | | | | | | | | | | | | | |
| Class A | | | 0.24 | % | | | 0.77 | % | | | 3.50 | % | | | (4.75 | )% | | | 3.94 | % |
| Class C | | | (0.56 | ) | | | (0.07 | ) | | | 2.73 | | | | (5.61 | ) | | | 3.26 | |
| Class I | | | 0.44 | | | | 0.99 | | | | 3.73 | | | | (4.51 | ) | | | 0.21 | |
| Net assets at end of period (000 omitted) | | | | | | | | | | | | | | | | | | | | |
| Class A | | | $154,133 | | | | $189,623 | | | | $268,380 | | | | $429,416 | | | | $791,599 | |
| Class C | | | 20,954 | | | | 25,668 | | | | 35,387 | | | | 58,371 | | | | 120,709 | |
| Class I | | | 23,562 | | | | 29,048 | | | | 50,493 | | | | 70,078 | | | | 145,869 | |
| Ratio of expenses to average net assets (%) | | | | | | | | | | | | | | | | | | | | |
| Class A | | | 0.91 | % | | | 0.96 | % | | | 0.92 | % | | | 0.83 | % | | | 0.81 | % |
| Class C | | | 1.72 | | | | 1.74 | | | | 1.73 | | | | 1.63 | | | | 1.59 | |
| Class I | | | 0.68 | | | | 0.73 | | | | 0.68 | | | | 0.60 | | | | 0.57 | |
| Ratio of expenses to average net assets before contractual and voluntary expense reimbursements (%)** | | | | | | | | | | | | | | | | | | | | |
| Class A | | | 0.91 | | | | 0.96 | | | | 0.92 | | | | 0.83 | | | | 0.81 | |
| Class C | | | 1.72 | | | | 1.74 | | | | 1.73 | | | | 1.63 | | | | 1.59 | |
| Class I | | | 0.68 | | | | 0.73 | | | | 0.68 | | | | 0.60 | | | | 0.57 | |
| Ratio of net investment income (loss) to average net assets (%) | | | | | | | | | | | | | | | | | | | | |
| Class A | | | 1.63 | | | | 1.76 | | | | 1.80 | | | | 1.54 | | | | 1.29 | |
| Class C | | | 0.82 | | | | 0.98 | | | | 0.99 | | | | 0.73 | | | | 0.50 | |
| Class I | | | 1.88 | | | | 1.98 | | | | 2.05 | | | | 1.76 | | | | 1.52 | |
| Sentinel Government Securities Fund |
| Selected Data for a Share Outstanding Throughout Each Period | | Year
Ended
November
30, 2016 | | Year
Ended
November
30, 2015 | | Year
Ended
November
30, 2014 | | Year
Ended
November
30, 2013 | | Year
Ended
November
30, 2012 |
| Ratio of net investment income (loss) to average net assets before contractual and voluntary expense reimbursements (%)** | | | | | | | | | | | | | | | | | | | | |
| Class A | | | 1.63 | | | | 1.76 | | | | 1.80 | | | | 1.54 | | | | 1.29 | |
| Class C | | | 0.82 | | | | 0.98 | | | | 0.99 | | | | 0.73 | | | | 0.50 | |
| Class I | | | 1.88 | | | | 1.98 | | | | 2.05 | | | | 1.76 | | | | 1.52 | |
| Portfolio turnover rate (%) | | | | | | | | | | | | | | | | | | | | |
| Class A | | | 59 | | | | 150 | | | | 161 | | | | 795 | | | | 581 | |
| Class C | | | 59 | | | | 150 | | | | 161 | | | | 795 | | | | 581 | |
| Class I | | | 59 | | | | 150 | | | | 161 | | | | 795 | | | | 581 | |
| Sentinel Low Duration Bond Fund |
| | | November
30, 2016 | | November
30, 2015 | | November
30, 2014(B) | | November
30, 2013 | | November
30, 2012 |
| Net asset value, beginning of period | | | | | | | | | | | | | | | | | | | | |
| Class A | | | $8.53 | | | | $8.73 | | | | $8.84 | | | | $9.06 | | | | $9.20 | |
| Class I(B) | | | 8.53 | | | | 8.73 | | | | 8.82 | | | | | | | | | |
| Class S | | | 8.54 | | | | 8.74 | | | | 8.84 | | | | 9.07 | | | | 9.20 | |
| | | | | | | | | | | | | | | | | | | | | |
| Income from Investment Operations | | | | | | | | | | | | | | | | | | | | |
| Net investment income (loss) | | | | | | | | | | | | | | | | | | | | |
| Class A | | | 0.13 | | | | 0.17 | | | | 0.12 | | | | 0.03 | | | | 0.06 | |
| Class I(B) | | | 0.17 | | | | 0.20 | | | | 0.13 | | | | | | | | | |
| Class S | | | 0.12 | | | | 0.16 | | | | 0.11 | | | | 0.01 | | | | 0.02 | |
| Net gains or losses on securities (realized and unrealized) | | | | | | | | | | | | | | | | | | | | |
| Class A | | | (0.08 | ) | | | (0.18 | ) | | | (0.07 | ) | | | (0.10 | ) | | | (0.02 | ) |
| Class I(B) | | | (0.08 | ) | | | (0.19 | ) | | | (0.06 | ) | | | | | | | | |
| Class S | | | (0.07 | ) | | | (0.18 | ) | | | (0.06 | ) | | | (0.12 | ) | | | (0.01 | ) |
| Total from investment operations | | | | | | | | | | | | | | | | | | | | |
| Class A | | | 0.05 | | | | (0.01 | ) | | | 0.05 | | | | (0.07 | ) | | | 0.04 | |
| Class I(B) | | | 0.09 | | | | 0.01 | | | | 0.07 | | | | | | | | | |
| Class S | | | 0.05 | | | | (0.02 | ) | | | 0.05 | | | | (0.11 | ) | | | 0.01 | |
| | | | | | | | | | | | | | | | | | | | | |
| Less Distributions | | | | | | | | | | | | | | | | | | | | |
| Dividends (from net investment income) | | | | | | | | | | | | | | | | | | | | |
| Class A | | | 0.17 | | | | 0.19 | | | | 0.16 | | | | 0.15 | | | | 0.18 | |
| Class I | | | 0.19 | | | | 0.21 | | | | 0.16 | | | | | | | | | |
| Class S | | | 0.16 | | | | 0.18 | | | | 0.15 | | | | 0.12 | | | | 0.14 | |
| Net asset value, end of period | | | | | | | | | | | | | | | | | | | | |
| Class A | | | 8.41 | | | | 8.53 | | | | 8.73 | | | | 8.84 | | | | 9.06 | |
| Class I(B) | | | 8.43 | | | | 8.53 | | | | 8.73 | | | | | | | | | |
| Class S | | | 8.43 | | | | 8.54 | | | | 8.74 | | | | 8.84 | | | | 9.07 | |
| | | | | | | | | | | | | | | | | | | | | |
| Ratios/Supplemental Data | | | | | | | | | | | | | | | | | | | | |
| Total return (%)* | | | | | | | | | | | | | | | | | | | | |
| Class A | | | 0.58 | % | | | (0.12 | )% | | | 0.54 | % | | | (0.82 | )% | | | 0.40 | % |
| Class I(B) | | | 1.08 | | | | 0.14 | | | | 0.75 | | | | | | | | | |
| Class S | | | 0.54 | | | | (0.29 | ) | | | 0.53 | | | | (1.19 | ) | | | 0.11 | |
| Net assets at end of period (000 omitted) | | | | | | | | | | | | | | | | | | | | |
| Class A | | | $98,167 | | | | $117,770 | | | | $187,430 | | | | $307,959 | | | | $554,187 | |
| Class I(B) | | | 17,802 | | | | 47,788 | | | | 44,267 | | | | (B) | | | | (B) | |
| Class S | | | 235,133 | | | | 342,516 | | | | 516,503 | | | | 691,645 | | | | 1,535,093 | |
| Sentinel Low Duration Bond Fund |
| | | November
30, 2016 | | November
30, 2015 | | November
30, 2014(B) | | November
30, 2013 | | November
30, 2012 |
| Ratio of expenses to average net assets (%) | | | | | | | | | | | | | | | | | | | | |
| Class A | | | 0.94 | % | | | 0.97 | % | | | 0.95 | % | | | 0.89 | % | | | 0.86 | % |
| Class I(B) | | | 0.60 | | | | 0.63 | | | | 0.68 | | | | | | | | | |
| Class S | | | 1.08 | | | | 1.09 | | | | 1.08 | | | | 1.13 | | | | 1.25 | |
| Ratio of expenses to average net assets before contractual and voluntary expense reimbursements (%)** | | | | | | | | | | | | | | | | | | | | |
| Class A | | | 0.94 | | | | 0.97 | | | | 0.95 | | | | 0.89 | | | | 0.86 | |
| Class I(B) | | | 0.60 | | | | 0.63 | | | | 0.68 | | | | | | | | | |
| Class S | | | 1.08 | | | | 1.09 | | | | 1.13 | | | | 1.27 | | | | 1.25 | |
| Ratio of net investment income (loss) to average net assets (%) | | | | | | | | | | | | | | | | | | | | |
| Class A | | | 1.54 | | | | 1.92 | | | | 1.33 | | | | 0.37 | | | | 0.65 | |
| Class I(B) | | | 2.03 | | | | 2.29 | | | | 1.83 | | | | | | | | | |
| Class S | | | 1.41 | | | | 1.81 | | | | 1.23 | | | | 0.12 | | | | 0.27 | |
| Ratio of net investment income (loss) to average net assets before contractual and voluntary expense reimbursements (%)** | | | | | | | | | | | | | | | | | | | | |
| Class A | | | 1.54 | | | | 1.92 | | | | 1.33 | | | | 0.37 | | | | 0.65 | |
| Class I(B) | | | 2.03 | | | | 2.29 | | | | 1.83 | | | | | | | | | |
| Class S | | | 1.41 | | | | 1.81 | | | | 1.19 | | | | (0.03 | ) | | | 0.27 | |
| Portfolio turnover rate (%) | | | | | | | | | | | | | | | | | | | | |
| Class A | | | 117 | | | | 27 | | | | 51 | | | | 16 | | | | 27 | |
| Class I(B) | | | 117 | | | | 27 | | | | 51 | | | | | | | | | |
| Class S | | | 117 | | | | 27 | | | | 51 | | | | 16 | | | | 27 | |
* See Notes at page [•].
| Sentinel Multi-Asset Income Fund |
| Selected Date for a Share Outstanding Throughout Each Period | | Year
Ended
November
30, 2016 | | Year
Ended
November
30, 2015 | | Year
Ended
November
30, 2014 | | Year
Ended
November
30, 2013 | | Year
Ended
November
30, 2012 |
| Net asset value, beginning of period | | | | | | | | | | | | | | | | | | | | |
| Class A | | | $12.78 | | | | $14.13 | | | | $13.65 | | | | $12.55 | | | | $11.74 | |
| Class C | | | 12.72 | | | | 14.08 | | | | 13.61 | | | | 12.50 | | | | 11.70 | |
| Class I | | | 12.76 | | | | 14.11 | | | | 13.64 | | | | 12.52 | | | | 11.71 | |
| | | | | | | | | | | | | | | | | | | | | |
| Income from Investment Operations | | | | | | | | | | | | | | | | | | | | |
| Net investment income (loss) | | | | | | | | | | | | | | | | | | | | |
| Class A | | | 0.36 | | | | 0.37 | | | | 0.26 | | | | 0.21 | | | | 0.16 | |
| Class C | | | 0.27 | | | | 0.28 | | | | 0.17 | | | | 0.11 | | | | 0.08 | |
| Class I | | | 0.38 | | | | 0.41 | | | | 0.31 | | | | 0.24 | | | | 0.18 | |
| Net gains or losses on securities (realized and unrealized) | | | | | | | | | | | | | | | | | | | | |
| Class A | | | 0.21 | | | | (0.39 | ) | | | 0.50 | | | | 1.12 | | | | 0.86 | |
| Class C | | | 0.21 | | | | (0.40 | ) | | | 0.48 | | | | 1.13 | | | | 0.86 | |
| Class I | | | 0.22 | | | | (0.39 | ) | | | 0.48 | | | | 1.13 | | | | 0.85 | |
| Total from investment operations | | | | | | | | | | | | | | | | | | | | |
| Class A | | | $0.57 | | | | ($0.02 | ) | | | $0.76 | | | | $1.33 | | | | $1.02 | |
| Class C | | | 0.48 | | | | (0.12 | ) | | | 0.65 | | | | 1.24 | | | | 0.94 | |
| Class I | | | 0.60 | | | | 0.02 | | | | 0.79 | | | | 1.37 | | | | 1.03 | |
| | | | | | | | | | | | | | | | | | | | | |
| Less Distributions | | | | | | | | | | | | | | | | | | | | |
| Dividends (from net investment income) | | | | | | | | | | | | | | | | | | | | |
| Class A | | | 0.37 | | | | 0.39 | | | | 0.28 | | | | 0.23 | | | | 0.21 | |
| Class C | | | 0.28 | | | | 0.30 | | | | 0.18 | | | | 0.13 | | | | 0.14 | |
| Class I | | | 0.41 | | | | 0.43 | | | | 0.32 | | | | 0.25 | | | | 0.22 | |
| Distributions (from realized gains) | | | | | | | | | | | | | | | | | | | | |
| Class A | | | 0.84 | | | | 0.94 | | | | - | | | | - | | | | - | |
| Class C | | | 0.84 | | | | 0.94 | | | | - | | | | - | | | | - | |
| Class I | | | 0.84 | | | | 0.94 | | | | - | | | | - | | | | - | |
| Total distributions | | | | | | | | | | | | | | | | | | | | |
| Class A | | | 1.21 | | | | 1.33 | | | | 0.28 | | | | 0.23 | | | | 0.21 | |
| Class C | | | 1.12 | | | | 1.24 | | | | 0.18 | | | | 0.13 | | | | 0.14 | |
| Class I | | | 1.25 | | | | 1.37 | | | | 0.32 | | | | 0.25 | | | | 0.22 | |
| Net asset value, end of period | | | | | | | | | | | | | | | | | | | | |
| Class A | | | 12.14 | | | | 12.78 | | | | 14.13 | | | | 13.65 | | | | 12.55 | |
| Class C | | | 12.08 | | | | 12.72 | | | | 14.08 | | | | 13.61 | | | | 12.50 | |
| Class I | | | 12.11 | | | | 12.76 | | | | 14.11 | | | | 13.64 | | | | 12.52 | |
| Sentinel Multi-Asset Income Fund |
| Selected Date for a Share Outstanding Throughout Each Period | | Year
Ended
November
30, 2016 | | Year
Ended
November
30, 2015 | | Year
Ended
November
30, 2014 | | Year
Ended
November
30, 2013 | | Year
Ended
November
30, 2012 |
| Ratios/Supplemental Data | | | | | | | | | | | | | | | | | | | | |
| Total return (%)* | | | | | | | | | | | | | | | | | | | | |
| Class A | | | 4.99 | % | | | 0.01 | % | | | 5.61 | % | | | 10.67 | % | | | 8.78 | % |
| Class C | | | 4.26 | | | | (0.78 | ) | | | 4.83 | �� | | | 9.99 | | | | 8.04 | |
| Class I | | | 5.22 | | | | 0.29 | | | | 5.86 | | | | 11.01 | | | | 8.87 | |
| Net assets at end of period (000 omitted) | | | | | | | | | | | | | | | | | | | | |
| Class A | | | $125,475 | | | | $126,591 | | | | $140,670 | | | | $166,168 | | | | $134,682 | |
| Class C | | | 105,852 | | | | 109,108 | | | | 117,373 | | | | 97,839 | | | | 70,037 | |
| Class I | | | 71,333 | | | | 50,728 | | | | 55,996 | | | | 29,833 | | | | 17,882 | |
| Ratio of expenses to average net assets (%) | | | | | | | | | | | | | | | | | | | | |
| Class A | | | 1.01 | % | | | 1.04 | % | | | 1.04 | % | | | 1.03 | % | | | 1.12 | % |
| Class C | | | 1.75 | | | | 1.77 | | | | 1.76 | | | | 1.77 | | | | 1.81 | |
| Class I | | | 0.79 | | | | 0.77 | | | | 0.75 | | | | 0.80 | | | | 1.00 | |
| Ratio of expenses to average net assets before contractual and voluntary expense reimbursements (%)** | | | | | | | | | | | | | | | | | | | | |
| Class A | | | 1.01 | | | | 1.04 | | | | 1.04 | | | | 1.03 | | | | 1.12 | |
| Class C | | | 1.75 | | | | 1.77 | | | | 1.76 | | | | 1.77 | | | | 1.81 | |
| Class I | | | 0.79 | | | | 0.77 | | | | 0.75 | | | | 0.80 | | | | 1.00 | |
| Ratio of net investment income (loss) to average net assets (%) | | | | | | | | | | | | | | | | | | | | |
| Class A | | | 2.97 | | | | 2.86 | | | | 1.89 | | | | 1.58 | | | | 1.33 | |
| Class C | | | 2.23 | | | | 2.13 | | | | 1.19 | | | | 0.83 | | | | 0.65 | |
| Class I | | | 3.14 | | | | 3.13 | | | | 2.24 | | | | 1.79 | | | | 1.47 | |
| Ratio of net investment income (loss) to average net assets before contractual and voluntary expense reimbursements (%)** | | | | | | | | | | | | | | | | | | | | |
| Class A | | | 2.97 | | | | 2.86 | | | | 1.89 | | | | 1.58 | | | | 1.33 | |
| Class C | | | 2.23 | | | | 2.13 | | | | 1.19 | | | | 0.83 | | | | 0.65 | |
| Class I | | | 3.14 | | | | 3.13 | | | | 2.24 | | | | 1.79 | | | | 1.47 | |
| Portfolio turnover rate (%) | | | | | | | | | | | | | | | | | | | | |
| Class A | | | 228 | | | | 198 | | | | 166 | | | | 279 | | | | 315 | |
| Class C | | | 228 | | | | 198 | | | | 166 | | | | 279 | | | | 315 | |
| Class I | | | 228 | | | | 198 | | | | 166 | | | | 279 | | | | 315 | |
* See Notes at page [•].
| Sentinel Sustainable Core Opportunities Fund |
| Selected Date for a Share Outstanding Throughout Each Period | | Year
Ended
November
30, 2016 | | Year
Ended
November
30, 2015 | | Year
Ended
November
30, 2014 | | Year
Ended
November
30, 2013 | | Year
Ended
November
30, 2012 |
| Net asset value, beginning of period | | | | | | | | | | | | | | | | | | | | |
| Class A | | | $20.63 | | | | $20.83 | | | | $18.51 | | | | $14.26 | | | | $12.57 | |
| Class I | | | 20.73 | | | | 20.93 | | | | 18.57 | | | | 14.31 | | | | 12.62 | |
| | | | | | | | | | | | | | | | | | | | | |
| Income from Investment Operations | | | | | | | | | | | | | | | | | | | | |
| Net investment income (loss) | | | | | | | | | | | | | | | | | | | | |
| Class A | | | 0.17 | | | | 0.38 | | | | 0.16 | | | | 0.11 | | | | 0.09 | |
| Class I | | | 0.23 | | | | 0.44 | | | | 0.22 | | | | 0.15 | | | | 0.13 | |
| Net gains or losses on securities (realized and unrealized) | | | | | | | | | | | | | | | | | | | | |
| Class A | | | 1.01 | | | | (0.41 | ) | | | 2.27 | | | | 4.25 | | | | 1.66 | |
| Class I | | | 1.01 | | | | (0.42 | ) | | | 2.27 | | | | 4.25 | | | | 1.67 | |
| Total from investment operations | | | | | | | | | | | | | | | | | | | | |
| Class A | | | 1.18 | | | | (0.03 | ) | | | 2.43 | | | | 4.36 | | | | 1.75 | |
| Class I | | | 1.24 | | | | 0.02 | | | | 2.49 | | | | 4.40 | | | | 1.80 | |
| | | | | | | | | | | | | | | | | | | | | |
| Less Distributions | | | | | | | | | | | | | | | | | | | | |
| Dividends (from net investment income) | | | | | | | | | | | | | | | | | | | | |
| Class A | | | 0.41 | | | | 0.17 | | | | 0.11 | | | | 0.11 | | | | 0.06 | |
| Class I | | | 0.47 | | | | 0.22 | | | | 0.13 | | | | 0.14 | | | | 0.11 | |
| Distributions (from realized gains) | | | | | | | | | | | | | | | | | | | | |
| Class A | | | 0.20 | | | | - | | | | - | | | | - | | | | - | |
| Class I | | | 0.20 | | | | - | | | | - | | | | - | | | | - | |
| Total distributions | | | | | | | | | | | | | | | | | | | | |
| Class A | | | 0.61 | | | | 0.17 | | | | 0.11 | | | | 0.11 | | | | 0.06 | |
| Class I | | | 0.67 | | | | 0.22 | | | | 0.13 | | | | 0.14 | | | | 0.11 | |
| Net asset value, end of period | | | | | | | | | | | | | | | | | | | | |
| Class A | | | 21.20 | | | | 20.63 | | | | 20.83 | | | | 18.51 | | | | 14.26 | |
| Class I | | | 21.30 | | | | 20.73 | | | | 20.93 | | | | 18.57 | | | | 14.31 | |
| | | | | | | | | | | | | | | | | | | | | |
| Ratios/Supplemental Data | | | | | | | | | | | | | | | | | | | | |
| Total return (%)* | | | | | | | | | | | | | | | | | | | | |
| Class A | | | 5.92 | % | | | (0.13 | )%# | | | 13.18 | % | | | 30.74 | % | | | 14.00 | % |
| Class I | | | 6.20 | | | | 0.12 | # | | | 13.50 | | | | 31.05 | | | | 14.38 | |
| Net assets at end of period (000 omitted) | | | | | | | | | | | | | | | | | | | | |
| Class A | | | $340,815 | | | | $224,862 | | | | $239,707 | | | | $224,489 | | | | $182,345 | |
| Class I | | | 21,777 | | | | 14,926 | | | | 15,275 | | | | 12,418 | | | | 8,194 | |
| Sentinel Sustainable Core Opportunities Fund |
| Selected Date for a Share Outstanding Throughout Each Period | | Year
Ended
November
30, 2016 | | Year
Ended
November
30, 2015 | | Year
Ended
November
30, 2014 | | Year
Ended
November
30, 2013 | | Year
Ended
November
30, 2012 |
| Ratio of expenses to average net assets (%) | | | | | | | | | | | | | | | | | | | | |
| Class A | | | 1.18 | % | | | 1.21 | % | | | 1.24 | % | | | 1.26 | % | | | 1.32 | % |
| Class I | | | 0.91 | | | | 0.93 | | | | 0.97 | | | | 1.00 | | | | 1.04 | |
| Ratio of expenses to average net assets before contractual and voluntary expense reimbursements (%)** | | | | | | | | | | | | | | | | | | | | |
| Class A | | | 1.18 | | | | 1.21 | | | | 1.24 | | | | 1.26 | | | | 1.32 | |
| Class I | | | 0.91 | | | | 0.93 | | | | 0.97 | | | | 1.00 | | | | 1.04 | |
| Ratio of net investment income (loss) to average net assets (%) | | | | | | | | | | | | | | | | | | | | |
| Class A | | | 0.86 | | | | 1.85 | ^ | | | 0.85 | | | | 0.67 | | | | 0.66 | |
| Class I | | | 1.14 | | | | 2.13 | ^ | | | 1.13 | | | | 0.93 | | | | 0.94 | |
| Ratio of net investment income (loss) to average net assets before contractual and voluntary expense reimbursements (%)** | | | | | | | | | | | | | | | | | | | | |
| Class A | | | 0.86 | | | | 1.85^ | | | | 0.85 | | | | 0.67 | | | | 0.66 | |
| Class I | | | 1.14 | | | | 2.13^ | | | | 1.13 | | | | 0.93 | | | | 0.94 | |
| Portfolio turnover rate (%) | | | | | | | | | | | | | | | | | | | | |
| Class A | | | 33 | | | | 20 | | | | 20 | | | | 14 | | | | 4 | |
| Class I | | | 33 | | | | 20 | | | | 20 | | | | 14 | | | | 4 | |
* See Notes at page [•].
| Sentinel Total Return Bond Fund |
| | | November
30, 2016 | | November
30, 2015(A) | | November
30, 2014 | | November
30, 2013 | | November
30, 2012 |
| Net asset value, beginning of period | | | | | | | | | | | | | | | | | | | | |
| Class A | | | $10.34 | | | | $10.64 | | | | $10.65 | | | | $10.93 | | | | $10.14 | |
| Class C | | | 10.31 | | | | 10.61 | | | | 10.63 | | | | 10.91 | | | | 10.13 | |
| Class I | | | 10.35 | | | | 10.65 | | | | 10.66 | | | | 10.94 | | | | 10.14 | |
| Class R3(A) | | | 10.34 | | | | 10.53 | | | | | | | | | | | | | |
| Class R6(A) | | | 10.35 | | | | 10.53 | | | | | | | | | | | | | |
| | | | | | | | | | | | | | | | | | | | | |
| Income from Investment Operations | | | | | | | | | | | | | | | | | | | | |
| Net investment income (loss) | | | | | | | | | | | | | | | | | | | | |
| Class A | | | 0.18 | | | | 0.19 | | | | 0.24 | | | | 0.25 | | | | 0.21 | |
| Class C | | | 0.10 | | | | 0.10 | | | | 0.18 | | | | 0.20 | | | | 0.17 | |
| Class I | | | 0.20 | | | | 0.20 | | | | 0.25 | | | | 0.29 | | | | 0.23 | |
| Class R3(A) | | | 0.18 | | | | 0.18 | | | | | | | | | | | | | |
| Class R6(A) | | | 0.20 | | | | 0.20 | | | | | | | | | | | | | |
| Net gains or losses on securities (realized and unrealized) | | | | | | | | | | | | | | | | | | | | |
| Class A | | | (0.05 | ) | | | (0.28 | ) | | | 0.15 | | | | 0.00 | | | | 1.01 | |
| Class C | | | (0.06 | ) | | | (0.28 | ) | | | 0.14 | | | | (0.01 | ) | | | 1.02 | |
| Class I | | | (0.05 | ) | | | (0.27 | ) | | | 0.15 | | | | (0.03 | ) | | | 1.02 | |
| Class R3(A) | | | (0.06 | ) | | | (0.18 | ) | | | | | | | | | | | | |
| Class R6(A) | | | (0.06 | ) | | | (0.17 | ) | | | | | | | | | | | | |
| Total from investment operations | | | | | | | | | | | | | | | | | | | | |
| Class A | | | 0.13 | | | | (0.09 | ) | | | 0.39 | | | | 0.25 | | | | 1.22 | |
| Class C | | | 0.04 | | | | (0.18 | ) | | | 0.32 | | | | 0.19 | | | | 1.19 | |
| Class I | | | 0.15 | | | | (0.07 | ) | | | 0.40 | | | | 0.26 | | | | 1.25 | |
| Class R3 | | | 0.12 | | | | - | | | | | | | | | | | | | |
| Class R6 | | | 0.14 | | | | 0.03 | | | | | | | | | | | | | |
| Sentinel Total Return Bond Fund |
| | | November
30, 2016 | | November
30, 2015(A) | | November
30, 2014 | | November
30, 2013 | | November
30, 2012 |
| Less Distributions | | | | | | | | | | | | | | | | | | | | |
| Dividends | | | | | | | | | | | | | | | | | | | | |
| Class A | | | 0.23 | | | | 0.21 | | | | 0.27 | | | | 0.28 | | | | 0.25 | |
| Class C | | | 0.14 | | | | 0.12 | | | | 0.21 | | | | 0.22 | | | | 0.23 | |
| Class I | | | 0.25 | | | | 0.23 | | | | 0.28 | | | | 0.29 | | | | 0.27 | |
| Class R3(A) | | | 0.23 | | | | 0.19 | | | | | | | | | | | | | |
| Class R6(A) | | | 0.25 | | | | 0.21 | | | | | | | | | | | | | |
| Distributions (from realized gains) | | | | | | | | | | | | | | | | | | | | |
| Class A | | | - | | | | - | | | | 0.13 | | | | 0.25 | | | | 0.18 | |
| Class C | | | - | | | | - | | | | 0.13 | | | | 0.25 | | | | 0.18 | |
| Class I | | | - | | | | - | | | | 0.13 | | | | 0.25 | | | | 0.18 | |
| Class R3(A) | | | - | | | | - | | | | | | | | | | | | | |
| Class R6(A) | | | - | | | | - | | | | | | | | | | | | | |
| Total distributions (from net investment income) | | | | | | | | | | | | | | | | | | | | |
| Class A | | | 0.23 | | | | 0.21 | | | | 0.40 | | | | 0.53 | | | | 0.43 | |
| Class C | | | 0.14 | | | | 0.12 | | | | 0.34 | | | | 0.47 | | | | 0.41 | |
| Class I | | | 0.25 | | | | 0.23 | | | | 0.41 | | | | 0.54 | | | | 0.45 | |
| Class R3 | | | 0.23 | | | | 0.19 | | | | | | | | | | | | | |
| Class R6 | | | 0.25 | | | | 0.21 | | | | | | | | | | | | | |
| Net asset value, end of period | | | | | | | | | | | | | | | | | | | | |
| Class A | | | 10.24 | | | | 10.34 | | | | 10.64 | | | | 10.65 | | | | 10.93 | |
| Class C | | | 10.21 | | | | 10.31 | | | | 10.61 | | | | 10.63 | | | | 10.91 | |
| Class I | | | 10.25 | | | | 10.35 | | | | 10.65 | | | | 10.66 | | | | 10.94 | |
| Class R3(A) | | | 10.23 | | | | 10.34 | | | | | | | | | | | | | |
| Class R6(A) | | | 10.24 | | | | 10.35 | | | | | | | | | | | | | |
| | | | | | | | | | | | | | | | | | | | | |
| Ratios/Supplemental Data | | | | | | | | | | | | | | | | | | | | |
| Total return (%)* | | | | | | | | | | | | | | | | | | | | |
| Class A | | | 1.26 | % | | | (0.87 | )% | | | 3.66 | % | | | 2.33 | % | | | 12.34 | % |
| Class C | | | 0.40 | | | | (1.69 | ) | | | 3.01 | | | | 1.79 | | | | 12.02 | |
| Class I | | | 1.40 | | | | (0.70 | ) | | | 3.79 | | | | 2.46 | | | | 12.59 | |
| Class R3(A) | | | 1.16 | | | | - | ++ | | | | | | | | | | | | |
| Class R6(A) | | | 1.36 | | | | 0.26 | ++ | | | | | | | | | | | | |
| Sentinel Total Return Bond Fund |
| | | November
30, 2016 | | November
30, 2015(A) | | November
30, 2014 | | November
30, 2013 | | November
30, 2012 |
| Net assets at end of period (000 omitted) | | | | | | | | | | | | | | | | | | | | |
| Class A | | | $92,331 | | | | $315,820 | | | | $203,871 | | | | $102,138 | | | | $111,263 | |
| Class C | | | 30,866 | | | | 42,316 | | | | 47,015 | | | | 26,222 | | | | 29,323 | |
| Class I | | | 280,081 | | | | 472,782 | | | | 485,459 | | | | 61,268 | | | | 22,792 | |
| Class R3(A) | | | 603 | | | | 596 | | | | | | | | | | | | | |
| Class R6(A) | | | 605 | | | | 596 | | | | | | | | | | | | | |
| Ratio of expenses to average net assets (%) | | | | | | | | | | | | | | | | | | | | |
| Class A | | | 0.89 | % | | | 0.89 | % | | | 0.89 | % | | | 0.89 | % | | | 0.94 | % |
| Class C | | | 1.73 | | | | 1.70 | | | | 1.49 | @ | | | 1.42 | | | | 1.35 | |
| Class I | | | 0.74 | | | | 0.69 | | | | 0.74 | | | | 0.73 | | | | 0.77 | |
| Class R3(A) | | | 0.89 | @ | | | 0.89 | +@ | | | | | | | | | | | | |
| Class R6(A) | | | 0.69 | | | | 0.69 | + | | | | | | | | | | | | |
| Ratio of expenses to average net assets before contractual and voluntary expense reimbursements (%)** | | | | | | | | | | | | | | | | | | | | |
| Class A | | | 1.07 | | | | 0.94 | | | | 0.93 | | | | 0.95 | | | | 0.96 | |
| Class C | | | 1.73 | | | | 1.75 | | | | 1.53 | @ | | | 1.48 | | | | 1.37 | |
| Class I | | | 0.74 | | | | 0.74 | | | | 0.78 | | | | 0.79 | | | | 0.79 | |
| Class R3(A) | | | 2.91 | @ | | | 2.87 | +@ | | | | | | | | | | | | |
| Class R6(A) | | | 2.90 | | | | 2.87 | + | | | | | | | | | | | | |
| Ratio of net investment income (loss) to average net assets (%) | | | | | | | | | | | | | | | | | | | | |
| Class A | | | 1.79 | | | | 1.76 | | | | 2.25 | | | | 2.38 | | | | 2.00 | |
| Class C | | | 0.94 | | | | 0.93 | | | | 1.68 | | | | 1.88 | | | | 1.62 | |
| Class I | | | 1.93 | | | | 1.94 | | | | 2.31 | | | | 2.69 | | | | 2.20 | |
| Class R3(A) | | | 1.77 | | | | 1.86 | + | | | | | | | | | | | | |
| Class R6(A) | | | 1.97 | | | | 2.06 | + | | | | | | | | | | | | |
| Ratio of net investment income (loss) to average net assets before contractual and voluntary expense reimbursements (%)** | | | | | | | | | | | | | | | | | | | | |
| Class A | | | 1.61 | | | | 1.71 | | | | 2.21 | | | | 2.32 | | | | 1.98 | |
| Class C | | | 0.94 | | | | 0.88 | | | | 1.64 | | | | 1.81 | | | | 1.60 | |
| Class I | | | 1.93 | | | | 1.89 | | | | 2.27 | | | | 2.63 | | | | 2.19 | |
| Class R3(A) | | | (0.25 | ) | | | (0.12 | )+ | | | | | | | | | | | | |
| Class R6(A) | | | (0.24 | ) | | | (0.12 | )+ | | | | | | | | | | | | |
| Sentinel Total Return Bond Fund |
| | | November
30, 2016 | | November
30, 2015(A) | | November
30, 2014 | | November
30, 2013 | | November
30, 2012 |
| Portfolio turnover rate (%) | | | | | | | | | | | | | | | | | | | | |
| Class A | | | 240 | | | | 441 | | | | 432 | | | | 499 | | | | 915 | |
| Class C | | | 240 | | | | 441 | | | | 432 | | | | 499 | | | | 915 | |
| Class I | | | 240 | | | | 441 | | | | 432 | | | | 499 | | | | 915 | |
| Class R3(A) | | | 240 | | | | 441 | ++ | | | | | | | | | | | | |
| Class R6(A) | | | 240 | | | | 441 | ++ | | | | | | | | | | | | |
* See Notes at page [•].
| Sentinel Balanced Fund |
| Selected Data for a Share Outstanding Throughout Each Period | | Year
Ended
November
30, 2016 | | Year
Ended
November
30, 2015 | | Year
Ended
November
30, 2014 | | Year
Ended
November
30, 2013 | | Year
Ended
November
30, 2012 |
| Net asset value, beginning of period | | | | | | | | | | | | | | | | | | | | |
| Class A | | | $19.87 | | | | $20.98 | | | | $20.23 | | | | $18.03 | | | | $17.10 | |
| Class C | | | 19.93 | | | | 21.04 | | | | 20.27 | | | | 18.07 | | | | 17.15 | |
| Class I | | | 19.78 | | | | 20.90 | | | | 20.15 | | | | 17.95 | | | | 17.04 | |
| | | | | | | | | | | | | | | | | | | | | |
| Income from Investment Operations | | | | | | | | | | | | | | | | | | | | |
| Net investment income (loss) | | | | | | | | | | | | | | | | | | | | |
| Class A | | | 0.23 | | | | 0.43 | | | | 0.26 | | | | 0.23 | | | | 0.23 | |
| Class C | | | 0.08 | | | | 0.28 | | | | 0.11 | | | | 0.08 | | | | 0.08 | |
| Class I | | | 0.27 | | | | 0.47 | | | | 0.31 | | | | 0.28 | | | | 0.23 | |
| Net gains or losses on securities (realized and unrealized) | | | | | | | | | | | | | | | | | | | | |
| Class A | | | 0.66 | | | | (0.35 | ) | | | 1.50 | | | | 2.91 | | | | 1.77 | |
| Class C | | | 0.66 | | | | (0.35 | ) | | | 1.51 | | | | 2.91 | | | | 1.78 | |
| Class I | | | 0.65 | | | | (0.34 | ) | | | 1.50 | | | | 2.89 | | | | 1.76 | |
| Total from investment operations | | | | | | | | | | | | | | | | | | | | |
| Class A | | | 0.89 | | | | 0.08 | | | | 1.76 | | | | 3.14 | | | | 2.00 | |
| Class C | | | 0.74 | | | | (0.07 | ) | | | 1.62 | | | | 2.99 | | | | 1.86 | |
| Class I | | | 0.92 | | | | 0.13 | | | | 1.81 | | | | 3.17 | | | | 1.99 | |
| | | | | | | | | | | | | | | | | | | | | |
| Less Distributions | | | | | | | | | | | | | | | | | | | | |
| Dividends (from net investment income) | | | | | | | | | | | | | | | | | | | | |
| Class A | | | 0.44 | | | | 0.30 | | | | 0.26 | | | | 0.26 | | | | 0.30 | |
| Class C | | | 0.30 | | | | 0.15 | | | | 0.10 | | | | 0.11 | | | | 0.17 | |
| Class I | | | 0.49 | | | | 0.36 | | | | 0.31 | | | | 0.29 | | | | 0.31 | |
| Distributions (from realized gains) | | | | | | | | | | | | | | | | | | | | |
| Class A | | | 0.64 | | | | 0.89 | | | | 0.75 | | | | 0.68 | | | | 0.77 | |
| Class C | | | 0.64 | | | | 0.89 | | | | 0.75 | | | | 0.68 | | | | 0.77 | |
| Class I | | | 0.64 | | | | 0.89 | | | | 0.75 | | | | 0.68 | | | | 0.77 | |
| Total distributions | | | | | | | | | | | | | | | | | | | | |
| Class A | | | 1.08 | | | | 1.19 | | | | 1.01 | | | | 0.94 | | | | 1.07 | |
| Class C | | | 0.94 | | | | 1.04 | | | | 0.85 | | | | 0.79 | | | | 0.94 | |
| Class I | | | 1.13 | | | | 1.25 | | | | 1.06 | | | | 0.97 | | | | 1.08 | |
| Net asset value, end of period | | | | | | | | | | | | | | | | | | | | |
| Class A | | | 19.68 | | | | 19.87 | | | | 20.98 | | | | 20.23 | | | | 18.03 | |
| Class C | | | 19.73 | | | | 19.93 | | | | 21.04 | | | | 20.27 | | | | 18.07 | |
| Class I | | | 19.57 | | | | 19.78 | | | | 20.90 | | | | 20.15 | | | | 17.95 | |
| Sentinel Balanced Fund |
| Selected Data for a Share Outstanding Throughout Each Period | | Year
Ended
November
30, 2016 | | Year
Ended
November
30, 2015 | | Year
Ended
November
30, 2014 | | Year
Ended
November
30, 2013 | | Year
Ended
November
30, 2012 |
| Ratios/Supplemental Data | | | | | | | | | | | | | | | | | | | | |
| Total return (%)* | | | | | | | | | | | | | | | | | | | | |
| Class A | | | 4.75 | % | | | 0.56 | % | | | 9.10 | % | | | 18.15 | % | | | 12.30 | % |
| Class C | | | 3.91 | | | | (0.23 | ) | | | 8.34 | | | | 17.19 | | | | 11.30 | |
| Class I | | | 4.94 | | | | 0.79 | | | | 9.43 | | | | 18.46 | | | | 12.25 | |
| Net assets at end of period (000 omitted) | | | | | | | | | | | | | | | | | | | | |
| Class A | | | $264,910 | | | | $263,276 | | | | $278,385 | | | | $267,627 | | | | $221,036 | |
| Class C | | | 43,066 | | | | 35,344 | | | | 32,002 | | | | 30,647 | | | | 16,635 | |
| Class I | | | 14,477 | | | | 12,589 | | | | 17,062 | | | | 20,468 | | | | 5,748 | |
| Ratio of expenses to average net assets (%) | | | | | | | | | | | | | | | | | | | | |
| Class A | | | 1.01 | % | | | 1.04 | % | | | 1.07 | % | | | 1.06 | % | | | 1.11 | % |
| Class C | | | 1.78 | | | | 1.82 | | | | 1.82 | | | | 1.86 | | | | 1.94 | |
| Class I | | | 0.81 | | | | 0.81 | | | | 0.80 | | | | 0.77 | | | | 1.11 | |
| Ratio of expenses to average net assets before contractual and voluntary expense reimbursements (%)** | | | | | | | | | | | | | | | | | | | | |
| Class A | | | 1.01 | | | | 1.04 | | | | 1.07 | | | | 1.06 | | | | 1.11 | |
| Class C | | | 1.78 | | | | 1.82 | | | | 1.82 | | | | 1.86 | | | | 1.94 | |
| Class I | | | 0.81 | | | | 0.81 | | | | 0.80 | | | | 0.77 | | | | 1.11 | |
| Ratio of net investment income (loss) to average net assets (%) | | | | | | | | | | | | | | | | | | | | |
| Class A | | | 1.20 | | | | 2.17 | ^ | | | 1.29 | | | | 1.22 | | | | 1.30 | |
| Class C | | | 0.43 | | | | 1.39 | ^ | | | 0.53 | | | | 0.42 | | | | 0.48 | |
| Class I | | | 1.41 | | | | 2.39 | ^ | | | 1.55 | | | | 1.50 | | | | 1.31 | |
| Ratio of net investment income (loss) to average net assets before contractual and voluntary expense reimbursements (%)** | | | | | | | | | | | | | | | | | | | | |
| Class A | | | 1.20 | % | | | 2.17 | %^ | | | 1.29 | % | | | 1.22 | % | | | 1.30 | % |
| Class C | | | 0.43 | | | | 1.39 | ^ | | | 0.53 | | | | 0.42 | | | | 0.48 | |
| Class I | | | 1.41 | | | | 2.39 | ^ | | | 1.55 | | | | 1.50 | | | | 1.31 | |
| Portfolio turnover rate (%) | | | | | | | | | | | | | | | | | | | | |
| Class A | | | 45 | | | | 86 | | | | 94 | | | | 154 | | | | 146 | |
| Class C | | | 45 | | | | 86 | | | | 94 | | | | 154 | | | | 146 | |
| Class I | | | 45 | | | | 86 | | | | 94 | | | | 154 | | | | 146 | |
* See Notes at page [•].
| Sentinel Common Stock Fund |
| Selected Data for a Share Outstanding Throughout Each Period | | Year
Ended
November
30, 2016 | | Year
Ended
November
30, 2015(A) | | Year
Ended
November
30, 2014 | | Year
Ended
November
30, 2013 | | Year
Ended
November
30, 2012 |
| Net asset value, beginning of period | | | | | | | | | | | | | | | | | | | | |
| Class A | | | $43.08 | | | | $42.79 | | | | $43.31 | | | | $34.84 | | | | $31.33 | |
| Class C | | | 41.36 | | | | 41.15 | | | | 41.82 | | | | 33.70 | | | | 30.35 | |
| Class I | | | 43.06 | | | | 42.76 | | | | 43.31 | | | | 34.85 | | | | 31.33 | |
| Class R6(A) | | | 43.11 | | | | 43.01 | | | | | | | | | | | | | |
| | | | | | | | | | | | | | | | | | | | | |
| Income from Investment Operations | | | | | | | | | | | | | | | | | | | | |
| Net investment income (loss) | | | | | | | | | | | | | | | | | | | | |
| Class A | | | 0.53 | | | | 1.01 | | | | 0.56 | | | | 0.44 | | | | 0.38 | |
| Class C | | | 0.21 | | | | 0.64 | | | | 0.21 | | | | 0.12 | | | | 0.09 | |
| Class I | | | 0.64 | | | | 1.12 | | | | 0.68 | | | | 0.56 | | | | 0.49 | |
| Class R6(A) | | | 0.70 | | | | 1.07 | | | | | | | | | | | | | |
| Net gains or losses on securities (realized and unrealized) | | | | | | | | | | | | | | | | | | | | |
| Class A | | | 2.43 | | | | (0.25 | ) | | | 4.97 | | | | 9.50 | | | | 3.93 | |
| Class C | | | 2.33 | | | | (0.24 | ) | | | 4.78 | | | | 9.18 | | | | 3.81 | |
| Class I | | | 2.43 | | | | (0.25 | ) | | | 4.97 | | | | 9.50 | | | | 3.94 | |
| Class R6(A) | | | 2.41 | | | | (0.51 | ) | | | | | | | | | | | | |
| Total from investment operations | | | | | | | | | | | | | | | | | | | | |
| Class A | | | 2.96 | | | | 0.76 | | | | 5.53 | | | | 9.94 | | | | 4.31 | |
| Class C | | | 2.54 | | | | 0.40 | | | | 4.99 | | | | 9.30 | | | | 3.90 | |
| Class I | | | 3.07 | | | | 0.87 | | | | 5.65 | | | | 10.06 | | | | 4.43 | |
| Class R6(A) | | | 3.11 | | | | 0.56 | | | | | | | | | | | | | |
| | | | | | | | | | | | | | | | | | | | | |
| Less Distributions | | | | | | | | | | | | | | | | | | | | |
| Dividends (from net investment income) | | | | | | | | | | | | | | | | | | | | |
| Class A | | | 1.08 | | | | 0.45 | | | | 0.58 | | | | 0.43 | | | | 0.37 | |
| Class C | | | 0.78 | | | | 0.17 | | | | 0.19 | | | | 0.14 | | | | 0.12 | |
| Class I | | | 1.19 | | | | 0.55 | | | | 0.73 | | | | 0.56 | | | | 0.48 | |
| Class R6(A) | | | 1.22 | | | | 0.46 | | | | | | | | | | | | | |
| Distributions (from realized gains) | | | | | | | | | | | | | | | | | | | | |
| Class A | | | 2.68 | | | | 0.02 | | | | 5.47 | | | | 1.04 | | | | 0.43 | |
| Class C | | | 2.68 | | | | 0.02 | | | | 5.47 | | | | 1.04 | | | | 0.43 | |
| Class I | | | 2.68 | | | | 0.02 | | | | 5.47 | | | | 1.04 | | | | 0.43 | |
| Class R6(A) | | | 2.68 | | | | - | | | | | | | | | | | | | |
| Sentinel Common Stock Fund |
| Selected Data for a Share Outstanding Throughout Each Period | | Year
Ended
November
30, 2016 | | Year
Ended
November
30, 2015(A) | | Year
Ended
November
30, 2014 | | Year
Ended
November
30, 2013 | | Year
Ended
November
30, 2012 |
| Total distributions | | | | | | | | | | | | | | | | | | | | |
| Class A | | | 3.76 | | | | 0.47 | | | | 6.05 | | | | 1.47 | | | | 0.80 | |
| Class C | | | 3.46 | | | | 0.19 | | | | 5.66 | | | | 1.18 | | | | 0.55 | |
| Class I | | | 3.87 | | | | 0.57 | | | | 6.20 | | | | 1.60 | | | | 0.91 | |
| Class R6(A) | | | 3.90 | | | | 0.46 | | | | | | | | | | | | | |
| Net asset value, end of period | | | | | | | | | | | | | | | | | | | | |
| Class A | | | 42.28 | | | | 43.08 | | | | 42.79 | | | | 43.31 | | | | 34.84 | |
| Class C | | | 40.44 | | | | 41.36 | | | | 41.15 | | | | 41.82 | | | | 33.70 | |
| Class I | | | 42.26 | | | | 43.06 | | | | 42.76 | | | | 43.31 | | | | 34.85 | |
| Class R6(A) | | | 42.32 | | | | 43.11 | | | | | | | | | | | | | |
| | | | | | | | | | | | | | | | | | | | | |
| Ratios/Supplemental Data | | | | | | | | | | | | | | | | | | | | |
| Total return (%)* | | | | | | | | | | | | | | | | | | | | |
| Class A | | | 7.53 | % | | | 1.79 | % | | | 13.30 | % | | | 29.53 | % | | | 13.99 | % |
| Class C | | | 6.71 | | | | 0.98 | | | | 12.40 | | | | 28.47 | | | | 13.03 | |
| Class I | | | 7.84 | | | | 2.07 | | | | 13.61 | | | | 29.93 | | | | 14.38 | |
| Class R6(A) | | | 7.92 | | | | 1.31 | ++ | | | | | | | | | | | | |
| Net assets at end of period (000 omitted) | | | | | | | | | | | | | | | | | | | | |
| Class A | | | $1,350,861 | | | | $1,416,147 | | | | $1,577,546 | | | | $1,454,446 | | | | $1,193,721 | |
| Class C | | | 83,246 | | | | 89,890 | | | | 90,784 | | | | 78,259 | | | | 51,460 | |
| Class I | | | 552,611 | | | | 689,502 | | | | 932,941 | | | | 941,223 | | | | 684,658 | |
| Class R6(A) | | | 29,927 | | | | 18,225 | | | | | | | | | | | | | |
| Ratio of expenses to average net assets (%) | | | | | | | | | | | | | | | | | | | | |
| Class A | | | 1.00 | % | | | 0.99 | % | | | 1.00 | % | | | 1.03 | % | | | 1.09 | % |
| Class C | | | 1.79 | | | | 1.78 | | | | 1.79 | | | | 1.84 | | | | 1.93 | |
| Class I | | | 0.72 | | | | 0.71 | | | | 0.72 | | | | 0.72 | | | | 0.75 | |
| Class R6(A) | | | 0.65 | | | | 0.61 | + | | | | | | | | | | | | |
| Ratio of expenses to average net assets before contractual and voluntary expense reimbursements (%)** | | | | | | | | | | | | | | | | | | | | |
| Class A | | | 1.00 | | | | 0.99 | | | | 1.00 | | | | 1.03 | | | | 1.09 | |
| Class C | | | 1.79 | | | | 1.78 | | | | 1.79 | | | | 1.84 | | | | 1.93 | |
| Class I | | | 0.72 | | | | 0.71 | | | | 0.72 | | | | 0.72 | | | | 0.75 | |
| Class R6(A) | | | 0.72 | | | | 1.76 | + | | | | | | | | | | | | |
| Sentinel Common Stock Fund |
| Selected Data for a Share Outstanding Throughout Each Period | | Year
Ended
November
30, 2016 | | Year
Ended
November
30, 2015(A) | | Year
Ended
November
30, 2014 | | Year
Ended
November
30, 2013 | | Year
Ended
November
30, 2012 |
| Ratio of net investment income (loss) to average net assets (%) | | | | | | | | | | | | | | | | | | | | |
| Class A | | | 1.32 | | | | 2.36 | ^ | | | 1.28 | | | | 1.15 | | | | 1.12 | |
| Class C | | | 0.54 | | | | 1.57 | ^ | | | 0.50 | | | | 0.32 | | | | 0.28 | |
| Class I | | | 1.60 | | | | 2.63 | ^ | | | 1.55 | | | | 1.45 | | | | 1.47 | |
| Class R6(A) | | | 1.72 | | | | 2.65 | +^ | | | | | | | | | | | | |
| Ratio of net investment income (loss) to average net assets before contractual and voluntary expense reimbursements (%)** | | | | | | | | | | | | | | | | | | | | |
| Class A | | | 1.32 | | | | 2.36 | ^ | | | 1.28 | | | | 1.15 | | | | 1.12 | |
| Class C | | | 0.54 | | | | 1.57 | ^ | | | 0.50 | | | | 0.32 | | | | 0.28 | |
| Class I | | | 1.60 | | | | 2.63 | ^ | | | 1.55 | | | | 1.45 | | | | 1.47 | |
| Class R6(A) | | | 1.65 | | | | 1.50 | +^ | | | | | | | | | | | | |
| Portfolio turnover rate (%) | | | | | | | | | | | | | | | | | | | | |
| Class A | | | 8 | | | | 11 | | | | 19 | | | | 12 | | | | 8 | |
| Class C | | | 8 | | | | 11 | | | | 19 | | | | 12 | | | | 8 | |
| Class I | | | 8 | | | | 11 | | | | 19 | | | | 12 | | | | 8 | |
| Class R6(A) | | | 8 | | | | 11 | ++ | | | | | | | | | | | | |
* See Notes at page [•].
| Sentinel International Equity Fund |
| Selected Data for a Share Outstanding Throughout Each Period | | Year
Ended
November
30, 2016 | | Year
Ended
November
30, 2015 | | Year
Ended
November
30, 2014 | | Year
Ended
November
30, 2013 | | Year
Ended
November
30, 2012 |
| Net asset value, beginning of period | | | | | | | | | | | | | | | | | | | | |
| Class A | | | $16.92 | | | | $19.61 | | | | $20.18 | | | | $16.03 | | | | $15.03 | |
| Class C | | | 16.06 | | | | 18.71 | | | | 19.34 | | | | 15.49 | | | | 14.59 | |
| Class I | | | 16.79 | | | | 19.53 | | | | 20.13 | | | | 15.99 | | | | 14.99 | |
| | | | | | | | | | | | | | | | | | | | | |
| Income from Investment Operations | | | | | | | | | | | | | | | | | | | | |
| Net investment income (loss) | | | | | | | | | | | | | | | | | | | | |
| Class A | | | 0.18 | | | | 0.13 | | | | 0.25 | | | | 0.16 | | | | 0.18 | |
| Class C | | | (0.01 | ) | | | (0.10 | ) | | | (0.04 | ) | | | (0.11 | ) | | | (0.06 | ) |
| Class I | | | 0.23 | | | | 0.18 | | | | 0.38 | | | | 0.26 | | | | 0.26 | |
| Net gains or losses on securities (realized and unrealized) | | | | | | | | | | | | | | | | | | | | |
| Class A | | | (0.97 | ) | | | 0.47 | | | | (0.61 | ) | | | 4.13 | | | | 0.98 | |
| Class C | | | (0.91 | ) | | | 0.37 | | | | (0.63 | ) | | | 3.86 | | | | 0.90 | |
| Class I | | | (0.95 | ) | | | 0.47 | | | | (0.65 | ) | | | 4.11 | | | | 0.98 | |
| Total from investment operations | | | | | | | | | | | | | | | | | | | | |
| Class A | | | (0.79 | ) | | | 0.60 | | | | (0.36 | ) | | | 4.29 | | | | 1.16 | |
| Class C | | | (0.90 | ) | | | 0.47 | | | | (0.59 | ) | | | 3.97 | | | | 0.96 | |
| Class I | | | (0.72 | ) | | | 0.65 | | | | (0.27 | ) | | | 4.37 | | | | 1.24 | |
| | | | | | | | | | | | | | | | | | | | | |
| Less Distributions | | | | | | | | | | | | | | | | | | | | |
| Dividends (from net investment income) | | | | | | | | | | | | | | | | | | | | |
| Class A | | | 0.12 | | | | 0.34 | | | | 0.21 | | | | 0.14 | | | | 0.16 | |
| Class C | | | - | | | | 0.07 | | | | - | | | | 0.01 | | | | - | |
| Class I | | | 0.18 | | | | 0.44 | | | | 0.33 | | | | 0.23 | | | | 0.24 | |
| Distributions (from realized gains) | | | | | | | | | | | | | | | | | | | | |
| Class A | | | 0.49 | | | | 2.95 | | | | - | | | | - | | | | - | |
| Class C | | | 0.49 | | | | 2.95 | | | | - | | | | - | | | | - | |
| Class I | | | 0.49 | | | | 2.95 | | | | - | | | | - | | | | - | |
| Total distributions | | | | | | | | | | | | | | | | | | | | |
| Class A | | | 0.61 | | | | 3.29 | | | | 0.21 | | | | 0.14 | | | | 0.16 | |
| Class C | | | 0.49 | | | | 3.02 | | | | - | | | | 0.01 | | | | - | |
| Class I | | | 0.67 | | | | 3.39 | | | | 0.33 | | | | 0.23 | | | | 0.24 | |
| Net asset value, end of period | | | | | | | | | | | | | | | | | | | | |
| Class A | | | 15.52 | | | | 16.92 | | | | 19.61 | | | | 20.18 | | | | 16.03 | |
| Class C | | | 14.66 | | | | 16.06 | | | | 18.71 | | | | 19.34 | | | | 15.49 | |
| Class I | | | 15.40 | | | | 16.79 | | | | 19.53 | | | | 20.13 | | | | 15.99 | |
| Sentinel International Equity Fund |
| Selected Data for a Share Outstanding Throughout Each Period | | Year
Ended
November
30, 2016 | | Year
Ended
November
30, 2015 | | Year
Ended
November
30, 2014 | | Year
Ended
November
30, 2013 | | Year
Ended
November
30, 2012 |
| Ratios/Supplemental Data | | | | | | | | | | | | | | | | | | | | |
| Total return (%)* | | | | | | | | | | | | | | | | | | | | |
| Class A | | | (4.81 | )% | | | 4.49 | % | | | (1.81 | )% | | | 26.93 | % | | | 7.84 | % |
| Class C | | | (5.82 | ) | | | 3.14 | | | | (3.26 | ) | | | 24.92 | | | | 6.17 | |
| Class I | | | (4.41 | ) | | | 4.89 | | | | (1.39 | ) | | | 27.64 | | | | 8.45 | |
| Net assets at end of period (000 omitted) | | | | | | | | | | | | | | | | | | | | |
| Class A | | | $114,616 | | | | $113,212 | | | | $115,216 | | | | $122,646 | | | | $106,173 | |
| Class C | | | 5,876 | | | | 4,732 | | | | 3,581 | | | | 3,634 | | | | 2,953 | |
| Class I | | | 40,528 | | | | 14,967 | | | | 10,997 | | | | 34,561 | | | | 27,887 | |
| Ratio of expenses to average net assets (%) | | | | | | | | | | | | | | | | | | | | |
| Class A | | | 1.36 | % | | | 1.41 | % | | | 1.41 | % | | | 1.44 | % | | | 1.49 | % |
| Class C | | | 2.49 | | | | 2.70 | | | | 2.86 | | | | 3.04 | | | | 3.05 | |
| Class I | | | 0.99 | | | | 1.02 | | | | 0.92 | | | | 0.89 | | | | 0.94 | |
| Ratio of expenses to average net assets before contractual and voluntary expense reimbursements (%)** | | | | | | | | | | | | | | | | | | | | |
| Class A | | | 1.36 | | | | 1.41 | | | | 1.41 | | | | 1.44 | | | | 1.49 | |
| Class C | | | 2.49 | | | | 2.70 | | | | 2.86 | | | | 3.04 | | | | 3.05 | |
| Class I | | | 0.99 | | | | 1.02 | | | | 0.92 | | | | 0.89 | | | | 0.94 | |
| Ratio of net investment income (loss) to average net assets (%) | | | | | | | | | | | | | | | | | | | | |
| Class A | | | 1.11 | | | | 0.76 | | | | 1.22 | | | | 0.91 | | | | 1.17 | |
| Class C | | | (0.04 | ) | | | (0.60 | ) | | | (0.23 | ) | | | (0.66 | ) | | | (0.40 | ) |
| Class I | | | 1.45 | | | | 1.05 | | | | 1.91 | | | | 1.48 | | | | 1.72 | |
| Ratio of net investment income (loss) to average net assets before contractual and voluntary expense reimbursements (%)** | | | | | | | | | | | | | | | | | | | | |
| Class A | | | 1.11 | | | | 0.76 | | | | 1.22 | | | | 0.91 | | | | 1.17 | |
| Class C | | | (0.04 | ) | | | (0.60 | ) | | | (0.23 | ) | | | (0.66 | ) | | | (0.40 | ) |
| Class I | | | 1.45 | | | | 1.05 | | | | 1.91 | | | | 1.48 | | | | 1.72 | |
| Portfolio turnover rate (%) | | | | | | | | | | | | | | | | | | | | |
| Class A | | | 36 | | | | 55 | | | | 50 | | | | 52 | | | | 37 | |
| Class C | | | 36 | | | | 55 | | | | 50 | | | | 52 | | | | 37 | |
| Class I | | | 36 | | | | 55 | | | | 50 | | | | 52 | | | | 37 | |
* See Notes at page [•].
| Sentinel Small Company Fund |
| Selected Data for a Share Outstanding Throughout Each Period | | Year
Ended
November
30, 2016 | | Year
Ended
November
30, 2015(A) | | Year
Ended
November
30, 2014 | | Year
Ended
November
30, 2013 | | Year
Ended
November
30, 2012 |
| Net asset value, beginning of period | | | | | | | | | | | | | | | | | | | | |
| Class A | | | $5.58 | | | | $7.19 | | | | $8.52 | | | | $7.96 | | | | $7.95 | |
| Class C | | | 4.01 | | | | 5.72 | | | | 7.17 | | | | 6.99 | | | | 7.12 | |
| Class I | | | 5.89 | | | | 7.48 | | | | 8.78 | | | | 8.16 | | | | 8.11 | |
| Class R6(A) | | | 5.60 | | | | 5.44 | | | | | | | | | | | | | |
| | | | | | | | | | | | | | | | | | | | | |
| Income from Investment Operations | | | | | | | | | | | | | | | | | | | | |
| Net investment income (loss) | | | | | | | | | | | | | | | | | | | | |
| Class A | | | (0.02 | ) | | | (0.03 | ) | | | - | | | | (0.02 | ) | | | - | |
| Class C | | | (0.03 | ) | | | (0.05 | ) | | | (0.04 | ) | | | (0.06 | ) | | | (0.05 | ) |
| Class I | | | 0.00 | | | | (0.01 | ) | | | 0.03 | | | | 0.01 | | | | 0.02 | |
| Class R6(A) | | | 0.01 | | | | (0.01 | ) | | | | | | | | | | | | |
| Net gains or losses on securities (realized and unrealized) | | | | | | | | | | | | | | | | | | | | |
| Class A | | | 0.57 | | | | 0.26 | | | | 0.38 | | | | 2.25 | | | | 0.70 | |
| Class C | | | 0.35 | | | | 0.18 | | | | 0.30 | | | | 1.91 | | | | 0.61 | |
| Class I | | | 0.61 | | | | 0.28 | | | | 0.38 | | | | 2.32 | | | | 0.72 | |
| Class R6(A) | | | 0.57 | | | | 0.17 | | | | | | | | | | | | | |
| Total from investment operations | | | | | | | | | | | | | | | | | | | | |
| Class A | | | 0.55 | | | | 0.23 | | | | 0.38 | | | | 2.23 | | | | 0.70 | |
| Class C | | | 0.32 | | | | 0.13 | | | | 0.26 | | | | 1.85 | | | | 0.56 | |
| Class I | | | 0.61 | | | | 0.27 | | | | 0.41 | | | | 2.33 | | | | 0.74 | |
| Class R6(A) | | | 0.58 | | | | 0.16 | | | | | | | | | | | | | |
| | | | | | | | | | | | | | | | | | | | | |
| Less Distributions | | | | | | | | | | | | | | | | | | | | |
| Dividends (from net investment income) | | | | | | | | | | | | | | | | | | | | |
| Class A | | | - | | | | - | | | | - | | | | - | | | | - | |
| Class C | | | - | | | | - | | | | - | | | | - | | | | - | |
| Class I | | | - | | | | 0.02 | | | | - | | | | 0.04 | | | | - | |
| Class R6(A) | | | - | | | | - | | | | | | | | | | | | | |
| Distributions (from realized gains) | | | | | | | | | | | | | | | | | | | | |
| Class A | | | 0.94 | | | | 1.84 | | | | 1.71 | | | | 1.67 | | | | 0.69 | |
| Class C | | | 0.94 | | | | 1.84 | | | | 1.71 | | | | 1.67 | | | | 0.69 | |
| Class I | | | 0.94 | | | | 1.84 | | | | 1.71 | | | | 1.67 | | | | 0.69 | |
| Class R6(A) | | | 0.94 | | | | 0.00 | | | | | | | | | | | | | |
| Sentinel Small Company Fund |
| Selected Data for a Share Outstanding Throughout Each Period | | Year
Ended
November
30, 2016 | | Year
Ended
November
30, 2015(A) | | Year
Ended
November
30, 2014 | | Year
Ended
November
30, 2013 | | Year
Ended
November
30, 2012 |
| Total distributions | | | | | | | | | | | | | | | | | | | | |
| Class A | | | 0.94 | | | | 1.84 | | | | 1.71 | | | | 1.67 | | | | 0.69 | |
| Class C | | | 0.94 | | | | 1.84 | | | | 1.71 | | | | 1.67 | | | | 0.69 | |
| Class I | | | 0.94 | | | | 1.86 | | | | 1.71 | | | | 1.71 | | | | 0.69 | |
| Class R6(A) | | | 0.94 | | | | - | | | | | | | | | | | | | |
| Net asset value, end of period | | | | | | | | | | | | | | | | | | | | |
| Class A | | | 5.19 | | | | 5.58 | | | | 7.19 | | | | 8.52 | | | | 7.96 | |
| Class C | | | 3.39 | | | | 4.01 | | | | 5.72 | | | | 7.17 | | | | 6.99 | |
| Class I | | | 5.56 | | | | 5.89 | | | | 7.48 | | | | 8.78 | | | | 8.16 | |
| Class R6(A) | | | 5.24 | | | | 5.60 | | | | | | | | | | | | | |
| | | | | | | | | | | | | | | | | | | | | |
| Ratios/Supplemental Data | | | | | | | | | | | | | | | | | | | | |
| Total return (%)* | | | | | | | | | | | | | | | | | | | | |
| Class A | | | 12.52 | % | | | 5.32 | % | | | 5.40 | % | | | 34.79 | % | | | 9.63 | % |
| Class C | | | 11.48 | | | | 4.72 | | | | 4.55 | | | | 33.94 | | | | 8.70 | |
| Class I | | | 12.95 | | | | 5.71 | | | | 5.62 | | | | 35.40 | | | | 9.96 | |
| Class R6(A) | | | 13.07 | | | | 2.94 | ++ | | | | | | | | | | | | |
| Net assets at end of period (000 omitted) | | | | | | | | | | | | | | | | | | | | |
| Class A | | | $685,807 | | | | $596,864 | | | | $682,481 | | | | $808,145 | | | | $815,661 | |
| Class C | | | 110,842 | | | | 108,192 | | | | 115,642 | | | | 128,521 | | | | 119,594 | |
| Class I | | | 257,483 | | | | 220,543 | | | | 247,639 | | | | 385,692 | | | | 523,540 | |
| Class R6(A) | | | 13,000 | | | | 599 | | | | | | | | | | | | | |
| Ratio of expenses to average net assets (%) | | | | | | | | | | | | | | | | | | | | |
| Class A | | | 1.22 | % | | | 1.25 | % | | | 1.20 | % | | | 1.21 | % | | | 1.14 | % |
| Class C | | | 1.95 | | | | 1.94 | | | | 1.91 | | | | 1.93 | | �� | | 1.89 | |
| Class I | | | 0.89 | | | | 0.87 | | | | 0.85 | | | | 0.81 | | | | 0.79 | |
| Class R6(A) | | | 0.73 | | | | 0.73 | + | | | | | | | | | | | | |
| Ratio of expenses to average net assets before contractual and voluntary expense reimbursements (%)** | | | | | | | | | | | | | | | | | | | | |
| Class A | | | 1.22 | | | | 1.25 | | | | 1.20 | | | | 1.21 | | | | 1.14 | |
| Class C | | | 1.95 | | | | 1.94 | | | | 1.91 | | | | 1.93 | | | | 1.89 | |
| Class I | | | 0.89 | | | | 0.87 | | | | 0.85 | | | | 0.81 | | | | 0.79 | |
| Class R6(A) | | | 0.99 | | | | 2.96 | + | | | | | | | | | | | | |
| Sentinel Small Company Fund |
| Selected Data for a Share Outstanding Throughout Each Period | | Year
Ended
November
30, 2016 | | Year
Ended
November
30, 2015(A) | | Year
Ended
November
30, 2014 | | Year
Ended
November
30, 2013 | | Year
Ended
November
30, 2012 |
| Ratio of net investment income (loss) to average net assets (%) | | | | | | | | | | | | | | | | | | | | |
| Class A | | | (0.38 | )% | | | (0.61 | )% | | | 0.06 | % | | | (0.24 | )% | | | (0.05 | )% |
| Class C | | | (1.10 | ) | | | (1.30 | ) | | | (0.66 | ) | | | (0.97 | ) | | | (0.79 | ) |
| Class I | | | (0.04 | ) | | | (0.24 | ) | | | 0.46 | | | | 0.17 | | | | 0.31 | |
| Class R6(A) | | | 0.16 | | | | (0.18 | )+ | | | | | | | | | | | | |
| Ratio of net investment income (loss) to average net assets before contractual and voluntary expense reimbursements (%)** | | | | | | | | | | | | | | | | | | | | |
| Class A | | | (0.38 | ) | | | (0.61 | ) | | | 0.06 | | | | (0.24 | ) | | | (0.05 | ) |
| Class C | | | (1.10 | ) | | | (1.30 | ) | | | (0.66 | ) | | | (0.97 | ) | | | (0.79 | ) |
| Class I | | | (0.04 | ) | | | (0.24 | ) | | | 0.46 | | | | 0.17 | | | | 0.31 | |
| Class R6(A) | | | (0.10 | ) | | | (2.41 | )+ | | | | | | | | | | | | |
| Portfolio turnover rate (%) | | | | | | | | | | | | | | | | | | | | |
| Class A | | | 61 | | | | 70 | | | | 59 | | | | 23 | | | | 33 | |
| Class C | | | 61 | | | | 70 | | | | 59 | | | | 23 | | | | 33 | |
| Class I | | | 61 | | | | 70 | | | | 59 | | | | 23 | | | | 33 | |
| Class R6(A) | | | 61 | | | | 70 | ++ | | | | | | | | | | | | |
Per share net investment (income) loss for each Fund is calculated utilizing the average shares method unless otherwise noted.
Amounts designated as “–” are either zero or represent less than $0.005 or $(0.005).
| * | Total return is calculated assuming an initial investment made at the net asset value at the beginning of the period, reinvestment of all distributions at net asset value during the period, and a redemption on the last day of the period. Neither an initial sales charge nor a CDSC is reflected in the calculation of total return. Total returns would have been lower in applicable years where Touchstone Advisors had not waived a portion of its fee. |
| | |
| ** | Expense reductions are comprised of the contractual and voluntary expense reimbursements as described in Note (3) of the latest Annual Report, if applicable. |
| | |
| + | Annualized. |
| | |
| ++ | Not Annualized. |
| | |
| (A) | Class R6 commenced operations December 23, 2014. |
| | |
| (B) | Class I commenced operations January 31, 2014. |
| | |
| # | Includes the impact of proceeds received and credited to the Funds resulting from class action settlements, which enhanced the performance for the Sentinel Sustainable Core Opportunities Fund Class A by 0.05% and Sentinel Sustainable Core Opportunities Fund Class I by 0.04% for the fiscal year ended November 30, 2015. |
| ^ | Includes the impact of special dividends resulting from an acquisition of Covidien plc by Medtronic, Inc. on January 26, 2015 through the formation of a new holding company, Medtronic plc, incorporated in Ireland. These special dividends enhanced the ratios of net investment income for the Sentinel Balanced Fund Class A by 0.86%, Sentinel Balanced Fund Class C by 0.86%, Sentinel Balanced Fund Class I by 0.86%, Sentinel Common Stock Fund Class A by 1.22%, Sentinel Common Stock Fund Class C by 1.22%, Sentinel Common Stock Fund Class I by 1.22%, Sentinel Common Stock Fund Class R6 by 1.30%, Sentinel Sustainable Core Opportunities Fund Class A by 1.07% and Sentinel Sustainable Core Opportunities Fund Class I by 1.07% for the fiscal year ended November 30, 2015. |
| @ | Includes the impact of the shares owned by NLV Financial Corporation and its affiliates, who do not get charged a distribution fee, which decreases the ratio by 0.20% for the Sentinel Total Return Bond Fund Class C for the fiscal year ended November 30, 2014; 0.30% for the ratio of expenses to average net assets on Sentinel Total Return Bond Fund Class R3, 0.50% for the ratio of expenses to average net assets before contractual and voluntary expense reimbursements on Sentinel Total Return Bond Fund Class R3 for the fiscal period from December 23, 2014 to November 30, 2015; 0.30% for the ratio of expenses to average net assets on Sentinel Total Return Bond Fund Class R3, 0.50% for the ratio of expenses to average net assets before contractual and voluntary expense reimbursements on Sentinel Total Return Bond Fund Class R3 for the fiscal year ended November 30, 2016. |
Touchstone Operating Fund Financial Highlights
The financial highlights tables with respect to each Touchstone Fund are intended to help you understand each Fund’s financial performance for the periods shown. The total returns in the tables represent the rate an investor would have earned (or lost) on an investment in a Fund, assuming reinvestment of all dividends and distributions. The financial highlights for Active Bond Fund and Ultra Short Duration Fixed Income Fund for each of the five years in the period ended September 30, 2016, for Sustainability and Impact Equity Fund for each of the periods presented and for Flexible Income Fund for each of the four years in the period ended March 31, 2017 were audited by Ernst & Young LLP, an independent registered public accounting firm. The report of Ernst & Young LLP, along with each such Fund’s financial statements and related notes, are included in the Funds’ annual report. The financial highlights for Flexible Income Fund for the periods presented through March 31, 2013 were audited by another independent registered public accounting firm. The report of each applicable independent registered accounting firm, along with each such Fund’s financial statements and related notes, were included in the Funds’ annual reports for those periods. Certain information reflects financial results for a single Fund share. The total returns in the tables represent the rate that an investor would have earned (or lost) on an investment in a Fund’s shares (assuming reinvestment of all dividends and other distributions).
| Touchstone Active Bond Fund |
| Selected Data for a Share Outstanding Throughout Each Period | | Six Months
Ended
March 31,
2017
(Unaudited) | | Year
Ended
September
30, 2016 | | Year
Ended
September
30, 2015 | | Year
Ended
September
30, 2014 | | Year
Ended
September
30, 2013 | | Year
Ended
September
30, 2012 |
| Net asset value, beginning of period | | | | | | | | | | | | | | |
| | Class A | | $10.59 | | $10.20 | | $10.45 | | $10.33 | | $10.89 | | | $10.46 | |
| | Class C | | 9.82 | | 9.48 | | 9.73 | | 9.64 | | 10.20 | | | 9.82 | |
| | Class Y | | 10.59 | | 10.20 | | 10.45 | | 10.32 | | 10.89 | | | 10.69 | (E) |
| | | | | | | | | | | | | | | | |
| Income from Investment Operations | | | | | | | | | | | | | | |
| | Net investment income | | | | | | | | | | | | | | |
| | Class A | | 0.13 | | 0.26 | | 0.26 | | 0.32 | | 0.30 | | | 0.30 | |
| | Class C | | 0.07 | | 0.16 | | 0.17 | | 0.21 | | 0.20 | | | 0.22 | |
| | Class Y | | 0.14 | | 0.29 | | 0.29 | | 0.34 | | 0.33 | | | 0.18 | (E) |
| | Net gains or losses on securities (realized and unrealized) | | | | | | | | | | | | | | |
| | Class A | | (0.23) | | 0.43 | | (0.23) | | 0.13 | | (0.38) | | | 0.46 | |
| | Class C | | (0.21) | | 0.41 | | (0.21) | | 0.14 | | (0.35) | | | 0.42 | |
| | Class Y | | (0.23) | | 0.43 | | (0.24) | | 0.15 | | (0.39) | | | 0.19 | (E) |
| | Total from investment operations | | | | | | | | | | | | | | |
| | Class A | | (0.10) | | 0.69 | | 0.03 | | 0.45 | | (0.08) | | | 0.76 | |
| | Class C | | (0.14) | | 0.57 | | (0.04) | | 0.35 | | (0.15) | | | 0.64 | |
| | Class Y | | (0.09) | | 0.72 | | 0.05 | | 0.49 | | (0.06) | | | 0.37 | (E) |
| Touchstone Active Bond Fund |
| Selected Data for a Share Outstanding Throughout Each Period | | Six Months
Ended
March 31,
2017
(Unaudited) | | Year
Ended
September
30, 2016 | | Year
Ended
September
30, 2015 | | Year
Ended
September
30, 2014 | | Year
Ended
September
30, 2013 | | Year
Ended
September
30, 2012 |
| Less Distributions | | | | | | | | | | | | | | | | | | | | | | | | |
| Dividends (from net investment income) | | | | | | | | | | | | | | | | | | | | | | | | |
| Class A | | | (0.14 | ) | | | (0.30 | ) | | | (0.28 | ) | | | (0.33 | ) | | | (0.36 | ) | | | (0.33 | ) |
| Class C | | | (0.10 | ) | | | (0.23 | ) | | | (0.21 | ) | | | (0.26 | ) | | | (0.29 | ) | | | (0.26 | ) |
| Class Y | | | (0.15 | ) | | | (0.33 | ) | | | (0.30 | ) | | | (0.36 | ) | | | (0.39 | ) | | | (0.17) | (E) |
| Distributions (from realized gains) | | | | | | | | | | | | | | | | | | | | | | | | |
| Class A | | | -- | | | | -- | | | | -- | | | | -- | | | | (0.12 | ) | | | -- | |
| Class C | | | -- | | | | -- | | | | -- | | | | -- | | | | (0.12 | ) | | | -- | |
| Class Y | | | -- | | | | -- | | | | -- | | | | -- | | | | (0.12 | ) | | | -- | |
| Total distributions | | | | | | | | | | | | | | | | | | | | | | | | |
| Class A | | | (0.14 | ) | | | (0.30 | ) | | | (0.28 | ) | | | (0.33 | ) | | | (0.48 | ) | | | (0.33 | ) |
| Class C | | | (0.10 | ) | | | (0.23 | ) | | | (0.21 | ) | | | (0.26 | ) | | | (0.41 | ) | | | (0.26 | ) |
| Class Y | | | (0.15 | ) | | | (0.33 | ) | | | (0.30 | ) | | | (0.36 | ) | | | (0.51 | ) | | | (0.17 | )(E) |
| Net asset value, end of period | | | | | | | | | | | | | | | | | | | | | | | | |
| Class A | | | 10.35 | | | | 10.59 | | | | 10.20 | | | | 10.45 | | | | 10.33 | | | | 10.89 | |
| Class C | | | 9.58 | | | | 9.82 | | | | 9.48 | | | | 9.73 | | | | 9.64 | | | | 10.20 | |
| Class Y | | | 10.35 | | | | 10.59 | | | | 10.20 | | | | 10.45 | | | | 10.32 | | | | 10.89 | (E) |
| | | | | | | | | | | | | | | | | | | | | | | | | |
| Ratios/Supplemental Data | | | | | | | | | | | | | | | | | | | | | | | | |
| Total return (%)* | | | | | | | | | | | | | | | | | | | | | | | | |
| Class A(A) | | | (0.95 | %)(B) | | | 6.90 | % | | | 0.24 | % | | | 4.41 | % | | | (0.85 | %) | | | 7.47 | % |
| Class C(A) | | | (1.29 | )(B) | | | 6.03 | | | | (0.47 | ) | | | 3.65 | | | | (1.55 | ) | | | 6.59 | |
| Class Y | | | (0.82 | )(B) | | | 7.18 | | | | 0.49 | | | | 4.78 | | | | (0.60 | ) | | | (3.46) | (B) (E) |
| Net assets at end of period (000 omitted) | | | | | | | | | | | | | | | | | | | | | | | | |
| Class A | | | $23,444 | | | | $25,324 | | | | $29,135 | | | | $28,920 | | | | $34,635 | | | | $79,208 | |
| Class C | | | 5,467 | | | | 6,513 | | | | 6,946 | | | | 8,725 | | | | 11,337 | | | | 19,386 | |
| Class Y | | | 67,761 | | | | 76,544 | | | | 57,394 | | | | 59,764 | | | | 58,944 | | | | 78,575 | (E) |
| Ratio of expenses to average net assets (%) | | | | | | | | | | | | | | | | | | | | | | | | |
| Class A | | | 0.90 | %(C) | | | 0.90 | % | | | 0.90 | % | | | 0.86 | % | | | 0.83 | % | | | 0.87 | %(C) |
| Class C | | | 1.65 | (C) | | | 1.65 | | | | 1.65 | | | | 1.61 | | | | 1.58 | | | | 1.62 | (C) |
| Class Y | | | 0.65 | (C) | | | 0.65 | | | | 0.65 | | | | 0.61 | | | | 0.58 | | | | 0.58 | (C) (E) |
| Touchstone Active Bond Fund |
| Selected Data for a Share Outstanding Throughout Each Period | | Six Months
Ended
March 31,
2017 (Unaudited) | | Year
Ended
September
30, 2016 | | Year
Ended
September
30, 2015 | | Year
Ended
September
30, 2014 | | Year
Ended
September
30, 2013 | | Year
Ended
September
30, 2012 |
| | Ratio of expenses to average net assets before contractual expense reimbursements (%)** | | | | | | | | | | | | |
| | Class A | | 1.19(C) | | 1.19 | | 1.19 | | 1.28 | | 1.18 | | 1.23 |
| | Class C | | 2.15(C) | | 2.09 | | 2.06 | | 2.15 | | 1.98 | | 2.10 |
| | Class Y | | 0.90(C) | | 0.90 | | 0.91 | | 0.95 | | 0.88 | | 0.97(E) |
| | Ratio of net investment income to average net assets (%) | | | | | | | | | | | | |
| | Class A | | 2.47(C) | | 2.52 | | 2.50 | | 2.99 | | 2.94 | | 2.72 |
| | Class C | | 1.72(C) | | 1.77 | | 1.75 | | 2.24 | | 2.19 | | 1.98 |
| | Class Y | | 2.72(C) | | 2.77 | | 2.75 | | 3.24 | | 3.19 | | 2.97(E) |
| | Portfolio turnover rate (%) | | | | | | | | | | | | |
| | Class A | | 269(B) | | 590 | | 349 | | 281 | | 353 | | 525(D) |
| | Class C | | 269(B) | | 590 | | 349 | | 281 | | 353 | | 525(D) |
| | Class Y | | 269(B) | | 590 | | 349 | | 281 | | 353 | | 525(D) |
* See Notes at page [•].
| Touchstone Ultra Short Duration Fixed Income Fund |
| Selected Data for a Share Outstanding Throughout Each Period | | Six Months
Ended
March 31,
2017
(Unaudited) | | Year
Ended
September
30, 2016 | | Year
Ended
September
30, 2015 | | Year
Ended
September
30, 2014 | | Year
Ended
September
30, 2013 | | Year
Ended
September
30, 2012 |
| Net asset value, beginning of period | | | | | | | | | | | | |
| Class A | | $9.32 | | $9.32 | | $9.41 | | $9.45 | | $9.56 | | $9.57(E) |
| Class Y | | 9.32 | | 9.32 | | 9.41 | | 9.45 | | 9.56 | | 9.57(E) |
| | | | | | | | | | | | | |
| Income from Investment Operations | | | | | | | | | | | | |
| Net investment income (loss) | | | | | | | | | | | | |
| Class A | | 0.05 | | 0.10 | | 0.06 | | 0.06 | | 0.09 | | 0.09(E) |
| Class Y | | 0.06 | | 0.13 | | 0.07 | | 0.10 | | 0.12 | | 0.08(E) |
| Net gains or losses on securities (realized and unrealized) | | | | | | | | | | | | |
| Class A | | (0.04) | | 0.02 | | (0.03) | | 0.03 | | (0.04) | | (0.01)(E) |
| Class Y | | --(G) | | 0.02 | | (0.02) | | 0.01 | | (0.05) | | 0.01(E) |
| Total from investment operations | | | | | | | | | | | | |
| Class A | | 0.01 | | 0.12 | | 0.03 | | 0.09 | | 0.05 | | 0.08(E) |
| Class Y | | 0.06 | | 0.15 | | 0.05 | | 0.11 | | 0.07 | | 0.09(E) |
| | | | | | | | | | | | | |
| Less Distributions | | | | | | | | | | | | |
| Dividends (from net investment income) | | | | | | | | | | | | |
| Class A | | (0.06) | | (0.12) | | (0.12) | | (0.13) | | (0.16) | | (0.09)(E) |
| Class Y | | (0.07) | | (0.15) | | (0.14) | | (0.15) | | (0.18) | | (0.10) (E) |
| Net asset value, end of period | | | | | | | | | | | | |
| Class A | | 9.27 | | 9.32 | | 9.32 | | 9.41 | | 9.45 | | 9.56(E) |
| Class Y | | 9.31 | | 9.32 | | 9.32 | | 9.41 | | 9.45 | | 9.56(E) |
| Touchstone Ultra Short Duration Fixed Income Fund |
| Selected Data for a Share Outstanding Throughout Each Period | | Six Months
Ended
March 31,
2017
(Unaudited) | | Year
Ended
September
30, 2016 | | Year
Ended
September
30, 2015 | | Year
Ended
September
30, 2014 | | Year
Ended
September
30, 2013 | | Year
Ended
September
30, 2012 |
| Ratios/Supplemental Data | | | | | | | | | | | | |
| Total return (%)* | | | | | | | | | | | | |
| Class A(A) | | 0.55%(B) | | 1.35% | | 0.31% | | 0.92% | | 0.48% | | 0.85%(B) (E) |
| Class Y | | 0.68(B) | | 1.60 | | 0.56 | | 1.17 | | 0.74 | | 0.97(B) (E) |
| Net assets at end of period (000 omitted) | | | | | | | | | | | | |
| Class A | | $12,765 | | $16,946 | | $10,675 | | $10,596 | | $32,088 | | $34,228(E) |
| Class Y | | 221,705 | | 206,313 | | 200,456 | | 244,885 | | 249,250 | | 190,515(E) |
| Ratio of expenses to average net assets (%) | | | | | | | | | | | | |
| Class A | | 0.69(C) | | 0.69 | | 0.69 | | 0.69 | | 0.69 | | 0.69(C) (E) |
| Class Y | | 0.44(C) | | 0.44 | | 0.44 | | 0.44 | | 0.44 | | 0.44(C) (E) |
| Ratio of expenses to average net assets before contractual expense reimbursements (%)** | | | | | | | | | | | | |
| Class A | | 0.87(C) | | 0.97 | | 0.99 | | 0.93 | | 0.83 | | 1.19(C) (E) |
| Class Y | | 0.53(C) | | 0.53 | | 0.52 | | 0.49 | | 0.51 | | 0.55(C) (E) |
| Ratio of net investment income (loss) to average net assets (%) | | | | | | | | | | | | |
| Class A | | 1.17(C) | | 1.09 | | 0.54 | | 0.79 | | 0.85 | | 1.40(C) (E) |
| Class Y | | 1.43(C) | | 1.34 | | 0.79 | | 1.04 | | 1.10 | | 1.65(C) (E) |
| Portfolio turnover rate (%) | | | | | | | | | | | | |
| Class A | | 68(B) | | 169 | | 132 | | 142 | | 107(F) | | 169(G) |
| Class Y | | 68(B) | | 169 | | 132 | | 142 | | 107(F) | | 169(G) |
* See Notes at page [•].
| Touchstone Flexible Income Fund |
Selected Date for a Share Outstanding
Throughout Each Period | | Year
Ended
March 31,
2017 | | Year
Ended
March
31, 2016 | | Year
Ended
March
31, 2015 | | Year
Ended
March
31, 2014 | | Year
Ended
March
31, 2013 | | Year
Ended
July 31,
2012 |
| Net asset value, beginning of period | | | | | | | | | | | | |
| Class A | | $10.58 | | $10.67 | | $10.60 | | $10.94 | | $10.76(H) | | $10.47 |
| Class C | | 10.44 | | 10.54 | | 10.47 | | 10.82 | | 10.65(H) | | 10.36 |
| Class Y | | 10.61 | | 10.70 | | 10.62 | | 10.97 | | 10.79(H)(L) | | 10.49 |
| | | | | | | | | | | | | |
| Income from Investment Operations | | | | | | | | | | | | |
| Net investment income | | | | | | | | | | | | |
| Class A | | 0.30 | | 0.32 | | 0.43 | | 0.51 | | 0.35(H)(I) | | 0.49(M) |
| Class C | | 0.20 | | 0.26 | | 0.34 | | 0.43 | | 0.29(H)(I) | | 0.40(M) |
| Class Y | | 0.32 | | 0.36 | | 0.46 | | 0.54 | | 0.37(H)(I)(L) | | 0.50(M) |
| Net gains or losses on securities (realized and unrealized) | | | | | | | | | | | | |
| Class A | | 0.11 | | (0.10) | | 0.11 | | (0.37) | | 0.16(H) | | 0.31 |
| Class C | | 0.13 | | (0.12) | | 0.12 | | (0.37) | | 0.15(H) | | 0.32 |
| Class Y | | 0.13 | | (0.11) | | 0.12 | | (0.38) | | 0.16(H)(L) | | 0.33 |
| Total from investment operations | | | | | | | | | | | | |
| Class A | | 0.41 | | 0.22 | | 0.54 | | 0.14 | | 0.51(H) | | 0.80 |
| Class C | | 0.33 | | 0.14 | | 0.46 | | 0.06 | | 0.44(H) | | 0.72 |
| Class Y | | 0.45 | | 0.25 | | 0.58 | | 0.16 | | 0.53(H)(L) | | 0.83 |
| | | | | | | | | | | | | |
| Less Distributions | | | | | | | | | | | | |
| Dividends (from net investment income) | | | | | | | | | | | | |
| Class A | | (0.28) | | (0.31) | | (0.47) | | (0.48) | | (0.33)(H) | | (0.51) |
| Class C | | (0.20) | | (0.24) | | (0.39) | | (0.41) | | (0.27)(H) | | (0.43) |
| Class Y | | (0.31) | | (0.34) | | (0.50) | | (0.51) | | (0.35)(H)(L) | | (0.53) |
| Net asset value, end of period | | | | | | | | | | | | |
| Class A | | $10.71 | | $10.58 | | $10.67 | | $10.60 | | $10.94(H) | | $10.76 |
| Class C | | 10.57 | | 10.44 | | 10.54 | | 10.47 | | 10.82(H) | | 10.65 |
| Class Y | | 10.75 | | 10.61 | | 10.70 | | 10.62 | | 10.97(H)(L) | | 10.79 |
| | | | | | | | | | | | | |
| Ratios/Supplemental Data | | | | | | | | | | | | |
| Total return (%)* | | | | | | | | | | | | |
| Class A(A) | | 3.93% | | 2.13% | | 5.22% | | 1.45% | | 4.77%(B)(H) | | 7.86% |
| Class C(A) | | 3.22 | | 1.32 | | 4.52 | | 0.61 | | 4.20(B)(H) | | 7.16 |
| Class Y | | 4.28 | | 2.38 | | 5.58 | | 1.63 | | 4.96(B)(H)(L) | | 8.21 |
| Touchstone Flexible Income Fund |
| Selected Data for a Share Outstanding Throughout Each Period | | Year
Ended
March 31,
2017 | | Year
Ended
March
31, 2016 | | Year
Ended
March
31, 2015 | | Year
Ended
March
31, 2014 | | Year
Ended
March
31, 2013 | | Year
Ended
July 31,
2012 |
| Net assets at end of period (000 omitted) | | | | | | | | | | | | | | | | | | | | | | | | |
| Class A | | | $49,544 | | | | $57,671 | | | | $32,695 | | | | $25,928 | | | | $41,301 | (H) | | | $49,458 | |
| Class C | | | 55,043 | | | | 45,079 | | | | 25,853 | | | | 21,043 | | | | 26,087 | (H) | | | 25,115 | |
| Class Y | | | 464,002 | | | | 358,423 | | | | 238,081 | | | | 151,652 | | | | 199,293 | (H)(L) | | | 200,325 | |
| Ratio of expenses to average net assets (%) | | | | | | | | | | | | | | | | | | | | | | | | |
| Class A | | | 1.10 | %(J) | | | 1.09 | % | | | 1.09 | % | | | 0.98 | % | | | 0.94 | %(C)(H) | | | 0.95 | % |
| Class C | | | 1.85 | (J) | | | 1.84 | | | | 1.84 | | | | 1.74 | | | | 1.69 | (C)(H) | | | 1.70 | |
| Class Y | | | 0.85 | (J) | | | 0.84 | | | | 0.84 | | | | 0.71 | | | | 0.64 | (C)(H)(L) | | | 0.70 | |
| Ratio of expenses to average net assets before contractual expense reimbursements (%)** | | | | | | | | | | | | | | | | | | | | | | | | |
| Class A | | | 1.30 | (K) | | | 1.32 | | | | 1.35 | | | | 1.35 | | | | 1.37 | (C)(H) | | | 1.60 | |
| Class C | | | 2.00 | (K) | | | 2.05 | | | | 2.10 | | | | 2.09 | | | | 2.16 | (C)(H) | | | 2.35 | |
| Class Y | | | 1.00 | (K) | | | 1.05 | | | | 1.01 | | | | 1.00 | | | | 1.05 | (C)(H)(L) | | | 1.35 | |
| Ratio of net investment income (loss) to average net assets (%) | | | | | | | | | | | | | | | | | | | | | | | | |
| Class A | | | 2.74 | | | | 3.19 | | | | 3.95 | | | | 4.82 | | | | 4.76 | (C)(H)(I) | | | 4.65 | |
| Class C | | | 1.99 | | | | 2.44 | | | | 3.20 | | | | 4.07 | | | | 4.01 | (C)(H)(I) | | | 3.82 | |
| Class Y | | | 2.99 | | | | 3.44 | | | | 4.21 | | | | 5.10 | | | | 5.06 | (C)(H)(I)(L) | | | 4.80 | |
| Portfolio turnover rate (%) | | | | | | | | | | | | | | | | | | | | | | | | |
| Class A | | | 127 | | | | 122 | | | | 102 | | | | 44 | | | | 41 | (B)(H) | | | 47 | |
| Class C | | | 127 | | | | 122 | | | | 102 | | | | 44 | | | | 41 | (B)(H) | | | 47 | |
| Class Y | | | 127 | | | | 122 | | | | 102 | | | | 44 | | | | 41 | (B)(H)(L) | | | 47 | |
* See Notes at page [•].
| Touchstone Sustainability & Impact Equity Fund |
| Selected Date for a Share Outstanding Throughout Each Period | | Year
Ended
March 31,
2017 | | Year
Ended
March 31,
2016 | | Year
Ended
March 31,
2015 | | Year
Ended
March 31,
2014 | | Year
Ended
March 31,
2013 |
| Net asset value, beginning of period | | | | | | | | | | | | | | | | | | | | |
| Class A | | | $18.98 | | | | $30.96 | | | | $31.81 | | | | $28.74 | | | | $27.74 | |
| Class Y | | | 19.49 | | | | 31.49 | | | | 32.23 | | | | 29.07 | | | | 28.09 | |
| | | | | | | | | | | | | | | | | | | | | |
| Income from Investment Operations | | | | | | | | | | | | | | | | | | | | |
| Net investment income (loss) | | | | | | | | | | | | | | | | | | | | |
| Class A | | | 0.18 | | | | 0.06 | (M) | | | 0.11 | | | | 0.02 | | | | 0.11 | |
| Class Y | | | 0.20 | | | | 0.13 | (M) | | | 0.22 | | | | 0.09 | | | | 0.18 | |
| Net gains or losses on securities (realized and unrealized) | | | | | | | | | | | | | | | | | | | | |
| Class A | | | 2.47 | | | | (1.99 | ) | | | 4.87 | | | | 5.96 | | | | 1.00 | |
| Class Y | | | 2.58 | | | | (2.06 | ) | | | 4.92 | | | | 6.06 | | | | 1.00 | |
| Total from investment operations | | | | | | | | | | | | | | | | | | | | |
| Class A | | | 2.65 | | | | (1.93 | ) | | | 4.98 | | | | 5.98 | | | | 1.11 | |
| Class Y | | | 2.78 | | | | (1.93 | ) | | | 5.14 | | | | 6.15 | | | | 1.18 | |
| | | | | | | | | | | | | | | | | | | | | |
| Less Distributions | | | | | | | | | | | | | | | | | | | | |
| Dividends (from net investment income) | | | | | | | | | | | | | | | | | | | | |
| Class A | | | (0.11 | ) | | | (0.03 | ) | | | (0.05 | ) | | | (0.05 | ) | | | (0.11 | ) |
| Class Y | | | (0.16 | ) | | | (0.05 | ) | | | (0.10 | ) | | | (0.13 | ) | | | (0.20 | ) |
| Distributions (from realized gains) | | | | | | | | | | | | | | | | | | | | |
| Class A | | | -- | | | | (10.02 | ) | | | (5.78 | ) | | | (2.86 | ) | | | -- | |
| Class Y | | | -- | | | | (10.02 | ) | | | (5.78 | ) | | | (2.86 | ) | | | -- | |
| Total distributions | | | | | | | | | | | | | | | | | | | | |
| Class A | | | (0.11 | ) | | | (10.05 | ) | | | (5.83 | ) | | | (2.91 | ) | | | (0.11 | ) |
| Class Y | | | (0.16 | ) | | | (10.07 | ) | | | (5.88 | ) | | | (2.99 | ) | | | (0.20 | ) |
| Net asset value, end of period | | | | | | | | | | | | | | | | | | | | |
| Class A | | | $21.52 | | | | $18.98 | | | | $30.96 | | | | $31.81 | | | | $28.74 | |
| Class Y | | | 22.11 | | | | 19.49 | | | | 31.49 | | | | 32.23 | | | | 29.07 | |
| | | | | | | | | | | | | | | | | | | | | |
| Ratios/Supplemental Data | | | | | | | | | | | | | | | | | | | | |
| Total return (%)* | | | | | | | | | | | | | | | | | | | | |
| Class A(A) | | | 14.01 | % | | | (8.73 | %) | | | 17.17 | % | | | 21.27 | % | | | 4.05 | % |
| Class Y | | | 14.30 | | | | (8.54 | ) | | | 17.48 | | | | 21.62 | | | | 4.32 | |
| Net assets at end of period (000 omitted) | | | | | | | | | | | | | | | | | | | | |
| Class A | | | $113,062 | | | | $137,306 | | | | $257,273 | | | | $287,813 | | | | $286,572 | |
| Class Y | | | 112,790 | | | | 67,638 | | | | 416,741 | | | | 577,708 | | | | 523,413 | |
| Touchstone Sustainability & Impact Equity Fund |
| Selected Date for a Share Outstanding Throughout Each Period | | Year
Ended
March 31,
2017 | | Year
Ended
March 31,
2016 | | Year
Ended
March 31,
2015 | | Year
Ended
March 31,
2014 | | Year
Ended
March 31,
2013 |
| Ratio of expenses to average net assets (%) | | | | | | | | | | | | | | | | | | | | |
| Class A | | | 1.24 | % | | | 1.24 | % | | | 1.25 | % | | | 1.23 | % | | | 1.22 | % |
| Class Y | | | 0.99 | | | | 0.99 | | | | 0.99 | | | | 0.97 | | | | 0.96 | |
| Ratio of expenses to average net assets before contractual expense reimbursements (%)** | | | | | | | | | | | | | | | | | | | | |
| Class A | | | 1.36 | | | | 1.39 | | | | 1.28 | | | | 1.29 | | | | 1.32 | |
| Class Y | | | 1.09 | | | | 1.14 | | | | 1.00 | | | | 1.05 | | | | 1.08 | |
| Ratio of net investment income (loss) to average net assets (%) | | | | | | | | | | | | | | | | | | | | |
| Class A | | | 0.83 | | | | 0.31 | | | | 0.35 | | | | 0.06 | | | | 0.47 | |
| Class Y | | | 1.08 | | | | 0.56 | | | | 0.61 | | | | 0.32 | | | | 0.72 | |
| Portfolio turnover rate (%) | | | | | | | | | | | | | | | | | | | | |
| Class A | | | 53 | | | | 304 | | | | 98 | | | | 92 | | | | 109 | (N) |
| Class Y | | | 53 | | | | 304 | | | | 98 | | | | 92 | | | | 109 | (N) |
| (A) | Total returns shown exclude the effect of applicable sales loads. If these charges were included, the returns would be lower. |
| | |
| (B) | Not annualized. |
| | |
| (C) | Annualized. |
| | |
| (D) | Portfolio turnover excludes the purchases and sales of the Funds acquired on April 16, 2012 and September 10, 2012. If these transactions were included, portfolio turnover would have been higher. |
| | |
| (E) | Represents the period from commencement of operations (April 16, 2012) through September 30, 2012. |
| | |
| (F) | Portfolio turnover excludes the purchases and sales of the Fund acquired on May 17, 2013. If these transactions were included, portfolio turnover would have been higher. |
| | |
| (G) | Less than $0.005 per share. |
| | |
| (H) | The Fund changed its fiscal year end from July 31 to March 31. |
| | |
| (I) | Reflects the impact of a corporate action event that resulted in a one-time increase to net investment income. If the corporate action event had not occurred, Class A net investment income per share and ratio of net investment income to average net assets would have been lower by $0.01 and 0.13%, respectively. |
| | |
| (J) | The ratio of net expenses to average net assets excluding dividend and interest expense on securities sold short for Class A, Class C and Class Y shares is 1.09%, 1.85% and 0.84%, respectively for the year ended March 31, 2017. |
| | |
| (K) | The ratio of gross expenses to average net assets excluding dividend and interest expense on securities sold short for Class A, Class C and Class Y shares is 1.29%, 1.99% and 0.99% for the year ended March 31, 2017. |
| | |
| (L) | Effective September 10, 2012, Institutional Class shares were renamed Y shares. |
| | |
| (M) | The net investment income(loss) per share is based on average shares outstanding for the period. |
| | |
| (N) | Portfolio turnover excludes the purchases and sales of the Fund acquired on September 10, 2012. If these transactions were included, portfolio turnover would have been higher. |
Exhibit A: Form of Agreement and Plan of Reorganization
FORM OF AGREEMENT AND PLAN OF REORGANIZATION
THIS AGREEMENT AND PLAN OF REORGANIZATION (the “Agreement”) is made as of [•], by and among [Touchstone Strategic Trust/Touchstone Funds Group Trust], a [Massachusetts business trust/Delaware statutory trust] (the “Acquiring Trust”), on behalf of each of the series set forth on Exhibit A hereto (each, an “Acquiring Fund” or a “Fund”); Sentinel Group Funds, Inc., a Maryland corporation (the “Corporation”), on behalf of each of the series set forth on Exhibit A hereto (each, a “Target Fund” or a “Fund”); and for purposes of paragraph 9.1 of this Agreement only, Touchstone Advisors, Inc. (“Touchstone”); and for purposes of paragraphs 8.7 and 9.1 only, Sentinel Asset Management, Inc. (“Sentinel”). References herein to a “party” or the “parties” to this Agreement mean the Acquiring Trust and/or the Corporation. The Acquiring Trust has its principal place of business at 303 Broadway, Suite 1100, Cincinnati, Ohio 45202. The Corporation has its principal place of business at One National Life Drive, Montpelier, Vermont 05604.
WHEREAS, each reorganization (each, a “Reorganization”) will consist of (i) the transfer of the Assets (as defined in paragraph 1.2) of the Target Fund to the corresponding Acquiring Fund as set forth on Exhibit A hereto in exchange solely for voting shares of beneficial interest, without par value, of such corresponding Acquiring Fund as set forth on Exhibit A hereto (the “Acquiring Fund Shares”) and the assumption by such corresponding Acquiring Fund of the Liabilities (as defined in paragraph 1.3) of the Target Fund; and (ii) the pro rata distribution, by class, of the Acquiring Fund Shares to the shareholders of the Target Fund as set forth on Exhibit A hereto in complete liquidation and termination of the Target Fund, all upon the terms and conditions in this Agreement;
WHEREAS, the parties hereto intend that this Agreement be a plan of reorganization and that each Reorganization will qualify as a reorganization within the meaning of Section 368(a) of the Internal Revenue Code of 1986, as amended (the “Code”), and the Treasury Regulations promulgated thereunder;
WHEREAS, for convenience, the remainder of this Agreement refers only to a single Reorganization, one Target Fund and one Acquiring Fund, but the terms and conditions hereof will apply separately to each Reorganization and the Target Fund and the corresponding Acquiring Fund participating therein. The consummation of any Reorganization will not be contingent on the consummation of any other Reorganization, and it is the intention of the parties hereto that each Reorganization described herein will be conducted separately and independently of the others;
WHEREAS, the Acquiring Fund is a separate series of the Acquiring Trust, an open-end registered management investment company under the Investment Company Act of 1940, as amended (the “1940 Act”);
WHEREAS, the Target Fund is a separate series of the Corporation, an open-end registered management investment company under the 1940 Act, and the Target Fund owns securities and other investments that generally are assets of the type and character in which the Acquiring Fund is permitted to invest;
[WHEREAS, the Acquiring Fund currently has no assets and has carried on no business activities prior to the date hereof and will have no assets, other than de minimis assets received in connection with the issuance of one share of the Acquiring Fund to facilitate the organization of the Acquiring Fund, which will be redeemed prior to the Closing (as defined in paragraph 3.1 below), and will have carried on no business activities prior to the consummation of the transactions described herein, other than as necessary to facilitate the organization of the Acquiring Fund as a new series of the Acquiring Trust prior to its commencement of operations;]1
WHEREAS, neither the Acquiring Fund nor Touchstone is an “affiliated person” of the Target Fund, as defined in the 1940 Act, or an affiliated person of an affiliated person of the Target Fund;
WHEREAS, the Board of Trustees of the Acquiring Trust, including a majority of the trustees who are not “interested persons” of the Acquiring Trust, as defined in the 1940 Act, has determined that the Reorganization will be in the best interests of the Acquiring Fund [and that the interests of the existing shareholders of the Acquiring Fund will not be diluted as a result of the Reorganization]2; and
WHEREAS, the Board of Directors of the Corporation, including a majority of the directors who are not “interested persons” of the Corporation, as defined in the 1940 Act, has determined that the Reorganization will be in the best interests of the Target Fund and that the interests of the existing shareholders of the Target Fund will not be diluted as a result of the Reorganization;
NOW, THEREFORE, in consideration of the premises and of the covenants and agreements in this Agreement, the parties hereto covenant and agree as follows:
Article I
TRANSFER OF ASSETS OF THE TARGET FUND IN EXCHANGE FOR
ACQUIRING FUND SHARES AND ASSUMPTION OF TARGET FUND
LIABILITIES; LIQUIDATION AND TERMINATION OF THE TARGET FUND
1.1 THE EXCHANGE. Subject to the terms and conditions of this Agreement and on the basis of the representations and warranties contained herein, the Corporation, on behalf of the Target Fund, agrees to assign, transfer and convey to the Acquiring Fund all of the Target Fund’s Assets, as set forth in paragraph 1.2, free and clear of all liens, encumbrances and claims whatsoever. The Acquiring Trust, on behalf of the Acquiring Fund, agrees in exchange for the Target Fund’s Assets (i) to deliver to the Target Fund the number of Acquiring Fund Shares, including fractional Acquiring Fund Shares, computed in the manner and as of the time and date set forth in paragraphs 2.2 and 2.3; and (ii) to assume the Target Fund’s Liabilities, as set forth in
| 1 | Include for Shell Fund Reorganizations. |
| 2 | Exclude for Shell Fund Reorganizations. |
paragraph 1.3. Such transactions will take place at the Closing [(as defined in paragraph 3.1 below)]3.
1.2 ASSETS TO BE ACQUIRED. The assets of the Target Fund to be acquired by the Acquiring Fund will consist of all assets, including, without limitation, all portfolio securities, cash, cash equivalents, commodities, interests in futures and other financial instruments, claims (whether absolute or contingent, known or unknown), receivables (including dividends or interest and other receivables) and other assets belonging to the Target Fund, and any deferred or prepaid expenses, reflected on an unaudited statement of assets and liabilities of the Target Fund, prepared in accordance with generally accepted accounting principles in the United States of America (“GAAP”), consistently applied, from the Target Fund’s prior audited period, and approved by Touchstone (the “Assets”), as of the Closing. The Corporation, on behalf of the Target Fund, will pay or cause to be paid to the Acquiring Fund any dividends or interest received by the Target Fund after the Closing with respect to Assets transferred to the Acquiring Fund hereunder. The Corporation, on behalf of the Target Fund, will transfer to the Acquiring Fund any distributions, rights or other assets received by the Target Fund after the Closing as distributions on or with respect to the Assets. Such assets will be deemed included in the Assets transferred to the Acquiring Fund on the Closing Date (as defined in paragraph 3.1 below) and will not be separately valued.
The Corporation has provided the Acquiring Trust with the Target Fund’s most recent audited financial statements, which contain a list of all of the Target Fund’s assets as of the date thereof. The Corporation represents that, as of the date of the execution of this Agreement, there have been no changes in the Target Fund’s financial position as reflected in said financial statements other than those occurring in the ordinary course of its business in connection with the purchase and sale of portfolio securities and other investments, purchases and redemptions of shares of the Target Fund, the payment of the Target Fund’s normal operating expenses and the distribution of the Target Fund’s net income and net capital gain. The Corporation, with respect to the Target Fund, reserves the right to buy and sell prior to the Closing any securities or other investments in accordance with the Target Fund’s investment objective and policies.
1.3 LIABILITIES TO BE ASSUMED. The Corporation will endeavor to discharge all of the Target Fund’s known liabilities and obligations prior to the Valuation Time (as defined in paragraph 2.1 below) and, prior to the Valuation Time, will have discharged the Excluded Liabilities set forth on Schedule 1.3 hereto (the “Excluded Liabilities”). Without limiting the foregoing, the Target Fund will have paid or otherwise discharged all liabilities or obligations accrued and owing to third parties under each of the contracts set forth in Schedule 7.4, including any early termination fees or penalties. The Acquiring Fund will assume all liabilities, expenses, costs, charges and reserves reflected on an unaudited statement of assets and liabilities of the Target Fund, prepared in accordance with GAAP, consistently applied, from the Target Fund’s prior audited period, and approved by Touchstone, as of the Valuation Time, except for the Excluded Liabilities (the “Liabilities”). The Acquiring Fund will not assume any other liabilities of the Target Fund, whether absolute or contingent.
| 3 | Exclude for Shell Fund Reorganizations. |
1.4 LIQUIDATION AND DISTRIBUTION. Immediately after the Closing, the Target Fund will completely liquidate and distribute pro rata to the Target Fund’s shareholders of record of each class (the “Target Fund Shareholders”), determined as of the time of such distribution, the Acquiring Fund Shares of the corresponding class (as set forth in paragraph 2.3) received by the Target Fund pursuant to paragraph 1.1, and as soon as practicable after the Closing, the Corporation will proceed to terminate the Target Fund in accordance with the applicable laws of the State of Maryland as set forth in paragraph 1.7 below. Such liquidation and distribution will be accomplished by the transfer of the Acquiring Fund Shares then credited to the account of the Target Fund on the books of the Acquiring Fund to open accounts on the share records of the Acquiring Fund in the names of the Target Fund Shareholders and representing the respective pro rata number of the Acquiring Fund Shares, by class, due such shareholders. All issued and outstanding shares of the Target Fund will simultaneously be canceled on the books of the Target Fund and will be null and void. Acquiring Fund Shares distributed to the Target Fund Shareholders will be reflected on the books of the Acquiring Fund’s transfer agent as uncertificated shares.
1.5 TRANSFER TAXES. Any transfer taxes payable upon issuance of the Acquiring Fund Shares in a name other than the registered holder of shares of the Target Fund on the books of the Target Fund as of that time will, as a condition of such issuance and transfer, be paid by the person to whom such Acquiring Fund Shares are to be issued and transferred.
1.6 REPORTING RESPONSIBILITY. Any reporting responsibility of the Target Fund, including the responsibility for filing regulatory reports, tax returns or other documents with the Securities and Exchange Commission (the “Commission”), any state securities commission, and any federal, state or local tax authorities or any other relevant regulatory authority, is and will remain the responsibility of the Target Fund.
1.7 TERMINATION. The Corporation will take all necessary and appropriate steps under its charter and applicable state law to terminate the Target Fund promptly following the Closing and the making of all distributions pursuant to paragraph 1.4.
[1.8 INITIAL SHARE. Prior to the Closing, the Acquiring Fund will issue one Institutional Class share of beneficial interest of the Acquiring Fund (the “Initial Share”) to Touchstone or one of its affiliates (the “Sole Shareholder”) in exchange for $1.00 for the sole purpose of allowing the Sole Shareholder to approve certain matters to facilitate the organization of the Acquiring Fund. Prior to the Closing, the Initial Share will be redeemed and cancelled by the Acquiring Fund in exchange for $1.00.]4
1.9 WAIVER OF INVESTMENT MINIMUMS AND SALES LOADS. In connection with the Reorganization, any minimum investment amounts or sales loads applicable to initial investments in the Acquiring Fund will be waived with respect to the Target Fund Shareholders’ initial receipt of Acquiring Fund Shares in the Reorganization.
| 4 | Include for Shell Fund Reorganizations. |
Article II
VALUATION
2.1 VALUATION OF ASSETS. The value of the Target Fund’s Assets attributable to each class of the Target Fund to be acquired, and the amount of the Target Fund’s Liabilities attributable to each class of the Target Fund to be assumed, by the Acquiring Fund will be computed as of the close of business on the New York Stock Exchange on the Closing Date (the “Valuation Time”) using the valuation procedures established by the Board of Trustees of the Acquiring Trust or such other valuation procedures as may be mutually agreed upon by the parties hereto.
2.2 VALUATION OF SHARES. The net asset value per share of each class of the Acquiring Fund will be [the net asset value per share of the corresponding class of the Target Fund]5 computed as of the Valuation Time using the valuation procedures established by the Board of Trustees of the Acquiring Trust or such other valuation procedures as may be mutually agreed upon by the parties hereto.
2.3 SHARES TO BE ISSUED. The number of full and fractional Acquiring Fund Shares to be issued in exchange for the Target Fund’s net assets will be determined with respect to each class by dividing (a) the net assets attributable to such class of the Target Fund, determined in accordance with paragraph 2.1, by (b) the net asset value per share of the corresponding class of the Acquiring Fund (as set forth in the following sentences of this paragraph 2.3), determined in accordance with paragraph 2.2. Holders of each class of shares of the Target Fund will receive full and fractional shares of the corresponding class of the Acquiring Fund, as set forth on Exhibit A to this Agreement.
2.4 DETERMINATION OF VALUE. All computations of value will be made by BNY Mellon Investment Servicing (US) Inc., the Acquiring Fund’s accounting agent, in accordance with its regular practice in pricing the shares and assets of the Acquiring Fund. To the extent that the valuation policies and procedures of the Acquiring Trust would result in material pricing differences, the Acquiring Trust and the Corporation agree to use commercially reasonable efforts to resolve, prior to the Valuation Time any material pricing differences with respect to portfolio securities or other Assets of the Target Fund that will be transferred to the Acquiring Fund.
Article III
CLOSING AND CLOSING DATE
3.1 CLOSING DATE. Subject to the satisfaction or waiver of the conditions precedent set forth in Articles VI, VII and VIII, the closing of the Reorganization (the “Closing”) will take place on October 13, 2017 or such other date as the parties hereto may agree (the “Closing Date”). All acts taking place at the Closing will be deemed to take place simultaneously as of 5:00 p.m. Eastern Time on the Closing Date, unless otherwise provided.
| 5 | Include for Shell Fund Reorganizations. |
The Closing will be held as of 5:00 p.m. Eastern Time at the offices of Vedder Price P.C., or at such other time or place as the parties hereto may agree.
3.2 EFFECT OF SUSPENSION IN TRADING. In the event that on the day on which the Valuation Time occurs (a) the New York Stock Exchange or another primary trading market for portfolio securities of [the Acquiring Fund or]6 the Target Fund is closed to trading or trading thereon is restricted; or (b) trading or the reporting of trading on said exchange or elsewhere is disrupted so that an accurate determination of the value of the net assets of [the Acquiring Fund or]7 the Target Fund is impracticable, the Closing Date will be postponed until the first business day after the day when trading has been fully resumed and reporting has been restored or such other date as the parties hereto may agree.
3.3 DELIVERY OF ASSETS. Delivery of the Target Fund’s Assets will be made on the Closing Date and will be delivered to Brown Brothers Harriman & Co., the Acquiring Fund’s custodian (the “Custodian”), for the account of the Acquiring Fund, in accordance with the customary practices of the Custodian, with all securities not in bearer or book-entry form duly endorsed, or accompanied by duly executed separate assignments or stock powers, in proper form for transfer, with signatures guaranteed, and with all necessary stock transfer stamps, sufficient to transfer good and marketable title thereto (including all accrued interest and dividends and rights pertaining thereto) to the Custodian for the account of the Acquiring Fund free and clear of all liens, encumbrances, rights, restrictions and claims. All cash delivered will be in the form of immediately available funds payable to the order of the Custodian for the account of the Acquiring Fund. If the Corporation, on behalf of the Target Fund, is unable to make delivery to the Custodian pursuant to this paragraph 3.3 of any Assets for the reason that any of such Assets have not yet been delivered to the Target Fund by the Target Fund’s broker, dealer or other counterparty, then, in lieu of such delivery, the Corporation, on behalf of the Target Fund, will deliver with respect to said Assets executed copies of an agreement of assignment and due bills executed on behalf of said broker, dealer or other counterparty, together with such other documents as may be required by the Acquiring Trust, on behalf of the Acquiring Fund, or the Custodian, including broker confirmation slips.
3.4 TRANSFER AGENT CERTIFICATES. The Corporation will cause the transfer agent for the Target Fund to deliver to the Acquiring Trust, on behalf of the Acquiring Fund, at the Closing a certificate of an authorized officer stating that its records contain the names and addresses of the Target Fund Shareholders and the number, class and percentage ownership of outstanding shares owned by each such shareholder as of the Closing. At the Closing, the Acquiring Trust will cause the transfer agent for the Acquiring Fund to issue and deliver to the Secretary of the Corporation a confirmation evidencing the Acquiring Fund Shares to be credited at the Closing or otherwise provide evidence reasonably satisfactory to the Corporation that such Acquiring Fund Shares have been credited to the Target Fund’s account on the books of the Acquiring Fund. At the Closing, each party will deliver to the other such bills of sale, checks, assignments, share certificates, if any, receipts and other documents as such other party or its counsel may reasonably request.
| 6 | Exclude for Shell Fund Reorganizations. |
| 7 | Exclude for Shell Fund Reorganizations. |
3.5 CUSTODIAN’S CERTIFICATE. At the Closing or as soon as practicable thereafter, the Corporation will cause the custodian for the Target Fund to deliver to the Acquiring Trust, on behalf of the Acquiring Fund, a certificate of an authorized officer stating that: (a) the Target Fund’s portfolio securities, cash and any other Assets have been delivered in proper form to the Acquiring Fund as of the final settlement date for such transfers; and (b) all necessary taxes, including without limitation all applicable federal and state stock transfer stamps, if any, have been paid, or provision for payment will have been made, in conjunction with the delivery of portfolio securities, cash and any other Assets by the Target Fund. At the Closing or as soon as practicable thereafter, the Acquiring Trust will cause the Custodian to deliver to the Corporation, on behalf of the Target Fund, a certificate of an authorized officer acknowledging that the Acquiring Fund has received the Target Fund’s portfolio securities, cash and any other Assets as of the final settlement date for such transfers.
Article IV
REPRESENTATIONS AND WARRANTIES
4.1 REPRESENTATIONS OF THE CORPORATION. The Corporation, on behalf of the Target Fund, represents and warrants to the Acquiring Trust, on behalf of the Acquiring Fund, as follows:
(a) The Corporation is a corporation duly incorporated, validly existing and in good standing under the laws of the State of Maryland with the power to carry out its obligations under this Agreement, and the Target Fund is a duly established and designated separate series of the Corporation.
(b) The Corporation is registered as an investment company, classified as a management company of the open-end type, under the 1940 Act, and the shares of the Target Fund are registered under the Securities Act of 1933, as amended (the “1933 Act”), and such registrations have not been revoked or rescinded and are in full force and effect. The Corporation and the Target Fund are in compliance in all material respects with the 1940 Act and the rules and regulations thereunder.
(c) The current prospectus and statement of additional information of the Target Fund conform in all material respects to the applicable requirements of the 1933 Act and the 1940 Act and the rules and regulations of the Commission and do not include any untrue statement of a material fact or omit to state any material fact required to be stated or necessary to make the statements, in light of the circumstances under which they were made, not misleading. The Target Fund currently complies in all material respects with its investment objective and its investment policies and restrictions as set forth in the current prospectus and statement of additional information.
(d) The Corporation is not, and the execution, delivery and performance of this Agreement will not result, in violation of any provision of the Corporation’s charter or Bylaws or of any material agreement, indenture, instrument, contract, lease or other undertaking to which the Corporation or the Target Fund is a party or by which the Corporation or the Target Fund is bound, nor will the execution, delivery and performance of this Agreement by the
Corporation result in the acceleration of any obligation, or the imposition of any penalty, under any agreement, indenture, instrument, contract, lease or other undertaking to which the Corporation or the Target Fund is a party or by which the Corporation or the Target Fund is bound.
(e) Neither the Corporation nor the Target Fund has any material contracts or other commitments (other than this Agreement), including without limitation pursuant to the contracts set forth on Schedule 7.4, that will be terminated with liability to the Target Fund at or prior to the Closing, except for liabilities, if any, to be discharged as provided in paragraph 1.3.
(f) At or prior to the Closing, the Corporation will have delivered written evidence in to the Acquiring Trust in a form satisfactory to the Acquiring Trust to the effect that the directors’ deferred compensation plan has been terminated with respect to the Target Fund and that any and all liabilities of the Target Fund thereunder have been discharged.
(g) Except as otherwise disclosed in writing to the Acquiring Trust, no litigation, administrative proceeding or investigation of or before any court or governmental body is presently pending or to its knowledge threatened against the Corporation or the Target Fund or any of the properties or assets of the Corporation or the Target Fund, which, if adversely determined, would materially and adversely affect the financial condition of the Corporation or the Target Fund, the conduct of the business of the Corporation or the Target Fund, or the ability of the Corporation, on behalf of the Target Fund, to carry out the Reorganization. The Corporation knows of no facts that might form the basis for the institution of such proceedings and is not a party to or subject to the provisions of any order, decree or judgment of any court or governmental body that materially and adversely affects the business of the Corporation or the Target Fund or the Corporation’s ability, on behalf of the Target Fund, to consummate the Reorganization or the transactions contemplated herein.
(h) The Statements of Assets and Liabilities, Statements of Operations, Statements of Changes in Net Assets and Statements of Investments (indicating their fair value) of the Target Fund for each of the Target Fund’s five fiscal years ended November 30, 2016 have been audited by PricewaterhouseCoopers LLP, an independent registered public accounting firm, and have been prepared in accordance with GAAP, consistently applied, and such statements (copies of which have been furnished to the Acquiring Fund) fairly reflect the financial condition of the Target Fund as of such dates, and there are no known contingent liabilities of the Target Fund as of such dates not disclosed therein.
(i) Since the date of the financial statements referred to in subsection (h) above, there has not been any material adverse change in the Target Fund’s financial condition, assets, liabilities or business other than changes occurring in the ordinary course of business, or any incurrence by the Target Fund of indebtedness maturing more than one year from the date such indebtedness was incurred, except as otherwise disclosed to and accepted by the Acquiring Trust.
(j) All federal, state and local income tax returns and other material tax returns and reports of the Target Fund required by law to be filed by it (taking into account permitted extensions for filing) have been timely filed and are complete and correct in all
material respects as of the time they were filed. All material federal, state, local and other taxes of the Target Fund required to be paid (whether or not shown as due on any such return or report) have been paid, or provision has been made for the payment thereof and any such unpaid taxes as of the date of the financial statements referred to in subsection (h) above are properly reflected on such financial statements. To the Corporation’s knowledge, no tax authority is currently auditing or threatening to audit the Target Fund, and no assessment or deficiency for taxes (including interest, additions to tax or penalties, in each case, with respect to taxes) has been asserted against the Target Fund.
(k) For each taxable year of its operations (including the taxable year [that includes the Closing Date for that portion of such taxable year]8 ending on the Closing Date), the Target Fund (i) has been, and will be, treated as a separate corporation for federal income tax purposes pursuant to Section 851(g) of the Code, (ii) has met, and will meet, the requirements of Subchapter M of the Code for qualification as a regulated investment company and has elected to be treated as such, (iii) has been eligible to compute and has computed its federal income tax under Section 852 of the Code, and (iv) has not been, and will not be, liable for any material income or excise tax under Section 852 or 4982 of the Code. The Target Fund has no earnings and profits accumulated with respect to any taxable year in which the provisions of Subchapter M of the Code did not apply to the Target Fund.
(l) No consent, approval, authorization or order of any court or governmental authority is required for the consummation by the Corporation, on behalf of the Target Fund, of the transactions contemplated herein, except as may be required under the 1933 Act, the Securities Exchange Act of 1934, as amended (the “1934 Act”), and the 1940 Act and by state laws.
(m) Neither the Corporation nor the Target Fund is under the jurisdiction of a court in a “Title 11 or similar case” (within the meaning of Section 368(a)(3)(A) of the Code).
(n) The Target Fund does not own any “converted property” (as that term is defined in Treasury Regulation Section 1.337(d)-7T(a)(2)) that is subject to the rules of Section 1374 of the Code as a consequence of the application of Section 337(d)(1) of the Code and Treasury Regulations thereunder.
(o) Except as otherwise disclosed to the Acquiring Trust, the Corporation, with respect to the Target Fund, has not previously been a party to a transaction that qualified as reorganization under Section 368(a) of the Code.
(p) All issued and outstanding shares of the Target Fund are, and at the Closing will be, duly and validly issued and outstanding, fully paid and non-assessable by the Corporation. All of the issued and outstanding shares of the Target Fund will, at the time of the Closing, be held by the persons and in the amounts set forth in the records of the transfer agent as provided in paragraph 3.4. The Target Fund does not have outstanding any options, warrants or other rights to subscribe for or purchase any shares of the Target Fund, nor is there outstanding any security convertible into any shares of the Target Fund.
| 8 | Include for Shell Fund Reorganizations. |
(q) All issued and outstanding shares of the Target Fund have been offered and sold in compliance in all material respects with applicable registration requirements of the 1933 Act and state securities laws, are registered under the laws of all jurisdictions in which registration is or was required, except as previously disclosed to the Acquiring Trust in writing. Such registrations are, in all material respects, complete, current and have been continuously effective, and all fees required to be paid have been paid. The Corporation’s registration statement under the 1933 Act is not subject to any “stop order,” and the Corporation is, and was, fully qualified to sell the shares of the Target Fund in each jurisdiction in which such shares are being, or were, registered and sold.
(r) At the Closing, the Target Fund will have good and marketable title to the Assets and full right, power and authority to sell, assign, transfer and deliver the Assets to be transferred by it hereunder free of any liens or other encumbrances, and, upon delivery and payment for the Assets, the Acquiring Fund will acquire good and marketable title thereto, subject to no restrictions on the full transfer thereof, including such restrictions as might arise under the 1933 Act, other than as disclosed to the Acquiring Trust and accepted by the Acquiring Trust.
(s) The execution, delivery and performance of this Agreement have been duly authorized by all necessary action on the part of the Board of Directors of the Corporation and, assuming the due authorization, execution and delivery of this Agreement by the Acquiring Trust, on behalf of the Acquiring Fund, this Agreement constitutes a valid and legally binding obligation of the Corporation, on behalf of the Target Fund, enforceable in accordance with its terms, subject as to enforcement to the effect of bankruptcy, insolvency, reorganization, moratorium and other similar laws relating to or affecting creditors’ rights generally and court decisions with respect thereto, and to general principles of equity and the discretion of the court (regardless of whether the enforceability is considered in a proceeding in equity or at law).
(t) The information furnished by the Corporation for use in no-action letters, applications for orders, registration statements and proxy materials and other documents that may be necessary in connection with the Reorganization is accurate and complete in all material respects and complies in all material respects with applicable federal securities and other laws and regulations.
(u) The Registration Statement (as defined in paragraph 5.4), the Proxy Statement/Prospectus (as defined in paragraph 5.4) and statement of additional information contained therein, and the documents incorporated therein by reference, and any amendment or supplement thereto, insofar as they relate to the Corporation, the Target Fund or Sentinel, each conform and will conform in all material respects to the requirements of the federal and state securities laws and the rules and regulations thereunder as of the effective date of the Registration Statement and at all times subsequent thereto up to and including the Closing Date. Each of the Registration Statement, the Proxy Statement/Prospectus and statement of additional information contained therein, and the documents incorporated therein by reference, and any amendment or supplement thereto, insofar as they relate to the Corporation, the Target Fund or Sentinel, do not and will not include any untrue statement of a material fact or omit to state any material fact required to be stated therein or necessary to make the statements therein, in light of the circumstances under which they were made, not misleading, on the effective date of such
Registration Statement; provided, however, that the Corporation makes no representations or warranties as to any information contained in the Registration Statement, Proxy Statement/Prospectus, statement of additional information or any documents incorporated therein by reference, and any amendment or supplement thereto, other than information relating to the Corporation, the Target Fund or Sentinel included therein in reliance upon and in conformity with information furnished by or on behalf of the Corporation to the Acquiring Trust specifically for use in connection with the Registration Statement, Proxy Statement/Prospectus, statement of additional information and the documents incorporated therein by reference, and any amendment or supplement thereto.
(v) Except as otherwise disclosed in writing to the Acquiring Fund, the Target Fund is in compliance in all material respects with the Code and applicable regulations promulgated under the Code pertaining to the reporting by regulated investment companies of dividends and other distributions on and redemptions of its shares and has withheld in respect of dividends and other distributions and paid to the proper taxing authority all material taxes required to be withheld, and is not liable for any material penalties with respect to such reporting and withholding requirements.
4.2 REPRESENTATIONS OF THE ACQUIRING TRUST. The Acquiring Trust, on behalf of the Acquiring Fund, represents and warrants to the Corporation, on behalf of the Target Fund, as follows:
(a) The Acquiring Trust is a [business trust/statutory trust] duly organized, validly existing and in good standing under the laws of the [Commonwealth of Massachusetts/State of Delaware] with the power to carry out its obligations under this Agreement, and the Acquiring Fund is a duly established and designated separate series of the Acquiring Trust.
(b) The Acquiring Trust is registered as an investment company, classified as a management company of the open-end type, under the 1940 Act, and[, as of the Closing Date,]9 the Acquiring Fund’s shares are registered under the 1933 Act, and such registrations have not been revoked or rescinded and are in full force and effect. The Acquiring Trust and the Acquiring Fund are in compliance in all material respects with the 1940 Act and the rules and regulations thereunder.
[(c) The current prospectus and statement of additional information, as of the date of the Proxy Statement/Prospectus, of the Acquiring Fund conform in all material respects to the applicable requirements of the 1933 Act and the 1940 Act and the rules and regulations of the Commission and do not include any untrue statement of a material fact or omit to state any material fact required to be stated or necessary to make the statements, in light of the circumstances under which they were made, not misleading. The Acquiring Fund currently complies in all material respects with its investment goal and its investment policies and restrictions as set forth in the current prospectus and statement of additional information.]10
| 9 | Include for Shell Fund Reorganizations. |
| 10 | Exclude for Shell Fund Reorganizations. |
(d) The Acquiring Trust is not, and the execution, delivery and performance of this Agreement will not result, in violation of any provision of the Acquiring Trust’s Declaration of Trust or By-Laws or of any material agreement, indenture, instrument, contract, lease or other undertaking to which the Acquiring Trust or the Acquiring Fund is a party or by which the Acquiring Trust or the Acquiring Fund is bound, nor will the execution, delivery and performance of this Agreement by the Acquiring Trust result in the acceleration of any obligation, or the imposition of any penalty, under any agreement, indenture, instrument, contract, lease or other undertaking to which the Acquiring Trust or the Acquiring Fund is a party or by which the Acquiring Trust or the Acquiring Fund is bound.
(e) Except as otherwise disclosed in writing to the Corporation, no litigation, administrative proceeding or investigation of or before any court or governmental body is presently pending or to its knowledge threatened against the Acquiring Trust or the Acquiring Fund or any of the properties or assets of the Acquiring Trust or the Acquiring Fund, which, if adversely determined, would materially and adversely affect the financial condition of the Acquiring Trust or the Acquiring Fund, the conduct of the business of the Acquiring Trust or the Acquiring Fund or the ability of the Acquiring Trust, on behalf of the Acquiring Fund, to carry out the Reorganization. The Acquiring Trust knows of no facts that might form the basis for the institution of such proceedings and is not a party to or subject to the provisions of any order, decree or judgment of any court or governmental body that materially and adversely affects the business of the Acquiring Trust or the Acquiring Fund or the Acquiring Trust’s ability, on behalf of the Acquiring Fund, to consummate the Reorganization or the transactions contemplated herein.
[(f) The Statements of Assets and Liabilities, Statements of Operations, Statements of Changes in Net Assets and Statements of Investments (indicating their fair value) of the Acquiring Fund for each of the Acquiring Fund’s five fiscal years ended [March 31, 2017/September 30, 2016] have been audited by Ernst & Young LLP, an independent registered public accounting firm, and have been prepared in accordance with GAAP, consistently applied, and such statements (copies of which have been furnished to the Target Fund) fairly reflect the financial condition of the Acquiring Fund as of such dates, and there are no known contingent liabilities of the Acquiring Fund as of such dates not disclosed therein.]11
[(g) The unaudited Statements of Assets and Liabilities, Statements of Operations, Statements of Changes in Net Assets and Statements of Investments (indicating their fair value) of the Acquiring Fund for the Acquiring Fund’s semi-annual period ended March 31, 2017 have been prepared in accordance with GAAP, consistently applied, and such statements (copies of which have been furnished to the Target Fund) fairly reflect the financial condition of the Acquiring Fund as of such date, and there are no known contingent liabilities of the Acquiring Fund as of such date not disclosed therein.]12
| 11 | Exclude for Shell Fund Reorganizations. |
| 12 | Exclude for Shell Fund Reorganizations and for Acquiring Funds with March 31 fiscal year ends. |
[(h) Since the date of the financial statements referred to in subsection [(f)/(g)] above, there has not been any material adverse change in the Acquiring Fund’s financial condition, assets, liabilities or business other than changes occurring in the ordinary course of business, or any incurrence by the Acquiring Fund of indebtedness maturing more than one year from the date such indebtedness was incurred, except as otherwise disclosed to and accepted by the Corporation.]13
[(i) All federal, state, local and other material tax returns and reports of the Acquiring Fund required by law to be filed by it (taking into account permitted extensions for filing) have been timely filed and are complete and correct in all material respects as of the time they were filed. All material federal, state, local and other taxes of the Acquiring Fund required to be paid (whether or not shown as due on any such return or report) have been paid, or provision has been made for the payment thereof and any such unpaid taxes as of the date of the financial statements referred to in subsection [(f)/(g)] above are properly reflected on such financial statements. To the Acquiring Trust’s knowledge, no tax authority is currently auditing or threatening to audit the Acquiring Fund, and no assessment or deficiency for taxes (including interest, additions to tax or penalties, in each case, with respect to taxes) has been asserted against the Acquiring Fund.]14
[(j) For each taxable year of its operations (including the taxable year that includes the Closing Date), the Acquiring Fund (i) has been, and will be, treated as a separate corporation for federal income tax purposes pursuant to Section 851(g) of the Code, (ii) has met, and will meet, the requirements of Subchapter M of the Code for qualification as a regulated investment company and has elected to be treated as such, (iii) has been eligible to compute and has computed its federal income tax under Section 852 of the Code, and (iv) has not been, and will not be, liable for any material income or excise tax under Section 852 or 4982 of the Code. The Acquiring Fund has no earnings and profits accumulated with respect to any taxable year in which the provisions of Subchapter M of the Code did not apply to the Acquiring Fund.]15
(k) No consent, approval, authorization or order of any court or governmental authority is required for the consummation by the Acquiring Trust, on behalf of the Acquiring Fund, of the transactions contemplated herein, except as may be required under the 1933 Act, the 1934 Act and the 1940 Act and by state securities laws.
[(l) Neither the Acquiring Trust nor the Acquiring Fund is under the jurisdiction of a court in a “Title 11 or similar case” (within the meaning of Section 368(a)(3)(A) of the Code).]16
[(m) All issued and outstanding shares of the Acquiring Fund are, and at the Closing will be, duly and validly issued and outstanding, fully paid and non-assessable by the
| 13 | Exclude for Shell Fund Reorganizations. |
| 14 | Exclude for Shell Fund Reorganizations. |
| 15 | Exclude for Shell Fund Reorganizations. |
| 16 | Exclude for Shell Fund Reorganizations. |
Acquiring Trust. The Acquiring Fund does not have outstanding any options, warrants or other rights to subscribe for or purchase any Acquiring Fund shares, nor is there outstanding any security convertible into any Acquiring Fund shares.]17
[(n) All issued and outstanding shares of the Acquiring Fund have been offered and sold in compliance in all material respects with applicable registration requirements of the 1933 Act and state securities laws, are registered under the laws of all jurisdictions in which registration is or was required, except as previously disclosed to the Corporation in writing. Such registrations are, in all material respects, complete, current and have been continuously effective, and all fees required to be paid have been paid. The Acquiring Trust’s registration statement under the 1933 Act is not subject to any “stop order,” and the Acquiring Trust is, and was, fully qualified to sell the shares of the Acquiring Fund in each jurisdiction in which such shares are being, or were, registered and sold.]18
[(o) The Acquiring Fund (i) will elect to be taxed as a regulated investment company under Subchapter M of the Code, will qualify for the tax treatment afforded regulated investment companies under the Code for its taxable year that includes the Closing Date, and intends to continue to qualify for such treatment for its subsequent taxable years, (ii) will be eligible to compute its federal income tax under Section 852 of the Code for the taxable year that includes the Closing Date, and (iii) will be treated as a separate corporation for federal income tax purposes pursuant to Section 851(g) of the Code for the taxable year that includes the Closing Date. The Acquiring Fund has not taken any action, caused any action to be taken or caused any action to fail to be taken, which action or failure could cause the Acquiring Fund to fail to qualify as a regulated investment company for its taxable year that includes the Closing Date. The Acquiring Fund has no earnings and profits accumulated in any taxable year.]19
(p) The execution, delivery and performance of this Agreement have been duly authorized by all necessary action on the part of the Board of Trustees of the Acquiring Trust and, assuming the due authorization, execution and delivery of this Agreement by the Corporation, on behalf of the Target Fund, this Agreement constitutes a valid and legally binding obligation of the Acquiring Trust, on behalf of the Acquiring Fund, enforceable in accordance with its terms, subject as to enforcement to the effect of bankruptcy, insolvency, reorganization, moratorium and other similar laws relating to or affecting creditors’ rights generally and court decisions with respect thereto, and to general principles of equity and the discretion of the court (regardless of whether the enforceability is considered in a proceeding in equity or at law).
(q) The Acquiring Fund Shares to be issued and delivered to the Target Fund, for the account of the Target Fund Shareholders, pursuant to the terms of this Agreement will, at the Closing, have been duly authorized and[, when so issued and delivered,]20 [will, after taking into account the redemption and cancellation of the Initial Share, constitute all of the issued and
| 17 | Exclude for Shell Fund Reorganizations. |
| 18 | Exclude for Shell Fund Reorganizations. |
| 19 | Include for Shell Fund Reorganizations. |
| 20 | Exclude for Shell Fund Reorganizations. |
outstanding shares of the Acquiring Fund as of the time immediately after the Closing. When so issued and delivered, such shares]21 will be duly and validly issued Acquiring Fund Shares, and will be fully paid and non-assessable by the Acquiring Fund.
(r) The information furnished by the Acquiring Trust for use in no-action letters, applications for orders, registration statements and proxy materials and other documents that may be necessary in connection with the Reorganization is accurate and complete in all material respects and complies in all material respects with applicable federal securities and other laws and regulations.
(s) The Registration Statement, the Proxy Statement/Prospectus and statement of additional information contained therein, and the documents incorporated therein by reference, and any amendment or supplement thereto, insofar as they relate to the Acquiring Trust, the Acquiring Fund or Touchstone, each conform and will conform in all material respects to the requirements of the federal and state securities laws and the rules and regulations thereunder as of the effective date of the Registration Statement and at all times subsequent thereto up to and including the Closing Date. Each of the Registration Statement, the Proxy Statement/Prospectus and statement of additional information contained therein, and the documents incorporated therein by reference, and any amendment or supplement thereto, insofar as they relate to the Acquiring Trust, the Acquiring Fund or Touchstone, do not and will not include any untrue statement of a material fact or omit to state any material fact required to be stated therein or necessary to make the statements therein, in light of the circumstances under which they were made, not misleading, on the effective date of such Registration Statement; provided, however, that the Acquiring Trust makes no representations or warranties as to any information contained in the Registration Statement, Proxy Statement/Prospectus, statement of additional information or any documents incorporated therein by reference, and any amendment or supplement thereto, relating to the Corporation, the Target Fund or Sentinel included therein in reliance upon and in conformity with information furnished by or on behalf of the Corporation to the Acquiring Trust specifically for use in connection with the Registration Statement, Proxy Statement/Prospectus, statement of additional information and the documents incorporated therein by reference, and any amendment or supplement thereto.
(t) No consideration other than the Acquiring Fund Shares (and the Acquiring Fund’s assumption of the Target Fund’s Liabilities) will be issued by the Acquiring Fund in exchange for the Target Fund’s Assets in the Reorganization.
(u) The Acquiring Fund does not directly or indirectly own, nor at the Closing will it directly or indirectly own, nor has it directly or indirectly owned at any time during the past five years, any shares of the Target Fund.
[(v) The Acquiring Fund was newly formed solely for the purpose of effecting the Reorganization. As of the time immediately prior to the Closing, the Acquiring Fund has carried on no business activities, other than as necessary to facilitate the organization of the Acquiring Fund as a new series of the Acquiring Trust prior to its commencement of operations. Except with respect to the consideration received in exchange for the issuance of the Initial
| 21 | Include for Shell Fund Reorganizations. |
Share, the Acquiring Fund has not owned any assets and will not own any assets prior to the Closing.]22
[(w) As of the time immediately prior to the Closing, there will be no issued or outstanding securities issued by the Acquiring Fund, other than the Initial Share issued to the Sole Shareholder for the purpose set forth in paragraph 1.8 above. The Initial Share will be redeemed and cancelled prior to the Closing.]23
Article V
COVENANTS OF THE ACQUIRING Trust AND THE CORPORATION
5.1 OPERATION [IN ORDINARY COURSE]24 [OF TARGET FUND]25. [The Acquiring Trust and the Corporation each will operate the business of the Acquiring Fund and the Target Fund, respectively,]26 [The Corporation will operate the business of the Target Fund]27 in the ordinary course between the date of this Agreement and the Closing, it being understood that such ordinary course of business will include purchases and redemptions of shares, customary dividends and distributions and any other distributions necessary or desirable to avoid federal income or excise taxes. Notwithstanding the foregoing sentence, the Corporation reserves the right of the Target Fund to make distributions to the Target Fund Shareholders on or before the Closing Date as contemplated in paragraph 8.6 below.
[5.2 OPERATION OF ACQUIRING FUND. Prior to the Closing, the Acquiring Fund will not have any issued and outstanding securities or assets other than as contemplated by paragraph 1.8 above. The Acquiring Fund was newly formed solely for the purpose of effecting the Reorganization and, prior to the Closing, the Acquiring Fund will have carried on no business activities, other than as necessary to facilitate the organization of the Acquiring Fund as a new series of the Acquiring Trust prior to its commencement of operations.]28
5.3 SHAREHOLDER MEETING. The Corporation will call a meeting of the Target Fund’s shareholders to consider and act upon this Agreement and to take all other action necessary to obtain approval of the transactions contemplated herein.
5.4 PROXY STATEMENT/PROSPECTUS AND REGISTRATION STATEMENT. The Acquiring Trust and the Corporation will cooperate with each other in the preparation of the Acquiring Trust’s Registration Statement on Form N-14 relating to the Reorganization, as
| 22 | Include for Shell Fund Reorganizations. |
| 23 | Include for Shell Fund Reorganizations. |
| 24 | Exclude for Shell Fund Reorganizations. |
| 25 | Include for Shell Fund Reorganizations. |
| 26 | Exclude for Shell Fund Reorganizations. |
| 27 | Include for Shell Fund Reorganizations. |
| 28 | Include for Shell Fund Reorganizations. |
amended or supplemented (the “Registration Statement”), including the Joint Proxy Statement/Prospectus contained therein (the “Proxy Statement/Prospectus”), and will cause the Registration Statement to be filed with the Commission in a form satisfactory to the Acquiring Trust and the Corporation and their respective counsel as promptly as practicable. Upon effectiveness of the Registration Statement, the Corporation, with the assistance of Touchstone, will cause the Proxy Statement/Prospectus to be delivered to shareholders of the Target Fund entitled to vote on this Agreement and the transactions contemplated herein in accordance with the Corporation’s charter and Bylaws. Each of the Acquiring Trust and the Corporation will provide the materials and information necessary to prepare the Registration Statement, for inclusion therein, in connection with the shareholder meeting of the Target Fund referred to in paragraph 5.3 above. If at any time prior to the Closing, the Acquiring Trust or the Corporation becomes aware of any untrue statement of material fact or omission to state a material fact required to be stated therein or necessary to make the statements made not misleading in light of the circumstances under which they were made, the party discovering the item will notify the other party and the parties will cooperate in promptly preparing, filing and clearing with the Commission and, if appropriate, distributing to shareholders appropriate disclosure with respect to the item.
5.5 INVESTMENT REPRESENTATION. The Corporation, on behalf of the Target Fund, covenants that the Acquiring Fund Shares to be issued are not being acquired for the purpose of making any distribution other than in accordance with the terms of this Agreement.
5.6 ADDITIONAL INFORMATION. The Corporation will assist the Acquiring Trust in obtaining such information as the Acquiring Trust reasonably requests concerning the beneficial ownership of the shares of the Target Fund.
5.7 FURTHER ACTION. (a) Subject to the provisions of this Agreement, the Acquiring Trust, on behalf of the Acquiring Fund, and the Corporation, on behalf of the Target Fund, will each take, or cause to be taken, all action, and do or cause to be done all things reasonably necessary, proper or advisable to consummate and make effective the Reorganization, including any actions required to be taken after the Closing; (b) the Acquiring Trust, on behalf of the Acquiring Fund, agrees to use all reasonable efforts to obtain the approvals and authorizations required by the 1933 Act, the 1940 Act and such of the state Blue Sky or securities laws as it may deem appropriate in order to continue its operations after the Closing Date; and (c) as promptly as practicable, but in any case within 60 days after the Closing Date, the Corporation will furnish the Acquiring Trust, in such form as is reasonably satisfactory to the Acquiring Trust, a statement of the earnings and profits of the Target Fund for federal income tax purposes that will be carried over to the Acquiring Fund as a result of Section 381 of the Code, which statement will be certified by the Corporation’s President and Chief Executive Officer or Vice President and its Treasurer.
5.8 ACCESS TO RECORDS. Upon reasonable notice, each party will make available to the other party for review any accounts, books, records or other documents (including but not limited to minute books, stock transfer ledgers, financial statements, tax returns and related work papers and letters from accountants and other similar records) required to be maintained by the parties with respect to the Acquiring Fund or the Target Fund, as
applicable, pursuant to Section 31(a) of the 1940 Act and Rules 31a-1 to 31a-3 thereunder that are reasonably requested by such other party in connection with the Reorganization.
5.9 TAX STATUS OF REORGANIZATION. It is the intention of the parties hereto that the transaction contemplated by this Agreement with respect to the Acquiring Fund and the Target Fund will qualify as a reorganization within the meaning of Section 368(a) of the Code. None of the Acquiring Trust, the Acquiring Fund, the Corporation or the Target Fund will take any action or cause any action to be taken (including without limitation the filing of any tax return) that is inconsistent with such treatment or results in the failure of the transaction to qualify as a reorganization within the meaning of Section 368(a) of the Code. At or prior to the Closing, the parties to this Agreement will take such reasonable action, or cause such action to be taken, as is reasonably necessary to enable Vedder Price P.C. to render the tax opinion contemplated in this Agreement.
Article VI
CONDITIONS PRECEDENT TO OBLIGATIONS OF THE CORPORATION
The obligations of the Corporation, on behalf of the Target Fund, to consummate the transactions provided for herein will be subject, at its election, to the performance by the Acquiring Trust, on behalf of the Acquiring Fund, of all the obligations to be performed by it hereunder at or before the Closing, and, in addition thereto, the following further conditions will be satisfied or, to the extent legally permissible, waived:
6.1 All representations and warranties of the Acquiring Trust contained in this Agreement will be true and correct in all material respects as of the date of this Agreement and as of the Closing Date with the same force and effect as if made at and as of the Closing. The Acquiring Trust, on behalf of the Acquiring Fund, will have delivered to the Corporation, on behalf of the Target Fund, at the Closing a certificate executed in its name by its President or Vice President, in form and substance reasonably satisfactory to the Corporation and dated as of the Closing Date, to such effect and as to such other matters as the Corporation may reasonably request.
6.2 (a) The Corporation, on behalf of the Target Fund, will have received an opinion of Vedder Price P.C., counsel to the Acquiring Trust, dated as of the Closing Date, in a form reasonably satisfactory to the Corporation, substantially to the effect that:
(i) the execution and delivery of this Agreement by the Acquiring Trust, on behalf of the Acquiring Fund, did not, and the consummation by the Acquiring Trust, on behalf of the Acquiring Fund, of the transactions contemplated hereby will not, result in a material violation of the express terms of any material agreement or instrument known to such counsel to which the Acquiring Trust is a party or by which it or its property is bound or result in the acceleration of any obligation, or the imposition of any penalty, under any such agreement, or any judgment or decree known to such counsel to which the Acquiring Trust is a party or by which it or its property is bound, under the express terms thereof;
(ii) to the knowledge of such counsel, no consent, approval, authorization or order of any court or governmental authority of the United States is required for the consummation by the Acquiring Trust, on behalf of the Acquiring Fund, of the transactions contemplated herein, except such as have been made or obtained;
(iii) the Acquiring Trust is registered with the Commission as an investment company under the 1940 Act, and, to the knowledge of such counsel, no order has been issued or proceeding instituted to suspend such registration; and
(iv) the Registration Statement has become effective under the 1933 Act, and, to the knowledge of such counsel, no order has been issued or proceeding instituted to suspend the effectiveness of such Registration Statement.
Insofar as the opinions expressed above relate to or are dependent upon matters that are governed by the laws of the [Commonwealth of Massachusetts/State of Delaware], Vedder Price P.C. may rely on the opinions of [•].
In rendering such opinion, counsel may rely as to factual matters, exclusively and without independent verification, on the representations and warranties made in this Agreement and in the certificates delivered pursuant to this Agreement, which counsel may treat as representations and warranties made to it, as well as on representations and warranties made in separate certificates of officers or trustees of the Acquiring Trust addressed to counsel.
Such opinion may contain such assumptions and limitations as may be, in the opinion of counsel, appropriate to render the opinions expressed.
(b) The Corporation, on behalf of the Target Fund, will have received an opinion of [•], [Massachusetts/Delaware] counsel to the Acquiring Trust, dated as of the Closing Date, in a form reasonably satisfactory to the Corporation, substantially to the effect that:
(i) [the Acquiring Trust is a voluntary association with transferable shares of the type commonly referred to as a “Massachusetts business trust” and is validly existing under the laws of the Commonwealth of Massachusetts, and the Acquiring Fund has the power under the Acquiring Trust’s Declaration of Trust and Massachusetts law applicable to business trusts to carry on its business as described in the Proxy Statement/Prospectus, and the Acquiring Fund has been established and designated as a series of the Acquiring Trust under the Acquiring Trust’s Declaration of Trust]29 [the Acquiring Trust is validly existing in good standing as a statutory trust under the Delaware Statutory Trust Act, 12 Del. C. § 3801, et seq. (the “Act”), and has the power and authority under its Declaration of Trust and the Act to execute, deliver and perform its obligations under this Agreement, and the Acquiring Fund has been established and designated as a series of the Acquiring Trust under the Acquiring Trust’s Declaration of Trust]30;
| 29 | Include for Massachusetts Acquiring Funds. |
| 30 | Include for Delaware Acquiring Funds. |
(ii) this Agreement has been duly authorized, executed and delivered by the Acquiring Trust, on behalf of the Acquiring Fund, and, assuming due authorization, execution and delivery of this Agreement by the Corporation, on behalf of the Target Fund, is a valid and legally binding obligation of the Acquiring Trust on behalf of the Acquiring Fund, enforceable against the Acquiring Fund in accordance with its terms, subject to the effect of bankruptcy, insolvency, fraudulent transfer, reorganization, receivership, moratorium and other laws affecting the rights and remedies of creditors or secured parties generally and general principles of equity;
(iii) the execution and delivery of this Agreement by the Acquiring Trust, on behalf of the Acquiring Fund, did not, and the consummation by the Acquiring Trust, on behalf of the Acquiring Fund, of the transactions contemplated hereby will not, violate the Acquiring Trust’s Declaration of Trust or By-Laws;
(iv) to the knowledge of such counsel, no consent, approval, authorization or order of any court or governmental authority of the [Commonwealth of Massachusetts/State of Delaware] is required for the consummation by the Acquiring Trust, on behalf of the Acquiring Fund, of the transactions contemplated herein, except such as have been made or obtained, and except such as may be required under [Massachusetts/Delaware] securities laws about which such counsel expresses no opinion; and
(v) the Acquiring Fund Shares to be issued and delivered by the Acquiring Trust pursuant to this Agreement have been duly authorized for issuance and, when issued and delivered as provided under this Agreement, will be validly issued, fully paid and non-assessable by the Acquiring Fund except that, as described in the Proxy Statement/Prospectus, shareholders of the Acquiring Fund may under certain circumstances be held personally liable for its obligations under [Massachusetts/Delaware] law and shareholders of the Acquiring Fund have no preemptive or other rights to subscribe for such shares under the Acquiring Trust’s Declaration of Trust or By-Laws.
In rendering such opinion, counsel may rely as to factual matters, exclusively and without independent verification, on the representations and warranties made in this Agreement and in the certificates delivered pursuant to this Agreement, which counsel may treat as representations and warranties made to it, as well as on representations and warranties made in separate certificates of officers or trustees of the Acquiring Trust addressed to counsel.
Such opinion may contain such assumptions and limitations as may be, in the opinion of counsel, appropriate to render the opinions expressed.
Article VII
CONDITIONS PRECEDENT TO OBLIGATIONS OF THE ACQUIRING TRUST
The obligations of the Acquiring Trust, on behalf of the Acquiring Fund, to consummate the transactions provided for herein will be subject, at its election, to the performance by the
Corporation, on behalf of the Target Fund, of all the obligations to be performed by it hereunder at or before the Closing and, in addition thereto, the following conditions will be satisfied or, to the extent legally permissible, waived:
7.1 All representations and warranties of the Corporation contained in this Agreement will be true and correct in all material respects as of the date of this Agreement and as of the Closing Date with the same force and effect as if made at and as of the Closing. The Corporation, on behalf of the Target Fund, will have delivered to the Acquiring Trust, on behalf of the Acquiring Fund, at the Closing a certificate executed in its name by the Corporation’s President and Chief Executive Officer or Vice President, in form and substance satisfactory to the Acquiring Trust and dated as of the Closing Date, to such effect and as to such other matters as the Acquiring Trust may reasonably request.
7.2 The Corporation will have delivered to the Acquiring Trust an unaudited statement of the Target Fund’s assets and liabilities, together with a list of the Target Fund’s portfolio securities and other investments showing the tax basis of such securities and other investments by lot and the holding periods of such securities and other investments, as of the Valuation Time, certified by the Vice President and Treasurer or Assistant Treasurer of the Corporation.
7.3 (a) The Acquiring Trust, on behalf of the Acquiring Fund, will have received an opinion of Sidley Austin LLP, counsel to the Corporation, dated as of the Closing Date, in a form reasonably satisfactory to the Acquiring Trust, substantially to the effect that:
(i) the execution and delivery of this Agreement did not, and the consummation of the transactions contemplated hereby will not, result in a material violation of the express terms of any material agreement or instrument known to such counsel to which the Corporation is a party or by which it or its property is bound or result in the acceleration of any obligation, or the imposition of any penalty, under any such agreement, or any judgment or decree known to such counsel to which the Corporation is a party or by which it or its property is bound, under the express terms thereof;
(ii) to the knowledge of such counsel without investigation, there is no legal, administrative or governmental proceeding, investigation, order, decree or judgment of any court or governmental body, only insofar as they relate to the Corporation or its assets or properties, pending or overtly threatened in writing on or before the effective date of the Registration Statement or the Closing Date that is required to be described in the Registration Statement or to be filed as an exhibit to the Registration Statement that is not described or filed as required;
(iii) to the knowledge of such counsel, no consent, approval, authorization or order of any court or governmental authority of the United States is required for the consummation by the Corporation, on behalf of the Target Fund, of the transactions contemplated herein, except such as have been made or obtained; and
(iv) the Corporation is registered with the Commission as an investment company under the 1940 Act, and, to the knowledge of such counsel, no order has been issued or proceeding instituted to suspend such registration.
In rendering such opinion, counsel may rely as to factual matters, exclusively and without independent verification, on the representations and warranties made in this Agreement and in the certificates delivered pursuant to this Agreement, which counsel may treat as representations and warranties made to it, as well as on representations and warranties made in separate certificates of officers or directors of the Corporation addressed to counsel.
Such opinion may contain such assumptions and limitations as may be, in the opinion of counsel, appropriate to render the opinions expressed.
(b) The Acquiring Trust, on behalf of the Acquiring Fund, will have received an opinion of [•], Maryland counsel to the Corporation, dated as of the Closing Date, in a form reasonably satisfactory to the Acquiring Trust, substantially to the effect that:
(i) this Agreement has been duly authorized, executed and delivered by the Corporation, on behalf of the Target Fund;
(ii) the execution and delivery of this Agreement did not, and the consummation of the transactions contemplated hereby will not, violate the Corporation’s charter or Bylaws or result in a material violation of the express terms of any material agreement or instrument known to such counsel to which the Corporation is a party or by which it or its property is bound or result in the acceleration of any obligation, or the imposition of any penalty, under any such agreement, or any judgment or decree known to such counsel to which the Corporation is a party or by which it or its property is bound, under the express terms thereof;
(iii) the Corporation is a corporation duly incorporated and validly existing under the laws of the State of Maryland and has the power to carry on its business as a registered investment company as described in its current prospectus, and the Target Fund is a separate series of common stock of the Corporation; and
(iv) to the knowledge of such counsel, no consent, approval, authorization or order of any court or governmental authority of the State of Maryland is required for the consummation by the Corporation, on behalf of the Target Fund, of the transactions contemplated herein, except such as have been made or obtained.
In rendering such opinion, counsel may rely as to factual matters, exclusively and without independent verification, on the representations and warranties made in this Agreement and in the certificates delivered pursuant to this Agreement, which counsel may treat as representations and warranties made to it, as well as on representations and warranties made in separate certificates of officers or directors of the Corporation addressed to counsel.
Such opinion may contain such assumptions and limitations as may be, in the opinion of counsel, appropriate to render the opinions expressed.
(c) The Acquiring Trust, on behalf of the Acquiring Fund, will have received an opinion of [•] dated as of the Closing Date, in a form reasonably satisfactory to the Acquiring Trust, substantially to the effect that, assuming due authorization, execution and delivery of this Agreement by the Acquiring Trust, on behalf of the Acquiring Fund, this Agreement is a valid and legally binding obligation of the Corporation, on behalf of the Target Fund, enforceable against the Corporation, with respect to the Target Fund, in accordance with its terms, subject to the effect of bankruptcy, insolvency, fraudulent transfer, reorganization, receivership, moratorium and other laws affecting the rights and remedies of creditors or secured parties generally and general principles of equity.
In rendering such opinion, counsel may rely as to factual matters, exclusively and without independent verification, on the representations and warranties made in this Agreement and in the certificates delivered pursuant to this Agreement, which counsel may treat as representations and warranties made to it, as well as on representations and warranties made in separate certificates of officers or directors of the Corporation addressed to counsel.
Such opinion may contain such assumptions and limitations as may be, in the opinion of counsel, appropriate to render the opinion expressed.
7.4 The contracts of the Corporation and the Target Fund set forth on Schedule 7.4 hereto will have been terminated at or prior to the Closing with respect to the Target Fund, and the Acquiring Fund will have received written evidence of such termination and assurance that no claims for damages (liquidated or otherwise) will arise as a result of such termination.
Article VIII
FURTHER CONDITIONS PRECEDENT TO OBLIGATIONS OF
THE ACQUIRING TRUST AND THE CORPORATION
If any of the conditions set forth below do not exist on or before the Closing with respect to the Corporation or the Acquiring Trust, the other party may, at its option, not be required to consummate the transactions contemplated by this Agreement:
8.1 The closing conditions to the Purchase Agreement dated as of April 18, 2017 by and among Sentinel, Touchstone and Fort Washington Investment Advisors, Inc. will have been satisfied or, to the extent legally permissible, waived by the parties thereto.
8.2 This Agreement and the transactions contemplated herein will have been approved by the requisite vote of the holders of the outstanding shares of the Target Fund in accordance with the provisions of the Corporation’s charter and Bylaws and the 1940 Act. Notwithstanding anything in this Agreement to the contrary, neither the Corporation nor the Acquiring Trust may waive the condition set forth in this paragraph 8.2.
8.3 On the Closing Date, the Commission will not have issued an unfavorable report under Section 25(b) of the 1940 Act, nor instituted any proceeding seeking to enjoin the consummation of the transactions contemplated by this Agreement under Section 25(c) of the 1940 Act and no action, suit or other proceeding will be pending or, to either party’s knowledge,
threatened before any court or governmental agency in which it is sought to restrain or prohibit, or obtain damages or other relief in connection with, this Agreement or the Reorganization.
8.4 All consents of other parties and all other consents, orders and permits of federal, state and local regulatory authorities (including those of the Commission and of state Blue Sky securities authorities, including any “no-action” positions of and exemptive orders from such federal and state authorities) deemed necessary by the Acquiring Trust or the Corporation to permit consummation of the Reorganization and the transactions contemplated by this Agreement will have been obtained, except where failure to obtain any such consent, order or permit would not involve a risk of a material adverse effect on the assets or properties of the Acquiring Fund or the Target Fund, provided that either party may for itself waive any of such conditions.
8.5 The Registration Statement will have become effective under the 1933 Act, and no stop orders suspending the effectiveness of the Registration Statement will have been issued and, to the best knowledge of the parties, no investigation or proceeding for that purpose will have been instituted or be pending, threatened or contemplated under the 1933 Act.
8.6 [Prior to the Valuation Time, the Corporation, with respect to the Target Fund, will have declared and paid a dividend or dividends that, together with all previous such dividends, will have the effect of distributing to the Target Fund’s shareholders all of the Target Fund’s investment company taxable income (within the meaning of Section 852(b)(2) of the Code) for all taxable years or periods ending on or before the Closing Date (computed without regard to any deduction for dividends paid), the excess of the Target Fund’s interest income excludable from gross income under Section 103(a) of the Code over its disallowed deductions under Sections 265 and 171(a)(2) of the Code for all taxable years or periods ending on or before the Closing Date, and all of the Target Fund’s net capital gain (as defined in Section 1222(11) of the Code) realized in all taxable years or periods ending on or before the Closing Date (after reduction for any available capital loss carryforward and excluding any net capital gain on which the Target Fund paid tax under Section 852(b)(3)(A) of the Code).]31 [If and to the extent that the Board of Directors of the Corporation deems it advisable for federal income tax purposes, the Target Fund may declare, and if it does so, pay, a dividend or dividends that, together with all previous such dividends, will have the effect of distributing to the Target Fund’s shareholders all of the Target Fund’s investment company taxable income (within the meaning of Section 852(b)(2) of the Code) for all years or periods up to and including the Closing Date (computed without regard to any deduction for dividends paid), the excess of the Target Fund’s interest income excludable from gross income under Section 103(a) of the Code over its disallowed deductions under Sections 265 and 171(a)(2) of the Code for all years or periods up to and including the Closing Date, and all of the Target Fund’s net capital gain (as defined in Section 1222(11) of the Code) realized in all years or periods up to and including the Closing Date (after reduction for any available capital loss carryforward and excluding any net capital gain on which the Target Fund paid tax under Section 852(b)(3)(A) of the Code).]32
| 31 | Exclude for Shell Fund Reorganizations. |
| 32 | Include for Shell Fund Reorganizations. |
8.7 For a period beginning at the Closing Date and ending no less than six years thereafter, Sentinel will have arranged for the provision of directors and officers errors and omissions insurance that is substantially similar in scope to the current coverage (“Insurance”) covering the current and former directors and officers of the Corporation, with respect to the Target Fund, with respect to “Wrongful Acts” (as defined under the Insurance) committed on or prior to the Closing Date.
8.8 Each of the Acquiring Trust and the Corporation will have received an opinion of Vedder Price P.C. substantially to the effect that, for federal income tax purposes:
(a) The transfer by the Target Fund of its Assets to the Acquiring Fund in exchange solely for Acquiring Fund Shares and the assumption by the Acquiring Fund of the Target Fund’s Liabilities, immediately followed by the pro rata, by class, distribution of all the Acquiring Fund Shares so received by the Target Fund to the Target Fund Shareholders in complete liquidation of the Target Fund and the termination of the Target Fund as soon as practicable thereafter, will constitute a “reorganization” within the meaning of Section 368(a)(1) of the Code, and the Acquiring Fund and the Target Fund will each be “a party to a reorganization,” within the meaning of Section 368(b) of the Code, with respect to the Reorganization.
(b) No gain or loss will be recognized by the Acquiring Fund upon the receipt of the Assets of the Target Fund solely in exchange for Acquiring Fund Shares and the assumption by the Acquiring Fund of the Target Fund’s Liabilities.
(c) No gain or loss will be recognized by the Target Fund upon the transfer of its Assets to the Acquiring Fund solely in exchange for Acquiring Fund Shares and the assumption by the Acquiring Fund of the Target Fund’s Liabilities or upon the distribution (whether actual or constructive) of the Acquiring Fund Shares so received to the Target Fund Shareholders solely in exchange for such shareholders’ shares of the Target Fund in complete liquidation of the Target Fund.
(d) No gain or loss will be recognized by the Target Fund Shareholders upon the exchange, pursuant to the Reorganization, of all their shares of the Target Fund solely for Acquiring Fund Shares.
(e) The aggregate basis of the Acquiring Fund Shares received by each Target Fund Shareholder pursuant to the Reorganization will be the same as the aggregate basis of the shares of the Target Fund exchanged therefor by such shareholder.
(f) The holding period of the Acquiring Fund Shares received by each Target Fund Shareholder in the Reorganization will include the period during which the shares of the Target Fund exchanged therefor were held by such shareholder, provided such shares of the Target Fund were held as capital assets at the effective time of the Reorganization.
(g) The basis of the Assets of the Target Fund received by the Acquiring Fund will be the same as the basis of such assets in the hands of the Target Fund immediately before the effective time of the Reorganization.
(h) The holding period of the Assets of the Target Fund received by the Acquiring Fund will include the period during which such assets were held by the Target Fund.
No opinion will be expressed as to (1) the effect of the Reorganization on the Acquiring Fund, the Target Fund or any Target Fund Shareholder with respect to any asset (including without limitation any stock held in a passive foreign investment company as defined in Section 1297(a) of the Code) as to which any unrealized gain or loss is required to be recognized for federal income tax purposes (a) at the end of a taxable year or upon the termination thereof, or (b) upon the transfer of such asset regardless of whether such transfer would otherwise be a non-taxable transaction under the Code, or (2) any other federal tax issues (except those set forth above) and all state, local or foreign tax issues of any kind.
Such opinion will be based on customary assumptions and limitations and such representations, without independent verification, as Vedder Price P.C. may reasonably request of the Target Fund and the Acquiring Fund, as well as the representations and warranties made in this Agreement, which counsel may treat as representations and warranties made to it. The Acquiring Trust, on behalf of the Acquiring Fund, and the Corporation, on behalf of the Target Fund, will cooperate to make and certify the accuracy of such representations.
Article IX
EXPENSES
9.1 Except as otherwise provided, all expenses of the Reorganization incurred by the Acquiring Trust, with respect to the Acquiring Fund, and the Corporation, with respect to the Target Fund, whether incurred before or after the date of this Agreement, will be borne by Touchstone, Sentinel and/or their respective affiliates as agreed to by such parties. Such expenses include, without limitation, (a) expenses incurred in connection with the entering into and the carrying out of the provisions of this Agreement; (b) expenses associated with the preparation and filing of the Registration Statement under the 1933 Act covering the Acquiring Fund Shares to be issued pursuant to the provisions of this Agreement; (c) postage; (d) printing; (e) accounting fees; and (f) legal fees. The Acquiring Fund will bear the registration or qualification fees and expenses of preparing and filing such forms as are necessary under applicable state securities laws to qualify the Acquiring Fund Shares to be issued in each state in which the shareholders of the Target Fund are residents as of the date of the mailing of the Proxy Statement/Prospectus to such shareholders.
9.2 Notwithstanding the foregoing, expenses will in any event be paid by the party directly incurring such expenses if and to the extent that the payment by another party of such expenses would result in the disqualification of the Acquiring Fund or the Target Fund, as the case may be, as a regulated investment company within the meaning of Section 851 of the Code.
Article X
TERMINATION
10.1 This Agreement may be terminated by the mutual agreement of the Acquiring Trust, on behalf of the Acquiring Fund, and the Corporation, on behalf of the Target Fund. In addition, either the Acquiring Trust, on behalf of the Acquiring Fund, or the Corporation, on behalf of the Target Fund, may at its option terminate this Agreement at or prior to the Closing because:
(a) of a breach by the other of any representation, warranty or agreement contained in this Agreement to be performed at or prior to the Closing, if not cured within 30 days; or
(b) a condition in this Agreement expressed to be precedent to the obligations of the terminating party has not been met and it reasonably appears that it will not or cannot be met.
10.2 In the event of any such termination, there will be no liability for damages on the part of the Acquiring Fund, the Acquiring Trust, the Target Fund, the Corporation, the trustees or officers of the Acquiring Trust or the directors or officers of the Corporation, to the other party, but Touchstone and Sentinel will bear the expenses incurred by each of them incidental to the preparation and carrying out of this Agreement as provided in paragraph 9.1.
Article XI
AMENDMENTS
11.1 This Agreement may be amended, modified or supplemented in such manner as may be mutually agreed upon in writing by the authorized officers of the Acquiring Trust and the Corporation.
Article XII
HEADINGS; COUNTERPARTS; ENTIRE AGREEMENT; GOVERNING LAW;
ASSIGNMENT; LIMITATION OF LIABILITY
12.1 The Article and paragraph headings contained in this Agreement are for reference purposes only and will not affect in any way the meaning or interpretation of this Agreement.
12.2 This Agreement may be executed in any number of counterparts, each of which will be deemed an original.
12.3 The Acquiring Trust, on behalf of the Acquiring Fund, and the Corporation, on behalf of the Target Fund, agree that neither party has made any representation, warranty or covenant not set forth in this Agreement and that this Agreement constitutes the entire agreement between the parties.
12.4 The representations, warranties and covenants contained in this Agreement or in any document delivered pursuant to or in connection with this Agreement will not survive the consummation of the Reorganization, with the exception of those representations, warranties and covenants that by their express terms require performance following the Closing.
12.5 This Agreement will be governed by and construed in accordance with the laws of the [Commonwealth of Massachusetts/State of Delaware], without giving effect to the conflicts of laws provisions of that state; provided that, in the case of any conflict between those laws and the federal securities laws, the latter will govern.
12.6 This Agreement will bind and inure to the benefit of the Acquiring Trust, on behalf of the Acquiring Fund, and the Corporation, on behalf of the Target Fund, and their respective successors and assigns, but no assignment or transfer of any rights or obligations under this Agreement will be made by the Acquiring Trust or the Corporation without the written consent of the other party. Nothing in this Agreement expressed or implied is intended or will be construed to confer upon or give any person, firm or corporation, other than the parties hereto and their respective successors and permitted assigns, any rights or remedies under or by reason of this Agreement.
12.7 It is understood and agreed that the use of a single agreement is for administrative convenience only and that this Agreement constitutes a separate agreement between the Acquiring Trust, on behalf of each Acquiring Fund, and the Corporation, on behalf of the corresponding Target Fund, as if each party had executed a separate document. No Fund will have any liability for the obligations of any other Fund, and the liabilities of each Fund will be several and not joint.
12.8 [With respect to the Acquiring Trust, the names used in this Agreement refer to the Acquiring Trust and the Acquiring Fund and, the trustees, as trustees but not individually or personally, acting under the Restated Agreement and Declaration of Trust, as amended, which is filed with the Secretary of the Commonwealth of Massachusetts and also on file at the principal office of the Acquiring Trust. The obligations of the Acquiring Trust entered into in the name or on behalf of any of the trustees, representatives or agents of the Acquiring Trust are made not individually, but in such capacities, and are not binding upon any of the trustees, shareholders or representatives of the Acquiring Trust personally, but bind only the property of the Acquiring Fund, and all persons dealing with the Acquiring Fund must look solely to property belonging to the Acquiring Fund for the enforcement of any claims against the Acquiring Fund.]33 [The Acquiring Trust is a Delaware statutory trust organized in series of which the Acquiring Fund constitutes one such series, and the Acquiring Trust is executing this Agreement with respect to the Acquiring Fund only. Pursuant to the Declaration of Trust of the Acquiring Trust and Section 3804(a) of the Act, there is a limitation on liabilities of each series such that (a) the debts, liabilities, obligations and expenses incurred, contracted for or otherwise existing with respect to the Acquiring Fund are enforceable against the assets of the Acquiring Fund only, and not against the assets of the Acquiring Trust generally or the assets of any other series thereof and (b) none of the debts, liabilities, obligations and expenses incurred, contracted for or
| 33 | Include for Massachusetts Acquiring Funds. |
otherwise existing with respect to the Acquiring Trust generally or any other series thereof are enforceable against the assets of the Acquiring Fund.]34
[SIGNATURE PAGE FOLLOWS]
| 34 | Include for Delaware Acquiring Funds. |
IN WITNESS WHEREOF, the parties hereto have duly executed this Agreement, all as of the date first written above.
| | [TOUCHSTONE STRATEGIC TRUST/ TOUCHSTONE FUNDS GROUP TRUST], |
| | on behalf of each of its separate series set forth on
Exhibit A |
| | SENTINEL GROUP FUNDS, INC., |
| | on behalf of each of its separate series set forth on
Exhibit A |
| | For purposes of paragraph 9.1 only: |
| | |
| | TOUCHSTONE ADVISORS, INC. |
[Signature Page to Agreement and Plan of Reorganization]
| | For purposes of paragraphs 8.7 and 9.1 only: |
| | |
| | SENTINEL ASSET MANAGEMENT, INC. |
[Signature Page to Agreement and Plan of Reorganization]
EXHIBIT A
The following table sets forth (i) each Target Fund and its classes of shares and (ii) the corresponding Acquiring Fund and its corresponding classes of shares:
Target Fund, each a series of the
Corporation, and its classes of shares | | Acquiring Fund, each a series of the
Acquiring Trust, and its classes of shares |
| [FUND] | | [FUND] |
| [CLASS] | | [CLASS] |
| [CLASS] | | [CLASS] |
| [CLASS] | | [CLASS] |
| | | |
| [FUND] | | [FUND] |
| [CLASS] | | [CLASS] |
| [CLASS] | | [CLASS] |
| [CLASS] | | [CLASS] |
| | | |
| [FUND] | | [FUND] |
| [CLASS] | | [CLASS] |
| [CLASS] | | [CLASS] |
| [CLASS] | | [CLASS] |
SCHEDULE 1.3
Excluded Liabilities
Notwithstanding any provision of the Agreement to the contrary, in connection with the consummation of the Reorganization, the Acquiring Fund will not assume the following liabilities of the Target Fund:
| · | Any undischarged obligations to the directors of the Corporation under the directors’ deferred compensation plan. |
| · | Any liabilities, costs or charges relating to fee waiver and expense reimbursement arrangements between the Corporation, on behalf of the Target Fund, and Sentinel (including any recoupment by Sentinel or its affiliates of any fees or expenses of the Target Fund previously waived or reimbursed). |
| · | Any liabilities or penalties resulting from the termination of material contracts or other commitments of the Corporation or the Target Fund, including without limitation the contracts set forth on Schedule 7.4. |
SCHEDULE 7.4
Contracts
Exhibit B: Fundamental Investment Limitations
All of the investment policies noted in the tables below are fundamental investment limitations that cannot be changed without the consent of the holders of a majority of the outstanding shares of the applicable Fund. The term “majority of the outstanding shares” means the vote of (i) 67% or more of a Fund’s shares present at a meeting, if more than 50% of the outstanding shares of the Fund are present or represented by proxy, or (ii) more than 50% of a Fund’s outstanding shares, whichever is less.
REORGANIZATION OF THE SENTINEL GOVERNMENT SECURITIES FUND INTO THE TOUCHSTONE ACTIVE BOND FUND
The fundamental investment limitations of the Sentinel Government Securities Fund and the Touchstone Active Bond Fund are set forth in the table below.
| | | Sentinel Government Securities Fund
(Target Fund)(1) | | Touchstone Active Bond Fund
(Acquiring Fund)(2) |
| Borrowing Money | | The Fund may not borrow money. | | The Fund may not engage in borrowing except as permitted by the 1940 Act, any rule, regulation, or order under the 1940 Act or any SEC staff interpretation of the 1940 Act. |
| Senior Securities | | The Fund may not issue senior securities. | | The Fund may not issue senior securities except as permitted by the 1940 Act, any rule, regulation, or order under the 1940 Act or any SEC staff interpretation of the 1940 Act. |
| Underwriting | | The Fund may not underwrite securities of other issuers, except to the extent that the sale of portfolio securities by the Fund may be deemed to be an underwriting. | | The Fund may not underwrite securities issued by other persons, except to the extent that, in connection with the sale or disposition of portfolio securities, the Fund may be deemed to be an underwriter under certain federal securities laws or in connection with investments in other investment companies. |
| Concentration of Investments | | The Fund may not concentrate its investments in a particular industry, as the term “concentrate” is used in the 1940 Act.(3) | | The Fund may not purchase the securities of an issuer (other than securities issued or guaranteed by the United States government, its agencies or its instrumentalities) if, as a result, more than 25% of the Fund’s total assets would be invested in the securities of companies whose principal business activities are in the same industry. |
| Real Estate | | The Fund may not purchase or sell real estate, except that the Fund may, to the extent permitted by applicable law, purchase, hold and sell securities or other instruments that are directly or indirectly secured by, or linked to, real estate or interests therein, securities of real estate investment trusts, mortgage-related securities and securities of companies that invest in real estate or interests therein, and the Fund may purchase, hold and sell real estate as a result of the ownership of securities or other instruments. | | The Fund may not purchase or sell real estate except that the Fund may (1) hold and sell real estate acquired as a result of the Fund’s ownership of securities or other instruments (2) purchase or sell securities or other instruments backed by real estate or interests in real estate and (3) purchase or sell securities of entities or investment vehicles, including real estate investment trusts that invest, deal or otherwise engage in transactions in real estate or interests in real estate. |
| | | Sentinel Government Securities Fund
(Target Fund)(1) | | Touchstone Active Bond Fund
(Acquiring Fund)(2) |
| Commodities | | The Fund may not purchase or sell commodities or commodity contracts. | | The Fund may not purchase or sell physical commodities except that the Fund may (1) hold and sell physical commodities acquired as a result of the Fund’s ownership of securities or other instruments, (2) purchase or sell securities or other instruments backed by physical commodities, (3) purchase or sell options, and (4) purchase or sell futures contracts. |
| Loans | | The Fund may not make loans, provided that this limitation does not affect the ability of the Fund to lend securities, to enter into repurchase agreements or to acquire debt obligations, including without limitation, debt securities, loans, loan participations and assignments, and other forms of debt instruments. | | The Fund may not make loans to other persons except that the Fund may (1) engage in repurchase agreements, (2) lend portfolio securities, (3) purchase debt securities, (4) purchase commercial paper, and (5) enter into any other lending arrangement permitted by the 1940 Act, any rule, regulation, or order under the 1940 Act or any SEC staff interpretation of the 1940 Act. |
| Diversification | | The Fund does not have a fundamental investment limitation concerning diversification. | | The Fund may not purchase securities of an issuer that would cause the Fund to fail to satisfy the diversification requirement for a diversified management company under the 1940 Act, the rules, or regulations or any exemption, as such statute, rules, or regulations may be amended or interpreted from time to time. |
| (1) | The Target Fund may not, except as permitted by the 1940 Act and the rules and regulations thereunder, or interpretations or exemptive or other relief from the SEC, SEC staff or other authority of competent jurisdiction engage in investment activities that are inconsistent with these fundamental investment limitations. |
| (2) | Several of the Acquiring Fund’s fundamental investment limitations include the defined term “1940 Act Laws, Interpretations and Exemptions.” This term means the 1940 Act and the rules and regulations promulgated thereunder, as such statutes, rules and regulations are amended from time to time or are interpreted from time to time by the staff of the SEC and any exemptive order or similar relief applicable to an Acquiring Fund. |
| (3) | For purposes of the Target Fund’s fundamental policies, “industry” is based on the Standard & Poor’s and Morgan Stanley Capital International’s Global Industry Classification Standards (“GICS”). Holdings in pooled investment vehicles, such as exchange-traded funds, or other securities that are not classified by GICS will be classified as the Target Funds’ investment advisor deems reasonable based on the primary characteristics of the security. |
REORGANIZATION OF THE SENTINEL TOTAL RETURN BOND FUND INTO THE TOUCHSTONE ACTIVE BOND FUND
The fundamental investment limitations of the Sentinel Total Return Bond Fund and the Touchstone Active Bond Fund are set forth in the table below.
| | | Sentinel Total Return Bond Fund
(Target Fund)(1) | | Touchstone Active Bond Fund
(Acquiring Fund)(2) |
| Borrowing Money | | The Fund may not borrow money. | | The Fund may not engage in borrowing except as permitted by the 1940 Act, any rule, regulation, or order under the 1940 Act or any SEC staff interpretation of the 1940 Act. |
| Senior Securities | | The Fund may not issue senior securities. | | The Fund may not issue senior securities except as permitted by the 1940 Act, any rule, regulation, or order under the 1940 Act or any SEC staff interpretation of the 1940 Act. |
| Underwriting | | The Fund may not underwrite securities of other issuers, except to the extent that the sale of portfolio securities by the Fund may be deemed to be an underwriting. | | The Fund may not underwrite securities issued by other persons, except to the extent that, in connection with the sale or disposition of portfolio securities, the Fund may be deemed to be an underwriter under certain federal securities laws or in connection with investments in other investment companies. |
| Concentration of Investments | | The Fund may not concentrate its investments in a particular industry, as the term “concentrate” is used in the 1940 Act.(3) | | The Fund may not purchase the securities of an issuer (other than securities issued or guaranteed by the United States government, its agencies or its instrumentalities) if, as a result, more than 25% of the Fund’s total assets would be invested in the securities of companies whose principal business activities are in the same industry. |
| Real Estate | | The Fund may not purchase or sell real estate, except that the Fund may, to the extent permitted by applicable law, purchase, hold and sell securities or other instruments that are directly or indirectly secured by, or linked to, real estate or interests therein, securities of real estate investment trusts, mortgage-related securities and securities of companies that invest in real estate or interests therein, and the Fund may purchase, hold and sell real estate as a result of the ownership of securities or other instruments. | | The Fund may not purchase or sell real estate except that the Fund may (1) hold and sell real estate acquired as a result of the Fund’s ownership of securities or other instruments (2) purchase or sell securities or other instruments backed by real estate or interests in real estate and (3) purchase or sell securities of entities or investment vehicles, including real estate investment trusts that invest, deal or otherwise engage in transactions in real estate or interests in real estate. |
| | | Sentinel Total Return Bond Fund
(Target Fund)(1) | | Touchstone Active Bond Fund
(Acquiring Fund)(2) |
| Commodities | | The Fund may not purchase or sell commodities or commodity contracts. | | The Fund may not purchase or sell physical commodities except that the Fund may (1) hold and sell physical commodities acquired as a result of the Fund’s ownership of securities or other instruments, (2) purchase or sell securities or other instruments backed by physical commodities, (3) purchase or sell options, and (4) purchase or sell futures contracts. |
| Loans | | The Fund may not make loans, provided that this limitation does not affect the ability of the Fund to lend securities, to enter into repurchase agreements or to acquire debt obligations, including without limitation, debt securities, loans, loan participations and assignments, and other forms of debt instruments. | | The Fund may not make loans to other persons except that the Fund may (1) engage in repurchase agreements, (2) lend portfolio securities, (3) purchase debt securities, (4) purchase commercial paper, and (5) enter into any other lending arrangement permitted by the 1940 Act, any rule, regulation, or order under the 1940 Act or any SEC staff interpretation of the 1940 Act. |
| Diversification | | The Fund does not have a fundamental investment limitation concerning diversification. | | The Fund may not purchase securities of an issuer that would cause the Fund to fail to satisfy the diversification requirement for a diversified management company under the 1940 Act, the rules, or regulations or any exemption, as such statute, rules, or regulations may be amended or interpreted from time to time. |
| (1) | The Target Fund may not, except as permitted by the 1940 Act and the rules and regulations thereunder, or interpretations or exemptive or other relief from the SEC, SEC staff or other authority of competent jurisdiction engage in investment activities that are inconsistent with these fundamental investment limitations. |
| (2) | Several of the Acquiring Fund’s fundamental investment limitations include the defined term “1940 Act Laws, Interpretations and Exemptions.” This term means the 1940 Act and the rules and regulations promulgated thereunder, as such statutes, rules and regulations are amended from time to time or are interpreted from time to time by the staff of the SEC and any exemptive order or similar relief applicable to an Acquiring Fund. |
| (3) | For purposes of the Target Fund’s fundamental policies, “industry” is based on the Standard & Poor’s and Morgan Stanley Capital International’s Global Industry Classification Standards (“GICS”). Holdings in pooled investment vehicles, such as exchange-traded funds, or other securities that are not classified by GICS will be classified as the Target Funds’ investment advisor deems reasonable based on the primary characteristics of the security. |
REORGANIZATION OF THE SENTINEL LOW DURATION BOND FUND INTO THE TOUCHSTONE ULTRA SHORT DURATION FIXED INCOME FUND
The fundamental investment limitations of the Sentinel Low Duration Bond Fund and the Touchstone Ultra Short Duration Fixed Income Fund are set forth in the table below.
| | | Sentinel Low Duration Bond Fund
(Target Fund)(1) | | Touchstone Ultra Short Duration Fixed
Income Fund (Acquiring Fund)(2) |
| Borrowing Money | | The Fund may not borrow money. | | The Fund may not borrow money in an amount exceeding 331/3% of the value of its total assets, provided that, for purposes of this limitation, investment strategies which either obligate the Fund to purchase securities or require a fund to segregate assets are not considered to be borrowings; asset coverage of at least 300% is required for all borrowings, except where the Fund has borrowed money for temporary purposes in amounts not exceeding 5% of its total assets; the Fund will not purchase securities while its borrowings exceed 5% of its total assets. |
| Senior Securities | | The Fund may not issue senior securities. | | The Fund may not issue senior securities as defined in the 1940 Act except as permitted by rule, regulation, or order of the SEC. |
| Underwriting | | The Fund may not underwrite securities of other issuers, except to the extent that the sale of portfolio securities by the Fund may be deemed to be an underwriting. | | The Fund may not act as an underwriter of securities of other issuers except as it may be deemed an underwriter in selling a portfolio security. |
| Concentration of Investments | | The Fund may not concentrate its investments in a particular industry, as the term “concentrate” is used in the 1940 Act.(3) | | The Fund may not invest more than 25% of the Fund’s assets in securities issued by companies in a single industry or related group of industries. |
| Real Estate | | The Fund may not purchase or sell real estate, except that the Fund may, to the extent permitted by applicable law, purchase, hold and sell securities or other instruments that are directly or indirectly secured by, or linked to, real estate or interests therein, securities of real estate investment trusts, mortgage-related securities and securities of companies that invest in real estate or interests therein, and the Fund may purchase, hold and sell real estate as a result of the ownership of securities or other instruments. | | The Fund may not purchase or sell real estate, except that the Fund may purchase marketable securities issued by companies which own or invest in real estate (including REITs). |
| | | Sentinel Low Duration Bond Fund
(Target Fund)(1) | | Touchstone Ultra Short Duration Fixed
Income Fund (Acquiring Fund)(2) |
| Commodities | | The Fund may not purchase or sell commodities or commodity contracts. | | The Fund may not purchase or sell physical commodities or commodities contracts, except that the Fund may purchase (i) commodities or commodities contracts; and (ii) commodities contracts relating to financial instruments, such as financial futures contracts and options on such contracts. |
| Loans | | The Fund may not make loans, provided that this limitation does not affect the ability of the Fund to lend securities, to enter into repurchase agreements or to acquire debt obligations, including without limitation, debt securities, loans, loan participations and assignments, and other forms of debt instruments. | | The Fund may not make loans to other persons except through the lending of its portfolio securities, provided that this limitation does not apply to the purchase of debt securities and loan participations or engaging in direct corporate loans or repurchase agreements in accordance with its investment objectives and policies; the loans cannot exceed 331/3% of the Fund’s assets; the Fund may also make loans to other investment companies to the extent permitted by the 1940 Act or any exemptions which may be granted to the Fund by the SEC; for example, at a minimum, the Fund will not make any such loans unless all requirements regarding common control and ownership of Fund shares are met. |
| Diversification | | The Fund does not have a fundamental investment limitation concerning diversification. | | The Fund may not, with respect to 75% of the Fund’s assets: (i) purchase securities of any issuer (except securities issued or guaranteed by the United States government, its agencies or instrumentalities and repurchase agreements involving such securities) if, as a result, more than 5% of the total assets of the Fund would be invested in the securities of such issuer; or (ii) acquire more than 10% of the outstanding voting securities of any one issuer. |
| Other | | — | | The Fund may not invest in interests in oil, gas, or other mineral exploration or development programs and oil, gas, or mineral leases. |
| (1) | The Target Fund may not, except as permitted by the 1940 Act and the rules and regulations thereunder, or interpretations or exemptive or other relief from the SEC, SEC staff or other authority of competent jurisdiction engage in investment activities that are inconsistent with these fundamental investment limitations. |
| | |
| (2) | Several of the Acquiring Fund’s fundamental investment limitations include the defined term “1940 Act Laws, Interpretations and Exemptions.” This term means the 1940 Act and the rules and regulations promulgated thereunder, as such statutes, rules and regulations are amended from time to time or are interpreted from time to time by the staff of the SEC and any exemptive order or similar relief applicable to an Acquiring Fund. |
| | |
| (3) | For purposes of the Target Fund’s fundamental policies, “industry” is based on the Standard & Poor’s and Morgan Stanley Capital International’s Global Industry Classification Standards (“GICS”). Holdings in pooled investment vehicles, such as exchange-traded funds, or other securities that are not classified by GICS will be classified as the Target Funds’ investment advisor deems reasonable based on the primary characteristics of the security. |
REORGANIZATION OF THE SENTINEL MULTI-ASSET INCOME FUND INTO THE TOUCHSTONE FLEXIBLE INCOME FUND
The fundamental investment limitations of the Sentinel Multi-Asset Income Fund and the Touchstone Flexible Income Fund are set forth in the table below.
| | | Sentinel Multi-Asset Income Fund
(Target Fund)(1) | | Touchstone Flexible Income Fund
(Acquiring Fund)(2) |
| Borrowing Money | | The Fund may not borrow money. | | The Fund may not engage in borrowing except as permitted by the Investment Company Act of 1940, any rule, regulation, or order under the Act or any SEC staff interpretation of the Act. |
| Senior Securities | | The Fund may not issue senior securities. | | The Fund may not issue senior securities except as permitted by the Investment Company Act of 1940, any rule, regulation or order under the Act or any SEC staff interpretation of the Act. |
| Underwriting | | The Fund may not underwrite securities of other issuers, except to the extent that the sale of portfolio securities by the Fund may be deemed to be an underwriting. | | The Fund may not underwrite securities issued by other persons, except to the extent that, in connection with the sale or disposition of portfolio securities, the Fund may be deemed to be an underwriter under certain federal securities laws or in connection with investments in other investment companies. |
| Concentration of Investments | | The Fund may not concentrate its investments in a particular industry, as the term “concentrate” is used in the 1940 Act.(3) | | The Fund may not purchase the securities of an issuer (other than securities issued or guaranteed by the United States Government, its agencies or its instrumentalities) if, as a result, more than 25% of the Fund’s total assets would be invested in the securities of companies whose principal business activities are in the same industry. |
| Real Estate | | The Fund may not purchase or sell real estate, except that the Fund may, to the extent permitted by applicable law, purchase, hold and sell securities or other instruments that are directly or indirectly secured by, or linked to, real estate or interests therein, securities of real estate investment trusts, mortgage-related securities and securities of companies that invest in real estate or interests therein, and the Fund may purchase, hold and sell real estate as a result of the ownership of securities or other instruments. | | The Fund may not purchase or sell real estate except that the Fund may (1) hold and sell real estate acquired as a result of the Fund’s ownership of securities or other instruments (2) purchase or sell securities or other instruments backed by real estate or interests in real estate and (3) purchase or sell securities of entities or investment vehicles, including real estate investment trusts that invest, deal or otherwise engage in transactions in real estate or interests in real estate. |
| | | Sentinel Multi-Asset Income Fund
(Target Fund)(1) | | Touchstone Flexible Income Fund
(Acquiring Fund)(2) |
| Commodities | | The Fund may not purchase or sell commodities or commodity contracts. | | The Fund may not purchase or sell physical commodities except that the Fund may (1) hold and sell physical commodities acquired as a result of the Fund’s ownership of securities or other instruments, (2) purchase or sell securities or other instruments backed by physical commodities, (3) purchase or sell options, and (4) purchase or sell futures contracts. |
| Loans | | The Fund may not make loans, provided that this limitation does not affect the ability of the Fund to lend securities, to enter into repurchase agreements or to acquire debt obligations, including without limitation, debt securities, loans, loan participations and assignments, and other forms of debt instruments. | | The Fund may not make loans to other persons except that the Fund may (1) engage in repurchase agreements, (2) lend portfolio securities, (3) purchase debt securities, (4) purchase commercial paper, and (5) enter into any other lending arrangement permitted by the Investment Company Act of 1940, any rule, regulation or order under the Act or any SEC staff interpretation of the Act. |
| Diversification | | The Fund does not have a fundamental investment limitation concerning diversification. | | The Fund may not purchase securities of an issuer that would cause the Fund to fail to satisfy the diversification requirement for a diversified management company under the 1940 Act, the rules or regulations thereunder or any exemption therefrom, as such statute, rules or regulations may be amended or interpreted from time to time. |
| (1) | The Target Fund may not, except as permitted by the 1940 Act and the rules and regulations thereunder, or interpretations or exemptive or other relief from the SEC, SEC staff or other authority of competent jurisdiction engage in investment activities that are inconsistent with these fundamental investment limitations. |
| (2) | Several of the Acquiring Fund’s fundamental investment limitations include the defined term “1940 Act Laws, Interpretations and Exemptions.” This term means the 1940 Act and the rules and regulations promulgated thereunder, as such statutes, rules and regulations are amended from time to time or are interpreted from time to time by the staff of the SEC and any exemptive order or similar relief applicable to an Acquiring Fund. |
| (3) | For purposes of the Target Fund’s fundamental policies, “industry” is based on the Standard & Poor’s and Morgan Stanley Capital International’s Global Industry Classification Standards (“GICS”). Holdings in pooled investment vehicles, such as exchange-traded funds, or other securities that are not classified by GICS will be classified as the Target Funds’ investment advisor deems reasonable based on the primary characteristics of the security. |
REORGANIZATION OF THE SENTINEL SUSTAINABLE CORE OPPORTUNITIES FUND INTO THE TOUCHSTONE SUSTAINABILITY AND IMPACT EQUITY FUND
The fundamental investment limitations of the Sentinel Sustainable Core Opportunities Fund and the Touchstone Sustainability and Impact Equity Fund are set forth in the table below.
| | | Sentinel Sustainable Core Opportunities
Fund (Target Fund)(1) | | Touchstone Sustainability and Impact
Equity Fund (Acquiring Fund)(2) |
| Borrowing Money | | The Fund may not borrow money. | | The Fund may not engage in borrowing except as permitted by the Investment Company Act of 1940, any rule, regulation, or order under the Act or any SEC staff interpretation of the Act. |
| Senior Securities | | The Fund may not issue senior securities. | | The Fund may not issue senior securities except as permitted by the Investment Company Act of 1940, any rule, regulation or order under the Act or any SEC staff interpretation of the Act. |
| Underwriting | | The Fund may not underwrite securities of other issuers, except to the extent that the sale of portfolio securities by the Fund may be deemed to be an underwriting. | | The Fund may not underwrite securities issued by other persons, except to the extent that, in connection with the sale or disposition of portfolio securities, the Fund may be deemed to be an underwriter under certain federal securities laws or in connection with investments in other investment companies. |
| Concentration of Investments | | The Fund may not concentrate its investments in a particular industry, as the term “concentrate” is used in the 1940 Act.(3) | | The Fund may not purchase the securities of an issuer (other than securities issued or guaranteed by the United States Government, its agencies or its instrumentalities) if, as a result, more than 25% of the Fund’s total assets would be invested in the securities of companies whose principal business activities are in the same industry. |
| Real Estate | | The Fund may not purchase or sell real estate, except that the Fund may, to the extent permitted by applicable law, purchase, hold and sell securities or other instruments that are directly or indirectly secured by, or linked to, real estate or interests therein, securities of real estate investment trusts, mortgage-related securities and securities of companies that invest in real estate or interests therein, and the Fund may purchase, hold and sell real estate as a result of the ownership of securities or other instruments. | | The Fund may not purchase or sell real estate except that the Fund may (1) hold and sell real estate acquired as a result of the Fund’s ownership of securities or other instruments (2) purchase or sell securities or other instruments backed by real estate or interests in real estate and (3) purchase or sell securities of entities or investment vehicles, including real estate investment trusts that invest, deal or otherwise engage in transactions in real estate or interests in real estate. |
| | | Sentinel Sustainable Core Opportunities
Fund (Target Fund)(1) | | Touchstone Sustainability and Impact
Equity Fund (Acquiring Fund)(2) |
| Commodities | | The Fund may not purchase or sell commodities or commodity contracts. | | The Fund may not purchase or sell physical commodities except that the Fund may (1) hold and sell physical commodities acquired as a result of the Fund’s ownership of securities or other instruments, (2) purchase or sell securities or other instruments backed by physical commodities, (3) purchase or sell options, and (4) purchase or sell futures contracts. |
| Loans | | The Fund may not make loans, provided that this limitation does not affect the ability of the Fund to lend securities, to enter into repurchase agreements or to acquire debt obligations, including without limitation, debt securities, loans, loan participations and assignments, and other forms of debt instruments. | | The Fund may not make loans to other persons except that the Fund may (1) engage in repurchase agreements, (2) lend portfolio securities, (3) purchase debt securities, (4) purchase commercial paper, and (5) enter into any other lending arrangement permitted by the Investment Company Act of 1940, any rule, regulation or order under the Act or any SEC staff interpretation of the Act. |
| Diversification | | The Fund does not have a fundamental investment limitation concerning diversification. | | The Fund may not purchase securities of an issuer that would cause the Fund to fail to satisfy the diversification requirement for a diversified management company under the 1940 Act, the rules or regulations thereunder or any exemption therefrom, as such statute, rules or regulations may be amended or interpreted from time to time. |
| (1) | The Target Fund may not, except as permitted by the 1940 Act and the rules and regulations thereunder, or interpretations or exemptive or other relief from the SEC, SEC staff or other authority of competent jurisdiction engage in investment activities that are inconsistent with these fundamental investment limitations. |
| | |
| (2) | Several of the Acquiring Fund’s fundamental investment limitations include the defined term “1940 Act Laws, Interpretations and Exemptions.” This term means the 1940 Act and the rules and regulations promulgated thereunder, as such statutes, rules and regulations are amended from time to time or are interpreted from time to time by the staff of the SEC and any exemptive order or similar relief applicable to an Acquiring Fund. |
| | |
| (3) | For purposes of the Target Fund’s fundamental policies, “industry” is based on the Standard & Poor’s and Morgan Stanley Capital International’s Global Industry Classification Standards (“GICS”). Holdings in pooled investment vehicles, such as exchange-traded funds, or other securities that are not classified by GICS will be classified as the Target Funds’ investment advisor deems reasonable based on the primary characteristics of the security. |
REORGANIZATION OF THE SENTINEL BALANCED FUND INTO THE TOUCHSTONE BALANCED FUND
The fundamental investment limitations of the Sentinel Balanced Fund and the Touchstone Balanced Fund are set forth in the table below.
| | | Sentinel Balanced Fund
(Target Fund)(1) | | Touchstone Balanced Fund
(Acquiring Fund)(2) |
| Borrowing Money | | The Fund may not borrow money. | | The Fund may not borrow money, except as permitted by the 1940 Act Laws, Interpretations and Exemptions. |
| Senior Securities | | The Fund may not issue senior securities. | | The Fund may not issue senior securities, except as permitted by the 1940 Act Laws, Interpretations and Exemptions. |
| Underwriting | | The Fund may not underwrite securities of other issuers, except to the extent that the sale of portfolio securities by the Fund may be deemed to be an underwriting. | | The Fund may not underwrite the securities of other issuers. This restriction does not prevent the Fund from engaging in transactions involving the acquisition, disposition or resale of its portfolio securities, regardless of whether the Fund may be considered an underwriter under the Securities Act of 1933, as amended. |
| Concentration of Investments | | The Fund may not concentrate its investments in a particular industry, as the term “concentrate” is used in the 1940 Act.(3) | | The Fund will not make investments that will result in the concentration (as that term may be defined or interpreted by the 1940 Act Laws, Interpretations and Exemptions) of its investments in the securities of issuers primarily engaged in the same industry. This restriction does not limit the Fund’s investments in (i) obligations issued or guaranteed by the U.S. Government, its agencies or instrumentalities, (ii) tax-exempt obligations issued by governments or political subdivisions of governments or (iii) repurchase agreements collateralized by such obligations. |
| Real Estate | | The Fund may not purchase or sell real estate, except that the Fund may, to the extent permitted by applicable law, purchase, hold and sell securities or other instruments that are directly or indirectly secured by, or linked to, real estate or interests therein, securities of real estate investment trusts, mortgage-related securities and securities of companies that invest in real estate or interests therein, and the Fund may purchase, hold and sell real estate as a result of the ownership of securities or other instruments. | | The Fund may not purchase or sell real estate unless acquired as a result of ownership of securities or other instruments. This restriction does not prevent the Fund from investing in issuers that invest, deal or otherwise engage in transactions in real estate or interests therein, or investing in securities that are secured by real estate or interests therein. |
| | | Sentinel Balanced Fund
(Target Fund)(1) | | Touchstone Balanced Fund
(Acquiring Fund)(2) |
| Commodities | | The Fund may not purchase or sell commodities or commodity contracts. | | The Fund may not purchase or sell physical commodities unless acquired as a result of ownership of securities or other instruments. This restriction does not prevent the Fund from engaging in transactions involving futures contracts and options thereon or investing in securities that are secured by physical commodities. |
| Loans | | The Fund may not make loans, provided that this limitation does not affect the ability of the Fund to lend securities, to enter into repurchase agreements or to acquire debt obligations, including without limitation, debt securities, loans, loan participations and assignments, and other forms of debt instruments. | | The Fund may not make personal loans or loans of its assets to persons who control or are under common control with the Fund, except to the extent permitted by the 1940 Act Laws, Interpretations and Exemptions. This restriction does not prevent the Fund from, among other things, purchasing debt obligations, entering repurchase agreements, lending portfolio securities or investing in loans, including assignments and participation interests. |
| Diversification | | The Fund does not have a fundamental investment limitation concerning diversification. | | The Fund is a “diversified company” as defined in the 1940 Act. This means that the Fund will not purchase the securities of any issuer if, as a result, the Fund would fail to be a diversified company within the meaning of the 1940 Act Laws, Interpretations and Exemptions. This restriction does not prevent the Fund from purchasing the securities of other investment companies to the extent permitted by the 1940 Act Laws, Interpretations and Exemptions. |
| (1) | The Target Fund may not, except as permitted by the 1940 Act and the rules and regulations thereunder, or interpretations or exemptive or other relief from the SEC, SEC staff or other authority of competent jurisdiction engage in investment activities that are inconsistent with these fundamental investment limitations. |
| (2) | Several of the Acquiring Fund’s fundamental investment limitations include the defined term “1940 Act Laws, Interpretations and Exemptions.” This term means the 1940 Act and the rules and regulations promulgated thereunder, as such statutes, rules and regulations are amended from time to time or are interpreted from time to time by the staff of the SEC and any exemptive order or similar relief applicable to an Acquiring Fund. |
| (3) | For purposes of the Target Fund’s fundamental policies, “industry” is based on the Standard & Poor’s and Morgan Stanley Capital International’s Global Industry Classification Standards (“GICS”). Holdings in pooled investment vehicles, such as exchange-traded funds, or other securities that are not classified by GICS will be classified as the Target Funds’ investment advisor deems reasonable based on the primary characteristics of the security. |
REORGANIZATION OF THE SENTINEL COMMON STOCK FUND INTO THE TOUCHSTONE LARGE CAP FOCUSED FUND
The fundamental investment limitations of the Sentinel Common Stock Fund and the Touchstone Large Cap Focused Fund are set forth in the table below.
| | | Sentinel Common Stock Fund
(Target Fund)(1) | | Touchstone Large Cap Focused Fund
(Acquiring Fund)(2) |
| | | | | |
| Borrowing Money | | The Fund may not borrow money. | | The Fund may not borrow money, except as permitted by the 1940 Act Laws, Interpretations and Exemptions. |
| | | | | |
| Senior Securities | | The Fund may not issue senior securities. | | The Fund may not issue senior securities, except as permitted by the 1940 Act Laws, Interpretations and Exemptions. |
| | | | | |
| Underwriting | | The Fund may not underwrite securities of other issuers, except to the extent that the sale of portfolio securities by the Fund may be deemed to be an underwriting. | | The Fund may not underwrite the securities of other issuers. This restriction does not prevent the Fund from engaging in transactions involving the acquisition, disposition or resale of its portfolio securities, regardless of whether the Fund may be considered an underwriter under the Securities Act of 1933, as amended. |
| | | | | |
| Concentration of Investments | | The Fund may not concentrate its investments in a particular industry, as the term “concentrate” is used in the 1940 Act.(3) | | The Fund will not make investments that will result in the concentration (as that term may be defined or interpreted by the 1940 Act Laws, Interpretations and Exemptions) of its investments in the securities of issuers primarily engaged in the same industry. This restriction does not limit the Fund’s investments in (i) obligations issued or guaranteed by the U.S. Government, its agencies or instrumentalities, (ii) tax-exempt obligations issued by governments or political subdivisions of governments or (iii) repurchase agreements collateralized by such obligations. |
| | | | | |
| Real Estate | | The Fund may not purchase or sell real estate, except that the Fund may, to the extent permitted by applicable law, purchase, hold and sell securities or other instruments that are directly or indirectly secured by, or linked to, real estate or interests therein, securities of real estate investment trusts, mortgage-related securities and securities of companies that invest in real estate or interests therein, and the Fund may purchase, hold and sell real estate as a result of the ownership of securities or other instruments. | | The Fund may not purchase or sell real estate unless acquired as a result of ownership of securities or other instruments. This restriction does not prevent the Fund from investing in issuers that invest, deal or otherwise engage in transactions in real estate or interests therein, or investing in securities that are secured by real estate or interests therein. |
| | | Sentinel Common Stock Fund
(Target Fund)(1) | | Touchstone Large Cap Focused Fund
(Acquiring Fund)(2) |
| | | | | |
| Commodities | | The Fund may not purchase or sell commodities or commodity contracts. | | The Fund may not purchase or sell physical commodities unless acquired as a result of ownership of securities or other instruments. This restriction does not prevent the Fund from engaging in transactions involving futures contracts and options thereon or investing in securities that are secured by physical commodities. |
| | | | | |
| Loans | | The Fund may not make loans, provided that this limitation does not affect the ability of the Fund to lend securities, to enter into repurchase agreements or to acquire debt obligations, including without limitation, debt securities, loans, loan participations and assignments, and other forms of debt instruments. | | The Fund may not make personal loans or loans of its assets to persons who control or are under common control with the Fund, except to the extent permitted by the 1940 Act Laws, Interpretations and Exemptions. This restriction does not prevent the Fund from, among other things, purchasing debt obligations, entering repurchase agreements, lending portfolio securities or investing in loans, including assignments and participation interests. |
| | | | | |
| Diversification | | The Fund does not have a fundamental investment limitation concerning diversification. | | The Fund does not have a fundamental investment limitation concerning diversification. |
| (1) | The Target Fund may not, except as permitted by the 1940 Act and the rules and regulations thereunder, or interpretations or exemptive or other relief from the SEC, SEC staff or other authority of competent jurisdiction engage in investment activities that are inconsistent with these fundamental investment limitations. |
| (2) | Several of the Acquiring Fund’s fundamental investment limitations include the defined term “1940 Act Laws, Interpretations and Exemptions.” This term means the 1940 Act and the rules and regulations promulgated thereunder, as such statutes, rules and regulations are amended from time to time or are interpreted from time to time by the staff of the SEC and any exemptive order or similar relief applicable to an Acquiring Fund. |
| (3) | For purposes of the Target Fund’s fundamental policies, “industry” is based on the Standard & Poor’s and Morgan Stanley Capital International’s Global Industry Classification Standards (“GICS”). Holdings in pooled investment vehicles, such as exchange-traded funds, or other securities that are not classified by GICS will be classified as the Target Funds’ investment advisor deems reasonable based on the primary characteristics of the security. |
REORGANIZATION OF THE SENTINEL INTERNATIONAL EQUITY FUND INTO THE TOUCHSTONE INTERNATIONAL EQUITY FUND
The fundamental investment limitations of the Sentinel International Equity Fund and the Touchstone International Equity Fund are set forth in the table below.
| | | Sentinel International Equity Fund
(Target Fund)(1) | | Touchstone International Equity Fund
(Acquiring Fund)(2) |
| | | | | |
| Borrowing Money | | The Fund may not borrow money. | | The Fund may not borrow money, except as permitted by the 1940 Act Laws, Interpretations and Exemptions. |
| | | | | |
| Senior Securities | | The Fund may not issue senior securities. | | The Fund may not issue senior securities, except as permitted by the 1940 Act Laws, Interpretations and Exemptions. |
| | | | | |
| Underwriting | | The Fund may not underwrite securities of other issuers, except to the extent that the sale of portfolio securities by the Fund may be deemed to be an underwriting. | | The Fund may not underwrite the securities of other issuers. This restriction does not prevent the Fund from engaging in transactions involving the acquisition, disposition or resale of its portfolio securities, regardless of whether the Fund may be considered an underwriter under the Securities Act of 1933, as amended. |
| | | | | |
| Concentration of Investments | | The Fund may not concentrate its investments in a particular industry, as the term “concentrate” is used in the 1940 Act.(3) | | The Fund will not make investments that will result in the concentration (as that term may be defined or interpreted by the 1940 Act Laws, Interpretations and Exemptions) of its investments in the securities of issuers primarily engaged in the same industry. This restriction does not limit the Fund’s investments in (i) obligations issued or guaranteed by the U.S. Government, its agencies or instrumentalities, (ii) tax-exempt obligations issued by governments or political subdivisions of governments or (iii) repurchase agreements collateralized by such obligations. |
| | | | | |
| Real Estate | | The Fund may not purchase or sell real estate, except that the Fund may, to the extent permitted by applicable law, purchase, hold and sell securities or other instruments that are directly or indirectly secured by, or linked to, real estate or interests therein, securities of real estate investment trusts, mortgage-related securities and securities of companies that invest in real estate or interests therein, and the Fund may purchase, hold and sell real estate as a result of the ownership of securities or other instruments. | | The Fund may not purchase or sell real estate unless acquired as a result of ownership of securities or other instruments. This restriction does not prevent the Fund from investing in issuers that invest, deal or otherwise engage in transactions in real estate or interests therein, or investing in securities that are secured by real estate or interests therein. |
| | | Sentinel International Equity Fund
(Target Fund)(1) | | Touchstone International Equity Fund
(Acquiring Fund)(2) |
| Commodities | | The Fund may not purchase or sell commodities or commodity contracts. | | The Fund may not purchase or sell physical commodities unless acquired as a result of ownership of securities or other instruments. This restriction does not prevent the Fund from engaging in transactions involving futures contracts and options thereon or investing in securities that are secured by physical commodities. |
| | | | | |
| Loans | | The Fund may not make loans, provided that this limitation does not affect the ability of the Fund to lend securities, to enter into repurchase agreements or to acquire debt obligations, including without limitation, debt securities, loans, loan participations and assignments, and other forms of debt instruments. | | The Fund may not make personal loans or loans of its assets to persons who control or are under common control with the Fund, except to the extent permitted by the 1940 Act Laws, Interpretations and Exemptions. This restriction does not prevent the Fund from, among other things, purchasing debt obligations, entering repurchase agreements, lending portfolio securities or investing in loans, including assignments and participation interests. |
| | | | | |
| Diversification | | The Fund does not have a fundamental investment limitation concerning diversification. | | The Fund is a “diversified company” as defined in the 1940 Act. This means that the Fund will not purchase the securities of any issuer if, as a result, the Fund would fail to be a diversified company within the meaning of the 1940 Act Laws, Interpretations and Exemptions. This restriction does not prevent the Fund from purchasing the securities of other investment companies to the extent permitted by the 1940 Act Laws, Interpretations and Exemptions. |
| (1) | The Target Fund may not, except as permitted by the 1940 Act and the rules and regulations thereunder, or interpretations or exemptive or other relief from the SEC, SEC staff or other authority of competent jurisdiction engage in investment activities that are inconsistent with these fundamental investment limitations. |
| (2) | Several of the Acquiring Fund’s fundamental investment limitations include the defined term “1940 Act Laws, Interpretations and Exemptions.” This term means the 1940 Act and the rules and regulations promulgated thereunder, as such statutes, rules and regulations are amended from time to time or are interpreted from time to time by the staff of the SEC and any exemptive order or similar relief applicable to an Acquiring Fund. |
| (3) | For purposes of the Target Fund’s fundamental policies, “industry” is based on the Standard & Poor’s and Morgan Stanley Capital International’s Global Industry Classification Standards (“GICS”). Holdings in pooled investment vehicles, such as exchange-traded funds, or other securities that are not classified by GICS will be classified as the Target Funds’ investment advisor deems reasonable based on the primary characteristics of the security. |
REORGANIZATION OF THE SENTINEL SMALL COMPANY FUND INTO THE TOUCHSTONE SMALL COMPANY FUND
The fundamental investment limitations of the Sentinel Small Company Fund and the Touchstone Small Company Fund are set forth in the table below.
| | | Sentinel Small Company Fund
(Target Fund)(1) | | Touchstone Small Company Fund
(Acquiring Fund)(2) |
| | | | | |
| Borrowing Money | | The Fund may not borrow money. | | The Fund may not borrow money, except as permitted by the 1940 Act Laws, Interpretations and Exemptions. |
| | | | | |
| Senior Securities | | The Fund may not issue senior securities. | | The Fund may not issue senior securities, except as permitted by the 1940 Act Laws, Interpretations and Exemptions. |
| | | | | |
| Underwriting | | The Fund may not underwrite securities of other issuers, except to the extent that the sale of portfolio securities by the Fund may be deemed to be an underwriting. | | The Fund may not underwrite the securities of other issuers. This restriction does not prevent the Fund from engaging in transactions involving the acquisition, disposition or resale of its portfolio securities, regardless of whether the Fund may be considered an underwriter under the Securities Act of 1933, as amended. |
| | | | | |
| Concentration of Investments | | The Fund may not concentrate its investments in a particular industry, as the term “concentrate” is used in the 1940 Act.(3) | | The Fund will not make investments that will result in the concentration (as that term may be defined or interpreted by the 1940 Act Laws, Interpretations and Exemptions) of its investments in the securities of issuers primarily engaged in the same industry. This restriction does not limit the Fund’s investments in (i) obligations issued or guaranteed by the U.S. Government, its agencies or instrumentalities, (ii) tax-exempt obligations issued by governments or political subdivisions of governments or (iii) repurchase agreements collateralized by such obligations. |
| | | | | |
| Real Estate | | The Fund may not purchase or sell real estate, except that the Fund may, to the extent permitted by applicable law, purchase, hold and sell securities or other instruments that are directly or indirectly secured by, or linked to, real estate or interests therein, securities of real estate investment trusts, mortgage-related securities and securities of companies that invest in real estate or interests therein, and the Fund may purchase, hold and sell real estate as a result of the ownership of securities or other instruments. | | The Fund may not purchase or sell real estate unless acquired as a result of ownership of securities or other instruments. This restriction does not prevent the Fund from investing in issuers that invest, deal or otherwise engage in transactions in real estate or interests therein, or investing in securities that are secured by real estate or interests therein. |
| | | Sentinel Small Company Fund
(Target Fund)(1) | | Touchstone Small Company Fund
(Acquiring Fund)(2) |
| | | | | |
| Commodities | | The Fund may not purchase or sell commodities or commodity contracts. | | The Fund may not purchase or sell physical commodities unless acquired as a result of ownership of securities or other instruments. This restriction does not prevent the Fund from engaging in transactions involving futures contracts and options thereon or investing in securities that are secured by physical commodities. |
| | | | | |
| Loans | | The Fund may not make loans, provided that this limitation does not affect the ability of the Fund to lend securities, to enter into repurchase agreements or to acquire debt obligations, including without limitation, debt securities, loans, loan participations and assignments, and other forms of debt instruments. | | The Fund may not make personal loans or loans of its assets to persons who control or are under common control with the Fund, except to the extent permitted by the 1940 Act Laws, Interpretations and Exemptions. This restriction does not prevent the Fund from, among other things, purchasing debt obligations, entering repurchase agreements, lending portfolio securities or investing in loans, including assignments and participation interests. |
| | | | | |
| Diversification | | The Fund does not have a fundamental investment limitation concerning diversification. | | The Fund is a “diversified company” as defined in the 1940 Act. This means that the Fund will not purchase the securities of any issuer if, as a result, the Fund would fail to be a diversified company within the meaning of the 1940 Act Laws, Interpretations and Exemptions. This restriction does not prevent the Fund from purchasing the securities of other investment companies to the extent permitted by the 1940 Act Laws, Interpretations and Exemptions. |
| (1) | The Target Fund may not, except as permitted by the 1940 Act and the rules and regulations thereunder, or interpretations or exemptive or other relief from the SEC, SEC staff or other authority of competent jurisdiction engage in investment activities that are inconsistent with these fundamental investment limitations. |
| (2) | Several of the Acquiring Fund’s fundamental investment limitations include the defined term “1940 Act Laws, Interpretations and Exemptions.” This term means the 1940 Act and the rules and regulations promulgated thereunder, as such statutes, rules and regulations are amended from time to time or are interpreted from time to time by the staff of the SEC and any exemptive order or similar relief applicable to an Acquiring Fund. |
| (3) | For purposes of the Target Fund’s fundamental policies, “industry” is based on the Standard & Poor’s and Morgan Stanley Capital International’s Global Industry Classification Standards (“GICS”). Holdings in pooled investment vehicles, such as exchange-traded funds, or other securities that are not classified by GICS will be classified as the Target Funds’ investment advisor deems reasonable based on the primary characteristics of the security. |
Exhibit C: Control Persons and Principal Holders of Securities
The shareholders of the Target Funds at the close of business on the Record Date will be entitled to be present and vote at the Special Meeting with respect to shares of the Target Funds owned as of the Record Date. As of the Record Date, the total number of shares of each class of the Target Funds outstanding and entitled to vote and the corresponding number of votes was as follows:
Target Fund and
Share Class | | Number of
Shares | | Net Asset
Value /
Number of
Votes |
| Sentinel Government Securities Fund | | | | |
| Class A | | [•] | | [•] |
| Class C | | [•] | | [•] |
| Class I | | [•] | | [•] |
| Total | | [•] | | [•] |
| Sentinel Total Return Bond Fund | | | | |
| Class A | | [•] | | [•] |
| Class C | | [•] | | [•] |
| Class I | | [•] | | [•] |
| Class R3 | | [•] | | [•] |
| Class R6 | | [•] | | [•] |
| Total | | [•] | | [•] |
| Sentinel Low Duration Bond Fund | | | | |
| Class A | | [•] | | [•] |
| Class I | | [•] | | [•] |
| Class S | | [•] | | [•] |
| Total | | [•] | | [•] |
| Sentinel Multi-Asset Income Fund | | | | |
| Class A | | [•] | | [•] |
| Class C | | [•] | | [•] |
| Class I | | [•] | | [•] |
| Total | | [•] | | [•] |
| Sentinel Sustainable Core Opportunities Fund | | | | |
| Class A | | [•] | | [•] |
| Class I | | [•] | | [•] |
| Total | | [•] | | [•] |
| Sentinel Balanced Fund | | | | |
| Class A | | [•] | | [•] |
| Class C | | [•] | | [•] |
| Class I | | [•] | | [•] |
| Total | | [•] | | [•] |
| Sentinel Common Stock Fund | | | | |
| Class A | | [•] | | [•] |
| Class C | | [•] | | [•] |
| Class I | | [•] | | [•] |
| Class R6 | | [•] | | [•] |
| Total | | [•] | | [•] |
Target Fund and
Share Class | | Number of
Shares | | Net Asset
Value /
Number of
Votes |
| Sentinel International Equity Fund | | | | |
| Class A | | [•] | | [•] |
| Class C | | [•] | | [•] |
| Class I | | [•] | | [•] |
| Total | | [•] | | [•] |
| Sentinel Small Company Fund | | | | |
| Class A | | [•] | | [•] |
| Class C | | [•] | | [•] |
| Class I | | [•] | | [•] |
| Class R6 | | [•] | | [•] |
| Total | | [•] | | [•] |
[As of the Record Date, the Officers and Directors of the Sentinel Funds owned less than 1% of any class of any Target Fund.] As of the Record Date, the Officers and Trustees of the Touchstone Funds owned less than 1% of any class of any Acquiring Fund that is an Operating Fund. As of the Record Date, the following persons owned of record or beneficially 5% or more of the outstanding shares of a class of a Fund. A shareholder who owns beneficially 25% or more of the outstanding securities of a Fund is presumed to “control” the Fund as defined in the 1940 Act. Such control may affect the voting rights of other shareholders.
Target Fund and
Share Class | | Name and Address | | Number of Shares | | Percentage of
Ownership of Class
of Target Fund
before the
Reorganization | | Percentage of
Ownership of Class
of the Acquiring
Fund after the
Reorganization |
| Sentinel Government Securities Fund | | | | | | | | |
| Class A | | | | | | | | |
| | | [•] | | [•] | | [•]% | | [•]% |
| | | [•] | | [•] | | [•]% | | [•]% |
| Class C | | | | | | | | |
| | | [•] | | [•] | | [•]% | | [•]% |
| | | [•] | | [•] | | [•]% | | [•]% |
| Class I | | | | | | | | |
| | | [•] | | [•] | | [•]% | | [•]% |
| | | [•] | | [•] | | [•]% | | [•]% |
| Sentinel Total Return Bond Fund | | | | | | | | |
| Class A | | | | | | | | |
| | | [•] | | [•] | | [•]% | | [•]% |
| | | [•] | | [•] | | [•]% | | [•]% |
| Class C | | | | | | | | |
| | | [•] | | [•] | | [•]% | | [•]% |
| | | [•] | | [•] | | [•]% | | [•]% |
| Class I | | | | | | | | |
| | | [•] | | [•] | | [•]% | | [•]% |
| | | [•] | | [•] | | [•]% | | [•]% |
| Class R3 | | | | | | | | |
| | | [•] | | [•] | | [•]% | | [•]% |
| | | [•] | | [•] | | [•]% | | [•]% |
| Class R6 | | | | | | | | |
| | | [•] | | [•] | | [•]% | | [•]% |
| | | [•] | | [•] | | [•]% | | [•]% |
Target Fund and
Share Class | | Name and Address | | Number of Shares | | Percentage of
Ownership of Class
of Target Fund
before the
Reorganization | | Percentage of
Ownership of Class
of the Acquiring
Fund after the
Reorganization |
| Sentinel Low Duration Bond Fund | | | | | | | | |
| Class A | | | | | | | | |
| | | [•] | | [•] | | [•]% | | [•]% |
| | | [•] | | [•] | | [•]% | | [•]% |
| Class I | | | | | | | | |
| | | [•] | | [•] | | [•]% | | [•]% |
| | | [•] | | [•] | | [•]% | | [•]% |
| Class S | | | | | | | | |
| | | [•] | | [•] | | [•]% | | [•]% |
| | | [•] | | [•] | | [•]% | | [•]% |
| Sentinel Multi-Asset Income Fund | | | | | | | | |
| Class A | | | | | | | | |
| | | [•] | | [•] | | [•]% | | [•]% |
| | | [•] | | [•] | | [•]% | | [•]% |
| Class C | | | | | | | | |
| | | [•] | | [•] | | [•]% | | [•]% |
| | | [•] | | [•] | | [•]% | | [•]% |
| Class I | | | | | | | | |
| | | [•] | | [•] | | [•]% | | [•]% |
| | | [•] | | [•] | | [•]% | | [•]% |
| Sentinel Sustainable Core Opportunities Fund | | | | | | | | |
| Class A | | | | | | | | |
| | | [•] | | [•] | | [•]% | | [•]% |
| | | [•] | | [•] | | [•]% | | [•]% |
| Class I | | | | | | | | |
| | | [•] | | [•] | | [•]% | | [•]% |
| | | [•] | | [•] | | [•]% | | [•]% |
| Sentinel Balanced Fund | | | | | | | | |
| Class A | | | | | | | | |
| | | [•] | | [•] | | [•]% | | [•]% |
| | | [•] | | [•] | | [•]% | | [•]% |
| | | [•] | | [•] | | [•]% | | [•]% |
| Class C | | | | | | | | |
| | | [•] | | [•] | | [•]% | | [•]% |
| | | [•] | | [•] | | [•]% | | [•]% |
| | | [•] | | [•] | | [•]% | | [•]% |
| Class I | | | | | | | | |
| | | [•] | | [•] | | [•]% | | [•]% |
| | | [•] | | [•] | | [•]% | | [•]% |
| | | [•] | | [•] | | [•]% | | [•]% |
Target Fund and
Share Class | | Name and Address | | Number of Shares | | Percentage of
Ownership of Class
of Target Fund
before the
Reorganization | | Percentage of
Ownership of Class
of the Acquiring
Fund after the
Reorganization |
| Sentinel Common Stock Fund | | | | | | | | |
| Class A | | | | | | | | |
| | | [•] | | [•] | | [•]% | | [•]% |
| | | [•] | | [•] | | [•]% | | [•]% |
| | | [•] | | [•] | | [•]% | | [•]% |
| Class C | | | | | | | | |
| | | [•] | | [•] | | [•]% | | [•]% |
| | | [•] | | [•] | | [•]% | | [•]% |
| | | [•] | | [•] | | [•]% | | [•]% |
| Class I | | | | | | | | |
| | | [•] | | [•] | | [•]% | | [•]% |
| | | [•] | | [•] | | [•]% | | [•]% |
| | | [•] | | [•] | | [•]% | | [•]% |
| Class R6 | | | | | | | | |
| | | [•] | | [•] | | [•]% | | [•]% |
| | | [•] | | [•] | | [•]% | | [•]% |
| | | [•] | | [•] | | [•]% | | [•]% |
| Sentinel International Equity Fund | | | | | | | | |
| Class A | | | | | | | | |
| | | [•] | | [•] | | [•]% | | [•]% |
| | | [•] | | [•] | | [•]% | | [•]% |
| | | [•] | | [•] | | [•]% | | [•]% |
| Class C | | | | | | | | |
| | | [•] | | [•] | | [•]% | | [•]% |
| | | [•] | | [•] | | [•]% | | [•]% |
| | | [•] | | [•] | | [•]% | | [•]% |
| Class I | | | | | | | | |
| | | [•] | | [•] | | [•]% | | [•]% |
| | | [•] | | [•] | | [•]% | | [•]% |
| | | [•] | | [•] | | [•]% | | [•]% |
| Sentinel Small Company Fund | | | | | | | | |
| Class A | | | | | | | | |
| | | [•] | | [•] | | [•]% | | [•]% |
| | | [•] | | [•] | | [•]% | | [•]% |
| | | [•] | | [•] | | [•]% | | [•]% |
| Class C | | | | | | | | |
| | | [•] | | [•] | | [•]% | | [•]% |
| | | [•] | | [•] | | [•]% | | [•]% |
| | | [•] | | [•] | | [•]% | | [•]% |
| Class I | | | | | | | | |
| | | [•] | | [•] | | [•]% | | [•]% |
| | | [•] | | [•] | | [•]% | | [•]% |
| | | [•] | | [•] | | [•]% | | [•]% |
| Class R6 | | | | | | | | |
| | | [•] | | [•] | | [•]% | | [•]% |
| | | [•] | | [•] | | [•]% | | [•]% |
| | | [•] | | [•] | | [•]% | | [•]% |
Acquiring Fund and
Share Class | | Name and Address | | Number of Shares | | Percentage of
Ownership of Class
of Acquiring Fund
before the
Reorganization | | Percentage of
Ownership of Class
of the Acquiring
Fund after the
Reorganization |
| Touchstone Active Bond Fund | | | | | | | | |
| Class A | | | | | | | | |
| Class C | | | | | | | | |
| Class Y | | | | | | | | |
| Institutional Class | | | | | | | | |
| Touchstone Ultra Short Duration Fixed Income Fund | | | | | | | | |
| Class A | | | | | | | | |
| Class C | | | | | | | | |
| Class Y | | | | | | | | |
| Class Z | | | | | | | | |
| Institutional Class | | | | | | | | |
| Touchstone Flexible Income Fund | | | | | | | | |
| Class A | | | | | | | | |
| Class C | | | | | | | | |
| Class Y | | | | | | | | |
| Institutional Class | | | | | | | | |
| Touchstone Sustainability and Impact Equity Fund | | | | | | | | |
| Class A | | | | | | | | |
| Class B | | | | | | | | |
| Class C | | | | | | | | |
| Class Y | | | | | | | | |
| Institutional Class | | | | | | | | |
Exhibit D: Prior Performance For Similar Accounts Managed by Fort Washington for the Touchstone Large Cap Focused Fund
The following table sets forth composite performance data relating to the historical performance of all accounts managed by Fort Washington for the periods indicated with investment objectives, policies, strategies, and risks substantially similar to those of the Touchstone Large Cap Focused Fund. The data is provided to illustrate the past performance of the sub-advisor in managing substantially similar accounts and does not represent the performance of the Touchstone Funds.
Performance Comparison
Fort Washington Large Cap Focused Equity Composite
Average Annual Total Returns
For the period ended December 31, 2016
| | | 1 Year | | 3 Years | | Since Composite
Inception (10/1/2013) |
| Fort Washington Large Cap Focused Equity Strategy | | 13.71% | | 8.90% | | 12.34% |
| Standard & Poor’s 500 Index (reflects no deductions for fees, expenses or taxes) | | 11.96% | | 8.87% | | 11.53% |
| | | | | | | |
The Large Cap Focused Equity Composite (the “Composite”), which is managed by Fort Washington, represents the investment performance track record of Fort Washington’s large cap focused equity strategy, which is the strategy that will be used to manage the Touchstone Large Cap Focused Fund. The accounts comprising the Composite are not subject to the same types of expenses to which the Touchstone Large Cap Focused Fund is subject, certain investment limitations, diversification requirements, and other restrictions imposed by the Investment Company Act of 1940, as amended, and the Internal Revenue Code of 1986, as amended. Thus, the performance results for the Composite could have been adversely affected if the account had been regulated as an investment company under federal securities and tax laws.
The Composite’s returns are net of actual fees and expenses and reflect the reinvestment of all income. Actual fees are not reflective of the expenses of the Touchstone Funds and may vary depending on, among other things, the applicable fee schedule and portfolio size. All returns are expressed in U.S. dollars. Past performance of the Composite is not indicative of future results. As with any investment there is always the potential for gains as well as the possibility of losses.
[FORM OF PROXY CARD]
EVERY SHAREHOLDER’S VOTE IS IMPORTANT
| | EASY VOTING OPTIONS: |
| | | |
| | | VOTE ON THE INTERNET Log on to: www.proxyvote.com Follow the on-screen instructions. If
you vote by internet, you do not have
to return your voting instruction card. |
| | | |
| | | VOTE BY PHONE Please call us toll-free at 1-800-690-
6903, and follow the instructions
provided. If you vote by telephone,
you do not have to return your voting
instruction card |
| | | |
| | | VOTE BY MAIL Complete, sign and date your voting
instruction card and return it promptly
in the envelope provided. |
Please detach at perforation before mailing.
| | SENTINEL GROUP FUNDS, INC.
SENTINEL GOVERNMENT SECURITIES FUND
JOINT SPECIAL MEETING OF SHAREHOLDERS
TO BE HELD ON AUGUST 23, 2017 | PROXY |
THIS PROXY IS BEING SOLICITED BY THE BOARD OF DIRECTORS OF SENTINEL GROUP FUNDS, INC. The undersigned shareholder(s) of Sentinel Government Securities Fund, a series of Sentinel Group Funds, Inc., revoking previous proxies, hereby appoints Gregory D. Teese and Lisa F. Muller, or any one of them true and lawful attorneys with power of substitution of each, to vote all shares of Sentinel Government Securities Fund which the undersigned is entitled to vote, at the Joint Special Meeting of Shareholders to be held on August 23, 2017, at 11:00 a.m., Eastern time, at the offices of Sentinel Group Funds, Inc., One National Life Drive, Montpelier, Vermont 05604, and at any adjournment or postponement thereof as indicated on the reverse side. In their discretion, the proxy holders named above are authorized to vote upon such other matters as may properly come before the meeting or any adjournment or postponement thereof.
Receipt of the Notice of the Special Meeting and the accompanying Joint Proxy Statement/Prospectus is hereby acknowledged. The shares of Sentinel Government Securities Fund represented hereby will be voted as indicated or FOR the proposal if no choice is indicated.
| | VOTE VIA THE INTERNET: www.proxyvote.com
VOTE VIA THE TELEPHONE: 1-800-690-6903 |
| | | | |
| | Note: Please sign exactly as your name(s) appear(s) on this card. When signing as attorney, executor, administrator, trustee, guardian or as custodian for a minor, please sign your name and give your full title as such. If signing on behalf of a corporation, please sign the full corporate name and your name and indicate your title. If you are a partner signing for a partnership, please sign the partnership name, your name and indicate your title. Joint owners should each sign these instructions. Please sign, date and return. |
| | |
| | Signature and Title, if applicable |
| | |
| | Signature (if held jointly) |
| | | |
| | Date | [CFS Code] |
EVERY SHAREHOLDER’S VOTE IS IMPORTANT
Important Notice Regarding the Availability of Proxy Materials for
Sentinel Government Securities Fund
Shareholders Meeting to Be Held on August 23, 2017.
The Joint Proxy Statement/Prospectus for this meeting is available at:
Sentinelinvestments.com
IF YOU VOTE ON THE INTERNET OR BY TELEPHONE,
YOU NEED NOT RETURN THIS PROXY CARD
Please detach at perforation before mailing.
In their discretion, the proxy holders are authorized to vote upon such other matters as may properly come before the meeting or any adjournments or postponements thereof.
Properly executed proxies will be voted as specified. If no other specification is made, such shares will be voted “FOR” the proposal.
TO VOTE, MARK BLOCKS BELOW IN BLUE OR BLACK INK. Example: █
| 1. | To approve an Agreement and Plan of Reorganization (the “Plan”) providing for (i) the transfer of all the assets of Sentinel Government Securities Fund (the “Target Fund”), a series of Sentinel Group Funds, Inc., to Touchstone Active Bond Fund (the “Acquiring Fund”), a series of Touchstone Funds Group Trust, in exchange solely for shares of the Acquiring Fund as set forth in the Plan and the assumption by the Acquiring Fund of all the liabilities (other than certain excluded liabilities) of the Target Fund, as described in the Plan; (ii) the pro rata distribution, by class, to the Target Fund’s shareholders of the shares of the Acquiring Fund as set forth in the Plan; and (iii) the termination of the Target Fund. | | FOR o | AGAINST o | ABSTAIN o |
WE URGE YOU TO SIGN, DATE AND MAIL THIS PROXY PROMPTLY
[FORM OF PROXY CARD]
EVERY SHAREHOLDER’S VOTE IS IMPORTANT
| | EASY VOTING OPTIONS: |
| | | |
| | | VOTE ON THE INTERNET Log on to: www.proxyvote.com Follow the on-screen instructions. If
you vote by internet, you do not have
to return your voting instruction card. |
| | | |
| | | VOTE BY PHONE Please call us toll-free at 1-800-690-
6903, and follow the instructions
provided. If you vote by telephone,
you do not have to return your voting
instruction card |
| | | |
| | | VOTE BY MAIL Complete, sign and date your voting
instruction card and return it promptly
in the envelope provided. |
Please detach at perforation before mailing.
| | SENTINEL GROUP FUNDS, INC.
SENTINEL TOTAL RETURN BOND FUND
JOINT SPECIAL MEETING OF SHAREHOLDERS
TO BE HELD ON AUGUST 23, 2017 | PROXY |
THIS PROXY IS BEING SOLICITED BY THE BOARD OF DIRECTORS OF SENTINEL GROUP FUNDS, INC. The undersigned shareholder(s) of Sentinel Total Return Bond Fund, a series of Sentinel Group Funds, Inc., revoking previous proxies, hereby appoints Gregory D. Teese and Lisa F. Muller, or any one of them true and lawful attorneys with power of substitution of each, to vote all shares of Sentinel Total Return Bond Fund which the undersigned is entitled to vote, at the Joint Special Meeting of Shareholders to be held on August 23, 2017, at 11:00 a.m., Eastern time, at the offices of Sentinel Group Funds, Inc., One National Life Drive, Montpelier, Vermont 05604, and at any adjournment or postponement thereof as indicated on the reverse side. In their discretion, the proxy holders named above are authorized to vote upon such other matters as may properly come before the meeting or any adjournment or postponement thereof.
Receipt of the Notice of the Special Meeting and the accompanying Joint Proxy Statement/Prospectus is hereby acknowledged. The shares of Sentinel Total Return Bond Fund represented hereby will be voted as indicated or FOR the proposal if no choice is indicated.
| | VOTE VIA THE INTERNET: www.proxyvote.com
VOTE VIA THE TELEPHONE: 1-800-690-6903 |
| | | | |
| | Note: Please sign exactly as your name(s) appear(s) on this card. When signing as attorney, executor, administrator, trustee, guardian or as custodian for a minor, please sign your name and give your full title as such. If signing on behalf of a corporation, please sign the full corporate name and your name and indicate your title. If you are a partner signing for a partnership, please sign the partnership name, your name and indicate your title. Joint owners should each sign these instructions. Please sign, date and return. |
| | |
| | Signature and Title, if applicable |
| | |
| | Signature (if held jointly) |
| | | |
| | Date | [CFS Code] |
EVERY SHAREHOLDER’S VOTE IS IMPORTANT
Important Notice Regarding the Availability of Proxy Materials for
Sentinel Total Return Bond Fund
Shareholders Meeting to Be Held on August 23, 2017.
The Joint Proxy Statement/Prospectus for this meeting is available at:
Sentinelinvestments.com
IF YOU VOTE ON THE INTERNET OR BY TELEPHONE,
YOU NEED NOT RETURN THIS PROXY CARD
Please detach at perforation before mailing.
In their discretion, the proxy holders are authorized to vote upon such other matters as may properly come before the meeting or any adjournments or postponements thereof.
Properly executed proxies will be voted as specified. If no other specification is made, such shares will be voted “FOR” the proposal.
TO VOTE, MARK BLOCKS BELOW IN BLUE OR BLACK INK. Example: █
| 1. | To approve an Agreement and Plan of Reorganization (the “Plan”) providing for (i) the transfer of all the assets of Sentinel Total Return Bond Fund (the “Target Fund”), a series of Sentinel Group Funds, Inc., to Touchstone Active Bond Fund (the “Acquiring Fund”), a series of Touchstone Funds Group Trust, in exchange solely for shares of the Acquiring Fund as set forth in the Plan and the assumption by the Acquiring Fund of all the liabilities (other than certain excluded liabilities) of the Target Fund, as described in the Plan; (ii) the pro rata distribution, by class, to the Target Fund’s shareholders of the shares of the Acquiring Fund as set forth in the Plan; and (iii) the termination of the Target Fund. | | FOR o | AGAINST o | ABSTAIN o |
WE URGE YOU TO SIGN, DATE AND MAIL THIS PROXY PROMPTLY
[FORM OF PROXY CARD]
EVERY SHAREHOLDER’S VOTE IS IMPORTANT
| | EASY VOTING OPTIONS: |
| | | |
| | | VOTE ON THE INTERNET Log on to: www.proxyvote.com Follow the on-screen instructions. If
you vote by internet, you do not have
to return your voting instruction card. |
| | | |
| | | VOTE BY PHONE Please call us toll-free at 1-800-690-
6903, and follow the instructions
provided. If you vote by telephone,
you do not have to return your voting
instruction card |
| | | |
| | | VOTE BY MAIL Complete, sign and date your voting
instruction card and return it promptly
in the envelope provided. |
Please detach at perforation before mailing.
| | SENTINEL GROUP FUNDS, INC.
SENTINEL LOW DURATION BOND FUND
JOINT SPECIAL MEETING OF SHAREHOLDERS
TO BE HELD ON AUGUST 23, 2017 | PROXY |
THIS PROXY IS BEING SOLICITED BY THE BOARD OF DIRECTORS OF SENTINEL GROUP FUNDS, INC. The undersigned shareholder(s) of Sentinel Low Duration Bond Fund, a series of Sentinel Group Funds, Inc., revoking previous proxies, hereby appoints Gregory D. Teese and Lisa F. Muller, or any one of them true and lawful attorneys with power of substitution of each, to vote all shares of Sentinel Low Duration Bond Fund which the undersigned is entitled to vote, at the Joint Special Meeting of Shareholders to be held on August 23, 2017, at 11:00 a.m., Eastern time, at the offices of Sentinel Group Funds, Inc., One National Life Drive, Montpelier, Vermont 05604, and at any adjournment or postponement thereof as indicated on the reverse side. In their discretion, the proxy holders named above are authorized to vote upon such other matters as may properly come before the meeting or any adjournment or postponement thereof.
Receipt of the Notice of the Special Meeting and the accompanying Joint Proxy Statement/Prospectus is hereby acknowledged. The shares of Sentinel Low Duration Bond Fund represented hereby will be voted as indicated or FOR the proposal if no choice is indicated.
| | VOTE VIA THE INTERNET: www.proxyvote.com
VOTE VIA THE TELEPHONE: 1-800-690-6903 |
| | | | |
| | Note: Please sign exactly as your name(s) appear(s) on this card. When signing as attorney, executor, administrator, trustee, guardian or as custodian for a minor, please sign your name and give your full title as such. If signing on behalf of a corporation, please sign the full corporate name and your name and indicate your title. If you are a partner signing for a partnership, please sign the partnership name, your name and indicate your title. Joint owners should each sign these instructions. Please sign, date and return. |
| | |
| | Signature and Title, if applicable |
| | |
| | Signature (if held jointly) |
| | | |
| | Date | [CFS Code] |
EVERY SHAREHOLDER’S VOTE IS IMPORTANT
Important Notice Regarding the Availability of Proxy Materials for
Sentinel Low Duration Bond Fund
Shareholders Meeting to Be Held on August 23, 2017.
The Joint Proxy Statement/Prospectus for this meeting is available at:
Sentinelinvestments.com
IF YOU VOTE ON THE INTERNET OR BY TELEPHONE,
YOU NEED NOT RETURN THIS PROXY CARD
Please detach at perforation before mailing.
In their discretion, the proxy holders are authorized to vote upon such other matters as may properly come before the meeting or any adjournments or postponements thereof.
Properly executed proxies will be voted as specified. If no other specification is made, such shares will be voted “FOR” the proposal.
TO VOTE, MARK BLOCKS BELOW IN BLUE OR BLACK INK. Example: █
| 1. | To approve an Agreement and Plan of Reorganization (the “Plan”) providing for (i) the transfer of all the assets of Sentinel Low Duration Bond Fund (the “Target Fund”), a series of Sentinel Group Funds, Inc., to Touchstone Ultra Short Duration Fixed Income (the “Acquiring Fund”), a series of Touchstone Funds Group Trust, in exchange solely for shares of the Acquiring Fund as set forth in the Plan and the assumption by the Acquiring Fund of all the liabilities (other than certain excluded liabilities) of the Target Fund, as described in the Plan; (ii) the pro rata distribution, by class, to the Target Fund’s shareholders of the shares of the Acquiring Fund as set forth in the Plan; and (iii) the termination of the Target Fund. | | FOR o | AGAINST o | ABSTAIN o |
WE URGE YOU TO SIGN, DATE AND MAIL THIS PROXY PROMPTLY
The information contained in this Statement of Additional Information is not complete and may be changed. We may not sell these securities until the registration statement filed with the Securities and Exchange Commission is effective. This Statement of Additional Information is not an offer to sell these securities, and it is not a solicitation of an offer to buy these securities, in any jurisdiction where the offer or sale is not permitted.
SUBJECT TO COMPLETION,
DATED MAY 30, 2017
STATEMENT OF ADDITIONAL INFORMATION
relating to the reorganization of the
target funds and acquiring funds
(as defined below)
TOUCHSTONE FUNDS GROUP TRUST
303 Broadway, Suite 1100
Cincinnati, Ohio 45202
800.543.0407
and
Sentinel GROUP funds, inc.
One National Life Drive
Montpelier, Vermont 05604
802.229.7410
[•], 2017
This Statement of Additional Information (“SAI”) is not a prospectus but should be read in conjunction with the Joint Proxy Statement/Prospectus dated [__], 2017 relating specifically to the reorganization of each of Sentinel Government Securities Fund, Sentinel Low Duration Bond Fund, and Sentinel Total Return Bond Fund (each a “Target Fund” and collectively, the “Target Funds”), each a series of Sentinel Group Funds, Inc. (“Sentinel Funds”), into a corresponding mutual fund advised by Touchstone Advisors, Inc. (“Touchstone Advisors”) as set forth in the table below under the heading Acquiring Funds (each an “Acquiring Fund” and collectively, the “Acquiring Funds”).
Target Funds | | Acquiring Funds |
| Sentinel Government Securities Fund | | Touchstone Active Bond Fund |
| Sentinel Total Return Bond Fund | | Touchstone Active Bond Fund |
| Sentinel Low Duration Bond Fund | | Touchstone Ultra Short Duration Fixed Income Fund |
This SAI and the related Joint Proxy Statement/Prospectus are provided for use in connection with the joint special meeting of shareholders of the Target Funds to be held at the offices of the Sentinel Funds, One National Life Drive, Montpelier, Vermont 05604, on August 23, 2017 at 11:00 a.m., Eastern time, and any adjournment or postponement thereof (the “Special Meeting”). At the Special Meeting, shareholders of each Target Fund will be asked to approve the reorganization (the “Reorganization”) of such Target Fund into the corresponding Acquiring Fund as described in the Joint Proxy Statement/Prospectus. The Target Funds and the Acquiring Funds are referred to herein individually as a “Fund” and collectively as the “Funds.” Copies of the Joint Proxy Statement/Prospectus
may be obtained at no charge by calling or writing to Sentinel Group Funds, Inc. or Touchstone Funds Group Trust at the addresses or telephone number shown above.
Further information about the Funds is contained in each Fund’s Statement of Additional Information. The Acquiring Funds’ Statement of Additional Information, dated January 30, 2017, (as filed January 27, 2017) (File Nos. 033-70958 and 811-08104), as supplemented through the date of this SAI, is incorporated herein by reference only insofar as it relates to the Acquiring Funds. The Target Funds’ Statement of Additional Information, dated March 30, 2017 (as filed March 30, 2017) (File Nos. 002-10685 and 811-00214), as supplemented through the date of this SAI, is incorporated herein by reference only insofar as it relates to the Target Funds. No other parts are incorporated by reference herein.
The audited financial statements and related independent registered public accounting firm’s report for the Acquiring Funds are contained in the Acquiring Funds’ Annual Report for the fiscal year ended September 30, 2016 (as filed November 30, 2016) (File No. 811-08104), and the unaudited financial statements for the Acquiring Funds are contained in the Acquiring Funds’ Semi-Annual Report for the six-month period ended March 31, 2017 (as filed [•], 2017) (File No. 811-08104), each of which is incorporated herein by reference only insofar as they relate to the Acquiring Funds. No other parts of the Acquiring Funds’ Annual Report or Semi-Annual Report are incorporated by reference herein.
The audited financial statements and related independent registered public accounting firm’s report for the Target Funds are contained in the Target Funds’ Annual Report for the fiscal year ended November 30, 2016 (as filed February 6, 2017) (File No. 811-00214), which is incorporated herein by reference only insofar as they relate to the Target Funds. No other parts of the Target Fund’s Annual Report are incorporated by reference herein.
The date of this Statement of Additional Information is [__], 2017.
Appendix A
Pro Forma Financial Information (Unaudited)
Pro Forma Financial Statements for the Reorganization of Sentinel Government Securities Fund into the Touchstone Active Bond Fund
Pro Forma Statement of Assets and Liabilities
As of March 31, 2017 (Unaudited)
| | | Sentinel
Government
Securities
Fund | | | Touchstone
Active Bond
Fund | | | Pro Forma
Adjustments | | | Proforma
Combined
Touchstone
Active Bond
Fund | |
| Assets | | | | | | | | | | | | |
| Investments, at cost | | $ | 185,740,231 | | | $ | 101,703,072 | | | | (250,827 | )(1) | | $ | 287,192,476 | |
| Investments, at market value (A) | | $ | 186,644,318 | | | $ | 103,304,990 | | | | (250,827 | )(1) | | $ | 289,698,481 | |
| Cash deposits held at prime broker (B) | | | - | | | | 23,588 | | | | | | | | 23,588 | |
| Dividends and interest receivable | | | 545,488 | | | | 682,649 | | | | | | | | 1,228,137 | |
| Receivable for capital shares sold | | | 92,448 | | | | 85,374 | | | | | | | | 177,822 | |
| Receivable for investments sold | | | - | | | | 395,712 | | | | | | | | 395,712 | |
| Receivable for variation margin on futures contracts | | | - | | | | 8,930 | | | | | | | | 8,930 | |
| Receivable for securities lending income | | | - | | | | 294 | | | | | | | | 294 | |
| Other assets | | | - | | | | 32,178 | | | | | | | | 32,178 | |
| Total Assets | | | 187,282,254 | | | | 104,533,715 | | | | (250,827 | ) | | | 291,565,142 | |
| Liabilities | | | | | | | | | | | | | | | | |
| Bank Overdrafts | | | - | | | | 13,914 | | | | | | | | 13,914 | |
| Payable to Transfer Agent | | | 24,291 | | | | 37,595 | | | | | | | | 61,886 | |
| Payable for return of collateral for securities on loan | | | - | | | | 609,596 | | | | | | | | 609,596 | |
| Payable for capital shares redeemed | | | 112,006 | | | | 145,476 | | | | | | | | 257,482 | |
| Payable for investments purchased | | | 5,727,393 | | | | 182,573 | | | | | | | | 5,909,966 | |
| Payable to Investment Advisor | | | 69,574 | | | | 27,471 | | | | | | | | 97,045 | |
| Payable to other affiliates | | | 44,693 | | | | 5,850 | | | | | | | | 50,543 | |
| Payable to Trustees and Compliance Fees | | | 382 | | | | 3,914 | | | | | | | | 4,296 | |
| Payable for Professional Services | | | 25,615 | | | | 15,462 | | | | | | | | 41,077 | |
| Deferred Compensation | | | 250,827 | | | | - | | | | (250,827 | )(1) | | | - | |
| Other accrued expenses and liabilities | | | 46,427 | | | | 30,983 | | | | | | | | 77,410 | |
| Total Liabilities | | | 6,301,208 | | | | 1,072,834 | | | | (250,827 | ) | | | 7,123,215 | |
| Net Assets | | $ | 180,981,046 | | | $ | 103,460,881 | | | | - | | | $ | 284,441,927 | |
| Net assets consist of: | | | | | | | | | | | | | | | | |
| Par Value | | $ | 186,742 | (C) | | $ | 100,381 | (D) | | | | | | $ | 287,123 | |
| Paid-in capital | | | 239,183,367 | | | | 110,833,964 | | | | | | | | 350,017,331 | |
| Accumulated net investment income (loss) | | | (781,561 | ) | | | (12,866 | ) | | | | | | | (794,427 | ) |
| Accumulated net realized gains (losses) on investments, foreign currency transactions, written options and securities sold short | | | (58,511,589 | ) | | | (9,071,098 | ) | | | | | | | (67,582,687 | ) |
| Net unrealized appreciation (depreciation) on investments, foreign currency transactions, written options and securities sold short | | | 904,087 | | | | 1,610,500 | | | | | | | | 2,514,587 | |
| Net Assets applicable to shares outstanding | | $ | 180,981,046 | | | | 103,460,881 | | | | | | | $ | 284,441,927 | |
| Pricing of Class A Shares | | | | | | | | | | | | | | | | |
| Net assets attributable to Class A shares | | $ | 140,159,042 | | | $ | 23,444,475 | | | | | | | $ | 163,603,517 | |
| Shares of beneficial interest outstanding | | | 14,464,515 | (C) | | | 2,264,218 | (D) | | | (928,250 | ) | | | 15,800,483 | |
| Net asset value and redemption price per share | | $ | 9.69 | (E) | | $ | 10.35 | (F) | | | | | | $ | 10.35 | (F) |
| Maximum sales charge - Class A shares | | | 2.25% | | | | 4.75% | | | | | | | | 4.75% | |
| Maximum offering price per share | | $ | 9.91 | | | $ | 10.87 | | | | | | | $ | 10.87 | |
| | | | | | | | | | | | | | | | | |
| Pricing of Class C Shares | | | | | | | | | | | | | | | | |
| Net assets attributable to Class C shares | | $ | 17,251,841 | | | $ | 5,466,677 | | | | | | | $ | 22,718,518 | |
| Shares of beneficial interest outstanding | | | 1,777,935 | (C) | | | 570,446 | (D) | | | 22,289 | | | | 2,370,670 | |
| Net asset value, offering price and redemption price per share(G) | | $ | 9.70 | | | $ | 9.58 | | | | | | | $ | 9.58 | |
| Pricing of Class Y Shares | | | | | | | | | | | | | | | | |
| Net assets attributable to Class Y shares(H) | | $ | 23,570,163 | | | $ | 67,760,762 | | | | | | | $ | 91,330,925 | |
| Shares of beneficial interest outstanding | | | 2,431,719 | (C) | | | 6,547,101 | (D) | | | (154,350 | ) | | | 8,824,470 | |
| | | Sentinel
Government
Securities
Fund | | | Touchstone
Active Bond
Fund | | | Pro Forma
Adjustments | | | Proforma
Combined
Touchstone
Active Bond
Fund | |
| Net asset value, offering price and redemption price per share(G) | | $ | 9.69 | | | $ | 10.35 | | | | | | | $ | 10.35 | |
| | | | | | | | | | | | | | | | | |
| Pricing of Institutional Class Shares | | | | | | | | | | | | | | | | |
| Net assets attributable to Institutional Class shares | | | | | | $ | 6,788,967 | | | | | | | $ | 6,788,967 | |
| Shares of beneficial interest outstanding | | | | | | | 656,297 | (D) | | | - | | | | 656,297 | |
| Net asset value, offering price and redemption price per share | | | | | | $ | 10.34 | | | | | | | $ | 10.34 | |
(A) Includes market value of securities on loan of: $573,430 for the Touchstone Active Bond Fund and the Pro Forma Combined Touchstone Active Bond Fund.
(B) Represents segregated cash for futures contracts
(C) Limited number of shares authorized, par value of $.01
(D) Unlimited number of shares authorized, par value of $.01
(E) There is no sales load on subsciptions of $500,000 or more. Redemptions that were part of a $500,000 or more subscription may be subject to a contingent deferred sales load if redeemed within a one-year period from the date of purchase.
(F) There is no sales load on subsciptions of $1 million or more. Redemptions that were part of a $1 million or more subscription may be subject to a contingent deferred sales load if redeemed within a one-year period from the date of purchase.
(G) Redemption price per share varies by length of time shares are held due to the terms of the contingent deferred sales charge.
(H) Sentinel Government Securities Fund Class I shares will convert to Touchstone Active Bond Fund Class Y shares.
(1) Deferred compensation plan will be redeemed prior to conversion.
Pro Forma Statement of Operations
For the twelve months ending March 31, 2017 (Unaudited)
| | | Sentinel
Government
Securities
Fund | | | Touchstone
Active Bond
Fund | | | Pro Forma
Adjustments | | | Proforma
Combined
Touchstone
Active Bond
Fund | |
| Investment Income | | | | | | | | | | | | | | | | |
| Dividends | | $ | 11,956 | | | $ | 40,516 | | | $ | - | | | $ | 52,472 | |
| Interest Income | | | 5,248,844 | | | | 3,691,667 | | | | - | | | | 8,940,511 | |
| Income from Securities loaned | | | - | | | | 1,082 | | | | - | | | | 1,082 | |
| Total Investment Income | | | 5,260,800 | | | | 3,733,265 | | | | - | | | | 8,994,065 | |
| Expenses | | | | | | | | | | | | | | | | |
| Investment advisory fees | | | 957,656 | | | | 437,642 | | | | (116,075 | )(A) | | | 1,279,223 | |
| Accounting and Administration services | | | 78,475 | | | | 158,645 | | | | 230,701 | (A) | | | 467,821 | |
| Compliance fees and expenses | | | 16,743 | | | | 2,856 | | | | (17,209 | )(B) | | | 2,390 | |
| Custody fees | | | 25,525 | | | | 44,338 | | | | (10,000 | )(B) | | | 59,863 | |
| Professional fees | | | 33,050 | | | | 32,858 | | | | (33,050 | )(B) | | | 32,858 | |
| Transfer Agent fees, Class A | | | 223,587 | | | | 34,505 | | | | - | | | | 258,092 | |
| Transfer Agent fees, Class C | | | 26,885 | | | | 7,534 | | | | - | | | | 34,419 | |
| Transfer Agent fees, Class Y | | | 26,340 | | | | 99,337 | | | | - | (C) | | | 125,677 | |
| Transfer Agent fees, Institutional Class | | | - | | | | 145 | | | | - | | | | 145 | |
| Registration Fees, Class A | | | 20,229 | | | | 12,201 | | | | (12,201 | )(B) | | | 20,229 | |
| Registration Fees, Class C | | | 11,748 | | | | 11,037 | | | | (11,037 | )(B) | | | 11,748 | |
| Registration Fees, Class Y | | | 10,348 | | | | 14,117 | | | | (10,348 | )(B)(C) | | | 14,117 | |
| Registration Fees, Institutional Class | | | - | | | | 10,572 | | | | - | | | | 10,572 | |
| Reports to Shareholders, Class A | | | 2,557 | | | | 3,131 | | | | - | | | | 5,688 | |
| Reports to Shareholders, Class C | | | 183 | | | | 2,021 | | | | - | | | | 2,204 | |
| Reports to Shareholders, Class Y | | | 109 | | | | 2,503 | | | | - | (C) | | | 2,612 | |
| Reports to Shareholders, Class Institutional Class | | | - | | | | 1,729 | | | | - | | | | 1,729 | |
| Distribution expenses, Class A | | | 323,175 | | | | 63,280 | | | | 81,571 | (D) | | | 468,026 | |
| Distribution expenses, Class C | | | 219,279 | | | | 63,529 | | | | - | | | | 282,808 | |
| Trustee fees | | | 46,028 | | | | 16,205 | | | | (48,752 | )(B) | | | 13,481 | |
| Other expenses | | | 19,701 | | | | 94,055 | | | | (411 | )(B) | | | 113,345 | |
| Total Expenses | | | 2,041,618 | | | | 1,112,240 | | | | 53,189 | | | | 3,207,047 | |
| Fees waived and/or reimbursed by the Advisor and/or Affiliates | | | - | | | | (279,694 | ) | | | (84,531 | )(E) | | | (364,225 | ) |
| Net Expenses | | | 2,041,618 | | | | 832,546 | | | | (31,342 | ) | | | 2,842,822 | |
| Net Investment Income (Loss) | | | 3,219,182 | | | | 2,900,719 | | | | 31,342 | | | | 6,151,243 | |
| Realized and Unrealized Gains (Losses) on Investments | | | | | | | | | | | | | | | | |
| Net realized gains (losses) on investments | | | (339,503 | ) | | | 16,937 | | | | - | | | | (322,566 | ) |
| Net realized gains (losses) on futures contracts | | | - | | | | 5,651 | | | | - | | | | 5,651 | |
| Net realized gains (losses) on swap agreements | | | - | | | | (558 | ) | | | - | | | | (558 | ) |
| Net realized gains (losses) on securities sold short | | | (77,500 | ) | | | - | | | | - | | | | (77,500 | ) |
| Net change in unrealized appreciation (depreciation) on investments | | | (4,791,154 | ) | | | 441,820 | | | | - | | | | (4,349,334 | ) |
| Net change in unrealized appreciation (depreciation) on foreign currency transactions | | | - | | | | 3,861 | | | | - | | | | 3,861 | |
| Net change in unrealized appreciation (depreciation) on futures contracts | | | - | | | | 8,539 | | | | - | | | | 8,539 | |
| Net Realized and Unrealized Gains (Losses) on Investments | | | (5,208,157 | ) | | | 476,250 | | | | - | | | | (4,731,907 | ) |
| Change in Net Assets Resulting from Operations | | $ | (1,988,975 | ) | | $ | 3,376,969 | | | $ | 31,342 | | | $ | 1,419,336 | |
(A) Reflects the impact of applying the Acquiring Fund’s Investment Advisory and Administration fee rates following the Reorganization to the combined fund’s average net assets.
(B) Reflects the anticipated reduction of certain duplicative expenses eliminated as a result of the Reorganization.
(C) Holders of Sentinel Government Securities Fund Class I shares will receive Class Y shares of the Touchstone Active Bond Fund upon closing of the reorganization.
(D) Reflects the impact of applying the Acquiring Fund’s 12b-1 distribution fee rate following the Reorganization to the combined fund’s average net assets.
(E) Reflects the increase (decrease) in expense reimbursement payments the advisor would have made to the combined fund if the Reorganization had occurred on the first day of the 12-month period ended March 31, 2017.
(F) Reflects the anticipated increase of certain expenses as a result of the Reorganization.
Pro Forma Portfolio of Investments
As of March 31, 2017 (Unaudited)
| | | Touchstone Active Bond
Fund | | Sentinel Government Securities
Fund | | Pro Forma Adjustments | | Proforma Combined
Touchstone Active Bond
Fund |
| | | Principal
Amount | | Market
Value | | Principal
Amount | | Market
Value | | Principal
Amount | | Market
Value | | Principal
Amount | | Market
Value |
| U.S. Government Mortgage-Backed Obligations - 66.8% | | | | | | | | | | | | | | | | | | |
| FHLMC, 360017, 11.000%, 11/1/17 | | — | | $ | — | | 6 | | $ 6 | (D) | | | | $ | | | 6 | | $ 6 |
| FHLMC, A64971, 5.500%, 8/1/37 | | — | | — | | 8,166 | | 9,204 | (D) | | | | | | | 8,166 | | 9,204 |
| FHLMC, A89148, 4.000%, 10/1/39 | | — | | — | | 6,489,922 | | 6,830,519 | (D) | | | | | | | 6,489,922 | | 6,830,519 |
| FHLMC, G05483, 4.500%, 6/1/39 | | — | | — | | 4,146,832 | | 4,471,402 | (D) | | | | | | | 4,146,832 | | 4,471,402 |
| FHLMC, G05624, 4.500%, 9/1/39 | | — | | — | | 9,290,437 | | 10,020,323 | (D) | | | | | | | 9,290,437 | | 10,020,323 |
| FHLMC, J22900, 2.500%, 3/1/28 | | — | | — | | 13,641,223 | | 13,810,054 | (D) | | | | | | | 13,641,223 | | 13,810,054 |
| FHLMC, Q29056, 4.000%, 10/1/44 | | — | | — | | 5,371,006 | | 5,638,497 | (D) | | | | | | | 5,371,006 | | 5,638,497 |
| FHLMC, Q32917, 3.000%, 4/1/45 | | — | | — | | — | | — | | | | | | | | — | | — |
| FHLMC, Q33006, 3.500%, 4/1/45 | | — | | — | | 11,579,810 | | 11,852,320 | (D) | | | | | | | 11,579,810 | | 11,852,320 |
| FHLMC, 1B3366, 3.447%, 3/1/37(A) | | 65,703 | | 69,384 | | — | | — | | | | | | | | 65,703 | | 69,384 |
| FHLMC, 1H1348, 2.681%, 10/1/36(A) | | 173,302 | | 183,254 | | — | | — | | | | | | | | 173,302 | | 183,254 |
| FHLMC, 1Q0339, 3.312%, 4/1/37(A) | | 595,629 | | 630,351 | | — | | — | | | | | | | | 595,629 | | 630,351 |
| FHLMC, A12886, 5.000%, 8/1/33 | | 24,555 | | 26,990 | | — | | — | | | | | | | | 24,555 | | 26,990 |
| FHLMC, A13842, 6.000%, 9/1/33 | | 61,701 | | 69,653 | | — | | — | | | | | | | | 61,701 | | 69,653 |
| FHLMC, A21415, 5.000%, 5/1/34 | | 14,285 | | 15,657 | | — | | — | | | | | | | | 14,285 | | 15,657 |
| FHLMC, A35682, 5.000%, 7/1/35 | | 33,037 | | 36,121 | | — | | — | | | | | | | | 33,037 | | 36,121 |
| FHLMC, A36523, 5.000%, 8/1/35 | | 17,717 | | 19,373 | | — | | — | | | | | | | | 17,717 | | 19,373 |
| FHLMC, A46590, 5.000%, 8/1/35 | | 85,991 | | 93,576 | | — | | — | | | | | | | | 85,991 | | 93,576 |
| FHLMC, A56988, 5.500%, 2/1/37 | | 28,073 | | 31,144 | | — | | — | | | | | | | | 28,073 | | 31,144 |
| FHLMC, A96485, 4.500%, 1/1/41 | | 179,984 | | 193,452 | | — | | — | | | | | | | | 179,984 | | 193,452 |
| FHLMC, A97897, 4.500%, 4/1/41 | | 824,015 | | 897,396 | | — | | — | | | | | | | | 824,015 | | 897,396 |
| FHLMC, C62740, 7.000%, 1/1/32 | | 26,593 | | 29,475 | | — | | — | | | | | | | | 26,593 | | 29,475 |
| FHLMC, C72254, 6.500%, 7/1/32 | | 26,743 | | 30,563 | | — | | — | | | | | | | | 26,743 | | 30,563 |
| FHLMC, C90986, 7.000%, 6/1/26 | | 100,904 | | 110,930 | | — | | — | | | | | | | | 100,904 | | 110,930 |
| FHLMC, G02184, 5.000%, 4/1/36 | | 29,278 | | 32,005 | | — | | — | | | | | | | | 29,278 | | 32,005 |
| FHLMC, G05733, 5.000%, 11/1/39 | | 457,021 | | 502,844 | | — | | — | | | | | | | | 457,021 | | 502,844 |
| FHLMC, J13584, 3.500%, 11/1/25 | | 279,316 | | 292,442 | | — | | — | | | | | | | | 279,316 | | 292,442 |
| FHR, 3331 PE, 6.000%, 6/15/37 | | — | | — | | 7,433,185 | | 8,263,097 | (D) | | | | | | | 7,433,185 | | 8,263,097 |
| FHR, 3859 JB, 5.000%, 5/15/41 | | — | | — | | — | | — | | | | | | | | — | | — |
| FNMA, 426830, 8.000%, 11/1/24 | | — | | — | | 16,920 | | 17,551 | (D) | | | | | | | 16,920 | | 17,551 |
| FNMA, 725423, 5.500%, 5/1/34 | | — | | — | | — | | — | | | | | | | | — | | — |
| FNMA, 725610, 5.500%, 7/1/34 | | — | | — | | — | | — | | | | | | | | — | | — |
| FNMA, 738887, 5.500%, 10/1/33 | | — | | — | | 115,622 | | 128,301 | (D) | | | | | | | 115,622 | | 128,301 |
| FNMA, 748895, 6.000%, 12/1/33 | | — | | — | | 104,096 | | 113,490 | (D) | | | | | | | 104,096 | | 113,490 |
| FNMA, 758564, 6.000%, 9/1/24 | | — | | — | | 177,251 | | 200,104 | (D) | | | | | | | 177,251 | | 200,104 |
| FNMA, 881279, 5.000%, 11/1/36 | | — | | — | | 947,049 | | 1,044,605 | (D) | | | | | | | 947,049 | | 1,044,605 |
| FNMA, 890310, 4.500%, 12/1/40 | | — | | — | | — | | — | | | | | | | | — | | — |
| FNMA, 931533, 4.500%, 7/1/39 | | — | | — | | 1,651,661 | | 1,783,087 | (D) | | | | | | | 1,651,661 | | 1,783,087 |
| FNMA, 931535, 5.500%, 7/1/39 | | — | | — | | 1,373,993 | | 1,527,247 | (D) | | | | | | | 1,373,993 | | 1,527,247 |
| FNMA, AB7845, 3.000%, 2/1/43 | | — | | — | | 9,815,373 | | 9,789,558 | (D) | | | | | | | 9,815,373 | | 9,789,558 |
| FNMA, AD9193, 5.000%, 9/1/40 | | — | | — | | 6,868,947 | | 7,517,748 | (D) | | | | | | | 6,868,947 | | 7,517,748 |
| FNMA, AE0215, 4.000%, 12/1/39 | | — | | — | | 7,874,539 | | 8,259,718 | (D) | | | | | | | 7,874,539 | | 8,259,718 |
| FNMA, AI4728, 4.500%, 7/1/41 | | — | | — | | 11,078,528 | | 11,892,852 | (D) | | | | | | | 11,078,528 | | 11,892,852 |
| FNMA, AL2860, 3.000%, 12/1/42 | | — | | — | | 13,504,662 | | 13,469,132 | (D) | | | | | | | 13,504,662 | | 13,469,132 |
| FNMA, AL5718, 3.500%, 9/1/44 | | — | | — | | 6,569,647 | | 6,750,595 | (D) | | | | | | | 6,569,647 | | 6,750,595 |
| FNMA, AS0779, 4.000%, 10/1/43 | | — | | — | | — | | — | | | | | | | | — | | — |
| FNMA, AT2016, 3.000%, 4/1/43 | | — | | — | | 16,042,143 | | 15,999,909 | (D) | | | | | | | 16,042,143 | | 15,999,909 |
| FNMA, BC1809, 3.500%, 5/1/46 | | — | | — | | 12,797,387 | | 13,098,886 | (D) | | | | | | | 12,797,387 | | 13,098,886 |
| FNMA, TBA 15 YR 2.5, 2.500%, 4/18/32(D) | | — | | — | | 5,780,000 | | 5,781,806 | (D) | | | | | | | 5,780,000 | | 5,781,806 |
| FNMA, 255628, 5.500%, 2/1/25 | | 106,683 | | 118,385 | | — | | — | | | | | | | | 106,683 | | 118,385 |
| FNMA, 432269, 6.500%, 8/1/28 | | 6,136 | | 6,822 | | — | | — | | | | | | | | 6,136 | | 6,822 |
| FNMA, 535290, 8.000%, 5/1/30 | | 5,155 | | 6,057 | | — | | — | | | | | | | | 5,155 | | 6,057 |
| | | Touchstone Active Bond
Fund | | Sentinel Government Securities
Fund | | | Pro Forma Adjustments | | Proforma Combined
Touchstone Active Bond
Fund |
| | | Principal
Amount | | Market
Value | | Principal
Amount | | Market
Value | | | Principal
Amount | | Market
Value | | Principal
Amount | | Market
Value |
| FNMA, 540040, 7.500%, 6/1/28 | | 10,534 | | 10,560 | | — | | — | | | | | | | | 10,534 | | 10,560 |
| FNMA, 561741, 7.500%, 1/1/31 | | 21,437 | | 24,494 | | — | | — | | | | | | | | 21,437 | | 24,494 |
| FNMA, 626811, 6.500%, 6/1/17 | | 391 | | 391 | | — | | — | | | | | | | | 391 | | 391 |
| FNMA, 640291, 7.000%, 8/1/32 | | 60,169 | | 65,777 | | — | | — | | | | | | | | 60,169 | | 65,777 |
| FNMA, 653301, 6.500%, 7/1/32 | | 33,026 | | 36,720 | | — | | — | | | | | | | | 33,026 | | 36,720 |
| FNMA, 653502, 6.500%, 7/1/32 | | 98,661 | | 109,697 | | — | | — | | | | | | | | 98,661 | | 109,697 |
| FNMA, 670402, 6.500%, 6/1/32 | | 49,178 | | 55,157 | | — | | — | | | | | | | | 49,178 | | 55,157 |
| FNMA, 704460, 6.000%, 5/1/18 | | 4,500 | | 4,517 | | — | | — | | | | | | | | 4,500 | | 4,517 |
| FNMA, 725906, 2.859%, 8/1/34(A) | | 6,591 | | 6,960 | | — | | — | �� | | | | | | | 6,591 | | 6,960 |
| FNMA, 745257, 6.000%, 1/1/36 | | 274,159 | | 311,375 | | — | | — | | | | | | | | 274,159 | | 311,375 |
| FNMA, 745974, 3.237%, 10/1/36(A) | | 2,060 | | 2,176 | | — | | — | | | | | | | | 2,060 | | 2,176 |
| FNMA, 810049, 5.500%, 3/1/35 | | 108,166 | | 120,358 | | — | | — | | | | | | | | 108,166 | | 120,358 |
| FNMA, 819297, 6.000%, 9/1/35 | | 172,728 | | 195,707 | | — | | — | | | | | | | | 172,728 | | 195,707 |
| FNMA, 889060, 6.000%, 1/1/38 | | 60,591 | | 68,980 | | — | | — | | | | | | | | 60,591 | | 68,980 |
| FNMA, 889061, 6.000%, 1/1/38 | | 130,789 | | 150,894 | | — | | — | | | | | | | | 130,789 | | 150,894 |
| FNMA, 893003, 7.000%, 9/1/36 | | 83,537 | | 90,242 | | — | | — | | | | | | | | 83,537 | | 90,242 |
| FNMA, 895657, 6.500%, 8/1/36 | | 16,840 | | 18,562 | | — | | — | | | | | | | | 16,840 | | 18,562 |
| FNMA, 905049, 5.500%, 11/1/36 | | 187,185 | | 207,649 | | — | | — | | | | | | | | 187,185 | | 207,649 |
| FNMA, 908944, 5.500%, 1/1/37 | | 182,576 | | 202,536 | | — | | — | | | | | | | | 182,576 | | 202,536 |
| FNMA, 928553, 5.500%, 8/1/37 | | 678,918 | | 775,962 | | — | | — | | | | | | | | 678,918 | | 775,962 |
| FNMA, 995220, 6.000%, 11/1/23 | | 21,146 | | 22,527 | | — | | — | | | | | | | | 21,146 | | 22,527 |
| FNMA, AA3467, 4.500%, 4/1/39 | | 327,531 | | 354,305 | | — | | — | | | | | | | | 327,531 | | 354,305 |
| FNMA, AA4584, 4.500%, 4/1/39 | | 514,572 | | 557,008 | | — | | — | | | | | | | | 514,572 | | 557,008 |
| FNMA, AB1800, 4.000%, 11/1/40 | | 118,034 | | 124,782 | | — | | — | | | | | | | | 118,034 | | 124,782 |
| FNMA, AB2452, 4.000%, 3/1/26 | | 426,964 | | 449,460 | | — | | — | | | | | | | | 426,964 | | 449,460 |
| FNMA, AD3775, 4.500%, 3/1/25 | | 138,363 | | 147,148 | | — | | — | | | | | | | | 138,363 | | 147,148 |
| FNMA, AD6193, 5.000%, 6/1/40 | | 172,483 | | 188,767 | | — | | — | | | | | | | | 172,483 | | 188,767 |
| FNMA, AE0996, 4.000%, 2/1/41 | | 429,900 | | 454,406 | | — | | — | | | | | | | | 429,900 | | 454,406 |
| FNMA, AE1568, 4.000%, 9/1/40 | | 242,964 | | 255,726 | | — | | — | | | | | | | | 242,964 | | 255,726 |
| FNMA, AE2497, 4.500%, 9/1/40 | | 764,985 | | 829,740 | | — | | — | | | | | | | | 764,985 | | 829,740 |
| FNMA, AE5441, 5.000%, 10/1/40 | | 123,218 | | 134,824 | | — | | — | | | | | | | | 123,218 | | 134,824 |
| FNMA, AH1135, 5.000%, 1/1/41 | | 369,972 | | 405,615 | | — | | — | | | | | | | | 369,972 | | 405,615 |
| FNMA, AH3483, 3.500%, 2/1/26 | | 619,875 | | 648,963 | | — | | — | | | | | | | | 619,875 | | 648,963 |
| FNMA, AH3671, 4.000%, 2/1/26 | | 270,908 | | 288,340 | | — | | — | | | | | | | | 270,908 | | 288,340 |
| FNMA, AH6622, 4.000%, 3/1/41 | | 633,787 | | 673,510 | | — | | — | | | | | | | | 633,787 | | 673,510 |
| FNMA, AI0805, 4.500%, 7/1/41 | | 27,662 | | 29,694 | | — | | — | | | | | | | | 27,662 | | 29,694 |
| FNMA, AL0150, 4.000%, 2/1/41 | | 828,217 | | 875,437 | | — | | — | | | | | | | | 828,217 | | 875,437 |
| FNMA, AL0211, 5.000%, 4/1/41 | | 202,072 | | 220,969 | | — | | — | | | | | | | | 202,072 | | 220,969 |
| FNR, 03-32 BZ, 6.000%, 11/25/32 | | — | | — | | 377,493 | | 425,610 | (D) | | | | | | | 377,493 | | 425,610 |
| FNR, 12-47 AI Interest Only, 3.000%, 5/25/22 | | — | | — | | 4,202,261 | | 198,692 | (D) | | | | | | | 4,202,261 | | 198,692 |
| GNMA, AG8936, 4.000%, 2/15/44 | | — | | — | | 6,857,151 | | 7,273,987 | (D) | | | | | | | 6,857,151 | | 7,273,987 |
| GNMA II, 004424, 5.000%, 4/20/39 | | — | | — | | 2,409,115 | | 2,656,080 | (D) | | | | | | | 2,409,115 | | 2,656,080 |
| GNMA II, 005175, 4.500%, 9/20/41 | | — | | — | | — | | — | | | | | | | | — | | — |
| GNMA, 5305, 4.000%, 2/20/42 | | 40,772 | | 43,274 | | — | | — | | | | | | | | 40,772 | | 43,274 |
| GNMA, 748495, 4.000%, 8/15/40 | | 10,366 | | 10,961 | | — | | — | | | | | | | | 10,366 | | 10,961 |
| GNMA, 8503, 2.125%, 9/20/24(A) | | 19,371 | | 19,900 | | — | | — | | | | | | | | 19,371 | | 19,900 |
| GNR, 10-169 AW, 4.500%, 12/20/40 | | — | | — | | — | | — | | | | | | | | — | | — |
| GNR, 10-33 PX, 5.000%, 9/20/38 | | — | | — | | 8,125,849 | | 8,508,801 | (D) | | | | | | | 8,125,849 | | 8,508,801 |
| GNR, 12-147 IO, 0.583%, 4/16/54 | | — | | — | | — | | — | | | | | | | | — | | — |
| U.S. Government Mortgage-Backed Obligations Total | | | | $12,589,944 | | | | $177,333,181 | | | | | | | | | | $189,923,125 |
| | | | | | | | | | | | | | | | | | | |
| Corporate Bonds - 14.7% | | | | | | | | | | | | | | | | | | |
| | | | | | | | | | | | | | | | | | | |
| Financials - 3.4% | | | | | | | | | | | | | | | | | | |
| Air Lease Corp., 5.625%, 4/1/17 | | 250,000 | | 250,000 | | — | | — | | | | | | | | 250,000 | | 250,000 |
| Ally Financial, Inc., 5.750%, 11/20/25 | | 38,000 | | 38,903 | | — | | — | | | | | | | | 38,000 | | 38,903 |
| Ally Financial, Inc., 8.000%, 11/1/31 | | 290,000 | | 344,375 | | — | | — | | | | | | | | 290,000 | | 344,375 |
| | | Touchstone Active Bond
Fund | | Sentinel Government Securities
Fund | | | Pro Forma Adjustments | | Proforma Combined
Touchstone Active Bond
Fund |
| | | Principal
Amount | | Market
Value | | Principal
Amount | | Market
Value | | | Principal
Amount | | Market
Value | | Principal
Amount | | Market
Value |
| Bank of America Corp. MTN, 4.000%, 1/22/25 | | 550,000 | | 549,421 | | — | | — | | | | | | | | 550,000 | | 549,421 |
| Bank of America Corp., 6.100%, 1/0/00(A)(B) | | 630,000 | | 667,485 | | — | | — | | | | | | | | 630,000 | | 667,485 |
| Barclays PLC (United Kingdom), 3.250%, 1/12/21 | | 370,000 | | 372,605 | | — | | — | | | | | | | | 370,000 | | 372,605 |
| Branch Banking & Trust Co., 3.625%, 9/16/25 | | 384,000 | | 393,382 | | — | | — | | | | | | | | 384,000 | | 393,382 |
| Capital One NA, 1.650%, 2/5/18 | | 575,000 | | 574,903 | | — | | — | | | | | | | | 575,000 | | 574,903 |
| Chubb INA Holdings, Inc., 4.350%, 11/3/45 | | 335,000 | | 353,638 | | — | | — | | | | | | | | 335,000 | | 353,638 |
| Citigroup, Inc., 2.485%, 9/1/23(A) | | 660,000 | | 678,678 | | — | | — | | | | | | | | 660,000 | | 678,678 |
| Citigroup, Inc., 3.300%, 4/27/25 | | 250,000 | | 244,867 | | — | | — | | | | | | | | 250,000 | | 244,867 |
| Citigroup, Inc., 4.750%, 5/18/46 | | 152,000 | | 150,157 | | — | | — | | | | | | | | 152,000 | | 150,157 |
| Citigroup, Inc., 6.125%, 1/0/00(A)(B) | | 58,000 | | 61,190 | | — | | — | | | | | | | | 58,000 | | 61,190 |
| Credit Suisse Group Funding Guernsey Ltd. (Guernsey), 2.750%, 3/26/20 | | 250,000 | | 250,379 | | — | | — | | | | | | | | 250,000 | | 250,379 |
| CyrusOne LP / CyrusOne Finance Corp., 144a 5.000%, 3/15/24 | | 6,000 | | 6,165 | | — | | — | | | | | | | | 6,000 | | 6,165 |
| CyrusOne LP / CyrusOne Finance Corp., 144a 5.375%, 3/15/27 | | 6,000 | | 6,060 | | — | | — | | | | | | | | 6,000 | | 6,060 |
| Dana Financing Luxembourg Sarl (Luxembourg), 144a 5.750%, 4/15/25 | | 13,000 | | 13,114 | | — | | — | | | | | | | | 13,000 | | 13,114 |
| Fifth Third Bancorp, 2.875%, 7/27/20 | | 380,000 | | 386,046 | | — | | — | | | | | | | | 380,000 | | 386,046 |
| FirstCash, Inc., 6.750%, 4/1/21 | | 34,000 | | 35,445 | | — | | — | | | | | | | | 34,000 | | 35,445 |
| GE Capital International Funding Co. Unlimited Co. (Ireland), 4.418%, 11/15/35 | | 232,000 | | 244,981 | | — | | — | | | | | | | | 232,000 | | 244,981 |
| General Motors Financial Co., Inc., 3.200%, 7/13/20 | | 495,000 | | 503,524 | | — | | — | | | | | | | | 495,000 | | 503,524 |
| Goldman Sachs Group, Inc. (The), 5.250%, 7/27/21 | | 155,000 | | 170,022 | | — | | — | | | | | | | | 155,000 | | 170,022 |
| Goldman Sachs Group, Inc. (The), 5.375%, 1/0/00(A)(B) | | 55,000 | | 56,238 | | — | | — | | | | | | | | 55,000 | | 56,238 |
| HSBC Holdings PLC (United Kingdom), 2.650%, 1/5/22(A) | | 430,000 | | 442,118 | | — | | — | | | | | | | | 430,000 | | 442,118 |
| Huntington National Bank (The), 2.200%, 11/6/18 | | 420,000 | | 421,781 | | — | | — | | | | | | | | 420,000 | | 421,781 |
| JPMorgan Chase & Co., 3.250%, 9/23/22 | | 145,000 | | 147,646 | | — | | — | | | | | | | | 145,000 | | 147,646 |
| JPMorgan Chase & Co., 5.150%, 1/0/00(A)(B) | | 630,000 | | 635,512 | | — | | — | | | | | | | | 630,000 | | 635,512 |
| JPMorgan Chase & Co., 6.000%, 1/15/18 | | 265,000 | | 273,945 | | — | | — | | | | | | | | 265,000 | | 273,945 |
| Mid-America Apartments LP, 3.750%, 6/15/24 | | 80,000 | | 81,413 | | — | | — | | | | | | | | 80,000 | | 81,413 |
| Morgan Stanley, 3.950%, 4/23/27 | | 355,000 | | 351,588 | | — | | — | | | | | | | | 355,000 | | 351,588 |
| OneMain Financial Holdings LLC, 144a 7.250%, 12/15/21 | | 51,000 | | 53,422 | | — | | — | | | | | | | | 51,000 | | 53,422 |
| PNC Bank NA, 2.700%, 11/1/22 | | 250,000 | | 247,880 | | — | | — | | | | | | | | 250,000 | | 247,880 |
| Prudential Financial, Inc., 5.625%, 6/15/43(A) | | 360,000 | | 385,740 | | — | | — | | | | | | | | 360,000 | | 385,740 |
| Quicken Loans, Inc., 144a 5.750%, 5/1/25 | | 28,000 | | 27,510 | | — | | — | | | | | | | | 28,000 | | 27,510 |
| Teachers Insurance & Annuity Association of America, 144a 6.850%, 12/16/39 | | 285,000 | | 376,722 | | — | | — | | | | | | | | 285,000 | | 376,722 |
| | | | | 9,796,855 | | | | — | | | | | | | | | | 9,796,855 |
| | | | | | | | | | | | | | | | | | | |
| Consumer Discretionary - 1.9% | | | | | | | | | | | | | | | | | | |
| ACCO Brands Corp., 144a 5.250%, 12/15/24 | | 18,000 | | 18,090 | | — | | — | | | | | | | | 18,000 | | 18,090 |
| AMC Entertainment Holdings, Inc., 144a 5.875%, 11/15/26 | | 33,000 | | 33,371 | | — | | — | | | | | | | | 33,000 | | 33,371 |
| AMC Networks, Inc., 4.750%, 12/15/22 | | 25,000 | | 25,125 | | — | | — | | | | | | | | 25,000 | | 25,125 |
| American Builders & Contractors Supply Co., Inc., 144a 5.750%, 12/15/23 | | 6,000 | | 6,240 | | — | | — | | | | | | | | 6,000 | | 6,240 |
| | | Touchstone Active Bond
Fund | | Sentinel Government Securities
Fund | | | Pro Forma Adjustments | | Proforma Combined
Touchstone Active Bond
Fund |
| | | Principal
Amount | | Market
Value | | Principal
Amount | | Market
Value | | | Principal
Amount | | Market
Value | | Principal
Amount | | Market
Value |
| Anheuser-Busch InBev Finance, Inc., 2.650%, 2/1/21 | | 120,000 | | 120,902 | | — | | — | | | | | | | | 120,000 | | 120,902 |
| Anheuser-Busch InBev Finance, Inc., 4.900%, 2/1/46 | | 306,000 | | 330,702 | | — | | — | | | | | | | | 306,000 | | 330,702 |
| AutoNation, Inc., 5.500%, 2/1/20 | | 490,000 | | 526,224 | | — | | — | | | | | | | | 490,000 | | 526,224 |
| Belo Corp., 7.250%, 9/15/27 | | 57,000 | | 60,420 | | — | | — | | | | | | | | 57,000 | | 60,420 |
| Brookfield Residential Properties, Inc. / Brookfield Residential US Corp. (Canada), 144a 6.125%, 7/1/22 | | 23,000 | | 23,690 | | — | | — | | | | | | | | 23,000 | | 23,690 |
| Cable One, Inc., 144a 5.750%, 6/15/22 | | 14,000 | | 14,560 | | — | | — | | | | | | | | 14,000 | | 14,560 |
| Cablevision Systems Corp., 5.875%, 9/15/22 | | 70,000 | | 70,613 | | — | | — | | | | | | | | 70,000 | | 70,613 |
| CalAtlantic Group, Inc., 5.875%, 11/15/24 | | 17,000 | | 17,850 | | — | | — | | | | | | | | 17,000 | | 17,850 |
| CBS Corp., 4.900%, 8/15/44 | | 205,000 | | 207,861 | | — | | — | | | | | | | | 205,000 | | 207,861 |
| CCO Holdings LLC / CCO Holdings Capital Corp., 144a 5.750%, 2/15/26 | | 101,000 | | 106,050 | | — | | — | | | | | | | | 101,000 | | 106,050 |
| Cimpress NV (Netherlands), 144a 7.000%, 4/1/22 | | 50,000 | | 51,750 | | — | | — | | | | | | | | 50,000 | | 51,750 |
| Delphi Automotive PLC (Jersey), 3.150%, 11/19/20 | | 436,000 | | 444,798 | | — | | — | | | | | | | | 436,000 | | 444,798 |
| Dollar General Corp., 3.250%, 4/15/23 | | 387,000 | | 386,925 | | — | | — | | | | | | | | 387,000 | | 386,925 |
| Dollar Tree, Inc., 5.750%, 3/1/23 | | 15,000 | | 15,975 | | — | | — | | | | | | | | 15,000 | | 15,975 |
| Ford Motor Co., 4.750%, 1/15/43 | | 156,000 | | 146,558 | | — | | — | | | | | | | | 156,000 | | 146,558 |
| Forest Laboratories LLC, 144a 5.000%, 12/15/21 | | 475,000 | | 514,725 | | — | | — | | | | | | | | 475,000 | | 514,725 |
| GLP Capital LP / GLP Financing II, Inc., 5.375%, 11/1/23 | | 10,000 | | 10,600 | | — | | — | | | | | | | | 10,000 | | 10,600 |
| GLP Capital LP / GLP Financing II, Inc., 5.375%, 4/15/26 | | 58,000 | | 59,885 | | — | | — | | | | | | | | 58,000 | | 59,885 |
| Hanesbrands, Inc., 144a 4.625%, 5/15/24 | | 38,000 | | 37,478 | | — | | — | | | | | | | | 38,000 | | 37,478 |
| Home Depot, Inc. (The), 5.950%, 4/1/41 | | 220,000 | | 281,470 | | — | | — | | | | | | | | 220,000 | | 281,470 |
| Imperial Brands Finance PLC (United Kingdom), 144a 3.500%, 2/11/23 | | 575,000 | | 579,768 | | — | | — | | | | | | | | 575,000 | | 579,768 |
| International Game Technology PLC (United Kingdom), 144a 6.250%, 2/15/22 | | 33,000 | | 35,228 | | — | | — | | | | | | | | 33,000 | | 35,228 |
| JC Penney Corp., Inc., 144a 5.875%, 7/1/23 | | 12,000 | | 12,000 | | — | | — | | | | | | | | 12,000 | | 12,000 |
| Lear Corp., 5.375%, 3/15/24 | | 318,000 | | 335,555 | | — | | — | | | | | | | | 318,000 | | 335,555 |
| Lennar Corp., 4.750%, 5/30/25 | | 42,000 | | 42,105 | | — | | — | | | | | | | | 42,000 | | 42,105 |
| Lennar Corp., 4.875%, 12/15/23 | | 12,000 | | 12,270 | | — | | — | | | | | | | | 12,000 | | 12,270 |
| Live Nation Entertainment, Inc., 144a 4.875%, 11/1/24 | | 16,000 | | 16,000 | | — | | — | | | | | | | | 16,000 | | 16,000 |
| LSC Communications, Inc., 144a 8.750%, 10/15/23 | | 33,000 | | 33,908 | | — | | — | | | | | | | | 33,000 | | 33,908 |
| M/I Homes, Inc., 6.750%, 1/15/21 | | 29,000 | | 30,361 | | — | | — | | | | | | | | 29,000 | | 30,361 |
| MDC Partners, Inc. (Canada), 144a 6.500%, 5/1/24 | | 37,000 | | 35,289 | | — | | — | | | | | | | | 37,000 | | 35,289 |
| NCL Corp. Ltd. (Bermuda), 144a 4.750%, 12/15/21 | | 52,000 | | 52,780 | | — | | — | | | | | | | | 52,000 | | 52,780 |
| New Home Co., Inc. (The), 144a 7.250%, 4/1/22 | | 12,000 | | 12,090 | | — | | — | | | | | | | | 12,000 | | 12,090 |
| Newell Brands, Inc., 4.200%, 4/1/26 | | 188,000 | | 195,660 | | — | | — | | | | | | | | 188,000 | | 195,660 |
| Nexstar Broadcasting, Inc., 144a 6.125%, 2/15/22 | | 38,000 | | 39,520 | | — | | — | | | | | | | | 38,000 | | 39,520 |
| PulteGroup, Inc., 5.500%, 3/1/26 | | 19,000 | | 19,665 | | — | | — | | | | | | | | 19,000 | | 19,665 |
| Quad/Graphics, Inc., 7.000%, 5/1/22 | | 31,000 | | 31,000 | | — | | — | | | | | | | | 31,000 | | 31,000 |
| Sabre GLBL, Inc., 144a 5.250%, 11/15/23 | | 20,000 | | 20,450 | | — | | — | | | | | | | | 20,000 | | 20,450 |
| ServiceMaster Co. LLC (The), 144a 5.125%, 11/15/24 | | 46,000 | | 47,150 | | — | | — | | | | | | | | 46,000 | | 47,150 |
| Sirius XM Radio, Inc., 144a 5.375%, 4/15/25 | | 7,000 | | 7,164 | | — | | — | | | | | | | | 7,000 | | 7,164 |
| Sirius XM Radio, Inc., 144a 5.375%, 7/15/26 | | 17,000 | | 17,382 | | — | | — | | | | | | | | 17,000 | | 17,382 |
| | | Touchstone Active Bond
Fund | | Sentinel Government Securities
Fund | | | Pro Forma Adjustments | | Proforma Combined
Touchstone Active Bond
Fund |
| | | Principal
Amount | | Market
Value | | Principal
Amount | | Market
Value | | | Principal
Amount | | Market
Value | | Principal
Amount | | Market
Value |
| Sonic Automotive, Inc., 144a 6.125%, 3/15/27 | | 13,000 | | 13,016 | | — | | — | | | | | | | | 13,000 | | 13,016 |
| Suburban Propane Partners LP/Suburban Energy Finance Corp., 5.875%, 3/1/27 | | 8,000 | | 7,880 | | — | | — | | | | | | | | 8,000 | | 7,880 |
| Tenneco, Inc., 5.000%, 7/15/26 | | 26,000 | | 25,464 | | — | | — | | | | | | | | 26,000 | | 25,464 |
| Toll Brothers Finance Corp., 4.875%, 11/15/25 | | 42,000 | | 42,315 | | — | | — | | | | | | | | 42,000 | | 42,315 |
| United Rentals North America, Inc., 4.625%, 7/15/23 | | 25,000 | | 25,750 | | — | | — | | | | | | | | 25,000 | | 25,750 |
| United Rentals North America, Inc., 5.875%, 9/15/26 | | 8,000 | | 8,340 | | — | | — | | | | | | | | 8,000 | | 8,340 |
| Vista Outdoor, Inc., 5.875%, 10/1/23 | | 10,000 | | 9,725 | | — | | — | | | | | | | | 10,000 | | 9,725 |
| William Lyon Homes, Inc., 144a 5.875%, 1/31/25 | | 10,000 | | 10,075 | | — | | — | | | | | | | | 10,000 | | 10,075 |
| ZF North America Capital, Inc., 144a 4.500%, 4/29/22 | | 65,000 | | 67,681 | | — | | — | | | | | | | | 65,000 | | 67,681 |
| | | | | 5,297,453 | | | | — | | | | | | | | | | 5,297,453 |
| | | | | | | | | | | | | | | | | | | |
| Energy - 1.6% | | | | | | | | | | | | | | | | | | |
| Boardwalk Pipelines LP, 3.375%, 2/1/23 | | 292,000 | | 284,547 | | — | | — | | | | | | | | 292,000 | | 284,547 |
| Cenovus Energy, Inc. (Canada), 6.750%, 11/15/39 | | 275,000 | | 313,633 | | — | | — | | | | | | | | 275,000 | | 313,633 |
| Continental Resources, Inc., 4.500%, 4/15/23 | | 21,000 | | 20,436 | | — | | — | | | | | | | | 21,000 | | 20,436 |
| Enterprise Products Operating LLC, 7.000%, 6/1/67(A) | | 152,000 | | 140,600 | | — | | — | | | | | | | | 152,000 | | 140,600 |
| Exterran Energy Solutions LP / EES Finance Corp., 144a 8.125%, 5/1/25 | | 14,000 | | 14,280 | | — | | — | | | | | | | | 14,000 | | 14,280 |
| Genesis Energy LP / Genesis Energy Finance Corp., 6.000%, 5/15/23 | | 12,000 | | 12,060 | | — | | — | | | | | | | | 12,000 | | 12,060 |
| Genesis Energy LP / Genesis Energy Finance Corp., 6.750%, 8/1/22 | | 19,000 | | 19,589 | | — | | — | | | | | | | | 19,000 | | 19,589 |
| Gulfport Energy Corp., 144a 6.375%, 5/15/25 | | 46,000 | | 45,195 | | — | | — | | | | | | | | 46,000 | | 45,195 |
| Hilcorp Energy I LP / Hilcorp Finance Co., 144a 5.000%, 12/1/24 | | 19,000 | | 17,813 | | — | | — | | | | | | | | 19,000 | | 17,813 |
| Hilcorp Energy I LP / Hilcorp Finance Co., 144a 5.750%, 10/1/25 | | 15,000 | | 14,475 | | — | | — | | | | | | | | 15,000 | | 14,475 |
| Holly Energy Partners LP / Holly Energy Finance Corp., 144a 6.000%, 8/1/24 | | 9,000 | | 9,428 | | — | | — | | | | | | | | 9,000 | | 9,428 |
| HollyFrontier Corp., 5.875%, 4/1/26 | | 26,000 | | 27,605 | | — | | — | | | | | | | | 26,000 | | 27,605 |
| Kinder Morgan Energy Partners LP, 3.500%, 9/1/23 | | 377,000 | | 371,049 | | — | | — | | | | | | | | 377,000 | | 371,049 |
| Marathon Oil Corp., 2.800%, 11/1/22 | | 440,000 | | 422,759 | | — | | — | | | | | | | | 440,000 | | 422,759 |
| Midcontinent Express Pipeline LLC, 144a 6.700%, 9/15/19 | | 392,000 | | 416,512 | | — | | — | | | | | | | | 392,000 | | 416,512 |
| Nabors Industries, Inc., 5.000%, 9/15/20 | | 215,000 | | 222,391 | | — | | — | | | | | | | | 215,000 | | 222,391 |
| Occidental Petroleum Corp., 4.100%, 2/15/47 | | 248,000 | | 239,342 | | — | | — | | | | | | | | 248,000 | | 239,342 |
| Parsley Energy LLC / Parsley Finance Corp., 144a 5.250%, 8/15/25 | | 4,000 | | 4,040 | | — | | — | | | | | | | | 4,000 | | 4,040 |
| PDC Energy, Inc., 144a 6.125%, 9/15/24 | | 27,000 | | 27,675 | | — | | — | | | | | | | | 27,000 | | 27,675 |
| Peabody Securities Finance Corp., 144a 6.000%, 3/31/22 | | 14,000 | | 13,921 | | — | | — | | | | | | | | 14,000 | | 13,921 |
| Peabody Securities Finance Corp., 144a 6.375%, 3/31/25 | | 14,000 | | 13,930 | | — | | — | | | | | | | | 14,000 | | 13,930 |
| Petroleos Mexicanos (Mexico), 4.500%, 1/23/26 | | 285,000 | | 273,172 | | — | | — | | | | | | | | 285,000 | | 273,172 |
| Petroleos Mexicanos (Mexico), 144a 5.375%, 3/13/22 | | 150,000 | | 157,125 | | — | | — | | | | | | | | 150,000 | | 157,125 |
| Precision Drilling Corp. (Canada), 5.250%, 11/15/24 | | 45,000 | | 42,638 | | — | | — | | | | | | | | 45,000 | | 42,638 |
| Precision Drilling Corp. (Canada), 144a 7.750%, 12/15/23 | | 29,000 | | 30,522 | | — | | — | | | | | | | | 29,000 | | 30,522 |
| | | Touchstone Active Bond
Fund | | Sentinel Government Securities
Fund | | | Pro Forma Adjustments | | Proforma Combined
Touchstone Active Bond
Fund |
| | | Principal
Amount | | Market
Value | | Principal
Amount | | Market
Value | | | Principal
Amount | | Market
Value | | Principal
Amount | | Market
Value |
| QEP Resources, Inc., 5.375%, 10/1/22 | | 27,000 | | 26,595 | | — | | — | | | | | | | | 27,000 | | 26,595 |
| Range Resources Corp., 144a 5.000%, 8/15/22 | | 27,000 | | 26,730 | | — | | — | | | | | | | | 27,000 | | 26,730 |
| Range Resources Corp., 144a 5.750%, 6/1/21 | | 16,000 | | 16,400 | | — | | — | | | | | | | | 16,000 | | 16,400 |
| Rose Rock Midstream LP / Rose Rock Finance Corp., 5.625%, 11/15/23 | | 48,000 | | 47,040 | | — | | — | | | | | | | | 48,000 | | 47,040 |
| Sabine Pass Liquefaction LLC, 144a 5.000%, 3/15/27 | | 415,000 | | 433,815 | | — | | — | | | | | | | | 415,000 | | 433,815 |
| SemGroup Corp., 144a 6.375%, 3/15/25 | | 16,000 | | 15,720 | | — | | — | | | | | | | | 16,000 | | 15,720 |
| SESI LLC, 7.125%, 12/15/21 | | 15,000 | | 15,188 | | — | | — | | | | | | | | 15,000 | | 15,188 |
| Shell International Finance BV (Netherlands), 1.875%, 5/10/21 | | 400,000 | | 391,747 | | — | | — | | | | | | | | 400,000 | | 391,747 |
| Southwestern Energy Co., 4.100%, 3/15/22 | | 40,000 | | 37,400 | | — | | — | | | | | | | | 40,000 | | 37,400 |
| Southwestern Energy Co., 5.800%, 1/23/20 | | 31,000 | | 31,291 | | — | | — | | | | | | | | 31,000 | | 31,291 |
| Summit Midstream Holdings LLC / Summit Midstream Finance Corp., 5.750%, 4/15/25 | | 22,000 | | 21,890 | | — | | — | | | | | | | | 22,000 | | 21,890 |
| Transocean Phoenix 2 Ltd. (Cayman Islands), 144a 7.750%, 10/15/24 | | 55,000 | | 59,125 | | — | | — | | | | | | | | 55,000 | | 59,125 |
| Unit Corp., 6.625%, 5/15/21 | | 85,000 | | 83,725 | | — | | — | | | | | | | | 85,000 | | 83,725 |
| Weatherford International Ltd (Bermuda), 6.500%, 8/1/36 | | 31,000 | | 29,295 | | — | | — | | | | | | | | 31,000 | | 29,295 |
| Williams Partners LP, 3.350%, 8/15/22 | | 217,000 | | 216,633 | | — | | — | | | | | | | | 217,000 | | 216,633 |
| | | | | 4,607,331 | | | | — | | | | | | | | | | 4,607,331 |
| | | | | | | | | | | | | | | | | | | |
| Health Care - 1.5% | | | | | | | | | | | | | | | | | | |
| Abbott Laboratories, 3.750%, 11/30/26 | | 395,000 | | 394,503 | | — | | — | | | | | | | | 395,000 | | 394,503 |
| AbbVie, Inc., 4.450%, 5/14/46 | | 342,000 | | 326,348 | | — | | — | | | | | | | | 342,000 | | 326,348 |
| Acadia Healthcare Co., Inc., 6.500%, 3/1/24 | | 77,000 | | 81,043 | | — | | — | | | | | | | | 77,000 | | 81,043 |
| Actavis Funding SCS (Luxembourg), 3.800%, 3/15/25 | | 195,000 | | 196,779 | | — | | — | | | | | | | | 195,000 | | 196,779 |
| Catholic Health Initiatives, 4.200%, 8/1/23 | | 380,000 | | 391,072 | | — | | — | | | | | | | | 380,000 | | 391,072 |
| Centene Corp., 4.750%, 1/15/25 | | 12,000 | | 12,068 | | — | | — | | | | | | | | 12,000 | | 12,068 |
| CHS / Community Health Systems, Inc., 7.125%, 7/15/20 | | 21,000 | | 19,241 | | — | | — | | | | | | | | 21,000 | | 19,241 |
| CHS/Community Health Systems, Inc., 6.250%, 3/31/23 | | 28,000 | | 28,490 | | — | | — | | | | | | | | 28,000 | | 28,490 |
| Envision Healthcare Corp., 5.625%, 7/15/22 | | 28,000 | | 28,700 | | — | | — | | | | | | | | 28,000 | | 28,700 |
| Envision Healthcare Corp., 144a 5.125%, 7/1/22 | | 9,000 | | 9,160 | | — | | — | | | | | | | | 9,000 | | 9,160 |
| Envision Healthcare Corp., 144a 6.250%, 12/1/24 | | 24,000 | | 25,200 | | — | | — | | | | | | | | 24,000 | | 25,200 |
| Express Scripts Holding Co., 3.300%, 2/25/21 | | 336,000 | | 341,810 | | — | | — | | | | | | | | 336,000 | | 341,810 |
| HCA, Inc., 5.375%, 2/1/25 | | 54,000 | | 56,295 | | — | | — | | | | | | | | 54,000 | | 56,295 |
| HCA, Inc., 5.875%, 5/1/23 | | 52,000 | | 56,160 | | — | | — | | | | | | | | 52,000 | | 56,160 |
| HealthSouth Corp., 5.750%, 11/1/24 | | 54,000 | | 54,405 | | — | | — | | | | | | | | 54,000 | | 54,405 |
| Kindred Healthcare, Inc., 8.750%, 1/15/23 | | 28,000 | | 28,070 | | — | | — | | | | | | | | 28,000 | | 28,070 |
| Mallinckrodt International Finance SA (Luxembourg), 4.750%, 4/15/23 | | 7,000 | | 5,932 | | — | | — | | | | | | | | 7,000 | | 5,932 |
| Mallinckrodt International Finance SA / Mallinckrodt CB LLC (Luxembourg), 144a 5.500%, 4/15/25 | | 53,000 | | 48,760 | | — | | — | | | | | | | | 53,000 | | 48,760 |
| Medtronic Global Holdings SCA (Luxembourg), 3.350%, 4/1/27 | | 320,000 | | 322,275 | | — | | — | | | | | | | | 320,000 | | 322,275 |
| Mylan NV (Netherlands), 3.000%, 12/15/18 | | 180,000 | | 182,089 | | — | | — | | | | | | | | 180,000 | | 182,089 |
| Ochsner Clinic Foundation, 5.897%, 5/15/45 | | 300,000 | | 341,972 | | — | | — | | | | | | | | 300,000 | | 341,972 |
| | | Touchstone Active Bond
Fund | | Sentinel Government Securities
Fund | | | Pro Forma Adjustments | | Proforma Combined
Touchstone Active Bond
Fund |
| | | Principal
Amount | | Market
Value | | Principal
Amount | | Market
Value | | | Principal
Amount | | Market
Value | | Principal
Amount | | Market
Value |
| Select Medical Corp., 6.375%, 6/1/21 | | 54,000 | | 54,540 | | — | | — | | | | | | | | 54,000 | | 54,540 |
| Shire Acquisitions Investments Ireland DAC (Ireland), 2.400%, 9/23/21 | | 426,000 | | 416,591 | | — | | — | | | | | | | | 426,000 | | 416,591 |
| Teleflex, Inc., 4.875%, 6/1/26 | | 8,000 | | 8,040 | | — | | — | | | | | | | | 8,000 | | 8,040 |
| Tenet Healthcare Corp., 4.750%, 6/1/20 | | 6,000 | | 6,130 | | — | | — | | | | | | | | 6,000 | | 6,130 |
| Tenet Healthcare Corp., 144a 7.500%, 1/1/22 | | 15,000 | | 16,200 | | — | | — | | | | | | | | 15,000 | | 16,200 |
| Teva Pharmaceutical Finance Netherlands III BV (Netherlands), 2.200%, 7/21/21 | | 172,000 | | 165,990 | | — | | — | | | | | | | | 172,000 | | 165,990 |
| Teva Pharmaceutical Finance Netherlands III BV (Netherlands), 3.150%, 10/1/26 | | 378,000 | | 348,332 | | — | | — | | | | | | | | 378,000 | | 348,332 |
| Universal Hospital Services, Inc., 7.625%, 8/15/20 | | 28,000 | | 27,860 | | — | | — | | | | | | | | 28,000 | | 27,860 |
| Zimmer Biomet Holdings, Inc., 3.150%, 4/1/22 | | 190,000 | | 190,695 | | — | | — | | | | | | | | 190,000 | | 190,695 |
| Zimmer Biomet Holdings, Inc., 3.375%, 11/30/21 | | 110,000 | | 111,284 | | — | | — | | | | | | | | 110,000 | | 111,284 |
| | | | | 4,296,034 | | | | — | | | | | | | | | | 4,296,034 |
| | | | | | | | | | | | | | | | | | | |
| Information Technology - 1.4% | | | | | | | | | | | | | | | | | | |
| Activision Blizzard, Inc., 144a 6.125%, 9/15/23 | | 429,000 | | 464,393 | | — | | — | | | | | | | | 429,000 | | 464,393 |
| Apple, Inc., 4.650%, 2/23/46 | | 313,000 | | 335,850 | | — | | — | | | | | | | | 313,000 | | 335,850 |
| CDW LLC / CDW Finance Corp., 5.000%, 9/1/23 | | 17,000 | | 17,191 | | — | | — | | | | | | | | 17,000 | | 17,191 |
| CDW LLC / CDW Finance Corp., 5.500%, 12/1/24 | | 38,000 | | 39,805 | | — | | — | | | | | | | | 38,000 | | 39,805 |
| Diamond 1 Finance Corp. / Diamond 2 Finance Corp., 144a 4.420%, 6/15/21 | | 395,000 | | 413,069 | | — | | — | | | | | | | | 395,000 | | 413,069 |
| Diamond 1 Finance Corp. / Diamond 2 Finance Corp., 144a 5.450%, 6/15/23 | | 32,000 | | 34,528 | | — | | — | | | | | | | | 32,000 | | 34,528 |
| Diamond 1 Finance Corp. / Diamond 2 Finance Corp., 144a 7.125%, 6/15/24 | | 87,000 | | 96,177 | | — | | — | | | | | | | | 87,000 | | 96,177 |
| Diebold Nixdorf, Inc., 8.500%, 4/15/24 | | 54,000 | | 59,670 | | — | | — | | | | | | | | 54,000 | | 59,670 |
| Electronic Arts, Inc., 3.700%, 3/1/21 | | 432,000 | | 448,400 | | — | | — | | | | | | | | 432,000 | | 448,400 |
| EMC Corp., 3.375%, 6/1/23† | | 10,000 | | 9,552 | | — | | — | | | | | | | | 10,000 | | 9,552 |
| Fidelity National Information Services, Inc., 3.625%, 10/15/20 | | 470,000 | | 488,410 | | — | | — | | | | | | | | 470,000 | | 488,410 |
| First Data Corp., 144a 7.000%, 12/1/23 | | 7,000 | | 7,508 | | — | | — | | | | | | | | 7,000 | | 7,508 |
| Hewlett Packard Enterprise Co., 2.450%, 10/5/17 | | 440,000 | | 441,284 | | — | | — | | | | | | | | 440,000 | | 441,284 |
| Microsoft Corp., 3.500%, 2/12/35 | | 190,000 | | 182,808 | | — | | — | | | | | | | | 190,000 | | 182,808 |
| NCR Corp., 5.875%, 12/15/21 | | 88,000 | | 91,740 | | — | | — | | | | | | | | 88,000 | | 91,740 |
| Open Text Corp. (Canada), 144a 5.875%, 6/1/26 | | 47,000 | | 49,232 | | — | | — | | | | | | | | 47,000 | | 49,232 |
| Oracle Corp., 2.650%, 7/15/26 | | 338,000 | | 321,846 | | — | | — | | | | | | | | 338,000 | | 321,846 |
| QUALCOMM, Inc., 3.450%, 5/20/25 | | 425,000 | | 431,176 | | — | | — | | | | | | | | 425,000 | | 431,176 |
| Quintiles IMS, Inc., 144a 4.875%, 5/15/23 | | 11,000 | | 11,151 | | — | | — | | | | | | | | 11,000 | | 11,151 |
| Sensata Technologies BV (Netherlands), 144a 5.000%, 10/1/25 | | 31,000 | | 31,232 | | — | | — | | | | | | | | 31,000 | | 31,232 |
| | | | | 3,975,022 | | | | — | | | | | | | | | | 3,975,022 |
| | | | | | | | | | | | | | | | | | | |
| Telecommunication Services - 1.4% | | | | | | | | | | | | | | | | | | |
| Altice Financing SA (Luxemburg), 144a 6.625%, 2/15/23 | | 59,000 | | 61,419 | | — | | — | | | | | | | | 59,000 | | 61,419 |
| AMC Networks, Inc., 5.000%, 4/1/24 | | 23,000 | | 23,000 | | — | | — | | | | | | | | 23,000 | | 23,000 |
| AT&T, Inc., 3.900%, 3/11/24 | | 225,000 | | 228,620 | | — | | — | | | | | | | | 225,000 | | 228,620 |
| AT&T, Inc., 4.350%, 6/15/45 | | 90,000 | | 79,216 | | — | | — | | | | | | | | 90,000 | | 79,216 |
| AT&T, Inc., 4.500%, 5/15/35 | | 360,000 | | 339,850 | | — | | — | | | | | | | | 360,000 | | 339,850 |
| Block Communications, Inc., 144a 6.875%, 2/15/25 | | 7,000 | | 7,420 | | — | | — | | | | | | | | 7,000 | | 7,420 |
| | | Touchstone Active Bond
Fund | | Sentinel Government Securities
Fund | | | Pro Forma Adjustments | | Proforma Combined
Touchstone Active Bond
Fund |
| | | Principal
Amount | | Market
Value | | Principal
Amount | | Market
Value | | | Principal
Amount | | Market
Value | | Principal
Amount | | Market
Value |
| CenturyLink, Inc., 5.150%, 6/15/17 | | 325,000 | | 327,275 | | — | | — | | | | | | | | 325,000 | | 327,275 |
| CenturyLink, Inc., 5.800%, 3/15/22 | | 8,000 | | 8,250 | | — | | — | | | | | | | | 8,000 | | 8,250 |
| CenturyLink, Inc., 6.450%, 6/15/21 | | 2,000 | | 2,125 | | — | | — | | | | | | | | 2,000 | | 2,125 |
| Charter Communications Operating LLC / Charter Communications Operating Capital, 6.484%, 10/23/45 | | 264,000 | | 303,953 | | — | | — | | | | | | | | 264,000 | | 303,953 |
| Comcast Corp., 1.625%, 1/15/22 | | 372,000 | | 356,727 | | — | | — | | | | | | | | 372,000 | | 356,727 |
| CommScope Technologies LLC, 144a 5.000%, 3/15/27 | | 16,000 | | 15,975 | | — | | — | | | | | | | | 16,000 | | 15,975 |
| CommScope, Inc., 144a 5.500%, 6/15/24 | | 4,000 | | 4,136 | | — | | — | | | | | | | | 4,000 | | 4,136 |
| CSC Holdings LLC, 5.250%, 6/1/24 | | 34,000 | | 33,873 | | — | | — | | | | | | | | 34,000 | | 33,873 |
| CSC Holdings LLC, 144a 10.125%, 1/15/23 | | 60,000 | | 69,600 | | — | | — | | | | | | | | 60,000 | | 69,600 |
| Discovery Communications LLC, 3.450%, 3/15/25 | | 500,000 | | 473,476 | | — | | — | | | | | | | | 500,000 | | 473,476 |
| DISH DBS Corp., 5.125%, 5/1/20 | | 48,000 | | 50,040 | | — | | — | | | | | | | | 48,000 | | 50,040 |
| Frontier Communications Corp., 10.500%, 9/15/22 | | 10,000 | | 10,125 | | — | | — | | | | | | | | 10,000 | | 10,125 |
| Frontier Communications Corp., 6.250%, 9/15/21 | | 90,000 | | 83,700 | | — | | — | | | | | | | | 90,000 | | 83,700 |
| Gray Television, Inc., 144a 5.125%, 10/15/24 | | 45,000 | | 44,438 | | — | | — | | | | | | | | 45,000 | | 44,438 |
| Level 3 Financing, Inc., 5.250%, 3/15/26 | | 13,000 | | 13,065 | | — | | — | | | | | | | | 13,000 | | 13,065 |
| LIN Television Corp., 5.875%, 11/15/22 | | 5,000 | | 5,175 | | — | | — | | | | | | | | 5,000 | | 5,175 |
| Match Group, Inc., 6.375%, 6/1/24 | | 6,000 | | 6,491 | | — | | — | | | | | | | | 6,000 | | 6,491 |
| Nexstar Escrow Corp., 144a 5.625%, 8/1/24 | | 31,000 | | 31,465 | | — | | — | | | | | | | | 31,000 | | 31,465 |
| Qwest Corp., 6.750%, 12/1/21 | | 375,000 | | 411,093 | | — | | — | | | | | | | | 375,000 | | 411,093 |
| Sprint Communications, Inc., 6.000%, 11/15/22 | | 181,000 | | 185,072 | | — | | — | | | | | | | | 181,000 | | 185,072 |
| Symantec Corp., 144a 5.000%, 4/15/25 | | 7,000 | | 7,178 | | — | | — | | | | | | | | 7,000 | | 7,178 |
| Univision Communications, Inc., 144a 5.125%, 2/15/25 | | 13,000 | | 12,789 | | — | | — | | | | | | | | 13,000 | | 12,789 |
| Verizon Communications, Inc., 4.672%, 3/15/55 | | 425,000 | | 379,525 | | — | | — | | | | | | | | 425,000 | | 379,525 |
| Verizon Communications, Inc., 144a 5.012%, 4/15/49 | | 331,000 | | 321,449 | | — | | — | | | | | | | | 331,000 | | 321,449 |
| Videotron Ltd. / Videotron Ltee (Canada), 144a 5.125%, 4/15/27 | | 40,000 | | 40,300 | | — | | — | | | | | | | | 40,000 | | 40,300 |
| | | | | 3,936,820 | | | | — | | | | | | | | | | 3,936,820 |
| | | | | | | | | | | | | | | | | | | |
| Industrials - 1.0% | | | | | | | | | | | | | | | | | | |
| Allegion PLC (Ireland), 5.875%, 9/15/23 | | 9,000 | | 9,608 | | — | | — | | | | | | | | 9,000 | | 9,608 |
| Arconic, Inc., 5.125%, 10/1/24 | | 31,000 | | 32,023 | | — | | — | | | | | | | | 31,000 | | 32,023 |
| Burlington Northern Santa Fe LLC, 5.750%, 5/1/40 | | 190,000 | | 230,564 | | — | | — | | | | | | | | 190,000 | | 230,564 |
| Clean Harbors, Inc., 5.125%, 6/1/21 | | 3,000 | | 3,063 | | — | | — | | | | | | | | 3,000 | | 3,063 |
| CNH Industrial NV (Netherlands), 4.500%, 8/15/23 | | 48,000 | | 48,660 | | — | | — | | | | | | | | 48,000 | | 48,660 |
| Eagle Materials, Inc., 4.500%, 8/1/26 | | 19,000 | | 18,905 | | — | | — | | | | | | | | 19,000 | | 18,905 |
| FedEx Corp., 5.100%, 1/15/44 | | 400,000 | | 430,488 | | — | | — | | | | | | | | 400,000 | | 430,488 |
| Huntington Ingalls Industries, Inc., 144a 5.000%, 11/15/25 | | 5,000 | | 5,225 | | — | | — | | | | | | | | 5,000 | | 5,225 |
| Joy Global, Inc., 5.125%, 10/15/21 | | 403,000 | | 432,483 | | — | | — | | | | | | | | 403,000 | | 432,483 |
| KLX, Inc., 144a 5.875%, 12/1/22 | | 57,000 | | 58,781 | | — | | — | | | | | | | | 57,000 | | 58,781 |
| Koppers, Inc., 144a 6.000%, 2/15/25 | | 7,000 | | 7,228 | | — | | — | | | | | | | | 7,000 | | 7,228 |
| Louisiana-Pacific Corp., 4.875%, 9/15/24 | | 29,000 | | 29,145 | | — | | — | | | | | | | | 29,000 | | 29,145 |
| Masco Corp., 4.375%, 4/1/26 | | 310,000 | | 322,155 | | — | | — | | | | | | | | 310,000 | | 322,155 |
| Moog, Inc., 144a 5.250%, 12/1/22 | | 3,000 | | 3,075 | | — | | — | | | | | | | | 3,000 | | 3,075 |
| Orbital ATK, Inc., 5.250%, 10/1/21 | | 20,000 | | 20,675 | | — | | — | | | | | | | | 20,000 | | 20,675 |
| Owens-Brockway Glass Container, Inc., 144a 5.875%, 8/15/23 | | 5,000 | | 5,291 | | — | | — | | | | | | | | 5,000 | | 5,291 |
| Roper Technologies, Inc., 3.000%, 12/15/20 | | 430,000 | | 438,081 | | — | | — | | | | | | | | 430,000 | | 438,081 |
| | | Touchstone Active Bond
Fund | | Sentinel Government Securities
Fund | | | Pro Forma Adjustments | | Proforma Combined
Touchstone Active Bond
Fund |
| | | Principal
Amount | | Market
Value | | Principal
Amount | | Market
Value | | | Principal
Amount | | Market
Value | | Principal
Amount | | Market
Value |
| SBA Tower Trust, 144a 2.898%, 10/15/19 | | 334,000 | | 335,038 | | — | | — | | | | | | | | 334,000 | | 335,038 |
| Siemens Financieringsmaatschappij NV (Netherlands), 144a 3.125%, 3/16/24 | | 350,000 | | 352,503 | | — | | — | | | | | | | | 350,000 | | 352,503 |
| XPO CNW, Inc., 6.700%, 5/1/34 | | 158,000 | | 143,385 | | — | | — | | | | | | | | 158,000 | | 143,385 |
| | | | | 2,926,376 | | | | — | | | | | | | | | | 2,926,376 |
| | | | | | | | | | | | | | | | | | | |
| Consumer Staples - 0.9% | | | | | | | | | | | | | | | | | | |
| AdvancePierre Foods Holdings, Inc., 144a 5.500%, 12/15/24 | | 27,000 | | 27,304 | | — | | — | | | | | | | | 27,000 | | 27,304 |
| Albertsons Cos. LLC / Safeway, Inc. / New Albertson’s Inc. / Albertson’s LLC, 144a 5.750%, 3/15/25 | | 54,000 | | 52,380 | | — | | — | | | | | | | | 54,000 | | 52,380 |
| Avis Budget Car Rental LLC / Avis Budget Finance, Inc., 5.500%, 4/1/23 | | 55,000 | | 53,144 | | — | | — | | | | | | | | 55,000 | | 53,144 |
| B&G Foods, Inc., 5.250%, 4/1/25 | | 5,000 | | 5,044 | | — | | — | | | | | | | | 5,000 | | 5,044 |
| Cardtronics, Inc. / Cardtronics USA, 144a 5.500%, 5/1/25 | | 26,000 | | 26,293 | | — | | — | | | | | | | | 26,000 | | 26,293 |
| Cott Holdings, Inc., 144a 5.500%, 4/1/25 | | 27,000 | | 27,481 | | — | | — | | | | | | | | 27,000 | | 27,481 |
| CVS Health Corp., 5.125%, 7/20/45 | | 260,000 | | 286,857 | | — | | — | | | | | | | | 260,000 | | 286,857 |
| IHS Markit Ltd., 144a 5.000%, 11/1/22 | | 55,000 | | 57,612 | | — | | — | | | | | | | | 55,000 | | 57,612 |
| JBS USA LLC / JBS USA Finance, Inc., 144a 5.750%, 6/15/25 | | 20,000 | | 20,200 | | — | | — | | | | | | | | 20,000 | | 20,200 |
| KFC Holding Co. / Pizza Hut Holdings LLC/Taco Bell of America LLC, 144a 5.250%, 6/1/26 | | 6,000 | | 6,105 | | — | | — | | | | | | | | 6,000 | | 6,105 |
| KFC Holding Co./Pizza Hut Holdings LLC/Taco Bell of America LLC, 144a 5.000%, 6/1/24 | | 40,000 | | 40,850 | | — | | — | | | | | | | | 40,000 | | 40,850 |
| Kraft Heinz Foods Co., 6.875%, 1/26/39 | | 515,000 | | 642,460 | | — | | — | | | | | | | | 515,000 | | 642,460 |
| Kroger Co. (The), 5.000%, 4/15/42 | | 500,000 | | 523,726 | | — | | — | | | | | | | | 500,000 | | 523,726 |
| Mondelez International Holdings Netherlands BV (Netherlands), 144a 2.000%, 10/28/21 | | 450,000 | | 432,991 | | — | | — | | | | | | | | 450,000 | | 432,991 |
| Moody’s Corp., 2.750%, 12/15/21 | | 351,000 | | 350,455 | | — | | — | | | | | | | | 351,000 | | 350,455 |
| Post Holdings, Inc., 144a 5.000%, 8/15/26 | | 73,000 | | 69,898 | | — | | — | | | | | | | | 73,000 | | 69,898 |
| TreeHouse Foods, Inc., 4.875%, 3/15/22 | | 7,000 | | 7,158 | | — | | — | | | | | | | | 7,000 | | 7,158 |
| TreeHouse Foods, Inc., 144a 6.000%, 2/15/24 | | 14,000 | | 14,665 | | — | | — | | | | | | | | 14,000 | | 14,665 |
| US Foods, Inc., 144a 5.875%, 6/15/24 | | 11,000 | | 11,412 | | — | | — | | | | | | | | 11,000 | | 11,412 |
| | | | | 2,656,035 | | | | — | | | | | | | | | | 2,656,035 |
| | | | | | | | | | | | | | | | | | | |
| Utilities - 0.8% | | | | | | | | | | | | | | | | | | |
| AES Corp., 4.875%, 5/15/23 | | 78,000 | | 77,610 | | — | | — | | | | | | | | 78,000 | | 77,610 |
| Alabama Power Capital Trust V, 4.248%, 10/1/42(A) | | 874,000 | | 838,618 | | — | | — | | | | | | | | 874,000 | | 838,618 |
| Dominion Resources, Inc., 2.000%, 8/15/21 | | 420,000 | | 407,490 | | — | | — | | | | | | | | 420,000 | | 407,490 |
| Dynegy, Inc., 7.375%, 11/1/22 | | 18,000 | | 17,820 | | — | | — | | | | | | | | 18,000 | | 17,820 |
| Dynegy, Inc., 144a 8.000%, 1/15/25 | | 21,000 | | 20,108 | | — | | — | | | | | | | | 21,000 | | 20,108 |
| Fortis, Inc. (Canada), 144a 3.055%, 10/4/26 | | 384,000 | | 359,207 | | — | | — | | | | | | | | 384,000 | | 359,207 |
| NextEra Energy Capital Holdings, Inc., 6.000%, 3/1/19 | | 15,000 | | 16,072 | | — | | — | | | | | | | | 15,000 | | 16,072 |
| NGL Energy Partners LP / NGL Energy Finance Corp., 6.875%, 10/15/21 | | 17,000 | | 17,298 | | — | | — | | | | | | | | 17,000 | | 17,298 |
| NGL Energy Partners LP / NGL Energy Finance Corp., 144a 7.500%, 11/1/23 | | 65,000 | | 67,112 | | — | | — | | | | | | | | 65,000 | | 67,112 |
| PacifiCorp, 5.750%, 4/1/37 | | 272,000 | | 332,416 | | — | | — | | | | | | | | 272,000 | | 332,416 |
| | | | | 2,153,751 | | | | — | | | | | | | | | | 2,153,751 |
| | | | | | | | | | | | | | | | | | | |
| Real Estate - 0.6% | | | | | | | | | | | | | | | | | | |
| CoreCivic, Inc., 4.125%, 4/1/20† | | 7,000 | | 7,140 | | — | | — | | | | | | | | 7,000 | | 7,140 |
| | | Touchstone Active Bond
Fund | | Sentinel Government Securities
Fund | | | Pro Forma Adjustments | | Proforma Combined
Touchstone Active Bond
Fund |
| | | Principal
Amount | | Market
Value | | Principal
Amount | | Market
Value | | | Principal
Amount | | Market
Value | | Principal
Amount | | Market
Value |
| CoreCivic, Inc., 4.625%, 5/1/23 | | 6,000 | | 5,993 | | — | | — | | | | | | | | 6,000 | | 5,993 |
| CoreCivic, Inc., 5.000%, 10/15/22 | | 15,000 | | 15,488 | | — | | — | | | | | | | | 15,000 | | 15,488 |
| Crown Castle International Corp., REIT, 3.400%, 2/15/21 | | 450,000 | | 457,743 | | — | | — | | | | | | | | 450,000 | | 457,743 |
| Equinix, Inc. REIT, 5.375%, 4/1/23 | | 24,000 | | 24,990 | | — | | — | | | | | | | | 24,000 | | 24,990 |
| Equinix, Inc. REIT, 5.375%, 5/15/27 | | 7,000 | | 7,228 | | — | | — | | | | | | | | 7,000 | | 7,228 |
| ESH Hospitality, Inc. REIT, 144a 5.250%, 5/1/25 | | 39,000 | | 39,317 | | — | | — | | | | | | | | 39,000 | | 39,317 |
| Omega Healthcare Investors, Inc. REIT, 4.950%, 4/1/24 | | 400,000 | | 411,724 | | — | | — | | | | | | | | 400,000 | | 411,724 |
| Simon Property Group LP, REIT, 2.750%, 2/1/23 | | 330,000 | | 325,797 | | — | | — | | | | | | | | 330,000 | | 325,797 |
| Vornado Realty LP REIT, 5.000%, 1/15/22 | | 175,000 | | 188,748 | | — | | — | | | | | | | | 175,000 | | 188,748 |
| Welltower, Inc. REIT, 6.125%, 4/15/20 | | 316,000 | | 349,520 | | — | | — | | | | | | | | 316,000 | | 349,520 |
| | | | | 1,833,688 | | | | — | | | | | | | | | | 1,833,688 |
| | | | | | | | | | | | | | | | | | | |
| Materials - 0.2% | | | | | | | | | | | | | | | | | | |
| ArcelorMittal (Luxembourg), 6.250%, 3/1/21 | | 11,000 | | 11,880 | | — | | — | | | | | | | | 11,000 | | 11,880 |
| Braskem America Finance Co., 144a 7.125%, 7/22/41 | | 200,000 | | 212,100 | | — | | — | | | | | | | | 200,000 | | 212,100 |
| CF Industries, Inc., 3.450%, 6/1/23 | | 50,000 | | 47,250 | | — | | — | | | | | | | | 50,000 | | 47,250 |
| CVR Partners LP / CVR Nitrogen Finance Corp., 144a 9.250%, 6/15/23 | | 48,000 | | 49,260 | | — | | — | | | | | | | | 48,000 | | 49,260 |
| Domtar Corp., 10.750%, 6/1/17 | | 119,000 | | 120,354 | | — | | — | | | | | | | | 119,000 | | 120,354 |
| Freeport-McMoRan, Inc., 144a 6.750%, 2/1/22 | | 38,000 | | 38,950 | | — | | — | | | | | | | | 38,000 | | 38,950 |
| Hudbay Minerals, Inc. (Canada), 144a 7.250%, 1/15/23 | | 21,000 | | 22,260 | | — | | — | | | | | | | | 21,000 | | 22,260 |
| Kraton Polymers LLC / Kraton Polymers Capital Corp., 144a 7.000%, 4/15/25 | | 12,000 | | 12,165 | | — | | — | | | | | | | | 12,000 | | 12,165 |
| Lundin Mining Corp. (Canada), 144a 7.500%, 11/1/20 | | 47,000 | | 49,703 | | — | | — | | | | | | | | 47,000 | | 49,703 |
| NOVA Chemicals Corp. (Canada), 144a 5.250%, 8/1/23 | | 27,000 | | 27,608 | | — | | — | | | | | | | | 27,000 | | 27,608 |
| Scotts Miracle-Gro Co. (The), 144a 5.250%, 12/15/26 | | 21,000 | | 21,262 | | — | | — | | | | | | | | 21,000 | | 21,262 |
| | | | | 612,792 | | | | — | | | | | | | | | | 612,792 |
| | | | | | | | | | | | | | | | | | | |
| Corporate Bonds Total | | | | 42,092,157 | | | | — | | | | | | | | | | 42,092,157 |
| | | | | | | | | | | | | | | | | | | |
| U.S. Treasury Obligations - 12.5% | | | | | | | | | | | | | | | | | | |
| U.S. Treasury Bond, 2.250%, 8/15/46 | | 1,036,000 | | 876,796 | | — | | — | | | | | | | | 1,036,000 | | 876,796 |
| U.S. Treasury Bond, 2.500%, 2/15/46 | | 410,000 | | 367,462 | | — | | — | | | | | | | | 410,000 | | 367,462 |
| U.S. Treasury Bond, 2.875%, 11/15/46 | | 200,000 | | 194,055 | | — | | — | | | | | | | | 200,000 | | 194,055 |
| U.S. Treasury Bond, 3.000%, 2/15/47 | | 2,800,000 | | 2,790,046 | | — | | — | | | | | | | | 2,800,000 | | 2,790,046 |
| U.S. Treasury Bond, 3.000%, 5/15/45 | | 135,000 | | 134,214 | | — | | — | | | | | | | | 135,000 | | 134,214 |
| U.S. Treasury Inflation Indexed Bonds, 0.375%, 1/15/27 | | 13,020,000 | | 13,029,710 | | — | | — | | | | | | | | 13,020,000 | | 13,029,710 |
| U.S. Treasury Note, 1.125%, 2/28/19 | | 2,055,000 | | 2,050,343 | | — | | — | | | | | | | | 2,055,000 | | 2,050,343 |
| U.S. Treasury Note, 1.125%, 7/31/21 | | 1,500,000 | | 1,454,766 | | — | | — | | | | | | | | 1,500,000 | | 1,454,766 |
| U.S. Treasury Note, 1.375%, 4/30/21 | | 1,500,000 | | 1,474,804 | | — | | — | | | | | | | | 1,500,000 | | 1,474,804 |
| U.S. Treasury Note, 2.000%, 11/15/26 | | 4,740,000 | | 4,578,916 | | — | | — | | | | | | | | 4,740,000 | | 4,578,916 |
| U.S. Treasury Note, 2.000%, 12/31/21 | | 8,500,000 | | 8,532,538 | | — | | — | | | | | | | | 8,500,000 | | 8,532,538 |
| U.S. Treasury Obligations Total | | | | 35,483,650 | | | | — | | | | | | | | | | 35,483,650 |
| | | | | | | | | | | | | | | | | | | |
| Asset-Backed Securities - 2.0% | | | | | | | | | | | | | | | | | | |
| Ascentium Equipment Receivables Trust, Ser 2016-1A, Class B, 144a 2.850%, 7/10/20 | | 475,000 | | 480,332 | | — | | — | | | | | | | | 475,000 | | 480,332 |
| CIT Home Equity Loan Trust, Ser 2002-1, Class AF5, 7.210%, 2/25/33(C) | | 3,465 | | 3,459 | | — | | — | | | | | | | | 3,465 | | 3,459 |
| | | Touchstone Active Bond
Fund | | Sentinel Government Securities
Fund | | | Pro Forma Adjustments | | Proforma Combined
Touchstone Active Bond
Fund |
| | | Principal
Amount | | Market
Value | | Principal
Amount | | Market
Value | | | Principal
Amount | | Market
Value | | Principal
Amount | | Market
Value |
| CWHEQ Home Equity Loan Trust, Ser 2007-S1, Class A5, 6.018%, 11/25/36(A) | | 382,425 | | 364,822 | | — | | — | | | | | | | | 382,425 | | 364,822 |
| Dell Equipment Finance Trust, Ser 2015-1, Class C, 144a 2.420%, 3/23/20 | | 450,000 | | 452,388 | | — | | — | | | | | | | | 450,000 | | 452,388 |
| Domino’s Pizza Master Issuer LLC, Ser 2012-1A, Class A2, 144a 5.216%, 1/25/42 | | 176,271 | | 178,568 | | — | | — | | | | | | | | 176,271 | | 178,568 |
| FFMLT Trust, Ser 2005-FFA, Class M3, 6.017%, 3/25/25(C) | | 414,795 | | 426,006 | | — | | — | | | | | | | | 414,795 | | 426,006 |
| FHLMC Structured Pass Through Securities, Ser T-20, Class A5, 6.895%, 12/25/29(C) | | 200,011 | | 248,669 | | — | | — | | | | | | | | 200,011 | | 248,669 |
FNMA REMIC Trust, Ser 2001-W2, Class AF6,
6.589%, 10/25/31(C) | | 51,706 | | 55,148 | | — | | — | | | | | | | | 51,706 | | 55,148 |
| Keuka Park CLO Ltd 2013-1, 2.741%, 10/21/24 | | — | | — | | — | | — | | | | | | | | — | | — |
| Leaf Receivables Funding LLC, Ser 2016-1, Class B, 144a 2.780%, 8/15/22 | | 300,000 | | 297,318 | | — | | — | | | | | | | | 300,000 | | 297,318 |
| Mid-State Capital Corp. Trust, Ser 2005-1, Class M2, 7.079%, 1/15/40 | | 1,556,467 | | 1,704,112 | | — | | — | | | | | | | | 1,556,467 | | 1,704,112 |
| Nomad CLO Ltd., 2.223%, 1/15/25 | | — | | — | | — | | — | | | | | | | | — | | — |
| Orange Lake Timeshare Trust, Ser 2016-A, Class A, 144a 2.610%, 3/8/29 | | 485,246 | | 479,438 | | — | | — | | | | | | | | 485,246 | | 479,438 |
| RASC Trust, Ser 2001-KS3, Class AI6, 5.960%, 9/25/31(A) | | 1,999 | | 2,074 | | — | | — | | | | | | | | 1,999 | | 2,074 |
| Santander Drive Auto Receivables Trust, Ser 2015-1, Class B, 1.970%, 11/15/19 | | 288,603 | | 289,031 | | — | | — | | | | | | | | 288,603 | | 289,031 |
| Sonic Capital LLC, Ser 2016-1A, Class A2, 144a 4.472%, 5/20/46 | | 313,163 | | 308,609 | | — | | — | | | | | | | | 313,163 | | 308,609 |
| SpringCastle America Funding LLC, Ser 2016-AA, Class A, 144a 3.050%, 4/25/29 | | 434,579 | | 437,245 | | — | | — | | | | | | | | 434,579 | | 437,245 |
| Taco Bell Funding, LLC, 3.832%, 5/25/26 | | — | | — | | — | | — | | | | | | | | — | | — |
| Asset-Backed Securities Total | | | | 5,727,219 | | | | — | | | | | | | | | | 5,727,219 |
| | | | | | | | | | | | | | | | | | | |
| Non-Agency Collateralized Mortgage Obligations - 1.1% | | | | | | | | | | | | | | | | | | |
| Adjustable Rate Mortgage Trust, Ser 2004-4, Class 3A1, 3.336%, 3/25/35(A) | | 4,388 | | 4,234 | | — | | — | | | | | | | | 4,388 | | 4,234 |
| Alternative Loan Trust, Ser 2004-30CB, Class 3A1, 5.000%, 2/25/20 | | 283,674 | | 281,120 | | — | | — | | | | | | | | 283,674 | | 281,120 |
| Alternative Loan Trust, Ser 2005-J3, Class 3A1, 6.500%, 9/25/34 | | 25,957 | | 25,499 | | — | | — | | | | | | | | 25,957 | | 25,499 |
| CSFB Mortgage-Backed Trust, Ser 2004-7, Class 6A1, 5.250%, 10/25/19 | | 49,863 | | 50,409 | | — | | — | | | | | | | | 49,863 | | 50,409 |
| JP Morgan Mortgage Trust, Ser 2005-A1, Class 2A1, 3.268%, 2/25/35(A) | | 106,458 | | 107,572 | | — | | — | | | | | | | | 106,458 | | 107,572 |
| JP Morgan Mortgage Trust, Ser 2005-A2, Class 7CB1, 3.367%, 4/25/35(A) | | 272,584 | | 273,935 | | — | | — | | | | | | | | 272,584 | | 273,935 |
| JP Morgan Mortgage Trust, Ser 2006-A4, Class 2A2, 3.082%, 6/25/36(A) | | 62,113 | | 55,689 | | — | | — | | | | | | | | 62,113 | | 55,689 |
| MASTR Alternative Loans Trust, Ser 2004-7, Class 10A1, 6.000%, 6/25/34 | | 53,990 | | 54,264 | | — | | — | | | | | | | | 53,990 | | 54,264 |
| Residential Asset Securitization Trust, Ser 2006-A1, Class 1A3, 6.000%, 4/25/36 | | 213,117 | | 163,546 | | — | | — | | | | | | | | 213,117 | | 163,546 |
| Sequoia Mortgage Trust, Ser 2013-10, Class B2, 144a 3.568%, 8/25/43(A) | | 595,221 | | 583,456 | | — | | — | | | | | | | | 595,221 | | 583,456 |
| | | Touchstone Active Bond
Fund | | Sentinel Government Securities
Fund | | | Pro Forma Adjustments | | Proforma Combined
Touchstone Active Bond
Fund |
| | | Principal
Amount | | Market
Value | | Principal
Amount | | Market
Value | | | Principal
Amount | | Market
Value | | Principal
Amount | | Market
Value |
| Structured Asset Securities Corp. Mortgage Pass-Through Certificates, Ser 2004-21XS, Class 2A6B, 5.650%, 12/25/34(C) | | 1,987 | | 2,015 | | — | | — | | | | | | | | 1,987 | | 2,015 |
| Structured Asset Securities Corp. Trust, Ser 2005-17, Class 5A1, 5.500%, 10/25/35 | | 150,892 | | 120,104 | | — | | — | | | | | | | | 150,892 | | 120,104 |
| Towd Point Mortgage Trust, Ser 2015-3, Class A2, 144a 4.000%, 3/25/54(A) | | 700,000 | | 707,540 | | — | | — | | | | | | | | 700,000 | | 707,540 |
| Towd Point Mortgage Trust, Ser 2016-2, Class A1, 144a 3.000%, 8/25/55(A) | | 374,288 | | 375,506 | | — | | — | | | | | | | | 374,288 | | 375,506 |
| Washington Mutual Alternative Mortgage Pass-Through Certificates, Ser 2005-9, Class 2A4, 5.500%, 11/25/35 | | 124,450 | | 111,639 | | — | | — | | | | | | | | 124,450 | | 111,639 |
| Wells Fargo Mortgage Backed Securities Trust, Ser 2003-G, Class A1, 2.895%, 6/25/33(A) | | 125,129 | | 125,372 | | — | | — | | | | | | | | 125,129 | | 125,372 |
| Non-Agency Collateralized Mortgage Obligations Total | | | | 3,041,900 | | | | — | | | | | | | | | | 3,041,900 |
| | | | | | | | | | | | | | | | | | | |
| Commercial Mortgage-Backed Securities - 0.6% | | | | | | | | | | | | | | | | | | |
| Cosmopolitan Hotel Trust, Ser 2016-CSMO, Class A, 144a 2.312%, 11/15/33(A) | | 595,000 | | 599,840 | | — | | — | | | | | | | | 595,000 | | 599,840 |
| Eleven Madison Trust Mortgage Trust, Ser 2015-11MD, Class C, 144a 3.555%, 9/10/35(A) | | 550,000 | | 546,464 | | — | | — | | | | | | | | 550,000 | | 546,464 |
| J.P. Morgan Chase Commercial Mortgage Securities Trust, Ser 2016-NINE, Class B, 144a 2.854%, 10/6/38(A) | | 528,000 | | 503,906 | | — | | — | | | | | | | | 528,000 | | 503,906 |
| Commercial Mortgage-Backed Securities Total | | | | 1,650,210 | | | | — | | | | | | | | | | 1,650,210 |
| | | | | | | | | | | | | | | | | | | |
| | | Shares | | | | Shares | | | | | Shares | | | | Shares | | |
| Preferred Stocks - 0.4% | | | | | | | | | | | | | | | | | | |
| | | | | | | | | | | | | | | | | | | |
| Utilities - 0.2% | | | | | | | | | | | | | | | | | | |
| Entergy Arkansas, Inc., 4.875% | | 8,634 | | 196,164 | | — | | — | | | | | | | | 8,634 | | 196,164 |
| Entergy Louisiana LLC, 4.875% | | 8,769 | | 198,267 | | — | | — | | | | | | | | 8,769 | | 198,267 |
| Entergy Mississippi, Inc., 4.900% | | 7,966 | | 180,271 | | — | | — | | | | | | | | 7,966 | | 180,271 |
| | | | | 574,702 | | | | — | | | | | | | | | | 574,702 |
| | | | | | | | | | | | | | | | | | | |
| Real Estate - 0.2% | | | | | | | | | | | | | | | | | | |
| Public Storage, 4.900% | | 19,007 | | 427,467 | | — | | — | | | | | | | | 19,007 | | 427,467 |
| | | | | | | | | | | | | | | | | | | |
| Preferred Stocks Total | | | | 1,002,169 | | | | — | | | | | | | | | | 1,002,169 |
| | | | | | | | | | | | | | | | | | | |
| | | Principal
Amount | | | | Principal
Amount | | | | | Principal
Amount | | | | Principal
Amount | | |
| Agency Collateralized Mortgage Obligations - 0.1% | | | | | | | | | | | | | | | | | | |
| FNMA REMIC, Ser 2015-51, Class KC, 3.000%, 6/25/45 | | 138,812 | | 140,345 | | — | | — | | | | | | | | 138,812 | | 140,345 |
| FNMA Trust, Ser 2004-W15, Class 2AF, 1.232%, 8/25/44(A) | | 139,845 | | 138,784 | | — | | — | | | | | | | | 139,845 | | 138,784 |
| GNMA, Ser 2003-11, Class GJ, 4.000%, 10/17/29 | | 10,844 | | 11,403 | | — | | — | | | | | | | | 10,844 | | 11,403 |
| Agency Collateralized Mortgage Obligations Total | | | | 290,532 | | | | — | | | | | | | | | | 290,532 |
| | | | | | | | | | | | | | | | | | | |
| Sovereign Bond - 0.1% | | | | | | | | | | | | | | | | | | |
| Bermuda Government International Bond, 144a 3.717%, 1/25/27 | | 253,000 | | 243,520 | | — | | — | | | | | | | | 253,000 | | 243,520 |
| | | Touchstone Active Bond
Fund | | Sentinel Government Securities
Fund | | | Pro Forma Adjustments | | Proforma Combined
Touchstone Active Bond
Fund |
| | | Shares | | Market
Value | | Shares | | Market
Value | | | Shares | | Market
Value | | Shares | | Market
Value |
| Short Term Investments - 3.6% | | | | | | | | | | | | | | | | | | |
| Dreyfus Government Cash Management, Institutional Shares, 0.66%∞Ω | | 574,093 | | 574,093 | | — | | — | | | | | | | | 574,093 | | 574,093 | |
| Invesco Government & Agency Portfolio, Institutional Class, 0.61%**∞Ω | | 609,596 | | 609,596 | | — | | — | | | | | | | | 609,596 | | 609,596 | |
| State Street Institutional U.S. Government Money Market Fund Premier Class | | — | | — | | 9,311,136 | | 9,311,136 | (D) | | (250,827 | ) | (250,827 | )(E) | | 9,060,309 | | 9,060,309 | |
| Short Term Investments Total | | | | 1,183,689 | | | | 9,311,136 | | | | | (250,827 | ) | | | | 10,243,998 | |
| | | | | | | | | | | | | | | | | | | | |
Total Investment Securities - 101.8%
(Cost $287,192,476) | | | | 103,304,990 | | | | 186,644,318 | | | | | (250,827 | ) | | | | 289,698,481 | |
| | | | | | | | | | | | | | | | | | | | |
| Liabilities in Excess of Other Assets - -1.8% | | | | 155,891 | | | | (5,663,272 | ) | | | | 250,827 | (E) | | | | (5,256,554 | ) |
| | | | | | | | | | | | | | | | | | | | |
| Net Assets - 100.0% | | | | $103,460,881 | | | | $180,981,046 | | | | | — | | | | | $284,441,927 | |
| (A) | Variable rate security - Rate reflected is the rate in effect as of March 31, 2017. |
| (B) | Perpetual Bond - A Bond with no definite maturity date. |
| (C) | Step Bond - A bond that pays an initial interest rate for the first period and then a higher interest rate for the following periods until maturity. The interest rate shown reflects the rate in effect as of March 31, 2017. |
| (E) | Following the Reorganization, all or a portion of this security may be sold. It is expected that the Touchstone Active Bond Fund will sell approximately 67% of the securities acquired from the Target Fund. If such sales had occurred as of 3/31/17, shareholders would have recognized capital gains of $0.07 per share of the Proforma Combined Touchstone Active Bond Fund. |
| (E) | Deferred compensation plan will be redeemed prior to conversion. |
| ** | Represents collateral for securities loaned. |
| † | All or a portion of the security is on loan. The total market value of the securities on loan as of March 31, 2017 was $573,430. |
| ∞ | Open-End Fund. |
| Ω | Represents the 7-day SEC yield as of March 31, 2017. |
FHLMC - Federal Home Loan Mortgage Corporation
FNMA - Federal National Mortgage Association
GNMA - Government National Mortgage Association
LLC - Limited Liability Company
LP - Limited Partnership
MTN - Medium Term Note
PLC - Public Limited Company
REIT - Real Estate Investment Trust
REMIC - Real Estate Mortgage Investment Conduit
144a - This is a restricted security that was sold in a transaction qualifying for the exemption under Rule 144A of the Securities Act of 1933. This security may be sold in transactions exempt from registration, normally to qualified institutional buyers. At March 31, 2017, these securities were valued at $14,095,446 or 2.5% of net assets. These securities were deemed liquid pursuant to procedures approved by the Board of Trustees.
| Description | | Level 1 | | | Level 2 | | | Level 3 | | | Total | |
| U.S. Government Mortgage-Backed Obligations | | $ | — | | | S | 189,923,125 | | | $ | — | | | $ | 189,923,125 | |
| Corporate Bonds | | | — | | | | 42,092,157 | | | | — | | | | 42,092,157 | |
| U.S. Treasury Obligations | | | — | | | | 35,483,650 | | | | — | | | | 35,483,650 | |
| Asset-Backed Securities | | | — | | | | 5,727,219 | | | | — | | | | 5,727,219 | |
| Non-Agency Collateralized Mortgage Obligations | | | — | | | | 3,041,900 | | | | — | | | | 3,041,900 | |
| Commercial Mortgage-Backed Securities | | | — | | | | 1,650,210 | | | | — | | | | 1,650,210 | |
| Preferred Stocks | | | 1,002,169 | | | | — | | | | — | | | | 1,002,169 | |
| Agency Collateralized Mortgage Obligations | | | — | | | | 290,532 | | | | — | | | | 290,532 | |
| Sovereign Bond | | | — | | | | 243,520 | | | | — | | | | 243,520 | |
| Short Term Investments | | | 1,183,689 | | | | 9,060,309 | | | | — | | | | 10,243,998 | |
| Total | | $ | 2,185,858 | | | $ | 287,512,623 | | | $ | — | | | $ | 289,698,481 | |
Pro Forma Financial Statements for the Reorganization of Sentinel Total Return Bond Fund into Touchstone Active Bond Fund
Pro Forma Statement of Assets and Liabilities
As of March 31, 2017 (Unaudited)
| | | Sentinel Total
Return Bond
Fund | | | Touchstone
Active Bond
Fund | | | Pro Forma
Adjustments | | | Proforma
Combined
Touchstone
Active Bond
Fund | |
| Assets | | | | | | | | | | | | |
| Investments, at cost | | $ | 288,587,030 | | | $ | 101,703,072 | | | | (88,618 | )(1) | | $ | 390,201,484 | |
| Investments, at market value (A) | | $ | 290,226,264 | | | $ | 103,304,990 | | | | (88,618 | )(1) | | $ | 393,442,636 | |
| Cash deposits held at prime broker (B) | | | 760,626 | | | | 23,588 | | | | | | | | 784,214 | |
| Dividends and interest receivable | | | 1,498,126 | | | | 682,649 | | | | | | | | 2,180,775 | |
| Receivable for capital shares sold | | | 695,824 | | | | 85,374 | | | | | | | | 781,198 | |
| Receivable for investments sold | | | 3,575 | | | | 395,712 | | | | | | | | 399,287 | |
| Receivable for variation margin on futures contracts | | | - | | | | 8,930 | | | | | | | | 8,930 | |
| Receivable for securities lending income | | | 124 | | | | 294 | | | | | | | | 418 | |
| Receivable from Fund Advisor | | | 7,370 | | | | - | | | | | | | | 7,370 | |
| Other assets | | | - | | | | 32,178 | | | | | | | | 32,178 | |
| Total Assets | | | 293,191,909 | | | | 104,533,715 | | | | (88,618 | ) | | | 397,637,006 | |
| | | | | | | | | | | | | | | | | |
| Liabilities | | | | | | | | | | | | | | | | |
| Bank Overdrafts | | | - | | | | 13,914 | | | | | | | | 13,914 | |
| Payable to Transfer Agent | | | 45,656 | | | | 37,595 | | | | | | | | 83,251 | |
| Payable for return of collateral for securities on loan | | | - | | | | 609,596 | | | | | | | | 609,596 | |
| Payable for capital shares redeemed | | | 784,635 | | | | 145,476 | | | | | | | | 930,111 | |
| Payable for investments purchased | | | 9,496,445 | | | | 182,573 | | | | | | | | 9,679,018 | |
| Payable for variation margin on futures contracts | | | 67,188 | | | | - | | | | | | | | 67,188 | |
| Payable to Investment Advisor | | | 132,301 | | | | 27,471 | | | | | | | | 159,772 | |
| Payable to other affiliates | | | 41,094 | | | | 5,850 | | | | | | | | 46,944 | |
| Payable to Trustees and Compliance Fees | | | 2,142 | | | | 3,914 | | | | | | | | 6,056 | |
| Payable for Professional Services | | | 40,898 | | | | 15,462 | | | | | | | | 56,360 | |
| Deferred Compensation | | | 88,618 | | | | - | | | | (88,618 | )(1) | | | - | |
| Other accrued expenses and liabilities | | | 31,520 | | | | 30,983 | | | | | | | | 62,503 | |
| Total Liabilities | | | 10,730,497 | | | | 1,072,834 | | | | (88,618 | ) | | | 11,714,713 | |
| Net Assets | | $ | 282,461,412 | | | $ | 103,460,881 | | | | - | | | $ | 385,922,293 | |
| Net assets consist of: | | | | | | | | | | | | | | | | |
| Par Value | | $ | 274,851 | (C) | | $ | 100,381 | (D) | | | | | | $ | 375,232 | |
| Paid-in capital | | | 314,359,888 | | | | 110,833,964 | | | | | | | | 425,193,852 | |
| Accumulated net investment income (loss) | | | (466,516 | ) | | | (12,866 | ) | | | | | | | (479,382 | ) |
| Accumulated net realized gains (losses) on investments, foreign currency transactions, written options and securities sold short | | | (32,991,102 | ) | | | (9,071,098 | ) | | | | | | | (42,062,200 | ) |
| Net unrealized appreciation (depreciation) on investments, foreign currency transactions, written options and securities sold short | | | 1,284,291 | | | | 1,610,500 | | | | | | | | 2,894,791 | |
| Net Assets applicable to shares outstanding | | $ | 282,461,412 | | | $ | 103,460,881 | | | | | | | $ | 385,922,293 | |
| Pricing of Class A Shares | | | | | | | | | | | | | | | | |
| Net assets attributable to Class A shares | | $ | 64,109,477 | | | $ | 23,444,475 | | | $ | 609,755 | (H) | | $ | 88,163,707 |
| Shares of beneficial interest outstanding | | | 6,240,246 | (C) | | | 2,264,218 | (D) | | | 10,201 | | | | 8,514,665 | |
| Net asset value and redemption price per share | | $ | 10.27 | (E) | | $ | 10.35 | (F) | | | | | | $ | 10.35 | (F) |
| Maximum sales charge - Class A shares | | | 2.25 | % | | | 4.75 | % | | | | | | | 4.75 | % |
| Maximum offering price per share | | $ | 10.51 | | | $ | 10.87 | | | | | | | $ | 10.87 | |
| | | | | | | | | | | | | | | | | |
| Pricing of Class C Shares | | | | | | | | | | | | | | | | |
| Net assets attributable to Class C shares | | $ | 23,784,867 | | | $ | 5,466,677 | | | | | | | $ | 29,251,544 | |
| Shares of beneficial interest outstanding | | | 2,321,707 | (C) | | | 570,446 | (D) | | | 160,236 | | | | 3,052,389 | |
| Net asset value, offering price and redemption price per share(G) | | $ | 10.24 | | | $ | 9.58 | | | | | | | $ | 9.58 | |
| | | | | | | | | | | | | | | | | |
| Pricing of Class R3 Shares | | | | | | | | | | | | | | | | |
| Net assets attributable to Class R3 shares(H) | | $ | 609,755 | | | | - | | | $ | (609,755 | ) | | | - | |
| Shares of beneficial interest outstanding | | | 59,363 | (C) | | | - | | | | (59,363 | ) | | | - | |
| Net asset value, offering price and redemption price per share(G) | | $ | 10.27 | | | | | | | | | | | | - | |
| | Sentinel Total
Return Bond
Fund | | | Touchstone
Active Bond
Fund | | | Pro Forma
Adjustments | | | Proforma
Combined
Touchstone
Active Bond
Fund | |
| | | | | | | | | | | | | |
| Pricing of Class R6 Shares | | | | | | | | | | | | | | | | |
| Net assets attributable to Class R6 shares(I) | | $ | 612,150 | | | | - | | | $ | (612,150 | ) | | | - | |
| Shares of beneficial interest outstanding | | | 59,537 | (C) | | | - | | | | (59,537 | ) | | | - | |
| Net asset value, offering price and redemption price per share(G) | | $ | 10.28 | | | | | | | | | | | | - | |
| | | | | | | | | | | | | | | | | |
| Pricing of Class Y Shares | | | | | | | | | | | | | | | | |
| Net assets attributable to Class Y shares(J) | | $ | 193,345,163 | | | $ | 67,760,762 | | | $ | 612,150 | | | $ | 261,718,075 | |
| Shares of beneficial interest outstanding | | | 18,804,288 | (C) | | | 6,547,101 | (D) | | | (63,972 | ) | | | 25,287,417 | |
| Net asset value, offering price and redemption price per share(G) | | $ | 10.28 | | | $ | 10.35 | | | | | | | $ | 10.35 | |
| | | | | | | | | | | | | | | | | |
| Pricing of Institutional Class Shares | | | | | | | | | | | | | | | | |
| Net assets attributable to Institutional Class shares | | | | | | $ | 6,788,967 | | | | | | | $ | 6,788,967 | |
| Shares of beneficial interest outstanding | | | | | | | 656,297 | (D) | | | | | | | 656,297 | |
| Net asset value, offering price and redemption price per share | | | | | | $ | 10.34 | | | | | | | $ | 10.34 | |
(A) Includes market value of securities on loan of: $573,430 for the Touchstone Active Board Fund and the Pro Forma Combined Touchstone Active Bond Fund.
(B) Represents segregated cash for futures contracts
(C) Limited number of shares authorized, par value of $.01
(D) Unlimited number of shares authorized, par value of $.01
(E) There is no sales load on subscriptions of $500,000 or more. Redemptions that were part of a $500,000 or more subscription may be subject to a contingent deferred sales load if redeemed within a one-year period from the date of purchase.
(F) There is no sales load on subscriptions of $1 million or more. Redemptions that were part of a $1 million or more subscription may be subject to a contingent deferred sales load if redeemed within a one-year period from the date of purchase.
(G) Redemption price per share varies by length of time shares are held due to the terms of the contingent deferred sales charge.
(H) Sentinel Total Return Bond Fund Class R3 shares will convert to Touchstone Active Bond Fund Class A shares.
(I) Sentinel Total Return Bond Fund Class R6 shares will convert to Touchstone Active Bond Fund Class Y shares.
(J) Sentinel Total Return Bond Funds Class I shares will convert to Touchstone Active Bond Fund Class Y shares.
(1) Deferred compensation plan will be redeemed prior to conversion.
Pro Forma Statement of Operations
For the twelve months ending March 31, 2017 (Unaudited)
| | | Sentinel
Total Return
Bond Fund | | | Touchstone
Active Bond
Fund | | | Pro Forma
Adjustments | | | Proforma
Combined
Touchstone
Active Bond
Fund | |
| Investment Income | | | | | | | | | | | | | | | | |
| Dividends | | $ | 5,792,678 | | | $ | 40,516 | | | $ | - | | | $ | 5,833,194 | |
| Interest Income | | | 6,045,264 | | | | 3,691,667 | | | | - | | | | 9,736,931 | |
| Income from Securities loaned | | | 113,304 | | | | 1,082 | | | | - | | | | 114,386 | |
| Total Investment Income | | | 11,951,246 | | | | 3,733,265 | | | | - | | | | 15,684,511 | |
| Expenses | | | | | | | | | | | | | | | | |
| Investment advisory fees | | | 2,281,007 | | | | 437,642 | | | | (631,996 | )(A) | | | 2,086,653 | |
| Accounting and Administration services | | | 163,341 | | | | 158,645 | | | | 480,341 | (A) | | | 802,327 | |
| Compliance fees and expenses | | | 33,358 | | | | 2,856 | | | | (33,824 | )(B) | | | 2,390 | |
| Custody fees | | | 52,454 | | | | 44,338 | | | | - | | | | 96,792 | |
| Professional fees | | | 50,175 | | | | 32,858 | | | | (50,175 | )(B) | | | 32,858 | |
| Transfer Agent fees, Class A | | | 287,917 | | | | 34,505 | | | | - | | | | 322,422 | |
| Transfer Agent fees, Class C | | | 31,844 | | | | 7,534 | | | | - | | | | 39,378 | |
| Transfer Agent fees, Class Y | | | 414,073 | | | | 99,337 | | | | - | (C) | | | 513,410 | |
| Transfer Agent fees, Institutional Class | | | - | | | | 145 | | | | - | | | | 145 | |
| Transfer Agent fees, Class R3 | | | 9 | | | | - | | | | (9 | )(C) | | | - | |
| Transfer Agent fees, Class R6 | | | 9 | | | | - | | | | (9 | )(C) | | | - | |
| Registration Fees, Class A | | | 13,876 | | | | 12,201 | | | | (12,201 | )(B) | | | 13,876 | |
| Registration Fees, Class C | | | 13,089 | | | | 11,037 | | | | (11,037 | )(B) | | | 13,089 | |
| Registration Fees, Class Y | | | 24,026 | | | | 14,117 | | | | (14,117 | )(B)(C) | | | 24,026 | |
| Registration Fees, Institutional Class | | | - | | | | 10,572 | | | | - | | | | 10,572 | |
| Registration Fees, Class R3 | | | 13,585 | | | | - | | | | (13,585 | )(B)(C) | | | - | |
| Registration Fees, Class R6 | | | 13,785 | | | | - | | | | (13,785 | )(B)(C) | | | - | |
| Reports to Shareholders, Class A | | | 5,551 | | | | 3,131 | | | | - | | | | 8,682 | |
| Reports to Shareholders, Class C | | | 1,239 | | | | 2,021 | | | | - | | | | 3,260 | |
| Reports to Shareholders, Class Y | | | 4,647 | | | | 2,503 | | | | - | (C) | | | 7,150 | |
| Reports to Shareholders, Class Institutional Class | | | - | | | | 1,729 | | | | - | | | | 1,729 | |
| Reports to Shareholders, Class R3 | | | 4 | | | | - | | | | (4 | )(C) | | | - | |
| Reports to Shareholders, Class R6 | | | 4 | | | | - | | | | (4 | )(C) | | | - | |
| Distribution expenses, Class A | | | 198,520 | | | | 63,280 | | | | 51,677 | (D) | | | 313,477 | |
| Distribution expenses, Class C | | | 321,778 | | | | 63,529 | | | | - | | | | 385,307 | |
| Trustee fees | | | 55,927 | | | | 16,205 | | | | (58,651 | )(B) | | | 13,481 | |
| Other expenses | | | 27,002 | | | | 94,055 | | | | (711 | )(B) | | | 120,346 | |
| Total Expenses | | | 4,007,220 | | | | 1,112,240 | | | | (308,090 | ) | | | 4,811,370 | |
| Fees waived and/or reimbursed by the Advisor and/or Affiliates | | | (278,750 | ) | | | (279,694 | ) | | | 37,400 | (E) | | | (521,044 | ) |
| Net Expenses | | | 3,728,470 | | | | 832,546 | | | | (270,690 | ) | | | 4,290,326 | |
| Net Investment Income (Loss) | | | 8,222,776 | | | | 2,900,719 | | | | 270,690 | | | | 11,394,185 | |
| Realized and Unrealized Gains (Losses) on Investments | | | | | | | | | | | | | | | | |
| Net realized gains (losses) on investments | | | 11,192,200 | | | | 16,937 | | | | - | | | | 11,209,137 | |
| Net realized gains (losses) on futures contracts | | | 81,682 | | | | 5,651 | | | | - | | | | 87,333 | |
| Net realized gains (losses) on swap agreements | | | - | | | | (558 | ) | | | - | | | | (558 | ) |
| Net realized gains (losses) on securities sold short | | | - | | | | - | | | | - | | | | - | |
| Net change in unrealized appreciation (depreciation) on investments | | | (9,989,198 | ) | | | 441,820 | | | | - | | | | (9,547,378 | ) |
| Net change in unrealized appreciation (depreciation) on foreign currency transactions | | | - | | | | 3,861 | | | | - | | | | 3,861 | |
| Net change in unrealized appreciation (depreciation) on futures contracts | | | (69,138 | ) | | | 8,539 | | | | - | | | | (60,599 | ) |
| Net Realized and Unrealized Gains (Losses) on Investments | | | 1,215,546 | | | | 476,250 | | | | - | | | | 1,691,796 | |
| Change in Net Assets Resulting from Operations | | $ | 9,438,322 | | | $ | 3,376,969 | | | $ | 270,690 | | | $ | 13,085,981 | |
(A) Reflects the impact of applying the Acquiring Fund’s Investment Advisory and Administration fee rates following the Reorganization to the combined fund’s average net assets.
(B) Reflects the anticipated reduction of certain duplicative expenses eliminated as a result of the Reorganization.
(C) Holders of Sentinel Total Return Bond Fund Class I, Class R3 and Class R6 shares will receive Class Y, Class A and Class Y shares, respectively, of the Touchstone Active Bond Fund upon closing of the reorganization.
(D) Reflects the impact of applying the Acquiring Fund’s 12b-1 distribution fee rate following the Reorganization to the combined fund’s average net assets.
(E) Reflects the increase (decrease) in expense reimbursement payments the advisor would have made to the combined fund if the Reorganization had occurred on the first day of the 12-month period ended March 31, 2017.
(F) Reflects the anticipated increase of certain expenses as a result of the Reorganization.
Pro Forma Portfolio of Investments
As of March 31, 2017 (Unaudited)
| | | Touchstone Active Bond
Fund | | Sentinel Total Return Bond Fund | | Pro Forma Adjustments | | Proforma Combined
Touchstone Active Bond Fund |
| | | Principal
Amount | | Market
Value | | Principal
Amount | | Market
Value | | Principal
Amount | | Market
Value | | Principal
Amount | | Market
Value |
| Bank Loans - 32.6% | | | | | | | | | | | | | | | | |
| Consumer Non-Cyclical - 7.4% | | | | | | | | | | | | | | | | |
| Abbott Laboratories, 4.900%, 11/30/46 | | - | $ | - | | 800,000 | $ | 829,458 | (E) | | $ | | | 800,000 | $ | 829,458 |
| Altria Group, Inc., 3.875%, 9/16/46 | | - | | - | | 3,000,000 | | 2,775,294 | (E) | | | | | 3,000,000 | | 2,775,294 |
| Amgen, Inc., 2.600%, 8/19/26 | | - | | - | | 3,000,000 | | 2,780,574 | (E) | | | | | 3,000,000 | | 2,780,574 |
| Anheuser-Busch InBev Finance, Inc., 4.900%, 2/1/46 | | - | | - | | 2,900,000 | | 3,131,243 | (E) | | | | | 2,900,000 | | 3,131,243 |
| Cardinal Health, Inc., 4.900%, 9/15/45 | | - | | - | | 2,010,000 | | 2,078,786 | (E) | | | | | 2,010,000 | | 2,078,786 |
| DaVita, Inc., 5.125%, 7/15/24 | | - | | - | | 600,000 | | 606,000 | (E) | | | | | 600,000 | | 606,000 |
| Express Scripts Holding Co., 3.400%, 3/1/27 | | - | | - | | 3,000,000 | | 2,825,220 | (E) | | | | | 3,000,000 | | 2,825,220 |
| HCA, Inc., 5.375%, 2/1/25 | | - | | - | | 600,000 | | 624,000 | (E) | | | | | 600,000 | | 624,000 |
| Kraft Heinz Foods Co., 4.375%, 6/1/46 | | - | | - | | 3,000,000 | | 2,803,416 | (E) | | | | | 3,000,000 | | 2,803,416 |
| Medtronic, Inc., 3.500%, 3/15/25 | | - | | - | | 2,900,000 | | 2,965,586 | (E) | | | | | 2,900,000 | | 2,965,586 |
| Molson Coors Brewing Co., 3.000%, 7/15/26 | | - | | - | | 3,000,000 | | 2,852,496 | (E) | | | | | 3,000,000 | | 2,852,496 |
| Thermo Fisher Scientific, Inc., 2.950%, 9/19/26 | | - | | - | | 3,000,000 | | 2,856,042 | (E) | | | | | 3,000,000 | | 2,856,042 |
| Zoetis, Inc., 3.250%, 2/1/23 | | - | | - | | 1,386,000 | | 1,399,498 | (E) | | | | | 1,386,000 | | 1,399,498 |
| | | | | - | | | | 28,527,614 | | | | | | | | 28,527,614 |
| Communications - 6.6% | | | | | | | | | | | | | | | | |
| AMC Networks, Inc., 5.000%, 4/1/24 | | - | | - | | 2,880,000 | | 2,883,600 | (E) | | | | | 2,880,000 | | 2,883,600 |
| America Movil SAB de CV, 6.125%, 3/30/40 | | - | | - | | 900,000 | | 1,049,743 | (E) | | | | | 900,000 | | 1,049,743 |
| AT&T, Inc., 3.800%, 3/15/22 | | - | | - | | 5,231,000 | | 5,410,157 | (E) | | | | | 5,231,000 | | 5,410,157 |
| CBS Corp., 4.000%, 1/15/26 | | - | | - | | 3,000,000 | | 3,071,445 | (E) | | | | | 3,000,000 | | 3,071,445 |
| CCO Holdings LLC, 5.750%, 2/15/26 | | - | | - | | 600,000 | | 630,000 | (E) | | | | | 600,000 | | 630,000 |
| Comcast Corp., 2.350%, 1/15/27 | | - | | - | | 2,900,000 | | 2,655,977 | (E) | | | | | 2,900,000 | | 2,655,977 |
| Cox Communications, Inc., 3.350%, 9/15/26 | | - | | - | | 800,000 | | 773,900 | (E) | | | | | 800,000 | | 773,900 |
| CSC Holdings LLC, 10.875%, 10/15/25 | | - | | - | | 1,900,000 | | 2,284,750 | (E) | | | | | 1,900,000 | | 2,284,750 |
| Frontier Communications Corp., 11.000%, 9/15/25 | | - | | - | | 600,000 | | 581,625 | (E) | | | | | 600,000 | | 581,625 |
| GCI, Inc., 6.875%, 4/15/25 | | - | | - | | 1,434,000 | | 1,502,115 | (E) | | | | | 1,434,000 | | 1,502,115 |
| SFR Group SA, 7.375%, 5/1/26 | | - | | - | | 600,000 | | 618,000 | (E) | | | | | 600,000 | | 618,000 |
| Sprint Corp., 7.875%, 9/15/23 | | - | | - | | 600,000 | | 664,500 | (E) | | | | | 600,000 | | 664,500 |
| Telesat Canada / Telesat LLC, 8.875%, 11/15/24 | | - | | - | | 600,000 | | 658,500 | (E) | | | | | 600,000 | | 658,500 |
| Time Warner, Inc., 3.800%, 2/15/27 | | - | | - | | 2,900,000 | | 2,868,059 | (E) | | | | | 2,900,000 | | 2,868,059 |
| | | | | - | | | | 25,652,370 | | | | | | | | 25,652,370 |
| Consumer Cyclical - 4.0% | | | | | | | | | | | | | | | | |
| Amazon.com, Inc., 4.950%, 12/5/44 | | - | | - | | 900,000 | | 1,017,365 | (E) | | | | | 900,000 | | 1,017,365 |
| DR Horton, Inc., 4.750%, 2/15/23 | | - | | - | | 1,150,000 | | 1,223,646 | (E) | | | | | 1,150,000 | | 1,223,646 |
| General Motors Financial Co., Inc., 3.200%, 7/6/21 | | - | | - | | 2,150,000 | | 2,157,946 | (E) | | | | | 2,150,000 | | 2,157,946 |
| General Motors Financial Co., Inc., 5.250%, 3/1/26 | | - | | - | | 2,000,000 | | 2,148,620 | (E) | | | | | 2,000,000 | | 2,148,620 |
| Macy’s Retail Holdings, Inc., 2.875%, 2/15/23 | | - | | - | | 800,000 | | 748,358 | (E) | | | | | 800,000 | | 748,358 |
| McDonald’s Corp., 3.700%, 1/30/26 | | - | | - | | 2,900,000 | | 2,965,821 | (E) | | | | | 2,900,000 | | 2,965,821 |
| QVC, Inc., 5.450%, 8/15/34 | | - | | - | | 2,325,000 | | 2,143,738 | (E) | | | | | 2,325,000 | | 2,143,738 |
| Walgreens Boots Alliance, Inc., 3.450%, 6/1/26 | | - | | - | | 2,900,000 | | 2,826,993 | (E) | | | | | 2,900,000 | | 2,826,993 |
| Wynn Las Vegas LLC, 5.500%, 3/1/25 | | - | | - | | 325,000 | | 330,281 | (E) | | | | | 325,000 | | 330,281 |
| | | | | - | | | | 15,562,768 | | | | | | | | 15,562,768 |
| Technology - 3.7% | | | | | | | | | | | | | | | | |
| Broadcom Corp / Broadcom Cayman Finance Ltd., 3.875%, 1/15/27 | | - | | - | | 3,000,000 | | 3,018,912 | (E) | | | | | 3,000,000 | | 3,018,912 |
| Ericsson LM, 4.125%, 5/15/22 | | - | | - | | 2,725,000 | | 2,780,407 | (E) | | | | | 2,725,000 | | 2,780,407 |
| KLA-Tencor Corp., 4.650%, 11/1/24 | | - | | - | | 800,000 | | 851,726 | (E) | | | | | 800,000 | | 851,726 |
| Micron Technology, Inc., 4.750%, 4/26/22 | | - | | - | | 1,419,275 | | 1,424,157 | (E) | | | | | 1,419,275 | | 1,424,157 |
| Microsoft Corp., 2.400%, 8/8/26 | | - | | - | | 2,900,000 | | 2,741,982 | (E) | | | | | 2,900,000 | | 2,741,982 |
| Nuance Communications, Inc., 5.625%, 12/15/26 | | - | | - | | 325,000 | | 332,313 | (E) | | | | | 325,000 | | 332,313 |
| QUALCOMM, Inc., 3.450%, 5/20/25 | | - | | - | | 3,000,000 | | 3,043,311 | (E) | | | | | 3,000,000 | | 3,043,311 |
| | | | | - | | | | 14,192,809 | | | | | | | | 14,192,809 |
| Insurance - 2.7% | | | | | | | | | | | | | | | | |
| Chubb INA Holdings, Inc., 3.350%, 5/3/26 | | - | | - | | 2,900,000 | | 2,933,234 | (E) | | | | | 2,900,000 | | 2,933,234 |
| Manulife Financial Corp., 4.150%, 3/4/26 | | - | | - | | 1,570,000 | | 1,653,139 | (E) | | | | | 1,570,000 | | 1,653,139 |
| MetLife, Inc., 4.600%, 5/13/46 | | - | | - | | 2,900,000 | | 3,045,261 | (E) | | | | | 2,900,000 | | 3,045,261 |
| Travelers Cos, Inc., 3.750%, 5/15/46 | | - | | - | | 3,000,000 | | 2,841,951 | (E) | | | | | 3,000,000 | | 2,841,951 |
| | | | | - | | | | 10,473,585 | | | | | | | | 10,473,585 |
| Financials - 2.7% | | | | | | | | | | | | | | | | |
| Bank of America Corp., 3.248%, 10/21/27 | | - | | - | | 2,900,000 | | 2,760,235 | (E) | | | | | 2,900,000 | | 2,760,235 |
| Brookfield Asset Management, Inc., 4.000%, 1/15/25 | | - | | - | | 3,696,000 | | 3,720,519 | (E) | | | | | 3,696,000 | | 3,720,519 |
| Citizens Financial Group, Inc., 4.300%, 12/3/25 | | - | | - | | 824,000 | | 849,191 | (E) | | | | | 824,000 | | 849,191 |
| Icahn Enterprises LP, 5.875%, 2/1/22 | | - | | - | | 325,000 | | 329,875 | (E) | | | | | 325,000 | | 329,875 |
| JPMorgan Chase & Co, 2.950%, 10/1/26 | | - | | - | | 2,900,000 | | 2,756,943 | (E) | | | | | 2,900,000 | | 2,756,943 |
| | | | | - | | | | 10,416,763 | | | | | | | | 10,416,763 |
| | | Touchstone Active Bond
Fund | | Sentinel Total Return Bond Fund | | Pro Forma Adjustments | | Proforma Combined
Touchstone Active Bond Fund |
| | | Principal
Amount | | Market
Value | | Principal
Amount | | Market
Value | | Principal
Amount | | Market
Value | | Principal
Amount | | Market
Value |
| Capital Goods - 1.9% | | | | | | | | | | | | | | | | |
| Lockheed Martin Corp., 3.550%, 1/15/26 | | - | | - | | 2,900,000 | | 2,943,744 | (E) | | | | | 2,900,000 | | 2,943,744 |
| Northrop Grumman Corp., 3.850%, 4/15/45 | | - | | - | | 3,000,000 | | 2,823,324 | (E) | | | | | 3,000,000 | | 2,823,324 |
| Reynolds Group Issuer LLC, 5.125%, 7/15/23 | | - | | - | | 600,000 | | 616,500 | (E) | | | | | 600,000 | | 616,500 |
| United Technologies Corp., 2.650%, 11/1/26 | | - | | - | | 900,000 | | 867,461 | (E) | | | | | 900,000 | | 867,461 |
| | | | | - | | | | 7,251,029 | | | | | | | | 7,251,029 |
| Real Estate - 1.6% | | | | | | | | | | | | | | | | |
| HCP, Inc., 4.000%, 6/1/25 | | - | | - | | 800,000 | | 804,213 | (E) | | | | | 800,000 | | 804,213 |
| Retail Opportunity Investments Partnership LP, 5.000%, 12/15/23 | | - | | - | | 2,300,000 | | 2,376,059 | (E) | | | | | 2,300,000 | | 2,376,059 |
| Simon Property Group LP, 4.250%, 11/30/46 | | - | | - | | 3,000,000 | | 2,901,819 | (E) | | | | | 3,000,000 | | 2,901,819 |
| | | | | - | | | | 6,082,091 | | | | | | | | 6,082,091 |
| Basic Industry - 1.5% | | | | | | | | | | | | | | | | |
| CF Industries, Inc., 4.950%, 6/1/43 | | - | | - | | 2,583,000 | | 2,189,093 | (E) | | | | | 2,583,000 | | 2,189,093 |
| Domtar Corp., 6.250%, 9/1/42 | | - | | - | | 3,000,000 | | 2,959,734 | (E) | | | | | 3,000,000 | | 2,959,734 |
| Int’l. Paper Co., 4.400%, 8/15/47 | | - | | - | | 800,000 | | 754,974 | (E) | | | | | 800,000 | | 754,974 |
| | | | | - | | | | 5,903,800 | | | | | | | | 5,903,800 |
| Utilities - 0.2% | | | | | | | | | | | | | | | | |
| Electricite de France SA, 3.625%, 10/13/25 | | - | | - | | 800,000 | | 804,850 | (E) | | | | | 800,000 | | 804,850 |
| Energy - 0.1% | | | | | | | | | | | | | | | | |
| Sabine Pass Liquefaction LLC, 5.625%, 3/1/25 | | - | | - | | 325,000 | | 352,317 | (E) | | | | | 325,000 | | 352,317 |
| Transportation - 0.1% | | | | | | | | | | | | | | | | |
| XPO Logistics, Inc., 6.500%, 6/15/22 | | - | | - | | 325,000 | | 341,250 | (E) | | | | | 325,000 | | 341,250 |
| Consumer Discretionary - 0.1% | | | | | | | | | | | | | | | | |
| J Crew Group, Inc., 4.090%, 3/5/21 | | - | | - | | 325,000 | | 196,921 | (E) | | | | | 325,000 | | 196,921 |
| Bank Loans Total | | | | - | | | | 125,758,168 | | | | | | | | 125,758,168 |
| | | | | | | | | | | | | | | | | |
| | | Shares | | | | Shares | | | | Shares | | | | Shares | | |
| Exchange Traded Funds - 17.3% | | | | | | | | | | | | | | | | |
| iShares iBoxx $ Investment Grade Corporate Bond ETF | | - | | - | | 500,731 | | 59,041,192 | (E) | | | | | 500,731 | | 59,041,192 |
| SPDR Barclays Short Term Corporate Bond ETF | | - | | - | | 248,641 | | 7,610,901 | (E) | | | | | 248,641 | | 7,610,901 |
| Exchange Traded Funds Total | | | | - | | | | 66,652,093 | | | | | | | | 66,652,093 |
| | | | | | | | | | | | | | | | | |
| | | Principal
Amount | | | | Principal
Amount | | | | Principal
Amount | | | | Principal
Amount | | |
| U.S. Government Mortgage-Backed Obligations - 24.5% | | | | | | | | | | | | | | | | |
| FHLMC, J22900, 2.500%, 3/1/28 | | - | | - | | 1,091,298 | | 1,104,804 | (E) | | | | | 1,091,298 | | 1,104,804 |
| FHLMC, Q29056, 4.000%, 10/1/44 | | - | | - | | 8,019,425 | | 8,418,815 | (E) | | | | | 8,019,425 | | 8,418,815 |
| FHLMC, Q32917, 3.000%, 4/1/45 | | - | | - | | 10,665,455 | | 10,615,702 | (E) | | | | | 10,665,455 | | 10,615,702 |
| FHLMC, Q33006, 3.500%, 4/1/45 | | - | | - | | 13,113,262 | | 13,421,860 | (E) | | | | | 13,113,262 | | 13,421,860 |
| FHLMC, 1B3366, 3.447%, 3/1/37(A) | | 65,703 | | 69,384 | | - | | - | | | | | | 65,703 | | 69,384 |
| FHLMC, 1H1348, 2.681%, 10/1/36(A) | | 173,302 | | 183,254 | | - | | - | | | | | | 173,302 | | 183,254 |
| FHLMC, 1Q0339, 3.312%, 4/1/37(A) | | 595,629 | | 630,351 | | - | | - | | | | | | 595,629 | | 630,351 |
| FHLMC, A12886, 5.000%, 8/1/33 | | 24,555 | | 26,990 | | - | | - | | | | | | 24,555 | | 26,990 |
| FHLMC, A13842, 6.000%, 9/1/33 | | 61,701 | | 69,653 | | - | | - | | | | | | 61,701 | | 69,653 |
| FHLMC, A21415, 5.000%, 5/1/34 | | 14,285 | | 15,657 | | - | | - | | | | | | 14,285 | | 15,657 |
| FHLMC, A35682, 5.000%, 7/1/35 | | 33,037 | | 36,121 | | - | | - | | | | | | 33,037 | | 36,121 |
| FHLMC, A36523, 5.000%, 8/1/35 | | 17,717 | | 19,373 | | - | | - | | | | | | 17,717 | | 19,373 |
| FHLMC, A46590, 5.000%, 8/1/35 | | 85,991 | | 93,576 | | - | | - | | | | | | 85,991 | | 93,576 |
| FHLMC, A56988, 5.500%, 2/1/37 | | 28,073 | | 31,144 | | - | | - | | | | | | 28,073 | | 31,144 |
| FHLMC, A96485, 4.500%, 1/1/41 | | 179,984 | | 193,452 | | - | | - | | | | | | 179,984 | | 193,452 |
| FHLMC, A97897, 4.500%, 4/1/41 | | 824,015 | | 897,396 | | - | | - | | | | | | 824,015 | | 897,396 |
| FHLMC, C62740, 7.000%, 1/1/32 | | 26,593 | | 29,475 | | - | | - | | | | | | 26,593 | | 29,475 |
| FHLMC, C72254, 6.500%, 7/1/32 | | 26,743 | | 30,563 | | - | | - | | | | | | 26,743 | | 30,563 |
| FHLMC, C90986, 7.000%, 6/1/26 | | 100,904 | | 110,930 | | - | | - | | | | | | 100,904 | | 110,930 |
| FHLMC, G02184, 5.000%, 4/1/36 | | 29,278 | | 32,005 | | - | | - | | | | | | 29,278 | | 32,005 |
| FHLMC, G05733, 5.000%, 11/1/39 | | 457,021 | | 502,844 | | - | | - | | | | | | 457,021 | | 502,844 |
| FHLMC, J13584, 3.500%, 11/1/25 | | 279,316 | | 292,442 | | - | | - | | | | | | 279,316 | | 292,442 |
| FHR, 3859 JB, 5.000%, 5/15/41 | | - | | - | | 2,071,445 | | 2,243,361 | (E) | | | | | 2,071,445 | | 2,243,361 |
| FNMA, 725423, 5.500%, 5/1/34 | | - | | - | | 634,360 | | 710,259 | (E) | | | | | 634,360 | | 710,259 |
| FNMA, 725610, 5.500%, 7/1/34 | | - | | - | | 576,484 | | 645,739 | (E) | | | | | 576,484 | | 645,739 |
| FNMA, 890310, 4.500%, 12/1/40 | | - | | - | | 4,968,551 | | 5,349,890 | (E) | | | | | 4,968,551 | | 5,349,890 |
| FNMA, AD9193, 5.000%, 9/1/40 | | - | | - | | 1,717,237 | | 1,879,437 | (E) | | | | | 1,717,237 | | 1,879,437 |
| FNMA, AS0779, 4.000%, 10/1/43 | | - | | - | | 3,440,586 | | 3,646,810 | (E) | | | | | 3,440,586 | | 3,646,810 |
| FNMA, AT2016, 3.000%, 4/1/43 | | - | | - | | 8,672,326 | | 8,649,494 | (E) | | | | | 8,672,326 | | 8,649,494 |
| FNMA, BC1809, 3.500%, 5/1/46 | | - | | - | | 5,093,487 | | 5,213,487 | (E) | | | | | 5,093,487 | | 5,213,487 |
| FNMA, TBA 15 YR 2.5, 2.500%, 4/18/32(D) | | - | | - | | 9,400,000 | | 9,402,938 | (E) | | | | | 9,400,000 | | 9,402,938 |
| FNMA, 255628, 5.500%, 2/1/25 | | 106,683 | | 118,385 | | - | | - | | | | | | 106,683 | | 118,385 |
| FNMA, 432269, 6.500%, 8/1/28 | | 6,136 | | 6,822 | | - | | - | | | | | | 6,136 | | 6,822 |
| FNMA, 535290, 8.000%, 5/1/30 | | 5,155 | | 6,057 | | - | | - | | | | | | 5,155 | | 6,057 |
| FNMA, 540040, 7.500%, 6/1/28 | | 10,534 | | 10,560 | | - | | - | | | | | | 10,534 | | 10,560 |
| FNMA, 561741, 7.500%, 1/1/31 | | 21,437 | | 24,494 | | - | | - | | | | | | 21,437 | | 24,494 |
| FNMA, 626811, 6.500%, 6/1/17 | | 391 | | 391 | | - | | - | | | | | | 391 | | 391 |
| FNMA, 640291, 7.000%, 8/1/32 | | 60,169 | | 65,777 | | - | | - | | | | | | 60,169 | | 65,777 |
| FNMA, 653301, 6.500%, 7/1/32 | | 33,026 | | 36,720 | | - | | - | | | | | | 33,026 | | 36,720 |
| FNMA, 653502, 6.500%, 7/1/32 | | 98,661 | | 109,697 | | - | | - | | | | | | 98,661 | | 109,697 |
| FNMA, 670402, 6.500%, 6/1/32 | | 49,178 | | 55,157 | | - | | - | | | | | | 49,178 | | 55,157 |
| FNMA, 704460, 6.000%, 5/1/18 | | 4,500 | | 4,517 | | - | | - | | | | | | 4,500 | | 4,517 |
| FNMA, 725906, 2.859%, 8/1/34(A) | | 6,591 | | 6,960 | | - | | - | | | | | | 6,591 | | 6,960 |
| FNMA, 745257, 6.000%, 1/1/36 | | 274,159 | | 311,375 | | - | | - | | | | | | 274,159 | | 311,375 |
| | | Touchstone Active Bond
Fund | | Sentinel Total Return Bond Fund | | Pro Forma Adjustments | | Proforma Combined
Touchstone Active Bond Fund |
| | | Principal
Amount | | Market
Value | | Principal
Amount | | Market
Value | | Principal
Amount | | Market
Value | | Principal
Amount | | Market
Value |
| FNMA, 745974, 3.237%, 10/1/36(A) | | 2,060 | | 2,176 | | - | | - | | | | | | 2,060 | | 2,176 |
| FNMA, 810049, 5.500%, 3/1/35 | | 108,166 | | 120,358 | | - | | - | | | | | | 108,166 | | 120,358 |
| FNMA, 819297, 6.000%, 9/1/35 | | 172,728 | | 195,707 | | - | | - | | | | | | 172,728 | | 195,707 |
| FNMA, 889060, 6.000%, 1/1/38 | | 60,591 | | 68,980 | | - | | - | | | | | | 60,591 | | 68,980 |
| FNMA, 889061, 6.000%, 1/1/38 | | 130,789 | | 150,894 | | - | | - | | | | | | 130,789 | | 150,894 |
| FNMA, 893003, 7.000%, 9/1/36 | | 83,537 | | 90,242 | | - | | - | | | | | | 83,537 | | 90,242 |
| FNMA, 895657, 6.500%, 8/1/36 | | 16,840 | | 18,562 | | - | | - | | | | | | 16,840 | | 18,562 |
| FNMA, 905049, 5.500%, 11/1/36 | | 187,185 | | 207,649 | | - | | - | | | | | | 187,185 | | 207,649 |
| FNMA, 908944, 5.500%, 1/1/37 | | 182,576 | | 202,536 | | - | | - | | | | | | 182,576 | | 202,536 |
| FNMA, 928553, 5.500%, 8/1/37 | | 678,918 | | 775,962 | | - | | - | | | | | | 678,918 | | 775,962 |
| FNMA, 995220, 6.000%, 11/1/23 | | 21,146 | | 22,527 | | - | | - | | | | | | 21,146 | | 22,527 |
| FNMA, AA3467, 4.500%, 4/1/39 | | 327,531 | | 354,305 | | - | | - | | | | | | 327,531 | | 354,305 |
| FNMA, AA4584, 4.500%, 4/1/39 | | 514,572 | | 557,008 | | - | | - | | | | | | 514,572 | | 557,008 |
| FNMA, AB1800, 4.000%, 11/1/40 | | 118,034 | | 124,782 | | - | | - | | | | | | 118,034 | | 124,782 |
| FNMA, AB2452, 4.000%, 3/1/26 | | 426,964 | | 449,460 | | - | | - | | | | | | 426,964 | | 449,460 |
| FNMA, AD3775, 4.500%, 3/1/25 | | 138,363 | | 147,148 | | - | | - | | | | | | 138,363 | | 147,148 |
| FNMA, AD6193, 5.000%, 6/1/40 | | 172,483 | | 188,767 | | - | | - | | | | | | 172,483 | | 188,767 |
| FNMA, AE0996, 4.000%, 2/1/41 | | 429,900 | | 454,406 | | - | | - | | | | | | 429,900 | | 454,406 |
| FNMA, AE1568, 4.000%, 9/1/40 | | 242,964 | | 255,726 | | - | | - | | | | | | 242,964 | | 255,726 |
| FNMA, AE2497, 4.500%, 9/1/40 | | 764,985 | | 829,740 | | - | | - | | | | | | 764,985 | | 829,740 |
| FNMA, AE5441, 5.000%, 10/1/40 | | 123,218 | | 134,824 | | - | | - | | | | | | 123,218 | | 134,824 |
| FNMA, AH1135, 5.000%, 1/1/41 | | 369,972 | | 405,615 | | - | | - | | | | | | 369,972 | | 405,615 |
| FNMA, AH3483, 3.500%, 2/1/26 | | 619,875 | | 648,963 | | - | | - | | | | | | 619,875 | | 648,963 |
| FNMA, AH3671, 4.000%, 2/1/26 | | 270,908 | | 288,340 | | - | | - | | | | | | 270,908 | | 288,340 |
| FNMA, AH6622, 4.000%, 3/1/41 | | 633,787 | | 673,510 | | - | | - | | | | | | 633,787 | | 673,510 |
| FNMA, AI0805, 4.500%, 7/1/41 | | 27,662 | | 29,694 | | - | | - | | | | | | 27,662 | | 29,694 |
| FNMA, AL0150, 4.000%, 2/1/41 | | 828,217 | | 875,437 | | - | | - | | | | | | 828,217 | | 875,437 |
| FNMA, AL0211, 5.000%, 4/1/41 | | 202,072 | | 220,969 | | - | | - | | | | | | 202,072 | | 220,969 |
| GNMA II, 005175, 4.500%, 9/20/41 | | - | | - | | 2,297,331 | | 2,479,980 | (E) | | | | | 2,297,331 | | 2,479,980 |
| GNMA, 5305, 4.000%, 2/20/42 | | 40,772 | | 43,274 | | - | | - | | | | | | 40,772 | | 43,274 |
| GNMA, 748495, 4.000%, 8/15/40 | | 10,366 | | 10,961 | | - | | - | | | | | | 10,366 | | 10,961 |
| GNMA, 8503, 2.125%, 9/20/24(A) | | 19,371 | | 19,900 | | - | | - | | | | | | 19,371 | | 19,900 |
| GNR, 10-169 AW, 4.500%, 12/20/40 | | - | | - | | 2,750,000 | | 2,976,593 | (E) | | | | | 2,750,000 | | 2,976,593 |
| GNR, 10-33 PX, 5.000%, 9/20/38 | | - | | - | | 4,501,935 | | 4,714,100 | (E) | | | | | 4,501,935 | | 4,714,100 |
| GNR, 12-147 IO, 0.583%, 4/16/54 | | - | | - | | 8,324,202 | | 313,117 | (E) | | | | | 8,324,202 | | 313,117 |
| U.S. Government Mortgage-Backed Obligations Total | | | | 12,589,944 | | | | 81,786,386 | | | | | | | | 94,376,330 |
| Corporate Bonds - 11.0% | | | | | | | | | | | | | | | | |
| Financials - 2.5% | | | | | | | | | | | | | | | | |
| Air Lease Corp., 5.625%, 4/1/17 | | 250,000 | | 250,000 | | - | | - | | | | | | 250,000 | | 250,000 |
| Ally Financial, Inc., 5.750%, 11/20/25 | | 38,000 | | 38,903 | | - | | - | | | | | | 38,000 | | 38,903 |
| Ally Financial, Inc., 8.000%, 11/1/31 | | 290,000 | | 344,375 | | - | | - | | | | | | 290,000 | | 344,375 |
| Bank of America Corp. MTN, 4.000%, 1/22/25 | | 550,000 | | 549,421 | | - | | - | | | | | | 550,000 | | 549,421 |
| Bank of America Corp., 6.100%, 1/0/00(A)(B) | | 630,000 | | 667,485 | | - | | - | | | | | | 630,000 | | 667,485 |
| Barclays PLC (United Kingdom), 3.250%, 1/12/21 | | 370,000 | | 372,605 | | - | | - | | | | | | 370,000 | | 372,605 |
| Branch Banking & Trust Co., 3.625%, 9/16/25 | | 384,000 | | 393,382 | | - | | - | | | | | | 384,000 | | 393,382 |
| Capital One NA, 1.650%, 2/5/18 | | 575,000 | | 574,903 | | - | | - | | | | | | 575,000 | | 574,903 |
| Chubb INA Holdings, Inc., 4.350%, 11/3/45 | | 335,000 | | 353,638 | | - | | - | | | | | | 335,000 | | 353,638 |
| Citigroup, Inc., 2.485%, 9/1/23(A) | | 660,000 | | 678,678 | | - | | - | | | | | | 660,000 | | 678,678 |
| Citigroup, Inc., 3.300%, 4/27/25 | | 250,000 | | 244,867 | | - | | - | | | | | | 250,000 | | 244,867 |
| Citigroup, Inc., 4.750%, 5/18/46 | | 152,000 | | 150,157 | | - | | - | | | | | | 152,000 | | 150,157 |
| Citigroup, Inc., 6.125%, 1/0/00(A)(B) | | 58,000 | | 61,190 | | - | | - | | | | | | 58,000 | | 61,190 |
| Credit Suisse Group Funding Guernsey Ltd. (Guernsey), 2.750%, 3/26/20 | | 250,000 | | 250,379 | | - | | - | | | | | | 250,000 | | 250,379 |
| CyrusOne LP / CyrusOne Finance Corp., 144a 5.000%, 3/15/24 | | 6,000 | | 6,165 | | - | | - | | | | | | 6,000 | | 6,165 |
| CyrusOne LP / CyrusOne Finance Corp., 144a 5.375%, 3/15/27 | | 6,000 | | 6,060 | | - | | - | | | | | | 6,000 | | 6,060 |
| Dana Financing Luxembourg Sarl (Luxembourg), 144a 5.750%, 4/15/25 | | 13,000 | | 13,114 | | - | | - | | | | | | 13,000 | | 13,114 |
| Fifth Third Bancorp, 2.875%, 7/27/20 | | 380,000 | | 386,046 | | - | | - | | | | | | 380,000 | | 386,046 |
| FirstCash, Inc., 6.750%, 4/1/21 | | 34,000 | | 35,445 | | - | | - | | | | | | 34,000 | | 35,445 |
| GE Capital International Funding Co. Unlimited Co. (Ireland), 4.418%, 11/15/35 | | 232,000 | | 244,981 | | - | | - | | | | | | 232,000 | | 244,981 |
| General Motors Financial Co., Inc., 3.200%, 7/13/20 | | 495,000 | | 503,524 | | - | | - | | | | | | 495,000 | | 503,524 |
| Goldman Sachs Group, Inc. (The), 5.250%, 7/27/21 | | 155,000 | | 170,022 | | - | | - | | | | | | 155,000 | | 170,022 |
| Goldman Sachs Group, Inc. (The), 5.375%, 1/0/00(A)(B) | | 55,000 | | 56,238 | | - | | - | | | | | | 55,000 | | 56,238 |
| HSBC Holdings PLC (United Kingdom), 2.650%, 1/5/22(A) | | 430,000 | | 442,118 | | - | | - | | | | | | 430,000 | | 442,118 |
| Huntington National Bank (The), 2.200%, 11/6/18 | | 420,000 | | 421,781 | | - | | - | | | | | | 420,000 | | 421,781 |
| JPMorgan Chase & Co., 3.250%, 9/23/22 | | 145,000 | | 147,646 | | - | | - | | | | | | 145,000 | | 147,646 |
| JPMorgan Chase & Co., 5.150%, 1/0/00(A)(B) | | 630,000 | | 635,512 | | - | | - | | | | | | 630,000 | | 635,512 |
| JPMorgan Chase & Co., 6.000%, 1/15/18 | | 265,000 | | 273,945 | | - | | - | | | | | | 265,000 | | 273,945 |
| Mid-America Apartments LP, 3.750%, 6/15/24 | | 80,000 | | 81,413 | | - | | - | | | | | | 80,000 | | 81,413 |
| | | Touchstone Active Bond
Fund | | Sentinel Total Return Bond Fund | | Pro Forma Adjustments | | Proforma Combined
Touchstone Active Bond Fund |
| | | Principal
Amount | | Market
Value | | Principal
Amount | | Market
Value | | Principal
Amount | | Market
Value | | Principal
Amount | | Market
Value |
| Morgan Stanley, 3.950%, 4/23/27 | | 355,000 | | 351,588 | | - | | - | | | | | | 355,000 | | 351,588 |
| OneMain Financial Holdings LLC, 144a 7.250%, 12/15/21 | | 51,000 | | 53,422 | | - | | - | | | | | | 51,000 | | 53,422 |
| PNC Bank NA, 2.700%, 11/1/22 | | 250,000 | | 247,880 | | - | | - | | | | | | 250,000 | | 247,880 |
| Prudential Financial, Inc., 5.625%, 6/15/43(A) | | 360,000 | | 385,740 | | - | | - | | | | | | 360,000 | | 385,740 |
| Quicken Loans, Inc., 144a 5.750%, 5/1/25 | | 28,000 | | 27,510 | | - | | - | | | | | | 28,000 | | 27,510 |
| Teachers Insurance & Annuity Association of America, 144a 6.850%, 12/16/39 | | 285,000 | | 376,722 | | - | | - | | | | | | 285,000 | | 376,722 |
| | | | | 9,796,855 | | | | - | | | | | | | | 9,796,855 |
| Consumer Discretionary - 1.4% | | | | | | | | | | | | | | | | |
| ACCO Brands Corp., 144a 5.250%, 12/15/24 | | 18,000 | | 18,090 | | - | | - | | | | | | 18,000 | | 18,090 |
| AMC Entertainment Holdings, Inc., 144a 5.875%, 11/15/26 | | 33,000 | | 33,371 | | - | | - | | | | | | 33,000 | | 33,371 |
| AMC Networks, Inc., 4.750%, 12/15/22 | | 25,000 | | 25,125 | | - | | - | | | | | | 25,000 | | 25,125 |
| American Builders & Contractors Supply Co., Inc., 144a 5.750%, 12/15/23 | | 6,000 | | 6,240 | | - | | - | | | | | | 6,000 | | 6,240 |
| Anheuser-Busch InBev Finance, Inc., 2.650%, 2/1/21 | | 120,000 | | 120,902 | | - | | - | | | | | | 120,000 | | 120,902 |
| Anheuser-Busch InBev Finance, Inc., 4.900%, 2/1/46 | | 306,000 | | 330,702 | | - | | - | | | | | | 306,000 | | 330,702 |
| AutoNation, Inc., 5.500%, 2/1/20 | | 490,000 | | 526,224 | | - | | - | | | | | | 490,000 | | 526,224 |
| Belo Corp., 7.250%, 9/15/27 | | 57,000 | | 60,420 | | - | | - | | | | | | 57,000 | | 60,420 |
| Brookfield Residential Properties, Inc. / Brookfield Residential US Corp. (Canada), 144a 6.125%, 7/1/22 | | 23,000 | | 23,690 | | - | | - | | | | | | 23,000 | | 23,690 |
| Cable One, Inc., 144a 5.750%, 6/15/22 | | 14,000 | | 14,560 | | - | | - | | | | | | 14,000 | | 14,560 |
| Cablevision Systems Corp., 5.875%, 9/15/22 | | 70,000 | | 70,613 | | - | | - | | | | | | 70,000 | | 70,613 |
| CalAtlantic Group, Inc., 5.875%, 11/15/24 | | 17,000 | | 17,850 | | - | | - | | | | | | 17,000 | | 17,850 |
| CBS Corp., 4.900%, 8/15/44 | | 205,000 | | 207,861 | | - | | - | | | | | | 205,000 | | 207,861 |
| CCO Holdings LLC / CCO Holdings Capital Corp., 144a 5.750%, 2/15/26 | | 101,000 | | 106,050 | | - | | - | | | | | | 101,000 | | 106,050 |
| Cimpress NV (Netherlands), 144a 7.000%, 4/1/22 | | 50,000 | | 51,750 | | - | | - | | | | | | 50,000 | | 51,750 |
| Delphi Automotive PLC (Jersey), 3.150%, 11/19/20 | | 436,000 | | 444,798 | | - | | - | | | | | | 436,000 | | 444,798 |
| Dollar General Corp., 3.250%, 4/15/23 | | 387,000 | | 386,925 | | - | | - | | | | | | 387,000 | | 386,925 |
| Dollar Tree, Inc., 5.750%, 3/1/23 | | 15,000 | | 15,975 | | - | | - | | | | | | 15,000 | | 15,975 |
| Ford Motor Co., 4.750%, 1/15/43 | | 156,000 | | 146,558 | | - | | - | | | | | | 156,000 | | 146,558 |
| Forest Laboratories LLC, 144a 5.000%, 12/15/21 | | 475,000 | | 514,725 | | - | | - | | | | | | 475,000 | | 514,725 |
| GLP Capital LP / GLP Financing II, Inc., 5.375%, 11/1/23 | | 10,000 | | 10,600 | | - | | - | | | | | | 10,000 | | 10,600 |
| GLP Capital LP / GLP Financing II, Inc., 5.375%, 4/15/26 | | 58,000 | | 59,885 | | - | | - | | | | | | 58,000 | | 59,885 |
| Hanesbrands, Inc., 144a 4.625%, 5/15/24 | | 38,000 | | 37,478 | | - | | - | | | | | | 38,000 | | 37,478 |
| Home Depot, Inc. (The), 5.950%, 4/1/41 | | 220,000 | | 281,470 | | - | | - | | | | | | 220,000 | | 281,470 |
| Imperial Brands Finance PLC (United Kingdom), 144a 3.500%, 2/11/23 | | 575,000 | | 579,768 | | - | | - | | | | | | 575,000 | | 579,768 |
| International Game Technology PLC (United Kingdom), 144a 6.250%, 2/15/22 | | 33,000 | | 35,228 | | - | | - | | | | | | 33,000 | | 35,228 |
| JC Penney Corp., Inc., 144a 5.875%, 7/1/23 | | 12,000 | | 12,000 | | - | | - | | | | | | 12,000 | | 12,000 |
| Lear Corp., 5.375%, 3/15/24 | | 318,000 | | 335,555 | | - | | - | | | | | | 318,000 | | 335,555 |
| Lennar Corp., 4.750%, 5/30/25 | | 42,000 | | 42,105 | | - | | - | | | | | | 42,000 | | 42,105 |
| Lennar Corp., 4.875%, 12/15/23 | | 12,000 | | 12,270 | | - | | - | | | | | | 12,000 | | 12,270 |
| Live Nation Entertainment, Inc., 144a 4.875%, 11/1/24 | | 16,000 | | 16,000 | | - | | - | | | | | | 16,000 | | 16,000 |
| LSC Communications, Inc., 144a 8.750%, 10/15/23 | | 33,000 | | 33,908 | | - | | - | | | | | | 33,000 | | 33,908 |
| M/I Homes, Inc., 6.750%, 1/15/21 | | 29,000 | | 30,361 | | - | | - | | | | | | 29,000 | | 30,361 |
| MDC Partners, Inc. (Canada), 144a 6.500%, 5/1/24 | | 37,000 | | 35,289 | | - | | - | | | | | | 37,000 | | 35,289 |
| NCL Corp. Ltd. (Bermuda), 144a 4.750%, 12/15/21 | | 52,000 | | 52,780 | | - | | - | | | | | | 52,000 | | 52,780 |
| New Home Co., Inc. (The), 144a 7.250%, 4/1/22 | | 12,000 | | 12,090 | | - | | - | | | | | | 12,000 | | 12,090 |
| Newell Brands, Inc., 4.200%, 4/1/26 | | 188,000 | | 195,660 | | - | | - | | | | | | 188,000 | | 195,660 |
| Nexstar Broadcasting, Inc., 144a 6.125%, 2/15/22 | | 38,000 | | 39,520 | | - | | - | | | | | | 38,000 | | 39,520 |
| PulteGroup, Inc., 5.500%, 3/1/26 | | 19,000 | | 19,665 | | - | | - | | | | | | 19,000 | | 19,665 |
| Quad/Graphics, Inc., 7.000%, 5/1/22 | | 31,000 | | 31,000 | | - | | - | | | | | | 31,000 | | 31,000 |
| Sabre GLBL, Inc., 144a 5.250%, 11/15/23 | | 20,000 | | 20,450 | | - | | - | | | | | | 20,000 | | 20,450 |
| ServiceMaster Co. LLC (The), 144a 5.125%, 11/15/24 | | 46,000 | | 47,150 | | - | | - | | | | | | 46,000 | | 47,150 |
| Sirius XM Radio, Inc., 144a 5.375%, 4/15/25 | | 7,000 | | 7,164 | | - | | - | | | | | | 7,000 | | 7,164 |
| Sirius XM Radio, Inc., 144a 5.375%, 7/15/26 | | 17,000 | | 17,382 | | - | | - | | | | | | 17,000 | | 17,382 |
| Sonic Automotive, Inc., 144a 6.125%, 3/15/27 | | 13,000 | | 13,016 | | - | | - | | | | | | 13,000 | | 13,016 |
| Suburban Propane Partners LP/Suburban Energy Finance Corp., 5.875%, 3/1/27 | | 8,000 | | 7,880 | | - | | - | | | | | | 8,000 | | 7,880 |
| Tenneco, Inc., 5.000%, 7/15/26 | | 26,000 | | 25,464 | | - | | - | | | | | | 26,000 | | 25,464 |
| Toll Brothers Finance Corp., 4.875%, 11/15/25 | | 42,000 | | 42,315 | | - | | - | | | | | | 42,000 | | 42,315 |
| | | Touchstone Active Bond
Fund | | Sentinel Total Return Bond Fund | | Pro Forma Adjustments | | Proforma Combined
Touchstone Active Bond Fund |
| | | Principal
Amount | | Market
Value | | Principal
Amount | | Market
Value | | Principal
Amount | | Market
Value | | Principal
Amount | | Market
Value |
| United Rentals North America, Inc., 4.625%, 7/15/23 | | 25,000 | | 25,750 | | - | | - | | | | | | 25,000 | | 25,750 |
| United Rentals North America, Inc., 5.875%, 9/15/26 | | 8,000 | | 8,340 | | - | | - | | | | | | 8,000 | | 8,340 |
| Vista Outdoor, Inc., 5.875%, 10/1/23 | | 10,000 | | 9,725 | | - | | - | | | | | | 10,000 | | 9,725 |
| William Lyon Homes, Inc., 144a 5.875%, 1/31/25 | | 10,000 | | 10,075 | | - | | - | | | | | | 10,000 | | 10,075 |
| ZF North America Capital, Inc., 144a 4.500%, 4/29/22 | | 65,000 | | 67,681 | | - | | - | | | | | | 65,000 | | 67,681 |
| | | | | 5,297,453 | | | | - | | | | | | | | 5,297,453 |
| Energy - 1.2% | | | | | | | | | | | | | | | | |
| Boardwalk Pipelines LP, 3.375%, 2/1/23 | | 292,000 | | 284,547 | | - | | - | | | | | | 292,000 | | 284,547 |
| Cenovus Energy, Inc. (Canada), 6.750%, 11/15/39 | | 275,000 | | 313,633 | | - | | - | | | | | | 275,000 | | 313,633 |
| Continental Resources, Inc., 4.500%, 4/15/23 | | 21,000 | | 20,436 | | - | | - | | | | | | 21,000 | | 20,436 |
| Enterprise Products Operating LLC, 7.000%, 6/1/67(A) | | 152,000 | | 140,600 | | - | | - | | | | | | 152,000 | | 140,600 |
| Exterran Energy Solutions LP / EES Finance Corp., 144a 8.125%, 5/1/25 | | 14,000 | | 14,280 | | - | | - | | | | | | 14,000 | | 14,280 |
| Genesis Energy LP / Genesis Energy Finance Corp., 6.000%, 5/15/23 | | 12,000 | | 12,060 | | - | | - | | | | | | 12,000 | | 12,060 |
| Genesis Energy LP / Genesis Energy Finance Corp., 6.750%, 8/1/22 | | 19,000 | | 19,589 | | - | | - | | | | | | 19,000 | | 19,589 |
| Gulfport Energy Corp., 144a 6.375%, 5/15/25 | | 46,000 | | 45,195 | | - | | - | | | | | | 46,000 | | 45,195 |
| Hilcorp Energy I LP / Hilcorp Finance Co., 144a 5.000%, 12/1/24 | | 19,000 | | 17,813 | | - | | - | | | | | | 19,000 | | 17,813 |
| Hilcorp Energy I LP / Hilcorp Finance Co., 144a 5.750%, 10/1/25 | | 15,000 | | 14,475 | | - | | - | | | | | | 15,000 | | 14,475 |
| Holly Energy Partners LP / Holly Energy Finance Corp., 144a 6.000%, 8/1/24 | | 9,000 | | 9,428 | | - | | - | | | | | | 9,000 | | 9,428 |
| HollyFrontier Corp., 5.875%, 4/1/26 | | 26,000 | | 27,605 | | - | | - | | | | | | 26,000 | | 27,605 |
| Kinder Morgan Energy Partners LP, 3.500%, 9/1/23 | | 377,000 | | 371,049 | | - | | - | | | | | | 377,000 | | 371,049 |
| Marathon Oil Corp., 2.800%, 11/1/22 | | 440,000 | | 422,759 | | - | | - | | | | | | 440,000 | | 422,759 |
| Midcontinent Express Pipeline LLC, 144a 6.700%, 9/15/19 | | 392,000 | | 416,512 | | - | | - | | | | | | 392,000 | | 416,512 |
| Nabors Industries, Inc., 5.000%, 9/15/20 | | 215,000 | | 222,391 | | - | | - | | | | | | 215,000 | | 222,391 |
| Occidental Petroleum Corp., 4.100%, 2/15/47 | | 248,000 | | 239,342 | | - | | - | | | | | | 248,000 | | 239,342 |
| Parsley Energy LLC / Parsley Finance Corp., 144a 5.250%, 8/15/25 | | 4,000 | | 4,040 | | - | | - | | | | | | 4,000 | | 4,040 |
| PDC Energy, Inc., 144a 6.125%, 9/15/24 | | 27,000 | | 27,675 | | - | | - | | | | | | 27,000 | | 27,675 |
| Peabody Securities Finance Corp., 144a 6.000%, 3/31/22 | | 14,000 | | 13,921 | | - | | - | | | | | | 14,000 | | 13,921 |
| Peabody Securities Finance Corp., 144a 6.375%, 3/31/25 | | 14,000 | | 13,930 | | - | | - | | | | | | 14,000 | | 13,930 |
| Petroleos Mexicanos (Mexico), 4.500%, 1/23/26 | | 285,000 | | 273,172 | | - | | - | | | | | | 285,000 | | 273,172 |
| Petroleos Mexicanos (Mexico), 144a 5.375%, 3/13/22 | | 150,000 | | 157,125 | | - | | - | | | | | | 150,000 | | 157,125 |
| Precision Drilling Corp. (Canada), 5.250%, 11/15/24 | | 45,000 | | 42,638 | | - | | - | | | | | | 45,000 | | 42,638 |
| Precision Drilling Corp. (Canada), 144a 7.750%, 12/15/23 | | 29,000 | | 30,522 | | - | | - | | | | | | 29,000 | | 30,522 |
| QEP Resources, Inc., 5.375%, 10/1/22 | | 27,000 | | 26,595 | | - | | - | | | | | | 27,000 | | 26,595 |
| Range Resources Corp., 144a 5.000%, 8/15/22 | | 27,000 | | 26,730 | | - | | - | | | | | | 27,000 | | 26,730 |
| Range Resources Corp., 144a 5.750%, 6/1/21 | | 16,000 | | 16,400 | | - | | - | | | | | | 16,000 | | 16,400 |
| Rose Rock Midstream LP / Rose Rock Finance Corp., 5.625%, 11/15/23 | | 48,000 | | 47,040 | | - | | - | | | | | | 48,000 | | 47,040 |
| Sabine Pass Liquefaction LLC, 144a 5.000%, 3/15/27 | | 415,000 | | 433,815 | | - | | - | | | | | | 415,000 | | 433,815 |
| SemGroup Corp., 144a 6.375%, 3/15/25 | | 16,000 | | 15,720 | | - | | - | | | | | | 16,000 | | 15,720 |
| SESI LLC, 7.125%, 12/15/21 | | 15,000 | | 15,188 | | - | | - | | | | | | 15,000 | | 15,188 |
| Shell International Finance BV (Netherlands), 1.875%, 5/10/21 | | 400,000 | | 391,747 | | - | | - | | | | | | 400,000 | | 391,747 |
| Southwestern Energy Co., 4.100%, 3/15/22 | | 40,000 | | 37,400 | | - | | - | | | | | | 40,000 | | 37,400 |
| Southwestern Energy Co., 5.800%, 1/23/20 | | 31,000 | | 31,291 | | - | | - | | | | | | 31,000 | | 31,291 |
| Summit Midstream Holdings LLC / Summit Midstream Finance Corp., 5.750%, 4/15/25 | | 22,000 | | 21,890 | | - | | - | | | | | | 22,000 | | 21,890 |
| Transocean Phoenix 2 Ltd. (Cayman Islands), 144a 7.750%, 10/15/24 | | 55,000 | | 59,125 | | - | | - | | | | | | 55,000 | | 59,125 |
| Unit Corp., 6.625%, 5/15/21 | | 85,000 | | 83,725 | | - | | - | | | | | | 85,000 | | 83,725 |
| Weatherford International Ltd (Bermuda), 6.500%, 8/1/36 | | 31,000 | | 29,295 | | - | | - | | | | | | 31,000 | | 29,295 |
| Williams Partners LP, 3.350%, 8/15/22 | | 217,000 | | 216,633 | | - | | - | | | | | | 217,000 | | 216,633 |
| | | | | 4,607,331 | | | | - | | | | | | | | 4,607,331 |
| Health Care - 1.1% | | | | | | | | | | | | | | | | |
| Abbott Laboratories, 3.750%, 11/30/26 | | 395,000 | | 394,503 | | - | | - | | | | | | 395,000 | | 394,503 |
| AbbVie, Inc., 4.450%, 5/14/46 | | 342,000 | | 326,348 | | - | | - | | | | | | 342,000 | | 326,348 |
| | | Touchstone Active Bond
Fund | | Sentinel Total Return Bond Fund | | Pro Forma Adjustments | | Proforma Combined
Touchstone Active Bond Fund |
| | | Principal
Amount | | Market
Value | | Principal
Amount | | Market
Value | | Principal
Amount | | Market
Value | | Principal
Amount | | Market
Value |
| Acadia Healthcare Co., Inc., 6.500%, 3/1/24 | | 77,000 | | 81,043 | | - | | - | | | | | | 77,000 | | 81,043 |
| Actavis Funding SCS (Luxembourg), 3.800%, 3/15/25 | | 195,000 | | 196,779 | | - | | - | | | | | | 195,000 | | 196,779 |
| Catholic Health Initiatives, 4.200%, 8/1/23 | | 380,000 | | 391,072 | | - | | - | | | | | | 380,000 | | 391,072 |
| Centene Corp., 4.750%, 1/15/25 | | 12,000 | | 12,068 | | - | | - | | | | | | 12,000 | | 12,068 |
| CHS / Community Health Systems, Inc., 7.125%, 7/15/20 | | 21,000 | | 19,241 | | - | | - | | | | | | 21,000 | | 19,241 |
| CHS/Community Health Systems, Inc., 6.250%, 3/31/23 | | 28,000 | | 28,490 | | - | | - | | | | | | 28,000 | | 28,490 |
| Envision Healthcare Corp., 5.625%, 7/15/22 | | 28,000 | | 28,700 | | - | | - | | | | | | 28,000 | | 28,700 |
| Envision Healthcare Corp., 144a 5.125%, 7/1/22 | | 9,000 | | 9,160 | | - | | - | | | | | | 9,000 | | 9,160 |
| Envision Healthcare Corp., 144a 6.250%, 12/1/24 | | 24,000 | | 25,200 | | - | | - | | | | | | 24,000 | | 25,200 |
| Express Scripts Holding Co., 3.300%, 2/25/21 | | 336,000 | | 341,810 | | - | | - | | | | | | 336,000 | | 341,810 |
| HCA, Inc., 5.375%, 2/1/25 | | 54,000 | | 56,295 | | - | | - | | | | | | 54,000 | | 56,295 |
| HCA, Inc., 5.875%, 5/1/23 | | 52,000 | | 56,160 | | - | | - | | | | | | 52,000 | | 56,160 |
| HealthSouth Corp., 5.750%, 11/1/24 | | 54,000 | | 54,405 | | - | | - | | | | | | 54,000 | | 54,405 |
| Kindred Healthcare, Inc., 8.750%, 1/15/23 | | 28,000 | | 28,070 | | - | | - | | | | | | 28,000 | | 28,070 |
| Mallinckrodt International Finance SA (Luxembourg), 4.750%, 4/15/23 | | 7,000 | | 5,932 | | - | | - | | | | | | 7,000 | | 5,932 |
| Mallinckrodt International Finance SA / Mallinckrodt CB LLC (Luxembourg), 144a 5.500%, 4/15/25 | | 53,000 | | 48,760 | | - | | - | | | | | | 53,000 | | 48,760 |
| Medtronic Global Holdings SCA (Luxembourg), 3.350%, 4/1/27 | | 320,000 | | 322,275 | | - | | - | | | | | | 320,000 | | 322,275 |
| Mylan NV (Netherlands), 3.000%, 12/15/18 | | 180,000 | | 182,089 | | - | | - | | | | | | 180,000 | | 182,089 |
| Ochsner Clinic Foundation, 5.897%, 5/15/45 | | 300,000 | | 341,972 | | - | | - | | | | | | 300,000 | | 341,972 |
| Select Medical Corp., 6.375%, 6/1/21 | | 54,000 | | 54,540 | | - | | - | | | | | | 54,000 | | 54,540 |
| Shire Acquisitions Investments Ireland DAC (Ireland), 2.400%, 9/23/21 | | 426,000 | | 416,591 | | - | | - | | | | | | 426,000 | | 416,591 |
| Teleflex, Inc., 4.875%, 6/1/26 | | 8,000 | | 8,040 | | - | | - | | | | | | 8,000 | | 8,040 |
| Tenet Healthcare Corp., 4.750%, 6/1/20 | | 6,000 | | 6,130 | | - | | - | | | | | | 6,000 | | 6,130 |
| Tenet Healthcare Corp., 144a 7.500%, 1/1/22 | | 15,000 | | 16,200 | | - | | - | | | | | | 15,000 | | 16,200 |
| Teva Pharmaceutical Finance Netherlands III BV (Netherlands), 2.200%, 7/21/21 | | 172,000 | | 165,990 | | - | | - | | | | | | 172,000 | | 165,990 |
| Teva Pharmaceutical Finance Netherlands III BV (Netherlands), 3.150%, 10/1/26 | | 378,000 | | 348,332 | | - | | - | | | | | | 378,000 | | 348,332 |
| Universal Hospital Services, Inc., 7.625%, 8/15/20 | | 28,000 | | 27,860 | | - | | - | | | | | | 28,000 | | 27,860 |
| Zimmer Biomet Holdings, Inc., 3.150%, 4/1/22 | | 190,000 | | 190,695 | | - | | - | | | | | | 190,000 | | 190,695 |
| Zimmer Biomet Holdings, Inc., 3.375%, 11/30/21 | | 110,000 | | 111,284 | | - | | - | | | | | | 110,000 | | 111,284 |
| | | | | 4,296,034 | | | | - | | | | | | | | 4,296,034 |
| Information Technology - 1.0% | | | | | | | | | | | | | | | | |
| Activision Blizzard, Inc., 144a 6.125%, 9/15/23 | | 429,000 | | 464,393 | | - | | - | | | | | | 429,000 | | 464,393 |
| Apple, Inc., 4.650%, 2/23/46 | | 313,000 | | 335,850 | | - | | - | | | | | | 313,000 | | 335,850 |
| CDW LLC / CDW Finance Corp., 5.000%, 9/1/23 | | 17,000 | | 17,191 | | - | | - | | | | | | 17,000 | | 17,191 |
| CDW LLC / CDW Finance Corp., 5.500%, 12/1/24 | | 38,000 | | 39,805 | | - | | - | | | | | | 38,000 | | 39,805 |
| Diamond 1 Finance Corp. / Diamond 2 Finance Corp., 144a 4.420%, 6/15/21 | | 395,000 | | 413,069 | | - | | - | | | | | | 395,000 | | 413,069 |
| Diamond 1 Finance Corp. / Diamond 2 Finance Corp., 144a 5.450%, 6/15/23 | | 32,000 | | 34,528 | | - | | - | | | | | | 32,000 | | 34,528 |
| Diamond 1 Finance Corp. / Diamond 2 Finance Corp., 144a 7.125%, 6/15/24 | | 87,000 | | 96,177 | | - | | - | | | | | | 87,000 | | 96,177 |
| Diebold Nixdorf, Inc., 8.500%, 4/15/24 | | 54,000 | | 59,670 | | - | | - | | | | | | 54,000 | | 59,670 |
| Electronic Arts, Inc., 3.700%, 3/1/21 | | 432,000 | | 448,400 | | - | | - | | | | | | 432,000 | | 448,400 |
| EMC Corp., 3.375%, 6/1/23† | | 10,000 | | 9,552 | | - | | - | | | | | | 10,000 | | 9,552 |
| Fidelity National Information Services, Inc., 3.625%, 10/15/20 | | 470,000 | | 488,410 | | - | | - | | | | | | 470,000 | | 488,410 |
| First Data Corp., 144a 7.000%, 12/1/23 | | 7,000 | | 7,508 | | - | | - | | | | | | 7,000 | | 7,508 |
| Hewlett Packard Enterprise Co., 2.450%, 10/5/17 | | 440,000 | | 441,284 | | - | | - | | | | | | 440,000 | | 441,284 |
| Microsoft Corp., 3.500%, 2/12/35 | | 190,000 | | 182,808 | | - | | - | | | | | | 190,000 | | 182,808 |
| NCR Corp., 5.875%, 12/15/21 | | 88,000 | | 91,740 | | - | | - | | | | | | 88,000 | | 91,740 |
| Open Text Corp. (Canada), 144a 5.875%, 6/1/26 | | 47,000 | | 49,232 | | - | | - | | | | | | 47,000 | | 49,232 |
| Oracle Corp., 2.650%, 7/15/26 | | 338,000 | | 321,846 | | - | | - | | | | | | 338,000 | | 321,846 |
| QUALCOMM, Inc., 3.450%, 5/20/25 | | 425,000 | | 431,176 | | - | | - | | | | | | 425,000 | | 431,176 |
| Quintiles IMS, Inc., 144a 4.875%, 5/15/23 | | 11,000 | | 11,151 | | - | | - | | | | | | 11,000 | | 11,151 |
| Sensata Technologies BV (Netherlands), 144a 5.000%, 10/1/25 | | 31,000 | | 31,232 | | - | | - | | | | | | 31,000 | | 31,232 |
| | | | | 3,975,022 | | | | - | | | | | | | | 3,975,022 |
| Telecommunication Services - 1.0% | | | | | | | | | | | | | | | | |
| Altice Financing SA (Luxemburg), 144a 6.625%, 2/15/23 | | 59,000 | | 61,419 | | - | | - | | | | | | 59,000 | | 61,419 |
| | | Touchstone Active Bond
Fund | | Sentinel Total Return Bond Fund | | Pro Forma Adjustments | | Proforma Combined
Touchstone Active Bond Fund |
| | | Principal
Amount | | Market
Value | | Principal
Amount | | Market
Value | | Principal
Amount | | Market
Value | | Principal
Amount | | Market
Value |
| AMC Networks, Inc., 5.000%, 4/1/24 | | 23,000 | | 23,000 | | - | | - | | | | | | 23,000 | | 23,000 |
| AT&T, Inc., 3.900%, 3/11/24 | | 225,000 | | 228,620 | | - | | - | | | | | | 225,000 | | 228,620 |
| AT&T, Inc., 4.350%, 6/15/45 | | 90,000 | | 79,216 | | - | | - | | | | | | 90,000 | | 79,216 |
| AT&T, Inc., 4.500%, 5/15/35 | | 360,000 | | 339,850 | | - | | - | | | | | | 360,000 | | 339,850 |
| Block Communications, Inc., 144a 6.875%, 2/15/25 | | 7,000 | | 7,420 | | - | | - | | | | | | 7,000 | | 7,420 |
| CenturyLink, Inc., 5.150%, 6/15/17 | | 325,000 | | 327,275 | | - | | - | | | | | | 325,000 | | 327,275 |
| CenturyLink, Inc., 5.800%, 3/15/22 | | 8,000 | | 8,250 | | - | | - | | | | | | 8,000 | | 8,250 |
| CenturyLink, Inc., 6.450%, 6/15/21 | | 2,000 | | 2,125 | | - | | - | | | | | | 2,000 | | 2,125 |
| Charter Communications Operating LLC / Charter Communications Operating Capital, 6.484%, 10/23/45 | | 264,000 | | 303,953 | | - | | - | | | | | �� | 264,000 | | 303,953 |
| Comcast Corp., 1.625%, 1/15/22 | | 372,000 | | 356,727 | | - | | - | | | | | | 372,000 | | 356,727 |
| CommScope Technologies LLC, 144a 5.000%, 3/15/27 | | 16,000 | | 15,975 | | - | | - | | | | | | 16,000 | | 15,975 |
| CommScope, Inc., 144a 5.500%, 6/15/24 | | 4,000 | | 4,136 | | - | | - | | | | | | 4,000 | | 4,136 |
| CSC Holdings LLC, 5.250%, 6/1/24 | | 34,000 | | 33,873 | | - | | - | | | | | | 34,000 | | 33,873 |
| CSC Holdings LLC, 144a 10.125%, 1/15/23 | | 60,000 | | 69,600 | | - | | - | | | | | | 60,000 | | 69,600 |
| Discovery Communications LLC, 3.450%, 3/15/25 | | 500,000 | | 473,476 | | - | | - | | | | | | 500,000 | | 473,476 |
| DISH DBS Corp., 5.125%, 5/1/20 | | 48,000 | | 50,040 | | - | | - | | | | | | 48,000 | | 50,040 |
| Frontier Communications Corp., 10.500%, 9/15/22 | | 10,000 | | 10,125 | | - | | - | | | | | | 10,000 | | 10,125 |
| Frontier Communications Corp., 6.250%, 9/15/21 | | 90,000 | | 83,700 | | - | | - | | | | | | 90,000 | | 83,700 |
| Gray Television, Inc., 144a 5.125%, 10/15/24 | | 45,000 | | 44,438 | | - | | - | | | | | | 45,000 | | 44,438 |
| Level 3 Financing, Inc., 5.250%, 3/15/26 | | 13,000 | | 13,065 | | - | | - | | | | | | 13,000 | | 13,065 |
| LIN Television Corp., 5.875%, 11/15/22 | | 5,000 | | 5,175 | | - | | - | | | | | | 5,000 | | 5,175 |
| Match Group, Inc., 6.375%, 6/1/24 | | 6,000 | | 6,491 | | - | | - | | | | | | 6,000 | | 6,491 |
| Nexstar Escrow Corp., 144a 5.625%, 8/1/24 | | 31,000 | | 31,465 | | - | | - | | | | | | 31,000 | | 31,465 |
| Qwest Corp., 6.750%, 12/1/21 | | 375,000 | | 411,093 | | - | | - | | | | | | 375,000 | | 411,093 |
| Sprint Communications, Inc., 6.000%, 11/15/22 | | 181,000 | | 185,072 | | - | | - | | | | | | 181,000 | | 185,072 |
| Symantec Corp., 144a 5.000%, 4/15/25 | | 7,000 | | 7,178 | | - | | - | | | | | | 7,000 | | 7,178 |
| Univision Communications, Inc., 144a 5.125%, 2/15/25 | | 13,000 | | 12,789 | | - | | - | | | | | | 13,000 | | 12,789 |
| Verizon Communications, Inc., 4.672%, 3/15/55 | | 425,000 | | 379,525 | | - | | - | | | | | | 425,000 | | 379,525 |
| Verizon Communications, Inc., 144a 5.012%, 4/15/49 | | 331,000 | | 321,449 | | - | | - | | | | | | 331,000 | | 321,449 |
| Videotron Ltd. / Videotron Ltee (Canada), 144a 5.125%, 4/15/27 | | 40,000 | | 40,300 | | - | | - | | | | | | 40,000 | | 40,300 |
| | | | | 3,936,820 | | | | - | | | | | | | | 3,936,820 |
| Industrials - 0.8% | | | | | | | | | | | | | | | | |
| Allegion PLC (Ireland), 5.875%, 9/15/23 | | 9,000 | | 9,608 | | - | | - | | | | | | 9,000 | | 9,608 |
| Arconic, Inc., 5.125%, 10/1/24 | | 31,000 | | 32,023 | | - | | - | | | | | | 31,000 | | 32,023 |
| Burlington Northern Santa Fe LLC, 5.750%, 5/1/40 | | 190,000 | | 230,564 | | - | | - | | | | | | 190,000 | | 230,564 |
| Clean Harbors, Inc., 5.125%, 6/1/21 | | 3,000 | | 3,063 | | - | | - | | | | | | 3,000 | | 3,063 |
| CNH Industrial NV (Netherlands), 4.500%, 8/15/23 | | 48,000 | | 48,660 | | - | | - | | | | | | 48,000 | | 48,660 |
| Eagle Materials, Inc., 4.500%, 8/1/26 | | 19,000 | | 18,905 | | - | | - | | | | | | 19,000 | | 18,905 |
| FedEx Corp., 5.100%, 1/15/44 | | 400,000 | | 430,488 | | - | | - | | | | | | 400,000 | | 430,488 |
| Huntington Ingalls Industries, Inc., 144a 5.000%, 11/15/25 | | 5,000 | | 5,225 | | - | | - | | | | | | 5,000 | | 5,225 |
| Joy Global, Inc., 5.125%, 10/15/21 | | 403,000 | | 432,483 | | - | | - | | | | | | 403,000 | | 432,483 |
| KLX, Inc., 144a 5.875%, 12/1/22 | | 57,000 | | 58,781 | | - | | - | | | | | | 57,000 | | 58,781 |
| Koppers, Inc., 144a 6.000%, 2/15/25 | | 7,000 | | 7,228 | | - | | - | | | | | | 7,000 | | 7,228 |
| Louisiana-Pacific Corp., 4.875%, 9/15/24 | | 29,000 | | 29,145 | | - | | - | | | | | | 29,000 | | 29,145 |
| Masco Corp., 4.375%, 4/1/26 | | 310,000 | | 322,155 | | - | | - | | | | | | 310,000 | | 322,155 |
| Moog, Inc., 144a 5.250%, 12/1/22 | | 3,000 | | 3,075 | | - | | - | | | | | | 3,000 | | 3,075 |
| Orbital ATK, Inc., 5.250%, 10/1/21 | | 20,000 | | 20,675 | | - | | - | | | | | | 20,000 | | 20,675 |
| Owens-Brockway Glass Container, Inc., 144a 5.875%, 8/15/23 | | 5,000 | | 5,291 | | - | | - | | | | | | 5,000 | | 5,291 |
| Roper Technologies, Inc., 3.000%, 12/15/20 | | 430,000 | | 438,081 | | - | | - | | | | | | 430,000 | | 438,081 |
| SBA Tower Trust, 144a 2.898%, 10/15/19 | | 334,000 | | 335,038 | | - | | - | | | | | | 334,000 | | 335,038 |
| Siemens Financieringsmaatschappij NV (Netherlands), 144a 3.125%, 3/16/24 | | 350,000 | | 352,503 | | - | | - | | | | | | 350,000 | | 352,503 |
| XPO CNW, Inc., 6.700%, 5/1/34 | | 158,000 | | 143,385 | | - | | - | | | | | | 158,000 | | 143,385 |
| | | | | 2,926,376 | | | | - | | | | | | | | 2,926,376 |
| Consumer Staples - 0.7% | | | | | | | | | | | | | | | | |
| AdvancePierre Foods Holdings, Inc., 144a 5.500%, 12/15/24 | | 27,000 | | 27,304 | | - | | - | | | | | | 27,000 | | 27,304 |
| Albertsons Cos. LLC / Safeway, Inc. / New Albertson’s Inc. / Albertson’s LLC, 144a 5.750%, 3/15/25 | | 54,000 | | 52,380 | | - | | - | | | | | | 54,000 | | 52,380 |
| Avis Budget Car Rental LLC / Avis Budget Finance, Inc., 5.500%, 4/1/23 | | 55,000 | | 53,144 | | - | | - | | | | | | 55,000 | | 53,144 |
| B&G Foods, Inc., 5.250%, 4/1/25 | | 5,000 | | 5,044 | | - | | - | | | | | | 5,000 | | 5,044 |
| Cardtronics, Inc. / Cardtronics USA, 144a 5.500%, 5/1/25 | | 26,000 | | 26,293 | | - | | - | | | | | | 26,000 | | 26,293 |
| | | Touchstone Active Bond
Fund | | Sentinel Total Return Bond Fund | | Pro Forma Adjustments | | Proforma Combined
Touchstone Active Bond Fund |
| | | Principal
Amount | | Market
Value | | Principal
Amount | | Market
Value | | Principal
Amount | | Market
Value | | Principal
Amount | | Market
Value |
| Cott Holdings, Inc., 144a 5.500%, 4/1/25 | | 27,000 | | 27,481 | | - | | - | | | | | | 27,000 | | 27,481 |
| CVS Health Corp., 5.125%, 7/20/45 | | 260,000 | | 286,857 | | - | | - | | | | | | 260,000 | | 286,857 |
| IHS Markit Ltd., 144a 5.000%, 11/1/22 | | 55,000 | | 57,612 | | - | | - | | | | | | 55,000 | | 57,612 |
| JBS USA LLC / JBS USA Finance, Inc., 144a 5.750%, 6/15/25 | | 20,000 | | 20,200 | | - | | - | | | | | | 20,000 | | 20,200 |
| KFC Holding Co. / Pizza Hut Holdings LLC/Taco Bell of America LLC, 144a 5.250%, 6/1/26 | | 6,000 | | 6,105 | | - | | - | | | | | | 6,000 | | 6,105 |
| KFC Holding Co./Pizza Hut Holdings LLC/Taco Bell of America LLC, 144a 5.000%, 6/1/24 | | 40,000 | | 40,850 | | - | | - | | | | | | 40,000 | | 40,850 |
| Kraft Heinz Foods Co., 6.875%, 1/26/39 | | 515,000 | | 642,460 | | - | | - | | | | | | 515,000 | | 642,460 |
| Kroger Co. (The), 5.000%, 4/15/42 | | 500,000 | | 523,726 | | - | | - | | | | | | 500,000 | | 523,726 |
| Mondelez International Holdings Netherlands BV (Netherlands), 144a 2.000%, 10/28/21 | | 450,000 | | 432,991 | | - | | - | | | | | | 450,000 | | 432,991 |
| Moody’s Corp., 2.750%, 12/15/21 | | 351,000 | | 350,455 | | - | | - | | | | | | 351,000 | | 350,455 |
| Post Holdings, Inc., 144a 5.000%, 8/15/26 | | 73,000 | | 69,898 | | - | | - | | | | | | 73,000 | | 69,898 |
| TreeHouse Foods, Inc., 4.875%, 3/15/22 | | 7,000 | | 7,158 | | - | | - | | | | | | 7,000 | | 7,158 |
| TreeHouse Foods, Inc., 144a 6.000%, 2/15/24 | | 14,000 | | 14,665 | | - | | - | | | | | | 14,000 | | 14,665 |
| US Foods, Inc., 144a 5.875%, 6/15/24 | | 11,000 | | 11,412 | | - | | - | | | | | | 11,000 | | 11,412 |
| | | | | 2,656,035 | | | | - | | | | | | | | 2,656,035 |
| Utilities - 0.6% | | | | | | | | | | | | | | | | |
| AES Corp., 4.875%, 5/15/23 | | 78,000 | | 77,610 | | - | | - | | | | | | 78,000 | | 77,610 |
| Alabama Power Capital Trust V, 4.248%, 10/1/42(A) | | 874,000 | | 838,618 | | - | | - | | | | | | 874,000 | | 838,618 |
| Dominion Resources, Inc., 2.000%, 8/15/21 | | 420,000 | | 407,490 | | - | | - | | | | | | 420,000 | | 407,490 |
| Dynegy, Inc., 7.375%, 11/1/22 | | 18,000 | | 17,820 | | - | | - | | | | | | 18,000 | | 17,820 |
| Dynegy, Inc., 144a 8.000%, 1/15/25 | | 21,000 | | 20,108 | | - | | - | | | | | | 21,000 | | 20,108 |
| Fortis, Inc. (Canada), 144a 3.055%, 10/4/26 | | 384,000 | | 359,207 | | - | | - | | | | | | 384,000 | | 359,207 |
| NextEra Energy Capital Holdings, Inc., 6.000%, 3/1/19 | | 15,000 | | 16,072 | | - | | - | | | | | | 15,000 | | 16,072 |
| NGL Energy Partners LP / NGL Energy Finance Corp., 6.875%, 10/15/21 | | 17,000 | | 17,298 | | - | | - | | | | | | 17,000 | | 17,298 |
| NGL Energy Partners LP / NGL Energy Finance Corp., 144a 7.500%, 11/1/23 | | 65,000 | | 67,112 | | - | | - | | | | | | 65,000 | | 67,112 |
| PacifiCorp, 5.750%, 4/1/37 | | 272,000 | | 332,416 | | - | | - | | | | | | 272,000 | | 332,416 |
| | | | | 2,153,751 | | | | - | | | | | | | | 2,153,751 |
| Real Estate - 0.5% | | | | | | | | | | | | | | | | |
| CoreCivic, Inc., 4.125%, 4/1/20† | | 7,000 | | 7,140 | | - | | - | | | | | | 7,000 | | 7,140 |
| CoreCivic, Inc., 4.625%, 5/1/23 | | 6,000 | | 5,993 | | - | | - | | | | | | 6,000 | | 5,993 |
| CoreCivic, Inc., 5.000%, 10/15/22 | | 15,000 | | 15,488 | | - | | - | | | | | | 15,000 | | 15,488 |
| Crown Castle International Corp., REIT, 3.400%, 2/15/21 | | 450,000 | | 457,743 | | - | | - | | | | | | 450,000 | | 457,743 |
| Equinix, Inc. REIT, 5.375%, 4/1/23 | | 24,000 | | 24,990 | | - | | - | | | | | | 24,000 | | 24,990 |
| Equinix, Inc. REIT, 5.375%, 5/15/27 | | 7,000 | | 7,228 | | - | | - | | | | | | 7,000 | | 7,228 |
| ESH Hospitality, Inc. REIT, 144a 5.250%, 5/1/25 | | 39,000 | | 39,317 | | - | | - | | | | | | 39,000 | | 39,317 |
| Omega Healthcare Investors, Inc. REIT, 4.950%, 4/1/24 | | 400,000 | | 411,724 | | - | | - | | | | | | 400,000 | | 411,724 |
| Simon Property Group LP, REIT, 2.750%, 2/1/23 | | 330,000 | | 325,797 | | - | | - | | | | | | 330,000 | | 325,797 |
| Vornado Realty LP REIT, 5.000%, 1/15/22 | | 175,000 | | 188,748 | | - | | - | | | | | | 175,000 | | 188,748 |
| Welltower, Inc. REIT, 6.125%, 4/15/20 | | 316,000 | | 349,520 | | - | | - | | | | | | 316,000 | | 349,520 |
| | | | | 1,833,688 | | | | - | | | | | | | | 1,833,688 |
| Materials - 0.2% | | | | | | | | | | | | | | | | |
| ArcelorMittal (Luxembourg), 6.250%, 3/1/21 | | 11,000 | | 11,880 | | - | | - | | | | | | 11,000 | | 11,880 |
| Braskem America Finance Co., 144a 7.125%, 7/22/41 | | 200,000 | | 212,100 | | - | | - | | | | | | 200,000 | | 212,100 |
| CF Industries, Inc., 3.450%, 6/1/23 | | 50,000 | | 47,250 | | - | | - | | | | | | 50,000 | | 47,250 |
| CVR Partners LP / CVR Nitrogen Finance Corp., 144a 9.250%, 6/15/23 | | 48,000 | | 49,260 | | - | | - | | | | | | 48,000 | | 49,260 |
| Domtar Corp., 10.750%, 6/1/17 | | 119,000 | | 120,354 | | - | | - | | | | | | 119,000 | | 120,354 |
| Freeport-McMoRan, Inc., 144a 6.750%, 2/1/22 | | 38,000 | | 38,950 | | - | | - | | | | | | 38,000 | | 38,950 |
| Hudbay Minerals, Inc. (Canada), 144a 7.250%, 1/15/23 | | 21,000 | | 22,260 | | - | | - | | | | | | 21,000 | | 22,260 |
| Kraton Polymers LLC / Kraton Polymers Capital Corp., 144a 7.000%, 4/15/25 | | 12,000 | | 12,165 | | - | | - | | | | | | 12,000 | | 12,165 |
| Lundin Mining Corp. (Canada), 144a 7.500%, 11/1/20 | | 47,000 | | 49,703 | | - | | - | | | | | | 47,000 | | 49,703 |
| NOVA Chemicals Corp. (Canada), 144a 5.250%, 8/1/23 | | 27,000 | | 27,608 | | - | | - | | | | | | 27,000 | | 27,608 |
| Scotts Miracle-Gro Co. (The), 144a 5.250%, 12/15/26 | | 21,000 | | 21,262 | | - | | - | | | | | | 21,000 | | 21,262 |
| | | | | 612,792 | | | | - | | | | | | | | 612,792 |
| Corporate Bonds Total | | | | 42,092,157 | | | | - | | | | | | | | 42,092,157 |
| U.S. Treasury Obligations - 9.2% | | | | | | | | | | | | | | | | |
| U.S. Treasury Bond, 2.250%, 8/15/46 | | 1,036,000 | | 876,796 | | - | | - | | | | | | 1,036,000 | | 876,796 |
| U.S. Treasury Bond, 2.500%, 2/15/46 | | 410,000 | | 367,462 | | - | | - | | | | | | 410,000 | | 367,462 |
| | | Touchstone Active Bond
Fund | | Sentinel Total Return Bond Fund | | Pro Forma Adjustments | | Proforma Combined
Touchstone Active Bond Fund |
| | | Principal
Amount | | Market
Value | | Principal
Amount | | Market
Value | | Principal
Amount | | Market
Value | | Principal
Amount | | Market
Value |
| U.S. Treasury Bond, 2.875%, 11/15/46 | | 200,000 | | 194,055 | | - | | - | | | | | | 200,000 | | 194,055 |
| U.S. Treasury Bond, 3.000%, 2/15/47 | | 2,800,000 | | 2,790,046 | | - | | - | | | | | | 2,800,000 | | 2,790,046 |
| U.S. Treasury Bond, 3.000%, 5/15/45 | | 135,000 | | 134,214 | | - | | - | | | | | | 135,000 | | 134,214 |
| U.S. Treasury Inflation Indexed Bonds, 0.375%, 1/15/27 | | 13,020,000 | | 13,029,710 | | - | | - | | | | | | 13,020,000 | | 13,029,710 |
| U.S. Treasury Note, 1.125%, 2/28/19 | | 2,055,000 | | 2,050,343 | | - | | - | | | | | | 2,055,000 | | 2,050,343 |
| U.S. Treasury Note, 1.125%, 7/31/21 | | 1,500,000 | | 1,454,766 | | - | | - | | | | | | 1,500,000 | | 1,454,766 |
| U.S. Treasury Note, 1.375%, 4/30/21 | | 1,500,000 | | 1,474,804 | | - | | - | | | | | | 1,500,000 | | 1,474,804 |
| U.S. Treasury Note, 2.000%, 11/15/26 | | 4,740,000 | | 4,578,916 | | - | | - | | | | | | 4,740,000 | | 4,578,916 |
| U.S. Treasury Note, 2.000%, 12/31/21 | | 8,500,000 | | 8,532,538 | | - | | - | | | | | | 8,500,000 | | 8,532,538 |
| U.S. Treasury Obligations Total | | | | 35,483,650 | | | | - | | | | | | | | 35,483,650 |
| Asset-Backed Securities - 2.9% | | | | | | | | | | | | | | | | |
| Ascentium Equipment Receivables Trust, Ser 2016-1A, Class B, 144a 2.850%, 7/10/20 | | 475,000 | | 480,332 | | - | | - | | | | | | 475,000 | | 480,332 |
| CIT Home Equity Loan Trust, Ser 2002-1, Class AF5, 7.210%, 2/25/33(C) | | 3,465 | | 3,459 | | - | | - | | | | | | 3,465 | | 3,459 |
| CWHEQ Home Equity Loan Trust, Ser 2007-S1, Class A5, 6.018%, 11/25/36(A) | | 382,425 | | 364,822 | | - | | - | | | | | | 382,425 | | 364,822 |
| Dell Equipment Finance Trust, Ser 2015-1, Class C, 144a 2.420%, 3/23/20 | | 450,000 | | 452,388 | | - | | - | | | | | | 450,000 | | 452,388 |
| Domino’s Pizza Master Issuer LLC, Ser 2012-1A, Class A2, 144a 5.216%, 1/25/42 | | 176,271 | | 178,568 | | - | | - | | | | | | 176,271 | | 178,568 |
| FFMLT Trust, Ser 2005-FFA, Class M3, 6.017%, 3/25/25(C) | | 414,795 | | 426,006 | | - | | - | | | | | | 414,795 | | 426,006 |
| FHLMC Structured Pass Through Securities, Ser T-20, Class A5, 6.895%, 12/25/29(C) | | 200,011 | | 248,669 | | - | | - | | | | | | 200,011 | | 248,669 |
| FNMA REMIC Trust, Ser 2001-W2, Class AF6, 6.589%, 10/25/31(C) | | 51,706 | | 55,148 | | - | | - | | | | | | 51,706 | | 55,148 |
| Keuka Park CLO Ltd 2013-1, 2.741%, 10/21/24 | | - | | - | | 2,000,000 | | 1,999,994 | (E) | | | | | 2,000,000 | | 1,999,994 |
| Leaf Receivables Funding LLC, Ser 2016-1, Class B, 144a 2.780%, 8/15/22 | | 300,000 | | 297,318 | | - | | - | | | | | | 300,000 | | 297,318 |
| Mid-State Capital Corp. Trust, Ser 2005-1, Class M2, 7.079%, 1/15/40 | | 1,556,467 | | 1,704,112 | | - | | - | | | | | | 1,556,467 | | 1,704,112 |
| Nomad CLO Ltd., 2.223%, 1/15/25 | | - | | - | | 1,250,000 | | 1,249,995 | (E) | | | | | 1,250,000 | | 1,249,995 |
| Orange Lake Timeshare Trust, Ser 2016-A, Class A, 144a 2.610%, 3/8/29 | | 485,246 | | 479,438 | | - | | - | | | | | | 485,246 | | 479,438 |
| RASC Trust, Ser 2001-KS3, Class AI6, 5.960%, 9/25/31(A) | | 1,999 | | 2,074 | | - | | - | | | | | | 1,999 | | 2,074 |
| Santander Drive Auto Receivables Trust, Ser 2015-1, Class B, 1.970%, 11/15/19 | | 288,603 | | 289,031 | | - | | - | | | | | | 288,603 | | 289,031 |
| Sonic Capital LLC, Ser 2016-1A, Class A2, 144a 4.472%, 5/20/46 | | 313,163 | | 308,609 | | - | | - | | | | | | 313,163 | | 308,609 |
| SpringCastle America Funding LLC, Ser 2016-AA, Class A, 144a 3.050%, 4/25/29 | | 434,579 | | 437,245 | | - | | - | | | | | | 434,579 | | 437,245 |
| Taco Bell Funding, LLC, 3.832%, 5/25/26 | | - | | - | | 1,990,000 | | 2,017,293 | (E) | | | | | 1,990,000 | | 2,017,293 |
| Asset-Backed Securities Total | | | | 5,727,219 | | | | 5,267,282 | | | | | | | | 10,994,501 |
| Non-Agency Collateralized Mortgage Obligations - 0.8% | | | | | | | | | | | | | | | | |
| Adjustable Rate Mortgage Trust, Ser 2004-4, Class 3A1, 3.336%, 3/25/35(A) | | 4,388 | | 4,234 | | - | | - | | | | | | 4,388 | | 4,234 |
| Alternative Loan Trust, Ser 2004-30CB, Class 3A1, 5.000%, 2/25/20 | | 283,674 | | 281,120 | | - | | - | | | | | | 283,674 | | 281,120 |
| Alternative Loan Trust, Ser 2005-J3, Class 3A1, 6.500%, 9/25/34 | | 25,957 | | 25,499 | | - | | - | | | | | | 25,957 | | 25,499 |
| CSFB Mortgage-Backed Trust, Ser 2004-7, Class 6A1, 5.250%, 10/25/19 | | 49,863 | | 50,409 | | - | | - | | | | | | 49,863 | | 50,409 |
JP Morgan Mortgage Trust, Ser 2005-A1, Class 2A1, 3.268%,
2/25/35(A) | | 106,458 | | 107,572 | | - | | - | | | | | | 106,458 | | 107,572 |
JP Morgan Mortgage Trust, Ser 2005-A2, Class 7CB1, 3.367%,
4/25/35(A) | | 272,584 | | 273,935 | | - | | - | | | | | | 272,584 | | 273,935 |
JP Morgan Mortgage Trust, Ser 2006-A4, Class 2A2, 3.082%,
6/25/36(A) | | 62,113 | | 55,689 | | - | | - | | | | | | 62,113 | | 55,689 |
| MASTR Alternative Loans Trust, Ser 2004-7, Class 10A1, 6.000%, 6/25/34 | | 53,990 | | 54,264 | | - | | - | | | | | | 53,990 | | 54,264 |
| Residential Asset Securitization Trust, Ser 2006-A1, Class 1A3, 6.000%, 4/25/36 | | 213,117 | | 163,546 | | - | | - | | | | | | 213,117 | | 163,546 |
Sequoia Mortgage Trust, Ser 2013-10, Class B2, 144a 3.568%,
8/25/43(A) | | 595,221 | | 583,456 | | - | | - | | | | | | 595,221 | | 583,456 |
| Structured Asset Securities Corp. Mortgage Pass-Through Certificates, Ser 2004-21XS, Class 2A6B, 5.650%, 12/25/34(C) | | 1,987 | | 2,015 | | - | | - | | | | | | 1,987 | | 2,015 |
| Structured Asset Securities Corp. Trust, Ser 2005-17, Class 5A1, 5.500%, 10/25/35 | | 150,892 | | 120,104 | | - | | - | | | | | | 150,892 | | 120,104 |
| Towd Point Mortgage Trust, Ser 2015-3, Class A2, 144a 4.000%, 3/25/54(A) | | 700,000 | | 707,540 | | - | | - | | | | | | 700,000 | | 707,540 |
| Towd Point Mortgage Trust, Ser 2016-2, Class A1, 144a 3.000%, 8/25/55(A) | | 374,288 | | 375,506 | | - | | - | | | | | | 374,288 | | 375,506 |
| Washington Mutual Alternative Mortgage Pass-Through Certificates, Ser 2005-9, Class 2A4, 5.500%, 11/25/35 | | 124,450 | | 111,639 | | - | | - | | | | | | 124,450 | | 111,639 |
| | | Touchstone Active Bond
Fund | | Sentinel Total Return Bond Fund | | Pro Forma Adjustments | | Proforma Combined
Touchstone Active Bond Fund |
| | | Principal
Amount | | Market
Value | | Principal
Amount | | Market
Value | | Principal
Amount | | Market
Value | | Principal
Amount | | Market
Value |
| Wells Fargo Mortgage Backed Securities Trust, Ser 2003-G, Class A1, 2.895%, 6/25/33(A) | | 125,129 | | 125,372 | | - | | - | | | | | | 125,129 | | 125,372 |
| Non-Agency Collateralized Mortgage Obligations Total | | | | 3,041,900 | | | | - | | | | | | | | 3,041,900 |
| Commercial Mortgage-Backed Securities - 0.4% | | | | | | | | | | | | | | | | |
| Cosmopolitan Hotel Trust, Ser 2016-CSMO, Class A, 144a 2.312%, 11/15/33(A) | | 595,000 | | 599,840 | | - | | - | | | | | | 595,000 | | 599,840 |
| Eleven Madison Trust Mortgage Trust, Ser 2015-11MD, Class C, 144a 3.555%, 9/10/35(A) | | 550,000 | | 546,464 | | - | | - | | | | | | 550,000 | | 546,464 |
| J.P. Morgan Chase Commercial Mortgage Securities Trust, Ser 2016-NINE, Class B, 144a 2.854%, 10/6/38(A) | | 528,000 | | 503,906 | | - | | - | | | | | | 528,000 | | 503,906 |
| Commercial Mortgage-Backed Securities Total | | | | 1,650,210 | | | | - | | | | | | | | 1,650,210 |
| | | | | | | | | | | | | | | | | |
| | | Shares | | | | Shares | | | | Shares | | | | Shares | | |
| Preferred Stocks - 0.2% | | | | | | | | | | | | | | | | |
| Utilities - 0.1% | | | | | | | | | | | | | | | | |
| Entergy Arkansas, Inc., 4.875% | | 8,634 | | 196,164 | | - | | - | | | | | | 8,634 | | 196,164 |
| Entergy Louisiana LLC, 4.875% | | 8,769 | | 198,267 | | - | | - | | | | | | 8,769 | | 198,267 |
| Entergy Mississippi, Inc., 4.900% | | 7,966 | | 180,271 | | - | | - | | | | | | 7,966 | | 180,271 |
| | | | | 574,702 | | | | - | | | | | | | | 574,702 |
| Real Estate - 0.1% | | | | | | | | | | | | | | | | |
| Public Storage, 4.900% | | 19,007 | | 427,467 | | - | | - | | | | | | 19,007 | | 427,467 |
| Preferred Stocks Total | | | | 1,002,169 | | | | - | | | | | | | | 1,002,169 |
| | | | | | | | | | | | | | | | | |
| | | Principal
Amount | | | | Principal
Amount | | | | Principal
Amount | | | | Principal
Amount | | |
| Agency Collateralized Mortgage Obligations - 0.1% | | | | | | | | | | | | | | | | |
| FNMA REMIC, Ser 2015-51, Class KC, 3.000%, 6/25/45 | | 138,812 | | 140,345 | | - | | - | | | | | | 138,812 | | 140,345 |
| FNMA Trust, Ser 2004-W15, Class 2AF, 1.232%, 8/25/44(A) | | 139,845 | | 138,784 | | - | | - | | | | | | 139,845 | | 138,784 |
| GNMA, Ser 2003-11, Class GJ, 4.000%, 10/17/29 | | 10,844 | | 11,403 | | - | | - | | | | | | 10,844 | | 11,403 |
| Agency Collateralized Mortgage Obligations Total | | | | 290,532 | | | | - | | | | | | | | 290,532 |
| Sovereign Bond - 0.1% | | | | | | | | | | | | | | | | |
| Bermuda Government International Bond, 144a 3.717%, 1/25/27 | | 253,000 | | 243,520 | | - | | - | | | | | | 253,000 | | 243,520 |
| | | | | | | | | | | | | | | | | |
| | | Shares | | | | Shares | | | | Shares | | | | Shares | | |
| Short Term Investments - 3.1% | | | | | | | | | | | | | | | | |
Dreyfus Government Cash Management, Institutional Shares,
0.66%∞Ω | | 574,093 | | 574,093 | | - | | - | | | | | | 574,093 | | 574,093 |
Invesco Government & Agency Portfolio, Institutional Class,
0.61%**∞Ω | | 609,596 | | 609,596 | | - | | - | | | | | | 609,596 | | 609,596 |
| State Street Institutional U.S. Government Money Market Fund Premier Class | | - | | - | | 10,762,336 | | 10,762,336 | (E) | (88,618) | | (88,618) | (F) | 10,673,718 | | 10,673,718 |
| Short Term Investments Total | | | | 1,183,689 | | | | 10,762,336 | | | | (88,618) | | | | 11,857,407 |
Total Investment Securities - 101.9%
(Cost $390,201,484) | | | $ | 103,304,990 | | | $ | 290,226,264 | | | $ | (88,618) | | | $ | 393,442,636 |
| Liabilities in Excess of Other Assets - -1.9% | | | | 155,891 | | | | (7,764,852) | | | | 88,618 | (F) | | | (7,520,343) |
| Net Assets - 100.0% | | | $ | 103,460,881 | | | $ | 282,461,412 | | | $ | - | | | $ | 385,922,293 |
(A) Variable rate security - Rate reflected is the rate in effect as of March 31, 2017.
(B) Perpetual Bond - A Bond with no definite maturity date.
(C) Step Bond - A bond that pays an initial interest rate for the first period and then a higher interest rate for the following periods until maturity. The interest rate shown reflects the rate in effect as of March 31, 2017.
(D) The actual mortgage-backed security that will be delivered is not designated until 48 hours prior to the established trade settlement date with the broker.
(E) Following the Reorganization, all or a portion of this security may be sold. It is expected that the Touchstone Active Bond Fund will sell approximately 67% of the securities acquired from the Target Fund. If such sales had occurred as of 3/31/17, shareholders would have recognized capital gains of $0.10 per share of the Proforma Combined Touchstone Active Bond Fund.
(F) Deferred compensation plan will be redeemed prior to conversion.
** Represents collateral for securities loaned.
† All or a portion of the security is on loan. The total market value of the securities on loan as of March 31, 2017 was $573,430.
∞ Open-End Fund.
Ω Represents the 7-day SEC yield as of March 31, 2017.
FHLMC - Federal Home Loan Mortgage Corporation
FNMA - Federal National Mortgage Association
GNMA - Government National Mortgage Association
LLC - Limited Liability Company
LP - Limited Partnership
MTN - Medium Term Note
PLC - Public Limited Company
REIT - Real Estate Investment Trust
REMIC - Real Estate Mortgage Investment Conduit
144a - This is a restricted security that was sold in a transaction qualifying for the exemption under Rule 144A of the Securities Act of 1933. This security may be sold in transactions exempt from registration, normally to qualified institutional buyers. At March 31, 2017, these securities were valued at $14,095,446 or 2.5% of net assets. These securities were deemed liquid pursuant to procedures approved by the Board of Trustees.
| Description | | Level 1 | | Level 2 | | Level 3 | | Total |
| U.S. Government Mortgage-Backed Obligations | $ | - | $ | 94,376,330 | $ | - | $ | 94,376,330 |
| Bank Loans | | - | | 125,758,168 | | - | | 125,758,168 |
| Exchange Traded Funds | | - | | 66,652,093 | | - | | 66,652,093 |
| Corporate Bonds | | - | | 42,092,157 | | - | | 42,092,157 |
| U.S. Treasury Obligations | | - | | 35,483,650 | | - | | 35,483,650 |
| Asset-Backed Securities | | - | | 10,994,501 | | - | | 10,994,501 |
| Non-Agency Collateralized Mortgage Obligations | | - | | 3,041,900 | | - | | 3,041,900 |
| Commercial Mortgage-Backed Securities | | - | | 1,650,210 | | - | | 1,650,210 |
| Preferred Stocks | | 1,002,169 | | - | | - | | 1,002,169 |
| Agency Collateralized Mortgage Obligations | | - | | 290,532 | | - | | 290,532 |
| Sovereign Bond | | - | | 243,520 | | - | | 243,520 |
| Short Term Investments | | 1,183,689 | | 10,673,718 | | - | | 11,857,407 |
| Total | $ | 2,185,858 | $ | 391,256,778 | $ | - | $ | 393,442,636 |
Pro Forma Financial Statements for the Reorganization of Sentinel Government Securities Fund and Sentinel Total Return Bond Fund into Touchstone Active Bond Fund
Pro Forma Statement of Assets and Liabilities
As of March 31, 2017 (Unaudited)
| | | Sentinel
Government
Securities
Fund | | | Sentinel
Total Return
Bond Fund | | | Touchstone
Active Bond
Fund | | | Pro
Forma
Adjustments | | | Proforma
Combined
Touchstone
Active Bond
Fund |
| Assets | | | | | | | | | | | | | | |
| Investments, at cost | $ | 185,740,231 | | $ | 288,587,030 | | $ | 101,703,072 | | | (339,445 | ) (1) | $ | 575,690,888 |
| Investments, at market value (A) | $ | 186,644,318 | | $ | 290,226,264 | | $ | 103,304,990 | | | (339,445 | ) (1) | $ | 579,836,127 |
| Cash deposits held at prime broker (B) | | - | | | 760,626 | | | 23,588 | | | | | | 784,214 |
| Dividends and interest receivable | | 545,488 | | | 1,498,126 | | | 682,649 | | | | | | 2,726,263 |
| Receivable for capital shares sold | | 92,448 | | | 695,824 | | | 85,374 | | | | | | 873,646 |
| Receivable for investments sold | | - | | | 3,575 | | | 395,712 | | | | | | 399,287 |
| Receivable for variation margin on futures contracts | | - | | | - | | | 8,930 | | | | | | 8,930 |
| Receivable for securities lending income | | - | | | 124 | | | 294 | | | | | | 418 |
| Receivable from Fund Advisor | | - | | | 7,370 | | | - | | | | | | 7,370 |
| Other assets | | - | | | - | | | 32,178 | | | | | | 32,178 |
| Total Assets | | 187,282,254 | | | 293,191,909 | | | 104,533,715 | | | (339,445 | ) | | 584,668,433 |
| | | | | | | | | | | | | | | |
| Liabilities | | | | | | | | | | | | | | |
| Bank Overdrafts | | - | | | - | | | 13,914 | | | | | | 13,914 |
| Payable to Transfer Agent | | 24,291 | | | 45,656 | | | 37,595 | | | | | | 107,542 |
| Payable for return of collateral for securities on loan | | - | | | - | | | 609,596 | | | | | | 609,596 |
| Payable for capital shares redeemed | | 112,006 | | | 784,635 | | | 145,476 | | | | | | 1,042,117 |
| Payable for investments purchased | | 5,727,393 | | | 9,496,445 | | | 182,573 | | | | | | 15,406,411 |
| Payable for variation margin on futures contracts | | - | | | 67,188 | | | - | | | | | | 67,188 |
| Payable to Investment Advisor | | 69,574 | | | 132,301 | | | 27,471 | | | | | | 229,346 |
| Payable to other affiliates | | 44,693 | | | 41,094 | | | 5,850 | | | | | | 91,637 |
| Payable to Trustees and Compliance Fees | | 382 | | | 2,142 | | | 3,914 | | | | | | 6,438 |
| Payable for Professional Services | | 25,615 | | | 40,898 | | | 15,462 | | | | | | 81,975 |
| Deferred Compensation | | 250,827 | | | 88,618 | | | - | | | (339,445 | ) (1) | | - |
| Other accrued expenses and liabilities | | 46,427 | | | 31,520 | | | 30,983 | | | | | | 108,930 |
| Total Liabilities | | 6,301,208 | | | 10,730,497 | | | 1,072,834 | | | (339,445 | ) | | 17,765,094 |
| | | | | | | | | | | | | | | |
| Net Assets | $ | 180,981,046 | | $ | 282,461,412 | | $ | 103,460,881 | | | - | | $ | 566,903,339 |
| | | | | | | | | | | | | | | |
| Net assets consist of: | | | | | | | | | | | | | | |
| Par Value | $ | 186,742 | (C) | $ | 274,851 | (C) | $ | 100,381 | (D) | | | | $ | 561,974 |
| Paid-in capital | | 239,183,367 | | | 314,359,888 | | | 110,833,964 | | | | | | 664,377,219 |
| Accumulated net investment income (loss) | | (781,561) | | | (466,516 | ) | | (12,866 | ) | | | | | (1,260,943) |
| Accumulated net realized gains (losses) on investments, foreign currency transactions, written options and securities sold short | | (58,511,589 | ) | | (32,991,102 | ) | | (9,071,098 | ) | | | | | (100,573,789) |
| Net unrealized appreciation (depreciation) on investments, foreign currency transactions, written options and securities sold short | | 904,087 | | | 1,284,291 | | | 1,610,500 | | | | | | 3,798,878 |
| | | | | | | | | | | | | | | |
| Net Assets applicable to shares outstanding | $ | 180,981,046 | | $ | 282,461,412 | | $ | 103,460,881 | | | | | $ | 566,903,339 |
| | | Sentinel
Government
Securities
Fund | | | Sentinel
Total Return
Bond Fund | | | Touchstone
Active Bond
Fund | | | Pro
Forma
Adjustments | | | Proforma
Combined
Touchstone
Active Bond
Fund |
| | | | | | | | | | | | | | | |
| Pricing of Class A Shares | | | | | | | | | | | | | | |
| Net assets attributable to Class A shares | $ | 140,159,042 | | $ | 64,109,477 | | $ | 23,444,475 | | $ | 609,755 | (H) | $ | 228,322,749 |
| Shares of beneficial interest outstanding | | 14,464,515 | (C) | | 6,240,246 | (C) | | 2,264,218 | (D) | | (918,049) | | | 22,050,930 |
| Net asset value and redemption price per share | $ | 9.69 | (E) | $ | 10.27 | (E) | $ | 10.35 | (F) | | | | $ | 10.35 |
| Maximum sales charge - Class A shares | | 2.25% | | | 2.25% | | | 4.75% | | | | | | 4.75% |
| Maximum offering price per share | $ | 9.91 | | $ | 10.51 | | $ | 10.87 | | | | | $ | 10.87 |
| | | | | | | | | | | | | | | |
| Pricing of Class C Shares | | | | | | | | | | | | | | |
| Net assets attributable to Class C shares | $ | 17,251,841 | | $ | 23,784,867 | | $ | 5,466,677 | | | | | $ | 46,503,385 |
| Shares of beneficial interest outstanding | | 1,777,935 | (C) | | 2,321,707 | (C) | | 570,446 | (D) | | 182,525 | | | 4,852,613 |
| Net asset value, offering price and redemption price per share(G) | $ | 9.70 | | $ | 10.24 | | $ | 9.58 | | | | | $ | 9.58 |
| | | | | | | | | | | | | | | |
| Pricing of Class R3 Shares | | | | | | | | | | | | | | |
| Net assets attributable to Class R3 shares(H) | | - | | $ | 609,755 | | | - | | $ | (609,755) | | | - |
| Shares of beneficial interest outstanding | | - | | | 59,363 | (C) | | - | | | (59,363) | | | - |
| Net asset value, offering price and redemption price per share(G) | | | | $ | 10.27 | | | | | | | | | - |
| | | | | | | | | | | | | | | |
| Pricing of Class R6 Shares | | | | | | | | | | | | | | |
| Net assets attributable to Class R6 shares(I) | | - | | $ | 612,150 | | | - | | $ | (612,150) | | | - |
| Shares of beneficial interest outstanding | | - | | | 59,537 | (C) | | - | | | (59,537) | | | - |
| Net asset value, offering price and redemption price per share(G) | | | | $ | 10.28 | | | | | | | | | - |
| | | | | | | | | | | | | | | |
| Pricing of Class Y Shares | | | | | | | | | | | | | | |
| Net assets attributable to Class Y shares(J) | $ | 23,570,163 | | $ | 193,345,163 | | $ | 67,760,762 | | $ | 612,150 | | $ | 285,288,238 |
| Shares of beneficial interest outstanding | | 2,431,719 | (C) | | 18,804,288 | (C) | | 6,547,101 | (D) | | (218,322) | | | 27,564,786 |
| Net asset value, offering price and redemption price per share(G) | $ | 9.69 | | $ | 10.28 | | $ | 10.35 | | | | | $ | 10.35 |
| | | | | | | | | | | | | | | |
| Pricing of Institutional Class Shares | | | | | | | | | | | | | | |
| Net assets attributable to Institutional Class shares | | | | | | | $ | 6,788,967 | | | | | $ | 6,788,967 |
| Shares of beneficial interest outstanding | | | | | | | | 656,297 | (D) | | - | | | 656,297 |
| Net asset value, offering price and redemption price per share | | | | | | | $ | 10.34 | | | | | $ | 10.34 |
| | | | | | | | | | | | | | | |
| (A) Includes market value of securities on loan of: | | | | | | | $ | 573,430 | | | | | $ | 573,430 |
| (B) Represents segregated cash for futures contracts | | | | | | | | | | | | | | - |
| (C) Limited number of shares authorized, par value of $.01 | | | | | | | | | | | | | | |
| (D) Unlimited number of shares authorized, par value of $.01 | | | | | | | | | | | | | | |
(E) There is no sales load on subscriptions of $500,000 or more. Redemptions that were part of a $500,000 million or more subscription may be subject to a contingent deferred sales load if redeemed within a one-year period from the date of purchase.
(F) There is no sales load on subscriptions of $1 million or more. Redemptions that were part of a $1 million or more subscription may be subject to a contingent deferred sales load if redeemed within a one-year period from the date of purchase.
(G) Redemption price per share varies by length of time shares are held due to the terms of the contingent deferred sales charge.
(H) Sentinel Total Return Bond Fund Class R3 shares will convert to Touchstone Active Bond Fund Class A shares.
(I) Sentinel Total Return Bond Fund Class R6 shares will convert to Touchstone Active Bond Fund Class Y shares.
(J) Sentinel Government Securities and Total Return Bond Funds Class I shares will convert to Touchstone Active Bond Fund Class Y shares.
(1) Deferred compensation plan will be redeemed prior to conversion.
Pro Forma Statement of Operations
For the twelve months ending March 31, 2017 (Unaudited)
| | | Sentinel
Total
Return
Bond Fund | | | Sentinel
Government
Securities
Fund | | | Touchstone
Active Bond
Fund | | | Pro Forma
Adjustments | | | Proforma
Combined
Touchstone
Active Bond
Fund | |
| Investment Income | | | | | | | | | | | | | | | | | | | | |
| Dividends | | $ | 5,792,678 | | | $ | 11,956 | | | $ | 40,516 | | | $ | - | | | $ | 5,845,150 | |
| Interest Income | | | 6,045,264 | | | | 5,248,844 | | | | 3,691,667 | | | | - | | | | 14,985,775 | |
| Income from Securities loaned | | | 113,304 | | | | - | | | | 1,082 | | | | - | | | | 114,386 | |
| Total Investment Income | | | 11,951,246 | | | | 5,260,800 | | | | 3,733,265 | | | | - | | | | 20,945,311 | |
| Expenses | | | | | | | | | | | | | | | | | | | | |
| Investment advisory fees | | | 2,281,007 | | | | 957,656 | | | | 437,642 | | | | (843,366 | )(A) | | | 2,832,939 | |
| Accounting and Administration services | | | 163,341 | | | | 78,475 | | | | 158,645 | | | | 711,042 | (A) | | | 1,111,503 | |
| Compliance fees and expenses | | | 33,358 | | | | 16,743 | | | | 2,856 | | | | (50,567 | )(B) | | | 2,390 | |
| Custody fees | | | 52,454 | | | | 25,525 | | | | 44,338 | | | | (22,317 | )(B) | | | 100,000 | |
| Professional fees | | | 50,175 | | | | 33,050 | | | | 32,858 | | | | (83,225 | )(B) | | | 32,858 | |
| Transfer Agent fees, Class A | | | 287,917 | | | | 223,587 | | | | 34,505 | | | | - | | | | 546,009 | |
| Transfer Agent fees, Class C | | | 31,844 | | | | 26,885 | | | | 7,534 | | | | - | | | | 66,263 | |
| Transfer Agent fees, Class Y | | | 414,073 | | | | 26,340 | | | | 99,337 | | | | - | (C) | | | 539,750 | |
| Transfer Agent fees, Institutional Class | | | - | | | | - | | | | 145 | | | | - | | | | 145 | |
| Transfer Agent fees, Class R3 | | | 9 | | | | - | | | | - | | | | (9 | )(C) | | | - | |
| Transfer Agent fees, Class R6 | | | 9 | | | | - | | | | - | | | | (9 | )(C) | | | - | |
| Registration Fees, Class A | | | 13,876 | | | | 20,229 | | | | 12,201 | | | | (26,076 | )(B) | | | 20,230 | |
| Registration Fees, Class C | | | 13,089 | | | | 11,748 | | | | 11,037 | | | | (22,784 | )(B) | | | 13,090 | |
| Registration Fees, Class Y | | | 24,026 | | | | 10,348 | | | | 14,117 | | | | (24,465 | )(B)(C) | | | 24,026 | |
| Registration Fees, Institutional Class | | | - | | | | - | | | | 10,572 | | | | - | | | | 10,572 | |
| Registration Fees, Class R3 | | | 13,585 | | | | - | | | | - | | | | (13,585 | )(B)(C) | | | - | |
| Registration Fees, Class R6 | | | 13,785 | | | | - | | | | - | | | | (13,785 | )(B)(C) | | | - | |
| Reports to Shareholders, Class A | | | 5,551 | | | | 2,557 | | | | 3,131 | | | | - | | | | 11,239 | |
| Reports to Shareholders, Class C | | | 1,239 | | | | 183 | | | | 2,021 | | | | - | | | | 3,443 | |
| Reports to Shareholders, Class Y | | | 4,647 | | | | 109 | | | | 2,503 | | | | - | (C) | | | 7,259 | |
| Reports to Shareholders, Class Institutional Class | | | - | | | | - | | | | 1,729 | | | | - | | | | 1,729 | |
| Reports to Shareholders, Class R3 | | | 4 | | | | - | | | | - | | | | (4 | )(C) | | | - | |
| Reports to Shareholders, Class R6 | | | 4 | | | | - | | | | - | | | | (4 | )(C) | | | - | |
| Distribution expenses, Class A | | | 198,520 | | | | 323,175 | | | | 63,280 | | | | 133,248 | (D) | | | 718,223 | |
| Distribution expenses, Class C | | | 321,778 | | | | 219,279 | | | | 63,529 | | | | - | | | | 604,586 | |
| Trustee fees | | | 55,927 | | | | 46,028 | | | | 16,205 | | | | (104,679 | )(B) | | | 13,481 | |
| Other expenses | | | 27,002 | | | | 19,701 | | | | 94,055 | | | | 3,186 | (F) | | | 143,944 | |
| Total Expenses | | | 4,007,220 | | | | 2,041,618 | | | | 1,112,240 | | | | (357,399 | ) | | | 6,803,679 | |
| Fees waived and/or reimbursed by the Advisor and/or Affiliates | | | (278,750 | ) | | | - | | | | (279,694 | ) | | | 56,006 | (E) | | | (502,438 | ) |
| Net Expenses | | | 3,728,470 | | | | 2,041,618 | | | | 832,546 | | | | (301,393 | ) | | | 6,301,241 | |
| Net Investment Income (Loss) | | | 8,222,776 | | | | 3,219,182 | | | | 2,900,719 | | | | 301,393 | | | | 14,644,070 | |
| Realized and Unrealized Gains (Losses) on Investments | | | | | | | | | | | | | | | | | | | | |
| Net realized gains (losses) on investments | | | 11,192,200 | | | | (339,503 | ) | | | 16,937 | | | | - | | | | 10,869,634 | |
| Net realized gains (losses) on futures contracts | | | 81,682 | | | | - | | | | 5,651 | | | | - | | | | 87,333 | |
| Net realized gains (losses) on swap agreements | | | - | | | | - | | | | (558 | ) | | | - | | | | (558 | ) |
| Net realized gains (losses) on securities sold short | | | - | | | | (77,500 | ) | | | - | | | | - | | | | (77,500 | ) |
| Net change in unrealized appreciation (depreciation) on investments | | | (9,989,198 | ) | | | (4,791,154 | ) | | | 441,820 | | | | - | | | | (14,338,532 | ) |
| Net change in unrealized appreciation (depreciation) on foreign currency transactions | | | - | | | | - | | | | 3,861 | | | | - | | | | 3,861 | |
| Net change in unrealized appreciation (depreciation) on futures contracts | | | (69,138 | ) | | | - | | | | 8,539 | | | | - | | | | (60,599 | ) |
| Net Realized and Unrealized Gains (Losses) on Investments | | | 1,215,546 | | | | (5,208,157 | ) | | | 476,250 | | | | - | | | | (3,516,361 | ) |
| Change in Net Assets Resulting from Operations | | $ | 9,438,322 | | | $ | (1,988,975 | ) | | $ | 3,376,969 | | | $ | 301,393 | | | $ | 11,127,709 | |
(A) Reflects the impact of applying the Acquiring Fund’s Investment Advisory and Administration fee rates following the Reorganization to the combined fund’s average net assets.
(B) Reflects the anticipated reduction of certain duplicative expenses eliminated as a result of the Reorganization.
(C) Holders of Sentinel Government Securities Fund Class I shares will receive Class Y shares of the Touchstone Active Bond Fund upon closing of the reorganization. Holders of Sentinel Total Return Bond Fund Class I, Class R3 and Class R6 shares will receive Class Y, Class A and Class Y shares, respectively, of the Touchstone Active Bond Fund upon closing of the reorganization.
(D) Reflects the impact of applying the Acquiring Fund’s 12b-1 distribution fee rate following the Reorganization to the combined fund’s average net assets.
(E) Reflects the increase (decrease) in expense reimbursement payments the advisor would have made to the combined fund if the Reorganization had occurred on the first day of the 12-month period ended March 31, 2017.
(F) Reflects the anticipated increase of certain expenses as a result of the Reorganization.
Pro Forma Portfolio of Investments
As of March 31, 2017 (Unaudited)
| | | | Touchstone Active Bond
Fund | | | | Sentinel Total Return
Bond Fund | | | | Sentinel Government
Securities Fund | | | | Pro Forma Adjustments | | | | Proforma Combined
Touchstone Active Bond
Fund | |
| | | | Principal
Amount | | | | Market
Value | | | | Principal
Amount | | | | Market
Value | | | | Principal
Amount | | | | Market
Value | | | | Principal
Amount | | | | Market
Value | | | | Principal
Amount | | | | Market
Value | |
| U.S. Government Mortgage-Backed Obligations - 47.9% | | | | | | | | | | | | | | | | | | | | | | | | | | | | | | | | | | | | | | | | |
| FHLMC, 360017, 11.000%, 11/1/17 | | | - | | | $ | - | | | | - | | | $ | - | | | | 6 | | | | 6 | (E) | | | | | | $ | | | | | 6 | | | $ | 6 | |
| FHLMC, A64971, 5.500%, 8/1/37 | | | - | | | | - | | | | - | | | | - | | | | 8,166 | | | | 9,204 | (E) | | | | | | | | | | | 8,166 | | | | 9,204 | |
| FHLMC, A89148, 4.000%, 10/1/39 | | | - | | | | - | | | | - | | | | - | | | | 6,489,922 | | | | 6,830,519 | (E) | | | | | | | | | | | 6,489,922 | | | | 6,830,519 | |
| FHLMC, G05483, 4.500%, 6/1/39 | | | - | | | | - | | | | - | | | | - | | | | 4,146,832 | | | | 4,471,402 | (E) | | | | | | | | | | | 4,146,832 | | | | 4,471,402 | |
| FHLMC, G05624, 4.500%, 9/1/39 | | | - | | | | - | | | | - | | | | - | | | | 9,290,437 | | | | 10,020,323 | (E) | | | | | | | | | | | 9,290,437 | | | | 10,020,323 | |
| FHLMC, J22900, 2.500%, 3/1/28 | | | - | | | | - | | | | 1,091,298 | | | | 1,104,804 | (E) | | | 13,641,223 | | | | 13,810,054 | (E) | | | | | | | | | | | 14,732,521 | | | | 14,914,858 | |
| FHLMC, Q29056, 4.000%, 10/1/44 | | | - | | | | - | | | | 8,019,425 | | | | 8,418,815 | (E) | | | 5,371,006 | | | | 5,638,497 | (E) | | | | | | | | | | | 13,390,431 | | | | 14,057,311 | |
| FHLMC, Q32917, 3.000%, 4/1/45 | | | - | | | | - | | | | 10,665,455 | | | | 10,615,702 | (E) | | | - | | | | - | | | | | | | | | | | | 10,665,455 | | | | 10,615,702 | |
| FHLMC, Q33006, 3.500%, 4/1/45 | | | - | | | | - | | | | 13,113,262 | | | | 13,421,860 | (E) | | | 11,579,810 | | | | 11,852,320 | (E) | | | | | | | | | | | 24,693,072 | | | | 25,274,180 | |
| FHLMC, 1B3366, 3.447%, 3/1/37(A) | | | 65,703 | | | | 69,384 | | | | - | | | | - | | | | - | | | | - | | | | | | | | | | | | 65,703 | | | | 69,384 | |
| FHLMC, 1H1348, 2.681%, 10/1/36(A) | | | 173,302 | | | | 183,254 | | | | - | | | | - | | | | - | | | | - | | | | | | | | | | | | 173,302 | | | | 183,254 | |
| FHLMC, 1Q0339, 3.312%, 4/1/37(A) | | | 595,629 | | | | 630,351 | | | | - | | | | - | | | | - | | | | - | | | | | | | | | | | | 595,629 | | | | 630,351 | |
| FHLMC, A12886, 5.000%, 8/1/33 | | | 24,555 | | | | 26,990 | | | | - | | | | - | | | | - | | | | - | | | | | | | | | | | | 24,555 | | | | 26,990 | |
| FHLMC, A13842, 6.000%, 9/1/33 | | | 61,701 | | | | 69,653 | | | | - | | | | - | | | | - | | | | - | | | | | | | | | | | | 61,701 | | | | 69,653 | |
| FHLMC, A21415, 5.000%, 5/1/34 | | | 14,285 | | | | 15,657 | | | | - | | | | - | | | | - | | | | - | | | | | | | | | | | | 14,285 | | | | 15,657 | |
| FHLMC, A35682, 5.000%, 7/1/35 | | | 33,037 | | | | 36,121 | | | | - | | | | - | | | | - | | | | - | | | | | | | | | | | | 33,037 | | | | 36,121 | |
| FHLMC, A36523, 5.000%, 8/1/35 | | | 17,717 | | | | 19,373 | | | | - | | | | - | | | | - | | | | - | | | | | | | | | | | | 17,717 | | | | 19,373 | |
| FHLMC, A46590, 5.000%, 8/1/35 | | | 85,991 | | | | 93,576 | | | | - | | | | - | | | | - | | | | - | | | | | | | | | | | | 85,991 | | | | 93,576 | |
| FHLMC, A56988, 5.500%, 2/1/37 | | | 28,073 | | | | 31,144 | | | | - | | | | - | | | | - | | | | - | | | | | | | | | | | | 28,073 | | | | 31,144 | |
| FHLMC, A96485, 4.500%, 1/1/41 | | | 179,984 | | | | 193,452 | | | | - | | | | - | | | | - | | | | - | | | | | | | | | | | | 179,984 | | | | 193,452 | |
| FHLMC, A97897, 4.500%, 4/1/41 | | | 824,015 | | | | 897,396 | | | | - | | | | - | | | | - | | | | - | | | | | | | | | | | | 824,015 | | | | 897,396 | |
| FHLMC, C62740, 7.000%, 1/1/32 | | | 26,593 | | | | 29,475 | | | | - | | | | - | | | | - | | | | - | | | | | | | | | | | | 26,593 | | | | 29,475 | |
| FHLMC, C72254, 6.500%, 7/1/32 | | | 26,743 | | | | 30,563 | | | | - | | | | - | | | | - | | | | - | | | | | | | | | | | | 26,743 | | | | 30,563 | |
| FHLMC, C90986, 7.000%, 6/1/26 | | | 100,904 | | | | 110,930 | | | | - | | | | - | | | | - | | | | - | | | | | | | | | | | | 100,904 | | | | 110,930 | |
| FHLMC, G02184, 5.000%, 4/1/36 | | | 29,278 | | | | 32,005 | | | | - | | | | - | | | | - | | | | - | | | | | | | | | | | | 29,278 | | | | 32,005 | |
| FHLMC, G05733, 5.000%, 11/1/39 | | | 457,021 | | | | 502,844 | | | | - | | | | - | | | | - | | | | - | | | | | | | | | | | | 457,021 | | | | 502,844 | |
| FHLMC, J13584, 3.500%, 11/1/25 | | | 279,316 | | | | 292,442 | | | | - | | | | - | | | | - | | | | - | | | | | | | | | | | | 279,316 | | | | 292,442 | |
| FHR, 3331 PE, 6.000%, 6/15/37 | | | - | | | | - | | | | - | | | | - | | | | 7,433,185 | | | | 8,263,097 | (E) | | | | | | | | | | | 7,433,185 | | | | 8,263,097 | |
| FHR, 3859 JB, 5.000%, 5/15/41 | | | - | | | | - | | | | 2,071,445 | | | | 2,243,361 | (E) | | | - | | | | - | | | | | | | | | | | | 2,071,445 | | | | 2,243,361 | |
| FNMA, 426830, 8.000%, 11/1/24 | | | - | | | | - | | | | - | | | | - | | | | 16,920 | | | | 17,551 | (E) | | | | | | | | | | | 16,920 | | | | 17,551 | |
| FNMA, 725423, 5.500%, 5/1/34 | | | - | | | | - | | | | 634,360 | | | | 710,259 | (E) | | | - | | | | - | | | | | | | | | | | | 634,360 | | | | 710,259 | |
| FNMA, 725610, 5.500%, 7/1/34 | | | - | | | | - | | | | 576,484 | | | | 645,739 | (E) | | | - | | | | - | | | | | | | | | | | | 576,484 | | | | 645,739 | |
| FNMA, 738887, 5.500%, 10/1/33 | | | - | | | | - | | | | - | | | | - | | | | 115,622 | | | | 128,301 | (E) | | | | | | | | | | | 115,622 | | | | 128,301 | |
| FNMA, 748895, 6.000%, 12/1/33 | | | - | | | | - | | | | - | | | | - | | | | 104,096 | | | | 113,490 | (E) | | | | | | | | | | | 104,096 | | | | 113,490 | |
| FNMA, 758564, 6.000%, 9/1/24 | | | - | | | | - | | | | - | | | | - | | | | 177,251 | | | | 200,104 | (E) | | | | | | | | | | | 177,251 | | | | 200,104 | |
| FNMA, 881279, 5.000%, 11/1/36 | | | - | | | | - | | | | - | | | | - | | | | 947,049 | | | | 1,044,605 | (E) | | | | | | | | | | | 947,049 | | | | 1,044,605 | |
| FNMA, 890310, 4.500%, 12/1/40 | | | - | | | | - | | | | 4,968,551 | | | | 5,349,890 | (E) | | | - | | | | - | | | | | | | | | | | | 4,968,551 | | | | 5,349,890 | |
| FNMA, 931533, 4.500%, 7/1/39 | | | - | | | | - | | | | - | | | | - | | | | 1,651,661 | | | | 1,783,087 | (E) | | | | | | | | | | | 1,651,661 | | | | 1,783,087 | |
| FNMA, 931535, 5.500%, 7/1/39 | | | - | | | | - | | | | - | | | | - | | | | 1,373,993 | | | | 1,527,247 | (E) | | | | | | | | | | | 1,373,993 | | | | 1,527,247 | |
| FNMA, AB7845, 3.000%, 2/1/43 | | | - | | | | - | | | | - | | | | - | | | | 9,815,373 | | | | 9,789,558 | (E) | | | | | | | | | | | 9,815,373 | | | | 9,789,558 | |
| FNMA, AD9193, 5.000%, 9/1/40 | | | - | | | | - | | | | 1,717,237 | | | | 1,879,437 | (E) | | | 6,868,947 | | | | 7,517,748 | (E) | | | | | | | | | | | 8,586,183 | | | | 9,397,185 | |
| FNMA, AE0215, 4.000%, 12/1/39 | | | - | | | | - | | | | - | | | | - | | | | 7,874,539 | | | | 8,259,718 | (E) | | | | | | | | | | | 7,874,539 | | | | 8,259,718 | |
| FNMA, AI4728, 4.500%, 7/1/41 | | | - | | | | - | | | | - | | | | - | | | | 11,078,528 | | | | 11,892,852 | (E) | | | | | | | | | | | 11,078,528 | | | | 11,892,852 | |
| FNMA, AL2860, 3.000%, 12/1/42 | | | - | | | | - | | | | - | | | | - | | | | 13,504,662 | | | | 13,469,132 | (E) | | | | | | | | | | | 13,504,662 | | | | 13,469,132 | |
| FNMA, AL5718, 3.500%, 9/1/44 | | | - | | | | - | | | | - | | | | - | | | | 6,569,647 | | | | 6,750,595 | (E) | | | | | | | | | | | 6,569,647 | | | | 6,750,595 | |
| FNMA, AS0779, 4.000%, 10/1/43 | | | - | | | | - | | | | 3,440,586 | | | | 3,646,810 | (E) | | | - | | | | - | | | | | | | | | | | | 3,440,586 | | | | 3,646,810 | |
| FNMA, AT2016, 3.000%, 4/1/43 | | | - | | | | - | | | | 8,672,326 | | | | 8,649,494 | (E) | | | 16,042,143 | | | | 15,999,909 | (E) | | | | | | | | | | | 24,714,469 | | | | 24,649,404 | |
| FNMA, BC1809, 3.500%, 5/1/46 | | | - | | | | - | | | | 5,093,487 | | | | 5,213,487 | (E) | | | 12,797,387 | | | | 13,098,886 | (E) | | | | | | | | | | | 17,890,874 | | | | 18,312,373 | |
| FNMA, TBA 15 YR 2.5, 2.500%, 4/18/32(D) | | | - | | | | - | | | | 9,400,000 | | | | 9,402,938 | (E) | | | 5,780,000 | | | | 5,781,806 | (E) | | | | | | | | | | | 15,180,000 | | | | 15,184,744 | |
| FNMA, 255628, 5.500%, 2/1/25 | | | 106,683 | | | | 118,385 | | | | - | | | | - | | | | - | | | | - | | | | | | | | | | | | 106,683 | | | | 118,385 | |
| FNMA, 432269, 6.500%, 8/1/28 | | | 6,136 | | | | 6,822 | | | | - | | | | - | | | | - | | | | - | | | | | | | | | | | | 6,136 | | | | 6,822 | |
| FNMA, 535290, 8.000%, 5/1/30 | | | 5,155 | | | | 6,057 | | | | - | | | | - | | | | - | | | | - | | | | | | | | | | | | 5,155 | | | | 6,057 | |
| FNMA, 540040, 7.500%, 6/1/28 | | | 10,534 | | | | 10,560 | | | | - | | | | - | | | | - | | | | - | | | | | | | | | | | | 10,534 | | | | 10,560 | |
| FNMA, 561741, 7.500%, 1/1/31 | | | 21,437 | | | | 24,494 | | | | - | | | | - | | | | - | | | | - | | | | | | | | | | | | 21,437 | | | | 24,494 | |
| FNMA, 626811, 6.500%, 6/1/17 | | | 391 | | | | 391 | | | | - | | | | - | | | | - | | | | - | | | | | | | | | | | | 391 | | | | 391 | |
| FNMA, 640291, 7.000%, 8/1/32 | | | 60,169 | | | | 65,777 | | | | - | | | | - | | | | - | | | | - | | | | | | | | | | | | 60,169 | | | | 65,777 | |
| | | | Touchstone Active Bond
Fund | | | | Sentinel Total Return
Bond Fund | | | | Sentinel Government
Securities Fund | | | | Pro Forma Adjustments | | | | Proforma Combined
Touchstone Active Bond
Fund | |
| | | | Principal
Amount | | | | Market
Value | | | | Principal
Amount | | | | Market
Value | | | | Principal
Amount | | | | Market
Value | | | | Principal
Amount | | | | Market
Value | | | | Principal
Amount | | | | Market
Value | |
| FNMA, 653301, 6.500%, 7/1/32 | | | 33,026 | | | | 36,720 | | | | - | | | | - | | | | - | | | | - | | | | | | | | | | | | 33,026 | | | | 36,720 | |
| FNMA, 653502, 6.500%, 7/1/32 | | | 98,661 | | | | 109,697 | | | | - | | | | - | | | | - | | | | - | | | | | | | | | | | | 98,661 | | | | 109,697 | |
| FNMA, 670402, 6.500%, 6/1/32 | | | 49,178 | | | | 55,157 | | | | - | | | | - | | | | - | | | | - | | | | | | | | | | | | 49,178 | | | | 55,157 | |
| FNMA, 704460, 6.000%, 5/1/18 | | | 4,500 | | | | 4,517 | | | | - | | | | - | | | | - | | | | - | | | | | | | | | | | | 4,500 | | | | 4,517 | |
| FNMA, 725906, 2.859%, 8/1/34(A) | | | 6,591 | | | | 6,960 | | | | - | | | | - | | | | - | | | | - | | | | | | | | | | | | 6,591 | | | | 6,960 | |
| FNMA, 745257, 6.000%, 1/1/36 | | | 274,159 | | | | 311,375 | | | | - | | | | - | | | | - | | | | - | | | | | | | | | | | | 274,159 | | | | 311,375 | |
| FNMA, 745974, 3.237%, 10/1/36(A) | | | 2,060 | | | | 2,176 | | | | - | | | | - | | | | - | | | | - | | | | | | | | | | | | 2,060 | | | | 2,176 | |
| FNMA, 810049, 5.500%, 3/1/35 | | | 108,166 | | | | 120,358 | | | | - | | | | - | | | | - | | | | - | | | | | | | | | | | | 108,166 | | | | 120,358 | |
| FNMA, 819297, 6.000%, 9/1/35 | | | 172,728 | | | | 195,707 | | | | - | | | | - | | | | - | | | | - | | | | | | | | | | | | 172,728 | | | | 195,707 | |
| FNMA, 889060, 6.000%, 1/1/38 | | | 60,591 | | | | 68,980 | | | | - | | | | - | | | | - | | | | - | | | | | | | | | | | | 60,591 | | | | 68,980 | |
| FNMA, 889061, 6.000%, 1/1/38 | | | 130,789 | | | | 150,894 | | | | - | | | | - | | | | - | | | | - | | | | | | | | | | | | 130,789 | | | | 150,894 | |
| FNMA, 893003, 7.000%, 9/1/36 | | | 83,537 | | | | 90,242 | | | | - | | | | - | | | | - | | | | - | | | | | | | | | | | | 83,537 | | | | 90,242 | |
| FNMA, 895657, 6.500%, 8/1/36 | | | 16,840 | | | | 18,562 | | | | - | | | | - | | | | - | | | | - | | | | | | | | | | | | 16,840 | | | | 18,562 | |
| FNMA, 905049, 5.500%, 11/1/36 | | | 187,185 | | | | 207,649 | | | | - | | | | - | | | | - | | | | - | | | | | | | | | | | | 187,185 | | | | 207,649 | |
| FNMA, 908944, 5.500%, 1/1/37 | | | 182,576 | | | | 202,536 | | | | - | | | | - | | | | - | | | | - | | | | | | | | | | | | 182,576 | | | | 202,536 | |
| FNMA, 928553, 5.500%, 8/1/37 | | | 678,918 | | | | 775,962 | | | | - | | | | - | | | | - | | | | - | | | | | | | | | | | | 678,918 | | | | 775,962 | |
| FNMA, 995220, 6.000%, 11/1/23 | | | 21,146 | | | | 22,527 | | | | - | | | | - | | | | - | | | | - | | | | | | | | | | | | 21,146 | | | | 22,527 | |
| FNMA, AA3467, 4.500%, 4/1/39 | | | 327,531 | | | | 354,305 | | | | - | | | | - | | | | - | | | | - | | | | | | | | | | | | 327,531 | | | | 354,305 | |
| FNMA, AA4584, 4.500%, 4/1/39 | | | 514,572 | | | | 557,008 | | | | - | | | | - | | | | - | | | | - | | | | | | | | | | | | 514,572 | | | | 557,008 | |
| FNMA, AB1800, 4.000%, 11/1/40 | | | 118,034 | | | | 124,782 | | | | - | | | | - | | | | - | | | | - | | | | | | | | | | | | 118,034 | | | | 124,782 | |
| FNMA, AB2452, 4.000%, 3/1/26 | | | 426,964 | | | | 449,460 | | | | - | | | | - | | | | - | | | | - | | | | | | | | | | | | 426,964 | | | | 449,460 | |
| FNMA, AD3775, 4.500%, 3/1/25 | | | 138,363 | | | | 147,148 | | | | - | | | | - | | | | - | | | | - | | | | | | | | | | | | 138,363 | | | | 147,148 | |
| FNMA, AD6193, 5.000%, 6/1/40 | | | 172,483 | | | | 188,767 | | | | - | | | | - | | | | - | | | | - | | | | | | | | | | | | 172,483 | | | | 188,767 | |
| FNMA, AE0996, 4.000%, 2/1/41 | | | 429,900 | | | | 454,406 | | | | - | | | | - | | | | - | | | | - | | | | | | | | | | | | 429,900 | | | | 454,406 | |
| FNMA, AE1568, 4.000%, 9/1/40 | | | 242,964 | | | | 255,726 | | | | - | | | | - | | | | - | | | | - | | | | | | | | | | | | 242,964 | | | | 255,726 | |
| FNMA, AE2497, 4.500%, 9/1/40 | | | 764,985 | | | | 829,740 | | | | - | | | | - | | | | - | | | | - | | | | | | | | | | | | 764,985 | | | | 829,740 | |
| FNMA, AE5441, 5.000%, 10/1/40 | | | 123,218 | | | | 134,824 | | | | - | | | | - | | | | - | | | | - | | | | | | | | | | | | 123,218 | | | | 134,824 | |
| FNMA, AH1135, 5.000%, 1/1/41 | | | 369,972 | | | | 405,615 | | | | - | | | | - | | | | - | | | | - | | | | | | | | | | | | 369,972 | | | | 405,615 | |
| FNMA, AH3483, 3.500%, 2/1/26 | | | 619,875 | | | | 648,963 | | | | - | | | | - | | | | - | | | | - | | | | | | | | | | | | 619,875 | | | | 648,963 | |
| FNMA, AH3671, 4.000%, 2/1/26 | | | 270,908 | | | | 288,340 | | | | - | | | | - | | | | - | | | | - | | | | | | | | | | | | 270,908 | | | | 288,340 | |
| FNMA, AH6622, 4.000%, 3/1/41 | | | 633,787 | | | | 673,510 | | | | - | | | | - | | | | - | | | | - | | | | | | | | | | | | 633,787 | | | | 673,510 | |
| FNMA, AI0805, 4.500%, 7/1/41 | | | 27,662 | | | | 29,694 | | | | - | | | | - | | | | - | | | | - | | | | | | | | | | | | 27,662 | | | | 29,694 | |
| FNMA, AL0150, 4.000%, 2/1/41 | | | 828,217 | | | | 875,437 | | | | - | | | | - | | | | - | | | | - | | | | | | | | | | | | 828,217 | | | | 875,437 | |
| FNMA, AL0211, 5.000%, 4/1/41 | | | 202,072 | | | | 220,969 | | | | - | | | | - | | | | - | | | | - | | | | | | | | | | | | 202,072 | | | | 220,969 | |
| FNR, 03-32 BZ, 6.000%, 11/25/32 | | | - | | | | - | | | | - | | | | - | | | | 377,493 | | | | 425,610 | (E) | | | | | | | | | | | 377,493 | | | | 425,610 | |
| FNR, 12-47 AI Interest Only, 3.000%, 5/25/22 | | | - | | | | - | | | | - | | | | - | | | | 4,202,261 | | | | 198,692 | (E) | | | | | | | | | | | 4,202,261 | | | | 198,692 | |
| GNMA, AG8936, 4.000%, 2/15/44 | | | - | | | | - | | | | - | | | | - | | | | 6,857,151 | | | | 7,273,987 | (E) | | | | | | | | | | | 6,857,151 | | | | 7,273,987 | |
| GNMA II, 004424, 5.000%, 4/20/39 | | | - | | | | - | | | | - | | | | - | | | | 2,409,115 | | | | 2,656,080 | (E) | | | | | | | | | | | 2,409,115 | | | | 2,656,080 | |
| GNMA II, 005175, 4.500%, 9/20/41 | | | - | | | | - | | | | 2,297,331 | | | | 2,479,980 | (E) | | | - | | | | - | | | | | | | | | | | | 2,297,331 | | | | 2,479,980 | |
| GNMA, 5305, 4.000%, 2/20/42 | | | 40,772 | | | | 43,274 | | | | - | | | | - | | | | - | | | | - | | | | | | | | | | | | 40,772 | | | | 43,274 | |
| GNMA, 748495, 4.000%, 8/15/40 | | | 10,366 | | | | 10,961 | | | | - | | | | - | | | | - | | | | - | | | | | | | | | | | | 10,366 | | | | 10,961 | |
| GNMA, 8503, 2.125%, 9/20/24(A) | | | 19,371 | | | | 19,900 | | | | - | | | | - | | | | - | | | | - | | | | | | | | | | | | 19,371 | | | | 19,900 | |
| GNR, 10-169 AW, 4.500%, 12/20/40 | | | - | | | | - | | | | 2,750,000 | | | | 2,976,593 | (E) | | | - | | | | - | | | | | | | | | | | | 2,750,000 | | | | 2,976,593 | |
| GNR, 10-33 PX, 5.000%, 9/20/38 | | | - | | | | - | | | | 4,501,935 | | | | 4,714,100 | (E) | | | 8,125,849 | | | | 8,508,801 | (E) | | | | | | | | | | | 12,627,784 | | | | 13,222,901 | |
| GNR, 12-147 IO, 0.583%, 4/16/54 | | | - | | | | - | | | | 8,324,202 | | | | 313,117 | (E) | | | - | | | | - | | | | | | | | | | | | 8,324,202 | | | | 313,117 | |
| U.S. Government Mortgage-Backed Obligations Total | | | | | | | 12,589,944 | | | | | | | | 81,786,386 | | | | | | | | 177,333,181 | | | | | | | | | | | | | | | | 271,709,511 | |
| | | | | | | | | | | | | | | | | | | | | | | | | | | | | | | | | | | | | | | | | |
| Bank Loans - 22.1% | | | | | | | | | | | | | | | | | | | | | | | | | | | | | | | | | | | | | | | | |
| | | | | | | | | | | | | | | | | | | | | | | | | | | | | | | | | | | | | | | | | |
| Consumer Non-Cyclical - 5.0% | | | | | | | | | | | | | | | | | | | | | | | | | | | | | | | | | | | | | | | | |
| Abbott Laboratories, 4.900%, 11/30/46 | | | - | | | | - | | | | 800,000 | | | | 829,458 | (E) | | | - | | | | - | | | | | | | | | | | | 800,000 | | | | 829,458 | |
| Altria Group, Inc., 3.875%, 9/16/46 | | | - | | | | - | | | | 3,000,000 | | | | 2,775,294 | (E) | | | - | | | | - | | | | | | | | | | | | 3,000,000 | | | | 2,775,294 | |
| Amgen, Inc., 2.600%, 8/19/26 | | | - | | | | - | | | | 3,000,000 | | | | 2,780,574 | (E) | | | - | | | | - | | | | | | | | | | | | 3,000,000 | | | | 2,780,574 | |
| Anheuser-Busch InBev Finance, Inc., 4.900%, 2/1/46 | | | - | | | | - | | | | 2,900,000 | | | | 3,131,243 | (E) | | | - | | | | - | | | | | | | | | | | | 2,900,000 | | | | 3,131,243 | |
| Cardinal Health, Inc., 4.900%, 9/15/45 | | | - | | | | - | | | | 2,010,000 | | | | 2,078,786 | (E) | | | - | | | | - | | | | | | | | | | | | 2,010,000 | | | | 2,078,786 | |
| DaVita, Inc., 5.125%, 7/15/24 | | | - | | | | - | | | | 600,000 | | | | 606,000 | (E) | | | - | | | | - | | | | | | | | | | | | 600,000 | | | | 606,000 | |
| Express Scripts Holding Co., 3.400%, 3/1/27 | | | - | | | | - | | | | 3,000,000 | | | | 2,825,220 | (E) | | | - | | | | - | | | | | | | | | | | | 3,000,000 | | | | 2,825,220 | |
| HCA, Inc., 5.375%, 2/1/25 | | | - | | | | - | | | | 600,000 | | | | 624,000 | (E) | | | - | | | | - | | | | | | | | | | | | 600,000 | | | | 624,000 | |
| Kraft Heinz Foods Co., 4.375%, 6/1/46 | | | - | | | | - | | | | 3,000,000 | | | | 2,803,416 | (E) | | | - | | | | - | | | | | | | | | | | | 3,000,000 | | | | 2,803,416 | |
| Medtronic, Inc., 3.500%, 3/15/25 | | | - | | | | - | | | | 2,900,000 | | | | 2,965,586 | (E) | | | - | | | | - | | | | | | | | | | | | 2,900,000 | | | | 2,965,586 | |
| | | | Touchstone Active Bond
Fund | | | | Sentinel Total Return
Bond Fund | | | | Sentinel Government
Securities Fund | | | | Pro Forma Adjustments | | | | Proforma Combined
Touchstone Active Bond
Fund | |
| | | | Principal
Amount | | | | Market
Value | | | | Principal
Amount | | | | Market
Value | | | | Principal
Amount | | | | Market
Value | | | | Principal
Amount | | | | Market
Value | | | | Principal
Amount | | | | Market
Value | |
| Molson Coors Brewing Co., 3.000%, 7/15/26 | | | - | | | | - | | | | 3,000,000 | | | | 2,852,496 | (E) | | | - | | | | - | | | | | | | | | | | | 3,000,000 | | | | 2,852,496 | |
| Thermo Fisher Scientific, Inc., 2.950%, 9/19/26 | | | - | | | | - | | | | 3,000,000 | | | | 2,856,042 | (E) | | | - | | | | - | | | | | | | | | | | | 3,000,000 | | | | 2,856,042 | |
| Zoetis, Inc., 3.250%, 2/1/23 | | | - | | | | - | | | | 1,386,000 | | | | 1,399,498 | (E) | | | - | | | | - | | | | | | | | | | | | 1,386,000 | | | | 1,399,498 | |
| | | | | | | | - | | | | | | | | 28,527,614 | | | | | | | | - | | | | | | | | | | | | | | | | 28,527,614 | |
| | | | | | | | | | | | | | | | | | | | | | | | | | | | | | | | | | | | | | | | | |
| Communications - 4.5% | | | | | | | | | | | | | | | | | | | | | | | | | | | | | | | | | | | | | | | | |
| AMC Networks, Inc., 5.000%, 4/1/24 | | | - | | | | - | | | | 2,880,000 | | | | 2,883,600 | (E) | | | - | | | | - | | | | | | | | | | | | 2,880,000 | | | | 2,883,600 | |
| America Movil SAB de CV, 6.125%, 3/30/40 | | | - | | | | - | | | | 900,000 | | | | 1,049,743 | (E) | | | - | | | | - | | | | | | | | | | | | 900,000 | | | | 1,049,743 | |
| AT&T, Inc., 3.800%, 3/15/22 | | | - | | | | - | | | | 5,231,000 | | | | 5,410,157 | (E) | | | - | | | | - | | | | | | | | | | | | 5,231,000 | | | | 5,410,157 | |
| CBS Corp., 4.000%, 1/15/26 | | | - | | | | - | | | | 3,000,000 | | | | 3,071,445 | (E) | | | - | | | | - | | | | | | | | | | | | 3,000,000 | | | | 3,071,445 | |
| CCO Holdings LLC, 5.750%, 2/15/26 | | | - | | | | - | | | | 600,000 | | | | 630,000 | (E) | | | - | | | | - | | | | | | | | | | | | 600,000 | | | | 630,000 | |
| Comcast Corp., 2.350%, 1/15/27 | | | - | | | | - | | | | 2,900,000 | | | | 2,655,977 | (E) | | | - | | | | - | | | | | | | | | | | | 2,900,000 | | | | 2,655,977 | |
| Cox Communications, Inc., 3.350%, 9/15/26 | | | - | | | | - | | | | 800,000 | | | | 773,900 | (E) | | | - | | | | - | | | | | | | | | | | | 800,000 | | | | 773,900 | |
| CSC Holdings LLC, 10.875%, 10/15/25 | | | - | | | | - | | | | 1,900,000 | | | | 2,284,750 | (E) | | | - | | | | - | | | | | | | | | | | | 1,900,000 | | | | 2,284,750 | |
| Frontier Communications Corp., 11.000%, 9/15/25 | | | - | | | | - | | | | 600,000 | | | | 581,625 | (E) | | | - | | | | - | | | | | | | | | | | | 600,000 | | | | 581,625 | |
| GCI, Inc., 6.875%, 4/15/25 | | | - | | | | - | | | | 1,434,000 | | | | 1,502,115 | (E) | | | - | | | | - | | | | | | | | | | | | 1,434,000 | | | | 1,502,115 | |
| SFR Group SA, 7.375%, 5/1/26 | | | - | | | | - | | | | 600,000 | | | | 618,000 | (E) | | | - | | | | - | | | | | | | | | | | | 600,000 | | | | 618,000 | |
| Sprint Corp., 7.875%, 9/15/23 | | | - | | | | - | | | | 600,000 | | | | 664,500 | (E) | | | - | | | | - | | | | | | | | | | | | 600,000 | | | | 664,500 | |
| Telesat Canada / Telesat LLC, 8.875%, 11/15/24 | | | - | | | | - | | | | 600,000 | | | | 658,500 | (E) | | | - | | | | - | | | | | | | | | | | | 600,000 | | | | 658,500 | |
| Time Warner, Inc., 3.800%, 2/15/27 | | | - | | | | - | | | | 2,900,000 | | | | 2,868,059 | (E) | | | - | | | | - | | | | | | | | | | | | 2,900,000 | | | | 2,868,059 | |
| | | | | | | | - | | | | | | | | 25,652,370 | | | | | | | | - | | | | | | | | | | | | | | | | 25,652,370 | |
| | | | | | | | | | | | | | | | | | | | | | | | | | | | | | | | | | | | | | | | | |
| Consumer Cyclical - 2.7% | | | | | | | | | | | | | | | | | | | | | | | | | | | | | | | | | | | | | | | | |
| Amazon.com, Inc., 4.950%, 12/5/44 | | | - | | | | - | | | | 900,000 | | | | 1,017,365 | (E) | | | - | | | | - | | | | | | | | | | | | 900,000 | | | | 1,017,365 | |
| DR Horton, Inc., 4.750%, 2/15/23 | | | - | | | | - | | | | 1,150,000 | | | | 1,223,646 | (E) | | | - | | | | - | | | | | | | | | | | | 1,150,000 | | | | 1,223,646 | |
| General Motors Financial Co., Inc., 3.200%, 7/6/21 | | | - | | | | - | | | | 2,150,000 | | | | 2,157,946 | (E) | | | - | | | | - | | | | | | | | | | | | 2,150,000 | | | | 2,157,946 | |
| General Motors Financial Co., Inc., 5.250%, 3/1/26 | | | - | | | | - | | | | 2,000,000 | | | | 2,148,620 | (E) | | | - | | | | - | | | | | | | | | | | | 2,000,000 | | | | 2,148,620 | |
| Macy’s Retail Holdings, Inc., 2.875%, 2/15/23 | | | - | | | | - | | | | 800,000 | | | | 748,358 | (E) | | | - | | | | - | | | | | | | | | | | | 800,000 | | | | 748,358 | |
| McDonald’s Corp., 3.700%, 1/30/26 | | | - | | | | - | | | | 2,900,000 | | | | 2,965,821 | (E) | | | - | | | | - | | | | | | | | | | | | 2,900,000 | | | | 2,965,821 | |
| QVC, Inc., 5.450%, 8/15/34 | | | - | | | | - | | | | 2,325,000 | | | | 2,143,738 | (E) | | | - | | | | - | | | | | | | | | | | | 2,325,000 | | | | 2,143,738 | |
| Walgreens Boots Alliance, Inc., 3.450%, 6/1/26 | | | - | | | | - | | | | 2,900,000 | | | | 2,826,993 | (E) | | | - | | | | - | | | | | | | | | | | | 2,900,000 | | | | 2,826,993 | |
| Wynn Las Vegas LLC, 5.500%, 3/1/25 | | | - | | | | - | | | | 325,000 | | | | 330,281 | (E) | | | - | | | | - | | | | | | | | | | | | 325,000 | | | | 330,281 | |
| | | | | | | | - | | | | | | | | 15,562,768 | | | | | | | | - | | | | | | | | | | | | | | | | 15,562,768 | |
| | | | | | | | | | | | | | | | | | | | | | | | | | | | | | | | | | | | | | | | | |
| Technology - 2.5% | | | | | | | | | | | | | | | | | | | | | | | | | | | | | | | | | | | | | | | | |
| Broadcom Corp / Broadcom Cayman Finance Ltd., 3.875%, 1/15/27 | | | - | | | | - | | | | 3,000,000 | | | | 3,018,912 | (E) | | | - | | | | - | | | | | | | | | | | | 3,000,000 | | | | 3,018,912 | |
| Ericsson LM, 4.125%, 5/15/22 | | | - | | | | - | | | | 2,725,000 | | | | 2,780,407 | (E) | | | - | | | | - | | | | | | | | | | | | 2,725,000 | | | | 2,780,407 | |
| KLA-Tencor Corp., 4.650%, 11/1/24 | | | - | | | | - | | | | 800,000 | | | | 851,726 | (E) | | | - | | | | - | | | | | | | | | | | | 800,000 | | | | 851,726 | |
| Micron Technology, Inc., 4.750%, 4/26/22 | | | - | | | | - | | | | 1,419,275 | | | | 1,424,157 | (E) | | | - | | | | - | | | | | | | | | | | | 1,419,275 | | | | 1,424,157 | |
| Microsoft Corp., 2.400%, 8/8/26 | | | - | | | | - | | | | 2,900,000 | | | | 2,741,982 | (E) | | | - | | | | - | | | | | | | | | | | | 2,900,000 | | | | 2,741,982 | |
| Nuance Communications, Inc., 5.625%, 12/15/26 | | | - | | | | - | | | | 325,000 | | | | 332,313 | (E) | | | - | | | | - | | | | | | | | | | | | 325,000 | | | | 332,313 | |
| QUALCOMM, Inc., 3.450%, 5/20/25 | | | - | | | | - | | | | 3,000,000 | | | | 3,043,311 | (E) | | | - | | | | - | | | | | | | | | | | | 3,000,000 | | | | 3,043,311 | |
| | | | | | | | - | | | | | | | | 14,192,809 | | | | | | | | - | | | | | | | | | | | | | | | | 14,192,809 | |
| | | | | | | | | | | | | | | | | | | | | | | | | | | | | | | | | | | | | | | | | |
| Insurance - 1.9% | | | | | | | | | | | | | | | | | | | | | | | | | | | | | | | | | | | | | | | | |
| Chubb INA Holdings, Inc., 3.350%, 5/3/26 | | | - | | | | - | | | | 2,900,000 | | | | 2,933,234 | (E) | | | - | | | | - | | | | | | | | | | | | 2,900,000 | | | | 2,933,234 | |
| Manulife Financial Corp., 4.150%, 3/4/26 | | | - | | | | - | | | | 1,570,000 | | | | 1,653,139 | (E) | | | - | | | | - | | | | | | | | | | | | 1,570,000 | | | | 1,653,139 | |
| MetLife, Inc., 4.600%, 5/13/46 | | | - | | | | - | | | | 2,900,000 | | | | 3,045,261 | (E) | | | - | | | | - | | | | | | | | | | | | 2,900,000 | | | | 3,045,261 | |
| Travelers Cos, Inc., 3.750%, 5/15/46 | | | - | | | | - | | | | 3,000,000 | | | | 2,841,951 | (E) | | | - | | | | - | | | | | | | | | | | | 3,000,000 | | | | 2,841,951 | |
| | | | | | | | - | | | | | | | | 10,473,585 | | | | | | | | - | | | | | | | | | | | | | | | | 10,473,585 | |
| | | | | | | | | | | | | | | | | | | | | | | | | | | | | | | | | | | | | | | | | |
| Financials - 1.8% | | | | | | | | | | | | | | | | | | | | | | | | | | | | | | | | | | | | | | | | |
| Bank of America Corp., 3.248%, 10/21/27 | | | - | | | | - | | | | 2,900,000 | | | | 2,760,235 | (E) | | | - | | | | - | | | | | | | | | | | | 2,900,000 | | | | 2,760,235 | |
| Brookfield Asset Management, Inc., 4.000%, 1/15/25 | | | - | | | | - | | | | 3,696,000 | | | | 3,720,519 | (E) | | | - | | | | - | | | | | | | | | | | | 3,696,000 | | | | 3,720,519 | |
| Citizens Financial Group, Inc., 4.300%, 12/3/25 | | | - | | | | - | | | | 824,000 | | | | 849,191 | (E) | | | - | | | | - | | | | | | | | | | | | 824,000 | | | | 849,191 | |
| Icahn Enterprises LP, 5.875%, 2/1/22 | | | - | | | | - | | | | 325,000 | | | | 329,875 | (E) | | | - | | | | - | | | | | | | | | | | | 325,000 | | | | 329,875 | |
| JPMorgan Chase & Co, 2.950%, 10/1/26 | | | - | | | | - | | | | 2,900,000 | | | | 2,756,943 | (E) | | | - | | | | - | | | | | | | | | | | | 2,900,000 | | | | 2,756,943 | |
| | | | | | | | - | | | | | | | | 10,416,763 | | | | | | | | - | | | | | | | | | | | | | | | | 10,416,763 | |
| | | | Touchstone Active Bond
Fund | | | | Sentinel Total Return
Bond Fund | | | | Sentinel Government
Securities Fund | | | | Pro Forma Adjustments | | | | Proforma Combined
Touchstone Active Bond
Fund | |
| | | | Principal
Amount | | | | Market
Value | | | | Principal
Amount | | | | Market
Value | | | | Principal
Amount | | | | Market
Value | | | | Principal
Amount | | | | Market
Value | | | | Principal
Amount | | | | Market
Value | |
| Capital Goods - 1.3% | | | | | | | | | | | | | | | | | | | | | | | | | | | | | | | | | | | | | | | | |
| Lockheed Martin Corp., 3.550%, 1/15/26 | | | - | | | | - | | | | 2,900,000 | | | | 2,943,744 | (E) | | | - | | | | - | | | | | | | | | | | | 2,900,000 | | | | 2,943,744 | |
| Northrop Grumman Corp., 3.850%, 4/15/45 | | | - | | | | - | | | | 3,000,000 | | | | 2,823,324 | (E) | | | - | | | | - | | | | | | | | | | | | 3,000,000 | | | | 2,823,324 | |
| Reynolds Group Issuer LLC, 5.125%, 7/15/23 | | | - | | | | - | | | | 600,000 | | | | 616,500 | (E) | | | - | | | | - | | | | | | | | | | | | 600,000 | | | | 616,500 | |
| United Technologies Corp., 2.650%, 11/1/26 | | | - | | | | - | | | | 900,000 | | | | 867,461 | (E) | | | - | | | | - | | | | | | | | | | | | 900,000 | | | | 867,461 | |
| | | | | | | | - | | | | | | | | 7,251,029 | | | | | | | | - | | | | | | | | | | | | | | | | 7,251,029 | |
| | | | | | | | | | | | | | | | | | | | | | | | | | | | | | | | | | | | | | | | | |
| Real Estate - 1.1% | | | | | | | | | | | | | | | | | | | | | | | | | | | | | | | | | | | | | | | | |
| HCP, Inc., 4.000%, 6/1/25 | | | - | | | | - | | | | 800,000 | | | | 804,213 | (E) | | | - | | | | - | | | | | | | | | | | | 800,000 | | | | 804,213 | |
| Retail Opportunity Investments Partnership LP, 5.000%, 12/15/23 | | | - | | | | - | | | | 2,300,000 | | | | 2,376,059 | (E) | | | - | | | | - | | | | | | | | | | | | 2,300,000 | | | | 2,376,059 | |
| Simon Property Group LP, 4.250%, 11/30/46 | | | - | | | | - | | | | 3,000,000 | | | | 2,901,819 | (E) | | | - | | | | - | | | | | | | | | | | | 3,000,000 | | | | 2,901,819 | |
| | | | | | | | - | | | | | | | | 6,082,091 | | | | | | | | - | | | | | | | | | | | | | | | | 6,082,091 | |
| | | | | | | | | | | | | | | | | | | | | | | | | | | | | | | | | | | | | | | | | |
| Basic Industry - 1.0% | | | | | | | | | | | | | | | | | | | | | | | | | | | | | | | | | | | | | | | | |
| CF Industries, Inc., 4.950%, 6/1/43 | | | - | | | | - | | | | 2,583,000 | | | | 2,189,093 | (E) | | | - | | | | - | | | | | | | | | | | | 2,583,000 | | | | 2,189,093 | |
| Domtar Corp., 6.250%, 9/1/42 | | | - | | | | - | | | | 3,000,000 | | | | 2,959,734 | (E) | | | - | | | | - | | | | | | | | | | | | 3,000,000 | | | | 2,959,734 | |
| Int’l. Paper Co., 4.400%, 8/15/47 | | | - | | | | - | | | | 800,000 | | | | 754,974 | (E) | | | - | | | | - | | | | | | | | | | | | 800,000 | | | | 754,974 | |
| | | | | | | | - | | | | | | | | 5,903,800 | | | | | | | | - | | | | | | | | | | | | | | | | 5,903,800 | |
| | | | | | | | | | | | | | | | | | | | | | | | | | | | | | | | | | | | | | | | | |
| Utilities - 0.1% | | | | | | | | | | | | | | | | | | | | | | | | | | | | | | | | | | | | | | | | |
| Electricite de France SA, 3.625%, 10/13/25 | | | - | | | | - | | | | 800,000 | | | | 804,850 | (E) | | | - | | | | - | | | | | | | | | | | | 800,000 | | | | 804,850 | |
| | | | | | | | | | | | | | | | | | | | | | | | | | | | | | | | | | | | | | | | | |
| Energy - 0.1% | | | | | | | | | | | | | | | | | | | | | | | | | | | | | | | | | | | | | | | | |
| Sabine Pass Liquefaction LLC, 5.625%, 3/1/25 | | | - | | | | - | | | | 325,000 | | | | 352,317 | (E) | | | - | | | | - | | | | | | | | | | | | 325,000 | | | | 352,317 | |
| | | | | | | | | | | | | | | | | | | | | | | | | | | | | | | | | | | | | | | | | |
| Transportation - 0.1% | | | | | | | | | | | | | | | | | | | | | | | | | | | | | | | | | | | | | | | | |
| XPO Logistics, Inc., 6.500%, 6/15/22 | | | - | | | | - | | | | 325,000 | | | | 341,250 | (E) | | | - | | | | - | | | | | | | | | | | | 325,000 | | | | 341,250 | |
| | | | | | | | | | | | | | | | | | | | | | | | | | | | | | | | | | | | | | | | | |
| Consumer Discretionary - 0.0% | | | | | | | | | | | | | | | | | | | | | | | | | | | | | | | | | | | | | | | | |
| J Crew Group, Inc., 4.090%, 3/5/21 | | | - | | | | - | | | | 325,000 | | | | 196,921 | (E) | | | - | | | | - | | | | | | | | | | | | 325,000 | | | | 196,921 | |
| | | | | | | | | | | | | | | | | | | | | | | | | | | | | | | | | | | | | | | | | |
| Bank Loans Total | | | | | | | - | | | | | | | | 125,758,168 | | | | | | | | - | | | | | | | | | | | | | | | | 125,758,168 | |
| | | | | | | | | | | | | | | | | | | | | | | | | | | | | | | | | | | | | | | | | |
| | | | Shares | | | | | | | | Shares | | | | | | | | Shares | | | | | | | | Shares | | | | | | | | Shares | | | | | |
| Exchange Traded Funds - 11.8% | | | | | | | | | | | | | | | | | | | | | | | | | | | | | | | | | | | | | | | | |
| iShares iBoxx $ Investment Grade Corporate Bond ETF | | | - | | | | - | | | | 500,731 | | | | 59,041,192 | (E) | | | - | | | | - | | | | | | | | | | | | 500,731 | | | | 59,041,192 | |
| SPDR Barclays Short Term Corporate Bond ETF | | | - | | | | - | | | | 248,641 | | | | 7,610,901 | (E) | | | - | | | | - | | | | | | | | | | | | 248,641 | | | | 7,610,901 | |
| Exchange Traded Funds Total | | | | | | | - | | | | | | | | 66,652,093 | | | | | | | | - | | | | | | | | | | | | | | | | 66,652,093 | |
| | | | | | | | | | | | | | | | | | | | | | | | | | | | | | | | | | | | | | | | | |
| | | | Principal
Amount | | | | | | | | Principal
Amount | | | | | | | | Principal
Amount | | | | | | | | Principal
Amount | | | | | | | | Principal
Amount | | | | | |
| Corporate Bonds - 7.4% | | | | | | | | | | | | | | | | | | | | | | | | | | | | | | | | | | | | | | | | |
| | | | | | | | | | | | | | | | | | | | | | | | | | | | | | | | | | | | | | | | | |
| Financials - 1.7% | | | | | | | | | | | | | | | | | | | | | | | | | | | | | | | | | | | | | | | | |
| Air Lease Corp., 5.625%, 4/1/17 | | | 250,000 | | | | 250,000 | | | | - | | | | - | | | | - | | | | - | | | | | | | | | | | | 250,000 | | | | 250,000 | |
| Ally Financial, Inc., 5.750%, 11/20/25 | | | 38,000 | | | | 38,903 | | | | - | | | | - | | | | - | | | | - | | | | | | | | | | | | 38,000 | | | | 38,903 | |
| Ally Financial, Inc., 8.000%, 11/1/31 | | | 290,000 | | | | 344,375 | | | | - | | | | - | | | | - | | | | - | | | | | | | | | | | | 290,000 | | | | 344,375 | |
| Bank of America Corp. MTN, 4.000%, 1/22/25 | | | 550,000 | | | | 549,421 | | | | - | | | | - | | | | - | | | | - | | | | | | | | | | | | 550,000 | | | | 549,421 | |
| Bank of America Corp., 6.100%, 1/0/00(A)(B) | | | 630,000 | | | | 667,485 | | | | - | | | | - | | | | - | | | | - | | | | | | | | | | | | 630,000 | | | | 667,485 | |
| Barclays PLC (United Kingdom), 3.250%, 1/12/21 | | | 370,000 | | | | 372,605 | | | | - | | | | - | | | | - | | | | - | | | | | | | | | | | | 370,000 | | | | 372,605 | |
| Branch Banking & Trust Co., 3.625%, 9/16/25 | | | 384,000 | | | | 393,382 | | | | - | | | | - | | | | - | | | | - | | | | | | | | | | | | 384,000 | | | | 393,382 | |
| Capital One NA, 1.650%, 2/5/18 | | | 575,000 | | | | 574,903 | | | | - | | | | - | | | | - | | | | - | | | | | | | | | | | | 575,000 | | | | 574,903 | |
| Chubb INA Holdings, Inc., 4.350%, 11/3/45 | | | 335,000 | | | | 353,638 | | | | - | | | | - | | | | - | | | | - | | | | | | | | | | | | 335,000 | | | | 353,638 | |
| Citigroup, Inc., 2.485%, 9/1/23(A) | | | 660,000 | | | | 678,678 | | | | - | | | | - | | | | - | | | | - | | | | | | | | | | | | 660,000 | | | | 678,678 | |
| Citigroup, Inc., 3.300%, 4/27/25 | | | 250,000 | | | | 244,867 | | | | - | | | | - | | | | - | | | | - | | | | | | | | | | | | 250,000 | | | | 244,867 | |
| Citigroup, Inc., 4.750%, 5/18/46 | | | 152,000 | | | | 150,157 | | | | - | | | | - | | | | - | | | | - | | | | | | | | | | | | 152,000 | | | | 150,157 | |
| Citigroup, Inc., 6.125%, 1/0/00(A)(B) | | | 58,000 | | | | 61,190 | | | | - | | | | - | | | | - | | | | - | | | | | | | | | | | | 58,000 | | | | 61,190 | |
| | | | Touchstone Active Bond
Fund | | | | Sentinel Total Return
Bond Fund | | | | Sentinel Government
Securities Fund | | | | Pro Forma Adjustments | | | | Proforma Combined
Touchstone Active Bond
Fund | |
| | | | Principal
Amount | | | | Market
Value | | | | Principal
Amount | | | | Market
Value | | | | Principal
Amount | | | | Market
Value | | | | Principal
Amount | | | | Market
Value | | | | Principal
Amount | | | | Market
Value | |
| Credit Suisse Group Funding Guernsey Ltd. (Guernsey), 2.750%, 3/26/20 | | | 250,000 | | | | 250,379 | | | | - | | | | - | | | | - | | | | - | | | | | | | | | | | | 250,000 | | | | 250,379 | |
| CyrusOne LP / CyrusOne Finance Corp., 144a 5.000%, 3/15/24 | | | 6,000 | | | | 6,165 | | | | - | | | | - | | | | - | | | | - | | | | | | | | | | | | 6,000 | | | | 6,165 | |
| CyrusOne LP / CyrusOne Finance Corp., 144a 5.375%, 3/15/27 | | | 6,000 | | | | 6,060 | | | | - | | | | - | | | | - | | | | - | | | | | | | | | | | | 6,000 | | | | 6,060 | |
| Dana Financing Luxembourg Sarl (Luxembourg), 144a 5.750%, 4/15/25 | | | 13,000 | | | | 13,114 | | | | - | | | | - | | | | - | | | | - | | | | | | | | | | | | 13,000 | | | | 13,114 | |
| Fifth Third Bancorp, 2.875%, 7/27/20 | | | 380,000 | | | | 386,046 | | | | - | | | | - | | | | - | | | | - | | | | | | | | | | | | 380,000 | | | | 386,046 | |
| FirstCash, Inc., 6.750%, 4/1/21 | | | 34,000 | | | | 35,445 | | | | - | | | | - | | | | - | | | | - | | | | | | | | | | | | 34,000 | | | | 35,445 | |
| GE Capital International Funding Co. Unlimited Co. (Ireland), 4.418%, 11/15/35 | | | 232,000 | | | | 244,981 | | | | - | | | | - | | | | - | | | | - | | | | | | | | | | | | 232,000 | | | | 244,981 | |
| General Motors Financial Co., Inc., 3.200%, 7/13/20 | | | 495,000 | | | | 503,524 | | | | - | | | | - | | | | - | | | | - | | | | | | | | | | | | 495,000 | | | | 503,524 | |
| Goldman Sachs Group, Inc. (The), 5.250%, 7/27/21 | | | 155,000 | | | | 170,022 | | | | - | | | | - | | | | - | | | | - | | | | | | | | | | | | 155,000 | | | | 170,022 | |
| Goldman Sachs Group, Inc. (The), 5.375%, 1/0/00(A)(B) | | | 55,000 | | | | 56,238 | | | | - | | | | - | | | | - | | | | - | | | | | | | | | | | | 55,000 | | | | 56,238 | |
| HSBC Holdings PLC (United Kingdom), 2.650%, 1/5/22(A) | | | 430,000 | | | | 442,118 | | | | - | | | | - | | | | - | | | | - | | | | | | | | | | | | 430,000 | | | | 442,118 | |
| Huntington National Bank (The), 2.200%, 11/6/18 | | | 420,000 | | | | 421,781 | | | | - | | | | - | | | | - | | | | - | | | | | | | | | | | | 420,000 | | | | 421,781 | |
| JPMorgan Chase & Co., 3.250%, 9/23/22 | | | 145,000 | | | | 147,646 | | | | - | | | | - | | | | - | | | | - | | | | | | | | | | | | 145,000 | | | | 147,646 | |
| JPMorgan Chase & Co., 5.150%, 1/0/00(A)(B) | | | 630,000 | | | | 635,512 | | | | - | | | | - | | | | - | | | | - | | | | | | | | | | | | 630,000 | | | | 635,512 | |
| JPMorgan Chase & Co., 6.000%, 1/15/18 | | | 265,000 | | | | 273,945 | | | | - | | | | - | | | | - | | | | - | | | | | | | | | | | | 265,000 | | | | 273,945 | |
| Mid-America Apartments LP, 3.750%, 6/15/24 | | | 80,000 | | | | 81,413 | | | | - | | | | - | | | | - | | | | - | | | | | | | | | | | | 80,000 | | | | 81,413 | |
| Morgan Stanley, 3.950%, 4/23/27 | | | 355,000 | | | | 351,588 | | | | - | | | | - | | | | - | | | | - | | | | | | | | | | | | 355,000 | | | | 351,588 | |
| OneMain Financial Holdings LLC, 144a 7.250%, 12/15/21 | | | 51,000 | | | | 53,422 | | | | - | | | | - | | | | - | | | | - | | | | | | | | | | | | 51,000 | | | | 53,422 | |
| PNC Bank NA, 2.700%, 11/1/22 | | | 250,000 | | | | 247,880 | | | | - | | | | - | | | | - | | | | - | | | | | | | | | | | | 250,000 | | | | 247,880 | |
| Prudential Financial, Inc., 5.625%, 6/15/43(A) | | | 360,000 | | | | 385,740 | | | | - | | | | - | | | | - | | | | - | | | | | | | | | | | | 360,000 | | | | 385,740 | |
| Quicken Loans, Inc., 144a 5.750%, 5/1/25 | | | 28,000 | | | | 27,510 | | | | - | | | | - | | | | - | | | | - | | | | | | | | | | | | 28,000 | | | | 27,510 | |
| Teachers Insurance & Annuity Association of America, 144a 6.850%, 12/16/39 | | | 285,000 | | | | 376,722 | | | | - | | | | - | | | | - | | | | - | | | | | | | | | | | | 285,000 | | | | 376,722 | |
| | | | | | | | 9,796,855 | | | | | | | | - | | | | | | | | - | | | | | | | | | | | | | | | | 9,796,855 | |
| | | | | | | | | | | | | | | | | | | | | | | | | | | | | | | | | | | | | | | | | |
| Consumer Discretionary - 0.9% | | | | | | | | | | | | | | | | | | | | | | | | | | | | | | | | | | | | | | | | |
| ACCO Brands Corp., 144a 5.250%, 12/15/24 | | | 18,000 | | | | 18,090 | | | | - | | | | - | | | | - | | | | - | | | | | | | | | | | | 18,000 | | | | 18,090 | |
| AMC Entertainment Holdings, Inc., 144a 5.875%, 11/15/26 | | | 33,000 | | | | 33,371 | | | | - | | | | - | | | | - | | | | - | | | | | | | | | | | | 33,000 | | | | 33,371 | |
| AMC Networks, Inc., 4.750%, 12/15/22 | | | 25,000 | | | | 25,125 | | | | - | | | | - | | | | - | | | | - | | | | | | | | | | | | 25,000 | | | | 25,125 | |
| American Builders & Contractors Supply Co., Inc., 144a 5.750%, 12/15/23 | | | 6,000 | | | | 6,240 | | | | - | | | | - | | | | - | | | | - | | | | | | | | | | | | 6,000 | | | | 6,240 | |
| Anheuser-Busch InBev Finance, Inc., 2.650%, 2/1/21 | | | 120,000 | | | | 120,902 | | | | - | | | | - | | | | - | | | | - | | | | | | | | | | | | 120,000 | | | | 120,902 | |
| Anheuser-Busch InBev Finance, Inc., 4.900%, 2/1/46 | | | 306,000 | | | | 330,702 | | | | - | | | | - | | | | - | | | | - | | | | | | | | | | | | 306,000 | | | | 330,702 | |
| AutoNation, Inc., 5.500%, 2/1/20 | | | 490,000 | | | | 526,224 | | | | - | | | | - | | | | - | | | | - | | | | | | | | | | | | 490,000 | | | | 526,224 | |
| Belo Corp., 7.250%, 9/15/27 | | | 57,000 | | | | 60,420 | | | | - | | | | - | | | | - | | | | - | | | | | | | | | | | | 57,000 | | | | 60,420 | |
| Brookfield Residential Properties, Inc. / Brookfield Residential US Corp. (Canada), 144a 6.125%, 7/1/22 | | | 23,000 | | | | 23,690 | | | | - | | | | - | | | | - | | | | - | | | | | | | | | | | | 23,000 | | | | 23,690 | |
| Cable One, Inc., 144a 5.750%, 6/15/22 | | | 14,000 | | | | 14,560 | | | | - | | | | - | | | | - | | | | - | | | | | | | | | | | | 14,000 | | | | 14,560 | |
| Cablevision Systems Corp., 5.875%, 9/15/22 | | | 70,000 | | | | 70,613 | | | | - | | | | - | | | | - | | | | - | | | | | | | | | | | | 70,000 | | | | 70,613 | |
| CalAtlantic Group, Inc., 5.875%, 11/15/24 | | | 17,000 | | | | 17,850 | | | | - | | | | - | | | | - | | | | - | | | | | | | | | | | | 17,000 | | | | 17,850 | |
| CBS Corp., 4.900%, 8/15/44 | | | 205,000 | | | | 207,861 | | | | - | | | | - | | | | - | | | | - | | | | | | | | | | | | 205,000 | | | | 207,861 | |
| CCO Holdings LLC / CCO Holdings Capital Corp., 144a 5.750%, 2/15/26 | | | 101,000 | | | | 106,050 | | | | - | | | | - | | | | - | | | | - | | | | | | | | | | | | 101,000 | | | | 106,050 | |
| Cimpress NV (Netherlands), 144a 7.000%, 4/1/22 | | | 50,000 | | | | 51,750 | | | | - | | | | - | | | | - | | | | - | | | | | | | | | | | | 50,000 | | | | 51,750 | |
| Delphi Automotive PLC (Jersey), 3.150%, 11/19/20 | | | 436,000 | | | | 444,798 | | | | - | | | | - | | | | - | | | | - | | | | | | | | | | | | 436,000 | | | | 444,798 | |
| Dollar General Corp., 3.250%, 4/15/23 | | | 387,000 | | | | 386,925 | | | | - | | | | - | | | | - | | | | - | | | | | | | | | | | | 387,000 | | | | 386,925 | |
| Dollar Tree, Inc., 5.750%, 3/1/23 | | | 15,000 | | | | 15,975 | | | | - | | | | - | | | | - | | | | - | | | | | | | | | | | | 15,000 | | | | 15,975 | |
| Ford Motor Co., 4.750%, 1/15/43 | | | 156,000 | | | | 146,558 | | | | - | | | | - | | | | - | | | | - | | | | | | | | | | | | 156,000 | | | | 146,558 | |
| Forest Laboratories LLC, 144a 5.000%, 12/15/21 | | | 475,000 | | | | 514,725 | | | | - | | | | - | | | | - | | | | - | | | | | | | | | | | | 475,000 | | | | 514,725 | |
| GLP Capital LP / GLP Financing II, Inc., 5.375%, 11/1/23 | | | 10,000 | | | | 10,600 | | | | - | | | | - | | | | - | | | | - | | | | | | | | | | | | 10,000 | | | | 10,600 | |
| GLP Capital LP / GLP Financing II, Inc., 5.375%, 4/15/26 | | | 58,000 | | | | 59,885 | | | | - | | | | - | | | | - | | | | - | | | | | | | | | | | | 58,000 | | | | 59,885 | |
| Hanesbrands, Inc., 144a 4.625%, 5/15/24 | | | 38,000 | | | | 37,478 | | | | - | | | | - | | | | - | | | | - | | | | | | | | | | | | 38,000 | | | | 37,478 | |
| | | | Touchstone Active Bond
Fund | | | | Sentinel Total Return
Bond Fund | | | | Sentinel Government
Securities Fund | | | | Pro Forma Adjustments | | | | Proforma Combined
Touchstone Active Bond
Fund | |
| | | | Principal
Amount | | | | Market
Value | | | | Principal
Amount | | | | Market
Value | | | | Principal
Amount | | | | Market
Value | | | | Principal
Amount | | | | Market
Value | | | | Principal
Amount | | | | Market
Value | |
| Home Depot, Inc. (The), 5.950%, 4/1/41 | | | 220,000 | | | | 281,470 | | | | - | | | | - | | | | - | | | | - | | | | | | | | | | | | 220,000 | | | | 281,470 | |
| Imperial Brands Finance PLC (United Kingdom), 144a 3.500%, 2/11/23 | | | 575,000 | | | | 579,768 | | | | - | | | | - | | | | - | | | | - | | | | | | | | | | | | 575,000 | | | | 579,768 | |
| International Game Technology PLC (United Kingdom), 144a 6.250%, 2/15/22 | | | 33,000 | | | | 35,228 | | | | - | | | | - | | | | - | | | | - | | | | | | | | | | | | 33,000 | | | | 35,228 | |
| JC Penney Corp., Inc., 144a 5.875%, 7/1/23 | | | 12,000 | | | | 12,000 | | | | - | | | | - | | | | - | | | | - | | | | | | | | | | | | 12,000 | | | | 12,000 | |
| Lear Corp., 5.375%, 3/15/24 | | | 318,000 | | | | 335,555 | | | | - | | | | - | | | | - | | | | - | | | | | | | | | | | | 318,000 | | | | 335,555 | |
| Lennar Corp., 4.750%, 5/30/25 | | | 42,000 | | | | 42,105 | | | | - | | | | - | | | | - | | | | - | | | | | | | | | | | | 42,000 | | | | 42,105 | |
| Lennar Corp., 4.875%, 12/15/23 | | | 12,000 | | | | 12,270 | | | | - | | | | - | | | | - | | | | - | | | | | | | | | | | | 12,000 | | | | 12,270 | |
| Live Nation Entertainment, Inc., 144a 4.875%, 11/1/24 | | | 16,000 | | | | 16,000 | | | | - | | | | - | | | | - | | | | - | | | | | | | | | | | | 16,000 | | | | 16,000 | |
| LSC Communications, Inc., 144a 8.750%, 10/15/23 | | | 33,000 | | | | 33,908 | | | | - | | | | - | | | | - | | | | - | | | | | | | | | | | | 33,000 | | | | 33,908 | |
| M/I Homes, Inc., 6.750%, 1/15/21 | | | 29,000 | | | | 30,361 | | | | - | | | | - | | | | - | | | | - | | | | | | | | | | | | 29,000 | | | | 30,361 | |
| MDC Partners, Inc. (Canada), 144a 6.500%, 5/1/24 | | | 37,000 | | | | 35,289 | | | | - | | | | - | | | | - | | | | - | | | | | | | | | | | | 37,000 | | | | 35,289 | |
| NCL Corp. Ltd. (Bermuda), 144a 4.750%, 12/15/21 | | | 52,000 | | | | 52,780 | | | | - | | | | - | | | | - | | | | - | | | | | | | | | | | | 52,000 | | | | 52,780 | |
| New Home Co., Inc. (The), 144a 7.250%, 4/1/22 | | | 12,000 | | | | 12,090 | | | | - | | | | - | | | | - | | | | - | | | | | | | | | | | | 12,000 | | | | 12,090 | |
| Newell Brands, Inc., 4.200%, 4/1/26 | | | 188,000 | | | | 195,660 | | | | - | | | | - | | | | - | | | | - | | | | | | | | | | | | 188,000 | | | | 195,660 | |
| Nexstar Broadcasting, Inc., 144a 6.125%, 2/15/22 | | | 38,000 | | | | 39,520 | | | | - | | | | - | | | | - | | | | - | | | | | | | | | | | | 38,000 | | | | 39,520 | |
| PulteGroup, Inc., 5.500%, 3/1/26 | | | 19,000 | | | | 19,665 | | | | - | | | | - | | | | - | | | | - | | | | | | | | | | | | 19,000 | | | | 19,665 | |
| Quad/Graphics, Inc., 7.000%, 5/1/22 | | | 31,000 | | | | 31,000 | | | | - | | | | - | | | | - | | | | - | | | | | | | | | | | | 31,000 | | | | 31,000 | |
| Sabre GLBL, Inc., 144a 5.250%, 11/15/23 | | | 20,000 | | | | 20,450 | | | | - | | | | - | | | | - | | | | - | | | | | | | | | | | | 20,000 | | | | 20,450 | |
| ServiceMaster Co. LLC (The), 144a 5.125%, 11/15/24 | | | 46,000 | | | | 47,150 | | | | - | | | | - | | | | - | | | | - | | | | | | | | | | | | 46,000 | | | | 47,150 | |
| Sirius XM Radio, Inc., 144a 5.375%, 4/15/25 | | | 7,000 | | | | 7,164 | | | | - | | | | - | | | | - | | | | - | | | | | | | | | | | | 7,000 | | | | 7,164 | |
| Sirius XM Radio, Inc., 144a 5.375%, 7/15/26 | | | 17,000 | | | | 17,382 | | | | - | | | | - | | | | - | | | | - | | | | | | | | | | | | 17,000 | | | | 17,382 | |
| Sonic Automotive, Inc., 144a 6.125%, 3/15/27 | | | 13,000 | | | | 13,016 | | | | - | | | | - | | | | - | | | | - | | | | | | | | | | | | 13,000 | | | | 13,016 | |
| Suburban Propane Partners LP/Suburban Energy Finance Corp., 5.875%, 3/1/27 | | | 8,000 | | | | 7,880 | | | | - | | | | - | | | | - | | | | - | | | | | | | | | | | | 8,000 | | | | 7,880 | |
| Tenneco, Inc., 5.000%, 7/15/26 | | | 26,000 | | | | 25,464 | | | | - | | | | - | | | | - | | | | - | | | | | | | | | | | | 26,000 | | | | 25,464 | |
| Toll Brothers Finance Corp., 4.875%, 11/15/25 | | | 42,000 | | | | 42,315 | | | | - | | | | - | | | | - | | | | - | | | | | | | | | | | | 42,000 | | | | 42,315 | |
| United Rentals North America, Inc., 4.625%, 7/15/23 | | | 25,000 | | | | 25,750 | | | | - | | | | - | | | | - | | | | - | | | | | | | | | | | | 25,000 | | | | 25,750 | |
| United Rentals North America, Inc., 5.875%, 9/15/26 | | | 8,000 | | | | 8,340 | | | | - | | | | - | | | | - | | | | - | | | | | | | | | | | | 8,000 | | | | 8,340 | |
| Vista Outdoor, Inc., 5.875%, 10/1/23 | | | 10,000 | | | | 9,725 | | | | - | | | | - | | | | - | | | | - | | | | | | | | | | | | 10,000 | | | | 9,725 | |
| William Lyon Homes, Inc., 144a 5.875%, 1/31/25 | | | 10,000 | | | | 10,075 | | | | - | | | | - | | | | - | | | | - | | | | | | | | | | | | 10,000 | | | | 10,075 | |
| ZF North America Capital, Inc., 144a 4.500%, 4/29/22 | | | 65,000 | | | | 67,681 | | | | - | | | | - | | | | - | | | | - | | | | | | | | | | | | 65,000 | | | | 67,681 | |
| | | | | | | | 5,297,453 | | | | | | | | - | | | | | | | | - | | | | | | | | | | | | | | | | 5,297,453 | |
| | | | | | | | | | | | | | | | | | | | | | | | | | | | | | | | | | | | | | | | | |
| Energy - 0.8% | | | | | | | | | | | | | | | | | | | | | | | | | | | | | | | | | | | | | | | | |
| Boardwalk Pipelines LP, 3.375%, 2/1/23 | | | 292,000 | | | | 284,547 | | | | - | | | | - | | | | - | | | | - | | | | | | | | | | | | 292,000 | | | | 284,547 | |
| Cenovus Energy, Inc. (Canada), 6.750%, 11/15/39 | | | 275,000 | | | | 313,633 | | | | - | | | | - | | | | - | | | | - | | | | | | | | | | | | 275,000 | | | | 313,633 | |
| Continental Resources, Inc., 4.500%, 4/15/23 | | | 21,000 | | | | 20,436 | | | | - | | | | - | | | | - | | | | - | | | | | | | | | | | | 21,000 | | | | 20,436 | |
| Enterprise Products Operating LLC, 7.000%, 6/1/67(A) | | | 152,000 | | | | 140,600 | | | | - | | | | - | | | | - | | | | - | | | | | | | | | | | | 152,000 | | | | 140,600 | |
| Exterran Energy Solutions LP / EES Finance Corp., 144a 8.125%, 5/1/25 | | | 14,000 | | | | 14,280 | | | | - | | | | - | | | | - | | | | - | | | | | | | | | | | | 14,000 | | | | 14,280 | |
| Genesis Energy LP / Genesis Energy Finance Corp., 6.000%, 5/15/23 | | | 12,000 | | | | 12,060 | | | | - | | | | - | | | | - | | | | - | | | | | | | | | | | | 12,000 | | | | 12,060 | |
| Genesis Energy LP / Genesis Energy Finance Corp., 6.750%, 8/1/22 | | | 19,000 | | | | 19,589 | | | | - | | | | - | | | | - | | | | - | | | | | | | | | | | | 19,000 | | | | 19,589 | |
| Gulfport Energy Corp., 144a 6.375%, 5/15/25 | | | 46,000 | | | | 45,195 | | | | - | | | | - | | | | - | | | | - | | | | | | | | | | | | 46,000 | | | | 45,195 | |
| Hilcorp Energy I LP / Hilcorp Finance Co., 144a 5.000%, 12/1/24 | | | 19,000 | | | | 17,813 | | | | - | | | | - | | | | - | | | | - | | | | | | | | | | | | 19,000 | | | | 17,813 | |
| Hilcorp Energy I LP / Hilcorp Finance Co., 144a 5.750%, 10/1/25 | | | 15,000 | | | | 14,475 | | | | - | | | | - | | | | - | | | | - | | | | | | | | | | | | 15,000 | | | | 14,475 | |
| Holly Energy Partners LP / Holly Energy Finance Corp., 144a 6.000%, 8/1/24 | | | 9,000 | | | | 9,428 | | | | - | | | | - | | | | - | | | | - | | | | | | | | | | | | 9,000 | | | | 9,428 | |
| HollyFrontier Corp., 5.875%, 4/1/26 | | | 26,000 | | | | 27,605 | | | | - | | | | - | | | | - | | | | - | | | | | | | | | | | | 26,000 | | | | 27,605 | |
| Kinder Morgan Energy Partners LP, 3.500%, 9/1/23 | | | 377,000 | | | | 371,049 | | | | - | | | | - | | | | - | | | | - | | | | | | | | | | | | 377,000 | | | | 371,049 | |
| | | | Touchstone Active Bond
Fund | | | | Sentinel Total Return
Bond Fund | | | | Sentinel Government
Securities Fund | | | | Pro Forma Adjustments | | | | Proforma Combined
Touchstone Active Bond
Fund | |
| | | | Principal
Amount | | | | Market
Value | | | | Principal
Amount | | | | Market
Value | | | | Principal
Amount | | | | Market
Value | | | | Principal
Amount | | | | Market
Value | | | | Principal
Amount | | | | Market
Value | |
| Marathon Oil Corp., 2.800%, 11/1/22 | | | 440,000 | | | | 422,759 | | | | - | | | | - | | | | - | | | | - | | | | | | | | | | | | 440,000 | | | | 422,759 | |
| Midcontinent Express Pipeline LLC, 144a 6.700%, 9/15/19 | | | 392,000 | | | | 416,512 | | | | - | | | | - | | | | - | | | | - | | | | | | | | | | | | 392,000 | | | | 416,512 | |
| Nabors Industries, Inc., 5.000%, 9/15/20 | | | 215,000 | | | | 222,391 | | | | - | | | | - | | | | - | | | | - | | | | | | | | | | | | 215,000 | | | | 222,391 | |
| Occidental Petroleum Corp., 4.100%, 2/15/47 | | | 248,000 | | | | 239,342 | | | | - | | | | - | | | | - | | | | - | | | | | | | | | | | | 248,000 | | | | 239,342 | |
| Parsley Energy LLC / Parsley Finance Corp., 144a 5.250%, 8/15/25 | | | 4,000 | | | | 4,040 | | | | - | | | | - | | | | - | | | | - | | | | | | | | | | | | 4,000 | | | | 4,040 | |
| PDC Energy, Inc., 144a 6.125%, 9/15/24 | | | 27,000 | | | | 27,675 | | | | - | | | | - | | | | - | | | | - | | | | | | | | | | | | 27,000 | | | | 27,675 | |
| Peabody Securities Finance Corp., 144a 6.000%, 3/31/22 | | | 14,000 | | | | 13,921 | | | | - | | | | - | | | | - | | | | - | | | | | | | | | | | | 14,000 | | | | 13,921 | |
| Peabody Securities Finance Corp., 144a 6.375%, 3/31/25 | | | 14,000 | | | | 13,930 | | | | - | | | | - | | | | - | | | | - | | | | | | | | | | | | 14,000 | | | | 13,930 | |
| Petroleos Mexicanos (Mexico), 4.500%, 1/23/26 | | | 285,000 | | | | 273,172 | | | | - | | | | - | | | | - | | | | - | | | | | | | | | | | | 285,000 | | | | 273,172 | |
| Petroleos Mexicanos (Mexico), 144a 5.375%, 3/13/22 | | | 150,000 | | | | 157,125 | | | | - | | | | - | | | | - | | | | - | | | | | | | | | | | | 150,000 | | | | 157,125 | |
| Precision Drilling Corp. (Canada), 5.250%, 11/15/24 | | | 45,000 | | | | 42,638 | | | | - | | | | - | | | | - | | | | - | | | | | | | | | | | | 45,000 | | | | 42,638 | |
| Precision Drilling Corp. (Canada), 144a 7.750%, 12/15/23 | | | 29,000 | | | | 30,522 | | | | - | | | | - | | | | - | | | | - | | | | | | | | | | | | 29,000 | | | | 30,522 | |
| QEP Resources, Inc., 5.375%, 10/1/22 | | | 27,000 | | | | 26,595 | | | | - | | | | - | | | | - | | | | - | | | | | | | | | | | | 27,000 | | | | 26,595 | |
| Range Resources Corp., 144a 5.000%, 8/15/22 | | | 27,000 | | | | 26,730 | | | | - | | | | - | | | | - | | | | - | | | | | | | | | | | | 27,000 | | | | 26,730 | |
| Range Resources Corp., 144a 5.750%, 6/1/21 | | | 16,000 | | | | 16,400 | | | | - | | | | - | | | | - | | | | - | | | | | | | | | | | | 16,000 | | | | 16,400 | |
| Rose Rock Midstream LP / Rose Rock Finance Corp., 5.625%, 11/15/23 | | | 48,000 | | | | 47,040 | | | | - | | | | - | | | | - | | | | - | | | | | | | | | | | | 48,000 | | | | 47,040 | |
| Sabine Pass Liquefaction LLC, 144a 5.000%, 3/15/27 | | | 415,000 | | | | 433,815 | | | | - | | | | - | | | | - | | | | - | | | | | | | | | | | | 415,000 | | | | 433,815 | |
| SemGroup Corp., 144a 6.375%, 3/15/25 | | | 16,000 | | | | 15,720 | | | | - | | | | - | | | | - | | | | - | | | | | | | | | | | | 16,000 | | | | 15,720 | |
| SESI LLC, 7.125%, 12/15/21 | | | 15,000 | | | | 15,188 | | | | - | | | | - | | | | - | | | | - | | | | | | | | | | | | 15,000 | | | | 15,188 | |
| Shell International Finance BV (Netherlands), 1.875%, 5/10/21 | | | 400,000 | | | | 391,747 | | | | - | | | | - | | | | - | | | | - | | | | | | | | | | | | 400,000 | | | | 391,747 | |
| Southwestern Energy Co., 4.100%, 3/15/22 | | | 40,000 | | | | 37,400 | | | | - | | | | - | | | | - | | | | - | | | | | | | | | | | | 40,000 | | | | 37,400 | |
| Southwestern Energy Co., 5.800%, 1/23/20 | | | 31,000 | | | | 31,291 | | | | - | | | | - | | | | - | | | | - | | | | | | | | | | | | 31,000 | | | | 31,291 | |
| Summit Midstream Holdings LLC / Summit Midstream Finance Corp., 5.750%, 4/15/25 | | | 22,000 | | | | 21,890 | | | | - | | | | - | | | | - | | | | - | | | | | | | | | | | | 22,000 | | | | 21,890 | |
| Transocean Phoenix 2 Ltd. (Cayman Islands), 144a 7.750%, 10/15/24 | | | 55,000 | | | | 59,125 | | | | - | | | | - | | | | - | | | | - | | | | | | | | | | | | 55,000 | | | | 59,125 | |
| Unit Corp., 6.625%, 5/15/21 | | | 85,000 | | | | 83,725 | | | | - | | | | - | | | | - | | | | - | | | | | | | | | | | | 85,000 | | | | 83,725 | |
| Weatherford International Ltd (Bermuda), 6.500%, 8/1/36 | | | 31,000 | | | | 29,295 | | | | - | | | | - | | | | - | | | | - | | | | | | | | | | | | 31,000 | | | | 29,295 | |
| Williams Partners LP, 3.350%, 8/15/22 | | | 217,000 | | | | 216,633 | | | | - | | | | - | | | | - | | | | - | | | | | | | | | | | | 217,000 | | | | 216,633 | |
| | | | | | | | 4,607,331 | | | | | | | | - | | | | | | | | - | | | | | | | | | | | | | | | | 4,607,331 | |
| | | | | | | | | | | | | | | | | | | | | | | | | | | | | | | | | | | | | | | | | |
| Health Care - 0.8% | | | | | | | | | | | | | | | | | | | | | | | | | | | | | | | | | | | | | | | | |
| Abbott Laboratories, 3.750%, 11/30/26 | | | 395,000 | | | | 394,503 | | | | - | | | | - | | | | - | | | | - | | | | | | | | | | | | 395,000 | | | | 394,503 | |
| AbbVie, Inc., 4.450%, 5/14/46 | | | 342,000 | | | | 326,348 | | | | - | | | | - | | | | - | | | | - | | | | | | | | | | | | 342,000 | | | | 326,348 | |
| Acadia Healthcare Co., Inc., 6.500%, 3/1/24 | | | 77,000 | | | | 81,043 | | | | - | | | | - | | | | - | | | | - | | | | | | | | | | | | 77,000 | | | | 81,043 | |
| Actavis Funding SCS (Luxembourg), 3.800%, 3/15/25 | | | 195,000 | | | | 196,779 | | | | - | | | | - | | | | - | | | | - | | | | | | | | | | | | 195,000 | | | | 196,779 | |
| Catholic Health Initiatives, 4.200%, 8/1/23 | | | 380,000 | | | | 391,072 | | | | - | | | | - | | | | - | | | | - | | | | | | | | | | | | 380,000 | | | | 391,072 | |
| Centene Corp., 4.750%, 1/15/25 | | | 12,000 | | | | 12,068 | | | | - | | | | - | | | | - | | | | - | | | | | | | | | | | | 12,000 | | | | 12,068 | |
| CHS / Community Health Systems, Inc., 7.125%, 7/15/20 | | | 21,000 | | | | 19,241 | | | | - | | | | - | | | | - | | | | - | | | | | | | | | | | | 21,000 | | | | 19,241 | |
| CHS/Community Health Systems, Inc., 6.250%, 3/31/23 | | | 28,000 | | | | 28,490 | | | | - | | | | - | | | | - | | | | - | | | | | | | | | | | | 28,000 | | | | 28,490 | |
| Envision Healthcare Corp., 5.625%, 7/15/22 | | | 28,000 | | | | 28,700 | | | | - | | | | - | | | | - | | | | - | | | | | | | | | | | | 28,000 | | | | 28,700 | |
| Envision Healthcare Corp., 144a 5.125%, 7/1/22 | | | 9,000 | | | | 9,160 | | | | - | | | | - | | | | - | | | | - | | | | | | | | | | | | 9,000 | | | | 9,160 | |
| Envision Healthcare Corp., 144a 6.250%, 12/1/24 | | | 24,000 | | | | 25,200 | | | | - | | | | - | | | | - | | | | - | | | | | | | | | | | | 24,000 | | | | 25,200 | |
| Express Scripts Holding Co., 3.300%, 2/25/21 | | | 336,000 | | | | 341,810 | | | | - | | | | - | | | | - | | | | - | | | | | | | | | | | | 336,000 | | | | 341,810 | |
| HCA, Inc., 5.375%, 2/1/25 | | | 54,000 | | | | 56,295 | | | | - | | | | - | | | | - | | | | - | | | | | | | | | | | | 54,000 | | | | 56,295 | |
| HCA, Inc., 5.875%, 5/1/23 | | | 52,000 | | | | 56,160 | | | | - | | | | - | | | | - | | | | - | | | | | | | | | | | | 52,000 | | | | 56,160 | |
| HealthSouth Corp., 5.750%, 11/1/24 | | | 54,000 | | | | 54,405 | | | | - | | | | - | | | | - | | | | - | | | | | | | | | | | | 54,000 | | | | 54,405 | |
| Kindred Healthcare, Inc., 8.750%, 1/15/23 | | | 28,000 | | | | 28,070 | | | | - | | | | - | | | | - | | | | - | | | | | | | | | | | | 28,000 | | | | 28,070 | |
| Mallinckrodt International Finance SA (Luxembourg), 4.750%, 4/15/23 | | | 7,000 | | | | 5,932 | | | | - | | | | - | | | | - | | | | - | | | | | | | | | | | | 7,000 | | | | 5,932 | |
| Mallinckrodt International Finance SA / Mallinckrodt CB LLC (Luxembourg), 144a 5.500%, 4/15/25 | | | 53,000 | | | | 48,760 | | | | - | | | | - | | | | - | | | | - | | | | | | | | | | | | 53,000 | | | | 48,760 | |
| Medtronic Global Holdings SCA (Luxembourg), 3.350%, 4/1/27 | | | 320,000 | | | | 322,275 | | | | - | | | | - | | | | - | | | | - | | | | | | | | | | | | 320,000 | | | | 322,275 | |
| | | | Touchstone Active Bond
Fund | | | | Sentinel Total Return
Bond Fund | | | | Sentinel Government
Securities Fund | | | | Pro Forma Adjustments | | | | Proforma Combined
Touchstone Active Bond
Fund | |
| | | | Principal
Amount | | | | Market
Value | | | | Principal
Amount | | | | Market
Value | | | | Principal
Amount | | | | Market
Value | | | | Principal
Amount | | | | Market
Value | | | | Principal
Amount | | | | Market
Value | |
| Mylan NV (Netherlands), 3.000%, 12/15/18 | | | 180,000 | | | | 182,089 | | | | - | | | | - | | | | - | | | | - | | | | | | | | | | | | 180,000 | | | | 182,089 | |
| Ochsner Clinic Foundation, 5.897%, 5/15/45 | | | 300,000 | | | | 341,972 | | | | - | | | | - | | | | - | | | | - | | | | | | | | | | | | 300,000 | | | | 341,972 | |
| Select Medical Corp., 6.375%, 6/1/21 | | | 54,000 | | | | 54,540 | | | | - | | | | - | | | | - | | | | - | | | | | | | | | | | | 54,000 | | | | 54,540 | |
| Shire Acquisitions Investments Ireland DAC (Ireland), 2.400%, 9/23/21 | | | 426,000 | | | | 416,591 | | | | - | | | | - | | | | - | | | | - | | | | | | | | | | | | 426,000 | | | | 416,591 | |
| Teleflex, Inc., 4.875%, 6/1/26 | | | 8,000 | | | | 8,040 | | | | - | | | | - | | | | - | | | | - | | | | | | | | | | | | 8,000 | | | | 8,040 | |
| Tenet Healthcare Corp., 4.750%, 6/1/20 | | | 6,000 | | | | 6,130 | | | | - | | | | - | | | | - | | | | - | | | | | | | | | | | | 6,000 | | | | 6,130 | |
| Tenet Healthcare Corp., 144a 7.500%, 1/1/22 | | | 15,000 | | | | 16,200 | | | | - | | | | - | | | | - | | | | - | | | | | | | | | | | | 15,000 | | | | 16,200 | |
| Teva Pharmaceutical Finance Netherlands III BV (Netherlands), 2.200%, 7/21/21 | | | 172,000 | | | | 165,990 | | | | - | | | | - | | | | - | | | | - | | | | | | | | | | | | 172,000 | | | | 165,990 | |
| Teva Pharmaceutical Finance Netherlands III BV (Netherlands), 3.150%, 10/1/26 | | | 378,000 | | | | 348,332 | | | | - | | | | - | | | | - | | | | - | | | | | | | | | | | | 378,000 | | | | 348,332 | |
| Universal Hospital Services, Inc., 7.625%, 8/15/20 | | | 28,000 | | | | 27,860 | | | | - | | | | - | | | | - | | | | - | | | | | | | | | | | | 28,000 | | | | 27,860 | |
| Zimmer Biomet Holdings, Inc., 3.150%, 4/1/22 | | | 190,000 | | | | 190,695 | | | | - | | | | - | | | | - | | | | - | | | | | | | | | | | | 190,000 | | | | 190,695 | |
| Zimmer Biomet Holdings, Inc., 3.375%, 11/30/21 | | | 110,000 | | | | 111,284 | | | | - | | | | - | | | | - | | | | - | | | | | | | | | | | | 110,000 | | | | 111,284 | |
| | | | | | | | 4,296,034 | | | | | | | | - | | | | | | | | - | | | | | | | | | | | | | | | | 4,296,034 | |
| | | | | | | | | | | | | | | | | | | | | | | | | | | | | | | | | | | | | | | | | |
| Information Technology - 0.7% | | | | | | | | | | | | | | | | | | | | | | | | | | | | | | | | | | | | | | | | |
| Activision Blizzard, Inc., 144a 6.125%, 9/15/23 | | | 429,000 | | | | 464,393 | | | | - | | | | - | | | | - | | | | - | | | | | | | | | | | | 429,000 | | | | 464,393 | |
| Apple, Inc., 4.650%, 2/23/46 | | | 313,000 | | | | 335,850 | | | | - | | | | - | | | | - | | | | - | | | | | | | | | | | | 313,000 | | | | 335,850 | |
| CDW LLC / CDW Finance Corp., 5.000%, 9/1/23 | | | 17,000 | | | | 17,191 | | | | - | | | | - | | | | - | | | | - | | | | | | | | | | | | 17,000 | | | | 17,191 | |
| CDW LLC / CDW Finance Corp., 5.500%, 12/1/24 | | | 38,000 | | | | 39,805 | | | | - | | | | - | | | | - | | | | - | | | | | | | | | | | | 38,000 | | | | 39,805 | |
| Diamond 1 Finance Corp. / Diamond 2 Finance Corp., 144a 4.420%, 6/15/21 | | | 395,000 | | | | 413,069 | | | | - | | | | - | | | | - | | | | - | | | | | | | | | | | | 395,000 | | | | 413,069 | |
| Diamond 1 Finance Corp. / Diamond 2 Finance Corp., 144a 5.450%, 6/15/23 | | | 32,000 | | | | 34,528 | | | | - | | | | - | | | | - | | | | - | | | | | | | | | | | | 32,000 | | | | 34,528 | |
| Diamond 1 Finance Corp. / Diamond 2 Finance Corp., 144a 7.125%, 6/15/24 | | | 87,000 | | | | 96,177 | | | | - | | | | - | | | | - | | | | - | | | | | | | | | | | | 87,000 | | | | 96,177 | |
| Diebold Nixdorf, Inc., 8.500%, 4/15/24 | | | 54,000 | | | | 59,670 | | | | - | | | | - | | | | - | | | | - | | | | | | | | | | | | 54,000 | | | | 59,670 | |
| Electronic Arts, Inc., 3.700%, 3/1/21 | | | 432,000 | | | | 448,400 | | | | - | | | | - | | | | - | | | | - | | | | | | | | | | | | 432,000 | | | | 448,400 | |
| EMC Corp., 3.375%, 6/1/23† | | | 10,000 | | | | 9,552 | | | | - | | | | - | | | | - | | | | - | | | | | | | | | | | | 10,000 | | | | 9,552 | |
| Fidelity National Information Services, Inc., 3.625%, 10/15/20 | | | 470,000 | | | | 488,410 | | | | - | | | | - | | | | - | | | | - | | | | | | | | | | | | 470,000 | | | | 488,410 | |
| First Data Corp., 144a 7.000%, 12/1/23 | | | 7,000 | | | | 7,508 | | | | - | | | | - | | | | - | | | | - | | | | | | | | | | | | 7,000 | | | | 7,508 | |
| Hewlett Packard Enterprise Co., 2.450%, 10/5/17 | | | 440,000 | | | | 441,284 | | | | - | | | | - | | | | - | | | | - | | | | | | | | | | | | 440,000 | | | | 441,284 | |
| Microsoft Corp., 3.500%, 2/12/35 | | | 190,000 | | | | 182,808 | | | | - | | | | - | | | | - | | | | - | | | | | | | | | | | | 190,000 | | | | 182,808 | |
| NCR Corp., 5.875%, 12/15/21 | | | 88,000 | | | | 91,740 | | | | - | | | | - | | | | - | | | | - | | | | | | | | | | | | 88,000 | | | | 91,740 | |
| Open Text Corp. (Canada), 144a 5.875%, 6/1/26 | | | 47,000 | | | | 49,232 | | | | - | | | | - | | | | - | | | | - | | | | | | | | | | | | 47,000 | | | | 49,232 | |
| Oracle Corp., 2.650%, 7/15/26 | | | 338,000 | | | | 321,846 | | | | - | | | | - | | | | - | | | | - | | | | | | | | | | | | 338,000 | | | | 321,846 | |
| QUALCOMM, Inc., 3.450%, 5/20/25 | | | 425,000 | | | | 431,176 | | | | - | | | | - | | | | - | | | | - | | | | | | | | | | | | 425,000 | | | | 431,176 | |
| Quintiles IMS, Inc., 144a 4.875%, 5/15/23 | | | 11,000 | | | | 11,151 | | | | - | | | | - | | | | - | | | | - | | | | | | | | | | | | 11,000 | | | | 11,151 | |
| Sensata Technologies BV (Netherlands), 144a 5.000%, 10/1/25 | | | 31,000 | | | | 31,232 | | | | - | | | | - | | | | - | | | | - | | | | | | | | | | | | 31,000 | | | | 31,232 | |
| | | | | | | | 3,975,022 | | | | | | | | - | | | | | | | | - | | | | | | | | | | | | | | | | 3,975,022 | |
| | | | | | | | | | | | | | | | | | | | | | | | | | | | | | | | | | | | | | | | | |
| Telecommunication Services - 0.7% | | | | | | | | | | | | | | | | | | | | | | | | | | | | | | | | | | | | | | | | |
| Altice Financing SA (Luxemburg), 144a 6.625%, 2/15/23 | | | 59,000 | | | | 61,419 | | | | - | | | | - | | | | - | | | | - | | | | | | | | | | | | 59,000 | | | | 61,419 | |
| AMC Networks, Inc., 5.000%, 4/1/24 | | | 23,000 | | | | 23,000 | | | | - | | | | - | | | | - | | | | - | | | | | | | | | | | | 23,000 | | | | 23,000 | |
| AT&T, Inc., 3.900%, 3/11/24 | | | 225,000 | | | | 228,620 | | | | - | | | | - | | | | - | | | | - | | | | | | | | | | | | 225,000 | | | | 228,620 | |
| AT&T, Inc., 4.350%, 6/15/45 | | | 90,000 | | | | 79,216 | | | | - | | | | - | | | | - | | | | - | | | | | | | | | | | | 90,000 | | | | 79,216 | |
| AT&T, Inc., 4.500%, 5/15/35 | | | 360,000 | | | | 339,850 | | | | - | | | | - | | | | - | | | | - | | | | | | | | | | | | 360,000 | | | | 339,850 | |
| Block Communications, Inc., 144a 6.875%, 2/15/25 | | | 7,000 | | | | 7,420 | | | | - | | | | - | | | | - | | | | - | | | | | | | | | | | | 7,000 | | | | 7,420 | |
| CenturyLink, Inc., 5.150%, 6/15/17 | | | 325,000 | | | | 327,275 | | | | - | | | | - | | | | - | | | | - | | | | | | | | | | | | 325,000 | | | | 327,275 | |
| CenturyLink, Inc., 5.800%, 3/15/22 | | | 8,000 | | | | 8,250 | | | | - | | | | - | | | | - | | | | - | | | | | | | | | | | | 8,000 | | | | 8,250 | |
| CenturyLink, Inc., 6.450%, 6/15/21 | | | 2,000 | | | | 2,125 | | | | - | | | | - | | | | - | | | | - | | | | | | | | | | | | 2,000 | | | | 2,125 | |
| Charter Communications Operating LLC / Charter Communications Operating Capital, 6.484%, 10/23/45 | | | 264,000 | | | | 303,953 | | | | - | | | | - | | | | - | | | | - | | | | | | | | | | | | 264,000 | | | | 303,953 | |
| Comcast Corp., 1.625%, 1/15/22 | | | 372,000 | | | | 356,727 | | | | - | | | | - | | | | - | | | | - | | | | | | | | | | | | 372,000 | | | | 356,727 | |
| CommScope Technologies LLC, 144a 5.000%, 3/15/27 | | | 16,000 | | | | 15,975 | | | | - | | | | - | | | | - | | | | - | | | | | | | | | | | | 16,000 | | | | 15,975 | |
| | | | Touchstone Active Bond
Fund | | | | Sentinel Total Return
Bond Fund | | | | Sentinel Government
Securities Fund | | | | Pro Forma Adjustments | | | | Proforma Combined
Touchstone Active Bond
Fund | |
| | | | Principal
Amount | | | | Market
Value | | | | Principal
Amount | | | | Market
Value | | | | Principal
Amount | | | | Market
Value | | | | Principal
Amount | | | | Market
Value | | | | Principal
Amount | | | | Market
Value | |
| CommScope, Inc., 144a 5.500%, 6/15/24 | | | 4,000 | | | | 4,136 | | | | - | | | | - | | | | - | | | | - | | | | | | | | | | | | 4,000 | | | | 4,136 | |
| CSC Holdings LLC, 5.250%, 6/1/24 | | | 34,000 | | | | 33,873 | | | | - | | | | - | | | | - | | | | - | | | | | | | | | | | | 34,000 | | | | 33,873 | |
| CSC Holdings LLC, 144a 10.125%, 1/15/23 | | | 60,000 | | | | 69,600 | | | | - | | | | - | | | | - | | | | - | | | | | | | | | | | | 60,000 | | | | 69,600 | |
| Discovery Communications LLC, 3.450%, 3/15/25 | | | 500,000 | | | | 473,476 | | | | - | | | | - | | | | - | | | | - | | | | | | | | | | | | 500,000 | | | | 473,476 | |
| DISH DBS Corp., 5.125%, 5/1/20 | | | 48,000 | | | | 50,040 | | | | - | | | | - | | | | - | | | | - | | | | | | | | | | | | 48,000 | | | | 50,040 | |
| Frontier Communications Corp., 10.500%, 9/15/22 | | | 10,000 | | | | 10,125 | | | | - | | | | - | | | | - | | | | - | | | | | | | | | | | | 10,000 | | | | 10,125 | |
| Frontier Communications Corp., 6.250%, 9/15/21 | | | 90,000 | | | | 83,700 | | | | - | | | | - | | | | - | | | | - | | | | | | | | | | | | 90,000 | | | | 83,700 | |
| Gray Television, Inc., 144a 5.125%, 10/15/24 | | | 45,000 | | | | 44,438 | | | | - | | | | - | | | | - | | | | - | | | | | | | | | | | | 45,000 | | | | 44,438 | |
| Level 3 Financing, Inc., 5.250%, 3/15/26 | | | 13,000 | | | | 13,065 | | | | - | | | | - | | | | - | | | | - | | | | | | | | | | | | 13,000 | | | | 13,065 | |
| LIN Television Corp., 5.875%, 11/15/22 | | | 5,000 | | | | 5,175 | | | | - | | | | - | | | | - | | | | - | | | | | | | | | | | | 5,000 | | | | 5,175 | |
| Match Group, Inc., 6.375%, 6/1/24 | | | 6,000 | | | | 6,491 | | | | - | | | | - | | | | - | | | | - | | | | | | | | | | | | 6,000 | | | | 6,491 | |
| Nexstar Escrow Corp., 144a 5.625%, 8/1/24 | | | 31,000 | | | | 31,465 | | | | - | | | | - | | | | - | | | | - | | | | | | | | | | | | 31,000 | | | | 31,465 | |
| Qwest Corp., 6.750%, 12/1/21 | | | 375,000 | | | | 411,093 | | | | - | | | | - | | | | - | | | | - | | | | | | | | | | | | 375,000 | | | | 411,093 | |
| Sprint Communications, Inc., 6.000%, 11/15/22 | | | 181,000 | | | | 185,072 | | | | - | | | | - | | | | - | | | | - | | | | | | | | | | | | 181,000 | | | | 185,072 | |
| Symantec Corp., 144a 5.000%, 4/15/25 | | | 7,000 | | | | 7,178 | | | | - | | | | - | | | | - | | | | - | | | | | | | | | | | | 7,000 | | | | 7,178 | |
| Univision Communications, Inc., 144a 5.125%, 2/15/25 | | | 13,000 | | | | 12,789 | | | | - | | | | - | | | | - | | | | - | | | | | | | | | | | | 13,000 | | | | 12,789 | |
| Verizon Communications, Inc., 4.672%, 3/15/55 | | | 425,000 | | | | 379,525 | | | | - | | | | - | | | | - | | | | - | | | | | | | | | | | | 425,000 | | | | 379,525 | |
| Verizon Communications, Inc., 144a 5.012%, 4/15/49 | | | 331,000 | | | | 321,449 | | | | - | | | | - | | | | - | | | | - | | | | | | | | | | | | 331,000 | | | | 321,449 | |
| Videotron Ltd. / Videotron Ltee (Canada), 144a 5.125%, 4/15/27 | | | 40,000 | | | | 40,300 | | | | - | | | | - | | | | - | | | | - | | | | | | | | | | | | 40,000 | | | | 40,300 | |
| | | | | | | | 3,936,820 | | | | | | | | - | | | | | | | | - | | | | | | | | | | | | | | | | 3,936,820 | |
| | | | | | | | | | | | | | | | | | | | | | | | | | | | | | | | | | | | | | | | | |
| Industrials - 0.5% | | | | | | | | | | | | | | | | | | | | | | | | | | | | | | | | | | | | | | | | |
| Allegion PLC (Ireland), 5.875%, 9/15/23 | | | 9,000 | | | | 9,608 | | | | - | | | | - | | | | - | | | | - | | | | | | | | | | | | 9,000 | | | | 9,608 | |
| Arconic, Inc., 5.125%, 10/1/24 | | | 31,000 | | | | 32,023 | | | | - | | | | - | | | | - | | | | - | | | | | | | | | | | | 31,000 | | | | 32,023 | |
| Burlington Northern Santa Fe LLC, 5.750%, 5/1/40 | | | 190,000 | | | | 230,564 | | | | - | | | | - | | | | - | | | | - | | | | | | | | | | | | 190,000 | | | | 230,564 | |
| Clean Harbors, Inc., 5.125%, 6/1/21 | | | 3,000 | | | | 3,063 | | | | - | | | | - | | | | - | | | | - | | | | | | | | | | | | 3,000 | | | | 3,063 | |
| CNH Industrial NV (Netherlands), 4.500%, 8/15/23 | | | 48,000 | | | | 48,660 | | | | - | | | | - | | | | - | | | | - | | | | | | | | | | | | 48,000 | | | | 48,660 | |
| Eagle Materials, Inc., 4.500%, 8/1/26 | | | 19,000 | | | | 18,905 | | | | - | | | | - | | | | - | | | | - | | | | | | | | | | | | 19,000 | | | | 18,905 | |
| FedEx Corp., 5.100%, 1/15/44 | | | 400,000 | | | | 430,488 | | | | - | | | | - | | | | - | | | | - | | | | | | | | | | | | 400,000 | | | | 430,488 | |
| Huntington Ingalls Industries, Inc., 144a 5.000%, 11/15/25 | | | 5,000 | | | | 5,225 | | | | - | | | | - | | | | - | | | | - | | | | | | | | | | | | 5,000 | | | | 5,225 | |
| Joy Global, Inc., 5.125%, 10/15/21 | | | 403,000 | | | | 432,483 | | | | - | | | | - | | | | - | | | | - | | | | | | | | | | | | 403,000 | | | | 432,483 | |
| KLX, Inc., 144a 5.875%, 12/1/22 | | | 57,000 | | | | 58,781 | | | | - | | | | - | | | | - | | | | - | | | | | | | | | | | | 57,000 | | | | 58,781 | |
| Koppers, Inc., 144a 6.000%, 2/15/25 | | | 7,000 | | | | 7,228 | | | | - | | | | - | | | | - | | | | - | | | | | | | | | | | | 7,000 | | | | 7,228 | |
| Louisiana-Pacific Corp., 4.875%, 9/15/24 | | | 29,000 | | | | 29,145 | | | | - | | | | - | | | | - | | | | - | | | | | | | | | | | | 29,000 | | | | 29,145 | |
| Masco Corp., 4.375%, 4/1/26 | | | 310,000 | | | | 322,155 | | | | - | | | | - | | | | - | | | | - | | | | | | | | | | | | 310,000 | | | | 322,155 | |
| Moog, Inc., 144a 5.250%, 12/1/22 | | | 3,000 | | | | 3,075 | | | | - | | | | - | | | | - | | | | - | | | | | | | | | | | | 3,000 | | | | 3,075 | |
| Orbital ATK, Inc., 5.250%, 10/1/21 | | | 20,000 | | | | 20,675 | | | | - | | | | - | | | | - | | | | - | | | | | | | | | | | | 20,000 | | | | 20,675 | |
| Owens-Brockway Glass Container, Inc., 144a 5.875%, 8/15/23 | | | 5,000 | | | | 5,291 | | | | - | | | | - | | | | - | | | | - | | | | | | | | | | | | 5,000 | | | | 5,291 | |
| Roper Technologies, Inc., 3.000%, 12/15/20 | | | 430,000 | | | | 438,081 | | | | - | | | | - | | | | - | | | | - | | | | | | | | | | | | 430,000 | | | | 438,081 | |
| SBA Tower Trust, 144a 2.898%, 10/15/19 | | | 334,000 | | | | 335,038 | | | | - | | | | - | | | | - | | | | - | | | | | | | | | | | | 334,000 | | | | 335,038 | |
| Siemens Financieringsmaatschappij NV (Netherlands), 144a 3.125%, 3/16/24 | | | 350,000 | | | | 352,503 | | | | - | | | | - | | | | - | | | | - | | | | | | | | | | | | 350,000 | | | | 352,503 | |
| XPO CNW, Inc., 6.700%, 5/1/34 | | | 158,000 | | | | 143,385 | | | | - | | | | - | | | | - | | | | - | | | | | | | | | | | | 158,000 | | | | 143,385 | |
| | | | | | | | 2,926,376 | | | | | | | | - | | | | | | | | - | | | | | | | | | | | | | | | | 2,926,376 | |
| | | | | | | | | | | | | | | | | | | | | | | | | | | | | | | | | | | | | | | | | |
| Consumer Staples - 0.5% | | | | | | | | | | | | | | | | | | | | | | | | | | | | | | | | | | | | | | | | |
| AdvancePierre Foods Holdings, Inc., 144a 5.500%, 12/15/24 | | | 27,000 | | | | 27,304 | | | | - | | | | - | | | | - | | | | - | | | | | | | | | | | | 27,000 | | | | 27,304 | |
| Albertsons Cos. LLC / Safeway, Inc. / New Albertson’s Inc. / Albertson’s LLC, 144a 5.750%, 3/15/25 | | | 54,000 | | | | 52,380 | | | | - | | | | - | | | | - | | | | - | | | | | | | | | | | | 54,000 | | | | 52,380 | |
| Avis Budget Car Rental LLC / Avis Budget Finance, Inc., 5.500%, 4/1/23 | | | 55,000 | | | | 53,144 | | | | - | | | | - | | | | - | | | | - | | | | | | | | | | | | 55,000 | | | | 53,144 | |
| B&G Foods, Inc., 5.250%, 4/1/25 | | | 5,000 | | | | 5,044 | | | | - | | | | - | | | | - | | | | - | | | | | | | | | | | | 5,000 | | | | 5,044 | |
| Cardtronics, Inc. / Cardtronics USA, 144a 5.500%, 5/1/25 | | | 26,000 | | | | 26,293 | | | | - | | | | - | | | | - | | | | - | | | | | | | | | | | | 26,000 | | | | 26,293 | |
| Cott Holdings, Inc., 144a 5.500%, 4/1/25 | | | 27,000 | | | | 27,481 | | | | - | | | | - | | | | - | | | | - | | | | | | | | | | | | 27,000 | | | | 27,481 | |
| CVS Health Corp., 5.125%, 7/20/45 | | | 260,000 | | | | 286,857 | | | | - | | | | - | | | | - | | | | - | | | | | | | | | | | | 260,000 | | | | 286,857 | |
| IHS Markit Ltd., 144a 5.000%, 11/1/22 | | | 55,000 | | | | 57,612 | | | | - | | | | - | | | | - | | | | - | | | | | | | | | | | | 55,000 | | | | 57,612 | |
| | | | Touchstone Active Bond
Fund | | | | Sentinel Total Return
Bond Fund | | | | Sentinel Government
Securities Fund | | | | Pro Forma Adjustments | | | | Proforma Combined
Touchstone Active Bond
Fund | |
| | | | Principal
Amount | | | | Market
Value | | | | Principal
Amount | | | | Market
Value | | | | Principal
Amount | | | | Market
Value | | | | Principal
Amount | | | | Market
Value | | | | Principal
Amount | | | | Market
Value | |
| JBS USA LLC / JBS USA Finance, Inc., 144a 5.750%, 6/15/25 | | | 20,000 | | | | 20,200 | | | | - | | | | - | | | | - | | | | - | | | | | | | | | | | | 20,000 | | | | 20,200 | |
| KFC Holding Co. / Pizza Hut Holdings LLC/Taco Bell of America LLC, 144a 5.250%, 6/1/26 | | | 6,000 | | | | 6,105 | | | | - | | | | - | | | | - | | | | - | | | | | | | | | | | | 6,000 | | | | 6,105 | |
| KFC Holding Co./Pizza Hut Holdings LLC/Taco Bell of America LLC, 144a 5.000%, 6/1/24 | | | 40,000 | | | | 40,850 | | | | - | | | | - | | | | - | | | | - | | | | | | | | | | | | 40,000 | | | | 40,850 | |
| Kraft Heinz Foods Co., 6.875%, 1/26/39 | | | 515,000 | | | | 642,460 | | | | - | | | | - | | | | - | | | | - | | | | | | | | | | | | 515,000 | | | | 642,460 | |
| Kroger Co. (The), 5.000%, 4/15/42 | | | 500,000 | | | | 523,726 | | | | - | | | | - | | | | - | | | | - | | | | | | | | | | | | 500,000 | | | | 523,726 | |
| Mondelez International Holdings Netherlands BV (Netherlands), 144a 2.000%, 10/28/21 | | | 450,000 | | | | 432,991 | | | | - | | | | - | | | | - | | | | - | | | | | | | | | | | | 450,000 | | | | 432,991 | |
| Moody’s Corp., 2.750%, 12/15/21 | | | 351,000 | | | | 350,455 | | | | - | | | | - | | | | - | | | | - | | | | | | | | | | | | 351,000 | | | | 350,455 | |
| Post Holdings, Inc., 144a 5.000%, 8/15/26 | | | 73,000 | | | | 69,898 | | | | - | | | | - | | | | - | | | | - | | �� | | | | | | | | | | 73,000 | | | | 69,898 | |
| TreeHouse Foods, Inc., 4.875%, 3/15/22 | | | 7,000 | | | | 7,158 | | | | - | | | | - | | | | - | | | | - | | | | | | | | | | | | 7,000 | | | | 7,158 | |
| TreeHouse Foods, Inc., 144a 6.000%, 2/15/24 | | | 14,000 | | | | 14,665 | | | | - | | | | - | | | | - | | | | - | | | | | | | | | | | | 14,000 | | | | 14,665 | |
| US Foods, Inc., 144a 5.875%, 6/15/24 | | | 11,000 | | | | 11,412 | | | | - | | | | - | | | | - | | | | - | | | | | | | | | | | | 11,000 | | | | 11,412 | |
| | | | | | | | 2,656,035 | | | | | | | | - | | | | | | | | - | | | | | | | | | | | | | | | | 2,656,035 | |
| | | | | | | | | | | | | | | | | | | | | | | | | | | | | | | | | | | | | | | | | |
| Utilities - 0.4% | | | | | | | | | | | | | | | | | | | | | | | | | | | | | | | | | | | | | | | | |
| AES Corp., 4.875%, 5/15/23 | | | 78,000 | | | | 77,610 | | | | - | | | | - | | | | - | | | | - | | | | | | | | | | | | 78,000 | | | | 77,610 | |
| Alabama Power Capital Trust V, 4.248%, 10/1/42(A) | | | 874,000 | | | | 838,618 | | | | - | | | | - | | | | - | | | | - | | | | | | | | | | | | 874,000 | | | | 838,618 | |
| Dominion Resources, Inc., 2.000%, 8/15/21 | | | 420,000 | | | | 407,490 | | | | - | | | | - | | | | - | | | | - | | | | | | | | | | | | 420,000 | | | | 407,490 | |
| Dynegy, Inc., 7.375%, 11/1/22 | | | 18,000 | | | | 17,820 | | | | - | | | | - | | | | - | | | | - | | | | | | | | | | | | 18,000 | | | | 17,820 | |
| Dynegy, Inc., 144a 8.000%, 1/15/25 | | | 21,000 | | | | 20,108 | | | | - | | | | - | | | | - | | | | - | | | | | | | | | | | | 21,000 | | | | 20,108 | |
| Fortis, Inc. (Canada), 144a 3.055%, 10/4/26 | | | 384,000 | | | | 359,207 | | | | - | | | | - | | | | - | | | | - | | | | | | | | | | | | 384,000 | | | | 359,207 | |
| NextEra Energy Capital Holdings, Inc., 6.000%, 3/1/19 | | | 15,000 | | | | 16,072 | | | | - | | | | - | | | | - | | | | - | | | | | | | | | | | | 15,000 | | | | 16,072 | |
| NGL Energy Partners LP / NGL Energy Finance Corp., 6.875%, 10/15/21 | | | 17,000 | | | | 17,298 | | | | - | | | | - | | | | - | | | | - | | | | | | | | | | | | 17,000 | | | | 17,298 | |
| NGL Energy Partners LP / NGL Energy Finance Corp., 144a 7.500%, 11/1/23 | | | 65,000 | | | | 67,112 | | | | - | | | | - | | | | - | | | | - | | | | | | | | | | | | 65,000 | | | | 67,112 | |
| PacifiCorp, 5.750%, 4/1/37 | | | 272,000 | | | | 332,416 | | | | - | | | | - | | | | - | | | | - | | | | | | | | | | | | 272,000 | | | | 332,416 | |
| | | | | | | | 2,153,751 | | | | | | | | - | | | | | | | | - | | | | | | | | | | | | | | | | 2,153,751 | |
| | | | | | | | | | | | | | | | | | | | | | | | | | | | | | | | | | | | | | | | | |
| Real Estate - 0.3% | | | | | | | | | | | | | | | | | | | | | | | | | | | | | | | | | | | | | | | | |
| CoreCivic, Inc., 4.125%, 4/1/20† | | | 7,000 | | | | 7,140 | | | | - | | | | - | | | | - | | | | - | | | | | | | | | | | | 7,000 | | | | 7,140 | |
| CoreCivic, Inc., 4.625%, 5/1/23 | | | 6,000 | | | | 5,993 | | | | - | | | | - | | | | - | | | | - | | | | | | | | | | | | 6,000 | | | | 5,993 | |
| CoreCivic, Inc., 5.000%, 10/15/22 | | | 15,000 | | | | 15,488 | | | | - | | | | - | | | | - | | | | - | | | | | | | | | | | | 15,000 | | | | 15,488 | |
| Crown Castle International Corp., REIT, 3.400%, 2/15/21 | | | 450,000 | | | | 457,743 | | | | - | | | | - | | | | - | | | | - | | | | | | | | | | | | 450,000 | | | | 457,743 | |
| Equinix, Inc. REIT, 5.375%, 4/1/23 | | | 24,000 | | | | 24,990 | | | | - | | | | - | | | | - | | | | - | | | | | | | | | | | | 24,000 | | | | 24,990 | |
| Equinix, Inc. REIT, 5.375%, 5/15/27 | | | 7,000 | | | | 7,228 | | | | - | | | | - | | | | - | | | | - | | | | | | | | | | | | 7,000 | | | | 7,228 | |
| ESH Hospitality, Inc. REIT, 144a 5.250%, 5/1/25 | | | 39,000 | | | | 39,317 | | | | - | | | | - | | | | - | | | | - | | | | | | | | | | | | 39,000 | | | | 39,317 | |
| Omega Healthcare Investors, Inc. REIT, 4.950%, 4/1/24 | | | 400,000 | | | | 411,724 | | | | - | | | | - | | | | - | | | | - | | | | | | | | | | | | 400,000 | | | | 411,724 | |
| Simon Property Group LP, REIT, 2.750%, 2/1/23 | | | 330,000 | | | | 325,797 | | | | - | | | | - | | | | - | | | | - | | | | | | | | | | | | 330,000 | | | | 325,797 | |
| Vornado Realty LP REIT, 5.000%, 1/15/22 | | | 175,000 | | | | 188,748 | | | | - | | | | - | | | | - | | | | - | | | | | | | | | | | | 175,000 | | | | 188,748 | |
| Welltower, Inc. REIT, 6.125%, 4/15/20 | | | 316,000 | | | | 349,520 | | | | - | | | | - | | | | - | | | | - | | | | | | | | | | | | 316,000 | | | | 349,520 | |
| | | | | | | | 1,833,688 | | | | | | | | - | | | | | | | | - | | | | | | | | | | | | | | | | 1,833,688 | |
| | | | | | | | | | | | | | | | | | | | | | | | | | | | | | | | | | | | | | | | | |
| Materials - 0.1% | | | | | | | | | | | | | | | | | | | | | | | | | | | | | | | | | | | | | | | | |
| ArcelorMittal (Luxembourg), 6.250%, 3/1/21 | | | 11,000 | | | | 11,880 | | | | - | | | | - | | | | - | | | | - | | | | | | | | | | | | 11,000 | | | | 11,880 | |
| Braskem America Finance Co., 144a 7.125%, 7/22/41 | | | 200,000 | | | | 212,100 | | | | - | | | | - | | | | - | | | | - | | | | | | | | | | | | 200,000 | | | | 212,100 | |
| CF Industries, Inc., 3.450%, 6/1/23 | | | 50,000 | | | | 47,250 | | | | - | | | | - | | | | - | | | | - | | | | | | | | | | | | 50,000 | | | | 47,250 | |
| CVR Partners LP / CVR Nitrogen Finance Corp., 144a 9.250%, 6/15/23 | | | 48,000 | | | | 49,260 | | | | - | | | | - | | | | - | | | | - | | | | | | | | | | | | 48,000 | | | | 49,260 | |
| Domtar Corp., 10.750%, 6/1/17 | | | 119,000 | | | | 120,354 | | | | - | | | | - | | | | - | | | | - | | | | | | | | | | | | 119,000 | | | | 120,354 | |
| Freeport-McMoRan, Inc., 144a 6.750%, 2/1/22 | | | 38,000 | | | | 38,950 | | | | - | | | | - | | | | - | | | | - | | | | | | | | | | | | 38,000 | | | | 38,950 | |
| Hudbay Minerals, Inc. (Canada), 144a 7.250%, 1/15/23 | | | 21,000 | | | | 22,260 | | | | - | | | | - | | | | - | | | | - | | | | | | | | | | | | 21,000 | | | | 22,260 | |
| Kraton Polymers LLC / Kraton Polymers Capital Corp., 144a 7.000%, 4/15/25 | | | 12,000 | | | | 12,165 | | | | - | | | | - | | | | - | | | | - | | | | | | | | | | | | 12,000 | | | | 12,165 | |
| Lundin Mining Corp. (Canada), 144a 7.500%, 11/1/20 | | | 47,000 | | | | 49,703 | | | | - | | | | - | | | | - | | | | - | | | | | | | | | | | | 47,000 | | | | 49,703 | |
| | | | Touchstone Active Bond
Fund | | | | Sentinel Total Return
Bond Fund | | | | Sentinel Government
Securities Fund | | | | Pro Forma Adjustments | | | | Proforma Combined
Touchstone Active Bond
Fund | |
| | | | Principal
Amount | | | | Market
Value | | | | Principal
Amount | | | | Market
Value | | | | Principal
Amount | | | | Market
Value | | | | Principal
Amount | | | | Market
Value | | | | Principal
Amount | | | | Market
Value | |
| NOVA Chemicals Corp. (Canada), 144a 5.250%, 8/1/23 | | | 27,000 | | | | 27,608 | | | | - | | | | - | | | | - | | | | - | | | | | | | | | | | | 27,000 | | | | 27,608 | |
| Scotts Miracle-Gro Co. (The), 144a 5.250%, 12/15/26 | | | 21,000 | | | | 21,262 | | | | - | | | | - | | | | - | | | | - | | | | | | | | | | | | 21,000 | | | | 21,262 | |
| | | | | | | | 612,792 | | | | | | | | - | | | | | | | | - | | | | | | | | | | | | | | | | 612,792 | |
| | | | | | | | | | | | | | | | | | | | | | | | | | | | | | | | | | | | | | | | | |
| Corporate Bonds Total | | | | | | | 42,092,157 | | | | | | | | - | | | | | | | | - | | | | | | | | | | | | | | | | 42,092,157 | |
| | | | | | | | | | | | | | | | | | | | | | | | | | | | | | | | | | | | | | | | | |
| U.S. Treasury Obligations - 6.3% | | | | | | | | | | | | | | | | | | | | | | | | | | | | | | | | | | | | | | | | |
| U.S. Treasury Bond, 2.250%, 8/15/46 | | | 1,036,000 | | | | 876,796 | | | | - | | | | - | | | | - | | | | - | | | | | | | | | | | | 1,036,000 | | | | 876,796 | |
| U.S. Treasury Bond, 2.500%, 2/15/46 | | | 410,000 | | | | 367,462 | | | | - | | | | - | | | | - | | | | - | | | | | | | | | | | | 410,000 | | | | 367,462 | |
| U.S. Treasury Bond, 2.875%, 11/15/46 | | | 200,000 | | | | 194,055 | | | | - | | | | - | | | | - | | | | - | | | | | | | | | | | | 200,000 | | | | 194,055 | |
| U.S. Treasury Bond, 3.000%, 2/15/47 | | | 2,800,000 | | | | 2,790,046 | | | | - | | | | - | | | | - | | | | - | | | | | | | | | | | | 2,800,000 | | | | 2,790,046 | |
| U.S. Treasury Bond, 3.000%, 5/15/45 | | | 135,000 | | | | 134,214 | | | | - | | | | - | | | | - | | | | - | | | | | | | | | | | | 135,000 | | | | 134,214 | |
| U.S. Treasury Inflation Indexed Bonds, 0.375%, 1/15/27 | | | 13,020,000 | | | | 13,029,710 | | | | - | | | | - | | | | - | | | | - | | | | | | | | | | | | 13,020,000 | | | | 13,029,710 | |
| U.S. Treasury Note, 1.125%, 2/28/19 | | | 2,055,000 | | | | 2,050,343 | | | | - | | | | - | | | | - | | | | - | | | | | | | | | | | | 2,055,000 | | | | 2,050,343 | |
| U.S. Treasury Note, 1.125%, 7/31/21 | | | 1,500,000 | | | | 1,454,766 | | | | - | | | | - | | | | - | | | | - | | | | | | | | | | | | 1,500,000 | | | | 1,454,766 | |
| U.S. Treasury Note, 1.375%, 4/30/21 | | | 1,500,000 | | | | 1,474,804 | | | | - | | | | - | | | | - | | | | - | | | | | | | | | | | | 1,500,000 | | | | 1,474,804 | |
| U.S. Treasury Note, 2.000%, 11/15/26 | | | 4,740,000 | | | | 4,578,916 | | | | - | | | | - | | | | - | | | | - | | | | | | | | | | | | 4,740,000 | | | | 4,578,916 | |
| U.S. Treasury Note, 2.000%, 12/31/21 | | | 8,500,000 | | | | 8,532,538 | | | | - | | | | - | | | | - | | | | - | | | | | | | | | | | | 8,500,000 | | | | 8,532,538 | |
| U.S. Treasury Obligations Total | | | | | | | 35,483,650 | | | | | | | | - | | | | | | | | - | | | | | | | | | | | | | | | | 35,483,650 | |
| | | | | | | | | | | | | | | | | | | | | | | | | | | | | | | | | | | | | | | | | |
| Asset-Backed Securities - 1.9% | | | | | | | | | | | | | | | | | | | | | | | | | | | | | | | | | | | | | | | | |
| Ascentium Equipment Receivables Trust, Ser 2016-1A, Class B, 144a 2.850%, 7/10/20 | | | 475,000 | | | | 480,332 | | | | - | | | | - | | | | - | | | | - | | | | | | | | | | | | 475,000 | | | | 480,332 | |
CIT Home Equity Loan Trust, Ser 2002-1, Class AF5, 7.210%,
2/25/33(C) | | | 3,465 | | | | 3,459 | | | | - | | | | - | | | | - | | | | - | | | | | | | | | | | | 3,465 | | | | 3,459 | |
| CWHEQ Home Equity Loan Trust, Ser 2007-S1, Class A5, 6.018%, 11/25/36(A) | | | 382,425 | | | | 364,822 | | | | - | | | | - | | | | - | | | | - | | | | | | | | | | | | 382,425 | | | | 364,822 | |
| Dell Equipment Finance Trust, Ser 2015-1, Class C, 144a 2.420%, 3/23/20 | | | 450,000 | | | | 452,388 | | | | - | | | | - | | | | - | | | | - | | | | | | | | | | | | 450,000 | | | | 452,388 | |
| Domino’s Pizza Master Issuer LLC, Ser 2012-1A, Class A2, 144a 5.216%, 1/25/42 | | | 176,271 | | | | 178,568 | | | | - | | | | - | | | | - | | | | - | | | | | | | | | | | | 176,271 | | | | 178,568 | |
| FFMLT Trust, Ser 2005-FFA, Class M3, 6.017%, 3/25/25(C) | | | 414,795 | | | | 426,006 | | | | - | | | | - | | | | - | | | | - | | | | | | | | | | | | 414,795 | | | | 426,006 | |
| FHLMC Structured Pass Through Securities, Ser T-20, Class A5, 6.895%, 12/25/29(C) | | | 200,011 | | | | 248,669 | | | | - | | | | - | | | | - | | | | - | | | | | | | | | | | | 200,011 | | | | 248,669 | |
| FNMA REMIC Trust, Ser 2001-W2, Class AF6, 6.589%, 10/25/31(C) | | | 51,706 | | | | 55,148 | | | | - | | | | - | | | | - | | | | - | | | | | | | | | | | | 51,706 | | | | 55,148 | |
| Keuka Park CLO Ltd 2013-1, 2.741%, 10/21/24 | | | - | | | | - | | | | 2,000,000 | | | | 1,999,994 | (E) | | | - | | | | - | | | | | | | | | | | | 2,000,000 | | | | 1,999,994 | |
| Leaf Receivables Funding LLC, Ser 2016-1, Class B, 144a 2.780%, 8/15/22 | | | 300,000 | | | | 297,318 | | | | - | | | | - | | | | - | | | | - | | | | | | | | | | | | 300,000 | | | | 297,318 | |
| Mid-State Capital Corp. Trust, Ser 2005-1, Class M2, 7.079%, 1/15/40 | | | 1,556,467 | | | | 1,704,112 | | | | - | | | | - | | | | - | | | | - | | | | | | | | | | | | 1,556,467 | | | | 1,704,112 | |
| Nomad CLO Ltd., 2.223%, 1/15/25 | | | - | | | | - | | | | 1,250,000 | | | | 1,249,995 | (E) | | | - | | | | - | | | | | | | | | | | | 1,250,000 | | | | 1,249,995 | |
| Orange Lake Timeshare Trust, Ser 2016-A, Class A, 144a 2.610%, 3/8/29 | | | 485,246 | | | | 479,438 | | | | - | | | | - | | | | - | | | | - | | | | | | | | | | | | 485,246 | | | | 479,438 | |
| RASC Trust, Ser 2001-KS3, Class AI6, 5.960%, 9/25/31(A) | | | 1,999 | | | | 2,074 | | | | - | | | | - | | | | - | | | | - | | | | | | | | | | | | 1,999 | | | | 2,074 | |
| Santander Drive Auto Receivables Trust, Ser 2015-1, Class B, 1.970%, 11/15/19 | | | 288,603 | | | | 289,031 | | | | - | | | | - | | | | - | | | | - | | | | | | | | | | | | 288,603 | | | | 289,031 | |
| Sonic Capital LLC, Ser 2016-1A, Class A2, 144a 4.472%, 5/20/46 | | | 313,163 | | | | 308,609 | | | | - | | | | - | | | | - | | | | - | | | | | | | | | | | | 313,163 | | | | 308,609 | |
| SpringCastle America Funding LLC, Ser 2016-AA, Class A, 144a 3.050%, 4/25/29 | | | 434,579 | | | | 437,245 | | | | - | | | | - | | | | - | | | | - | | | | | | | | | | | | 434,579 | | | | 437,245 | |
| Taco Bell Funding, LLC, 3.832%, 5/25/26 | | | - | | | | - | | | | 1,990,000 | | | | 2,017,293 | (E) | | | - | | | | - | | | | | | | | | | | | 1,990,000 | | | | 2,017,293 | |
| Asset-Backed Securities Total | | | | | | | 5,727,219 | | | | | | | | 5,267,282 | | | | | | | | - | | | | | | | | | | | | | | | | 10,994,501 | |
| | | | | | | | | | | | | | | | | | | | | | | | | | | | | | | | | | | | | | | | | |
| Non-Agency Collateralized Mortgage Obligations - 0.5% | | | | | | | | | | | | | | | | | | | | | | | | | | | | | | | | | | | | | | | | |
| Adjustable Rate Mortgage Trust, Ser 2004-4, Class 3A1, 3.336%, 3/25/35(A) | | | 4,388 | | | | 4,234 | | | | - | | | | - | | | | - | | | | - | | | | | | | | | | | | 4,388 | | | | 4,234 | |
| Alternative Loan Trust, Ser 2004-30CB, Class 3A1, 5.000%, 2/25/20 | | | 283,674 | | | | 281,120 | | | | - | | | | - | | | | - | | | | - | | | | | | | | | | | | 283,674 | | | | 281,120 | |
| | | | Touchstone Active Bond
Fund | | | | Sentinel Total Return
Bond Fund | | | | Sentinel Government
Securities Fund | | | | Pro Forma Adjustments | | | | Proforma Combined
Touchstone Active Bond
Fund | |
| | | | Principal
Amount | | | | Market
Value | | | | Principal
Amount | | | | Market
Value | | | | Principal
Amount | | | | Market
Value | | | | Principal
Amount | | | | Market
Value | | | | Principal
Amount | | | | Market
Value | |
| Alternative Loan Trust, Ser 2005-J3, Class 3A1, 6.500%, 9/25/34 | | | 25,957 | | | | 25,499 | | | | - | | | | - | | | | - | | | | - | | | | | | | | | | | | 25,957 | | | | 25,499 | |
| CSFB Mortgage-Backed Trust, Ser 2004-7, Class 6A1, 5.250%, 10/25/19 | | | 49,863 | | | | 50,409 | | | | - | | | | - | | | | - | | | | - | | | | | | | | | | | | 49,863 | | | | 50,409 | |
JP Morgan Mortgage Trust, Ser 2005-A1, Class 2A1, 3.268%,
2/25/35(A) | | | 106,458 | | | | 107,572 | | | | - | | | | - | | | | - | | | | - | | | | | | | | | | | | 106,458 | | | | 107,572 | |
JP Morgan Mortgage Trust, Ser 2005-A2, Class 7CB1, 3.367%,
4/25/35(A) | | | 272,584 | | | | 273,935 | | | | - | | | | - | | | | - | | | | - | | | | | | | | | | | | 272,584 | | | | 273,935 | |
JP Morgan Mortgage Trust, Ser 2006-A4, Class 2A2, 3.082%,
6/25/36(A) | | | 62,113 | | | | 55,689 | | | | - | | | | - | | | | - | | | | - | | | | | | | | | | | | 62,113 | | | | 55,689 | |
| MASTR Alternative Loans Trust, Ser 2004-7, Class 10A1, 6.000%, 6/25/34 | | | 53,990 | | | | 54,264 | | | | - | | | | - | | | | - | | | | - | | | | | | | | | | | | 53,990 | | | | 54,264 | |
| Residential Asset Securitization Trust, Ser 2006-A1, Class 1A3, 6.000%, 4/25/36 | | | 213,117 | | | | 163,546 | | | | - | | | | - | | | | - | | | | - | | | | | | | | | | | | 213,117 | | | | 163,546 | |
Sequoia Mortgage Trust, Ser 2013-10, Class B2, 144a 3.568%,
8/25/43(A) | | | 595,221 | | | | 583,456 | | | | - | | | | - | | | | - | | | | - | | | | | | | | | | | | 595,221 | | | | 583,456 | |
| Structured Asset Securities Corp. Mortgage Pass-Through Certificates, Ser 2004-21XS, Class 2A6B, 5.650%, 12/25/34(C) | | | 1,987 | | | | 2,015 | | | | - | | | | - | | | | - | | | | - | | | | | | | | | | | | 1,987 | | | | 2,015 | |
| Structured Asset Securities Corp. Trust, Ser 2005-17, Class 5A1, 5.500%, 10/25/35 | | | 150,892 | | | | 120,104 | | | | - | | | | - | | | | - | | | | - | | | | | | | | | | | | 150,892 | | | | 120,104 | |
| Towd Point Mortgage Trust, Ser 2015-3, Class A2, 144a 4.000%, 3/25/54(A) | | | 700,000 | | | | 707,540 | | | | - | | | | - | | | | - | | | | - | | | | | | | | | | | | 700,000 | | | | 707,540 | |
| Towd Point Mortgage Trust, Ser 2016-2, Class A1, 144a 3.000%, 8/25/55(A) | | | 374,288 | | | | 375,506 | | | | - | | | | - | | | | - | | | | - | | | | | | | | | | | | 374,288 | | | | 375,506 | |
| Washington Mutual Alternative Mortgage Pass-Through Certificates, Ser 2005-9, Class 2A4, 5.500%, 11/25/35 | | | 124,450 | | | | 111,639 | | | | - | | | | - | | | | - | | | | - | | | | | | | | | | | | 124,450 | | | | 111,639 | |
| Wells Fargo Mortgage Backed Securities Trust, Ser 2003-G, Class A1, 2.895%, 6/25/33(A) | | | 125,129 | | | | 125,372 | | | | - | | | | - | | | | - | | | | - | | | | | | | | | | | | 125,129 | | | | 125,372 | |
| Non-Agency Collateralized Mortgage Obligations Total | | | | | | | 3,041,900 | | | | | | | | - | | | | | | | | - | | | | | | | | | | | | | | | | 3,041,900 | |
| | | | | | | | | | | | | | | | | | | | | | | | | | | | | | | | | | | | | | | | | |
| Commercial Mortgage-Backed Securities - 0.3% | | | | | | | | | | | | | | | | | | | | | | | | | | | | | | | | | | | | | | | | |
| Cosmopolitan Hotel Trust, Ser 2016-CSMO, Class A, 144a 2.312%, 11/15/33(A) | | | 595,000 | | | | 599,840 | | | | - | | | | - | | | | - | | | | - | | | | | | | | | | | | 595,000 | | | | 599,840 | |
| Eleven Madison Trust Mortgage Trust, Ser 2015-11MD, Class C, 144a 3.555%, 9/10/35(A) | | | 550,000 | | | | 546,464 | | | | - | | | | - | | | | - | | | | - | | | | | | | | | | | | 550,000 | | | | 546,464 | |
| J.P. Morgan Chase Commercial Mortgage Securities Trust, Ser 2016-NINE, Class B, 144a 2.854%, 10/6/38(A) | | | 528,000 | | | | 503,906 | | | | - | | | | - | | | | - | | | | - | | | | | | | | | | | | 528,000 | | | | 503,906 | |
| Commercial Mortgage-Backed Securities Total | | | | | | | 1,650,210 | | | | | | | | - | | | | | | | | - | | | | | | | | | | | | | | | | 1,650,210 | |
| | | | | | | | | | | | | | | | | | | | | | | | | | | | | | | | | | | | | | | | | |
| | | | Shares | | | | | | | | Shares | | | | | | | | Shares | | | | | | | | Shares | | | | | | | | Shares | | | | | |
| Preferred Stocks - 0.2% | | | | | | | | | | | | | | | | | | | | | | | | | | | | | | | | | | | | | | | | |
| | | | | | | | | | | | | | | | | | | | | | | | | | | | | | | | | | | | | | | | | |
| Utilities - 0.1% | | | | | | | | | | | | | | | | | | | | | | | | | | | | | | | | | | | | | | | | |
| Entergy Arkansas, Inc., 4.875% | | | 8,634 | | | | 196,164 | | | | - | | | �� | - | | | | - | | | | - | | | | | | | | | | | | 8,634 | | | | 196,164 | |
| Entergy Louisiana LLC, 4.875% | | | 8,769 | | | | 198,267 | | | | - | | | | - | | | | - | | | | - | | | | | | | | | | | | 8,769 | | | | 198,267 | |
| Entergy Mississippi, Inc., 4.900% | | | 7,966 | | | | 180,271 | | | | - | | | | - | | | | - | | | | - | | | | | | | | | | | | 7,966 | | | | 180,271 | |
| | | | | | | | 574,702 | | | | | | | | - | | | | | | | | - | | | | | | | | | | | | | | | | 574,702 | |
| | | | | | | | | | | | | | | | | | | | | | | | | | | | | | | | | | | | | | | | | |
| Real Estate - 0.1% | | | | | | | | | | | | | | | | | | | | | | | | | | | | | | | | | | | | | | | | |
| Public Storage, 4.900% | | | 19,007 | | | | 427,467 | | | | - | | | | - | | | | - | | | | - | | | | | | | | | | | | 19,007 | | | | 427,467 | |
| | | | | | | | | | | | | | | | | | | | | | | | | | | | | | | | | | | | | | | | | |
| Preferred Stocks Total | | | | | | | 1,002,169 | | | | | | | | - | | | | | | | | - | | | | | | | | | | | | | | | | 1,002,169 | |
| | | | | | | | | | | | | | | | | | | | | | | | | | | | | | | | | | | | | | | | | |
| | | | Principal
Amount | | | | | | | | Principal
Amount | | | | | | | | Principal
Amount | | | | | | | | Principal
Amount | | | | | | | | Principal
Amount | | | | | |
| Agency Collateralized Mortgage Obligations - 0.1% | | | | | | | | | | | | | | | | | | | | | | | | | | | | | | | | | | | | | | | | |
| FNMA REMIC, Ser 2015-51, Class KC, 3.000%, 6/25/45 | | | 138,812 | | | | 140,345 | | | | - | | | | - | | | | - | | | | - | | | | | | | | | | | | 138,812 | | | | 140,345 | |
| FNMA Trust, Ser 2004-W15, Class 2AF, 1.232%, 8/25/44(A) | | | 139,845 | | | | 138,784 | | | | - | | | | - | | | | - | | | | - | | | | | | | | | | | | 139,845 | | | | 138,784 | |
| GNMA, Ser 2003-11, Class GJ, 4.000%, 10/17/29 | | | 10,844 | | | | 11,403 | | | | - | | | | - | | | | - | | | | - | | | | | | | | | | | | 10,844 | | | | 11,403 | |
| Agency Collateralized Mortgage Obligations Total | | | | | | | 290,532 | | | | | | | | - | | | | | | | | - | | | | | | | | | | | | | | | | 290,532 | |
| | | | Touchstone Active Bond
Fund | | | Sentinel Total Return
Bond Fund | | | | Sentinel Government
Securities Fund | | | | Pro Forma Adjustments | | | | Proforma Combined
Touchstone Active Bond
Fund | |
| | | | Principal
Amount | | | | Market
Value | | | Principal
Amount | | | | Market
Value | | | | Principal
Amount | | | | Market
Value | | | | Principal
Amount | | | | Market
Value | | | | Principal
Amount | | | | Market
Value | |
| Sovereign Bond - 0.0% | | | | | | | | | | | | | | | | | | | | | | | | | | | | | | | | | | | | | | | |
| Bermuda Government International Bond, 144a 3.717%, 1/25/27 | | | 253,000 | | | | 243,520 | | | - | | | | - | | | | - | | | | - | | | | | | | | | | | | 253,000 | | | | 243,520 | |
| | | | | | | | | | | | | | | | | | | | | | | | | | | | | | | | | | | | | | | | |
| | | | Shares | | | | | | | Shares | | | | | | | | Shares | | | | | | | | Shares | | | | | | | | Shares | | | | | |
| Short Term Investments - 3.7% | | | | | | | | | | | | | | | | | | | | | | | | | | | | | | | | | | | | | | | |
Dreyfus Government Cash Management, Institutional Shares,
0.66%∞Ω | | | 574,093 | | | | 574,093 | | | - | | | | - | | | | - | | | | - | | | | | | | | | | | | 574,093 | | | | 574,093 | |
| Invesco Government & Agency Portfolio, Institutional Class, 0.61%**∞Ω | | | 609,596 | | | | 609,596 | | | - | | | | - | | | | - | | | | - | | | | | | | | | | | | 609,596 | | | | 609,596 | |
| State Street Institutional U.S. Government Money Market Fund Premier Class | | | - | | | | - | | | 10,762,336 | | | | 10,762,336 | (E) | | | 9,311,136 | | | | 9,311,136 | (E) | | | (339,445 | ) | | | (339,445 | )(F) | | | 19,734,027 | | | | 19,734,027 | |
| Short Term Investments Total | | | | | | | 1,183,689 | | | | | | | 10,762,336 | | | | | | | | 9,311,136 | | | | | | | | (339,445 | ) | | | | | | | 20,917,716 | |
| | | | | | | | | | | | | | | | | | | | | | | | | | | | | | | | | | | | | | | | |
Total Investment Securities - 102.3%
(Cost $575,690,888) | | | | | | $ | 103,304,990 | | | | | | $ | 290,226,264 | | | | | | | $ | 186,644,318 | | | | | | | $ | (339,445 | ) | | | | | | $ | 579,836,127 | |
| | | | | | | | | | | | | | | | | | | | | | | | | | | | | | | | | | | | | | | | |
| Liabilities in Excess of Other Assets - -2.3% | | | | | | | 155,891 | | | | | | | (7,764,852 | ) | | | | | | | (5,663,272 | ) | | | | | | | 339,445 | (F) | | | | | | | (12,932,788 | ) |
| | | | | | | | | | | | | | | | | | | | | | | | | | | | | | | | | | | | | | | | |
| Net Assets - 100.0% | | | | | | $ | 103,460,881 | | | | | | $ | 282,461,412 | | | | | | | $ | 180,981,046 | | | | | | | $ | - | | | | | | | $ | 566,903,339 | |
(A) Variable rate security - Rate reflected is the rate in effect as of March 31, 2017.
(B) Perpetual Bond - A Bond with no definite maturity date.
(C) Step Bond - A bond that pays an initial interest rate for the first period and then a higher interest rate for the following periods until maturity. The interest rate shown reflects the rate in effect as of March 31, 2017.
(D) The actual mortgage-backed security that will be delivered is not designated until 48 hours prior to the established trade settlement date with the broker.
(E) Following the Reorganization, all or a portion of this security may be sold. It is expected that the Touchstone Active Bond Fund will sell approximately 67% of the securities acquired from each Target Fund. If such sales had occurred as of 3/31/17, shareholders would have recognized capital gains of $0.10 per share of the Proforma Combined Touchstone Active Bond Fund.
(F) Deferred compensation plan will be redeemed prior to conversion.
** Represents collateral for securities loaned.
† All or a portion of the security is on loan. The total market value of the securities on loan as of March 31, 2017 was $573,430.
∞ Open-End Fund.
Ω Represents the 7-day SEC yield as of March 31, 2017.
FHLMC - Federal Home Loan Mortgage Corporation
FNMA - Federal National Mortgage Association
GNMA - Government National Mortgage Association
LLC - Limited Liability Company
LP - Limited Partnership
MTN - Medium Term Note
PLC - Public Limited Company
REIT - Real Estate Investment Trust
REMIC - Real Estate Mortgage Investment Conduit 144a - This is a restricted security that was sold in a transaction qualifying for the exemption under Rule 144A of the Securities Act of 1933. This security may be sold in transactions exempt from registration, normally to qualified institutional buyers. At March 31, 2017, these securities were valued at $14,095,446 or 2.5% of net assets. These securities were deemed liquid pursuant to procedures approved by the Board of Trustees.
| Description | | Level1 | | | Level2 | | | Level3 | | | Total | |
| U.S. Government Mortgage-Backed Obligations | | $ | - | | | $ | 271,709,511 | | | $ | - | | | $ | 271,709,511 | |
| Bank Loans | | | - | | | | 125,758,168 | | | | - | | | | 125,758,168 | |
| Exchange Traded Funds | | | - | | | | 66,652,093 | | | | - | | | | 66,652,093 | |
| Corporate Bonds | | | - | | | | 42,092,157 | | | | - | | | | 42,092,157 | |
| U.S. Treasury Obligations | | | - | | | | 35,483,650 | | | | - | | | | 35,483,650 | |
| Asset-Backed Securities | | | - | | | | 10,994,501 | | | | - | | | | 10,994,501 | |
| Non-Agency Collateralized Mortgage Obligations | | | - | | | | 3,041,900 | | | | - | | | | 3,041,900 | |
| Commercial Mortgage-Backed Securities | | | - | | | | 1,650,210 | | | | - | | | | 1,650,210 | |
| Preferred Stocks | | | 1,002,169 | | | | - | | | | - | | | | 1,002,169 | |
| Agency Collateralized Mortgage Obligations | | | - | | | | 290,532 | | | | - | | | | 290,532 | |
| Sovereign Bond | | | - | | | | 243,520 | | | | - | | | | 243,520 | |
| Short Term Investments | | | 1,183,689 | | | | 19,734,027 | | | | - | | | | 20,917,716 | |
| Total | | $ | 2,185,858 | | | $ | 577,650,269 | | | $ | - | | | $ | 579,836,127 | |
Pro Forma Financial Statements for the Reorganization of Sentinel Low Duration Bond Fund into Touchstone Ultra Short Duration Fixed Income Fund
Pro Forma Statement of Assets and Liabilities
As of March 31, 2017 (Unaudited)
| | | Sentinel Low
Duration
Bond Fund | | | Touchstone
Ultra Short
Duration Fixed
Income Fund | | | Pro Forma
Adjustments | | | Proforma
Combined
Touchstone
Ultra Short
Duration
Fixed Income
Fund |
| Assets | | | | | | | | | | | |
| Investments, at cost | $ | 313,949,788 | | $ | 644,296,274 | | | (451,106) | (1) | $ | 957,794,956 |
| Investments, at market value | $ | 314,434,731 | | $ | 644,405,422 | | | (451,106) | (1) | $ | 958,389,047 |
| Cash | | - | | | 43,466 | | | | | | 43,466 |
| Cash collateral with futures commission merchant | | 315,751 | | | - | | | | | | 315,751 |
| Dividends and interest receivable | | 1,103,175 | | | 3,060,610 | | | | | | 4,163,785 |
| Receivable for capital shares sold | | 569,382 | | | 24,532,180 | | | | | | 25,101,562 |
| Receivable for investments sold | | 4,438 | | | 3,147,521 | | | | | | 3,151,959 |
| Receivable for securities lending income | | 308 | | | - | | | | | | 308 |
| Other assets | | - | | | 48,035 | | | | | | 48,035 |
| Total Assets | | 316,427,785 | | | 675,237,234 | | | (451,106) | | | 991,213,913 |
| | | | | | | | | | | | |
| Liabilities | | | | | | | | | | | |
| Distributions payable | | - | | | 176,095 | | | | | | 176,095 |
| Payable to Transfer Agent | | 20,612 | | | 87,882 | | | | | | 108,494 |
| Payable for capital shares redeemed | | 1,060,499 | | | 1,334,621 | | | | | | 2,395,120 |
| Payable for investments purchased | | 742,000 | | | 19,171,987 | | | | | | 19,913,987 |
| Payable for variation margin on futures contracts | | 18,867 | | | - | | | | | | 18,867 |
| Payable to Investment Advisor | | 121,242 | | | 120,856 | | | | | | 242,098 |
| Payable to other affiliates | | 117,243 | | | 153,593 | | | | | | 270,836 |
| Payable to Trustees and Compliance Fees | | 730 | | | 3,914 | | | | | | 4,644 |
| Payable for Professional Services | | 40,028 | | | 23,778 | | | | | | 63,806 |
| Deferred Compensation | | 451,106 | | | - | | | (451,106) | | | - |
| Other accrued expenses and liabilities | | 60,013 | | | 48,263 | | | | | | 108,276 |
| Total Liabilities | | 2,632,340 | | | 21,120,989 | | | (451,106) | | | 23,302,223 |
| | | | | | | | | | | | |
| Net Assets | $ | 313,795,445 | | $ | 654,116,245 | | | - | | $ | 967,911,690 |
| | | | | | | | | | | | |
| Net assets consist of: | | | | | | | | | | | |
| Par Value | $ | 371,879 | (A) | $ | 702,860 | (B) | | | | $ | 1,074,739 |
| Paid-in capital | | 440,966,356 | | | 680,304,822 | | | | | | 1,121,271,178 |
| Accumulated net investment income (loss) | | (848,899) | | | (155,139) | | | | | | (1,004,038) |
| Accumulated net realized gains (losses) on investments, futures contracts and foreign currency transactions | | (127,175,717) | | | (26,845,446) | | | | | | (154,021,163) |
| Net unrealized appreciation (depreciation) on investments, futures contracts and foreign currency transactions | | 481,826 | | | 109,148 | | | | | | 590,974 |
| Net Assets applicable to shares outstanding | $ | 313,795,445 | | $ | 654,116,245 | | | | | $ | 967,911,690 |
| | | Sentinel Low
Duration
Bond Fund | | | Touchstone
Ultra Short
Duration Fixed
Income Fund | | | Pro Forma
Adjustments | | | Proforma
Combined
Touchstone
Ultra Short
Duration
Fixed Income
Fund |
| Pricing of Class A Shares | | | | | | | | | | | |
| Net assets attributable to Class A shares | $ | 88,625,791 | | $ | 12,764,742 | | | | | $ | 101,390,533 |
| Shares of beneficial interest outstanding | | 10,514,203 | (A) | | 1,376,890 | (B) | | (954,436) | | | 10,936,657 |
| Net asset value and redemption price per share(C) | $ | 8.43 | | $ | 9.27 | | | | | $ | 9.27 |
| Maximum sales charge - Class A shares | | 1.00% | | | 2.00% | | | | | | 2.00% |
| Maximum offering price per share | $ | 8.52 | | $ | 9.46 | | | | | $ | 9.46 |
| | | | | | | | | | | | |
| Pricing of Class C Shares | | | | | | | | | | | |
| Net assets attributable to Class C shares | | - | | $ | 7,351,857 | | | | | $ | 7,351,857 |
| Shares of beneficial interest outstanding | | - | | | 789,123 | (B) | | - | | | 789,123 |
| Net asset value, offering price and redemption price per share(D) | | - | | $ | 9.32 | | | | | $ | 9.32 |
| | | | | | | | | | | | |
| Pricing of Class S Shares | | | | | | | | | | | |
| Net assets attributable to Class S shares (E) | $ | 206,565,798 | | | - | | | | | $ | 206,565,798 |
| Shares of beneficial interest outstanding | | 24,470,186 | (A) | | - | | | (2,287,887) | | | 22,182,299 |
| Net asset value, offering price and redemption price per share(D) | $ | 8.44 | | | - | | | | | $ | 9.31 |
| | | | | | | | | | | | |
| Pricing of Class Y Shares | | | | | | | | | | | |
| Net assets attributable to Class Y shares(F) | $ | 18,603,856 | | $ | 221,705,064 | | | | | $ | 240,308,920 |
| Shares of beneficial interest outstanding | | 2,203,470 | (A) | | 23,808,046 | (B) | | (205,674) | | | 25,805,842 |
| Net asset value, offering price and redemption price per share(D) | $ | 8.44 | | $ | 9.31 | | | | | $ | 9.31 |
| | | | | | | | | | | | |
| Pricing of Class Z Shares | | | | | | | | | | | |
| Net assets attributable to Class Z shares | | - | | $ | 219,212,381 | | | | | $ | 219,212,381 |
| Shares of beneficial interest outstanding | | - | | | 23,577,201 | (B) | | - | | | 23,577,201 |
| Net asset value, offering price and redemption price per share | | - | | $ | 9.30 | | | | | $ | 9.30 |
| | | | | | | | | | | | |
| Pricing of Institutional Class Shares | | | | | | | | | | | |
| Net assets attributable to Institutional Class shares | | - | | $ | 193,082,201 | | | | | $ | 193,082,201 |
| Shares of beneficial interest outstanding | | - | | | 20,734,708 | (B) | | - | | | 20,734,708 |
| Net asset value, offering price and redemption price per share | | - | | $ | 9.31 | | | | | $ | 9.31 |
(A) Limited number of shares authorized, par value of $.01
(B) Unlimited number of shares authorized, par value of $.01
(C) There is no sales load on subscriptions of $1 million or more. Redemptions that were part of a $1 million or more subscription may be subject to a contingent deferred sales load if redeemed within a one-year period from the date of purchase.
(D) Redemption price per share varies by length of time shares are held due to the terms of the contingent deferred sales charge.
(E) Touchstone Ultra Short Duration Fixed Income Fund will open Class S shares
(F) Sentinel Low Duration Bond Fund Class I shares will convert to Touchstone Ultra Short Duration Fixed Income Fund Class Y shares.
(1) Deferred compensation plan will be redeemed prior to conversion.
Pro Forma Statement of Operations
For the twelve months ending March 31, 2017 (Unaudited)
| | | Sentinel Low
Duration Bond
Fund | | Touchstone
Ultra Short
Duration Fixed
Income Fund | | Pro Forma
Adjustments | | | Proforma
Combined
Touchstone Ultra
Short Duration
Fixed Income
Fund |
| Investment Income | | | | | | | | | |
| Dividends | | $ | 4,397,482 | | $ | 2,020 | | $ | - | | | $ | 4,399,502 |
| Interest Income | | 2,803,906 | | 12,762,186 | | - | | | 15,566,092 |
| Income from Securities loaned | | 131,340 | | - | | - | | | 131,340 |
| Total Investment Income | | 7,332,728 | | 12,764,206 | | - | | | 20,096,934 |
| Expenses | | | | | | | | | |
| Investment advisory fees | | 1,670,389 | | 1,490,407 | | (740,606) | (A) | | 2,420,190 |
| Accounting and Administration services | | 136,882 | | 864,436 | | 402,392 | (A) | | 1,403,710 |
| Compliance fees and expenses | | 29,287 | | 2,856 | | (29,753) | (B) | | 2,390 |
| Custody fees | | 43,600 | | 40,083 | | (31,097) | (B) | | 52,586 |
| Professional fees | | 46,200 | | 47,375 | | (46,200) | (B) | | 47,375 |
| Transfer Agent fees, Class A | | 129,439 | | 9,505 | | - | | | 138,944 |
| Transfer Agent fees, Class C | | - | | 5,988 | | - | | | 5,988 |
| Transfer Agent fees, Class Y | | 9,411 | | 175,668 | | - | (C) | | 185,079 |
| Transfer Agent fees, Institutional Class | | - | | 6,476 | | - | | | 6,476 |
| Transfer Agent fees, Class Z | | - | | 193,498 | | - | | | 193,498 |
| Transfer Agent fees, Class S | | 70,845 | | - | | - | | | 70,845 |
| Registration Fees, Class A | | 16,197 | | 16,995 | | (16,197) | (B) | | 16,995 |
| Registration Fees, Class C | | - | | 17,767 | | - | | | 17,767 |
| Registration Fees, Class Y | | 10,806 | | 20,071 | | (10,806) | (B)(C) | | 20,071 |
| Registration Fees, Institutional Class | | - | | 19,182 | | - | | | 19,182 |
| Registration Fees, Class Z | | - | | 41,862 | | - | | | 41,862 |
| Registration Fees, Class S | | 21,536 | | - | | - | | | 21,536 |
| Reports to Shareholders, Class A | | 3,378 | | 5,378 | | - | | | 8,756 |
| Reports to Shareholders, Class C | | - | | 5,188 | | - | | | 5,188 |
| Reports to Shareholders, Class Y | | 40 | | 12,474 | | - | (C) | | 12,514 |
| Reports to Shareholders, Class Institutional Class | | - | | 5,068 | | - | | | 5,068 |
| Reports to Shareholders, Class Z | | - | | 14,595 | | - | | | 14,595 |
| Reports to Shareholders, Class S | | 482 | | - | | 5,000 | (E) | | 5,482 |
| Distribution expenses, Class A | | 249,563 | | 35,276 | | - | | | 284,839 |
| Distribution expenses, Class C | | - | | 60,559 | | - | | | 60,559 |
| Shareholder Servicing Fees, Class Z | | - | | 581,929 | | - | | | 581,929 |
| Distribution expenses, Class S | | 1,206,934 | | - | | - | | | 1,206,934 |
| Trustee fees | | 82,685 | | 16,204 | | (85,409) | (B) | | 13,480 |
| Other expenses | | 32,083 | | 109,290 | | (4,220) | (B) | | 137,153 |
| Total Expenses | | 3,759,757 | | 3,798,130 | | (556,896) | | | 7,000,991 |
| Fees waived and/or reimbursed by the Advisor and/or Affiliates | | - | | (563,328) | | (106,682) | (D) | | (670,010) |
| Net Expenses | | 3,759,757 | | 3,234,802 | | (663,578) | | | 6,330,981 |
| Net Investment Income (Loss) | | 3,572,971 | | 9,529,404 | | 663,578 | | | 13,765,953 |
| Realized and Unrealized Gains (Losses) on Investments | | | | | | | | | |
| Net realized gains (losses) on investments | | 7,139,313 | | (3,212,562) | | - | | | 3,926,751 |
| Net realized gains (losses) on futures contracts | | (453,875) | | - | | - | | | (453,875) |
| Net change in unrealized appreciation (depreciation) on investments | | (4,119,606) | | 2,668,586 | | - | | | (1,451,020) |
| Net change in unrealized appreciation (depreciation) on futures contracts | | 221,758 | | - | | - | | | 221,758 |
| | | | Sentinel Low
Duration Bond
Fund | | | Touchstone
Ultra Short
Duration Fixed
Income Fund | | | Pro Forma
Adjustments | | | | Proforma
Combined
Touchstone Ultra
Short Duration
Fixed Income
Fund |
| Net Realized and Unrealized Gains (Losses) on Investments | | | 2,787,590 | | | (543,976) | | | - | | | | 2,243,614 |
| Change in Net Assets Resulting from Operations | | $ | 6,360,561 | | $ | 8,985,428 | | $ | 663,578 | | | $ | 16,009,567 |
(A) Reflects the impact of applying the Acquiring Fund’s Investment Advisory and Administration fee rates following the Reorganization to the combined fund’s average net assets.
(B) Reflects the anticipated reduction of certain duplicative expenses eliminated as a result of the Reorganization.
(C) Holders of Sentinel Low Duration Bond Fund Class I shares will receive Class Y shares of the Touchstone Ultra Short Duration Fixed Income Fund upon closing of the reorganization.
(D) Reflects the increase in expense reimbursement payments the advisor would have made to the combined fund if the Reorganization had occurred on the first day of the 12-month period ended March 31, 2017.
(E) Reflects the anticipated increase of certain expenses as a result of the Reorganization.
Pro Forma Portfolio of Investments
As of March 31, 2017 (Unaudited)
| | | Touchstone Ultra Short
Duration Fixed Income
Fund | | Sentinel Low Duration
Bond Fund | | Pro Forma
Adjustments | | Proforma Combined
Touchstone Ultra Short
Duration Fixed Income
Fund |
| | | Principal
Amount | | Market
Value | | Principal
Amount | | Market
Value | | Principal
Amount | | Market
Value | | Principal
Amount | | Market
Value |
| Corporate Bonds - 35.0% | | | | | | | | | | | | | | | | |
| | | | | | | | | | | | | | | | | |
| Financials - 11.7% | | | | | | | | | | | | | | | | |
| Air Lease Corp., 5.625%, 4/1/17 | | 5,389,000 | | 5,389,000 | | - | | - | | | | | | 5,389,000 | | 5,389,000 |
| Bank of America Corp. MTN, 1.700%, 8/25/17 | | 2,765,000 | | 2,769,289 | | - | | - | | | | | | 2,765,000 | | 2,769,289 |
| Bank of America Corp., 3.124%, 1/20/23 | | - | | - | | 1,500,000 | | 1,505,769 | (E) | | | | | 1,500,000 | | 1,505,769 |
| Bank of America Corp., 3.248%, 10/21/27 | | - | | - | | 950,000 | | 904,215 | (E) | | | | | 950,000 | | 904,215 |
| Bank of America NA, 6.100%, 6/15/17 | | 2,704,000 | | 2,728,752 | | - | | - | | | | | | 2,704,000 | | 2,728,752 |
| Brandywine Operating Partnership LP, 5.700%, 5/1/17 | | 800,000 | | 802,405 | | - | | - | | | | | | 800,000 | | 802,405 |
| Brookfield Asset Management, Inc., 4.000%, 1/15/25 | | - | | - | | 1,935,000 | | 1,947,837 | (E) | | | | | 1,935,000 | | 1,947,837 |
| Camden Property Trust, 5.700%, 5/15/17 | | 400,000 | | 401,864 | | - | | - | | | | | | 400,000 | | 401,864 |
| Canadian Imperial Bank of Commerce/New York NY (Canada), 1.650%, 5/10/17(A) | | 5,000,000 | | 5,003,490 | | - | | - | | | | | | 5,000,000 | | 5,003,490 |
| Capital One Bank USA NA, 1.300%, 6/5/17 | | 2,700,000 | | 2,699,919 | | - | | - | | | | | | 2,700,000 | | 2,699,919 |
| Citibank NA, 1.490%, 3/20/19(A) | | 6,050,000 | | 6,051,149 | | - | | - | | | | | | 6,050,000 | | 6,051,149 |
| Citigroup, Inc., 1.800%, 2/5/18 | | 1,800,000 | | 1,800,925 | | - | | - | | | | | | 1,800,000 | | 1,800,925 |
| Credit Suisse/New York (Switzerland) MTN, 1.542%, 5/26/17(A) | | 4,800,000 | | 4,803,115 | | - | | - | | | | | | 4,800,000 | | 4,803,115 |
| DDR Corp., 7.500%, 4/1/17 | | 1,250,000 | | 1,250,000 | | - | | - | | | | | | 1,250,000 | | 1,250,000 |
| Equity Commonwealth, 5.875%, 9/15/20 | | 2,250,000 | | 2,415,240 | | - | | - | | | | | | 2,250,000 | | 2,415,240 |
| Equity Commonwealth, 6.650%, 1/15/18 | | 6,600,000 | | 6,687,391 | | - | | - | | | | | | 6,600,000 | | 6,687,391 |
| HCP, Inc., 5.625%, 5/1/17 | | 860,000 | | 862,552 | | - | | - | | | | | | 860,000 | | 862,552 |
| Highwoods Realty LP, 7.500%, 4/15/18 | | 1,790,000 | | 1,890,295 | | - | | - | | | | | | 1,790,000 | | 1,890,295 |
| HSBC Bank USA NA/New York NY, 6.000%, 8/9/17 | | 3,200,000 | | 3,247,069 | | - | | - | | | | | | 3,200,000 | | 3,247,069 |
| Icahn Enterprises LP, 5.875%, 2/1/22 | | - | | - | | 1,325,000 | | 1,344,875 | (E) | | | | | 1,325,000 | | 1,344,875 |
| JPMorgan Chase & Co, 2.700%, 5/18/23 | | - | | - | | 1,500,000 | | 1,467,114 | (E) | | | | | 1,500,000 | | 1,467,114 |
| JPMorgan Chase & Co, 2.950%, 10/1/26 | | - | | - | | 950,000 | | 903,137 | (E) | | | | | 950,000 | | 903,137 |
| JPMorgan Chase & Co., 6.125%, 6/27/17 | | 2,550,000 | | 2,576,770 | | - | | - | | | | | | 2,550,000 | | 2,576,770 |
| Mizuho Bank Ltd. (Japan), 144a 1.550%, 10/17/17 | | 2,800,000 | | 2,799,919 | | - | | - | | | | | | 2,800,000 | | 2,799,919 |
| Moody’s Corp., 1.414%, 9/4/18(A) | | 3,000,000 | | 3,005,199 | | - | | - | | | | | | 3,000,000 | | 3,005,199 |
| Morgan Stanley MTN, 6.250%, 8/28/17 | | 1,450,000 | | 1,477,769 | | - | | - | | | | | | 1,450,000 | | 1,477,769 |
| Mountain Agency, Inc. (The), 1.040%, 12/1/23(A) | | 8,685,000 | | 8,685,000 | | - | | - | | | | | | 8,685,000 | | 8,685,000 |
| Post Apartment Homes LP, 4.750%, 10/15/17 | | 500,000 | | 504,188 | | - | | - | | | | | | 500,000 | | 504,188 |
| Principal Life Global Funding II, 144a 1.500%, 4/18/19 | | 2,500,000 | | 2,478,858 | | - | | - | | | | | | 2,500,000 | | 2,478,858 |
| Prologis LP, 4.000%, 1/15/18 | | 865,000 | | 875,273 | | - | | - | | | | | | 865,000 | | 875,273 |
| Royal Bank of Canada (Canada) MTN, 2.125%, 3/2/20 | | 4,000,000 | | 4,000,172 | | - | | - | | | | | | 4,000,000 | | 4,000,172 |
| Royal Bank of Canada/New York NY (Canada), 1.489%, 7/28/17(A) | | 2,800,000 | | 2,804,060 | | - | | - | | | | | | 2,800,000 | | 2,804,060 |
| Simon Property Group LP, 144a 1.500%, 2/1/18 | | 2,210,000 | | 2,208,201 | | - | | - | | | | | | 2,210,000 | | 2,208,201 |
| State Street Corp., 5.375%, 4/30/17 | | 4,000,000 | | 4,011,172 | | - | | - | | | | | | 4,000,000 | | 4,011,172 |
| SunTrust Bank/Atlanta GA, 7.250%, 3/15/18 | | 4,977,000 | | 5,226,676 | | - | | - | | | | | | 4,977,000 | | 5,226,676 |
| UBS AG/Stamford CT (Switzerland) MTN, 1.375%, 8/14/17 | | 5,000,000 | | 5,001,360 | | - | | - | | | | | | 5,000,000 | | 5,001,360 |
| Ventas Realty LP, 1.250%, 4/17/17 | | 3,765,000 | | 3,764,977 | | - | | - | | | | | | 3,765,000 | | 3,764,977 |
| WEA Finance LLC / Westfield UK & Europe Finance PLC, 144a 1.750%, 9/15/17 | | 4,520,000 | | 4,521,116 | | - | | - | | | | | | 4,520,000 | | 4,521,116 |
| | | Touchstone Ultra Short
Duration Fixed Income
Fund | | Sentinel Low Duration
Bond Fund | | Pro Forma
Adjustments | | Proforma Combined
Touchstone Ultra Short
Duration Fixed Income
Fund |
| | | Principal
Amount | | Market
Value | | Principal
Amount | | Market
Value | | Principal
Amount | | Market
Value | | Principal
Amount | | Market
Value |
| XLIT Ltd. (Cayman Islands), 2.300%, 12/15/18 | | 2,600,000 | | 2,616,458 | | - | | - | | | | | | 2,600,000 | | 2,616,458 |
| | | | | 105,359,623 | | | | 8,072,946 | | | | | | | | 113,432,569 |
| | | | | | | | | | | | | | | | | |
| Utilities - 4.2% | | | | | | | | | | | | | | | | |
| Commonwealth Edison Co., 6.150%, 9/15/17 | | 280,000 | | 285,741 | | - | | - | | | | | | 280,000 | | 285,741 |
| Dominion Resources, Inc., 144a 1.500%, 9/30/18 | | 825,000 | | 817,232 | | - | | - | | | | | | 825,000 | | 817,232 |
| E.ON International Finance BV (Netherlands), 144a 5.800%, 4/30/18 | | 2,705,000 | | 2,811,923 | | - | | - | | | | | | 2,705,000 | | 2,811,923 |
| Electricite de France SA, 3.625%, 10/13/25 | | - | | - | | 850,000 | | 855,154 | (E) | | | | | 850,000 | | 855,154 |
| Exelon Corp., 1.550%, 6/9/17 | | 3,084,000 | | 3,084,093 | | - | | - | | | | | | 3,084,000 | | 3,084,093 |
| Georgia Power Co., 2.000%, 3/30/20 | | 5,000,000 | | 4,971,185 | | - | | - | | | | | | 5,000,000 | | 4,971,185 |
| ITC Holdings Corp., 144a 5.500%, 1/15/20 | | 700,000 | | 747,628 | | - | | - | | | | | | 700,000 | | 747,628 |
| Jersey Central Power & Light Co., 5.650%, 6/1/17 | | 9,000,000 | | 9,054,639 | | - | | - | | | | | | 9,000,000 | | 9,054,639 |
| Kentucky Power Co., 144a 6.000%, 9/15/17 | | 5,900,000 | | 6,010,867 | | - | | - | | | | | | 5,900,000 | | 6,010,867 |
| New York State Electric & Gas Corp., 144a 6.150%, 12/15/17 | | 800,000 | | 823,217 | | - | | - | | | | | | 800,000 | | 823,217 |
| NiSource Finance Corp., 5.250%, 9/15/17 | | 1,400,000 | | 1,419,827 | | - | | - | | | | | | 1,400,000 | | 1,419,827 |
| Oklahoma Gas & Electric Co., 6.500%, 7/15/17 | | 1,178,000 | | 1,192,954 | | - | | - | | | | | | 1,178,000 | | 1,192,954 |
| Oncor Electric Delivery Co. LLC, 5.000%, 9/30/17 | | 700,000 | | 712,285 | | - | | - | | | | | | 700,000 | | 712,285 |
| South Carolina Electric & Gas Co., 5.250%, 11/1/18 | | 900,000 | | 947,120 | | - | | - | | | | | | 900,000 | | 947,120 |
| Southern Electric Generating Co., 144a 2.200%, 12/1/18 | | 451,000 | | 453,918 | | - | | - | | | | | | 451,000 | | 453,918 |
| TECO Finance, Inc., 6.572%, 11/1/17 | | 650,000 | | 667,556 | | - | | - | | | | | | 650,000 | | 667,556 |
| United Utilities PLC (United Kingdom), 4.550%, 6/19/18 | | 4,500,000 | | 4,636,557 | | - | | - | | | | | | 4,500,000 | | 4,636,557 |
| West Penn Power Co., 144a 5.950%, 12/15/17 | | 1,255,000 | | 1,290,558 | | - | | - | | | | | | 1,255,000 | | 1,290,558 |
| | | | | 39,927,300 | | | | 855,154 | | | | | | | | 40,782,454 |
| | | | | | | | | | | | | | | | | |
| Industrials - 2.0% | | | | | | | | | | | | | | | | |
| Experian Finance PLC (United Kingdom), 144a 2.375%, 6/15/17 | | 4,404,000 | | 4,409,633 | | - | | - | | | | | | 4,404,000 | | 4,409,633 |
| Johnson Controls International PLC (Ireland), 1.400%, 11/2/17 | | 1,880,000 | | 1,876,195 | | - | | - | | | | | | 1,880,000 | | 1,876,195 |
| Norfolk Southern Corp., 7.700%, 5/15/17 | | 1,550,000 | | 1,560,965 | | - | | - | | | | | | 1,550,000 | | 1,560,965 |
| Penske Truck Leasing Co. LP / PTL Finance Corp., 144a 3.750%, 5/11/17 | | 1,000,000 | | 1,002,274 | | - | | - | | | | | | 1,000,000 | | 1,002,274 |
| SBA Tower Trust, 144a 2.898%, 10/15/19 | | 958,000 | | 960,977 | | - | | - | | | | | | 958,000 | | 960,977 |
| SBA Tower Trust, 144a 2.933%, 12/11/17 | | 3,555,000 | | 3,556,753 | | - | | - | | | | | | 3,555,000 | | 3,556,753 |
| Temple-Inland, Inc., 6.625%, 1/15/18 | | 6,200,000 | | 6,428,079 | | - | | - | | | | | | 6,200,000 | | 6,428,079 |
| | | | | 19,794,876 | | | | - | | | | | | | | 19,794,876 |
| | | | | | | | | | | | | | | | | |
| Consumer Non-Cyclical - 1.9% | | | | | | | | | | | | | | | | |
| Abbott Laboratories, 4.900%, 11/30/46 | | - | | - | | 850,000 | | 881,300 | (E) | | | | | 850,000 | | 881,300 |
| Altria Group, Inc., 2.850%, 8/9/22 | | - | | - | | 2,000,000 | | 2,003,814 | (E) | | | | | 2,000,000 | | 2,003,814 |
| Amgen, Inc., 3.625%, 5/22/24 | | - | | - | | 1,500,000 | | 1,537,101 | (E) | | | | | 1,500,000 | | 1,537,101 |
| Anheuser-Busch InBev Finance, Inc., 4.900%, 2/1/46 | | - | | - | | 950,000 | | 1,025,752 | (E) | | | | | 950,000 | | 1,025,752 |
| Anheuser-Busch InBev Worldwide, Inc., 3.750%, 1/15/22 | | - | | - | | 1,500,000 | | 1,570,797 | (E) | | | | | 1,500,000 | | 1,570,797 |
| DaVita, Inc., 5.125%, 7/15/24 | | - | | - | | 1,325,000 | | 1,338,250 | (E) | | | | | 1,325,000 | | 1,338,250 |
| HCA, Inc., 5.375%, 2/1/25 | | - | | - | | 1,325,000 | | 1,378,000 | (E) | | | | | 1,325,000 | | 1,378,000 |
| Kraft Foods Group, Inc., 3.500%, 6/6/22 | | - | | - | | 2,000,000 | | 2,045,618 | (E) | | | | | 2,000,000 | | 2,045,618 |
| Medtronic, Inc., 3.150%, 3/15/22 | | - | | - | | 1,500,000 | | 1,540,562 | (E) | | | | | 1,500,000 | | 1,540,562 |
| | | Touchstone Ultra Short
Duration Fixed Income
Fund | | Sentinel Low Duration
Bond Fund | | Pro Forma
Adjustments | | Proforma Combined
Touchstone Ultra Short
Duration Fixed Income
Fund |
| | | Principal
Amount | | Market
Value | | Principal
Amount | | Market
Value | | Principal
Amount | | Market
Value | | Principal
Amount | | Market
Value |
| Medtronic, Inc., 3.500%, 3/15/25 | | - | | - | | 950,000 | | 971,485 | (E) | | | | | 950,000 | | 971,485 |
| Molson Coors Brewing Co., 2.100%, 7/15/21 | | - | | - | | 2,000,000 | | 1,954,840 | (E) | | | | | 2,000,000 | | 1,954,840 |
| Thermo Fisher Scientific, Inc., 3.600%, 8/15/21 | | - | | - | | 2,000,000 | | 2,075,602 | (E) | | | | | 2,000,000 | | 2,075,602 |
| | | | | - | | | | 18,323,120 | | | | | | | | 18,323,120 |
| | | | | | | | | | | | | | | | | |
| Consumer Discretionary - 1.9% | | | | | | | | | | | | | | | | |
| Blue Hen Hotel LLC, 1.250%, 9/1/27(A) | | 6,250,000 | | 6,250,000 | | - | | - | | | | | | 6,250,000 | | 6,250,000 |
| Hasbro, Inc., 6.300%, 9/15/17 | | 3,300,000 | | 3,368,062 | | - | | - | | | | | | 3,300,000 | | 3,368,062 |
| Hyundai Capital America, 144a 4.000%, 6/8/17 | | 325,000 | | 326,328 | | - | | - | | | | | | 325,000 | | 326,328 |
| Lear Corp., 4.750%, 1/15/23 | | 4,900,000 | | 5,075,709 | | - | | - | | | | | | 4,900,000 | | 5,075,709 |
| Marriott International, Inc. MD, 6.375%, 6/15/17 | | 1,800,000 | | 1,817,150 | | - | | - | | | | | | 1,800,000 | | 1,817,150 |
| Newell Brands, Inc., 5.000%, 11/15/23 | | 1,000,000 | | 1,071,663 | | - | | - | | | | | | 1,000,000 | | 1,071,663 |
| | | | | 17,908,912 | | | | - | | | | | | | | 17,908,912 |
| | | | | | | | | | | | | | | | | |
| Consumer Cyclical - 1.8% | | | | | | | | | | | | | | | | |
| Amazon.com, Inc., 4.950%, 12/5/44 | | - | | - | | 950,000 | | 1,073,885 | (E) | | | | | 950,000 | | 1,073,885 |
| Ford Motor Credit Co LLC, 5.000%, 5/15/18 | | - | | - | | 3,500,000 | | 3,615,945 | (E) | | | | | 3,500,000 | | 3,615,945 |
| General Motors Financial Co., Inc., 3.200%, 7/6/21 | | - | | - | | 2,950,000 | | 2,960,903 | (E) | | | | | 2,950,000 | | 2,960,903 |
| General Motors Financial Co., Inc., 6.750%, 6/1/18 | | - | | - | | 3,000,000 | | 3,164,325 | (E) | | | | | 3,000,000 | | 3,164,325 |
| Macy’s Retail Holdings, Inc., 2.875%, 2/15/23 | | - | | - | | 850,000 | | 795,130 | (E) | | | | | 850,000 | | 795,130 |
| McDonald’s Corp., 2.750%, 12/9/20 | | - | | - | | 1,500,000 | | 1,519,952 | (E) | | | | | 1,500,000 | | 1,519,952 |
| McDonald’s Corp., 3.700%, 1/30/26 | | - | | - | | 950,000 | | 971,562 | (E) | | | | | 950,000 | | 971,562 |
| Walgreen Co., 3.100%, 9/15/22 | | - | | - | | 1,500,000 | | 1,509,495 | (E) | | | | | 1,500,000 | | 1,509,495 |
| Walgreens Boots Alliance, Inc., 3.450%, 6/1/26 | | - | | - | | 950,000 | | 926,084 | (E) | | | | | 950,000 | | 926,084 |
| Wynn Las Vegas LLC, 5.500%, 3/1/25 | | - | | - | | 1,325,000 | | 1,346,531 | (E) | | | | | 1,325,000 | | 1,346,531 |
| | | | | - | | | | 17,883,811 | | | | | | | | 17,883,811 |
| | | | | | | | | | | | | | | | | |
| Communications - 1.8% | | | | | | | | | | | | | | | | |
| America Movil SAB de CV, 6.125%, 3/30/40 | | - | | - | | 950,000 | | 1,108,062 | (E) | | | | | 950,000 | | 1,108,062 |
| American Tower Corp., 4.500%, 1/15/18 | | - | | - | | 3,750,000 | | 3,829,894 | (E) | | | | | 3,750,000 | | 3,829,894 |
| AT&T, Inc., 3.800%, 3/15/22 | | - | | - | | 2,708,000 | | 2,800,746 | (E) | | | | | 2,708,000 | | 2,800,746 |
| CCO Holdings LLC, 5.750%, 2/15/26 | | - | | - | | 1,325,000 | | 1,391,250 | (E) | | | | | 1,325,000 | | 1,391,250 |
| Comcast Corp., 2.350%, 1/15/27 | | - | | - | | 950,000 | | 870,061 | (E) | | | | | 950,000 | | 870,061 |
| Cox Communications, Inc., 3.350%, 9/15/26 | | - | | - | | 850,000 | | 822,269 | (E) | | | | | 850,000 | | 822,269 |
| Frontier Communications Corp., 11.000%, 9/15/25 | | - | | - | | 1,325,000 | | 1,284,422 | (E) | | | | | 1,325,000 | | 1,284,422 |
| SFR Group SA, 7.375%, 5/1/26 | | - | | - | | 1,325,000 | | 1,364,750 | (E) | | | | | 1,325,000 | | 1,364,750 |
| Sprint Corp., 7.875%, 9/15/23 | | - | | - | | 1,325,000 | | 1,467,438 | (E) | | | | | 1,325,000 | | 1,467,438 |
| Telesat Canada / Telesat LLC, 8.875%, 11/15/24 | | - | | - | | 1,325,000 | | 1,454,188 | (E) | | | | | 1,325,000 | | 1,454,188 |
| Time Warner, Inc., 3.800%, 2/15/27 | | - | | - | | 950,000 | | 939,537 | (E) | | | | | 950,000 | | 939,537 |
| | | | | - | | | | 17,332,616 | | | | | | | | 17,332,616 |
| | | | | | | | | | | | | | | | | |
| Consumer Staples - 1.7% | | | | | | | | | | | | | | | | |
| Bunge Ltd. Finance Corp., 3.200%, 6/15/17 | | 4,370,000 | | 4,384,688 | | - | | - | | | | | | 4,370,000 | | 4,384,688 |
| Constellation Brands, Inc., 3.875%, 11/15/19 | | 1,239,000 | | 1,290,561 | | - | | - | | | | | | 1,239,000 | | 1,290,561 |
| Constellation Brands, Inc., 7.250%, 5/15/17 | | 7,258,000 | | 7,298,325 | | - | | - | | | | | | 7,258,000 | | 7,298,325 |
| Diageo Capital PLC (United Kingdom), 1.500%, 5/11/17 | | 1,000,000 | | 1,000,040 | | - | | - | | | | | | 1,000,000 | | 1,000,040 |
| Reynolds American, Inc., 2.300%, 8/21/17 | | 500,000 | | 501,404 | | - | | - | | | | | | 500,000 | | 501,404 |
| RJ Reynolds Tobacco Co., 2.300%, 8/21/17 | | 1,500,000 | | 1,504,212 | | - | | - | | | | | | 1,500,000 | | 1,504,212 |
| | | | | 15,979,230 | | | | - | | | | | | | | 15,979,230 |
| | | Touchstone Ultra Short
Duration Fixed Income
Fund | | Sentinel Low Duration
Bond Fund | | Pro Forma
Adjustments | | Proforma Combined
Touchstone Ultra Short
Duration Fixed Income
Fund |
| | | Principal
Amount | | Market
Value | | Principal
Amount | | Market
Value | | Principal
Amount | | Market
Value | | Principal
Amount | | Market
Value |
| Health Care - 1.5% | | | | | | | | | | | | | | | | |
| Amgen, Inc., 1.430%, 5/22/17(A) | | 4,800,000 | | 4,802,314 | | - | | - | | | | | | 4,800,000 | | 4,802,314 |
| Catholic Health Initiatives, 1.600%, 11/1/17 | | 1,955,000 | | 1,952,955 | | - | | - | | | | | | 1,955,000 | | 1,952,955 |
| Dignity Health, 2.637%, 11/1/19 | | 7,700,000 | | 7,725,610 | | - | | - | | | | | | 7,700,000 | | 7,725,610 |
| | | | | 14,480,879 | | | | - | | | | | | | | 14,480,879 |
| | | | | | | | | | | | | | | | | |
| Information Technology - 1.1% | | | | | | | | | | | | | | | | |
| Diamond 1 Finance Corp. / Diamond 2 Finance Corp., 144a 3.480%, 6/1/19 | | 3,200,000 | | 3,279,078 | | - | | - | | | | | | 3,200,000 | | 3,279,078 |
| Fidelity National Information Services, Inc., 1.450%, 6/5/17 | | 2,040,000 | | 2,039,755 | | - | | - | | | | | | 2,040,000 | | 2,039,755 |
| Hewlett Packard Enterprise Co., 2.450%, 10/5/17 | | 4,850,000 | | 4,864,152 | | - | | - | | | | | | 4,850,000 | | 4,864,152 |
| | | | | 10,182,985 | | | | - | | | | | | | | 10,182,985 |
| | | | | | | | | | | | | | | | | |
| Telecommunication Services - 0.9% | | | | | | | | | | | | | | | | |
| BellSouth LLC, 144a 4.400%, 4/26/17 | | 4,000,000 | | 4,008,320 | | - | | - | | | | | | 4,000,000 | | 4,008,320 |
| Cox Communications, Inc., 144a 6.250%, 6/1/18 | | 2,435,000 | | 2,548,498 | | - | | - | | | | | | 2,435,000 | | 2,548,498 |
| Crown Castle Towers LLC, 144a 6.113%, 1/15/20 | | 406,000 | | 439,602 | | - | | - | | | | | | 406,000 | | 439,602 |
| DIRECTV Holdings LLC / DIRECTV Financing Co., Inc., 1.750%, 1/15/18 | | 2,000,000 | | 2,000,720 | | - | | - | | | | | | 2,000,000 | | 2,000,720 |
| | | | | 8,997,140 | | | | - | | | | | | | | 8,997,140 |
| | | | | | | | | | | | | | | | | |
| Capital Goods - 0.9% | | | | | | | | | | | | | | | | |
| Lockheed Martin Corp., 2.500%, 11/23/20 | | - | | - | | 1,500,000 | | 1,510,154 | (E) | | | | | 1,500,000 | | 1,510,154 |
| Lockheed Martin Corp., 3.550%, 1/15/26 | | - | | - | | 950,000 | | 964,330 | (E) | | | | | 950,000 | | 964,330 |
| Northrop Grumman Corp., 3.250%, 8/1/23 | | - | | - | | 2,000,000 | | 2,039,788 | (E) | | | | | 2,000,000 | | 2,039,788 |
| Reynolds Group Issuer LLC, 5.125%, 7/15/23 | | - | | - | | 1,325,000 | | 1,361,438 | (E) | | | | | 1,325,000 | | 1,361,438 |
| Rolls-Royce PLC, 3.625%, 10/14/25 | | - | | - | | 1,500,000 | | 1,508,685 | (E) | | | | | 1,500,000 | | 1,508,685 |
| United Technologies Corp., 2.650%, 11/1/26 | | - | | - | | 950,000 | | 915,654 | (E) | | | | | 950,000 | | 915,654 |
| | | | | - | | | | 8,300,048 | | | | | | | | 8,300,048 |
| | | | | | | | | | | | | | | | | |
| Technology - 0.8% | | | | | | | | | | | | | | | | |
| Broadcom Corp / Broadcom Cayman Finance Ltd., 3.000%, 1/15/22 | | - | | - | | 1,500,000 | | 1,495,485 | (E) | | | | | 1,500,000 | | 1,495,485 |
| KLA-Tencor Corp., 4.650%, 11/1/24 | | - | | - | | 850,000 | | 904,959 | (E) | | | | | 850,000 | | 904,959 |
| Microsoft Corp., 2.375%, 5/1/23 | | - | | - | | 1,500,000 | | 1,477,542 | (E) | | | | | 1,500,000 | | 1,477,542 |
| Microsoft Corp., 2.400%, 8/8/26 | | - | | - | | 950,000 | | 898,235 | (E) | | | | | 950,000 | | 898,235 |
| Nuance Communications, Inc., 5.625%, 12/15/26 | | - | | - | | 1,325,000 | | 1,354,813 | (E) | | | | | 1,325,000 | | 1,354,813 |
| QUALCOMM, Inc., 3.000%, 5/20/22 | | - | | - | | 2,000,000 | | 2,023,726 | (E) | | | | | 2,000,000 | | 2,023,726 |
| | | | | - | | | | 8,154,760 | | | | | | | | 8,154,760 |
| | | | | | | | | | | | | | | | | |
| Energy - 0.7% | | | | | | | | | | | | | | | | |
| BP Capital Markets PLC (United Kingdom), 1.846%, 5/5/17 | | 1,800,000 | | 1,800,873 | | - | | - | | | | | | 1,800,000 | | 1,800,873 |
| Cameron International Corp., 1.400%, 6/15/17 | | 775,000 | | 775,369 | | - | | - | | | | | | 775,000 | | 775,369 |
| Questar Pipeline LLC, 5.830%, 2/1/18 | | 800,000 | | 824,372 | | - | | - | | | | | | 800,000 | | 824,372 |
| Ras Laffan Liquefied Natural Gas Co. (Qatar), 6.750%, 9/30/19 | | 1,500,000 | | 1,661,250 | | - | | - | | | | | | 1,500,000 | | 1,661,250 |
| Ras Laffan Liquefied Natural Gas Co. Ltd. II (Qatar), 144a 5.298%, 9/30/20 | | 339,210 | | 356,320 | | - | | - | | | | | | 339,210 | | 356,320 |
| Sabine Pass Liquefaction LLC, 5.625%, 3/1/25 | | - | | - | | 1,325,000 | | 1,436,370 | (E) | | | | | 1,325,000 | | 1,436,370 |
| | | | | 5,418,184 | | | | 1,436,370 | | | | | | | | 6,854,554 |
| | | Touchstone Ultra Short
Duration Fixed Income
Fund | | Sentinel Low Duration
Bond Fund | | Pro Forma
Adjustments | | Proforma Combined
Touchstone Ultra Short
Duration Fixed Income
Fund |
| | | Principal
Amount | | Market
Value | | Principal
Amount | | Market
Value | | Principal
Amount | | Market
Value | | Principal
Amount | | Market
Value |
| Insurance - 0.7% | | | | | | | | | | | | | | | | |
| Chubb INA Holdings, Inc., 2.875%, 11/3/22 | | - | | - | | 1,500,000 | | 1,511,901 | (E) | | | | | 1,500,000 | | 1,511,901 |
| Chubb INA Holdings, Inc., 3.350%, 5/3/26 | | - | | - | | 950,000 | | 960,887 | (E) | | | | | 950,000 | | 960,887 |
| Jackson National Life Global Funding, 3.250%, 1/30/24 | | - | | - | | 1,500,000 | | 1,507,917 | (E) | | | | | 1,500,000 | | 1,507,917 |
| MetLife, Inc., 4.368%, 9/15/23 | | - | | - | | 1,500,000 | | 1,614,714 | (E) | | | | | 1,500,000 | | 1,614,714 |
| MetLife, Inc., 4.600%, 5/13/46 | | - | | - | | 950,000 | | 997,586 | (E) | | | | | 950,000 | | 997,586 |
| | | | | - | | | | 6,593,005 | | | | | | | | 6,593,005 |
| | | | | | | | | | | | | | | | | |
| Materials - 0.5% | | | | | | | | | | | | | | | | |
| Cabot Corp., 2.550%, 1/15/18 | | 4,900,000 | | 4,926,916 | | - | | - | | | | | | 4,900,000 | | 4,926,916 |
| Domtar Corp., 10.750%, 6/1/17 | | 300,000 | | 303,412 | | - | | - | | | | | | 300,000 | | 303,412 |
| | | | | 5,230,328 | | | | - | | | | | | | | 5,230,328 |
| | | | | | | | | | | | | | | | | |
| Media - 0.4% | | | | | | | | | | | | | | | | |
| CBS Corp., 3.375%, 3/1/22 | | - | | - | | 2,000,000 | | 2,040,514 | (E) | | | | | 2,000,000 | | 2,040,514 |
| Comcast Corp., 3.125%, 7/15/22 | | - | | - | | 1,500,000 | | 1,535,841 | (E) | | | | | 1,500,000 | | 1,535,841 |
| | | | | - | | | | 3,576,355 | | | | | | | | 3,576,355 |
| | | | | | | | | | | | | | | | | |
| Real Estate - 0.3% | | | | | | | | | | | | | | | | |
| HCP, Inc., 4.000%, 6/1/25 | | - | | - | | 850,000 | | 854,476 | (E) | | | | | 850,000 | | 854,476 |
| Simon Property Group LP, 2.350%, 1/30/22 | | - | | - | | 2,000,000 | | 1,966,366 | (E) | | | | | 2,000,000 | | 1,966,366 |
| | | | | - | | | | 2,820,842 | | | | | | | | 2,820,842 |
| | | | | | | | | | | | | | | | | |
| Transportation - 0.1% | | | | | | | | | | | | | | | | |
| XPO Logistics, Inc., 6.500%, 6/15/22 | | - | | - | | 1,325,000 | | 1,391,250 | (E) | | | | | 1,325,000 | | 1,391,250 |
| | | | | | | | | | | | | | | | | |
| Basic Industry - 0.1% | | | | | | | | | | | | | | | | |
| Int’l. Paper Co., 4.400%, 8/15/47 | | - | | - | | 850,000 | | 802,159 | (E) | | | | | 850,000 | | 802,159 |
| | | | | | | | | | | | | | | | | |
| Corporate Bonds Total | | | | 243,279,457 | | | | 95,542,436 | | | | | | | | 338,821,893 |
| | | | | | | | | | | | | | | | | |
| Asset-Backed Securities - 25.4% | | | | | | | | | | | | | | | | |
| Acis CLO, Ser 2013-2A, Class A, 144a 1.523%, 10/14/22(A) | | 504,474 | | 504,404 | | - | | - | | | | | | 504,474 | | 504,404 |
| American Credit Acceptance Receivables Trust, Ser 2013-2, Class D, 144a 5.920%, 8/17/20 | | 4,250,000 | | 4,299,104 | | - | | - | | | | | | 4,250,000 | | 4,299,104 |
| American Credit Acceptance Receivables Trust, Ser 2014-2, Class C, 144a 3.590%, 3/10/20 | | 4,919,902 | | 4,938,960 | | - | | - | | | | | | 4,919,902 | | 4,938,960 |
| American Credit Acceptance Receivables Trust, Ser 2014-3, Class D, 144a 4.700%, 11/10/21 | | 7,750,000 | | 7,868,418 | | - | | - | | | | | | 7,750,000 | | 7,868,418 |
| American Credit Acceptance Receivables Trust, Ser 2014-4, Class C, 144a 4.250%, 10/12/20 | | 4,875,000 | | 4,947,474 | | - | | - | | | | | | 4,875,000 | | 4,947,474 |
| American Credit Acceptance Receivables Trust, Ser 2015-3, Class A, 144a 1.950%, 9/12/19 | | 698,453 | | 698,491 | | - | | - | | | | | | 698,453 | | 698,491 |
| American Homes 4 Rent, Ser 2014-SFR1, Class A, 144a 1.943%, 6/17/31(A) | | 2,359,747 | | 2,360,481 | | - | | - | | | | | | 2,359,747 | | 2,360,481 |
| AmeriCredit Automobile Receivables Trust, Ser 2013-4, Class C, 2.720%, 9/9/19 | | 3,122,453 | | 3,134,638 | | - | | - | | | | | | 3,122,453 | | 3,134,638 |
| AmeriCredit Automobile Receivables, Ser 2013-2, Class C, 1.790%, 3/8/19 | | 1,366,385 | | 1,367,159 | | - | | - | | | | | | 1,366,385 | | 1,367,159 |
| | | Touchstone Ultra Short
Duration Fixed Income
Fund | | Sentinel Low Duration
Bond Fund | | Pro Forma
Adjustments | | Proforma Combined
Touchstone Ultra Short
Duration Fixed Income
Fund |
| | | Principal
Amount | | Market
Value | | Principal
Amount | | Market
Value | | Principal
Amount | | Market
Value | | Principal
Amount | | Market
Value |
| Ascentium Equipment Receivables Trust, Ser 2016-1A, Class A2, 144a 1.750%, 11/13/18 | | 4,070,761 | | 4,077,209 | | - | | - | | | | | | 4,070,761 | | 4,077,209 |
| Ascentium Equipment Receivables, Ser 2015-2A, Class D, 144a 3.440%, 10/12/21 | | 2,294,000 | | 2,327,473 | | - | | - | | | | | | 2,294,000 | | 2,327,473 |
| Bayview Financial Acquisition Trust, Ser 2004-C, Class M1, 1.958%, 5/28/44(A) | | 330,098 | | 330,326 | | - | | - | | | | | | 330,098 | | 330,326 |
| BlueMountain CLO II Ltd., Ser 2006-2A, Class A1, 144a 1.305%, 7/15/18(A) | | 2,358,194 | | 2,357,017 | | - | | - | | | | | | 2,358,194 | | 2,357,017 |
| BlueMountain CLO II Ltd., Ser 2006-2A, Class C, 144a 1.855%, 7/15/18(A) | | 4,420,000 | | 4,409,648 | | - | | - | | | | | | 4,420,000 | | 4,409,648 |
| BlueVirgo Trust, Ser 2015-1A, 144a 3.000%, 12/15/22 | | 3,251,675 | | 3,274,860 | | - | | - | | | | | | 3,251,675 | | 3,274,860 |
| California Republic Auto Receivables Trust, Ser 2013-2, Class C, 3.320%, 8/17/20 | | 3,345,000 | | 3,386,905 | | - | | - | | | | | | 3,345,000 | | 3,386,905 |
| Capital Auto Receivables Asset Trust, Ser 2014-1, Class E, 144a 4.090%, 9/22/22 | | 6,710,000 | | 6,806,361 | | - | | - | | | | | | 6,710,000 | | 6,806,361 |
| Capital Auto Receivables Asset Trust, Ser 2014-3, Class E, 3.940%, 4/20/23 | | 5,710,000 | | 5,792,852 | | - | | - | | | | | | 5,710,000 | | 5,792,852 |
| CarFinance Capital Auto Trust, Ser 2013-1A, Class B, 144a 2.750%, 11/15/18 | | 589,189 | | 590,054 | | - | | - | | | | | | 589,189 | | 590,054 |
| CarFinance Capital Auto Trust, Ser 2013-2A, Class D, 144a 5.930%, 8/15/19 | | 7,930,000 | | 8,133,718 | | - | | - | | | | | | 7,930,000 | | 8,133,718 |
| CarFinance Capital Auto Trust, Ser 2015-1A, Class A, 144a 1.750%, 6/15/21 | | 770,727 | | 770,987 | | - | | - | | | | | | 770,727 | | 770,987 |
| Cazenovia Creek Funding I LLC, Ser 2015-1A, Class A, 144a 2.000%, 12/10/23 | | 1,540,290 | | 1,529,700 | | - | | - | | | | | | 1,540,290 | | 1,529,700 |
| CCG Receivables Trust, Ser 2014-1, Class A2, 144a 1.060%, 11/15/21 | | 424,896 | | 424,703 | | - | | - | | | | | | 424,896 | | 424,703 |
| Chrysler Capital Auto Receivables Trust, Ser 2013-BA, Class D, 144a 2.890%, 10/15/20 | | 8,485,000 | | 8,518,096 | | - | | - | | | | | | 8,485,000 | | 8,518,096 |
| CNH Equipment Trust, Ser 2014-C, Class A3, 1.050%, 11/15/19 | | 1,819,500 | | 1,817,314 | | - | | - | | | | | | 1,819,500 | | 1,817,314 |
| College & University Facility Loan Trust, Ser 2, Class D, 4.000%, 6/1/18 | | 18,968 | | 18,968 | | - | | - | | | | | | 18,968 | | 18,968 |
| Countrywide Asset-Backed Certificates, Ser 2004-12, Class MV3, 1.972%, 3/25/35(A) | | 368,381 | | 368,437 | | - | | - | | | | | | 368,381 | | 368,437 |
| Credit Acceptance Auto Loan Trust, Ser 2014-2A, Class A, 144a 1.880%, 3/15/22 | | 10,905,676 | | 10,918,691 | | - | | - | | | | | | 10,905,676 | | 10,918,691 |
| Credit Acceptance Auto Loan Trust, Ser 2015-1A, Class A, 144a 2.000%, 7/15/22 | | 10,618,753 | | 10,637,038 | | - | | - | | | | | | 10,618,753 | | 10,637,038 |
| Credit-Based Asset Servicing and Securitization LLC, Ser 2006-SC1, Class A, 144a 1.252%, 5/25/36(A) | | 198,613 | | 197,820 | | - | | - | | | | | | 198,613 | | 197,820 |
| Dell Equipment Finance Trust, Ser 2015-1, Class D, 144a 2.840%, 9/22/20 | | 2,725,000 | | 2,728,512 | | - | | - | | | | | | 2,725,000 | | 2,728,512 |
| Dell Equipment Finance Trust, Ser 2015-2, Class C, 144a 2.750%, 9/22/20 | | 4,500,000 | | 4,517,446 | | - | | - | | | | | | 4,500,000 | | 4,517,446 |
| Dell Equipment Finance Trust, Ser 2016-1, Class A1, 144a 0.850%, 7/24/17 | | 123,083 | | 123,064 | | - | | - | | | | | | 123,083 | | 123,064 |
| Dell Equipment Finance Trust, Ser 2016-1, Class A2, 144a 1.430%, 9/24/18 | | 3,000,000 | | 3,000,139 | | - | | - | | | | | | 3,000,000 | | 3,000,139 |
| DT Auto Owner Trust, Ser 2015-1A, Class C, 144a 2.870%, 11/16/20 | | 5,991,380 | | 6,023,981 | | - | | - | | | | | | 5,991,380 | | 6,023,981 |
| | | Touchstone Ultra Short
Duration Fixed Income
Fund | | Sentinel Low Duration
Bond Fund | | Pro Forma
Adjustments | | Proforma Combined
Touchstone Ultra Short
Duration Fixed Income
Fund |
| | | Principal
Amount | | Market
Value | | Principal
Amount | | Market
Value | | Principal
Amount | | Market
Value | | Principal
Amount | | Market
Value |
| | | | | | | | | | | | | | | | | |
| Elara HGV Timeshare Issuer LLC, Ser 2014-A, Class A, 144a 2.530%, 2/25/27 | | 980,542 | | 974,712 | | - | | - | | | | | | 980,542 | | 974,712 |
| | | | | | | | | | | | | | | | | |
| Exeter Automobile Receivables Trust, Ser 2015-1A, Class A, 144a 1.600%, 6/17/19 | | 350,024 | | 349,950 | | - | | - | | | | | | 350,024 | | 349,950 |
| | | | | | | | | | | | | | | | | |
| First Investors Auto Owner Trust, Ser 2014-1A, Class B, 144a 2.260%, 1/15/20 | | 4,450,000 | | 4,461,767 | | - | | - | | | | | | 4,450,000 | | 4,461,767 |
| | | | | | | | | | | | | | | | | |
| First Investors Auto Owner Trust, Ser 2016-2A, Class A1, 144a 1.530%, 11/16/20 | | 1,945,752 | | 1,943,022 | | - | | - | | | | | | 1,945,752 | | 1,943,022 |
| | | | | | | | | | | | | | | | | |
| Flagship Credit Auto Trust, Ser 2016-3, Class A1, 144a 1.610%, 12/15/19 | | 2,664,833 | | 2,662,901 | | - | | - | | | | | | 2,664,833 | | 2,662,901 |
| | | | | | | | | | | | | | | | | |
| FNA 2015-1 Trust, Ser 2015-1, Class A, 144a 3.240%, 12/10/23 | | 1,471,090 | | 1,462,264 | | - | | - | | | | | | 1,471,090 | | 1,462,264 |
| | | | | | | | | | | | | | | | | |
| GLS Auto Receivables Trust, Ser 2016-1A, Class A, 144a 2.730%, 10/15/20 | | 3,165,259 | | 3,168,951 | | - | | - | | | | | | 3,165,259 | | 3,168,951 |
| | | | | | | | | | | | | | | | | |
| GreatAmerica Leasing Receivables Funding LLC Series, Ser 2016-1, Class A2, 144a 1.570%, 5/21/18 | | 4,053,972 | | 4,055,386 | | - | | - | | | | | | 4,053,972 | | 4,055,386 |
| | | | | | | | | | | | | | | | | |
| Keuka Park CLO Ltd 2013-1, 2.741%, 10/21/24 | | - | | - | | 750,000 | | 749,998 | (E) | | | | | 750,000 | | 749,998 |
| | | | | | | | | | | | | | | | | |
| Kingsland IV Ltd., Ser 2007-4A, Class C, 144a 1.673%, 4/16/21(A) | | 7,910,000 | | 7,788,906 | | - | | - | | | | | | 7,910,000 | | 7,788,906 |
| | | | | | | | | | | | | | | | | |
| Leaf Receivables Funding 11 LLC, Ser 2016-1, Class A2, 144a 1.720%, 7/15/18 | | 2,658,921 | | 2,656,688 | | - | | - | | | | | | 2,658,921 | | 2,656,688 |
| | | | | | | | | | | | | | | | | |
| MMAF Equipment Finance LLC, Ser 2012-AA, Class A4, 144a 1.350%, 10/10/18 | | 1,576 | | 1,576 | | - | | - | | | | | | 1,576 | | 1,576 |
| | | | | | | | | | | | | | | | | |
| Morgan Stanley ABS Capital I, Inc. Trust, Ser 2006-NC1, Class A4, 1.282%, 12/25/35(A) | | 2,271,614 | | 2,236,421 | | - | | - | | | | | | 2,271,614 | | 2,236,421 |
| | | | | | | | | | | | | | | | | |
| Navitas Equipment Receivables LLC, Ser 2016-1, Class A1, 144a 1.100%, 9/15/17 | | 2,173,620 | | 2,170,756 | | - | | - | | | | | | 2,173,620 | | 2,170,756 |
| | | | | | | | | | | | | | | | | |
| Navitas Equipment Receivables LLC, Ser 2016-1, Class A2, 144a 2.200%, 6/15/21 | | 6,600,000 | | 6,591,919 | | - | | - | | | | | | 6,600,000 | | 6,591,919 |
| | | | | | | | | | | | | | | | | |
| Nomad CLO Ltd., 2.223%, 1/15/25 | | - | | - | | 1,500,000 | | 1,499,994 | (E) | | | | | 1,500,000 | | 1,499,994 |
| | | | | | | | | | | | | | | | | |
| OneMain Direct Auto Receivables Trust, Ser 2016-1A, Class A, 144a 2.040%, 1/15/21 | | 2,955,269 | | 2,960,616 | | - | | - | | | | | | 2,955,269 | | 2,960,616 |
| | | | | | | | | | | | | | | | | |
| Orange Lake Timeshare Trust, Ser 2012-AA, Class A, 144a 3.450%, 3/10/27 | | 2,142,947 | | 2,161,210 | | - | | - | | | | | | 2,142,947 | | 2,161,210 |
| | | | | | | | | | | | | | | | | |
| Orange Lake Timeshare Trust, Ser 2014-AA, Class A, 144a 2.290%, 7/9/29 | | 1,023,535 | | 1,012,809 | | - | | - | | | | | | 1,023,535 | | 1,012,809 |
| | | | | | | | | | | | | | | | | |
| Park Place Securities, Inc. Asset Backed Pass Through Certificates, Ser 2005-WHQ3, Class M2, 1.657%, 6/25/35(A) | | 323,850 | | 323,511 | | - | | - | | | | | | 323,850 | | 323,511 |
| | | | | | | | | | | | | | | | | |
| Prestige Auto Receivables Trust, Ser 2014-1A, Class A3, 144a 1.520%, 4/15/20 | | 337,834 | | 337,825 | | - | | - | | | | | | 337,834 | | 337,825 |
| | | | | | | | | | | | | | | | | |
| Rockwall CDO II Ltd., Ser 2007-1A, Class A1LA, 144a 1.284%, 8/1/24(A) | | 4,742,289 | | 4,738,514 | | - | | - | | | | | | 4,742,289 | | 4,738,514 |
| | | | | | | | | | | | | | | | | |
| Santander Drive Auto Receivables Trust, Ser 2012-AA, Class D, 144a 2.460%, 12/17/18 | | 4,446,216 | | 4,454,896 | | - | | - | | | | | | 4,446,216 | | 4,454,896 |
| | | | | | | | | | | | | | | | | |
| Santander Drive Auto Receivables Trust, Ser 2013-1, Class C, 1.760%, 1/15/19 | | 539,664 | | 539,830 | | - | | - | | | | | | 539,664 | | 539,830 |
| | | | | | | | | | | | | | | | | |
| Santander Drive Auto Receivables Trust, Ser 2013-1, Class D, 2.270%, 1/15/19 | | 200,000 | | 200,467 | | - | | - | | | | | | 200,000 | | 200,467 |
| | | | | | | | | | | | | | | | | |
| Santander Drive Auto Receivables Trust, Ser 2013-2, Class C, 1.950%, 3/15/19 | | 1,409,120 | | 1,410,318 | | - | | - | | | | | | 1,409,120 | | 1,410,318 |
| | | | | | | | | | | | | | | | | |
| Santander Drive Auto Receivables Trust, Ser 2013-5, Class D, 2.730%, 10/15/19 | | 7,038,000 | | 7,105,203 | | - | | - | | | | | | 7,038,000 | | 7,105,203 |
| | | Touchstone Ultra Short
Duration Fixed Income
Fund | | Sentinel Low Duration
Bond Fund | | Pro Forma
Adjustments | | Proforma Combined
Touchstone Ultra Short
Duration Fixed Income
Fund |
| | | Principal
Amount | | Market
Value | | Principal
Amount | | Market
Value | | Principal
Amount | | Market
Value | | Principal
Amount | | Market
Value |
| | | | | | | | | | | | | | | | | |
| Santander Drive Auto Receivables Trust, Ser 2014-1, Class E, 3.920%, 5/17/21 | | 9,200,000 | | 9,335,023 | | - | | - | | | | | | 9,200,000 | | 9,335,023 |
| | | | | | | | | | | | | | | | | |
| Santander Drive Auto Receivables Trust, Ser 2015-1, Class B, 1.970%, 11/15/19 | | 1,709,696 | | 1,712,237 | | - | | - | | | | | | 1,709,696 | | 1,712,237 |
| | | | | | | | | | | | | | | | | |
| Securitized Equipment Receivables Trust, Ser 2017-1A, 2.760%, 12/13/22 | | 4,725,000 | | 4,717,394 | | - | | - | | | | | | 4,725,000 | | 4,717,394 |
| | | | | | | | | | | | | | | | | |
| Sierra Timeshare Receivables Funding LLC, Ser 2012-3A, Class A, 144a 1.870%, 8/20/29 | | 2,517,180 | | 2,514,949 | | - | | - | | | | | | 2,517,180 | | 2,514,949 |
| | | | | | | | | | | | | | | | | |
| Sierra Timeshare Receivables Funding LLC, Ser 2013-1A, Class A, 144a 1.590%, 11/20/29 | | 1,151,966 | | 1,148,928 | | - | | - | | | | | | 1,151,966 | | 1,148,928 |
| | | | | | | | | | | | | | | | | |
| Sierra Timeshare Receivables Funding LLC, Ser 2013-3A, Class A, 144a 2.200%, 10/20/30 | | 2,134,541 | | 2,134,346 | | - | | - | | | | | | 2,134,541 | | 2,134,346 |
| | | | | | | | | | | | | | | | | |
| Sierra Timeshare Receivables Funding LLC, Ser 2014-1A, Class A, 144a 2.070%, 3/20/30 | | 861,435 | | 860,607 | | - | | - | | | | | | 861,435 | | 860,607 |
| | | | | | | | | | | | | | | | | |
| Sierra Timeshare Receivables Funding LLC, Ser 2014-2A, Class A, 144a 2.050%, 6/20/31 | | 641,875 | | 640,861 | | - | | - | | | | | | 641,875 | | 640,861 |
| | | | | | | | | | | | | | | | | |
| Sierra Timeshare Receivables Funding LLC, Ser 2014-3A, Class A, 144a 2.300%, 10/20/31 | | 1,776,747 | | 1,777,349 | | - | | - | | | | | | 1,776,747 | | 1,777,349 |
| | | | | | | | | | | | | | | | | |
| Stoney Lane Funding I Corp., Ser 2007-1A, Class B, 144a 1.723%, 4/18/22(A) | | 1,830,000 | | 1,806,689 | | - | | - | | | | | | 1,830,000 | | 1,806,689 |
| | | | | | | | | | | | | | | | | |
| Taco Bell Funding, LLC, 144a, 3.832%, 5/25/26 | | - | | - | | 1,592,000 | | 1,613,834 | (E) | | | | | 1,592,000 | | 1,613,834 |
| | | | | | | | | | | | | | | | | |
| Tidewater Auto Receivables Trust, Ser 2016-AA, Class A2, 144a 2.300%, 9/15/19 | | 1,474,627 | | 1,474,185 | | - | | - | | | | | | 1,474,627 | | 1,474,185 |
| | | | | | | | | | | | | | | | | |
| United Auto Credit Securitization Trust, Ser 2016-2, Class A, 144a 1.670%, 9/10/18 | | 2,417,712 | | 2,419,244 | | - | | - | | | | | | 2,417,712 | | 2,419,244 |
| | | | | | | | | | | | | | | | | |
| Welk Resorts LLC, Ser 2013-AA, Class A, 144a 3.100%, 3/15/29 | | 3,281,657 | | 3,301,161 | | - | | - | | | | | | 3,281,657 | | 3,301,161 |
| | | | | | | | | | | | | | | | | |
| Westgate Resorts LLC, Ser 2015-1A, Class A, 144a 2.750%, 5/20/27 | | 2,066,421 | | 2,072,425 | | - | | - | | | | | | 2,066,421 | | 2,072,425 |
| | | | | | | | | | | | | | | | | |
| Westgate Resorts LLC, Ser 2016-1A, Class A, 144a 3.500%, 12/20/28 | | 5,715,712 | | 5,743,484 | | - | | - | | | | | | 5,715,712 | | 5,743,484 |
| | | | | | | | | | | | | | | | | |
| Westlake Automobile Receivables Trust, Ser 2014-2A, Class C, 144a 2.240%, 4/15/20 | | 4,040,554 | | 4,046,359 | | - | | - | | | | | | 4,040,554 | | 4,046,359 |
| | | | | | | | | | | | | | | | | |
| Westlake Automobile Receivables Trust, Ser 2015-2A, Class A2A, 144a 1.280%, 7/16/18 | | 148,416 | | 148,405 | | - | | - | | | | | | 148,416 | | 148,405 |
| | | | | | | | | | | | | | | | | |
| Westlake Automobile Receivables Trust, Ser 2016-1A, Class A2A, 144a 1.820%, 1/15/19 | | 411,140 | | 411,615 | | - | | - | | | | | | 411,140 | | 411,615 |
| | | | | | | | | | | | | | | | | |
| Westlake Automobile Receivables Trust, Ser 2016-1A, Class A2B, 144a 1.962%, 1/15/19(A) | | 2,119,878 | | 2,125,131 | | - | | - | | | | | | 2,119,878 | | 2,125,131 |
| | | | | | | | | | | | | | | | | |
| Westlake Automobile Receivables Trust, Ser 2016-2A, Class A2, 144a 1.570%, 6/17/19 | | 4,329,979 | | 4,331,153 | | - | | - | | | | | | 4,329,979 | | 4,331,153 |
| | | | | | | | | | | | | | | | | |
| Westwood CDO II Ltd., Ser 2007-2A, Class A1, 144a 1.258%, 4/25/22(A) | | 266,834 | | 266,774 | | - | | - | | | | | | 266,834 | | 266,774 |
| Asset-Backed Securities Total | | | | 241,959,185 | | | | 3,863,826 | | | | | | | | 245,823,011 |
| | | | | | | | | | | | | | | | | |
| U.S. Government Mortgage-Backed Obligations - 13.6% | | | | | | | | | | | | | | | | |
| FED HOME LN DISCOUNT NT, 0.600%, 4/4/17 | | - | | - | | 21,000,000 | | 20,998,950 | (E) | | | | | 21,000,000 | | 20,998,950 |
| FHLMC, 1B1580, 3.086%, 3/1/34(A) | | 144,193 | | 154,033 | | - | | - | | | | | | 144,193 | | 154,033 |
| FHLMC, 1B2629, 3.250%, 11/1/34(A) | | 150,968 | | 160,418 | | - | | - | | | | | | 150,968 | | 160,418 |
| FHLMC, 1B7189, 3.806%, 3/1/36(A) | | 420,026 | | 448,077 | | - | | - | | | | | | 420,026 | | 448,077 |
| FHLMC, 1G1471, 3.170%, 1/1/37(A) | | 124,888 | | 131,894 | | - | | - | | | | | | 124,888 | | 131,894 |
| | | Touchstone Ultra Short
Duration Fixed Income
Fund | | Sentinel Low Duration
Bond Fund | | Pro Forma
Adjustments | | Proforma Combined
Touchstone Ultra Short
Duration Fixed Income
Fund |
| | | Principal
Amount | | Market
Value | | Principal
Amount | | Market
Value | | Principal
Amount | | Market
Value | | Principal
Amount | | Market
Value |
| | | | | | | | | | | | | | | | | |
| FHLMC, 1H1354, 2.791%, 11/1/36(A) | | 788,197 | | 835,979 | | - | | - | | | | | | 788,197 | | 835,979 |
| FHLMC, 1H2524, 2.868%, 8/1/35(A) | | 81,950 | | 86,597 | | - | | - | | | | | | 81,950 | | 86,597 |
| FHLMC, 1J1813, 3.175%, 8/1/37(A) | | 435,251 | | 463,303 | | - | | - | | | | | | 435,251 | | 463,303 |
| FHLMC, 1K1238, 2.783%, 7/1/36(A) | | 290,814 | | 308,487 | | - | | - | | | | | | 290,814 | | 308,487 |
| FHLMC, 1L0087, 2.756%, 6/1/35(A) | | 172,648 | | 181,866 | | - | | - | | | | | | 172,648 | | 181,866 |
| FHLMC, 1L0147, 2.803%, 7/1/35(A) | | 380,432 | | 403,216 | | - | | - | | | | | | 380,432 | | 403,216 |
| FHLMC, 1L1288, 2.879%, 5/1/36(A) | | 247,845 | | 262,329 | | - | | - | | | | | | 247,845 | | 262,329 |
| FHLMC, 1Q0080, 2.946%, 1/1/36(A) | | 197,284 | | 208,171 | | - | | - | | | | | | 197,284 | | 208,171 |
| FHLMC, 1Q0119, 3.074%, 9/1/36(A) | | 464,298 | | 493,677 | | - | | - | | | | | | 464,298 | | 493,677 |
| FHLMC, 1Q0187, 3.110%, 12/1/36(A) | | 885,816 | | 942,952 | | - | | - | | | | | | 885,816 | | 942,952 |
| FHLMC, 1Q0339, 3.312%, 4/1/37(A) | | 534,434 | | 565,589 | | - | | - | | | | | | 534,434 | | 565,589 |
| FHLMC, 1Q0669, 3.116%, 11/1/37(A) | | 149,743 | | 157,659 | | - | | - | | | | | | 149,743 | | 157,659 |
| FHLMC, 1Q1303, 2.796%, 11/1/36(A) | | 620,475 | | 657,647 | | - | | - | | | | | | 620,475 | | 657,647 |
| FHLMC, 781515, 2.829%, 4/1/34(A) | | 770,647 | | 814,958 | | - | | - | | | | | | 770,647 | | 814,958 |
| FHLMC, 782760, 2.787%, 11/1/36(A) | | 327,329 | | 347,068 | | - | | - | | | | | | 327,329 | | 347,068 |
| FHLMC, 847795, 2.827%, 4/1/35(A) | | 276,016 | | 291,216 | | - | | - | | | | | | 276,016 | | 291,216 |
| FHLMC, 848088, 2.900%, 4/1/35(A) | | 165,209 | | 174,835 | | - | | - | | | | | | 165,209 | | 174,835 |
| FHLMC, 848539, 2.877%, 4/1/37(A) | | 535,187 | | 572,185 | | - | | - | | | | | | 535,187 | | 572,185 |
| FHLMC, 848583, 2.898%, 1/1/36(A) | | 1,350,869 | | 1,427,838 | | - | | - | | | | | | 1,350,869 | | 1,427,838 |
| FHLMC, A92646, 5.500%, 6/1/40 | | 19,022 | | 21,608 | | - | | - | | | | | | 19,022 | | 21,608 |
| FHLMC, C03505, 5.500%, 6/1/40 | | 17,748 | | 19,700 | | - | | - | | | | | | 17,748 | | 19,700 |
| FHLMC, C66916, 7.000%, 5/1/32 | | 70,172 | | 78,803 | | - | | - | | | | | | 70,172 | | 78,803 |
| FHLMC, D94230, 7.500%, 10/1/19 | | - | | - | | 1,372 | | 1,374 | (E) | | | | | 1,372 | | 1,374 |
| FHLMC, D94598, 6.500%, 4/1/21 | | 14,453 | | 15,291 | | - | | - | | | | | | 14,453 | | 15,291 |
| FHLMC, G00100, 8.000%, 2/1/23 | | - | | - | | 2,641 | | 2,938 | (E) | | | | | 2,641 | | 2,938 |
| FHLMC, G01840, 5.000%, 7/1/35 | | 57,434 | | 63,104 | | - | | - | | | | | | 57,434 | | 63,104 |
| FHLMC, G11769, 5.000%, 10/1/20 | | 600,544 | | 623,452 | | - | | - | | | | | | 600,544 | | 623,452 |
| FHLMC, G11773, 5.000%, 10/1/20 | | 384,114 | | 398,930 | | - | | - | | | | | | 384,114 | | 398,930 |
| FHLMC, G30085, 7.500%, 10/1/17 | | 1,491 | | 1,497 | | - | | - | | | | | | 1,491 | | 1,497 |
| FHLMC, J05907, 6.000%, 8/1/19 | | - | | - | | 388,907 | | 396,846 | (E) | | | | | 388,907 | | 396,846 |
| FHLMC, J10895, 4.000%, 10/1/19 | | 198,208 | | 205,091 | | - | | - | | | | | | 198,208 | | 205,091 |
| FHR, 2927 ED, 4.000%, 1/15/35 | | - | | - | | 144,671 | | 145,988 | (E) | | | | | 144,671 | | 145,988 |
| FHR, 3874 BD, 3.000%, 6/15/21 | | - | | - | | 2,394,609 | | 2,435,063 | (E) | | | | | 2,394,609 | | 2,435,063 |
| FHR, 4022 AH, 1.500%, 12/15/25 | | - | | - | | 26,823,349 | | 26,329,894 | (E) | | | | | 26,823,349 | | 26,329,894 |
| FHR, 4039 PB, 1.500%, 5/15/27 | | - | | - | | 14,721,348 | | 14,334,847 | (E) | | | | | 14,721,348 | | 14,334,847 |
| FHR, 4238 TL, 1.250%, 8/15/27 | | - | | - | | 6,663,505 | | 6,432,566 | (E) | | | | | 6,663,505 | | 6,432,566 |
| FNMA, 175123, 7.450%, 8/1/22 | | - | | - | | 73,433 | | 76,167 | (E) | | | | | 73,433 | | 76,167 |
| FNMA, 207530, 8.250%, 4/1/22 | | - | | - | | 5,874 | | 5,891 | (E) | | | | | 5,874 | | 5,891 |
| FNMA, 254868, 5.000%, 9/1/33 | | 181,004 | | 198,463 | | - | | - | | | | | | 181,004 | | 198,463 |
| FNMA, 256272, 5.500%, 6/1/26 | | 85,106 | | 94,450 | | - | | - | | | | | | 85,106 | | 94,450 |
| FNMA, 256852, 6.000%, 8/1/27 | | 146,520 | | 165,459 | | - | | - | | | | | | 146,520 | | 165,459 |
| FNMA, 323832, 7.500%, 7/1/29 | | 32,181 | | 37,664 | | - | | - | | | | | | 32,181 | | 37,664 |
| FNMA, 334593, 7.000%, 5/1/24 | | 2,483 | | 2,727 | | - | | - | | | | | | 2,483 | | 2,727 |
| FNMA, 555380, 3.123%, 4/1/33(A) | | 155,533 | | 163,825 | | - | | - | | | | | | 155,533 | | 163,825 |
| FNMA, 665773, 7.500%, 6/1/31 | | 58,183 | | 60,132 | | - | | - | | | | | | 58,183 | | 60,132 |
| FNMA, 671380, 6.000%, 11/1/17 | | - | | - | | 2,358 | | 2,365 | (E) | | | | | 2,358 | | 2,365 |
| FNMA, 679742, 3.032%, 1/1/40(A) | | 115,385 | | 119,025 | | - | | - | | | | | | 115,385 | | 119,025 |
| FNMA, 681842, 2.901%, 2/1/33(A) | | 80,031 | | 83,903 | | - | | - | | | | | | 80,031 | | 83,903 |
| FNMA, 681898, 2.756%, 4/1/33(A) | | 161,660 | | 170,134 | | - | | - | | | | | | 161,660 | | 170,134 |
| FNMA, 725245, 2.762%, 2/1/34(A) | | 193,557 | | 203,986 | | - | | - | | | | | | 193,557 | | 203,986 |
| FNMA, 725284, 7.000%, 11/1/18 | | - | | - | | 2,149 | | 2,164 | (E) | | | | | 2,149 | | 2,164 |
| FNMA, 725424, 5.500%, 4/1/34 | | 201,181 | | 225,288 | | - | | - | | | | | | 201,181 | | 225,288 |
| FNMA, 725490, 2.760%, 4/1/34(A) | | 1,269,750 | | 1,354,456 | | - | | - | | | | | | 1,269,750 | | 1,354,456 |
| | | Touchstone Ultra Short
Duration Fixed Income
Fund | | Sentinel Low Duration
Bond Fund | | Pro Forma
Adjustments | | Proforma Combined
Touchstone Ultra Short
Duration Fixed Income
Fund |
| | | Principal
Amount | | Market
Value | | Principal
Amount | | Market
Value | | Principal
Amount | | Market
Value | | Principal
Amount | | Market
Value |
| | | | | | | | | | | | | | | | | |
| FNMA, 735439, 6.000%, 9/1/19 | | 60,292 | | 61,762 | | - | | - | | | | | | 60,292 | | 61,762 |
| FNMA, 735539, 2.927%, 4/1/35(A) | | 149,088 | | 157,145 | | - | | - | | | | | | 149,088 | | 157,145 |
| FNMA, 743207, 2.912%, 10/1/33(A) | | 82,890 | | 86,670 | | - | | - | | | | | | 82,890 | | 86,670 |
| FNMA, 745467, 3.387%, 4/1/36(A) | | 48,745 | | 51,360 | | - | | - | | | | | | 48,745 | | 51,360 |
| FNMA, 745790, 2.743%, 8/1/36(A) | | 67,590 | | 71,195 | | - | | - | | | | | | 67,590 | | 71,195 |
| FNMA, 761411, 4.500%, 5/1/19 | | 340,576 | | 349,288 | | - | | - | | | | | | 340,576 | | 349,288 |
| FNMA, 784365, 2.799%, 5/1/34(A) | | 106,237 | | 110,434 | | - | | - | | | | | | 106,237 | | 110,434 |
| FNMA, 791978, 2.817%, 9/1/34(A) | | 248,780 | | 259,014 | | - | | - | | | | | | 248,780 | | 259,014 |
| FNMA, 804001, 2.721%, 10/1/34(A) | | 89,728 | | 94,227 | | - | | - | | | | | | 89,728 | | 94,227 |
| FNMA, 809897, 3.192%, 3/1/35(A) | | 56,196 | | 59,716 | | - | | - | | | | | | 56,196 | | 59,716 |
| FNMA, 813170, 3.200%, 1/1/35(A) | | 223,295 | | 233,637 | | - | | - | | | | | | 223,295 | | 233,637 |
| FNMA, 815323, 2.787%, 1/1/35(A) | | 1,157,955 | | 1,203,895 | | - | | - | | | | | | 1,157,955 | | 1,203,895 |
| FNMA, 820364, 2.095%, 4/1/35(A) | | 201,958 | | 208,624 | | - | | - | | | | | | 201,958 | | 208,624 |
| FNMA, 827787, 2.799%, 5/1/35(A) | | 579,092 | | 602,350 | | - | | - | | | | | | 579,092 | | 602,350 |
| FNMA, 828480, 2.980%, 6/1/35(A) | | 80,544 | | 85,702 | | - | | - | | | | | | 80,544 | | 85,702 |
| FNMA, 839239, 3.010%, 9/1/35(A) | | 132,927 | | 140,539 | | - | | - | | | | | | 132,927 | | 140,539 |
| FNMA, 888179, 3.406%, 2/1/37(A) | | 107,597 | | 114,285 | | - | | - | | | | | | 107,597 | | 114,285 |
| FNMA, 888548, 2.787%, 5/1/35(A) | | 68,175 | | 71,791 | | - | | - | | | | | | 68,175 | | 71,791 |
| FNMA, 889060, 6.000%, 1/1/38 | | 121,182 | | 137,960 | | - | | - | | | | | | 121,182 | | 137,960 |
| FNMA, 889061, 6.000%, 1/1/38 | | 116,038 | | 133,876 | | - | | - | | | | | | 116,038 | | 133,876 |
| FNMA, 889382, 5.500%, 4/1/38 | | 7,525 | | 8,519 | | - | | - | | | | | | 7,525 | | 8,519 |
| FNMA, 922674, 3.368%, 4/1/36(A) | | 420,803 | | 448,372 | | - | | - | | | | | | 420,803 | | 448,372 |
| FNMA, 931676, 5.500%, 1/1/19 | | 182,707 | | 186,833 | | - | | - | | | | | | 182,707 | | 186,833 |
| FNMA, 950385, 2.277%, 8/1/37(A) | | 205,961 | | 211,127 | | - | | - | | | | | | 205,961 | | 211,127 |
| FNMA, 960376, 5.500%, 12/1/37 | | 60,721 | | 67,613 | | - | | - | | | | | | 60,721 | | 67,613 |
| FNMA, 985670, 6.500%, 10/1/21 | | - | | - | | 334,510 | | 352,718 | (E) | | | | | 334,510 | | 352,718 |
| FNMA, 995284, 5.500%, 3/1/20 | | 8,587 | | 8,655 | | - | | - | | | | | | 8,587 | | 8,655 |
| FNMA, AA1150, 4.000%, 4/1/23 | | 502,856 | | 519,822 | | - | | - | | | | | | 502,856 | | 519,822 |
| FNMA, AD0941, 5.500%, 4/1/40 | | 11,796 | | 13,415 | | - | | - | | | | | | 11,796 | | 13,415 |
| FNMA, AE0363, 5.000%, 7/1/37 | | 90,857 | | 99,430 | | - | | - | | | | | | 90,857 | | 99,430 |
| FNMA, AE0727, 4.000%, 10/1/20 | | 241,196 | | 249,334 | | - | | - | | | | | | 241,196 | | 249,334 |
| FNMA, AE5441, 5.000%, 10/1/40 | | 123,218 | | 134,824 | | - | | - | | | | | | 123,218 | | 134,824 |
| FNMA, AI6588, 4.000%, 7/1/26 | | 206,895 | | 217,873 | | - | | - | | | | | | 206,895 | | 217,873 |
| FNMA, AI8506, 4.000%, 8/1/26 | | 216,806 | | 228,449 | | - | | - | | | | | | 216,806 | | 228,449 |
| FNMA, AL0211, 5.000%, 4/1/41 | | 202,072 | | 220,969 | | - | | - | | | | | | 202,072 | | 220,969 |
| FNMA, AL0302, 5.000%, 4/1/24 | | 33,940 | | 36,140 | | - | | - | | | | | | 33,940 | | 36,140 |
| FNMA, AL0478, 3.149%, 4/1/36(A) | | 1,299,128 | | 1,379,021 | | - | | - | | | | | | 1,299,128 | | 1,379,021 |
| FNMA, AL0543, 5.000%, 7/1/41 | | 339,365 | | 373,541 | | - | | - | | | | | | 339,365 | | 373,541 |
| FNMA, AL1105, 4.500%, 12/1/40 | | 182,373 | | 197,400 | | - | | - | | | | | | 182,373 | | 197,400 |
| FNMA, AL2591, 5.500%, 5/1/38 | | 77,332 | | 81,817 | | - | | - | | | | | | 77,332 | | 81,817 |
| FNMA, AL5275, 2.708%, 9/1/37(A) | | 835,359 | | 869,725 | | - | | - | | | | | | 835,359 | | 869,725 |
| FNMA, AL7396, 2.779%, 2/1/37(A) | | 4,050,828 | | 4,213,184 | | - | | - | | | | | | 4,050,828 | | 4,213,184 |
| FNMA, 735484, 5.000%, 5/1/35 | | 35,542 | | 38,889 | | - | | - | | | | | | 35,542 | | 38,889 |
| FNR, 09-32 BH, 5.250%, 5/25/39 | | - | | - | | 934,369 | | 994,889 | (E) | | | | | 934,369 | | 994,889 |
| FNR, 10-64 AD, 3.000%, 12/25/20 | | - | | - | | 14,720,942 | | 14,913,697 | (E) | | | | | 14,720,942 | | 14,913,697 |
| FNR, 11-15 HC, 2.500%, 3/25/26 | | - | | - | | 5,036,168 | | 5,066,334 | (E) | | | | | 5,036,168 | | 5,066,334 |
| FNR, 11-67 DA, 4.500%, 7/25/21 | | - | | - | | 3,990,579 | | 4,087,836 | (E) | | | | | 3,990,579 | | 4,087,836 |
| FNR, 12-47 AI Interest Only, 3.000%, 5/25/22 | | - | | - | | 4,449,453 | | 210,380 | (E) | | | | | 4,449,453 | | 210,380 |
| GNMA, 344233, 8.000%, 2/15/23 | | 12,693 | | 13,646 | | - | | - | | | | | | 12,693 | | 13,646 |
| GNMA, 345123, 8.000%, 12/15/23 | | 59,224 | | 64,362 | | - | | - | | | | | | 59,224 | | 64,362 |
| GNMA, 569337, 6.500%, 4/15/22 | | 6,098 | | 6,494 | | - | | - | | | | | | 6,098 | | 6,494 |
| GNMA, 628440, 7.000%, 4/15/24 | | - | | - | | 16,222 | | 16,215 | (E) | | | | | 16,222 | | 16,215 |
| GNMA, 780322, 8.000%, 11/15/22 | | 14,563 | | 16,033 | | - | | - | | | | | | 14,563 | | 16,033 |
| | | Touchstone Ultra Short
Duration Fixed Income
Fund | | Sentinel Low Duration
Bond Fund | | Pro Forma
Adjustments | | Proforma Combined
Touchstone Ultra Short
Duration Fixed Income
Fund |
| | | Principal
Amount | | Market
Value | | Principal
Amount | | Market
Value | | Principal
Amount | | Market
Value | | Principal
Amount | | Market
Value |
| | | | | | | | | | | | | | | | | |
| GNMA, 780327, 8.000%, 11/15/17 | | 33 | | 33 | | - | | - | | | | | | 33 | | 33 |
| GNMA, 80826, 2.000%, 2/20/34(A) | | 614,385 | | 637,110 | | - | | - | | | | | | 614,385 | | 637,110 |
| GNMA, 80889, 2.125%, 4/20/34(A) | | 265,747 | | 275,951 | | - | | - | | | | | | 265,747 | | 275,951 |
| GNMA, 81016, 2.125%, 8/20/34(A) | | 453,146 | | 469,698 | | - | | - | | | | | | 453,146 | | 469,698 |
| GNMA, 814, 8.000%, 8/20/17 | | 434 | | 435 | | - | | - | | | | | | 434 | | 435 |
| GNMA, 82760, 2.000%, 3/20/41(A) | | 996,030 | | 1,027,179 | | - | | - | | | | | | 996,030 | | 1,027,179 |
| GNMA, 8426, 3.000%, 11/20/18(A) | | 1,485 | | 1,487 | | - | | - | | | | | | 1,485 | | 1,487 |
| GNMA, MA2392, 2.000%, 11/20/44(A) | | 873,384 | | 899,880 | | - | | - | | | | | | 873,384 | | 899,880 |
| GNMA, MA2466, 2.000%, 12/20/44(A) | | 3,227,261 | | 3,331,460 | | - | | - | | | | | | 3,227,261 | | 3,331,460 |
| U.S. Government Mortgage-Backed Obligations Total | | | | 35,179,172 | | | | 96,807,122 | | | | | | | | 131,986,294 |
| | | | | | | | | | | | | | | | | |
| Commercial Mortgage-Backed Securities - 5.4% | | | | | | | | | | | | | | | | |
| | | | | | | | | | | | | | | | | |
| BAMLL Re-REMIC Trust, Ser 2014-FRR7, Class A, 144a 3.232%, 10/26/44(A) | | 6,344,522 | | 6,341,345 | | - | | - | | | | | | 6,344,522 | | 6,341,345 |
| | | | | | | | | | | | | | | | | |
| CD Mortgage Trust, Ser 2006-CD3, Class AM, 5.648%, 10/15/48 | | 4,069,402 | | 4,150,526 | | - | | - | | | | | | 4,069,402 | | 4,150,526 |
| | | | | | | | | | | | | | | | | |
| CDGJ Commercial Mortgage Trust, Ser 2014-BXCH, Class B, 144a 2.762%, 12/15/27(A) | | 5,645,000 | | 5,648,528 | | - | | - | | | | | | 5,645,000 | | 5,648,528 |
| | | | | | | | | | | | | | | | | |
| COMM Mortgage Trust, Ser 2016-SAVA, Class A, 144a 2.632%, 10/15/34(A) | | 5,042,000 | | 5,067,272 | | - | | - | | | | | | 5,042,000 | | 5,067,272 |
| | | | | | | | | | | | | | | | | |
| Commercial Mortgage Loan Trust, Ser 2008-LS1, Class A4B, 6.101%, 12/10/49(A) | | 3,060,746 | | 3,091,117 | | - | | - | | | | | | 3,060,746 | | 3,091,117 |
| | | | | | | | | | | | | | | | | |
| DBRR Trust, Ser 2013-EZ3, Class A, 144a 1.636%, 12/18/49(A) | | 229,146 | | 228,959 | | - | | - | | | | | | 229,146 | | 228,959 |
| | | | | | | | | | | | | | | | | |
| DBUBS Mortgage Trust, Ser 2011-LC2A, Class A1FL, 144a 2.208%, 7/12/44(A) | | 1,042,123 | | 1,055,672 | | - | | - | | | | | | 1,042,123 | | 1,055,672 |
| | | | | | | | | | | | | | | | | |
| EQTY Mortgage Trust, Ser 2014-INNS, Class A, 144a 1.697%, 5/8/31(A) | | 7,373,536 | | 7,380,453 | | - | | - | | | | | | 7,373,536 | | 7,380,453 |
| | | | | | | | | | | | | | | | | |
| FDIC Guaranteed Notes, Ser 2010-C1, Class A, 144a 2.980%, 12/6/20 | | 34,533 | | 34,722 | | - | | - | | | | | | 34,533 | | 34,722 |
| | | | | | | | | | | | | | | | | |
| Hyatt Hotel Portfolio Trust, Ser 2015-HYT, Class A, 144a 2.162%, 11/15/29(A) | | 4,965,000 | | 4,977,359 | | - | | - | | | | | | 4,965,000 | | 4,977,359 |
| | | | | | | | | | | | | | | | | |
| JP Morgan Chase Commercial Mortgage Securities Trust, Ser 2014-INN, Class D, 144a 3.262%, 6/15/29(A) | | 6,050,000 | | 6,050,001 | | - | | - | | | | | | 6,050,000 | | 6,050,001 |
| | | | | | | | | | | | | | | | | |
| PFP Ltd., Ser 2015-2, Class A, 144a 2.378%, 7/14/34(A) | | 1,914,554 | | 1,913,617 | | - | | - | | | | | | 1,914,554 | | 1,913,617 |
| | | | | | | | | | | | | | | | | |
| UBS-Citigroup Commercial Mortgage Trust, Ser 2011-C1, Class XA, 144a 2.263%, 1/10/45(A)(B) | | 15,609,693 | | 1,301,408 | | - | | - | | | | | | 15,609,693 | | 1,301,408 |
| | | | | | | | | | | | | | | | | |
| Wells Fargo Commercial Mortgage Trust, Ser 2014-TISH, Class B, 144a 2.262%, 2/15/27(A) | | 5,000,000 | | 5,016,130 | | - | | - | | | | | | 5,000,000 | | 5,016,130 |
| Commercial Mortgage-Backed Securities Total | | | | 52,257,109 | | | | - | | | | | | | | 52,257,109 |
| | | | | | | | | | | | | | | | | |
| U.S. Treasury Obligations - 5.2% | | | | | | | | | | | | | | | | |
| Treasury Bill, 0.350%, 4/6/17 | | - | | - | | 50,000,000 | | 49,997,569 | (E) | | | | | 50,000,000 | | 49,997,569 |
| | | | | | | | | | | | | | | | | |
| | | Shares | | | | Shares | | | | Shares | | | | Shares | | |
| Exchange Traded Funds - 4.3% | | | | | | | | | | | | | | | | |
| iShares 0-5 Year High Yield Corporate Bond ETF | | - | | - | | 33,400 | | 1,595,852 | (E) | | | | | 33,400 | | 1,595,852 |
| iShares iBoxx $ Investment Grade Corporate Bond ETF | | - | | - | | 90,627 | | 10,685,830 | (E) | | | | | 90,627 | | 10,685,830 |
| SPDR Barclays Intermediate Term Corporate Bond ETF | | - | | - | | 445,627 | | 15,209,250 | (E) | | | | | 445,627 | | 15,209,250 |
| SPDR Barclays Short Term Corporate Bond ETF | | - | | - | | 454,070 | | 13,899,083 | (E) | | | | | 454,070 | | 13,899,083 |
| | | Touchstone Ultra Short
Duration Fixed Income
Fund | | Sentinel Low Duration
Bond Fund | | Pro Forma
Adjustments | | Proforma Combined
Touchstone Ultra Short
Duration Fixed Income
Fund |
| | | Shares | | Market
Value | | Shares | | Market
Value | | Shares | | Market
Value | | Shares | | Market
Value |
| Exchange Traded Funds Total | | | | - | | | | 41,390,014 | | | | | | | | 41,390,014 |
| | | | | | | | | | | | | | | | | |
| | | Principal
Amount | | | | Principal
Amount | | | | Principal
Amount | | | | Principal
Amount | | |
| Commercial Paper - 2.4% | | | | | | | | | | | | | | | | |
| Church & Dwight Co. Inc., 1.070%, 4/3/17, 0.000%, 4/3/17(C) | | 10,000,000 | | 9,999,082 | | - | | - | | | | | | 10,000,000 | | 9,999,082 |
| Cintas Corp., 1.070%, 4/3/17, 0.000%, 4/3/17(C) | | 10,000,000 | | 9,999,099 | | - | | - | | | | | | 10,000,000 | | 9,999,099 |
| | | | | | | | | | | | | | | | | |
| MDU Resourses Group, Inc., 1.080%, 4/3/17, 0.000%, 4/3/17(C) | | 2,700,000 | | 2,699,757 | | - | | - | | | | | | 2,700,000 | | 2,699,757 |
| Commercial Paper Total | | | | 22,697,938 | | | | - | | | | | | | | 22,697,938 |
| | | | | | | | | | | | | | | | | |
| Municipal Bonds - 2.2% | | | | | | | | | | | | | | | | |
| | | | | | | | | | | | | | | | | |
| California - 0.5% | | | | | | | | | | | | | | | | |
| CA St Enterprise Dev Authority, Txbl Variable J Harris Indl Wt, (LOC: City National Bank), 144a 1.230%, 9/1/41 | | 2,340,000 | | 2,340,000 | | - | | - | | | | | | 2,340,000 | | 2,340,000 |
| CA St Infrastructure & Economic Dev Bank, Txbl Studio Moulding, Ser B, (LOC: Comerica Bank), 1.980%, 12/1/28 | | 730,000 | | 730,000 | | - | | - | | | | | | 730,000 | | 730,000 |
| | | | | | | | | | | | | | | | | |
| CA St Infrastructure & Economic Dev Bank, Txbl Tobinworld Pj, Ser B, (LOC: Comerica Bank), 1.980%, 11/1/36 | | 110,000 | | 110,000 | | - | | - | | | | | | 110,000 | | 110,000 |
| | | | | | | | | | | | | | | | | |
| CA St Infrastructure & Economic Dev Bank, Variable Canyon Plastics Inc P, (LOC: Bank Of West (The), 1.110%, 12/1/39 | | 1,885,000 | | 1,885,000 | | - | | - | | | | | | 1,885,000 | | 1,885,000 |
| | | | | 5,065,000 | | | | - | | | | | | | | 5,065,000 |
| | | | | | | | | | | | | | | | | |
| Florida - 0.5% | | | | | | | | | | | | | | | | |
| State Brd of Admin Fin Corp., Txbl Ser A, 2.163%, 7/1/19 | | 5,000,000 | | 5,039,600 | | - | | - | | | | | | 5,000,000 | | 5,039,600 |
| | | | | | | | | | | | | | | | | |
| New York - 0.4% | | | | | | | | | | | | | | | | |
| Brookhaven NY IDA, Variable Intercounty Asso, (LOC: Capital One NA), 1.050%, 1/1/25 | | 3,450,000 | | 3,450,000 | | - | | - | | | | | | 3,450,000 | | 3,450,000 |
| | | | | | | | | | | | | | | | | |
| Massachusetts - 0.3% | | | | | | | | | | | | | | | | |
| MA St Edu Fin Auth, Ser B 1, 2.733%, 1/1/31(A) | | 2,726,000 | | 2,723,301 | | - | | - | | | | | | 2,726,000 | | 2,723,301 |
| | | | | | | | | | | | | | | | | |
| Minnesota - 0.2% | | | | | | | | | | | | | | | | |
| Saint Paul MN Hsg & Redev Auth, Txbl Ref Healthpartners Oblig, 1.400%, 7/1/17 | | 1,000,000 | | 1,000,250 | | - | | - | | | | | | 1,000,000 | | 1,000,250 |
| | | | | | | | | | | | | | | | | |
| Saint Paul MN Hsg & Redev Auth, Txbl Ref Healthpartners Oblig, 1.838%, 7/1/18 | | 1,095,000 | | 1,096,796 | | - | | - | | | | | | 1,095,000 | | 1,096,796 |
| | | | | 2,097,046 | | | | - | | | | | | | | 2,097,046 |
| | | | | | | | | | | | | | | | | |
| Indiana - 0.2% | | | | | | | | | | | | | | | | |
| Indiana Finance Authority, Ref Amt Republic Svcs Inc Proj, Ser A, 1.200%, 5/1/34(A) | | 2,000,000 | | 1,999,960 | | - | | - | | | | | | 2,000,000 | | 1,999,960 |
| | | | | | | | | | | | | | | | | |
| South Carolina - 0.1% | | | | | | | | | | | | | | | | |
| Spartanburg SC Wtrwks Rev, Txbl Ref Sys Ser B, 1.519%, 12/1/17 | | 535,000 | | 535,487 | | - | | - | | | | | | 535,000 | | 535,487 |
| | | | | | | | | | | | | | | | | |
| Spartanburg SC Wtrwks Rev, Txbl Ref Sys Ser B, 1.785%, 12/1/18 | | 280,000 | | 281,100 | | - | | - | | | | | | 280,000 | | 281,100 |
| | | | | 816,587 | | | | - | | | | | | | | 816,587 |
| | | Touchstone Ultra Short
Duration Fixed Income
Fund | | Sentinel Low Duration
Bond Fund | | Pro Forma
Adjustments | | Proforma Combined
Touchstone Ultra Short
Duration Fixed Income
Fund |
| | | Principal
Amount | | Market
Value | | Principal
Amount | | Market
Value | | Principal
Amount | | Market
Value | | Principal
Amount | | Market
Value |
| | | | | | | | | | | | | | | | | |
| Connecticut - 0.0% | | | | | | | | | | | | | | | | |
| State of Connecticut, Ser A, UTGO, 1.830%, 5/15/18(A) | | 425,000 | | 426,798 | | - | | - | | | | | | 425,000 | | 426,798 |
| | | | | | | | | | | | | | | | | |
| New Mexico - 0.0% | | | | | | | | | | | | | | | | |
| New Mexico Educational Assistance Foundation, Ser 2010, Class A2, 1.705%, 12/1/28(A) | | 30,000 | | 30,007 | | - | | - | | | | | | 30,000 | | 30,007 |
| | | | | | | | | | | | | | | | | |
| Municipal Bonds Total | | | | 21,648,299 | | | | - | | | | | | | | 21,648,299 |
| | | | | | | | | | | | | | | | | |
| Non-Agency Collateralized Mortgage Obligations - 1.7% | | | | | | | | | | | | | | | | |
| Bear Stearns ARM Trust, Ser 2003-1, Class 5A1, 3.047%, 4/25/33(A)†† | | 2,947,338 | | 2,962,076 | | - | | - | | | | | | 2,947,338 | | 2,962,076 |
| | | | | | | | | | | | | | | | | |
| Bear Stearns ARM Trust, Ser 2004-1, Class 13A3, 3.715%, 4/25/34(A)†† | | 318,467 | | 308,688 | | - | | - | | | | | | 318,467 | | 308,688 |
| | | | | | | | | | | | | | | | | |
| Bear Stearns Asset Backed Securities Trust, Ser 2003-AC7, Class A2, 5.750%, 1/25/34(D)†† | | 237,493 | | 243,491 | | - | | - | | | | | | 237,493 | | 243,491 |
| | | | | | | | | | | | | | | | | |
| Community Program Loan Trust, Ser 1987-A, Class A5, 4.500%, 4/1/29 | | 88,904 | | 88,404 | | - | | - | | | | | | 88,904 | | 88,404 |
| | | | | | | | | | | | | | | | | |
| CSMC Trust, Ser 2012-CIM1, Class A1, 144a 3.380%, 2/25/42(A) | | 551,546 | | 554,864 | | - | | - | | | | | | 551,546 | | 554,864 |
| | | | | | | | | | | | | | | | | |
| FDIC Structured Sale Guaranteed Notes, Ser 2010-S3, Class A, 144a 2.740%, 12/3/20 | | 78,107 | | 78,300 | | - | | - | | | | | | 78,107 | | 78,300 |
| | | | | | | | | | | | | | | | | |
| JP Morgan Mortgage Trust, Ser 2006-A4, Class 2A2, 3.082%, 6/25/36(A) | | 195,655 | | 175,419 | | - | | - | | | | | | 195,655 | | 175,419 |
| | | | | | | | | | | | | | | | | |
| Merrill Lynch Mortgage Investors Trust, Ser 2003-A1, Class 2A, 3.365%, 12/25/32(A) | | 22,110 | | 21,905 | | - | | - | | | | | | 22,110 | | 21,905 |
| | | | | | | | | | | | | | | | | |
| Merrill Lynch Mortgage Investors Trust, Ser 2004-1, Class 1A, 3.001%, 12/25/34(A) | | 194,684 | | 191,981 | | - | | - | | | | | | 194,684 | | 191,981 |
| | | | | | | | | | | | | | | | | |
| Mill City Mortgage Trust, Ser 2015-1, Class A1, 144a 2.230%, 6/25/56(A) | | 1,316,264 | | 1,320,862 | | - | | - | | | | | | 1,316,264 | | 1,320,862 |
| | | | | | | | | | | | | | | | | |
| People’s Choice Home Loan Securities Trust Series, Ser 2005-1, Class M3, 1.852%, 1/25/35(A) | | 705,948 | | 706,833 | | - | | - | | | | | | 705,948 | | 706,833 |
| | | | | | | | | | | | | | | | | |
| RFMSI Trust, Ser 2007-SA1, Class 1A1, 3.416%, 2/25/37(A) | | 1,009,624 | | 847,896 | | - | | - | | | | | | 1,009,624 | | 847,896 |
| | | | | | | | | | | | | | | | | |
| Springleaf Mortgage Loan Trust, Ser 2013-3A, Class A, 144a 1.870%, 9/25/57(A) | | 4,737,909 | | 4,733,566 | | - | | - | | | | | | 4,737,909 | | 4,733,566 |
| | | | | | | | | | | | | | | | | |
| Towd Point Mortgage Trust, Ser 2015-4, Class A1B, 144a 2.750%, 4/25/55(A) | | 3,310,121 | | 3,313,603 | | - | | - | | | | | | 3,310,121 | | 3,313,603 |
| | | | | | | | | | | | | | | | | |
| Wells Fargo Mortgage Backed Securities Trust, Ser 2003-G, Class A1, 2.895%, 6/25/33(A) | | 192,386 | | 192,759 | | - | | - | | | | | | 192,386 | | 192,759 |
| | | | | | | | | | | | | | | | | |
| Wells Fargo Mortgage Backed Securities Trust, Ser 2003-M, Class A1, 3.000%, 12/25/33(A) | | 502,378 | | 504,086 | | - | | - | | | | | | 502,378 | | 504,086 |
| Non-Agency Collateralized Mortgage Obligations Total | | | | 16,244,733 | | | | - | | | | | | | | 16,244,733 |
| | | | | | | | | | | | | | | | | |
| Residential Mortgage-Backed Securities - 1.4% | | | | | | | | | | | | | | | | |
| Bear Stearns Trust FLT, 3.174%, 6/25/34 | | - | | - | | 6,286,410 | | 6,350,833 | (E) | | | | | 6,286,410 | | 6,350,833 |
| BOAMS 2004 5 3A1, 4.500%, 6/25/19 | | - | | - | | 1,728,826 | | 1,732,098 | (E) | | | | | 1,728,826 | | 1,732,098 |
| GSR 2003 13 1A1, 2.869%, 10/25/33 | | - | | - | | 5,386,719 | | 5,429,348 | (E) | | | | | 5,386,719 | | 5,429,348 |
| Residential Mortgage-Backed Securities Total | | | | - | | | | 13,512,279 | | | | | | | | 13,512,279 |
| | | Touchstone Ultra Short
Duration Fixed Income
Fund | | Sentinel Low Duration
Bond Fund | | Pro Forma
Adjustments | | Proforma Combined
Touchstone Ultra Short
Duration Fixed Income
Fund |
| | | Principal
Amount | | Market
Value | | Principal
Amount | | Market
Value | | Principal
Amount | | Market
Value | | Principal
Amount | | Market
Value |
| | | | | | | | | | | | | | | | | |
| U.S. Government Agency Obligations - 0.8% | | | | | | | | | | | | | | | | |
| Overseas Private Investment Corp., 0.900%, 10/15/33(A) | | 2,100,000 | | 2,100,000 | | - | | - | | | | | | 2,100,000 | | 2,100,000 |
| Overseas Private Investment Corp., 0.900%, 7/20/22(A) | | 5,000,000 | | 5,000,000 | | - | | - | | | | | | 5,000,000 | | 5,000,000 |
| Small Business Administration Participation Certificates, Ser 2002-20A, Class 1, 6.140%, 1/1/22 | | 26,972 | | 28,872 | | - | | - | | | | | | 26,972 | | 28,872 |
| Small Business Administration Participation Certificates, Ser 2003-20E, Class 1, 4.640%, 5/1/23 | | 39,672 | | 41,699 | | - | | - | | | | | | 39,672 | | 41,699 |
| Small Business Administration Pools, 1.150%, 1/25/26(A) | | 198,468 | | 198,013 | | - | | - | | | | | | 198,468 | | 198,013 |
| Small Business Administration Pools, 1.250%, 4/25/28(A) | | 162,592 | | 162,644 | | - | | - | | | | | | 162,592 | | 162,644 |
| U.S. Government Agency Obligations Total | | | | 7,531,228 | | | | - | | | | | | | | 7,531,228 |
| | | | | | | | | | | | | | | | | |
| Agency Collateralized Mortgage Obligations - 0.4% | | | | | | | | | | | | | | | | |
| FHLMC Multifamily Structured Pass Through Certificates, Ser K504 Class X1, 0.222%, 9/25/20(A)(B) | | 125,095,654 | | 649,397 | | - | | - | | | | | | 125,095,654 | | 649,397 |
| FHLMC REMIC, Ser 2510 Class TA, 4.000%, 6/15/32 | | 40,093 | | 40,910 | | - | | - | | | | | | 40,093 | | 40,910 |
| FHLMC REMIC, Ser 2770 Class FH, 1.312%, 3/15/34(A) | | 433,346 | | 433,097 | | - | | - | | | | | | 433,346 | | 433,097 |
| FHLMC REMIC, Ser 3414 Class MB, 4.250%, 12/15/19 | | 90,494 | | 91,810 | | - | | - | | | | | | 90,494 | | 91,810 |
| FHLMC REMIC, Ser 4459 Class NG, 6.500%, 10/15/24 | | 8,241 | | 8,333 | | - | | - | | | | | | 8,241 | | 8,333 |
| FNMA REMIC Trust, Ser 2001-W4, Class AF5, 6.114%, 2/25/32(D) | | 142,031 | | 172,503 | | - | | - | | | | | | 142,031 | | 172,503 |
| FNMA REMIC, Ser 2003-119, Class PU, 4.000%, 11/25/33 | | 242,674 | | 245,663 | | - | | - | | | | | | 242,674 | | 245,663 |
| FNMA REMIC, Ser 2003-33, Class AM, 4.250%, 5/25/33 | | 88,689 | | 93,735 | | - | | - | | | | | | 88,689 | | 93,735 |
| FNMA REMIC, Ser 2003-42, Class CA, 4.000%, 5/25/33 | | 81,023 | | 84,220 | | - | | - | | | | | | 81,023 | | 84,220 |
| FNMA REMIC, Ser 2003-81, Class FE, 1.482%, 9/25/33(A) | | 349,776 | | 351,128 | | - | | - | | | | | | 349,776 | | 351,128 |
| FNMA REMIC, Ser 2008-35, Class IO, 4.500%, 4/25/23(B) | | 25,520 | | 133 | | - | | - | | | | | | 25,520 | | 133 |
| FNMA REMIC, Ser 2010-13, Class WD, 4.250%, 3/25/25 | | 102,212 | | 104,501 | | - | | - | | | | | | 102,212 | | 104,501 |
| FNMA REMIC, Ser 2010-54, Class NA, 4.500%, 10/25/39 | | 3,287 | | 3,286 | | - | | - | | | | | | 3,287 | | 3,286 |
| FNMA REMIC, Ser 2011-52, Class AH, 2.750%, 10/25/18 | | 75,567 | | 75,917 | | - | | - | | | | | | 75,567 | | 75,917 |
| FNMA REMIC, Ser 2012-102, Class NA, 1.500%, 9/25/27 | | 331,920 | | 321,508 | | - | | - | | | | | | 331,920 | | 321,508 |
| GNMA, Ser 2002-72, Class AB, 4.500%, 10/20/32 | | 144,654 | | 155,128 | | - | | - | | | | | | 144,654 | | 155,128 |
| GNMA, Ser 2011-142, Class IO, 0.611%, 9/16/46(A)(B) | | 13,094,503 | | 294,491 | | - | | - | | | | | | 13,094,503 | | 294,491 |
| GNMA, Ser 2011-161, Class A, 1.738%, 1/16/34 | | 72,597 | | 72,512 | | - | | - | | | | | | 72,597 | | 72,512 |
| GNMA, Ser 2011-57, Class BA, 3.000%, 5/20/40 | | 110,903 | | 112,586 | | - | | - | | | | | | 110,903 | | 112,586 |
| GNMA, Ser 2012-27, Class A, 1.614%, 7/16/39 | | 210,120 | | 205,203 | | - | | - | | | | | | 210,120 | | 205,203 |
| Agency Collateralized Mortgage Obligations Total | | | | 3,516,061 | | | | - | | | | | | | | 3,516,061 |
| | | | | | | | | | | | | | | | | |
| Bank Loans - 0.3% | | | | | | | | | | | | | | | | |
| | | | | | | | | | | | | | | | | |
| Technology - 0.2% | | | | | | | | | | | | | | | | |
| Micron Technology, Inc., 4.750%, 4/26/22(A) | | - | | - | | 1,761,688 | | 1,767,748 | (E) | | | | | 1,761,688 | | 1,767,748 |
| | | Touchstone Ultra Short
Duration Fixed Income
Fund | | Sentinel Low Duration
Bond Fund | | Pro Forma
Adjustments | | Proforma Combined
Touchstone Ultra Short
Duration Fixed Income
Fund |
| | | Principal
Amount | | Market
Value | | Principal
Amount | | Market
Value | | Principal
Amount | | Market
Value | | Principal
Amount | | Market
Value |
| | | | | | | | | | | | | | | | | |
| Consumer Discretionary - 0.1% | | | | | | | | | | | | | | | | |
| J Crew Group, Inc., 4.090%, 3/5/21 | | - | | - | | 1,325,000 | | 802,831 | (E) | | | | | 1,325,000 | | 802,831 |
| | | | | | | | | | | | | | | | | |
| Bank Loans Total | | | | - | | | | 2,570,578 | | | | | | | | 2,570,578 |
| | | | | | | | | | | | | | | | | |
| | | Shares | | | | Shares | | | | Shares | | | | Shares | | |
| Short Term Investments - 1.1% | | | | | | | | | | | | | | | | |
| Dreyfus Government Cash Management, Institutional Shares, 0.66%∞Ω | | 92,240 | | 92,240 | | - | | - | | | | | | 92,240 | | 92,240 |
| State Street Institutional U.S. Government Money Market Fund Premier Class | | - | | - | | 10,750,906 | | 10,750,906 | (E) | (451,106) | | (451,106) | (F) | 10,299,800 | | 10,299,800 |
| Short Term Investments Total | | | | 92,240 | | | | 10,750,906 | | | | (451,106) | | | | 10,392,040 |
Total Investment Securities - 99.0%
(Cost $957,794,956) | | | $ | 644,405,422 | | | $ | 314,434,731 | | | $ | (451,106) | | | $ | 958,389,047 |
| | | | | | | | | | | | | | | | | |
| Other Assets in Excess of Liabilities - 1.% | | | | 9,710,823 | | | | (639,286) | | | | 451,106 | (F) | | | 9,522,643 |
| Net Assets - 100.0% | | | $ | 654,116,245 | | | $ | 313,795,445 | | | $ | - | | | $ | 967,911,690 |
(A) Variable rate security - Rate reflected is the rate in effect as of March 31, 2017.
(B) Interest only security. This type of security represents the right to receive the monthly interest payments on an underlying pool of mortgages. Payments of principal on the pool reduce the value of the “interest only” holding.
(C) Rate reflects yield at the time of purchase.
(D) Step Bond - A bond that pays an initial interest rate for the first period and then a higher interest rate for the following periods until maturity. The interest rate shown reflects the rate in effect as of March 31, 2017.
(E) Following the Reorganization, all or a portion of this security may be sold. It is expected that the Touchstone Ultra Short Duration Fixed Income Fund will sell approximately 67% of the securities acquired from the Target Fund. If such sales had occurred as of 3/31/17, shareholders would have recognized capital gains of $0.02 per share of the Proforma Combined Touchstone Ultra Short Duration Fixed Income Fund.
(F) Deferred compensation plan will be redeemed prior to conversion.
| †† The issuers and/or sponsors of certain mortgage-backed securities may no longer exist; however, the securities held by the Fund are separate legal entities organized as trusts and publicly traded. The Fund receives principal and interest payments directly from these trusts. | | | | | | | | | | | | | | | | |
| | | | | | | | | | | | | | | | | |
| ∞ Open-End Fund. | | | | | | | | | | | | | | | | |
| Ω Represents the 7-day SEC yield as of March 31, 2017. | | | | | | | | | | | | | | | | |
| | | | | | | | | | | | | | | | | |
| ARM - Adjustable Rate Mortgage | | | | | | | | | | | | | | | | |
| CDO - Collateralized Debt Obligations | | | | | | | | | | | | | | | | |
| CLO - Collateralized Loan Obligations | | | | | | | | | | | | | | | | |
| FDIC - Federal Deposit Insurance Corporation | | | | | | | | | | | | | | | | |
| FHLMC - Federal Home Loan Mortgage Corporation | | | | | | | | | | | | | | | | |
| FNMA - Federal National Mortgage Association | | | | | | | | | | | | | | | | |
| GNMA - Government National Mortgage Association | | | | | | | | | | | | | | | | |
| IDA - Industrial Development Agency | | | | | | | | | | | | | | | | |
| LLC - Limited Liability Company | | | | | | | | | | | | | | | | |
| LOC - Letter of Credit | | | | | | | | | | | | | | | | |
| LP - Limited Partnership | | | | | | | | | | | | | | | | |
| MTN - Medium Term Note | | | | | | | | | | | | | | | | |
| PLC - Public Limited Company | | | | | | | | | | | | | | | | |
| REMIC - Real Estate Mortgage Investment Conduit | | | | | | | | | | | | | | | | |
| UTGO - Unlimited Tax General Obligation | | | | | | | | | | | | | | | | |
| 144a - This is a restricted security that was sold in a transaction qualifying for the exemption under Rule 144A of the Securities Act of 1933. This security may be sold in transactions exempt from registration, normally to qualified institutional buyers. At March 31, 2017, these securities were valued at $302,983,897 or 31.3% of net assets. These securities were deemed liquid pursuant to procedures approved by the Board of Trustees. | | | | | | | | | | | | | | | | |
| Description | | Level 1 | | Level 2 | | Level 3 | | Total |
| Corporate Bonds | $ | - | $ | 338,821,893 | $ | - | $ | 338,821,893 |
| Asset-Backed Securities | | - | | 245,823,011 | | - | | 245,823,011 |
| U.S. Government Mortgage-Backed Obligations | | - | | 131,986,294 | | - | | 131,986,294 |
| Commercial Mortgage-Backed Securities | | - | | 52,257,109 | | - | | 52,257,109 |
| U.S. Treasury Obligations | | - | | 49,997,569 | | - | | 49,997,569 |
| Exchange Traded Funds | | 41,390,014 | | - | | - | | 41,390,014 |
| Commercial Paper | | - | | 22,697,938 | | - | | 22,697,938 |
| Municipal Bonds | | - | | 21,648,299 | | - | | 21,648,299 |
| Non-Agency Collateralized Mortgage Obligations | | - | | 16,244,733 | | - | | 16,244,733 |
| Residential Mortgage-Backed Securities | | - | | 13,512,279 | | - | | 13,512,279 |
| U.S. Government Agency Obligations | | - | | 7,531,228 | | - | | 7,531,228 |
| Agency Collateralized Mortgage Obligations | | - | | 3,516,061 | | - | | 3,516,061 |
| Bank Loans | | - | | 2,570,578 | | - | | 2,570,578 |
| Short Term Investments | | 92,240 | | 10,299,800 | | - | | 10,392,040 |
| Total | $ | 41,482,254 | $ | 916,906,793 | $ | - | $ | 958,389,047 |
Notes to Pro Forma Financial Statements
March 31, 2017 (Unaudited)
Pro Forma Financial Information
Note 1—Reorganizations
The unaudited pro forma financial information set forth in the accompanying pro forma financial statements is for informational purposes only and does not purport to be indicative of the financial condition that actually would have resulted if the reorganization of each Sentinel Fund into the corresponding Touchstone Fund (each, a “Reorganization” and collectively, the “Reorganizations”) had been consummated. These pro forma numbers have been estimated in good faith based on information provided by the Sentinel Funds as of and for the twelve months ended March 31, 2017 for the Sentinel Funds. The unaudited pro forma financial information should be read in conjunction with the historical financial statements of the Sentinel Funds and the Touchstone Funds, which are available in their annual shareholder reports.
Note 2—Basis of Pro Forma
Each of the acquiring funds, Touchstone Active Bond Fund and the Touchstone Ultra Short Duration Fixed Income Fund (the “Acquiring Funds”), is a series of Touchstone Funds Group Trust (“Touchstone Funds”), which is registered under the Investment Company Act of 1940, as amended, as an open-end, management investment company. As of March 31, 2017, the Acquiring Funds had shares outstanding of the share classes listed below:
| Funds | | Classes |
| Touchstone Active Bond Fund | | A, C, Y, and Institutional |
| Touchstone Ultra Short Duration Fixed Income Fund* | | A, C, Y, Z, and Institutional |
| |
| * Touchstone Ultra Short Duration Fixed Income Fund will open Class S shares. |
Each of the target funds, Sentinel Government Securities Fund, Sentinel Total Return Bond Fund, and Sentinel Low Duration Bond Fund (the “Target Funds”), is a series of Sentinel Group Funds, Inc. (“Sentinel Funds”), which is registered under the Investment Company Act of 1940, as amended, as an open-end, management investment company. As of March 31, 2017, the Sentinel Funds had shares outstanding of the share classes listed below:
| Funds | | Classes |
| Sentinel Government Securities Fund | | A, C, and I* |
| Sentinel Total Return Bond Fund | | A, C, I*, R3** and R6* |
| Sentinel Low Duration Bond Fund | | A, S and I* |
| | |
| * Class I and Class R6 shares of the Sentinel Funds will be exchanged for Class Y shares of the Touchstone Funds. |
| ** Class R3 shares of the Sentinel Funds will be exchanged for Class A shares of the Touchstone Funds. |
The accompanying unaudited pro forma financial statements are presented to show the effect of the transfer of assets and liabilities of the Target Funds in exchange for shares of the Acquiring Funds (for purposes of maintaining the financial statements and performance).
Under the terms of the Agreement and Plan of Reorganization, the combination of each Target Fund and the corresponding Acquiring Fund will be accounted for by the method of accounting for tax-free reorganizations of investment companies. The statements of assets and liabilities and the related statements of operations of the Acquiring Funds and the Target Funds have been combined as of and for the twelve months ended March 31, 2017. In accordance with U.S. generally accepted accounting principles (“U.S. GAAP”), the historical cost of investment securities will be carried forward to the Acquiring Funds and the results of operations for pre-combination periods of the Acquiring Funds will not be restated.
Each Reorganization will be accounted for as a tax-free reorganization for federal income tax purposes; therefore, no gain or loss will be recognized by the Target Funds or their shareholders as a direct result of the Reorganizations. The Target Funds and the Acquiring Funds are each registered open-end management investment companies. Each Reorganization will be accomplished by the transfer of the assets and the liabilities of the applicable Sentinel Fund to the corresponding Touchstone Fund in exchange for shares of the Touchstone Fund and the distribution of such shares to the shareholders of the Sentinel Fund, in complete liquidation of the Sentinel Fund, followed by the termination of the Sentinel Fund. The table below shows the shares that Target Fund shareholders would have received had the Reorganizations occurred on March 31, 2017.
| Touchstone Funds Group Trust—Touchstone Active Bond Fund assumes the Reorganization of both the Sentinel Government Securities Fund and Sentinel Total Return Bond Fund |
| | | | | | | |
| Class of Shares | | Shares of Acquiring
Fund Pre-
Combination | | Additional Shares
Assumed Issued in
Reorganization | | Total Outstanding
Shares Post-
Combination |
| Class A* | | 2,264,218 | | 19,786,712 | | 22,050,930 |
| Class C | | 570,446 | | 4,282,167 | | 4,852,613 |
| Class Y** | | 6,547,101 | | 21,017,685 | | 27,564,786 |
| Institutional Class | | 656,297 | | - | | 656,297 |
| Touchstone Funds Group Trust—Touchstone Active Bond Fund assumes the Reorganization of only the Sentinel Government Securities Fund |
| | | | | | | |
| Class of Shares | | Shares of Acquiring
Fund Pre-
Combination | | Additional Shares
Assumed Issued in
Reorganization | | Total Outstanding
Shares Post-
Combination |
| Class A | | 2,264,218 | | 13,536,265 | | 15,800,483 |
| Class C | | 570,446 | | 1,800,224 | | 2,370,670 |
| Class Y** | | 6,547,101 | | 2,277,369 | | 8,824,470 |
| Institutional Class | | 656,297 | | - | | 656,297 |
| Touchstone Funds Group Trust—Touchstone Active Bond Fund assumes the Reorganization of only the Sentinel Total Return Bond Fund |
| | | | | | | |
| Class of Shares | | Shares of Acquiring
Fund Pre-
Combination | | Additional Shares
Assumed Issued in
Reorganization | | Total Outstanding
Shares Post-
Combination |
| Class A* | | 2,264,218 | | 6,250,447 | | 8,514,665 |
| Class C | | 570,446 | | 2,481,943 | | 3,052,389 |
| Class Y** | | 6,547,101 | | 18,740,316 | | 25,287,417 |
| Institutional Class | | 656,297 | | - | | 656,297 |
| Touchstone Funds Group Trust—Touchstone Sustainability and Impact Equity Fund |
| | | | | | | |
| Class of Shares | | Shares of Acquiring
Fund Pre-
Combination | | Additional Shares
Assumed Issued in
Reorganization | | Total Outstanding
Shares Post-
Combination |
| Class A | | 1,376,890 | | 9,559,767 | | 10,936,657 |
| Class C | | 789,123 | | - | | 789,123 |
| Class S | | - | | 22,182,299 | | 22,182,299 |
| Class Y** | | 23,808,046 | | 1,997,796 | | 25,805,842 |
| Class Z | | 23,577,201 | | - | | 23,577,201 |
| Institutional Class | | 20,734,708 | | - | | 20,734,708 |
* Class R3 shares of the Sentinel Funds will be exchanged for Class A shares of the Touchstone Funds.
** Class I and Class R6 shares of the Sentinel Funds will be exchanged for Class Y shares of the Touchstone Funds.
| Fund | | Net Assets
March 31, 2017 |
| Sentinel Government Securities Fund | | $180,981,046 |
| Sentinel Total Return Bond Fund | | $282,461,412 |
| Touchstone Active Bond Fund | | $103,460,881 |
| Pro Forma Combined Touchstone Active Bond Fund assumes the Reorganization of both the Sentinel Government Securities Fund and Sentinel Total Return Bond Fund | | $566,903,339 |
| Pro Forma Combined Touchstone Active Bond Fund assumes the Reorganization of only the Sentinel Government Securities Fund | | $284,441,927 |
| Pro Forma Combined Touchstone Active Bond Fund assumes the Reorganization of only the Sentinel Total Return Bond Fund) | | $385,922,293 |
| Fund | | Net Assets
March 31, 2017 |
| Sentinel Low Duration Bond Fund | | $313,795,445 |
| Touchstone Ultra Short Duration Fixed Income Fund | | $654,116,245 |
| Pro Forma Combined Touchstone Ultra Short Durations Fixed Income Fund | | $967,911,690 |
Note 3—Estimates
The preparation of financial statements in conformity with U.S. GAAP requires management to make estimates and assumptions that affect the reported amounts of assets and liabilities and disclosure of contingent assets and liabilities at the date of the financial statements and the reported amounts of income and expenses during the reporting period. Actual results could differ from those estimates.
Note 4—Pro Forma Expense Adjustments
These pro forma numbers have been estimated in good faith based on information provided by the Sentinel Funds as of and for the twelve months ended March 31, 2017 for the Sentinel Funds. The pro forma expenses have been adjusted to reflect the contractual rates of the Touchstone Funds, expense reductions of certain duplicative expenses, and the impact of the expense limitation agreement as a result of the Reorganization.
Note 5—Portfolio Repositioning
A significant portion of the portfolio securities of each Sentinel Target Fund are expected to be sold following the Reorganization. To the extent that portfolio investments received by a Touchstone Acquiring Fund from a Sentinel Target Fund in a Reorganization are sold after the Reorganization, the Touchstone Acquiring Fund may recognize gains or losses, which may result in taxable distributions to shareholders holding shares of the Touchstone Acquiring Fund (including former Sentinel Target Fund shareholders who hold shares of the Touchstone Acquiring Fund following the Reorganization). The sub-advisors may take steps to limit the amount of capital gains recognized during a single fiscal year including executing the portfolio repositionings over a period of time.
Note 6—Reorganization Costs
Touchstone Advisors, Inc. (“Touchstone Advisors”) and Sentinel Asset Management, Inc. (“Sentinel”) estimate that expenses for the Reorganizations of the Sentinel Group Funds, Inc. and the Sentinel Variable Products Trust will be approximately $1.7 million . These costs represent management’s estimate of professional services fees, printing costs and mailing charges related to the Reorganizations. Touchstone Advisors and Sentinel will bear 100% of the Reorganization expenses. As a result there are no pro forma adjustments to net assets for Reorganization expenses.
Note 7—Accounting Survivor
The table below indicates the accounting and performance survivor for each Reorganization based on the legal survivors of the Reorganizations and their forms of organization; the boards of trustees/directors; portfolio management; portfolio composition; investment goals, policies and restrictions; expenses structures and expense ratios; and asset size.
| Target Funds | | Acquiring Funds | | Accounting Survivor |
| Sentinel Government Securities Fund | | Touchstone Active Bond Fund | | Touchstone Active Bond Fund |
| Sentinel Total Return Bond Fund | | Touchstone Active Bond Fund | | Touchstone Active Bond Fund |
| Sentinel Low Duration Bond Fund | | Touchstone Ultra Short Duration Fixed Income Fund | | Touchstone Ultra Short Duration Fixed Income Fund |
Note 8—Federal Income Taxes
Each Fund has elected to be taxed as a “regulated investment company” under the Internal Revenue Code of 1986, as amended (the “Code”). After each Reorganization, the applicable Acquiring Fund intends to continue to qualify as a regulated investment company, if such qualification is in the best interest of its shareholders, by complying with the provisions available to certain investment companies, as defined in applicable sections of the Code, and to make distributions of taxable income sufficient to relieve it from all, or substantially all, federal income taxes. The identified cost of investments for the Funds is substantially the same for both financial accounting and federal income tax purposes. The tax cost of investments will remain unchanged for the combined Funds.
Note 9—Capital Loss Carry Forwards
The table below lists the capital loss carry forwards and the expiration year for each fund as of November 30, 2016 for the Sentinel Funds and as of September 30, 2016 for the Touchstone Funds.
| Fund | 2017 | 2018 | 2019 | No Expiration | Total |
| Sentinel Government Securities Fund | | | | $58,457,106 | $58,457,106 |
| Sentinel Total Return Bond Fund | | | | $34,311,196 | $34,311,196 |
| Sentinel Low Duration Bond Fund | $2,065,072 | $16,447,278 | $32,731,463 | $76,001,489 | $127,245,302 |
| Touchstone Active Bond Fund | $8,427,960 | | | | $8,427,960 |
| Touchstone Ultra Short Duration Fixed Income Fund | $3,231,117 | $3,336,624 | $933,830 | $17,631,734 | $25,133,305 |
The Sentinel Funds
Class A, Class C, Class I, Class R3, Class R6 and Class S
Supplement dated May 1, 2017
to the Summary Prospectuses and Prospectus
dated March 30, 2017, as supplemented to date
Sentinel Balanced Fund and Sentinel Common Stock Fund
Retirement of Daniel J. Manion, CFA, Portfolio Manager
Daniel J. Manion, CFA, Director of Equity Research with Sentinel Asset Management, Inc. (“Sentinel”) and co-portfolio manager of the Sentinel Balanced and Sentinel Common Stock Funds has retired from Sentinel.
Sentinel Balanced Fund
The section of the Prospectus titled “Fund Summaries – Sentinel Balanced Fund – Management – Portfolio Managers” is hereby modified, effective immediately, to read in its entirety as follows:
Portfolio Manager. Jason Doiron, portfolio manager and Head of Investments with Sentinel, has been a portfolio manager of the Fund since 2012.
Sentinel Common Stock Fund
The section of the Prospectus titled “Fund Summaries – Sentinel Common Stock Fund – Management – Portfolio Managers” is hereby modified, effective immediately, to read in its entirety as follows:
Portfolio Manager. Hilary Roper, portfolio manager with Sentinel, has been a portfolio manager of the Fund since 2010.
Management of the Funds
The section of the Prospectus titled “Management of the Funds” as it relates to the specific individuals who manage each of the Sentinel Balanced and Sentinel Common Stock Funds is hereby modified, effective immediately, as follows:
Balanced Fund
Jason Doiron manages the Balanced Fund with assistance from equity and fixed income portfolio managers and analysts. Mr. Doiron has been employed by Sentinel since 2008 and is Head of Investments at Sentinel. He has co-managed or managed the Fund since 2012. From 2005 to 2008, Mr. Doiron was Director—Quantitative Trading and Strategies Group for the Royal Bank of Canada’s Capital Markets Group and from 2003 to 2005 he was a Senior Quantitative Analyst - Fixed Income Derivatives for Citigroup Global Investments. Mr. Doiron holds the Financial Risk Manager and Professional Risk Manager designations.
Common Stock Fund
Hilary Roper manages the Common Stock Fund. Ms. Roper has been employed by Sentinel since 1998 as an equity analyst and has co-managed or managed the Fund since 2010. She holds the Chartered Financial Analyst designation.
Sentinel Group Funds, Inc.
Class A, Class C, Class I, Class R3, Class R6 and Class S
Supplement dated April 26, 2017
to the Prospectus dated March 30, 2017
As described in a supplement to the Prospectus dated April 20, 2017, Sentinel Asset Management, Inc., the Sentinel Funds’ investment advisor (“Sentinel”), announced the execution of a definitive agreement whereby Touchstone Advisors, Inc. (“Touchstone”) has agreed to acquire certain assets related to Sentinel’s business of providing investment advisory services to the Sentinel Funds, and nine of the Sentinel Funds are expected to be reorganized into either existing Touchstone Funds or into newly created Touchstone Funds (the “Reorganizations”). Each Reorganization requires the approval of the shareholders of the applicable Sentinel Fund.
On April 24, 2017, the Board of Directors of Sentinel Group Funds, Inc. unanimously approved each of the proposed Reorganizations. A proxy statement is expected to be filed soon with the Securities and Exchange Commission (the “Commission”). The proxy statement will contain more detailed information about the proposed Reorganizations (including information about anticipated expense ratios and differences in investment strategy, if any), Touchstone and the proposed portfolio managers. Once finalized with the Commission, the proxy statement will be sent to Sentinel Fund shareholders.
The Sentinel Funds
Class A, Class C, Class I, Class R3, Class R6 and Class S
Supplement dated April 20, 2017
to the Prospectus dated March 30, 2017
Sentinel Asset Management, Inc., the Sentinel Funds’ investment advisor (“Sentinel”) announced the execution of a definitive agreement whereby Touchstone Advisors, Inc. (“Touchstone”) has agreed to acquire certain assets related to Sentinel’s business of providing investment advisory services to the Sentinel Funds (the “transaction”).
Under the terms of the agreement, nine of the Sentinel Funds will be reorganized into either existing Touchstone Funds or into newly created Touchstone Funds (the “Reorganizations”), and subsequently will be advised by Touchstone under their sub-advised mutual fund approach. It is anticipated that the Sentinel Small Company and International Equity Funds will retain their current portfolio management teams under sub-advisor Fort Washington Investment Advisors, Inc.
Listed below are the Sentinel Funds that are covered by the transaction, and the anticipated acquiring Touchstone Fund. Anticipated share class mapping is also included in the table below. The Sentinel Unconstrained Bond Fund is not part of the transaction.
The Reorganizations are subject to the approval of the Board of Directors of the Sentinel Funds. In addition, shareholders of each Sentinel Fund must approve the Reorganization with respect to their individual Sentinel Fund. If the Reorganizations are approved by the Board of Directors of the Sentinel Funds, a proxy statement will be filed with the Securities and Exchange Commission (the “Commission”). The proxy statement will contain more detailed information about the Reorganizations (including information about anticipated expense ratios and differences in investment strategy, if any), Touchstone and the proposed portfolio managers. Once finalized with the Commission, the proxy statement will be sent to Sentinel Fund shareholders.
Sentinel Fund/Share
Class | | Proposed Touchstone Fund –
Existing Fund/Share Class | | Touchstone Sub-Advisor | |
| Government Securities | | Active Bond | | Fort Washington Investment Advisors, Inc.
– current management team of the Touchstone Fund |
| Class A | | Class A | | | |
| Class C | | Class C | | | |
| Class I | | Class Y | | | |
| | | | | | |
| Total Return Bond | | Active Bond | | Fort Washington Investment Advisors, Inc.
– current management team of the Touchstone Fund |
| Class A | | Class A | | | |
| Class C | | Class C | | | |
| Class I | | Class Y | | | |
| Class R3 | | Class A | | | |
| Class R6 | | Class Y | | | |
| | | | | | |
| Low Duration Bond | | Ultra Short Duration Fixed Income | | Fort Washington Investment Advisors, Inc.
– current management team of the Touchstone Fund |
| Class A | | Class A | | | |
| Class I | | Class Y | | | |
| Class S | | Class S (to be created) | | | |
Sentinel Fund/Share
Class | | Proposed Touchstone Fund –
Existing Fund/Share Class | | Touchstone Sub-Advisor |
| Multi-Asset Income | | Flexible Income | | ClearArc Capital, Inc. – current management team of the Touchstone Fund |
| Class A | | Class A | | | |
| Class C | | Class C | | | |
| Class I | | Class Y | | | |
| | | | | | |
| Sustainable Core Opportunities | | Sustainability & Impact Equity | | Rockefeller & Co., Inc. – current management team of the Touchstone Fund |
| Class A | | Class A | | | |
| Class I | | Class Y | | | |
| | | | | | |
Sentinel Fund/Share
Class | | Proposed Touchstone Fund –
New Fund/Share Class | | Proposed Touchstone Sub-
Advisor – New Fund | Proposed Portfolio
Manager – New Fund |
| Small Company | | Small Company | | Fort Washington
Investment Advisors, Inc. | Jason Ronovech |
| Class A | | Class A | | | |
| Class C | | Class C | | | |
| Class I | | Class Y | | | |
| Class R6 | | Class R6 | | | |
| | | | | | |
| International Equity | | International Equity | | Fort Washington
Investment Advisors, Inc. | Andrew Boczek |
| Class A | | Class A | | | |
| Class C | | Class C | | | |
| Class I | | Class Y | | | |
| | | | | | |
| Common Stock | | Large Cap Focused | | Fort Washington
Investment Advisors, Inc. | Jamie Wilhelm |
| Class A | | Class A | | | |
| Class C | | Class C | | | |
| Class I | | Class Y | | | |
| Class R6 | | Class I | | | |
| | | | | | |
| Balanced | | Balanced | | Fort Washington
Investment Advisors, Inc. | Jamie Wilhelm, Tim
Policinski, Dan Carter |
| Class A | | Class A | | | |
| Class C | | Class C | | | |
| Class I | | Class Y | | | |
Sentinel Funds Prospectus
Dated March 30, 2017
| | Class A | Class C | Class S | Class I | Class R3 | Class R6 |
| Sentinel Balanced Fund | SEBLX | SBACX | | SIBLX | | |
| Sentinel Common Stock Fund | SENCX | SCSCX | | SICWX | | SCRLX |
| Sentinel Government Securities Fund | SEGSX | SCGGX | | SIBWX | | |
| Sentinel International Equity Fund | SWRLX | SWFCX | | SIIEX | | |
| Sentinel Low Duration Bond Fund | SSIGX | | SSSGX | SSBDX | | |
| Sentinel Multi-Asset Income Fund | SECMX | SMKCX | | SCSIX | | |
| Sentinel Small Company Fund | SAGWX | SSCOX | | SIGWX | | SSRRX |
| Sentinel Sustainable Core Opportunities Fund | MYPVX | | | CVALX | | |
| Sentinel Total Return Bond Fund | SATRX | SCTRX | | SITRX | SBRRX | STRRX |
| Sentinel Unconstrained Bond Fund | SUBAX | SUBCX | | SUBIX | | |
This prospectus contains information you should know before investing, including information about risks. Please read it before you invest and keep it for future reference.
The Securities and Exchange Commission (“SEC”) has not approved or disapproved these securities or determined if this prospectus is accurate or complete. Any representation to the contrary is a criminal offense.
Sentinel Group Funds, Inc. • One National Life Drive • Montpelier, VT 05604 • 800.233.4332
www.sentinelinvestments.com
Table of Contents
Fund Summaries
Sentinel Balanced Fund
Investment Objective
The Fund seeks capital appreciation and current income.
Fees and Expenses of the Fund
This table describes the fees and expenses that you may pay if you buy and hold shares of the Fund. You may qualify for sales charge discounts if you and your family invest, or agree to invest in the future, at least $25,000 in shares of the Sentinel Funds that include Class A shares. More information about these and other discounts is available from your financial professional and in the section entitled “Share Classes” on page 82 of the Fund’s prospectus and “How to Purchase Shares and Reduce Sales Charges” on page 44 of the Fund’s statement of additional information.
Shareholder Fees (fees paid directly from your investment)
| | Class A | Class C | Class I |
| Maximum Sales Charge (Load) Imposed on Purchases (as a percentage of offering price) | 5.00% | None | None |
| Maximum Deferred Sales Charge (Load)(as a percentage of purchase price or redemption proceeds, whichever is less) | None* | 1.00% | None |
| Redemption Fees (as a percentage of amounts redeemed or exchanged within 30 days) | 0.00% | 0.00% | 0.00% |
Annual Fund Operating Expenses (expenses that you pay each year as a percentage of the value of your investment) [all to be updated]
| | Class A | Class C | Class I |
| Management Fee | 0.53% | 0.53% | 0.53% |
| Distribution and/or Service (12b-1) Fees | 0.25% | 1.00% | None |
| Other Expenses | 0.23% | 0.25% | 0.28% |
| Acquired Fund Fees and Expenses@ | 0.02% | 0.02% | 0.02% |
| Total Annual Fund Operating Expenses | 1.03% | 1.80% | 0.83% |
* You pay a deferred sales charge of 1% on certain redemptions of Class A shares made within twelve months of purchase if you bought them without an initial sales charge as part of an investment of $1,000,000 or more.
@ “Acquired Fund Fees and Expenses” are expenses indirectly incurred by the Fund through its investments in one or more underlying funds, including money market funds. Because these costs are indirect, the Total Annual Fund Operating Expenses do not correlate to the ratio of expenses to average net assets in the Fund’s most recent annual report.
Example This Example is intended to help you compare the cost of investing in the Fund with the cost of investing in other mutual funds. The Example assumes that you invest $10,000 in the Fund for the time periods indicated and then redeem all of your shares at the end of those periods. The Example also assumes that your investment has a 5% return each year and that the Fund’s operating expenses remain the same. Although your actual costs may be higher or lower, based on these assumptions, your costs would be:
| Class | 1 Year | 3 Years | 5 Years | 10 Years |
| Class A | $600 | $811 | $1,040 | $1,696 |
| Class C | 283 | 566 | 975 | 2,116 |
| Class I | 85 | 265 | 460 | 1,025 |
You would pay the following expenses if you did not redeem your shares:
| Class | 1 Year | 3 Years | 5 Years | 10 Years |
| Class C | $183 | $566 | $975 | $2,116 |
Portfolio Turnover
The Fund pays transaction costs, such as commissions, when it buys and sells securities (or “turns over” its portfolio). A higher portfolio turnover rate may indicate higher transaction costs and may result in higher taxes when Fund shares are held in a taxable account. These costs, which are not reflected in annual fund operating expenses or in the example, affect the Fund’s performance. During the most recent fiscal year the Fund’s portfolio turnover rate was 45% of the average value of its portfolio.
Principal Investment Strategies
The Fund normally invests primarily in common stocks and investment-grade bonds with at least 25% of its assets in bonds and at least 25% of its assets in common stock. When determining this percentage, convertible bonds and/or preferred stocks are considered common stocks, unless these securities are held primarily for income. Sentinel will divide the Fund’s assets among stocks and bonds based on whether it believes stocks or bonds offer a better value at the time. More bonds normally enhance price stability, and more stocks usually enhance growth potential. Up to 25% of the Fund’s assets may be invested in securities within a single industry.
With respect to equities, Sentinel’s investment philosophy centers on building a diverse portfolio consisting largely of securities of high quality companies with a positive multi-year outlook offered at attractive valuation levels, based on a number of metrics, including value relative to its history, peers and/or the market over time. Although the Fund may invest in any economic sector, at times it may emphasize one or more particular sectors. Sentinel has a preference for companies that earn above-average rates of return on capital and that generate free cash flow. Additionally, earnings revision trends are important. The Fund may invest without limitation in foreign securities. Under normal circumstances, the equity securities in which the Fund invests are predominantly those of U.S. companies.
The bond portion of the Fund may be invested without limitation in bonds in the first through the fourth highest rating categories of Moody’s (Aaa to Baa) and Standard and Poor’s (AAA to BBB). No more than 20% of the Fund’s total assets may be invested in lower-quality bonds (e.g., bonds rated below Baa by Moody’s or BBB by Standard & Poor’s). These lower-quality bonds have speculative characteristics and are sometimes referred to as “junk bonds”.
The Fund may make unlimited investments in U.S. government mortgage-backed securities (“MBS”) issued and/or guaranteed by the Federal National Mortgage Association (“FNMA” or “Fannie Mae”), the Federal Home Loan Mortgage Corporation (“FHLMC” or “Freddie Mac”) and by the Government National Mortgage Association (“GNMA” or “Ginnie Mae”). While the original maximum life of a mortgage-backed security considered for this Fund can vary, its average life is likely to be substantially less than the original maturity of the underlying mortgages, because the mortgages in these pools may be prepaid, refinanced, curtailed, or foreclosed. Prepayments are passed through to the mortgage-backed security holder along with regularly scheduled minimum repayments of principal and payments of interest.
The Fund may purchase or sell agency MBS on a “to be announced” or “TBA” basis, where the Fund buys or sells agency MBS on a forward commitment basis. In a TBA securities transaction, the seller of the agency MBS agrees on a sale price, but does not specify which particular securities will be delivered to the buyer on settlement day. Instead, only a few basic characteristics of the securities are agreed upon, such as the coupon rate and the face value. The Fund may engage in short sales of agency MBS that the Fund does not own, primarily as part of a TBA swap transaction. A TBA swap transaction involves an agreement to purchase one agency MBS and a simultaneous agreement to sell a different agency MBS.
The Fund may invest in exchange-traded funds (“ETFs”) in carrying out its investment strategies with respect to the fixed-income portion of the portfolio. The Fund considers investments in bond ETFs (ETFs whose underlying portfolio consists of debt instruments) as investments in fixed income instruments.
The Fund may attempt to hedge various risks, such as interest rate, credit and currency risk, using derivative instruments (e.g., exchange-traded futures and options, and other derivatives such as swaps, options on swaps, and caps and floors), and may use derivative instruments for other investment purposes, such as replicating permitted investments, as long as such investments do not have the effect of leveraging portfolio risks. The Fund is not required to use hedging and may choose not to do so.
In managing the fixed-income portion of the portfolio, the Fund utilizes an active trading approach, which is expected to result in portfolio turnover greater than 100%.
The Fund may sell a security if the fundamentals of the company are deteriorating or the original investment premise is no longer valid, the security is trading meaningfully higher than what the portfolio manager believes is a fair valuation, to manage the size of the holding or the sector weighting and/or to take advantage of a more attractive investment opportunity. The Fund may also sell a security to meet redemptions.
Principal Investment Risks
You could lose money by investing in the Fund. An investment in the Fund is not a deposit of a bank and is not insured or guaranteed by the Federal Deposit Insurance Corporation or any other government agency. The following is a summary description of the principal risks of investing in the Fund:
| | • | Asset Allocation Risk. The Fund’s allocations to the various asset classes and market sectors could cause the Fund to underperform other funds with a similar investment objective. |
| | • | Derivatives Risk. Derivative investments involve counterparty risk (the risk that the counterparty of the derivative transaction or clearing member used by the Fund to hold a cleared derivatives contract will be unable or unwilling to honor its financial obligation to the Fund), basis risk (the risk that the derivative instrument will not fully offset the underlying positions), and liquidity risk (the risk that the Fund cannot sell the derivative instrument because of an illiquid secondary market). In addition, the portfolio manager may incorrectly forecast the values of securities, currencies or interest rates or other economic factors in using derivatives for the Fund. Certain aspects of the tax treatment of derivative instruments, including swap agreements and commodity-linked derivative instruments, are currently unclear and may be affected by changes in legislation, regulations or other legally binding authority that could affect the character, timing and amount of the Fund’s taxable income or gains and distributions. |
| | • | ETF Risk. Owning an ETF generally reflects the risks of owning the underlying securities it is designed to track. ETFs typically trade on a securities exchange and their shares may, at times, trade at a premium or discount to their net asset values. In addition, an ETF may not replicate exactly the performance of the benchmark index it seeks to track for a number of reasons, including transaction costs incurred by the ETF, the temporary unavailability of certain index securities in the secondary market or discrepancies between the ETF and the index with respect to the weighting or number of instruments held by the ETF. Investing in ETFs, which are investment companies, may involve duplication of advisory fees and certain other expenses. The Fund will incur brokerage costs when purchasing and selling shares of ETFs. |
| | • | Foreign Banks and Securities Depositories Risk. Some foreign banks and securities depositories in which the Fund generally holds its foreign securities may be recently organized or new to the foreign custody business. In addition, there may be limited or no regulatory oversight over their operations. Also, the laws of certain countries may put limits on the Fund’s ability to recover its assets if a foreign bank, depository or issuer of a security, or any of their agents, goes bankrupt. |
| | • | General Fixed-Income Securities Risk. The market prices of bonds, including those issued by the U.S. government, go up as interest rates fall, and go down as interest rates rise. As a result, the net asset value of the Fund will fluctuate with conditions in the bond markets. Bonds with longer durations are generally more sensitive to interest rate changes than those with shorter durations. As of the date of this Prospectus, interest rates in the United States are near historic lows. If interest rates rise quickly, it may have a pronounced negative effect on the prices on the bonds held by the Fund. In the case of corporate bonds and commercial paper, values may fluctuate as perceptions of credit quality change. Fixed-income securities may be difficult to purchase and sell in adverse market conditions. In addition, corporate bonds may be downgraded or default. During periods of declining interest rates or for other reasons, bonds may be “called”, or redeemed, by the bond issuer prior to the bond’s maturity date, resulting in the Fund receiving payment earlier than expected. This may reduce the Fund’s income if the proceeds are reinvested at a lower interest rate. |
| | • | General Foreign Securities Risk. Investments in foreign securities may be affected unfavorably by changes in currency rates or exchange control regulations, or political and/or social instability in a particular foreign country or region. |
| | • | Government Securities Risk. Economic, business, or political developments may affect the ability of government-sponsored guarantors to repay principal and to make interest payments on the securities in which the Fund invests. In addition, certain of these securities, including those issued or guaranteed by FNMA and FHLMC, are not backed by the full faith and credit of the U.S. government. |
| | • | High Portfolio Turnover Risk. An active trading approach increases the Fund’s costs and may reduce the Fund’s performance. It may also increase the amount of capital gains tax that you have to pay on the Fund’s returns. |
| | • | Investment Style Risk. The Fund uses a “blend” strategy to invest in both growth and value stocks, and/or in stocks with characteristics of both. This strategy may be out of favor at any particular time. The prices of growth stocks may fall dramatically if the company fails to meet earnings or revenue projections. The prices of value stocks may lag the stock market for long periods of time if the market fails to recognize the company’s intrinsic worth. |
| | • | Lower-Quality Bonds Risk. Bonds with lower credit ratings are more speculative and likely to default than higher-quality bonds. Lower-rated bonds also tend to fluctuate more widely in value. |
| | • | Mortgage-Backed Securities Risk. Mortgage-backed securities represent interests in “pools” of mortgages and are subject to certain additional risks. When interest rates rise, certain obligations will be paid off by the obligor more slowly than anticipated causing the value of these securities to fall. This is known as extension risk. In addition, adjustable and fixed rate mortgage-related securities are subject to prepayment risk. When interest rates decline, borrowers may pay off their mortgages sooner than expected. This can reduce the returns of the Fund because the Fund may have to reinvest that money |
| | | at the lower prevailing interest rates. These securities also are subject to risk of default on the underlying mortgage, particularly during periods of economic downturn. |
| | • | Sector Risk. Investments in a particular sector may trail returns from other economic sectors. |
| | • | Short Sales Risk. Short sale transactions involving TBA securities involve leverage risk because they can result in investment exposure greater than the amount of the initial investment. Entering into a short position involves speculative exposure risk. If the price of the security increases between the date of the short sale and the date on which the Fund replaces the security, the Fund may incur a loss (without a limit). |
| | • | Stock Market and Selection Risk. The stock market may go down in value, and may go down sharply and unpredictably. The stocks selected by the portfolio manager may underperform the stock market or other funds with similar investment objectives and investment strategies. |
| | • | To-Be-Announced (“TBA”) Securities Risk. In a TBA securities transaction, the Fund commits to purchase certain securities for a fixed price at a future date. TBA securities include when-issued and delayed delivery securities and forward commitments. TBA securities involve the risk that the security the Fund buys will lose value prior to its delivery. There also is the risk that the security will not be issued or that the other party to the transaction will not meet its obligation. If this occurs, the Fund loses both the investment opportunity for the assets it set aside to pay for the security and any gain in the security’s price. |
Performance
The following bar chart and table provide some indication of the risks of investing in the Fund by showing changes in the Fund’s performance from year to year and by showing how the Fund’s average annual returns for 1, 5 and 10 years compare with those of broad measures of market performance. The bar chart shows changes in the Fund’s performance for Class A shares for each calendar year over a ten-year period. Sales charges are not reflected in the bar chart. If sales charges were reflected, returns would be less than those shown. However, the table includes, for share classes with a sales charge, the effect of the maximum sales charge, including any contingent deferred sales charge that would apply to a redemption at the end of the period. How the Fund performed in the past (before and after taxes) is not necessarily an indication of how the Fund will perform in the future. Updated information on the Fund’s results can be obtained by visiting www.sentinelinvestments.com.
Performance of the Class A shares prior to June 30, 2012, has not been adjusted to reflect the decrease in the maximum 12b-1 fee from 0.30% to 0.25%. If it had, those returns would be higher. Performance of the Class I shares prior to August 27, 2007 (the inception date for the Class I shares) is based on the Fund’s Class A share performance, restated to reflect that Class I shares are offered without a sales charge.
Fund Inception: 1938
Annual Total Return for Class A Shares (%) as of December 31
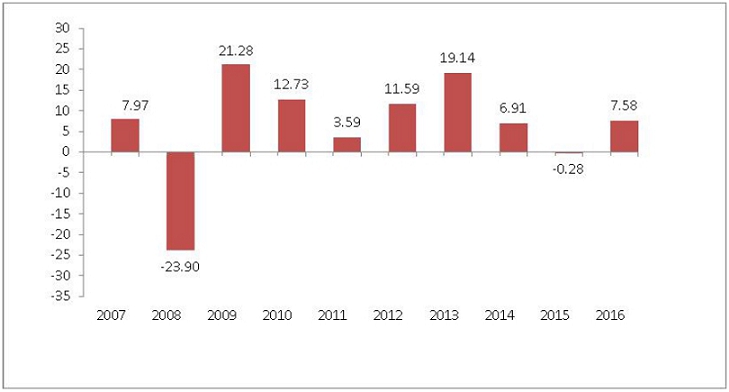
During the ten-year period shown in the above bar chart, the highest return for a quarter was 11.94 % (quarter ended June 30, 2009) and the lowest return for a quarter was -13.84% (quarter ended December 31, 2008).
Average Annual Total Return (%)
| For the periods ended | | | |
| December 31, 2016 | 1 Year | 5 Years | 10 Years |
| Return Before Taxes: Class A | 2.22 | 7.69 | 5.36 |
| | | | |
| Return After Taxes on Distributions: Class A | 1.74 | 6.54 | 4.37 |
| | | | |
| Return After Taxes on Distributions and Sale of Fund Shares: Class A | 1.64 | 5.99 | 4.19 |
| | | | |
| Return Before Taxes: Class C | 5.76 | 7.95 | 5.01 |
| Return Before Taxes: Class I | 7.73 | 9.01 | 5.98 |
| Standard & Poor’s 500 Index (Reflects no deduction for fees, expenses or taxes) | 11.96 | 14.66 | 6.95 |
| Bloomberg Barclays US Aggregate Bond Index (Reflects no deduction for fees, expenses or taxes)1 | 2.65 | 2.23 | 4.34 |
1 The Bloomberg Barclays US Aggregate Bond Index measures the U.S. investment grade fixed-rate bond market, with index components for government and corporate securities, mortgage pass-through securities, and asset-backed securities. The Fund compares its performance to this index because the Fund’s investment strategy may include investments in the asset classes that comprise the index.
After-tax returns are calculated using the historical highest applicable individual federal marginal income tax rates in effect during the relevant period and do not reflect the impact of state and local taxes. Actual after-tax returns depend on an investor’s tax situation and may differ from those shown. After-tax returns are not relevant to investors who hold their Fund shares through tax-deferred arrangements, such as 401(k) plans or individual retirement accounts. After-tax returns are shown only for Class A shares and after-tax returns for other classes of shares will vary.
Management
Investment Adviser. Sentinel Asset Management, Inc. (“Sentinel”) is the investment adviser to the Fund.
Portfolio Managers. Daniel J. Manion, portfolio manager and Director of Equity Research with Sentinel, has been a portfolio manager of the Fund since 2004. Jason Doiron, portfolio manager and Head of Investments with Sentinel, has been a portfolio manager of the Fund since 2012.
Mr. Manion has announced his intention to retire from Sentinel in the second quarter of 2017. Following his retirement, he will no longer manage the Fund.
Purchase and Sale of Fund Shares
Investors may purchase or redeem Fund shares on any day that the New York Stock Exchange is open for business using the options and applicable contact information listed below. Investors who wish to purchase, exchange or redeem Fund shares through a broker-dealer should contact the broker-dealer directly.
| By wire transfer: | By mail: | By telephone: | Online: |
| Contact the Fund at 800-282-3863 | Sentinel Investments
PO Box 55929
Boston, MA 02205-5929 | 1-800-282-FUND (3863). Redemptions by telephone are only permitted upon previously receiving appropriate authorization. | If you already have an account and have elected to do so, you may purchase or redeem shares of the Fund by accessing the Fund’s website at www.sentinelinvestments.com. |
The minimum initial and subsequent investment amounts for various types of accounts are shown below, although we may reduce or waive the minimums in some cases.
| | Retirement Accounts | All Other Accounts | Automatic
Investment
Plan |
| | Initial | Subsequent | Initial | Subsequent | |
| Classes A and C | $1,000 | $50 | $1,000 | $50 | $50 |
Class I shares are only available to institutional investors, with certain limited exceptions. There is a $1 million initial investment minimum for institutional investors, with certain exceptions.
Tax Information
Dividends and capital gain distributions you receive from the Fund may be subject to federal income taxes and may be taxed as ordinary income or capital gains. If you are a tax-exempt investor or are investing through a retirement plan you may be subject to federal income tax upon withdrawal from such tax deferred arrangements. In addition, dividends and capital gain distributions you receive from the Fund may also be subject to state and local taxes.
Payments to Broker-Dealers and Other Financial Intermediaries
If you purchase the Fund through a broker-dealer or other financial intermediary (such as a bank), the Fund and its related companies may pay the intermediary for the sale of Fund shares and related services. These payments may create a conflict of interest by influencing the broker-dealer or other intermediary and your salesperson to recommend the Fund over another investment. Ask your salesperson or visit your financial intermediary’s website for more information.
Sentinel Common Stock Fund
Investment Objective
The Fund seeks a combination of capital appreciation and income.
Fees and Expenses of the Fund
This table describes the fees and expenses that you may pay if you buy and hold shares of the Fund. You may qualify for sales charge discounts if you and your family invest, or agree to invest in the future, at least $25,000 in shares of the Sentinel Funds that include Class A shares. More information about these and other discounts is available from your financial professional and in the section entitled “Share Classes” on page 82 of the Fund’s prospectus and “How to Purchase Shares and Reduce Sales Charges” on page 44 of the Fund’s statement of additional information.
Shareholder Fees (fees paid directly from your investment)
| | Class A | Class C | Class I | Class R6 |
| Maximum Sales Charge (Load) Imposed on Purchases (as a percentage of offering price) | 5.00% | None | None | None |
| Maximum Deferred Sales Charge (Load)(as a percentage of purchase price or redemption proceeds, whichever is less) | None* | 1.00% | None | None |
| Redemption Fees (as a percentage of amounts redeemed or exchanged within 30 days) | 0.00% | 0.00% | 0.00% | 0.00% |
Annual Fund Operating Expenses (expenses that you pay each year as a percentage of the value of your investment)
| | Class A | Class C | Class I | Class R6 |
| Management Fee | 0.57% | 0.57% | 0.57% | 0.57% |
| Distribution and/or Service (12b-1) Fees | 0.25% | 1.00% | None | None |
| Other Expenses | 0.18% | 0.22% | 0.15% | 0.15% |
| Total Annual Fund Operating Expenses | 1.00% | 1.79% | 0.72% | 0.72% |
| Fee Waiver and/or Expense Reimbursement** | None | None | None | (0.07)% |
| Total Annual Fund Operating Expenses After Fee Waiver and/or Expense Reimbursement** | 1.00% | 1.79% | 0.72% | 0.65% |
* You pay a deferred sales charge of 1% on certain redemptions of Class A shares made within twelve months of purchase if you bought them without an initial sales charge as part of an investment of $1,000,000 or more.
** The Fund’s investment advisor has contractually agreed, effective March 30, 2017, to waive fees and/or reimburse certain expenses in order to limit Total Annual Fund Operating Expenses After Fee Waiver and/or Expense Reimbursement for Class R6 shares, on an annualized basis, to 0.65% of average daily net assets attributable to Class R6 shares through March 31, 2018. The Fund may have to repay some of these waivers and reimbursements to the Fund’s investment adviser in the following two years. This agreement may be terminated upon 90 days’ notice by a majority of the non-interested directors of the Fund.
Example
This Example is intended to help you compare the cost of investing in the Fund with the cost of investing in other mutual funds. The Example assumes that you invest $10,000 in the Fund for the time periods indicated and then redeem all of your shares at the end of those periods. The Example also assumes that your investment has a 5% return each year and that the Fund’s operating expenses remain the same. Although your actual costs may be higher or lower, based on these assumptions, your costs would be:
| Class | 1 Year | 3 Years | 5 Years | 10 Years |
| Class A | $597 | $802 | $1,025 | $1,663 |
| Class C | 282 | 563 | 970 | 2,105 |
| Class I | 74 | 230 | 401 | 894 |
| Class R6 | 74 | 230 | 401 | 894 |
You would pay the following expenses if you did not redeem your shares:
| Class | 1 Year | 3 Years | 5 Years | 10 Years |
| Class C | $182 | $563 | $970 | $2,105 |
Portfolio Turnover
The Fund pays transaction costs, such as commissions, when it buys and sells securities (or “turns over” its portfolio). A higher portfolio turnover rate may indicate higher transaction costs and may result in higher taxes when Fund shares are held in a taxable account. These costs, which are not reflected in annual fund operating expenses or in the example, affect the Fund’s performance. During the most recent fiscal year the Fund’s portfolio turnover rate was 8% of the average value of its portfolio.
Principal Investment Strategies
The Fund normally invests at least 80% of its net assets in common stocks. The Fund invests mainly in a diverse group of common stocks of well-established companies, typically above $5 billion in market capitalization, many of which historically have paid regular dividends. When appropriate, the Fund also may invest in preferred stocks or debentures convertible into common stocks. Up to 25% of the Fund’s assets may be invested in securities within a single industry. The Fund may invest without limitation in foreign securities. Under normal circumstances, the Fund invests predominantly in common stocks of U.S. companies.
Sentinel’s investment philosophy centers on building a diverse portfolio consisting largely of securities of high quality companies with a positive multi-year outlook offered at attractive valuation levels, based on a number of metrics, including value relative to its history, peers and/or the market over time. Although the Fund may invest in any economic sector, at times it may emphasize one or more particular sectors. Sentinel has a preference for companies that earn above-average rates of return on capital and that generate free cash flow. Additionally, earnings revision trends are important.
The Fund may sell a security if the fundamentals of the company are deteriorating or the original investment premise is no longer valid, the security is trading meaningfully higher than what the portfolio managers believe is a fair valuation, to manage the size of the holding or the sector weighting and/or to take advantage of a more attractive investment opportunity. A security may also be sold to meet redemptions.
Principal Investment Risks
You could lose money by investing in the Fund. An investment in the Fund is not a deposit of a bank and is not insured or guaranteed by the Federal Deposit Insurance Corporation or any other government agency. The following is a summary description of the principal risks of investing in the Fund:
| | • | Foreign Banks and Securities Depositories Risk. Some foreign banks and securities depositories in which the Fund generally holds its foreign securities may be recently organized or new to the foreign custody business. In addition, there may be limited or no regulatory oversight over their operations. Also, the laws of certain countries may put limits on the Fund’s ability to recover its assets if a foreign bank, depository or issuer of a security, or any of their agents, goes bankrupt. |
| | • | General Foreign Securities Risk. Investments in foreign securities may be affected unfavorably by changes in currency rates or exchange control regulations, or political and/or social instability in a particular foreign country or region. |
| | • | Investment Style Risk. The Fund uses a “blend” strategy to invest in both growth and value stocks, and/or in stocks with characteristics of both. This strategy may be out of favor at any particular time. The prices of growth stocks may fall dramatically if the company fails to meet earnings or revenue projections. The prices of value stocks may lag the stock market for long periods of time if the market fails to recognize the company’s intrinsic worth. |
| | • | Sector Risk. Investments in a particular sector may trail returns from other economic sectors. |
| | • | Stock Market and Selection Risk. The stock market may go down in value, and may go down sharply and unpredictably. The stocks selected by the portfolio manager may underperform the stock market or other funds with similar investment objectives and investment strategies. |
Performance
The following bar chart and table provide some indication of the risks of investing in the Fund by showing changes in the Fund’s performance from year to year and by showing how the Fund’s average annual returns for 1, 5 and 10 years compare with those of a broad measure of market performance. The bar chart shows changes in the Fund’s performance for Class A shares for each calendar year over a ten-year period. Sales charges are not reflected in the bar chart. If sales charges were reflected, returns would be less than
those shown. However, the table includes, for share classes with a sales charge, the effect of the maximum sales charge, including any contingent deferred sales charge that would apply to a redemption at the end of the period. How the Fund performed in the past (before and after taxes) is not necessarily an indication of how the Fund will perform in the future. Updated information on the Fund’s results can be obtained by visiting www.sentinelinvestments.com.
Performance of the Class A shares prior to June 30, 2012, has not been adjusted to reflect the decrease in the maximum 12b-1 fee from 0.30% to 0.25%. If it had, those returns would be higher. Performance of the Class I shares prior to May 4, 2007 (the inception date for the Class I shares) is based on the Fund’s Class A share performance, restated to reflect that Class I shares are offered without a sales charge. Performance of the Class R6 shares prior to December 23, 2014 (the inception date for the Class R6 shares) is based on the Fund’s Class A share performance, restated to reflect that Class R6 shares are offered without a sales charge.
Fund Inception: 1934
Annual Total Return for Class A Shares (%) as of December 31
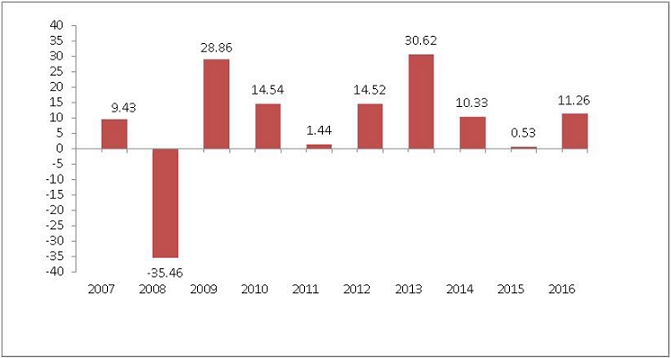
During the ten-year period shown in the above bar chart, the highest return for a quarter was 17.55% (quarter ended June 30, 2009) and the lowest return for a quarter was -21.75% (quarter ended December 31, 2008).
Average Annual Total Return (%)
| For the periods ended | | | |
| December 31, 2016 | 1 Year | 5 Years | 10 Years |
| Return Before Taxes: Class A | 5.70 | 11.89 | 6.37 |
| Return After Taxes on Distributions: Class A | 3.97 | 10.16 | 5.37 |
| Return After Taxes on Distributions and Sale of Fund Shares: Class A* | 4.65 | 9.39 | 5.08 |
| Return Before Taxes: Class C | 9.38 | 12.14 | 6.01 |
| Return Before Taxes: Class I | 11.58 | 13.38 | 7.27 |
| Return Before Taxes: Class R6 | 11.64 | 13.20 | 6.99 |
| Standard & Poor’s 500 Index (Reflects no deduction for fees, expenses or taxes) | 11.96 | 14.66 | 6.95 |
* Return after taxes on distributions and sale of fund shares may be higher than return before taxes and/or return after taxes on distributions when a net capital loss occurs upon the redemption of fund shares.
After-tax returns are calculated using the historical highest applicable individual federal marginal income tax rates in effect during the relevant period and do not reflect the impact of state and local taxes. Actual after-tax returns depend on an investor’s tax situation and may differ from those shown. After-tax returns are not relevant to investors who hold their Fund shares through tax-deferred arrangements, such as 401(k) plans or individual retirement accounts. After-tax returns are shown only for Class A shares and after-tax returns for other classes of shares will vary.
Management
Investment Adviser. Sentinel Asset Management, Inc. (“Sentinel”) is the investment adviser to the Fund.
Portfolio Managers. Daniel J. Manion, portfolio manager and Director of Equity Research with Sentinel, has been a portfolio manager of the Fund since 1994. Hilary Roper, portfolio manager with Sentinel, has been a portfolio manager of the Fund since 2010.
Mr. Manion has announced his intention to retire from Sentinel in the second quarter of 2017. Following his retirement, he will no longer manage the Fund.
Purchase and Sale of Fund Shares
Investors may purchase or redeem Fund shares on any day that the New York Stock Exchange is open for business using the options and applicable contact information listed below. Investors who wish to purchase, exchange or redeem Fund shares through a broker-dealer should contact the broker-dealer directly.
| By wire transfer: | By mail: | By telephone: | Online: |
| Contact the Fund at 800-282-3863 | Sentinel Investments
PO Box 55929
Boston, MA 02205-5929 | 1-800-282-FUND (3863). Redemptions by telephone are only permitted upon previously receiving appropriate authorization. | If you already have an account and have elected to do so, you may purchase or redeem shares of the Fund by accessing the Fund’s website at www.sentinelinvestments.com. |
The minimum initial and subsequent investment amounts for various types of accounts are shown below, although we may reduce or waive the minimums in some cases.
| | Retirement Accounts | All Other Accounts | Automatic |
| | | | | | Investment |
| | | | | | Plan |
| | Initial | Subsequent | Initial | Subsequent | |
| Classes A and C | $1,000 | $50 | $1,000 | $50 | $50 |
Class I shares are only available to institutional investors, with certain limited exceptions. There is a $1 million initial investment minimum for institutional investors, with certain exceptions.
Class R6 shares are available to certain employer sponsored group retirement and group 529 college savings plans; registered investment companies; institutions, trusts and foundations with a $1 million initial investment; and certain fee-based advisory programs.
Tax Information
Dividends and capital gain distributions you receive from the Fund may be subject to federal income taxes and may be taxed as ordinary income or capital gains. If you are a tax-exempt investor or are investing through a retirement plan you may be subject to federal income tax upon withdrawal from such tax deferred arrangements. In addition, dividends and capital gain distributions you receive from the Fund may also be subject to state and local taxes.
Payments to Broker-Dealers and Other Financial Intermediaries
If you purchase the Fund through a broker-dealer or other financial intermediary (such as a bank), the Fund and its related companies may pay the intermediary for the sale of Fund shares and related services. These payments may create a conflict of interest by influencing the broker-dealer or other intermediary and your salesperson to recommend the Fund over another investment. Ask your salesperson or visit your financial intermediary’s website for more information.
Sentinel Government Securities Fund
Investment Objective
The Fund seeks a high level of current income consistent with the preservation of principal.
Fees and Expenses of the Fund
This table describes the fees and expenses that you may pay if you buy and hold shares of the Fund. You may qualify for sales charge discounts if you and your family invest, or agree to invest in the future, at least $100,000 in shares of the Sentinel Funds that include Class A shares. More information about these and other discounts is available from your financial professional and in the section entitled “Share Classes” on page 82 of the Fund’s prospectus and “How to Purchase Shares and Reduce Sales Charges” on page 44 of the Fund’s statement of additional information.
Shareholder Fees (fees paid directly from your investment)
| | Class A | Class C | Class I |
| Maximum Sales Charge (Load) Imposed on Purchases (as a percentage of offering price) | 2.25% | None | None |
| Maximum Deferred Sales Charge (Load)(as a percentage of purchase price or redemption proceeds, whichever is less) | None* | 1.00% | None |
| Redemption Fees (as a percentage of amounts redeemed or exchanged within 30 days) | None | None | None |
Annual Fund Operating Expenses (expenses that you pay each year as a percentage of the value of your investment)
| | Class A | Class C | Class I |
| Management Fee | 0.45% | 0.45% | 0.45% |
| Distribution and/or Service (12b-1) Fees | 0.20% | 1.00% | None |
| Other Expenses | 0.26% | 0.27% | 0.23% |
| Acquired Fund Fees and Expenses@ | 0.01% | 0.01% | 0.01% |
| Total Annual Fund Operating Expenses | 0.92% | 1.73% | 0.69% |
* You pay a deferred sales charge of 0.50% on certain redemptions of Class A shares made within twelve months of purchase if you bought them without an initial sales charge as part of an investment of $500,000 or more.
@ “Acquired Fund Fees and Expenses” are expenses indirectly incurred by the Fund through its investments in one or more underlying funds, including money market funds. Because these costs are indirect, the Total Annual Fund Operating Expenses do not correlate to the ratio of expenses to the average net assets in the Fund’s most recent annual report.
Example
This Example is intended to help you compare the cost of investing in the Fund with the cost of investing in other mutual funds. The Example assumes that you invest $10,000 in the Fund for the time periods indicated and then redeem all of your shares at the end of those periods. The Example also assumes that your investment has a 5% return each year and that the Fund’s operating expenses remain the same. Although your actual costs may be higher or lower, based on these assumptions, your costs would be:
| Class | 1 Year | 3 Years | 5 Years | 10 Years |
| Class A | $317 | $512 | $723 | $1,331 |
| Class C | 276 | 545 | 939 | 2,041 |
| Class I | 70 | 221 | 384 | 859 |
You would pay the following expenses if you did not redeem your shares:
| Class | 1 Year | 3 Years | 5 Years | 10 Years |
| Class C | $176 | $545 | $939 | $2,041 |
Portfolio Turnover
The Fund pays transaction costs, such as commissions, when it buys and sells securities (or “turns over” its portfolio). A higher portfolio turnover rate may indicate higher transaction costs and may result in higher taxes when Fund shares are held in a taxable account. These costs, which are not reflected in annual fund operating expenses or in the example, affect the Fund’s performance. During the most recent fiscal year the Fund’s portfolio turnover rate was 59% of the average value of its portfolio.
Principal Investment Strategies
The Fund normally invests at least 80% of its net assets in U.S. government securities and related derivatives. Related derivatives include exchange-traded futures on U.S. Treasury notes and bonds, and options on these futures, and other derivatives intended to hedge interest rate risk, such as swaps, options on swaps, and interest rate caps and floors. The Fund invests mainly in U.S. government bonds. These bonds include direct obligations of the U.S. Treasury, obligations guaranteed by the U.S. government, and obligations of U.S. government agencies and instrumentalities. The Fund is not required, however, to invest set amounts in any of the various types of U.S. government securities. Sentinel will choose the types of U.S. government securities that it believes will provide capital preservation and the best return with the least risk in light of its analysis of current market conditions and its outlook for interest rates and the economy.
The Fund invests substantially in U.S. government mortgage-backed securities (“MBS”) issued and/or guaranteed by the Federal National Mortgage Association (“FNMA” or “Fannie Mae”), the Federal Home Loan Mortgage Corporation (“FHLMC” or “Freddie Mac”) and the Government National Mortgage Association (“GNMA” or “Ginnie Mae”). The Fund may also purchase or sell agency MBS on a “to be announced” or “TBA” basis, where the Fund buys or sells agency MBS on a forward commitment basis. In a TBA securities transaction, the seller of the agency MBS agrees on a sale price, but does not specify which particular securities will be delivered to the buyer on settlement day. Instead, only a few basic characteristics of the securities are agreed upon, such as the coupon rate and the face value. The Fund may engage in short sales of agency MBS that the Fund does not own, primarily as part of a TBA swap transaction. A TBA swap transaction involves an agreement to purchase one agency MBS and a simultaneous agreement to sell a different agency MBS.
The Fund may attempt to hedge various risks, such as interest rate risk, using derivative instruments (e.g., futures and options on futures, swaps, options on swaps, and caps and floors), and may use derivative instruments for other investment purposes such as replicating permitted investments, as long as such investments do not have the effect of leveraging portfolio risks. The Fund is not required to use hedging and may choose not to do so.
The Fund may sell a security if the security is overvalued on a relative basis compared to other securities available in the market or for duration management purposes. The Fund may also sell a security to meet redemptions.
The Fund utilizes an active trading approach, which is expected to result in portfolio turnover greater than 100%.
Principal Investment Risks
You could lose money by investing in the Fund. An investment in the Fund is not a deposit of a bank and is not insured or guaranteed by the Federal Deposit Insurance Corporation or any other government agency. The following is a summary description of the principal risks of investing in the Fund:
| | • | Derivatives Risk. Derivative investments involve counterparty risk (the risk that the counterparty of the derivative transaction or clearing member used by the Fund to hold a cleared derivatives contract will be unable or unwilling to honor its financial obligation to the Fund), basis risk (the risk that the derivative instrument will not fully offset the underlying positions), and liquidity risk (the risk that the Fund cannot sell the derivative instrument because of an illiquid secondary market). In addition, the portfolio manager may incorrectly forecast the values of securities, currencies or interest rates or other economic factors in using derivatives for the Fund. Certain aspects of the tax treatment of derivative instruments, including swap agreements and commodity-linked derivative instruments, are currently unclear and may be affected by changes in legislation, regulations or other legally binding authority that could affect the character, timing and amount of the Fund’s taxable income or gains and distributions. |
| | • | General Fixed-Income Securities Risk. The market prices of bonds, including those issued by the U.S. government, go up as interest rates fall, and go down as interest rates rise. As a result, the net asset value of the Fund will fluctuate with conditions in the bond markets. Fixed-income securities may be difficult to purchase and sell in adverse market conditions. Bonds with longer durations are generally more sensitive to interest rate changes than those with shorter durations. As of the date of this Prospectus, interest rates in the United States are near historic lows. If interest rates rise quickly, it may have a pronounced negative effect on the prices on the bonds held by the Fund. |
| | • | Government Securities Risk. Economic, business, or political developments may affect the ability of government-sponsored guarantors to repay principal and to make interest payments on the securities in which the Fund invests. In addition, certain of these securities, including those issued or guaranteed by FNMA and FHLMC, are not backed by the full faith and credit of the U.S. government. |
| | • | High Portfolio Turnover Risk. An active trading approach increases the Fund’s costs and may reduce the Fund’s performance. It may also increase the amount of capital gains tax that you have to pay on the Fund’s returns. |
| | • | Mortgage-Backed Securities Risk. Mortgage-backed securities represent interests in “pools” of mortgages and are subject to certain additional risks. When interest rates rise, certain obligations will be paid off by the obligor more slowly than anticipated causing the value of these securities to fall. This is known as extension risk. In addition, adjustable and fixed rate mortgage-related securities are subject to prepayment risk. When interest rates decline, borrowers may pay off their mortgages sooner than expected. This can reduce the returns of the Fund because the Fund may have to reinvest that money at the lower prevailing interest rates. These securities also are subject to risk of default on the underlying mortgage, particularly during periods of economic downturn. |
| | • | Short Sales Risk. Short sale transactions involving TBA securities involve leverage risk because they can result in investment exposure greater than the amount of the initial investment. Entering into a short position involves speculative exposure risk. If the price of the security increases between the date of the short sale and the date on which the Fund replaces the security, the Fund may incur a loss (without a limit). |
| | • | To-Be-Announced (“TBA”) Securities Risk. In a TBA securities transaction, the Fund commits to purchase certain securities for a fixed price at a future date. TBA securities include when-issued and delayed delivery securities and forward commitments. TBA securities involve the risk that the security the Fund buys will lose value prior to its delivery. There also is the risk that the security will not be issued or that the other party to the transaction will not meet its obligation. If this occurs, the Fund loses both the investment opportunity for the assets it set aside to pay for the security and any gain in the security’s price. |
Performance
The following bar chart and table provide some indication of the risks of investing in the Fund by showing changes in the Fund’s performance from year to year and by showing how the Fund’s average annual returns for 1, 5 and 10 years compare with those of a broad measure of market performance. The bar chart shows changes in the Fund’s performance for Class A shares for each calendar year over a ten-year period. Sales charges are not reflected in the bar chart. If sales charges were reflected, returns would be less than those shown. However, the table includes, for share classes with a sales charge, the effect of the maximum sales charge, including any contingent deferred sales charge that would apply to a redemption at the end of the period. How the Fund performed in the past (before and after taxes) is not necessarily an indication of how the Fund will perform in the future. Updated information on the Fund’s results can be obtained by visiting www.sentinelinvestments.com.
Class A returns shown are based on the 2.25% maximum sales charge and are not adjusted to reflect a maximum 4% sales charge in effect from inception through April 10, 2005 and from June 1, 2006 through July 31, 2010. If they were, the returns would be lower. Class I share performance prior to May 4, 2007 (the inception date for the Class I shares) is based on the Fund’s Class A share performance, restated to reflect that Class I shares are offered without a sales charge.
Fund Inception: 1986
Annual Total Return for Class A Shares (%) as of December 31
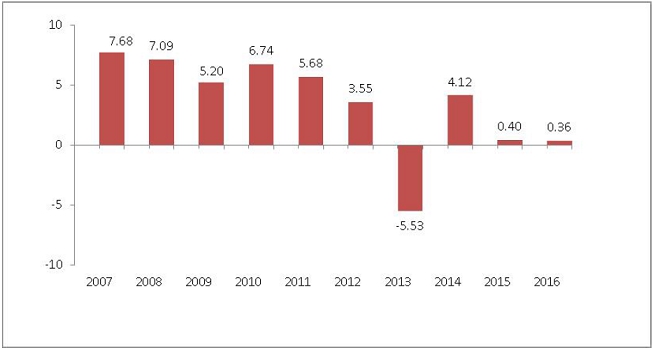
During the ten-year period shown in the above bar chart, the highest return for a quarter was 4.13% (quarter ended June 30, 2010) and the lowest return for a quarter was -2.88% (quarter ended June 30, 2013).
Average Annual Total Return (%)
For the periods ended
December 31, 2016 | 1 Year | 5 Years | 10 Years |
| Return Before Taxes: Class A | -1.91 | 0.06 | 3.22 |
| Return After Taxes on Distributions: Class A | -2.97 | -1.00 | 1.78 |
| Return After Taxes on Distributions and Sale of Fund Shares: Class A* | -1.07 | -0.40 | 1.95 |
| Return Before Taxes: Class C | -1.42 | -0.28 | 2.56 |
| Return Before Taxes: Class I | 0.67 | 0.77 | 3.72 |
Bloomberg Barclays US Government/Mortgage Backed Securities Index
(Reflects no deduction for fees, expenses or taxes) | 1.31 | 1.57 | 4.04 |
* Return after taxes on distributions and sale of fund shares may be higher than return before taxes and/or return after taxes on distributions when a net capital loss occurs upon the redemption of fund shares.
After-tax returns are calculated using the historical highest applicable individual federal marginal income tax rates in effect during the relevant period and do not reflect the impact of state and local taxes. Actual after-tax returns depend on an investor’s tax situation and may differ from those shown. After-tax returns are not relevant to investors who hold their Fund shares through tax-deferred arrangements, such as 401(k) plans or individual retirement accounts. After-tax returns are shown only for Class A shares and after-tax returns for other classes of shares will vary.
Management
Investment Adviser. Sentinel Asset Management, Inc. (“Sentinel”) is the investment adviser to the Fund.
Portfolio Managers. Jason Doiron, portfolio manager and Head of Investments with Sentinel, has been a portfolio manager of the Fund since 2012. Peter Hassler, portfolio manager with Sentinel, has been a portfolio manager of the Fund since 2014.
Purchase and Sale of Fund Shares
Investors may purchase or redeem Fund shares on any day that the New York Stock Exchange is open for business using the options and applicable contact information listed below. Investors who wish to purchase, exchange or redeem Fund shares through a broker-dealer should contact the broker-dealer directly.
By wire transfer:
Contact the Fund at 800-282-3863 | By mail:
Sentinel Investments
PO Box 55929
Boston, MA 02205-5929 | By telephone:
1-800-282-FUND (3863).
Redemptions by telephone are only permitted upon previously receiving appropriate authorization. | Online:
If you already have an account and have elected to do so, you may purchase or redeem shares of the Fund by accessing the Fund’s website at www.sentinelinvestments.com. |
The minimum initial and subsequent investment amounts for various types of accounts are shown below, although we may reduce or waive the minimums in some cases.
| | Retirement Accounts | All Other Accounts | Automatic |
| | | | | | Investment |
| | | | | | Plan |
| | Initial | Subsequent | Initial | Subsequent | |
| Classes A and C | $1,000 | $50 | $1,000 | $50 | $50 |
Class I shares are only available to institutional investors, with certain limited exceptions. There is a $1 million initial investment minimum for institutional investors, with certain exceptions.
Tax Information
Dividends and capital gain distributions you receive from the Fund may be subject to federal income taxes and may be taxed as ordinary income or capital gains. If you are a tax-exempt investor or are investing through a retirement plan you may be subject to federal income tax upon withdrawal from such tax deferred arrangements. In addition, dividends and capital gain distributions you receive from the Fund may also be subject to state and local taxes.
Payments to Broker-Dealers and Other Financial Intermediaries
If you purchase the Fund through a broker-dealer or other financial intermediary (such as a bank), the Fund and its related companies may pay the intermediary for the sale of Fund shares and related services. These payments may create a conflict of interest by influencing the broker-dealer or other intermediary and your salesperson to recommend the Fund over another investment. Ask your salesperson or visit your financial intermediary’s website for more information.
Sentinel International Equity Fund
Investment Objective
The Fund seeks growth of capital.
Fees and Expenses of the Fund
This table describes the fees and expenses that you may pay if you buy and hold shares of the Fund. You may qualify for sales charge discounts if you and your family invest, or agree to invest in the future, at least $25,000 in shares of the Sentinel Funds that include Class A shares. More information about these and other discounts is available from your financial professional and in the section entitled “Share Classes” on page 82 of the Fund’s prospectus and “How to Purchase Shares and Reduce Sales Charges” on page 44 of the Fund’s statement of additional information.
Shareholder Fees (fees paid directly from your investment)
| | Class A | Class C | Class I |
| Maximum Sales Charge (Load) Imposed on Purchases (as a percentage of offering price) | 5.00% | None | None |
| Maximum Deferred Sales Charge (Load)(as a percentage of purchase price or redemption proceeds, whichever is less) | None* | 1.00% | None |
| Redemption Fees (as a percentage of amounts redeemed or exchanged within 30 days) | 2.00% | 2.00% | 2.00% |
Annual Fund Operating Expenses (expenses that you pay each year as a percentage of the value of your investment)
| | Class A | Class C | Class I |
| Management Fee | 0.70% | 0.70% | 0.70% |
| Distribution and/or Service (12b-1) Fees | 0.25% | 1.00% | None |
| Other Expenses | 0.41% | 0.79% | 0.29% |
| Acquired Fund Fees and Expenses@ | 0.01% | 0.01% | 0.01% |
| Total Annual Fund Operating Expenses | 1.37% | 2.50% | 1.00% |
* You pay a deferred sales charge of 1% on certain redemptions of Class A shares made within twelve months of purchase if you bought them without an initial sales charge as part of an investment of $1,000,000 or more.
@ “Acquired Fund Fees and Expenses” are expenses indirectly incurred by the Fund through its investments in one or more underlying funds, including money market funds. Because these costs are indirect, the Total Annual Fund Operating Expenses do not correlate to the ratio of expenses to average net assets in the Fund’s most recent annual report.
Example
This Example is intended to help you compare the cost of investing in the Fund with the cost of investing in other mutual funds. The Example assumes that you invest $10,000 in the Fund for the time periods indicated and then redeem all of your shares at the end of those periods. The Example also assumes that your investment has a 5% return each year and that the Fund’s operating expenses remain the same. Although your actual costs may be higher or lower, based on these assumptions, your costs would be:
| Class | 1 Year | 3 Years | 5 Years | 10 Years |
| Class A | $633 | $912 | $1,212 | $2,064 |
| Class C | 353 | 779 | 1,331 | 2,836 |
| Class I | 102 | 318 | 552 | 1,225 |
You would pay the following expenses if you did not redeem your shares:
| Class | 1 Year | 3 Years | 5 Years | 10 Years |
| Class C | $253 | $779 | $1,331 | $2,836 |
Portfolio Turnover
The Fund pays transaction costs, such as commissions, when it buys and sells securities (or “turns over” its portfolio). A higher portfolio turnover rate may indicate higher transaction costs and may result in higher taxes when Fund shares are held in a taxable account. These costs, which are not reflected in annual fund operating expenses or in the example, affect the Fund’s performance. During the most recent fiscal year the Fund’s portfolio turnover rate was 36% of the average value of its portfolio.
Principal Investment Strategies
The Fund normally invests at least 80% of its net assets in equity securities. The Fund invests mainly in common stocks of established companies located in or that conduct their business mainly in one or more foreign countries, which may include emerging markets. The Fund will normally be invested in ten or more foreign countries and may invest up to 40% of its assets in any one country if Sentinel feels that economic and business conditions make it appropriate to do so. The Fund focuses its investments on developed foreign countries, but may invest up to 25% of its total assets in emerging markets. It normally will have substantial investments in European countries. Normally, at least 75% of the Fund’s total assets are invested in securities of non-U.S. issuers selected by Sentinel mainly for their long-term capital growth prospects. The remaining 25% may be invested in companies organized in the United States that have at least 50% of their assets and/or revenues outside the United States. The Fund also expects to purchase American Depositary Receipts (ADRs) and Global Depositary Receipts in bearer form, which are designed for use in non-U.S. securities markets.
The Fund also may invest in convertible or debt securities rated Baa or higher by Moody’s Investors Service, Inc. or BBB or higher by Standard & Poor’s.
Sentinel employs a fundamental, bottom up approach to building its international equity portfolio. The process starts with a regular quantitative screening in order to narrow the investable universe. Stocks are then analyzed based on the following five fundamental factors: business quality, valuation, growth, management, and balance sheet strength. Risk is managed through portfolio diversification, by individual issuer, sector and country.
The Fund generally may sell a security when there is a deterioration of one or more of the five factors described above or when the portfolio manager identifies a more favorable investment opportunity. The Fund may also sell a security to meet redemptions or for tax management purposes.
Principal Investment Risks
You could lose money by investing in the Fund. An investment in the Fund is not a deposit of a bank and is not insured or guaranteed by the Federal Deposit Insurance Corporation or any other government agency. The following is a summary description of the principal risks of investing in the Fund:
| | • | Emerging Markets Risk. The risks of foreign investments are usually much greater for the emerging markets. Investments in emerging markets may be considered speculative. Emerging markets are riskier because they develop unevenly and may never fully develop. In addition, many emerging securities markets have lower trading volumes and less liquidity than developed markets. |
| | • | Foreign Banks and Securities Depositories Risk. Some foreign banks and securities depositories in which the Fund generally holds its foreign securities may be recently organized or new to the foreign custody business. In addition, there may be limited or no regulatory oversight over their operations. Also, the laws of certain countries may put limits on the Fund’s ability to recover its assets if a foreign bank, depository or issuer of a security, or any of their agents, goes bankrupt. |
| | • | General Foreign Securities Risk. Investments in foreign securities may be affected unfavorably by changes in currency rates or exchange control regulations, or political and/or social instability in a particular foreign country or region. |
| | • | Investment Style Risk. The Fund’s growth style of investing may be out of favor at any particular time. The stocks of growth companies may be more sensitive to investor perceptions about company earnings than other stocks and may be more volatile than the market in general. |
| | • | Sector Risk. Investments in a particular sector may trail returns from other economic sectors. |
| | • | Stock Market and Selection Risk. The stock market may go down in value, and may go down sharply and unpredictably. The stocks selected by the portfolio manager may underperform the stock market or other funds with similar investment objectives and investment strategies. |
Performance
The following bar chart and table provide some indication of the risks of investing in the Fund by showing changes in the Fund’s performance from year to year and by showing how the Fund’s average annual returns for 1, 5 and 10 years compare with those of a broad measure of market performance. The bar chart shows changes in the Fund’s performance for Class A shares for each calendar year over a ten-year period. Sales charges are not reflected in the bar chart. If sales charges were reflected, returns would be less than those shown. However, the table includes, for share classes with a sales charge, the effect of the maximum sales charge, including any contingent deferred sales charge that would apply to a redemption at the end of the period. How the Fund performed in the past (before and after taxes) is not necessarily an indication of how the Fund will perform in the future. Updated information on the Fund’s results can be obtained by visiting www.sentinelinvestments.com.
Performance of the Class A shares prior to June 30, 2012, has not been adjusted to reflect the decrease in the maximum 12b-1 fee from 0.30% to 0.25%. If it had, those returns would be higher. Performance of the Class I shares prior to August 27, 2007 (the inception date for the Class I shares) is based on the Fund’s Class A share performance, restated to reflect that Class I shares are offered without a sales charge.
Fund Inception: 1993
Annual Total Return for Class A Shares (%) as of December 31

During the ten-year period shown in the above bar chart, the highest return for a quarter was 24.26% (quarter ended June 30, 2009) and the lowest return for a quarter was -21.09% (quarter ended September 30, 2011).
Average Annual Total Return (%)
For the periods ended
December 31, 2016 | 1 Year | 5 Years | 10 Years |
| Return Before Taxes: Class A | -6.54 | 6.08 | 1.07 |
| Return After Taxes on Distributions: Class A | -6.69 | 4.89 | 0.26 |
| Return After Taxes on Distributions and Sale of Fund Shares: Class A* | -3.59 | 4.73 | 0.90 |
| Return Before Taxes: Class C | -3.69 | 5.69 | 0.24 |
| Return Before Taxes: Class I | -1.29 | 7.67 | 1.98 |
| Morgan Stanley Capital International “EAFE” (Europe, Australasia, Far East) Index (Reflects no deduction for fees, expenses or taxes) | 1.00 | 6.53 | 0.75 |
* Return after taxes on distributions and sale of fund shares may be higher than return before taxes and/or return after taxes on distributions when a net capital loss occurs upon the redemption of fund shares.
After-tax returns are calculated using the historical highest applicable individual federal marginal income tax rates in effect during the relevant period and do not reflect the impact of state and local taxes. Actual after-tax returns depend on an investor’s tax situation and may differ from those shown. After-tax returns are not relevant to investors who hold their Fund shares through tax-deferred arrangements, such as 401(k) plans or individual retirement accounts. After-tax returns are shown only for Class A shares and after-tax returns for other classes of shares will vary.
Management
Investment Adviser. Sentinel Asset Management, Inc. (“Sentinel”) is the investment adviser to the Fund.
Portfolio Manager. Andrew Boczek, portfolio manager with Sentinel, has been a portfolio manager of the Fund since 2012.
Purchase and Sale of Fund Shares
Investors may purchase or redeem Fund shares on any day that the New York Stock Exchange is open for business using the options and applicable contact information listed below. Investors who wish to purchase, exchange or redeem Fund shares through a broker-dealer should contact the broker-dealer directly.
By wire transfer:
Contact the Fund at 800-282-3863 | By mail:
Sentinel Investments
PO Box 55929
Boston, MA 02205-5929 | By telephone:
1-800-282-FUND (3863).
Redemptions by telephone are only permitted upon previously receiving appropriate authorization. | Online:
If you already have an account and have elected to do so, you may purchase or redeem shares of the Fund by accessing the Fund’s website at www.sentinelinvestments.com. |
The minimum initial and subsequent investment amounts for various types of accounts are shown below, although we may reduce or waive the minimums in some cases.
| | Retirement Accounts | All Other Accounts | Automatic |
| | | | | | Investment |
| | | | | | Plan |
| | Initial | Subsequent | Initial | Subsequent | |
| Classes A and C | $1,000 | $50 | $1,000 | $50 | $50 |
Class I shares are only available to institutional investors, with certain limited exceptions. There is a $1 million initial investment minimum for institutional investors, with certain exceptions.
Tax Information
Dividends and capital gain distributions you receive from the Fund may be subject to federal income taxes and may be taxed as ordinary income or capital gains. If you are a tax-exempt investor or are investing through a retirement plan you may be subject to
federal income tax upon withdrawal from such tax deferred arrangements. In addition, dividends and capital gain distributions you receive from the Fund may also be subject to state and local taxes.
Payments to Broker-Dealers and Other Financial Intermediaries
If you purchase the Fund through a broker-dealer or other financial intermediary (such as a bank), the Fund and its related companies may pay the intermediary for the sale of Fund shares and related services. These payments may create a conflict of interest by influencing the broker-dealer or other intermediary and your salesperson to recommend the Fund over another investment. Ask your salesperson or visit your financial intermediary’s website for more information.
Sentinel Low Duration Bond Fund
Investment Objective
The Fund seeks high current income and limited fluctuations in principal value.
Fees and Expenses of the Fund
This table describes the fees and expenses that you may pay if you buy and hold shares of the Fund. You may qualify for sales charge discounts if you and your family invest, or agree to invest in the future, at least $1,000,000 in shares of the Sentinel Funds that include Class A shares. More information about these and other discounts is available from your financial professional and in the section entitled “Share Classes” on page 82 of the Fund’s prospectus and “How to Purchase Shares and Reduce Sales Charges” on page 44 of the Fund’s statement of additional information.
Shareholder Fees (fees paid directly from your investment)
| | Class A | Class S | Class I |
| Maximum Sales Charge (Load) Imposed on Purchases (as a percentage of offering price) | 1.00% | None | None |
| Maximum Deferred Sales Charge (Load)(as a percentage of purchase price or redemption proceeds, whichever is less) | None* | None | None |
| Redemption Fees (as a percentage of amounts redeemed or exchanged within 30 days) | None | None | None |
Annual Fund Operating Expenses (expenses that you pay each year as a percentage of the value of your investment)
| | Class A | Class S | Class I |
| Management Fee | 0.45% | 0.45% | 0.45% |
| Distribution and/or Service (12b-1) Fees | 0.25% | 0.50% | None |
| Other Expenses | 0.24% | 0.13% | 0.15% |
| Acquired Fund Fees and Expenses@ | 0.08% | 0.08% | 0.08% |
| Total Annual Fund Operating Expenses | 1.02% | 1.16% | 0.68% |
* You pay a deferred sales charge of 0.50% on certain redemptions of Class A shares made within twelve months of purchase if you bought them without an initial sales charge as part of an investment of $1,000,000 or more.
@ “Acquired Fund Fees and Expenses” are expenses indirectly incurred by the Fund through its investments in one or more underlying funds, including money market funds. Because these costs are indirect, the Total Annual Fund Operating Expenses do not correlate to the ratio of expenses to average net assets in the Fund’s most recent annual report.
Example
This Example is intended to help you compare the cost of investing in the Fund with the cost of investing in other mutual funds. The Example assumes that you invest $10,000 in the Fund for the time periods indicated and then redeem all of your shares at the end of those periods. The Example also assumes that your investment has a 5% return each year and that the Fund’s operating expenses remain the same. Although your actual costs may be higher or lower, based on these assumptions, your costs would be:
| Class | 1 Year | 3 Years | 5 Years | 10 Years |
| Class A | $203 | $421 | $658 | $1,335 |
| Class S | 118 | 368 | 638 | 1,409 |
| Class I | 69 | 218 | 379 | 847 |
Portfolio Turnover
The Fund pays transaction costs, such as commissions, when it buys and sells securities (or “turns over” its portfolio). A higher portfolio turnover rate may indicate higher transaction costs and may result in higher taxes when Fund shares are held in a taxable account. These costs, which are not reflected in annual fund operating expenses or in the example, affect the Fund’s performance. During the most recent fiscal year the Fund’s portfolio turnover rate was 117% of the average value of its portfolio.
Principal Investment Strategies
The Fund normally invests at least 80% of its net assets in fixed income instruments and related derivatives. The Fund seeks to achieve its investment objective by investing principally in a diversified portfolio of fixed income instruments of varying maturities, and related derivatives. Related derivatives include exchange-traded futures on U.S. Treasury notes and bonds and equity indexes, and options on these futures, and other derivatives intended to hedge interest rate risk and credit risk, such as interest rate caps and floors, swaps and options on swaps. Under normal market conditions, the Fund expects to invest at least 50% of its total assets in investment grade debt securities, such as:
| | • | Corporate debt securities issued by U.S. companies; |
| | • | Corporate debt securities issued by non-U.S. (including emerging markets) companies that are denominated in U.S. dollars; |
| | • | Mortgage-backed and other asset-backed securities; |
| | • | Securities issued or guaranteed by the U.S. government, its agencies or instrumentalities; and |
| | • | Inflation-linked investments. |
Under normal market conditions, the Fund expects to invest no more than 50% of its total assets in any one or combination of the following types of fixed income securities and other instruments:
| | • | Below investment-grade debt securities (sometimes called “junk bonds”); |
| | • | Debt securities of non-U.S. (including emerging markets) issuers that are denominated in foreign currencies; |
| | • | Senior bank loans, including participations; and |
| | • | Convertible securities, including convertible bonds and preferred stocks. |
The Fund attempts to manage interest rate risk through its management of the average duration of the securities it holds in its portfolio.
Under normal market conditions, the Fund expects to maintain its average duration range between zero and three years. Duration is a mathematical concept that measures a portfolio’s sensitivity to interest rate changes. The longer a portfolio’s duration, the more sensitive it is to changes in interest rates. The shorter a portfolio’s duration, the less sensitive it is to changes in interest rates. For example, the price of a portfolio with a duration of five years would be expected to fall approximately five percent if interest rates rose by one percentage point and a portfolio with a duration of two years would be expected to fall approximately two percent if interest rates rose by one percentage point.
The Fund may invest in exchange-traded funds (“ETFs”) in carrying out its investment strategies. The Fund considers investments in bond ETFs (ETFs whose underlying portfolio consists of debt instruments) as investments in fixed income instruments. At times, the Fund may have considerable exposure to ETFs.
The Fund may also purchase or sell “to be announced” or “TBA” securities, which usually are transactions in which the Fund buys or sells agency mortgage-backed securities (“MBS”) on a forward commitment basis. In a TBA transaction, the seller of the agency MBS agrees on a sale price, but does not specify which particular securities will be delivered to the buyer on settlement day. Instead, only a few basic characteristics of the securities are agreed upon, such as the coupon rate and the face value. The Fund may engage in short sales of agency MBS that the Fund does not own, primarily as part of a TBA swap transaction. A TBA swap transaction involves an agreement to purchase one agency MBS and a simultaneous agreement to sell a different agency MBS.
The Fund may use derivative instruments in order to hedge various risks and manage the average duration of the Fund’s portfolio. Currently, it expects to invest principally in futures, options, swaps and options on swaps. The Fund may use derivative instruments for other investment purposes, such as replicating permitted investments, as long as such investments do not have the effect of leveraging portfolio risks. The Fund is not required to use hedging and may choose not to do so.
The Fund utilizes an active trading approach which is expected to result in portfolio turnover greater than 100%.
Sentinel may sell a security if it no longer meets the Fund’s investment criteria, or for a variety of other reasons, such as to secure gains, limit losses, maintain its duration, redeploy assets into opportunities believed to be more promising, or satisfy redemption requests, among others.
Principal Investment Risks
You could lose money by investing in the Fund. An investment in the Fund is not a deposit of a bank and is not insured or guaranteed by the Federal Deposit Insurance Corporation or any other government agency. The following is a summary description of the principal risks of investing in the Fund:
| | • | Bank Loan Risk. The market for bank loans may not be highly liquid and, in some cases, the Fund may have to dispose of such securities at a substantial discount from face value. These investments expose the Fund to the credit risk of the underlying corporate borrower. |
| | • | Derivatives Risk. Derivative investments involve counterparty risk (the risk that the counterparty of the derivative transaction or clearing member used by the Fund to hold a cleared derivatives contract will be unable or unwilling to honor its financial obligation to the Fund), basis risk (the risk that the derivative instrument will not fully offset the underlying positions), and liquidity risk (the risk that the Fund cannot sell the derivative instrument because of an illiquid secondary market). In addition, the portfolio manager may incorrectly forecast the values of securities, currencies or interest rates or other economic factors in using derivatives for the Fund. Certain aspects of the tax treatment of derivative instruments, including swap agreements and commodity-linked derivative instruments, are currently unclear and may be affected by changes in legislation, regulations or other legally binding authority that could affect the character, timing and amount of the Fund’s taxable income or gains and distributions. |
| | • | ETF Risk. Owning an ETF generally reflects the risks of owning the underlying securities it is designed to track. ETFs typically trade on a securities exchange and their shares may, at times, trade at a premium or discount to their net asset values. In addition, an ETF may not replicate exactly the performance of the benchmark index it seeks to track for a number of reasons, including transaction costs incurred by the ETF, the temporary unavailability of certain index securities in the secondary market or discrepancies between the ETF and the index with respect to the weighting or number of instruments held by the ETF. Investing in ETFs, which are investment companies, may involve duplication of advisory fees and certain other expenses. The Fund will incur brokerage costs when purchasing and selling shares of ETFs. |
| | • | Foreign Banks and Securities Depositories Risk. Some foreign banks and securities depositories in which the Fund generally holds its foreign securities may be recently organized or new to the foreign custody business. In addition, there may be limited or no regulatory oversight over their operations. Also, the laws of certain countries may put limits on the Fund’s ability to recover its assets if a foreign bank, depository or issuer of a security, or any of their agents, goes bankrupt. |
| | • | General Fixed-Income Securities Risk. The market prices of bonds, including those issued by the U.S. government, go up as interest rates fall, and go down as interest rates rise. As a result, the net asset value of the Fund will fluctuate with conditions in the bond markets. Bonds with longer durations are generally more sensitive to interest rate changes than those with shorter durations. As of the date of this Prospectus, interest rates in the United States are near historic lows. If interest rates rise quickly, it may have a pronounced negative effect on the prices on the bonds held by the Fund. In the case of corporate bonds and commercial paper, values may fluctuate as perceptions of credit quality change. Fixed-income securities may be difficult to purchase and sell in adverse market conditions. In addition, corporate bonds may be downgraded or default. During periods of declining interest rates or for other reasons, bonds may be “called”, or redeemed, by the bond issuer prior to the bond’s maturity date, resulting in the Fund receiving payment earlier than expected. This may reduce the Fund’s income if the proceeds are reinvested at a lower interest rate. |
| | • | General Foreign Securities Risk. Investments in foreign securities may be affected unfavorably by changes in currency rates or exchange control regulations, or political and/or social instability in a particular foreign country or region. The Fund is not required to hedge against changes in foreign currency exchange rates. |
| | • | Government Securities Risk. Economic, business, or political developments may affect the ability of government-sponsored guarantors to repay principal and to make interest payments on the securities in which the Fund invests. In addition, certain of these securities, including those issued or guaranteed by FNMA and FHLMC, are not backed by the full faith and credit of the U.S. government. |
| | • | High Portfolio Turnover Risk. An active trading approach increases the Fund’s costs and may reduce the Fund’s performance. It may also increase the amount of capital gains tax that you have to pay on the Fund’s returns. |
| | • | Inflation-Linked Investments Risk. Unlike traditional fixed income securities, the principal and interest payments of inflation-linked securities issued by the U.S. Department of Treasury are adjusted periodically based on the inflation rate. The value of the Fund’s inflation-linked investments may be vulnerable to changes in expectations of inflation or interest rates. |
| | • | Lower-Quality Bonds Risk. Bonds with lower credit ratings, sometimes called “junk bonds”, are more speculative and likely to default than higher-quality bonds. Lower-rated bonds also tend to fluctuate more widely in value. |
| | • | Mortgage-Backed Securities Risk. Mortgage-backed securities represent interests in “pools” of mortgages and are subject to certain additional risks. When interest rates rise, certain obligations will be paid off by the obligor more slowly than anticipated causing the value of these securities to fall. This is known as extension risk. In addition, adjustable and fixed rate mortgage-related securities are subject to prepayment risk. When interest rates decline, borrowers may pay off their mortgages sooner than expected. This can reduce the returns of the Fund because the Fund may have to reinvest that money at the lower prevailing interest rates. These securities also are subject to risk of default on the underlying mortgage, particularly during periods of economic downturn. |
| | • | Municipal Securities Risk. Municipal securities can be significantly affected by political changes as well as uncertainties in the municipal market related to taxation, legislative changes, or the rights of municipal security holders. |
| | • | Short Sales Risk. Short sale transactions involving TBA securities involve leverage risk because they can result in investment exposure greater than the amount of the initial investment. Entering into a short position involves speculative exposure risk. |
| | | If the price of the security increases between the date of the short sale and the date on which the Fund replaces the security, the Fund may incur a loss (without a limit). |
| | • | To-Be-Announced (“TBA”) Securities Risk. In a TBA securities transaction, the Fund commits to purchase certain securities for a fixed price at a future date. TBA securities include when-issued and delayed delivery securities and forward commitments. TBA securities involve the risk that the security the Fund buys will lose value prior to its delivery. There also is the risk that the security will not be issued or that the other party to the transaction will not meet its obligation. If this occurs, the Fund loses both the investment opportunity for the assets it set aside to pay for the security and any gain in the security’s price. |
Performance
The following bar chart and table provide some indication of the risks of investing in the Fund by showing changes in the Fund’s performance from year to year and by showing how the Fund’s average annual returns for 1, 5 and 10 years compare with those of a broad measure of market performance. The bar chart shows changes in the Fund’s performance for Class A shares for each calendar year over a ten-year period. Sales charges are not reflected in the bar chart. If sales charges were reflected, returns would be less than those shown. However, the table includes, for share classes with a sales charge, the effect of the maximum sales charge, including any contingent deferred sales charge that would apply to a redemption at the end of the period. How the Fund performed in the past (before and after taxes) is not necessarily an indication of how the Fund will perform in the future. Updated information on the Fund’s results can be obtained by visiting www.sentinelinvestments.com.
The Class A returns shown are based on the 1% maximum sales charge and are not adjusted to reflect a maximum sales charge of 3% in effect from June 1, 2006 to December 31, 2008. If they were, the returns would be lower. Performance of the Class S shares prior to January 31, 2014 has not been adjusted to reflect the decrease in the maximum 12b-1 fee from 0.75% to 0.50%. If it had, those returns would be higher, except for the period from April 1, 2013 to January 30, 2014 during which a voluntary waiver of 0.25% of those fees was in effect. Performance of the Class I shares prior to January 31, 2014 (the inception date for Class I shares) is based on the Fund’s Class A share performance, restated to reflect that Class I shares are offered without a sales charge. Effective January 31, 2014, the Fund changed its investment strategies from investing primarily in U.S. government securities to investing in a variety of fixed income instruments. The performance information provided below for periods prior to January 31, 2014 relates to the Fund’s investment strategies that were in effect during such periods.
Fund Inception: 1995
Annual Total Return for Class A Shares (%) as of December 31
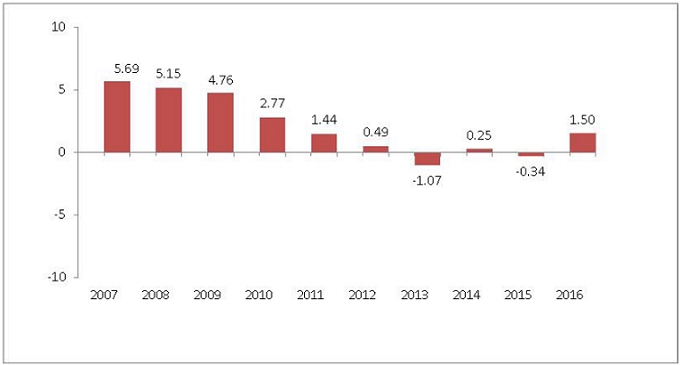
During the ten-year period shown in the above bar chart, the highest return for a quarter was 1.97% (quarter ended September 30, 2007) and the lowest return for a quarter was -1.14% (quarter ended December 31, 2016).
| Average Annual Total Return (%) | | | |
| | | | |
| For the periods ended | | | |
| December 31, 2016 | 1 Year | 5 Years | 10 Years |
| Return Before Taxes: Class A | 0.43 | -0.03 | 1.94 |
| Return After Taxes on Distributions: Class A | -0.37 | -0.82 | 0.93 |
| Return After Taxes on Distributions and Sale of Fund Shares: Class A* | 0.24 | -0.36 | 1.11 |
| Return Before Taxes: Class S | 1.46 | -0.01 | 1.73 |
| Return Before Taxes: Class I | 1.91 | 0.37 | 2.14 |
| Bloomberg Barclays 1-3 Year US Government/Credit Index (Reflects no deduction for fees, expenses or taxes) | 1.28 | 0.92 | 2.44 |
* Return after taxes on distributions and sale of fund shares may be higher than return before taxes and/or return after taxes on distributions when a net capital loss occurs upon the redemption of fund shares.
After-tax returns are calculated using the historical highest applicable individual federal marginal income tax rates in effect during the relevant period and do not reflect the impact of state and local taxes. Actual after-tax returns depend on an investor’s tax situation and may differ from those shown. After-tax returns are not relevant to investors who hold their Fund shares through tax-deferred arrangements, such as 401(k) plans or individual retirement accounts. After-tax returns are shown only for Class A shares and after-tax returns for other classes of shares will vary.
Management
Investment Adviser. Sentinel Asset Management, Inc. (“Sentinel”) is the investment adviser to the Fund.
Portfolio Manager. Jason Doiron, portfolio manager and Head of Investments with Sentinel, has been a portfolio manager of the Fund since 2012.
Purchase and Sale of Fund Shares
Investors may purchase or redeem Fund shares on any day that the New York Stock Exchange is open for business using the options and applicable contact information listed below. Investors who wish to purchase, exchange or redeem Fund shares through a broker-dealer should contact the broker-dealer directly.
| By wire transfer: | By mail: | By telephone: | Online: |
| Contact the Fund at 800-282-3863 | Sentinel Investments
PO Box 55929
Boston, MA 02205-5929 | 1-800-282-FUND (3863). Redemptions by telephone are only permitted upon previously receiving appropriate authorization. | If you already have an account and have elected to do so, you may purchase or redeem shares of the Fund by accessing the Fund’s website at www.sentinelinvestments.com. |
The minimum initial and subsequent investment amounts for various types of accounts are shown below, although we may reduce or waive the minimums in some cases.
| | Retirement Accounts | All Other Accounts | Automatic |
| | | | | | Investment |
| | | | | | Plan |
| | Initial | Subsequent | Initial | Subsequent | |
| Class A and S | $1,000 | $50 | $1,000 | $50 | $50 |
Class I shares are only available to institutional investors, with certain limited exceptions. There is a $1 million initial investment minimum for institutional investors, with certain exceptions.
Tax Information
Dividends and capital gain distributions you receive from the Fund may be subject to federal income taxes and may be taxed as ordinary income or capital gains. If you are a tax-exempt investor or are investing through a retirement plan you may be subject to
federal income tax upon withdrawal from such tax deferred arrangements. In addition, dividends and capital gain distributions you receive from the Fund may also be subject to state and local taxes.
Payments to Broker-Dealers and Other Financial Intermediaries
If you purchase the Fund through a broker-dealer or other financial intermediary (such as a bank), the Fund and its related companies may pay the intermediary for the sale of Fund shares and related services. These payments may create a conflict of interest by influencing the broker-dealer or other intermediary and your salesperson to recommend the Fund over another investment. Ask your salesperson or visit your financial intermediary’s website for more information.
Sentinel Multi-Asset Income Fund
Investment Objective
The Fund seeks a high level of current income, with a secondary objective of long-term capital appreciation.
Fees and Expenses of the Fund
This table describes the fees and expenses that you may pay if you buy and hold shares of the Fund. You may qualify for sales charge discounts if you and your family invest, or agree to invest in the future, at least $25,000 in shares of the Sentinel Funds that include Class A shares. More information about these and other discounts is available from your financial professional and in the section entitled “Share Classes” on page 82 of the Fund’s prospectus and “How to Purchase Shares and Reduce Sales Charges” on page 44 of the Fund’s statement of additional information.
Shareholder Fees (fees paid directly from your investment)
| | Class A | Class C | Class I |
| Maximum Sales Charge (Load) Imposed on Purchases (as a percentage of offering price) | 5.00% | None | None |
| Maximum Deferred Sales Charge (Load)(as a percentage of purchase price or redemption proceeds, whichever is less) | None* | 1.00% | None |
| Redemption Fees (as a percentage of amounts redeemed or exchanged within 30 days) | None | None | None |
Annual Fund Operating Expenses (expenses that you pay each year as a percentage of the value of your investment)
| | Class A | Class C | Class I |
| Management Fee | 0.53% | 0.53% | 0.53% |
| Distribution and/or Service (12b-1) Fees | 0.25% | 1.00% | None |
| Other Expenses | 0.23% | 0.22% | 0.26% |
| Acquired Fund Fees and Expenses@ | 0.19% | 0.19% | 0.19% |
| Total Annual Fund Operating Expenses | 1.20% | 1.94% | 0.98% |
* You pay a deferred sales charge of 1% on certain redemptions of Class A shares made within twelve months of purchase if you bought them without an initial sales charge as part of an investment of $1,000,000 or more.
@ “Acquired Fund Fees and Expenses” are expenses indirectly incurred by the Fund through its investments in one or more underlying funds, including money market funds. Because these costs are indirect, the Total Annual Fund Operating Expenses do not correlate to the ratio of expenses to average net assets in the Fund’s most recent annual report.
Example
This Example is intended to help you compare the cost of investing in the Fund with the cost of investing in other mutual funds. The Example assumes that you invest $10,000 in the Fund for the time periods indicated and then redeem all of your shares at the end of those periods. The Example also assumes that your investment has a 5% return each year and that the Fund’s operating expenses remain the same. Although your actual costs may be higher or lower, based on these assumptions, your costs would be:
| Class | 1 Year | 3 Years | 5 Years | 10 Years |
| Class A | $616 | $862 | $1,127 | $1,882 |
| Class C | 297 | 609 | 1,047 | 2,264 |
| Class I | 100 | 312 | 542 | 1,201 |
You would pay the following expenses if you did not redeem your shares:
| Class | 1 Year | 3 Years | 5 Years | 10 Years |
| Class C | $197 | $609 | $1,047 | $2,264 |
Portfolio Turnover
The Fund pays transaction costs, such as commissions, when it buys and sells securities (or “turns over” its portfolio). A higher portfolio turnover rate may indicate higher transaction costs and may result in higher taxes when Fund shares are held in a taxable account. These costs, which are not reflected in annual fund operating expenses or in the example, affect the Fund’s performance. During the most recent fiscal year the Fund’s portfolio turnover rate was 228% of the average value of its portfolio.
Principal Investment Strategies
The Fund normally invests in a broad range of debt instruments and equity securities. Sentinel has broad discretion to allocate assets among asset classes in order to pursue the Fund’s investment objective, and may shift the Fund’s investments from one asset class to another based on Sentinel’s analysis of the best opportunities for the Fund in a given market.
The debt instruments in which the Fund may invest include all varieties of fixed and floating rate instruments, including, without limitation, secured and unsecured bonds and mortgage-backed or other asset-backed securities. The debt instruments may be of any maturity and any credit quality, including high-yield (below investment-grade) bonds (sometimes called “junk bonds”). The Fund may invest up to 100% of its assets in debt instruments, and has the flexibility to invest exclusively in any one type of debt instrument, including junk bonds, or in any combination of debt instruments.
The Fund may invest in any stock or other equity security that Sentinel believes may assist the Fund in pursuing its investment objective, including common stocks of companies of any size or any market capitalization, preferred stock, utility stocks, publicly-traded real estate investment trusts (“REITs”) securities and other equity trusts and partnership interests, including master limited partnerships. The Fund may invest up to 100% of its assets in equity securities, but no more than 70% of its assets in equity securities of non-U.S. companies. Currently, the Fund expects to invest no more than 40% of its assets in equity securities.
The Fund may purchase or sell “to be announced” or “TBA” securities, which usually are transactions in which the Fund buys or sells agency mortgage-backed securities (“MBS”) on a forward commitment basis. In a TBA transaction, the seller of the agency MBS agrees on a sale price, but does not specify which particular securities will be delivered to the buyer on settlement day. Instead, only a few basic characteristics of the securities are agreed upon, such as the coupon rate and the face value. The Fund may engage in short sales of agency MBS that the Fund does not own, primarily as part of a TBA swap transaction. A TBA swap transaction involves an agreement to purchase one agency MBS and a simultaneous agreement to sell a different agency MBS.
Assets in which the Fund invests may be denominated in U.S. dollars or foreign currencies.
The Fund may invest in exchange-traded funds (“ETFs”) in carrying out its investment strategies. At times, the Fund may have considerable exposure to ETFs, potentially a majority of the Fund’s assets may be invested in a combination of different ETFs.
The Fund may attempt to hedge various risks, such as interest rate, equity, credit and currency risk, using derivative instruments (e.g., exchange-traded futures and options, and other derivatives such as swaps, options on swaps, and interest rate caps and floors), and may use derivative instruments for other investment purposes such as replicating permitted investments, as long as such investments do not have the effect of leveraging portfolio risks. The Fund is not required to use hedging and may choose not to do so.
The Fund utilizes an active trading approach, which is expected to result in portfolio turnover greater than 100%.
The Fund may sell a security if it no longer meets the Fund’s investment criteria, or for a variety of other reasons, such as to secure gains, limit losses, redeploy assets into opportunities believed to be more promising, or satisfy redemption requests, among others.
Principal Investment Risks
You could lose money by investing in the Fund. An investment in the Fund is not a deposit of a bank and is not insured or guaranteed by the Federal Deposit Insurance Corporation or any other government agency. The following is a summary description of the principal risks of investing in the Fund:
| | • | Asset Allocation Risk. The Fund’s allocations to the various asset classes and market sectors could cause the Fund to underperform other funds with a similar investment objective. |
| | • | Derivatives Risk. Derivative investments involve counterparty risk (the risk that the counterparty of the derivative transaction or clearing member used by the Fund to hold a cleared derivatives contract will be unable or unwilling to honor its financial obligation to the Fund), basis risk (the risk that the derivative instrument will not fully offset the underlying positions), and liquidity risk (the risk that the Fund cannot sell the derivative instrument because of an illiquid secondary market). In |
| | | addition, the portfolio manager may incorrectly forecast the values of securities, currencies or interest rates or other economic factors in using derivatives for the Fund. Certain aspects of the tax treatment of derivative instruments, including swap agreements and commodity-linked derivative instruments, are currently unclear and may be affected by changes in legislation, regulations or other legally binding authority that could affect the character, timing and amount of the Fund’s taxable income or gains and distributions. |
| | • | ETF Risk. Owning an ETF generally reflects the risks of owning the underlying securities it is designed to track. ETFs typically trade on a securities exchange and their shares may, at times, trade at a premium or discount to their net asset values. In addition, an ETF may not replicate exactly the performance of the benchmark index it seeks to track for a number of reasons, including transaction costs incurred by the ETF, the temporary unavailability of certain index securities in the secondary market or discrepancies between the ETF and the index with respect to the weighting or number of instruments held by the ETF. Investing in ETFs, which are investment companies, may involve duplication of advisory fees and certain other expenses. The Fund will incur brokerage costs when purchasing and selling shares of ETFs. |
| | • | General Fixed-Income Securities Risk. The market prices of bonds, including those issued by the U.S. government, go up as interest rates fall, and go down as interest rates rise. As a result, the net asset value of the Fund will fluctuate with conditions in the bond markets. Bonds with longer durations are generally more sensitive to interest rate changes than those with shorter durations. As of the date of this Prospectus, interest rates in the United States are near historic lows. If interest rates rise quickly, it may have a pronounced negative effect on the prices on the bonds held by the Fund. In the case of corporate bonds and commercial paper, values may fluctuate as perceptions of credit quality change. Fixed-income securities may be difficult to purchase and sell in adverse market conditions. In addition, corporate bonds may be downgraded or default. During periods of declining interest rates or for other reasons, bonds may be “called”, or redeemed, by the bond issuer prior to the bond’s maturity date, resulting in the Fund receiving payment earlier than expected. This may reduce the Fund’s income if the proceeds are reinvested at a lower interest rate. |
| | • | High Portfolio Turnover Risk. An active trading approach increases the Fund’s costs and may reduce the Fund’s performance. It may also increase the amount of capital gains tax that you have to pay on the Fund’s returns. |
| | • | Income Risk. Because the Fund can only distribute what it earns, the Fund’s distributions to shareholders may decline when prevailing interest rates fall or when the Fund experiences defaults on debt securities it holds. |
| | • | Lower-Quality Bonds Risk. Bonds with lower credit ratings are more speculative and likely to default than higher-quality bonds. Lower-rated bonds also tend to fluctuate more widely in value. |
| | • | Mortgage-Backed Securities Risk. Mortgage-backed securities represent interests in “pools” of mortgages and are subject to certain additional risks. When interest rates rise, certain obligations will be paid off by the obligor more slowly than anticipated causing the value of these securities to fall. This is known as extension risk. In addition, adjustable and fixed rate mortgage-related securities are subject to prepayment risk. When interest rates decline, borrowers may pay off their mortgages sooner than expected. This can reduce the returns of the Fund because the Fund may have to reinvest that money at the lower prevailing interest rates. These securities also are subject to risk of default on the underlying mortgage, particularly during periods of economic downturn. |
| | • | Preferred Stocks Risk. Preferred stock represents an equity or ownership interest in a company. Preferred stock normally pays dividends at a specified rate and has precedence over common stock in the event the issuer is liquidated or declares bankruptcy. However, in the event a company is liquidated or declares bankruptcy, the claims of owners of bonds take precedence over the claims of those who own preferred and common stock. If interest rates rise, the fixed dividend on preferred stocks may be less attractive, causing the price of such stocks to decline. Preferred stock is subject to many of the risks to which common stock and debt securities are subject. |
| | • | Real Estate-Related Investments Risk. The Fund’s investments in real estate investment trusts (“REITs”) are subject to risks affecting real estate investments generally (including market conditions and changes in the value of the underlying property, competition, zoning laws and other regulations, property obsolescence, changes in interest rates and casualty to real estate), as well as risks specifically affecting REITs (the quality and skill of REIT management and the internal expenses of the REIT). |
| | • | Sector Risk. Investments in a particular sector may trail returns from other economic sectors. |
| | • | Short Sales Risk. Short sale transactions involving TBA securities involve leverage risk because they can result in investment exposure greater than the amount of the initial investment. Entering into a short position involves speculative exposure risk. If the price of the security increases between the date of the short sale and the date on which the Fund replaces the security, the Fund may incur a loss (without a limit). |
| | • | Stock Market and Selection Risk. The stock market may go down in value, and may go down sharply and unpredictably. The stocks selected by the portfolio manager may underperform the stock market or other funds with similar investment objectives and investment strategies. |
| | • | To-Be-Announced (“TBA”) Securities Risk. In a TBA securities transaction, the Fund commits to purchase certain securities for a fixed price at a future date. TBA securities include when-issued and delayed delivery securities and forward commitments. TBA securities involve the risk that the security the Fund buys will lose value prior to its delivery. There also is the risk that the security will not be issued or that the other party to the transaction will not meet its obligation. If this |
| | | occurs, the Fund loses both the investment opportunity for the assets it set aside to pay for the security and any gain in the security’s price. |
| | • | Utilities Industry Risk. Utility company equity securities, to the extent they are purchased for their dividend yield, historically have been sensitive to interest rate movements. In addition, utility companies are subject to state and federal regulation, both respect to rates and operations, and face the potential for increased costs due to additional regulation and litigation. |
Performance
The following bar chart and table provide some indication of the risks of investing in the Fund by showing changes in the Fund’s performance from year to year and by showing how the Fund’s average annual returns for 1, 5 and 10 years compare with those of broad measures of market performance. The bar chart shows changes in the Fund’s performance for Class A shares for each calendar year over a ten-year period. Sales charges are not reflected in the bar chart. If sales charges were reflected, returns would be less than those shown. However, the table includes, for share classes with a sales charge, the effect of the maximum sales charge, including any contingent deferred sales charge that would apply to a redemption at the end of the period. How the Fund performed in the past (before and after taxes) is not necessarily an indication of how the Fund will perform in the future. Updated information on the Fund’s results can be obtained by visiting www.sentinelinvestments.com.
Performance of the Class A shares prior to June 30, 2012, has not been adjusted to reflect the decrease in the maximum 12b-1 fee from 0.30% to 0.25%. If it had, those returns would be higher. Performance of the Class I shares prior to December 17, 2010 (the inception date for the Class I shares) is based on the Fund’s Class A share performance, restated to reflect that Class I shares are offered without a sales charge. Effective July 1, 2014, the Fund changed its investment strategies. The performance information provided below for periods prior to July 1, 2014 relates to the Fund’s investment strategies that were in effect during such periods.
Fund Inception: 2003
Annual Total Return for Class A Shares (%) as of December 31
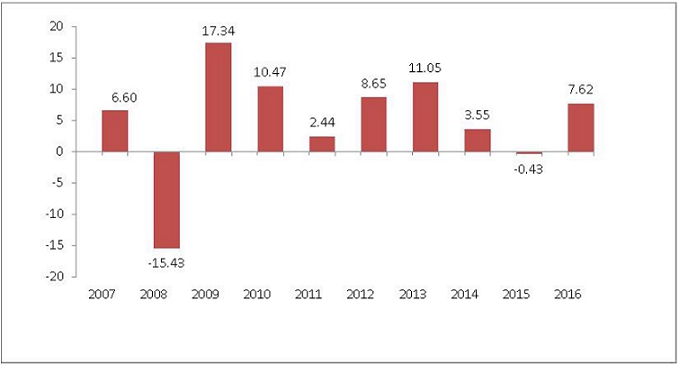
During the ten-year period shown in the above bar chart, the highest return for a quarter was 7.66% (quarter ended September 30, 2009) and the lowest return for a quarter was -10.97% (quarter ended December 31, 2008).
| Average Annual Total Return (%) | | | | | |
| | | | | | |
| For the periods ended | | | | | |
| December 31, 2016 | 1 Year | 5 Years | 10 Years |
| Return Before Taxes: Class A | 2.21 | | 4.93 | | 4.29 |
| Return After Taxes on Distributions: Class A | 0.60 | | 3.27 | | 3.03 |
| Return After Taxes on Distributions and Sale of Fund Shares: Class A* | 1.33 | | 3.39 | | 3.02 |
| Return Before Taxes: Class C | 5.88 | | 5.24 | | 4.03 |
| Return Before Taxes: Class I | 7.85 | | 6.25 | | 4.95 |
| Standard & Poor’s 500 Index (Reflects no deduction for fees, expenses or taxes) | 11.96 | | 14.66 | | 6.95 |
| Bloomberg Barclays US Aggregate Bond Index (Reflects no deduction for fees, expenses or taxes)1 | 2.65 | | 2.23 | | 4.34 |
* Return after taxes on distributions and sale of fund shares may be higher than return before taxes and/or return after taxes on distributions when a net capital loss occurs upon the redemption of fund shares.
1 The Bloomberg Barclays US Aggregate Bond Index measures the U.S. investment grade fixed-rate bond market, with index components for government and corporate securities, mortgage pass-through securities, and asset-backed securities. The Fund compares its performance to this index because the Fund’s investment strategy may include investments in the asset classes that comprise the index.
After-tax returns are calculated using the historical highest applicable individual federal marginal income tax rates in effect during the relevant period and do not reflect the impact of state and local taxes. Actual after-tax returns depend on an investor’s tax situation and may differ from those shown. After-tax returns are not relevant to investors who hold their Fund shares through tax-deferred arrangements, such as 401(k) plans or individual retirement accounts. After-tax returns are shown only for Class A shares and after-tax returns for other classes of shares will vary.
Management
Investment Adviser. Sentinel Asset Management, Inc. (“Sentinel”) is the investment adviser to the Fund.
Portfolio Manager. Jason Doiron, portfolio manager and Head of Investments with Sentinel, has been a portfolio manager of the Fund since 2009.
Purchase and Sale of Fund Shares
Investors may purchase or redeem Fund shares on any day that the New York Stock Exchange is open for business using the options and applicable contact information listed below. Investors who wish to purchase, exchange or redeem Fund shares through a broker-dealer should contact the broker-dealer directly.
| By wire transfer: | By mail: | By telephone: | Online: |
| Contact the Fund at 800-282-3863 | Sentinel Investments
PO Box 55929
Boston, MA 02205-5929 | 1-800-282-FUND (3863). Redemptions by telephone are only permitted upon previously receiving appropriate authorization. | If you already have an account and have elected to do so, you may purchase or redeem shares of the Fund by accessing the Fund’s website at www.sentinelinvestments.com. |
The minimum initial and subsequent investment amounts for various types of accounts are shown below, although we may reduce or waive the minimums in some cases.
| | Retirement Accounts | All Other Accounts | Automatic |
| | | | | | Investment |
| | | | | | Plan |
| | Initial | Subsequent | Initial | Subsequent | |
| Classes A and C | $1,000 | $50 | $1,000 | $50 | $50 |
Class I shares are only available to institutional investors, with certain limited exceptions. There is a $1 million initial investment minimum for institutional investors, with certain exceptions.
Tax Information
Dividends and capital gain distributions you receive from the Fund may be subject to federal income taxes and may be taxed as ordinary income or capital gains. If you are a tax-exempt investor or are investing through a retirement plan you may be subject to federal income tax upon withdrawal from such tax deferred arrangements. In addition, dividends and capital gain distributions you receive from the Fund may also be subject to state and local taxes.
Payments to Broker-Dealers and Other Financial Intermediaries
If you purchase the Fund through a broker-dealer or other financial intermediary (such as a bank), the Fund and its related companies may pay the intermediary for the sale of Fund shares and related services. These payments may create a conflict of interest by influencing the broker-dealer or other intermediary and your salesperson to recommend the Fund over another investment. Ask your salesperson or visit your financial intermediary’s website for more information.
Sentinel Small Company Fund
Investment Objective
The Fund seeks growth of capital.
Fees and Expenses of the Fund
This table describes the fees and expenses that you may pay if you buy and hold shares of the Fund. You may qualify for sales charge discounts if you and your family invest, or agree to invest in the future, at least $25,000 in shares of the Sentinel Funds that include Class A shares. More information about these and other discounts is available from your financial professional and in the section entitled “Share Classes” on page 82 of the Fund’s prospectus and “How to Purchase Shares and Reduce Sales Charges” on page 44 of the Fund’s statement of additional information.
Shareholder Fees (fees paid directly from your investment)
| | Class A | Class C | Class I | Class R6 |
| Maximum Sales Charge (Load) Imposed on Purchases (as a percentage of offering price) | 5.00% | None | None | None |
| Maximum Deferred Sales Charge (Load)(as a percentage of purchase price or redemption proceeds, whichever is less) | None* | 1.00% | None | None |
| Redemption Fees (as a percentage of amounts redeemed or exchanged within 30 days) | 2.00% | 2.00% | 2.00% | 2.00% |
Annual Fund Operating Expenses (expenses that you pay each year as a percentage of the value of your investment)
| | Class A | Class C | Class I | Class R6 |
| Management Fee | 0.67% | 0.67% | 0.67% | 0.67% |
| Distribution and/or Service (12b-1) Fees | 0.25%+ | 1.00% | None | None |
| Other Expenses | 0.29% | 0.28% | 0.22% | 0.32% |
| Acquired Fund Fees and Expenses@ | 0.01% | 0.01% | 0.01% | 0.01% |
| Total Annual Fund Operating Expenses | 1.22% | 1.96% | 0.90% | 1.00% |
| Fee Waiver and/or Expense Reimbursement** | None | None | None | (0.26)% |
| Total Annual Fund Operating Expenses After Fee Waiver and/or Expense Reimbursement** | 1.22% | 1.96% | 0.90% | 0.74% |
* You pay a deferred sales charge of 1% on certain redemptions of Class A shares made within twelve months of purchase if you bought them without an initial sales charge as part of an investment of $1,000,000 or more.
+ 12b-1 fees have been restated from fiscal year amounts to reflect the maximum fee payable under the applicable distribution plan for such share class. 12b-1 fees are not assessed with respect to shares owned by NLV Financial Corporation or an affiliate (“NLVFin”), which may result in an overall distribution fee charged to all shareholders of less than the maximum for so long as the NLVFin investment is maintained.
@ “Acquired Fund Fees and Expenses” are expenses indirectly incurred by the Fund through its investments in one or more underlying funds, including money market funds. Because these costs are indirect, the Total Annual Fund Operating Expenses do not correlate to the ratio of expenses to average net assets in the Fund’s most recent annual report.
** The Fund’s investment advisor has contractually agreed, effective March 30, 2017, to waive fees and/or reimburse certain expenses in order to limit Total Annual Fund Operating Expenses After Fee Waiver and/or Expense Reimbursement (excluding Acquired Fund Fees and Expenses) for Class R6 shares, on an annualized basis, to 0.73% of average daily net assets attributable to Class R6 shares through March 31, 2018. The Fund may have to repay some of these waivers and reimbursements to the Fund’s investment adviser in the following two years.
This agreement may be terminated upon 90 days’ notice by a majority of the non-interested directors of the Fund.
Example
This Example is intended to help you compare the cost of investing in the Fund with the cost of investing in other mutual funds. The Example assumes that you invest $10,000 in the Fund for the time periods indicated and then redeem all of your shares at the end of those periods. The Example also assumes that your investment has a 5% return each year and that the Fund’s operating expenses remain the same. Although your actual costs may be higher or lower, based on these assumptions, your costs would be:
| Class | 1 Year | 3 Years | 5 Years | 10 Years |
| Class A | $618 | $868 | $1,137 | $1,903 |
| Class C | 299 | 615 | 1,057 | 2,285 |
| Class I | 92 | 287 | 498 | 1,108 |
| Class R6 | 102 | 318 | 552 | 1,225 |
You would pay the following expenses if you did not redeem your shares:
| Class | 1 Year | 3 Years | 5 Years | 10 Years |
| Class C | $199 | $615 | $1,057 | $2,285 |
Portfolio Turnover
The Fund pays transaction costs, such as commissions, when it buys and sells securities (or “turns over” its portfolio). A higher portfolio turnover rate may indicate higher transaction costs and may result in higher taxes when Fund shares are held in a taxable account. These costs, which are not reflected in annual fund operating expenses or in the example, affect the Fund’s performance. During the most recent fiscal year the Fund’s portfolio turnover rate was 61% of the average value of its portfolio.
Principal Investment Strategies
The Fund normally invests at least 80% of its net assets in small-capitalization companies. For this purpose, small capitalization companies are companies that have, at the time of purchase, market capitalizations of less than $4 billion. For these purposes the market cap is determined at the time of purchase. The Fund seeks to invest primarily in common stocks of small companies that Sentinel believes are high quality, have superior business models, solid management teams, sustainable growth potential and are attractively valued. The Fund may invest without limitation in foreign securities, although only where the securities are trading in the U.S. or Canada and only where trading is denominated in U.S. or Canadian dollars.
Up to 25% of the Fund’s assets may be invested in securities within a single industry. The Fund attempts to be well-balanced across major economic sectors. Although the Fund may invest in any economic sector, at times it may emphasize one or more particular sectors.
At times the Fund may have less than 80% of its investments in companies with a market cap of less than $4 billion due to market appreciation.
The Fund would typically sell a security if the portfolio managers believe it is overvalued, if the original investment premise is no longer true, if the holding size exceeds the portfolio managers’ company or sector weighting guidelines and/or to take advantage of a more attractive investment opportunity. The Fund may also sell a partial position in a security in order to manage the size of the position. A security may also be sold to meet redemptions.
Principal Investment Risks
You could lose money by investing in the Fund. An investment in the Fund is not a deposit of a bank and is not insured or guaranteed by the Federal Deposit Insurance Corporation or any other government agency. The following is a summary description of the principal risks of investing in the Fund:
| | • | General Foreign Securities Risk. Investments in foreign securities may be affected unfavorably by changes in currency rates or exchange control regulations, or political and/or social instability in a particular foreign country or region. |
| | • | Illiquid Securities Risk. Securities held by the Fund that are not deemed to be illiquid at the time of purchase may become illiquid. The Fund will not be able to readily resell illiquid securities. The inability to sell these securities at the most opportune time may negatively affect the Fund’s net asset value. |
| | • | Investment Style Risk. The Fund’s growth style of investing may be out of favor at any particular time. The stocks of growth companies may be more sensitive to investor perceptions about company earnings than other stocks and may be more volatile than the market in general. |
| | • | Sector Risk. Investments in a particular sector may trail returns from other economic sectors. |
| | • | Stock Market and Selection Risk. The stock market may go down in value, and may go down sharply and unpredictably. The stocks selected by the portfolio manager may underperform the stock market or other funds with similar investment objectives and investment strategies. |
| | • | Stocks of Smaller Companies Risk. The stocks of small- and/or mid-capitalization companies in which the Fund invests typically involve more risk than the stocks of larger companies. These smaller companies may have more limited financial resources and product lines, and may have less seasoned managers. In addition, these stocks may trade less frequently and in lower share volumes, making them subject to wider price fluctuations. |
Performance
The following bar chart and table provide some indication of the risks of investing in the Fund by showing changes in the Fund’s performance from year to year and by showing how the Fund’s average annual returns for 1, 5 and 10 years compare with those of a broad measure of market performance. The bar chart shows changes in the Fund’s performance for Class A shares for each calendar year over a ten-year period. Sales charges are not reflected in the bar chart. If sales charges were reflected, returns would be less than those shown. However, the table includes, for share classes with a sales charge, the effect of the maximum sales charge, including any contingent deferred sales charge that would apply to a redemption at the end of the period. How the Fund performed in the past (before and after taxes) is not necessarily an indication of how the Fund will perform in the future. Updated information on the Fund’s results can be obtained by visiting www.sentinelinvestments.com.
Performance of the Class A shares prior to March 30, 2016, has not been adjusted to reflect the decrease in the maximum 12b-1 fee from 0.30% to 0.25%. If it had, those returns would be higher. Class I share performance prior to May 4, 2007 (the inception date for the Class I shares) is based on the Fund’s Class A share performance, restated to reflect that Class I shares are offered without a sales charge. Performance of the Class R6 shares prior to December 23, 2014 (the inception date for the Class R6 shares) is based on the Fund’s Class A share performance, restated to reflect that Class R6 shares are offered without a sales charge.
Fund Inception: 1993
Annual Total Return for Class A Shares (%) as of December 31
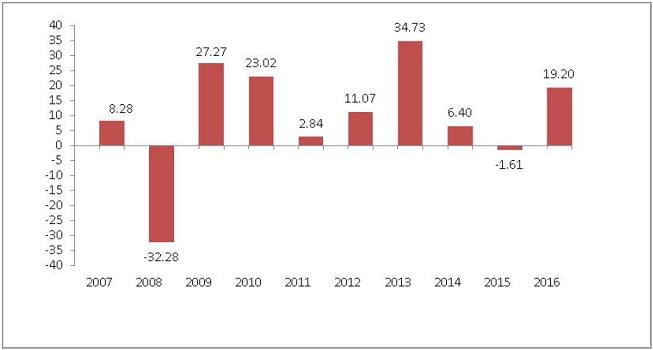
During the ten-year period shown in the above bar chart, the highest return for a quarter was 15.93% (quarter ended September 30, 2009) and the lowest return for a quarter was -24.08% (quarter ended December 31, 2008).
Average Annual Total Return (%)
For the periods ended
December 31, 2016 | 1 Year | 5 Years | 10 Years |
| Return Before Taxes: Class A | 13.30 | 12.16 | 7.67 |
| Return After Taxes on Distributions: Class A | 11.16 | 7.57 | 5.12 |
| Return After Taxes on Distributions and Sale of Fund Shares: Class A* | 9.32 | 9.21 | 5.95 |
| Return Before Taxes: Class C | 17.51 | 12.51 | 7.40 |
| Return Before Taxes: Class I | 19.68 | 13.69 | 8.64 |
| Return Before Taxes: Class R6 | 19.74 | 13.53 | 8.34 |
| Russell 2000® Index (Reflects no deduction for fees, expenses or taxes) | 21.31 | 14.46 | 7.07 |
* Return after taxes on distributions and sale of fund shares may be higher than return before taxes and/or return after taxes on distributions when a net capital loss occurs upon the redemption of fund shares.
After-tax returns are calculated using the historical highest applicable individual federal marginal income tax rates in effect during the relevant period and do not reflect the impact of state and local taxes. Actual after-tax returns depend on an investor’s tax situation and may differ from those shown. After-tax returns are not relevant to investors who hold their Fund shares through tax-deferred arrangements, such as 401(k) plans or individual retirement accounts. After-tax returns are shown only for Class A shares and after-tax returns for other classes of shares will vary.
Management
Investment Adviser. Sentinel Asset Management, Inc. (“Sentinel”) is the investment adviser to the Fund.
Portfolio Manager. Jason Ronovech, portfolio manager with Sentinel, has been a portfolio manager of the Fund since 2013.
Purchase and Sale of Fund Shares
Investors may purchase or redeem Fund shares on any day that the New York Stock Exchange is open for business using the options and applicable contact information listed below. Investors who wish to purchase, exchange or redeem Fund shares through a broker-dealer should contact the broker-dealer directly.
By wire transfer:
Contact the Fund at 800-282-3863 | By mail:
Sentinel Investments
PO Box 55929
Boston, MA 02205-5929 | By telephone:
1-800-282-FUND (3863). Redemptions by telephone are only permitted upon previously receiving appropriate authorization. | Online:
If you already have an account and have elected to do so, you may purchase or redeem shares of the Fund by accessing the Fund’s website at www.sentinelinvestments.com. |
The minimum initial and subsequent investment amounts for various types of accounts are shown below, although we may reduce or waive the minimums in some cases.
| | Retirement Accounts | All Other Accounts | Automatic |
| | | | | | Investment |
| | | | | | Plan |
| | Initial | Subsequent | Initial | Subsequent | |
| Classes A and C | $1,000 | $50 | $1,000 | $50 | $50 |
Class I shares are only available to institutional investors, with certain limited exceptions. There is a $1 million initial investment minimum for institutional investors, with certain exceptions.
Class R6 shares are available to certain employer sponsored group retirement and group 529 college savings plans; registered investment companies; institutions, trusts and foundations with a $1 million initial investment; and certain fee-based advisory programs.
Tax Information
Dividends and capital gain distributions you receive from the Fund may be subject to federal income taxes and may be taxed as ordinary income or capital gains. If you are a tax-exempt investor or are investing through a retirement plan you may be subject to federal income tax upon withdrawal from such tax deferred arrangements. In addition, dividends and capital gain distributions you receive from the Fund may also be subject to state and local taxes.
Payments to Broker-Dealers and Other Financial Intermediaries
If you purchase the Fund through a broker-dealer or other financial intermediary (such as a bank), the Fund and its related companies may pay the intermediary for the sale of Fund shares and related services. These payments may create a conflict of interest by influencing the broker-dealer or other intermediary and your salesperson to recommend the Fund over another investment. Ask your salesperson or visit your financial intermediary’s website for more information.
Sentinel Sustainable Core Opportunities Fund
Investment Objective
The Fund seeks long-term capital appreciation.
Fees and Expenses of the Fund
This table describes the fees and expenses that you may pay if you buy and hold shares of the Fund. You may qualify for sales charge discounts if you and your family invest, or agree to invest in the future, at least $25,000 in shares of the Sentinel Funds that include Class A shares. More information about these and other discounts is available from your financial professional and in the section entitled “Share Classes” on page 82 of the Fund’s prospectus and “How to Purchase Shares and Reduce Sales Charges” on page 44 of the Fund’s statement of additional information.
Shareholder Fees (fees paid directly from your investment)
| | Class A | Class I |
| Maximum Sales Charge (Load) Imposed on Purchases (as a percentage of offering price) | 5.00% | None |
| Maximum Deferred Sales Charge (Load)(as a percentage of purchase price or redemption proceeds, whichever is less) | None* | None |
| Redemption Fees (as a percentage of amounts redeemed or exchanged within 30 days) | None | None |
Annual Fund Operating Expenses (expenses that you pay each year as a percentage of the value of your investment)
| | Class A | Class I |
| Management Fee | 0.70% | 0.70% |
| Distribution and/or Service (12b-1) Fees | 0.25% | None |
| Other Expenses | 0.23% | 0.21% |
| Total Annual Fund Operating Expenses | 1.18% | 0.91% |
* You pay a deferred sales charge of 1% on certain redemptions of Class A shares made within twelve months of purchase if you bought them without an initial sales charge as part of an investment of $1,000,000 or more.
Example
This Example is intended to help you compare the cost of investing in the Fund with the cost of investing in other mutual funds. The Example assumes that you invest $10,000 in the Fund for the time periods indicated and then redeem all of your shares at the end of those periods. The Example also assumes that your investment has a 5% return each year and that the Fund’s operating expenses remain the same. Although your actual costs may be higher or lower, based on these assumptions, your costs would be:
| Class | 1 Year | 3 Years | 5 Years | 10 Years |
| Class A | $614 | $856 | $1,117 | $1,860 |
| Class I | 93 | 290 | 504 | 1,120 |
Portfolio Turnover
The Fund pays transaction costs, such as commissions, when it buys and sells securities (or “turns over” its portfolio). A higher portfolio turnover rate may indicate higher transaction costs and may result in higher taxes when Fund shares are held in a taxable account. These costs, which are not reflected in annual fund operating expenses or in the example, affect the Fund’s performance. During the most recent fiscal year the Fund’s portfolio turnover rate was 33% of the average value of its portfolio.
Principal Investment Strategies
The Fund normally invests at least 65% of its net assets in stocks of well-established U.S. companies, typically those above $5 billion in market capitalization.
Sentinel’s investment philosophy centers on building a diverse portfolio consisting largely of securities of high quality companies with a positive multi-year outlook offered at attractive valuation levels, based on a number of metrics, including value relative to its history, peers and/or the market over time. The Fund may also invest in stocks with the potential to provide current income, growth of income and relatively low risk as compared to the stock market as a whole when consistent with the Fund’s investment objective.
Up to 25% of the Fund’s assets may be invested in securities within a single industry. Although the Fund may invest in any economic sector, at times it may emphasize one or more particular sectors. Sentinel has a preference for companies that earn above-average rates of return on capital and that generate free cash flow. Additionally, earnings revision trends are important. The Fund may invest in foreign securities.
The Fund may sell a security if the fundamentals of the company are deteriorating or the original investment premise is no longer valid, the stock is trading meaningfully higher than what the portfolio manager believes is a fair valuation, to manage the size of the holding or the sector weighting and/or to take advantage of a more attractive investment opportunity, and to meet redemptions. A security will also be sold if it is determined that it no longer meets the environmental, social and/or corporate governance performance criteria.
Sustainable and Responsible Investing. The Fund employs a process of environmental, social and corporate governance (“ESG”) screening that is overseen by Sentinel’s in-house sustainable research department. While no investment is ever made solely based on the qualitative criteria alone, the Fund believes sustainable screening provides a unique and more comprehensive view of the companies it considers for investment. Generally, companies are eliminated from investment consideration if they produce tobacco or tobacco products or alcoholic beverages; generate nuclear power or supply nuclear facilities with industry specific components, as a primary line of business; have material interests in the manufacture of weapons or weapons-specific components; are involved in gambling as a main line of business; and/or lack diversity at the level of the board of directors/senior management. The Fund favors companies that publish and enforce codes of conduct and vendor standards; promote equal opportunity, diversity and good employee relations; are sensitive to community concerns; seek alternatives to animal testing when not required by law; and/or have minimal impact on the environment and engage in proactive environmental initiatives.
Sentinel may, in its discretion, choose to apply additional screens, modify the application of the screens listed above or vary the application of the screens listed above to the Funds’ investments at any time without shareholder approval.
For additional information on the environmental, social and governance screening process used by the Fund, please see “Additional Information About Each Fund – Investment Objectives and Strategies – Sentinel Sustainable Core Opportunities Fund – Principal Investment Strategies” at page 63 of the Prospectus.
Principal Investment Risks
You could lose money by investing in the Fund. An investment in the Fund is not a deposit of a bank and is not insured or guaranteed by the Federal Deposit Insurance Corporation or any other government agency. The following is a summary description of the principal risks of investing in the Fund:
| | • | Foreign Banks and Securities Depositories Risk. Some foreign banks and securities depositories in which the Fund generally holds its foreign securities may be recently organized or new to the foreign custody business. In addition, there may be limited or no regulatory oversight over their operations. Also, the laws of certain countries may put limits on the Fund’s ability to recover its assets if a foreign bank, depository or issuer of a security, or any of their agents, goes bankrupt. |
| | • | General Foreign Securities Risk. Investments in foreign securities may be affected unfavorably by changes in currency rates or exchange control regulations, or political and/or social instability in a particular foreign country or region. |
| | • | Investment Style Risk. The Fund uses a “blend” strategy to invest in both growth and value stocks, and/or in stocks with characteristics of both. This strategy may be out of favor at any particular time. The prices of growth stocks may fall dramatically if the company fails to meet earnings or revenue projections. The prices of value stocks may lag the stock market for long periods of time if the market fails to recognize the company’s intrinsic worth. |
| | • | Sector Risk. Investments in a particular sector may trail returns from other economic sectors. |
| | • | Stock Market and Selection Risk. The stock market may go down in value, and may go down sharply and unpredictably. The stocks selected by the portfolio manager may underperform the stock market or other funds with similar investment objectives and investment strategies. |
| | • | Sustainable/Responsible Investing Risk. The Fund’s environmental, social and corporate governance criteria may cause the Fund to forgo opportunities to buy certain securities, and/or forgo opportunities to gain exposure to certain industries, sectors, regions and countries. In addition, the Fund may be required to sell a security when it might otherwise be disadvantageous for it to do so. |
Performance
The following bar chart and table provide some indication of the risks of investing in the Fund by showing changes in the Fund’s performance from year to year and by showing how the Fund’s average annual returns for 1, 5 and 10 years compare with those of a broad measure of market performance. The bar chart shows changes in the Fund’s performance for Class A shares for each calendar year over a ten-year period. Sales charges are not reflected in the bar chart. If sales charges were reflected, returns would be less than those shown. However, the table includes, for share classes with a sales charge, the effect of the maximum sales charge, including any contingent deferred sales charge that would apply to a redemption at the end of the period. How the Fund performed in the past (before and after taxes) is not necessarily an indication of how the Fund will perform in the future. Updated information on the Fund’s results can be obtained by visiting www.sentinelinvestments.com.
The Sentinel Sustainable Core Opportunities Fund, which began operations on April 4, 2008, is a successor to the Citizens Value Fund, which was a successor to the Meyers Pride Value Fund, which began operations on June 13, 1996. Performance for the Class A shares of the Fund from September 24, 2001 to April 4, 2008 is based on the performance of the Standard shares of the predecessor Citizens Value Fund, which was offered without a sales charge and reflects the current maximum sales charge. Performance of the Class A shares from their inception on April 4, 2008 to June 29, 2012, has not been adjusted to reflect the lower maximum 12b-1 fee in effect prior to April 4, 2008 or the decrease in the maximum 12b-1 fee, effective June 30, 2012, from 0.30% to 0.25%. If it had, those returns would be higher. Performance of the Class I shares from March 31, 2006 to April 4, 2008 (the inception date for the Class I shares) is based on the performance of the Institutional shares of the Citizens Value Fund, which had different expenses but substantially similar investment risks.
Fund Inception: 1996 (the inception of the Fund’s predecessor)
Annual Total Return for Class A Shares (%) as of December 31
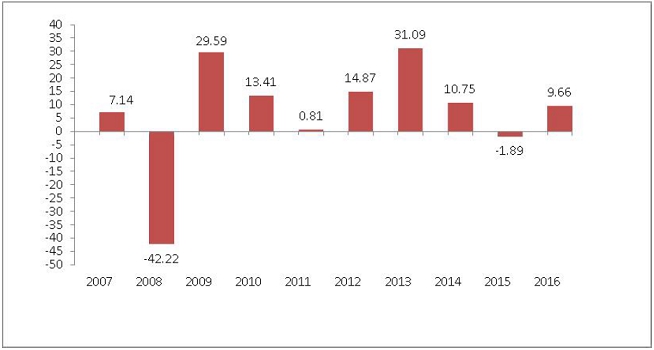
During the ten-year period shown in the above bar chart, the highest return for a quarter was 19.35% (quarter ended June 30, 2009) and the lowest return for a quarter was -23.51% (quarter ended December 31, 2008).
Average Annual Total Return (%)
For the periods ended
December 31, 2016 | 1 Year | 5 Years | 10 Years |
| Return Before Taxes: Class A | 4.18 | 11.26 | 4.57 |
| Return After Taxes on Distributions: Class A | 3.72 | 10.90 | 4.37 |
| Return After Taxes on Distributions and Sale of Fund Shares: Class A | 2.75 | 8.96 | 3.63 |
| Return Before Taxes: Class I | 10.02 | 12.71 | 5.49 |
| Standard & Poor’s 500 Index (Reflects no deduction for fees, expenses or taxes) | 11.96 | 14.66 | 6.95 |
After-tax returns are calculated using the historical highest applicable individual federal marginal income tax rates in effect during the relevant period and do not reflect the impact of state and local taxes. Actual after-tax returns depend on an investor’s tax situation and may differ from those shown. After-tax returns are not relevant to investors who hold their Fund shares through tax-deferred arrangements, such as 401(k) plans or individual retirement accounts. After-tax returns are shown only for Class A shares and after-tax returns for other classes of shares will vary.
Management
Investment Adviser. Sentinel Asset Management, Inc. (“Sentinel”) is the investment adviser to the Fund.
Portfolio Manager. Helena Ocampo, portfolio manager with Sentinel, has been a portfolio manager of the Fund since 2008.
Purchase and Sale of Fund Shares
Investors may purchase or redeem Fund shares on any day that the New York Stock Exchange is open for business using the options and applicable contact information listed below. Investors who wish to purchase, exchange or redeem Fund shares through a broker-dealer should contact the broker-dealer directly.
By wire transfer:
Contact the Fund at 800-282-3863 | By mail:
Sentinel Investments
PO Box 55929
Boston, MA 02205-5929 | By telephone:
1-800-282-FUND (3863).
Redemptions by telephone are only permitted upon previously receiving appropriate authorization. | Online:
If you already have an account and have elected to do so, you may purchase or redeem shares of the Fund by accessing the Fund’s website at www.sentinelinvestments.com. |
The minimum initial and subsequent investment amounts for various types of accounts are shown below, although we may reduce or waive the minimums in some cases.
| | Retirement Accounts | All Other Accounts | Automatic |
| | | | | | Investment |
| | | | | | Plan |
| | Initial | Subsequent | Initial | Subsequent | |
| Class A | $1,000 | $50 | $1,000 | $50 | $50 |
Class I shares are only available to institutional investors, with certain limited exceptions. There is a $1 million initial investment minimum for institutional investors, with certain exceptions.
Tax Information
Dividends and capital gain distributions you receive from the Fund may be subject to federal income taxes and may be taxed as ordinary income or capital gains. If you are a tax-exempt investor or are investing through a retirement plan you may be subject to federal income tax upon withdrawal from such tax deferred arrangements. In addition, dividends and capital gain distributions you receive from the Fund may also be subject to state and local taxes.
Payments to Broker-Dealers and Other Financial Intermediaries
If you purchase the Fund through a broker-dealer or other financial intermediary (such as a bank), the Fund and its related companies may pay the intermediary for the sale of Fund shares and related services. These payments may create a conflict of interest by influencing the broker-dealer or other intermediary and your salesperson to recommend the Fund over another investment. Ask your salesperson or visit your financial intermediary’s website for more information.
Sentinel Total Return Bond Fund
Investment Objective
The Fund seeks maximum investment return through a combination of current income and capital appreciation.
Fees and Expenses of the Fund
This table describes the fees and expenses that you may pay if you buy and hold shares of the Fund. You may qualify for sales charge discounts if you and your family invest, or agree to invest in the future, at least $100,000 in shares of the Sentinel Funds that include Class A shares. More information about these and other discounts is available from your financial professional and in the section entitled “Share Classes” on page 82 of the Fund’s prospectus and “How to Purchase Shares and Reduce Sales Charges” on page 44 of the Fund’s statement of additional information.
Shareholder Fees (fees paid directly from your investment)
| | Class A | Class C | Class I | Class R3 | Class R6 |
| Maximum Sales Charge (Load) Imposed on Purchases (as a percentage of offering price) | 2.25% | None | None | None | None |
| Maximum Deferred Sales Charge (Load)(as a percentage of purchase price or redemption proceeds, whichever is less) | None* | 1.00% | None | None | None |
| Redemption Fees (as a percentage of amounts redeemed or exchanged within 30 days) | None | None | None | None | None |
Annual Fund Operating Expenses (expenses that you pay each year as a percentage of the value of your investment)
| | Class A | Class C | Class I | Class R3 | Class R6 |
| Management Fee | 0.53% | 0.53% | 0.53% | 0.53% | 0.53% |
| Distribution and/or Service (12b-1) Fees | 0.20% | 1.00% | None | 0.50%+ | None |
| Other Expenses | 0.37% | 0.23% | 0.24% | 2.41% | 2.40% |
| Acquired Fund Fees and Expenses@ | 0.07% | 0.07% | 0.07% | 0.07% | 0.07% |
| Total Annual Fund Operating Expenses | 1.17%# | 1.83%# | 0.84%# | 3.51%# | 3.00%# |
| Fee Waiver and/or Expense Reimbursement** | (0.21)% | None | None | (2.25)% | (2.24)% |
| Total Annual Fund Operating Expenses After Fee Waiver and/or Expense Reimbursement** | 0.96% | 1.83% | 0.84% | 1.26% | 0.76% |
* You pay a deferred sales charge of 0.50% on certain redemptions of Class A shares made within twelve months of purchase if you bought them without an initial sales charge as part of an investment of $500,000 or more.
+ 12b-1 fees have been restated from fiscal year amounts to reflect the maximum fee payable under the applicable distribution plan for such share class. 12b-1 fees are not assessed with respect to shares owned by NLV Financial Corporation or an affiliate (“NLVFin”), which may result in an overall distribution fee charged to all shareholders of less than the maximum for so long as the NLVFin investment is maintained.
@ “Acquired Fund Fees and Expenses” are expenses indirectly incurred by the Fund through its investments in one or more underlying funds, including money market funds. Because these costs are indirect, the Total Annual Fund Operating Expenses do not correlate to the ratio of expenses to average net assets in the Fund’s most recent annual report.
# Total Annual Fund Operating Expenses have been restated to reflect current fees.
** The Fund’s investment advisor has contractually agreed, effective March 30, 2017, to waive fees and/or reimburse certain expenses in order to limit Total Annual Fund Operating Expenses After Fee Waiver and/or Expense Reimbursement (excluding Acquired Fund Fees and Expenses) for Class A shares, on an annualized basis, to 0.89% of average daily net assets attributable to Class A shares through March 31, 2018. In addition, the Fund’s investment advisor has contractually agreed, effective March 30, 2017, to waive fees and/or reimburse certain expenses in order to limit Total Annual Fund Operating Expenses After Fee Waiver and/or Expense Reimbursement (excluding Acquired Fund Fees and Expenses) for Class R6 shares, on an annualized basis, to 0.69% of average daily net assets attributable to Class R6 shares through March 31, 2018, and to waive fees and/or reimburse certain expenses in order to limit Total Annual Fund Operating Expenses After Fee Waiver and/or Expense Reimbursement (excluding Acquired Fund Fees and Expenses) for Class R3 shares, on an annualized basis, to 1.19% of average daily net assets attributable to Class R3 shares through March 31, 2018. The Fund may have to repay some of these waivers and reimbursements to the Fund’s investment adviser in the following two years. Each of these agreements may be terminated upon 90 days’ notice by a majority of the non-interested directors of the Fund.
Example
This Example is intended to help you compare the cost of investing in the Fund with the cost of investing in other mutual funds. The Example assumes that you invest $10,000 in the Fund for the time periods indicated and then redeem all of your shares at the end of those periods. The Example also assumes that your investment has a 5% return each year and that the Fund’s operating expenses remain the same. Although your actual costs may be higher or lower, based on these assumptions, your costs would be:
| Class | 1 Year | 3 Years | 5 Years | 10 Years |
| Class A | $342 | $588 | $854 | $1,613 |
| Class C | 286 | 576 | 990 | 2,148 |
| Class I | 86 | 268 | 466 | 1,037 |
| Class R3 | 354 | 1,077 | 1,822 | 3,783 |
| Class R6 | 303 | 927 | 1,577 | 3,318 |
You would pay the following expenses if you did not redeem your shares:
| Class | 1 Year | 3 Years | 5 Years | 10 Years |
| Class C | $186 | $576 | $990 | $2,148 |
Portfolio Turnover
The Fund pays transaction costs, such as commissions, when it buys and sells securities (or “turns over” its portfolio). A higher portfolio turnover rate may indicate higher transaction costs and may result in higher taxes when Fund shares are held in a taxable account. These costs, which are not reflected in annual fund operating expenses or in the example, affect the Fund’s performance. During the most recent fiscal year the Fund’s portfolio turnover rate was 240% of the average value of its portfolio.
Principal Investment Strategies
The Fund seeks to achieve its investment objective by investing in fixed-income securities and in related derivatives, such as interest rate, credit, equity and foreign currency derivatives (futures, options, swaps, options on swaps, and caps and floors). The Fund invests primarily in investment-grade bonds. At least 80% of the Fund’s assets will normally be invested in the following types of bonds and related derivatives:
1. Corporate bonds of varying maturities issued by various U.S. and non-U.S. private-sector entities denominated in U.S. dollars and foreign currencies;
2. Debt securities issued or guaranteed by the U.S. government, its agencies or instrumentalities, including mortgage-backed securities, and by non-U.S. sovereign and quasi-sovereign entities; and
3. Taxable or tax-exempt municipal securities.
The Fund may invest in securities of any duration. Duration is a mathematical concept that measures a fixed income security’s sensitivity to interest rate changes. The value of a fixed-income security with a positive duration will decline if interest rates increase. The longer the portfolio’s duration, the more sensitive it is to changes in interest rates. For example, the value of a portfolio with a duration of five years would be expected to fall approximately five percent if interest rates rose by one percentage point and a portfolio with a duration of two years would be expected to fall approximately two percent if interest rates rose by one percentage point.
The Fund may invest up to 50% of its assets in below investment-grade bonds. Below investment-grade bonds are sometimes called “junk bonds”.
The Fund may invest in exchange-traded funds (“ETFs”) in carrying out its investment strategies. The Fund considers investments in bond ETFs (ETFs whose underlying portfolio consists of debt instruments) as investments in fixed income instruments. At times, the Fund may have considerable exposure to ETFs.
The Fund may also purchase or sell “to be announced” or “TBA” securities, which usually are transactions in which the Fund buys or sells agency mortgage-backed securities (“MBS”) on a forward commitment basis. In a TBA transaction, the seller of the agency MBS agrees on a sale price, but does not specify which particular securities will be delivered to the buyer on settlement day. Instead, only a few basic characteristics of the securities are agreed upon, such as the coupon rate and the face value. The Fund may engage in short sales of agency MBS that the Fund does not own, primarily as part of a TBA swap transaction. A TBA swap transaction involves an agreement to purchase one agency MBS and a simultaneous agreement to sell a different agency MBS.
Up to 25% of the Fund’s net assets may be invested in securities within a single industry.
The Fund may use derivative instruments (e.g., exchange-traded derivatives such as futures and options, and other derivatives such as swap agreements, options on swaps and interest rate caps and floors) in order to hedge various risks, such as interest rate, credit and currency risk. The Fund may use derivative instruments for other investment purposes, such as replicating permitted investments, as long as such investments do not have the effect of leveraging portfolio risks. The Fund is not required to use hedging and may choose not to do so.
The Fund may sell a security if the security is overvalued on a relative basis compared to other securities available in the market, if the fundamentals of the company are deteriorating, or for duration management purposes. The Fund may also sell a security to meet redemptions.
The Fund utilizes an active trading approach, which is expected to result in portfolio turnover greater than 100%.
Principal Investment Risks
You could lose money by investing in the Fund. An investment in the Fund is not a deposit of a bank and is not insured or guaranteed by the Federal Deposit Insurance Corporation or any other government agency. The following is a summary description of the principal risks of investing in the Fund:
| | • | Derivatives Risk. Derivative investments involve counterparty risk (the risk that the counterparty of the derivative transaction or clearing member used by the Fund to hold a cleared derivatives contract will be unable or unwilling to honor its financial obligation to the Fund), basis risk (the risk that the derivative instrument will not fully offset the underlying positions), and liquidity risk (the risk that the Fund cannot sell the derivative instrument because of an illiquid secondary market). In addition, the portfolio manager may incorrectly forecast the values of securities, currencies or interest rates or other economic factors in using derivatives for the Fund. Certain aspects of the tax treatment of derivative instruments, including swap agreements and commodity-linked derivative instruments, are currently unclear and may be affected by changes in legislation, regulations or other legally binding authority that could affect the character, timing and amount of the Fund’s taxable income or gains and distributions. |
| | • | ETF Risk. Owning an ETF generally reflects the risks of owning the underlying securities it is designed to track. ETFs typically trade on a securities exchange and their shares may, at times, trade at a premium or discount to their net asset values. In addition, an ETF may not replicate exactly the performance of the benchmark index it seeks to track for a number of reasons, including transaction costs incurred by the ETF, the temporary unavailability of certain index securities in the secondary market or discrepancies between the ETF and the index with respect to the weighting or number of instruments held by the ETF. Investing in ETFs, which are investment companies, may involve duplication of advisory fees and certain other expenses. The Fund will incur brokerage costs when purchasing and selling shares of ETFs. |
| | • | Foreign Banks and Securities Depositories Risk. Some foreign banks and securities depositories in which the Fund generally holds its foreign securities may be recently organized or new to the foreign custody business. In addition, there may be limited or no regulatory oversight over their operations. Also, the laws of certain countries may put limits on the Fund’s ability to recover its assets if a foreign bank, depository or issuer of a security, or any of their agents, goes bankrupt. |
| | • | General Fixed-Income Securities Risk. The market prices of bonds, including those issued by the U.S. government, go up as interest rates fall, and go down as interest rates rise. As a result, the net asset value of the Fund will fluctuate with conditions in the bond markets. Bonds with longer durations are generally more sensitive to interest rate changes than those with shorter durations. As of the date of this Prospectus, interest rates in the United States are near historic lows. If interest rates rise quickly, it may have a pronounced negative effect on the prices on the bonds held by the Fund. In the case of corporate bonds and commercial paper, values may fluctuate as perceptions of credit quality change. Fixed-income securities may be difficult to purchase and sell in adverse market conditions. In addition, corporate bonds may be downgraded or default. During periods of declining interest rates or for other reasons, bonds may be “called”, or redeemed, by the bond issuer prior to the bond’s maturity date, resulting in the Fund receiving payment earlier than expected. This may reduce the Fund’s income if the proceeds are reinvested at a lower interest rate. |
| | • | General Foreign Securities Risk. Investments in foreign securities may be affected unfavorably by changes in currency rates or exchange control regulations, or political or social instability in the particular foreign country or region. The Fund is not required to hedge against changes in foreign currency exchange rates. |
| | • | Government Securities Risk. Economic, business, or political developments may affect the ability of government-sponsored guarantors to repay principal and to make interest payments on the securities in which the Fund invests. In addition, certain of these securities, including those issued or guaranteed by FNMA and FHLMC, are not backed by the full faith and credit of the U.S. government. |
| | • | High Portfolio Turnover Risk. An active trading approach increases the Fund’s costs and may reduce the Fund’s performance. It may also increase the amount of capital gains tax that you have to pay on the Fund’s returns. |
| | • | Lower-Quality Bonds Risk. Bonds with lower credit ratings are more speculative and likely to default than higher-quality bonds. Lower-rated bonds also tend to fluctuate more widely in value. |
| | • | Mortgage-Backed Securities Risk. Mortgage-backed securities represent interests in “pools” of mortgages and are subject to certain additional risks. When interest rates rise, certain obligations will be paid off by the obligor more slowly than anticipated causing the value of these securities to fall. This is known as extension risk. In addition, adjustable and fixed rate mortgage-related securities are subject to prepayment risk. When interest rates decline, borrowers may pay off their mortgages sooner than expected. This can reduce the returns of the Fund because the Fund may have to reinvest that money at the lower prevailing interest rates. These securities also are subject to risk of default on the underlying mortgage, particularly during periods of economic downturn. |
| | • | Municipal Securities Risk. Municipal securities can be significantly affected by political changes as well as uncertainties in the municipal market related to taxation, legislative changes, or the rights of municipal security holders. |
| | • | Short Sales Risk. Short sale transactions involving TBA securities involve leverage risk because they can result in investment exposure greater than the amount of the initial investment. Entering into a short position involves speculative exposure risk. If the price of the security increases between the date of the short sale and the date on which the Fund replaces the security, the Fund may incur a loss (without a limit). |
| | • | To-Be-Announced (“TBA”) Securities Risk. In a TBA securities transaction, the Fund commits to purchase certain securities for a fixed price at a future date. TBA securities include when-issued and delayed delivery securities and forward commitments. TBA securities involve the risk that the security the Fund buys will lose value prior to its delivery. There also is the risk that the security will not be issued or that the other party to the transaction will not meet its obligation. If this occurs, the Fund loses both the investment opportunity for the assets it set aside to pay for the security and any gain in the security’s price. |
Performance
The following bar chart and table provide some indication of the risks of investing in the Fund by showing changes in the Fund’s performance from year to year and by showing how the Fund’s average annual returns for 1 year, 5 years and since inception compare with those of a broad measure of market performance. The bar chart shows the Fund’s performance for Class A shares for each calendar year since inception. Sales charges are not reflected in the bar chart. If sales charges were reflected, returns would be less than those shown. However, the table includes, for share classes with a sales charge, the effect of the maximum sales charge, including any contingent deferred sales charge that would apply to a redemption at the end of the period. How the Fund performed in the past (before and after taxes) is not necessarily an indication of how the Fund will perform in the future. Updated information on the Fund’s results can be obtained by visiting www.sentinelinvestments.com.
Performance of the Class R3 shares prior to December 23, 2014 (the inception date for the Class R3 shares) is based on the Fund’s Class A share performance, restated to reflect that Class R3 shares are offered without a sales charge and adjusted for Class R3’s estimated higher expenses. Performance of the Class R6 shares prior to December 23, 2014 (the inception date for the Class R6 shares) is based on the Fund’s Class A share performance, restated to reflect that Class R6 shares are offered without a sales charge.
Fund Inception: 2010
Annual Total Return for Class A Shares (%) as of December 31
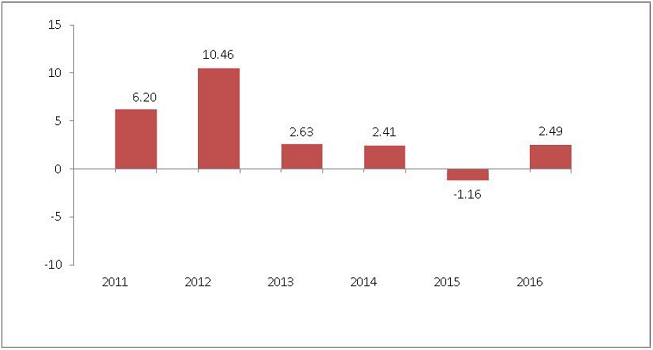
During the period(s) shown in the above bar chart, the highest return for a quarter was 3.61% (quarter ended September 30, 2012) and the lowest return for a quarter was -2.35% (quarter ended December 31, 2016).
Average Annual Total Return (%)
For the periods ended
December 31, 2016 | 1 Year | 5 Years | Since Inception
(December 17,
2010) |
| Return Before Taxes: Class A | 0.14 | 2.83 | 3.40 |
| Return After Taxes on Distributions: Class A | -0.84 | 1.62 | 2.10 |
| Return After Taxes on Distributions and Sale of Fund Shares: Class A* | 0.08 | 1.69 | 2.10 |
| Return Before Taxes: Class C | 0.62 | 2.64 | 3.21 |
| Return Before Taxes: Class I | 2.63 | 3.46 | 3.94 |
| Return Before Taxes: Class R3 | 2.49 | 3.02 | 3.49 |
| Return Before Taxes: Class R6 | 2.69 | 3.40 | 3.87 |
| Barclays US Aggregate Bond Index (Reflects no deduction for fees, expenses or taxes) | 2.65 | 2.23 | 3.31 |
* Return after taxes on distributions and sale of fund shares may be higher than return before taxes and/or return after taxes on distributions when a net capital loss occurs upon the redemption of fund shares.
After-tax returns are calculated using the historical highest applicable individual federal marginal income tax rates in effect during the relevant period and do not reflect the impact of state and local taxes. Actual after-tax returns depend on an investor’s tax situation and may differ from those shown. After-tax returns are not relevant to investors who hold their Fund shares through tax-deferred arrangements, such as 401(k) plans or individual retirement accounts. After-tax returns are shown only for Class A shares and after-tax returns for other classes of shares will vary.
Management
Investment Adviser. Sentinel Asset Management, Inc. (“Sentinel”) is the investment adviser to the Fund.
Portfolio Manager. Jason Doiron, portfolio manager and Head of Investments with Sentinel, has been a portfolio manager of the Fund since its inception in 2010.
Purchase and Sale of Fund Shares
Investors may purchase or redeem Fund shares on any day that the New York Stock Exchange is open for business using the options and applicable contact information listed below. Investors who wish to purchase, exchange or redeem Fund shares through a broker-dealer should contact the broker-dealer directly.
By wire transfer:
Contact the Fund at 800-282-3863 | By mail:
Sentinel Investments
PO Box 55929
Boston, MA 02205-5929 | By telephone:
1-800-282-FUND (3863).
Redemptions by telephone are only permitted upon previously receiving appropriate authorization. | Online:
If you already have an account and have elected to do so, you may purchase or redeem shares of the Fund by accessing the Fund’s website at www.sentinelinvestments.com. |
The minimum initial and subsequent investment amounts for various types of accounts are shown below, although we may reduce or waive the minimums in some cases.
| | Retirement Accounts | All Other Accounts | Automatic |
| | | | | | Investment |
| | | | | | Plan |
| | Initial | Subsequent | Initial | Subsequent | |
| Classes A and C | $1,000 | $50 | $1,000 | $50 | $50 |
Class I shares are only available to institutional investors, with certain limited exceptions. There is a $1 million initial investment minimum for institutional investors, with certain exceptions.
Class R3 shares are only available to employer sponsored group retirement and group 529 college savings plans. To be eligible, shares must be held through plan administrator level or omnibus accounts held on the books of the Fund.
Class R6 shares are available to certain employer sponsored group retirement and group 529 college savings plans; registered investment companies; institutions, trusts and foundations with a $1 million initial investment; and certain fee-based advisory programs.
Tax Information
Dividends and capital gain distributions you receive from the Fund may be subject to federal income taxes and may be taxed as ordinary income or capital gains. If you are a tax-exempt investor or are investing through a retirement plan you may be subject to federal income tax upon withdrawal from such tax deferred arrangements. In addition, dividends and capital gain distributions you receive from the Fund may also be subject to state and local taxes.
Payments to Broker-Dealers and Other Financial Intermediaries
If you purchase the Fund through a broker-dealer or other financial intermediary (such as a bank), the Fund and its related companies may pay the intermediary for the sale of Fund shares and related services. These payments may create a conflict of interest by influencing the broker-dealer or other intermediary and your salesperson to recommend the Fund over another investment. Ask your salesperson or visit your financial intermediary’s website for more information.
Sentinel Unconstrained Bond Fund
Investment Objective
The Fund seeks maximum investment return through a combination of current income and capital appreciation.
Fees and Expenses of the Fund
This table describes the fees and expenses that you may pay if you buy and hold shares of the Fund. You may qualify for sales charge discounts if you and your family invest, or agree to invest in the future, at least $100,000 in shares of the Sentinel Funds that include Class A shares. More information about these and other discounts is available from your financial professional and in the section entitled “Share Classes” on page 82 of the Fund’s prospectus and “How to Purchase Shares and Reduce Sales Charges” on page 44 of the Fund’s statement of additional information.
Shareholder Fees (fees paid directly from your investment)
| | Class A | Class C | Class I |
| Maximum Sales Charge (Load) Imposed on Purchases (as a percentage of offering price) | 2.25% | None | None |
| Maximum Deferred Sales Charge (Load)(as a percentage of purchase price or redemption proceeds, whichever is less) | None* | 1.00% | None |
| Redemption Fees (as a percentage of amounts redeemed or exchanged within 30 days) | None | None | None |
Annual Fund Operating Expenses (expenses that you pay each year as a percentage of the value of your investment)
| | Class A | Class C | Class I |
| Management Fee | 0.75% | 0.75% | 0.75% |
| Distribution and/or Service (12b-1) Fees | 0.20%+ | 1.00%+ | None |
| Other Expenses | 0.53% | 1.04% | 0.29% |
| Acquired Fund Fees and Expenses@ | 0.11% | 0.11% | 0.11% |
| Total Annual Fund Operating Expenses | 1.59% | 2.90% | 1.15% |
| Fee Waiver and/or Expense Reimbursement** | None | (0.73)% | None |
| Total Annual Fund Operating Expenses After Fee Waiver and/or Expense Reimbursement** | 1.59% | 2.17% | 1.15% |
* You pay a deferred sales charge of 0.50% on certain redemptions of Class A shares made within twelve months of purchase if you bought them without an initial sales charge as part of an investment of $500,000 or more.
+ 12b-1 fees have been restated from fiscal year amounts to reflect the maximum fee payable under the applicable distribution plan for such share class. 12b-1 fees are not assessed with respect to shares owned by NLV Financial Corporation or an affiliate (“NLVFin”), which may result in an overall distribution fee charged to all shareholders of less than the maximum for so long as the NLVFin investment is maintained.
@ “Acquired Fund Fees and Expenses” are expenses indirectly incurred by the Fund through its investments in one or more underlying funds, including money market funds. Because these costs are indirect, the Total Annual Fund Operating Expenses do not correlate to the ratio of expenses to average net assets in the Fund’s most recent annual report.
** The Fund’s investment advisor has contractually agreed, effective March 30, 2017, to waive fees and/or reimburse certain expenses in order to limit Total Annual Fund Operating Expenses After Fee Waiver and/or Expense Reimbursement (excluding Acquired Fund Fees and Expenses) for Class C shares, on an annualized basis, to 2.06% of average daily net assets attributable to Class C shares through March 31, 2018. The Fund may have to repay some of these waivers and reimbursements to the Fund’s investment adviser in the following two years. This agreement may be terminated upon 90 days’ notice by a majority of the non-interested directors of the Fund.
Example
This Example is intended to help you compare the cost of investing in the Fund with the cost of investing in other mutual funds. The Example assumes that you invest $10,000 in the Fund for the time periods indicated and then redeem all of your shares at the end of those periods. The Example also assumes that your investment has a 5% return each year and that the Fund’s operating expenses remain the same. Although your actual costs may be higher or lower, based on these assumptions, your costs would be:
| Class | 1 Year | 3 Years |
| Class A | $383 | $716 |
| Class C | 393 | 898 |
| Class I | 117 | 365 |
You would pay the following expenses if you did not redeem your shares:
| Class | 1 Year | 3 Years |
| Class C | $293 | $898 |
Portfolio Turnover
The Fund pays transaction costs, such as commissions, when it buys and sells securities (or “turns over” its portfolio). A higher portfolio turnover rate may indicate higher transaction costs and may result in higher taxes when Fund shares are held in a taxable account. These costs, which are not reflected in annual fund operating expenses or in the example, affect the Fund’s performance. During the most recent fiscal year the Fund’s portfolio turnover rate was 472% of the average value of its portfolio.
Principal Investment Strategies
Under normal circumstances, the Fund seeks to achieve its investment objective by investing at least 80% of its net assets (plus any borrowings made for investment purposes) in U.S. and non-U.S. fixed-income instruments and related derivatives. The Fund’s investments may be represented by forwards or derivative instruments. The Fund focuses on investments in U.S. fixed-income instruments. “Fixed-income instruments” include bonds, debt securities and similar instruments. The Fund has a flexible investment strategy, and will utilize a variety of investment techniques, and may invest in a broad array of fixed income instruments. The Fund’s investments in fixed-income instruments may include, among other things, corporate bonds and other debt securities, U.S. government and agency securities, foreign government and supranational debt securities, emerging market debt securities, commercial paper, zero-coupon securities, mortgage-related securities (including senior and junior loans, mortgage dollar rolls, stripped mortgage-related securities, and collateralized mortgage obligations) and other asset-backed securities, collateralized debt and loan obligations, when-issued securities, investments in the securities of real estate investment trusts (“REITs”), Rule 144A securities, preferred securities, structured products, repurchase agreements, reverse repurchase agreements, convertible securities and mezzanine securities. The Fund may invest in fixed, variable and floating rate instruments, including bank loans or loan participation interests in secured, second lien or unsecured variable, fixed or floating rate loans. The Fund may invest in fixed income instruments of any maturity. The Fund may invest in non-U.S. dollar denominated securities on a currency hedged or unhedged basis, and may invest in foreign (non-U.S.) currencies for hedging or investment purposes. The Fund may invest up to 20% of its net assets, at the time of purchase, in equity securities. The Fund may also invest in exchange-traded funds (“ETFs”) in carrying out its investment strategies. The Fund considers investments in bond ETFs (ETFs whose underlying portfolio consists of debt instruments) as investments in fixed income instruments. At times, the Fund may have considerable exposure to ETFs. Fund management may adjust the Fund’s portfolio among various types of instruments based on then-current or anticipated market conditions.
The Fund may invest in fixed income instruments of any credit quality, including instruments that are in default. The Fund may invest up to 70% of its net assets, at the time of purchase, in fixed-income instruments that are below investment-grade (e.g., rated below BBB by Standard and Poor’s or below Baa by Moody’s) or which are unrated. These bonds are sometimes called “junk bonds”.
The Fund may invest in securities of any duration. The average portfolio duration of the Fund will normally vary from negative five (-5) years to positive ten (10) years, depending on Sentinel’s forecast of interest rates and its assessment of market risks generally. Duration is a mathematical concept that measures a portfolio’s sensitivity to interest rate changes. The value of a fixed-income security with a positive duration will decline if interest rates increase. The value of a fixed-income security with a negative duration will increase if interest rates increase. The longer the portfolio’s duration, the more sensitive it is to changes in interest rates. The shorter a portfolio’s duration, the less sensitive it is to changes in interest rates. For example, the price of a portfolio with a duration of five years would be expected to fall approximately five percent if interest rates rose by one percentage point and a portfolio with a duration of two years would be expected to fall approximately two percent if interest rates rose by one percentage point. The price of a portfolio with a duration of negative five years would be expected to rise approximately five percent if interest rates rose by one percentage point and a portfolio with a duration of negative two years would be expected to rise approximately two percent if interest rates rose by one percentage point.
The Fund may also purchase or sell “to be announced” or “TBA” securities, which usually are transactions in which the Fund buys or sells agency mortgage-backed securities (“MBS”) on a forward commitment basis. In a TBA transaction, the seller of the agency MBS agrees on a sale price, but does not specify which particular securities will be delivered to the buyer on settlement day. Instead, only a few basic characteristics of the securities are agreed upon, such as the coupon rate and the face value. The Fund may engage in short sales of agency MBS that the Fund does not own, primarily as part of a TBA swap transaction. A TBA swap transaction involves an agreement to purchase one agency MBS and a simultaneous agreement to sell a different agency MBS.
The Fund may enter into derivative transactions without limitation, including for investment and/or for hedging purposes. The Fund may use derivative instruments to gain both long and short exposure to fixed-income or other instruments by investing in, among other instruments, derivatives such as futures and options, and other derivatives such as swap agreements, including interest rate swaps, total return swaps, credit default swaps and index swaps and forward contracts, subject to applicable law and any other restrictions described elsewhere in the Fund’s Prospectus or the Fund’s Statement of Additional Information. The Fund is not required to use hedging and may choose not to do so. Currently, the Fund expects to utilize primarily the following derivative instruments: futures, interest rate swaps and credit default swaps.
The Fund may also use commodity and commodity index futures options and swaps and structured notes.
The derivatives used by the Fund may involve substantial leverage risk and may expose the Fund to potential losses that exceed the amount originally invested by the Fund.
The Fund may enter into transactions such as repurchase agreements, reverse repurchase agreements and dollar rolls. These transactions may involve leverage risk.
The Fund may sell a security if the security is overvalued on a relative basis compared to other securities available in the market, if the fundamentals of the company are deteriorating, or for duration management purposes. The Fund may also sell a security to meet redemptions.
The Fund has fewer restrictions than many other fixed income funds, and utilizes an active trading approach, which is expected to result in portfolio turnover greater than 100%.
Principal Investment Risks
You could lose money by investing in the Fund. An investment in the Fund is not a deposit of a bank and is not insured or guaranteed by the Federal Deposit Insurance Corporation or any other government agency. The following is a summary description of the principal risks of investing in the Fund:
| | • | Bank Loan Risk. The market for bank loans may not be highly liquid and, in some cases, the Fund may have to dispose of such securities at a substantial discount from face value. These investments expose the Fund to the credit risk of the underlying corporate borrower. When interest rates decline, borrowers may pay off bank loans more quickly than originally anticipated, and the Fund may have to invest the proceeds in securities with lower yields. |
| | • | Derivatives Risk. Derivative investments can increase Fund losses and/or increase volatility. Derivative instruments may be difficult to price and leveraged so that small changes may produce disproportionate losses for the Fund. Derivatives involve counterparty risk (the risk that the counterparty of the derivative transaction or a clearing member used by the Fund to hold a cleared derivatives contract will be unable or unwilling to honor its financial obligation to the Fund), basis risk (the risk that the derivative instrument will not fully offset the underlying positions), and liquidity risk (the risk that the Fund cannot sell the derivative instrument because of an illiquid secondary market). In addition, the portfolio manager may incorrectly forecast the values of securities, currencies or interest rates or other economic factors in using derivatives for the Fund. Certain derivative transactions may involve substantial leverage risk and the Fund could lose more than the principal amount invested. Certain aspects of the tax treatment of derivative instruments, including swap agreements and commodity-linked derivative instruments, are currently unclear and may be affected by changes in legislation, regulations or other legally binding authority that could affect the character, timing and amount of the Fund’s taxable income or gains and distributions. |
| | • | Duration Risk. Duration is a measure that relates the expected price volatility of a fixed-income instrument to changes in interest rates. The duration of a fixed income instrument may be shorter than or equal to the full maturity of the fixed income instrument. Fixed income instruments with longer durations have more risk. |
| | • | ETF Risk. Owning an ETF generally reflects the risks of owning the underlying securities it is designed to track. ETFs typically trade on a securities exchange and their shares may, at times, trade at a premium or discount to their net asset values. In addition, an ETF may not replicate exactly the performance of the benchmark index it seeks to track for a number of reasons, including transaction costs incurred by the ETF, the temporary unavailability of certain index securities in the secondary market or discrepancies between the ETF and the index with respect to the weighting or number of instruments held by the ETF. Investing in ETFs, which are investment companies, may involve duplication of advisory fees and certain other expenses. The Fund will incur brokerage costs when purchasing and selling shares of ETFs. |
| | • | Foreign Banks and Securities Depositories Risk. Some foreign banks and securities depositories in which the Fund generally holds its foreign securities may be recently organized or new to the foreign custody business. In addition, there may be limited or no regulatory oversight over their operations. Also, the laws of certain countries may put limits on the Fund’s ability to recover its assets if a foreign bank, depository or issuer of a security, or any of their agents, goes bankrupt. |
| | • | General Fixed-Income Securities Risk. The market prices of bonds, including those issued by the U.S. government, generally go up as interest rates fall, and go down as interest rates rise. In the event the Fund has a negative average portfolio duration, |
| | | the value of the Fund may decline in as interest rates fall, and rise as interest rates rise. As a result, the net asset value of the Fund will fluctuate with conditions in the bond markets. Bonds with longer durations are generally more sensitive to interest rate changes than those with shorter durations. As of the date of this Prospectus, interest rates in the United States are near historic lows. If interest rates rise quickly, it may have a pronounced negative effect on the prices on the bonds held by the Fund. In the case of corporate bonds and commercial paper, values may fluctuate as perceptions of credit quality change. In addition, corporate bonds may be downgraded or default. During periods of declining interest rates or for other reasons, bonds may be “called”, or redeemed, by the bond issuer prior to the bond’s maturity date, resulting in the Fund receiving payment earlier than expected. This may reduce the Fund’s income if the proceeds are reinvested at a lower interest rate. |
| | • | General Foreign Securities Risk. Investments in foreign securities may be affected unfavorably by changes in currency rates or exchange control regulations, or political or social instability in the particular foreign country or region. The Fund is not required to hedge against changes in foreign currency exchange rates. |
| | • | Government Securities Risk. Economic, business, or political developments may affect the ability of government-sponsored guarantors to repay principal and to make interest payments on the securities in which the Fund invests. In addition, certain of these securities, including those issued or guaranteed by FNMA and FHLMC, are not backed by the full faith and credit of the U.S. government. |
| | • | High Portfolio Turnover Risk. An active trading approach increases the Fund’s costs and may reduce the Fund’s performance. It may also increase the amount of capital gains tax that you have to pay on the Fund’s returns. |
| | • | Income Risk. Because the Fund can only distribute what it earns, the Fund’s distributions to shareholders may decline when prevailing interest rates fall (or, if the Fund has a negative duration, when prevailing interest rates rise) or when the Fund experiences defaults on debt instruments it holds. |
| | • | Leverage Risk. The Fund may engage in certain transactions, such as derivative transactions, reverse repurchase agreements and forward commitment transactions, that may result in a form of economic leverage. These transactions may expose the Fund to greater risk and increase its costs. Certain transactions in derivatives involve substantial leverage risk and may expose the Fund to potential losses that exceed the amount originally invested by the Fund. |
| | • | Lower-Quality Bonds Risk. Bonds with lower credit ratings are more speculative and likely to default than higher-quality bonds. Lower-rated bonds also tend to fluctuate more widely in value. |
| | • | Mortgage-Backed Securities Risk. Mortgage-backed securities represent interests in “pools” of mortgages and are subject to certain additional risks. When interest rates rise, certain obligations will be paid off by the obligor more slowly than anticipated causing the value of these securities to fall. This is known as extension risk. In addition, adjustable and fixed rate mortgage-related securities are subject to prepayment risk. When interest rates decline, borrowers may pay off their mortgages sooner than expected. This can reduce the returns of the Fund because the Fund may have to reinvest that money at the lower prevailing interest rates. These securities also are subject to risk of default on the underlying mortgage, particularly during periods of economic downturn. |
| | • | Municipal Securities Risk. Municipal securities can be significantly affected by political changes as well as uncertainties in the municipal market related to taxation, legislative changes, or the rights of municipal security holders. |
| | • | Short Sales Risk. Short sale transactions involving TBA securities involve leverage risk because they can result in investment exposure greater than the amount of the initial investment. Entering into a short position involves speculative exposure risk. If the price of the security increases between the date of the short sale and the date on which the Fund replaces the security, the Fund may incur a loss (without a limit). |
| | • | Sovereign Debt Risk. Issuers of non-U.S. sovereign debt instruments are subject to the risk that the governmental authorities that control the repayment of the debt may be unable or unwilling to repay the principal or interest when due. |
| | • | To-Be-Announced (“TBA”) Securities Risk. In a TBA securities transaction, the Fund commits to purchase certain securities for a fixed price at a future date. TBA securities include when-issued and delayed delivery securities and forward commitments. TBA securities involve the risk that the security the Fund buys will lose value prior to its delivery. There also is the risk that the security will not be issued or that the other party to the transaction will not meet its obligation. If this occurs, the Fund loses both the investment opportunity for the assets it set aside to pay for the security and any gain in the security’s price. |
Performance
The following bar chart and table provide some indication of the risks of investing in the Fund by showing changes in the Fund’s performance from year to year and by showing how the Fund’s average annual returns for 1 year and since inception compare with those of a broad measure of market performance. The bar chart shows the Fund’s performance for Class A shares for each calendar year since inception. Sales charges are not reflected in the bar chart. If sales charges were reflected, returns would be less than those shown. However, the table includes, for share classes with a sales charge, the effect of the maximum sales charge, including any contingent deferred sales charge that would apply to a redemption at the end of the period. How the Fund performed in the past (before and after taxes) is not necessarily an indication of how the Fund will perform in the future. Updated information on the Fund’s results can be obtained by visiting www.sentinelinvestments.com
Inception: 2014
Annual Total Return for Class A Shares (%) as of December 31
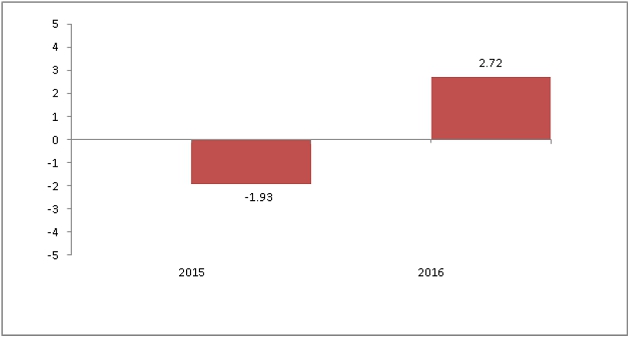
During the period(s) shown in the above bar chart, the highest return for a quarter was 1.86 % (quarter ended March 31, 2016) and the lowest return for a quarter was -1.70 % (quarter ended December 31, 2016).
Average Annual Total Return (%)
For the periods ended
December 31, 2016 | 1 Year | Since Inception
(December 23,
2014) |
| Return Before Taxes: Class A | 0.43 | -0.76 |
| Return After Taxes on Distributions: Class A | -0.15 | -1.37 |
| Return After Taxes on Distributions and Sale of Fund Shares: Class A* | 0.24 | -0.85 |
| Return Before Taxes: Class C | 1.15 | -0.33 |
| Return Before Taxes: Class I | 3.09 | 0.59 |
| BofA/ML USD 3-Month LIBOR Index (Reflects no deduction for fees, expenses or taxes) | 0.66 | 0.44 |
* Return after taxes on distributions and sale of fund shares may be higher than return before taxes and/or return after taxes on distributions when a net capital loss occurs upon the redemption of fund shares.
After-tax returns are calculated using the historical highest applicable individual federal marginal income tax rates in effect during the relevant period and do not reflect the impact of state and local taxes. Actual after-tax returns depend on an investor’s tax situation and may differ from those shown. After-tax returns are not relevant to investors who hold their Fund shares through tax-deferred arrangements, such as 401(k) plans or individual retirement accounts. After-tax returns are shown only for Class A shares and after-tax returns for other classes of shares will vary.
Management
Investment Adviser. Sentinel Asset Management, Inc. (“Sentinel”) is the investment adviser to the Fund.
Portfolio Manager. Jason Doiron, portfolio manager and Head of Investments with Sentinel, has been a portfolio manager of the Fund since its inception in 2014.
Purchase and Sale of Fund Shares
Investors may purchase or redeem Fund shares on any day that the New York Stock Exchange is open for business using the options and applicable contact information listed below. Investors who wish to purchase, exchange or redeem Fund shares through a broker-dealer should contact the broker-dealer directly.
By wire transfer:
Contact the Fund at 800-282-3863 | By mail:
Sentinel Investments
PO Box 55929
Boston, MA 02205-5929 | By telephone:
1-800-282-FUND (3863).
Redemptions by telephone are only permitted upon previously receiving appropriate authorization. | Online:
If you already have an account and have elected to do so, you may purchase or redeem shares of the Fund by accessing the Fund’s website at www.sentinelinvestments.com. |
The minimum initial and subsequent investment amounts for various types of accounts are shown below, although we may reduce or waive the minimums in some cases.
| | Retirement Accounts | All Other Accounts | Automatic |
| | | | | | Investment |
| | | | | | Plan |
| | Initial | Subsequent | Initial | Subsequent | |
| Classes A and C | $1,000 | $50 | $1,000 | $50 | $50 |
Class I shares are only available to institutional investors, with certain limited exceptions. There is a $1 million initial investment minimum for institutional investors, with certain exceptions.
Tax Information
Dividends and capital gain distributions you receive from the Fund may be subject to federal income taxes and may be taxed as ordinary income or capital gains. If you are a tax-exempt investor or are investing through a retirement plan you may be subject to federal income tax upon withdrawal from such tax deferred arrangements. In addition, dividends and capital gain distributions you receive from the Fund may also be subject to state and local taxes.
Payments to Broker-Dealers and Other Financial Intermediaries
If you purchase the Fund through a broker-dealer or other financial intermediary (such as a bank), the Fund and its related companies may pay the intermediary for the sale of Fund shares and related services. These payments may create a conflict of interest by influencing the broker-dealer or other intermediary and your salesperson to recommend the Fund over another investment. Ask your salesperson or visit your financial intermediary’s website for more information.
Additional Information About Each Fund
Investment Objectives and Strategies
Sentinel Balanced Fund
Investment Objective
The Fund seeks capital appreciation and current income.
If the Fund’s Board of Directors determines that the Fund’s investment objective should be changed, shareholders of the Fund will be given at least 30 days’ notice before any such change is made. However, the investment objective can be changed without shareholder approval.
Principal Investment Strategies
The Fund normally invests primarily in common stocks and investment-grade bonds with at least 25% of its assets in bonds and at least 25% of its assets in common stock. When determining this percentage, convertible bonds and/or preferred stocks are considered common stocks, unless these securities are held primarily for income. Sentinel will divide the Fund’s assets among stocks and bonds based on whether it believes stocks or bonds offer a better value at the time. More bonds normally enhance price stability, and more stocks usually enhance growth potential. Up to 25% of the Fund’s assets may be invested in securities within a single industry.
Sentinel’s philosophy for the equity portion of the portfolio is based on a long-term view and emphasizes diversification, high quality and valuation discipline. Sentinel looks for securities of high quality companies with a positive multi-year outlook offered at attractive valuation levels based on a number of metrics, including value relative to its history, peers and/or the market over time, with attractive risk profiles and long-term adjusted returns. Although the Fund may invest in any economic sector, at times it may emphasize one or more particular sectors. The Fund may invest without limitation in foreign securities. Under normal circumstances, the equity securities in which the Fund invests are predominantly those of U.S companies.
The bond portion of the Fund may be invested without limitation in bonds in the first through the fourth highest categories of Moody’s (Aaa to Baa) and Standard and Poor’s (AAA to BBB). The Fund may also purchase bonds in the lowest rating categories (C for Moody’s and D for Standard and Poor’s) and comparable unrated securities. No more than 20% of the Fund’s total assets may be invested in lower-quality bonds (e.g., bonds rated below Baa by Moody’s or BBB by Standard & Poor’s).
The Fund may make unlimited investments in U.S. government mortgage-backed securities (“MBS”), including pass-through certificates guaranteed by the Government National Mortgage Association (“GNMA” or “Ginnie Mae”). Each GNMA certificate is backed by a pool of mortgage loans insured by the Federal Housing Administration and/or the Veterans Administration, and provides for the payment of minimum fixed monthly installments of principal and interest. The guarantee by GNMA of timely repayment of principal and payment of interest is backed by the full faith and credit of the United States. The Fund may invest in mortgage-backed securities issued and guaranteed by the Federal National Mortgage Association (“FNMA” or “Fannie Mae”) and by the Federal Home Loan Mortgage Corporation (“FHLMC” or “Freddie Mac”). In all of these mortgage-backed securities, the actual maturity of and realized yield will vary based on the prepayment experience of the underlying pool of mortgages. Mortgage- related securities issued by FNMA are guaranteed as to timely payment of principal and interest by FNMA. They are not backed by the full faith and credit of the United States, but are supported by the right of FNMA to borrow from the U.S. Treasury Department (e.g., the Federal Home Loan Banks). Mortgage-related securities issued by FHLMC are not guaranteed by the United States or by any Federal Home Loan Bank and do not constitute a debt or obligation of the United States or of any Federal Home Loan Bank. FHLMC guarantees timely payment of interest and ultimate collection of principal on its mortgage-related securities; provided, however, that FHLMC may remit on account of its guarantee of ultimate payment of principal the amount due with respect to any underlying mortgage loan at any time after default on such underlying mortgage, but in no event later than one year after it becomes payable. On September 6, 2008, Director James Lockhart of the Federal Housing Finance Agency (“FHFA”) appointed FHFA as conservator of both FNMA and FHLMC. In addition, the U.S. Treasury Department agreed to provide FNMA and FHLMC up to $100 billion of capital each on an as needed basis to insure that they continue to provide liquidity to the housing and mortgage markets. While the original maximum life of a mortgage-backed security considered for this Fund can vary, its average life is likely to be substantially less than the original maturity of the underlying mortgages, because the mortgages in these pools may be prepaid, refinanced, curtailed, or foreclosed. Prepayments are passed through to the mortgage-backed securityholder along with regularly scheduled minimum repayments of principal and payments of interest.
The Fund may purchase or sell agency MBS on a “to be announced” or “TBA” basis, where the Fund buys or sells agency MBS on a forward commitment basis. In a TBA transaction, the seller of the agency MBS agrees on a sale price, but does not specify which
particular securities will be delivered to the buyer on settlement day. Instead, only a few basic characteristics of the securities are agreed upon, such as the coupon rate and the face value. The Fund may engage in short sales of agency MBS that the Fund does not own, primarily as part of a TBA swap transaction. A TBA swap transaction involves an agreement to purchase one agency MBS and a simultaneous agreement to sell a different agency MBS.
The Fund may invest in exchange-traded funds (“ETFs”) in carrying out its investment strategies with respect to the fixed-income portion of the portfolio. The Fund considers investments in bond ETFs (ETFs whose underlying portfolio consists of debt instruments) as investments in fixed income instruments.
The Fund may attempt to hedge various risks, such as interest rate, credit and currency risk, using derivative instruments, such as exchange-traded futures and options, and other derivatives such as swaps, interest rate caps and floors, credit default swaps and credit indices. The Fund may use derivative instruments for other investment purposes, such as replicating permitted investments, as long as such investments do not have the effect of leveraging portfolio risks. The Fund is not required to use hedging and may choose not to do so.
In managing the fixed-income portion of the portfolio, the Fund utilizes an active trading approach, which is expected to result in portfolio turnover greater than 100%.
The Fund may sell a security if the fundamentals of the company are deteriorating or the original investment premise is no longer valid, the security is trading meaningfully higher than what the portfolio manager believes is a fair valuation, to manage the size of the holding or the sector weighting and/or to take advantage of a more attractive investment opportunity. The Fund may also sell a security to meet redemptions.
Sentinel Common Stock Fund
Investment Objective
The Fund seeks a combination of capital appreciation and income.
If the Fund’s Board of Directors determines that the Fund’s investment objective should be changed, shareholders of the Fund will be given at least 30 days’ notice before any such change is made. However, the investment objective can be changed without shareholder approval.
Principal Investment Strategies
The Fund normally invests at least 80% of its net assets in common stocks. This principal investment strategy is a non-fundamental policy that may not be changed without 60 days’ prior written notice to the Fund’s shareholders. The Fund invests mainly in a diverse group of common stocks of well-established companies, typically above $5 billion in market capitalization, many of which historically have paid regular dividends. When appropriate, the Fund also may invest in preferred stocks or debentures convertible into common stocks. Up to 25% of the Fund’s assets may be invested in securities within a single industry. The Fund may invest without limitation in foreign securities. Under normal circumstances, the Fund invests predominantly in common stocks of U.S. companies.
Sentinel’s philosophy with respect to the Fund is based on a long-term view and emphasizes diversification, high quality and valuation discipline. Sentinel looks for securities of high quality companies with a positive multi-year outlook offered at attractive valuation levels based on a number of metrics, including value relative to its history, peers and/or the market over time. Although the Fund may invest in any economic sector, at times it may emphasize one or more particular sectors. Sentinel has a preference for companies that earn above-average rates of return on capital and that generate free cash flow. Additionally, earnings revision trends are important.
The Fund may sell a security to meet redemptions, if the fundamentals of the company are deteriorating or the original investment premise is no longer valid, the stock is trading meaningfully higher than what the portfolio managers believe is a fair valuation, to manage the size of the holding or the sector weighting and/or to take advantage of a more attractive investment opportunity.
Sentinel Government Securities Fund
Investment Objective
The Fund seeks a high level of current income consistent with the preservation of principal.
If the Fund’s Board of Directors determines that the Fund’s investment objective should be changed, shareholders of the Fund will be given at least 30 days’ notice before any such change is made. However, the investment objective can be changed without shareholder approval.
Principal Investment Strategies
The Fund normally invests at least 80% of its net assets in U.S. government securities and related derivatives. Related derivatives include exchange-traded futures on U.S. Treasury notes and bonds, and options on these futures, and other derivatives intended to hedge interest rate risk, such as swaps, options on swaps, and interest rate caps and floors. This principal investment strategy is a non-fundamental policy that may not be changed without 60 days’ prior written notice to the Fund’s shareholders. The Fund invests mainly in U.S. government bonds. These bonds include direct obligations of the U.S. Treasury, obligations guaranteed by the U.S. government, and obligations of U.S. government agencies and instrumentalities. The Fund is not required, however, to invest set amounts in any of the various types of U.S. government securities. Sentinel will choose the types of U.S. government securities that it believes will provide capital preservation and the best return with the least risk in light of its analysis of current market conditions and its outlook for interest rates and the economy.
The Fund invests substantially in U.S. government mortgage-backed securities (“MBS”), including pass-through certificates guaranteed by the Government National Mortgage Association (“GNMA” or “Ginnie Mae”). Each GNMA certificate is backed by a pool of mortgage loans insured by the Federal Housing Administration and/or the Veterans Administration, and provides for the payment of minimum fixed monthly installments of principal and interest. The guarantee by GNMA of timely repayment of principal and payment of interest is backed by the full faith and credit of the United States. The Fund may invest in mortgage-backed securities issued and guaranteed by the Federal National Mortgage Association (“FNMA” or “Fannie Mae”) and by the Federal Home Loan Mortgage Corporation (“FHLMC” or “Freddie Mac”). In all of these mortgage-backed securities, the actual maturity of and realized yield will vary based on the prepayment experience of the underlying pool of mortgages. Mortgage- related securities issued by FNMA are guaranteed as to timely payment of principal and interest by FNMA. They are not backed by the full faith and credit of the United States, but are supported by the right of FNMA to borrow from the U.S. Treasury Department (e.g., the Federal Home Loan Banks). Mortgage-related securities issued by FHLMC are not guaranteed by the United States or by any Federal Home Loan Bank and do not constitute a debt or obligation of the United States or of any Federal Home Loan Bank. FHLMC guarantees timely payment of interest and ultimate collection of principal on its mortgage-related securities; provided, however, that FHLMC may remit on account of its guarantee of ultimate payment of principal the amount due with respect to any underlying mortgage loan at any time after default on such underlying mortgage, but in no event later than one year after it becomes payable. On September 6, 2008, Director James Lockhart of the Federal Housing Finance Agency (“FHFA”) appointed FHFA as conservator of both FNMA and FHLMC. In addition, the U.S. Treasury Department agreed to provide FNMA and FHLMC up to $100 billion of capital each on an as needed basis to insure that they continue to provide liquidity to the housing and mortgage markets. While the original maximum life of a mortgage-backed security considered for this Fund can vary, its average life is likely to be substantially less than the original maturity of the underlying mortgages, because the mortgages in these pools may be prepaid, refinanced, curtailed, or foreclosed. Prepayments are passed through to the mortgage-backed securityholder along with regularly scheduled minimum repayments of principal and payments of interest.
The Fund may also purchase or sell agency MBS on a “to be announced” or “TBA” basis, wherethe Fund buys or sells agency MBS on a forward commitment basis. In a TBA transaction, the seller of the agency MBS agrees on a sale price, but does not specify which particular securities will be delivered to the buyer on settlement day. Instead, only a few basic characteristics of the securities are agreed upon, such as the coupon rate and the face value. The Fund may engage in short sales of agency MBS that the Fund does not own, primarily as part of a TBA swap transaction. A TBA swap transaction involves an agreement to purchase one agency MBS and a simultaneous agreement to sell a different agency MBS.
The Fund utilizes an active trading approach, which is expected to result in portfolio turnover greater than 100%.
The Fund may attempt to hedge various risks, such as interest rate risk, using derivative instruments (e.g., futures and options on futures, swaps, options on swaps, and caps and floors), and may use derivative instruments for other investment purposes such as replicating permitted investments, as long as such investments do not have the effect of leveraging portfolio risks. The Fund is not required to use hedging and may choose not to do so.
The Fund may sell a security if the security is overvalued on a relative basis compared to other securities available in the market or for duration management purposes. The Fund may also sell a security to meet redemptions.
Sentinel International Equity Fund
Investment Objective
The Fund seeks growth of capital.
If the Fund’s Board of Directors determines that the Fund’s investment objective should be changed, shareholders of the Fund will be given at least 30 days’ notice before any such change is made. However, the investment objective can be changed without shareholder approval.
Principal Investment Strategies
The Fund normally invests at least 80% of its net assets in equity securities. This principal investment strategy is a non-fundamental policy that may not be changed without 60 days’ prior written notice to the Fund’s shareholders. The Fund invests mainly in common stocks of established companies located in or that conduct their business mainly in one or more foreign countries, which may include emerging markets. The Fund will normally be invested in ten or more foreign countries and may invest up to 40% of its assets in any one country if Sentinel feels that economic and business conditions make it appropriate to do so.
Sentinel employs a fundamental, bottom up approach to building its international equity portfolio. Our process starts with a regular quantitative screening in order to narrow the investable universe. Stocks are then analyzed based on the following five fundamental factors: business quality, valuation, growth, management, and balance sheet strength. Risk is managed through portfolio diversification, by individual issuer, sector and country.
The Fund focuses its investments on developed foreign countries, but may invest up to 25% of its total assets in emerging markets. It normally will have substantial investments in European countries. Up to 25% of the Fund’s assets may be invested in securities within a single industry. Although the Fund may invest in any economic sector, at times it may emphasize one or more particular sectors.
Normally, at least 75% of the Fund’s total assets are invested in securities of non-U.S. issuers selected by Sentinel mainly for their long-term capital growth prospects. The remaining 25% may be invested in companies organized in the United States that have at least 50% of their assets and/or revenues outside the United States.
The majority of the Fund’s trading of stocks occurs on established stock exchanges or in the over-the-counter markets in the countries in which investments are being made. The Fund also expects to purchase American Depositary Receipts (ADRs) and Global Depositary Receipts in bearer form, which are designed for use in non-U.S. securities markets. ADRs trade on U.S. exchanges or in the U.S. over-the-counter markets, and represent foreign stocks. To expedite settlement of portfolio transactions and minimize currency value fluctuations, the Fund may purchase foreign currencies and/or engage in forward foreign currency transactions. Normally, however, the Fund does not hedge its foreign currency exposure.
The Fund generally may sell a security when there is a deterioration of one or more of the five factors described above or when the portfolio manager identifies a more favorable investment opportunity. The Fund may also sell a security to meet redemptions or for tax management purposes.
Sentinel Low Duration Bond Fund
Investment Objective
The Fund seeks high current income and limited fluctuations in principal value.
Principal Investment Strategies
The Fund normally invests at least 80% of its net assets in fixed income instruments and related derivatives. The Fund’s policy of investing, under normal circumstances, at least 80% of its net assets in fixed income instruments and related derivatives is a non-fundamental policy that may not be changed without 60 days’ prior notice to the Fund’s shareholders. The Fund seeks to achieve its investment objective by investing principally in a diversified portfolio of fixed income instruments of varying maturities, and related derivatives. Related derivatives include exchange-traded futures on U.S. Treasury notes and bonds and equity indexes, and options on these futures, and other derivatives intended to hedge interest rate risk and credit risk, such as interest rate caps and floors, swaps and options on swaps. Under normal market conditions, the Fund expects to invest at least 50% of its total assets in investment grade debt securities. Investment grade debt securities are securities that are rated within the four highest grades assigned by rating agencies such as Moody’s (Aaa to Baa) and Standard and Poor’s (AAA to BBB), or are unrated but considered by Sentinel to be of comparable credit quality.
The investment-grade debt securities in which the Fund may invest include, among others:
• Corporate debt securities issued by U.S. companies;
• Corporate debt securities issued by non-U.S. (including emerging markets) companies that are denominated in U.S. dollars;
• Mortgage-backed and other asset-backed securities;
• Securities issued or guaranteed by the U.S. government, its agencies or instrumentalities; and
• Inflation-linked investments.
Under normal market conditions, the Fund expects to invest no more than 50% of its total assets in any one or combination of the following types of fixed income securities and other instruments:
• Below investment-grade debt securities (sometimes called “junk bonds”);
• Debt securities of non-U.S. (including emerging markets) issuers that are denominated in foreign currencies;
• Senior bank loans, primarily participations, but may also include bridge loans, novations and assignments; and
• Convertible securities, including convertible bonds and preferred stocks.
The Fund attempts to manage interest rate risk through its management of the average duration of the securities it holds in its portfolio. Under normal market conditions, the Fund expects to maintain its average duration range between zero and three years. Duration is a mathematical concept that measures a portfolio’s sensitivity to changes in interest rates. The longer a portfolio’s duration, the more sensitive the portfolio is to shifts in interest rates. In comparison to maturity (which is the date on which a debt instrument ceases and the issuer is obligated to repay the principal amount), duration is a measure of the expected price volatility of a debt instrument as a result of changes in market rates of interest, based on the weighted average timing of the instrument’s expected principal and interest payments and other factors. Duration differs from maturity in that it considers a security’s yield, coupon payments, principal payments, call features and coupon adjustments in addition to the amount of time until the security finally matures. As the value of a security changes over time, so will its duration. Prices of securities with lower durations tend to be less sensitive to interest rate changes than securities with higher durations. Similarly, a portfolio with a shorter average duration is expected to be less sensitive to interest rate changes than a portfolio with a higher duration.
The Fund may invest in exchange-traded funds (“ETFs”) in carrying out its investment strategies. The Fund considers investments in bond ETFs (ETFs whose underlying portfolio consists of debt instruments) as investments in fixed income instruments. At times, the Fund may have considerable exposure to ETFs.
Subject to the limitations above, the Fund may invest in below investment-grade debt securities, sometimes called “junk bonds”. Below investment-grade debt securities are debt securities that are rated below Baa by Moody’s or below BBB by Standard and Poor’s, or are unrated but considered by Sentinel to be of comparable credit quality.
The investment grade and below investment-grade debt securities described above may include mortgage-backed (“MBS”), mortgage-related and other asset-backed securities, which directly or indirectly represent a participation in, or are secured by and payable from, mortgage loans, real property, or other assets. Mortgage-related securities include mortgage pass-through securities, collateralized mortgage obligations (“CMO”s), commercial mortgage-backed securities (“CMBS”), mortgage dollar rolls, stripped mortgage-backed securities (“SMBS”) and other securities that directly or indirectly represent a participation in, or are secured by and payable from, mortgage loans on real property.
The Fund may also purchase or sell “to be announced” or “TBA” securities, which usually are transactions in which the Fund buys or sells agency mortgage-backed securities (“MBS”) on a forward commitment basis. In a TBA transaction, the seller of the agency MBS agrees on a sale price, but does not specify which particular securities will be delivered to the buyer on settlement day. Instead, only a few basic characteristics of the securities are agreed upon, such as the coupon rate and the face value. The Fund may engage in short sales of agency MBS that the Fund does not own, primarily as part of a TBA swap transaction. A TBA swap transaction involves an agreement to purchase one agency MBS and a simultaneous agreement to sell a different agency MBS.
Inflation-linked, or inflation-indexed fixed income securities are securities whose principal and/or interest payments are adjusted for inflation, unlike traditional fixed income securities that make fixed or variable principal and interest payments. The Fund may invest in Treasury Inflation Protected Securities (“TIPS”), which are U.S. government bonds whose principal automatically is adjusted for inflation as measured by the CPI, and other inflation-indexed securities issued by the U.S. Department of the Treasury. In addition to investing in TIPS, the Fund also may invest in sovereign inflation-indexed fixed income securities (sometimes referred to as “linkers”) issued by non-U.S. sovereign entities. To the extent that the Fund invests in such non-U.S. inflation-indexed fixed income securities that are denominated in foreign currencies, the Fund will limit such investments in accordance with the limitations described above.
The Fund may invest in convertible securities, such as preferred stocks or bonds, which are exchangeable at the option of the holder for a fixed number of other securities, usually common stock, at a set price or formula.
The Fund may invest in floating and/ or adjustable rate senior bank loans. Senior bank loans are business loans made to borrowers that may be U.S. or foreign corporations, partnerships or other business entities. The interest rates on these loans periodically are adjusted to a generally recognized base rate such as the London Interbank Offered Rate or the prime rate as set by the Federal Reserve. Senior loans typically are secured by specific collateral of the borrower and hold the most senior position in the borrower’s capital structure or share the senior position with the borrower’s other senior debt securities. This capital structure position generally gives holders of senior loans a priority claim on some or all of the borrower’s assets in the event of default.
The Fund may invest in Rule 144A securities.
The Fund may use derivative instruments in order to hedge various risks and manage the average duration of the Fund’s portfolio. Currently, it expects to invest principally in futures, options, swaps and options on swaps The Fund may use derivative instruments for other investment purposes, such as replicating permitted investments, as long as such investments do not have the effect of leveraging portfolio risks. The Fund is not required to use hedging and may choose not to do so. The Fund may engage in such transactions on an exchange or in the over-the-counter (“OTC”) market.
The Fund utilizes an active trading approach which is expected to result in portfolio turnover greater than 100%.
Sentinel may sell a security if it no longer meets the Fund’s investment criteria, or for a variety of other reasons, such as to secure gains, limit losses, maintain its duration, redeploy assets into opportunities believed to be more promising, or satisfy redemption requests, among others.
Sentinel Multi-Asset Income Fund
Investment Objective
The Fund seeks a high level of current income, with a secondary objective of long-term capital appreciation.
Principal Investment Strategies
The Fund normally invests in a broad range of debt instruments and equity securities. The Fund may shift its investments from one asset class to another based on Sentinel’s analysis of the best opportunities for the Fund in a given market.
The debt instruments in which the Fund may invest include all varieties of fixed, floating and variable rate instruments, including, without limitation, secured and unsecured bonds and mortgage-backed or other asset-backed securities. The debt instruments may be of any maturity and any credit quality, including high-yield (below investment-grade) bonds (sometimes called “junk bonds”). The Fund may invest up to 100% of its assets in debt instruments, and has the flexibility to invest exclusively in any one type of debt instrument, including junk bonds, or in any combination of debt instruments.
The Fund may also invest in other debt securities, including government obligations, debt securities convertible into common stocks, debentures, bank loans, zero-coupon securities, notes, short-term debt instruments, when-issued securities, Rule 144A securities, structured notes and repurchase agreements. The below investment-grade debt securities in which the Fund may invest may include distressed securities.
The Fund may invest in any stock or other equity security that Sentinel believes may assist the Fund in pursuing its investment objective, including common stocks of companies of any size or any market capitalization, preferred stock, securities convertible into common stocks, utility stocks, publicly-traded real estate investment trusts (“REITs”) securities and other equity trusts and partnership interests, including master limited partnerships (“MLPs”) that are generally in energy-related industries. The Fund may invest up to 100% of its assets in equity and equity-related securities, but currently expects to invest no more than 40% of its assets in equity securities. The Fund will not invest more than 70% of its assets in equity and equity-related securities of foreign issuers.
REITs are companies that own interests in real estate or in real estate related loans or other interests, and have revenue primarily consisting of rent derived from owned, income producing real estate properties and capital gains from the sale of such properties. REITs can generally be classified as equity REITs, mortgage REITs and hybrid REITs. Equity REITs invest the majority of their assets directly in real property and derive their income primarily from rents. Equity REITs can also realize capital gains by selling properties that have appreciated in value. Mortgage REITs invest the majority of their assets in real estate mortgages and derive their income primarily from interest payments. Hybrid REITs combine the characteristics of both equity REITs and mortgage REITs. REITs are not taxed on income distributed to shareholders provided they comply with the requirements of the Internal Revenue Code of 1986, as amended (the “Internal Revenue Code”). The Fund intends to invest in equity REITs.
The Fund may invest in both U.S. and non-U.S. dollar denominated debt instruments and equity securities, and securities of U.S. and foreign issuers, including emerging markets issuers.
The Fund may also purchase or sell “to be announced” or “TBA” securities, which usually are transactions in which the Fund buys or sells agency mortgage-backed securities (“MBS”) on a forward commitment basis. In a TBA transaction, the seller of the agency MBS agrees on a sale price, but does not specify which particular securities will be delivered to the buyer on settlement day. Instead, only a few basic characteristics of the securities are agreed upon, such as the coupon rate and the face value. The Fund may engage in short
sales of agency MBS that the Fund does not own, primarily as part of a TBA swap transaction. A TBA swap transaction involves an agreement to purchase one agency MBS and a simultaneous agreement to sell a different agency MBS.
The Fund may invest in exchange-traded funds (“ETFs”) in carrying out its investment strategies. At times, the Fund may have considerable exposure to ETFs, potentially a majority of the Fund’s assets may be invested in a combination of different ETFs.
The Fund may attempt to hedge various risks, such as interest rate, equity, credit and currency risk, using derivative instruments (e.g., exchange-traded futures and options, and other derivatives such as swaps, options on swaps, and interest rate caps and floors), and may use derivative instruments for other investment purposes such as replicating permitted investments, as long as such investments do not have the effect of leveraging portfolio risks. The Fund is not required to use hedging and may choose not to do so.
The Fund utilizes an active trading approach, which is expected to result in portfolio turnover greater than 100%.
The Fund may purchase or sell securities on a when-issued, delayed delivery and forward commitment basis.
Although the Fund may invest in any economic sector, at times it may emphasize one or more particular sectors.
The Fund may sell a security if it no longer meets the Fund’s investment criteria, or for a variety of other reasons, such as to secure gains, limit losses, redeploy assets into opportunities believed to be more promising, or satisfy redemption requests, among others.
Sentinel Small Company Fund
Investment Objective
The Fund seeks growth of capital.
Principal Investment Strategies
The Fund normally invests at least 80% of its net assets in small-capitalization companies. This principal investment strategy is a non-fundamental policy that may not be changed without 60 days’ prior written notice to the Fund’s shareholders. For this purpose, small companies are considered to be companies that have, at the time of purchase, market capitalizations of less than $4 billion. For these purposes the market cap is determined at the time of purchase. The Fund invests primarily in common stocks of small companies that Sentinel believes are high quality, have superior business models, solid management teams, sustainable growth potential and are attractively valued. The weighted median market capitalization of the Fund’s holdings as of February 29, 2017 was approximately $2.3 billion. Market capitalization is the total value of all the outstanding shares of common stock of a company.
Up to 25% of the Fund’s assets may be invested in securities within a single industry. The Fund attempts to be well-balanced across major economic sectors. Although the Fund may invest in any economic sector, at times it may emphasize one or more particular sectors. The Fund may invest without limitation in foreign securities, although only where the securities are trading in the U.S. or Canada and only where trading is denominated in U.S. or Canadian dollars.
At times the Fund may have less than 80% of its investments in companies with a market cap of less than $4 billion due to market appreciation.
The Fund would typically sell a security if the portfolio managers believe it is overvalued, if the original investment premise is no longer true and/or if the holding size exceeds the portfolio managers’ company or sector weighting guidelines. The Fund may also sell a partial position in a security in order to manage the size of the position. The Fund may also sell a security to meet redemptions.
Sentinel Sustainable Core Opportunities Fund
Investment Objective
The Fund seeks long-term capital appreciation.
If the Fund’s Board of Directors determines that the Fund’s investment objective should be changed, shareholders of the Fund will be given at least 30 days’ notice before any such change is made. However, the investment objective can be changed without shareholder approval.
Principal Investment Strategies
The Fund normally invests at least 65% of its net assets in stocks of well-established U.S. companies, typically those with market capitalizations above $5 billion.
Sentinel’s philosophy is based on a long-term view and emphasizes diversification, high quality, and valuation discipline. The Fund favors companies that have a high degree of corporate responsibility. Sentinel looks for securities of high quality companies with a positive multi-year outlook offered at attractive valuation levels based on a number of metrics, including value relative to its history, peers and/or the market over time. The Fund may invest up to 25% of its assets in stocks of companies within a single industry. Although the Fund may invest in any economic sector, at times it may emphasize one or more particular sectors. The Fund may also invest in stocks with the potential to provide current income, growth of income and relatively low risk as compared to the stock market as a whole when consistent with the Fund’s investment objective.
The Fund may invest without limitation in foreign securities.
The Fund may sell a security if the fundamentals of the company are deteriorating or the original investment premise is no longer valid, the stock is trading meaningfully higher than what the portfolio managers believe is a fair valuation, to manage the size of the holding or the sector weighting and/or to take advantage of a more attractive investment opportunity. The Fund may sell a security to meet redemptions. Additionally, a security will be sold if it is determined that it no longer meets the environmental, social and/or corporate governance performance criteria.
Sustainable and Responsible Investing. The Fund employs a process of environmental, social, and corporate governance (“ESG”) screening that is overseen by Sentinel’s in-house sustainable research department. Through a disciplined process, Sentinel’s sustainable research analysts produce a detailed evaluation of corporate policies and practices. First, Sentinel’s financial analysts and portfolio managers apply a series of exclusionary screens developed by our sustainable research analysts to a company. If a company passes the exclusionary screens, the company’s securities are eligible to be purchased by the Fund. Next, Sentinel’s sustainable research analysts conduct a second, more in-depth qualitative screening process. If a company fails the qualitative screening process, the company’s securities are no longer eligible for investment and must be sold within 90 days of the final rejection of the company by the sustainable research team if it is held by the Fund. As a result, the Fund may be required to sell securities based on social, environmental or corporate governance reasons when it may be financially disadvantageous to do so. While no investment is ever made solely based on the qualitative criteria alone, the Fund believes sustainable screening provides a unique and more comprehensive view of the companies it considers for investment.
Generally, companies are eliminated from investment consideration if they:
| | • | have material interests in the production of tobacco or tobacco products, or if the sale of such products represents a significant source of revenue; |
| | • | have material interests in the production of alcoholic beverages or if sale of such products represents a significant source of revenue; |
| | • | generate nuclear power or supply nuclear facilities with industry specific components, as a primary line of business; |
| | • | have material interests in the manufacture of weapons or weapons-specific components; |
| | • | are involved in gambling as a main line of business; and/or |
| | • | lack diversity at the level of the board of directors or senior management. |
The Fund favors companies that:
| | • | publish and enforce codes of conduct and vendor standards; |
| | • | promote equal opportunity, diversity and good employee relations; |
| | • | are sensitive to community concerns; |
| | • | seek alternatives to animal testing when not required by law; and/or |
| | • | have minimal impact on the environment and engage in proactive environmental initiatives. |
Sentinel may, in its discretion, choose to apply additional screens, modify the application of the screens listed above or vary the application of the screens listed above to the Fund’s investments at any time without shareholder approval.
Sentinel Total Return Bond Fund
Investment Objective
The Fund seeks maximum investment return through a combination of current income and capital appreciation.
If the Fund’s Board of Directors determines that the Fund’s investment objective should be changed, shareholders of the Fund will be given at least 30 days’ notice before any such change is made. However, the investment objective can be changed without shareholder approval.
Principal Investment Strategies
The Fund seeks to achieve its investment objective by investing in fixed-income securities and in related derivatives, such as interest rate, credit, equity and foreign currency derivatives (futures, options, swaps, options on swaps, and caps and floors).
The Fund invests primarily in investment grade bonds.
At least 80% of the Fund’s assets will normally be invested in the following types of bonds and related derivatives:
1. Corporate bonds of varying maturities issued by various U.S. and non-U.S. private-sector entities denominated in U.S. dollars and foreign currencies;
2. Debt securities issued or guaranteed by the U.S. government, its agencies or instrumentalities, including mortgage-backed securities, and by non-U.S. sovereign and quasi-sovereign entities; and
3. Taxable or tax-exempt municipal securities.
The Fund may invest in securities of any duration. Duration is a mathematical concept that measures a fixed income security’s sensitivity to interest rate changes. The value of a fixed-income security with a positive duration will decline if interest rates increase. The longer the portfolio’s duration, the more sensitive it is to changes in interest rates. For example, the value of a portfolio with a duration of five years would be expected to fall approximately five percent if interest rates rose by one percentage point and a portfolio with a duration of two years would be expected to fall approximately two percent if interest rates rose by one percentage point.
The Fund’s policy of investing, under normal circumstances, at least 80% of its assets in bonds and related derivatives is a non-fundamental policy that may not be changed without 60 days’ prior notice to the Fund’s shareholders.
The fixed-income securities in which the Fund may invest include, among other things, corporate bonds and other debt securities, U.S. government securities, commercial paper, zero-coupon securities, mortgage-related securities (including senior and junior loans, mortgage dollar rolls, stripped mortgage-related securities, and collateralized mortgage obligations) and other asset-backed securities, when-issued securities, REIT securities, Rule 144A securities, structured notes, repurchase agreements, preferred stocks and convertible debt and equity securities.
The Fund will invest no more than 50% of its total assets in lower quality bonds, sometimes called “junk bonds.” These bonds, because of the greater possibility that the issuers will default, are not investment grade - that is, they are rated below BBB by Standard & Poor’s or below Baa by Moody’s, or are unrated but considered by Sentinel to be of comparable credit quality.
The Fund may invest in exchange-traded funds (“ETFs”) in carrying out its investment strategies. The Fund considers investments in bond ETFs (ETFs whose underlying portfolio consists of debt instruments) as investments in fixed income instruments. At times, the Fund may have considerable exposure to ETFs.
The Fund may also purchase or sell “to be announced” or “TBA” securities, which usually are transactions in which the Fund buys or sells agency mortgage-backed securities (“MBS”) on a forward commitment basis. In a TBA transaction, the seller of the agency MBS agrees on a sale price, but does not specify which particular securities will be delivered to the buyer on settlement day. Instead, only a few basic characteristics of the securities are agreed upon, such as the coupon rate and the face value. The Fund may engage in short sales of agency MBS that the Fund does not own, primarily as part of a TBA swap transaction. A TBA swap transaction involves an agreement to purchase one agency MBS and a simultaneous agreement to sell a different agency MBS.
Up to 25% of the Fund’s net assets may be invested in securities within a single industry.
The Fund utilizes an active trading approach, which is expected to result in portfolio turnover greater than 100%.
The Fund may use derivative instruments (e.g., exchange-traded derivatives such as futures and options, and other derivatives such as swap agreements, options on swaps, interest rate caps and floors, credit default swaps and credit indices) in order to hedge various risks, such as interest rate, credit and currency risk. The Fund may use derivative instruments for other investment purposes, such as replicating permitted investments, as long as such investments do not have the effect of leveraging portfolio risks. The Fund is not required to use hedging and may choose not to do so.
The Fund may sell a security if the security is overvalued on a relative basis compared to other securities available in the market, if the fundamentals of the company are deteriorating, or for duration management purposes. The Fund may also sell a security to meet redemptions.
Sentinel Unconstrained Bond Fund
Investment Objective
The Fund seeks maximum investment return through a combination of current income and capital appreciation.
If the Fund’s Board of Directors determines that the Fund’s investment objective should be changed, shareholders of the Fund will be given at least 30 days’ notice before any such change is made. However, the investment objective can be changed without shareholder approval.
Principal Investment Strategies
Under normal circumstances, the Fund seeks to achieve its investment objective by investing at least 80% of its net assets (plus any borrowings made for investment purposes) in U.S. and non-U.S. fixed-income instruments and related derivatives. The Fund’s investments may be represented by forwards or derivative instruments. The Fund focuses on investments in U.S. fixed-income instruments. “Fixed-income instruments” include bonds, debt securities and similar instruments. The Fund has a flexible investment strategy, and will utilize a variety of investment techniques, and may invest in a broad array of fixed income instruments. The Fund’s investments in fixed-income instruments may include, among other things, corporate bonds and other debt securities, U.S. government and agency securities, foreign government and supranational debt securities, emerging market debt securities, commercial paper, zero-coupon securities, mortgage-related securities (including senior and junior loans, mortgage dollar rolls, stripped mortgage-related securities, and collateralized mortgage obligations) and other asset-backed securities, collateralized debt and loan obligations, when-issued securities, investments in REIT securities, Rule 144A securities, preferred securities, structured products, repurchase agreements, reverse repurchase agreements, convertible securities and mezzanine securities. The Fund may invest in fixed, variable and floating rate instruments, including bank loans or loan participation interests in secured, second lien or unsecured variable, fixed or floating rate loans. . The Fund may invest in fixed income instruments of any maturity. The Fund may invest in non-U.S. dollar denominated securities on a currency hedged or unhedged basis, and may invest in foreign (non-U.S.) currencies for hedging or investment purposes. The Fund may invest up to 20% of its net assets, at the time of purchase, in equity securities. The Fund may also invest in exchange-traded funds (“ETFs”) in carrying out its investment strategies. The Fund considers investments in bond ETFs (ETFs whose underlying portfolio consists of debt instruments) as investments in fixed income instruments. At times, the Fund may have considerable exposure to ETFs. Fund management may adjust the Fund’s portfolio among various types of instruments based on then-current or anticipated market conditions.
The Fund’s policy of investing, under normal circumstances, at least 80% of its net assets (plus any borrowings made for investment purposes) in U.S. and non-U.S. fixed-income instruments, which may be represented by forwards or derivative instruments, is a non-fundamental policy that may not be changed without 60 days’ prior notice to the Fund’s shareholders.
The Fund may invest in fixed income instruments of any credit quality, including instruments that are in default. The Fund will invest no more than 70% of its total assets in lower quality bonds, sometimes called “junk bonds.” These bonds, because of the greater possibility that the issuers will default, are not investment grade - that is, they are rated below BBB by Standard & Poor’s or below Baa by Moody’s, or are unrated but considered by Sentinel to be of comparable credit quality.
The Fund may invest in securities of any duration. The average portfolio duration of the Fund will normally vary from negative five (-5) years to positive ten (10) years, depending on Sentinel’s forecast of interest rates and its assessment of market risks generally. Duration is a mathematical concept that measures a portfolio’s sensitivity to interest rate changes. The longer the portfolio’s duration, the more sensitive the portfolio is to shifts in interest rates. In comparison to maturity (which is the date on which a debt instrument ceases and the issuer is obligated to repay the principal amount), duration is a measure of the expected price volatility of a debt
instrument as a result of changes in market rates of interest, based on the weighted average timing of the instrument’s expected principal and interest payments and other factors. Duration differs from maturity in that it considers a security’s yield, coupon payments, principal payments, call features and coupon adjustments in addition to the amount of time until the security finally matures. As the value of a security changes over time, so will its duration. The value of a fixed-income security with a positive duration will decline if interest rates increase. The value of a fixed-income security with a negative duration will increase if interest rates increase. Prices of securities with lower durations tend to be less sensitive to interest rate changes than securities with higher durations. Similarly, a portfolio with a shorter average duration is expected to be less sensitive to interest rate changes than a portfolio with a higher average duration.
The Fund may also purchase or sell “to be announced” or “TBA” securities, which usually are transactions in which the Fund buys or sells agency mortgage-backed securities (“MBS”) on a forward commitment basis. In a TBA transaction, the seller of the agency MBS agrees on a sale price, but does not specify which particular securities will be delivered to the buyer on settlement day. Instead, only a few basic characteristics of the securities are agreed upon, such as the coupon rate and the face value. The Fund may engage in short sales of agency MBS that the Fund does not own, primarily as part of a TBA swap transaction. A TBA swap transaction involves an agreement to purchase one agency MBS and a simultaneous agreement to sell a different agency MBS.
The Fund may use derivative instruments without limitation for hedging or for other investment purposes, such as replicating permitted investments. The Fund may use derivative instruments to gain both long and short exposure to fixed-income or other instruments by investing in, among other instruments, derivatives such as futures and options, and other derivatives such as swap agreements, including interest rate swaps, total return swaps, credit default swaps and index swaps and forward contracts, subject to applicable law and any other restrictions described in the Fund’s prospectus or Statement of Additional Information. The Fund is not required to use hedging and may choose not to do so. Currently, the Fund expects to utilize primarily the following derivative instruments: futures, interest rate swaps and credit default swaps.
The derivatives used by the Fund may involve substantial leverage risk and may expose the Fund to potential losses that exceed the amount originally invested by the Fund.
The Fund may use borrowings or other leverage for investment purposes. The Fund may enter into transactions such as reverse repurchase agreements and dollar rolls.
The Fund has fewer restrictions than many other fixed income funds, and utilizes an active trading approach, which is expected to result in portfolio turnover greater than 100%.
The Fund may engage in dollar roll transactions. In a dollar roll, the Fund sells mortgage-backed or U.S. Treasury securities for delivery in the current month, and simultaneously contracts to buy back securities of the same type, coupon and maturity on a predetermined future date. During the roll period, the Fund forgoes principal and interest paid on the mortgage-backed or U.S. Treasury securities. In return, the Fund receives the difference between the current sales price and the lower forward price for the future purchase (often referred to as the “drop”), and interest earned on the cash proceeds of the initial sale. A “covered roll” is a specific type of dollar roll in which the proceeds of a dollar roll are held in a separate account and invested only in high-grade, money-market instruments. The Fund may only invest in covered rolls.
The Fund may invest in repurchase agreements, provided the counterparty maintains the value of the underlying securities at not less than 102% of the repurchase price stated in the agreement. Under a repurchase agreement, the Fund purchases bonds and simultaneously agrees to resell these bonds to a counterparty at a prearranged time and specific price.
The Fund may sell a security if the security is overvalued on a relative basis compared to other securities available in the market, if the fundamentals of the company are deteriorating, or for duration management purposes. The Fund may also sell a security to meet redemptions.
From time to time, the Fund may invest up to 100% of its assets in cash, commercial paper, high-grade bonds, or cash equivalents for temporary defensive reasons if Sentinel believes that adverse market or other conditions warrant. This strategy is an attempt to protect the Fund’s assets from a temporary unacceptable risk of loss. If the Fund takes a temporary defensive position, it may not achieve its investment objective.
Other Investment Strategies
Convertible Securities. The International Equity Fund also may invest in convertible or debt securities rated Baa or higher by Moody’s Investors Service, Inc. or BBB or higher by Standard & Poor’s.
Derivative Instruments. The Common Stock, International Equity, Mid Cap, Small Company and Sustainable Core Opportunities Funds also may use derivative instruments (e.g., futures and options agreements) for hedging purposes, and for other investment purposes such as replicating permitted investments, as long as such investments do not have the effect of leveraging portfolio risks. Each of these Funds may establish derivative positions only when immediately thereafter not more than 5% of its total assets are held in derivative positions. The Funds are not required to use hedging and may choose not to do so.
Dollar Rolls. The Balanced, Government Securities, Low Duration Bond, Multi-Asset Income, Total Return Bond and Unconstrained Bond Funds may engage in dollar roll transactions. In a dollar roll, a Fund sells mortgage-backed or U.S. Treasury securities for delivery in the current month, and simultaneously contracts to buy back securities of the same type, coupon and maturity on a predetermined future date. During the roll period, a Fund forgoes principal and interest paid on the mortgage-backed or U.S. Treasury securities. In return, a Fund receives the difference between the current sales price and the lower forward price for the future purchase (often referred to as the “drop”), and interest earned on the cash proceeds of the initial sale. A “covered roll” is a specific type of dollar roll in which the proceeds of a dollar roll are held in a separate account and invested only in high-grade, money-market instruments. The Funds may only invest in covered rolls.
Investments in Money Market Funds and Instruments. Each Fund may invest in high quality registered and unregistered money market funds and high quality money market instruments pending investments or to maintain liquidity for the payment of redemptions or other purposes. A Fund will not be deemed to deviate from its normal strategies if it holds these money market securities. The Government Securities Fund may invest up to 20% of its net assets in high-quality, money-market instruments that are not issued or guaranteed by the U.S. government or its agencies or instrumentalities. These include bank money market instruments, commercial paper or other short-term corporate obligations listed in the highest rating categories by nationally recognized statistical rating organizations. These money market instruments may be used as a means of making short-term investments.
Investments in other Investment Companies, including Exchange-Traded Funds. All of the Funds may invest in other investment companies, including exchange-traded fund (“ETFs”), to the extent permitted by the 1940 Act. In addition, each of the Balanced, Low Duration Bond, Multi-Asset Income, Total Return Bond and Unconstrained Bond Funds may invest in certain ETFs in excess of the limits permitted by the 1940 Act pursuant to an exemptive order obtained by the ETF on which these Funds may rely . As with traditional mutual funds, ETFs charge asset-based fees, although these fees tend to be relatively low. ETFs are traded on stock exchanges or on the over-the-counter market. ETFs do not charge initial sales charges or redemption fees and each Fund pays customary brokerage fees to buy and sell ETF shares.
Master Limited Partnerships. The Multi-Asset Income Fund may invest in MLPs. MLPs are limited partnerships or limited liability companies taxable as partnerships. MLPs may derive income and gains from the exploration, development, mining or production, processing, refining, transportation (including pipelines transporting gas, oil, or products thereof), or the marketing of any mineral or natural resources. MLPs generally have two classes of owners, the general partner and limited partners. When investing in an MLP, the Fund intends to purchase publicly traded common units issued to limited partners of the MLP. The general partner is typically owned by a major energy company, an investment fund, the direct management of the MLP or is an entity owned by one or more of such parties. The general partner may be structured as a private or publicly traded corporation or other entity.
Repurchase Agreements. Each Fund may invest in repurchase agreements, provided the counterparty maintains the value of the underlying securities at not less than 102% of the repurchase price stated in the agreement. Under a repurchase agreement, a Fund purchases bonds and simultaneously agrees to resell these bonds to a counterparty at a prearranged time and specific price. A Fund might incur time delays or losses if the other party to the agreement defaults on the repurchase of the securities.
Securities Lending. Each Fund may participate in a securities lending program. Due to the nature of the holdings of the Small Company, Multi-Asset Income and Total Return Bond Funds, these Funds’ participation in a securities lending program may involve a substantial amount of their respective holdings.
Short Term-Trading. The Small Company Fund’s policy is to avoid short-term trading. However, the Fund may sell a security without regard to its holding period if Sentinel believes it is in the Fund’s best interest to do so. The Fund’s turnover rate is not expected to exceed 100% annually.
Temporary Defensive Position. Each Fund may invest up to 100% of its assets in cash, commercial paper, high-grade bonds, or cash equivalents for temporary defensive reasons if Sentinel believes that adverse market or other conditions warrant. This is to attempt to protect the Fund’s assets from a temporary unacceptable risk of loss. If a Fund takes a temporary defensive position, it may not achieve its investment objective.
Investment Risks
We cannot guarantee that a Fund’s investment objective will be achieved. You can find additional information about the investment risks of the Funds in the Funds’ Statement of Additional Information, which is incorporated by reference into (is legally made a part of) this Prospectus. You can get a free copy of the Statement of Additional Information by calling 1-800-282-FUND (3863), by visiting sentinelinvestments.com, or by writing to Sentinel Investments at PO Box 55929, Boston, MA 02205-5929. The Funds are not guaranteed or insured by the U.S. government. The value of a Fund’s shares is expected to fluctuate.
Principal Equity Securities Risks
Illiquid Securities Risk. Securities held by the Small Company Fund that are not deemed to be illiquid at the time of purchase may become illiquid. Other securities, such as lower-quality bonds and restricted securities (securities subject to legal or contractual restrictions on resale) may also become illiquid, even if they are not deemed to be illiquid at the time of purchase. Some restricted securities (such as securities issued pursuant to Rule 144A under the Securities Act of 1933 or certain commercial paper) may be treated as liquid, although they may be less liquid than registered securities traded on established secondary markets. Sentinel may determine that certain Rule 144A securities in which certain of the Funds invest are liquid securities under guidelines approved by the Funds’ Board of Directors, and these Rule 144A securities will not be subject to any limitation or prohibition on the purchase of illiquid securities. Rule 144A securities may become illiquid if qualified institutional buyers are unavailable. The Fund will not be able to readily resell illiquid securities. The inability to sell these securities at the most opportune time may negatively affect the Fund’s net asset value.
Investment Style Risk. The International Equity and Small Company Funds tend to focus on “growth” stocks, and target stocks with what the managers consider sustainable, rather than aggressive, growth rates and that are trading at reasonable valuations. The Common Stock Fund, the equity portion of the Balanced Fund and the Sustainable Core Opportunities Fund focus on both “growth” and “value” stocks, or stocks with characteristics of both, commonly called a blend style. Different types of stocks tend to shift into and out of favor with stock market investors depending on market and economic conditions. Growth stocks may be more volatile than other stocks because they are generally more sensitive to investor perceptions of the issuing company’s growth of earnings potential. Also, because growth companies usually invest a high portion of earnings in their business, growth stocks may lack the dividends of value stocks that can cushion stock prices in a falling market. Value stocks may not increase in price or pay dividends, as anticipated by the Funds’ managers, or may decline even further if: other investors fail to recognize the company’s value; other investors favor investing in faster-growing companies; or the factors that the managers believe will increase the price do not occur. The Funds’ performance may at times be better or worse than the performance of funds that focus on other types of stocks or that have a broader investment style.
Preferred Stock Risk. Preferred stock represents an equity or ownership interest in a company. Preferred stock normally pays dividends at a specified rate and has precedence over common stock in the event the issuer is liquidated or declares bankruptcy. However, in the event a company is liquidated or declares bankruptcy, the claims of owners of bonds take precedence over the claims of those who own preferred and common stock. Preferred stock, unlike common stock, often has a stated dividend rate payable from the corporation’s earnings. Preferred stock dividends may be cumulative or non-cumulative, participating, or auction rate. If interest rates rise, the fixed dividend on preferred stocks may be less attractive, causing the price of such stocks to decline. Preferred stock may have mandatory sinking fund provisions, as well as provisions allowing the stock to be called or redeemed, which can limit the benefit of a decline in interest rates. Preferred stock is subject to many of the risks to which common stock and debt securities are subject.
Sector Risk. To the extent a Fund invests in a particular sector, it is subject to the risks of that sector. Returns in an economic sector may trail returns from other economic sectors. As a group, sectors tend to go through cycles of doing better or worse than the securities market in general. These periods may last several years. In addition, the sectors that dominate the market change over time. For more information on risks of a particular sector consult the Funds’ Statement of Additional Information.
Stock Market and Selection Risk. Stock market risk is the risk that the stock market will go down in value, including the possibility that the market will go down sharply and unpredictably. Selection risk is the risk that the investments that Sentinel selects will underperform the stock market or other funds with similar investment objectives and investment strategies.
Stocks of Smaller Companies Risk. The stocks of small- and mid-capitalization companies in which the Small Company Fund invests typically involve more risk than the stocks of larger companies. These smaller companies may have more limited financial
resources, narrower product lines, and may have less seasoned managers. In addition, these stocks may trade less frequently and in lower share volumes, making them subject to wider price fluctuations.
Principal Fixed-Income Securities Risks
Bank Loan Risk. The market for bank loans in which the Funds may invest may not be highly liquid and, in some cases, the Funds may have to dispose of such securities at a substantial discount from face value. These investments may expose the Funds to the credit risk of the underlying corporate borrower. When interest rates decline, borrowers may pay off bank loans more quickly than originally anticipated, and the Fund may have to invest the proceeds in securities with lower yields.
Derivatives Risk. The Funds may use derivatives, which are financial contracts whose value depends upon or is derived from the value of an underlying asset, reference rate, or index. Derivative investments can increase Fund losses and/or increase volatility. Derivative instruments may be difficult to price, and may be leveraged so that small changes may produce disproportionate losses for the Funds. Derivatives involve counterparty risk (the risk that the counterparty of the derivative transaction or a clearing member used by the Fund to hold a cleared derivatives contract will be unable or unwilling to honor its financial obligation to the Fund), basis risk (the risk that the derivative instrument will not fully offset the underlying positions), and liquidity risk (the risk that the Fund cannot sell the derivative instrument because of an illiquid secondary market). In addition, the portfolio managers may incorrectly forecast the values of securities, currencies or interest rates or other economic factors in using derivatives for the Fund.
Specific Risks relating to the derivatives used by the Funds:
Futures Contracts and Options on Futures Contracts: A futures contract is a standardized, exchange-traded agreement that obligates the buyer to buy and the seller to sell a specified quantity of an underlying asset (or settle for cash the value of a contract based on an underlying asset, rate or index) at a specific price on the contract maturity date. Options on futures contracts are options that call for the delivery of futures contracts upon exercise. Futures contracts and options on futures contracts are subject to risks, including (i) imperfect correlation to the underlying asset, (ii) lack of liquidity, (iii) losses caused by unanticipated market movements, which are potentially unlimited, and (iv) the risk that the counterparty will not perform its obligations.
Swaps: Swaps are two party contracts that generally obligate the parties to exchange payments based on a specified reference security, basket of securities, security index or index component. Swaps can involve greater risks than direct investments in securities because swaps may be leveraged. Swaps also involve the risk that the counterparty may not be able to satisfy its obligations to pay the Fund, and the risk that the Fund may not be able to satisfy its obligation to pay the counterparty. Certain swaps, including but not limited to certain interest rate swaps, are required to be executed on a regulated exchange or trading facility and cleared through a regulated clearinghouse, involving the risk of a default by or insolvency of the clearinghouse. Swaps may also be difficult to value.
Credit Default Swaps: A credit default swap involves a protection buyer and a protection seller. The Fund may be either a protection buyer or seller. The protection buyer makes periodic premium payments to the protection seller during the swap term in exchange for the protection seller agreeing to make certain defined payments to the protection buyer in the event certain defined credit events occur with respect to a particular security, issuer or basket of securities.
Options: The Fund may purchase and write put and call options on securities and indices. A put option on a security gives the purchaser of the option the right to sell, and the writer of the option the obligation to buy, the underlying security at any time during the option period. A call option on a security gives the purchaser of the option the right to buy, and the writer of the option the obligation to sell, the underlying security at any time during the option period. The premium paid to the writer is the consideration for undertaking the obligations under the option contract.
Put and call options on indices are similar to options on securities except that options on an index give the holder the right to receive, upon exercise of the option, an amount of cash if the closing level of the underlying index is greater than (or less than, in the case of puts) the exercise price of the option. This amount of cash is equal to the difference between the closing price of the index and the exercise price of the option, expressed in dollars multiplied by a specified number. Thus, unlike options on individual securities, all settlements are in cash, and gain or loss depends on price movements in the particular market represented by the index generally, rather than the price movements in individual securities. All options written on indices or securities must be “covered” as required by the Investment Company Act of 1940, as amended.
Options on securities may be subject to greater fluctuations in value than an investment in the underlying securities. If the Fund is unable to effect a closing purchase transaction with respect to covered options it has written, the Fund will not be able to sell the underlying securities or dispose of assets held in a segregated account until the options expire or are exercised. Similarly, if the Fund is unable to effect a closing sale transaction with respect to options it has purchased, it will have to exercise the options in order to realize any profit and will incur transaction costs upon the purchase or sale of underlying securities. To the extent that the Fund writes or sells an option, if the decline or increase in the underlying asset is significantly below or above the exercise price of the written option, the Fund could experience a substantial loss.
Options on indices may, depending on circumstances, involve greater risk than options on securities. Because index options are settled in cash, when the Fund writes a call on an index it may not be able to provide in advance for its potential settlement obligations by acquiring and holding the underlying securities.
Forward Contracts: The Fund may invest in forward contracts. Forward contracts are transactions involving the Fund’s obligation to purchase or sell a specific currency or other asset at a future date at a specified price. Forward contracts may be used by the Fund for hedging purposes to protect against uncertainty in the level of future foreign currency exchange rates, such as when the Fund anticipates purchasing or selling a foreign security. This technique would allow a Fund to “lock in” the U.S. dollar price of the investment. Forward contracts also may be used to attempt to protect the value of a Fund’s existing holdings of foreign securities. There may be, however, imperfect correlation between a Fund’s foreign securities holdings and the forward contracts entered into with respect to such holdings. The cost to a Fund of engaging in forward contracts varies with factors such as the currency involved, the length of the contract period and the market conditions then prevailing.
The Fund’s use of certain derivatives, such as forward currency contracts, structured notes, futures transactions and swap transactions involve other risks, such as the credit risk relating to the other party to a derivative contract (which is greater for forward currency contracts, swaps and other over-the counter traded derivatives), the risk of difficulties in pricing and valuation. Credit default swaps involve special risks because they are difficult to value and are subject to credit and liquidity risk. Certain derivative transactions may involve substantial leverage risk and the Fund could lose more than the principal amount invested. Recent legislation calls for new regulation of the derivatives markets. The extent and impact of the regulation is not yet known and may not be known for some time. New regulation may make derivatives more costly, may limit the availability of derivatives, or may otherwise adversely affect the value or performance of derivatives. Certain aspects of the tax treatment of derivative instruments, including swap agreements and commodity-linked derivative instruments, are currently unclear and may be affected by changes in legislation, regulations or other legally binding authority that could affect the character, timing and amount of the Fund’s taxable income or gains and distributions.
Duration Risk. Duration is a measure that relates the expected price volatility of a fixed-income instrument to changes in interest rates. The duration of a fixed income instrument may be shorter than or equal to the full maturity of the fixed income instrument. Fixed income instruments with longer durations have more risk.
General Fixed-Income Securities Risk. The market prices of bonds, including those issued by the U.S. government, generally go up as interest rates fall, and go down as interest rates rise. In the event a Fund has a negative average portfolio duration, the value of the Fund may decline as interest rates fall, and rise as interest rates rise. As a result, the net asset value of the shares of Funds holding bonds will fluctuate with conditions in the bond markets. Bonds with longer maturities and longer durations (a measure of a bond’s sensitivity to changes in interest rates) generally are subject to greater price fluctuation due to interest-rate changes than bonds with shorter maturities or shorter durations. As of the date of this Prospectus, interest rates in the United States are near historic lows. If interest rates rise quickly, it may have a pronounced negative effect on the prices on the bonds held by the Funds. Fixed-income securities may also be difficult to purchase and sell in adverse market conditions. While considered investment-grade, bonds in the fourth highest rating category of Moody’s and Standard & Poor’s may have more speculative characteristics and may be more likely to be downgraded than bonds rated in the three highest rating categories. When interest rates fall, certain obligations will be paid off by the obligor more quickly than originally anticipated, and the Fund may have to invest the proceeds in securities with lower yields.
Government Securities Risk. Economic, business, or political developments may affect the ability of government-sponsored guarantors, such as the Federal National Mortgage Association (FNMA, or Fannie Mae), the Federal Farm Credit Bank (FFCB), the Federal Home Loan Bank system (FHLB) and the Federal Home Loan Mortgage Corporation (FHLMC or Freddie Mac), to repay principal and to make interest payments on the securities in which the Balanced, Government Securities, Low Duration Bond, Multi-Asset Income, Total Return Bond and Unconstrained Funds invest. In addition, certain of these securities, including those guaranteed by FNMA, FFCB, FHLB and FHLMC, are not backed by the full faith and credit of the U.S. government. In addition, if prevailing interest rates are below the rates on the mortgages, the mortgage borrowers are more likely to refinance their mortgages than if interest rates are at or above the interest rates on the mortgages. Faster prepayments will reduce the potential of the mortgage-backed securities to rise in value during periods of falling interest rates, while the risk of falling value during periods of rising interest rates may be comparable to or higher than other bonds of similar maturities.
Inflation-Linked Investments Risk. The fixed income Funds may invest in Treasury Inflation Protected Securities (“TIPS”), which are U.S. government bonds whose principal automatically is adjusted for inflation as measured by the Consumer Price Index for All Urban Consumers (“CPI-U”) and other inflation-indexed securities issued by the U.S. Department of Treasury and non-U.S. sovereign entities. Unlike traditional fixed-income securities, the principal and interest payments of inflation-linked investments are adjusted periodically based on the inflation rate. The value of a Fund’s inflation-linked investments may be vulnerable to changes in expectations of inflation or interest rates, and there is no guarantee that a Fund’s use of these instruments will be successful.
Leverage Risk. Some transactions may give rise to a form of economic leverage. These transactions may include, among others, derivatives, reverse repurchase agreements and forward commitment transactions, and may expose a Fund to greater risk and increase its costs. Certain transactions in derivatives involve substantial leverage risk and may expose a Fund to potential losses that exceed the
amount originally invested by a Fund. The use of leverage may cause a Fund to liquidate portfolio positions when it may not be advantageous to do so to satisfy its obligations or to meet any required asset segregation requirements. Increases and decreases in the value of a Fund’s portfolio will be magnified when a Fund uses leverage.
Lower-Quality Bonds Risk. The lower-quality bonds in which the Low Duration Bond, Multi-Asset Income, Total Return Bond and Unconstrained Bond Funds and, to a lesser extent the Balanced Fund, may invest generally have higher nominal or effective interest rates than higher-quality bonds. Lower quality bonds are sometimes called “junk bonds”. Lower-quality bonds may pay interest at fixed, floating or adjustable rates. The value of floating or adjustable rate bonds is less likely to be adversely affected by interest-rate changes than fixed rate bonds. However, if interest rates fall, the Funds may earn less income if they hold floating or adjustable rate bonds. Lower-rated bonds are more speculative and likely to default than higher-quality bonds. Lower-rated bond values also tend to fluctuate more widely in value, for several reasons. An economic downturn may have a greater impact on the ability of issuers with less financial strength to make their bond payments. These bonds may not be traded as actively. Their prices may respond more adversely to negative publicity and investor perceptions. If trading in lower-rated bonds becomes less active, the Funds may have more difficulty in valuing these bonds. Success in investing in junk bonds depends heavily on Sentinel’s credit analysis. Lower-rated bonds are also more sensitive than other debt securities to adverse business developments affecting specific issuers. The risk of loss due to default by the issuer of a lower-quality bond may be significantly greater than the risk for higher rated bonds because lower-quality bonds are more likely to be unsecured and may be subordinated to other creditors. If a bond defaults, the Funds may incur additional expenses in seeking a recovery or participating in a restructuring. Lower-quality bonds also may have call features that permit the issuer to repurchase the securities from the Funds before their maturity. If a call is exercised during a period of declining interest rates, the affected Fund would probably have to replace the called bonds with lower-yielding bonds, and the Fund’s investment income would go down.
Mortgage-Backed Securities Risk. Mortgage-backed securities (residential and commercial) represent interests in “pools” of mortgages held in trust and differ from traditional fixed-income securities and are subject to certain additional risks. Like traditional fixed-income securities, when interest rates fall the value of mortgage-backed securities typically increases, and when interest rates rise, the value of mortgage-backed securities typically decreases. However, when interest rates rise, certain obligations will be paid off by the obligor more slowly than anticipated causing the value of these securities to fall. This is known as extension risk. As a result, in a period of rising interest rates, mortgage-backed securities may exhibit additional volatility and may lose value. In addition, the principal on mortgage- backed securities may normally be prepaid at any time, which will reduce the yield and market value. When interest rates decline, borrowers may pay off their mortgages sooner than expected and the Fund may have to invest the proceeds in securities with lower yields. This is known as prepayment risk. Prepayment reduces the yield to maturity and the average life of the asset-backed securities. Movements in interest rates (both increases and decreases) may quickly and significantly reduce the value of certain mortgage-backed securities.
The mortgage market in the United States recently has experienced difficulties that may adversely affect the performance and market value of certain of the Fund’s mortgage-related investments. Delinquencies and losses on mortgage loans (including subprime and second-lien mortgage loans) generally have increased recently and may continue to increase, and a decline in or flattening of real-estate values (as has recently been experienced and may continue to be experienced in many housing markets) may exacerbate such delinquencies and losses. Also, a number of mortgage loan originators have recently experienced serious financial difficulties or bankruptcy. Reduced investor demand for mortgage loans and mortgage-related securities and increased investor yield requirements have caused limited liquidity in the secondary market for mortgage-related securities, which can adversely affect the market value of mortgage-related securities. It is possible that such limited liquidity in such secondary markets could continue or worsen.
Sovereign Debt Risk. An investor in non-U.S. sovereign debt instruments are subject to the risk that the governmental authorities that control the repayment of the debt may be unable or unwilling to repay the principal or interest when due.
To-Be-Announced (“TBA”) Securities Risk. In a TBA securities transaction, a Fund commits to purchase certain securities for a fixed price at a future date. TBA securities include when-issued and delayed delivery securities and forward commitments. TBA securities involve the risk that the security a Fund buys will lose value prior to its delivery. There also is the risk that the security will not be issued or that the other party to the transaction will not meet its obligation. If this occurs, the Fund loses both the investment opportunity for the assets it set aside to pay for the security and any gain in the security’s price.
Principal Foreign Securities Risks
General Foreign Securities Risk. Investing in foreign securities involves certain special risks in addition to those associated with U.S. securities. For example, the Funds may be affected favorably or unfavorably by changes in currency rates or exchange control regulations. Foreign markets may have less active trading volume than those in the United States, and values may fluctuate more as a result. If the Funds, specifically the International Equity Fund, had to sell securities to meet unanticipated cash requirements, they
might be forced to accept lower prices. There may be less supervision and regulation of foreign exchanges. Foreign companies generally release less financial information than comparable U.S. companies. Furthermore, foreign companies generally are not subject to uniform accounting, auditing and financial reporting requirements. Other possible risks include seizing of assets by foreign governments, high and changing taxes and withholding taxes imposed by foreign governments on dividend and/or interest payments, difficulty enforcing judgments against foreign issuers, political or social instability, or diplomatic developments that could affect U.S. investments in those countries. The Funds are not required to hedge against foreign currency exchange rates.
Emerging Markets Risk. The risks of foreign investments are usually much greater for the emerging markets in which the Funds may invest. Investments in emerging markets may be considered speculative. Emerging markets include those in countries defined as emerging or developing by the World Bank, the International Finance Corporation or the United Nations. Emerging markets are riskier because they develop unevenly and may never fully develop. They are more likely to experience hyperinflation and currency devaluations, which adversely affect returns to U.S. investors. In addition, the securities markets in many of these countries have far lower trading volumes and less liquidity than developed markets. Because these markets are so small, investments in them may be more likely to suffer sharp and frequent price changes or long-term price depression because of adverse publicity, investor perceptions or the actions of a few large investors. In addition, traditional measures of investment values used in the United States, such as price-to-earnings ratios, may not apply to certain small markets.
Many emerging markets have histories of political instability and abrupt changes in policies. As a result, their governments are more likely to take actions that are hostile or detrimental to private enterprise or foreign investment than those of more developed countries. Certain emerging markets may also face other significant internal or external risks, including the risk of war, and ethnic, religious and racial conflicts. In addition, governments in many emerging market countries participate to a significant degree in their economies and securities markets, which may impair investment and economic growth.
Foreign Banks and Securities Depositories Risk. Some foreign banks and securities depositories in which the Funds generally hold their foreign securities may be recently organized or new to the foreign custody business. In addition, there may be limited or no regulatory oversight over their operations. Also, the laws of certain countries may put limits on the Funds’ ability to recover their assets if a foreign bank, depository or issuer of a security, or any of their agents, goes bankrupt. Also, brokerage commissions, and other costs of buying, selling or holding securities in foreign markets are often higher than in the United States. This can reduce amounts the Funds can earn on their investments. Foreign settlement and clearance procedures and trade regulations also may involve certain risks (such as delays in payment for or delivery of securities) not typically involved with the settlement of U.S. investments. Communications between the United States and emerging market countries may be unreliable, increasing the risk of delayed settlements or losses of security certificates. Settlements in certain foreign countries at times have not kept pace with the number of securities transactions. These problems may make it difficult for the Funds to carry out transactions.
Other Principal Investment Risks
Asset Allocation Risk. The Balanced and Multi-Asset Income Funds attempt to identify investment allocations that will provide consistent, quality performance for the Fund, but there is no guarantee that the allocations will produce the desired results. It is possible that the managers will focus on an asset class that performs poorly or underperforms other investments under various market conditions.
ETF Risk. ETFs typically trade on a securities exchange and their shares may, at times, trade at a premium or discount to their net asset values. In addition, an ETF may not replicate exactly the performance of the benchmark index it seeks to track for a number of reasons, including transaction costs incurred by the ETF, the temporary unavailability of certain index securities in the secondary market or discrepancies between the ETF and the index with respect to the weighting or number of instruments held by the ETF. The price of an ETF can fluctuate up or down, and the Fund could lose money investing in an ETF if the prices of the securities owned by the ETF go down. Owning an ETF generally reflects the risks of owning the underlying securities it is designed to track. The total return from an investment in an ETF will be reduced by the operating expenses and fees of the ETF. The Fund, and indirectly, shareholders of the Fund, bear a proportionate share of the ETF’s expenses, which include management and advisory fees and other expenses. In addition, the Fund pays brokerage fees in connection with the purchase and sale of shares of ETFs.
High Portfolio Turnover Risk. A change in the securities held by a Fund is known as “portfolio turnover.” A Fund may engage in frequent and active trading of portfolio securities to achieve its investment objective and principal investment strategies, particularly during periods of volatile market movements. High portfolio turnover (e.g., over 100%) involves correspondingly greater expenses to a Fund, including brokerage commissions or dealer mark-ups and other transaction costs on the sale of securities and reinvestments in other securities. Such sales may also result in realization of taxable capital gains, including short-term capital gains (which are generally taxed at ordinary income tax rates when distributed to individual shareholders). The trading costs and tax effects associated with portfolio turnover may adversely affect a Fund’s performance. Please see the “Financial Highlights” in this prospectus for the portfolio turnover rates of the Funds during the last fiscal year.
The Funds shown below had portfolio turnover rates of over 100% in their 2016 fiscal year:
| Low Duration Bond | 117% |
| Multi-Asset Income | 228% |
| Total Return Bond | 240% |
| Unconstrained Bond | 472% |
Income Risk. Because a Fund can only distribute what it earns, the Fund’s distributions to shareholders may decline when prevailing interest rates fall (or, if the Fund has a negative duration, when prevailing interest rates rise) or when the Fund experiences defaults on debt instruments it holds. A Fund’s income generally declines during periods of falling interest rates because a Fund must reinvest the proceeds it receives from existing investments (upon their maturity, prepayment, amortization, call or buy-back) at a lower rate of interest or return.
Master Limited Partnership Risk. The common units of an MLP are listed and traded on U.S. securities exchanges and their value fluctuates predominantly based on prevailing market conditions and the success of the MLP. Unlike owners of common stock of a corporation, owners of common units have limited voting rights and have no ability to annually elect directors. In the event of a liquidation, common units have preference over subordinated units, but not over debt or preferred units, to the remaining assets of the MLP.
Short Sales Risk. A short sale involves the sale by a Fund of a security that it does not own with the hope of purchasing the same security at a later date at a lower price. A Fund may also enter into a short position through a forward commitment or a short derivative position through a futures contract or swap agreement. If the price of the security or derivative has increased during this time, then the Fund will incur a loss equal to the increase in price from the time that the short sale was entered into plus any premiums and interest paid to the third party. Therefore, short sales involve the risk that a Fund’s losses may be exaggerated (without a limit). By contrast, a loss on a long position arises from decreases in the value of the security and is limited by the fact that a security’s value cannot decrease below zero.
By investing the proceeds received from selling securities short, a Fund could be deemed to be employing a form of leverage, which creates special risks. The use of leverage may increase a Fund’s exposure to long securities positions and make any change in the Fund’s NAV greater than it would be without the use of leverage. This could result in increased volatility of returns. There is no guarantee that any leveraging strategy a Fund employs will be successful during any period in which it is employed.
In times of unusual or adverse market, economic, regulatory or political conditions, the Fund may not be able, fully or partially, to implement its short selling strategy. Periods of unusual or adverse market, economic, regulatory or political conditions generally may exist for as long as six months and, in some cases, much longer. Also, there is the risk that the third party to the short sale may fail to honor its contract terms, causing a loss to the Fund.
Sustainable/Responsible Investing Risk. The Sustainable Core Opportunities Fund employs a process of environmental, social and corporate governance screening to potential investments. The application of Sentinel’s screening process may affect the Fund’s exposure to certain issuers, industries, sectors, regions and countries, and may negatively impact the relative performance of the Fund. In addition, the Fund may be required to sell a security when it might otherwise be disadvantageous for it to do so.
Utilities Industry Risk. Utility company equity securities, to the extent they are purchased for their dividend yield, historically have been sensitive to interest rate movements. In addition, utility companies are subject to state and federal regulation, with respect to both rates and operations, and face the potential for increased costs due to additional regulation and litigation.
Other Investment Risks
Borrowing Risk. Borrowing may exaggerate changes in the net asset value of Fund shares and in the return on a Fund’s portfolio. Borrowing will cost a Fund interest expense and other fees. The costs of borrowing may reduce a Fund’s return. Borrowing may cause a Fund to liquidate positions when it may not be advantageous to do so to satisfy its obligations.
Convertible Securities Risk. Convertible securities generally offer lower interest or dividend yields than non-convertible securities of similar quality. The market values of convertible securities tend to decline as interest rates rise and, conversely, to increase as interest rates decline. However, the convertible securities market value tends to reflect the market price of the common stock of the issuing company when that stock price is greater than the convertible’s “conversion price.” The conversion price is defined as the predetermined price at which the convertible security could be exchanged for the associated stock. As the market price of the underlying common stock declines (other than in distressed situations), the price of the convertible security tends to be influenced more by the yield of the convertible security. Thus, it may not decline in price to the same extent as the underlying common stock. In the event of a liquidation of the issuing company, holders of convertible securities would be paid after the company’s creditors but before the company’s common shareholders. Consequently, the issuer’s convertible securities generally may be viewed as having more risk than its debt securities, but less risk than its common stock.
Currency Risk. Foreign (non-U.S.) currencies may decline in value relative to the U.S. dollar, which would affect the Fund’s investments in foreign currencies or in securities that trade in, and receive revenues in, or in derivatives that provide exposure to, foreign currencies.
Dollar Rolls Risk. The use of dollar rolls by the Balanced, Government Securities, Low Duration Bond, Multi-Asset Income, Total Return Bond and Unconstrained Bond Funds tends to increase the portfolio turnover rate of the Fund. Dollar rolls involve the risk that the market value of the securities a Fund is obligated to repurchase under the agreement may decline below the contracted repurchase price. In the event the buyer of securities under a dollar roll files for bankruptcy or becomes insolvent, a Fund’s use of the proceeds of the agreement may be restricted pending a determination by the other party, or its trustee or receiver, whether to release the counterparty from its contractual obligation.
Investments in Other Investment Companies Risk. A Fund investing in other investment companies, including exchange-traded funds (“ETFs”), will indirectly bear the management and other fees of the other investment company in addition to its own expenses.
Municipal Securities Risk. Municipal securities can be significantly affected by political changes as well as uncertainties in the municipal market related to taxation, legislative changes, or the rights of municipal security holders. Because many municipal securities are issued to finance similar projects, especially those relating to education, health care, transportation, and utilities, conditions in those sectors can affect the overall municipal market. In addition, changes in the financial condition of an individual municipal insurer can affect the overall municipal market, and market conditions may directly impact the liquidity and valuation of municipal securities.
Not Guaranteed Risk. None of the Funds are guaranteed or insured by the U.S. government. The value of each Fund’s shares is expected to fluctuate.
Preferred Stock Risk. Preferred stock represents an equity or ownership interest in a company. Preferred stock normally pays dividends at a specified rate and has precedence over common stock in the event the issuer is liquidated or declares bankruptcy. However, in the event a company is liquidated or declares bankruptcy, the claims of owners of bonds take precedence over the claims of those who own preferred and common stock. Preferred stock, unlike common stock, often has a stated dividend rate payable from
the corporation’s earnings. Preferred stock dividends may be cumulative or non-cumulative, participating, or auction rate. If interest rates rise, the fixed dividend on preferred stocks may be less attractive, causing the price of such stocks to decline. Preferred stock may have mandatory sinking fund provisions, as well as provisions allowing the stock to be called or redeemed, which can limit the benefit of a decline in interest rates. Preferred stock is subject to many of the risks to which common stock and debt securities are subject.
Real Estate-Related Investments Risk. Some of the Funds may invest in real estate investment trusts (“REITs”) which are subject to risks affecting real estate investments generally (including market conditions and changes in the value of the underlying property, competition, zoning laws and other regulations, property obsolescence, changes in interest rates and casualty to real estate), as well as risks specifically affecting REITs (the quality and skill of REIT management and the internal expenses of the REIT).
Repurchase Agreements Risk. If the repurchase agreement counterparty defaults on its repurchase obligation, a Fund would have the collateral securities and be able to sell them to another party, but it could suffer a loss if the proceeds from a sale of the securities turn out to be less than the repurchase price stated in the agreement. If the counterparty becomes insolvent or goes bankrupt, a Fund may be delayed in being able to sell securities that were subject to the repurchase agreement. In general, for federal income tax purposes, repurchase agreements are treated as collateralized loans secured by the securities “sold”. Therefore, amounts earned under such agreements are not eligible for the dividends-received deduction available to corporate shareholders or for treatment as qualified dividend income taxable at reduced rates in the hands of non-corporate shareholders.
Restricted and Illiquid Securities Risk. Restricted securities are securities for which trading is limited to qualified institutional buyers (Rule 144A securities, for example), or are subject to other legal or contractual restrictions on resale. Sentinel may determine that certain Rule 144A securities in which the Fund invests are liquid securities under guidelines approved by the Fund’s Board of Directors, and these Rule 144A securities will not be subject to any limitation on the purchase of illiquid securities. These liquid Rule 144A securities may become illiquid if qualified institutional buyers are unavailable. Other securities, such as lower-quality bonds or small-cap securities, may also become illiquid. The Fund will not be able to readily resell illiquid securities and resale of some of these securities may be restricted by law or contractual provisions. The inability to sell these securities at the most opportune time may negatively affect the Fund’s net asset value.
Reverse Repurchase Agreements. A reverse repurchase agreement is an agreement under which a Fund sells a portfolio security and agrees to repurchase it at an agreed-upon date, price and interest payment. Reverse repurchase agreements involve the risk that the other party may fail to return the securities in a timely manner or at all. Reverse repurchase agreements also involve the risk that the market value of the securities sold by a Fund may decline below the price at which a Fund is obligated to repurchase the securities. These events could also trigger adverse tax consequences to the Fund.
Securities Lending Risk. Securities lending programs are subject to borrower default risk (e.g., borrower fails to return a loaned security and there is a shortfall on the collateral posted by the borrower), cash collateral investment risk (e.g., principal loss resulting from the investment of the cash collateral) and security recall/return risk (e.g., the Fund is unable to recall a security in time to exercise valuable rights or sell the security). In addition, substitute payments (i.e., amounts equivalent to any dividends, interest or other distributions received by the Fund while the securities are on loan) are not treated as dividends and are not eligible for the dividends-received deduction available to corporate shareholders or for treatment as qualified dividend income taxable at reduced rates in the hands of non-corporate shareholders.
Structured Notes Risk. Investment in structured notes involves certain risks, including the risk that the issuer may be unable or unwilling to satisfy its obligations to pay principal or interest, which are separate from the risk that the note’s reference instruments may move in a manner that is disadvantageous to the holder of the note. Structured notes, which are often illiquid, are also subject to additional risks such as market risk, liquidity risk and interest rate risk. The terms of certain structured notes may provide that a decline in the reference instrument may result in the interest rate or principal amount being reduced to zero. Structured notes may be more volatile than the underlying reference instruments or traditional debt instruments.
Temporary Defensive Position Risk. If a Fund, other than the Government Securities Fund, takes a temporary defensive position, it may invest all or a large portion of its assets in U.S. government securities, high-quality money-market instruments, bank deposits, or cash. If a Fund takes a temporary defensive position it may not achieve its investment objective(s).
Operational Risks
Cyber Security Risk. With the increased use of technologies such as the Internet and the dependence on computer systems to perform necessary business functions, the Funds have become potentially more susceptible to operational risks through breaches in cyber security. A breach in cyber security refers to both intentional and unintentional events that may cause a Fund to lose proprietary information, suffer data corruption, or lose operational capacity. This in turn could cause a Fund to incur regulatory penalties, reputational damage, additional compliance costs associated with corrective measures, and/or financial loss. Cyber security breaches may involve unauthorized access to a Fund’s digital information systems (e.g., through “hacking” or malicious software coding), but may also result from outside attacks such as denial-of-service attacks (i.e., efforts to make network services unavailable to intended users). In addition, cyber security breaches of a Fund’s third party service providers (including transfer agents, custodians, sub-advisers and Fund accountants), or by the exchanges and clearing houses on which the securities and derivatives that are purchased or sold by the Funds are traded or cleared, can also subject a Fund to many of the same risks associated with direct cyber security breaches. Similar types of cyber security risks also are present for issuers of securities in which the Funds invest, and a cyber security breach could result in material adverse consequences for such issuers, and may cause the Fund’s investment in such securities to lose value. The Funds and the Adviser have established risk management systems designed to reduce the risks associated with cyber security; however, there is no guarantee that such efforts will succeed. Furthermore, the Adviser and the Funds cannot control the cyber security plans and systems of third party service providers, exchanges and clearing houses, or issuers in which the Funds invest.The Funds and their shareholders could be negatively impacted as a result of a cyber security breach.
Disclosure of Portfolio Securities
A description of each Fund’s policies and procedures with respect to disclosure of its portfolio securities is available in the Funds’ Statement of Additional Information. Information about a Fund’s top ten holdings are provided in the Fund’s Quarterly Fact Sheet posted at www.sentinelinvestments.com under “Forms & Literature”, “Performance” with at least a 15-day lag.
Share Classes
Sentinel Funds offer different pricing options to investors in the form of different share classes. Through this Prospectus, you can learn about a Fund’s Class A, Class C, Class S and Class I, Class R3, and Class R6 shares, as applicable.
| Fund | Class A | Class C | Class S | Class I | Class R3 | Class R6 |
| Balanced | X | X | | X | | |
| Common Stock | X | X | | X | | X |
| Government Securities | X | X | | X | | |
| International Equity | X | X | | X | | |
| Low Duration Bond | X | | X | X | | |
| Multi-Asset Income | X | X | | X | | |
| Small Company | X | X | | X | | X |
| Sustainable Core Opportunities | X | | | X | | |
| Total Return Bond | X | X | | X | X | X |
| Unconstrained Bond | X | X | | X | | |
You can compare the differences among the classes of shares using the table below.
| | | Contingent | | | |
| | | Deferred Sales | Distribution and/or | Conversion | |
| Class | Initial Sales Charge | Charge (“CDSC”) | Service (12b-1) Fees | Feature | Availability |
| A | Maximum initial | None (Certain | 0.20% fixed-income | None | Generally available |
| | sales charge: | redemptions of | funds (other than | | |
| | •1% Low Duration | shares that were | Low Duration Bond | | |
| | Bond; | purchased without a | Fund); | | |
| | •2.25% Government | sales charge may be | 0.25% Low Duration | | |
| | Securities, Total | charged a CDSC)1 | Bond and equity | | |
| | Return Bond and | | funds | | |
| | Unconstrained Bond; | | | | |
| | and | | | | |
| | •5% all other Funds | | | | |
| C | None | 1% if redeemed in | 1.00% | None | Generally available |
| | | the first year | | | |
| S | None | None | 0.50% | None | Offered only by the Low |
| | | | | | Duration Bond Fund |
| I | None | None | None | None | Strict eligibility requirements |
| | | | | | apply |
| R3 | None | None | 0.50% | None | Eligibility requirements apply |
| | | | | | (offered only by the Total |
| | | | | | Return Bond Fund) |
| R6 | None | None | None | None | Eligibility requirements apply |
| | | | | | (offered only by the Common |
| | | | | | Stock, Small Company and |
| | | | | | Total Return Bond Funds) |
1 There is no sales charge for new purchases of $1,000,000 and over ($500,000 or more for the Government Securities, Total Return Bond and Unconstrained Bond Funds). A contingent deferred sales charge (“CDSC”) may apply to redemptions of Class A shares if shares are redeemed in the first twelve months after purchase where the initial sales charge was zero based on a purchase of $1,000,000 or more ($500,000 or more for the Government Securities, Total Return Bond, and Unconstrained Bond Funds). The CDSC schedule with respect to these Funds is set forth below under “Class A Shares”.
This Prospectus frequently uses the term “CDSC”, which stands for Contingent Deferred Sales Charge. This type of charge is assessed when you redeem shares subject to a CDSC if none of the waivers described in this Prospectus apply. If you do not redeem shares during the time periods in which an investment is subject to a CDSC, you will not pay this charge. CDSC schedules may change from time to time. Your shares are subject to the CDSC schedule in effect when you purchased them.
When choosing a share class, your considerations should include:
| | • | the amount of the investment; |
| | • | the intended length of the investment; |
| | • | the type of Fund you want; |
| | • | whether you are eligible for a waiver or reduction of an initial sales charge or CDSC; and |
| | • | whether you intend to utilize the exchange privilege (exchange privileges among Sentinel Funds differ by share class). |
Class A shares have the advantage of lower ongoing distribution expenses. The disadvantage of the Class A shares is that you pay an initial sales charge. If in your circumstances the lower ongoing expenses outweigh the impact of the initial sales charge, Class A shares may be appropriate for you.
Class C shares have the advantages of no initial sales charge and a relatively small CDSC that applies only in the first year. However, you pay higher ongoing distribution fees for the entire period of your investment. This class may be appropriate for you if the benefits of avoiding an initial sales charge outweigh the continuing higher distribution fees. Over long periods, however, the other share classes may outperform Class C shares.
Class S shares, available for the Low Duration Bond Fund only, have the advantage that you pay no sales charges. However, you pay higher ongoing distribution fees for the entire period of your investment.
Class I shares have the advantages of no sales charges and no distribution fees. They typically have an expense ratio that is lower than the Fund’s other classes of shares. In general, investors who can satisfy the Class I share class eligibility requirements should purchase Class I shares, if offered by the Fund. Class I shares do not offer certain account services available to other classes, such as automatic investment and withdrawal plans and online account access.
Class R3 shares, available for the Total Return Bond Fund only, have the advantages of no sales charges. Class R3 shares are only available to employer sponsored group retirement and group 529 college savings plans where plan level or omnibus accounts are held on the books of the Fund and in which the plan administrator or record keeper has entered into a plan services agreement with the distributor. Class R3 shares do not offer certain account services available to other classes, such as automatic investment and withdrawal plans and online account access.
Class R6 shares, available for the Common Stock, Small Company and Total Return Bond Funds only, have the advantages of no sales charges and no distribution fees. They are available to certain employer sponsored group retirement and group 529 college savings plans; registered investment companies; institutions, trusts and foundations with a $1 million initial investment; and certain fee-based advisory programs. They typically have an expense ratio that is lower than the Fund’s other classes of shares. Class R6 shares do not offer certain account services available to other classes, such as automatic investment and withdrawal plans and online account access.
Sentinel has agreed to reimburse certain expenses paid by the Class I shares of the Funds to the extent necessary to prevent the total annual fund operating expense ratio of the Class I shares of the Funds, on an annualized basis, from exceeding the total annual fund operating expense ratio of the Class A shares of the same Fund. This agreement will continue through March 31, 2018. This agreement may be terminated upon 90 days’ notice by a majority of the non-interested directors of the Funds.
Purchase of Fund Shares
There is no size limit on purchases of Class A or Class S shares. The maximum purchase of Class C shares accepted is $999,999. Investment minimums apply to the purchase of Class I and Class R6 shares, with certain exceptions. Broker/dealers, financial institutions, plan agents and other intermediaries (collectively, “intermediaries”) may charge additional fees in connection with transactions in Fund shares. Sentinel Financial Services Company, the Funds’ distributor, and/or an affiliate make payments from their own resources to intermediaries related to marketing the Funds and/or servicing Fund shareholders, which may represent a premium over payments to those intermediaries made by other fund families, and investment professionals may have an added incentive to sell or recommend a Fund or Class over others offered by competing fund families. Additional information about these arrangements is available in the Funds’ Statement of Additional Information
Class A Shares
Class A shares are generally subject to a front-end sales charge. You may qualify for a reduced front-end sales charge based on the size of your purchase. For all purchases of Class A shares, you pay the offering price, which includes the front-end sales charge, next computed after we receive your order. The tables below show the front-end sales charges that you may pay if you purchase Class A shares:
Balanced, Common Stock, International Equity, Multi-Asset Income, Small Company, and Sustainable Core Opportunities Funds:
| | Sales charge as a percentage of: | Dealer Reallowance |
| Invested Assets | Offering Price | Net Amount Invested |
| $0 to $24,999 | 5.00% | 5.26% | 4.50% |
| $25,000 to $49,999 | 4.50% | 4.71% | 4.25% |
| $50,000 to $99,999 | 4.00% | 4.17% | 3.75% |
| $100,000 to $249,999 | 3.00% | 3.10% | 2.75% |
| $250,000 to $999,999 | 2.00% | 2.04% | 1.75% |
| $1,000,000 and over | 0.00% | 0.00% | 0.00%(1) |
| (1) | Distributor may pay the following compensation to securities dealers who initiate purchases of Class A shares of $1 million or more. However, if shares are redeemed prior to 12 months after the date of purchase, they will be subject to a CDSC of 1% unless a CDSC waiver applies. |
| Invested Assets (based on ROA) | Compensation |
| for the portion up to and including $2 million | 1.00% |
| for the portion of the order exceeding $2 million up to and including $4 million | 0.70% |
| for the portion exceeding $4 million | 0.50% |
Government Securities, Total Return Bond and Unconstrained Bond Funds:
| | Sales charge as a percentage of: | Dealer Reallowance |
| Invested Assets | Offering Price | Net Amount Invested |
| $0 to $99,999 | 2.25% | 2.30% | 2.00% |
| $100,000 to $249,999 | 1.75% | 1.78% | 1.50% |
| $250,000 to $499,999 | 1.25% | 1.27% | 1.00% |
| $500,000 and over | 0.00% | 0.00% | 0.00%(2) |
| (2) | Distributor may pay the following commission to securities dealers who initiate purchases of Class A shares of $500,000 or more. However, if shares are redeemed prior to 12 months after the date of purchase, they will be subject to a CDSC of .50% unless a CDSC waiver applies. |
| Invested Assets (based on ROA) | Compensation |
| for the portion up to and including $2.5 million | 0.50% |
| for the portion of the order exceeding $2.5 million up to and including $15 million | 0.25% |
| for the portion of the order exceeding $15 million | 0.15% |
Low Duration Bond Fund:
| | Sales charge as a percentage of: | Dealer Reallowance |
| Invested Assets | Offering Price | Net Amount Invested |
| $0 to $999,999 | 1.00% | 1.01% | .75% |
| $1,000,000 and over | 0.00% | 0.00% | 0.00%(3) |
| (3) | Distributor may pay the following commission to securities dealers who initiate purchases of Class A shares of $1 million or more. However, if shares are redeemed prior to 12 months after the date of purchase, they will be subject to a CDSC of .50% unless a CDSC waiver applies. |
| Invested Assets (based on ROA) | Compensation |
| for the portion up to and including $2 million | 0.50% |
| for the portion of the order exceeding $2 million up to and including $4 million | 0.35% |
| for the portion of the order exceeding $4 million | 0.25% |
Due to rounding, the initial sales charge expressed as a percentage of the offering price may be higher or lower than the charges described above. No initial sales charge applies to Class A shares that you purchase through reinvestment of Fund dividends or capital gains.
For complete redemptions of your account, any CDSC is imposed on the lower of the original cost or the current net asset value of the shares redeemed. For partial redemptions, any CDSC is imposed on the original cost of the shares redeemed, regardless of current market value. If you redeem part of your shares, your redemption request will be increased by the amount of any CDSC due. If you redeem your entire account, we will deduct any CDSC due from the redemption proceeds. Sentinel Financial Services Company receives the entire amount of any CDSC paid. Also see “Waiver or Reduction of a CDSC” below. In determining whether a CDSC is payable, we will first redeem shares not subject to any charge.
Reduced Sales Charges
Sales charges on Class A shares may be reduced or eliminated in certain situations, as described below. Please note that, to take advantage of any reduced or eliminated sales charge, you must inform the Funds’ transfer agent, Boston Financial Data Services (“BFDS”, also referred to as the “Transfer Agent”), Sentinel Financial Services Company, the Funds or your financial intermediary of your eligibility at the time of purchase, and provide any necessary information about the accounts involved. Failure to inform BFDS, Sentinel Financial Services Company, the Funds or your financial intermediary that you may qualify for a reduced or eliminated sales charge may result in your not receiving the sales charge reduction for which you might otherwise be eligible.
The availability of certain sales charge waivers and discounts will depend on whether you purchase your shares directly from the Fund or through a financial intermediary. Intermediaries may have different policies and procedures regarding the availability of front-end sales load waivers or contingent deferred (back-end) sales load (“CDSC”) waivers, which are discussed below. In all instances, it is the purchaser’s responsibility to notify the Fund or the purchaser’s financial intermediary at the time of purchase of any relationship or other facts qualifying the purchaser for sales charge waivers or discounts. For waivers and discounts not available through a particular intermediary, shareholders will have to purchase Fund shares directly from the Fund or through another intermediary to receive these waivers or discounts.
Please see Appendix A or contact your financial intermediary for more information.
Right of Accumulation. Quantity discounts for the Class A shares of the Funds begin with investments of $25,000. You may qualify for quantity discounts based on the current value of all classes of shares of the Sentinel Funds, taken together, that are owned by you, your spouse, your civil union partner, your children, parents or a fiduciary for these persons. These may include shares held in personal accounts, certain retirement accounts, employee benefit plan accounts, Uniform Gifts to Minors Act (UGMA) and Uniform Transfers to Minors Act (UTMA) accounts, joint tenancy accounts, trust accounts and transfer on death accounts, as well as shares purchased by a trust of which you are a beneficiary. Assets previously invested in a Sentinel Fund that were subject to an initial sales charge or a CDSC and are, at the time of determination, invested in the Service Shares of the Federated Government Obligations Fund (the “FGO Fund”), an unaffiliated money market fund distributed by Federated Securities Corp., through an account maintained by Transfer Agent will also be considered when determining whether you may qualify for a quantity discount. Shares held under the tax identification number of anyone other than you, your spouse, your civil union partner, your children or parent, however, do not qualify for quantity discounts. Contact the Transfer Agent for help in combining accounts for purposes of obtaining quantity discounts on purchases. To receive a reduced sales charge, you should inform the Transfer Agent, Sentinel Financial Services Company or your financial intermediary of any other shares owned by you, your spouse, your civil union partner, your children or parent each time you purchase shares. Your financial adviser or other financial intermediary may request documentation from you, including account statements and records of the original acquisition of the shares owned by you, your spouse, your civil union partner, your children or parent, to show that you qualify for a reduced sales charge. You should retain these records because, depending on where an account is held or the type of account (brokerage, retirement plan, etc.), the Fund, the Transfer Agent and/or your financial adviser or other financial intermediary may not be able to maintain this information. We will require your financial intermediary’s approval and cooperation to consider accounts controlled by the financial intermediary
Letter of Intent. You may use a letter of intent (LOI) to obtain a reduced sales charge for Class A shares of a Fund if you plan to make an investment in the Sentinel Funds that include Class A shares and the total amount of such investments is anticipated to be $25,000 or more over a period of 13 months (30 months in the case of corporate qualified plans). Any shares purchased within 90 days prior to the date you establish the LOI are credited toward fulfillment of your purchase commitment under the LOI. However, sales charges will not be reduced for purchases made prior to the date the LOI is established; the reduced sales charge will only apply to new purchases made on or after the establishment date of the LOI. The 13 month period (30 months for corporate qualified plans) begins on the date the LOI is established. Assets previously invested in a Sentinel Fund that were subject to an initial sales charge or a CDSC and are, at the time of determination, invested in the FGO Fund through an account maintained by Sentinel Administrative Services, Inc. will also be considered when determining whether you may qualify for a quantity discount. You may count purchases to be made by you, your spouse, your civil union partner and your children or parent. The LOI is not a binding commitment by you to complete the intended purchases. All your purchases made under the LOI during the period covered will be made at the reduced sales charge for your intended total purchase. Dividends and distributions will be reinvested without a sales charge and will not count as purchases under the LOI. We will hold in escrow 2% of the shares you purchase under the LOI, and release these shares when you have completed the intended purchases. If, by the end of the period covered by the LOI you have not made the intended purchases, an additional sales charge may be due, in which case we will notify you. The additional amount will be equal to what the initial sales charge would have been on the amount actually invested, minus the sales charges already paid. You may pay this additional sales charge within 20 days after our notification is sent, or we may redeem shares held in escrow to the extent necessary to pay this charge, after which time we will release any remaining escrow shares. The redemption of shares for this purpose will be a taxable event to you. We will require your financial intermediary’s approval and cooperation to consider accounts controlled by the financial intermediary.
Advantage Program. Employers establishing either SIMPLE-IRAs or SEP-IRAs investing in the Funds for which the Transfer Agent is the agent for the custodian may group participating employee accounts together in such a way as to result in reduced sales charges for quantity purchases. Quantity discounts under this program are based upon the current value of investments in the Funds.
Account Level Net Asset Value Purchases. You may purchase Class A shares of the Funds at net asset value if you are included in the following list of eligible purchasers and you provide notice of such eligibility prior to or at the time of purchase.
Failure to inform the Transfer Agent, Sentinel Financial Services Company, the Funds or your financial intermediary that you may be eligible to purchase Class A shares of the Funds at net asset value may result in your not receiving the net asset value purchase privilege. The net asset value purchase privileges described below may not be available through accounts held with financial intermediaries and may be available only when you purchase direct from the Funds. Once an account is established under this net asset value purchase privilege, additional investments can be made at net asset value for the life of the account.
| | • | current and former Directors of the Funds and predecessors to the Funds; |
| | • | current and retired employees and Directors of Sentinel and its affiliates; |
| | • | National Life Insurance Company employee benefit plans; |
| | • | employees of NTT Data and DST Systems, Inc. and affiliates, who currently provide services to Sentinel, Sentinel Administrative Services, Inc. and/or Sentinel Financial Services Company; |
| | • | registered representatives and other employees of securities dealers that have entered into a sales agreement with Sentinel Financial Services Company; |
| | • | members of the immediate families (spouse, civil union partner, children, parent or a fiduciary for these persons) of, or survivors of, all of the above mentioned individuals; |
| | • | tax exempt entities that meet the requirements for qualification under section 501 of the Code who have determined that a Fund is a legally permissible investment where the dealer of record on the account is Sentinel Financial Services Company; |
| | • | former shareholders of the Bramwell Growth Fund or the Bramwell Focus Fund, each a series of the Bramwell Funds, Inc., who in those funds’ 2006 reorganization received Class A shares of the Sentinel Capital Growth or Sentinel Growth Leaders Funds, as applicable; or |
| | • | former shareholders of the Citizens Funds, who in those funds’ 2008 reorganization received shares of a Sentinel Fund. |
Other Waivers of Front-end Loads. We also waive the front-end load where purchasers demonstrate that they are included in one of the following groups:
| | • | registered investment advisers who place trades for their own accounts or the accounts of their clients, and who charge an investment management fee or transaction fee for their services, and clients of these investment advisers who place trades for their own accounts; |
| | • | Clients of financial intermediaries who have entered into an agreement with Sentinel Financial Services Company to offer shares to self-directed investment brokerage accounts that may or may not charge a transaction fee to its customers; |
| | • | clients of trust companies who have entered into an agreement with Sentinel Financial Services Company under which all their clients are eligible to buy Class A shares at net asset value; |
| | • | qualified retirement, profit-sharing or deferred compensation plans that are maintained on platforms sponsored by financial intermediaries, provided these financial intermediaries have entered into a Class A net asset value purchase agreement with Sentinel Administrative Services, Inc. or Sentinel Financial Services Company with respect to such plans (Sentinel Financial Services Company may pay financial intermediaries compensation up to 1% for sales of the Funds’ shares under this waiver, and a CDSC up to 1% subject to eligibility for waiver or reduction of a CDSC as outlined in this Prospectus, may apply to shares redeemed within 12 months of purchase; see “Share Classes- Class A Shares” above for the compensation/ CDSC schedule applicable to each Fund); |
| | • | transfers of assets, rollovers from retirement plans, or required minimum distributions (“Transferred Assets”) to an IRA sponsored by Sentinel Group Funds, Inc. and held directly with the Fund (“Sentinel Fund IRA”), but only to the extent the Transferred Assets were invested in a Sentinel Fund at the time of distribution (you must notify the Transfer Agent, Sentinel Financial Services Company, the Sentinel Funds or your financial intermediary of your eligibility to purchase at net asset value at the time of purchase). Any portion of Transferred Assets that were not attributable to Sentinel Fund investments, as well as future contributions to the Sentinel Fund IRA, will be subject to the terms and conditions generally applicable to purchases of Class A shares (including the applicability of sales charges) as described in this Prospectus and the Funds’ Statement of Additional Information; and |
| | • | investors directly reinvesting qualified proceeds of redemptions of the F G O Fund shares held in accounts maintained by the Transfer Agent pursuant to the reinvestment privileges described in this Prospectus. Please see “Additional Information About Buying, Selling and Exchanging Shares — Reinvestment Privileges with Respect to Certain Shareholders of the FGO Fund” below for additional information. If more than one person owns an account, all owners must qualify for the lower sales charge. Please also note you may be charged transaction and/or other fees if you effect transactions in Fund shares through an intermediary. |
Information about sales charge reductions and waivers is available, free of charge in a clear and prominent format, via hyperlink at the Funds’ website at www.sentinelinvestments.com.
Failure to inform the Transfer Agent, Sentinel Financial Services Company, the Funds or your financial intermediary that you may qualify for a reduced or eliminated sales charge may result in your not receiving the sales charge reduction or net asset value purchase privilege for which you might otherwise be eligible.
Right of Reinvestment. If you notify the Transfer Agent, Sentinel Financial Services Company or your financial intermediary, you may reinvest proceeds from a redemption, dividend payment or capital gain distribution in the same Fund or in another Sentinel Fund without a sales charge, provided that the reinvestment occurs within 90 days after the date of the redemption, dividend payment or distribution and is made into the same account from which you redeemed the shares or received the dividend payment or distribution. If the account has been closed, you may reinvest without a sales charge if the new receiving account has the same registration as the closed account and the reinvestment is made within 90 days after the date of redemption, dividend payment or distribution. Low Duration Bond Fund shareholders who have held their shares for 90 days or less, however, may only use the Right of Reinvestment privilege to reinvest in the Low Duration Bond Fund.
Proceeds from a Class C share redemption may be reinvested in Class C shares or Class A shares without an initial sales charge or subsequent CDSC. Proceeds will be reinvested at the next calculated net asset value after your request is received by the transfer agent, provided that your request contains all information and legal documentation necessary to process the transaction.
For purposes of this “right of reinvestment” privilege, automatic transactions (including, e.g., automatic purchases, withdrawals and payroll deductions) and ongoing retirement plan contributions are not eligible for investment without a sales charge.
You may not reinvest proceeds in the Sentinel Funds as described above if such proceeds are subject to a purchase block as described under “Purchasing, Selling and Exchanging Fund Shares – Additional Information about Buying, Selling and Exchanging Shares –Excessive Trading Policy” below.
Class A Distribution Plan
The Class A shares of each Fund have adopted a plan under Rule 12b-1 that allows the Fund to pay fees for the sale and distribution of its shares and for services provided to shareholders. The Class A shares of the Fund will pay to Sentinel Financial Services Company a monthly fee of up to a maximum annual rate of: (a) 0.25% of average daily net assets in the case of the Balanced, Common Stock, International Equity, Low Duration Bond, Multi-Asset Income, Small Company, and Sustainable Core Opportunities Funds, or (b) 0.20% of average daily net assets in the case of the Government Securities, Total Return Bond and Unconstrained Bond Funds. Such fee reimburses Sentinel Financial Services Company for expenses actually incurred in marketing the Funds. Sentinel Financial Services Company may pay all or a portion of these Rule 12b-1 fees to intermediaries (up to the maximum annual rate for distribution and up to 0.25% for servicing) that have an agreement with Sentinel Financial Services Company to sell shares of the Funds.
Class A Accounts Ineligible for 12b1 Payment
No fee is paid by Sentinel Financial Services Company to intermediaries with respect to any Fund shares purchased prior to March 1, 1993.
The Funds are not assessed a 12b-1 fee with respect to shares (if any) owned by NLV Financial Corporation or its affiliates, which may result in an overall 12b-1 fee of less than the maximum for so long as the investment is maintained by NLV Financial Corporation or its affiliates.
Class C Shares
For purchases of Class C shares, you pay the current net asset value. There is no initial sales charge. Class C shares are subject to higher distribution fees than Class A shares. Class C shares never convert to Class A shares, thus investments in Class C shares remain subject to these higher distribution fees for the entire holding period of the investment.
Contingent Deferred Sales Charge
You will pay a CDSC in the amount of 1.00% of the lower of the purchase price or the net asset value of the shares redeemed, if you redeem Class C shares in the first year after purchase, unless a waiver applies. See “Waiver or Reductions of a CDSC” below. In determining whether a CDSC is payable, we will take redemptions first from shares acquired through reinvestment of distributions, or any other shares as to which a CDSC is waived. If you redeem part of your shares, you may choose whether any CDSC due should be deducted from the redemption proceeds or your redemption request is increased by the amount of any CDSC due. If no choice is made, we will increase the redemption amount by the amount of any CDSC due. However, if a full account liquidation is chosen, the CDSC amount will be deducted from the redemption proceeds. Sentinel Financial Services Company receives the entire amount of any CDSC paid.
Class C Distribution Plan
The Class C shares of the Funds have adopted a plan under Rule 12b-1 that allows the Funds offering Class C shares to pay distribution fees for the sale and distribution of their shares, and services provided to shareholders. These Funds pay a fee to Sentinel Financial Services Company at a maximum annual rate of up to a total of 1.00% of average daily net assets. Such fee reimburses Sentinel Financial Services Company for expenses actually incurred in marketing the Funds. In the first year after the purchase, including dividend and capital gain reinvestments, Sentinel Financial Services Company keeps this fee to recover the initial sales commission of 1.00% that it pays to the selling intermediary. In subsequent years, the entire fee may be paid to the selling intermediary for distribution or up to 0.25% for servicing. Because these fees are paid out of the Fund’s assets on an ongoing basis, over time these fees will increase the cost of your investment and may cost you more than paying other types of sales charges.
The Funds are not assessed a 12b-1 fee with respect to shares (if any) owned by NLV Financial Corporation or its affiliates, which may result in an overall 12b-1 fee of less than the maximum for so long as the investment is maintained by NLV Financial Corporation or its affiliates.
Payments to Intermediaries
For all sales of Class C shares, Sentinel Financial Services Company intends to make payments to selling intermediaries at the time you purchase Class C shares of amounts equal to 1.00% of the aggregate purchase amount.
Class S Shares ( Low Duration Bond Fund only)
There is no initial sales charge or CDSC on Class S shares.
For all purchases of Class S shares of the Low Duration Bond Fund, you pay the current net asset value. There is no initial sales charge. There is also no CDSC. Class S shares of the Low Duration Bond Fund are subject to higher distribution fees than the Class A shares of the Low Duration Bond Fund. Class S shares never convert to Class A shares. As a result, investments in Class S shares remain subject to higher distribution fees for the entire holding period of the investment.
Class S Distribution Plan
The Class S shares of the Low Duration Bond Fund have adopted a plan under Rule 12b-1 that allows the Fund to pay fees for the sale and distribution of its shares, and for services provided to shareholders. The Class S distribution plan provides for the Class S shares of the Fund to pay a fee to Sentinel Financial Services Company, the Funds’ distributor, at a maximum annual rate of up to 0.50% of average daily net assets. Such fee reimburses Sentinel Financial Services Company for expenses actually incurred in marketing the Fund. Sentinel Financial Services Company may pay all or a portion of these Rule 12b-1 fees to intermediaries (up to the maximum annual rate for distribution and up to 0.25% for servicing) that have an agreement with Sentinel Financial Services Company to sell shares of the Funds. Because these fees are paid out of the Fund’s assets on an ongoing basis, over time these fees will increase the cost of your investment and may cost you more than paying other types of sales charges.
The Fund is not assessed a 12b-1 fee with respect to shares (if any) owned by NLV Financial Corporation or its affiliates, which may result in an overall 12b-1 fee of less than the maximum for so long as the investment is maintained by NLV Financial Corporation or its affiliates.
Class I Shares
There is no initial sales charge or CDSC on Class I shares. Class I shares are available for purchase only by the following:
| | • | institutional investors who purchase Fund shares directly from the Fund and who make an initial investment of at least $1 million in Class I shares of the Sentinel Funds; |
| | | |
| | • | institutional investors who invest through an intermediary that has a special agreement with the Sentinel Funds’ distributor to offer Class I shares and who make an initial investment of at least $1 million in Class I shares of the Sentinel Funds; |
| | | |
| | • | investment advisory and retirement plan platforms, if such plan’s overall fee structure is designed with the intent of investing in Class I or similar classes of shares, as evidenced by the platform’s investing in the Class I or a similar class of shares of at least one other mutual fund complex which offers classes similar to the Sentinel Funds’ Class I and load-waived Class A shares, or by the platform’s investing solely in classes of shares of other mutual fund complexes that do not pay 12b-1 service fees; |
| | | |
| | • | qualified tuition programs established under Section 529 of the Code; |
| | | |
| | • | registered investment companies; |
| | | |
| | • | Synovus Trust Company for trust accounts established on behalf of its clients; |
| | | |
| | • | retirement and deferred compensation plans established for the benefit of the employees, agents or Directors of National Life Insurance Company and its affiliates; |
| | • | accounts that received Class I shares of a Sentinel Fund in exchange for Class A shares of a Synovus Fund in a reorganization and which continue to own such shares, but only with respect to reinvested dividends and distributions; and |
| | | |
| | • | accounts that received Class I shares of a Sentinel Fund in exchange for shares of a Citizens Fund in a reorganization and which continue to own such shares. |
Investment minimums apply to accounts held on the Funds’ records. Intermediaries that maintain omnibus accounts on the Funds’ records may establish different minimums for their clients holding through such omnibus accounts. In addition, a Fund may waive investment minimums to the extent such waivers are approved by the Fund’s Chief Compliance Officer and reported to the Fund’s Board of Directors.
Class I shares have not adopted a distribution plan under Rule 12b-1.
Class R3 Shares (Total Return Bond Fund Only)
There is no initial sales charge or CDSC on Class R3 shares. Class R3 shares are available for purchase only by the following:
| | • | Employer Sponsored Group Retirement and Group 529 College Savings Plans where plan level or omnibus accounts are held on the books of the Fund and in which the plan administrator or record keeper has entered into a plan services agreement with the distributor. |
The Class R3 shares are not available to retail nonretirement accounts, individual retirement accounts (“IRAs”), Roth IRAs, SIMPLE IRAs, individual (“solo”) and certain small employer 401(k) plans, individual profit sharing plans, individual 403(b) accounts, Simplified Employee Pensions (“SEPs”), SARSEPs, individual 529 tuition plan accounts and Coverdell Educational Savings Accounts. “Small employer,” for purposes of the preceding sentence, means an employer that has not engaged the services of a professional plan administrator with automated trading and recordkeeping capability.
“Employer-Sponsored Group Retirement Plan” includes group profit sharing and money purchase pension plans, defined benefit plans and nonqualified deferred compensation plans, and plans described in Sections 401(k), 403(b) and 457 of the Internal Revenue Code.
Class R3 Shares Distribution Plan
The Class R3 shares of the Total Return Bond Fund has adopted a plan under Rule 12b-1 that allows the Fund to pay fees for the sale and distribution of its shares and for services provided to shareholders. The Class R3 shares of the Fund will pay to Sentinel Financial Services Company a monthly fee of up to a maximum annual rate of 0.50%. Such fee reimburses Sentinel Financial Services Company for expenses actually incurred in marketing the Fund. Sentinel Financial Services Company may pay all or a portion of these Rule 12b-1 fees to intermediaries (up to the maximum annual rate for distribution and up to 0.25% for servicing) that have an agreement with Sentinel Financial Services Company to sell shares of the Fund. Because these fees are paid out of the Fund’s assets on an ongoing basis, over time these fees will increase the cost of your investment and may cost you more than paying other types of sales charges.
The Funds are not assessed a 12b-1 fee with respect to shares (if any) owned by NLV Financial Corporation or its affiliates, which may result in an overall 12b-1 fee of less than the maximum for so long as the investment is maintained by NLV Financial Corporation or its affiliates.
Class R6 Shares (Common Stock, Small Company and Total Return Bond Funds Only)
There is no initial sales charge or CDSC on Class R6 shares. Class R6 shares are available for purchase only by the following:
| | • | Employer Sponsored Group Retirement or Group 529 College Savings Plans where shares are held through plan level or omnibus accounts on the books of the Fund and the Plan sponsor or other administrator has entered into an agreement with the distributor. |
| | | |
| | • | Registered investment companies. |
| | | |
| | • | Institutions, trusts and foundations whose initial investment is at least $1,000,000. |
| | | |
| | • | Fee-based advisory programs where shares are held through omnibus accounts on the books of the Fund. |
| | • | The R6 share class can be made available to fee-based programs of investment dealers that have special agreements with the fund’s distributor, to certain registered investment advisors, and to other intermediaries approved by the fund’s distributor. |
The Class R6 share class is not available to retail nonretirement accounts, individual retirement accounts (“IRAs”), Roth IRAs, SIMPLE IRAs, individual (“solo”) and certain small employer 401(k) plans, individual profit sharing plans, individual 403(b) accounts, Simplified Employee Pensions (“SEPs”), SARSEPs, individual 529 tuition plan accounts and Coverdell Educational Savings Accounts. “Small employer,” for purposes of the preceding sentence, means an employer that has not engaged the services of a professional plan administrator with automated trading and recordkeeping capability.
“Employer-Sponsored Group Retirement Plan” includes group profit sharing and money purchase pension plans, defined benefit plans and nonqualified deferred compensation plans, and plans described in Sections 401(k), 403(b) and 457 of the Internal Revenue Code.
Investment minimums apply to accounts held on the Funds’ records. Intermediaries that maintain omnibus accounts on the Funds’ records may establish different minimums for their clients holding through such omnibus accounts. In addition, a Fund may waive investment minimums to the extent such waivers are approved by the Fund’s Chief Compliance Officer and reported to the Fund’s Board of Directors.
Class R6 shares have not adopted a distribution plan under Rule 12b-1.
Waiver or Reduction of a CDSC
A CDSC will be waived in the following situations if you notify us at the time of redemption that a waiver applies:
| | • | redemptions of shares you acquire from the reinvestment of income distributions and/or capital gains distributions; |
| | • | redemptions from your account (including when you own the shares as joint tenant with your spouse) following your death, or from the account of a trust whose primary income beneficiary has died; |
| | • | required minimum distributions from a retirement account; and |
| | • | redemptions of shares that qualify for a waiver of the CDSC pursuant to the reinvestment privilege described in this Prospectus. Please see “Additional Information About Buying, Selling and Exchanging Shares – Reinvestment Privileges with Respect to Certain Shareholders of the FGO Fund below for additional information. |
Sentinel Financial Services Company may require documentation to show a waiver applies, such as certifications by plan administrators, applicable tax forms, or death certificates.
Other Matters Relating to Distribution of Fund Shares
Sentinel Financial Services Company, Sentinel and/or an affiliate pay amounts or otherwise provide items of material value out of their own resources to certain intermediaries that support the sale of the Funds or provide services to Fund shareholders. This practice may create an incentive for an intermediary or its employees or associated persons to recommend or sell shares of a Fund. Payments may be based on, among other things, the number or value of shares that the intermediary sells or may sell; the value of the intermediary’s client assets invested in the Funds; or the type and nature of services or support furnished by the intermediary. In connection with these payments, the intermediary may elevate the prominence or profile of the Funds within the intermediary’s organization by, for example, placement on a list of preferred or recommended funds and/or granting the Sentinel Financial Services Company preferential or enhanced opportunities to promote the Funds. Additional information about these arrangements is available in the Funds’ Statement of Additional Information.
Purchasing, Selling and Exchanging Fund Shares
Purchasing Shares
You may purchase shares at net asset value (or Public Offering Price, if applicable), less any applicable initial sales charge, as of the close of business on the day your instructions are received prior to the close of the NYSE, usually 4:00 p.m. Eastern Time, on each day it is open for business. Financial Intermediaries that maintain omnibus accounts on the Fund’s records may establish alternate closing times but in no case later that the close of the NYSE.
By Check
To purchase shares by check, make your check payable to the “Sentinel _[Name of Fund]_ Fund” or “Sentinel Funds” and mail it to the Transfer Agent at the following addresses:
| By US Mail | By Delivery |
| Sentinel Investments | Sentinel Investments |
| PO Box 55929 | c/o Boston Financial Data Services |
| Boston MA 02205-5929 | 30 Dan Road |
| | Canton, MA 02021-2809 |
To make your initial purchase by check, please also fill out an application and return the application with your check. All checks must be drawn in U.S. dollars on a U.S. bank. The Funds do not accept third-party checks, except those issued by NLV Financial Corporation and/or its subsidiaries or U.S. government agencies or institutions that meet verification requirements of the Funds’ transfer agent. The Funds reserve the right to withhold the proceeds of a redemption of shares purchased by check until the check has cleared, which may take up to 15 days after the purchase date. Your purchase will be effected on the date that your check is received by the Transfer Agent at one of the addresses listed above, if the check is received prior to the close of business on the NYSE (usually 4:00 p.m. Eastern Time) and your purchase order is otherwise in good order (i.e., you have included a properly completed application and/or other required documentation). We may charge a fee of $25 for each check returned unpaid due to insufficient funds.
By Wire
You may purchase shares by wiring federal funds directly to the Sentinel Funds on any day when both the NYSE and Federal Reserve banks are open for business. To make your initial purchase by wire, call us toll-free (1-800-282-3863) and obtain an account number. You must first complete an application and return it to the Transfer Agent. Your bank may charge you a fee to wire funds. Payments made by wire and received by the Transfer Agent on any business day are available to the Fund on the next business day.
Online
If you already have an account and have elected to do so, you may purchase shares of the Funds over the Internet by accessing the Funds’ website at www.sentinelinvestments.com. Purchases completed via Automated Clearing House (ACH) will receive the trade date the funds are received from your bank.
By Automatic Investment Plan
This feature affords you the opportunity to dollar-cost-average using periodic electronic funds transfer from your bank account to the Fund(s) of your choice. Investments will be made on or about the 5th day of the month unless otherwise specified. Automatic investment plan may be used to establish a new account if investing at least $50 per month.
By Telephone
This feature enables you to purchase Fund shares via electronic funds transfer from your bank account by phoning Sentinel Investments, or accessing our automated telephone system known as “OnCall 24.” Purchases completed via ACH will receive the trade date the funds are received from your bank.
By Government Direct Deposit
You may purchase Fund shares (minimum of $50.00 per transaction) by having local, state or Federal salary, Social Security, or certain veterans’, military or other payments from the Federal government automatically deposited into your account. You may deposit as much of the payments as you elect. To enroll in Government Direct Deposit, please contact the Transfer Agent.
By Payroll Savings Plan
You may purchase Fund shares automatically on a regular basis by having money withheld from your paycheck, if your employer permits this. You may have part or all of your paycheck transferred to your existing Sentinel account each pay period. To establish a Sentinel Payroll Savings Plan account, please contact the Transfer Agent.
Investment Minimum – Initial/Subsequent Investments
These investment minimums apply to accounts held on the Funds’ records. Intermediaries that maintain omnibus accounts on the Funds’ records may establish different minimums for their clients holding through such omnibus accounts. In addition, a Fund may waive investment minimums to the extent such waivers are approved by the Funds’ Chief Compliance Officer and reported to the Funds’ Board of Directors.
All Funds
| Account/Investment Type1 | | Class A | Class C | Class I4 | Class R3 | Class R64 | Class S |
| Individual Retirement Accounts (IRAs & SIMPLE IRAs)2 | Initial | $1,000 | $1,000 | Not
Available | Not
Available | Not
Available | $1,000 |
| Subsequent | $50 | $50 | $50 |
| All Other Accounts2 | Initial | $1,000 | $1,000 | Not
Available | Not
Available | Not
Available | $1,000 |
| Subsequent | $50 | $50 | $50 |
| Automatic Investment Plan | | $503 | $503 | Not
Available | Not
Available | Not
Available | $503 |
| Institutional Investors | Initial | $1,000 | $1,000 | $1,000,000 | Not
Available | $1,000,000 | $1,000,000 |
| Subsequent | None | None | None | None | None |
| Retirement Plans with omnibus accounts held on the books of the fund | Initial | $1,000 | $1,000 | None | None | None | $1,000 |
| Subsequent | None | None | None | None | None | None |
| Fee Based Investment Advisory Platforms | Initial | $1,000 | $1,000 | None | Not
Available | None | $1,000 |
| Subsequent | None | None | None | None | None |
| Qualified Tuition Programs Established Under Section 529 of the Code | Initial | $1,000 | $1,000 | None | None | None | $1,000 |
| Subsequent | None | None | None | None | None | None |
| Registered Investment Companies | Initial | $1,000 | $1,000 | None | Not
Available | None | $1,000 |
| Subsequent | None | None | None | None | None |
1 For a more complete description of the account/investment type as it relates to each share Class, please see “Share Classes”, above.
2 These also apply to investments through the Payroll Savings Plan.
3 The Automatic Investment Plan may be used to make an initial investment if investing at least $50 per month.
4 Class I and Class R6 share investment minimums are per Class; all other investment minimums are per Fund.
For information about Class I, Class R3 and Class R6 share eligibility, please see “Share Classes — Class I Shares, Class R3 Shares and Class R6 Shares” above.
Except for the Class I and Class R6 shares, investment minimums are determined by Fund rather than Class. These investment minimums apply to accounts held on the Funds’ records. Intermediaries that maintain omnibus accounts on the Funds’ records may establish different minimums for their clients holding through such omnibus accounts. In addition, a Fund may waive investment minimums to the extent such waivers are approved by the Funds’ Chief Compliance Officer and reported to the Funds’ Board of Directors.
Selling Shares
You may redeem shares at net asset value, less any applicable CDSC and/or other applicable charge, as of the close of business on the day your instructions are received prior to the close of the NYSE on a day it is open for business, which is usually 4:00 p.m. Eastern Time.
By Mail
If your shares are held directly with a Fund, you may sell your shares by providing the Transfer Agent with the appropriate instructions by mail. Your instructions must be signed by the registered owner(s) exactly as the shares are registered. If the proceeds of the redemption exceed $100,000, if the check is not made payable to the registered owner(s) and mailed to the record address, or if the record address has been changed within the past 30 days, we may require the signature(s) of the registered owner(s) to be guaranteed by an eligible financial institution that meets the Transfer Agent’s requirements.
By Telephone
You may redeem up to $250,000 from your account each business day, by providing instructions to do so over the telephone to the Transfer Agent (1-800-282-FUND (3863)). You may request that a check made payable to the registered owners be sent to their address of record, or you may request that the proceeds be sent directly to a predesignated commercial bank account. If proceeds are wired to your bank, we will deduct a fee of $20 from the proceeds. In addition, it is possible that your bank may charge a fee for receiving wire transfers. You may request a redemption on the Funds’ automated voice response system. This is also limited to a maximum of $250,000 each business day.
None of the Funds, Sentinel Financial Services Company nor the Transfer Agent is responsible for the authenticity of exchange or redemption instructions received by telephone, and they are not liable in the event of an unauthorized telephone exchange or redemption, provided that, in the case of the Funds, the Funds have followed procedures reasonably designed to prevent losses. In processing telephone exchange or redemption requests, the Funds will use reasonable procedures to confirm that telephone instructions are genuine. These procedures include receiving all calls for telephone redemptions and exchanges on a recorded telephone line, and screening callers through a series of questions regarding specific account information. You may indicate on your purchase application that you do not wish to have telephone transaction privileges.
By Facsimile
The Transfer Agent will generally accept transaction instructions in good form via facsimile from intermediaries that have entered into agreements with and have made prior arrangements with Sentinel Investments. Sentinel Investments may require an intermediary to provide indemnification and/or a signature guarantee for transactions by facsimile. Call 1-800-282-FUND (3863) for additional information and instructions regarding transacting by facsimile.
Online
You may redeem up to $250,000 from your account each business day by providing instructions to do so over the Funds’ website at www.sentinelinvestments.com. You may request that a check made payable to the registered owners be sent to their address of record, or you may request that the proceeds be sent directly to a predesignated commercial bank account. If proceeds are wired to your bank, we will deduct a fee of $20 from the proceeds. In addition, it is possible that your bank may charge a fee for receiving wire transfers. None of the Funds, Sentinel Financial Services Company nor the Transfer Agent is responsible for the authenticity of exchange or redemption instructions received online, and they are not liable in the event of an unauthorized online exchange or redemption, provided that, in the case of the Funds, the Funds have followed procedures reasonably designed to prevent losses. In processing online exchange or redemption requests, the Funds will use reasonable procedures to confirm that online instructions are genuine. These procedures include restricting access to the section of the website on which transaction instructions may be entered to those who enter a password selected by the shareholder.
By Check Writing
If you own Class A shares of the Low Duration Bond Fund you may sell shares by writing a check against your non-retirement account. This check writing privilege is free. There is a per check minimum of $500. The Fund reserves the right to withhold the proceeds of a redemption of shares purchased by check until the check has cleared, which may take up to 15 days after the purchase date. Low Duration Bond Fund redemptions by checkwriting are taxable transactions. The Transfer Agent provides overdraft protection by automatically transferring available funds from your other identically registered accounts if you have available balances. A fee of $30.00 will be charged to the account when funds are transferred from protecting account(s) to cover an overdraft. Transferred funds are treated like a sale or exchange of shares of the Fund from which they are transferred, including for redemption fee purposes. New checkbooks cannot be ordered within 30 days of an address change without a signature guarantee.
By Systematic Withdrawal
You may arrange to receive automatic regular withdrawals from your account. Withdrawal payments generally should not be considered dividends. Withdrawals generally are treated as sales of shares and may result in a taxable gain or loss. You must reinvest dividends and capital gains distributions to use systematic withdrawals. No interest will accrue on amounts represented by uncashed checks sent under a systematic withdrawal plan. Systematic withdrawals established after March 31, 2009 and payable by check are limited to the 5th, 10th, 15th, 20th (default date if none specified) or 25th day of each month. If such date is not a business day, the withdrawal will occur on the immediately preceding business day. Payments made by direct deposit are available any day.
Exchanging Shares
You may exchange shares of one Sentinel Fund for shares of the same class of another Sentinel Fund, if available, without charge by contacting the Transfer Agent. You may also set up your account to exchange automatically a specified number or dollar-value of shares in one of the Sentinel Funds into shares of the same class in another Sentinel Fund at regular intervals. Commissionable purchases of less than $500,000 of Class A shares of the Government Securities, Total Return Bond and Unconstrained Bond Funds and less than $1 million of Class A shares of the Low Duration Bond Fund must remain in the account for 90 days before they are eligible for an exchange. New purchases of any class of shares must remain in an account for 15 days before they can be exchanged to another Sentinel Fund. We may modify or terminate the exchange privilege in accordance with the rules of the Securities and Exchange Commission (the current rules require 60 days advance notice to shareholders prior to the modification or termination of the exchange privilege).
Although there are no exchange privileges between the Sentinel Funds and the FGO Fund, an unaffiliated money market fund distributed by Federated Securities Corp., there are certain reinvestment privileges that permit the direct reinvestment of certain qualified proceeds of redemptions of the FGO Fund shares into shares of the Sentinel Funds to qualify for waivers of sales charges. Please see “Additional Information About Buying, Selling and Exchanging Shares — Reinvestment Privileges with Respect to Certain Shareholders of the FGO Fund” below for additional information.
Class A Shares
Class A shares of one Sentinel Fund may be exchanged for Class A shares of another Sentinel Fund, if offered, at net asset value. However, Class A shares of the Low Duration Bond Fund received as a result of an exchange from Class C shares of another Sentinel Fund may not be exchanged, except as described directly below. Holding periods for shares which have been exchanged for the currently held shares will be included in the holding period of the current shares. The normal minimum account sizes apply to new accounts opened by exchange. In addition, Class A shares of any Sentinel Fund may be exchanged at net asset value for Class I shares of the same or another Sentinel Fund, if offered, if, at the time of the exchange, such shareholder otherwise satisfies the criteria for purchasing Class I shares. No gain or loss will be recognized for federal income tax purposes by Class A shareholders exchanging into Class I shares of the same Fund on the terms set forth in this Prospectus.
Class C Shares
Class C shares of one Fund may be exchanged at net asset value for Class C shares of another Fund, if offered through exchange, at net asset value. Class C shares may also be exchanged for Class A shares of the Sentinel Low Duration Bond Fund. The time during which the assets are in Class A shares of the Low Duration Bond Fund will count toward the time that results in a reduced CDSC. Class A shares of the Low Duration Bond Fund held as a result of an exchange from Class C funds may only be exchanged back to available Class C shares of a Sentinel Fund.
Class C shares not subject to a CDSC may be exchanged at net asset value for Class A or Class I shares of the same or another Sentinel Fund, if offered at the time of the exchange and such shareholder otherwise satisfies the criteria for purchasing Class I shares. No gain or loss will be recognized for federal income tax purposes by Class C shareholders exchanging into Class A or Class I shares of the same Fund on the terms set forth in this Prospectus.
Class S Shares
Class S shares of the Low Duration Bond Fund may be exchanged at net asset value for the Class A shares of each of the other Sentinel Funds, if offered through exchange, except that Class S shares may not be exchanged into Class A shares of the Low Duration Bond Fund. Purchases of the Class S shares of the Low Duration Bond Fund must remain in the account for 90 days before they are eligible for an exchange. Class A shares of a Fund obtained through an exchange of Class S shares of the Low Duration Bond Fund may be exchanged for Class A shares of other Sentinel Funds, if offered, including the Low Duration Bond Fund. Exchanges from other Funds into the Class S shares of the Low Duration Bond Fund are not permitted. In addition, Class S shares of the Fund may be exchanged at net asset value for Class I shares of the same or another Sentinel Fund, if offered, if, at the time of the exchange,
such shareholder otherwise satisfies the criteria for purchasing Class I shares. No gain or loss will be recognized for federal income tax purposes by Class S shareholders exchanging into Class I shares of the same Fund on the terms set forth in this Prospectus.
Class I Shares
Class I shares of one Sentinel Fund may be exchanged for Class I shares of another Sentinel Fund, if offered through exchange, at net asset value. Class I shares may be exchanged for Class R6 shares of another Sentinel Fund, if offered.
Class R3 Shares
Class R3 shares are offered only by the Sentinel Total Return Bond Fund and may not be exchanged for shares of any other Sentinel Fund.
Class R6 Shares
Class R6 shares of one Sentinel Fund may be exchanged for Class R6 shares of another Sentinel Fund, if offered through exchange, at net asset value.
Transfers of Ownership of Shares
When you need to change ownership of your shares or change the name on an account, a Transfer Agent representative will assist you.
Additional Information About Buying, Selling and Exchanging Shares
Reinvestment Privileges with Respect to Certain Shareholders of the Federated Government Obligations Fund – Institutional Service Class Shares
Persons who wish to invest in the Federated Government Obligations Fund (“FGO Fund”), a money market fund distributed by Federated Securities Corporation, which is offered to investors through a separate prospectus, may choose to have their accounts in that fund maintained by Sentinel Investments. Sentinel offers certain sales charge waivers to investors who directly reinvest certain proceeds of redemptions of the FGO Fund held in accounts maintained by Sentinel Investments in shares of Sentinel Funds (a “reinvestment”), as described below:
| | • | Investors in the FGO Fund who obtained their shares by redeeming shares of the Daily Income Fund U.S. Government (“DIF”) portfolio from an account maintained by Sentinel Investments and immediately investing the proceeds of such redemption in the FGO Fund in account maintained by Sentinel Investments, where the DIF shares were obtained by using the proceeds of a redemption of Class A shares or Class C shares of a Sentinel Fund that were subject to front end sales charge or CDSC, as applicable, may direct that the proceeds of a redemption of such shares of the FGO Fund be used to directly purchase Class A or Class C shares of a Sentinel Fund, and such shares of the Sentinel Fund will not be subject to a front-end sales charge or a CDSC, as applicable. |
| | • | Investors in the FGO Fund who obtained their shares by redeeming shares of the Daily Income Fund U.S. Government (“DIF”) portfolio from an account maintained by Sentinel Investments and immediately investing the proceeds of such redemption in the FGO Fund in account maintained by Sentinel Investments and who did not purchase their DIF shares using proceeds from a redemption of the Sentinel Funds may use the proceeds of a redemption of the FGO Fund to purchase shares of a Sentinel Fund; however such purchase will be treated as an initial purchase of the Sentinel Fund’s shares, and subject to all applicable sales charges. |
| | • | Investors in the FGO Fund who maintain their accounts through Sentinel Investments and who obtained such shares by using proceeds of a redemption of Class A shares of a Sentinel Fund that were subject to a front-end sales or CDSC charge may direct that the proceeds of a redemption of such shares of the FGO Fund be used to directly purchase Class A shares of a Sentinel Fund, and such Class A shares of the Sentinel Fund will not be subject to a front-end sales charge or a CDSC. |
| | • | Investors in Sentinel Funds may redeem Class A shares of such funds that are subject to a CDSC and direct that such proceeds be used to directly purchase shares of the FGO Fund upon payment of any applicable CDSC. Upon the redemption of the shares of the FGO Fund received in connection with such a purchase, an investor may direct that the proceeds of the redemption be used to directly purchase Class A shares of a Sentinel Fund, and such Class A shares of the Sentinel Fund will not be subject to a front-end sales charge or a CDSC. |
| | • | Investors in Sentinel Funds may redeem Class C shares of such funds and direct that such proceeds be used to directly purchase shares of the FGO Fund upon payment of any applicable CDSC. Upon the redemption of the shares of the FGO Fund received in connection with such a purchase, an investor may direct that the proceeds of the redemption be used to |
| | | directly purchase Class C shares of a Sentinel Fund, and such Class C shares of the Sentinel Fund will not be subject to a front-end sales charge or a CDSC. |
There is no administrative charge for the reinvestment privilege, although Sentinel Investments does receive a fee from the FGO Fund and/or Federated Securities Corporation for its services in connection with maintaining the accounts. The purchase of any shares of a Sentinel Fund pursuant to a reinvestment will be subject to all applicable fees and expenses of the applicable Sentinel Fund. Policies prohibiting short term or excessive trading apply. The minimum amount for a reinvestment is $1,000. However, shareholders who are establishing a new account through the reinvestment privilege must ensure that a sufficient number of shares are invested to meet the minimum initial investment required for the fund into which the investment is being made.
The reinvestment privilege is available to shareholders resident in any state in which shares of the Fund being acquired may legally be sold.
Initial investors in the FGO Fund who maintain their accounts through Sentinel Investments and who redeem shares of the FGO Fund and use the proceeds to purchase shares of a Sentinel Fund will be treated as initial purchasers of the Sentinel Fund’s shares. The purchase of the Sentinel Fund’s shares will be subject to all applicable sales charges.
Additional Information
Primary Service Providers to the Funds
Sentinel Asset Management, Inc. is the Funds’ investment adviser. Information about the investment adviser is located below, under “Management of the Funds”. Shares of the Funds are distributed by Sentinel Financial Services Company. Information about Sentinel Financial Services Company can be found in the Funds’ Statement of Additional Information under “Principal Underwriter”. Boston Financial Data Services, Inc. is the Funds’ transfer agent. Information about the Funds’ transfer agent can be found in the Funds’ Statement of Additional Information under “Fund Services Arrangements”. Sentinel Administrative Services, Inc. provides transfer agency administrative and oversight services to the Funds.
Customer Identification Requirement
To help the government fight the funding of terrorism and money laundering activities, Federal law requires all financial institutions to obtain, verify, and record information that identifies each person who opens an account. This means when you open an account, we will ask for your name, address, date of birth and other information that will allow us to identify you. We may also ask to see your driver’s license or other identifying documents. Each Fund reserves the right to reject purchase orders from persons who have not submitted information that is sufficient to allow the Fund to verify the identity of the purchaser. Each Fund also reserves the right to redeem amounts in the Fund from any person whose identity the Fund is unable to verify on a timely basis.
Foreign Addresses
Because the Funds are not registered for sales outside of the U.S., they generally will not accept new accounts or investments into an account with a mailing address that is not within the U.S. or a U.S. military address.
Redemptions in Kind
Each Fund may, at its discretion, redeem its shares in kind (i.e., in securities rather than in cash). If this occurs, securities received in kind remain at the risk of the market, and the redeeming shareholder may incur brokerage or other transaction costs to convert the securities to cash. As with redemptions for cash, upon a redemption in kind, any gain on the transaction may be subject to tax. If illiquid securities are used to satisfy redemptions in kind, redeeming shareholders may face difficulties in selling the illiquid securities at a fair price.
Redemption Proceeds
If a redemption is paid by check, the Transfer Agent will normally mail you a check in payment for your shares within seven days after it receives all documents required to process the redemption. We may delay payment during any period in which the right of redemption is suspended or date of payment is postponed because the NYSE is closed, trading on the NYSE is restricted, or the Securities and Exchange Commission deems an emergency to exist. No interest will accrue on amounts represented by uncashed redemption checks. We may require additional documentation to redeem shares that are registered in the name of a corporation, trust, company retirement plan, agent or fiduciary, or if a shareholder is deceased. The Funds reserve the right to withhold the proceeds of a redemption of shares purchased by check until the check has cleared, which may take up to 15 days after the purchase date. Distributions from retirement plans may be subject to withholding by the Internal Revenue Service under the Code. In their discretion, the Funds may reinvest redemption checks that remain uncashed for more than one year.
Share Certificates
The Funds are not required to and do not expect to issue share certificates. If you are the shareholder of record and have a certificate representing ownership in a Fund, you can redeem your shares by mailing the certificate to the Transfer Agent with appropriate
instructions to redeem. Your instructions should be signed by the registered owner(s) exactly as the shares are registered. The Transfer Agent may require the signature(s) of the registered owner(s) to be guaranteed by an eligible financial institution which meets BFDS’s requirements if the proceeds of the redemption exceed $100,000, if the check is not made payable to the registered owner(s) and mailed to the record address, or if the record address has been changed within the past 30 days. We suggest sending certificates by certified mail. You may also redeem share certificates by presenting them in person to Sentinel Investments c/o Boston Financial Data Services, 30 Dan Road, Canton MA 02021-2809.
Telephone or Online Delays
At times, telephone or online transactions may be difficult to implement. Information processing and communications systems, both those of the Transfer Agent and third-party vendors on whom we depend, are subject to occasional congestion, technological problems, or in extreme cases, outages. The failure of these systems for a significant period of time may limit our ability to process a telephone or online transaction. Shareholders who wish to make use of the telephone and/or our website to transact business in the Funds should not assume that these systems will always be available. If you experience difficulty in contacting us by telephone or online, please write to Sentinel Investments at P.O. Box 55929, Boston, MA 02205-5929.
Transacting Through an Intermediary
If you transact through an intermediary, you must follow the intermediary’s procedures for transacting in the Fund. The intermediary may have different procedures, account options and/or transactional fees from those described here.
Undesignated Investments
When all or a portion of a purchase is received for investment without a clear Fund designation or for investment in one of our closed classes or Funds, the transfer agent may initiate a call to the shareholder or financial advisor to obtain investment designation. If the call does not result in a resolution, we may return the money to you or we may deposit the undesignated portion or the entire amount, as applicable, into the Class A shares of the Low Duration Bond Fund without sales charge. We will treat your inaction as approval of this purchase. You may at any time after the purchase direct us to redeem or exchange these shares of the Low Duration Bond Fund at the next net asset value calculated after we accept such direction. Exchange transactions will be subject to any applicable sales charge.
Certain Account Fees and Minimum Account Size
Due to the expense of maintaining accounts with small balances, we reserve the right to liquidate any account that has a value of less than $1,000 and that has been open for at least 12 months. Individual shareholders that received Class I shares of a Sentinel Fund in an exchange for Synovus or Citizens Funds’ shares in a reorganization are subject to the account minimums for Class A shares. We also reserve the right to charge an annual maintenance fee of $25 to any such account. The annual maintenance fee is deducted automatically from each such shareholder account on a quarterly pro-rated basis.
Shares held through an omnibus account or wrap-fee program for which a Fund has waived investment minimums are subject to the minimum account size requirements established by the financial intermediary.
Miscellaneous Fees
| Service Fees | |
| Express Mail Deliveries | $15.00 |
| Federal Funds Wire | $20.00 |
| Bounced check-writing checks & ACH Transactions | $30.00 |
| Bounced check received for deposit | $30.00 |
| Over-draft protection | $30.00 |
| Each copy of a paid check | $10.00 |
| Transcripts - 2004 and per year prior to 2003 | $50.00 |
| Transcripts - per year after 2004 | $25.00 |
Custodial Account Fees. Custodial accounts for which the Transfer Agent is the agent for the custodian also pay the following fees:
| Annual custodial fee per social security number | $20.00 |
| Closeout fee per account | $20.00 |
| Transfer of assets per transaction | $25.00 |
A portion of these fees is paid to the custodian and a portion is paid to the Transfer Agent, which provides certain services to these accounts as agent for the custodian.
Excessive Trading Policy
Excessive trading (which may be as a result of market timing) by shareholders of a Fund may harm performance by disrupting portfolio management strategies and by increasing expenses, including brokerage and administrative costs, and may dilute the value of the holdings of other shareholders. Excessive trading may cause a Fund to retain more cash than the Fund’s portfolio manager would normally retain in order to meet unanticipated redemptions or may force the Fund to sell portfolio securities at disadvantageous times to raise the cash needed to meet those redemption or exchange requests. The Funds will not accommodate excessive trading in any Fund, and have adopted a policy to deter such trading. The policy has been reviewed and approved by the Board of Directors of the Funds. Under this policy, a Fund will reject any purchase order or exchange request if the Fund has determined that an investor’s trading, in the judgment of the Fund, has been or may be disruptive to a Fund. In making this judgment, a Fund may consider trading done in multiple accounts under common ownership or control. Certain types of regular transactions that will not be deemed by the Funds to be excessive trading for this purpose include systematic exchanges, dollar cost averaging, regular rebalancing of holdings in the Funds (e.g., periodic rebalancing to maintain an investment adviser’s asset allocations model) and pre-authorized withdrawals.
The policy applies to all shareholders. However, a Fund may not be able to determine that a specific purchase order or request for exchange or redemption, particularly an order or request made through omnibus accounts or 401(k) plans, is excessive or disruptive to the Fund. In addition, the Funds may not analyze every transaction that could potentially be excessive or disruptive to a Fund. The Funds therefore make no representation that all such purchase orders or exchange requests can or will be rejected. In addition, with respect to shares held on the books of third party intermediaries, such as retirement plan administrators, the Funds may work with such intermediaries to implement alternate procedures that the Funds determine are reasonably designed to achieve the objective of the Funds’ excessive trading policy. Where an intermediary adopts such procedures, shareholders whose accounts are on the books of such intermediary will be subject to that intermediary’s procedures, which may differ from the procedures applied by the Funds to accounts held directly on the Funds’ books, but which are reasonably designed to achieve the same objective.
Each Fund reserves the right to reject or cancel a purchase or exchange order for any reason without prior notice. A fund may in its discretion reject or cancel a purchase or an exchange order even if the transaction is not subject to the specific roundtrip transaction limitation described below if the Advisor believes that there appears to be a pattern of short-term or excessive trading activity by a shareholder or deems any other trading activity harmful or disruptive to a fund.
Each Fund, through its Advisor and transfer agent, will measure excessive trading by the number of roundtrip transactions within a shareholder’s account during a rolling 12-month period. A “roundtrip” transaction is defined as any combination of purchase and redemption activity (including exchanges) of the same Fund’s shares. Each Fund may take other trading activity into account if a Fund believes such activity is of an amount or frequency that may be harmful to long-term shareholders or disruptive to portfolio management.
Shareholders are limited to six roundtrip transactions in the same Sentinel Fund over a rolling 12-month period. Shareholders with six or more roundtrip transactions in the same Sentinel Fund within a rolling 12-month period generally will be blocked from making additional purchases of, or exchanges into, that Sentinel Fund. Each Fund has sole discretion whether to remove a block from a shareholder’s account (e.g., such as when the Advisor has determined that the transactions were not abusive or harmful to the Fund). The rights of a shareholder to redeem shares are not affected by the six roundtrip transaction limitation.
Each Fund may make exceptions to the roundtrip transaction policy for certain types of transactions if, in the opinion of the Advisor, the transactions do not represent short term or excessive trading or are not abusive or harmful to a Fund, such as, but not limited to, systematic transactions, required minimum retirement distributions, transactions initiated by a fund or administrator and transactions by certain qualified funds-of-funds.
Excessive Trading and Short Term Trading Fee Waivers
Excessive trading block and redemption fees do not apply to:
• any single redemption of $5,000 or less, fees of $100 or less, or other amount considered by the Funds’ Chief Compliance Officer to be de minimis in light of the size of the account;
• accounts of asset allocation programs, lifestyle investment options or investment adviser wrap programs whose trading practices are determined by the Fund not to be detrimental to a Fund or its shareholders, that do not allow frequent trading or market timing and that have policies in place to monitor and address such trading;
• periodic portfolio re-balancing of retirement plans on a pre-arranged schedule with recordkeepers that do not allow frequent trading or market timing and who have policies in place to monitor and address such trading;
• retirement plan sponsor-initiated transfers, such as plan mergers, terminations, changes to fund offerings and service provider changes;
• rollovers of current investments in the Fund through qualified employee benefit plans; and
• transactions during the initial 90 days of any participant’s default investment in any Fund selected by a retirement plan to be used as a qualified default investment alternative or with a qualified default investment alternative.
Pricing Fund Shares
Net asset value for each class of shares of a Fund is calculated each day that the New York Stock Exchange (“NYSE”) is open, as of the close of business on the NYSE, based on prices at the time of closing of regular trading. The NYSE generally closes at 4:00 p.m. Eastern time. The net asset value per share is computed by dividing the total value of the assets of each class of the Fund, less its liabilities, by the total number of outstanding shares of each class of such Fund.
Equity securities that are traded on a national or foreign securities exchange and over-the-counter (“OTC”) securities listed in the NASDAQ National Market System are valued at the last reported sales price or official closing price on the principal exchange on which they are traded on the date of determination as of the close of business of the NYSE, usually 4:00 p.m. Eastern Time, each day that the NYSE is open. ETFs will be valued at their most recent closing price.
Foreign equity securities traded on a foreign securities exchange are subject to fair value pricing when appropriate, using valuations provided by an independent pricing service.
Securities for which no sale was reported on the valuation date are valued at the mean between the last reported bid and asked prices.
OTC securities not listed on the NASDAQ National Market System are valued at the mean of the current bid and asked prices.
Fixed-income securities with original maturities of greater than 60 days, including short-term securities with more than 60 days left to maturity, are valued on the basis of valuations provided by an independent pricing service. The bid price is generally used for valuation purposes. Short-term securities with original maturities of less than 60 days are valued at amortized cost, which approximates market value. The value of short-term securities originally purchased with maturities greater than 60 days is determined based on an amortized value to par when they reach 60 days or less remaining to maturity. The amortized cost method values a security at cost on the date of purchase and thereafter assumes a constant amortization to maturity of any discount or premium. Investments in mutual funds are valued at the net asset value per share on the day of valuation. Investments in exchange traded derivatives are valued at the settlement price determined by the relevant exchange. Investments in non-exchange traded derivatives and cleared derivatives are valued on the basis of prices supplied by an independent pricing service, if available, or quotes obtained from brokers and dealers.
Securities for which market quotations are not readily available, or whose values have been materially affected by events occurring before a Fund’s pricing time but after the close of the securities’ primary markets, including an unscheduled early closing of a primary exchange or when trading in a particular security is halted during the day and does not resume prior to the time a Fund’s net asset value is calculated, will be fair valued under procedures adopted by the Funds’ Board of Directors. The Board has delegated this responsibility to the Sentinel Valuation Committee (the “Valuation Committee”), established by Sentinel and subject to the Board’s review and supervision. Fair value represents a good faith approximation of the value of a security. The fair value of one or more securities may not, in retrospect, be the price at which those assets could have been sold during the period in which the particular fair values were used in determining a Fund’s net asset value.
The Funds may use one or more independent pricing services, as approved by the Board. Such independent pricing services shall provide their daily evaluations directly to the Funds’ custodian bank and fund accounting service provider, State Street Bank and Trust Company (“SSB”). Sentinel Administrative Services, Inc., the Funds’ administrator and a subsidiary of Sentinel, shall have an oversight role over the daily accounting process. Portfolio securities for which market quotations are readily available shall be valued at current market value; other securities and assets shall be valued at fair value as determined in good faith by Sentinel, which may act through its Valuation Committee, subject to the overall oversight of the Board or its Audit Committee.
The Valuation Committee, SSB and Sentinel Administrative Services, Inc. perform a series of activities to provide reasonable comfort over the accuracy of prices including: 1) periodic vendor due diligence meetings to review underlying methodologies, policies and procedures with respect to valuations, 2) daily monitoring of significant events that may impact markets and valuations, 3) daily comparisons of security valuations versus prior day valuations for all securities with additional follow-up procedures implemented for those that exceed established thresholds, and 4) daily reviews of stale valuations and manually priced securities which may be subjected to additional procedures at the discretion of the Valuation Committee.
In addition, there are several processes outside of the pricing process that are used to monitor valuation issues including: 1) performance and performance attribution reports are monitored by Sentinel for anomalous impacts based upon benchmark performance, and 2) portfolio managers review all portfolios for performance and analytics.
Securities transactions are accounted for on the next business day following trade date (trade date plus one). Under certain circumstances, exceptions are made so that purchases and sales are booked on trade date. These exceptions include: (1) when trades
occur on a day that happens to coincide with the end of a month; or (2) on occasion, if Sentinel Administrative Services, Inc. believes significant price movements are deemed large enough to impact the calculation of the net asset value per share.
The per share net asset value of Class A shares generally will be higher than the per share net asset value of Class C or Class S shares, reflecting the higher daily expense accruals of Class C and Class S shares. It is expected, however, that the per share net asset value of the classes will tend to converge (although not necessarily meet) immediately after the payment of dividends or distributions. Dividends and distributions will differ by the approximate amount of the expense accrual differences between the classes.
Dividends, Capital Gains and Taxes
The Funds distribute their net investment income, if any, as follows:
| Fund | Dividends Paid |
| Sentinel Government Securities Fund | Monthly |
| Sentinel Low Duration Bond Fund | |
| Sentinel Multi-Asset Income Fund | |
| Sentinel Total Return Bond Fund | |
| Sentinel Unconstrained Bond Fund | |
| Sentinel Balanced Fund | Quarterly |
| Sentinel Common Stock Fund | |
| Sentinel International Equity Fund | Annually |
| Sentinel Small Company Fund | |
| Sentinel Sustainable Core Opportunities Fund | |
For each Fund, distributions of any net realized capital gains for a fiscal year are generally paid in December, following the November 30th fiscal year-end.
You may elect to receive all or any part of your dividends and/or capital gains distributions in cash, shares of your Fund, or shares of the same class of another Sentinel Fund. Unless you elect otherwise, your dividends and capital gains distributions will be reinvested in shares of the same Fund. If you elect to receive dividends and capital gains distributions in cash, you will only receive a check if the distribution amount exceeds $10.00. If the distribution is $10.00 or less, the amount will automatically be reinvested. If you would like to receive cash distributions, regardless of the amount, you can establish an electronic funds transfer to your bank. If you elect to receive distributions by check, in its discretion the Fund may reinvest previously issued distribution checks and also reinvest future distributions. This may occur if a distribution check remains uncashed and outstanding for six months or the post office is unable to deliver the check to you. No interest will accrue on amounts represented by uncashed dividend or other distribution checks. To change the current option for payment of dividends and capital gains distributions or to establish electronic funds transfer please call 1-800-282-FUND (3863). If your mailing address is not within the U.S. or a U.S. military address, you must receive your distributions by check.
You will pay tax on dividends and capital gains distributions from the Funds whether you receive them in cash, additional shares or shares of another Sentinel Fund. Capital gains may be taxable to you at different rates depending on how long the Fund held the assets sold. If you redeem Fund shares or exchange them for shares of another Fund, any gain on the transaction may be subject to tax. In addition, a Fund is generally required by law to provide you and the Internal Revenue Service with cost basis information on the redemption or exchange of any of your shares in the Fund acquired on or after January 1, 2012 (including shares that you acquire through the reinvestment of distributions). Certain dividend income received by a Fund, including dividends received from qualifying foreign corporations and long-term capital gains, are eligible for taxation at a reduced rate that applies to individual shareholders. However, to the extent a Fund’s distributions are derived from income on debt securities and non-qualifying dividends of foreign corporations and/or short-term capital gains, its distributions will not be eligible for this reduced tax rate.
If you are neither a tax resident nor a citizen of the U.S. or if you are a foreign entity, the Funds’ ordinary dividends will generally be subject to a 30% U.S. withholding tax, unless a lower treaty rate applies.
Dividends and interest received by the International Equity Fund and, to a lesser extent, the Balanced, Common Stock, Low Duration Bond Fund, Multi-Asset Income, Small Company, Sustainable Core Opportunities, Total Return Bond and Unconstrained Bond Funds, may give rise to withholding and other taxes imposed by foreign countries. Tax conventions between certain countries and the U.S. may reduce or eliminate these taxes. Shareholders in the International Equity, Multi-Asset Income and Total Return Bond Funds may be able to claim a credit or deduction with respect to such taxes if certain requirements are met. However, it is unlikely that a credit or deduction will be available to shareholders of the Balanced, Common Stock, Small Company, and Sustainable Core Opportunities with respect to such taxes.
By law, your redemption proceeds and dividends of ordinary income and capital gains will be subject to a withholding tax if you are not a corporation and have not provided a taxpayer identification number or social security number or if the number you have provided is incorrect.
A 30% withholding tax is currently imposed on dividends and will be imposed on redemption proceeds paid after December 31, 2018 to (i) foreign financial institutions (as defined in Section 1471(d)(4) of the Code) unless they agree to collect and disclose to the IRS information regarding their direct and indirect United States account holders and (ii) certain other foreign entities unless they certify
certain information regarding their direct and indirect United States owners. Under some circumstances, a foreign shareholder may be eligible for refunds or credits of such taxes.
A 3.8% Medicare tax is imposed on the net investment income (which includes taxable dividends and gain recognized on a redemption or exchange of shares) of certain individuals, trusts and estates.
This section summarizes some of the consequences under current federal tax law of investment in the Funds. It is not a substitute for individualized tax advice. Consult your tax advisor about the potential tax consequences of an investment in any of the Funds under all applicable tax laws.
Index Descriptions
All indices are unmanaged and index performance does not reflect any fees, expenses or taxes. An investment cannot be made directly in an index.
The Bloomberg Barclays 1-3 Year U.S. Government/Credit Index is an index which consists of U.S. government, government agency and investment grade corporate securities with maturities of one to three years. (Low Duration Bond Fund)
The Bloomberg Barclays U.S. Aggregate Bond Index measures the U.S. investment grade fixed-rate bond market, with index components for government and corporate securities, mortgage pass-through securities, and asset-backed securities. (Balanced (secondary), Multi-Asset Income (secondary) and Total Return Bond Funds)
The Bloomberg Barclays U.S. Government/Mortgage Backed Securities (MBS) Index is an unmanaged index comprising U.S. Treasuries and agency debentures with maturities of one year or longer and agency mortgage-backed pass-through securities issued by Government National Mortgage Association (GNMA), Federal National Mortgage Association (FNMA), and Federal Home Loan Mortgage Corporation (FHLMC). (Government Securities Fund)
The BofA Merrill Lynch U.S. Dollar 3-Month LIBOR Constant Maturity Index represents the London interbank offered rate (LIBOR) with a constant 3-month average maturity. LIBOR, published by the British Bankers’ Association, is a composite of the rates of interest at which banks borrow from one another in the London market, and is a widely used benchmark for short-term interest rates (Unconstrained Bond Fund)
The Morgan Stanley Capital International (MSCI) Europe, Australasia, Far East (EAFE) Index is a free float-adjusted, market capitalization-weighted index that is designed to measure the equity market performance of developed markets, excluding the U.S. and Canada. The Fund uses the net version of the Index, which reflects reinvested dividends which have been subject to the maximum non-U.S. tax rate applicable (International Equity Fund)
The Russell 2000® Index measures the performance of 2000 small-cap companies within the U.S. equity universe. (Small Company Fund)
The Standard & Poor’s 500 Index consists of approximately 500 widely held U.S. equity securities chosen for market size, liquidity, and industry group representation. (Balanced, Common Stock, Multi-Asset Income and Sustainable Core Opportunities Funds)
Management of the Funds
Sentinel manages the Funds’ investments and their business operations under the overall supervision of the Funds’ Board of Directors. Sentinel has the responsibility for making all investment decisions for the Funds, except where it has retained a subadviser to make the investment decisions for a Fund.
Sentinel is an indirectly wholly owned subsidiary of the National Life Holding Company. Its principal business address is One National Life Drive, Montpelier, Vermont 05604.
Each Fund pays Sentinel, as investment adviser, fees in return for providing investment advisory services. For the fiscal year ended November 30, 2016, the Funds paid monthly advisory fees to Sentinel at the following annual rates (stated as a percentage of the average daily net assets of each Fund taken separately):
| Balanced Fund | 0.53% |
| Common Stock Fund | 0.57% |
| Government Securities Fund | 0.45% |
| International Equity Fund | 0.70% |
| Low Duration Bond Fund | 0.45% |
| Multi-Asset Income Fund | 0.53% |
| Small Company Fund | 0.67% |
| Sustainable Core Opportunities Fund | 0.70% |
| Total Return Bond Fund | 0.49% |
| Unconstrained Bond Fund | 0.75% |
Sentinel has contractually agreed, effective March 30, 2017, to reimburse certain expenses paid by the Class I shares of the Funds to the extent necessary to prevent the total annual fund operating expense ratio of the Class I shares of the Funds, on an annualized basis, from exceeding the total annual fund operating expense ratio of the Class A shares of the same Fund. This agreement will continue through March 31, 2018. This agreement may be terminated upon 90 days’ notice by a majority of the non-interested directors of the Funds.
Sentinel has contractually agreed, effective March 30, 2017, to waive fees and/or reimburse certain expenses in order to limit Total Annual Fund Operating Expenses After Fee Waiver and/or Expense Reimbursement for Class R6 shares of the Common Stock Fund, on an annualized basis, to 0.65% of average daily net assets attributable to Class R6 shares through March 31, 2018. This agreement may be terminated upon 90 days’ notice by a majority of the non-interested directors of the Fund.
Sentinel has contractually agreed, effective March 30, 2017, to waive fees and/or reimburse certain expenses in order to limit Total Annual Fund Operating Expenses After Fee Waiver and/or Expense Reimbursement for Class R6 shares of the Small Company Fund, on an annualized basis, to 0.73% of average daily net assets attributable to Class R6 shares through March 31, 2018. This agreement may be terminated upon 90 days’ notice by a majority of the non-interested directors of the Fund.
Sentinel has contractually agreed, effective March 30, 2017, to waive fees and/or reimburse certain expenses in order to limit Total Annual Fund Operating Expenses After Fee Waiver and/or Expense Reimbursement for Class A shares of the Total Return Bond Fund, on an annualized basis, to 0.89% of average daily net assets attributable to Class A shares through March 31, 2018. In addition, the Fund’s investment advisor has contractually agreed, effective March 30, 2017, to waive fees and/or reimburse certain expenses in order to limit Total Annual Fund Operating Expenses After Fee Waiver and/or Expense Reimbursement for Class R6 shares, on an annualized basis, to 0.69% of average daily net assets attributable to Class R6 shares through March 31, 2018, and to waive fees and/or reimburse certain expenses in order to limit Total Annual Fund Operating Expenses After Fee Waiver and/or Expense Reimbursement for Class R3 shares, on an annualized basis, to 1.19% of average daily net assets attributable to Class R3 shares through March 31, 2018. Each of these agreements may be terminated upon 90 days’ notice by a majority of the non-interested directors of the Fund.
Sentinel has contractually agreed, effective March 30, 2017, to waive fees and/or reimburse certain expenses in order to limit Total Annual Fund Operating Expenses After Fee Waiver and/or Expense Reimbursement for Class C shares of the Unconstrained Bond Fund, on an annualized basis, to 2.06% of average daily net assets attributable to Class C shares through March 31, 2018. This agreement may be terminated upon 90 days’ notice by a majority of the non-interested directors of the Fund.
The fee waivers and expense reimbursement agreements referred to above are net of any Acquired Fund Fees and Expenses.
A discussion regarding the basis for the Board of Directors’ most recent approval of the Funds’ investment advisory contracts is available in the Funds’ Annual Report for the fiscal year ended November 30, 2016.
The following individuals manage the Funds:
Balanced Fund
Daniel J. Manion, lead manager, manages the equity portion of the Balanced Fund and Jason Doiron manages the fixed-income portion of the Balanced Fund. Mr. Manion has been employed by Sentinel since 1993 and is Sentinel’s Director of Equity Research. He has managed the equity portion of the Fund since 2004. Mr. Manion holds the Chartered Financial Analyst designation. Mr. Doiron has been employed by Sentinel since 2008 and is Head of Investments at Sentinel. He has co-managed the Fund since 2012. From 2005 to 2008, Mr. Doiron was Director—Quantitative Trading and Strategies Group for the Royal Bank of Canada’s Capital Markets Group. Mr. Doiron holds the Financial Risk Manager and Professional Risk Manager designations.
Mr. Manion has announced his intention to retire from Sentinel in the second quarter of 2017. Following his retirement, he will no longer manage the Fund.
Common Stock Fund
Mr. Manion is lead manager and Hilary Roper is co-manager of the Common Stock Fund. Mr. Manion has managed or co-managed the Fund since 1994. Ms. Roper has been employed by Sentinel since 1998 as an equity analyst and has co-managed the Fund since 2010. She holds the Chartered Financial Analyst designation.
Mr. Manion has announced his intention to retire from Sentinel in the second quarter of 2017. Following his retirement, he will no longer manage the Fund.
Government Securities Fund
Mr. Doiron and Peter Hassler co-manage the Government Securities Fund. Mr. Doiron has co-managed the Fund since March 29, 2012. Mr. Hassler has co-managed the Fund since February 13, 2014. Mr. Hassler has been employed by Sentinel since August 2012. Prior to joining Sentinel, Mr. Hassler was employed at Dwight Asset Management Company LLC in a variety of capacities, most recently as an associate portfolio manager from 2009 to 2012. He holds the Chartered Financial Analyst designation.
International Equity Fund
Andrew Boczek manages the International Equity Fund. Mr. Boczek has been associated with Sentinel since 2012, and has managed or co-managed the Fund since September 1, 2012. Prior to joining Sentinel, from 2006-2012, Mr. Boczek served as an analyst with Legend Capital Management, LLC. Prior to Legend Capital, Mr. Boczek served as an analyst on the International Value team at Artisan Partners LP from 2002 - 2006.
Low Duration Bond Fund
Mr. Doiron manages the Low Duration Bond Fund. He is assisted by a team of additional portfolio managers and analysts. He has managed or co-managed the Fund since March 29, 2012.
Multi-Asset Income Fund
Mr. Doiron is responsible for day-to-day management of the Fund. He is assisted by a team of additional portfolio managers and analysts. He has managed or co-managed the Fund since 2009.
Small Company Fund
Jason Ronovech is lead manager of the Small Company Fund. Mr. Ronovech has co-managed the Fund since March 30, 2013.
Sustainable Core Opportunities Fund
Helena Ocampo manages the Sustainable Core Opportunities Fund. Ms. Ocampo has been employed by Sentinel since 2005, and has managed or co-managed the Fund since 2008.
Total Return Bond Fund
Mr. Doiron manages the Total Return Bond Fund. He is assisted by a team of additional portfolio managers and analysts. He has managed or co-managed the Fund since its inception in 2010.
Unconstrained Bond Fund
Mr. Doiron manages the Unconstrained Bond Fund. He is assisted by a team of additional portfolio managers and analysts. He has managed the Fund since its inception in 2014.
The teams of investment management personnel may include additional portfolio managers and a number of analysts. The Funds’ Statement of Additional Information provides additional information about portfolio manager compensation, other accounts they manage, and their ownership of shares in the Funds they manage.
Householding and Electronic Delivery of Documents
Each year you are automatically sent an updated prospectus, or summary prospectus for the Fund or Funds that you own, and annual and semi-annual reports for the Funds. You may also occasionally receive proxy statements and supplements to the prospectus. In order to eliminate duplicate mailings and reduce expenses, only one copy of these documents is sent to shareholders who are part of the same family and share the same household address. This process is known as “householding.” If you do not want the mailings of your documents to be subject to householding, please contact the Funds at 1-800-282-FUND (3863). You may elect to receive these documents, as well as your quarterly account statements, electronically in lieu of paper form by enrolling in e-delivery. To enroll, visit http://www.sentinelinvestments.com, select “Investor Login” and follow the prompts. Once enrolled, you will receive e-mail notifications of quarterly statements, annual and semi-annual reports and prospectuses. You will then be able to access the electronic copies on the Funds’ website.
Financial Highlights
The financial highlights table is intended to help you understand each Fund’s financial performance for the past five years, or for the other applicable period of the Fund’s operations. Certain information reflects financial results for a single Fund share. The total returns in the table represent the rate that an investor would have earned on an investment in each Fund, assuming reinvestment of all dividends and distributions. Per share data is calculated utilizing average daily shares outstanding.
The financial highlights through November 30, 2016 were audited by PricewaterhouseCoopers LLP, whose report, along with the related financial statements of the Funds, is included in the Funds’ Annual Report to Shareholders, which is available upon request.
| | | | | | | | | | | Income from Investment Operations | | Less Distributions | | | | |
| | | | | | | | | | | | | | | | | | | | | | | | | | | | | | | | | | | | | |
Fund/
Share
Class | | | Fiscal year
(period
ended) | | Net asset
value,
beginning
of period | | Net
investment
income
(loss) | | Net gains or
losses on
securities (both
realized and
unrealized) | | Total from
investment
operations | | Dividends
(from net
investment
income) | | Distributions
(from
realized
gains) | | Total
distributions | | Net asset
value, end
of period | |
| Balanced Class A | | | | | | | | | | | | | | | | | | | | | | | | | | | | | | | | |
| | | | 11/30/12 | | | | $17.10 | | | $ | 0.23 | | | $ | 1.77 | | | $ | 2.00 | | | $ | 0.30 | | | $ | 0.77 | | | $ | 1.07 | | | | $18.03 | |
| | | | 11/30/13 | | | | 18.03 | | | | 0.23 | | | | 2.91 | | | | 3.14 | | | | 0.26 | | | | 0.68 | | | | 0.94 | | | | 20.23 | |
| | | | 11/30/14 | | | | 20.23 | | | | 0.26 | | | | 1.50 | | | | 1.76 | | | | 0.26 | | | | 0.75 | | | | 1.01 | | | | 20.98 | |
| | | | 11/30/15 | | | | 20.98 | | | | 0.43 | | | | (0.35 | ) | | | 0.08 | | | | 0.30 | | | | 0.89 | | | | 1.19 | | | | 19.87 | |
| | | | 11/30/16 | | | | 19.87 | | | | 0.23 | | | | 0.66 | | | | 0.89 | | | | 0.44 | | | | 0.64 | | | | 1.08 | | | | 19.68 | |
| Balanced Class C | | | | | | | | | | | | | | | | | | | | | | | | | | | | | | | | |
| | | | 11/30/12 | | | | 17.15 | | | | 0.08 | | | | 1.78 | | | | 1.86 | | | | 0.17 | | | | 0.77 | | | | 0.94 | | | | 18.07 | |
| | | | 11/30/13 | | | | 18.07 | | | | 0.08 | | | | 2.91 | | | | 2.99 | | | | 0.11 | | | | 0.68 | | | | 0.79 | | | | 20.27 | |
| | | | 11/30/14 | | | | 20.27 | | | | 0.11 | | | | 1.51 | | | | 1.62 | | | | 0.10 | | | | 0.75 | | | | 0.85 | | | | 21.04 | |
| | | | 11/30/15 | | | | 21.04 | | | | 0.28 | | | | (0.35 | ) | | | (0.07 | ) | | | 0.15 | | | | 0.89 | | | | 1.04 | | | | 19.93 | |
| | | | 11/30/16 | | | | 19.93 | | | | 0.08 | | | | 0.66 | | | | 0.74 | | | | 0.30 | | | | 0.64 | | | | 0.94 | | | | 19.73 | |
| Balanced Class I | | | | | | | | | | | | | | | | | | | | | | | | | | | | | | | | |
| | | | 11/30/12 | | | | 17.04 | | | | 0.23 | | | | 1.76 | | | | 1.99 | | | | 0.31 | | | | 0.77 | | | | 1.08 | | | | 17.95 | |
| | | | 11/30/13 | | | | 17.95 | | | | 0.28 | | | | 2.89 | | | | 3.17 | | | | 0.29 | | | | 0.68 | | | | 0.97 | | | | 20.15 | |
| | | | 11/30/14 | | | | 20.15 | | | | 0.31 | | | | 1.50 | | | | 1.81 | | | | 0.31 | | | | 0.75 | | | | 1.06 | | | | 20.90 | |
| | | | 11/30/15 | | | | 20.90 | | | | 0.47 | | | | (0.34 | ) | | | 0.13 | | | | 0.36 | | | | 0.89 | | | | 1.25 | | | | 19.78 | |
| | | | 11/30/16 | | | | 19.78 | | | | 0.27 | | | | 0.65 | | | | 0.92 | | | | 0.49 | | | | 0.64 | | | | 1.13 | | | | 19.57 | |
| Common Stock Class A | | | | | | | | | | | | | | | | | | | | | | | | | | | | | | | | |
| | | | 11/30/12 | | | | 31.33 | | | | 0.38 | | | | 3.93 | | | | 4.31 | | | | 0.37 | | | | 0.43 | | | | 0.80 | | | | 34.84 | |
| | | | 11/30/13 | | | | 34.84 | | | | 0.44 | | | | 9.50 | | | | 9.94 | | | | 0.43 | | | | 1.04 | | | | 1.47 | | | | 43.31 | |
| | | | 11/30/14 | | | | 43.31 | | | | 0.56 | | | | 4.97 | | | | 5.53 | | | | 0.58 | | | | 5.47 | | | | 6.05 | | | | 42.79 | |
| | | | 11/30/15 | | | | 42.79 | | | | 1.01 | | | | (0.25 | ) | | | 0.76 | | | | 0.45 | | | | 0.02 | | | | 0.47 | | | | 43.08 | |
| | | | 11/30/16 | | | | 43.08 | | | | 0.53 | | | | 2.43 | | | | 2.96 | | | | 1.08 | | | | 2.68 | | | | 3.76 | | | | 42.28 | |
| Common Stock Class C | | | | | | | | | | | | | | | | | | | | | | | | | | | | | | | | |
| | | | 11/30/12 | | | | 30.35 | | | | 0.09 | | | | 3.81 | | | | 3.90 | | | | 0.12 | | | | 0.43 | | | | 0.55 | | | | 33.70 | |
| | | | 11/30/13 | | | | 33.70 | | | | 0.12 | | | | 9.18 | | | | 9.30 | | | | 0.14 | | | | 1.04 | | | | 1.18 | | | | 41.82 | |
| | | | 11/30/14 | | | | 41.82 | | | | 0.21 | | | | 4.78 | | | | 4.99 | | | | 0.19 | | | | 5.47 | | | | 5.66 | | | | 41.15 | |
| | | | 11/30/15 | | | | 41.15 | | | | 0.64 | | | | (0.24 | ) | | | 0.40 | | | | 0.17 | | | | 0.02 | | | | 0.19 | | | | 41.36 | |
| | | | 11/30/16 | | | | 41.36 | | | | 0.21 | | | | 2.33 | | | | 2.54 | | | | 0.78 | | | | 2.68 | | | | 3.46 | | | | 40.44 | |
| Common Stock Class I | | | | | | | | | | | | | | | | | | | | | | | | | | | | | | | | |
| | | | 11/30/12 | | | | 31.33 | | | | 0.49 | | | | 3.94 | | | | 4.43 | | | | 0.48 | | | | 0.43 | | | | 0.91 | | | | 34.85 | |
| | | | 11/30/13 | | | | 34.85 | | | | 0.56 | | | | 9.50 | | | | 10.06 | | | | 0.56 | | | | 1.04 | | | | 1.60 | | | | 43.31 | |
| | | | 11/30/14 | | | | 43.31 | | | | 0.68 | | | | 4.97 | | | | 5.65 | | | | 0.73 | | | | 5.47 | | | | 6.20 | | | | 42.76 | |
| | | | 11/30/15 | | | | 42.76 | | | | 1.12 | | | | (0.25 | ) | | | 0.87 | | | | 0.55 | | | | 0.02 | | | | 0.57 | | | | 43.06 | |
| | | | 11/30/16 | | | | 43.06 | | | | 0.64 | | | | 2.43 | | | | 3.07 | | | | 1.19 | | | | 2.68 | | | | 3.87 | | | | 42.26 | |
| Common Stock Class R6 | | | | | | | | | | | | | | | | | | | | | | | | | | | | | | | | |
| | | | 11/30/15 | (A) | | | 43.01 | | | | 1.07 | | | | (0.51 | ) | | | 0.56 | | | | 0.46 | | | | – | | | | 0.46 | | | | 43.11 | |
| | | | 11/30/16 | | | | 43.11 | | | | 0.70 | | | | 2.41 | | | | 3.11 | | | | 1.22 | | | | 2.68 | | | | 3.90 | | | | 42.32 | |
See notes to Financial Highlights at the end of the schedule.
| | | | | | | | | Ratios/Supplemental Data |
| | | | | | | | | | | | | | | | | | | | | | | | | | | |
Total
return
(%)* | | | Net assets at
end of
period (000
omitted) | | Ratio of expenses
to average net
assets (%) | | Ratio of expenses to average
net assets before
contractual and voluntary
expense reimbursements
(%)** | | Ratio of net
investment income
(loss) to average
net assets (%) | | Ratio of net investment
income (loss) to average net
assets before contractual and
voluntary expense
reimbursements (%)** | | Portfolio
turnover
rate (%) |
| | | | | | | | | | | | | | | | | | | | | | | | | | | |
| | 12.30 | | | $ | 221,036 | | | | 1.11 | | | | 1.11 | | | | 1.30 | | | | 1.30 | | | | 146 | |
| | 18.15 | | | | 267,627 | | | | 1.06 | | | | 1.06 | | | | 1.22 | | | | 1.22 | | | | 154 | |
| | 9.10 | | | | 278,385 | | | | 1.07 | | | | 1.07 | | | | 1.29 | | | | 1.29 | | | | 94 | |
| | 0.56 | | | | 263,276 | | | | 1.04 | | | | 1.04 | | | | 2.17 | ^ | | | 2.17 | ^ | | | 86 | |
| | 4.75 | | | | 264,910 | | | | 1.01 | | | | 1.01 | | | | 1.20 | | | | 1.20 | | | | 45 | |
| | | | | | | | | | | | | | | | | | | | | | | | | | | |
| | 11.30 | | | | 16,635 | | | | 1.94 | | | | 1.94 | | | | 0.48 | | | | 0.48 | | | | 146 | |
| | 17.19 | | | | 30,647 | | | | 1.86 | | | | 1.86 | | | | 0.42 | | | | 0.42 | | | | 154 | |
| | 8.34 | | | | 32,002 | | | | 1.82 | | | | 1.82 | | | | 0.53 | | | | 0.53 | | | | 94 | |
| | (0.23 | ) | | | 35,344 | | | | 1.82 | | | | 1.82 | | | | 1.39 | ^ | | | 1.39 | ^ | | | 86 | |
| | 3.91 | | | | 43,066 | | | | 1.78 | | | | 1.78 | | | | 0.43 | | | | 0.43 | | | | 45 | |
| | | | | | | | | | | | | | | | | | | | | | | | | | | |
| | 12.25 | | | | 5,748 | | | | 1.11 | | �� | | 1.11 | | | | 1.31 | | | | 1.31 | | | | 146 | |
| | 18.46 | | | | 20,468 | | | | 0.77 | | | | 0.77 | | | | 1.50 | | | | 1.50 | | | | 154 | |
| | 9.43 | | | | 17,062 | | | | 0.80 | | | | 0.80 | | | | 1.55 | | | | 1.55 | | | | 94 | |
| | 0.79 | | | | 12,589 | | | | 0.81 | | | | 0.81 | | | | 2.39 | ^ | | | 2.39 | ^ | | | 86 | |
| | 4.94 | | | | 14,477 | | | | 0.81 | | | | 0.81 | | | | 1.41 | | | | 1.41 | | | | 45 | |
| | | | | | | | | | | | | | | | | | | | | | | | | | | |
| | 13.99 | | | | 1,193,721 | | | | 1.09 | | | | 1.09 | | | | 1.12 | | | | 1.12 | | | | 8 | |
| | 29.53 | | | | 1,454,446 | | | | 1.03 | | | | 1.03 | | | | 1.15 | | | | 1.15 | | | | 12 | |
| | 13.30 | | | | 1,577,546 | | | | 1.00 | | | | 1.00 | | | | 1.28 | | | | 1.28 | | | | 19 | |
| | 1.79 | | | | 1,416,147 | | | | 0.99 | | | | 0.99 | | | | 2.36 | ^ | | | 2.36 | ^ | | | 11 | |
| | 7.53 | | | | 1,350,861 | | | | 1.00 | | | | 1.00 | | | | 1.32 | | | | 1.32 | | | | 8 | |
| | | | | | | | | | | | | | | | | | | | | | | | | | | |
| | 13.03 | | | | 51,460 | | | | 1.93 | | | | 1.93 | | | | 0.28 | | | | 0.28 | | | | 8 | |
| | 28.47 | | | | 78,259 | | | | 1.84 | | | | 1.84 | | | | 0.32 | | | | 0.32 | | | | 12 | |
| | 12.40 | | | | 90,784 | | | | 1.79 | | | | 1.79 | | | | 0.50 | | | | 0.50 | | | | 19 | |
| | 0.98 | | | | 89,890 | | | | 1.78 | | | | 1.78 | | | | 1.57 | ^ | | | 1.57 | ^ | | | 11 | |
| | 6.71 | | | | 83,246 | | | | 1.79 | | | | 1.79 | | | | 0.54 | | | | 0.54 | | | | 8 | |
| | | | | | | | | | | | | | | | | | | | | | | | | | | |
| | 14.38 | | | | 684,658 | | | | 0.75 | | | | 0.75 | | | | 1.47 | | | | 1.47 | | | | 8 | |
| | 29.93 | | | | 941,223 | | | | 0.72 | | | | 0.72 | | | | 1.45 | | | | 1.45 | | | | 12 | |
| | 13.61 | | | | 932,941 | | | | 0.72 | | | | 0.72 | | | | 1.55 | | | | 1.55 | | | | 19 | |
| | 2.07 | | | | 689,502 | | | | 0.71 | | | | 0.71 | | | | 2.63 | ^ | | | 2.63 | ^ | | | 11 | |
| | 7.84 | | | | 552,611 | | | | 0.72 | | | | 0.72 | | | | 1.60 | | | | 1.60 | | | | 8 | |
| | | | | | | | | | | | | | | | | | | | | | | | | | | |
| | 1.31++ | | | | 18,225 | | | | 0.61+ | | | | 1.76 | + | | | 2.65 | +^ | | | 1.50 | +^ | | | 11 | ++ |
| | 7.92 | | | | 29,927 | | | | 0.65 | | | | 0.72 | | | | 1.72 | | | | 1.65 | | | | 8 | |
| | | | | | | | | | | Income from Investment Operations | | | Less Distributions | | | | | | | | |
| | | | | | | | | | | | | | | | | | | | | | | | | | | | | | | | | | | | | | | | | |
Fund/
Share
Class | | | Fiscal
year
(period
ended) | | Net asset
value,
beginning
of period | | Net
investment
income
(loss) | | Net gains or
losses on
securities (both
realized and
unrealized) | | Total from
investment
operations | | Dividends
(from net
investment
income) | | Distributions
(from
realized
gains) | | Return of
capital | | Total
distributions | | Net asset
value, end
of period | |
| Government Securities Class A | | | | | | | | | | | | | | | | | | | | | | | | | | | | | | | | | |
| | | | 11/30/12 | | | $ | 10.72 | | | $ | 0.14 | | | $ | 0.28 | | | $ | 0.42 | | | $ | 0.31 | | | $ | – | | | $ | – | | | $ | 0.31 | | | | $10.83 | |
| | | | 11/30/13 | | | | 10.83 | | | | 0.16 | | | | (0.66 | ) | | | (0.50 | ) | | | 0.26 | | | | 0.03 | | | | – | | | | 0.29 | | | | 10.04 | |
| | | | 11/30/14 | | | | 10.04 | | | | 0.18 | | | | 0.17 | | | | 0.35 | | | | 0.26 | | | | – | | | | – | | | | 0.26 | | | | 10.13 | |
| | | | 11/30/15 | | | | 10.13 | | | | 0.18 | | | | (0.10 | ) | | | 0.08 | | | | 0.24 | | | | – | | | | – | | | | 0.24 | | | | 9.97 | |
| | | | 11/30/16 | | | | 9.97 | | | | 0.16 | | | | (0.13 | ) | | | 0.03 | | | | 0.25 | | | | – | | | | – | | | | 0.25 | | | | 9.75 | |
| Government Securities Class C | | | | | | | | | | | | | | | | | | | | | | | | | | | | | | | | | |
| | | | 11/30/12 | | | | 10.72 | | | | 0.05 | | | | 0.30 | | | | 0.35 | | | | 0.23 | | | | – | | | | – | | | | 0.23 | | | | 10.84 | |
| | | | 11/30/13 | | | | 10.84 | | | | 0.08 | | | | (0.68 | ) | | | (0.60 | ) | | | 0.17 | | | | 0.03 | | | | – | | | | 0.20 | | | | 10.04 | |
| | | | 11/30/14 | | | | 10.04 | | | | 0.10 | | | | 0.17 | | | | 0.27 | | | | 0.17 | | | | – | | | | – | | | | 0.17 | | | | 10.14 | |
| | | | 11/30/15 | | | | 10.14 | | | | 0.10 | | | | (0.11 | ) | | | (0.01 | ) | | | 0.15 | | | | – | | | | – | | | | 0.15 | | | | 9.98 | |
| | | | 11/30/16 | | | | 9.98 | | | | 0.08 | | | | (0.13 | ) | | | (0.05 | ) | | | 0.17 | | | | – | | | | – | | | | 0.17 | | | | 9.76 | |
| Government Securities Class I | | | | | | | | | | | | | | | | | | | | | | | | | | | | | | | | | |
| | | | 11/30/12 | | | | 10.72 | | | | 0.16 | | | | 0.28 | | | | 0.44 | | | | 0.33 | | | | – | | | | – | | | | 0.33 | | | | 10.83 | |
| | | | 11/30/13 | | | | 10.83 | | | | 0.19 | | | | (0.67 | ) | | | (0.48 | ) | | | 0.28 | | | | 0.03 | | | | – | | | | 0.31 | | | | 10.04 | |
| | | | 11/30/14 | | | | 10.04 | | | | 0.21 | | | | 0.16 | | | | 0.37 | | | | 0.28 | | | | – | | | | – | | | | 0.28 | | | | 10.13 | |
| | | | 11/30/15 | | | | 10.13 | | | | 0.20 | | | | (0.10 | ) | | | 0.10 | | | | 0.26 | | | | – | | | | – | | | | 0.26 | | | | 9.97 | |
| | | | 11/30/16 | | | | 9.97 | | | | 0.19 | | | | (0.14 | ) | | | 0.05 | | | | 0.27 | | | | – | | | | – | | | | 0.27 | | | | 9.75 | |
| International Equity Class A | | | | | | | | | | | | | | | | | | | | | | | | | | | | | | | | | |
| | | | 11/30/12 | | | | 15.03 | | | | 0.18 | | | | 0.98 | | | | 1.16 | | | | 0.16 | | | | – | | | | – | | | | 0.16 | | | | 16.03 | |
| | | | 11/30/13 | | | | 16.03 | | | | 0.16 | | | | 4.13 | | | | 4.29 | | | | 0.14 | | | | – | | | | – | | | | 0.14 | | | | 20.18 | |
| | | | 11/30/14 | | | | 20.18 | | | | 0.25 | | | | (0.61 | ) | | | (0.36 | ) | | | 0.21 | | | | – | | | | – | | | | 0.21 | | | | 19.61 | |
| | | | 11/30/15 | | | | 19.61 | | | | 0.13 | | | | 0.47 | | | | 0.60 | | | | 0.34 | | | | 2.95 | | | | – | | | | 3.29 | | | | 16.92 | |
| | | | 11/30/16 | | | | 16.92 | | | | 0.18 | | | | (0.97 | ) | | | (0.79 | ) | | | 0.12 | | | | 0.49 | | | | – | | | | 0.61 | | | | 15.52 | |
| International Equity Class C | | | | | | | | | | | | | | | | | | | | | | | | | | | | | | | | | |
| | | | 11/30/12 | | | | 14.59 | | | | (0.06 | ) | | | 0.96 | | | | 0.90 | | | | – | | | | – | | | | – | | | | – | | | | 15.49 | |
| | | | 11/30/13 | | | | 15.49 | | | | (0.11 | ) | | | 3.97 | | | | 3.86 | | | | 0.01 | | | | – | | | | – | | | | 0.01 | | | | 19.34 | |
| | | | 11/30/14 | | | | 19.34 | | | | (0.04 | ) | | | (0.59 | ) | | | (0.63 | ) | | | – | | | | – | | | | – | | | | – | | | | 18.71 | |
| | | | 11/30/15 | | | | 18.71 | | | | (0.10 | ) | | | 0.47 | | | | 0.37 | | | | 0.07 | | | | 2.95 | | | | – | | | | 3.02 | | | | 16.06 | |
| | | | 11/30/16 | | | | 16.06 | | | | (0.01 | ) | | | (0.90 | ) | | | (0.91 | ) | | | – | | | | 0.49 | | | | – | | | | 0.49 | | | | 14.66 | |
| International Equity Class I | | | | | | | | | | | | | | | | | | | | | | | | | | | | | | | | | |
| | | | 11/30/12 | | | | 14.99 | | | | 0.26 | | | | 0.98 | | | | 1.24 | | | | 0.24 | | | | – | | | | – | | | | 0.24 | | | | 15.99 | |
| | | | 11/30/13 | | | | 15.99 | | | | 0.26 | | | | 4.11 | | | | 4.37 | | | | 0.23 | | | | – | | | | – | | | | 0.23 | | | | 20.13 | |
| | | | 11/30/14 | | | | 20.13 | | | | 0.38 | | | | (0.65 | ) | | | (0.27 | ) | | | 0.33 | | | | – | | | | – | | | | 0.33 | | | | 19.53 | |
| | | | 11/30/15 | | | | 19.53 | | | | 0.18 | | | | 0.47 | | | | 0.65 | | | | 0.44 | | | | 2.95 | | | | – | | | | 3.39 | | | | 16.79 | |
| | | | 11/30/16 | | | | 16.79 | | | | 0.23 | | | | (0.95 | ) | | | (0.72 | ) | | | 0.18 | | | | 0.49 | | | | – | | | | 0.67 | | | | 15.40 | |
See notes to Financial Highlights at the end of the schedule.
| | | | | | | | | Ratios/Supplemental Data |
| | | | | | | | | | | | | | | | | | | | | | | | | | | |
Total
return
(%)* | | | Net assets at
end of
period (000
omitted) | | Ratio of expenses
to average net
assets (%) | | Ratio of expenses to average
net assets before
contractual and voluntary
expense reimbursements
(%)** | | Ratio of net
investment income
(loss) to average
net assets (%) | | Ratio of net investment
income (loss) to average net
assets before contractual and
voluntary expense
reimbursements (%)** | | Portfolio
turnover
rate (%) |
| | | | | | | | | | | | | | | | | | | | | | | | | | | |
| | 3.94 | | | $ | 791,599 | | | | 0.81 | | | | 0.81 | | | | 1.29 | | | | 1.29 | | | | 581 | |
| | (4.75 | ) | | | 429,416 | | | | 0.83 | | | | 0.83 | | | | 1.54 | | | | 1.54 | | | | 795 | |
| | 3.50 | | | | 268,380 | | | | 0.92 | | | | 0.92 | | | | 1.80 | | | | 1.80 | | | | 161 | |
| | 0.77 | | | | 189,623 | | | | 0.96 | | | | 0.96 | | | | 1.76 | | | | 1.76 | | | | 150 | |
| | 0.24 | | | | 154,133 | | | | 0.91 | | | | 0.91 | | | | 1.63 | | | | 1.63 | | | | 59 | |
| | | | | | | | | | | | | | | | | | | | | | | | | | | |
| | 3.26 | | | | 120,709 | | | | 1.59 | | | | 1.59 | | | | 0.50 | | | | 0.50 | | | | 581 | |
| | (5.61 | ) | | | 58,371 | | | | 1.63 | | | | 1.63 | | | | 0.73 | | | | 0.73 | | | | 795 | |
| | 2.73 | | | | 35,387 | | | | 1.73 | | | | 1.73 | | | | 0.99 | | | | 0.99 | | | | 161 | |
| | (0.07 | ) | | | 25,668 | | | | 1.74 | | | | 1.74 | | | | 0.98 | | | | 0.98 | | | | 150 | |
| | (0.56 | ) | | | 20,954 | | | | 1.72 | | | | 1.72 | | | | 0.82 | | | | 0.82 | | | | 59 | |
| | | | | | | | | | | | | | | | | | | | | | | | | | | |
| | 4.21 | | | | 145,869 | | | | 0.57 | | | | 0.57 | | | | 1.52 | | | | 1.52 | | | | 581 | |
| | (4.51 | ) | | | 70,078 | | | | 0.60 | | | | 0.60 | | | | 1.76 | | | | 1.76 | | | | 795 | |
| | 3.73 | | | | 50,493 | | | | 0.68 | | | | 0.68 | | | | 2.05 | | | | 2.05 | | | | 161 | |
| | 0.99 | | | | 29,048 | | | | 0.73 | | | | 0.73 | | | | 1.98 | | | | 1.98 | | | | 150 | |
| | 0.44 | | | | 23,562 | | | | 0.68 | | | | 0.68 | | | | 1.88 | | | | 1.88 | | | | 59 | |
| | | | | | | | | | | | | | | | | | | | | | | | | | | |
| | 7.84 | | | | 106,173 | | | | 1.49 | | | | 1.49 | | | | 1.17 | | | | 1.17 | | | | 37 | |
| | 26.93 | | | | 122,646 | | | | 1.44 | | | | 1.44 | | | | 0.91 | | | | 0.91 | | | | 52 | |
| | (1.81 | ) | | | 115,216 | | | | 1.41 | | | | 1.41 | | | | 1.22 | | | | 1.22 | | | | 50 | |
| | 4.49 | | | | 113,212 | | | | 1.41 | | | | 1.41 | | | | 0.76 | | | | 0.76 | | | | 55 | |
| | (4.81 | ) | | | 114,616 | | | | 1.36 | | | | 1.36 | | | | 1.11 | | | | 1.11 | | | | 36 | |
| | | | | | | | | | | | | | | | | | | | | | | | | | | |
| | 6.17 | | | | 2,953 | | | | 3.05 | | | | 3.05 | | | | (0.40 | ) | | | (0.40 | ) | | | 37 | |
| | 24.92 | | | | 3,634 | | | | 3.04 | | | | 3.04 | | | | (0.66 | ) | | | (0.66 | ) | | | 52 | |
| | (3.26 | ) | | | 3,581 | | | | 2.86 | | | | 2.86 | | | | (0.23 | ) | | | (0.23 | ) | | | 50 | |
| | 3.14 | | | | 4,732 | | | | 2.70 | | | | 2.70 | | | | (0.60 | ) | | | (0.60 | ) | | | 55 | |
| | (5.82 | ) | | | 5,876 | | | | 2.49 | | | | 2.49 | | | | (0.04 | ) | | | (0.04 | ) | | | 36 | |
| | | | | | | | | | | | | | | | | | | | | | | | | | | |
| | 8.45 | | | | 27,887 | | | | 0.94 | | | | 0.94 | | | | 1.72 | | | | 1.72 | | | | 37 | |
| | 27.64 | | | | 34,561 | | | | 0.89 | | | | 0.89 | | | | 1.48 | | | | 1.48 | | | | 52 | |
| | (1.39 | ) | | | 10,997 | | | | 0.92 | | | | 0.92 | | | | 1.91 | | | | 1.91 | | | | 50 | |
| | 4.89 | | | | 14,967 | | | | 1.02 | | | | 1.02 | | | | 1.05 | | | | 1.05 | | | | 55 | |
| | (4.41 | ) | | | 40,528 | | | | 0.99 | | | | 0.99 | | | | 1.45 | | | | 1.45 | | | | 36 | |
| | | | | | | | | Income from Investment Operations | | | Less Distributions | | | | |
| | | | | | | | | | | | | | | | | | | |
Fund/
Share
Class | | Fiscal year
(period
ended) | | Net asset
value,
beginning
of period | | Net
investment
income
(loss) | | Net gains or
losses on
securities (both
realized and
unrealized) | | Total from
investment
operations | | Dividends
(from net
investment
income) | | Distributions
(from
realized
gains) | | Total
distributions | | Net asset
value, end
of period |
| Low Duration Bond Class A | | | | | | | | | | | | | | | | | | | | | | | | | | | | | | | |
| | | | 11/30/12 | | | | $9.20 | | | $ | 0.06 | | | $ | (0.02 | ) | | $ | 0.04 | | | $ | 0.18 | | | $ | – | | | $ | 0.18 | | | | $9.06 | |
| | | | 11/30/13 | | | | 9.06 | | | | 0.03 | | | | (0.10 | ) | | | (0.07 | ) | | | 0.15 | | | | – | | | | 0.15 | | | | 8.84 | |
| | | | 11/30/14 | | | | 8.84 | | | | 0.12 | | | | (0.07 | ) | | | 0.05 | | | | 0.16 | | | | – | | | | 0.16 | | | | 8.73 | |
| | | | 11/30/15 | | | | 8.73 | | | | 0.17 | | | | (0.18 | ) | | | (0.01 | ) | | | 0.19 | | | | – | | | | 0.19 | | | | 8.53 | |
| | | | 11/30/16 | | | | 8.53 | | | | 0.13 | | | | (0.08 | ) | | | 0.05 | | | | 0.17 | | | | – | | | | 0.17 | | | | 8.41 | |
| Low Duration Bond Class I | | | | | | | | | | | | | | | | | | | | | | | | | | | | | | | |
| | | | 11/30/14 | (B) | | | 8.82 | | | | 0.13 | | | | (0.06 | ) | | | 0.07 | | | | 0.16 | | | | – | | | | 0.16 | | | | 8.73 | |
| | | | 11/30/15 | | | | 8.73 | | | | 0.20 | | | | (0.19 | ) | | | 0.01 | | | | 0.21 | | | | – | | | | 0.21 | | | | 8.53 | |
| | | | 11/30/16 | | | | 8.53 | | | | 0.17 | | | | (0.08 | ) | | | 0.09 | | | | 0.19 | | | | – | | | | 0.19 | | | | 8.43 | |
| Low Duration Bond Class S | | | | | | | | | | | | | | | | | | | | | | | | | | | | | | | |
| | | | 11/30/12 | | | | 9.20 | | | | 0.02 | | | | (0.01 | ) | | | 0.01 | | | | 0.14 | | | | – | | | | 0.14 | | | | 9.07 | |
| | | | 11/30/13 | | | | 9.07 | | | | 0.01 | | | | (0.12 | ) | | | (0.11 | ) | | | 0.12 | | | | – | | | | 0.12 | | | | 8.84 | |
| | | | 11/30/14 | | | | 8.84 | | | | 0.11 | | | | (0.06 | ) | | | 0.05 | | | | 0.15 | | | | – | | | | 0.15 | | | | 8.74 | |
| | | | 11/30/15 | | | | 8.74 | | | | 0.16 | | | | (0.18 | ) | | | (0.02 | ) | | | 0.18 | | | | – | | | | 0.18 | | | | 8.54 | |
| | | | 11/30/16 | | | | 8.54 | | | | 0.12 | | | | (0.07 | ) | | | 0.05 | | | | 0.16 | | | | – | | | | 0.16 | | | | 8.43 | |
| Multi-Asset Income Class A | | | | | | | | | | | | | | | | | | | | | | | | | | | | | | | |
| | | | 11/30/12 | | | | 11.74 | | | | 0.16 | | | | 0.86 | | | | 1.02 | | | | 0.21 | | | | – | | | | 0.21 | | | | 12.55 | |
| | | | 11/30/13 | | | | 12.55 | | | | 0.21 | | | | 1.12 | | | | 1.33 | | | | 0.23 | | | | – | | | | 0.23 | | | | 13.65 | |
| | | | 11/30/14 | | | | 13.65 | | | | 0.26 | | | | 0.50 | | | | 0.76 | | | | 0.28 | | | | – | | | | 0.28 | | | | 14.13 | |
| | | | 11/30/15 | | | | 14.13 | | | | 0.37 | | | | (0.39 | ) | | | (0.02 | ) | | | 0.39 | | | | 0.94 | | | | 1.33 | | | | 12.78 | |
| | | | 11/30/16 | | | | 12.78 | | | | 0.36 | | | | 0.21 | | | | 0.57 | | | | 0.37 | | | | 0.84 | | | | 1.21 | | | | 12.14 | |
| Multi-Asset Income Class C | | | | | | | | | | | | | | | | | | | | | | | | | | | | | | | |
| | | | 11/30/12 | | | | 11.70 | | | | 0.08 | | | | 0.86 | | | | 0.94 | | | | 0.14 | | | | – | | | | 0.14 | | | | 12.50 | |
| | | | 11/30/13 | | | | 12.50 | | | | 0.11 | | | | 1.13 | | | | 1.24 | | | | 0.13 | | | | – | | | | 0.13 | | | | 13.61 | |
| | | | 11/30/14 | | | | 13.61 | | | | 0.17 | | | | 0.48 | | | | 0.65 | | | | 0.18 | | | | – | | | | 0.18 | | | | 14.08 | |
| | | | 11/30/15 | | | | 14.08 | | | | 0.28 | | | | (0.40 | ) | | | (0.12 | ) | | | 0.30 | | | | 0.94 | | | | 1.24 | | | | 12.72 | |
| | | | 11/30/16 | | | | 12.72 | | | | 0.27 | | | | 0.21 | | | | 0.48 | | | | 0.28 | | | | 0.84 | | | | 1.12 | | | | 12.08 | |
| Multi-Asset Income Class I | | | | | | | | | | | | | | | | | | | | | | | | | | | | | | | |
| | | | 11/30/12 | | | | 11.71 | | | | 0.18 | | | | 0.85 | | | | 1.03 | | | | 0.22 | | | | – | | | | 0.22 | | | | 12.52 | |
| | | | 11/30/13 | | | | 12.52 | | | | 0.24 | | | | 1.13 | | | | 1.37 | | | | 0.25 | | | | – | | | | 0.25 | | | | 13.64 | |
| | | | 11/30/14 | | | | 13.64 | | | | 0.31 | | | | 0.48 | | | | 0.79 | | | | 0.32 | | | | – | | | | 0.32 | | | | 14.11 | |
| | | | 11/30/15 | | | | 14.11 | | | | 0.41 | | | | (0.39 | ) | | | 0.02 | | | | 0.43 | | | | 0.94 | | | | 1.37 | | | | 12.76 | |
| | | | 11/30/16 | | | | 12.76 | | | | 0.38 | | | | 0.22 | | | | 0.60 | | | | 0.41 | | | | 0.84 | | | | 1.25 | | | | 12.11 | |
See notes to Financial Highlights at the end of the schedule.
| | | | | | | Ratios/Supplemental Data |
| | | | | | | | | | | | | | |
Total
return
(%)* | | Net assets at
end of
period (000
omitted) | | Ratio of expenses
to average net
assets (%) | | Ratio of expenses to average
net assets before
contractual and voluntary
expense reimbursements
(%)** | | Ratio of net
investment income
(loss) to average
net assets (%) | | Ratio of net investment
income (loss) to average net
assets before contractual and
voluntary expense
reimbursements (%)** | | Portfolio
turnover
rate (%) |
| | 0.40 | | | $ | 554,187 | | | | 0.86 | | | | 0.86 | | | | 0.65 | | | | 0.65 | | | | 27 | |
| | (0.82 | ) | | | 307,959 | | | | 0.89 | | | | 0.89 | | | | 0.37 | | | | 0.37 | | | | 16 | |
| | 0.54 | | | | 187,430 | | | | 0.95 | | | | 0.95 | | | | 1.33 | | | | 1.33 | | | | 51 | |
| | (0.12 | ) | | | 117,770 | | | | 0.97 | | | | 0.97 | | | | 1.92 | | | | 1.92 | | | | 27 | |
| | 0.58 | | | | 98,167 | | | | 0.94 | | | | 0.94 | | | | 1.54 | | | | 1.54 | | | | 117 | |
| | | | | | | | | | | | | | | | | | | | | | | | | | | |
| | 0.75++ | | | | 44,267 | | | | 0.68+ | | | | 0.68 | + | | | 1.83 | + | | | 1.83 | + | | | 51 | ++ |
| | 0.14 | | | | 47,788 | | | | 0.63 | | | | 0.63 | | | | 2.29 | | | | 2.29 | | | | 27 | |
| | 1.08 | | | | 17,802 | | | | 0.60 | | | | 0.60 | | | | 2.03 | | | | 2.03 | | | | 117 | |
| | | | | | | | | | | | | | | | | | | | | | | | | | | |
| | 0.11 | | | | 1,535,093 | | | | 1.25 | | | | 1.25 | | | | 0.27 | | | | 0.27 | | | | 27 | |
| | (1.19 | ) | | | 691,645 | | | | 1.13 | | | | 1.27 | | | | 0.12 | | | | (0.03 | ) | | | 16 | |
| | 0.53 | | | | 516,503 | | | | 1.08 | | | | 1.13 | | | | 1.23 | | | | 1.19 | | | | 51 | |
| | (0.29 | ) | | | 342,516 | | | | 1.09 | | | | 1.09 | | | | 1.81 | | | | 1.81 | | | | 27 | |
| | 0.54 | | | | 235,133 | | | | 1.08 | | | | 1.08 | | | | 1.41 | | | | 1.41 | | | | 117 | |
| | | | | | | | | | | | | | | | | | | | | | | | | | | |
| | 8.78 | | | | 134,682 | | | | 1.12 | | | | 1.12 | | | | 1.33 | | | | 1.33 | | | | 315 | |
| | 10.67 | | | | 166,168 | | | | 1.03 | | | | 1.03 | | | | 1.58 | | | | 1.58 | | | | 279 | |
| | 5.61 | | | | 140,670 | | | | 1.04 | | | | 1.04 | | | | 1.89 | | | | 1.89 | | | | 166 | |
| | 0.01 | | | | 126,591 | | | | 1.04 | | | | 1.04 | | | | 2.86 | | | | 2.86 | | | | 198 | |
| | 4.99 | | | | 125,475 | | | | 1.01 | | | | 1.01 | | | | 2.97 | | | | 2.97 | | | | 228 | |
| | | | | | | | | | | | | | | | | | | | | | | | | | | |
| | 8.04 | | | | 70,037 | | | | 1.81 | | | | 1.81 | | | | 0.65 | | | | 0.65 | | | | 315 | |
| | 9.99 | | | | 97,839 | | | | 1.77 | | | | 1.77 | | | | 0.83 | | | | 0.83 | | | | 279 | |
| | 4.83 | | | | 117,373 | | | | 1.76 | | | | 1.76 | | | | 1.19 | | | | 1.19 | | | | 166 | |
| | (0.78 | ) | | | 109,108 | | | | 1.77 | | | | 1.77 | | | | 2.13 | | | | 2.13 | | | | 198 | |
| | 4.26 | | | | 105,852 | | | | 1.75 | | | | 1.75 | | | | 2.23 | | | | 2.23 | | | | 228 | |
| | | | | | | | | | | | | | | | | | | | | | | | | | | |
| | 8.87 | | | | 17,882 | | | | 1.00 | | | | 1.00 | | | | 1.47 | | | | 1.47 | | | | 315 | |
| | 11.01 | | | | 29,833 | | | | 0.80 | | | | 0.80 | | | | 1.79 | | | | 1.79 | | | | 279 | |
| | 5.86 | | | | 55,996 | | | | 0.75 | | | | 0.75 | | | | 2.24 | | | | 2.24 | | | | 166 | |
| | 0.29 | | | | 50,728 | | | | 0.77 | | | | 0.77 | | | | 3.13 | | | | 3.13 | | | | 198 | |
| | 5.22 | | | | 71,333 | | | | 0.79 | | | | 0.79 | | | | 3.14 | | | | 3.14 | | | | 228 | |
| | | | | | | | | Income from Investment Operations | | | Less Distributions | | | | |
| | | | | | | | | | | | | | | | | | | | |
Fund/
Share
Class | | Fiscal year
(period
ended) | | | Net asset
value,
beginning
of period | | Net
investment
income
(loss) | | Net gains or
losses on
securities (both
realized and
unrealized) | | Total from
investment
operations | | Dividends
(from net
investment
income) | | Distributions
(from
realized
gains) | | Total
distributions | | Net asset
value, end
of period |
| Small Company Class A | | | | | | | | | | | | | | | | | | | | | | | | | | | | | | | |
| | | | 11/30/12 | | | | $7.95 | | | $ | – | | | $ | 0.70 | | | $ | 0.70 | | | $ | – | | | $ | 0.69 | | | $ | 0.69 | | | | $7.96 | |
| | | | 11/30/13 | | | | 7.96 | | | | (0.02 | ) | | | 2.25 | | | | 2.23 | | | | – | | | | 1.67 | | | | 1.67 | | | | 8.52 | |
| | | | 11/30/14 | | | | 8.52 | | | | – | | | | 0.38 | | | | 0.38 | | | | – | | | | 1.71 | | | | 1.71 | | | | 7.19 | |
| | | | 11/30/15 | | | | 7.19 | | | | (0.03 | ) | | | 0.26 | | | | 0.23 | | | | – | | | | 1.84 | | | | 1.84 | | | | 5.58 | |
| | | | 11/30/16 | | | | 5.58 | | | | (0.02 | ) | | | 0.57 | | | | 0.55 | | | | – | | | | 0.94 | | | | 0.94 | | | | 5.19 | |
| Small Company Class C | | | | | | | | | | | | | | | | | | | | | | | | | | | | | | | |
| | | | 11/30/12 | | | | 7.12 | | | | (0.05 | ) | | | 0.61 | | | | 0.56 | | | | – | | | | 0.69 | | | | 0.69 | | | | 6.99 | |
| | | | 11/30/13 | | | | 6.99 | | | | (0.06 | ) | | | 1.91 | | | | 1.85 | | | | – | | | | 1.67 | | | | 1.67 | | | | 7.17 | |
| | | | 11/30/14 | | | | 7.17 | | | | (0.04 | ) | | | 0.30 | | | | 0.26 | | | | – | | | | 1.71 | | | | 1.71 | | | | 5.72 | |
| | | | 11/30/15 | | | | 5.72 | | | | (0.05 | ) | | | 0.18 | | | | 0.13 | | | | – | | | | 1.84 | | | | 1.84 | | | | 4.01 | |
| | | | 11/30/16 | | | | 4.01 | | | | (0.03 | ) | | | 0.35 | | | | 0.32 | | | | – | | | | 0.94 | | | | 0.94 | | | | 3.39 | |
| Small Company Class I | | | | | | | | | | | | | | | | | | | | | | | | | | | | | | | |
| | | | 11/30/12 | | | | 8.11 | | | | 0.02 | | | | 0.72 | | | | 0.74 | | | | – | | | | 0.69 | | | | 0.69 | | | | 8.16 | |
| | | | 11/30/13 | | | | 8.16 | | | | 0.01 | | | | 2.32 | | | | 2.33 | | | | 0.04 | | | | 1.67 | | | | 1.71 | | | | 8.78 | |
| | | | 11/30/14 | | | | 8.78 | | | | 0.03 | | | | 0.38 | | | | 0.41 | | | | – | | | | 1.71 | | | | 1.71 | | | | 7.48 | |
| | | | 11/30/15 | | | | 7.48 | | | | (0.01 | ) | | | 0.28 | | | | 0.27 | | | | 0.02 | | | | 1.84 | | | | 1.86 | | | | 5.89 | |
| | | | 11/30/16 | | | | 5.89 | | | | – | | | | 0.61 | | | | 0.61 | | | | – | | | | 0.94 | | | | 0.94 | | | | 5.56 | |
| Small Company Class R6 | | | | | | | | | | | | | | | | | | | | | | | | | | | | | | | |
| | | | 11/30/15 | (A) | | | 5.44 | | | | (0.01 | ) | | | 0.17 | | | | 0.16 | | | | – | | | | – | | | | – | | | | 5.60 | |
| | | | 11/30/16 | | | | 5.60 | | | | 0.01 | | | | 0.57 | | | | 0.58 | | | | – | | | | 0.94 | | | | 0.94 | | | | 5.24 | |
| Sustainable Core Opportunities Class A | | | | | | | | | | | | | | | | | | | | | | | | | | | | | | |
| | | | 11/30/12 | | | | 12.57 | | | | 0.09 | | | | 1.66 | | | | 1.75 | | | | 0.06 | | | | – | | | | 0.06 | | | | 14.26 | |
| | | | 11/30/13 | | | | 14.26 | | | | 0.11 | | | | 4.25 | | | | 4.36 | | | | 0.11 | | | | – | | | | 0.11 | | | | 18.51 | |
| | | | 11/30/14 | | | | 18.51 | | | | 0.16 | | | | 2.27 | | | | 2.43 | | | | 0.11 | | | | – | | | | 0.11 | | | | 20.83 | |
| | | | 11/30/15 | | | | 20.83 | | | | 0.38 | | | | (0.41 | ) | | | (0.03 | ) | | | 0.17 | | | | – | | | | 0.17 | | | | 20.63 | |
| | | | 11/30/16 | | | | 20.63 | | | | 0.17 | | | | 1.01 | | | | 1.18 | | | | 0.41 | | | | 0.20 | | | | 0.61 | | | | 21.20 | |
| Sustainable Core Opportunities Class I | | | | | | | | | | | | | | | | | | | | | | | | | | | | | | |
| | | | 11/30/12 | | | | 12.62 | | | | 0.13 | | | | 1.67 | | | | 1.80 | | | | 0.11 | | | | – | | | | 0.11 | | | | 14.31 | |
| | | | 11/30/13 | | | | 14.31 | | | | 0.15 | | | | 4.25 | | | | 4.40 | | | | 0.14 | | | | – | | | | 0.14 | | | | 18.57 | |
| | | | 11/30/14 | | | | 18.57 | | | | 0.22 | | | | 2.27 | | | | 2.49 | | | | 0.13 | | | | – | | | | 0.13 | | | | 20.93 | |
| | | | 11/30/15 | | | | 20.93 | | | | 0.44 | | | | (0.42 | ) | | | 0.02 | | | | 0.22 | | | | – | | | | 0.22 | | | | 20.73 | |
| | | | 11/30/16 | | | | 20.73 | | | | 0.23 | | | | 1.01 | | | | 1.24 | | | | 0.47 | | | | 0.20 | | | | 0.67 | | | | 21.30 | |
See notes to Financial Highlights at the end of the schedule.
| | | | | | | Ratios/Supplemental Data |
| | | | | | | | | | | | | |
Total
return
(%)* | | Net assets at
end of
period (000
omitted) | | Ratio of expenses
to average net
assets (%) | | Ratio of expenses to average
net assets before
contractual and voluntary
expense reimbursements
(%)** | | Ratio of net
investment income
(loss) to average
net assets (%) | | Ratio of net investment
income (loss) to average net
assets before contractual and
voluntary expense
reimbursements (%)** | | Portfolio
turnover
rate (%) |
| | | | | | | | | | | | | | | | | | | | | | | | | | | |
| | 9.63 | | | $ | 815,661 | | | | 1.14 | | | | 1.14 | | | | (0.05 | ) | | | (0.05 | ) | | | 33 | |
| | 34.79 | | | | 808,145 | | | | 1.21 | | | | 1.21 | | | | (0.24 | ) | | | (0.24 | ) | | | 23 | |
| | 5.40 | | | | 682,481 | | | | 1.20 | | | | 1.20 | | | | 0.06 | | | | 0.06 | | | | 59 | |
| | 5.32 | | | | 596,864 | | | | 1.25 | | | | 1.25 | | | | (0.61 | ) | | | (0.61 | ) | | | 70 | |
| | 12.52 | | | | 685,807 | | | | 1.22 | | | | 1.22 | | | | (0.38 | ) | | | (0.38 | ) | | | 61 | |
| | | | | | | | | | | | | | | | | | | | | | | | | | | |
| | 8.70 | | | | 119,594 | | | | 1.89 | | | | 1.89 | | | | (0.79 | ) | | | (0.79 | ) | | | 33 | |
| | 33.94 | | | | 128,521 | | | | 1.93 | | | | 1.93 | | | | (0.97 | ) | | | (0.97 | ) | | | 23 | |
| | 4.55 | | | | 115,642 | | | | 1.91 | | | | 1.91 | | | | (0.66 | ) | | | (0.66 | ) | | | 59 | |
| | 4.72 | | | | 108,192 | | | | 1.94 | | | | 1.94 | | | | (1.30 | ) | | | (1.30 | ) | | | 70 | |
| | 11.48 | | | | 110,842 | | | | 1.95 | | | | 1.95 | | | | (1.10 | ) | | | (1.10 | ) | | | 61 | |
| | | | | | | | | | | | | | | | | | | | | | | | | | | |
| | 9.96 | | | | 523,540 | | | | 0.79 | | | | 0.79 | | | | 0.31 | | | | 0.31 | | | | 33 | |
| | 35.40 | | | | 385,692 | | | | 0.81 | | | | 0.81 | | | | 0.17 | | | | 0.17 | | | | 23 | |
| | 5.62 | | | | 247,639 | | | | 0.85 | | | | 0.85 | | | | 0.46 | | | | 0.46 | | | | 59 | |
| | 5.71 | | | | 220,543 | | | | 0.87 | | | | 0.87 | | | | (0.24 | ) | | | (0.24 | ) | | | 70 | |
| | 12.95 | | | | 257,483 | | | | 0.89 | | | | 0.89 | | | | (0.04 | ) | | | (0.04 | ) | | | 61 | |
| | | | | | | | | | | | | | | | | | | | | | | | | | | |
| | 2.94++ | | | | 599 | | | | 0.73+ | | | | 2.96 | + | | | (0.18 | )+ | | | (2.41 | )+ | | | 70 | ++ |
| | 13.07 | | | | 13,000 | | | | 0.73 | | | | 0.99 | | | | 0.16 | | | | (0.10 | ) | | | 61 | |
| | | | | | | | | | | | | | | | | | | | | | | | | | | |
| | 14.00 | | | | 182,345 | | | | 1.32 | | | | 1.32 | | | | 0.66 | | | | 0.66 | | | | 4 | |
| | 30.74 | | | | 224,489 | | | | 1.26 | | | | 1.26 | | | | 0.67 | | | | 0.67 | | | | 14 | |
| | 13.18 | | | | 239,707 | | | | 1.24 | | | | 1.24 | | | | 0.85 | | | | 0.85 | | | | 20 | |
| | (0.13)# | | | | 224,862 | | | | 1.21 | | | | 1.21 | | | | 1.85 | ^ | | | 1.85 | ^ | | | 20 | |
| | 5.92 | | | | 340,815 | | | | 1.18 | | | | 1.18 | | | | 0.86 | | | | 0.86 | | | | 33 | |
| | | | | | | | | | | | | | | | | | | | | | | | | | | |
| | 14.38 | | | | 8,194 | | | | 1.04 | | | | 1.04 | | | | 0.94 | | | | 0.94 | | | | 4 | |
| | 31.05 | | | | 12,418 | | | | 1.00 | | | | 1.00 | | | | 0.93 | | | | 0.93 | | | | 14 | |
| | 13.50 | | | | 15,275 | | | | 0.97 | | | | 0.97 | | | | 1.13 | | | | 1.13 | | | | 20 | |
| | 0.12# | | | | 14,926 | | | | 0.93 | | | | 0.93 | | | | 2.13 | ^ | | | 2.13 | ^ | | | 20 | |
| | 6.20 | | | | 21,777 | | | | 0.91 | | | | 0.91 | | | | 1.14 | | | | 1.14 | | | | 33 | |
| | | | | Income from Investment Operations | | Less Distributions | | | | |
| | | | | | | | | | | | | | | | | | | | | | |
Fund/
Share
Class | | Fiscal year
(period
ended) | | Net asset
value,
beginning
of period | | Net
investment
income
(loss) | | Net gains or
losses on
securities (both
realized and
unrealized) | | Total from
investment
operations | | Dividends
(from net
investment
income) | | Distributions
(from
realized
gains) | | Return of
Capital | | Total
distributions | | Net asset
value, end
of period | |
| Total Return Bond Class A | | | | | | | | | | | | | | | | | | | | | | | | | | | | |
| | | 11/30/12 | | | $10.14 | | | $ | 0.21 | | | $ | 1.01 | | | $ | 1.22 | | | $ | 0.25 | | | $ | 0.18 | | | $ | – | | | $ | 0.43 | | | | $10.93 | |
| | | 11/30/13 | | | 10.93 | | | | 0.25 | | | | – | | | | 0.25 | | | | 0.28 | | | | 0.25 | | | | – | | | | 0.53 | | | | 10.65 | |
| | | 11/30/14 | | | 10.65 | | | | 0.24 | | | | 0.15 | | | | 0.39 | | | | 0.27 | | | | 0.13 | | | | – | | | | 0.40 | | | | 10.64 | |
| | | 11/30/15 | | | 10.64 | | | | 0.19 | | | | (0.28 | ) | | | (0.09 | ) | | | 0.21 | | | | – | | | | – | | | | 0.21 | | | | 10.34 | |
| | | 11/30/16 | | | 10.34 | | | | 0.18 | | | | (0.05 | ) | | | 0.13 | | | | 0.23 | | | | – | | | | – | | | | 0.23 | | | | 10.24 | |
| Total Return Bond Class C | | | | | | | | | | | | | | | | | | | | | | | | | | | | |
| | | 11/30/12 | | | 10.13 | | | | 0.17 | | | | 1.02 | | | | 1.19 | | | | 0.23 | | | | 0.18 | | | | – | | | | 0.41 | | | | 10.91 | |
| | | 11/30/13 | | | 10.91 | | | | 0.20 | | | | (0.01 | ) | | | 0.19 | | | | 0.22 | | | | 0.25 | | | | – | | | | 0.47 | | | | 10.63 | |
| | | 11/30/14 | | | 10.63 | | | | 0.18 | | | | 0.14 | | | | 0.32 | | | | 0.21 | | | | 0.13 | | | | – | | | | 0.34 | | | | 10.61 | |
| | | 11/30/15 | | | 10.61 | | | | 0.10 | | | | (0.28 | ) | | | (0.18 | ) | | | 0.12 | | | | – | | | | – | | | | 0.12 | | | | 10.31 | |
| | | 11/30/16 | | | 10.31 | | | | 0.10 | | | | (0.06 | ) | | | 0.04 | | | | 0.14 | | | | – | | | | – | | | | 0.14 | | | | 10.21 | |
| Total Return Bond Class I | | | | | | | | | | | | | | | | | | | | | | | | | | | | |
| | | 11/30/12 | | | 10.14 | | | | 0.23 | | | | 1.02 | | | | 1.25 | | | | 0.27 | | | | 0.18 | | | | – | | | | 0.45 | | | | 10.94 | |
| | | 11/30/13 | | | 10.94 | | | | 0.29 | | | | (0.03 | ) | | | 0.26 | | | | 0.29 | | | | 0.25 | | | | – | | | | 0.54 | | | | 10.66 | |
| | | 11/30/14 | | | 10.66 | | | | 0.25 | | | | 0.15 | | | | 0.40 | | | | 0.28 | | | | 0.13 | | | | – | | | | 0.41 | | | | 10.65 | |
| | | 11/30/15 | | | 10.65 | | | | 0.20 | | | | (0.27 | ) | | | (0.07 | ) | | | 0.23 | | | | – | | | | – | | | | 0.23 | | | | 10.35 | |
| | | 11/30/16 | | | 10.35 | | | | 0.20 | | | | (0.05 | ) | | | 0.15 | | | | 0.25 | | | | – | | | | – | | | | 0.25 | | | | 10.25 | |
| Total Return Bond Class R3 | | | | | | | | | | | | | | | | | | | | | | | | | | | | |
| | | 11/30/15(A) | | | 10.53 | | | | 0.18 | | | | (0.18 | ) | | | – | | | | 0.19 | | | | – | | | | – | | | | 0.19 | | | | 10.34 | |
| | | 11/30/16 | | | 10.34 | | | | 0.18 | | | | (0.06 | ) | | | 0.12 | | | | 0.23 | | | | – | | | | – | | | | 0.23 | | | | 10.23 | |
| Total Return Bond Class R6 | | | | | | | | | | | | | | | | | | | | | | | | | | | | |
| | | 11/30/15(A) | | | 10.53 | | | | 0.20 | | | | (0.17 | ) | | | 0.03 | | | | 0.21 | | | | – | | | | – | | | | 0.21 | | | | 10.35 | |
| | | 11/30/16 | | | 10.35 | | | | 0.20 | | | | (0.06 | ) | | | 0.14 | | | | 0.25 | | | | – | | | | – | | | | 0.25 | | | | 10.24 | |
| Unconstrained Bond Class A | | | | | | | | | | | | | | | | | | | | | | | | | | | | |
| | | 11/30/15(A) | | | 10.00 | | | | 0.11 | | | | (0.23 | ) | | | (0.12 | ) | | | 0.12 | | | | – | | | | – | | | | 0.12 | | | | 9.76 | |
| | | 11/30/16 | | | 9.76 | | | | 0.10 | | | | 0.08 | | | | 0.18 | | | | 0.14 | | | | 0.02 | | | | – | | | | 0.16 | | | | 9.78 | |
| Unconstrained Bond Class C | | | | | | | | | | | | | | | | | | | | | | | | | | | | |
| | | 11/30/15(A) | | | 10.00 | | | | 0.06 | | | | (0.26 | ) | | | (0.20 | ) | | | 0.08 | | | | – | | | | – | | | | 0.08 | | | | 9.72 | |
| | | 11/30/16 | | | 9.72 | | | | 0.04 | | | | 0.08 | | | | 0.12 | | | | 0.07 | | | | 0.02 | | | | – | | | | 0.09 | | | | 9.75 | |
| Unconstrained Bond Class I | | | | | | | | | | | | | | | | | | | | | | | | | | | | |
| | | 11/30/15(A) | | | 10.00 | | | | 0.13 | | | | (0.24 | ) | | | (0.11 | ) | | | 0.13 | | | | – | | | | – | | | | 0.13 | | | | 9.76 | |
| | | 11/30/16 | | | 9.76 | | | | 0.13 | | | | 0.08 | | | | 0.21 | | | | 0.15 | | | | 0.02 | | | | – | | | | 0.17 | | | | 9.80 | |
Per share net investment (income) loss for each Fund is calculated utilizing the average shares method unless otherwise noted.
Amounts designated as “–” are either zero or represent less than $0.005 or $(0.005).
* Total return is calculated assuming an initial investment made at the net asset value at the beginning of the period, reinvestment of all distributions at net asset value during the period, and a redemption on the last day of the period. Neither an initial sales charge nor a CDSC is reflected in the calculation of total return. Total returns would have been lower in applicable years where the Advisor had not waived a portion of its fee.
**Expense reductions are comprised of the contractual and voluntary expense reimbursements as described in Note (3), if applicable.
+ Annualized.
++ Not Annualized.
(A) Commenced operations December 23, 2014.
(B) Commenced operations January 31, 2014.
| | | | | | | | | Ratios/Supplemental Data |
| | | | | | | | | | | | | |
Total
return
(%)* | | Net assets at
end of
period (000
omitted) | | Ratio of expenses
to average net
assets (%) | | Ratio of expenses to average
net assets before
contractual and voluntary
expense reimbursements
(%)** | | Ratio of net
investment income
(loss) to average
net assets (%) | | Ratio of net investment
income (loss) to average net
assets before contractual and
voluntary expense
reimbursements (%)** | | Portfolio
turnover
rate (%) |
| | 12.34 | | | $ | 111,263 | | | | 0.94 | | | | 0.96 | | | | 2.00 | | | | 1.98 | | | | 915 | |
| | 2.33 | | | | 102,138 | | | | 0.89 | | | | 0.95 | | | | 2.38 | | | | 2.32 | | | | 499 | |
| | 3.66 | | | | 203,871 | | | | 0.89 | | | | 0.93 | | | | 2.25 | | | | 2.21 | | | | 432 | |
| | (0.87) | | | | 315,820 | | | | 0.89 | | | | 0.94 | | | | 1.76 | | | | 1.71 | | | | 441 | |
| | 1.26 | | | | 92,331 | | | | 0.89 | | | | 1.07 | | | | 1.79 | | | | 1.61 | | | | 240 | |
| | | | | | | | | | | | | | | | | | | | | | | | | | | |
| | 12.02 | | | | 29,323 | | | | 1.35 | | | | 1.37 | | | | 1.62 | | | | 1.60 | | | | 915 | |
| | 1.79 | | | | 26,222 | | | | 1.42 | | | | 1.48 | | | | 1.88 | | | | 1.81 | | | | 499 | |
| | 3.01 | | | | 47,015 | | | | 1.49@ | | | | 1.53 | @ | | | 1.68 | | | | 1.64 | | | | 432 | |
| | (1.69) | | | | 42,316 | | | | 1.70 | | | | 1.75 | | | | 0.93 | | | | 0.88 | | | | 441 | |
| | 0.40 | | | | 30,866 | | | | 1.73 | | | | 1.73 | | | | 0.94 | | | | 0.94 | | | | 240 | |
| | | | | | | | | | | | | | | | | | | | | | | | | | | |
| | 12.59 | | | | 22,792 | | | | 0.77 | | | | 0.79 | | | | 2.20 | | | | 2.19 | | | | 915 | |
| | 2.46 | | | | 61,268 | | | | 0.73 | | | | 0.79 | | | | 2.69 | | | | 2.63 | | | | 499 | |
| | 3.79 | | | | 485,459 | | | | 0.74 | | | | 0.78 | | | | 2.31 | | | | 2.27 | | | | 432 | |
| | (0.70) | | | | 472,782 | | | | 0.69 | | | | 0.74 | | | | 1.94 | | | | 1.89 | | | | 441 | |
| | 1.40 | | | | 280,081 | | | | 0.74 | | | | 0.74 | | | | 1.93 | | | | 1.93 | | | | 240 | |
| | | | | | | | | | | | | | | | | | | | | | | | | | | |
| | 0.00++ | | | | 596 | | | | 0.89+@ | | | | 2.87 | +@ | | | 1.86 | + | | | (0.12 | )+ | | | 441 | ++ |
| | 1.16 | | | | 603 | | | | 0.89@ | | | | 2.91 | @ | | | 1.77 | | | | (0.25 | ) | | | 240 | |
| | | | | | | | | | | | | | | | | | | | | | | | | | | |
| | 0.26++ | | | | 596 | | | | 0.69+ | | | | 2.87 | + | | | 2.06 | + | | | (0.12 | )+ | | | 441 | ++ |
| | 1.36 | | | | 605 | | | | 0.69 | | | | 2.90 | | | | 1.97 | | | | (0.24 | ) | | | 240 | |
| | | | | | | | | | | | | | | | | | | | | | | | | | | |
| | (1.23)++ | | | | 5,008 | | | | 1.16+@ | | | | 1.16 | +@ | | | 1.19 | + | | | 1.19 | + | | | 1153 | ++ |
| | 1.81 | | | | 5,131 | | | | 1.28@ | | | | 1.28 | @ | �� | | 1.07 | | | | 1.07 | | | | 472 | |
| | | | | | | | | | | | | | | | | | | | | | | | | | | |
| | (1.99)++ | | | | 1,649 | | | | 1.88+@ | | | | 1.88 | +@ | | | 0.64 | + | | | 0.64 | + | | | 1153 | ++ |
| | 1.24 | | | | 1,648 | | | | 1.91@ | | | | 1.91 | @ | | | 0.43 | | | | 0.43 | | | | 472 | |
| | | | | | | | | | | | | | | | | | | | | | | | | | | |
| | (1.14)++ | | | | 18,883 | | | | 1.00+ | | | | 1.00 | + | | | 1.35 | + | | | 1.35 | + | | | 1153 | ++ |
| | 2.16 | | | | 19,716 | | | | 1.04 | | | | 1.04 | | | | 1.30 | | | | 1.30 | | | | 472 | |
# Includes the impact of proceeds received and credited to the Funds resulting from class action settlements, which enhanced the performance for the Sentinel Sustainable Core Opportunities Fund Class A by 0.05% and Sentinel Sustainable Core Opportunities Fund Class I by 0.04% for the fiscal year ended November 30, 2015.
^ Includes the impact of special dividends resulting from an acquisition of Covidien plc by Medtronic, Inc. on January 26, 2015 through the formation of a new holding company, Medtronic plc, incorporated in Ireland. These special dividends enhanced the ratios of net investment income for the Sentinel Balanced Fund Class A by 0.86%, Sentinel Balanced Fund Class C by 0.86%, Sentinel Balanced Fund Class I by 0.86%, the Sentinel Common Stock Fund Class A by 1.22%, Sentinel Common Stock Fund Class C by 1.22%, Sentinel Common Stock Fund Class I by 1.22%, Sentinel Common Stock Fund Class R6 by 1.30%, Sentinel Sustainable Core Opportunities Fund Class A by 1.07% and Sentinel Sustainable Core Opportunities Fund Class I by 1.07% for the fiscal year ended November 30, 2015.
@ Includes the impact of the shares owned by NLV Financial Corporation and its affiliates, who do not get charged a distribution fee, which decreases the ratio by 0.20% for the Sentinel Total Return Bond Fund Class C for the fiscal year ended November 30, 2014; 0.30% for the ratio of expenses to average net assets on Sentinel Total Return Bond Fund Class R3, 0.50% for the ratio of expenses to average net assets before contractual and voluntary expense reimbursements on Sentinel Total Return Bond Fund Class R3, 0.20% for the Sentinel Unconstrained Bond Fund Class A, 0.18% for the ratio of expenses to average net assets on Sentinel Unconstrained Bond Fund Class C and 0.92% for the ratio of expenses to average net assets before contractual and voluntary expense reimbursements on Sentinel Unconstrained Bond Fund Class C for the fiscal period from December 23, 2014 to November 30, 2015; 0.30% for the ratio of expenses to average net assets on Sentinel Total Return Bond Fund Class R3, 0.50% for the ratio of expenses to average net assets before contractual and voluntary expense reimbursements on Sentinel Total Return Bond Fund Class R3, 0.20% for the Sentinel Unconstrained Bond Fund Class A, 0.15% for the ratio of expenses to average net assets on Sentinel Unconstrained Bond Fund Class C and 0.88% for the ratio of expenses to average net assets before contractual and voluntary expense reimbursements on Sentinel Unconstrained Bond Fund Class C for the fiscal year ended November 30, 2016.
Appendix A –
Merrill Lynch
Effective April 10, 2017, shareholders purchasing Fund shares through a Merrill Lynch platform or account will be eligible only for the following load waivers (front-end sales charge waivers and contingent deferred, or back-end, sales charge waivers) and discounts, which may differ from those disclosed elsewhere in this Fund’s prospectus or SAI.
Front-end Sales Load Waivers on Class A Shares available at Merrill Lynch
| | • | Employer-sponsored retirement, deferred compensation and employee benefit plans (including health savings accounts) and trusts used to fund those plans, provided that the shares are not held in a commission-based brokerage account and shares are held for the benefit of the plan |
| | | |
| | • | Shares purchased by or through a 529 Plan |
| | | |
| | • | Shares purchased through a Merrill Lynch affiliated investment advisory program |
| | | |
| | • | Shares purchased by third party investment advisors on behalf of their advisory clients through Merrill Lynch’s platform |
| | | |
| | • | [Shares of funds purchased through the Merrill Edge Self-Directed platform] (if applicable) |
| | | |
| | • | Shares purchased through reinvestment of capital gains distributions and dividend reinvestment when purchasing shares of the same fund (but not any other fund within the fund family) |
| | | |
| | • | Shares exchanged from Class C (i.e. level-load) shares of the same fund in the month of or following the 10-year anniversary of the purchase date |
| | | |
| | • | Employees and registered representatives of Merrill Lynch or its affiliates and their family members |
| | | |
| | • | Directors or Trustees of the Fund, and employees of the Fund’s investment adviser or any of its affiliates, as described in the this prospectus |
| | | |
| | • | Shares purchased from the proceeds of redemptions within the same fund family, provided (1) the repurchase occurs within 90 days following the redemption, (2) the redemption and purchase occur in the same account, and (3)redeemed shares were subject to a front-end or deferred sales load (known as Rights of Reinstatement) |
CDSC Waivers on A, B and C Shares available at Merrill Lynch
| | • | Death or disability of the shareholder |
| | | |
| | • | Shares sold as part of a systematic withdrawal plan as described in the Fund’s prospectus |
| | | |
| | • | Return of excess contributions from an IRA Account |
| | | |
| | • | Shares sold as part of a required minimum distribution for IRA and retirement accounts due to the shareholder reaching age 70½ |
| | | |
| | • | Shares sold to pay Merrill Lynch fees but only if the transaction is initiated by Merrill Lynch |
| | • | Shares acquired through a right of reinstatement |
| | | |
| • Shares held in retirement brokerage accounts, that are exchanged for a lower cost share class due to transfer to certain fee based accounts or platforms (applicable to A and C shares only) |
Front-end load Discounts Available at Merrill Lynch: Breakpoints, Rights of Accumulation & Letters of Intent
| • | | Breakpoints as described in this prospectus. |
| | | |
| | • | Rights of Accumulation (ROA) which entitle shareholders to breakpoint discounts will be automatically calculated based on the aggregated holding of fund family assets held by accounts within the purchaser’s household at Merrill Lynch. Eligible fund family assets not held at Merrill Lynch may be included in the ROA calculation only if the shareholder notifies his or her financial advisor about such assets |
| | | |
| | • | Letters of Intent (LOI) which allow for breakpoint discounts based on anticipated purchases within a fund family, through Merrill Lynch, over a 13-month period of time] (if applicable) |
To Get More Information
Shareholder Reports
Additional information about the Funds’ investments is or will be available in the Funds’ annual and semi-annual reports to shareholders. In the Funds’ annual report you will find a discussion of the market conditions and investment strategies that significantly affected each Fund’s performance during its last fiscal year. You may obtain copies of these reports at no cost by calling 1-800-282-FUND (3863).
The Funds will send you one copy of each shareholder report and certain other mailings, regardless of the number of Fund accounts you have. To receive separate shareholder reports for each account at no cost, call 1 800-282-FUND (3863).
Statement of Additional Information
The Funds’ Statement of Additional Information contains additional information about the Funds, including a description of the Funds’ policies and procedures with respect to the disclosure of the Funds’ portfolio securities, and is incorporated by reference (legally considered to be part of this Prospectus). You may request a free copy by writing the Funds at the address shown below or by calling 1-800-282-FUND (3863).
Please contact your registered representative or the Funds at 1-800-282-FUND (3863) if you have any questions or would like additional information about the Funds.
The Funds’ Statement of Additional Information and its annual and semi-annual reports are also available, free of charge, at the Funds’ website at www.sentinelinvestments.com or by calling the Funds at 1-800-282-FUND (3863). Information about the Funds (including the Statement of Additional Information) can also be reviewed and copied at the SEC’s Public Reference Room at 100 F Street, N.E., Washington, D.C. 20549-0102. Call 1-202-551-8090 for information on the operation of the public reference room. This information is also accessible via the Edgar database on the SEC’s internet site at www.sec.gov and copies may be obtained upon payment of a duplicating fee, by electronic request at the following E-mail address: publicinfo@sec.gov, or by writing the SEC’s Public Reference Section, Washington, D.C. 20549-1520.
You should rely only on the information contained in this Prospectus. No one is authorized to provide you with information that is different.
| | Mail and correspondence should be addressed to: |
| | |
| | Sentinel Group Funds, Inc. |
| Sentinel Group Funds, Inc. | c/o Sentinel Investments |
| One National Life Drive | P.O. Box 55929 |
| Montpelier, VT 05604 | Boston, MA 02205-5929 |
| | |
| Investment Adviser | Counsel |
| Sentinel Asset Management, Inc. | Sidley Austin LLP |
| One National Life Drive | 787 Seventh Avenue |
| Montpelier, VT 05604 | New York, NY 10019 |
| | |
| Principal Underwriter | Independent Registered |
| Sentinel Financial Services Company | Public Accounting Firm |
| One National Life Drive | PricewaterhouseCoopers LLP |
| Montpelier, VT 05604 | 300 Madison Avenue |
| | New York, NY 10017 |
| | |
| Transfer and Dividend Disbursing Agent | Custodian |
| Boston Financial Data Services, Inc. | State Street Bank & Trust Company |
| 30 Dan Road | 801 Pennsylvania Avenue |
| Canton, MA 02021-2809 | Kansas City, MO 64105 |
| | |
| Administrator | |
| Sentinel Administrative Services, Inc. | |
| One National Life Drive | |
Montpelier, VT 05604
800-282-FUND (3863)
Sentinel Investments in the unifying brand name for Sentinel Financial Services Company, Sentinel Asset Management, Inc. and Sentinel Administrative Services, Inc. Sentinel Funds are distributed by Sentinel Financial Services Company.
Investment Company Act File No. 811- 00214
STATEMENT OF ADDITIONAL INFORMATION
March 30, 2017
SENTINEL GROUP FUNDS, INC.
One National Life Drive
Montpelier, Vermont 05604
(800) 282-FUND (3863)
| | Class A | Class C | Class S | Class I | Class R3 | Class R6 |
| Sentinel Balanced Fund | SEBLX | SBACX | | SIBLX | | |
| Sentinel Common Stock Fund | SENCX | SCSCX | | SICWX | | SCRLX |
| Sentinel Government Securities Fund | SEGSX | SCGGX | | SIBWX | | |
| Sentinel International Equity Fund | SWRLX | SWFCX | | SIIEX | | |
| Sentinel Low Duration Bond Fund | SSIGX | | SSSGX | SSBDX | | |
| Sentinel Multi-Asset Income Fund | SECMX | SMKCX | | SCSIX | | |
| Sentinel Small Company Fund | SAGWX | SSCOX | | SIGWX | | SSRRX |
| Sentinel Sustainable Core Opportunities Fund | MYPVX | | | CVALX | | |
| Sentinel Total Return Bond Fund | SATRX | SCTRX | | SITRX | SBRRX | STRRX |
| Sentinel Unconstrained Bond Fund | SUBAX | SUBCX | | SUBIX | | |
Sentinel Group Funds, Inc. (the “Company”) is a managed, open-end investment company, which continuously offers its shares to investors. The Company consists of several separate and distinct funds. This Statement of Additional Information pertains to the funds of the Company listed above (referred to hereinafter collectively as the “Funds”, and individually as a “Fund”). Each Fund is classified as diversified under the Investment Company Act of 1940, as amended (“the 1940 Act”). The Funds have different investment objectives and risk characteristics.
Sentinel Asset Management, Inc. (the “Adviser”) acts as the investment adviser to the Funds. Shares of the Funds are distributed by Sentinel Financial Services Company (“SFSC”). Both the Adviser and SFSC are indirect wholly owned subsidiaries of National Life Holding Company.
This Statement of Additional Information is not a Prospectus and should be read in conjunction with the Prospectus dated March 30, 2017, as supplemented from time to time (the “Prospectus”). The Prospectus, which has been filed with the Securities and Exchange Commission (the “SEC”), can be obtained upon request and without charge by calling 1-800-282-FUND (3863), by visiting www.sentinelinvestments.com or by writing to the Funds at PO Box 55929, Boston, MA 02205-5929. The financial statements of the Funds that are included in the Annual Report of the Funds dated November 30, 2016 (“Annual Report”) have been incorporated by reference into this Statement of Additional Information. The Annual Report can be obtained in the same way as the Prospectus. This Statement of Additional Information has been incorporated by reference into the Funds’ Prospectus and the Funds’ Prospectus is incorporated into this Statement of Additional Information.
TABLE OF CONTENTS
THE FUNDS
Originally incorporated in the State of Delaware on December 5, 1933 as Group Securities, Inc., the Company became a Maryland corporation on February 28, 1973. On November 30, 1973, the Company’s name was changed to USLIFE Funds, Inc. On September 30, 1976, the Company’s name was changed to Sentinel Group Funds, Inc. The Company is registered under the 1940 Act as an open end, investment company, and is comprised of ten investment portfolios, or funds.
On July 1, 2014, the Conservative Strategies Fund changed its name to the Multi-Asset Income Fund.
On October 21, 2014, the Capital Growth and Growth Leaders Funds reorganized into the Common Stock Fund, and soon thereafter, were terminated as a series of the Company.
On December 23, 2014, the Unconstrained Bond Fund was first offered as a new series of the Company.
On March 30, 2016, the Mid Cap Fund reorganized into the Small Company Fund, and the Sustainable Mid Cap Opportunities Fund reorganized into the Sustainable Core Opportunities Fund. Each of the Mid Cap Fund and the Sustainable Mid Cap Opportunities Fund were terminated as a series of the Company following the respective reorganization.
FUNDAMENTAL INVESTMENT POLICIES
With respect to each Fund, fundamental investment policies may not be changed without the approval of a majority of the outstanding shares. A vote of a majority of the outstanding shares for this purpose means the affirmative vote of the lesser of (1) 67% of shares present at a meeting if more than 50% of the outstanding shares of a Fund are present at a meeting in person or by proxy or (2) more than 50% of the outstanding shares of a Fund.
Pursuant to each Fund’s fundamental investment policies listed below, the Funds may not, except as permitted by the 1940 Act and the rules and regulations thereunder, or interpretations or exemptive or other relief from the SEC, SEC staff or other authority of competent jurisdiction:
1. borrow money;
2. purchase or sell real estate, except that a Fund may, to the extent permitted by applicable law, purchase, hold and sell securities or other instruments that are directly or indirectly secured by, or linked to, real estate or interests therein, securities of real estate investment trusts, mortgage-related securities and securities of companies that invest in real estate or interests therein, and the Fund may purchase, hold and sell real estate as a result of the ownership of securities or other instruments;
3. underwrite securities of other issuers, except to the extent that the sale of portfolio securities by a Fund may be deemed to be an underwriting;
4. issue senior securities;
5. purchase or sell commodities or commodity contracts;
6. make loans, provided that this limitation does not affect the ability of a Fund to lend securities, to enter into repurchase agreements or to acquire debt obligations, including without limitation, debt securities, loans, loan participations and assignments, and other forms of debt instruments; or
7. concentrate its investments in a particular industry, as the term “concentrate” is used in the 1940 Act.
For purposes of the Funds’ fundamental policies, “industry” is based on the Standard & Poor’s and Morgan Stanley Capital International’s Global Industry Classification Standards (“GICS”). Holdings in pooled investment vehicles, such as exchange-traded funds, or other securities that are not classified by GICS will be classified as the Adviser deems reasonable based on the primary characteristics of the security.
Additional Information Regarding Fundamental Investment Policies
The information provided below is not a part of a Fund’s fundamental policies. The information is intended to provide a summary of what is currently required or permitted by the 1940 Act and the rules and regulations thereunder, or by the interpretive guidance related thereto, relating to particular fundamental policies of the Fund.
Fundamental Investment Policy #1: The Fund may borrow money to the extent permitted under the 1940 Act. This means that, in general, the Fund may borrow money from banks for any purpose in an amount up to 1/3 of the Fund’s total assets. The Fund also may borrow money for temporary purposes in an amount not to exceed 5% of the Fund’s total assets. For purposes of this calculation, the Fund’s total assets include the amounts being borrowed. Also, under the 1940 Act, the Fund is required to maintain at all times an “asset coverage” of at least 300% of the amount of its borrowings. Asset coverage means the ratio that the value of the Fund’s total assets (including amounts borrowed), minus liabilities other than borrowings, bears to the aggregate amount of all borrowings. Certain trading practices and investments, such as reverse repurchase agreements, may be considered to be a borrowings unless the Fund takes steps to segregate or earmark liquid assets or otherwise cover its obligations. Fundamental Investment Policy #1 will be interpreted to permit the Fund to engage in trading practices and investments that may be considered to be borrowing or to involve leverage to the extent permitted by the 1940 Act and to permit the Fund to segregate or earmark liquid assets or enter into offsetting positions or otherwise cover its obligations using a method permitted by the 1940 Act, the rules and regulations thereunder or orders issued by the SEC. The Fund may take into account interpretations and guidance provided by the SEC staff. Short-term credits necessary for the settlement of securities transactions and arrangements with respect to securities lending will not be considered to be borrowings under the policy.
Fundamental Investment Policy #4: The Fund may not issue senior securities to the extent such issuance would violate the 1940 Act. The 1940 Act currently generally defines a “senior security” as any bond, debenture, note, or similar obligation or instrument constituting a security and evidencing indebtedness, and any stock of a class having priority over any other class as to distribution of assets or payment of dividends. With certain exceptions, the 1940 Act prohibits the Fund from issuing senior securities. For example, the Fund may borrow from any bank if it maintains an asset coverage of at least 300% in the aggregate provided that, in the event that such asset coverage falls below 300%, the Fund must, within three days (not including Sundays and holidays), reduce the amount of its borrowings to attain the 300% asset coverage.
Fundamental Investment Policy #5: Subject to the Fund’s investment objectives and investment policies (as set forth in the Fund’s prospectus and in this statement of additional information), the Fund interprets Fundamental Investment Policy #5 relating to the purchase and sale of commodities or commodities contracts to permit the Fund to purchase, sell or enter into futures contracts and options thereon, commodity-related swap agreements, foreign currency contracts, foreign currency options, hybrid instruments, or any interest rate or securities-related or foreign currency-related hedging instruments, including swap agreements and other derivative instruments, subject to compliance with any applicable provisions of the federal securities or commodities laws, and other commodity-related derivative instruments.
Fundamental Investment Policy #6: The 1940 Act does not prohibit the Fund from making loans (including lending its portfolio securities); however, under current interpretations of the staff of the Securities and Exchange Commission the Fund may not, at any given time, have on loan more than 33-1/3% of its total assets, except through the purchase of debt obligations or the use of repurchase agreements. Collateral arrangements with respect to options, forward currency and futures transactions and other derivative instruments (as applicable), as well as delays in the settlement of securities transactions, will not be considered loans.
Fundamental Investment Policy #7: The 1940 Act does not define what constitutes “concentration” in an industry. The staff of the Securities and Exchange Commission has taken the position that the investment of 25% or more of a fund’s total assets in one or more issuers conducting their principal activities in the same industry or group of industries constitutes concentration. It is possible that interpretations of what constitutes concentration may change in the future. The policy in Fundamental Investment Policy #7 will be interpreted to refer to concentration as that term may be interpreted from time to time. The Fund interprets its policy with respect to concentration in a particular industry to apply to direct investments in the securities of issuers in a particular industry, as defined by the Fund. For purposes of this policy, a foreign government is considered to be an industry. Currency positions are not considered to be an investment in a foreign government for purposes of this policy. Mortgage-backed securities that are issued or guaranteed by the U.S. Government, its agencies or instrumentalities are not subject to the Fund’s industry concentration restriction, by virtue of the exclusion from that test available to all U.S. Government securities. Similarly, municipal bonds issued by states, municipalities and other political subdivisions, agencies, authorities and instrumentalities of states and multi-state agencies and authorities are not subject to the Fund’s industry concentration restrictions. In the case of privately issued mortgage-related securities, or any asset-backed securities, the Fund takes the position that such securities do not represent interests in any particular “industry” or group of industries. The Fund may invest in certain derivative instruments which, while representing a relatively small amount of the Fund’s net assets, provide a greater amount of economic exposure to a particular industry. To the extent that the Fund obtains economic exposure to a particular industry in this manner, it may be subject to similar risks of concentration in that industry as if it had invested in the securities of issuers in that industry directly.
For purposes of the Fundamental Investment Policy #7, “industry” is based on the Standard & Poor’s and Morgan Stanley Capital International’s Global Industry Classification Standards (“GICS”). Holdings in pooled investment vehicles, such as exchange-traded funds, or other securities that are not classified by GICS will be classified as the Adviser deems reasonable based on the primary characteristics of the security.
NON-FUNDAMENTAL INVESTMENT POLICIES
Non-fundamental investment policies are established and may be changed by the Board of Directors of the Company (the “Board of Directors”, or the “Board”) without shareholder approval. The following are the Funds’ non-fundamental investment policies.
Each Fund’s investment objective (except for the Low Duration Bond, Multi-Asset Income and Small Company Funds), is a non-fundamental policy, and may be changed without shareholder approval by the Fund’s Board of Directors upon 30 days’ notice to shareholders.
For the Balanced, Government Securities, Low Duration Bond, Multi-Asset Income and Total Return Bond Funds, each Fund may enter into derivatives transactions in order to hedge various risks, including, but not limited to, currency risk, interest rate risk and credit risk, and for other investment purposes, such as replicating permitted investments; provided that, to the extent a Fund invests in derivatives, it will observe the following limitations:
| | • | It may not enter into a derivative transaction if the effect of such transaction would be to leverage the Fund’s portfolio risks. |
| | • | When entering into derivative transactions, it will segregate cash or appropriate liquid securities in an amount equal to its current obligations under swap agreements; when an agreement provides for netting of the payments by the two parties, the Fund will segregate only the amount of its net obligation, if any. |
| | • | When transacting in OTC derivatives involving counterparty risk, it will deal only with counterparties that meet credit guidelines (as determined in the Adviser’s sole discretion), and will limit exposure to any counterparty such that the sum of the value of all portfolio securities held by the Fund of which the issuer is the counterparty or an affiliate of the counterparty, plus the exposure to the counterparty in respect of the OTC derivatives does not exceed 5% of the total assets of the Fund. |
Each of the Balanced, Low Duration Bond, Multi-Asset Income and Total Return Bond Funds will be subject to the following additional non-fundamental investment policies:
| | • | It may enter into derivative transactions (e.g., interest rate, foreign exchange, total return, credit and equity) on fixed income and equity indices in order to transfer, or hedge, risk without leveraging risk. |
| | • | It may enter into single name default swaps on fixed-income securities for the purpose of hedging credit risk on securities owned by the Fund. It may also enter into credit default swaps on credit indices where the Fund may or may not own the underlying credit entities. The Fund may not leverage portfolio credit risk through the use of default swaps. In addition, the Fund may enter into futures transactions on indices of equity securities when the Adviser believes such transactions are appropriate hedges with respect to credit risk associated with the non-investment grade portion of the Fund’s portfolio. |
The Unconstrained Bond Fund may enter into derivatives transactions without limitation, including for investment and/or for hedging purposes. The Fund may use derivative instruments to gain both long and short exposure to fixed-income or other instruments by investing in, among other instruments, derivatives such as futures and options, and other derivatives such as swap agreements, including interest rate swaps, total return swaps, and credit swaps. The Fund’s use of derivatives may expose the Fund to leverage risk and may expose the Fund to potential losses that exceed the amount originally invested by the Fund.
For Funds other than the Balanced, Government Securities, Low Duration Bond, Multi-Asset Income, Total Return Bond and Unconstrained Bond Funds, to the extent the Fund invests in derivatives, it will observe the following limitations:
| | • | It may not hold more than 5% of its total assets in the aggregate in options on individual securities, options on securities indices, and futures contracts. |
| | • | It will buy options on individual securities only to hedge underlying securities that are owned by the Fund, or to close out transactions in options written. |
| | • | It will sell options on individual securities only to generate additional income on securities that are owned by the Fund, or to close out transactions in options purchased. |
| | • | It will sell options on securities indices or futures on securities indices only to hedge portfolio risks, or to close out positions in such index options or futures that had previously been purchased. As such, a Fund shall not sell such index options or futures with aggregate notional amounts in excess of that Fund’s exposure to the market or sector covered by such index option or future. |
| | • | It will purchase options on securities indices or futures on securities indices only in anticipation of buying securities related to the index, or to close out positions in such index options or futures that the Fund had previously sold. In purchasing such |
| | | index options or futures, it must set aside cash or short-term money market investments so as to ensure that the purchase of such index options or futures does not result in leveraging the Fund’s portfolio. |
| | • | It will enter into interest rate swap transactions and total return swaps on fixed income indices only in circumstances in which there is no leveraging of credit risk in the portfolio, or in which significant diversification or reduction of credit risk results. |
| | • | It will enter into default swaps on fixed-income securities only for the purpose of hedging credit risk on securities owned by the Fund, and will not take on additional credit risk through the use of default swaps. |
| | • | When entering into swap agreements, it will segregate cash or appropriate liquid securities in an amount equal to its obligations under swap agreements; when an agreement provides for netting of the payments by the two parties, the Fund will segregate only the amount of its net obligation, if any. |
| | • | When transacting in OTC derivatives involving counterparty risk, it will deal only with counterparties that meet appropriate credit guidelines, and will limit exposure to any counterparty such that the sum of the value of all portfolio securities held by the Fund of which the issuer is the counterparty or an affiliate of the counterparty, plus the exposure to the counterparty in respect of the OTC options, does not exceed 5% of the total assets of the Fund. |
In addition, to comply with Subchapter M of the Internal Revenue Code of 1986, as amended (the “Code”), at least 50% of each Fund’s total assets must be comprised of individual issues, each of which represents no more than 5% of such Fund’s total assets and no more than 10% of the issuer’s outstanding voting securities. Those issues which represent more than 5% of the Fund’s total assets must be limited in the aggregate to 50% of such Fund’s total assets, provided, however, that no more than 25% of the Fund’s total assets may be invested in any one issuer or in qualified publicly-traded partnerships.
Under the 1940 Act, each of the Funds may invest up to 10% of its total assets in the securities of other investment companies, but may not invest more than 5% of its total assets in the securities of any one investment company or acquire more than 3% of the outstanding securities of any one investment company, unless it does so in reliance on a statutory exemption under the 1940 Act or related rules or SEC staff interpretations. Many ETFs have obtained exemptive relief from the SEC permitting unaffiliated funds (such as the Funds) to invest in such ETF’s shares beyond the statutory limits, subject to certain conditions and pursuant to contractual arrangements between the ETFs and the investing fund. The Balanced, Low Duration Bond, Multi-Asset Income, Total Return Bond and Unconstrained Bond Funds may invest in ETFs in reliance on such exemptive orders.
It is a non-fundamental policy of each Fund, other than the Unconstrained Bond Fund, that it may not borrow money, except from banks in an amount up to 5% of the Fund’s total assets for temporary or emergency purposes or to meet redemption requests that might otherwise require untimely disposition of securities.
The Balanced Fund:
| | • | Must invest at least 25% of its assets in bonds; |
| | • | Must invest at least 25% of its assets in common stocks; |
| | • | May not invest more than 20% of its total assets in debt securities that are rated below “investment grade” (or, if not rated, which the Adviser determines possess similar credit characteristics); |
| | • | May not invest more than 25% of its net assets in repurchase agreements; and |
| | • | May invest up to 100% of its assets in cash, commercial paper, high-grade bonds, or cash equivalents for temporary defensive reasons if the Adviser believes that adverse market or other conditions warrant. |
The Common Stock Fund:
| | • | May not change its policy of investing, under normal circumstances, at least 80% of its assets in common stock, unless the Fund provides its shareholders with 60 days’ prior written notice of such change; |
| | • | May not invest more than 25% of its net assets in repurchase agreements; and |
| | • | May invest up to 100% of its assets in cash, commercial paper, high-grade bonds, or cash equivalents for temporary defensive reasons if the Adviser believes that adverse market or other conditions warrant. |
The Government Securities Fund:
| | • | May not change its policy of investing, under normal circumstances, at least 80% of its assets in government securities and related derivatives, unless the Fund provides its shareholders with 60 days’ prior written notice of such change; |
| | • | May not invest more than 25% of its net assets in repurchase agreements; and |
| | • | May not invest more than 20% of its net assets in high-quality, money-market instruments that are not issued or guaranteed by the U.S. government or its agencies or instrumentalities. |
The International Equity Fund:
| | • | May not change its policy of investing, under normal circumstances, at least 80% of its assets in equity securities unless the Fund provides its shareholders with 60 days’ prior written notice of such change; |
| | • | May not invest more than 40% of its assets in any one country; |
| | • | Must normally be invested in ten or more foreign countries; |
| | • | May not invest more than 25% of its total assets in emerging markets; |
| | • | Must invest at least 75% of its total assets in securities of non-U.S. issuers; |
| | • | May not invest more than 25% of its total assets in companies organized in the United States, and only if they have at least 50% of their assets and/or revenues outside the United States; |
| | • | May not invest in convertible or debt securities rated below Baa by Moody’s Investors Service, Inc. or BBB or higher by Standard & Poor’s; |
| | • | May not invest more than 25% of its net assets in repurchase agreements; and |
| | • | May invest up to 100% of its assets in cash, commercial paper, high-grade bonds, or cash equivalents for temporary defensive reasons if the Adviser believes that adverse market or other conditions warrant. |
The Low Duration Bond Fund:
| | • | May not change its policy of investing, under normal circumstances, at least 80% of its net assets in fixed income instruments and related derivatives unless the Fund provides its shareholders with 60 days’ prior written notice of such change; |
| | • | May not invest more than 25% of its net assets in repurchase agreements; and |
| | • | May invest up to 100% of its assets in cash, commercial paper, high-grade bonds, or cash equivalents for temporary defensive reasons if the Adviser believes that adverse market or other conditions warrant. |
The Multi-Asset Income Fund:
| | • | May invest up to 100% of its total assets in debt securities and other fixed income instruments, including 100% in high yield (below investment-grade) bonds (“junk bonds”); |
| | • | May invest up to 100% of its total assets in equity and equity-related securities; |
| | • | May invest up to 70% of its total assets in foreign equity and equity-related securities, including emerging markets; |
| | • | May not invest more than 25% of its net assets in repurchase agreements; and |
| | • | May invest up to 100% of its assets in cash, commercial paper, high-grade bonds, or cash equivalents for temporary defensive reasons if the Fund’s investment adviser believes that adverse market or other conditions warrant. |
The Small Company Fund:
| | • | May not change its policy of investing, under normal circumstances, at least 80% of its assets in small companies, unless the Fund provides its shareholders with 60 days’ prior written notice of such change; |
| | • | May not invest more than 5% of its total assets in debt securities that are rated below “investment grade” (or, if not rated, which the Adviser determines possess similar credit characteristics); |
| | • | May not invest more than 25% of its net assets in repurchase agreements; and |
| | • | May invest up to 100% of its assets in cash, commercial paper, high-grade bonds, or cash equivalents for temporary defensive reasons if the Adviser believes that adverse market or other conditions warrant. |
The Sustainable Core Opportunities Fund:
| | • | May not invest more than 25% of its net assets in repurchase agreements; and |
| | • | May invest up to 100% of its assets in cash, commercial paper, high grade bonds, or cash equivalents for temporary defensive reasons if the Adviser believes that adverse market or other conditions warrant. |
The Total Return Bond Fund:
| | • | May not change its policy of investing, under normal circumstances, at least 80% of its assets in bonds and related derivatives unless the Fund provides its shareholders with 60 days’ prior written notice of such change; |
| | • | May invest up to 50% of its total assets in below investment grade bonds; |
| | • | May not invest more than 25% of its net assets in repurchase agreements; |
| | • | May not make short sales of securities or maintain a short position, except to the extent permitted by the Fund’s prospectus and statement of additional information, as amended from time to time, and applicable law; and |
| | • | May invest up to 100% of its assets in cash, commercial paper, high-grade bonds, or cash equivalents for temporary defensive reasons if the Adviser believes that adverse market or other conditions warrant. |
The Unconstrained Bond Fund:
| | • | May not change its policy of investing, under normal circumstances, at least 80% of its net assets (plus any borrowings made for investment purposes) in U.S. and non-U.S. fixed-income instruments and related derivatives, unless the Fund provides its shareholders with 60 days’ prior written notice of such change; |
| | • | May not invest more than 25% of its net assets in repurchase agreements; |
| | • | May not invest more than 15% of its assets in illiquid securities; |
| | • | May not invest more than 70% of its total assets in below investment grade bonds; |
| | • | May not invest more than 20% of its total assets in preferred securities and equity securities; and |
| | • | May invest up to 100% of its assets in cash, commercial paper, high-grade bonds, or cash equivalents for temporary defensive reasons if the Adviser believes that adverse market or other conditions warrant. |
| | | |
| | For purposes of the Unconstrained Bond Fund’s policy of investing, under normal circumstances, at least 80% of its net assets (plus any borrowings made for investment purposes) in U.S. and non-U.S. fixed-income instruments and related derivatives, investments may be represented by forwards or derivatives such as options, futures contracts, or swap agreements. |
Fundamental and non-fundamental investment policies are considered at the time that portfolio securities are purchased. If a percentage restriction is satisfied at the time of investment, a later increase or decrease in such percentage resulting from a change in asset value will not constitute a violation of the restriction.
ADDITIONAL INFORMATION ABOUT INVESTMENT STRATEGIES AND RISKS
Derivatives Transactions.
General. The Balanced and Multi-Asset Income Funds and the fixed-income Funds may (a) purchase and sell exchange traded and over-the-counter (“OTC”) put and call options on fixed income securities and indices of fixed income securities, (b) purchase and sell futures contracts on fixed income securities and indices of fixed income and equity securities, and (c) enter into interest rate swaps, total return swaps on fixed income indices, and default swaps.
The Balanced, Common Stock, International Equity, Multi-Asset Income, Small Company, and Sustainable Core Opportunities Funds may purchase and sell (a) exchange traded and OTC put and call options on equity securities and indices of equity securities, (b) futures contracts on indices of equity securities, and (c) other securities that replicate the performance of specific “baskets” of stocks.
Each of these Funds may utilize options and futures contracts to manage exposure to changing interest rates, currency exchange rates and/or security prices. Some options and futures strategies, including selling futures contracts and buying puts, tend to hedge a Fund’s investments against price fluctuations. Other strategies, including buying futures contracts, writing puts and calls, and buying calls, tend to increase market exposure. Derivatives may also be used by a Fund to replicate permitted investments.
The Unconstrained Bond Fund may enter into derivatives transactions without limitation, including for investment and/or for hedging purposes. The Fund may use derivative instruments to gain both long and short exposure to fixed-income or other instruments by investing in, among other instruments, derivatives such as futures and options, and other derivatives such as swap agreements, including interest rate swaps, total return swaps, and credit swaps. The Fund’s use of derivative may also include, for example, the purchase and sales of exchange traded and over-the-counter (“OTC”) put and call options on fixed income securities and indices of fixed income securities, the purchase and sale of futures contracts on fixed income securities and indices of fixed income and equity securities, and entering into forward contracts. The Fund’s use of derivatives may expose the Fund to leverage risk and may expose the Fund to potential losses that exceed the amount originally invested by the Fund. To the extent the Fund enters into derivatives transactions, it will comply with guidelines established by the SEC with respect to coverage for these instruments, and any applicable rules of the CFTC. Please see “Commodity Pool Operator and Limitations on the Use of Futures, Options on Futures and Swaps” and “Asset Segregation and Coverage”, below.
The use of options and futures is a highly specialized activity which involves investment strategies and risks different from those associated with ordinary portfolio securities transactions, and there can be no guarantee that their use will increase a Fund’s return. While the use of these instruments by a Fund may reduce certain risks associated with owning its portfolio securities, these techniques themselves entail certain other risks. If the Adviser applies a strategy at an inappropriate time or judges market conditions or trends incorrectly, options and futures strategies may lower a Fund’s return. Certain strategies limit a Fund’s possibilities to realize gains as well as limiting its exposure to losses. A Fund could also experience losses if the prices of its options and futures positions were poorly correlated with its other investments, or if it could not close out its positions because of an illiquid secondary market. In
addition, a Fund will incur transaction costs, including trading commissions and option premiums, in connection with its futures and options transactions and these transactions could significantly increase the Fund’s portfolio turnover rate.
Except for the Balanced, Government Securities, Low Duration Bond, Multi-Asset Income, Total Return Bond and Unconstrained Bond Funds (also referred to as the “fixed income and allocation Funds”), no Fund may purchase or sell derivative instruments if, as a result, the aggregate initial margin and options premiums required to establish these positions exceed 5% of the total assets of such Fund. The options premiums required to establish the put and call options on individual securities and on securities indices that are discussed below are not subject to this 5% limitation.
Purchasing Put Options. By purchasing a put option, a Fund obtains the right (but not the obligation) to sell the instrument underlying the option at a fixed strike price. In return for this right, the Fund pays the current market price for the option (known as the option premium). Options have various types of underlying instruments, including specific securities, indices of securities, and indices of securities prices. A Fund may terminate its position in a put option it has purchased by allowing it to expire or by exercising the option. A Fund may also close out a put option position by entering into an offsetting transaction, if a liquid market exists. If the option is allowed to expire, the Fund will lose the entire premium it paid. If a Fund exercises a put option on a security, it will sell the instrument underlying the option at the strike price. If a Fund exercises an option on an index, settlement is in cash and does not involve the actual sale of securities. If an option is American Style, it may be exercised on any day up to its expiration date. A European Style option may be exercised only on its expiration date.
The buyer of a typical put option can expect to realize a gain if the price of the underlying instrument falls substantially. However, if the price of the instrument underlying the option does not fall enough to offset the cost of purchasing the option, a put buyer can expect to suffer a loss (limited to the amount of the premium paid, plus related transaction costs).
The Funds may purchase put options, but will not sell, or write, put options on individual securities, except to close out put options previously purchased.
Selling (Writing) Call Options. The features of call options are essentially the same as those of put options, except that the purchaser of a call option obtains the right to purchase, rather than sell, the instrument underlying the option at the option’s strike price. A call buyer typically attempts to participate in potential price increases of the instrument underlying the option with risk limited to the cost of the option if security prices fall. At the same time, the buyer can expect to suffer a loss if the underlying security price does not rise sufficiently to offset the cost of the option. The Funds will not purchase call options on individual securities, except to close out call options previously sold, but may sell, or write, call options on individual securities.
Writing a call option obligates a Fund to sell or deliver the option’s underlying instrument in return for the strike price upon exercise of the option. The characteristics of writing call options are similar to those of writing put options, except that writing calls generally is a profitable strategy if prices remain the same or fall. Through receipt of the option premium a call writer offsets part of the effect of a price decline. At the same time, because a call writer must be prepared to deliver the underlying instrument in return for the strike price, even if its current value is greater, a call writer gives up some ability to participate in security price increases.
The writer of an exchange traded put or call option on a security, an index of securities or a futures contract is required to deposit cash or securities or a letter of credit as margin and to make mark-to-market payments of variation margin as the position becomes unprofitable.
Options on Indices. Each Fund that is permitted to enter into options transactions may purchase and sell (write) put and call options on any securities index based on securities in which the Fund may invest. Options on securities indices are similar to options on securities, except that the exercise of securities index options is settled by cash payment and does not involve the actual purchase or sale of securities. In addition, these options are designed to reflect price fluctuations in a group of securities or segment of the securities market rather than price fluctuations in a single security. A Fund, in purchasing or selling index options, is subject to the risk that the value of its portfolio securities may not change as much as an index because the Fund’s investments generally will not match the composition of an index.
For a number of reasons, a liquid market may not exist and thus a Fund may not be able to close out an option position that it has previously entered into. When a Fund purchases an OTC option, it will be relying on its counterparty to perform its obligations, and a Fund may incur additional losses if the counterparty is unable to perform.
Futures Contracts. When a Fund purchases a futures contract, it agrees to purchase a specified quantity of an underlying instrument at a specified future date or to make a cash payment based on the value of a securities index. When a Fund sells a futures contract, it agrees to sell a specified quantity of the underlying instrument at a specified future date or to receive a cash payment based on the
value of a securities index. The price at which the purchase and sale will take place is fixed when a Fund enters into the contract. Futures can be held until their delivery dates or the position can be (and normally is) closed out before then. There is no assurance, however, that a liquid market will exist when a Fund wishes to close out a particular position.
When a Fund purchases a futures contract, the value of the futures contract tends to increase and decrease in tandem with the value of its underlying instrument. Therefore, purchasing futures contracts will tend to increase a Fund’s exposure to positive and negative price fluctuations in the underlying instrument, much as if it had purchased the underlying instrument directly. When a Fund sells a futures contract, by contrast, the value of its futures position will tend to move in a direction contrary to the value of the underlying instrument. Selling futures contracts, therefore, will tend to offset both positive and negative market price changes, much as if the underlying instrument has been sold.
The purchaser or seller of a futures contract is not required to deliver or pay for the underlying instrument unless the contract is held until the delivery date. However, when a Fund buys or sells a futures contract it will be required to deposit “initial margin” with its custodian in a segregated account in the name of its futures broker, known as a futures commission merchant (“FCM”). Initial margin deposits are typically equal to a small percentage of the contract’s value. If the value of either party’s position declines, that party will be required to make additional “variation margin” payments equal to the change in value on a daily basis. The party that has a gain may be entitled to receive all or a portion of this amount. A Fund may be obligated to make payments of variation margin at a time when it is disadvantageous to do so. Furthermore, it may not always be possible for a Fund to close out its futures positions. Until it closes out a futures position, a Fund will be obligated to continue to pay variation margin. Initial and variation margin payments do not constitute purchasing on margin for purposes of the Fund’s investment restrictions. In the event of the bankruptcy of an FCM that holds margin on behalf of a Fund, the Fund may be entitled to return of margin owed to it only in proportion to the amount received by the FCM’s other customers, potentially resulting in losses to the Fund.
Each Fund will segregate liquid assets in connection with its use of options and futures to the extent required by the staff of the SEC. Securities held in a segregated account cannot be sold while the futures contract or option is outstanding, unless they are replaced with other suitable assets. As a result, there is a possibility that segregation of a large percentage of a Fund’s assets could impede portfolio management or the Fund’s ability to meet redemption requests or other current obligations.
Correlation of Price Changes. Because there are a limited number of types of exchange-traded options and futures contracts, it is likely that the standardized options and futures contracts available will not match a Fund’s current or anticipated investments exactly. A Fund may invest in options and futures contracts based on securities with different issuers, maturities, or other characteristics from the securities in which it typically invests, which involves a risk that the options or futures position will not track the performance of the Fund’s other investments.
Options and futures contracts prices can also diverge from the prices of their underlying instruments, even if the underlying instruments match the Fund’s investments well. Options and futures contracts prices are affected by such factors as current and anticipated short term interest rates, changes in volatility of the underlying instrument, and the time remaining until expiration of the contract, which may not affect security prices the same way. Imperfect correlation also may result from differing levels of demand in the options and futures markets and the securities markets, structural differences in how options and futures and securities are traded, or imposition of daily price fluctuation limits or trading halts. A Fund may purchase or sell options and futures contracts with a greater or lesser value than the securities it wishes to hedge or intends to purchase in order to attempt to compensate for differences in volatility between the contract and the securities, although this may not be successful in all cases. If price changes in a Fund’s options or futures positions are poorly correlated with its other investments, the positions may fail to produce anticipated gains or result in losses that are not offset by gains in other investments.
Liquidity of Options and Futures Contracts. There is no assurance a liquid market will exist for any particular options or futures contract at any particular time, even if the contract is traded on an exchange. In addition, exchanges may establish daily price fluctuation limits for options and futures contracts and may halt trading if a contract’s price moves up or down more than the limit on a given day. On volatile trading days when the price fluctuation limit is reached or a trading halt is imposed, it may be impossible for a Fund to enter into new positions or close out existing positions. If the market for a contract is not liquid because of price fluctuation limits or otherwise, it could prevent prompt liquidation of unfavorable positions, and could potentially require a Fund to continue to hold a position until delivery or expiration regardless of changes in its value. As a result, a Fund’s access to other assets held to cover its options or futures positions also could be impaired.
Swaps. Swaps are privately negotiated over-the-counter derivative products in which two parties agree to exchange payment streams calculated in relation to a rate, index, instrument or certain securities and a particular “notional amount”. Swaps may involve an interest rate (fixed or floating), a commodity price index, or a security, securities index or a combination thereof. A great deal of flexibility is possible in the way the products may be structured, with the effect being that the parties may have exchanged amounts
equal to the return on one rate, index or group of securities for another. For example, in a simple fixed-to-floating interest rate swap, one party makes payments equivalent to a fixed interest rate, and the other make payments equivalent to a specified interest rate index. A fixed-income Fund may engage in simple or more complex swap transactions involving a wide variety of underlying instruments or rates.
Swaps are credit-intensive products. A Fund that enters into a swap transaction bears the risk of default (i.e., nonpayment) by the other party to the swap. The internal limitation below which deals with counterparty risk is intended to reduce this risk to the extent reasonably practicable, but it cannot eliminate entirely the risk that a counterparty to a swap, or another OTC derivative, will default. Consistent with current market practices, a Fund will generally enter into swap transactions on a net basis, and all swap transactions with the same party will be documented under a single master agreement to provide for a net payment upon default. In addition, a Fund’s obligations under an agreement will be accrued daily (offset against any amounts owing to the Fund) and any accrued, but unpaid, net amounts owed to the other party to a master agreement will be covered by the maintenance of a segregated account consisting of cash or liquid securities.
Interest rate and total return swaps generally do not involve the delivery of securities, other underlying assets, or principal. In such case, if the other party to an interest rate or total return swap defaults, a Fund’s risk of loss will consist of the payments that a Fund is contractually entitled to receive from the other party. If there is a default by the other party, a Fund may have contractual remedies under the agreements related to the transaction. A credit default swap involves a protection buyer and a protection seller. The Fund may be either a protection buyer or seller. The protection buyer makes periodic premium payments to the protection seller during the swap term in exchange for the protection seller agreeing to make certain defined payments to the protection buyer in the event certain defined credit events occur with respect to a particular security, issuer or basket of securities.
Position Limits. Futures exchanges can limit the number of futures and options on futures contracts that can be held or controlled by an entity. If an adequate exemption cannot be obtained, a Fund may be required to reduce the size of its futures and options positions or may not be able to trade a certain futures or options contract in order to avoid exceeding such limits.
Commodity Pool Operator and Limitations on the Use of Futures, Options on Futures and Swaps. Each Fund has claimed an exclusion from the definition of the term “commodity pool operator” under the Commodity Exchange Act (“CEA”) pursuant to Rule 4.5 under the CEA (the “exclusion”) promulgated by the Commodity Futures Trading Commission (“CFTC”). Accordingly, neither the Funds nor the Adviser (with respect to any Fund) are subject to registration or regulation as a “commodity pool operator” under the CEA. To remain eligible for the exclusion, each Fund will be limited in its ability to use certain financial instruments regulated under the CEA (“commodity interests”), including futures, options on futures and CFTC-regulated swaps transactions (including commodity options and options on such swaps transactions). Put and call options on individual securities and securities indices are not regulated by the CFTC as commodity interests and are therefore not subject to such limitation. Each Fund currently limits its direct investments in futures, options on futures and CFTC-regulated swaps to the extent necessary for the Adviser and the Fund to continue to claim the exclusion. None of the Funds is intended as a vehicle for trading in the futures, commodity options or CFTC-regulated swaps markets and does not market itself as a commodity pool. Under Rule 4.5 as currently in effect, in order to claim the exclusion, each Fund must limit its trading activity in futures, options on futures and CFTC-regulated swaps (excluding activity for “bona fide hedging purposes,” as defined by the CFTC) such that it meets one of the following tests:
• Aggregate initial margin and premiums required to establish its futures, options on futures and swap positions do not exceed 5% of the liquidation value of the Fund’s portfolio, after taking into account unrealized profits and losses on such positions; or
• Aggregate net notional value of its futures, options on futures and swap positions does not exceed 100% of the liquidation value of the Fund’s portfolio, after taking into account unrealized profits and losses on such positions.
The Unconstrained Bond Fund may enter into derivatives transactions that involve leverage. In the event this or any Fund’s investments in commodity interests require the Adviser to register with the CFTC as a commodity pool operator with respect to that Fund, the Fund’s expenses may increase, adversely affecting the Fund’s return.
Asset Segregation and Coverage. Transactions in certain derivative instruments may expose a Fund to an obligation to another party. Each Fund will comply with guidelines established by the SEC with respect to coverage for these instruments and, if the guidelines so require, will segregate on its books cash or liquid assets in the amount prescribed. The amounts that are segregated or designated may be based on the notional value of the derivative or on the daily mark-to-market obligation under the derivatives contract and may be reduced by amounts on deposit with the applicable broker or counterparty to the derivatives transactions. By setting aside assets equal only to its net obligations, a Fund will have the ability to engage to a greater extent in transactions in derivatives, which may increase the risks associated with such investments. In certain cases, a Fund may enter into an offsetting position rather than segregating or designating liquid assets. A Fund may cover such transactions using other methods currently or in the future permitted under the 1940
Act, the rules and regulations thereunder, or orders issued by the SEC thereunder. For these purposes, interpretations and guidance provided by the SEC staff may be taken into account when deemed appropriate by the Fund. As a result of a Fund’s asset segregation policies, there is a possibility that segregation of a large percentage of the Fund’s assets could impede portfolio management or the Fund’s ability to meet redemption requests or other current obligations. A Fund may modify its asset segregation policies from time to time.
Additional Risk Factors of OTC Transactions. Derivatives traded in OTC markets, including swaps and OTC options, involve substantial liquidity risk. The absence of liquidity may make it difficult or impossible for the Fund to sell such instruments promptly at an acceptable price. The absence of liquidity may also make it more difficult for the Fund to ascertain a market value for such instruments. Because derivatives traded in OTC markets are not guaranteed by an exchange or clearing corporation and generally do not require payment of margin, to the extent that the Fund has unrealized gains in such instruments or has deposited collateral with its counterparty, the Fund is at risk that its counterparty will become bankrupt or otherwise fail to honor its obligations.
Tax Risks of Derivatives. Certain aspects of the tax treatment of derivative instruments, including swap agreements and commodity-linked derivative instruments, are currently unclear and may be affected by changes in legislation, regulations or other legally binding authority that could affect the character, timing and amount of a Fund’s taxable income or gains and distributions.
OTC Derivatives Legislation. On July 21, 2010, President Obama signed into law the Dodd -Frank Wall Street Reform and Consumer Protection Act ( “Dodd-Frank”). Dodd-Frank includes provisions that comprehensively regulate OTC derivatives markets for the first time.
Dodd-Frank requires that a substantial portion of OTC derivatives must be executed in regulated markets and submitted for clearing to regulated clearinghouses. OTC trades submitted for clearing will be subject to minimum initial and variation margin requirements set by the relevant clearinghouse, as well as margin requirements mandated by the CFTC, SEC and/or prudential regulators. The regulators also have recently proposed imposing margin requirements on non-cleared OTC derivatives. OTC derivatives dealers will be subject to clearing and margin requirements notwithstanding whether the Fund is subject to such requirements. OTC derivatives dealers will be required to post margin to the clearinghouses through which they clear their customers’ trades instead of using such margin in their operations, as was widely permitted before Dodd-Frank. OTC derivatives dealers will also be subject to new business conduct standards, disclosure requirements, reporting and recordkeeping requirements, transparency requirements, position limits, limitations on conflicts of interest, and other regulatory burdens. These new requirements will further increase the dealers’ costs, which costs are expected to be passed through to other market participants, such as the Fund, in the form of higher fees and new clearing account maintenance fees.
The SEC and CFTC also now requires certain OTC derivatives transactions that were previously transacted on a bilateral basis to be executed through a regulated futures or swap exchange or swap execution facility. Certain CFTC-regulated derivatives trades are now subject to these requirements. The SEC is also expected to impose similar requirements on certain security-based derivatives in the near future, although it is not clear when these parallel SEC requirements will go into effect. Such requirements may make it more difficult and costly for investment funds, including the Funds, to enter into highly tailored or customized transactions.
With respect to cleared OTC derivatives, a Fund will not face a clearinghouse directly but instead will trade through an OTC derivatives dealer that is registered with the CFTC or SEC to act as a clearing member. A Fund may face the inherent risk of the failure by another clearing member customer to meet its obligations to the clearing member. Such scenarios could arise due to a default by the clearing member on its obligations to the clearing house, triggered by a customer’s failure to meet its obligations to the clearing member. If a Fund decides to become a direct member of one or more of these one or more of these exchanges or facilities, the Fund would be subject to all of their rules, which would bring additional risks, liabilities and potential regulatory requirements.
The overall impact of Dodd-Frank on the Funds is highly uncertain and it is unclear how the OTC derivatives markets will adapt to this new regulatory regime, along with additional, sometimes overlapping, regulatory requirements imposed by non-U.S. regulators.
Exchange-Traded Funds. Exchange-traded funds (“ETFs”) represent publicly traded shares of ownership in open-end funds or unit investment trusts (“UITs”), that hold portfolios of securities that closely track the performance and dividend yield of specific domestic or foreign market indices. An index-based ETF seeks to track the performance of a particular index by holding in its portfolio either the contents of the index or a representative sample of the securities in the index. Unlike typical open-end mutual funds or UITs, ETFs do not sell or redeem their individual shares at net asset value (“NAV”). Instead, ETFs sell and redeem their shares at NAV only in large blocks (such as 50,000 shares). In addition, national securities exchanges list ETF shares for trading, which allows investors to purchase and sell individual ETF shares among themselves at market prices throughout the day. ETFs therefore possess characteristics of traditional open-end mutual funds and UITs, which issue redeemable shares, and of closed-end funds, which generally issue shares that trade at negotiated prices on national securities exchanges and are not redeemable. Owning an ETF generally reflects the risks of
owning the underlying securities it is designed to track. ETFs typically trade on a securities exchange and their shares may, at times, trade at a premium or discount to their net asset values. In addition, an ETF may not replicate exactly the performance of the benchmark index it seeks to track for a number of reasons, including transaction costs incurred by the ETF, the temporary unavailability of certain index securities in the secondary market or discrepancies between the ETF and the index with respect to the weighting or number of instruments held by the ETF. Investing in ETFs, which are investment companies, may involve duplication of advisory fees and certain other expenses. A Fund will incur brokerage costs when purchasing and selling shares of ETFs.
Foreign Currency Transactions. The value of the assets of the portion of a Fund invested in foreign securities, as measured in U.S. dollars may be affected favorably or unfavorably by changes in foreign currency exchange rates and exchange control regulations, and these Funds may incur costs in connection with conversions between various currencies.
The Funds will conduct their foreign currency exchange transactions either on a spot (i.e., cash) basis at the spot rate prevailing in the foreign currency exchange market or through the use of forward contracts to purchase or sell foreign currencies. A forward foreign currency exchange contract involves an obligation by a Fund to purchase or sell a specific amount of currency at a future date, which may be any fixed number of days from the date of the contract agreed upon by the parties, at a price set at the time of the contract. These contracts are transferable in the interbank market conducted directly between currency traders (usually large commercial banks) and their customers. A forward contract generally has no deposit requirements, and no commissions are charged at any stage for trades. Neither type of foreign currency transaction will eliminate fluctuations in the prices of the Funds’ portfolio securities or prevent loss if the prices of such securities should decline.
The Multi-Asset Income, International Equity, Low Duration Bond and Total Return Bond Funds may enter into forward foreign currency exchange contracts only under two circumstances. First, when the Fund enters into a contract for the purchase or sale of a security denominated in a foreign currency, it may desire to “lock in” the U.S. dollar price of the security. The Fund will then enter into a forward contract for the purchase or sale, for a fixed amount of dollars, of the amount of foreign currency involved in the underlying securities transactions; in this manner the Fund will be better able to protect itself against a possible loss resulting from an adverse change in the relationship between the U.S. dollar and the subject foreign currency during the period between the date the securities are purchased or sold and the date on which payment is made or received.
Forward foreign currency exchange contracts do not eliminate fluctuations in the value of non-U.S. securities but rather allow the Fund to establish a fixed rate of exchange for a future point in time. Use of these contracts can have the effect of reducing returns and minimizing opportunities for gain.
In addition, a Fund may enter into a forward contract to sell, for a fixed amount of dollars, the amount of foreign currency approximating the value of some or all of the Fund’s securities denominated in such foreign currency if the Adviser believes that the currency of a particular foreign country may suffer a substantial decline against the U.S. dollar. The precise matching of the forward contract amounts and the value of the securities involved generally will not be possible since the future value of those securities may change between the date the forward contract is entered into and the date it matures. The projection of short-term currency market movement is extremely difficult, and the successful execution of a short-term hedging strategy is highly uncertain. The Adviser does not intend to enter into such forward contracts under this second circumstance on a regular or continuous basis. The Funds will not enter into such forward contracts or maintain a net exposure to such contracts when the consummation of the contracts would obligate the Funds to deliver an amount of foreign currency in excess of the value of the Funds’ securities or other assets denominated in that currency. The Adviser believes that it is important to have the flexibility to enter into such forward contracts when it determines that to do so is in the best interest of the Funds. The Funds’ custodian bank segregates cash or equity or debt securities in an amount not less than the value of the Funds’ total assets committed to forward foreign currency exchange contracts entered into under the second circumstance. If the value of the securities segregated declines, additional cash or securities are added so that the segregated amount is not less than the amount of the Funds’ commitments with respect to such contracts. Under normal circumstances, the Funds expect that any appreciation (depreciation) on such forward exchange contracts will be offset approximately by the (depreciation) appreciation in translation of the underlying foreign investment arising from fluctuations in foreign currency exchange rates.
The Funds will experience the unrealized appreciation or depreciation from the fluctuation in a foreign currency forward contract as an increase or decrease in the Funds’ net assets on a daily basis, thereby providing an appropriate measure of the Funds’ financial position and changes in financial position.
Foreign Securities. Foreign securities are typically subject to different taxation, regulation, trading volume and currency controls, than U.S. securities. They also may be subject to the possibility of expropriation and a lack of uniform accounting and reporting standards. While there may be investment opportunities in foreign securities, there also may be investment risks not usually associated with U.S. securities.
Foreign securities investments may be affected by changes in currency rates or exchange control regulations, changes in governmental administration or economic or monetary policy (in the United States and abroad) or changed circumstances in dealings between nations. Dividends paid by foreign issuers may be subject to withholding and other foreign taxes that may decrease the net return on these investments as compared to dividends paid to the Fund by U.S. issuers. There may be less publicly available information about foreign issuers than about U.S. issuers, and foreign issuers are not subject to uniform accounting, auditing and financial reporting standards and requirements comparable to those of domestic issuers. Securities of some foreign issuers are less liquid and more volatile than securities of comparable domestic issuers and foreign brokerage commissions are generally higher than commissions in the United States. Foreign securities markets may also be less liquid, more volatile and subject to less government supervision than those in the United States. Investments in foreign countries could be affected by other factors not present in the United States, including expropriation, confiscatory taxation and potential difficulties in enforcing contractual obligations. Securities purchased on foreign exchanges may be held in custody by a foreign bank or a foreign branch of a domestic bank.
American Depositary Receipts (ADRs) and American Depositary Shares (ADSs) are traded in U.S. securities markets and represent the securities of foreign issuers. While ADRs and ADSs may not necessarily be denominated in the same currency as the foreign securities they represent, many of the risks associated with foreign securities may also apply to ADRs and ADSs.
The investments the Funds may make in Taiwanese companies are subject to the risks of the continuing hostility between China and Taiwan. In addition, Taiwan’s growth has to a significant degree been export-driven with the U.S. as a key market. Therefore, Taiwan is affected by changes in the economies of the U.S. and other primary trading partners and by competing export-driven Asian economies. Also, Taiwan, as an island, has very limited natural resources, resulting in dependence on foreign sources particularly for energy.
The Korean government has historically imposed significant restrictions and controls on foreign investors. Under the current regulations, foreign investors are allowed to invest in almost all shares listed on the Korean Stock Exchange. From time to time, many of the securities trade among non-Korean residents at a premium over the market price. Foreign investors may effect transactions with other foreign investors off the exchange in the shares of companies that have reached the maximum aggregate foreign ownership limit through a securities company in Korea. These transactions typically occur at a premium over prices on the exchange. Investment in Korean companies subjects the Multi-Asset Income and International Equity Funds to the risks of political, economic or social instability in Korea, and to changes in Korean law or regulations. In addition, there is the possibility of the imposition of currency-exchange controls, foreign withholding tax on the interest income payable on such instruments, foreign controls, seizure or nationalization of foreign deposits or assets, or the adoption of other government restrictions. Korea is also subject to political instability and/or military conflict. The Funds are not expected to be subject to any Korean income taxes other than Korean withholding taxes. However, there may be changes in the treaty provisions, which may cause significant additional withholding or other taxes to apply to the Funds.
Foreign investment in the securities of issuers in India is usually restricted or controlled to some degree. In India, “Foreign Institutional Investors” (“FIIs”) may predominately invest in exchange-traded securities (and securities to be listed, or those approved on the over-the-counter exchange of India) subject to certain conditions. FIIs have to apply for registration to the Securities and Exchange Board of India and to the Reserve Bank of India for permission to trade in Indian securities. The International Equity Fund and the Multi-Asset Income Fund have registered to trade in India. FIIs are required to observe certain investment restrictions, including ownership ceilings on the total issued share capital of any one company. Under normal circumstances, income, gains and initial capital with respect to such investments are freely repatriatable, subject to payment of applicable Indian taxes. However, there can be no assurance that the Indian government in the future, whether for purposes of managing its balance of payments or for other reasons, will not impose restrictions on foreign capital remittances abroad or otherwise modify the exchange control regime applicable to FIIs in a way that may adversely affect the ability of the Funds to repatriate their income and capital.
The Multi-Asset Income and certain of the equity Funds may invest in the stock of “passive foreign investment companies” (“PFICs”) in accordance with their investment objectives, policies and restrictions. A PFIC is a foreign corporation that, in general, meets either of the following tests: (1) at least 75% of its gross income is passive or (2) an average of at least 50% of its assets produce, or are held for the production of, passive income. Under certain circumstances, the Fund may be subject to federal income tax on any “excess distribution” (which is made up of a defined portion of distributions to shareholders of the PFIC and any gain on their disposition of the PFIC stock), plus interest thereon, even if the Fund distributes such income as a taxable dividend to its shareholders. The balance of the PFIC income will be included in the Fund’s investment company taxable income and, accordingly, will not be taxable to it to the extent that income is distributed to its shareholders. If the Fund invests in a PFIC and elects to treat the PFIC as a “qualified electing fund” (“QEF”), then in lieu of the foregoing tax and interest charge, the Fund will be required to include in income each year its pro rata share of the QEF’s annual ordinary earnings and net capital gain (the excess of net long-term capital gain over net short-term capital loss) -- which probably would have to be distributed to its shareholders to satisfy the Fund’s Distribution Requirement and avoid imposition of the Excise Tax -- even if those earnings and gain were not received by the Fund. In most instances it will be very
difficult, if not impossible, to make this election because of certain requirements thereof. Finally, neither of the foregoing will apply if the Fund elects to mark-to-market the gains of the PFIC annually. In such a case, these gains will be treated as ordinary income.
Illiquid and Restricted Securities.
All of the Funds may invest in illiquid securities. According to current guidance from the staff of the SEC, a Fund may not invest more than 15% of its net assets in illiquid securities. Securities held by a Fund that are not deemed to be illiquid at the time of purchase may become illiquid. In addition, the small- and mid-capitalization companies in which the Multi-Asset Income and Small Company Funds, invest and the municipal securities in which the fixed income and allocation Funds invest may become illiquid. The SEC has stated that although the ultimate responsibility for liquidity determinations rests with a fund’s board of directors, the board may delegate the day-to-day function of determining liquidity to the investment adviser provided the board retains sufficient oversight. The Board has adopted policies and procedures for the purpose of determining whether Rule 144A securities and corporate loans are liquid or illiquid. The policies and procedures give guidelines for the Adviser to make the above mentioned determinations on an ongoing basis. In making these determinations, consideration is given to, among other things, the frequency of trades and quotes for the investment, the number of dealers willing to sell the investment and the number of potential purchasers, dealer undertakings to make a market in the investment, the nature of the investment, the time needed to dispose of the investment, the method of soliciting offers, and the mechanics of transfer. The Board reviews quarterly purchases and sales of Rule 144A securities and corporate loans.
To the extent that liquid Rule 144A securities or other securities, or corporate or bank loans in which the Funds invest become illiquid, due to the lack of sufficient qualified institutional buyers or market or other conditions, the Adviser, under the supervision of the Board, will consider appropriate measures to enable the Fund to maintain sufficient liquidity for operating purposes and to meet redemption requests. If institutional trading in restricted securities were to decline to limited levels, the liquidity of these Funds could be adversely affected. If an investment becomes illiquid, the affected Fund’s Adviser will determine the best course of action to permit the Fund to realize maximum value, which could include, among other possibilities, continuing to hold or seeking a private sale.
All of the Funds may invest in restricted securities. Restricted securities are those that cannot be sold to the public without registration under the Securities Act of 1933 (the “Securities Act”) or the availability of an exemption from registration (such as Rules 144 or 144A), or are subject to legal or contractual restrictions on resale.
Inflation-Linked Securities. The fixed income and allocation Funds may invest in inflation-linked securities. Inflation linked securities are fixed income securities whose principal value is periodically adjusted according to the rate of inflation. Two structures are common. The U.S. Treasury and some other issuers use a structure that accrues inflation into the principal value of the bond. Most other issuers pay out the Consumer Price Index (“CPI”) accruals as part of a semiannual coupon. Inflation-indexed securities issued by the U.S. Treasury have maturities of five, ten or thirty years, although it is possible that securities with other maturities will be issued in the future. The U.S. Treasury securities pay interest on a semiannual basis, equal to a fixed percentage of the inflation-adjusted principal amount. If the periodic adjustment rate measuring inflation falls, the principal value of the inflation-focused bonds will be adjusted downward, and consequently the interest payable on these securities (calculated with respect to a smaller principal amount) will be reduced. Repayment of the original bond principal upon maturity (as adjusted for inflation) is guaranteed in the case of U.S. Treasury inflation-indexed bonds, even during a period of deflation. However, the current market value of the bonds is not guaranteed, and will fluctuate. The Funds also may invest in other inflation related bonds which may or may not provide a similar guarantee. If a guarantee of principal is not provided, the adjusted principal value of the bond repaid at maturity may be less than the original principal. The value of inflation-indexed bonds is expected to change in response to changes in real interest rates. Real interest rates in turn are tied to the relationship between nominal interest rates and the rate of inflation. Therefore, if inflation were to rise at a faster rate than nominal interest rates, real interest rates might decline, leading to an increase in value of inflation linked bonds. While these securities are expected to be protected from long-term inflationary trends, short-term increases in inflation may lead to a decline in value. If interest rates rise due to reasons other than inflation (for example, due to changes in currency exchange rates), investors in these securities may not be protected to the extent that the increase is not reflected in the bond’s inflation measure. The periodic adjustment of U.S. inflation-indexed bonds is tied to the Consumer Price Index for Urban Consumers (“CPI-U”), which is calculated monthly by the U.S. Bureau of Labor Statistics. The CPI-U is a measurement of changes in the cost of living, made up of components such as housing, food, transportation and energy. Inflation-indexed bonds issued by a foreign government generally are adjusted to reflect a comparable inflation index, calculated by that government. There can be no assurance that the CPI-U or any foreign inflation index will accurately measure the real rate of inflation in the prices of goods and services, there can be no assurance that the rate of inflation in a foreign country will be correlated to the rate of inflation in the U.S. Any increase in the principal amount of an inflation-indexed bond will be considered taxable ordinary income, even though investors do not receive their principal until maturity.
Initial Public Offerings. From time to time, the Adviser may invest for a client, including the Funds, in securities being offered in an initial or secondary public offering (“IPO”), if the Adviser believes the investment is appropriate and desirable for that client. In making this judgment, the Adviser may consider, among other things, the client’s investment objectives, restrictions and tax
circumstances; the client’s tolerance for risk and high portfolio turnover; the nature, size and investment merits of the IPO; the size of the client’s account, cash availability, other holdings, asset allocation and other current or expected competing investment opportunities that may be available for the account; if the Adviser contemplates holding the investment for the client’s account, as opposed to immediately selling it, whether a meaningful position in the IPO securities could be obtained for the account; and expected transaction, custodial and other costs to the client in making the investment. The Adviser also may consider the number and nature of the account’s past participation in IPOs and any indicators of the client’s contribution to the availability of the particular investment opportunity or IPO investment opportunities generally, including the amount of brokerage commissions and underwriter compensation generated by the client account. After weighing these and other relevant factors, the Adviser may decide to invest in a particular IPO for some but not all clients, or for no clients. IPO investments made may be in amounts that are not equal or proportionate to the participating account’s asset size. The Adviser may make different investment decisions for different clients about the same IPO.
A Fund or other client’s access to profitable IPOs may be limited. Investing in IPOs is risky, and the prices of stocks purchased in IPOs tend to fluctuate more widely than stocks of more established companies. In addition, when a Fund or other client account is small, profitable IPOs may greatly increase the Fund or account’s total return, but the same level of performance is not likely to be achieved when an account grows larger.
“Hot issues” are IPOs that trade at a premium when secondary market trading begins. Typically, the demand for “hot issues” exceeds the supply, and the amount of any “hot issue” IPO made available to an investment manager like the Adviser is usually limited. In addition, IPO underwriters tend to offer “hot issues” on a priority basis to investors that have invested or are likely to invest in other offerings underwritten by the same firm or that have executed a significant volume of trades through the firm.
Lower-Quality Securities. The Multi-Asset Income Fund may invest up to 100% of its assets, the fixed income portion of the Balanced Fund may invest up to 20% of its total assets, the Total Return Bond Fund may invest up to 50% of its total assets and the Unconstrained Bond Fund may invest up to 70% of its total net assets in debt securities which are rated below “investment grade”, i.e., lower than “Baa” by Moody’s Investors Service, Inc. (“Moody’s”) or lower than “BBB” by Standard & Poor’s Ratings Services (“Standard & Poor’s”) or which are unrated and, in the case of the Balanced, Total Return Bond and Unconstrained Bond Funds, in the Adviser’s judgment, possess similar credit characteristics to below investment grade securities. Under normal market conditions, the Low Duration Bond Fund expects to invest no more than 50% of its total assets in below investment-grade debt securities. Below investment-grade debt securities are sometimes called “junk bonds”. See Appendix A - “Bond Ratings” for additional information regarding ratings of debt securities. The Adviser considers the ratings assigned by Standard & Poor’s or Moody’s as one of several factors in its independent credit analysis of issuers. Such securities are considered by Standard & Poor’s and Moody’s to have varying degrees of speculative characteristics. Consequently, although securities rated below investment grade can be expected to provide higher yields, such securities may be subject to greater market price fluctuations and risk of loss of principal than lower yielding, higher rated debt securities. For the Balanced Fund, investments in such securities will be made only when, in the judgment of the Adviser, such securities provide attractive total return potential relative to the risk of such securities, as compared to higher quality debt securities.
Mortgage-Backed Securities. Mortgage-backed securities represent direct or indirect participations in, or are secured by and payable from, mortgage loans secured by real property, and include single- and multi-class pass-through securities and collateralized mortgage obligations. Such securities may be issued or guaranteed by U.S. government agencies or instrumentalities, such as the Federal Home Loan Mortgage Corporation, Government National Mortgage Association and the Federal National Mortgage Association, or by private issuers, generally originators and investors in mortgage loans, including savings associations, mortgage bankers, commercial banks, investment bankers, insurance companies and special purpose entities (collectively, “private lenders”). Mortgage-backed securities issued by private lenders may be supported by pools of mortgage loans or other mortgage-backed securities which are typically issued without any governmental guarantee of the underlying mortgage assets but with some form of non-governmental credit enhancement.
The rate of principal payment on mortgage-backed securities generally depends on the rate of principal payments received on the underlying assets that in turn, may be affected by a variety of economic and other factors. As a result, the yield on any mortgage-backed security is difficult to predict with precision and actual yield to maturity may be more or less than the anticipated yield to maturity. The yield characteristics of mortgage-backed securities differ from those of traditional debt securities. Among the principal differences are that interest and principal payments are made more frequently on mortgage-backed securities, usually monthly, and that principal may be prepaid at any time because the underlying mortgage loans or other assets generally may be prepaid at any time. As a result, if the Fund purchases these securities at a premium, a prepayment rate that is faster than expected will reduce yield to maturity, while a prepayment rate that is slower than expected will have the opposite effect of increasing the yield to maturity. Conversely, if the Fund purchases these securities at a discount, a prepayment rate that is faster than expected will increase yield to maturity, while a prepayment rate that is slower than expected will reduce yield to maturity. Amounts available for reinvestment by the Fund are likely to be greater during a period of declining interest rates and, as a result, are likely to be reinvested at lower interest
rates than during a period of rising interest rates. Accelerated prepayments on securities purchased by the Fund at a premium also impose a risk of loss of principal because the premium may not have been fully amortized at the time the principal is prepaid in full. The market for privately issued mortgage-backed securities is smaller and less liquid than the market for government-sponsored mortgage-backed securities.
Mortgage-backed securities may be issued in either a single class or in multiple classes, which are commonly referred to as a CMO. Multiple classes may permit the issuance of securities with payment terms, interest rates, or other characteristics differing both from those of each other and from those of the underlying assets. Examples include so-called “strips” (mortgage-backed securities entitling the holder to disproportionate interests with respect to the allocation of interest and principal of the assets backing the security), and securities with class or classes having characteristics that mimic the characteristics of non-mortgage-backed securities, such as floating interest rates (i.e., interest rates which adjust as a specified benchmark changes) or scheduled amortization of principal.
The Balanced, Government Securities, Low Duration Bond, Total Return Bond and Unconstrained Bond Funds may transact in TBA swaps. Mortgage-backed securities are generally traded on a “to-be-announced”, or TBA, basis. In a TBA trade, the seller of the mortgage-backed security agrees on a sale price, but does not specify which particular securities will be delivered to the buyer on settlement day. Instead, only a few basic characteristics of the securities are agreed upon, such as the coupon rate and the face value. A TBA swap is a standard market transaction involving an agreement to purchase one agency mortgage-backed security and a simultaneous agreement to sell a different agency mortgage-backed security. Sales of TBA securities, including those that the Fund does not own, may be used by the Fund’s portfolio managers to more efficiently maneuver around the mortgage-backed security market, hedge overall mortgage risk and adjust exposure to certain securities without having to restructure cash and duration profiles.
Z-tranches (or Z bonds), also known as Accretion-Directed Bonds or Accrual Bonds, are classes of CMOs that pay no interest for an extended period of time. In lieu of monthly interest payments, a Z-tranche is credited the monthly “accrued interest” in the form of accreted principal value or negative amortization. During the accrual period, the principal amount outstanding of the Z-tranche increases at a fixed compounding interest rate eliminating reinvestment risk should interest rates decline. Z-tranches are typically structured to be the last cash-flow tranche of a CMO structure possessing average life of 18 to 22 years, although some may be structured to carry intermediate average lives. After the earlier tranches of the CMO structure have been retired, the Z-tranche starts to receive cash payments that include both principal and interest on a monthly basis. Z-bonds are generally considered long-duration assets whose prices can fluctuate significantly with changes in interest rates.
The mortgage market in the United States recently has experienced difficulties that may adversely affect the performance and market value of certain of a Fund’s mortgage-related investments. Delinquencies and losses on mortgage loans (including subprime and second-lien mortgage loans) generally have increased recently and may continue to increase, and a decline in or flattening of real-estate values (as has recently been experienced and may continue to be experienced in many housing markets) may exacerbate such delinquencies and losses. Also, a number of mortgage loan originators have recently experienced serious financial difficulties or bankruptcy. Reduced investor demand for mortgage loans and mortgage-related securities and increased investor yield requirements have caused limited liquidity in the secondary market for mortgage-related securities, which can adversely affect the market value of mortgage-related securities. It is possible that such limited liquidity in such secondary markets could continue or worsen.
Municipal Bond Insurance. Certain of the municipal obligations held in the portfolio of the fixed income and allocation funds may be insured. Different types of such insurance include a “New Issue Insurance Policy”, a “Mutual Fund Insurance Policy” or a “Secondary Market Insurance Policy”.
A New Issue Insurance Policy is obtained by the issuer of the securities, and all premiums for such a policy are paid in advance by the issuer. Such policies are generally used by an issuer to increase the credit rating of a lower-rated security, and therefore may increase both the purchase price and the subsequent resale value of a security for the Fund’s portfolio. They are non-cancellable and continue in force as long as the securities are outstanding and the respective insurers remain in business. Premiums for issuer insurance are paid in advance by the issuer and are reflected in a somewhat higher purchase price paid by the Funds for these obligations. The creditworthiness of the issuer will be evaluated in order to determine its ability to meet its obligations to pay interest and repay principal. The insurance covers the event that the issuer defaults on an interest payment or principal repayment; if this occurs, the insurer will be notified and will make payment to the bondholders. There is, however, no guarantee that the insurer will meet its obligations. These insurance policies do not protect bondholders from adverse changes in interest rates.
A Mutual Fund Insurance Policy is used to guarantee specific bonds only while owned by a mutual fund. If the Funds were to purchase such a policy, payment of the annual premiums would reduce the Fund’s current yield.
A Secondary Market Insurance Policy is purchased by an investor subsequent to a security’s issuance and generally insures a particular security for the remainder of its term. The fixed income and allocation funds may purchase securities which already have been insured
under a Secondary Market Insurance Policy by a prior investor, or the Funds may purchase such a policy from a vendor providing such a service.
Real Estate Investment Trusts. The Funds may invest in real estate investment trusts (“REIT”). REITs are entities that invest in different kinds of real estate or real estate related assets, including shopping centers, office buildings, hotels, and mortgages secured by real estate. There are basically three types of REITs: (a) equity REITS, the most common type of REIT, invest in or own real estate and make money for investors from the rents they collect; (b) mortgage REITs lend money to owners and developers or invest in financial instruments secured by mortgages on real estate; and (c) hybrid REITS are a combination of equity and mortgage REITs. The Code lists the conditions a company must meet to qualify as a REIT. For example, the company must pay 90% of its taxable income to shareholders every year. It must also invest at least 75% of its total assets in real estate-related assets, cash items and government securities and generate 75% or more of its gross income from investments in or mortgages on real property.
Repurchase Agreements. Each of the Funds to a limited extent may enter into repurchase agreements with selected banks and broker-dealers under which the Fund purchases securities issued or guaranteed by the U.S. government or its agencies or instrumentalities (“U.S. Government Securities”) and agrees to resell the securities at an agreed upon time and at an agreed upon price. The difference between the amount a Fund pays for the securities and the amount it receives upon resale is interest income to the Fund. Failure of the seller to repurchase the securities as agreed may result in a loss to a Fund if the market value of the securities has fallen to less than the repurchase price. In the event of such a default, a Fund may also experience certain costs and be delayed or prevented from recovering or liquidating the collateral securities, which could result in further loss to a Fund. The Funds will use repurchase agreements as a means of making short-term investments of seven days or less and in aggregate amounts of not more than 25% of the net assets of the Fund. All repurchase agreements used by the Funds will provide that the value of the collateral underlying the repurchase agreement always will be equal to at least 102% of the repurchase price. The Adviser will monitor on a continuing basis the creditworthiness of the counterparty to each repurchase agreement and will enter into such agreement only if it determines that the credit risk of such a transaction is minimal.
Sector Concentration. From time to time, a Fund may invest substantially in a particular sector. Returns in an economic sector may trail returns from other economic sectors. As a group, sectors tend to go through cycles of doing better or worse than the securities market in general. These periods may last several years. In addition, the sectors that dominate the market change over time.
Consumer Cyclicals. Companies in this sector are subject to changing levels of consumer confidence and spending, changes in demographics and consumer tastes, and interest rate levels.
Consumer Staples. This sector is subject to government regulations regarding food additives and production methods. In addition, tobacco companies may be adversely affected by legislation and/or by litigation. Also, the success of food and soft drink companies may be strongly affected by fads, marketing campaigns and other factors affecting supply and demand.
Energy. The securities of energy companies are subject to changes in value and dividend yield that depend to a large extent on the price and supply of energy fuels. Swift price and supply fluctuations of energy fuels may be caused by events relating to international politics, energy conservation, the success of exploration projects, currency exchange rate fluctuations, and tax and other regulatory policies of various governments.
Financials. Companies in the financials sector are subject to extensive governmental regulation, which may limit both the amounts and types of loans and other financial commitments they can make, and the rates and fees they can charge. Profitability is largely dependent on the availability and cost of capital, and can fluctuate significantly when interest rates change. Credit losses resulting from financial difficulties of borrowers also can negatively impact the sector.
Healthcare. Companies in the healthcare sector are subject to patent considerations, regulatory approval of products and other government regulation, and rapid obsolescence of their products and services.
Industrial. Companies in the industrial sector are affected by supply and demand for their specific product or service and for industrial sector products in general. Government regulation, world events and economic conditions will affect the performance of these companies. Transportation stocks, in particular, are cyclical and have occasional sharp price movements from changes in the economy, fuel prices, labor agreements and insurance costs.
Materials. Companies in the materials sector may be affected by the level and volatility of commodity prices, the exchange value of the dollar, import controls, and worldwide competition. Other risks may include liability for environmental damage, depletion of resources, and safety and pollution control laws. This sector may also be affected by capital spending, profitability, interest rates, economic cycles, technology advancements, labor relations, and government regulations.
Technology. The value of companies in the technology sector is subject to rapidly changing technology, government regulation, and relatively high risks of obsolescence caused by scientific and technological advances. Smaller companies in this sector face greater risk of business failure. Also, the securities of these smaller companies may have higher price/earnings (P/E) ratios than the general stock market. The higher the P/E, the more earnings growth investors are expecting. However, stocks with a higher P/E are considered riskier than stocks with a lower P/E, lower growth, and proven earnings.
Telecommunications. This sector’s risks include rapid obsolescence, lack of standardization and/or compatibility with existing technologies, and a dependency on patent and copyright protection. Both federal and state regulations may affect the prices of securities in this sector. The sector is also subject to heavy market share competition and foreign competition. The sector has seen heavy consolidation, which may lead to greater regulatory oversight.
Utilities. Utility companies are at risk for increases in fuel and other operating costs; the cost of borrowing to finance capital construction; restrictions on operations, costs and delays in connection with environmental and nuclear safety regulations; and problems obtaining natural gas for resale or fuel for generating electricity. Other risks include those related to the power plants construction and operation; energy conservation efforts and regulatory changes.
Securities Lending Program. In a securities lending program, a Fund may lend securities to broker-dealers and other institutional borrowers that meet credit requirements and other criteria. Typically, the criteria include that the borrower pledges to the Fund cash collateral (or other approved high quality collateral) in an amount equal to at least 100% of the market value of the securities loaned (with such collateralization valued by the securities lending agent on a daily basis and adjusted accordingly). The securities lending agent pays to the Fund a negotiated percentage of the interest earned on investments of cash collateral and of the lending fee paid by the borrower (when non-cash collateral is pledged by the borrower). In determining whether to lend securities to a particular broker-dealer or institutional borrower, the securities lending agent will generally consider, and during the period of the loan will monitor, all relevant facts and circumstances of the securities loan including the creditworthiness of the borrower. The Fund retains the authority to terminate a securities loan. The Fund pays reasonable administrative and custodial fees in connection with each securities loan, and a negotiated portion of the interest earned on the investment of the cash collateral first to the borrower (as a rebate) and, to the extent of any remaining earned interest, a negotiated percentage to the securities lending agent. The Fund receives from the borrower amounts equivalent to any dividends, interest, or other distributions while the securities are on loan (“substitute payments”). Substitute payments are not to be treated as either dividends or interest received with respect to the loaned securities for federal income tax purposes. The Fund retains certain ownership rights with respect to the loaned securities (such as voting and subscription rights, and rights to dividends, interest, or other distributions) when retaining such rights is considered to be in the Fund’s best interest. The cash collateral received from each borrower will be invested by the securities lending agent in high-quality investments (including money market instruments and repurchase agreements). Such investments may include investments in mutual funds or similar investment companies that are affiliated with the securities lending agent or the Fund’s custodian, subject to compliance with all applicable laws, regulations and orders. Even though securities lending usually does not impose market risks on the lending Fund, as with any extension of credit, there are risks of delay in recovery of the loaned securities and in some cases loss of rights in the collateral should the borrower of the securities fail financially. In addition, the value of the collateral taken as security for the securities loaned may decline in value or may be difficult to convert to cash in the event that a Fund must rely on the collateral to recover the value of the securities. Moreover, if the borrower of the securities is insolvent, under current bankruptcy law, the Fund could be ordered by a court not to liquidate the collateral for an indeterminate period of time. If the borrower is the subject of insolvency proceedings and the collateral held might not be liquidated, the result could be a material adverse impact on the liquidity of the lending Fund. A Fund will not lend securities having a value in excess of 33 1/3% of its assets, including collateral received for loaned securities (valued at the time of any loan).
Short-Hold Trading Strategy. The Multi-Asset Income Fund, the Low Duration Bond Fund, the Total Return Bond Fund, the Unconstrained Bond Fund and the fixed-income portion of the Balanced Fund may have the opportunity to participate in the primary market for new fixed-income issues offered by issuers and/or underwriters at prices the Adviser deems favorable, based on factors such as the supply of bonds in the marketplace and economic conditions. When one of the Funds receives less than an optimal allocation in such new issues or when it is otherwise in the Fund’s bests interests, the Fund may decide to purchase these new security issues at the negotiated opening price, and shortly thereafter offer to sell all or a part of the Fund’s purchased allocation to third-party interested purchasers at a higher price, depending on market conditions. Because these Funds are “at risk” for the purchased amount of these new issues, they may experience losses on these trades.
Syndicated and Senior Bank Loans. The fixed income and allocation Funds may invest in syndicated bank loans. Syndicated bank loans are interests in amounts owed by a corporate, governmental or other borrower to another party. They may represent amounts owed to lenders or lending syndicates to suppliers of goods or services, or to other parties. A syndicated loan typically is originated, negotiated and structured by a U.S. or foreign commercial bank (the “Agent”) for a group of loan investors (“Loan Investors”). The Agent typically administers and enforces the loan on behalf of the other Loan Investors in the syndicate. In addition, an institution,
typically but not always the Agent, holds any collateral on behalf of the Loan Investors. Loan interests primarily take the form of participation interests. They may also take the form of assignments purchased in the primary or secondary market, or novations of, a loan. The purchase of a loan participation typically results in the Fund having a contractual relationship only with the Loan Investor who sold the participation, not with the borrower. As a result, the Fund may have the right to receive payments of principal, interest and any fees to which it is entitled only from the Loan Investor selling the participation and only upon receipt by such Loan Investor of such payments from the borrower. In connection with purchasing participations, the Fund generally will have no right to enforce compliance by the borrower with the terms of the loan agreement, nor any rights with respect to any funds acquired by other Loan Investors through setoff against the borrower and the Fund may not directly benefit from the collateral supporting the senior loan in which it has purchased the participation. As a result, the Fund may assume the credit risk of both the borrower and the Loan Investor selling the participation. If a Loan Investor selling a participation becomes insolvent, the Fund may be treated as a general creditor of such Loan Investor. The Fund may also purchase assignments from the Agent or other Loan Investors. The purchaser of an assignment typically succeeds to all the rights and obligations under the Loan Agreement of the assigning Loan Investor and becomes a Loan Investor under the Loan Agreement with the same rights and obligations as the assigning Loan Investor. Assignments may, however, be arranged through private negotiations between potential assignees and potential assignors, and the rights and obligations acquired by the purchaser of an Assignment may differ from, and be more limited than, those held by the assigning Loan Investor.
Each Fund that invests in bank loans could be held liable as co-lender under legal theories of lender liability. In addition, if the loan is foreclosed, the Fund could be part owner of any collateral and could bear the costs and liabilities of owning and disposing of the collateral. Syndicated bank loans may not be readily marketable and may be subject to restrictions on resale. In addition, some syndicated bank loans may not be rated by major rating agencies and may not be protected by the securities laws. Investments in syndicated bank loans involve risk of loss in case of default or insolvency of the borrower.
Investments in syndicated bank loans involve risk of loss in case of default or insolvency of the borrower. Syndicated bank loans may not be readily marketable and may be subject to restrictions on resale. In addition, bank loans are generally not covered by the federal securities laws.
The purchase of a loan participation typically results in the Fund having a contractual relationship only with the Loan Investor who sold the participation, not with the Borrower. As a result, the Fund may have the right to receive payments of principal, interest and any fees to which it is entitled only from the Loan Investor selling the Participation and only upon receipt by such Loan Investor of such payments from the Borrower. In connection with purchasing participations, the Fund generally will have no right to enforce compliance by the Borrower with the terms of the loan agreement, nor any rights with respect to any funds acquired by other Loan Investors through setoff against the Borrower and the Fund may not directly benefit from the collateral supporting the senior loan in which it has purchased the participation. As a result, the Fund may assume the credit risk of both the Borrower and the Loan Investor selling the participation. If a Loan Investor selling a participation becomes insolvent, the Fund may be treated as a general creditor of such Loan Investor.
A Fund may also purchase assignments from the Agent or other Loan Investors. The purchaser of an assignment typically succeeds to all the rights and obligations under the Loan Agreement of the assigning Loan Investor and becomes a Loan Investor under the Loan Agreement with the same rights and obligations as the assigning Loan Investor. Assignments may, however, be arranged through private negotiations between potential assignees and potential assignors, and the rights and obligations acquired by the purchaser of an Assignment may differ from, and be more limited than, those held by the assigning Loan Investor.
There may not be a readily available market for bank loans and, in some cases, this could result in a Fund disposing of such investments at a substantial discount from face value or holding such investment until maturity. In the event that a corporate borrower failed to pay its scheduled interest or principal payments on bank loan interests held by the Fund, the market value of the affected investment would decline, resulting in a loss of value of such investment to the Fund. Accordingly, such investments may result in the income level and net assets of the Fund being reduced.
U.S. Government Securities. U.S. government securities are issued by the U.S. government or its agencies or instrumentalities, including Treasury bills, notes, and bonds; securities issued by the Federal Housing Administration, Farmers Home Administration, Export-Import Bank of the United States, Federal Farm Credit Bank, Small Business Administration, and the Government National Mortgage Association (“GNMA”), including GNMA pass-through certificates, whose securities are supported by the full faith and credit of the United States; securities issued by the Federal Home Loan Banks, Federal Intermediate Credit Banks, and the Tennessee Valley Authority, which securities are supported by the right of the agency to borrow from the U.S. Treasury; securities issued by the Federal National Mortgage Association (“FNMA”), which securities are supported by the right of FNMA to borrow from the U.S. Treasury Department (e.g., the Federal Home Loan Banks); securities issued by the Federal Home Loan Mortgage Corporation (“FHLMC”); and securities issued by the Student Loan Marketing Association, the Inter-American Development Bank, and International Bank for Reconstruction and Development, which securities are supported only by the credit of such agencies. Although
the U.S. government provides various types of financial support to U.S. government-sponsored agencies or instrumentalities, no assurance can be given that it will always do so and not all U.S. government securities are guaranteed or backed by the full faith and credit of the U.S. government. The U.S. government and its agencies and instrumentalities do not guarantee the market value of their securities. Consequently, the market value of such securities will fluctuate. On September 6, 2008, Director James Lockhart of the Federal Housing Finance Agency (“FHFA”) appointed FHFA as conservator of both FNMA and FHLMC. In addition, the U.S. Treasury Department agreed to provide FNMA and FHLMC up to $100 billion of capital each on an as needed basis to insure that they continue to provide liquidity to the housing and mortgage markets.
Variable or Floating Rate Notes. The fixed income and allocation Funds may invest in variable or floating rate demand obligations, which are securities that provide for adjustment in their interest rates at intervals ranging from daily to up to one year based upon prevailing market rates for similar investments and an adjustment formula that is intended to maintain the market value of the security at par. These obligations normally have a stated maturity in excess of one year but permit the holder to demand repayment of principal plus payment of accrued interest at any time upon a specified number of days’ notice. Where necessary to ensure that an unrated note is of high quality, the Funds will require that the issuer’s obligation to pay the principal of the note be backed by an unconditional domestic or foreign bank letter or line of credit, guarantee or commitment to lend. In such a case, the quality of the bank will be looked to for purposes of satisfying the Fund’s quality standards. Although there may be no active secondary market for a particular instrument, the Funds may, upon notice, exercise a note’s demand feature or resell the note at any time to a third party. If a significant portion of a Fund’s assets were invested in notes of a single issuer, however, the issuer’s ability to meet the demand feature could affect that Fund’s liquidity. In determining average weighted portfolio maturity, an instrument will be deemed to have a maturity equal to the longer of the period remaining to the next interest rate adjustment or the demand notice period.
When Issued Purchases. The fixed income and allocation Funds may purchase bonds on a when issued or delayed-delivery basis. Delivery of and payment for these bonds could take place a month or more after the date of the transaction. During this time, the value of the purchase commitment will fluctuate with the market for these bonds. However, when a Fund makes a commitment to purchase the bonds, the payment and interest terms of these issues are fixed. A Fund will make these commitments only with the intention of acquiring the bonds, but may sell those bonds before settlement date if the Adviser believes that would benefit shareholders. When a Fund purchases bonds on a when issued or delayed-delivery basis, it will provide its custodian with enough cash or short-term investments to pay the purchase price of these bonds upon delivery. This policy ensures that when issued or delayed-delivery purchases will not be used as a form of borrowing to make investments.
MANAGEMENT OF THE FUNDS
The Board of Directors of the Company is responsible for the management of the business and affairs of the Funds in accordance with the laws of the State of Maryland and the 1940 Act. The Board currently consists of eight Directors, six of whom are not “interested persons” of the Company or the Funds as defined in the 1940 Act (the “Independent Directors”). The Chairman of the Board is Mehran Assadi. Mr. Assadi is an “interested person” of the Company because he is president and chief executive officer of National Life Holding Company, NLV Financial Corporation and National Life Insurance Company, all of which are affiliates of the Adviser. The Directors have determined that an interested Chairman is appropriate and benefits shareholders because an interested Chairman has a professional stake in the quality and continuity of services provided to the Funds. The Independent Directors have determined that they can act independently and effectively without having an Independent Director serve as Chairman and that a key structural component for assuring that they are in a position to do so is the Lead Independent Director. John Raisian serves as the Lead Independent Director and as such (i) acts as a liaison between the Independent Directors and management with respect to matters important to the Independent Directors and (ii) identifies matters of special interest to be addressed by management when preparing Board meeting agendas.
The Board has two standing committees: the Audit, Compliance and Valuation Committee (the “Audit Committee”) and the Governance, Contracts and Nominating Committee (the “Governance Committee”). Each of the Audit and Governance Committees is comprised of all of the Independent Directors. The Independent Directors are: Gary Dunton, Deborah Miller, John Pelletier, John Raisian, Richard H. Showalter, Jr. and Angela E. Vallot.
The Audit Committee reviews reports by management and the Funds’ independent auditor relating to the integrity of the Funds’ financial reporting process and their internal controls, and, as appropriate, the internal controls of certain service companies; is directly responsible for the appointment, compensation, retention and oversight of the Funds’ independent auditor; oversees the quality, clarity and objectivity of the Funds’ financial statements and the independent audit thereof; provides an avenue of communication among the Board, management, and the independent auditor; acts as a liaison between the Board and the Chief Compliance Officer of the Funds (the “CCO”), and monitors the performance by the CCO of the CCO’s responsibilities under the procedures approved by the Board pursuant to Rule 38a-1 under the 1940 Act; oversees the procedures utilized for the valuation of portfolio securities owned by the
Funds; and oversees the conflicts review process. The Board has adopted a written charter for the Audit Committee. During the fiscal year ended November 30, 2016, the Audit Committee held six meetings.
With respect to governance matters, the Governance Committee reviews board governance practices and procedures, board committee assignments and responsibilities, Director compensation and Director self-assessment. With respect to nominations of Directors, the Governance Committee reviews the composition of the Board, considers nominations for membership on the Board and evaluates candidates’ qualifications for Board membership and their independence from the Funds’ investment advisers and other principal service providers. When considering nominations, the Governance Committee may consider referrals from a variety of sources, including current Directors, management of the Funds, the Company’s legal counsel and shareholders who submit nominations in accordance with any procedures specified in the Funds communications to shareholders. In its evaluation of potential nominees, the Governance Committee may consider such factors as it deems appropriate, including the contribution that the person can make to the Board, with consideration being given to the person’s business and professional experience, the specific financial, technical or other expertise possessed by the person and the person’s reputation for high ethical standards and personal and professional integrity. Independent Director nominee recommendations from shareholders should be sent to the Secretary of the Company at the address on the cover page of this Statement of Additional Information. With respect to contract matters, the Governance Committee requests information regarding, and evaluates the terms of, the advisory agreements, administrative services agreements, distribution agreements and related distribution plans pursuant to Rule 12b-1 relating to the Funds. The Governance Committee also coordinates the annual review process of the Funds’ CCO. The Governance Committee held four meetings during the fiscal year ended November 30, 2016.
The Board’s risk management role for the Funds is one of informed oversight, not active management. The Board has determined that the Company’s leadership structure is appropriate because its majority independent composition allows the Board to exercise independent judgment over management and to allocate areas of responsibility among committees and the full Board to enhance effective oversight.
Day-to-day risk management of the Funds is the responsibility of the Adviser. The Funds are subject to a number of risks, including investment/portfolio, valuation, operational/enterprise and compliance risks. The Board considers risk management issues at its regular board meetings as part of its general oversight responsibilities through reports of the Adviser’s senior management and senior officers of the Funds that address a variety of risk areas relating to the Funds, including but not limited to investment/portfolio risks, valuation risks, operational/enterprise risks and compliance risks. In addition, the Independent Directors exercise oversight of fund risk through the Audit Committee, which considers risks relating to financial reporting and controls.
With respect to investment/portfolio risk, the Board receives regular written reports from the Funds’ portfolio managers describing and analyzing the investment performance of the Funds. In addition, the Board meets at least annually with the Funds’ portfolio managers to discuss portfolio performance, including investment risk. The Board also meets regularly with the Chief Executive Officer of the Adviser to discuss the Funds’ performance and investment risk.
With respect to valuation risk, the Board receives regular written reports from the Funds’ fund administration and accounting personnel describing the number of securities that were fair valued in a particular portfolio, the reasons for the fair valuation and the process used to arrive at the fair value. The Audit Committee reviews the valuation procedures and pricing results with the Funds’ auditors each year in connection with the review of the results of the audit of each Fund’s year-end financial statements.
Operational/enterprise risks are addressed through regular meetings with and reports from senior officers of the Adviser and the Funds’ primary service providers that cover financial, operational, reputational and personnel matters, among others.
With respect to compliance risk, pursuant to Rule 38a-1 under the 1940 Act, the Board has appointed a CCO of the Funds, who is responsible for the implementation and testing of the Funds’ compliance program. The CCO is an active participant in the Funds’ operations. The CCO provides the Board with quarterly reports on compliance matters, including an annual written report summarizing his review and assessment of the adequacy of the Funds’ compliance program and of the compliance programs of the Funds’ service providers. In addition, the CCO provides the Board with a written compliance risk identification and assessment report annually.
The Board appoints the officers of the Company, who run the day-to-day operations of the Funds under the Board’s supervision. The Adviser, under agreements with the Company, supervises and assists in the management of the Funds and the purchase and sale of securities.
Biographical Information. Described below for each Director are specific experiences, qualifications, attributes, or skills that support a conclusion that he or she should serve as a Director of the Company as of the date of this Statement of Additional Information and in
light of the Company’s business and structure. The role of an effective Director inherently requires certain personal qualities, such as integrity, as well as the ability to comprehend, discuss and critically analyze materials and issues that are presented so that the Director may exercise judgment and reach conclusions in fulfilling his or her duties and fiduciary obligations. It is believed that the specific background of each Director evidences those abilities and is appropriate to his or her serving on the Company’s Board of Directors. Each Director serves the ten (10) series of the Company. Additional information about each Director is set forth in the tables below. Each Director serves until his or her successor is elected and qualified, or until his or her death, resignation, or removal as provided in the Company’s governing documents or by statute.
Mr. Assadi has been president and chief executive officer of National Life Holding Company (a mutual insurance company) and National Life Insurance Company (“National Life”) since 2009. Mr. Assadi has held other leadership positions at National Life Holding Company and National Life since 2003, and, prior to 2003, held various senior positions at other insurance companies. Mr. Assadi received a B.S. in Business from Towson University, and has a Masters degree in Management Information Systems from the University of Baltimore. Mr. Assadi has served as a Director since March 11, 2015. The Directors believe Mr. Assadi is suitable to serve as Director because of his experience in the financial services industry and his participation in management.
Mr. Brownell has been president and chief executive officer of the Adviser since 2013, and was chief investment officer (“CIO”) of National Life from 2005 to 2016. Since joining National Life in 1992, Mr. Brownell has held a number of positions within what was formerly National Life Investment Management Company and later became the Adviser. Mr. Brownell held a number of positions within National Life prior to being named chief investment officer, including corporate bond portfolio manager and head of the fixed income group. As CIO, Brownell is responsible for setting the investment strategy and asset allocations for National Life Group’s investment portfolios. Before joining National Life, Mr. Brownell was an associate in GE Capital’s Corporate Finance Group in Stamford, Connecticut. He earned his CFA designation in 1994, his undergraduate degree at Bowdoin College, and an MBA from Babson Graduate School of Management. Mr. Brownell has served as a Director since March 11, 2015. The Directors believe Mr. Brownell is suitable to serve as Director because of his significant experience in the asset management business, and his day-to-day working knowledge of the Corporation, the Adviser and the performance of the Funds.
Mr. Dunton has served as an Independent Director since January 1, 2013. He is self-employed as a consultant in the insurance industry. Prior to 2008, Mr. Dunton held various leadership positions with MBIA, Inc., a specialized financial services company, including chief operating officer, and most recently, chairman, president and CEO. Mr. Dunton has also held leadership positions with USF&G Insurance Company and AETNA Life & Casualty Company. Through his significant experience in the financial services industry, Mr. Dunton offers the Board his leadership and analytical skills, and experience in asset management. He holds the Chartered Financial Analyst designation. Mr. Dunton is a designated “audit committee financial expert”.
Ms. Miller has served as an Independent Director since 1995, and served as Chair of the Governance Committee from 2009 to 2011. Those positions have provided her with extensive knowledge of the operations and business of the Company and the Funds. As an executive officer of her own management consulting firm, Ms. Miller has considerable experience in the management of operating companies. She also has experience as a board member of other entities.
Mr. Pelletier has served as an Independent Director of the Company since January 1, 2013. Since 2010, Mr. Pelletier has been the Director of the Center for Financial Literacy at Champlain College in Burlington, Vermont, and is the principal of Sterling Valley Consulting LLC, a consulting firm he founded in 2009. Mr. Pelletier is an attorney by training, and prior to 2009, he held leadership positions in the asset management firms Natixis Global Associates (chief operating officer, and prior to that, chief legal officer) and Eaton Vance Corporation (chief legal officer). Mr. Pelletier brings to the Board his considerable knowledge of the mutual fund industry and his knowledge of Board governance matters. Mr. Pelletier is a designated “audit committee financial expert”.
Mr. Raisian has served as an Independent Director of the Company since 1996, and as Lead Independent Director since January 1, 2013. These positions have provided Mr. Raisian, an economist and senior fellow of the Hoover Institution at Stanford University, with knowledge of the operations and business of the Company and the Funds, and has called upon him to exercise leadership and analytical skills.
Mr. Showalter has served as an Independent Director of the Company since 2003. He served as Lead Independent Director from 2005 through 2012. He has held the positions of Treasurer and Chief Financial Officer for companies within the Dartmouth-Hitchcock health care system. Those positions have provided Mr. Showalter with significant experience in accounting and financial matters. Mr. Showalter has served on the Audit Committee since 2003 and is a designated “audit committee financial expert.” Mr. Showalter has served as Chair of the Audit Committee since June 2012.
Ms. Vallot has served as an Independent Director of the Company since 1996. She has served as Chair of the Governance Committee since January 1, 2013 and held this position previously from 2004 to 2009. These roles have provided her with knowledge of the
operations and business of the Company and the Funds. Ms. Vallot has experience as a management consultant, and has advised Fortune 500 companies on a broad range of legal issues as an attorney in private practice.
| Name, Address, Age | Position and Length
of Time Served | Principal Occupation(s) During Past Five Years | Public Directorships |
Gary Dunton (61)
National Life Drive
Montpelier, VT 05604 | Director, since 2013 | Dunton Consulting (an insurance industry consulting firm) – Principal, since 2008; MBIA, Inc. – Chairperson, President and Chief Executive Officer, from 2004 to 2008; Sentinel Variable Products Trust (“SVPT”) – Trustee, since May 2016 | None |
Deborah G. Miller (67)
National Life Drive
Montpelier, VT 05604 | Director, since 1995; Governance, Contracts and Nominating Committee Chairperson, from 2009 to 2011 | Enterprise Catalyst Group (a management consulting firm) – Chief Executive Officer, since 2003; Ascendent Systems (a voice and messaging systems company) – Chief Executive Officer, from 2005 to 2007; SVPT – Trustee, since May 2016 | Libby Glass – Director, since 2003; Wittenberg University – Director, since 1998 |
John Pelletier (53)
National Life Drive
Montpelier, VT 05604 | Director, since 2013 | Center for Financial Literacy at Champlain College – Director, since 2010; Sterling Valley Consulting LLC (a financial services consulting firm) – Principal, since 2009; Vermont Financial Literacy Commission – Co-Chairperson, since November 2015; Vermont’s Universal Children’s Higher Education Savings Account Program Advisory Committee – Chairperson, since November 2015; Eaton Vance Corporation – Chief Legal Officer, from 2007 to 2008; Natixis Global Associates – Chief Operating Officer, from 2004 to 2007; General Counsel, from 1997 to 2004; SVPT – Trustee, since May 2016 | None |
John Raisian, Ph.D. (67)
National Life Drive
Montpelier, VT 05604 | Director, since 1996; Lead Independent Director, since 2013 | Hoover Institution at Stanford University – Senior Fellow, since 1986; Director, from 1989 to 2015; SVPT – Trustee, since May 2015; Lead Independent Trustee, since June 2016 | None |
Richard H. Showalter (69)
National Life Drive
Montpelier, VT 05604 | Director, since 2003; Audit, Compliance and Valuation Committee Chairperson, since 2012; Lead Independent Director, from 2005 to 2012 | Dartmouth-Hitchcock – Senior Vice President and Treasurer, from 2007 to 2010; Dartmouth-Hitchcock Medical Center – Treasurer, from 1995 to 2010; Dartmouth-Hitchcock Alliance – Senior Vice President and Chief Financial Officer, from 1985 to 2008; Mary Hitchcock Memorial Hospital - Senior Vice President and Chief Financial Officer, from 1985 to 2007; Dartmouth-Hitchcock Clinic - Senior Vice President and Chief Financial Officer, from 1999 to 2007; SVPT – Trustee, since May 2016; Audit, Compliance and Valuation Committee Chairperson, since June 2016 | None |
Angela E. Vallot (60)
National Life Drive
Montpelier, VT 05604 | Director, since 1996; Governance, Contracts and Nominating Committee Chairperson, since 2013 and from 2004 to 2009 | VallotKarp Consulting (a diversity and inclusion consulting firm) – President, since 2004; Colgate-Palmolive Company (a consumer products company) – Vice President, from 2001 to 2003; Texaco, Inc. (an integrated energy company) – Director of Diversity, from 1997 to 2001; SVPT – Trustee, since May 2016; Governance, Contracts and Nominating Committee Chairperson, since June 2016 | None |
Certain biographical and other information relating to the Directors who are officers and/or “interested persons” of the Company as defined in the 1940 Act and to the other officers of the Funds is set forth below, including their ages, their business activities during the past five years, and the length of time served. As Directors, Messrs. Assadi and Brownell oversee all of the series of the Company. Each elected officer serves all series of the Company, and is elected by, and serves at the pleasure of, the Board.
| Name, Address, Age | Position and Length
of Time Served* | Principal Occupation(s) During Past Five Years | Public Directorships |
Mehran Assadi (58)**
National Life Drive
Montpelier, VT 05604 | Director and Chairperson, since 2015 | National Life Holding Company (a mutual insurance company) and National Life Insurance Company (“National Life”) – President and Chief Executive Officer, since 2009; President – Life and Annuity, from 2005 to 2009; Interim Chief Information Officer, from 2003 to 2005; NLV Financial Corporation - President and Chief Executive Officer, since 2009; Executive Vice President, from 2008 to 2009; SVPT – Trustee and Chairperson, since 2009 | None |
Thomas H. Brownell (56)**
National Life Drive
Montpelier, VT 05604 | Director, since 2015; President and Chief Executive Officer, since | National Life – Executive Vice President, since 2013; Executive Vice President and Chief Investment Officer, from 2013 to May 2016; Senior Vice President and Chief Investment Officer, from 2005 to | None |
| | 2013 | 2013; Sentinel Asset Management, Inc. (“Advisor”) – President and Chief Executive Officer, since 2013; SVPT – Trustee, since May 2016; President, since 2013 | |
Gregory D. Teese (49)
National Life Drive
Montpelier, VT 05604 | Chief Compliance Officer, since March 2016 | Advisor; National Variable Annuity Account II; National Variable Life Insurance Account – Chief Compliance Officer, since March 2016; SVPT – Chief Compliance Officer, since March 2016; Sentinel Financial Services Company(“SFSC”) – Chief Compliance Officer, since 2004; Vice President, since 1997; Equity Services, Inc. – Chief Compliance Officer, since 2004; Senior Vice President, since June 2009 | N/A |
Lisa F. Muller (49)
National Life Drive
Montpelier, VT 05604 | Secretary, since 2008 | SASI – President, Chief Executive Officer and Senior Counsel, since 2015; Advisor – Senior Counsel and Chief Operating Officer, since 2015; SFSC – Senior Counsel, since 2011; Counsel, from 2008 to 2011; National Life; Advisor; SASI – Senior Counsel, from 2011 to 2015; Counsel, from 2008 to 2011; SVPT – Secretary, since 2008; State of Vermont, Department of Banking and Insurance – Assistant General Counsel, from 2006 to 2008; Davis, Polk and Wardwell – Associate, from 2005 to 2006 and from 1999 to 2002; U.S. District Court N.D. Illinois – Law Clerk, from 2002 to 2004 | N/A |
John K. Landy (57)
National Life Drive
Montpelier, VT 05604 | Vice President, since 2002 | SASI – Senior Vice President, since 2006; SVPT – Vice President, since 2004; SASC – Senior Vice President, from 2004 to 2006; Vice President, from 1997 to 2004 | N/A |
Philip G. Partridge, Jr. (41)
National Life Drive
Montpelier, VT 05604 | Chief Financial Officer, since 2014 | Advisor – Vice President, since 2015; Chief Financial Officer, since 2014; SFSC – Vice President and Chief Financial Officer, since 2015; Vice President and Assistant Treasurer, from 2006 to 2015; Sentinel Administrative Services, Inc. (“SASI”) – Vice President and Chief Financial Officer, since 2015; SVPT – Vice President and Treasurer, since June 2016 | N/A |
Thomas P. Malone (60)
National Life Drive
Montpelier, VT 05604 | Vice President and Treasurer, since 1997 | SASI– Vice President, since 2006; SVPT – Assistant Vice President and Assistant Treasurer, since June 2016; Vice President and Treasurer, from 2000 to June 2016; SASC – Vice President, from 1998 to 2006 | N/A |
Scott G. Wheeler (51)
National Life Drive
Montpelier, VT 05604 | Assistant Vice President and Assistant Treasurer, since 1998 | SASI – Vice President, since 2007; Assistant Vice President, from 2006 to 2007; SVPT – Assistant Vice President and Assistant Treasurer, from 2004 to June 2016; SASC – Assistant Vice President, from 1998 to 2006 | N/A |
Lindsay E. Staples (35)
National Life Drive
Montpelier, VT 05604 | Assistant Secretary, since 2010 and from 2007 to 2009 | National Life – Senior Securities Paralegal, since 2010; SVPT – Assistant Secretary, since 2010 and from 2007 to 2009; National Life – Senior Compliance Associate, from 2009 to 2010; National Life – Securities Paralegal, from 2007 to 2009; Holman Immigration – Paralegal, from 2006 to 2007; Wilmer Cutler Pickering Hale and Dorr – Paralegal, from 2004 to 2006 | N/A |
* Each Officer is elected by, and serves at the pleasure of, the Board of the Funds.
** Mr. Assadi is an “interested person” of the Funds because he is the President and Chief Executive Officer of the Adviser’s parent company and Mr. Brownell is an “interested person” of the Funds because he is the President and Chief Executive Officer of the Adviser.
Other than the Chief Compliance Officer, the officers and Directors of the Company who are employees of National Life or its subsidiaries do not receive any compensation from the Funds. Effective January 1, 2016, each Director who is not an affiliate of the Adviser is paid an annual fee of $89,000. Each of the Lead Independent Director, the Chair of the Audit Committee and the Chair of the Governance Committees are paid an additional annual fee of $8,000. Directors are also reimbursed for travel and other out-of-pocket expenses incurred in connection with attending such meetings. The aggregate amount paid, including expense reimbursements, by the Company during the fiscal year ended November 30, 2016 to the officers and Directors as a group was $1,023,301.
The following table sets forth for the fiscal year ended November 30, 2016 compensation paid by the Company to the Independent Directors and the Chief Compliance Officer of the Funds:
| | | Pension or | |
| | Aggregate | Retirement Benefits | Total |
| | Compensation | Accrued as Part of | Compensation |
| Name | From Company | Fund Expense | From Company |
| Gary Dunton1 | 88,750 | - | 88,750 |
| Deborah G. Miller1 | 88,750 | - | 88,750 |
| D. Russell Morgan3 | 144,976 | - | 144,976 |
| John Pelletier1 | 88,750 | - | 88,750 |
| John Raisian1,2 | 96,750 | - | 96,750 |
| Richard H. Showalter, Jr1,2 | 96,750 | - | 96,750 |
| Gregory D. Teese4 | 144,976 | - | 144,976 |
| Angela E. Vallot1,2 | 96,750 | - | 96,750 |
| 1 | As of November 30, 2016, the total amount of deferred compensation (including interest) payable to or accrued for Mr. Dunton is $333,452, for Ms. Miller is $79,581, for Mr. Pelletier is $90,908, for Mr. Raisian is $99,133, for Mr. Showalter is $781,721, and for Ms. Vallot is $1,367,983. |
| 2 | Mr. Raisian was Lead Independent Director during the fiscal year ended November 30, 2016, Mr. Showalter was Chair of the Audit Committee and Ms. Vallot was Chair of the Governance Committee. |
| 3 | Mr. Morgan was also reimbursed for certain out-of-pocket business expenses. Mr. Morgan retired as the Company’s Chief Compliance Officer effective March 10, 2016 and was retained on a consulting basis until September 30, 2016. |
| 4 | Mr. Teese became Chief Compliance Officer of the Funds March 10, 2016. |
Share Ownership. Unless otherwise noted, information relating to each Director’s share ownership in the Funds as of December 31, 2016 is set forth in the chart below. The dollar ranges are as follows:
| A. | None |
| B. | $1 to $10,000 |
| C. | $10,001 to $50,000 |
| D. | $50,001 to $100,000 |
| E. | Over $100,000 |
For purposes of the chart below, the Funds are designated as follows
| BL | - | Balanced Fund | IE | - | International Equity Fund |
| CM | - | Multi-Asset Income Fund | SC | - | Small Company Fund |
| CO | - | Sustainable Core Opportunities Fund | SM | - | Low Duration Bond Fund |
| CS | - | Common Stock Fund | TR | - | Total Return Bond Fund |
| GS | - | Government Securities Fund | | | |
| UB | - | Unconstrained Bond | | | |
| | | | Aggregate Dollar Range |
| Name | Dollar Range of Equity Securities in Fund | of Equity Securities in |
| | | | All Funds |
| Interested Directors: | | | |
| Mehran Assadi1 | CS-E | IE-C | E |
| | | | |
| Thomas H. Brownell1,3 | IE-C | SM-C | E |
| | TR-CE | | |
| Independent Directors: | | | |
| Gary Dunton2 | GS-E | SM-E | E |
| | | | |
| Deborah G. Miller2 | CS-D | | D |
| John Pelletier2 | BL-E | IE-C | E |
| | CM-C | TR-C | |
| | CS-C | | |
| | | | |
| John Raisian2 | CS-D | SC-C | E |
| | | | |
| Richard H. Showalter, Jr2 | BL-C | GS-E | E |
| | CO-C | IE-E | |
| | CM-C | CS-E | |
| | SC-E | UB-C | |
| | | | |
| Angela E. Vallot2 | BL-C | SC-E | E |
| | CS-E | SM-E | |
| | IE-E | TR-E | |
| | UB-B | CM-C | |
1Mr. Assadi and Mr. Brownell may have indirect ownership positions in the listed Funds through National Life’s 401(k) and /or Performance Incentive Plans. These positions were included when calculating the dollar ranges shown.
2 These Directors participate in a deferred compensation plan, under which they can designate the deferred compensation to track the performance of one or more Funds. These allocations are included in the above.
3Mr. Brownell’s assets are reported as of January 24, 2017.
Codes of Ethics. The Board has adopted a Code of Ethics pursuant to Rule 17j-1 under the 1940 Act that covers the Funds, and the Adviser and SFSC have also each adopted a Code of Ethics under Rule 17j-1. The Codes of Ethics establish procedures for personal investing and restrict certain transactions. Employees subject to the Codes of Ethics may invest in securities for their personal investment accounts, including securities that may be purchased or held by the Funds.
PORTFOLIO MANAGERS
Portfolio Manager Compensation.
All portfolio managers are compensated by a combination of fixed salaries and incentive compensation. The fixed salary portion of compensation is generally based on comparative investment management industry data. Portfolio managers who manage more than one fund and/or also manage accounts for National Life and its affiliates have a share of their compensation based on estimated effort for each area and each type of investment or fund. Incentive compensation can be a significant portion of total compensation. Incentive compensation with respect to the management of the Funds is primarily based on relative performance within a Funds Morningstar category. Relative results for the most recent 1-, 3- and 5-year periods are taken into account, with 25% based on the 1-year relative performance, 50% based on the 3-year relative performance, and 25% based on the 5-year relative performance. Generally, no incentive compensation is paid for performance below a Morningstar 50th percentile ranking. The 1-, 2-, 3- and, if applicable, 4-year performance may be weighted more significantly for a new Fund prior to its 3-year and/or 5-year anniversary. Mr. Ronovech’s performance compensation in year one is based on a separate agreement. After one year, his performance compensation will be based on actual yearly results until year 5 when the calculation will follow the 1-, 3- and 5-year periods. Incentive compensation for Mr. Manion , Ms. Ocampo, and Ms. Roper is based primarily on the performance of the Common Stock Fund. Incentive compensation for Mr. Ronovech is based primarily on the performance of the Small Company Fund. Mr. Boczek’s incentive compensation is based primarily on the performance of the International Equity Fund. Mr. Hassler’s incentive compensation is based in part on the performance of the National Life fixed income accounts, and in part on the performance of the Government Securities Fund. As Head of Investments with the Adviser, Mr. Doiron’s incentive compensation is based in part on the performance of the National Life fixed income accounts, and in part on the performance of the fixed income and allocation Funds (primarily the Total Return Bond Fund).
Portfolio managers are eligible to receive additional incentive compensation based on certain qualitative factors, such as contributions to the Adviser’s and Company’s growth and success through leadership, expertise and collaboration.
In addition, portfolio managers may be awarded long-term equity-based compensation consisting of units whose value is based on the financial performance of Sentinel Investments (consisting of the Adviser, SFSC and SASI) and the Adviser’s assets under management. Units vest over a period of time, to create incentives to retain key talent. Participation is generally determined at the discretion of the Adviser, taking into account factors relevant to the portfolio manager’s contribution to the success of the Adviser.
Incentive compensation and awards of units described above are subject to the annual approval of the National Life Board of Directors.
Portfolio managers also participate in benefit plans and programs available generally to all employees of National Life and its affiliates. These include health, life and disability insurance, and a cash balance defined benefit pension plan. Additional discretionary incentives may be awarded from time to time based on overall results for National Life and its affiliates.
Portfolio Managers’ Fund Ownership. For each Fund, the following table shows the dollar range of shares owned beneficially and of record by the person(s) who are primarily responsible for the day-to-day management of the Fund (each a “portfolio manager”), including investments by their immediate family members, as of December 31, 2016.
| A. | None |
| B. | $1 to $10,000 |
| C. | $10,001 to $50,000 |
| D. | $50,001 to $100,000 |
| E. | $100,001 to $500,000 |
| F. | $500,001 to $1,000,000 |
| G. | Over $1,000,000 |
| Portfolio Manager | Fund(s) Managed | Aggregate Dollar Range of |
| | | Equity Securities in the |
| | | Fund |
| Andrew Boczek | International Equity Fund | E | |
| | | | |
| Jason Doiron | Balanced Fund | A | |
| | Government Securities Fund | A | |
| | Low Duration Bond Fund | A | |
| | Multi-Asset Income Fund | G | |
| | Total Return Bond Fund | C | |
| | Unconstrained Bond Fund | A | |
| | | | |
| Peter Hassler | Government Securities Fund | B | |
| | | | |
| Daniel Manion | Balanced Fund | A | |
| | Common Stock Fund | F | |
| | | | |
| Helena Ocampo | Sustainable Core Opportunities Fund | A | |
| | | | |
| Jason Ronovech | Small Company Fund | E | |
| | | | |
| Hilary Roper | Common Stock Fund | E | |
Portfolio Management Conflicts of Interest. In addition to managing the assets of one or more Funds, each portfolio manager may have responsibility for managing other client accounts of the Adviser. The manner in which the portfolio manager’s incentive compensation is weighted among the accounts managed may give a portfolio manager an incentive to allocate a particular investment opportunity to a product that has a greater weighting in determining his or her incentive compensation. The tables below show, for the portfolio manager(s) of each Fund, the number and asset size of the following types of accounts that he or she manages (if any): (1) SEC registered investment companies (or series thereof) other than the Company and (2) other accounts (e.g., accounts managed for individuals or organizations). The tables also show the number of performance based fee accounts for each category, as well as the
total assets of the accounts for which the advisory fee is based on the performance of the account. Information is provided as of November 30, 2016.
| | Portfolio Managers’ Management of Registered Investment | |
| | Companies/Series Other Than the Funds | |
| | | | | |
| | | | Number of | |
| | | | Companies/Series | Total Assets of |
| | | | with | Companies/Series |
| | Number of | | Performance- | with Performance- |
| Portfolio Manager | Companies/Series | Total Assets | Based Fee | Based Fee |
| Jason Doiron | 2 | $54.7 million | None | None |
| Daniel Manion | 2 | $159.2 million | None | None |
| Jason Ronovech | 2 | $67.1 million | None | None |
| Hilary Roper | 1 | $149.2 million | None | None |
| Portfolio Managers’ Management of Accounts |
| That Are Not Pooled Investment Vehicles |
| | | | Number of | |
| | | | Accounts | Total Assets of |
| | Number | | with | Accounts with |
| | of | | Performance- | Performance-Based |
| Portfolio Manager | Accounts | Total Assets | Based Fee | Fee |
| Andrew Boczek | 0 | $0 million | None | None |
| Jason Doiron | 11 | $22,744 million | None | None |
| Peter Hassler | 0 | $0 million | None | None |
| Daniel Manion | 0 | $0 million | None | None |
| Helena Ocampo | 0 | $0 million | None | None |
| Jason Ronovech | 1 | $0.3 million | None | None |
| Hilary Roper | 0 | $0 million | None | None |
| Portfolio Managers’ Management of Accounts |
| Pooled Investment Vehicles |
| | Number of | | Number of | |
| | Unregistered | | Accounts | Total Assets of |
| | Pooled | | with | Accounts with |
| | Investment | | Performance- | Performance-Based |
| Portfolio Manager | Vehicles | Total Assets | Based Fee | Fee |
| Daniel Manion(1) | 1 | $28.6 million | None | None |
| Hilary Roper(1) | 1 | $28.6 million | None | None |
| Andrew Boczek | 1 | $4.8 million | None | None |
| Jason Doiron | 0 | | None | None |
| Peter Hassler | 0 | | None | None |
| Helena Ocampo | 0 | | None | None |
| Jason Ronovech | 0 | | None | None |
(1) Ms. Roper and Mr. Manion are co-managers of the same pooled investment vehicle
Conflicts of Interest. The Adviser is affiliated with other companies in National Life Group that maintain accounts managed by the Adviser, including National Life Insurance Company. Real, potential or apparent conflicts of interest may arise where the same investment opportunities are appropriate for the portfolio of one of those companies or for the portfolios of other clients.
Conflicts of interest may arise particularly in cases where the same portfolio manager has day-to-day portfolio management responsibilities with respect to more than one Fund and/or other account. The Adviser has established procedures under which, when the Adviser recommends to a Fund the purchase of an issue that it may also recommend for other clients or for the portfolios of its affiliates, investment opportunities are allocated by a means which is fair. Generally investment opportunities are allocated to different investors for which a given investment opportunity is suitable on a pro rata basis. However, the allocation may be changed from pro rata where a good reason to do so exists, such as that the pro rata allocation would result in such small allocations to a particular investor that it is not cost effective or meaningful. For fixed-income investments, allocations are normally in proportion to cash available for investment in a particular opportunity, but an opportunity judged to be more suitable to a particular account than others may be allocated to such account. Over time the Adviser seeks to ensure that no Fund or other account is favored over others.
PRINCIPAL SHAREHOLDERS
Any person owning more than 25% of a Fund’s shares may be considered a “controlling person” of the Fund. Accordingly, a controlling person’s vote could have more significant effect on matters presented to shareholders for approval than the vote of other Fund shareholders.
As of March 1, 2017, the Company’s Directors and officers as a group owned less than 1% of the outstanding shares of each Fund. As of December 31, 2016, none of the Independent Directors nor any of their immediate family members owned beneficially or of record any securities in the Adviser, SFSC or any of their affiliates.
In addition, as of March 1, 2017, the National Life Holding Company, a Vermont corporation, and its subsidiaries, NLV Financial Corporation, a Delaware corporation, Sentinel Asset Management, Inc., a Vermont corporation, and Sentinel Administrative Services, Inc., a Vermont corporation, each of whom is located at One National Life Drive, Montpelier, Vermont 05604, owned of record and beneficially, the following shares in each Fund:
| Fund/Class | Number of Shares | Percent of Outstanding |
| Balanced – A | 77,250.855 | .58% |
| Balanced – I | 98,64.415 | 9.90% |
| Common Stock – A | 321,596.256 | 1.00% |
| Common Stock - I | 505,330.010 | 3.74% |
| Common Stock – R6 | 16,395.696 | 2.75% |
| Government Securities – A | 55,941.308 | .38% |
| International Equity – A | 113,503.442 | 1.57% |
| International Equity - I | 475,949.975 | 15.78% |
| Low Duration Bond - A | 18,816.667 | .17% |
| Low Duration Bond – I | 2,621,863.443 | 22.97% |
| Multi-Asset Income – A | 174,367.196 | 1.77% |
| Small Company – A | 748,240.170 | .55% |
| Small Company – R6 | 139,226.077 | 2.46% |
| Total Return Bond – A | 20,485.581 | .32% |
| Total Return Bond - I | 20,500,801.553 | 12.99% |
| Total Return Bond – R3 | 59,224,.019 | 100.00% |
| Total Return Bond – R6 | 59,392.256 | 100.00% |
| Unconstrained Bond – A | 528,682.112 | 97.43% |
| Unconstrained Bond – C | 153,095.365 | 89.64% |
| Unconstrained Bond – I | 1,963,065.893 | 98.05% |
| Sustainable Core Opp – I | 95,798.190 | 7.56% |
As of March 1, 2017, no other shareholder owned of record, or was known by the Company, to own beneficially 5% or more of the voting stock of any class of any Fund or 25% or more of a Fund except as set forth below.
| Sentinel Balanced Fund – Class C | | Morgan Stanley Smith Barney | 5.99% |
| Wells Fargo Clearing Services, LLC | 13.44% | Harborside Financial Center Plaza 2 | |
| Special Custody Acct for the Exclusive | | 3rd Floor | |
| Benefit of Customers | | Jersey City NJ 07311 | |
| 2801 Market St | | | |
| Saint Louis MO 63103-2523 | | Ascensus Trust Company FBO | 10.67% |
| | | Westmont Group employees 401(k) Plan | |
| UBS WM USA | 5.62% | PO Box 10758 | |
| Omni Account M/F | | Fargo ND 58106-0758 | |
| Attn: Dept Manager | | | |
| 1000 Harbor Blvd 5th Floor | | Sentinel Common Stock – Class R6 | |
| Weehawken NJ 07086-6761 | | NFS LLC FEBO FIIOC as Agent for | 91.25% |
| | | Qualified Employee Benefit Plans | |
| Raymond James Omnibus for Mutual Funds | 9.23% | 401k FINOPS-IC Funds | |
| 880 Carillon Way | | 100 Magellan Way KW1C | |
| Saint Petersburg FL 33716-1102 | | Covington KY 41015-1987 | |
| | | | |
| Morgan Stanley Smith Barney | 8.17% | Sentinel Common Stock – Class C | |
| Harborside Financial Center Plaza 2 | | Raymond James Omnibus for Mutual Funds | 22.97% |
| 3rd Floor | | 880 Carillon Way | |
| Jersey City NJ 07311 | | Saint Petersburg FL 33716-1102 | |
| | | | |
| Pershing LLC | 13.78% | Morgan Stanley Smith Barney | 7.69% |
| 1 Pershing Plaza | | Harborside Financial Center Plaza 2 | |
| Jersey City NJ 07399-0002 | | 3rd Floor | |
| | | Jersey City NJ 07311 | |
| Sentinel Balanced Fund – Class I | | | |
| | | Pershing LLC | 23.39% |
| LPL Financial | 6.14% | 1 Pershing Plaza | |
| FBO Customer Accounts | | Jersey City NJ 07399-0002 | |
| Attn: Mutual Fund Operations | | | |
| PO Box 509046 | | Sentinel Common Stock – Class I | |
| San Diego CA 92150-9046 | | Raymond James Omnibus for Mutual Funds | 5.14% |
| | | 880 Carillon Way | |
| Wells Fargo Clearing Services, LLC | 18.21% | Saint Petersburg FL 33716-1102 | |
| Special Custody Acct for the Exclusive | | | |
| Benefit of Customers | | Charles Schwab & Co Inc. | 5.71% |
| 2801 Market St | | Special Custody Acct FBO Customers | |
| Saint Louis MO 63103-2523 | | Attn Mutual Funds Dept | |
| | | 211 Main St | |
| Raymond James Omnibus for Mutual Funds | 8.61% | San Francisco CA 94105-1905 | |
| 880 Carillon Way | | | |
| Saint Petersburg FL 33716-1102 | | Merrill Lynch Pierce Fenner & Smith | 7.20% |
| | | For the Sole Benefit of Its Cust | |
| Life Insurance Company of the Southwest | 8.61% | Attn: Physical Team | |
| One National Life Drive | | 4800 Deer Lake Dr. East | |
| Montpelier VT 05604-1000 | | Jacksonville FL 32246-6484 | |
| | | Attn: Physical Team | |
| NFS LLC FEBO FIIOC as Agent for | 26.04% | 4800 Deer Lake Dr East | |
| Qualified Employee Benefit Plans | | Jacksonville FL 32246-6484 | |
| 401k FINOPS-IC Funds | | | |
| 100 Magellan Way KW1C | | Morgan Stanley Smith Barney | 11.51% |
| Covington KY 41015-1987 | | Harborside Financial Center Plaza 2 | |
| | | 3rd Floor | |
| Maril & Co FBO 5A | 8.19% | Jersey City NJ 07311 | |
| M&I Trust Co NA | | | |
| Attn Mutual Funds | | Pershing LLC | 11.66% |
| 11270 W Park Pl Ste 400 | | 1 Pershing Plaza | |
| Milwaukee WI 53224-3638 | | Jersey City NJ 07399-0002 | |
| | | | |
| Sentinel Government Securities – Class A | | Sentinel International Equity – Class C | |
| Merrill Lynch Pierce Fenner & Smith | 6.02% | Wells Fargo Clearing Services, LLC | 5.94% |
| For the Sole Benefit of Its Cust | | Special Custody Acct for the Exclusive | |
| Attn: Physical Team | | Benefit of Customers | |
| 4800 Deer Lake Dr East | | 2801 Market St | |
| Jacksonville FL 32246-6484 | | Saint Louis MO 63103-2523 | |
| | | | |
| Sentinel Government Securities – Class I | | Raymond James Omnibus for Mutual Funds | 7.90% |
| Wells Fargo Clearing Services, LLC | 8.10% | 880 Carillon Way | |
| Special Custody Acct for the Exclusive | | Saint Petersburg FL 33716-1102 | |
| Benefit of Customers | | | |
| 2801 Market St | | Sentinel International Equity – Class A | |
| Saint Louis MO 63103-2523 | | Charles Schwab & Co Inc. | 6.65% |
| | | Special Custody Acct FBO Customers | |
| UBS WM USA | 57.96% | Attn Mutual Funds Dept | |
| Omni Account M/F | | 211 Main St | |
| Attn: Dept Manager | | San Francisco CA 94105-1905 | |
| 1000 Harbor Blvd 5th Floor | | | |
| Weehawken NJ 07086-6761 | | Sentinel International Equity – Class I | |
| | | LPL Financial | 6.67% |
| Morgan Stanley Smith Barney | 5.14% | FBO Customer Accounts | |
| Harborside Financial Center Plaza 2 | | Attn: Mutual Fund Operations | |
| 3rd Floor | | PO Box 509046 | |
| Jersey City NJ 07311 | | San Diego CA 92150-9046 | |
| | | | |
| Sentinel Government Securities – Class C | | Wells Fargo Clearing Services, LLC | 15.89% |
| Wells Fargo Clearing Services, LLC | 12.75% | Special Custody Acct for the Exclusive | |
| Special Custody Acct for the Exclusive | | Benefit of Customers | |
| Benefit of Customers | | 2801 Market St | |
| 2801 Market St | | Saint Louis MO 63103-2523 | |
| Saint Louis MO 63103-2523 | | | |
| | | UBS WM USA | 15.84% |
| UBS WM USA | 5.87% | Omni Account M/F | |
| Omni Account M/F | | Attn: Dept Manager | |
| Attn: Dept Manager | | 1000 Harbor Blvd 5th Floor | |
| 1000 Harbor Blvd 5th Floor | | Weehawken NJ 07086-6761 | |
| Weehawken NJ 07086-6761 | | | |
| | | Raymond James Omnibus for Mutual Funds | 7.37% |
| Raymond James Omnibus for Mutual Funds | 6.71% | 880 Carillon Way | |
| 880 Carillon Way | | Saint Petersburg FL 33716-1102 | |
| Saint Petersburg FL 33716-1102 | | | |
| | | PIMS/Prudential Retirement | 12.03% |
| Merrill Lynch Pierce Fenner & Smith | 18.29% | As Nominee for the TTEE | |
| For the Sole Benefit of Its Cust | | National Life Group 401(k) | |
| 1 National Life Drive | | Special Custody Acct FBO Customers | |
| Montpelier VT 05602-3377 | | Attn Mutual Funds Dept | |
| | | 211 Main St | |
| Charles Schwab & Co Inc. | 5.22% | San Francisco CA 94105-1905 | |
| Special Custody Acct FBO Customers | | | |
| Attn Mutual Funds Dept | | Sentinel Low Duration Bond Fund – Class S | |
| 211 Main St | | Wells Fargo Clearing Services, LLC | 25.85% |
| San Francisco CA 94105-1905 | | Special Custody Acct for the Exclusive | |
| | | Benefit of Customers | |
| Nationwide Trust Company FSB | 6.84% | 2801 Market St | |
| C/O Portfolio Accounting | | Saint Louis MO 63103-2523 | |
| One Nationwide Plaza | | | |
| Columbus OH 43215-2216 | | UBS WM USA | 8.23% |
| | | Omni Account M/F | |
| Sentinel Low Duration Bond Fund – Class A | | Attn: Dept Manager | |
| Wells Fargo Clearing Services, LLC | 7.06% | 1000 Harbor Blvd 5th Floor | |
| Special Custody Acct for the Exclusive | | Weehawken NJ 07086-6761 | |
| Benefit of Customers | | | |
| 2801 Market St | | Morgan Stanley Smith Barney | 30.08% |
| Saint Louis MO 63103-2523 | | Harborside Financial Center Plaza 2 | |
| | | 3rd Floor | |
| Raymond James Omnibus for Mutual Funds | 5.47% | Jersey City NJ 07311 | |
| 880 Carillon Way | | | |
| Saint Petersburg FL 33716-1102 | | Pershing LLC | 5.01% |
| | | 1 Pershing Plaza | |
| Morgan Stanley Smith Barney | 6.45% | Jersey City NJ 07399-0002 | |
| Harborside Financial Center Plaza 2 | | | |
| 3rd Floor | | Sentinel Multi-Asset Income – Class A | |
| Jersey City NJ 07311 | | Wells Fargo Clearing Services, LLC | 7.21% |
| | | Special Custody Acct for the Exclusive | |
| Pershing LLC | 6.42% | Benefit of Customers | |
| 1 Pershing Plaza | | 2801 Market St | |
| Jersey City NJ 07399-0002 | | Saint Louis MO 63103-2523 | |
| | | | |
| Sentinel Low Duration Bond Fund – Class I | | Pershing LLC | 8.21% |
| Wells Fargo Clearing Services, LLC | 15.67% | 1 Pershing Plaza | |
| Special Custody Acct for the Exclusive | | Jersey City NJ 07399-0002 | |
| Benefit of Customers | | | |
| 2801 Market St | | Sentinel Multi-Asset Income – Class C | |
| Saint Louis MO 63103-2523 | | LPL Financial | 5.05% |
| | | FBO Customer Accounts | |
| UBS WM USA | 19.87% | Attn: Mutual Fund Operations | |
| Omni Account M/F | | PO Box 509046 | |
| Attn: Dept Manager | | San Diego CA 92150-9046 | |
| 1000 Harbor Blvd 5th Floor | | | |
| Weehawken NJ 07086-6761 | | Wells Fargo Clearing Services, LLC | 14.79% |
| | | Special Custody Acct for the Exclusive | |
| Life Insurance Company of the Southwest | 20.53% | Benefit of Customers | |
| One National Life Drive | | 2801 Market St | |
| Montpelier VT 05604-1000 | | Saint Louis MO 63103-2523 | |
| | | | |
| Morgan Stanley Smith Barney | 22.29% | Raymond James Omnibus for Mutual Funds | 13.95% |
| Harborside Financial Center Plaza 2 | | 880 Carillon Way | |
| 3rd Floor | | Saint Petersburg FL 33716-1102 | |
| Jersey City NJ 07311 | | | |
| | | Merrill Lynch Pierce Fenner & Smith | 14.96% |
| Charles Schwab & Co Inc. | 5.80% | For the Sole Benefit of Its Cust | |
| Attn: Physical Team | | Attn Trust Operations | |
| 4800 Deer Lake Dr. East | | 211 N Broadway | |
| Jacksonville FL 32246-6484 | | Saint Louis MO 63102-2748 | |
| | | | |
| Morgan Stanley Smith Barney | 12.49% | Sentinel Small Company Fund – Class I | |
| Harborside Financial Center Plaza 2 | | Wells Fargo Clearing Services, LLC | 5.17% |
| 3rd Floor | | Special Custody Acct for the Exclusive | |
| Jersey City NJ 07311 | | Benefit of Customers | |
| | | 2801 Market St | |
| Pershing LLC | 6.68% | Saint Louis MO 63103-2523 | |
| 1 Pershing Plaza | | | |
| Jersey City NJ 07399-0002 | | Merrill Lynch Pierce Fenner & Smith | 16.57% |
| | | For the Sole Benefit of Its Cust | |
| Sentinel Multi-Asset Income – Class I | | Attn: Physical Team | |
| LPL Financial | 5.91% | 4800 Deer Lake Dr. East | |
| FBO Customer Accounts | | Jacksonville FL 32246-6484 | |
| Attn: Mutual Fund Operations | | | |
| PO Box 509046 | | Charles Schwab & Co Inc. | 16.19% |
| San Diego CA 92150-9046 | | Special Custody Acct FBO Customers | |
| | | Attn Mutual Funds Dept | |
| Wells Fargo Clearing Services, LLC | 18.33% | 211 Main St | |
| Special Custody Acct for the Exclusive | | San Francisco CA 94105-1905 | |
| Benefit of Customers | | | |
| 2801 Market St | | NFS LLC FEBO FIIOC as Agent for | 5.75% |
| Saint Louis MO 63103-2523 | | Qualified Employee Benefit Plans | |
| | | 401k FINOPS-IC Funds | |
| UBS WM USA | 8.25% | 100 Magellan Way KW1C | |
| Omni Account M/F | | Covington KY 41015-1987 | |
| Attn: Dept Manager | | | |
| 1000 Harbor Blvd 5th Floor | | Sentinel Small Company Fund – Class A | |
| Weehawken NJ 07086-6761 | | Pershing LLC | 7.03% |
| | | 1 Pershing Plaza | |
| Raymond James Omnibus for Mutual Funds | 7.40% | Jersey City NJ 07399-0002 | |
| 880 Carillon Way | | | |
| Saint Petersburg FL 33716-1102 | | Sentinel Small Company Fund – Class C | |
| | | Wells Fargo Clearing Services, LLC | 7.02% |
| Merrill Lynch Pierce Fenner & Smith | 24.19% | Special Custody Acct for the Exclusive | |
| For the Sole Benefit of Its Cust | | Benefit of Customers | |
| Attn: Physical Team | | 2801 Market St | |
| 4800 Deer Lake Dr East | | Saint Louis MO 63103-2523 | |
| Jacksonville FL 32246-6484 | | | |
| | | RBC Capital Markets, LLC | 7.02% |
| Morgan Stanley Smith Barney | 9.95% | Mutual Fund Omnibus Processing | |
| Harborside Financial Center Plaza 2 | | Attn Mutual Fund Ops Manager | |
| 3rd Floor | | 510 Marquette Ave S | |
| Jersey City NJ 07311 | | Minneapolis MN 55402-1110 | |
| | | | |
| Sentinel Small Company Fund – Class R6 | | Raymond James Omnibus for Mutual Funds | 18.74% |
| NFS LLC FEBO | 74.05% | 880 Carillon Way | |
| State Street Bank & Trust Co | | Saint Petersburg FL 33716-1102 | |
| Ttee Various Retirement Plans | | | |
| 440 Mamaroneck Ave | | Morgan Stanley Smith Barney | 10.83% |
| Harrison NY 10528.2418 | | Harborside Financial Center Plaza 2 | |
| | | 3rd Floor | |
| TIAA-CREF Trust Co Cust/Ttee FBO | 15.06% | Jersey City NJ 07311 | |
| Retirement Plans for Which | | | |
| TIAA Acts As Recordkeeper | | Pershing LLC | 13.18% |
| 1 Pershing Plaza | | 1 Pershing Plaza | |
| Jersey City NJ 07399-0002 | | Jersey City NJ 07399-0002 | |
| | | | |
| Sentinel Sustainable Core Opportunity Fund – Class I | | Sentinel Total Return Bond Fund – Class C | |
| LPL Financial | 5.83% | Wells Fargo Clearing Services, LLC | 13.66% |
| FBO Customer Accounts | | Special Custody Acct for the Exclusive | |
| Attn: Mutual Fund Operations | | Benefit of Customers | |
| PO Box 509046 | | 2801 Market St | |
| San Diego CA 92150-9046 | | Saint Louis MO 63103-2523 | |
| | | | |
| Wells Fargo Clearing Services, LLC | 9.31% | UBS WM USA | 5.89% |
| Special Custody Acct for the Exclusive | | Omni Account M/F | |
| Benefit of Customers | | Attn: Dept Manager | |
| 2801 Market St | | 1000 Harbor Blvd 5th Floor | |
| Saint Louis MO 63103-2523 | | Weehawken NJ 07086-6761 | |
| | | | |
| UBS WM USA | 7.26% | Raymond James Omnibus for Mutual Funds | 11.17% |
| Omni Account M/F | | 880 Carillon Way | |
| Attn: Dept Manager | | Saint Petersburg FL 33716-1102 | |
| 1000 Harbor Blvd 5th Floor | | | |
| Weehawken NJ 07086-6761 | | Morgan Stanley Smith Barney | 9.28% |
| | | Harborside Financial Center Plaza 2 | |
| NLV Financial | 7.57% | 3rd Floor | |
| 1 National Life Drive | | Jersey City NJ 07311 | |
| Montpelier VT 05602-3377 | | | |
| | | Pershing LLC | 24.20% |
| Morgan Stanley Smith Barney | 6.06% | 1 Pershing Plaza | |
| Harborside Financial Center Plaza 2 | | Jersey City NJ 07399-0002 | |
| 3rd Floor | | | |
| Jersey City NJ 07311 | | Sentinel Total Return Bond Fund – Class I | |
| | | Wells Fargo Clearing Services, LLC | 10.60% |
| Charles Schwab & Co Inc. | 9.55% | Special Custody Acct for the Exclusive | |
| Special Custody Acct FBO Customers | | Benefit of Customers | |
| Attn Mutual Funds Dept | | 2801 Market St | |
| 211 Main St | | Saint Louis MO 63103-2523 | |
| San Francisco CA 94105-1905 | | | |
| | | UBS WM USA | 13.38% |
| Sentinel Total Return Bond Fund – Class A | | Omni Account M/F | |
| Charles Schwab & Co Inc. | 11.07% | Attn: Dept Manager | |
| Special Custody Acct FBO Customers | | 1000 Harbor Blvd 5th Floor | |
| Attn Mutual Funds Dept | | Weehawken NJ 07086-6761 | |
| 211 Main St | | | |
| San Francisco CA 94105-1905 | | Raymond James Omnibus for Mutual Funds | 5.18% |
| | | 880 Carillon Way | |
| Fifth Third Bank Ttee | 6.87% | Saint Petersburg FL 33716-1102 | |
| Various Fascore LLC Recordkept Plans | | | |
| C/O Fascore LLC | | Charles Schwab & Co Inc. | 7.50% |
| 8515 E Orchard Rd 2T2 | | Special Custody Acct FBO Customers | |
| Greenwood Village CO 80111-5002 | | Attn Mutual Funds Dept | |
| | | 211 Main St | |
| UBS WM USA | 9.37% | San Francisco CA 94105-1905 | |
| Omni Account M/F | | | |
| Attn: Dept Manager | | National Life Insurance Company | 13.00% |
| 1000 Harbor Blvd 5th Floor | | Separate Account II | |
| Weehawken NJ 07086-6761 | | Investment Acct Dept | |
| | | 1 National Life Drive | |
| Pershing LLC | 11.82% | Montpelier VT 05602-3377 | |
| | | Sentinel Unconstrained Bond Fund – Class A | |
| | | Life Insurance Company of the Southwest | 97.44% |
| Pershing LLC | 10.21% | One National Life Drive | |
| 1 Pershing Plaza | | Montpelier VT 05604-1000 | |
| Jersey City NJ 07399-0002 | | | |
| | | Sentinel Unconstrained Bond Fund – Class C | |
| Sentinel Total Return Bond Fund – Class R3 | | Life Insurance Company of the Southwest | 89.65% |
| Life Insurance Company of the Southwest | 100.00% | One National Life Drive | |
| One National Life Drive | | Montpelier VT 05604-1000 | |
| Montpelier VT 05604-1000 | | | |
| | | Sentinel Unconstrained Bond Fund – Class I | |
| Sentinel Total Return Bond Fund – Class R6 | | Life Insurance Company of the Southwest | 98.06% |
| Life Insurance Company of the Southwest | 100.00% | One National Life Drive | |
| One National Life Drive | | Montpelier VT 05604-1000 | |
| Montpelier VT 05604-1000 | | | |
THE INVESTMENT ADVISER
The Adviser provides general supervision of the Funds’ investments as well as certain administrative and related services. The Adviser is an indirect wholly owned subsidiary of the National Life Holding Company, a mutual insurance holding company.
Under investment advisory agreements with the Funds, each Fund pays the Adviser a monthly fee based on the annual rates shown.
| Fund | Advisory Fee Rate | Average Daily Net Assets |
| Balanced | 0.55% | First $200 million |
| | 0.50% | Next $200 million |
| | 0.45% | Next $600 million |
| | 0.40% | Next $1 billion |
| | 0.35% | In excess of $2 billion |
| | | |
| Common Stock | 0.70% | First $500 million |
| | 0.65% | Next $300 million |
| | 0.60% | Next $200 million |
| | 0.50% | Next $1 billion |
| | 0.40% | In excess of $2 billion |
| | | |
| Government Securities | 0.45% | First $500 million |
| | 0.40% | Next $500 million |
| | 0.35% | Next $1 billion |
| | 0.30% | Next $2 billion |
| | 0.25% | In excess of $4 billion |
| | | |
| International Equity | 0.70% | First $500 million |
| | 0.65% | Next $300 million |
| | 0.60% | Next $200 million |
| | 0.50% | Next $1 billion |
| | 0.40% | In excess of $2 billion |
| | | |
| Low Duration Bond | 0.45% | First $500 million |
| | 0.40% | Next $500 million |
| | 0.35% | Next $1 billion |
| | 0.30% | Next $2 billion |
| Fund | Advisory Fee Rate | Average Daily Net Assets |
| | 0.25% | In excess of $4 billion |
| | | |
| Multi-Asset Income | 0.55% | First $200 million |
| | 0.50% | Next $200 million |
| | 0.45% | Next $600 million |
| | 0.40% | Next $1 billion |
| | 0.35% | In excess of $2 billion |
| | | |
| Small Company | 0.70% | First $500 million |
| | 0.65% | Next $300 million |
| | 0.60% | Next $200 million |
| | 0.50% | Next $1 billion |
| | 0.40% | In excess of $2 billion |
| | | |
| Sustainable Core Opportunities | 0.70% | First $500 million |
| | 0.65% | Next $300 million |
| | 0.60% | Next $200 million |
| | 0.50% | Next $1 billion |
| | 0.40% | In excess of $2 billion |
| | | |
| Total Return Bond | 0.55% | First $200 million |
| | 0.50% | Next $200 million |
| | 0.45% | Next $600 million |
| | 0.40% | Next $1 billion |
| | 0.35% | In excess of $2 billion |
| | | |
| Unconstrained Bond | 0.75% | First $200 million |
| | 0.70% | Next $200 million |
| | 0.65% | Next $600 million |
| | 0.60% | Next $1 billion |
| | 0.55% | In excess of $2 billion |
The table below shows the total amount of advisory fees paid to the Adviser by each Fund for each of the past three fiscal years:
| | Advisory Fee Paid - Fiscal Year Ended |
| Fund | November 30, 2014 | November 30, 2015 | November 30, 2016 |
| Balanced Fund | $1,692,404 | $1,686,027 | $1,660,586 |
| Common Stock Fund | $13,545,947 | $13,119,459 | $12,005,685 |
| Government Securities Fund | $2,004,363 | $1,312,313 | $1,040,626 |
| International Equity Fund | $1,104,549 | $909,593 | $1,059,783 |
| Low Duration Bond Fund | $3,875,938 | $2,689,466 | $1,852,106 |
| Multi-Asset Income Fund | $1,653,420 | $1,600,671 | $1,546,635 |
| Small Company Fund | $7,427,993 | $6,575,178 | $6,279,690 |
| Sustainable Core Opportunities Fund | $1,693,183 | $1,724,280 | $2,206,505 |
| Total Return Bond Fund | $2,018,103 | $4,015,707 | $2,992,393 |
| Unconstrained Bond Fund(1) | N/A | $172,648 | $197,129 |
| | | | |
| Aggregate Advisory Fees(2) | $35,015,900 | $33,805,342 | $30,841,138 |
1 Commenced operations December 23, 2014..
2 The Adviser waived $363,879 of the aggregate advisory fees in the fiscal year ended 2016, $412,420 in the fiscal year ended 2015 and $143,198 in the fiscal year ended 2014.
The initial shareholder of the Sustainable Core Opportunities Fund approved the advisory agreement on April 2, 2008. Shareholders of the Small Company Fund last approved the advisory agreement on January 24, 2006. Shareholders of each of the Common Stock and International Equity Funds last approved the advisory agreement on November 21, 2005. The initial sole shareholder of the Multi-Asset Income Fund approved the advisory agreement on March 7, 2003. Shareholders of the Balanced Fund last approved the advisory agreement on November 30, 1992. The initial sole shareholder of the Total Return Bond Fund approved the advisory agreement with the Adviser on December 16, 2010. Shareholders of the Government Securities and Low Duration Bond Funds last approved the advisory agreement on March 2, 2015 and March 16, 2015 respectively. The Board last approved each of the advisory agreements on August 19, 2016.
Each advisory agreement must be approved annually by vote of the Board or by the vote of a majority of the outstanding voting securities of the applicable Fund, but in either event it must also be approved by a vote of a majority of the Independent Directors who are not parties to the contract, or interested persons, as defined in the 1940 Act, of any such party, cast in person at a meeting called for the purpose of voting on such approval. With respect to the submission of the Company’s advisory agreement to shareholders, such matters shall be deemed to be acted upon effectively with respect to any Fund if a majority of the outstanding voting securities of such Fund vote for approval of such matter, notwithstanding (A) that such matter has not been approved by a majority of the outstanding voting securities of any other Fund affected by such matter, and (B) that such matter has not been approved by a vote of a majority of the outstanding voting securities of the Company.
Each advisory agreement will terminate automatically in the event of its assignment and is terminable at any time without penalty by the Board, or, with respect to a particular Fund, by a majority of the Fund’s outstanding voting securities on not more than 60 days’ written notice to the Adviser and by the Adviser on 60 days’ written notice to the Fund.
PROXY VOTING PROCEDURES
The Funds have adopted proxy voting procedures pursuant to which the Board delegates the responsibility for voting proxies relating to portfolio securities held by the Funds to the Adviser or relevant subadvisor as part of its general management of the applicable Fund, subject to the Board’s continuing oversight. The proxy voting procedures of the Adviser are included in Appendix B to this Statement of Additional Information. For each Fund that makes any investments in voting securities, information regarding how the Fund voted proxies relating to portfolio securities during the most recent 12-month period ended June 30 is available without charge, upon request, by calling 1-800-282-FUND (3863), on the Funds’ website at http://www.sentinelinvestments.com/proxy_voting_information.php or at the SEC’s website at http://www.sec.gov.
SELECTIVE DISCLOSURE OF PORTFOLIO HOLDINGS
Pursuant to policies and procedures adopted by the Funds and the Adviser, the Funds and the Adviser may, under certain circumstances, make selective disclosure with respect to a Fund’s portfolio holdings. The Board has approved the policies and procedures adopted by the Funds and has delegated to the Adviser the responsibility for ongoing monitoring and supervision to ensure compliance with these policies and procedures, including compliance with any confidentiality requirements applicable to recipients of portfolio holdings. The Funds’ Chief Compliance Officer has undertaken to report any violations of these policies and procedures, including any confidentiality requirements pursuant to them, to the Board.
The Funds’ policy with respect to disclosure of portfolio holdings is that such disclosure shall be limited to:
Public Disclosure:
(i) information with respect to portfolio holdings contained in the Funds’ Annual and Semi-Annual Reports to Shareholders;
(ii) information with respect to portfolio holdings contained in the Funds’ Form N-Q filed with the SEC, which is filed with the SEC within 60 days of quarter-end;
(iii) information with respect to portfolio holdings that is: (1) provided on the Funds’ website; (2) provided in the Funds’ marketing materials, broadly used with all selling intermediaries of the Funds; or (3) otherwise made generally available to anyone who requests it, in all such cases such information to the extent it discloses the specific securities held by a Fund to be only as of the
last business day of a month and only at least 15 days later than the date of such information (except that for the Small Company Fund’s portfolio holdings other than the top ten holdings shall be at least 30 days later than the date of such information);
Non-Public Disclosure:
(iv) information with respect to portfolio holdings of the Funds provided to recognized mutual fund information services, such as Lipper Inc. and Morningstar, Inc., such information to be provided as of the last business day of a month and only if either (a) such information is disclosed to such services at least 15 days later than the date of such information (except that for the Small Company Fund’s portfolio holdings other than the top ten holdings shall be at least 30 days later than the date of such information), or (b) such services agree that they and their employees will not disclose or trade on such information before it is publicly disclosed; and
(v) information with respect to portfolio holdings of the Funds provided to persons who request it, including selling group members, consultants and investors, such information to be provided (a) as of the last business day of a month and (b) at least 15 days later than the date of such information (except that for the Small Company Fund’s portfolio holdings other than the top ten holdings shall be at least 30 days later than the date of such information).
Portfolio holdings information provided under (iii), (iv) or (v) above shall be released only by a limited group of individuals specifically designated by the Funds’ Chief Executive Officer or the President of the Funds’ distributor. Each individual shall be trained in these limitations on the release of portfolio holdings information. None of the Fund, the Adviser nor their respective affiliates receive compensation or other consideration with respect to the release of such portfolio holdings information.
The policy does not apply to the disclosure of information to: the Directors or their counsel; persons who owe a fiduciary or other duty of trust or confidence to the Company, such as the Funds’ counsel and independent registered public accounting firm; providers of fund accounting services; the Funds’ transfer agent and custodian; or executing brokers in connection with the sale of portfolio holdings. The fiduciary, contractual or other duties (e.g., legal or statutory) of these recipients generally require them not to misuse such information.
The Funds have adopted policies and procedures, including a Code of Ethics and various policies regarding securities trading, to address potential conflicts of interest that may arise in connection with disclosure of portfolio information. Among other things, the Code of Ethics prohibits officers and employees of the Adviser from knowingly or intentionally trading, directly or indirectly, against the Funds in any of the Funds’ portfolio securities. The Code of Ethics also generally prohibits such officers and employees from trading in a manner inconsistent with the best interests of the Funds.
The Funds have entered into ongoing arrangements to provide selective disclosure of Fund portfolio holdings to the following persons or entities:
| • | Funds’ Independent Registered Public Accounting Firm; |
| • | Funds’ administrative agent (in connection with accounting services); and |
| • | Mutual fund information services - Morningstar, Inc. and Lipper Inc. |
Selective disclosure of portfolio information is made to the Board, transfer agent, independent registered public accounting firm, administrator agent and custodian as frequently as necessary to enable such persons or entities to provide services to the Funds. Disclosure is made to Morningstar, Inc. and Lipper Inc. on a monthly basis.
The Funds and the Adviser monitor, to the extent possible, the use of portfolio information by the individuals or firms to which it has been disclosed. There can be no assurance, however, that the Funds’ policies and procedures with respect to the selective disclosure of Fund portfolio information will prevent all misuse of such information by individuals or firms that receive such information.
PRINCIPAL UNDERWRITER
SFSC acts as the principal underwriter of shares of the Funds. Its principal business address is National Life Drive, Montpelier, Vermont 05604. SFSC is a Vermont general partnership of the Adviser and Sentinel Administrative Services, Inc. (“SASI”), a wholly owned subsidiary of the Adviser.
The Funds receive the net asset value, as determined for the purpose of establishing the offering price, of each share sold. SFSC has advised the Funds that it allows concessions to intermediaries as shown in the Prospectus, except that items of a promotional nature amounting in value to not more than $100 may be given from time to time as a sales incentive to registered representatives. SFSC has advised the Funds that the total amount of underwriting commissions paid to it in the fiscal years ended November 30, 2016, 2015 and 2014 were $1,856,240, $1,738,499 and $2,014,991, respectively. Of these amounts, SFSC retained, in the fiscal years ended November 30, 2016, 2015 and 2014, $187,345, $159,292 and $178,809, respectively.
During the fiscal year ended November 30, 2016, SFSC also received $57,716 in contingent deferred sales charges. It did not receive any brokerage commissions or other compensation from the Funds. The distribution contracts of the Company provide that SFSC use its best efforts to continuously offer the Funds’ shares. These contracts may be terminated by either party thereto on 60 days’ written notice, without penalty, and they terminate automatically in the event of their assignment. The distribution contracts must be approved annually in one of the same ways as described above for the advisory agreements
Payments to Intermediaries. SFSC or an affiliate compensates intermediaries that distribute and/or service investors in the Funds or, at the direction of a retirement plan’s named fiduciary, make payments to intermediaries for certain plan expenses or otherwise for the benefit of plan participants and beneficiaries. A number of factors are considered in determining whether to pay these additional amounts. In certain situations, such factors may include, without limitation, the level or type of services provided by the intermediary, the level or expected level of assets or sales of shares, the placing of the Funds on a preferred or recommended fund list, access to an intermediary’s personnel, and other factors. In addition to such payments, SFSC or an affiliate may offer other incentives in the form of sponsorship of educational or client seminars relating to current products and issues, assistance in training and educating the intermediaries’ personnel, and/or payments of costs and expenses associated with attendance at seminars, including travel, lodging, entertainment and meals. SFSC anticipates that payments will be made to multiple intermediaries, including broker-dealers and other financial firms, and these payments may be significant. As permitted by SEC and the Financial Industry Regulatory Authority, Inc. (“FINRA”) rules and other applicable laws and regulations, SFSC may pay or allow other incentives or payments to intermediaries.
Some payments, which are sometimes referred to as “revenue sharing,” may represent a premium over payments made by other fund families, and investment professionals may have an added incentive to sell or recommend a Fund or a share class over others offered by competing fund families. During the fiscal year ended November 30, 2016, such payments made by SFSC or its affiliates to intermediaries aggregated approximately $6,614,099, of which $3,243,879 was for shareholder servicing and was reimbursed by the Funds. Payments for these purposes made by SFSC or an affiliate from their own resources may vary. Certain of the payments may be offset by 12b-1 fees retained by SFSC. The following is a list of intermediaries to which SFSC or an affiliate made payments in 2016 related to marketing the Funds and/or servicing Fund shareholders.
| ADP Broker-Dealer Inc | Nationwide Investments Service Corp |
| Ameriprise Financial | NY Life Distributors LLC |
| Ascensus | Oppenheimer & Co Inc |
| Benefit Plans Administrators | Pershing LLC |
| BMO Harris Bank | Principal Life Insurance Co |
| Charles Schwab & Co. Inc | Prudential Investment Management Services LLC |
| Charles Schwab Trust Co | Raymond James & Associates Inc |
| Davenport & Company LLC | RBC Capital Markets |
| Edward Jones | RBC Trust Company |
| Equity Services Inc | Reliance Trust Company |
| Fidelity Investments | |
| GWFS Equity Inc | Robert W. Baird & Co. Inc |
| John Hancock Retirement Plan Services | Standard Retirement Services |
| Lincoln Retirement Service Co | T. Rowe Price |
| LPL Financial Corp | TD Ameritrade Clearing Inc |
| MassMutual Life Insurance Co | TD Ameritrade Trust Co |
| Mercer Human Resource Services | TIAA-CREF |
| Merrill Lynch - Financial Data Services | UBS Financial Services Inc |
| Merrill Lynch – Retirement Group | Valic Financial Services Inc |
| MG Trust Co | Vanguard Fiduciary Trust Co |
| Mid Atlantic Capital Corp | Voya America Insurance Holdings Inc |
| Morgan Stanley | Wells Fargo Bank |
| MSCS Financial Services | Wells Fargo Bank Trust NA |
| National Financial Services Co | |
It is expected that SFSC or an affiliate will make payments to these and other intermediaries for similar purposes in the future.
To promote sales of the Funds and consistent with FINRA rules, National Life, Equity Services, Inc. (“ESI”) and/or their affiliates, which are affiliates of SFSC, may contribute amounts to various non-cash and cash incentives paid to registered representatives of ESI the amounts of which may be based in whole or in part on the sales of the Funds, including (1) sponsoring educational programs, (2) sponsoring sales contests and/or promotions in which participants receive prizes such as travel, merchandise, hardware and/or software; (3) paying for occasional meals, lodging and/or entertainment; (4) making cash payments in lieu of business expense reimbursements; (5) making loans and forgiving such loans and/or (6) health and welfare benefit programs.
National Life or an affiliate may provide loans to unaffiliated distribution firms to finance business development, and may then provide further loans or may forgive outstanding loans based on specified business criteria, including sales of the Funds, and measures of business quality.
THE DISTRIBUTION PLANS
The Company has adopted several plans pursuant to Rule 12b-1 under the 1940 Act with respect to the Funds’ Class A, Class C, Class R3 and Class S shares, which have been and may be amended from time to time. In all cases, the Plans reimburse SFSC for expenses actually incurred.
Each Fund paid fees for the various activities shown below under the Plans in the amounts set forth below for the fiscal year ended November 30, 2016.
| | | | Service | | | | Recovery | | | | Salaries | | | | Occupancy | | | | Total | | | | Total | | | | |
| Fund | | | Fees Paid
To Dealers | | | | Of Prepaid
Sales Comm | | | | and
Benefits | | | | & Other
Expenses | | | | Sales
Promotion | | | | Travel &
Entertainment | | | Total1 | |
| Balanced | | | 780,759 | | | | - | | | | 550,894 | | | | 90,868 | | | | 150,220 | | | | 63,574 | | | | 1,046,119 | |
| Common Stock | | | 3,176,563 | | | | - | | | | 2,325,096 | | | | 434,268 | | | | 717,915 | | | | 303,824 | | | | 4,227,232 | |
| Government Securities | | | 411,454 | | | | - | | | | 320,555 | | | | 60,138 | | | | 99,418 | | | | 42,074 | | | | 590,011 | |
| International Equity | | | 231,617 | | | | - | | | | 261,129 | | | | 36,768 | | | | 60,783 | | | | 25,724 | | | | 344,043 | |
| Low Duration Bond | | | 1,565,186 | | | | - | | | | 608,443 | | | | 112,981 | | | | 186,776 | | | | 79,044 | | | | 1,602,145 | |
| Multi-Asset Income | | | 1,085,717 | | | | - | | | | 462,705 | | | | 69,843 | | | | 115,462 | | | | 48,864 | | | | 1,375,476 | |
| Small Company | | | 1,958,439 | | | | - | | | | 1,230,324 | | | | 215,497 | | | | 356,251 | | | | 150,767 | | | | 2,639,151 | |
| Sustainable Core Opportunities | | | 190,178 | | | | - | | | | 451,108 | | | | 89,557 | | | | 148,052 | | | | 62,656 | | | | 740,442 | |
| Total Return Bond | | | 514,540 | | | | - | | | | 447,709 | | | | 63,909 | | | | 105,651 | | | | 44,712 | | | | 714,504 | |
| Unconstrained Bond | | | 1,031 | | | | 499 | | | | 729 | | | | 90 | | | | 149 | | | | 63 | | | | 2,254 | |
| Total | | | 9,915,482 | | | | 499 | | | | 6,658,692 | | | | 1,173,919 | | | | 1,940,677 | | | | 821,302 | | | | 13,281,377 | |
| 1 | This represents the total payment by each fund, which was less than the sum of all expenses because total expenses exceeded the maximum 12b-1 fee reimbursement. Total expenses were $7,336,887 greater than the maximum allowed reimbursement. |
Under the Plans applicable to Class A shares of the Funds, it is expected that the amounts payable to SFSC by the Funds will be equal to: (a) 0.25% of average daily net assets in the case of the Balanced, Common Stock, International Equity, Low Duration Bond, Multi-Asset Income, Small Company and Sustainable Core Opportunities Funds, and (b) 0.20% of average daily net assets in the case of the Government Securities, Total Return Bond and Unconstrained Bond Funds.
Under these Plans, SFSC may be reimbursed for distribution and service fees paid to financial intermediaries; salaries and expenses of the SFSC’s wholesale sales force and SFSC’s home office management and marketing personnel; expenses incurred by SFSC for the occupancy of its office space; expenses incurred by SFSC with respect to equipment and supplies; expenses incurred for the preparation, printing and distribution of sales literature used in connection with the offering of the Company’s shares to the public; expenses incurred in advertising, promoting and selling shares of the Company to the public; expenses incurred for the preparation, printing and distribution of the prospectus and statement of additional information of the Company, and any supplement thereto used in connection with the offering of the Company’s shares to the public; and expenses incurred for the printing of additional copies for use by SFSC as sales literature of reports and other communications which were prepared by the Company for distribution to existing shareholders. No fee is paid by SFSC to financial intermediaries with respect to any Fund shares purchased prior to March 1, 1993.
Under the Plan applicable to the Class C shares of the Funds, it is expected that the amounts payable to SFSC by the Funds will be equal to 1.00% of the net assets of the Class C shares of the relevant Fund. SFSC will use such payments to recoup service and
distribution fees with respect to Class C shares paid to financial intermediaries; front-end sales commissions paid by SFSC to financial intermediaries, together with the costs of financing such payments incurred by SFSC, except to the extent such costs are recovered through contingent deferred sales charges collected by SFSC; and expenses incurred for state “blue sky” registration fees for the first year of operations of the Class C shares of the Fund.
Under the Plan applicable to the Class R3 shares of the Total Return Bond Fund, it is expected that the amounts payable to SFSC will be equal to 0.50% of the net assets of the Class R3 shares of the Total Return Bond Fund. SFSC will use such payments to recoup distribution fees paid to financial intermediaries; salaries and expenses of SFSC’s wholesale sales force, and SFSC’s home office management and marketing personnel; expenses incurred by SFSC for the occupancy of its office space; expenses incurred by SFSC with respect to equipment and supplies; expenses incurred for the preparation, printing and distribution of sales literature used in connection with the offering of the Company’s shares to the public; expenses incurred in advertising, promoting and selling shares of the Company to the public; expenses incurred for the preparation, printing and distribution of the prospectus and statement of additional information of the Company, and any supplement thereto used in connection with the offering of the Company’s shares to the public; and expenses incurred for the printing of additional copies for use by SFSC as sales literature of reports and other communications which were prepared by the Company for distribution to existing shareholders.
Under the Plan applicable to the Class S shares of the Low Duration Bond Fund, it is expected that the amounts payable to SFSC will be equal to 0.50% of the net assets of the Class S shares of the Low Duration Bond Fund. SFSC will use such payments to recoup distribution fees paid to financial intermediaries; salaries and expenses of SFSC’s wholesale sales force, and SFSC’s home office management and marketing personnel; expenses incurred by SFSC for the occupancy of its office space; expenses incurred by SFSC with respect to equipment and supplies; expenses incurred for the preparation, printing and distribution of sales literature used in connection with the offering of the Company’s shares to the public; expenses incurred in advertising, promoting and selling shares of the Company to the public; expenses incurred for the preparation, printing and distribution of the prospectus and statement of additional information of the Company, and any supplement thereto used in connection with the offering of the Company’s shares to the public; and expenses incurred for the printing of additional copies for use by SFSC as sales literature of reports and other communications which were prepared by the Company for distribution to existing shareholders.
The Board believes that a consistent cash flow resulting from the sale of new shares is necessary and appropriate to meet redemptions and for the Funds to take advantage of buying opportunities without having to make unwarranted liquidations of portfolio securities. Because SFSC receives no other compensation from the Funds, the Board believes it would benefit the Funds to have monies available for the direct distribution activities of SFSC in promoting the sale of shares of the Funds.
The Plans have been approved by the Board, including all the Independent Directors. The Plans must be renewed annually by the Board, including a majority of the Independent Directors who have no direct or indirect financial interest in the operation of the Plans. It is also required that the selection and nomination of such Directors be done by the Independent Directors. The Plans and any distribution agreement may be terminated at any time, without penalty, by such Directors on 60 days’ written notice. SFSC or any intermediary may also terminate their respective distribution agreement at any time upon written notice.
The Plans and any distribution agreement may not be amended to increase materially the amount spent for distribution expenses or in any other material way without approval by a majority of the Funds’ outstanding shares, and all such material amendments to any Plan or any distribution agreement also shall be approved by a vote of a majority of the Independent Directors, cast in person at a meeting called for the purpose of voting on any such amendment.
SFSC is required to report in writing to the Board at least quarterly on the amounts and purpose of any payments made under the Plans and any distribution agreement, as well as to furnish the Board with such other information as reasonably may be requested in order to enable the Board to make informed determinations of whether the Plans should be continued.
FUND SERVICES ARRANGEMENTS
Transfer Agency, Dividend Disbursing and Administrative Services.
The Company has engaged Boston Financial Data Services, Inc. (“BFDS”, or the “Transfer Agent”), located at 2000 Crown Colony Drive, Quincy, Massachusetts, 02169, as the Sentinel Funds’ transfer agent to provide transfer agency and other related services. Prior to December 1, 2014, transfer agency and other related services were provided by Sentinel Administrative Services, Inc. (“SASI”) under a Transfer Agent and Dividend Disbursing Agent Agreement, and sub-transfer agency services were provided by BFDS. SASI is a wholly owned subsidiary of the Adviser and is located at One National Life Drive, Montpelier, Vermont 05604
SASI serves as the administrator to the Sentinel Funds under an Amended and Restated Administration Agreement. Under this Agreement, SASI provides the Sentinel Funds with administration and supervisory oversight of certain fund accounting, transfer agency and shareholder relations services. With respect to fund accounting services, the Sentinel Funds pay SASI a monthly fee at the annual rate of 0.0375% of the first $4 billion of the Sentinel Funds’ aggregate average daily net assets; 0.0350% of the next $3 billion of the Sentinel Funds’ aggregate average daily net assets and 0.0325% of the Sentinel Funds’ aggregate average daily net assets in excess of $7 billion. The Sentinel Funds are responsible for all charges of outside pricing services and other out-of- pocket expenses incurred by SASI in connection with the performance of its duties under this Agreement. Day to day fund accounting services are provided by State Street Bank and Trust Company. With respect to other administrative services and supervisory oversight of transfer agency services, the Funds reimburse SASI for all costs and expenses relating to SASI’ performance of these services, including personnel costs attributable to these services. In addition, the Sentinel Funds reimburse SASI for certain out-of-pocket expenses, including sub-transfer agent fees with respect to accounts held at retirement plan recordkeepers and similar intermediaries that underlie an omnibus account on a Fund’s books and records. These sub-transfer agent fee reimbursements are capped at an annual per account rate subject to annual review and approval of the Funds’ Directors.
Fees paid by the Company to SASI under the Administration and Transfer Agent and Dividend Disbursing Agent Agreements were $4,961,164 for fiscal year 2014, $3,254,766 for fiscal year 2015 and $2,876,551 for fiscal year 2016. It is expected that many Fund shares will be owned by certain intermediaries for the benefit of their customers. Because SFSC often does not maintain an account for shareholders in those instances, some or all of the recordkeeping services for these accounts may be performed by intermediaries.
SFSC or an affiliate makes payments out of its own resources to intermediaries, including those that sell shares of the Funds, for recordkeeping services as described above under “Payments to Intermediaries”. Retirement plans may also hold Fund shares in the name of the plan, rather than the participant. Plan recordkeepers, who may have affiliated financial intermediaries who sell shares of the Funds, may, at the direction of a retirement plan’s named fiduciary, be paid for providing services that would otherwise have been performed by SFSC or an affiliate. Payments may also be made to plan trustees to defray plan expenses or otherwise for the benefit of plan participants and beneficiaries. For certain types of tax-exempt plans, payments may be made to a plan custodian or other entity which holds plan assets. Payments also may be made to offset charges for certain services, such as plan participant communications, provided by SFSC or an affiliate or an unaffiliated third party.
In certain situations where SFSC or an affiliate provides recordkeeping services to a retirement plan, credits may be accrued which may be subsequently drawn down to pay for plan expenses. Credits may be accrued based on investments in particular Funds, or may be awarded for a given period of time. At the direction of a plan sponsor, credits generally may be used to offset certain non-recordkeeping expenses, such as the creation of plan participant communications. Credits also may be used to reimburse plan sponsors, or at the direction of plan sponsors, third parties, for expenses incurred in connection with plan services provided by a third party.
Custodian Services. State Street Bank and Trust Company, located at 801 Pennsylvania Avenue, Kansas City, MO 64105, is the Fund’s custodian (the “Custodian”). The Custodian is responsible for safeguarding and controlling the Funds’ cash and securities, handling the receipt and delivery of securities and collecting interest and dividends on the Funds’ investments. The Custodian is authorized to establish separate accounts in foreign currencies and to cause foreign securities owned by the Funds to be held in its offices outside the United States and with certain foreign banks and securities depositories.
The Sentinel Funds paid fees to the Custodian for custodian services totaling $463,025 for fiscal year 2014, $511,317 for fiscal year 2015 and $482,180 for fiscal year 2016.
Independent Registered Public Accounting Firm. PricewaterhouseCoopers LLP, located at 300 Madison Ave., New York, NY 10017, is the Funds’ independent registered public accounting firm. The Funds independent registered public accounting firm is responsible for auditing the financial statements of the Funds.
PORTFOLIO TRANSACTIONS AND BROKERAGE COMMISSIONS
Purchases are made for investment and not for trading purposes, except for the fixed income and asset allocation Funds where trading may be an important factor. Subject to the direction and control of the Board and in accordance with its advisory agreements, the Adviser supervises the investments of the Funds and, as an essential feature thereof, places orders for the purchase and sale of portfolio securities and supervises their execution, including negotiating the amount of the commission rate paid, in each case at prices it believes to be the best then available, taking into consideration such factors as price, commission, size of order, difficulty of execution and skill required of the executing broker-dealer as well as the extent to which a broker capable of satisfactory execution may provide research information and statistical and other services to the Adviser. In making such purchases and sales, the brokerage commissions are paid by the Funds. The Funds may also buy or sell securities from, or to, dealers acting as principals.
Section 28(e) of the Securities Exchange Act of 1934, as amended (“1934 Act”), which was enacted by Congress in connection with the elimination of fixed commission rates on May 1, 1975, provides that, except as agreements such as investment advisory contracts otherwise provide, money managers such as the Adviser will not be deemed to have acted unlawfully or to have breached a fiduciary duty if, subject to certain conditions, a broker-dealer is paid in return for brokerage and research services an amount of commission for effecting transactions for accounts, such as the Funds, in excess of the amount of commission another broker-dealer would charge for effecting the transaction. In order to cause the Funds to pay such greater commissions, the Adviser has to determine in good faith that the greater commission is reasonable in relation to the value of the brokerage and research services provided by the broker-dealer viewed in terms of either a particular transaction or the Adviser’s overall responsibilities to the Funds and to its other clients.
Brokerage and research services, as provided in Section 28(e) of the 1934 Act, include advice as to the value of securities, the advisability of investing in, purchasing or selling securities, the availability of securities or purchasers or sellers of securities; furnishing analyses and reports concerning issuers, industries, securities, economic factors and trends, portfolio strategy and the performance of accounts and effecting securities transactions and performing functions incidental thereto (such as clearance, settlement and custody). Research obtained in this manner may be used by the Adviser in servicing any or all of the Funds and in servicing other client accounts, and the Adviser obtains research services through the commissions paid in managing other client accounts. The Funds may benefit from research obtained through the commissions paid by the Adviser’s other client accounts.
Although research and market and statistical information from brokers and dealers can be useful to the Funds, it is the opinion of the management of the Funds that such information is only supplementary to the Adviser’s own research effort, since the information must still be analyzed, weighed and reviewed by the Adviser’s staff.
The Adviser obtains brokerage and research services specifically in exchange for commissions paid by the Funds and its other clients. These service providers may include, but are not limited to: Advent Software, BCA Research, Bloomberg, Briefing.com, Dow Jones, Factset, First Rain, Gartner, ITG, Morningstar, MSCI, NYSE, Russell Indices, Standard & Poor’s, SNL, Sustainalytics and Value Line.
Except for implementing the policies stated above, there is no commitment to place portfolio transactions with brokers or dealers who provide investment research. The Adviser has advised the Funds that it is not feasible to assign any precise value to services provided by such brokers and dealers to it, nor does the use of such services reduce its expense by any measurable or significant amount.
For the fiscal years ended November 30, 2016, 2015 and 2014, brokerage commissions paid by each Fund were as follows:
| Fund | 11/30/2016 | | 11/30/15 | | 11/30/14 |
| Balanced | $28,390 | | $47,480 | | $76,178 |
| Common Stock | 393,004 | | 680,762 | | 977,201 |
| Government Securities | None | | None | | None |
| International Equity | 210,076 | | 221,312 | | 299,603 |
| Low Duration Bond | 86,982 | | None | | None |
| Multi-Asset Income | 149,350 | | 165,060 | | 121,123 |
| Small Company | 1,875,084 | | 1,659,623 | | 2,191,106 |
| Sustainable Core Opportunities | 175,433 | | 74,161 | | 86,428 |
| Total Return Bond | 88,900 | | None | | None |
| Unconstrained Bond* | 4,609 | | None | | None |
| Total | $3,011,828 | | $2,848,398 | | $3,751,639 |
* Commenced operations December 23, 2014.
Certain commissions were allocated on the basis of research and statistical or other services provided by the dealer, although selling group dealers may have participated therein. Of the total commissions paid by the Funds, 89.6%, 89.2% and 89.5% respectively, were allocated in fiscal years 2016, 2015 and 2014 to brokers or dealers whose furnishing of research information was a factor in their selection.
At such time as the Adviser deems it advisable, the Fund may participate in a program with State Street Global Markets, LLC (“State Street Global”) under which the Fund would receive a credit for part of the brokerage commission paid in any brokerage transaction directed to participating brokers. The credit is applied to Fund expenses payable to the Fund’s third-party service providers other than
the Adviser or its affiliates. The credit may be applied to the fees of the Fund’s custodian, which is an affiliate of State Street Global. Neither the Adviser nor its affiliates receive any direct or indirect benefit from this arrangement.
For each Fund that acquired securities of its regular brokers or dealers (as defined in Rule 10b-1 of the 1940 Act) during the most recent fiscal year, listed below is the Fund’s aggregate holdings of the securities of such broker or dealer as of the close of the most recent fiscal year:
| Fund | | Regular Broker-Dealer | | Aggregate Value of
Securities Owned as of
November 30, 2016 |
| Balanced | | Morgan Stanley | | | $4,136,000 | |
| | | | | | | |
| Common Stock | | Morgan Stanley | | | 43,428,000 | |
| | | | | | | |
| Sustainable Core Opportunities | | Morgan Stanley | | | 6,617,600 | |
| | | Raymond James financial, Inc. | | | 2,727,246 | |
| | | Wells Fargo & Co. | | | 2,910,600 | |
PORTFOLIO TURNOVER
Portfolio turnover is the ratio of the lesser of annual purchases or sales of portfolio securities to average monthly market value, not including short-term securities. In the most recent full fiscal years ended 2016 and 2015, the Funds had the following rates of portfolio turnover:
| Fund | 2016 | | 2015 |
| | | | |
| Balanced | 45% | | 86% |
| Common Stock | 8% | | 11% |
| Government Securities | 59% | | 150% |
| International Equity | 36% | | 55% |
| Low Duration Bond | 117% | | 27% |
| Multi-Asset Income | 228% | | 198% |
| Small Company | 61% | | 70% |
| Sustainable Core Opportunities | 33% | | 20% |
| Total Return Bond | 240% | | 441% |
| Unconstrained Bond | 472% | | 1153% |
CAPITALIZATION
Shares of the Company’s common stock are fully paid and non-assessable and have no preemptive rights. Each such share is freely assignable to another bona fide investor by way of pledge (as, for example, for collateral purposes), gift, settlement of an estate and, also, by an investor who has held such Fund shares for not less than 30 days. Each share of the Company is entitled, at the discretion of the Board, to one vote per dollar of net asset value per share or one vote per share, on matters on which all Funds of the Company
vote as a single class. Voting rights are not cumulative, so that the holders of more than 50% of the shares voting in the election of Directors can, if they choose to do so, elect all the Directors of a Fund, in which event the holders of the remaining shares would be unable to elect any person as a Director.
Each share of each class of a Fund is entitled to participate equally in dividends and distributions declared by a Fund and in the net assets of the Fund attributable to such class upon liquidation after satisfaction of outstanding liabilities.
No Fund intends to hold annual meetings of shareholders in any year in which the 1940 Act does not require shareholders to act upon any of the following matters: (i) election of Directors; (ii) approval of a management agreement; (iii) approval of a distribution agreement; and (iv) ratification of selection of independent accountants.
The by-laws of the Company require that a special meeting of shareholders be held upon the written request of not less than 25% of the outstanding shares entitled to vote at such meeting, if they comply with applicable Maryland law.
The proceeds from the sale of shares of each Fund or class of shares of the Company and all income, earnings and profits therefrom irrevocably appertain to the Fund or class of shares. Each such Fund or class of shares records all liabilities (including accrued expenses) in respect of such Fund or class of shares, as well as a share of such liabilities (including general liabilities of the Company) in respect to two or more Funds or classes of shares, in proportion to their average net assets, or in proportion to the number of their respective shareholders. The Board has adopted an “Amended Rule 18f-3 Plan” for the Company under which the methods of allocating income and expenses among classes of shares of each Fund which has multiple classes, is specified, and the Company intends to comply fully with the provisions of Rule 18f-3 under the 1940 Act in allocating income and expenses among the classes of such Funds. If any reasonable doubt exists as to the Fund or class of shares to which any asset or liability appertains, the Board may resolve such doubt by resolution.
In the case of dissolution or liquidation of the Company, the shareholders of each Fund of the Company are entitled to receive ratably per share the net assets of such Fund, with any general assets of the Company distributed ratably per share, regardless of the Fund.
HOW TO PURCHASE SHARES AND REDUCE SALES CHARGES
Shares of the Funds may be purchased at the public offering price from any authorized investment dealer as described in the Prospectus. The public offering price of Class A shares is the sum of the current net asset value per share plus a sales charge, which varies up to 5.0% of the purchase price. The public offering price of Class C, Class I, Class R3, Class R6 and Class S shares is equal to the current net asset value per share. A contingent deferred sales charge (“CDSC”) may apply to redemptions of Class C shares in the first year after purchase, or to redemptions of Class A shares where the initial sales charge was zero based on a purchase of $1,000,000 or more ($500,000 or more for the Government Securities, Total Return Bond and Unconstrained Bond Funds). See the Prospectus for more information about how to purchase shares and/or receive a reduced sales charge.
��
There may be eligibility requirements to purchase a particular share class. See the Prospectus for more information. In addition to the eligibility requirements for Class I shares specified in the Prospectus, the Directors are eligible to defer compensation payable by the Company under a deferred compensation plan and direct such compensation, while deferred, to track the performance of the Class I shares of one or more of the Funds.
ISSUANCE OF SHARES AT NET ASSET VALUE
Subject to the applicable provisions of the 1940 Act, certain investors may purchase Class A shares of the Funds at net asset value. Such investors are listed in the Prospectus. Such investors include officers, directors and employees of the Funds, the Adviser, and the Advisers’ affiliates.
You may redeem your shares on any business day (as defined below). Class A, Class I, Class R3, Class R6 and Class S shares generally are redeemed at current net asset value; a CDSC may be payable on redemptions of Class A shares (under certain circumstances) or Class C shares and will be deducted from the redemption proceeds. For further information, please refer to the Prospectus.
DETERMINATION OF NET ASSET VALUE
Net asset value for each class of shares of a Fund is calculated each day that the New York Stock Exchange (“NYSE”) is open, as of the close of business on the NYSE, based on prices at the time of closing of regular trading. The NYSE generally closes at 4:00 p.m.
Eastern Time. The net asset value per share is computed by dividing the total value of the assets of each class of the Fund, less its liabilities, by the total number of outstanding shares of each class of such Fund.
Security Valuation: Equity securities that are traded on a national or foreign securities exchange and over-the-counter (“OTC”) securities listed in the NASDAQ National Market System are valued at the last reported sales price or official closing price on the principal exchange on which they are traded on the date of determination as of the close of business of the NYSE, usually 4:00 p.m. Eastern Time, each day that the NYSE is open. ETFs will be valued at their most recent closing price.
Foreign equity securities traded on a foreign securities exchange are subject to fair value pricing when appropriate, using valuations provided by an independent pricing service.
Securities for which no sale was reported on the valuation date are valued at the mean between the last reported bid and asked prices.
OTC securities not listed on the NASDAQ National Market System are valued at the mean of the current bid and asked prices.
Fixed-income securities with original maturities of greater than 60 days, including short-term securities with more than 60 days left to maturity, are valued on the basis of valuations provided by an independent pricing service. The bid price is generally used for valuation purposes. Short-term securities with original maturities of less than 60 days are valued at amortized cost, which approximates market value and are reviewed to determine that no material variation exists between amortized cost and market The value of short-term securities originally purchased with maturities greater than 60 days is determined based on an amortized value to par when they reach 60 days or less remaining to maturity. The amortized cost method values a security at cost on the date of purchase and thereafter assumes a constant amortization to maturity of any discount or premium. Investments in mutual funds are valued at the net asset value per share on the day of valuation. Investments in exchange traded derivatives are valued at the settlement price determined by the relevant exchange. Investments in non-exchange traded derivatives and cleared derivatives are valued on the basis of prices supplied by an independent pricing service, if available, or quotes obtained from brokers and dealers.
Securities for which market quotations are not readily available, or whose values have been materially affected by events occurring before a Fund’s pricing time but after the close of the securities’ primary markets, including an unscheduled early closing of a primary exchange or when trading is halted during the day and does not resume prior to the time a Fund’s net asset value is calculated, will be fair valued under procedures adopted by the Funds’ Board of Directors. The Board has delegated this responsibility to the Sentinel Valuation Committee (the “Valuation Committee”), established by the Adviser and subject to the Board’s review and supervision.
The Funds may use one or more independent pricing services, as approved by the Board. Such independent pricing services shall provide their daily evaluations directly to the Funds’ custodian bank and fund accounting service provider, State Street Bank and Trust Company (“SSB”). SASI shall have an oversight role over the daily accounting process. Portfolio securities for which market quotations are readily available shall be valued at current market value; other securities and assets shall be valued at fair value as determined in good faith by Sentinel, which may act through its Valuation Committee, subject to the overall oversight of the Board or its Audit Committee. Fair value represents a good faith approximation of the value of a security. The fair value of one or more securities may not, in retrospect, be the price at which those assets could have been sold during the period in which the particular fair values were used in determining a Fund’s net asset value.
The Valuation Committee, SSB and SASI perform a series of activities to provide reasonable comfort over the accuracy of prices including: 1) periodic vendor due diligence meetings to review underlying methodologies, policies and procedures with respect to valuations, 2) daily monitoring of significant events that may impact markets and valuations, 3) daily comparisons of security valuations versus prior day valuations for all securities with additional follow-up procedures implemented for those that exceed established thresholds, and 4) daily reviews of stale valuations and manually priced securities which may be subjected to additional procedures at the discretion of the Valuation Committee.
In addition, there are several processes outside of the pricing process that are used to monitor valuation issues including: 1) performance and performance attribution reports are monitored by the Adviser for anomalous impacts based upon benchmark performance, and 2) portfolio managers review all portfolios for performance and analytics.
Securities transactions are accounted for on the next business day following trade date (trade date plus one). Under certain circumstances, exceptions are made so that purchases and sales are booked on trade date. These exceptions include: (1) when trades occur on a day that happens to coincide with the end of a month; or (2) on occasion, if SASI believes significant price movements are deemed large enough to impact the calculation of the net asset value per share.
TAXES
The Funds intend to continue to qualify for the special tax treatment afforded regulated investment companies (“RICs”) under the Code. As long as it so qualifies, a Fund will not be subject to federal income tax on the part of its net ordinary income and net realized capital gains which it distributes to shareholders. Each Fund intends to distribute substantially all of such income. If, in any taxable year, a Fund fails to qualify as a RIC under the Code, notwithstanding the availability of certain relief provisions, it would be taxed in the same manner as an ordinary corporation and all distributions from earnings and profits (as determined under U.S. federal income tax principles) to its shareholders would be taxable as ordinary dividend income eligible for the reduced tax rate for non-corporate shareholders (currently a maximum of 20%, not including the 3.8% Medicare tax described below) and the dividends-received deduction for corporate shareholders.
The Company consists of several separate Funds. Each such Fund in the Company is a separate corporation for federal income tax purposes and is thus considered to be a separate entity in determining its treatment under the rules for RICs. Losses in one Fund do not offset gains in another Fund, and the requirements (other than certain organizational requirements) for qualifying for RIC status are determined at the Fund level rather than at the Company level.
Dividends paid by a Fund from its ordinary income or from an excess of net short-term capital gain over net long-term capital loss (together referred to hereafter as “ordinary income dividends”) are taxable to shareholders as ordinary income for federal income tax purposes. Distributions made from an excess of net long-term capital gain over net short-term capital loss (hereinafter referred to as “capital gain dividends”) are taxable to shareholders as long-term capital gains for federal income tax purposes, regardless of the length of time the shareholder has owned such Fund’s shares. Each Fund will furnish its shareholders with a written statement reporting the amounts of any exempt-interest dividends and capital gain dividends, and the portion of any ordinary income dividends eligible for either the dividends received deduction allowed to corporations under the Code or the reduced individual income tax rate applicable to qualified dividend income, as described below.
A debt obligation is purchased with market discount if it is acquired at a price below the principal amount or, in the case of a debt obligation having original issue discount, if it is acquired at a price below the “adjusted issue price.” In the case of a tax-exempt obligation, market discount results in ordinary, taxable income, and is taken into account either when the tax exempt obligation is sold or retired or, if the Fund so elects, incrementally over each taxable year in which the Fund holds the obligation. The treatment of market discount may result in, or increase the amount of, ordinary income dividends received by shareholders.
Certain dividend income and long-term capital gains are eligible for taxation at a reduced rate applicable to non-corporate shareholders. Under these rules, distributions comprised of dividends from domestic corporations and certain foreign corporations (generally, corporations incorporated in a possession of the United States, some corporations eligible for treaty benefits under a treaty with the United States and corporations to the extent their stock is readily tradable on an established securities market in the United States) are treated as “qualified dividend income” eligible for taxation at a reduced tax rate (currently a maximum of 20%, not including the 3.8% Medicare tax described below) in the hands of non-corporate shareholders. A certain portion of dividends paid by a RIC to non-corporate shareholders may be eligible for treatment as qualified dividend income. In order for dividends paid by a Fund to be qualified dividend income, the Fund must meet holding period and other requirements with respect to the dividend-paying stocks in its portfolio and the non-corporate shareholder must meet holding period and other requirements with respect to the Fund’s shares. To the extent that a Fund engages in securities lending with respect to stock paying qualified dividend income, it may be limited in its ability to pay qualified dividend income to its shareholders. Additionally, to the extent a Fund’s distributions are derived from income on debt securities, or on certain types of preferred stock treated as debt for federal income tax purposes, or consist of short-term capital gain, such Fund’s distributions will not be eligible for the reduced tax rate.
Any loss upon the sale or exchange of Fund shares held for six months or less will be disallowed or treated as long-term capital loss for federal income tax purposes to the extent of any capital gain dividends received by the shareholder. Distributions in excess of a Fund’s earnings and profits will first reduce the adjusted tax basis of a holder’s shares and, after such adjusted tax basis is reduced to zero, will constitute capital gains to such holder for federal income tax purposes (assuming the shares are held as a capital asset). Because each Fund has a non-calendar taxable year, a Fund’s earnings and profits are allocated first to distributions made on or before December 31 of the taxable year, and then to distributions made after December 31 of the taxable year.
Dividends are taxable to shareholders for federal income tax purposes even though they are reinvested in additional shares of the Funds. Generally, distributions by the Funds will not be eligible for the dividends received deduction allowed to corporations under the Code (although dividends from a Fund could be eligible to the extent attributable to dividends from domestic corporations). Except to the extent that distributions from a Fund are attributable to dividends from qualifying foreign corporations and domestic corporations, distributions from a Fund will also not be eligible for the reduced tax rate applicable to qualified dividend income in the
hands of non-corporate shareholders. A Fund will allocate any dividends eligible for the dividends received deduction and/or the reduced income tax rate applicable to qualified dividend income, any capital gain dividends as well as any exempt-interest dividends (and preference items) among the various classes of shares according to a method (which it believes is consistent with SEC Rule 18f-3 which authorizes the issuance and sale of multiple classes of shares) that is based on the gross income allocable to each class of shares during the taxable year, or such other method as the Internal Revenue Service (“IRS”) may prescribe.
If a Fund pays a dividend in January which was declared in the previous October, November or December to shareholders of record on a specified date in one of such months, then such dividend will be treated for federal income tax purposes as having been paid by the RIC and received by its shareholders on December 31 of the year in which the dividend was declared. If a Fund reports more capital gain dividends than it earns in such taxable year, then the Fund will reduce the amounts reported as capital gains. Where possible, such reduction will first be allocated to dividends made after December 31 of such taxable year. A Fund may elect to defer recognizing, until the following taxable year, certain net capital losses arising after October 31 of the current taxable year, and certain net ordinary losses arising after October 31 and/or December 31 of the current taxable year. This may have the effect of increasing the amount of dividends otherwise includible in the shareholder’s income with respect to the shareholder’s current taxable year.
A Fund is generally required by law to report to each shareholder and to the IRS cost basis information for shares of the Fund acquired on or after January 1, 2012, and sold or redeemed after that date. Upon a sale or redemption of such shares, a Fund will be required to report the adjusted cost basis, the gross proceeds from the sale or redemption, and whether the related gain or loss is long-term or short-term. The cost basis of the shares sold or redeemed will be based on the default cost basis reporting method selected by a Fund, unless a shareholder, before the sale or redemption, informs the Fund that it has selected a different IRS-accepted method offered by the Fund. This requirement will not apply, however, for investments through an IRA or other tax-advantaged account. Shareholders should consult their tax advisors to determine the best IRS-accepted cost basis method for their tax situation, and to obtain more information about how this new cost basis reporting requirement applies to them.
The Funds’ default accounting method for shares acquired after January 1, 2012 is Average Cost. If you prefer not to utilize the Average Cost method, you may elect a different accounting method by utilizing the “My Account” option on our website and submitting your preference online or by completing the Cost Basis Election Form available under the Forms and Literature option at www.sentinelinvestments.com. Completed forms should be sent to:
Sentinel Investments
C/O Boston Financial Data Services
PO Box 55929
Boston MA 02205-5929
Under certain provisions of the Code, some shareholders may be subject to a withholding tax on most ordinary income dividends and on capital gain dividends and redemption payments (“backup withholding”). Generally, shareholders subject to backup withholding will be non-corporate shareholders for whom no certified taxpayer identification number is on file with the Company, or who, to the Company’s knowledge, have furnished an incorrect number. When establishing an account, an investor must certify under penalty of perjury that such number is correct and that such investor is not otherwise subject to backup withholding. Backup withholding is not an additional tax. Any amount withheld generally may be allowed as a refund or credit against a shareholder’s federal income tax liability provided the required information is timely provided to the IRS.
Ordinary income dividends paid to shareholders who are nonresident aliens or foreign entities generally will be subject to a 30% U.S. withholding tax unless a reduced rate of withholding or a withholding exemption is provided under applicable treaty law. However, dividends derived by a RIC from short-term capital gains and qualifying net interest income (including income from original issue discount and market discount) and paid to shareholders who are nonresident aliens and foreign entities, if and to the extent properly reported as “interest-related dividends” or “short-term capital gain dividends,” generally will not be subject to U.S. withholding tax. Under guidance issued by the IRS, a RIC will generally be allowed to report the maximum amount of its qualified dividend income, interest related dividends and short term capital gain dividends even where the aggregate of the amounts reported exceeds the amounts of the RIC distributions. No assurance can be given whether any of the Fund’s distributions will be reported as eligible for this exemption from withholding tax. Nonresident stockholders are urged to consult their own tax advisers concerning the applicability of the U.S. withholding tax.
Dividends and interest received by a Fund may give rise to withholding and other taxes imposed by foreign countries. Tax conventions between certain countries and the United States may reduce or eliminate such taxes. Shareholders of a Fund may be able
to claim United States foreign tax credits with respect to such taxes, subject to certain conditions and limitations contained in the Code. A foreign tax credit may be claimed with respect to withholding tax on a dividend only if the shareholder meets certain holding period requirements. The distributing Fund also must meet these holding period requirements, and if the Fund fails to do so, it will not be able to “pass through” to shareholders the ability to claim a credit or a deduction for the related foreign taxes paid by such Fund. If a Fund satisfies the holding period requirements and if more than 50% in value of its total assets at the close of the taxable year consists of securities of foreign corporations, such Fund will be eligible to file an election with the IRS pursuant to which shareholders of the Fund will be required to include their proportionate shares of such withholding taxes in their United States income tax returns as gross income, treat such proportionate shares as taxes paid by them, and deduct such proportionate shares in computing their taxable incomes or, alternatively, use them as foreign tax credits against their United States income taxes. No assurances can be provided that the Fund will meet the requirements necessary to make such election. No deductions for foreign taxes may be claimed by non-corporate shareholders who do not itemize deductions. A shareholder that is a nonresident alien individual or a foreign corporation may be subject to United States withholding tax on the income resulting from a Fund’s election described in this paragraph but may not be able to claim a credit or deduction against such United States tax for the foreign taxes treated as having been paid by such shareholder. Additionally, certain retirement accounts cannot claim foreign tax credits on investments in foreign securities held in a Fund. A Fund, if applicable, will report annually to shareholders the amount per share of such withholding taxes and other information needed to claim the foreign tax credit. For purposes of passing through the foreign tax credit, if applicable, a Fund will allocate foreign taxes and foreign source income among its classes of shares according to a method similar to that described above for the allocation of other types of income.
Certain transactions of the Funds are subject to special tax rules of the Code that may, among other consequences, (a) affect the character of gains and losses realized, (b) disallow, suspend or otherwise limit the recognition of certain losses or deductions, and (c) accelerate the recognition of income without a corresponding receipt of cash (with which to make the necessary distributions to satisfy distribution requirements applicable to RICs). Operation of these rules could, therefore, affect the character, amount and timing of distributions to shareholders. Special tax rules also will require some of the Funds to mark to market certain types of positions in their portfolios (i.e., treat them as sold on the last day of the taxable year), and may result in the recognition of income without a corresponding receipt of cash. The Funds intend to monitor their transactions, make appropriate tax elections and make appropriate entries in their books and records to lessen the effect of these tax rules and avoid any possible disqualification for the special treatment afforded RICs under the Code.
No gain or loss will be recognized for federal income tax purposes by Class A, Class C or Class S shareholders exchanging into Class I shares of the same Fund pursuant to the provisions of the then-current Prospectus. A shareholder’s basis in the Class I shares acquired will be the same as such shareholder’s basis in the shares exchanged. Shareholders should consult their tax advisers regarding the state and local tax consequences of the exchange of Class A shares, Class C or Class S shares for Class I shares of the same Fund, or any other exchange of shares.
If a shareholder exercises an exchange privilege as described below within 90 days of acquiring such shares, then the loss such shareholder can recognize on the exchange for federal income tax purposes will be reduced (or the gain increased) to the extent any sales charge paid to the Company reduces any sales charge such shareholder would have owed for the shares of the new Fund in the absence of the exchange privilege. Instead, such sales charge will be treated as an amount paid for the new shares. Shareholders should consult their tax advisers regarding the state and local tax consequences of exchanging or converting classes of shares.
A loss realized on a sale or exchange of shares of a Fund will be disallowed for federal income tax purposes if other Fund shares are acquired (whether through the automatic reinvestment of dividends or otherwise) within a 61-day period beginning 30 days before and ending 30 days after the date the shares are disposed of. In such a case, the basis of the shares acquired will be adjusted to reflect the disallowed loss.
The Code requires each Fund to pay a non-deductible 4% excise tax to the extent it does not distribute, during each calendar year, 98% of its ordinary income, determined on a calendar year basis (except for foreign currency gains and losses, which are determined on a November 30 year end), and 98.2% of its capital gain net income, determined on a November 30 year end, plus certain undistributed amounts from previous years. The Company anticipates that it will make sufficient timely distributions to avoid the imposition of the excise tax.
A 30% withholding tax is imposed on dividends and will be imposed on redemption proceeds paid after December 31, 2018 to (i) foreign financial institutions (as defined in Section 1471(d)(4) of the Code) unless they agree to collect and disclose to the IRS information regarding their direct and indirect United States account holders and (ii) certain other foreign entities unless they certify certain information regarding their direct and indirect United States owners. Under some circumstances, a foreign shareholder may be eligible for refunds or credits of such taxes.
A 3.8% Medicare tax is imposed on the net investment income (which includes taxable dividends and gain recognized on the redemption or exchange of shares) of certain individuals, trusts and estates.
SHAREHOLDER SERVICES
Open Account. An open account is established automatically for each new investor, unless elected otherwise, in which all income dividends and any capital gains distributions are reinvested in additional shares, without charge, at the then current net asset value. Purchases made in this account will be made at the offering price on the day federal funds are available to the Funds as described in the Prospectus.
The Funds reserve the right at any time to vary the initial and subsequent investment minimums of any Fund.
Policy owners of National Life who invest policy dividends may open an account in any of the Funds with a minimum initial purchase of $50 or more of policy dividends and subsequent assignment of dividends to the Funds.
The Funds are not required to and do not currently intend to issue stock certificates.
Except for confirmation of purchases, the cost of these shareholder services is borne by the Funds.
Automated Clearing House (“ACH”). The ACH Network expedites the transfer of monies by electronically transmitting funds between member financial institutions. To take advantage of this convenient fund transfer method, you must provide BFDS with a pre-designated destination. There is no charge for this service.
Distribution Options. Shareholders of the Funds may elect to reinvest automatically their ordinary income and capital gain dividends in additional full and fractional shares of any one of the other funds of the Company of the same share class at the net asset value of the selected Fund at the close of business on the valuation date for the dividend, without the payment of any sales charge. Before exercising this option, shareholders should read the portions of the selected Fund’s Prospectus(es) relating to the fund’s objectives and policies. The target and original accounts for dividends must be in different funds.
Automatic Investment Plan. See the Prospectus for information. The minimum initial investment and subsequent investment is $50.
Telephone Investment Service. See the Prospectus for information.
Check Writing Service. (Class A shares of the Low Duration Bond Fund) A special feature of the Class A shares of this Fund is the check writing privilege available through State Street. Any shareholder who would like to draw checks on his non-retirement account should check the box on the application captioned “Check Writing Service” or subsequently, make a written request to the Fund. Checks then will be provided by State Street. These checks may be made payable in any amount not less than $500. Withdrawals by check may not be made until shares have been in the account for at least fifteen (15) days. The price at which shares will be redeemed to cover a check will be the net asset value determined on the day the check clears. Potential fluctuations in net asset value of the Fund’s shares should be taken into account when writing checks. If an ordinary income or capital gain dividend is paid during the period between writing and clearing of a check, the shareholder will be entitled to the dividend, but the net asset value of the shares will be reduced by the amount of the dividend payment. Because shareholders cannot determine the exact redemption price of their shares at the time a check is written, closing an account through check writing is not possible.
BFDS provides overdraft protection by automatically transferring available funds from your other identically registered accounts if you have available balances. A fee of $30.00 will be charged to the account when funds are transferred from protecting account(s) to cover an overdraft.
There is no fee for check writing, but, upon notice, a fee for this service may be charged in the future. Fees are charged for stop payments, insufficient funds or other valid reasons.
Exchange Privilege. This privilege permits a shareholder whose financial needs have changed to transfer an investment from a National Life Variable Annuity account (presently the only such entity is the Variable Annuity Account I). Such transfers from a National Life Variable Annuity account are made without a sales charge on the basis of respective net asset values.
An exchange is a taxable transaction for federal income tax purposes and any gain or loss realized is recognizable for such purposes.
Exchanges may be subject to certain limitations and are subject to the Funds’ policies concerning excessive trading practices, which are policies designed to protect the Funds and their shareholders from the harmful effect of frequent exchanges. These limitations are described in the Prospectus.
Right of Reinvestment. Shareholders who have redeemed all or part of their shares may reinvest all or part of the redemption proceeds at the current net asset value without charge if a written request is received or is postmarked within 90 days after the redemption. Low Duration Bond Fund shareholders who have held their shares for 90 days or less, however, may only use the reinstatement privilege to reinvest in the Low Duration Bond Fund. If the shareholder realizes a gain on redemption, the transaction is taxable and reinvestment will not alter any capital gains tax payable. If the shareholder realizes a loss on redemption and subsequently uses the reinstatement privilege, some or all of the loss may be disallowed under current federal tax law.
If the reinstatement is made for the purpose of effecting a rollover into an IRA, as described in Section 408(d)(3) of the Code, of a distribution from a tax sheltered retirement plan which had been invested in shares of the Funds, such reinvestment of redemption proceeds may be made any time within 60 days from the date on which the investor received the distribution.
Right To Reject Purchase and Exchange Orders. Purchases and exchanges should be made for investment purposes only. The Funds each reserve the right to reject or restrict any specific purchase or exchange request. Because an exchange request involves both a request to redeem shares of one Fund and to purchase shares of another Fund, the Funds consider the underlying redemption and purchase requests conditioned upon the acceptance of each of these underlying requests. Therefore, in the event that the Funds reject an exchange request, neither the redemption nor the purchase side of the exchange will be processed. When a Fund determines that the level of exchanges on any day may be harmful to its remaining shareholders, the Fund may delay the payment of exchange proceeds for up to seven days to permit cash to be raised through the orderly liquidation of its portfolio securities to pay the redemption proceeds. In this case, the purchase side of the exchange will be delayed until the exchange proceeds are paid by the redeeming Fund.
Application of Redemption Fee Policy to Investors Who Transact Fund Shares Through Intermediaries. As described in the Prospectus, under a Fund’s redemption fee policy the Fund may, in certain circumstances, reject an investor’s purchase or exchange of Fund shares, or impose a redemption fee. In accordance with Rule 22c-2 under the 1940 Act, a Fund will not permit investors to purchase shares through certain intermediaries, including brokers, that do not have shareholder information agreements with the Company, SFSC or SASI, acting on behalf of the Fund. Such shareholder information agreements are intended to help identify investors who engage in excessive trading through intermediaries. A Fund may elect to treat an intermediary that has no shareholder information agreement concerning the Fund as an individual investor with respect to its excessive trading policy. If a Fund makes this election, it will not, with respect to its redemption fee policy, consider any individual order to transact Fund shares that an investor has submitted to the intermediary, but will instead consider only single transactions submitted by the intermediary. Depending in part on an investor’s relationship with the intermediary, this may have adverse consequences to the investor -- such as the rejection of a transaction in Fund shares or the imposition of a fee -- that would not be borne by other investors who deal with the Fund directly or through a different intermediary.
Redemptions in Kind. Shares normally will be redeemed for cash upon receipt of a request in proper form, although each of the Funds retain the right to redeem some or all of its shares in-kind under unusual circumstances, in order to protect the interests of remaining shareholders, by delivery of securities selected from the Fund’s assets at its discretion. In-kind payment means payment will be made in portfolio securities rather than cash. If this occurs, securities received in kind remain at the risk of the market, and the redeeming shareholder might incur brokerage or other transaction costs to convert the securities to cash. As with redemptions for cash, upon a redemption in kind, any gain on the transaction may be subject to tax. If illiquid securities are used to satisfy redemptions in kind, redeeming shareholders may face difficulties in selling the illiquid securities at a fair price. The Funds have elected, however, to be governed by Rule 18f-1 under the 1940 Act so that each Fund is obligated to redeem its shares solely in cash up to the lesser of $250,000 or 1% of its net asset value during any 90-day period for any one shareholder of the Fund. The redemption price is the net asset value per share next determined after the initial receipt of proper notice of redemption.
DEALER SERVICING FEES
Dealers may charge their customers a processing or service fee in connection with the purchase or redemption of fund shares. The amount and applicability of such a fee is determined and disclosed to its customers by each individual dealer. Processing or service fees typically are fixed, nominal dollar amounts and are in addition to the sales and other charges described in the Prospectus and this Statement of Additional Information. Your financial intermediary will provide you with specific information about any processing or service fees you will be charged.
GENERAL INFORMATION
Copies of the Amended and Restated Articles of Incorporation and the Amended and Restated By-Laws of the Company, each as amended and supplemented, and various agreements referred to in the Prospectus and this Statement of Additional Information are filed with the registration statement at the SEC to which reference is made for their full terms. Such documents and other information filed with the SEC may be obtained from the SEC upon payment of the fees prescribed by the Rules of the SEC and are also available at the SEC’s Internet Web site at http://www.sec.gov. All cash and securities of the Funds, except for U.S. government securities which are represented only in book entry form at the Federal Reserve Bank, are held by State Street or in a central depository system in the name of State Street Bank & Trust Company Kansas City, 801 Pennsylvania Avenue, Kansas City, Missouri 64105 as the Funds’ Custodian. State Street is also Dividend Disbursing Agent for the Funds’ shares. Boston Financial Data Services, Inc. is Transfer Agent and Registrar for the Funds’ shares. All correspondence regarding the Funds should be mailed to the Transfer Agent at: Sentinel Investments, P.O. Box 55929, Boston, MA 02205-5929.
The independent registered public accounting firm for the Funds is PricewaterhouseCoopers LLP, located at 300 Madison Avenue, New York, NY. The independent registered public accounting firm is responsible for auditing the annual financial statements of the Company.
Counsel for the Funds is Sidley Austin LLP, 787 Seventh Avenue, New York, New York 10019.
FINANCIAL STATEMENTS
The financial statements of the Funds, that are included in the Annual Report, have been incorporated by reference into this Statement of Additional Information.
APPENDIX A: BOND RATINGS
Description of Moody’s Long-Term Obligations Ratings
There are nine basic rating categories for long-term obligations. They range from Aaa (highest quality) to C (lowest quality). Moody’s applies numerical modifiers 1, 2, and 3 in each generic rating classification from Aa to Caa. The Modifier 1 indicates that the issue ranks in the higher end of its generic rating category; the modifier 2 indicates a mid-range ranking; and the modifier 3 indicates that the issue ranks in the lower end of its generic category. Refunded issues that are secured by escrowed funds held in trust, reinvested in direct non-callable United States government obligations or non-callable obligations unconditionally guaranteed by the U.S. government are identified with a # (pound sign) symbol, e.g. # Aaa.
Aaa Bonds that are rated Aaa are judged to be of the best quality. They carry the smallest degree of investment risk and are generally referred to as “gilt edge.” Interest payments are protected by a large or by an exceptionally stable margin and principal is secure. While the various protective elements are likely to change, such changes as can be visualized are most unlikely to impair the fundamentally strong position of such issues.
Aa Bonds that are rated Aa are judged to be of high quality by all standards. Together with the Aaa group they comprise what are generally known as high grade bonds. They are rated lower than the best bonds because margins of protection may not be as large as in Aaa securities or fluctuation of protective elements may be of greater amplitude or there may be other elements present that make the long-term risks appear somewhat larger than in Aaa securities.
A Bonds that are rated A possess many favorable investment attributes and are to be considered as upper medium grade obligations. Factors giving security to principal and interest are considered adequate, but elements may be present that suggest a susceptibility to impairment sometime in the future.
Baa Bonds that are rated Baa are considered as medium grade obligations, i.e., they are neither highly protected nor poorly secured. Interest payments and principal security appear adequate for the present but certain protective elements may be lacking or may be characteristically unreliable over any great length of time. Such bonds lack outstanding investment characteristics and in fact have speculative characteristics as well.
Ba Bonds that are rated Ba are judged to have speculative elements; their future cannot be considered as well assured. Often the protection of interest and principal payments may be very moderate, and thereby not well safeguarded during both good and bad times over the future. Uncertainty of position characterizes bonds in this class.
B Bonds that are rated B generally lack characteristics of the desirable investment. Assurance of interest and principal payments or maintenance of other terms of the contract over any long period of time may be small.
Caa Bonds that are rated Caa are of poor standing. Such issues may be in default or there may be present elements of danger with respect to principal or interest.
Ca Bonds that are rated Ca represent obligations that are speculative in a high degree. Such issues are often in default or have other marked shortcomings.
C Bonds that are rated C are the lowest rated class of bonds, and issues so rated can be regarded as having extremely poor prospects of ever attaining any real investment standing.
Con. (...) Bonds for which the security depends upon the completion of some act or the fulfillment of some condition are rated conditionally. These are bonds secured by: (a) earnings of projects under construction, (b) earnings of projects unseasoned in operating experience, (c) rentals that begin when facilities are completed, or (d) payments to which some other limiting condition attaches. Parenthetical rating denotes probable credit stature upon completion of construction or elimination of basis of condition. Description of Standard & Poor’s Municipal Issue Ratings
Description of Standard & Poor’s Corporate Bond Ratings
A Standard & Poor’s issue credit rating is a forward-looking opinion of the creditworthiness of an obligor with respect to a specific financial obligation, a specific class of financial obligations, or a specific financial program. It takes into consideration the creditworthiness of guarantors, insurers, or other forms of credit enhancement on the obligation. The opinion reflects Standard & Poor’s view of the obligor’s capacity and willingness to meet its financial commitments as they come due, and may assess terms, such as collateral security and subordination, which could affect ultimate payment in the event of default. The issue credit rating is not a recommendation to purchase, sell, or hold a financial obligation, inasmuch as it does not comment as to market price or suitability for a particular investor.
Issue credit ratings are based on current information furnished by the obligors or obtained by Standard & Poor’s from other sources it considers reliable. Standard & Poor’s does not perform an audit in connection with any credit rating and may, on occasion, rely on unaudited financial information. Credit ratings may be changed, suspended, or withdrawn as a result of changes in, or unavailability of, such information, or based on other circumstances. Issue credit ratings can be either.
AAA An obligation rated ‘AAA’ has the highest rating assigned by Standard & Poor’s. The obligor’s capacity to meet its financial commitment on the obligation is extremely strong.
AA An obligation rated ‘AA’ differs from the highest-rated obligations only in small degree. The obligor’s capacity to meet its financial commitment on the obligation is very strong.
A An obligation rated ‘A’ is somewhat more susceptible to the adverse effects of changes in circumstances and economic conditions than obligations in higher-rated categories. However, the obligor’s capacity to meet its financial commitment on the obligation is still strong.
BBB An obligation rated ‘BBB’ exhibits adequate protection parameters. However, adverse economic conditions or changing circumstances are more likely to lead to a weakened capacity of the obligor to meet its financial commitment on the obligation.
BB, B, CCC, CC, And C Obligations rated ‘BB’, ‘B’, ‘CCC’, ‘CC’, and ‘C’ are regarded as having significant speculative characteristics. ‘BB’ indicates the least degree of speculation and ‘C’ the highest. While such obligations will likely have some quality and protective characteristics, these may be outweighed by large uncertainties or major exposures to adverse conditions.
BB An obligation rated ‘BB’ is less vulnerable to nonpayment than other speculative issues. However, it faces major ongoing uncertainties or exposure to adverse business, financial, or economic conditions, which could lead to the obligor’s inadequate capacity to meet its financial commitment on the obligation.
B An obligation rated ‘B’ is more vulnerable to nonpayment than obligations rated ‘BB’, but the obligor currently has the capacity to meet its financial commitment on the obligation. Adverse business, financial, or economic conditions will likely impair the obligor’s capacity or willingness to meet its financial commitment on the obligation.
CCC An obligation rated ‘CCC’ is currently vulnerable to nonpayment and is dependent upon favorable business, financial, and economic conditions for the obligor to meet its financial commitment on the obligation. In the event of adverse business, financial, or economic conditions, the obligor is not likely to have the capacity to meet its financial commitment on the obligation.
CC An obligation rated ‘CC’ is currently highly vulnerable to nonpayment.
C The ‘C’ rating may be used to cover a situation where a bankruptcy petition has been filed or similar action has been taken, but payments on this obligation are being continued.
D An obligation rated ‘D’ is in payment default. The ‘D’ rating category is used when payments on an obligation are not made on the date due even if the applicable grace period has not expired, unless Standard & Poor’s believes that such payments will be made during such grace period. The ‘D’ rating also will be used upon the filing of a bankruptcy petition or the taking of a similar action if payments on an obligation are jeopardized.
Plus (+) or minus (-)
The ratings from ‘AA’ to ‘CCC’ may be modified by the addition of a plus or minus sign to show relative standing within the major rating categories.
p This subscript is used for issues in which the credit factors, the terms, or both, that determine the likelihood of receipt of payment of principal are different from the credit factors, terms or both that determine the likelihood of receipt of interest on the obligation. The ‘p’ subscript indicates that the rating addresses the principal portion of the obligation only. The ‘p’ subscript will always be used in conjunction with the ‘i’ subscript, which addresses likelihood of receipt of interest.
NR Not rated.
Debt obligations of issuers outside the United States and its territories are rated on the same basis as domestic corporate and municipal issues. The ratings measure the creditworthiness of the obligor but do not take into account currency exchange and related uncertainties.
Moody’s Description of Short-Term Debt Ratings
Moody’s short-term ratings are opinions of the ability of issuers to honor short-term financial obligations. Ratings may be assigned to issuers, short-term programs or to individual short-term debt instruments. Such obligations generally have an original maturity not exceeding thirteen months, unless explicitly noted.
Moody’s employs the following designations to indicate the relative repayment ability of rated issuers:
P-1 Issuers (or supporting institutions) rated Prime-1 have a superior ability to repay short-term debt obligations.
P-2 Issuers (or supporting institutions) rated Prime-2 have a strong ability to repay short-term debt obligations.
P-3 Issuers (or supporting institutions) rated Prime-3 have an acceptable ability to repay short-term obligations.
NP Issuers (or supporting institutions) rated Not Prime do not fall within any of the Prime rating categories.
Note: Canadian issuers rated P-1 or P-2 have their short-term ratings enhanced by the senior-most long-term rating of the issuer, its guarantor or support-provider.
APPENDIX B: Proxy Voting Procedures
Sentinel Asset Management, Inc.
Proxy Voting Philosophy and Procedures
Revised February 2016, Effective April 2016
The proxy voting philosophy and procedures outlined below pertain to the mutual fund accounts (“the Funds”) managed by Sentinel Asset Management, Inc. (“SAM”), including Sentinel’s sustainable fund (“the Sustainable Fund”). For externally managed accounts, the sub-advisor shall maintain its own proxy voting philosophy and policy, unless otherwise agreed.
Fiduciary Responsibility
Sentinel Asset Management, Inc. has the fiduciary responsibility to make all decisions (including those related to proxy issues) according to the best interests of the ultimate beneficiaries of the various accounts under management. While SAM will carefully review each proxy issue and evaluate the statements of competing parties, the determination of the final vote, and/or resolution of any potential conflict of interest, will be based solely on the best interests of Sentinel Asset Management, Inc. clients and the Funds’ shareholders.
Proxy Voting Procedures
Proxies are voted by professional(s) designated by the CEO of SAM. To help make sure that SAM votes Fund proxies in accordance with these procedures, votes other client proxies in accordance with the procedures applicable to such other clients, and in the best interests of the Funds and other clients, SAM has established a Proxy Committee (the “Committee”), which is responsible for overseeing SAM’s proxy voting process. The Committee consists, at its core, of the following persons at SAM (i) the Chief Compliance Officer; (ii) one representative from the sustainable investing research department; and (iii) one representative from the investment management department. The person representing each department on the Committee may change from time to time. The Committee will meet as necessary to help SAM fulfill its duties to vote proxies for clients, but in any event, will meet at least annually to discuss various proxy voting issues. The Committee will designate a chair who will be primarily responsible for coordinating the activities of the Committee. The chair also will be primarily responsible for dealing directly with any third party to whom SAM delegates its administrative duties with respect to voting proxies under these procedures.
One of the main responsibilities of the Committee is to review and approve these procedures on a yearly basis. When reviewing these procedures, the Committee verifies that these procedures are designed to allow SAM to vote proxies in a manner consistent with the goals of voting in the best interests of the Funds and their shareholders, and maximizing the value of the underlying shares being voted by SAM. The Committee also reviews these procedures to ensure that they comply with any new rules promulgated by the SEC or other relevant regulatory bodies. After these procedures are approved by the Committee, SAM will vote proxies on securities held in the Funds generally in accordance with these procedures.
In order to facilitate the actual process of voting proxies, SAM has contractually delegated its administrative duties with respect to analyzing proxies to a third-party proxy agent (“the Agent”)1. Both the Agent and the Funds’ custodian monitor corporate events for SAM. SAM also gives an authorization and direction letter to the Funds’ custodian who then forwards the proxy statements to the Agent to analyze the proxy statements. On approximately a daily basis SAM will send the Agent an updated list of the security holdings in the Funds so that the Agent can update its database and is aware of which proxies they will need to analyze on behalf of the Funds. If needed, the Committee has access to these records. SAM provides the Agent with these procedures to use to analyze proxy statements on behalf of the Funds, and the Agent provides the vote recommendations to the SAM designee(s) so SAM may vote those proxy statements on behalf of the Funds in accordance with these procedures.
When the procedures state that a proxy issue will be decided on a case-by-case basis, the Agent will indicate “REFER” as the vote recommendation. The Committee chair, in consultation with the appropriate portfolio manager or analyst from the investment management department, will look at the relevant facts and circumstances and research the issue to determine how the proxy should be voted, so that the proxy is voted in the best interests of the Funds and their shareholders and in accordance with the parameters described in these procedures generally and specifically in the Proxy Voting Guidelines (the “guidelines”) below.
If these procedures do not address a particular proxy issue presented with respect to a Fund holding, the Agent will similarly indicate “REFER” as the vote recommendation. The Committee chair, in consultation with the appropriate portfolio manager or analyst from the investment department, will look at the relevant facts and circumstances and research the issue to determine how the proxy should
1 Currently, Institutional Shareholder Services (“ISS”) is the third-party proxy agent.
be voted, so that the proxy is voted in the best interests of the Funds and their shareholders, and pursuant to the spirit of these procedures. These procedures may be updated to reflect the proxy issue, if appropriate.
After a proxy has been voted, the Agent will create a record of the vote. After the proxies have been voted, each individual proxy vote is recorded with the Agent. The Agent records the following information: actual vote on each resolution, number of shares voted, whether vote was for or against management’s recommendation, and the date the proxy was voted. The Agent maintains these records on behalf of SAM.
There may be times when SAM believes that the best interests of the Funds and their shareholders will be better served if SAM votes a proxy counter to the established proxy voting guidelines. In those cases, the Committee may review the research provided by the Agent on the particular issue, and it may also conduct its own research or solicit additional research from another third party on the issue. After gathering this information and possibly discussing the issue with other relevant parties, the Committee will use the information they have gathered to make a determination of how to vote on the issue in a manner which the Committee believes is consistent with these procedures and in the best interests of the Funds and their shareholders.
SAM will attempt to process every vote for proxy statements which it or its Agent receives with respect to the Funds. However, there are situations in which SAM may not be able to process a proxy. For example, SAM may not be given enough time to process a vote because SAM or its Agent received a proxy statement in an untimely manner. SAM will make reasonable efforts to avoid a situation where it is unable to vote a proxy.
Conflict of Interest Policy
SAM will seek to identify material conflicts of interest which may arise between a Fund and SAM’s business relationships. Such a conflict of interest may arise, for example, where SAM manages assets for a pension plan or other investment account of the company soliciting the proxy, or seeks to serve in such a capacity. A conflict may also arise where the company soliciting the proxy regularly does business with SAM, potentially including securities dealers and investment banks. Where, in the judgment of the Chief Compliance Officer, a material conflict of interest exists, SAM will vote proxies in accordance with the following procedures:
| | • | if the proposal to be voted upon is specifically addressed in this philosophy and procedures statement, and does not provide discretion to SAM on how to vote the matter, then the proxy will be voted in accordance with the recommendation of the Agent, and SAM will under no circumstances override that recommendation; and |
| | • | if the proposal is not addressed in this philosophy and procedures statement or this philosophy and procedures statement provides SAM with discretion on how to vote, then SAM will vote in accordance with the Agent’s general recommendation on the proposal. |
SAM will also seek to identify conflicts of interest on the part of the Agent by requesting notification by the Agent when conflicts of interest exist. In addition, SAM will obtain from the Agent on an annual basis its conflict of interest policy and procedures.
Policy With Respect to Securities Lending
With respect to securities lending transactions, SAM seeks to balance the economic benefits of continuing to participate in an open securities lending transaction against the inability to vote proxies. If SAM determines that a vote involves matters that would have a material effect on the Fund’s investment in securities that are out on loan, it will attempt to recall the Fund’s portfolio securities that are on loan in order to be able to vote proxies relating to such securities.
Proxy Voting Guidelines
The following guidelines give a general indication as to how SAM will vote shares held by the Funds. The Proxy Committee has reviewed the guidelines and determined that voting proxies pursuant to the guidelines should be in the best interests of the Funds and their shareholders and should facilitate the goal of maximizing the value of the Funds’ investments. Although SAM will usually vote proxies in accordance with these guidelines, SAM reserves the right to vote certain issues counter to the guidelines if, after a thorough review of the matter, SAM determines that the best interests of the Funds and their shareholders would be served by such a vote. Moreover, the list of guidelines below is not exhaustive and does not include all potential voting issues. To the extent that the guidelines do not cover potential voting issues, SAM will vote shares held by the Funds on such issues in a manner that is consistent with the spirit of the guidelines below and that promotes the best interests of the Funds and their shareholders.
Proxy Voting Guidelines – Sustainable Fund
SAM is committed to the financial interests of the Fund and its shareholders, which include, with respect to the Sustainable Fund, the responsibility of encouraging socially and environmentally responsible behavior at the companies in which the Sustainable Fund
invests. To achieve those goals, SAM votes proxies on behalf of the Sustainable Fund according to the guidelines specific to the Sustainable Fund (noted as such below). In certain cases SAM may deviate from these guidelines as a company’s particular situation demands.
Company Management Recommendations
When determining whether to invest in a particular company for the Funds, one of the factors SAM may consider is the quality and depth of the company’s management. As a result, SAM believes that recommendations of management on any issue (particularly routine issues) should be given a fair amount of weight in determining how proxy issues should be voted. Thus, on many issues, SAM votes are cast in accordance with the recommendations of the company’s management. However, SAM will normally vote shares held in the Funds against management’s position when it runs counter to the guidelines, and SAM will also vote shares held in the Funds against management’s recommendation when such position is not in the best interests of the Funds and their shareholders.
Policy on Board of Directors
SAM believes that meaningful, independent oversight of corporate managers is a vital role of a company’s Board of Directors. To that end, SAM will generally support proposals seeking a majority of independent directors for the board, as well as proposals requiring independent directors for nominating, audit and compensation committees. Votes on director nominees are made on a case-by-case basis examining such factors as board and committee composition, attendance and governance. Votes for director nominees may be withheld in cases with a lack of independence.
For the Sustainable Fund, diversity is a key consideration. On behalf of the Sustainable Fund and its shareholders, SAM supports initiatives to increase diversity on boards of directors and among upper management. Diversity at the top sends a clear signal to employees that the issue is of importance to the company -- a move that coincides with improved employee morale and reduced turnover. Therefore, with respect to proxies on shares held in the Sustainable Fund, SAM will support proposals asking the board to include more women and minorities on the board of directors, and will normally withhold votes from a slate of board nominees if the board does not include either women or minorities.
Policy on Audit Committee
SAM believes that audit committees should be comprised of financially literate, independent directors and shall vote in favor of such proposals. Further, the audit committee should have the exclusive authority to hire independent auditors. SAM will generally withhold votes for audit committee members who approve significant non-audit relationships with outside auditors, as well as vote against ratification of such outside auditor.
Auditors
SAM will examine the fees paid to the independent auditor, as disclosed in the company proxy statement, to determine the ratio of non-audit fees to the aggregate fees. The objectivity and independence of the auditor may be compromised when a large percentage of fees are obtained from non-audit services. With respect to proxies on shares held in the Funds, SAM will oppose the approval or ratification of the auditor if 25% or more of the aggregate fees are for non-audit services.
Shareholder Issues
With respect to proxies on shares held in the Funds, SAM supports proposals that improve shareholder rights, including shareholders’ right to call a special meeting, act by written consent, maintain the right to have in-person annual meetings, and improve proxy access. SAM will also support proposals to eliminate super-majority vote requirements to approve mergers, by-law changes, or charter provisions.
Policy on Proxy Contest Defenses/Anti-takeover Measures
SAM generally opposes proxy contest defenses and anti-takeover measures since they tend to restrict shareholder rights and participation, and often limit the realization of maximum economic values. SAM generally supports shareholder resolutions that serve to reverse previously adopted anti-takeover measures or, in general, enhance shareholder rights. However, as with all proxy issues, SAM conducts an independent review of each proposal and votes in the best interests of its clients.
Anti-takeover measures that SAM generally opposes:
| | • | Classification of the Board of Directors |
| | • | Shareholder rights plans (poison pills) |
| | • | Supermajority rules to approve mergers or amend charter or bylaws |
| | • | Authority to place stock with disproportionate voting rights |
| | • | Golden Parachutes |
Shareholder resolutions that SAM has generally supported:
| | • | Rescind or prohibit any of the above-anti-takeover measures |
| | • | Annual voting of directors; repeal classified boards |
| | • | Anti-greenmail provisions |
| | • | Adoption of confidential voting |
| | • | Adoption of cumulative voting |
| | • | Redeem shareholder rights plans |
| | • | Proposals that require shareholder approval of rights plans (poison pills) |
Ownership and Corporate Defenses
On occasion, shareholders are asked to increase or decrease the number of shares authorized for issuance. SAM is mindful of the effects of these actions, and the rationale of the management for instituting the changes. The authorization of more shares presents management with potential takeover defenses, such as issuing stock to parties friendly to management. Therefore, with respect to proxies on shares held in the Funds, SAM evaluates such proposals on a case-by-case basis. However, SAM will oppose management proposals to authorize or increase blank check preferred stock when the board asks for the unlimited right to set the terms and conditions for the stock and may issue it for anti-takeover purposes without shareholder approval.
Corporate Restructuring
SAM looks at all mergers and other corporate actions on a case-by-case basis. With respect to proxies on shares held in the Sustainable Fund, SAM will evaluate mergers by looking at the financial impact on the Sustainable Fund and at the social implications to stakeholders.
Policy on Executive and Director Compensation
SAM believes that stock based compensation plans must be very carefully analyzed to protect the economic interests of shareholders, while providing proper motivation for corporate managers. Such plans should be highly correlated to both individual and corporate performance. SAM will oppose plans with excessive transfer of shareholder wealth, in the form of dilution to shareholder equity and voting power, to corporate executives and directors. SAM will consider other factors such as other corporate incentives, corporate performance, industry, terms and duration in its decision. Although each plan will be voted on a case-by-case basis, SAM will generally vote against plans which do not meet several criteria. SAM standards for option plan approval include: (1) dilution of less than 2% per annum, (2) strike prices either indexed against a relevant industry or market benchmark, or set at a premium to the current stock price, (3) strike prices set systematically, (4) options cost expensed, and (5) material revisions to plans voted by shareholders. SAM believes that these criteria will set votes in favor of plans that meet the overriding goal aligning management and shareholder interests, while providing reasonable economic incentives for managers. SAM will generally vote against option repricing, and will vote for proposals requiring shareholder approval to reprice options. SAM may withhold votes for director nominees in the event of option repricing without shareholder approval. Director compensation plans are viewed on a case-by-case basis, with the goal of protecting economic interests of shareholders and aligning interests of directors with shareholders. Employee Stock Purchase plans are voted on a case-by-case basis.
Social and Environmental Issues (excluding the Sustainable Fund)
Recognizing that social and environmental issues may have real economic impact on a company, its operations, and long-term shareholder value, shareholder resolutions that address social and environmental issues will be reviewed and voted on a case-by-case basis.
Social and Environmental Issues – Sustainable Fund
Equality Principles
When voting proxies on shares held in the Sustainable Fund, SAM will support proposals that ask management to adopt a sexual orientation non-discrimination policy. When so voting, SAM will also support initiatives to provide spousal benefits to domestic partners regardless of sexual orientation, and to promote diversity and tolerance through company sponsored programs.
Animal Testing
SAM seeks not to invest, on behalf of the Sustainable Fund, in companies that conduct animal testing when not required by law. However, it is not an exclusionary screen. Therefore, with respect to proxies on shares held in the Sustainable Fund, SAM will support proposals asking companies to phase out or stop animal testing when not required by law, as well as proposals asking management to develop animal welfare standards and report on those initiatives to shareholders.
Environment
Environmental stewardship is a key tenet of sustainable investing. Therefore, SAM will support shareholder proposals that promote environmental responsibility, accountability, and transparency. Such measures can include, but are not limited to, reductions in emissions, toxic substances, and hazardous waste; water conservation measures; renewable energy adoption; actions to address climate change; and reporting of environmental goals and progress.
Genetically Engineered Products
There is growing concern that genetically engineered products or genetically modified organisms (“GMOs”) may pose serious health risks to humans, animals and the environment. Conversely, GMOs may also provide important benefits, such as allowing crops to be grown in water stressed regions so as to alleviate food insecurity. Recognizing that this is a complex issue, with respect to proxies on shares held in the Sustainable Fund, SAM will evaluate proposals relating to GMO use and / or production on a case-by-case basis. However, SAM will support proposals asking management to label GMO use.
Human Rights
In efforts to reduce product costs, many companies make or import their products from factories in low-wage, developing countries that either do not have rigorous comprehensive labor or environmental codes or do not enforce them. As a result, numerous reports have surfaced about deplorable working conditions, also known as “sweatshops.” Many organizations have asked companies to adopt codes of conduct to address this issue, and hire independent monitoring groups to ensure the implementation of those codes at both company and sub-contractor facilities. With respect to proxies on shares held in the Sustainable Fund, SAM will support proposals that promote safe working conditions, compliance with internationally recognized labor standards, and transparency.
Political Contributions and Lobbying Expenses
In recent years, companies have faced scrutiny and criticism for political contributions to major political parties and candidates. There is a perception that companies consistently making large contributions are buying influence and unduly affecting the democratic process. With respect to proxies on shares held in the Sustainable Fund, SAM will support proposals that ask companies to increase disclosure of political or political action committee contributions as well as expenses related to lobbying activities.
Annual Report
November 30, 2016

Sentinel Common Stock Fund
Sentinel Small Company Fund
Sentinel Balanced Fund
Sentinel Multi-Asset Income Fund
Sentinel Sustainable Core Opportunities Fund
Sentinel International Equity Fund
Sentinel Government Securities Fund
Sentinel Low Duration Bond Fund
Sentinel Total Return Bond Fund
Sentinel Unconstrained Bond Fund
| www.sentinelinvestments.com |  |
Page intentionally left blank.
Table of Contents
Message to Shareholders

Thomas H. Brownell President and Chief Executive Officer Sentinel Asset Management, Inc. | Dear Fellow Shareholders, The Sentinel organization made great progress last year as we rationalized our product offerings, enhanced the efficiency of our distribution organization, and invested in our investment management teams. Both the fixed income and equity markets delivered bouts of volatility over the last twelve months which created both challenges and opportunities for our products. Specifically the fiscal year began with the Federal Reserve raising interest rates for the first time in over 6 years in December, 2015. This move precipitated a broad and sharp decline in the equity markets, particularly in the Energy and Materials segments of the market through the second week of February, 2016. Interestingly, markets then proceeded to rally sharply for most of the second quarter before selling off once again in June following the United Kingdom’s vote to leave the European Union. After recovering during the summer months, the equity markets then sold off once again leading up to the U.S. election in November. However, the U.S. election results seem to have set a new course for both the bond and equity markets. Investors have now bet on a stronger growth, pro-business agenda which moved virtually all U.S. markets. Interest rates jumped higher with the ten year U.S. Treasury now up over 100 basis points off its lows, and the equity markets also bounced to record highs led by small cap equities. The equity market also experienced a strong rotation in market leadership away from interest rate sensitive issuers toward more cyclical and industrial based companies. Through all of this our products performed well. We are optimistic on a number of fronts as we look ahead into 2017. We believe the investment environment has recently become ripe for active managers like Sentinel to perform well as market conditions and the political environment continue to evolve both domestically and abroad. Our objective continues to be to deliver high quality, actively managed investment solutions that reflect the core principles of our investors. With this in mind, we remain committed to: |
| | | • | Fundamental research and analysis as the primary drivers of investment returns; |
| | | | |
| | | • | A close attention to risk management; |
| | | | |
| | | • | A strong understanding of macro market-movers; and |
| | | | |
| | | • | Perhaps most importantly, a long-term perspective. |
| | | | |
| | Above all, Sentinel’s unwavering objective is to help our clients achieve their long-term investment objectives. Our standard of stewardship is evidenced by our investment teams’ persistent drive to deliver attractive returns over multiple market cycles. That is the Sentinel standard. Thank you for the trust you have placed in us. We value that trust and confidence, and we will continue to work diligently to meet your investment goals in the years ahead. 
|
This article contains the current opinions of the author but not necessarily those of Sentinel Investments.
The author’s opinions are subject to change without notice. This article is distributed for informational purposes only. Forecasts, estimates, and certain information contained herein are based upon proprietary research and should not be considered as investment advice or a recommendation of any particular security, strategy or investment product. Information contained herein has been obtained from sources believed to be reliable, but not guaranteed.
Sentinel Investments is the unifying brand name for Sentinel Financial Services Company, Sentinel Asset Management, Inc., and Sentinel Administrative Services, Inc.
Sentinel Funds are distributed by Sentinel Financial Services Company, One National Life Drive, Montpelier, VT 05604, 800-282-FUND, www.sentinelinvestments.com.
4
Understanding your Sentinel Funds Financial Statements
1 Schedule of Investments
This schedule shows you which investments your fund owned on the last day of the reporting period. The schedule includes:
| | • | a list of each investment |
| | | |
| | • | the number of shares/par amount of each stock, bond or short-term note |
| | | |
| | • | the market value of each investment |
| | | |
| | • | the percentage of investments in each industry |
| | | |
| | • | the percent and dollar breakdown of each category |
2 Statement of Assets and Liabilities
This statement details what the fund owns (assets), what it owes (liabilities), and its net assets as of the last day of the period. If you subtract what the fund owes from what it owns, you get the fund’s net assets. For each class of shares, the net assets divided by the total number of shares outstanding gives you the price of an individual share, or the net asset value per share.
Net assets are also broken down by capital (money invested by shareholders); net investment income not yet paid to shareholders or net investment losses, if any; net gains earned on investments but not yet paid to shareholders or net losses on investments (known as realized gains or losses); and finally gains or losses on securities still owned by the fund (known as unrealized appreciation or depreciation). This breakdown tells you the value of net assets that are performance-related, such as investment gains or losses, and the value of net assets that are not related to performance, such as shareholder investments and redemptions.
3 Statement of Operations
This statement breaks down how each fund’s net assets changed during the period as a result of the fund’s operations. It tells you how much money the fund made or lost after taking into account income, fees and expenses, and investment gains or losses. It does not include shareholder transactions and distributions. Fund operations include:
| | • | income earned from investments |
| | | |
| | • | management fees and other expenses |
| | | |
| | • | gains or losses from selling investments
(known as realized gains or losses) |
| | | |
| | • | gains or losses on current fund holdings
(known as unrealized appreciation or depreciation) |
4 Statement of Changes in Net Assets
This statement shows how each fund’s net assets changed over the past two reporting periods. It details how much a fund grew or shrank as a result of:
| | • | operations — a summary of the Statement of Operations for the most recent period |
| | | |
| | • | distributions — income and gains distributed to shareholders |
| | | |
| | • | capital share transactions — shareholders’ purchases, reinvestments, and redemptions |
Net assets at the beginning of the period plus the sum of operations, distributions to shareholders and capital share transactions result in net assets at the end of the period.
5 Financial Highlights
This statement itemizes current period activity and statistics and provides comparison data for the last five fiscal years (or less if the fund or class is not five years old). On a per-share basis, it includes:
| | • | share price at the beginning of the period |
| | | |
| | • | investment income and capital gains or losses |
| | | |
| | • | income and capital gains distributions paid to shareholders |
| | | |
| | • | share price at the end of the period |
It also includes some key statistics for the period:
| | • | total return — the overall percentage return of the fund, assuming reinvestment of all distributions |
| | | |
| | • | expense ratio — operating expenses as a percentage of average net assets |
| | | |
| | • | net income ratio — net investment income as a percentage of average net assets |
| | | |
| | • | portfolio turnover — the percentage of the portfolio that was replaced during the period |
5
Sentinel Balanced Fund
(Unaudited)

Daniel J. Manion, CFA Equity Portfolio Manager 
Jason Doiron, FRM, PRM Fixed Income Portfolio Manager | Performance Highlights For the fiscal year ending November 30, 2016, the Sentinel Balanced Fund Class I shares returned 4.94%. This compares to the Standard & Poor’s 500 Index which returned 8.06% during the same time period, the Bloomberg Barclays U.S. Aggregate Bond Index return of 2.17%, and a 4.17% return for the Morningstar Allocation – 50% to 70% Equity (Balanced) peer group average for the same time period. Equity Market Review For most of the year, the defensive, yield-heavy sectors dominated the market, as positive domestic economic indicators were not enough to counteract the uncertainties generated by international economic and political events. Fiscal 2016 saw weaker international economic growth and political unrest, the United Kingdom voting to leave the European Union, and a contested U.S. presidential election. However, the U.S. election results set a new course for the markets, as the Republican Party is set to take control of the executive and legislative branches. Many investors have bet on a strong pro-business agenda, and shifted positions accordingly, and aggressively. At fiscal year-end, value stocks decisively outperformed growth stocks, while small cap stocks swiftly reversed their underperformance vs. mid and large cap stocks, doubling the annual return of large cap stocks by the end of November. In terms of sectors, Utilities and Telecommunications led the S&P 500 Index for the majority of the year, but as interest rates rose they quickly lost ground post-election to the Industrials and Financials sectors, which ended up as the market leaders for the fiscal year. The Health Care and Information Technology sectors ended as the laggards, after being the clear leaders in previous years. Bond Market Review Following a period of election and central bank induced volatility in financial markets early in Q4 2016, risk assets recovered significantly in anticipation of material fiscal stimulus following the surprise victory for President-Elect Trump. As the calendar moved past the election market, participants celebrated accelerating Global Purchasing Managers’ Indexes (PMIs), a strong pick-up in U.S. growth and an OPEC/non-OPEC agreement to cut crude oil production. Higher readings for inflation and less accommodative talk from global central banks such as the U.S. Federal Reserve Bank, European Central Bank and the Bank of England were more than offset by the prospect for stronger global and U.S. growth in the future and did not lead to the market jitters experienced in Q3 2016. The Bloomberg Barclays U.S. Corporate High Yield Index ended the month of November 25 basis points (bps) tighter from its Q3 close while the S&P 500 rose more than 1.4%. U.S. Treasury securities moved significantly higher in yield in the first two months of Q4 2016 with the 10-year U.S. Treasury yield rising 79 bps to 2.38% from 1.59%. Realized inflation began to accelerate globally while the surprise victory for President-Elect Trump saw markets anticipate a significant increase in fiscal stimulus. Inflation expectations accelerated in the U.S. with 5-year inflation break even rising 32 bps by the end of November from 1.48% to 1.80%. The 30-year U.S. Treasury yield slightly |
The Standard & Poor’s 500 Index is an unmanaged index of approximately 500 widely held U.S. equity securities chosen for market size, liquidity, and industry group representation.
The Bloomberg Barclays U.S. Aggregate Bond Index is an unmanaged index of the U.S. investment grade fixed-rate bond market, with components for government and corporate securities, mortgage pass-through securities, and asset-backed securities.
The Bloomberg Barclays U.S. Corporate High Yield Index is an unmanaged index of U.S. dollar-denominated, non-investment grade, fixed-rate, taxable corporate bonds. Securities are classified as high yield if the middle rating of Moody’s, Fitch, and S&P is Ba1/BB+/BB+ or below, excluding emerging market debt.
An investment cannot be made directly in an index.
The return for the Morningstar category is an average of funds within the particular category as determined by Morningstar based on investment styles as measured by their underlying portfolio holdings.
6
Sentinel Balanced Fund
| | underperformed the 5-year U.S. Treasury yield by 3 bps at the end of November from the start of the quarter, as the market weighed the potential for greater fiscal stimulus, inflation and long-end treasury issuance versus a potentially faster pace of U.S. Federal Reserve Bank interest rate increases. Relative to developed global markets, U.S. Treasury security and spread products continued to offer a superior yield advantage, resulting in them being particularly attractive to foreign and global investors. Key Performance Attribution For the equity portion of the Fund, stock selection was the main driver of performance for the fiscal year. In particular, our holdings in Consumer Discretionary and Health Care were additive to the Fund’s performance, along with our underweight stance in the weak-performing Real Estate sector. Improving margins in cable and lowered fears of government intervention in deal-making helped our holdings in Media, while our focus away from Textiles, Apparel and Luxury Goods together with our emphasis on well-executed, off-price retailing benefitted performance. Within Health Care, our stock selection in Providers and Services, as well as in Pharmaceuticals, contributed positively to the Fund. Conversely, our Information Technology and Energy exposure worked against us. Within Information Technology, our exposure in IT Services was challenged as revenue expectations of one of our holdings fell amidst lower demand for consulting services in the financial services and health care industries, while another holding faced increased litigation and regulatory uncertainty. Within Energy, our exposure to oil majors did not participate as strongly on the upside as more leveraged names, despite our holdings having stronger balance sheets and better capital management. The Fixed Income portion of the Balanced Fund returned 0.81% on a gross of fees basis during the 12 months ending November 30, 2016, underperforming the Bloomberg Barclays U.S. Aggregate Bond Index by 1.37%. During the year, the yield on the 10-year U.S. Treasury rose 18 bps to 2.38% from 2.21%, while the Fund was, on average, short duration* vs. the benchmark by 2.01 years. The Fund’s short duration position resulted in 10 bps of underperformance vs. the benchmark. In addition, the Fund had limited exposure to U.S. Treasury securities as an asset class, which contributed 39 bps of positive allocation effects to overall performance. Risk assets performed quite well during the year with the Option Adjusted Spread (OAS) on the Bloomberg Barclays U.S. Corporate Index tightening by 26 bps, and the OAS on the Bloomberg Barclays U.S. Corporate High Yield Index tightening by 148 bps. The Fund’s asset allocation call detracted 15 bps of relative performance; however, contributing positively was the funds 1.3% overweight to high yield credit which added 9 bps. Negative sector allocation effects within investment grade credit detracted somewhat, costing the fund 37 bps in relative underperformance. Security selection within high yield credit also detracted less than 1 bp from performance, while security selection within investment grade resulted in 55 bps of underperformance. In addition, security selection within the Fund’s Agency Mortgage Backed Securities (MBS) portfolio resulted in 4 bps of underperformance. In addition, other effects resulted in 35 bps of underperformance. |
* Effective duration is a measure of the sensitivity of a bond’s price to changes in interest rates. The shorter (longer) the duration, the lower (higher) the interest rate risk and price volatility.
The Bloomberg Barclays U.S. Corporate Index (Investment Grade) is a broad-based benchmark that measures the investment grade, U.S. dollar-dominated fixed-rate, taxable corporate bond market. It includes USD-denominated securities publicly issued by U.S. and non-U.S. industrial, utility, and financial issuers that meet specified maturity, liquidity, and quality requirements.
An investment cannot be made directly in an index.
7
Sentinel Balanced Fund
| | During the fiscal year, the Fund’s usage of U.S. Treasury Futures resulted in 6 basis points of outperformance relative to the Bloomberg Barclay’s U.S. Aggregate Bond Index. Of the outperformance, 2 basis points was due to the impact of the trades on the Fund’s effective duration, while 4 basis points was due to the impact of intra-day price moves on days where a trade occurred. Portfolio Positioning and Outlook The Sentinel Balanced Fund’s asset allocation as of November 30, 2016 was 64% stocks, 22% bonds and 14% cash and cash equivalents. We have maintained our overweight position in the Financials, Health Care and Consumer Staples sectors, even as we moderate our Financials sector overweight. We also trimmed choice positions that we felt were fully priced in the current market environment, in favor of funding some smaller holdings which reflected a better risk/return profile. Within fixed income, looking ahead into Q1 2017, there is growing optimism amongst market participants that U.S. growth and inflation will accelerate as the incoming Trump Administration attempts to implement a number of fiscal stimulus measures including infrastructure investment, tax cuts, de-regulation and the repatriation of foreign earnings held abroad. At the same time the U.S. Federal Reserve Board is likely to take additional steps towards normalizing interest rates while the European Central Bank and Bank of England take additional steps towards unwinding their quantitative easing programs. For the first time in years, markets are likely to continue to experience rising headline inflation across most developed market Consumer Price Indexes (CPI) in the coming quarters due in part to favorable base effects from the Energy sector that already existed prior to an OPEC and Non-OPEC agreement to curb crude oil production. While central banks are likely to initially dismiss this rising inflation as “transitory” with more time needed to judge its sustainability, a faster rate of policy removal may occur should realized inflation start to prove stronger than that assumed in forward projections. Even though U.S. growth and inflation were showing signs of acceleration in Q3 and the early parts of Q4 2016, financial markets have currently priced a very optimistic view of stronger U.S. growth due to fiscal stimulus expectations. Should the incoming administration not deliver as quickly on some or all of these growth measures at the same time the markets are experiencing faster inflation and less accommodative global central bank policy, interest rate and risk markets may experience a period of price discovery. Investment strategies that are able to remain flexible in anticipation of a potential increase in volatility associated with these unknowns are likely to be favored in this environment. We believe the Sentinel Balanced Fund is well positioned to take advantage of the current market dynamics. We intend to maintain our focus on finding attractive opportunities for total long-term returns and modest levels of risk in high quality, large cap stocks. We plan to maintain a sizeable commitment to fixed income securities in the Fund as a means of generating income and reducing risk. 
|
8
Sentinel Balanced Fund
Performance Notes (Unaudited)
Graph and total return data assumes reinvestment of all distributions. Fund performance in the graphs and table reflects expenses and management fees but does not reflect the effect of any taxes on fund distributions or redemptions. Growth of Class A shares in the graph reflects the 5% maximum sales charge. Growth of Class C shares in the graph does not reflect the 1% contingent deferred sales charge (CDSC) applicable to redemptions within the first year, because none would apply if the shares were held for the full period. Index performance does not reflect any sales charges, fees or expenses. Data shown represents past performance; past performance does not guarantee future results; current performance may be higher or lower than that shown. Investment return and principal value will vary so that you may have a gain or loss when you sell shares. Before investing, carefully consider a fund’s objectives, risks, charges and expenses. Summary and full prospectuses containing this and other information are available from sentinelinvestments.com. Please read them carefully. Visit www.sentinelinvestments.com for the most current month-end performance information.
Growth of a $10,000 Investment (Class A shares and Class C shares)
November 30, 2006 – November 30, 2016
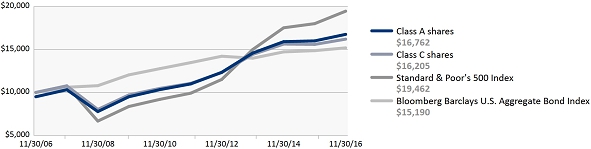
Growth of a $1,000,000 Investment (Class I shares)
November 30, 2006 – November 30, 2016
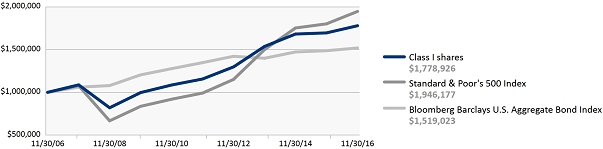
Average Annual Total Returns (as of November 30, 2016)
| | | Class A shares | | Class C shares | | Class I shares | | |
| | | Without
Sales Charge | | With 5%
Sales Charge | | Without
CDSC | | With 1%
CDSC | | No
Sales Charge | | Class | | Symbol |
| 1 year | | 4.75 | % | | -0.51 | % | | 3.91 | % | | 2.92 | % | | 4.94 | % | | A | | SEBLX |
| 3 years | | 4.75 | | | 2.98 | | | 3.95 | | | 3.95 | | | 4.99 | | | C | | SBACX |
| 5 years | | 8.80 | | | 7.69 | | | 7.94 | | | 7.94 | | | 9.00 | | | I | | SIBLX |
| 10 years | | 5.84 | | | 5.30 | | | 4.95 | | | 4.95 | | | 5.93 | | | | | |
Inception Date of the Fund – 11/15/38
Performance of the Class A shares prior to June 30, 2012 has not been adjusted to reflect the decrease in the maximum 12b-1 fee from 0.30% to 0.25%. If it had, those returns would be higher. Performance of the Class I shares prior to their inception on August 27, 2007 is based on the performance of the Fund’s Class A shares, restated to reflect that Class I shares are not subject to a sales charge. Only eligible investors may purchase Class I shares, as described in the Prospectus.
The following are total annual operating expense ratios for Sentinel Balanced Fund Class A, C & I shares: A – 1.05%, C – 1.83%, I – 0.82%. Expense ratio data is sourced from the Fund’s most recent prospectus.
International securities are subject to political influences, currency fluctuations and economic cycles that may be unrelated to those affecting the domestic financial markets and may experience wider price fluctuations than U.S. domestic securities. Fixed income securities are subject to credit and interest rate risk. Bond values will generally decrease when interest rates rise and will generally increase when interest rates fall. Bonds with lower credit ratings are more speculative and likely to default than higher quality bonds and tend to fluctuate more widely in value. Mortgage-backed securities (MBS) are subject to prepayment risks. These risks may result in greater share price volatility. Convertible securities are subject to the risks associated with both fixed income securities and common stocks. Small and mid-sized company stocks can be more volatile than large company stocks. Large company stocks as a group could fall out of favor with the market and underperform investments that focus on small and mid-sized company stocks. Fund shares are not insured or guaranteed by the U.S. Government or its agencies.
The Fund may use derivatives, which are financial contracts whose value depends upon or is derived from the value of an underlying asset, reference rate, or index. The Fund may use derivatives as part of a strategy designed to reduce exposure to certain risks, such as risks associated with changes in interest rates, or currency or credit risk (“hedging”). The use of derivatives may reduce the Fund’s return and increase the volatility in movements in the Fund’s net asset value. For additional information regarding the use of derivatives, please see the Fund’s current Prospectus.
A CDSC of up to 1% may apply to investments of $1,000,000 or more in Class A shares which are redeemed within 12 months. See the Prospectus.
The Standard & Poor’s 500 Index is an unmanaged index of approximately 500 widely held U.S. equity securities chosen for market size, liquidity, and industry group representation.
The Bloomberg Barclays U.S. Aggregate Bond Index is an unmanaged index of the U.S. investment grade fixed-rate bond market, with components for government and corporate securities, mortgage pass-through securities, and asset-backed securities.
An investment cannot be made directly in an index.
9
Sentinel Balanced Fund
Fund Profile
at November 30, 2016
Portfolio Weightings
| Asset Category | | Percent of Net Assets |
| Domestic Common Stocks | | 62.1% |
| U.S. Government Obligations | | 25.5% |
| Domestic Exchange Traded Funds | | 8.0% |
| Foreign Stocks & ADR’s | | 1.7% |
| Real Estate Investment Trusts | | 0.5% |
| Domestic Corporate Bonds | | 0.4% |
| Cash and Other | | 1.8% |
Top 10 Equity Holdings*
| | | |
| Description | | Percent of Net Assets |
| iShares iBoxx $ Investment Grade Corporate Bond ETF | | 7.6% |
| Microsoft Corp. | | 2.3% |
| Apple, Inc. | | 1.8% |
| Visa, Inc. | | 1.8% |
| Texas Instruments, Inc. | | 1.5% |
| Alphabet, Inc. | | 1.4% |
| The Travelers Cos., Inc. | | 1.4% |
| Cisco Systems, Inc. | | 1.4% |
| Merck & Co., Inc. | | 1.3% |
| McDonald’s Corp. | | 1.3% |
| Total of Net Assets | | 21.8% |
Top 10 Fixed Income Holdings*
| | | | | Maturity | | Percent of |
| Description | | Coupon | | Date | | Net Assets |
| FHLMC Q29056 | | 4.00% | | 10/01/44 | | 1.8% |
| FNMA TBA 15 YR Dec | | 2.50% | | 12/16/31 | | 1.5% |
| FNMA AT2016 | | 3.00% | | 04/01/43 | | 1.3% |
| FHLMC Q02664 | | 4.50% | | 08/01/41 | | 1.2% |
| FNMA BC1809 | | 3.50% | | 05/01/46 | | 0.8% |
| FHLMC Q29260 | | 4.00% | | 10/01/44 | | 0.8% |
| FNMA AZ7347 | | 3.00% | | 11/01/45 | | 0.7% |
| FHR 3859 JB | | 5.00% | | 05/15/41 | | 0.6% |
| GNMA II 005175 | | 4.50% | | 09/20/41 | | 0.6% |
| FNMA AS4707 | | 3.50% | | 04/01/45 | | 0.5% |
| Total of Net Assets | | | | | | 9.8% |
Average Effective Duration (for all Fixed Income Holdings) 1.3 years**(Unaudited)
*“Top 10 Equity Holdings” and “Top 10 Fixed Income Holdings” excludes any short-term investments and money market funds. Portfolio composition and holdings are subject to change. More complete holdings follow.
**The average effective duration considers the call and put dates of applicable fixed income investments and the pre-payment risks of mortgage-backed bonds to measure the sensitivity of the value of the Fund’s portfolio to changes in interest rates.
Schedule of Investments
at November 30, 2016
| | | Principal
Amount
(M=$1,000) | | | Value
(Note 2) | |
| U.S. Government Obligations 25.5% | | | | | |
| U.S. Government Agency Obligations 19.3% | | | | | |
| Federal Home Loan Bank 6.2% | | | | | |
| Agency Discount Notes: | | | | | | | | |
| 0.1%, 12/01/16 | | | 20,000 M | | | $ | 20,000,000 | |
| Federal Home Loan Mortgage Corporation 5.1% | | | | | |
| Collateralized Mortgage Obligations: | | | | | |
FHR 3859 JB
5%, 05/15/41 | | | 1,886 M | | | | 2,076,343 | |
| Mortgage-Backed Securities: | | | | | |
| 15-Year: | | | | | | | | |
FHLMC G18091
6%, 12/01/20 | | | 2 M | | | | 2,197 | |
| | | Principal
Amount
(M=$1,000) | | | Value
(Note 2) | |
FHLMC J22900
2.5%, 03/01/28 | | | 1,161 M | | | $ | 1,167,327 | |
| | | | | | | | 1,169,524 | |
| 20-Year: | | | | | | | | |
FHLMC P00020
6.5%, 10/01/22 | | | 21 M | | | | 20,973 | |
| 30-Year: | | | | | | | | |
FHLMC G08062
5%, 06/01/35 | | | 6 M | | | | 6,356 | |
FHLMC Q02664
4.5%, 08/01/41 | | | 3,712 M | | | | 3,998,413 | |
FHLMC Q29260
4%, 10/01/44 | | | 2,295 M | | | | 2,413,715 | |
FHLMC Q29056
4%, 10/01/44 | | | 5,485 M | | | | 5,768,291 | |
| | | Principal
Amount
(M=$1,000) | | | Value
(Note 2) | |
FHLMC G08637
4%, 04/01/45 | | | 943 M | | | $ | 990,885 | |
| | | | | | | | 13,177,660 | |
| Total Federal Home Loan Mortgage Corporation | | | | 16,444,500 | |
| Federal National Mortgage Association 7.0% | | | | | |
| Collateralized Mortgage Obligations: | | | | | |
FNR 02-2 UC
6%, 02/25/17 | | | 81 | | | | 81 | |
| Mortgage-Backed Securities: | | | | | |
| 15-Year: | | | | | | | | |
FNMA 254907
5%, 10/01/18 | | | 3 M | | | | 2,662 | |
FNMA 255273
4.5%, 06/01/19 | | | 5 M | | | | 5,189 | |
FNMA 255358
5%, 09/01/19 | | | 1 M | | | | 1,292 | |
The accompanying notes are an integral part of the financial statements.
10
Sentinel Balanced Fund
| | | Principal
Amount
(M=$1,000) | | | Value
(Note 2) | |
FNMA TBA 15 YR Dec
2.5%, 12/16/31(a) | | | 4,920 M | | | $ | 4,937,105 | |
| | | | | | | | 4,946,248 | |
| 30-Year: | | | | | | | | |
FNMA 687301
6%, 11/01/32 | | | 35 | | | | 39 | |
FNMA 690305
5.5%, 03/01/33 | | | 1 M | | | | 1,483 | |
FNMA 748895
6%, 12/01/33 | | | 112 M | | | | 122,118 | |
FNMA 725423
5.5%, 05/01/34 | | | 1,058 M | | | | 1,189,717 | |
FNMA 725610
5.5%, 07/01/34 | | | 958 M | | | | 1,077,711 | |
FNMA AD9193
5%, 09/01/40 | | | 596 M | | | | 655,534 | |
FNMA AH8925
4.5%, 03/01/41 | | | 1,184 M | | | | 1,281,122 | |
FNMA AL2860
3%, 12/01/42 | | | 1,249 M | | | | 1,248,513 | |
FNMA AR9195
3%, 03/01/43 | | | 821 M | | | | 821,259 | |
FNMA AT2016
3%, 04/01/43 | | | 4,343 M | | | | 4,342,979 | |
FNMA AL5718
3.5%, 09/01/44 | | | 560 M | | | | 577,774 | |
FNMA AS4707
3.5%, 04/01/45 | | | 1,399 M | | | | 1,441,376 | |
FNMA AZ7347
3%, 11/01/45 | | | 2,330 M | | | | 2,319,897 | |
FNMA BC1809
3.5%, 05/01/46 | | | 2,448 M | | | | 2,512,536 | |
| | | | | | | | 17,592,058 | |
| Total Federal National Mortgage Association | | | | 22,538,387 | |
| Government National Mortgage Corporation 1.0% | | | | | |
| Collateralized Mortgage Obligations: | | | | | |
GNR 10-169 AW
4.5%, 12/20/40 | | | 750 M | | | | 813,491 | |
GNR 12-147 Interest Only
0.584%, 04/16/54 | | | 8,953 M | | | | 353,009 | |
| | | | | | | | 1,166,500 | |
| Mortgage-Backed Securities: | | | | | |
| 30-Year: | | | | | | | | |
GNMA II 005175
4.5%, 09/20/41 | | | 1,877 M | | | | 2,046,586 | |
| Total Government National Mortgage Corporation | | | | 3,213,086 | |
| Total U.S. Government Agency Obligations | | | | 62,195,973 | |
| | | Principal
Amount
(M=$1,000) | | | Value
(Note 2) | |
| U.S. Treasury Obligations 6.2% | | | |
U.S. Treasury Bill
0.155%, 12/01/16 | | | 20,000 M | | | $ | 20,000,000 | |
Total U.S. Government Obligations
(Cost $82,130,754) | | | | 82,195,973 | |
| Domestic Corporate Bonds 0.4% | | | | | |
| Communications 0.2% | | | | |
AT&T, Inc.
3.8%, 03/15/22 | | | 552 M | | | | 563,209 | |
| Consumer Non-Cyclical 0.0%^ | | | | | |
Zoetis, Inc.
3.25%, 02/01/23 | | | 139 M | | | | 137,683 | |
| Financials 0.2% | | | | | |
Brookfield Asset Management, Inc.
4%, 01/15/25 | | | 468 M | | | | 456,334 | |
Wells Fargo & Co.
4.1%, 06/03/26 | | | 63 M | | | | 64,009 | |
| | | | | | | | 520,343 | |
| Insurance 0.0%^ | | | | | | | | |
Kemper Corp.
4.35%, 02/15/25 | | | 158 M | | | | 156,380 | |
Total Domestic Corporate Bonds
(Cost $1,386,626) | | | | 1,377,615 | |
| | | | | | | | | |
| | | Shares | | | Value
(Note 2) | |
| Domestic Common Stocks 62.1% | | | | | |
| Consumer Discretionary 7.4% | | | | | |
| Comcast Corp. | | | 60,000 | | | | 4,170,600 | |
| Goodyear Tire & Rubber Co. | | | 60,000 | | | | 1,841,400 | |
| Home Depot, Inc. | | | 15,000 | | | | 1,941,000 | |
| Marriott Int’l., Inc. | | | 31,100 | | | | 2,450,058 | |
| McDonald’s Corp. | | | 35,000 | | | | 4,174,450 | |
| Omnicom Group, Inc. | | | 25,000 | | | | 2,173,500 | |
| Time Warner, Inc. | | | 40,000 | | | | 3,672,800 | |
| TJX Cos., Inc. | | | 45,000 | | | | 3,525,300 | |
| | | | | | | | 23,949,108 | |
| Consumer Staples 6.2% | | | | | | | | |
| CVS Health Corp. | | | 20,000 | | | | 1,537,800 | |
| Estee Lauder Cos, Inc. | | | 30,000 | | | | 2,331,000 | |
| Kraft Heinz Co. | | | 30,000 | | | | 2,449,500 | |
| McCormick & Co., Inc. | | | 23,000 | | | | 2,097,600 | |
| PepsiCo, Inc. | | | 40,000 | | | | 4,004,000 | |
| Philip Morris Int’l., Inc. | | | 40,000 | | | | 3,531,200 | |
| Procter & Gamble Co. | | | 50,000 | | | | 4,123,000 | |
| | | | | | | | 20,074,100 | |
| Energy 4.8% | | | | | | | | |
| Chevron Corp. | | | 20,000 | | | | 2,231,200 | |
| EOG Resources, Inc. | | | 30,000 | | | | 3,075,600 | |
| ExxonMobil Corp. | | | 38,000 | | | | 3,317,400 | |
| | | | | | | |
| | | Shares | | | Value
(Note 2) | |
| Marathon Petroleum Corp. | | | 40,000 | | | $ | 1,880,800 | |
| Noble Energy, Inc. | | | 50,000 | | | | 1,908,000 | |
| Schlumberger Ltd. | | | 37,700 | | | | 3,168,685 | |
| | | | | | | | 15,581,685 | |
| Financials 12.3% | | | | | | | | |
| American Express Co. | | | 40,000 | | | | 2,881,600 | |
| Chubb Ltd. | | | 20,000 | | | | 2,560,000 | |
| CME Group, Inc. | | | 35,000 | | | | 3,951,850 | |
| Discover Financial Services | | | 60,000 | | | | 4,066,200 | |
| JPMorgan Chase & Co. | | | 50,000 | | | | 4,008,500 | |
| Morgan Stanley | | | 100,000 | | | | 4,136,000 | |
| PNC Financial Services Group, Inc. | | | 30,000 | | | | 3,316,200 | |
| S&P Global, Inc. | | | 35,000 | | | | 4,164,650 | |
| Signature Bank* | | | 15,000 | | | | 2,248,650 | |
| The Travelers Cos., Inc. | | | 40,000 | | | | 4,534,000 | |
| Wells Fargo & Co. | | | 70,000 | | | | 3,704,400 | |
| | | | | | | | 39,572,050 | |
| Health Care 9.2% | | | | | | | | |
| Amgen, Inc. | | | 20,000 | | | | 2,881,400 | |
| Becton Dickinson & Co. | | | 15,000 | | | | 2,536,500 | |
| Biogen, Inc.* | | | 5,000 | | | | 1,470,350 | |
| Bristol-Myers Squibb Co. | | | 50,000 | | | | 2,822,000 | |
| Eli Lilly & Co. | | | 30,000 | | | | 2,013,600 | |
| Johnson & Johnson | | | 25,000 | | | | 2,782,500 | |
| Medtronic PLC(b) | | | 55,320 | | | | 4,038,913 | |
| Merck & Co., Inc. | | | 70,000 | | | | 4,283,300 | |
| Stryker Corp. | | | 15,000 | | | | 1,704,900 | |
| UnitedHealth Group, Inc. | | | 20,000 | | | | 3,166,400 | |
| Zoetis, Inc. | | | 40,000 | | | | 2,015,200 | |
| | | | | | | | 29,715,063 | |
| Industrials 6.3% | | | | | | | | |
| Boeing Co. | | | 20,000 | | | | 3,011,200 | |
| Canadian National Railway Co. | | | 45,000 | | | | 3,007,350 | |
| General Dynamics Corp. | | | 15,000 | | | | 2,630,250 | |
| Honeywell Int’l., Inc. | | | 35,000 | | | | 3,987,900 | |
| Johnson Controls Int’l. plc | | | 57,300 | | | | 2,577,354 | |
| United Technologies Corp. | | | 25,000 | | | | 2,693,000 | |
| Verisk Analytics, Inc.* | | | 30,000 | | | | 2,492,400 | |
| | | | | | | | 20,399,454 | |
| Information Technology 13.5% | | | | | |
| Accenture PLC | | | 32,400 | | | | 3,869,532 | |
| Alphabet, Inc.* | | | 6,000 | | | | 4,548,240 | |
| Apple, Inc. | | | 53,200 | | | | 5,879,664 | |
| Check Point Software Technologies Ltd.* | | | 25,000 | | | | 2,058,250 | |
| Cisco Systems, Inc. | | | 150,000 | | | | 4,473,000 | |
| Cognizant Technology Solutions Corp.* | | | 50,000 | | | | 2,754,000 | |
| Microsoft Corp. | | | 125,000 | | | | 7,532,500 | |
The accompanying notes are an integral part of the financial statements.
11
Sentinel Balanced Fund
| | | Shares | | | Value
(Note 2) | |
| Synopsys, Inc.* | | | 30,000 | | | $ | 1,814,400 | |
| Texas Instruments, Inc. | | | 65,000 | | | | 4,805,450 | |
| Visa, Inc. | | | 75,000 | | | | 5,799,000 | |
| | | | | | | | 43,534,036 | |
| Materials 1.2% | | | | | | | | |
| EI Du Pont de Nemours & Co. | | | 30,000 | | | | 2,208,300 | |
| Praxair, Inc. | | | 12,000 | | | | 1,443,600 | |
| | | | | | | | 3,651,900 | |
| Telecommunication Services 1.2% | | | | | |
| Verizon Communications, Inc. | | | 75,000 | | | | 3,742,500 | |
Total Domestic Common Stocks
(Cost $103,611,466) | | | | 200,219,896 | |
| Domestic Exchange Traded Funds 8.0% | | |
| Bond Funds 8.0% | | | | | | | | |
| iShares iBoxx $ Investment Grade Corporate Bond ETF | | | 210,929 | | | | 24,644,944 | |
| SPDR Barclays Intermediate Term Corporate Bond ETF | | | 35,453 | | | | 1,202,566 | |
| SPDR Barclays Short Term Corporate Bond ETF | | | 1,062 | | | | 32,434 | |
Total Domestic Exchange Traded Funds
(Cost $25,428,696) | | | | 25,879,944 | |
| Foreign Stocks & ADR’s 1.7% | | | | | |
| Netherlands 1.1% | | | | | | | | |
| Unilever NV ADR | | | 90,000 | | | | 3,584,700 | |
| Switzerland 0.6% | | | | | | | | |
| Roche Holding AG ADR | | | 60,000 | | | | 1,663,800 | |
Total Foreign Stocks & ADR’s
(Cost $5,741,302) | | | | 5,248,500 | |
| Real Estate Investment Trusts 0.5% |
| Real Estate 0.5% | | | | | | | | |
Equinix, Inc.
(Cost $1,825,139) | | | 5,000 | | | | 1,693,800 | |
| Institutional Money Market Funds 3.2% |
| State Street Institutional U.S. Government Money Market Fund | | | | | | | | |
Premier Class
(Cost $10,395,309) | | | 10,395,309 | | | | 10,395,309 | |
Total Investments 101.4%
(Cost $230,519,292)† | | | | 327,011,037 | |
| | | | | | | | | |
| Excess of Liabilities Over Other Assets (1.4)% | | | | (4,557,530) | |
| | | | | | | | | |
| Net Assets 100.0% | | | | | | $ | 322,453,507 | |
| * | Non-income producing. |
| | |
| † | Cost for federal income tax purposes is $230,645,170. At November 30, 2016 unrealized appreciation for federal income tax purposes aggregated $96,365,867 of which $99,619,083 related to appreciated securities and $3,253,216 related to depreciated securities. |
| | |
| (a) | The actual mortgage-backed security that will be delivered is not designated until 48 hours prior to the established trade settlement date with the broker. |
| | |
| (b) | Return of capital paid during the fiscal period. |
| | |
| ADR | - American Depositary Receipt |
| | |
| SPDR | - Standard & Poor’s Depository Receipts |
| | |
| ^ | Represents less than 0.05% of net assets. |
The accompanying notes are an integral part of the financial statements.
12
Sentinel Common Stock Fund
(Unaudited)

Daniel J. Manion, CFA
Portfolio Manager | Performance Highlights |
| The Sentinel Common Stock Fund’s Class I shares had a return of 7.84% for the fiscal year ending November 30, 2016. This compares to a return of 8.06% for the Standard & Poor’s 500 Index, and a 6.33% average return for the funds in the Morningstar Large Blend category, for the same time period. |
| |
| Equity Market Review |
| For most of the year, the defensive, yield-heavy sectors dominated the market, as positive domestic economic indicators were not enough to counteract the uncertainties generated by international economic and political events. Fiscal 2016 saw weaker international economic growth and political unrest, the United Kingdom voting to leave the European Union, and a contested U.S. presidential election. However, the U.S. election results set a new course for the markets, as the Republican Party is set to take control of the executive and legislative branches. Many investors have bet on a strong pro-business agenda, and shifted positions accordingly, and aggressively. At fiscal year-end, value stocks decisively outperformed growth stocks, while small cap stocks swiftly reversed their underperformance vs. mid and large cap stocks, doubling the annual return of large cap stocks by the end of November. In terms of sectors, Utilities and Telecommunications led the S&P 500 Index for the majority of the year, but as interest rates rose they quickly lost ground post-election to the Industrials and Financials sectors, which ended up as the market leaders for the fiscal year. The Health Care and Information Technology sectors ended as the laggards, after being the clear leaders in previous years. |

Hilary T. Roper, CFA
Portfolio Manager | |
| |
| Key Performance Attribution |
| Stock selection was the main driver of performance for the fiscal year. Relative to the Fund’s benchmark, our holdings in Consumer Discretionary and Health Care were additive to the Fund’s performance, along with our underweight stance in the weak-performing Real Estate sector. Improving margins in cable and lowered fears of government intervention in deal-making helped our media holdings, while our focus away from textiles, apparel and luxury goods together with our emphasis on well-executed, off-price retailing benefitted performance. Within Health Care, our stock selection in providers and services, as well as in pharmaceuticals, contributed positively to the Fund. Conversely, our Information Technology, Consumer Staples and Energy exposure worked against us. Within Information Technology, our exposure in IT services was challenged as revenue expectations of one of our holdings fell amidst lower demand for consulting services in the financial services and health care industries, while another holding faced increased litigation and regulatory uncertainty. Our exposure to personal products within Consumer Staples also worked against us, as the industry overall underperformed, even within its sector. Within Energy, our exposure to oil majors did not participate as strongly on the upside as more leveraged names, despite our holdings having stronger balance sheets and better capital management. |
The Standard & Poor’s 500 Index is an unmanaged index of approximately 500 widely held U.S. equity securities chosen for market size, liquidity, and industry group representation.
An investment cannot be made directly in an index.
The return for the Morningstar category is an average of funds within the particular category as determined by Morningstar based on investment styles as measured by their underlying portfolio holdings.
13
Sentinel Common Stock Fund
| | Portfolio Positioning and Outlook |
| | |
| | Our long-term objective remains unchanged: to find superior companies with sustainable earnings streams trading at reasonable valuations. We believe this has the potential to lead to favorable returns relative to peer funds, as the Fund has produced over the long term. We have maintained our overweight position in the Financials, Health Care and Consumer Staples sectors. Through the fiscal year, we eliminated and / or trimmed low conviction positions, in favor of funding holdings that we believe reflect a better risk / return profile. We have continued moderating our Financials overweight, as certain positions became too large for our comfort, and have deployed the resulting capital into existing holdings in Health Care, Consumer Discretionary and Information Technology, where we see stronger fundamentals. |
| | |
| | We remain optimistic about finding attractive opportunities for total returns and modest levels of risk in high-quality, large-cap multinational stocks. The Fund owned, in aggregate, shares of companies that were growing earnings at attractive rates, generating strong free cash flow, and managing their capital prudently. These types of companies remain our focus and where we plan to invest the bulk of the Sentinel Common Stock Fund’s assets. |
| | |
| |  |
14
Sentinel Common Stock Fund
Performance Notes (Unaudited)
Graph and total return data assumes reinvestment of all distributions. Fund performance in the graphs and table reflects expenses and management fees but does not reflect the effect of any taxes on fund distributions or redemptions. Growth of Class A shares in the graph reflects the 5% maximum sales charge. Growth of Class C shares in the graph does not reflect the 1% contingent deferred sales charge (CDSC) applicable to redemptions within the first year, because none would apply if the shares were held for the full period. Index performance does not reflect any sales charges, fees or expenses. Data shown represents past performance; past performance does not guarantee future results; current performance may be higher or lower than that shown. Investment return and principal value will vary so that you may have a gain or loss when you sell shares. Before investing, carefully consider a fund’s objectives, risks, charges and expenses. Summary and full prospectuses containing this and other information are available from sentinelinvestments.com. Please read them carefully. Visit www.sentinelinvestments.com for the most current month-end performance information.
Growth of a $10,000 Investment (Class A shares and Class C shares)
November 30, 2006 – November 30, 2016

Growth of a $1,000,000 Investment (Class I shares and Class R6 shares)
November 30, 2006 – November 30, 2016
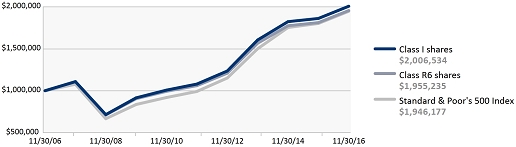
Average Annual Total Returns (as of November 30, 2016)
| | | Class A shares | | Class C shares | | Class I shares | Class R6 shares | | | | |
| | | Without Sales | | With 5% | | Without | | With 1% | | No | | No | | | | |
| | | Charge | | Sales Charge | | CDSC | | CDSC | | Sales Charge | | Sales Charge | | Class | | Symbol |
| 1 year | | | 7.53 | % | | | 2.15 | % | | | 6.71 | % | | | 5.73 | % | | | 7.84 | % | | | 7.92 | % | | A | | SENCX |
| 3 years | | | 7.44 | | | | 5.62 | | | | 6.59 | | | | 6.59 | | | | 7.74 | | | | 7.68 | | | C | | SCSCX |
| 5 years | | | 12.86 | | | | 11.71 | | | | 11.95 | | | | 11.95 | | | | 13.20 | | | | 13.01 | | | I | | SICWX |
| 10 years | | | 6.86 | | | | 6.32 | | | | 5.95 | | | | 5.95 | | | | 7.21 | | | | 6.94 | | | R6 | | SCRLX |
Inception Date of the Fund – 1/12/34
Performance of the Class A shares prior to June 30, 2012 has not been adjusted to reflect the decrease in the maximum 12b-1 fee from 0.30% to 0.25%. If it had, those returns would be higher. Performance of the Class I shares prior to their inception on May 4, 2007 is based on the performance of the Fund’s Class A shares, restated to reflect that Class I shares are not subject to a sales charge. Performance of the Class R6 shares prior to their inception on December 23, 2014 is based on the performance of the Fund’s Class A shares, restated to reflect that Class R6 shares are not subject to a sales charge. Only eligible investors may purchase Class I and Class R6 shares, as described in the prospectus.
The following are total annual operating expense ratios for Sentinel Common Stock Fund Class A, C, I and R6 shares: A – 0.99%, C - 1.78%, I - 0.71%, R6 – 1.76%. Expense ratio data is sourced from the Fund’s most recent prospectus.
International securities are subject to political influences, currency fluctuations and economic cycles that may be unrelated to those affecting the domestic financial markets and may experience wider price fluctuations than U.S. domestic securities.
Large company stocks as a group could fall out of favor with the market and underperform investments that focus on small and mid-sized company stocks.
A CDSC of up to 1% may apply to investments of $1,000,000 or more in Class A shares which are redeemed within 12 months. See the Prospectus.
The Standard & Poor’s 500 Index is an unmanaged index of approximately 500 widely held U.S. equity securities chosen for market size, liquidity, and industry group representation.
An investment cannot be made directly in an index.
15
Sentinel Common Stock Fund
Fund Profile
at November 30, 2016
Top Sectors*
| Sector | Percent of Net Assets |
| Information Technology | 20.8% |
| Financials | 17.3% |
| Health Care | 14.8% |
| Consumer Discretionary | 12.7% |
| Consumer Staples | 10.6% |
| | |
| Top 10 Holdings** | |
| | |
| Description | Percent of Net Assets |
| Microsoft Corp. | 3.4% |
| Visa, Inc. | 2.7% |
| Apple, Inc. | 2.5% |
| Texas Instruments, Inc. | 2.4% |
| UnitedHealth Group, Inc. | 2.2% |
| Sector | Percent of Net Assets |
| Industrials | 10.0% |
| Energy | 8.0% |
| Telecommunication Services | 1.9% |
| Materials | 1.6% |
| Real Estate | 0.7% |
| Description | Percent of Net Assets |
| Morgan Stanley | 2.1% |
| Comcast Corp. | 2.1% |
| Alphabet, Inc. | 2.1% |
| Merck & Co., Inc. | 2.1% |
| Accenture PLC | 2.1% |
| Total of Net Assets | 23.7% |
*“Top Sectors” includes Domestic Common Stocks, Foreign Stocks & ADRs and Real Estate Investment Trusts.
**“Top 10 Holdings” excludes any short-term investments and money market funds. Portfolio composition and holdings are subject to change. More complete holdings follow.
Schedule of Investments
at November 30, 2016
| | | | | Value | |
| | | Shares | | | (Note 2) | |
| Domestic Common Stocks 94.9% | |
| Consumer Discretionary 12.7% | |
| Comcast Corp. | | | 600,000 | | | $ | 41,706,000 | |
| Goodyear Tire & Rubber Co. | | | 650,000 | | | | 19,948,500 | |
| Home Depot, Inc. | | | 165,000 | | | | 21,351,000 | |
| Lear Corp. | | | 85,000 | | | | 11,008,350 | |
| Marriott Int’l., Inc. | | | 261,600 | | | | 20,608,848 | |
| McDonald’s Corp. | | | 300,000 | | | | 35,781,000 | |
| Omnicom Group, Inc. | | | 250,000 | | | | 21,735,000 | |
| Priceline Group, Inc.* | | | 9,500 | | | | 14,284,960 | |
| Time Warner, Inc. | | | 350,000 | | | | 32,137,000 | |
| TJX Cos., Inc. | | | 490,000 | | | | 38,386,600 | |
| | | | | | | | 256,947,258 | |
| Consumer Staples 8.9% | | | | | |
| CVS Health Corp. | | | 275,000 | | | | 21,144,750 | |
| Estee Lauder Cos, Inc. | | | 315,000 | | | | 24,475,500 | |
| Kraft Heinz Co. | | | 250,000 | | | | 20,412,500 | |
| McCormick & Co., Inc. | | | 100,000 | | | | 9,120,000 | |
| PepsiCo, Inc. | | | 400,000 | | | | 40,040,000 | |
| Philip Morris Int’l., Inc. | | | 300,000 | | | | 26,484,000 | |
| Procter & Gamble Co. | | | 450,000 | | | | 37,107,000 | |
| | | | | | | | 178,783,750 | |
| Energy 8.0% | | | | | | | | |
| Chevron Corp. | | | 197,400 | | | | 22,021,944 | |
| EOG Resources, Inc. | | | 230,000 | | | | 23,579,600 | |
| ExxonMobil Corp. | | | 455,000 | | | | 39,721,500 | |
| Marathon Petroleum Corp. | | | 400,000 | | | | 18,808,000 | |
| Noble Energy, Inc. | | | 600,000 | | | | 22,896,000 | |
| | | | | Value | |
| | | Shares | | | (Note 2) | |
| Schlumberger Ltd. | | | 400,000 | | | $ | 33,620,000 | |
| | | | | | | | 160,647,044 | |
| Financials 17.3% | | | | | |
| American Express Co. | | | 285,000 | | | | 20,531,400 | |
| Chubb Ltd. | | | 215,000 | | | | 27,520,000 | |
| CME Group, Inc. | | | 315,000 | | | | 35,566,650 | |
| Discover Financial Services | | | 375,000 | | | | 25,413,750 | |
| JPMorgan Chase & Co. | | | 469,700 | | | | 37,655,849 | |
| Morgan Stanley | | | 1,050,000 | | | | 43,428,000 | |
| PNC Financial Services Group, Inc. | | | 300,000 | | | | 33,162,000 | |
| S&P Global, Inc. | | | 300,000 | | | | 35,697,000 | |
| Signature Bank* | | | 155,000 | | | | 23,236,050 | |
| The Travelers Cos., Inc. | | | 260,000 | | | | 29,471,000 | |
| Wells Fargo & Co. | | | 726,600 | | | | 38,451,672 | |
| | | | | | | | 350,133,371 | |
| Health Care 13.7% | | | | | |
| Amgen, Inc. | | | 175,000 | | | | 25,212,250 | |
| Becton Dickinson & Co. | | | 100,000 | | | | 16,910,000 | |
| Biogen, Inc.* | | | 65,000 | | | | 19,114,550 | |
| Bristol-Myers Squibb Co. | | | 338,300 | | | | 19,093,652 | |
| Eli Lilly & Co. | | | 250,000 | | | | 16,780,000 | |
| Johnson & Johnson | | | 150,000 | | | | 16,695,000 | |
| Medtronic PLC(a) | | | 496,700 | | | | 36,264,067 | |
| Merck & Co., Inc. | | | 680,000 | | | | 41,609,200 | |
| Stryker Corp. | | | 140,000 | | | | 15,912,400 | |
| UnitedHealth Group, Inc. | | | 275,000 | | | | 43,538,000 | |
| Zoetis, Inc. | | | 498,000 | | | | 25,089,240 | |
| | | | | | | | 276,218,359 | |
| | | | | Value | |
| | | Shares | | | (Note 2) | |
| Industrials 10.0% | | | | | |
| Boeing Co. | | | 175,000 | | | $ | 26,348,000 | |
| Canadian National Railway Co. | | | 437,000 | | | | 29,204,710 | |
| General Dynamics Corp. | | | 185,500 | | | | 32,527,425 | |
| Honeywell Int’l., Inc. | | | 300,000 | | | | 34,182,000 | |
| Johnson Controls Int’l. plc | | | 477,834 | | | | 21,492,973 | |
| United Technologies Corp. | | | 275,000 | | | | 29,623,000 | |
| Verisk Analytics, Inc.* | | | 336,000 | | | | 27,914,880 | |
| | | | | | | | 201,292,988 | |
| Information Technology 20.8% | | | | | |
| Accenture PLC | | | 347,000 | | | | 41,442,210 | |
| Alphabet, Inc.* | | | 55,000 | | | | 41,692,200 | |
| Apple, Inc. | | | 450,520 | | | | 49,791,471 | |
| Check Point Software Technologies Ltd.* | | | 210,000 | | | | 17,289,300 | |
| Cisco Systems, Inc. | | | 1,345,770 | | | | 40,130,861 | |
| Cognizant Technology Solutions Corp.* | | | 362,100 | | | | 19,944,468 | |
| Microsoft Corp. | | | 1,150,000 | | | | 69,299,000 | |
| Oracle Corp. | | | 470,000 | | | | 18,889,300 | |
| Synopsys, Inc.* | | | 275,000 | | | | 16,632,000 | |
| Texas Instruments, Inc. | | | 658,000 | | | | 48,645,940 | |
| Visa, Inc. | | | 712,200 | | | | 55,067,304 | |
| | | | | | | | 418,824,054 | |
| Materials 1.6% | | | | | | | | |
| EI Du Pont de Nemours & Co. | | | 275,000 | | | | 20,242,750 | |
| Praxair, Inc. | | | 100,000 | | | | 12,030,000 | |
| | | | | | | | 32,272,750 | |
The accompanying notes are an integral part of the financial statements.
16
Sentinel Common Stock Fund
| | | | | | Value | |
| | | Shares | | | (Note 2) | |
| Telecommunication Services 1.9% | | | |
| Verizon Communications, Inc. | | | 777,300 | | | $ | 38,787,270 | |
Total Domestic Common Stocks
(Cost $945,277,456) | | 1,913,906,844 | |
| Foreign Stocks & ADR’s 2.8% | | | |
| Netherlands 1.7% | | | | | | | | |
| Unilever NV ADR | | | 850,000 | | | | 33,855,500 | |
| Switzerland 1.1% | | | | | | | | |
| Roche Holding AG ADR | | | 854,600 | | | | 23,698,058 | |
Total Foreign Stocks & ADR’s
(Cost $63,420,317) | | 57,553,558 | |
| Real Estate Investment Trusts 0.7% | |
| Real Estate 0.7% | | | | | | | | |
Equinix, Inc.
(Cost $14,509,053) | | | 40,000 | | | | 13,550,400 | |
| Institutional Money Market Funds 0.5% |
| State Street Institutional U.S. Government Money Market Fund | | | | | | | | |
Premier Class
(Cost $10,471,802) | | | 10,471,802 | | | | 10,471,802 | |
| | | | | | | |
| | | Principal
Amount
(M=$1,000) | | | Value
(Note 2) | |
| U.S. Government Obligations 0.7% | | | |
| U.S. Government Agency Obligations 0.7% | | | |
| Federal Home Loan Bank 0.7% | | | |
Agency Discount Notes: 0.1%, 12/01/16
(Cost $14,000,000) | | | 14,000 M | | | | 14,000,000 | |
Total Investments 99.6%
(Cost $1,047,678,628)† | | | | 2,009,482,604 | |
| | | | | | | | | |
| Other Assets in Excess of Liabilities 0.4% | | 7,161,053 | |
| | | | | | | | | |
| Net Assets 100.0% | | | $ | 2,016,643,657 | |
| * | | Non-income producing. |
| | | |
| † | | Cost for federal income tax purposes is $1,050,406,717. At November 30, 2016 unrealized appreciation for federal income tax purposes aggregated $959,075,887 of which $982,608,200 related to appreciated securities and $23,532,313 related to depreciated securities. |
| | | |
| (a) | | Return of capital paid during the fiscal period. |
| | | |
| ADR | | - American Depositary Receipt |
The accompanying notes are an integral part of the financial statements.
17
Sentinel Government Securities Fund
(Unaudited)
 Jason Doiron, FRM, PRM Portfolio Manager 
Peter Hassler, CFA Portfolio Manager | Performance Highlights For the fiscal year ending November 30, 2016, the Sentinel Government Securities Fund’s Class I shares had a return of 0.44%. This compares to the Bloomberg Barclays U.S. Government/Mortgage Backed Securities (MBS) Index which returned 1.26%, and a 0.87% return for the Morningstar Intermediate Government peer group in the same time period. Bond Market Review Following a period of election and central bank induced volatility in financial markets early in Q4 2016, risk assets recovered significantly in anticipation of material fiscal stimulus following the surprise victory for President-Elect Trump. As the calendar moved past the election market, participants celebrated accelerating Global Purchasing Managers’ Indexes (PMIs), a strong pick-up in U.S. growth and an OPEC/non-OPEC agreement to cut crude oil production. Higher readings for inflation and less accommodative talk from global central banks such as the U.S. Federal Reserve Bank, European Central Bank and the Bank of England were more than offset by the prospect for stronger global and U.S. growth in the future and did not lead to the market jitters experienced in Q3 2016. The Bloomberg Barclays U.S. Corporate High Yield Index ended the month of November 25 basis points (bps) tighter from its Q3 close while the S&P 500 rose more than 1.4%. U.S. Treasury securities moved significantly higher in yield in the first two months of Q4 2016 with the 10-year U.S. Treasury yield rising 79 bps to 2.38% from 1.59%. Realized inflation began to accelerate globally while the surprise victory for President-Elect Trump saw markets anticipate a significant increase in fiscal stimulus. Inflation expectations accelerated in the U.S. with 5-year inflation break even rising 32 bps by the end of November from 1.48% to 1.80%. The 30-year U.S. Treasury yield slightly underperformed the 5-year U.S. Treasury yield by 3 bps at the end of November from the start of the quarter, as the market weighed the potential for greater fiscal stimulus, inflation and long-end treasury issuance versus a potentially faster pace of U.S. Federal Reserve Bank interest rate increases. Relative to developed global markets, U.S. Treasury security and spread products continued to offer a superior yield advantage, resulting in them being particularly attractive to foreign and global investors. Performance Attribution While the Fund underperformed the Bloomberg Barclays U.S. Government/Mortgage Backed Securities (MBS) Index by 82 bps for the fiscal year ended November 30th, it underperformed the Morningstar Intermediate Government category by 39 bps over the same period. Moving from the year to date period ended September 30th to the fiscal year-end, the sources of relative fund performance changed significantly. With the 10-year U.S. Treasury yield increasing over 143 bps to end November at year to date highs, and prepayment speeds near the highs of the year, mortgages underperformed. Three main factors weighed on mortgage performance from September 30th to November 30th. First, prepayment speeds surprised to the upside as the effects of this summer’s low rates continued to be felt by MBS investors. Secondly, MBS Index duration* extended nearly 200 bps from 2.50 to 4.46 as expectations for future |
| * | Effective duration is a measure of the sensitivity of a bond’s price to changes in interest rates. The shorter (longer) the duration, the lower (higher) the interest rate risk and price volatility. |
The Bloomberg Barclays U.S. Corporate High Yield Index is an unmanaged index of U.S. dollar-denominated, non-investment grade, fixed-rate, taxable corporate bonds. Securities are classified as high yield if the middle rating of Moody’s, Fitch, and S&P is Ba1/BB+/BB+ or below, excluding emerging market debt.
The Bloomberg Barclays U.S. Government/Mortgage Backed Securities (MBS) Index is an unmanaged index comprising U.S. Treasuries and agency debentures, with maturities of one year or longer, and agency mortgage-backed pass-through securities issued by Government National Mortgage Association (GNMA), Federal National Mortgage Association (FNMA), and Federal Home Loan Mortgage Corporation (FHLMC).
An investment cannot be made directly in an index.
The return for the Morningstar category is an average of funds within the particular category as determined by Morningstar based on investment styles as measured by their underlying portfolio holdings.
18
Sentinel Government Securities Fund
| | prepayment speeds fell with higher rates causing some investors to sell down positions. Lastly, in the rate backup, the bid for call protected specified mortgage pools fell, exacerbating relative mortgage underperformance at the security level. However, more than offsetting the underperformance of MBS over October and November 2016 was the Fund’s overall duration underweight to the benchmark index. Despite the MBS Index duration extension, our defensive coupon positioning in the stack gave a lift to relative performance. During the fiscal year, the Fund’s usage of U.S. Treasury Futures resulted in less than 1 basis point of underperformance relative to the Bloomberg Barclay’s U.S. Government/ Mortgage Backed Securities (MBS) Index, which was due to the impact of the trades on the Fund’s effective duration. Portfolio Positioning and Outlook Looking ahead into Q1 2017, there is growing optimism amongst market participants that U.S. growth and inflation will accelerate as the incoming Trump Administration attempts to implement a number of fiscal stimulus measures including infrastructure investment, tax cuts, de-regulation and the repatriation of foreign earnings held abroad. At the same time the U.S. Federal Reserve Board is likely to take additional steps towards normalizing interest rates while the European Central Bank and Bank of England take additional steps towards unwinding their quantitative easing programs. For the first time in years, markets are likely to continue to experience rising headline inflation across most developed market Consumer Price Indexes (CPI) in the coming quarters due in part to favorable base effects from the Energy sector that already existed prior to an OPEC and non-OPEC agreement to curb crude oil production. While central banks are likely to initially dismiss this rising inflation as “transitory” with more time needed to judge its sustainability, a faster rate of policy removal may occur should realized inflation start to prove stronger than that assumed in forward projections. Even though U.S. growth and inflation were showing signs of acceleration in Q3 and the early parts of Q4, 2016, financial markets have currently priced a very optimistic view of stronger U.S. growth due to fiscal stimulus expectations. Should the incoming administration not deliver as quickly on some or all of these growth measures at the same time the markets are experiencing faster inflation and less accommodative global central bank policy, interest rate and risk markets may experience a period of price discovery. Investment strategies that are able to remain flexible in anticipation of a potential increase in volatility associated with these unknowns are likely to be favored in this environment. 
|
19
Sentinel Government Securities Fund
Performance Notes (Unaudited)
Graph and total return data assumes reinvestment of all distributions. Fund performance in the graphs and table reflects expenses and management fees but does not reflect the effect of any taxes on fund distributions or redemptions. Growth of Class A shares in the graph reflects the 2.25% maximum sales charge. Growth of Class C shares in the graph does not reflect the 1% contingent deferred sales charge (CDSC) applicable to redemptions within the first year, because none would apply if the shares were held for the full period. Index performance does not reflect any sales charges, fees or expenses. Data shown represents past performance; past performance does not guarantee future results; current performance may be higher or lower than that shown. Investment return and principal value will vary so that you may have a gain or loss when you sell shares. Before investing, carefully consider a fund’s objectives, risks, charges and expenses. Summary and full prospectuses containing this and other information are available from sentinelinvestments.com. Please read them carefully. Visit www.sentinelinvestments.com for the most current month-end performance information.
Growth of a $10,000 Investment (Class A shares and Class C shares)
November 30, 2006 – November 30, 2016
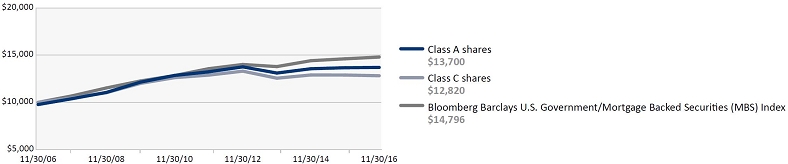
Growth of a $1,000,000 Investment (Class I shares)
November 30, 2006 – November 30, 2016

Average Annual Total Returns (as of November 30, 2016)
| | | | Class A shares | | Class C shares | Class I shares | | | | | | |
| | | | Without
Sales Charge | | With 2.25%
Sales Charge | | Without
CDSC | | With 1%
CDSC | | No
Sales Charge | | | Class | | | Symbol | |
| 1 year | | | | 0.24 | % | | | -2.02 | % | | | -0.56 | % | | | -1.54 | % | | | 0.44 | % | | | A | | | | SEGSX | |
| 3 years | | | | 1.49 | | | | 0.73 | | | | 0.69 | | | | 0.69 | | | | 1.71 | | | | C | | | | SCGGX | |
| 5 years | | | | 0.69 | | | | 0.23 | | | | -0.10 | | | | -0.10 | | | | 0.93 | | | | I | | | | SIBWX | |
| 10 years | | | | 3.44 | | | | 3.20 | | | | 2.52 | | | | 2.52 | | | | 3.69 | | | | | | | | | |
Inception Date of the Fund – 9/2/86
Performance of the Class A shares is based on the 2.25% maximum sales charge and is not adjusted to reflect the maximum 4% sales charge in effect from inception through April 10, 2005 and from June 1, 2006 through July 31, 2010, nor has it been adjusted to reflect the maximum sales charge of 2% in effect from April 11, 2005 to May 31, 2006. If it was the returns would be lower. Performance of the Class I shares prior to their inception on May 4, 2007 is based on the performance of the Fund’s Class A shares, restated to reflect that Class I shares are not subject to a sales charge. Only eligible investors may purchase Class I shares, as described in the Prospectus.
The following are total annual operating expense ratios for Sentinel Government Securities Fund Class A, C & I shares: A – 0.96%, C – 1.74%, I – 0.73%. Expense ratio data is sourced from the Fund’s most recent prospectus.
Fixed income securities are subject to credit and interest rate risk. Bond values will generally decrease when interest rates rise and will generally increase when interest rates fall. A fund’s investments in mortgage-backed securities are subject to prepayment risks. These risks may result in greater share price volatility. Fund shares are not insured or guaranteed by the U.S. government or its agencies.
The Fund may use derivatives, which are financial contracts whose value depends upon or is derived from the value of an underlying asset, reference rate, or index. The Fund may use derivatives as part of a strategy designed to reduce exposure to certain risks, such as risks associated with changes in interest rates, or currency or credit risk (“hedging”). The use of derivatives may reduce the Fund’s return and increase the volatility in movements in the Fund’s net asset value. For additional information regarding the use of derivatives, please see the Fund’s current Prospectus.
A CDSC of up to 0.50% may apply to investments of $500,000 or more in Class A shares which are redeemed within 12 months. See the Prospectus.
The Bloomberg Barclays U.S. Government/Mortgage Backed Securities (MBS) Index is an unmanaged index comprising U.S. Treasuries and agency debentures, with maturities of one year or longer, and agency mortgage-backed pass-through securities issued by Government National Mortgage Association (GNMA), Federal National Mortgage Association (FNMA), and Federal Home Loan Mortgage Corporation (FHLMC). An investment cannot be made directly in an index.
20
Sentinel Government Securities Fund
Fund Profile
at November 30, 2016
Average Effective Duration (Unaudited)
| | | Percent of |
| Duration | | Fixed Income Holdings |
| Less than 1 yr. | | | 9.8 | % |
| 1 yr. to 2.99 yrs. | | | 19.2 | % |
| 3 yrs. to 3.99 yrs. | | | 23.5 | % |
Average Effective Duration (for all Fixed Income Holdings) 3.9 years**
| | | Percent of |
| Duration | | Fixed Income Holdings |
| 4 yrs. to 5.99 yrs. | | | 35.4 | % |
| 6 yrs. to 7.99 yrs. | | | 12.1 | % |
Top 10 Holdings**
| | | | | | Maturity | | Percent of | |
| Description | | Coupon | | | Date | | Net Assets | |
| FNMA AT2016 | | | 3.00 | % | | 04/01/43 | | | 8.4 | % |
| FHLMC J22900 | | | 2.50 | % | | 03/01/28 | | | 7.3 | % |
| FNMA AL2860 | | | 3.00 | % | | 12/01/42 | | | 7.1 | % |
| FNMA AI4728 | | | 4.50 | % | | 07/01/41 | | | 6.9 | % |
| FNMA BC1809 | | | 3.50 | % | | 05/01/46 | | | 6.8 | % |
| FHLMC Q33006 | | | 3.50 | % | | 04/01/45 | | | 6.3 | % |
| | | | | | Maturity | | Percent of | |
| Description | | Coupon | | | Date | | Net Assets | |
| FHLMC G05624 | | | 4.50 | % | | 09/01/39 | | | 5.5 | % |
| FNMA AB7845 | | | 3.00 | % | | 02/01/43 | | | 5.1 | % |
| GNR 10-33 PX | | | 5.00 | % | | 09/20/38 | | | 4.8 | % |
| FNMA AE0215 | | | 4.00 | % | | 12/01/39 | | | 4.5 | % |
| Total of Net Assets | | | | | | | | | 62.7 | % |
*The average effective duration considers the call and put dates of applicable fixed income investments and the pre-payment risks of mortgage-backed bonds to measure the sensitivity of the value of the Fund’s portfolio to changes in interest rates.
** “Top 10 Holdings” excludes any short-term investments and money market funds. Portfolio composition and holdings are subject to change. More complete holdings follow.
Schedule of Investments
at November 30, 2016
| | | Principal
Amount
(M=$1,000) | | | Value
(Note 2) | |
| U.S. Government Obligations 97.8% | |
| U.S. Government Agency Obligations 97.8% |
| Federal Home Loan Bank 2.0% |
| Agency Discount Notes: 0.1%, 12/01/16 | | | 4,000 M | | | $ | 4,000,000 | |
| Federal Home Loan Mortgage Corporation 32.9% |
| Collateralized Mortgage Obligations: | | |
FHR 3331 PE
6%, 06/15/37 | | | 8,007 M | | | | 8,891,540 | |
| Mortgage-Backed Securities: |
| 15-Year: | | | | | | | | |
FHLMC J22900
2.5%, 03/01/28 | | | 14,518 M | | | | 14,591,588 | |
| 30-Year: | | | | | | | | |
FHLMC 360017
11%, 11/01/17 | | | 11 | | | | 11 | |
FHLMC A64971
5.5%, 08/01/37 | | | 8 M | | | | 9,322 | |
FHLMC G05483
4.5%, 06/01/39 | | | 4,591 M | | | | 4,974,139 | |
FHLMC G05624
4.5%, 09/01/39 | | | 10,050 M | | | | 10,919,796 | |
FHLMC A89148
4%, 10/01/39 | | | 7,063 M | | | | 7,458,037 | |
FHLMC Q29056
4%, 10/01/44 | | | 5,821 M | | | | 6,121,519 | |
| | | Principal
Amount
(M=$1,000) | | | Value
(Note 2) | |
FHLMC Q33006
3.5%, 04/01/45 | | | 12,139 M | | | $ | 12,448,217 | |
| | | | | | | | 41,931,041 | |
| Total Federal Home Loan Mortgage Corporation | | | | | | | 65,414,169 | |
| Federal National Mortgage Association 52.6% |
| Collateralized Mortgage Obligations: | |
FNR 12-47 AI Interest Only
3%, 05/25/22 | | | 4,842 M | | | | 251,430 | |
FNR 03-32 BZ
6%, 11/25/32 | | | 388 M | | | | 438,118 | |
| | | | | | | | 689,548 | |
| Mortgage-Backed Securities: | | | |
| 15-Year: | | | | | | | | |
FNMA TBA 15 YR Dec
2.5%, 12/16/31(a) | | | 5,780 M | | | | 5,800,095 | |
| 20-Year: | | | | | | | | |
FNMA 758564
6%, 09/01/24 | | | 183 M | | | | 208,216 | |
| 30-Year: | | | | | | | | |
FNMA 426830
8%, 11/01/24 | | | 17 M | | | | 18,162 | |
FNMA 738887
5.5%, 10/01/33 | | | 117 M | | | | 130,379 | |
FNMA 748895
6%, 12/01/33 | | | 112 M | | | | 122,104 | |
FNMA 881279
5%, 11/01/36 | | | 956 M | | | | 1,046,319 | |
| | | Principal
Amount
(M=$1,000) | | | Value
(Note 2) | |
FNMA 931533
4.5%, 07/01/39 | | | 1,832 M | | | $ | 1,970,701 | |
FNMA 931535
5.5%, 07/01/39 | | | 1,446 M | | | | 1,608,986 | |
FNMA AE0215
4%, 12/01/39 | | | 8,609 M | | | | 9,055,365 | |
FNMA AD9193
5%, 09/01/40 | | | 7,750 M | | | | 8,521,936 | |
FNMA AI4728
4.5%, 07/01/41 | | | 12,795 M | | | | 13,801,714 | |
FNMA AL2860
3%, 12/01/42 | | | 14,069 M | | | | 14,067,753 | |
FNMA AB7845
3%, 02/01/43 | | | 10,106 M | | | | 10,104,817 | |
FNMA AT2016
3%, 04/01/43 | | | 16,733 M | | | | 16,731,150 | |
FNMA AL5718
3.5%, 09/01/44 | | | 6,863 M | | | | 7,081,858 | |
FNMA BC1809
3.5%, 05/01/46 | | | 13,095 M | | | | 13,441,588 | |
| | | | | | | | 97,702,832 | |
| Total Federal National Mortgage Association | | | | | | | 104,400,691 | |
| Government National Mortgage Corporation 10.3% | |
| Collateralized Mortgage Obligations: | |
GNR 10-33 PX
5%, 09/20/38 | | | 9,025 M | | | | 9,506,094 | |
The accompanying notes are an integral part of the financial statements.
21
Sentinel Government Securities Fund
| | | Principal
Amount
(M=$1,000) | | | Value
(Note 2) | |
| Mortgage-Backed Securities: |
| 30-Year: | | | | | | | | |
GNMA II 004424
5%, 04/20/39 | | | 2,660 M | | | $ | 2,946,073 | |
GNMA AG8936
4%, 02/15/44 | | | 7,495 M | | | | 8,053,921 | |
| | | | | | | | 10,999,994 | |
| Total Government National Mortgage Corporation | | | | | | | 20,506,088 | |
Total U.S. Government Obligations
(Cost $193,028,620) | | | | 194,320,948 | |
| | | | | | | | | |
| | | | Shares | | | | Value
(Note 2) | |
| Institutional Money Market Funds 5.3% | |
| State Street Institutional U.S. Government Money Market Fund | | | | | | | | |
Premier Class
(Cost $10,530,044) | | | 10,530,044 | | | | 10,530,044 | |
Total Investments 103.1%
(Cost $203,558,664)† | | | | 204,850,992 | |
| | | | | | | | | |
| Excess of Liabilities Over Other Assets (3.1)% | | | | (6,202,601) | |
| | | | | | | | | |
| Net Assets 100.0% | | | | | | $ | 198,648,391 | |
| † | Cost for federal income tax purposes is $203,558,664. At November 30, 2016 unrealized appreciation for federal income tax purposes aggregated $1,292,328 of which $2,770,416 related to appreciated securities and $1,478,088 related to depreciated securities. |
| (a) | The actual mortgage-backed security that will be delivered is not designated until 48 hours prior to the established trade settlement date with the broker. |
The accompanying notes are an integral part of the financial statements.
22
Sentinel International Equity Fund
(Unaudited)

Andrew Boczek Portfolio Manager | Performance Highlights For the fiscal year ending November 30, 2016, the Sentinel International Equity Fund’s Class I shares returned -4.41%, compared to the -3.66% total return of the Morgan Stanley Capital International (MSCI) Europe, Australasia and Far East (EAFE) Index and the -3.31% return for the Morningstar Foreign Large Blend category for the same time period. Equity Market Review Fiscal 2016 marked the third consecutive year of disappointing overall equity returns in developed international markets, driven by meager corporate revenue growth, a recovery in depressed commodity input costs and a modest bounce in market interest rates. Political uncertainty emanating from the United Kingdom’s vote in June to leave the European Union (Brexit) referendum and fears about another banking crisis, this time in Italy, didn’t help. European stocks dropped double digits on average, led lower by Italy and Spain, while the U.K., despite the headlines, performed roughly in line with the region. Japanese stocks were flat in dollars, helped largely by a significant bounce in the value of the Japanese yen over the first half of the year, while equities in commodity-driven markets like Canada and Australia enjoyed a nice recovery after a rough 2015. The past year saw an abrupt shift in market leadership. For the two-year period ending June 30, 2016, the MSCI EAFE Growth Index outperformed its Value counterpart by approximately 15 percentage points. Subsequently, over just the last five-month period, Value has recouped more than two thirds of that gap. So the theme of stable growth that was driving markets has been quickly turned on its head, driven by a combination of extreme relative valuations, rising interest rates and renewed hopes for reflation in the developed world. Since mid-year, market performance has been led by stocks in the Financials, Energy and Materials sectors, while traditionally defensive sectors such as Consumer Staples, Health Care, Telecommunications and Utilities have lagged badly. This is almost a mirror image of relative sector performance over the previous two-year period. Emerging markets showed positive returns for the period, though this masks a wide range of outcomes across countries. In general, stock markets in commodity producing nations had a good year, led by Brazil and Russia, while other equity markets struggled. Brazil in particular had an eventful 2016, with the impeachment of its president and hosting of the Olympics in August. And while the economy and stock market have benefitted somewhat from a bounce in commodity prices, growth in industrial production remains firmly in negative territory, and political uncertainty continues to hang over markets there. Elsewhere in emerging markets, Chinese stocks were mixed while property prices continued their march upward, driven by an accommodative banking system that is unable or unwilling to put the brakes on lending. The average sales price per square meter of apartment space in Shanghai, for example, rose by more than one third during the year, suggesting that the authorities have yet to successfully prick this growing bubble. Meanwhile over in India, in an attempt to punish holders of ill-gotten gains and counterfeit money, the authorities have implemented one of the largest monetary experiments in the history of the world, removing from circulation virtually overnight 85% of the value of currency notes outstanding. The result has been utter economic chaos and a sharp slowdown in spending, upending a nascent economic recovery and waylaying one of the better performing stock markets in the world prior to November. |
The Morgan Stanley Capital International (MSCI) Europe, Australasia, Far East (EAFE) Index is an unmanaged, free oat-adjusted, market capitalization-weighted index that is designed to measure the equity market performance of developed markets, excluding the U.S. and Canada. The Fund uses the net version of the Index, which reflects reinvested dividends subjected to the maximum non-U.S. tax rate applicable.
The MSCI EAFE Growth Index captures large and mid cap securities exhibiting overall growth style characteristics across Developed Markets countries around the world, excluding the U.S. and Canada. The growth investment style characteristics for index construction are defined using five variables: long-term forward EPS growth rate, short-term forward EPS growth rate, current internal growth rate and long-term historical EPS growth trend and long-term historical sales per share growth trend.
The MSCI EAFE Value Index captures large and mid cap securities exhibiting overall value style characteristics across Developed Markets countries around the world, excluding the U.S. and Canada. The value investment style characteristics for index construction are defined using three variables: book value to price, 12-month forward earnings to price and dividend yield.
An investment cannot be made directly in an index.
The return for the Morningstar category is an average of funds within the particular category as determined by Morningstar based on investment styles as measured by their underlying portfolio holdings.
23
Sentinel International Equity Fund
Key Performance Attributes
Any analysis of the Fund’s relative performance during fiscal 2016 is complicated by the aforementioned dramatic shift in market leadership that occurred midway through the year. Stock markets’ behavior reminded us of the statistician’s joke about the man with his feet in the freezer and head in the oven being comfortable on average. That being said, a few things stand out when looking at a breakdown of performance by sector for the fiscal year. For example, over the course of the full year the Fund benefitted from being underweight Financials and Health Care stocks. Banks struggled through the first half of the year in an environment of low and even negative interest rates in most developed countries, accentuated by fears of a banking crisis in Italy over the summer, while pharmaceutical makers came under the microscope after a multiyear period of aggressive drug price increases. The Fund also benefitted from not holding any Telecommunications stocks, and from an above average allocation to cash during the year. On the other hand, we suffered from being underweight Materials stocks, which saw a significant bounce off the bottom after being heavily sold over the previous couple of years, and from an overweight position in Consumer Discretionary stocks, which fell on average due to continuing weak demand from China.
From a geographic perspective, the Fund benefitted from an underweight position in the poorly performing Italian stock market, as well as from its exposure to certain emerging markets, including Brazil, Korea and Greece. On the other hand, the Fund’s underweight position in Japan and lack of exposure to a recovering Australian stock market hurt relative performance.
All of the above just obscures the real drivers of performance during the fiscal year, however, which could be found in big moves by a handful of individual securities on both the plus and minus sides. No discussion of the Fund’s performance for the period would be complete without a post mortem of its investment in Countrywide plc, the U.K.’s leading residential real estate agency, by far the largest detractor to performance during fiscal 2016. The Fund first made an investment in the company in early 2013, shortly after its stock market relisting, following a period of private equity ownership that spanned the peak of the previous bull market and the depths of the financial crisis. At the time, we felt that the prospects for a recovery in the volume of home sales, combined with a cleaned up balance sheet and Countrywide’s role as the natural consolidator of a fragmented industry made it an attractive long term investment. We also thought that the company’s leasing business made it less cyclical than perceived by the market. In retrospect we were too optimistic, and we missed the signs as the housing market peaked again and management changed in 2014. Political uncertainty and a slowly releveraging balance sheet were accompanied by increasing competition from new digital players, driving down commission rates and increasing risk. The U.K.’s vote to leave the European Union in June of this year put the industry on its knees, and with a now less solid financial position and little prospect for a recovery in revenues, Countrywide stands the risk of violating covenants on its bank debt. To top things off, in November the government, in an unexpected move, announced its intention to outlaw the fees that brokers have charged to rental applicants. In contrast to the analogy of the man with his feet in the freezer and head in the oven, our experience with Countrywide has been more like the frog being slowly and comfortably boiled to death.
The Fund also suffered from its investment in Ericsson, the Swedish maker of telecommunications network equipment. Our thesis of an eventual recovery in equipment demand as operators begin to roll out next generation networks, backed by a nice recurring services revenue stream and a strong balance sheet, proved to be premature if not unfounded. The company reported disappointing results in both April and October, which took some doing given the already low level of expectations. Signs of activism from the company’s largest shareholder have so far been unable to rouse the stock from its slumber, though to management’s credit there have been some renewed efforts at cost cutting at this traditionally engineering-driven company.
Performance also suffered from the Fund’s investments in Bank of Cyprus and Delphi Automotive, although to be fair we think that the fundamentals in these two companies have been fine. Bank of Cyprus has seen a steady improvement in both asset quality and the composition of its liabilities, in line with our thesis. It seems to us that a combination of disappointment over lack of progress in Cypriot reunification talks between the Greeks and Turks, the relatively small size and illiquidity of the bank’s float and selling of shares by bailed in depositors have so far put a lid on the stock price.
Delphi Automotive, the U.K. domiciled maker of electronic car components, had been a market darling for a number of years and, similar to many automotive related companies, has more recently been the subject of fears of a peaking global automotive cycle, as well as structural headwinds coming from the eventual electrification of the fleet and the sharing economy. We consider such fears exaggerated and remain bullish on the company’s prospects.
On the plus side, the Fund benefitted from investments in two gaming related businesses, Greek Organization of Football Prognostics, known more commonly by its Greek acronym OPAP, and Wynn Macau, the Hong Kong listed subsidiary that now represents the majority of the value of Steve Wynn’s empire. OPAP is benefitting from new private ownership and the return of some semblance of stability to the Greek economy. In addition, the company successfully settled a dispute with the Greek government over a change in the regulatory framework for their soon to be rolled out video lottery terminal business, which had been halted for the last couple of years.
24
Sentinel International Equity Fund
Wynn Macau has been caught up in the general slowdown in spending on luxury and gaming in China over the last couple of years. This slowdown came at a particularly bad time for Wynn, the high-end gaming operator which has been building a new $4 billion mega-casino that finally opened this past August. Luckily, demand has just started to recover and we think that Wynn’s premium product has a long runway for growth.
The Fund was also the beneficiary of a couple of takeovers during the fiscal year. U.K.-based mobile chip architects ARM Holdings plc, a near monopolist in the design of chips for smartphones, was bought by aggressive Japanese conglomerate Softbank at a substantial premium. And Syngenta AG, the Swiss agrochemical and seeds business, was the subject of an offer from Chinese state owned chemical conglomerate ChemChina after rebuffing two separate offers from Monsanto, as the board of directors came to the realization that being left out of ongoing industry consolidation would put it at a significant competitive disadvantage.
Outlook
Another year has passed and monetary and fiscal authorities around the world have managed to more-or-less successfully sweep our growing economic imbalances under the rug again. Continued accommodative policies have allowed for modest growth in most of the developed world, led by the U.S. Following seven years of economic recovery and given an unemployment rate comfortably below 5%, accompanied by an acceleration in wage pressures and other input costs, it’s no longer possible for the Federal Reserve Board to pretend that zero interest rates are appropriate for the U.S. economy. The unanswered questions are whether the economy can actually withstand a normalization of interest rates, and whether the Federal Reserve Board is prepared to follow through with tightening in the face of potential financial market hiccups.
The U.K.’s vote in June to leave the European Union came as a shock to the establishment, causing a rethink of the unspoken assumption that further European economic and political integration is both desirable in the abstract and desired by the masses. The precise shape of the U.K.’s future relationship with its soon-to-be former European Union partners will be subject to heated discussions over the coming two years, during which time increased uncertainty is likely to dampen spending and capital inflows into the U.K.
Brexit has also thrown a monkey wrench into plans to press forward with further fiscal integration among the countries of the European Union, integration which will be necessary to shore up confidence in the single currency. And following the decisive defeat of a referendum in Italy held in early December that would have facilitated some necessary fiscal consolidation, the barbarians seem to be at the gates. With general elections coming in Germany and France, and negotiations between the U.K. and European Union set to start, it’s difficult to imagine much political will to address problems in the Italian banking system, for example, which have the potential to destabilize the entire continent and unravel the single currency. It will be another interesting year across Europe.
The news from China has been pretty quiet over the past year, with GDP growth stabilizing in the 6-7% range. The problem is that this growth has been accompanied by an accelerating buildup of debt, and the rebalancing that the authorities there are trying to engineer is still no more than a twinkle in President Xi’s eye. Foreign reserves, while still enormous at $3 trillion, have fallen by around 25% from the peak, and it’s evident that the government is worried about shoring up leakages in the capital account. We remain concerned by the unbalanced nature of Chinese economic growth and are wary of the sustainability of the current bounce in industrial commodity prices, which has been driven by renewed debt funded investment in property and infrastructure.
Finally, there’s little new to say about the economic situation in Japan, which remains mired in debt-induced deflation, but where the authorities continue to attack the symptom rather than the disease. The latest plan is for the Bank of Japan to hold rates on all Japan Government Bond maturities up to ten years at or below zero. The central bank’s balance sheet is growing at a rate of $1 trillion per year and is looking more and more like a black hole from which nothing can escape.
The last several months have been extremely challenging, to say the least, for investors focused on identifying high-quality businesses sporting strong balance sheets and exhibiting stable growth characteristics. Whereas from mid-2014 to mid-2016 the Fund operated in a market environment highly favorable to our style of investing, the final quarter of fiscal 2016 saw that tailwind turn into a substantial headwind. It’s tough for us to keep up when low quality stocks outperform, as they have recently. So while we wring our hands over recent performance, we’re also excited about the opportunities we see in the markets these days. When that gap between stock price movement and business performance opens up the way it has, our mouths start to water. Our work lists are full and we think the prospects for our companies continue to be good. We remain focused on identifying growing, high-quality businesses with strong balance sheets, run by shareholder-friendly management teams and trading at reasonable valuations.
Thanks once again for your interest.

25
Sentinel International Equity Fund
Performance Notes (Unaudited)
Graph and total return data assumes reinvestment of all distributions. Fund performance in the graphs and table reflects expenses and management fees but does not reflect the effect of any taxes on fund distributions or redemptions. Growth of Class A shares in the graph reflects the 5% maximum sales charge. Growth of Class C shares in the graph does not reflect the 1% contingent deferred sales charge (CDSC) applicable to redemptions within the first year, because none would apply if the shares were held for the full period. Index performance does not reflect any sales charges, fees or expenses. Data shown represents past performance; past performance does not guarantee future results; current performance may be higher or lower than that shown. Investment return and principal value will vary so that you may have a gain or loss when you sell shares. Before investing, carefully consider a fund’s objectives, risks, charges and expenses. Summary and full prospectuses containing this and other information are available from sentinelinvestments.com. Please read them carefully. Visit www.sentinelinvestments.com for the most current month-end performance information.
Growth of a $10,000 Investment (Class A shares and Class C shares)
November 30, 2006 – November 30, 2016
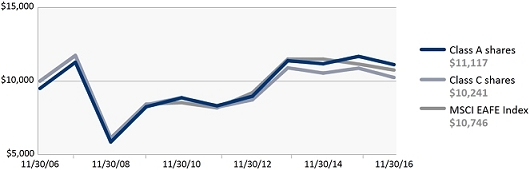
Growth of a $1,000,000 Investment (Class I shares)
November 30, 2006 – November 30, 2016

Average Annual Total Returns (as of November 30, 2016)
| | | Class A shares | | Class C shares | | Class I shares | | | | |
| | | Without | | With 5% | | Without | | With 1% | | No | | | | |
| | | Sales Charge | | Sales Charge | | CDSC | | CDSC | | Sales Charge | | Class | | Symbol |
| 1 year | | -4.81 | % | | -9.56 | % | | -5.82 | % | | -6.73 | % | | -4.41 | % | | A | | SWRLX |
| 3 years | | -0.78 | | | -2.46 | | | -2.05 | | | -2.05 | | | -0.38 | | | C | | SWFCX |
| 5 years | | 5.98 | | | 4.90 | | | 4.50 | | | 4.50 | | | 6.48 | | | I | | SIIEX |
| 10 years | | 1.58 | | | 1.06 | | | 0.24 | | | 0.24 | | | 1.97 | | | | | |
Inception Date of the Fund – 3/1/93
Performance of the Class A shares prior to June 30, 2012 has not been adjusted to reflect the decrease in the maximum 12b-1 fee from 0.30% to 0.25%. If it had, those returns would be higher. Performance of the Class I shares prior to their inception on August 27, 2007 is based on the performance of the Fund’s Class A shares, restated to reflect that Class I shares are not subject to a sales charge. Only eligible investors may purchase Class I shares, as described in the Prospectus.
The following are total annual operating expense ratios for Sentinel International Equity Fund Class A, C & I shares: A – 1.42%, C – 2.71%, I – 1.03%. Expense ratio data is sourced from the Fund’s most recent prospectus.
Certain Sentinel Funds have adopted a redemption fee. For the International Equity Fund, a fee of 2% will be assessed on the redemption of shares held for 30 calendar days or less.
International securities are subject to political influences, currency fluctuations and economic cycles that may be unrelated to those affecting the domestic financial markets and may experience wider price fluctuations than U.S. domestic securities.
A CDSC of up to 1% may apply to investments of $1,000,000 or more in Class A shares which are redeemed within 12 months. See the Prospectus.
The Morgan Stanley Capital International (MSCI) Europe, Australasia, Far East (EAFE) Index is an unmanaged, free float-adjusted, market capitalization-weighted index that is designed to measure the equity market performance of developed markets, excluding the U.S. and Canada. The Fund uses the net version of the Index, which reflects reinvested dividends which have been subject to the maximum non-U.S. tax rate applicable. An investment cannot be made directly in an index.
26
Sentinel International Equity Fund
Fund Profile
at November 30, 2016
Top Sectors *
| Sector | Percent of Net Assets |
| Consumer Discretionary | 33.3% |
| Information Technology | 18.6% |
| Industrials | 15.6% |
| Health Care | 6.7% |
| Financials | 5.4% |
| | |
| Top Geographical Weightings | |
| | |
| Country | Percent of Net Assets |
| United Kingdom | 26.3% |
| Switzerland | 10.1% |
| Germany | 5.9% |
| Japan | 5.7% |
| United States | 5.5% |
| | |
| Top 10 Holdings** | |
| | |
| Description | Percent of Net Assets |
| OPAP SA | 4.1% |
| Savills PLC | 2.8% |
| Experian PLC | 2.8% |
| SAP SE | 2.7% |
| Wynn Macau Ltd. | 2.7% |
| TE Connectivity Ltd. | 2.7% |
| Sector | Percent of Net Assets |
| Energy | 4.9% |
| Real Estate | 4.8% |
| Consumer Staples | 4.7% |
| Utilities | 2.0% |
| |
| |
| |
| |
| |
| Country | Percent of Net Assets |
| Canada | 4.8% |
| Ireland | 4.4% |
| France | 4.1% |
| Greece | 4.1% |
| India | 4.1% |
| |
| |
| |
| Description | Percent of Net Assets |
| Nestle SA | 2.7% |
| Uni-Select, Inc. | 2.7% |
| Delphi Automotive PLC | 2.6% |
| TGS Nopec Geophysical Co ASA | 2.6% |
| Total of Net Assets | 28.4% |
*“Top Sectors” includes Domestic Common Stocks and Foreign Stocks & ADR’s.
**“Top 10 Holdings” excludes any short-term investments and money market funds. Portfolio composition and holdings are subject to change. More complete holdings follow.
Schedule of Investments
at November 30, 2016
| | | | | | Value | |
| | | Shares | | | (Note 2) | |
| Domestic Common Stocks 13.3% | |
| Consumer Discretionary 2.6% | |
| Delphi Automotive PLC | | | 65,000 | | | $ | 4,160,000 | |
| Energy 2.3% | | | | | | | | |
| Core Laboratories NV | | | 33,000 | | | | 3,688,080 | |
| Health Care 1.7% | | | | | | | | |
| Medtronic PLC(a) | | | 39,000 | | | | 2,847,390 | |
| Information Technology 6.7% | | | |
| BlackBerry Ltd.* | | | 436,000 | | | | 3,361,560 | |
| Mastercard, Inc. | | | 30,000 | | | | 3,066,000 | |
| TE Connectivity Ltd. | | | 65,000 | | | | 4,396,600 | |
| | | | | | | | 10,824,160 | |
Total Domestic Common Stocks
(Cost $22,366,131) | | 21,519,630 | |
| Foreign Stocks & ADR’s 82.7% | |
| Canada 2.7% | | | | | | | | |
| Uni-Select, Inc. | | | 190,000 | | | | 4,287,129 | |
| China 1.2% | | | | | | | | |
| Tencent Holdings Ltd. (b) | | | 80,000 | | | | 1,992,071 | |
| Cyprus 1.8% | | | | | | | | |
| Bank of Cyprus Pcl *(b) | | | 22,000,000 | | | | 2,821,320 | |
| | | | | | Value | |
| | | Shares | | | (Note 2) | |
| Denmark 3.0% | | | | | | | | |
| ISS A/S (b) | | | 70,100 | | | $ | 2,392,031 | |
| Novo Nordisk A/S (b) | | | 72,000 | | | | 2,424,967 | |
| | | | | | | | 4,816,998 | |
| France 4.1% | | | | | | | | |
| Edenred SA (b) | | | 166,000 | | | | 3,496,080 | |
| Renault SA (b) | | | 40,500 | | | | 3,179,077 | |
| | | | | | | | 6,675,157 | |
| Germany 5.9% | | | | | | | | |
| Brenntag AG (b) | | | 52,447 | | | | 2,769,416 | |
| NORMA Group AG (b) | | | 58,000 | | | | 2,296,141 | |
| SAP SE (b) | | | 53,000 | | | | 4,426,260 | |
| | | | | | | | 9,491,817 | |
| Greece 4.1% | | | | | | | | |
| OPAP SA (b) | | | 700,000 | | | | 6,527,244 | |
| India 4.1% | | | | | | | | |
| PC Jeweller Ltd. (b) | | | 630,000 | | | | 3,383,670 | |
| Shriram Transport Finance Co Ltd. (b) | | | 250,000 | | | | 3,294,540 | |
| | | | | | | | 6,678,210 | |
| Ireland 2.7% | | | | | | | | |
| Experian PLC (b) | | | 235,000 | | | | 4,429,537 | |
| | | | | | Value | |
| | | Shares | | | (Note 2) | |
| Italy 1.1% | | | | | | | | |
| DiaSorin SpA (b) | | | 34,000 | | | $ | 1,834,176 | |
| Japan 5.7% | | | | | | | | |
| CyberAgent, Inc. (b) | | | 120,000 | | | | 2,934,181 | |
| FANUC Corp. (b) | | | 12,800 | | | | 2,184,641 | |
| USS Co Ltd. (b) | | | 252,000 | | | | 4,078,312 | |
| | | | | | | | 9,197,134 | |
| Luxembourg 2.6% | | | | |
| SES SA *(b) | | | 191,500 | | | | 4,133,582 | |
| Macau 2.7% | | | | | | | | |
| Wynn Macau Ltd. (b) | | | 2,390,000 | | | | 4,420,296 | |
| Netherlands 1.6% | | | | | | | | |
| Intertrust NV (b) | | | 150,000 | | | | 2,611,979 | |
| Norway 2.6% | | | | | | | | |
| TGS Nopec Geophysical Co ASA (b) | | | 210,000 | | | | 4,143,249 | |
| South Korea 3.7% | | | | | | | | |
| Hyundai Motor Co. (b) | | | 23,000 | | | | 2,612,714 | |
| Samsung Electronics Co Ltd. (b) | | | 2,200 | | | | 3,273,988 | |
| | | | | | | | 5,886,702 | |
The accompanying notes are an integral part of the financial statements.
27
Sentinel International Equity Fund
| | | | | | Value | |
| | | Shares | | | (Note 2) | |
| Spain 2.0% | | | | | | | | |
| Red Electrica Corp. SA (b) | | | 180,000 | | | $ | 3,200,886 | |
| Switzerland 7.4% | | | | | | | | |
| Adecco SA (b) | | | 61,000 | | | | 3,756,648 | |
| Nestle SA (b) | | | 64,000 | | | | 4,307,111 | |
| Roche Holding AG (b) | | | 17,000 | | | | 3,783,710 | |
| | | | | | | | 11,847,469 | |
| United Kingdom 23.7% | | | |
| Auto Trader Group PLC (b) | | | 500,000 | | | | 2,495,269 | |
| AVEVA Group PLC (b) | | | 134,000 | | | | 2,847,311 | |
| BCA Marketplace PLC (b) | | | 1,505,000 | | | | 3,502,483 | |
| Compass Group PLC (b) | | | 168,000 | | | | 2,876,275 | |
| Countrywide PLC (b) | | | 484,953 | | | | 1,035,289 | |
| Foxtons Group PLC (b) | | | 1,750,000 | | | | 2,304,553 | |
| Hays PLC (b) | | | 2,325,000 | | | | 4,034,974 | |
| ITV PLC (b) | | | 1,925,000 | | | | 4,044,132 | |
| Reckitt Benckiser Group PLC (b) | | | 38,000 | | | | 3,209,996 | |
| Rightmove PLC (b) | | | 84,000 | | | | 3,851,454 | |
| Savills PLC (b) | | | 544,000 | | | | 4,560,956 | |
| WPP PLC (b) | | | 158,000 | | | | 3,369,645 | |
| | | | | | | | 38,132,337 | |
Total Foreign Stocks & ADR’s
(Cost $128,076,620) | | 133,127,293 | |
| Institutional Money Market Funds 3.6% | |
| State Street Institutional U.S. Government Money Market Fund | | | | | | | | |
Premier Class
(Cost $5,770,139) | | | 5,770,139 | | | | 5,770,139 | |
Total Investments 99.6%
(Cost $156,212,890)† | | 160,417,062 | |
| | | | | | | | | |
| Other Assets in Excess of Liabilities 0.4% | | | | 603,301 | |
| | | | | | | | | |
| Net Assets 100.0% | $ | 161,020,363 | |
| | |
| * | Non-income producing. |
| | |
| † | Cost for federal income tax purposes is $156,212,890. At November 30, 2016 unrealized appreciation for federal income tax purposes aggregated $4,204,172 of which $17,080,884 related to appreciated securities and $12,876,712 related to depreciated securities. |
| | |
| (a) | Return of capital paid during the fiscal period. |
| | |
| (b) | Included as Level 2, as a fair value factor was applied at November 30, 2016. |
The accompanying notes are an integral part of the financial statements.
28
Sentinel Low Duration Bond Fund
(Unaudited)

Jason Doiron, FRM, PRM Portfolio Manager | Performance Highlights The Sentinel Low Duration Bond Fund’s Class I shares produced a total return of 1.08% for the fiscal year ending November 30, 2016. This compares to a return of 1.09% for the Bloomberg Barclays 1-3 Year U.S. Government/Credit Index and 1.53% for the Morningstar Short-Term Bond peer group average during the same period. Bond Market Review Following a period of election and central bank induced volatility in financial markets early in Q4 2016, risk assets recovered significantly in anticipation of material fiscal stimulus following the surprise victory for President-Elect Trump. As the calendar moved past the election market, participants celebrated accelerating Global Purchasing Managers’ Indexes (PMIs), a strong pick-up in U.S. growth and an OPEC/non-OPEC agreement to cut crude oil production. Higher readings for inflation and less accommodative talk from global central banks such as the U.S. Federal Reserve Bank, European Central Bank and the Bank of England were more than offset by the prospect for stronger global and U.S. growth in the future and did not lead to the market jitters experienced in Q3 2016. The Bloomberg Barclays U.S. Corporate High Yield Index ended the month of November 25 basis points (bps) tighter from its Q3 close while the S&P 500 rose more than 1.4%. U.S. Treasury securities moved significantly higher in yield in the first two months of Q4 2016 with the 10-year U.S. Treasury yield rising 79 bps to 2.38% from 1.59%. Realized inflation began to accelerate globally while the surprise victory for President-Elect Trump saw markets anticipate a significant increase in fiscal stimulus. Inflation expectations accelerated in the U.S. with 5-year inflation break even rising 32 bps by the end of November from 1.48% to 1.80%. The 30-year U.S. Treasury yield slightly underperformed the 5-year U.S. Treasury yield by 3 bps at the end of November from the start of the quarter, as the market weighed the potential for greater fiscal stimulus, inflation and long-end treasury issuance versus a potentially faster pace of U.S. Federal Reserve Bank interest rate increases. Relative to developed global markets, U.S. Treasury security and spread products continued to offer a superior yield advantage, resulting in them being particularly attractive to foreign and global investors. Key Performance Attribution The Low Duration Bond Fund Class I shares returned 1.08% during the 12 months ending November 30, 2016 underperforming the Bloomberg Barclays 1-3 Year U.S. Gov’t/Credit Index by 0.01%. During the year, the yield on the 10-year U.S. Treasury rose 20 bps to 1.84% from 1.64%, while the Fund was, on average, long duration* vs. the benchmark by 0.20 years. The Fund’s long duration position resulted in 97 bps of underperformance vs. the benchmark. Risk assets performed quite well during the year with the Option Adjusted Spread (OAS) on the Bloomberg Barclays U.S. Corporate Index tightening by 26 bps, and the OAS on the Bloomberg Barclays U.S. Corporate High Yield Index tightening by 148 bps. Largely due to the strong performance of risk assets, the Fund’s asset allocation call contributed 217 bps to outperformance, with 134 bps coming from a 17.5% average overweight to high yield credit and 47 bps coming from positive sector allocation within investment grade |
* Effective duration is a measure of the sensitivity of a bond’s price to changes in interest rates. The shorter (longer) the duration, the lower (higher) the interest rate risk and price volatility.
The Standard & Poor’s 500 Index is an unmanaged index of approximately 500 widely held U.S. equity securities chosen for market size, liquidity, and industry group representation.
The Bloomberg Barclays 1-3 Year U.S. Government/Credit Index is an unmanaged index of U.S. government, government agency and investment grade corporate securities with maturities of one to three years.
The Bloomberg Barclays U.S. Corporate High Yield Index is an unmanaged index of U.S. dollar-denominated, non-investment grade, fixed-rate, taxable corporate bonds. Securities are classified as high yield if the middle rating of Moody’s, Fitch, and S&P is Ba1/BB+/BB+ or below, excluding emerging market debt.
The Bloomberg Barclays U.S. Corporate Index (Investment Grade) is a broad-based benchmark that measures the investment grade, U.S. dollar-dominated fixed-rate, taxable corporate bond market. It includes USD-denominated securities publicly issued by U.S. and non-U.S. industrial, utility, and financial issuers that meet specified maturity, liquidity, and quality requirements.
An investment cannot be made directly in an index.
The return for the Morningstar category is an average of funds within the particular category as determined by Morningstar based on investment styles as measured by their underlying portfolio holdings.
29
Sentinel Low Duration Bond Fund
| | credit. Security selection within high yield credit was positive, contributing 35 bps to relative performance, while security selection within investment grade resulted in 94 bps of underperformance. In addition, security selection within the Fund’s Agency Mortgage Backed Securities (MBS) portfolio resulted in 2 bps of underperformance. During the fiscal year, the Fund’s usage of U.S. Treasury Futures resulted in 88 basis points of underperformance relative to the Bloomberg Barclays 1-3 Year U.S. Government/Credit Index. The Fund utilizes U.S. Treasury Futures to generally keep the portfolio’s effective duration at less than 3 years during normal market conditions. As a result of the U.S. Treasury market rally, nearly all of the underperformance was due to a reduction of the Fund’s effective duration resulting from the usage of U.S. Treasury Futures. Portfolio Positioning and Outlook Looking ahead into Q1 2017, there is growing optimism amongst market participants that U.S. growth and inflation will accelerate as the incoming Trump Administration attempts to implement a number of fiscal stimulus measures including infrastructure investment, tax cuts, de-regulation and the repatriation of foreign earnings held abroad. At the same time the U.S. Federal Reserve Board is likely to take additional steps towards normalizing interest rates while the European Central Bank and Bank of England take additional steps towards unwinding their quantitative easing programs. For the first time in years, markets are likely to continue to experience rising headline inflation across most developed market Consumer Price Indexes (CPI) in the coming quarters due in part to favorable base effects from the Energy sector that already existed prior to an OPEC and non-OPEC agreement to curb crude oil production. While central banks are likely to initially dismiss this rising inflation as “transitory” with more time needed to judge its sustainability, a faster rate of policy removal may occur should realized inflation start to prove stronger than that assumed in forward projections. Even though U.S. growth and inflation were showing signs of acceleration in Q3 and the early parts of Q4, 2016, financial markets have currently priced a very optimistic view of stronger U.S. growth due to fiscal stimulus expectations. Should the incoming administration not deliver as quickly on some or all of these growth measures at the same time the markets are experiencing faster inflation and less accommodative global central bank policy, interest rate and risk markets may experience a period of price discovery. Investment strategies that are able to remain flexible in anticipation of a potential increase in volatility associated with these unknowns are likely to be favored in this environment. 
|
30
Sentinel Low Duration Bond Fund
Performance Notes (Unaudited)
Graph and total return data assumes reinvestment of all distributions. Fund performance in the graphs and table reflects expenses and management fees but does not reflect the effect of any taxes on fund distributions or redemptions. Growth of Class A shares in the graph reflects the 1% maximum sales charge. Index performance does not reflect any sales charges, fees or expenses. Data shown represents past performance; past performance does not guarantee future results; current performance may be higher or lower than that shown. Investment return and principal value will vary so that you may have a gain or loss when you sell shares. Before investing, carefully consider a fund’s objectives, risks, charges and expenses. Summary and full prospectuses containing this and other information are available from sentinelinvestments.com. Please read them carefully. Visit www.sentinelinvestments.com for the most current month-end performance information.
Growth of a $10,000 Investment (Class A shares and Class S shares)
November 30, 2006 – November 30, 2016

Growth of a $1,000,000 Investment (Class I shares)
November 30, 2006 – November 30, 2016
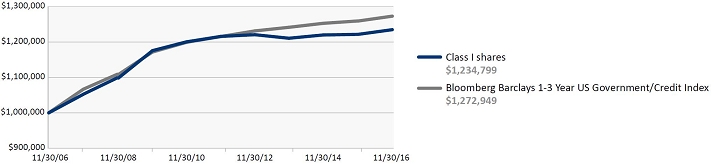
Average Annual Total Returns (as of November 30, 2016)
| | | Class A shares | | Class S shares | | Class I shares | | | | |
| | | Without | | With 1% | | No | | No | | | | |
| | | Sales Charge | | Sales Charge | | Sales Charge | | Sales Charge | | Class | | Symbol |
| 1 year | | 0.58 | % | | -0.47 | % | | 0.54 | % | | 1.08 | % | | A | | SSIGX |
| 3 years | | 0.33 | | | -0.01 | | | 0.26 | | | 0.66 | | | S | | SSSGX |
| 5 years | | 0.11 | | | -0.08 | | | -0.06 | | | 0.31 | | | I | | SSBDX |
| 10 years | | 2.03 | | | 1.93 | | | 1.71 | | | 2.13 | | | | | |
Inception Date of the Fund – 3/27/95
On January 31, 2014 the Sentinel Short Maturity Government Fund was renamed the Sentinel Low Duration Bond Fund and the Fund’s investment strategies changed. In addition, the Fund adopted the Bloomberg Barclays 1-3 Year US Government/Credit Index as its new benchmark and discontinued the use of a secondary benchmark. Performance prior to January 31, 2014 relate to the Fund’s prior investment strategies.
Performance of the Class A shares prior to June 1, 2006, has not been adjusted to reflect the decrease in the maximum 12b-1 fee from 0.35% to 0.25%. If it had, those returns would be higher. The Class A returns are based on the 1% maximum sales charge and are not adjusted to reflect a maximum sales charge of 3% in effect from June 1, 2006 to December 31, 2008. If they were, the returns would be lower. Performance of the Class S shares prior to January 31, 2014 has not been adjusted to reflect the decrease in the maximum 12b-1 fee from 0.75% to 0.50%. If it had, those returns would be higher, except for the period from April 1, 2013 to January 30, 2014 during which a voluntary waiver of 0.25% of those fees was in effect. Performance of the Class I shares prior to their inception on January 31, 2014 is based on the performance of the Fund’s Class A shares, restated to reflect that Class I shares are not subject to a sales charge. Only eligible investors may purchase Class I shares, as described in the prospectus.
The following are total annual operating expense ratios for Sentinel Low Duration Bond Fund Class A, S & I shares: A – 0.95%, S – 1.07%, I – 0.61%. Expense ratio data is sourced from the Fund’s most recent prospectus.
Fixed income securities are subject to credit and interest rate risk. Bond values will generally decrease when interest rates rise and will generally increase when interest rates fall. Bonds with lower credit ratings are more speculative and likely to default than higher-quality bonds and tend to fluctuate more widely in value. A fund’s investments in mortgage-backed securities are subject to prepayment risks. These risks may result in greater share price volatility. International securities are subject to political influences, currency fluctuations and economic cycles that may be unrelated to those affecting the domestic financial markets and may experience wider price fluctuations than U.S. domestic securities. Fund shares are not insured or guaranteed by the U.S. government or its agencies.
The Fund may use derivatives, which are financial contracts whose value depends upon or is derived from the value of an underlying asset, reference rate, or index. The Fund may use derivatives as part of a strategy designed to reduce exposure to certain risks, such as risks associated with changes in interest rates, or currency or credit risk (“hedging”). The use of derivatives may reduce the Fund’s return and increase the volatility in movements in the Fund’s net asset value. For additional information regarding the use of derivatives, please see the Fund’s current Prospectus.
A CDSC of up to 0.50% may apply to investments of $1,000,000 or more in Class A shares which are redeemed within 12 months. See the Prospectus.
The Bloomberg Barclays 1-3 Year U.S. Government/Credit Index is an unmanaged index of U.S. government, government agency and investment grade corporate securities with maturities of one to three years. An investment cannot be made directly in an index.
31
Sentinel Low Duration Bond Fund
Fund Profile
at November 30, 2016
| Average Effective Duration (Unaudited) |
| | |
| | Percent of |
| Duration | Fixed Income Holdings |
| Less than 1 yr. | 43.9% |
| 1 yr. to 2.99 yrs. | 31.5% |
| 3 yrs. to 3.99 yrs. | 8.3% |
| | |
| | |
| Percent of |
| Duration | Fixed Income Holdings |
| 4 yrs. to 5.99 yrs. | 9.8% |
| 6 yrs. to 7.99 yrs. | 0.5% |
| 8 yrs. and over | 6.0% |
Average Effective Duration (for all Fixed Income Holdings) 1.8 years*
| Top 10 Holdings** | | | | | | |
| | | | | | | |
| | | | | Maturity | | Percent of |
| Description | | Coupon | | Date | | Net Assets |
| SPDR Barclays Intermediate Term Corporate Bond ETF | | | | | | 8.7% |
| FHR 4022 AH | | 1.50% | | 12/15/25 | | 8.1% |
SPDR Barclays Short Term
Corporate Bond ETF | | | | | | 8.0% |
| iShares iBoxx $ Investment Grade Corporate Bond ETF | | | | | | 6.1% |
| | | | | | | |
| | | | | | | |
| | | | | Maturity | | Percent of |
| Description | | Coupon | | Date | | Net Assets |
| FNR 10-64 AD | | 3.00% | | 12/25/20 | | 5.2% |
| FHR 4039 PB | | 1.50% | | 05/15/27 | | 4.4% |
| FHR 4238 TL | | 1.25% | | 08/15/27 | | 2.2% |
| Bear Stearns Trust FLT | | 3.110% | | 06/25/34 | | 2.0% |
| FNR 11-15 HC | | 2.50% | | 03/25/26 | | 1.8% |
| WBCMT 2007 C30 A5 | | 5.342% | | 12/15/43 | | 1.7% |
| Total of Net Assets | | | | | | 48.2% |
*The average effective duration considers the call and put dates of applicable fixed income investments and the pre-payment risks of mortgage-backed bonds to measure the sensitivity of the value of the Fund’s portfolio to changes in interest rates.
** “Top 10 Holdings” excludes any short-term investments and money market funds. Portfolio composition and holdings are subject to change. More complete holdings follow.
Schedule of Investments
at November 30, 2016
| | | Principal | | | | |
| | | Amount | | | Value | |
| | | (M=$1,000) | | | (Note 2) | |
| U.S. Government Obligations 63.1% |
| U.S. Government Agency Obligations 48.9% |
| Federal Home Loan Bank 24.2% |
| Agency Discount Notes: | | | | | |
| 0.1%, 12/01/16 | | | 85,000 M | | | $ | 85,000,000 | |
| Federal Home Loan Mortgage Corporation 15.7% | | | | | |
| Collateralized Mortgage Obligations: | | | | | |
FHR 3874 BD
3%, 06/15/21 | | | 2,743 M | | | | 2,797,031 | |
FHR 4022 AH
1.5%, 12/15/25 | | | 29,044 M | | | | 28,613,143 | |
FHR 4039 PB
1.5%, 05/15/27 | | | 15,708 M | | | | 15,364,861 | |
FHR 4238 TL
1.25%, 08/15/27 | | | 7,847 M | | | | 7,648,377 | |
FHR 2927 ED
4%, 01/15/35 | | | 203 M | | | | 206,131 | |
| | | | | | | | 54,629,543 | |
| Mortgage-Backed Securities: |
| 15-Year: | | | | | | | | |
FHLMC E88357
6.5%, 03/01/17 | | | 2 M | | | | 2,492 | |
FHLMC J05907
6%, 08/01/19 | | | 500 M | | | | 514,288 | |
| | | | | | | | 516,780 | |
| | | Principal | | | | |
| | | Amount | | | Value | |
| | | (M=$1,000) | | | (Note 2) | |
| 20-Year: | | | | | | | | |
FHLMC D94230
7.5%, 10/01/19 | | | 2 M | | | $ | 2,289 | |
| 30-Year: | | | | | | | | |
FHLMC G00100
8%, 02/01/23 | | | 3 M | | | | 3,273 | |
Total Federal Home Loan
Mortgage Corporation | | | | 55,151,885 | |
| Federal National Mortgage Association 8.9% |
| Collateralized Mortgage Obligations: | | | | | |
FNR 10-64 AD
3%, 12/25/20 | | | 17,891 M | | | | 18,200,458 | |
FNR 11-67 DA
4.5%, 07/25/21 | | | 4,911 M | | | | 5,057,894 | |
FNR 12-47 AI
3%, 05/25/22 | | | 5,126 M | | | | 266,220 | |
FNR 11-15 HC
2.5%, 03/25/26 | | | 6,075 M | | | | 6,131,533 | |
FNR 09-32 BH
5.25%, 05/25/39 | | | 1,011 M | | | | 1,077,893 | |
| | | | | | | | 30,733,998 | |
| Mortgage-Backed Securities: | | | | | |
| 15-Year: | | | | | | | | |
FNMA 671380
6%, 11/01/17 | | | 4 M | | | | 3,685 | |
FNMA 725284
7%, 11/01/18 | | | 9 M | | | | 8,972 | |
| | | Principal | | | | | |
| | | Amount | | | Value | |
| | | (M=$1,000) | | | (Note 2) | |
FNMA 985670
6.5%, 10/01/21 | | | 367 M | | | $ | 389,440 | |
| | | | | | | | 402,097 | |
| 30-Year: | | | | | | | | |
FNMA 626664
6%, 04/01/17 | | | 10 M | | | | 10,146 | |
FNMA 207530
8.25%, 04/01/22 | | | 6 M | | | | 6,258 | |
FNMA 175123
7.45%, 08/01/22 | | | 77 M | | | | 81,132 | |
| | | | | | | | 97,536 | |
| Total Federal National Mortgage Association | | | | 31,233,631 | |
| Government National Mortgage Corporation 0.1% |
| Mortgage-Backed Securities: | | | | | |
| 20-Year: | | | | | | | | |
GNMA 628440
7%, 04/15/24 | | | 59 M | | | | 60,453 | |
| Total U.S. Government Agency Obligations | | | | 171,445,969 | |
| U.S. Treasury Obligations 14.2% | | | | | |
U.S. Treasury Bill
0.155%, 12/01/16 | | | 50,000 M | | | | 50,000,000 | |
Total U.S. Government Obligations
(Cost $222,231,112) | | | | 221,445,969 | |
The accompanying notes are an integral part of the financial statements.
32
Sentinel Low Duration Bond Fund
| | | Principal | | | | |
| | | Amount | | | Value | |
| | | (M=$1,000) | | | (Note 2) | |
| Domestic Corporate Bonds 4.8% | | | | | |
| Communications 1.9% | | | | | |
American Tower Corp.
4.5%, 01/15/18 | | | 3,750 M | | | $ | 3,856,305 | |
AT&T, Inc.
3.8%, 03/15/22 | | | 2,708 M | | | | 2,762,989 | |
| | | | | | | | 6,619,294 | |
| Consumer Cyclical 2.4% | | | | | |
Ford Motor Credit Co LLC
5%, 05/15/18 | | | 3,500 M | | | | 3,640,518 | |
| General Motors Financial Co., Inc. | | | | | | | | |
| 6.75%, 06/01/18 | | | 3,000 M | | | | 3,195,588 | |
| 3.2%, 07/06/21 | | | 1,450 M | | | | 1,432,525 | |
| | | | | | | | 8,268,631 | |
| Financials 0.5% | | | | | |
Brookfield Asset Management, Inc.
4%, 01/15/25 | | | 1,935 M | | | | 1,886,766 | |
Total Domestic Corporate Bonds
(Cost $16,793,661) | | | | 16,774,691 | |
| Asset Backed Securities 0.4% | | | | | |
Taco Bell Funding, LLC
3.832%, 05/25/26(a)
(Cost $1,596,000) | | | 1,596 M | | | | 1,608,340 | |
| Bank Loans 0.5% | | | | | |
| Technology 0.5% | | | | | |
Micron Technology, Inc.
6.8579%, 04/26/22(b)
(Cost $1,767,306) | | | 1,771 M | | | | 1,789,224 | |
| Commercial Mortgage-Backed Securities 1.7% |
| Financials 1.7% | | | | | |
WBCMT 2007 C30 A5
5.342%, 12/15/43
(Cost $6,517,666) | | | 5,920 M | | | | 5,922,565 | |
| Residential Mortgage-Backed Securities 4.2% |
| Financials 4.2% | | | | | |
Bear Stearns Trust FLT
3.1103%, 06/25/34 | | | 6,841 M | | | | 6,903,767 | |
BOAMS 2004 5 3A1
4.5%, 06/25/19 | | | 2,130 M | | | | 2,134,955 | |
GSR 2003 13 1A1
2.8703%, 10/25/33 | | | 5,684 M | | | | 5,728,160 | |
Total Residential Mortgage-Backed Securities
(Cost $14,813,339) | | | | 14,766,882 | |
| | | | | | | | | |
| | | | | | | Value | |
| | | Shares | | | (Note 2) | |
| Domestic Exchange Traded Funds 23.2% | |
| Bond Funds 23.2% | | | | | |
| iShares 0-5 Year High Yield Corporate Bond ETF | | | 33,400 | | | | 1,567,796 | |
| iShares iBoxx $ Investment Grade Corporate Bond ETF | | | 183,598 | | | | 21,451,590 | |
| SPDR Barclays Intermediate Term Corporate Bond ETF | | | 900,863 | | | | 30,557,273 | |
| | | | | | | |
| | | | | | Value | |
| | | Shares | | | (Note 2) | |
| SPDR Barclays Short Term Corporate Bond ETF | | | 916,585 | | | $ | 27,992,506 | |
Total Domestic Exchange Traded Funds
(Cost $80,892,750) | | | | 81,569,165 | |
| Institutional Money Market Funds 3.0% | | |
| State Street Institutional U.S. Government Money Market Fund | | | | | |
Premier Class
(Cost $10,548,807) | | | 10,548,807 | | | | 10,548,807 | |
Total Investments 100.9%
(Cost $355,160,641)† | | | | | | | 354,425,643 | |
| | | | | | | | | |
| Excess of Liabilities Over Other Assets (0.9)% | | | | (3,323,346 | ) |
| | | | | | | | | |
| Net Assets 100.0% | | | $ | 351,102,297 | |
| † | Cost for federal income tax purposes is $355,162,668. At November 30, 2016 unrealized depreciation for federal income tax purposes aggregated $737,025 of which $1,258,089 related to appreciated securities and $1,995,114 related to depreciated securities. |
| | |
| (a) | Security exempt from registration under Rule 144A of the Securities Act of 1933, as amended. These securities may be resold in transactions exempt from registration, normally to qualified institutional buyers. At November 30, 2016, the market value of rule 144A securities amounted to $1,608,340 or 0.46% of net assets. |
| | |
| (b) | Micron Technologies, Inc. has a variable interest rate that floats quarterly in January, April, July, and October. The interest rate is based on the 3-month Libor rate plus 6.00%. |
| | |
| SPDR | - Standard & Poor’s Depository Receipts |
The accompanying notes are an integral part of the financial statements.
33
Sentinel Multi-Asset Income Fund
(Unaudited)

Jason Doiron, FRM, PRM Portfolio Manager | Performance Highlights For the fiscal year ending November 30, 2016, the Sentinel Multi-Asset Income Fund’s Class I shares returned 5.22%. This compares to the Standard & Poor’s 500 Index which returned 8.06%, the Bloomberg Barclays U.S. Aggregate Bond Index return of 2.17%, and a 3.86% return for the Morningstar Allocation - 30% to 50% Equity (previously Conservative Allocation) peer group average in the same time period. Bond Market Review Following a period of election and central bank induced volatility in financial markets early in Q4 2016, risk assets recovered significantly in anticipation of material fiscal stimulus following the surprise victory for President-Elect Trump. As the calendar moved past the election market, participants celebrated accelerating Global Purchasing Managers’ Indexes (PMIs), a strong pick-up in U.S. growth and an OPEC/non-OPEC agreement to cut crude oil production. Higher readings for inflation and less accommodative talk from global central banks such as the U.S. Federal Reserve Bank, European Central Bank and the Bank of England were more than offset by the prospect for stronger global and U.S. growth in the future and did not lead to the market jitters experienced in Q3 2016. The Bloomberg Barclays U.S. Corporate High Yield Index ended the month of November 25 basis points (bps) tighter from its Q3 close while the S&P 500 rose more than 1.4%. U.S. Treasury securities moved significantly higher in yield in the first two months of Q4 2016 with the 10-year U.S. Treasury yield rising 79 bps to 2.38% from 1.59%. Realized inflation began to accelerate globally while the surprise victory for President-Elect Trump saw markets anticipate a significant increase in fiscal stimulus. Inflation expectations accelerated in the U.S. with 5-year inflation break even rising 32 bps by the end of November from 1.48% to 1.80%. The 30-year U.S. Treasury yield slightly underperformed the 5-year U.S. Treasury yield by 3 bps at the end of November from the start of the quarter, as the market weighed the potential for greater fiscal stimulus, inflation and long-end treasury issuance versus a potentially faster pace of U.S. Federal Reserve Bank interest rate increases. Relative to developed global markets, U.S. Treasury security and spread products continued to offer a superior yield advantage, resulting in them being particularly attractive to foreign and global investors. Key Performance Attribution The Multi-Asset Income Fund Class I shares returned 5.22% during the 12 months ending November 30, 2016 outperforming its internal benchmark by 49 bps. During the year, the yield on the 10-year U.S. Treasury rose 20 bps to 1.84% from 1.64%, while the Fund was, on average, long duration* vs. the benchmark by 0.27 years. The Fund’s long duration position resulted in 13 bps of underperformance vs. the benchmark. Risk assets performed quite well during the year with the Option Adjusted Spread (OAS) on the Bloomberg Barclays U.S. Corporate Index tightening by 26 bps, and the OAS on the Bloomberg Barclays U.S. Corporate High Yield Index tightening by 148 bps. In addition, the S&P 500 Index returned 8.06% during the year. While the Fund was underweight equities relative to its internal benchmark, during a year when equities outperformed, any negative performance associated with that call was offset by the Fund’s overweight to high yield corporate bonds relative to |
| * | Effective duration is a measure of the sensitivity of a bond’s price to changes in interest rates. The shorter (longer) the duration, the lower (higher) the interest rate risk and price volatility. |
The Standard & Poor’s 500 Index is an unmanaged index of approximately 500 widely held U.S. equity securities chosen for market size, liquidity, and industry group representation.
The Bloomberg Barclays U.S. Aggregate Bond Index is an unmanaged index of the U.S. investment grade fixed-rate bond market, with components for government and corporate securities, mortgage pass-through securities, and asset-backed securities.
The Bloomberg Barclays U.S. Corporate High Yield Index is an unmanaged index of U.S. dollar-denominated, non-investment grade, fixed-rate, taxable corporate bonds. Securities are classified as high yield if the middle rating of Moody’s, Fitch, and S&P is Ba1/BB+/BB+ or below, excluding emerging market debt.
The Bloomberg Barclays U.S. Corporate Index (Investment Grade) is a broad-based benchmark that measures the investment grade, U.S. dollar-dominated fixed-rate, taxable corporate bond market. It includes USD-denominated securities publicly issued by U.S. and non-U.S. industrial, utility, and financial issuers that meet specified maturity, liquidity, and quality requirements.
The internal benchmark consists of 60% Bloomberg Barclays U.S. Aggregate Bond Index and 40% Standard & Poor’s 500 Index.
An investment cannot be made directly in an index.
The return for the Morningstar category is an average of funds within the particular category as determined by Morningstar based on investment styles as measured by their underlying portfolio holdings.
34
Sentinel Multi-Asset Income Fund
| | other fixed income asset classes. Largely due to the strong performance of risk assets, the Fund’s asset allocation call contributed 246 bps to outperformance, with 485 bps coming from a 35.6% average overweight to high yield credit. In addition the Fund’s underweight to U.S. Treasury securities, as well as positioning within the Agency Mortgage Backed Securities (MBS) portfolio led to positive asset allocation effects. Security selection within both investment grade and high yield credit was negative, resulting in 17 and 34 bps of underperformance respectively. Finally, security selection within the Fund’s domestic equity portfolio resulted in 4 bps of underperformance. During the fiscal year, the Fund’s usage of U.S. Treasury Futures resulted in 3 basis points of underperformance relative to the Fund’s internal benchmark. Of the underperformance, 2 basis points was due to the impact of the trades on the Fund’s effective duration, while 8 basis points was due to asset allocation effects. These results were partially offset by 7 basis points of outperformance resulting from the impact of intra-day price moves on days where a trade occurred. In addition, the Fund utilized Standard & Poor’s 500 Index Futures at various points during the year. Overall, the Fund’s utilization of Standard & Poor’s 500 Index Futures resulted in 2 basis points of outperformance relative to the Fund’s internal benchmark. Portfolio Positioning and Outlook Looking ahead into Q1 2017, there is growing optimism amongst market participants that U.S. growth and inflation will accelerate as the incoming Trump Administration attempts to implement a number of fiscal stimulus measures including infrastructure investment, tax cuts, de-regulation and the repatriation of foreign earnings held abroad. At the same time the U.S. Federal Reserve Board is likely to take additional steps towards normalizing interest rates while the European Central Bank and Bank of England take additional steps towards unwinding their quantitative easing programs. For the first time in years, markets are likely to continue to experience rising headline inflation across most developed market Consumer Price Indexes (CPI) in the coming quarters due in part to favorable base effects from the Energy sector that already existed prior to an OPEC and non-OPEC agreement to curb crude oil production. While central banks are likely to initially dismiss this rising inflation as “transitory” with more time needed to judge its sustainability, a faster rate of policy removal may occur should realized inflation start to prove stronger than that assumed in forward projections. Even though U.S. growth and inflation were showing signs of acceleration in Q3 and the early parts of Q4, 2016, financial markets have currently priced a very optimistic view of stronger U.S. growth due to fiscal stimulus expectations. Should the incoming administration not deliver as quickly on some or all of these growth measures at the same time the markets are experiencing faster inflation and less accommodative global central bank policy, interest rate and risk markets may experience a period of price discovery. Investment strategies that are able to remain flexible in anticipation of a potential increase in volatility associated with these unknowns are likely to be favored in this environment. 
|
35
Sentinel Multi-Asset Income Fund
Performance Notes (Unaudited)
Graph and total return data assumes reinvestment of all distributions. Fund performance in the graphs and table reflects expenses and management fees but does not reflect the effect of any taxes on fund distributions or redemptions. Growth of Class A shares in the graph reflects the 5% maximum sales charge. Growth of Class C shares in the graph does not reflect the 1% contingent deferred sales charge (CDSC) applicable to redemptions within the first year, because none would apply if the shares were held for the full period. Index performance does not reflect any sales charges, fees or expenses. Data shown represents past performance; past performance does not guarantee future results; current performance may be higher or lower than that shown. Investment return and principal value will vary so that you may have a gain or loss when you sell shares. Before investing, carefully consider a fund’s objectives, risks, charges and expenses. Summary and full prospectuses containing this and other information are available from sentinelinvestments.com. Please read them carefully. Visit www.sentinelinvestments.com for the most current month-end performance information.
Growth of a $10,000 Investment (Class A shares and Class C shares)
November 30, 2006 – November 30, 2016
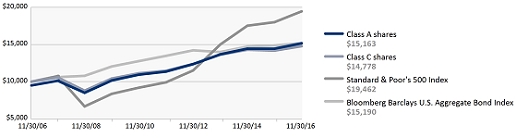
Growth of a $1,000,000 Investment (Class I shares)
November 30, 2006 – November 30, 2016
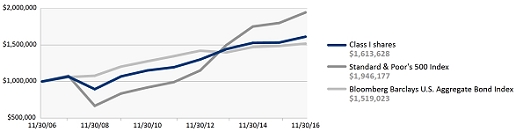
Average Annual Total Returns (as of November 30, 2016)
| | Class A shares | Class C shares | Class I shares | | | |
| | Without | With 5% | Without | With 1% | No | | | |
| | Sales Charge | Sales Charge | CDSC | CDSC | Sales Charge | | Class | Symbol |
| 1 year | 4.99% | -0.24% | 4.26% | 3.31% | 5.22% | | A | SECMX |
| 3 years | 3.51 | 1.75 | 2.74 | 2.74 | 3.76 | | C | SMKCX |
| 5 years | 5.95 | 4.86 | 5.20 | 5.20 | 6.19 | | I | SCSIX |
| 10 years | 4.79 | 4.25 | 3.98 | 3.98 | 4.90 | | | |
| Inception Date of the Fund – 3/10/03 |
Performance of the Class A shares prior to June 30, 2012 has not been adjusted to reflect the decrease in the maximum 12b-1 fee from 0.30% to 0.25%. If it had, those returns would be higher. Performance of the Class I shares prior to their inception on December 17, 2010 is based on the performance of the Fund’s Class A shares, restated to reflect that Class I shares are not subject to a sales charge. Only eligible investors may purchase Class I shares, as described in the Prospectus.
The following are total annual operating expense ratios for Sentinel Multi-Asset Income Fund Class A, C & I shares: A – 1.07%, C – 1.80%, I – 0.80%. Expense ratio data is sourced from the Fund’s most recent prospectus.
International securities are subject to political influences, currency fluctuations and economic cycles that may be unrelated to those affecting the domestic financial markets and may experience wider price fluctuations than U.S. domestic securities. Fixed income securities are subject to credit and interest rate risk. Bond values will generally decrease when interest rates rise and will generally increase when interest rates fall. Bonds with lower credit ratings are more speculative and likely to default than higher quality bonds and tend to fluctuate more widely in value. A fund’s investments in mortgage-backed securities are subject to prepayment risks. These risks may result in greater share price volatility. Convertible securities are subject to the risks associated with both fixed income securities and common stocks. Small and mid-sized company stocks can be more volatile than large company stocks. Large company stocks as a group could fall out of favor with the market and underperform investments that focus on small and mid-sized company stocks. Fund shares are not insured or guaranteed by the U.S. Government or its agencies.
The Fund may use derivatives, which are financial contracts whose value depends upon or is derived from the value of an underlying asset, reference rate, or index. The Fund may use derivatives as part of a strategy designed to reduce exposure to certain risks, such as risks associated with changes in interest rates, or currency or credit risk (“hedging”). The use of derivatives may reduce the Fund’s return and increase the volatility in movements in the Fund’s net asset value. For additional information regarding the use of derivatives, please see the Fund’s current Prospectus.
A CDSC of up to 1% may apply to investments of $1,000,000 or more in Class A shares which are redeemed within 12 months. See the Prospectus.
The Standard & Poor’s 500 Index is an unmanaged index of approximately 500 widely held U.S. equity securities chosen for market size, liquidity, and industry group representation.
The Bloomberg Barclays U.S. Aggregate Bond Index is an unmanaged index of the U.S. investment grade fixed-rate bond market, with components for government and corporate securities, mortgage pass-through securities, and asset-backed securities.
An investment cannot be made directly in an index.
36
Sentinel Multi-Asset Income Fund
Fund Profile
at November 30, 2016
Portfolio Weightings
| Asset Category | Percent of Net Assets |
| Domestic Exchange Traded Funds | 64.3% |
| U.S. Government Obligations | 27.6% |
| Domestic Corporate Bonds | 6.4% |
| Bank Loans | 0.7% |
| Asset Backed Securities | 0.1% |
| Cash and Other | 0.9% |
Top Equity Holdings*
| | |
| Description | Percent of Net Assets |
| iShares iBoxx $ Investment Grade Corporate Bond ETF | 20.5% |
| SPDR Barclays Short Term High Yield Bond ETF | 16.5% |
| iShares High Dividend ETF | 12.0% |
| SPDR Barclays Intermediate Term Corporate Bond ETF | 10.1% |
| iShares Int’l. Select Dividend ETF | 4.0% |
| iShares 0-5 Year High Yield Corporate Bond ETF | 1.2% |
| SPDR Barclays Short Term Corporate Bond ETF | 0.0%^ |
| Total of Net Assets | 64.3% |
Top 10 Fixed Income Holdings*
| | | Maturity | Percent of |
| Description | Coupon | Date | Net Assets |
| FHLMC Q41208 | 3.50% | 06/01/46 | 1.5% |
| FNMA TBA 30 YR Dec | 3.00% | 12/13/46 | 1.4% |
| FNMA BC4492 | 4.50% | 12/01/39 | 1.1% |
| FNMA AS7601 | 4.00% | 07/01/46 | 0.9% |
| FNMA TBA 15 YR Dec | 2.50% | 12/16/31 | 0.8% |
| AT&T, Inc. | 3.80% | 03/15/22 | 0.5% |
| Ingram Micro, Inc. | 4.95% | 12/15/24 | 0.5% |
| CSC Holdings LLC | 10.875% | 10/15/25 | 0.5% |
| Express Scripts Holding Co. | 3.40% | 03/01/27 | 0.5% |
| Retail Opportunity Investments Partnership LP | 5.00% | 12/15/23 | 0.5% |
| Total of Net Assets | | | 8.2% |
Average Effective Duration (for all Fixed Income Holdings) 3.4 years**(Unaudited)
*“Top Equity Holdings” and “Top 10 Fixed Income Holdings” excludes any short-term investments and money market funds. Portfolio composition and holdings are subject to change. More complete holdings follow.
**The average effective duration considers the call and put dates of applicable fixed income investments and the pre-payment risks of mortgage-backed bonds to measure the sensitivity of the value of the Fund’s portfolio to changes in interest rates.
Schedule of Investments
at November 30, 2016
| | | Principal | | | |
| | | Amount | | Value | |
| | | (M=$1,000) | | (Note 2) | |
| U.S. Government Obligations 27.6% |
| U.S. Government Agency Obligations 17.7% |
| Federal Home Loan Bank 11.9% |
| Agency Discount Notes: | | | | | | |
| 0.1%, 12/01/16 | | 36,000 M | | $ | 36,000,000 | |
| Federal Home Loan Mortgage Corporation 1.5% |
| Mortgage-Backed Securities: | | | | | | |
| 30-Year: | | | | | | |
FHLMC Q41208
3.5%, 06/01/46 | | 4,218 M | | | 4,329,409 | |
| Federal National Mortgage Association 4.2% |
| Mortgage-Backed Securities: | | | | | | |
| 15-Year: | | | | | | |
FNMA TBA 15 YR Dec
2.5%, 12/16/31(a) | | 2,500 M | | | 2,508,692 | |
| | | Principal | | | |
| | | Amount | | Value | |
| | | (M=$1,000) | | (Note 2) | |
| 30-Year: | | | | | | |
FNMA BC4492
4.5%, 12/01/39 | | 2,962 M | | $ | 3,193,962 | |
FNMA AS7601
4%, 07/01/46 | | 2,661 M | | | 2,800,693 | |
FNMA TBA 30 YR Dec
3%, 12/13/46(a) | | 4,300 M | | | 4,277,156 | |
| | | | | | 10,271,811 | |
| Total Federal National Mortgage Association | | | | | 12,780,503 | |
| Government National Mortgage Corporation 0.1% |
| Collateralized Mortgage Obligations: | | | | | | |
GNR 12-147 Interest Only
0.584%, 04/16/54 | | 8,950 M | | | 352,907 | |
| Total U.S. Government Agency Obligations | | | | | 53,462,819 | |
| | | Principal | | | |
| | | Amount | | Value | |
| | | (M=$1,000) | | (Note 2) | |
| U.S. Treasury Obligations 9.9% |
U.S. Treasury Bill
0.155%, 12/01/16 | | 30,000 M | | $ | 30,000,000 | |
Total U.S. Government Obligations
(Cost $83,847,108) | | | | | 83,462,819 | |
| Domestic Corporate Bonds 6.4% |
| Basic Industry 0.5% | | | | | | |
CF Industries, Inc.
4.95%, 06/01/43 | | 1,780 M | | | 1,410,650 | |
| Capital Goods 0.2% | | | | | | |
LafargeHolcim Finance US LLC
3.5%, 09/22/26(b) | | 775 M | | | 752,137 | |
| Communications 1.5% | | | | | | |
AMC Networks, Inc.
5%, 04/01/24 | | 735 M | | | 736,838 | |
AT&T, Inc.
3.8%, 03/15/22 | | 1,592 M | | | 1,624,327 | |
The accompanying notes are an integral part of the financial statements.
37
Sentinel Multi-Asset Income Fund
| | | Principal | | | |
| | | Amount | | Value | |
| | | (M=$1,000) | | (Note 2) | |
CSC Holdings LLC
10.875%, 10/15/25(b) | | 1,300 M | | $ | 1,514,500 | |
GCI, Inc.
6.875%, 04/15/25 | | 742 M | | | 740,145 | |
| | | | | | 4,615,810 | |
| Consumer Cyclical 0.8% | | | | | | |
General Motors Financial Co., Inc.
3.2%, 07/06/21 | | 1,100 M | | | 1,086,743 | |
QVC, Inc.
5.45%, 08/15/34 | | 1,535 M | | | 1,345,449 | |
| | | | | | 2,432,192 | |
| Consumer Non-Cyclical 1.0% |
Cardinal Health, Inc.
4.9%, 09/15/45 | | 1,370 M | | | 1,437,054 | |
Express Scripts Holding Co.
3.4%, 03/01/27 | | 1,560 M | | | 1,475,843 | |
| | | | | | 2,912,897 | |
| Energy 0.1% | | | | | | |
Westmoreland Coal Co.
8.75%, 01/01/22(b) | | 325 M | | | 277,063 | |
| Financials 0.6% | | | | | | |
Brookfield Asset Management, Inc.
4%, 01/15/25 | | 1,405 M | | | 1,369,978 | |
Citizens Financial Group, Inc.
4.3%, 12/03/25 | | 582 M | | | 587,792 | |
| | | | | | 1,957,770 | |
| Insurance 0.5% | | | | | | |
Kemper Corp.
4.35%, 02/15/25 | | 427 M | | | 422,622 | |
Manulife Financial Corp.
4.15%, 03/04/26 | | 1,045 M | | | 1,091,762 | |
| | | | | | 1,514,384 | |
| Real Estate 0.5% | | | | | | |
Retail Opportunity Investments Partnership LP
5%, 12/15/23 | | 1,400 M | | | 1,437,453 | |
| Technology 0.7% | | | | | | |
Diamond 1 Finance Corp / Diamond 2 Finance Corp.
7.125%, 06/15/24(b) | | 650 M | | | 709,665 | |
Ingram Micro, Inc.
4.95%, 12/15/24 | | 1,550 M | | | 1,521,298 | |
| | | | | | 2,230,963 | |
Total Domestic Corporate Bonds
(Cost $20,191,951) | | | | | 19,541,319 | |
| Asset Backed Securities 0.1% |
Taco Bell Funding, LLC
3.832%, 05/25/26(b)
(Cost $299,250) | | 299 M | | | 301,564 | |
| Bank Loans 0.7% | | | | | | |
| Energy 0.3% | | | | | | |
Westmoreland Coal Co.
7.3357%, 12/16/20(c) | | 920 M | | | 786,891 | |
| Technology 0.4% | | | | | | |
Micron Technology, Inc.
6.8579%, 04/26/22(d) | | 1,272 M | | | 1,285,217 | |
Total Bank Loans
(Cost $1,937,399) | | | | | 2,072,108 | |
| | | | | | | |
| | | | | | Value | |
| | | Shares | | | (Note 2) | |
| Domestic Exchange Traded Funds 64.3% |
| Bond Funds 48.3% | | | | | | | | |
| iShares 0-5 Year High Yield Corporate Bond ETF | | | 74,000 | | | $ | 3,473,560 | |
| iShares iBoxx $ Investment Grade Corporate Bond ETF | | | 530,431 | | | | 61,975,558 | |
| SPDR Barclays Intermediate Term Corporate Bond ETF(e) | | | 899,607 | | | | 30,514,669 | |
| SPDR Barclays Short Term Corporate Bond ETF | | | 1,902 | | | | 58,087 | |
| SPDR Barclays Short Term High Yield Bond ETF | | | 1,817,500 | | | | 49,944,900 | |
| | | | | | | | 145,966,774 | |
| Equity Funds 16.0% | | | | | | | | |
| iShares High Dividend ETF(e) | | | 450,547 | | | | 36,183,430 | |
| iShares Int’l. Select Dividend ETF(e) | | | 423,400 | | | | 12,189,686 | |
| | | | | | | | 48,373,116 | |
Total Domestic Exchange Traded Funds
(Cost $194,467,419) | | | | | | | 194,339,890 | |
| Institutional Money Market Funds 6.8% |
| State Street Institutional U.S. Government Money Market Fund | | | | | | | | |
Premier Class
(Cost $20,766,463) | | | 20,766,463 | | | | 20,766,463 | |
Total Investments 105.9%
(Cost $321,509,590)† | | | | 320,484,163 | |
| | | | | | | | | |
| Excess of Liabilities Over Other Assets (5.9)% | | | | (17,823,729) | |
| | | | | | | | | |
| Net Assets 100.0% | | | | | | $ | 302,660,434 | |
| | |
| | |
| | |
| † | Cost for federal income tax purposes is $321,553,361. At November 30, 2016 unrealized depreciation for federal income tax purposes aggregated $1,069,198 of which $3,909,781 related to appreciated securities and $4,978,979 related to depreciated securities. |
| (a) | The actual mortgage-backed security that will be delivered is not designated until 48 hours prior to the established trade settlement date with the broker. |
| (b) | Security exempt from registration under Rule 144A of the Securities Act of 1933, as amended. These securities may be resold in transactions exempt from registration, normally to qualified institutional buyers. At November 30, 2016, the market value of rule 144A securities amounted to $3,554,929 or 1.17% of net assets. |
| (c) | Westmoreland Coal Co. has a variable interest rate that floats quarterly on March, June, September, and December. The interest rate is based on the 3-month Libor rate plus 6.50%. |
| (d) | Micron Technologies, Inc. has a variable interest rate that floats quarterly in January, April, July, and October. The interest rate is based on the 3-month Libor rate plus 6.00%. |
| (e) | All or a portion of this security was on loan at November 30, 2016. The aggregate cost and market value of securities on loan at November 30, 2016 is $11,491,968 and $10,407,037, respectively. |
SPDR - Standard & Poor’s Depository Receipts
| ^ | Represents less than 0.05% of net assets. |
The accompanying notes are an integral part of the financial statements.
38
Sentinel Small Company Fund (Unaudited) |
| |

Jason Ronovech, CFA Portfolio Manager | Performance Highlights The Sentinel Small Company Fund’s Class I shares returned 12.95% for the fiscal year ending November 30, 2016, which compares to a return of 12.08% for the Russell 2000 Index. The Morningstar Small Growth category posted an average return of 5.54% for the same period. Equity Market Review U.S. small cap equities delivered strong returns in 2016, albeit with significant volatility. The year started off challenging, with the Russell 2000 index hitting a bear market low in February, close to 30% off the record high achieved in June 2015. We believe the decline in small cap stocks was a reaction to slower economic growth, which drove small cap earnings lower at the end of 2015 and into 2016. As growth and earnings expectations stabilized, small cap stocks recovered as the year progressed, weathering short-term corrections around the United Kingdom’s vote in June to leave the European Union (Brexit) and ahead of the U.S. election. The U.S. election results have been a significant catalyst for small cap stocks, propelling the Russell 2000 Index to all-time highs by the end of November, with a return of 40% since February. We believe that small cap stock returns are being driven by the potential for accelerated growth, lower corporate taxes, and reduced regulations, which would all benefit future small cap earnings growth. Sector Review Information Technology was the top performing sector within the Sentinel Small Company Fund, with a return of 29.2% compared to 14.9% for the benchmark sector. Our holdings in the hardware and equipment industry group returned 63.2%, followed by semiconductors up 19.7% and software and services returning 17.0%. Our overweight allocation to the sector of 25% compared to 18% in the benchmark slightly positively impacted performance. Health Care was the second best performing sector from an attribution perspective, with a return of 5.5% compared to a decline of 8.1% for the benchmark sector. Our stock selection was significantly positive, but partially offset by our overweight allocation of 21% compared to 14% for the benchmark sector. Our equipment and services stocks performed in-line with the benchmark industry group, with a return of 3%. Our pharma, biotech, and life sciences holdings returned 17% compared to an 18% decline for the benchmark industry group. Consumer Discretionary was our most challenging sector with a 3.1% decline for our holdings compared to a 6.4% return for the benchmark sector. Our lone media holding, MDC Partners, had experienced a difficult year, with slower growth compounded by leverage concerns. Our retail holdings also were weak, with a decline of 6.5% compared to a 1.0% decline for the benchmark industry group. Materials also detracted from returns during the year, entirely due to our underweight exposure. Our lone holding in the sector returned 38% compared to 35% for the benchmark sector. However, our average weight of 1% was below 4% for the benchmark sector. |
The Russell 2000 Index is an unmanaged index that measures the performance of 2000 small-cap companies within the U.S. equity universe.
An investment cannot be made directly in an index.
The return for the Morningstar category is an average of funds within the particular category as determined by Morningstar based on investment styles as measured by their underlying portfolio holdings.
39
Sentinel Small Company Fund
| | |
| | Holdings Review Long-term small cap outperformance in general benefits from merger and acquisition (“M&A”) activity. M&A activity has accelerated over the last three years and the portfolio has been a major beneficiary. In 2014, the portfolio had five companies involved with M&A activity, all within the Information Technology sector. In 2015, nine portfolio holdings were acquired, four in the Health Care sector, four in the Financials sector, and one in the Consumer Discretionary sector. In 2016, ten portfolio holdings have been acquired: Fleetmatics (FLTX) acquired by Verizon (VZ).
inContact (SAAS) acquired by NICE Systems (NICE)
QLogic (QLGC) acquired by Cavium (CAVM)
Ruckus Wireless (RKUS) acquired by Brocade (BRCD)
Brocade (BRCD) acquired by Broadcom Limited (BRCM)
Examworks (EXAM) acquired by private equity
Press Gainey (PGND) acquired by private equity
Private Bancorp (PVTB) acquired by Canadian Imperial Bank of Commerce (CM)
Endurance Specialty Holdings (ENH) acquired by SOMPO Holdings
Clarcor (CLC) acquired by Parker Hannifin (PH) While the pace of M&A activity in recent years has been generally beneficial to small cap outperformance, there is no way to know if that pace will be maintained in the future. Concluding Thoughts We will continue to focus on executing our fundamental stock selection and portfolio construction process. We believe that quality small cap companies poised to benefit from improvements in their business model, leadership team and industry positioning, coupled with disciplined valuation analysis to help identify favorable entry and exit points, can drive shareholder returns over time. As always, we appreciate your confidence in us and we will do our very best to help you achieve your investments goals. Thank you for your continued support. 
|
40
Sentinel Small Company Fund
Performance Notes (Unaudited)
Graph and total return data assumes reinvestment of all distributions. Fund performance in the graphs and table reflects expenses and management fees but does not reflect the effect of any taxes on fund distributions or redemptions. Growth of Class A shares in the graph reflects the 5% maximum sales charge. Growth of Class C shares in the graph does not reflect the 1% contingent deferred sales charge (CDSC) applicable to redemptions within the first year, because none would apply if the shares were held for the full period. Index performance does not reflect any sales charges, fees or expenses. Data shown represents past performance; past performance does not guarantee future results; current performance may be higher or lower than that shown. Investment return and principal value will vary so that you may have a gain or loss when you sell shares. Before investing, carefully consider a fund’s objectives, risks, charges and expenses. Summary and full prospectuses containing this and other information are available from sentinelinvestments.com. Please read them carefully. Visit www.sentinelinvestments.com for the most current month-end performance information.
Growth of a $10,000 Investment (Class A shares and Class C shares)
November 30, 2006 – November 30, 2016

Growth of a $1,000,000 Investment (Class I shares and Class R6 shares)
November 30, 2006 – November 30, 2016
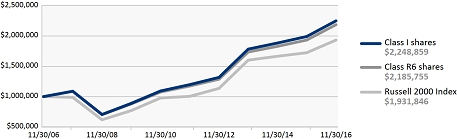
Average Annual Total Returns (as of November 30, 2016)
| | | Class A shares | | Class C shares | | Class I shares | Class R6 shares | | | | |
| | | Without | | With 5% | | Without | | With 1% | | No | | No | | | | |
| | | Sales Charge | | Sales Charge | | CDSC | | CDSC | | Sales Charge | | Sales Charge | | Class | | Symbol |
| 1 year | | | 12.52 | % | | | 6.96 | % | | | 11.48 | % | | | 10.64 | % | | | 12.95 | % | | | 13.07 | % | | A | | SAGWX |
| 3 years | | | 7.69 | | | | 5.86 | | | | 6.87 | | | | 6.87 | | | | 8.04 | | | | 8.00 | | | C | | SSCOX |
| 5 years | | | 13.04 | | | | 11.88 | | | | 12.19 | | | | 12.19 | | | | 13.43 | | | | 13.23 | | | I | | SIGWX |
| 10 years | | | 8.04 | | | | 7.49 | | | | 7.21 | | | | 7.21 | | | | 8.44 | | | | 8.13 | | | R6 | | SSRRX |
Inception Date of the Fund – 3/1/93
Performance of the Class A shares prior to March 30, 2016 has not been adjusted to reflect the decrease in the maximum 12b-1 fee from 0.30% to 0.25%. If it had, those returns would be higher. Performance of the Class I shares prior to their inception on May 4, 2007 is based on the performance of the Fund’s Class A shares, restated to reflect that Class I shares are not subject to a sales charge. Performance of the Class R6 shares prior to their inception on December 23, 2014 is based on the performance of the Fund’s Class A shares, restated to reflect that Class R6 shares are not subject to a sales charge. Only eligible investors may purchase Class I and Class R6 shares, as described in the prospectus.
The following are total annual operating expense ratios for Sentinel Small Company Fund Class A, C, I and R6 shares: A – 1.21%, C - 1.95%, I - 0.88%, R6 – 2.97%. Expense ratio data is sourced from the Fund’s most recent prospectus.
Certain Sentinel Funds have adopted a redemption fee. For the Small Company Fund, a fee of 2% will be assessed on the redemption of shares held for 30 calendar days or less.
Small company stocks can be more volatile than large company stocks.
International securities are subject to political influences, currency fluctuations and economic cycles that may be unrelated to those affecting the domestic financial markets and may experience wider price fluctuations than U.S. domestic securities.
A CDSC of up to 1% may apply to investments of $1,000,000 or more in Class A shares which are redeemed within 12 months. See the Prospectus.
The Russell 2000 Index is an unmanaged index of approximately 2000 small-cap companies within the U.S. equity universe. An investment cannot be made directly in an index.
41
Sentinel Small Company Fund
Fund Profile
at November 30, 2016
Top Sectors*
| Sector | Percent of Net Assets |
| Information Technology | 23.5% |
| Health Care | 18.8% |
| Industrials | 15.3% |
| Consumer Discretionary | 13.5% |
| | |
| Top 10 Holdings** | |
| | |
| Description | Percent of Net Assets |
| Magellan Health, Inc. | 2.0% |
| Webster Financial Corp. | 1.8% |
| Corporate Office Properties Trust | 1.7% |
| Western Alliance Bancorp | 1.7% |
| Nuance Communications, Inc. | 1.7% |
| Glacier Bancorp, Inc. | 1.6% |
| Sector | Percent of Net Assets |
| Financials | 8.7% |
| Energy | 2.4% |
| Real Estate | 1.7% |
| Materials | 0.9% |
| Description | Percent of Net Assets |
| Plantronics, Inc. | 1.6% |
| j2 Global, Inc. | 1.6% |
| Tower Semiconductor Ltd. | 1.6% |
| TRI Pointe Group, Inc. | 1.5% |
| Total of Net Assets | 16.8% |
*“Top Sectors” includes Domestic Common Stocks, Foreign Stocks & ADRs and Real Estate Investment Trusts.
**“Top 10 Holdings” excludes any short-term investments and money market funds. Portfolio composition and holdings are subject to change. More complete holdings follow.
Schedule of Investments
at November 30, 2016
| | | | | | Value | |
| | | Shares | | | (Note 2) | |
| Domestic Common Stocks 81.9% | |
| Consumer Discretionary 13.5% | |
| Bloomin’ Brands, Inc. | | | 616,840 | | | $ | 11,473,224 | |
| BorgWarner, Inc. | | | 238,930 | | | | 8,505,908 | |
| Callaway Golf Co. | | | 746,000 | | | | 9,063,900 | |
| KB Home | | | 602,100 | | | | 9,537,264 | |
| MDC Partners, Inc. | | | 635,666 | | | | 3,941,129 | |
| Oxford Industries, Inc. | | | 163,500 | | | | 11,879,910 | |
| Penn National Gaming, Inc.* | | | 778,300 | | | | 10,335,824 | |
| Planet Fitness, Inc. | | | 419,700 | | | | 8,507,319 | |
| Select Comfort Corp.* | | | 530,300 | | | | 11,995,386 | |
| Texas Roadhouse, Inc. | | | 257,500 | | | | 12,074,175 | |
| The Habit Restaurants, Inc.* | | | 548,200 | | | | 9,209,760 | |
| Tile Shop Holdings, Inc.* | | | 630,110 | | | | 12,633,706 | |
| TRI Pointe Group, Inc.* | | | 1,385,600 | | | | 16,100,672 | |
| Vitamin Shoppe, Inc.* | | | 373,900 | | | | 9,291,415 | |
| | | | | | | | 144,549,592 | |
| Energy 2.4% | | | | | | | | |
| Carrizo Oil & Gas, Inc.* | | | 273,300 | | | | 11,571,522 | |
| Forum Energy Technologies, Inc.* | | | 401,600 | | | | 8,734,800 | |
| Gulfport Energy Corp.* | | | 200,000 | | | | 5,138,000 | |
| | | | | | | | 25,444,322 | |
| Financials 8.7% | | | | | | | | |
| Evercore Partners, Inc. | | | 200,600 | | | | 13,520,440 | |
| Glacier Bancorp, Inc. | | | 512,000 | | | | 17,561,600 | |
| PRA Group, Inc.* | | | 317,500 | | | | 11,414,125 | |
| | | | | | Value | |
| | | Shares | | | (Note 2) | |
| Stifel Financial Corp.* | | | 250,300 | | | $ | 12,477,455 | |
| Webster Financial Corp. | | | 389,000 | | | | 19,298,290 | |
| Western Alliance Bancorp* | | | 393,000 | | | | 18,360,960 | |
| | | | | | | | 92,632,870 | |
| Health Care 18.8% | | | | | | | | |
| Air Methods Corp.* | | | 334,200 | | | | 10,928,340 | |
| AMN Healthcare Services, Inc.* | | | 343,316 | | | | 11,432,422 | |
| AngioDynamics, Inc.* | | | 734,206 | | | | 11,967,558 | |
| Bio-Rad Laboratories, Inc.* | | | 61,864 | | | | 10,733,404 | |
| Bio-Techne Corp. | | | 93,800 | | | | 9,882,768 | |
| Capital Senior Living Corp.* | | | 801,500 | | | | 12,487,370 | |
| Globus Medical, Inc.* | | | 534,800 | | | | 11,573,072 | |
| Haemonetics Corp.* | | | 281,200 | | | | 11,143,956 | |
| HealthSouth Corp. | | | 318,100 | | | | 13,255,227 | |
| Healthways, Inc.* | | | 590,634 | | | | 13,702,709 | |
| ICON PLC* | | | 123,800 | | | | 9,364,232 | |
| Magellan Health, Inc.* | | | 296,599 | | | | 21,592,407 | |
| MEDNAX, Inc.* | | | 103,100 | | | | 6,749,957 | |
| NuVasive, Inc.* | | | 173,500 | | | | 11,260,150 | |
| Omnicell, Inc.* | | | 259,500 | | | | 9,303,075 | |
| Owens & Minor, Inc. | | | 301,900 | | | | 10,237,429 | |
| Patterson Cos, Inc. | | | 205,200 | | | | 7,949,448 | |
| STERIS PLC | | | 112,500 | | | | 7,381,125 | |
| | | | | | | | 200,944,649 | |
| Industrials 15.3% | | | | | | | | |
| Advisory Board Co.* | | | 248,500 | | | | 8,796,900 | |
| Clarcor, Inc. | | | 151,561 | | | | 10,677,473 | |
| | | | | | Value | |
| | | Shares | | | (Note 2) | |
| Crane Co. | | | 146,400 | | | $ | 10,758,936 | |
| Esterline Technologies Corp.* | | | 129,700 | | | | 11,407,115 | |
| Genesee & Wyoming, Inc.* | | | 142,000 | | | | 10,848,800 | |
| Healthcare Services Group, Inc. | | | 259,100 | | | | 10,091,945 | |
| Hub Group, Inc.* | | | 266,300 | | | | 11,410,955 | |
| Knight Transportation, Inc. | | | 315,800 | | | | 11,053,000 | |
| Mobile Mini, Inc. | | | 393,032 | | | | 12,066,082 | |
| MYR Group, Inc.* | | | 312,100 | | | | 11,691,266 | |
| Quanta Services, Inc.* | | | 332,270 | | | | 11,204,144 | |
| Regal Beloit Corp. | | | 189,400 | | | | 13,807,260 | |
| Ritchie Bros Auctioneers, Inc. | | | 281,800 | | | | 10,773,214 | |
| Toro Co. | | | 147,000 | | | | 7,780,710 | |
| Woodward, Inc. | | | 155,600 | | | | 10,538,788 | |
| | | | | | | | 162,906,588 | |
| Information Technology 22.3% | |
| Acxiom Corp.* | | | 387,100 | | | | 10,269,763 | |
| Aspen Technology, Inc.* | | | 199,300 | | | | 10,529,019 | |
| Blackhawk Network Holdings, Inc.* | | | 289,900 | | | | 10,436,400 | |
| Bottomline Technologies de, Inc.* | | | 390,400 | | | | 9,783,424 | |
| CommVault Systems, Inc.* | | | 191,100 | | | | 10,319,400 | |
| Dolby Laboratories, Inc. | | | 187,690 | | | | 8,661,893 | |
| Finisar Corp.* | | | 325,500 | | | | 10,816,365 | |
| GTT Communications, Inc.* | | | 546,930 | | | | 13,892,022 | |
| j2 Global, Inc. | | | 236,685 | | | | 17,398,714 | |
The accompanying notes are an integral part of the financial statements.
42
Sentinel Small Company Fund
| | | | | | Value | |
| | | Shares | | | (Note 2) | |
| Microsemi Corp.* | | | 190,000 | | | $ | 10,402,500 | |
| Nanometrics, Inc.* | | | 245,700 | | | | 5,874,687 | |
| NetScout Systems, Inc.* | | | 334,300 | | | | 10,430,160 | |
| Nuance Communications, Inc.* | | | 1,124,670 | | | | 18,230,901 | |
| ON Semiconductor Corp.* | | | 1,191,580 | | | | 14,036,812 | |
| Open Text Corp. | | | 166,660 | | | | 10,592,910 | |
| Plantronics, Inc. | | | 338,740 | | | | 17,553,507 | |
| Rudolph Technologies, Inc.* | | | 551,300 | | | | 10,805,480 | |
| Skyworks Solutions, Inc. | | | 122,950 | | | | 9,448,708 | |
| Tower Semiconductor Ltd.* | | | 950,700 | | | | 17,074,572 | |
| Xcerra Corp.* | | | 1,720,600 | | | | 10,908,604 | |
| | | | | | | | 237,465,841 | |
| Materials 0.9% | | | | | | | | |
| Berry Plastics Group, Inc.* | | | 194,900 | | | | 9,700,173 | |
Total Domestic Common Stocks
(Cost $679,015,516) | | | | | | | 873,644,035 | |
| Foreign Stocks & ADR’s 1.2% |
| Israel 1.2% | | | | | | | | |
NICE Systems Ltd. ADR
(Cost $7,831,221) | | | 199,920 | | | | 13,152,737 | |
| Real Estate Investment Trusts 1.7% | |
| Real Estate 1.7% | | | | | | | | |
Corporate Office Properties Trust
(Cost $16,338,418) | | | 642,500 | | | | 18,388,350 | |
| Institutional Money Market Funds 1.4% |
| State Street Institutional U.S. Government Money Market Fund | | | | | | | | |
Premier Class
(Cost $15,054,755) | | | 15,054,755 | | | | 15,054,755 | |
| | | | | | | | | |
| | | Principal | | | | | |
| | | Amount | | | Value | |
| | | (M=$1,000) | | | (Note 2) | |
| U.S. Government Obligations 9.2% | |
| U.S. Government Agency Obligations 4.7% | |
| Federal Home Loan Bank 4.7% | |
| Agency Discount Notes: | | | | | | | | |
| 0.1%, 12/01/16 | | | 50,000 M | | | | 50,000,000 | |
| U.S. Treasury Obligations 4.5% | |
| U.S. Treasury Bill | | | | | | | | |
| 0.155%, 12/01/16 | | | 48,000 M | | | | 48,000,000 | |
Total U.S. Government Obligations
(Cost $98,000,000) | | | | | | | 98,000,000 | |
| | | Principal | | | | |
| | | Amount | | | Value | |
| | | (M=$1,000) | | | (Note 2) | |
Total Investments 95.4%
(Cost $816,239,910)† | | | $ | 1,018,239,877 | |
| | | | | | |
| Other Assets in Excess of Liabilities 4.6% | | | | 48,892,002 | |
| | | | | | |
| Net Assets 100.0% | | | $ | 1,067,131,879 | |
| | | | | | | | | |
| | | |
| * | | Non-income producing. |
| | | |
| † | | Cost for federal income tax purposes is $819,881,665. At November 30, 2016 unrealized appreciation for federal income tax purposes aggregated $198,358,212 of which $229,025,994 related to appreciated securities and $30,667,782 related to depreciated securities. |
| | | |
| ADR | | - American Depositary Receipt |
The accompanying notes are an integral part of the financial statements.
43
Sentinel Sustainable Core Opportunities Fund
(Unaudited)

Helena Ocampo Portfolio Manager | Performance Highlights The Sentinel Sustainable Core Opportunities Fund Class I shares had a total return of 6.20% for the fiscal year ending November 30, 2016, compared to a 8.06% return for the Standard & Poor’s 500 Index, and a 6.33% return for the Morningstar Large Blend category average. Equity Market Review For most of the year, the defensive, yield-heavy sectors dominated the market, as positive domestic economic indicators were not enough to counteract the uncertainties generated by international economic and political events. Fiscal 2016 saw weaker international economic growth and political unrest, the United Kingdom voting to leave the European Union, and a contested U.S. presidential election. However, the U.S. election results set a new course for the markets, as the Republican Party is set to take control of the executive and legislative branches. Many investors have bet on a strong pro-business agenda, and shifted positions accordingly, and aggressively. At fiscal year-end, value stocks decisively outperformed growth stocks, while small cap stocks swiftly reversed their under-performance vs. mid and large cap stocks, doubling the annual return of large cap stocks by the end of November. In terms of sectors, Utilities and Telecommunications led the S&P 500 Index for the majority of the year, but as interest rates rose they quickly lost ground post-election to the Industrials and Financials sectors, which ended up as the market leaders for the fiscal year. The Health Care and Information Technology sectors ended as the laggards, after being the clear leaders in previous years. Key Performance Attribution For the fiscal year ending November 30, 2016, our stock selection in Consumer Discretionary and Health Care was additive to the Fund’s performance, along with our stock selection and underweight stance in the weak-performing Real Estate sector. Improving margins in cable and lowered fears of government intervention in deal-making helped our holdings in media, while our focus on well-executed, off-price retailing helped our specialty retail exposure. Within Health Care, our stock selection in providers and services, as well as in pharmaceuticals, added to performance. Conversely, our Industrials, Energy and Information Technology exposure worked against us. Within Industrials, the bulk of the underperformance was due to our underweight stance in capital goods, as well as to a lone holding within commercial services that announced a material weakness in last year’s financial statements from its auditor. We have since moved on from this position. Within Energy, our underweight on the sector as a whole and our lack of exposure to oil majors accounted for most the underperformance vs. the overall sector. Within Information Technology, our exposure in IT services was challenged as revenue expectations of one of our holdings fell amidst lower demand for consulting services in the financial services and health care industries, while another holding faced increased litigation and regulatory uncertainty. |
The Standard & Poor’s 500 Index is an unmanaged index of approximately 500 widely held U.S. equity securities chosen for market size, liquidity, and industry group representation.
An investment cannot be made directly in an index.
The return for the Morningstar category is an average of funds within the particular category as determined by Morningstar based on investment styles as measured by their underlying portfolio holdings.
44
Sentinel Sustainable Core Opportunities Fund
| | Portfolio Positioning and Outlook Our long-term objective remains unchanged: to find superior companies with maintainable earnings streams trading at reasonable valuations. We believe this has the potential to lead to favorable returns relative to peer funds. We are currently overweight the Financials, Health Care, and Consumer Discretionary sectors, while maintaining our underweight stance on the more defensive, yield-heavy Utilities, Real Estate, and Telecommunications sectors. We are also underweight the Industrial sector, as we exited certain positions that did not meet our fundamental criteria and we currently wait for better entry points into our favored holdings. We have reduced the number of holdings down to 81, from a high of 103 after the March 30, 2016 merger with the Sustainable Mid Opportunities Fund. We continue to redeploy capital from eliminations to select existing holdings that we believe offer a better risk / return profile, as well as a more attractive Environmental, Social and Governance (ESG) profile. Our portfolio transition process due to the aforementioned merger continues, and we would expect a further reduction in names as time progresses. The Sentinel Sustainable Core Opportunities Fund aims to consistently deliver solid relative total returns with moderate levels of risk throughout varied financial market conditions. We continue to believe that our investment process, which emphasizes corporate, social and environmental sustainability standards for businesses, alongside successful business execution, attractive valuation and moderate levels of risk will reward our shareholders over the long term. 
|
45
Sentinel Sustainable Core Opportunities Fund
Performance Notes (Unaudited)
Graph and total return data assumes reinvestment of all distributions. Fund performance in the graphs and table reflects expenses and management fees but does not reflect the effect of any taxes on fund distributions or redemptions. Growth of Class A shares in the graph reflects the 5% maximum sales charge. Index performance does not reflect any sales charges, fees or expenses. Data shown represents past performance; past performance does not guarantee future results; current performance may be higher or lower than that shown. Investment return and principal value will vary so that you may have a gain or loss when you sell shares. Before investing, carefully consider a fund’s objectives, risks, charges and expenses. Summary and full prospectuses containing this and other information are available from sentinelinvestments.com. Please read them carefully. Visit www.sentinelinvestments.com for the most current month-end performance information.
Growth of a $10,000 Investment (Class A shares)
November 30, 2006 – November 30, 2016
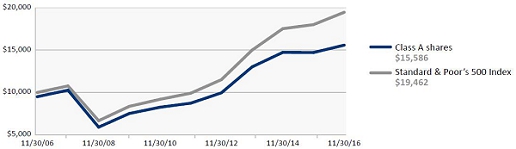
Growth of a $1,000,000 Investment (Class I shares)
November 30, 2006 – November 30, 2016
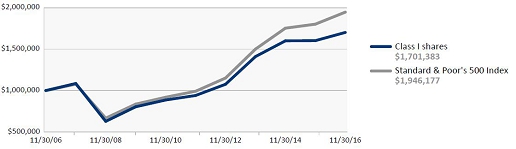
Average Annual Total Returns (as of November 30, 2016)
| | Class A shares | Class I shares | | | |
| | Without
Sales Charge | With 5%
Sales Charge | No
Sales Charge | | Class | Symbol |
| 1 year | 5.92 | % | 0.61 | % | 6.20 | % | | A | MYPVX |
| 3 years | 6.18 | | 4.39 | | 6.47 | | | I | CVALX |
| 5 years | 12.28 | | 11.14 | | 12.59 | | | | |
| 10 years | 5.07 | | 4.54 | | 5.46 | | | | |
Inception Date of the Fund – 6/13/96
The Sentinel Sustainable Core Opportunities Fund, which began operations on April 4, 2008, is a successor to the Citizens Value Fund, which was a successor to the Meyers Pride Value Fund, which began operations on June 13, 1996. Performance of the Class A shares from September 24, 2001 to their inception on April 4, 2008 is based on the performance of the Standard shares of the Citizens Value Fund, which was offered without a sales charge, and reflects the current maximum sales charge. Performance of Class A shares from April 4, 2008 to June 29, 2012 has not been adjusted to reflect the lower maximum 12b-1 fee in effect prior to April 4, 2008 or the decrease in the maximum 12b-1 fee, effective June 30, 2012, from 0.30% to 0.25%. If it had, those returns would be higher. Performance of the Class I shares from March 31, 2006 to their inception on April 4, 2008 is based on the performance of the Institutional shares of the Citizens Value Fund. Class I shares do not impose a sales charge. Only eligible investors may purchase Class I shares, as described in the Prospectus.
The following are total annual operating expense ratios for Sentinel Sustainable Core Opportunities Fund Class A & I shares: A – 1.21%, I – 0.93%. Expense ratio data is sourced from the Fund’s most recent prospectus.
Large company stocks as a group could fall out of favor with the market and underperform investments that focus on small and mid-sized company stocks.
International securities are subject to political influences, currency fluctuations and economic cycles that may be unrelated to those affecting the domestic financial markets and may experience wider price fluctuations than U.S. domestic securities.
A Sentinel Sustainable Fund’s environmental, social and corporate governance criteria may cause the Fund to forgo opportunities to buy certain securities, and/or forgo opportunities to gain exposure to certain industries, sectors, regions and countries. In addition, a Sentinel Sustainable Fund may be required to sell a security when it might otherwise be disadvantageous for it to do so.
A CDSC of up to 1% may apply to investments of $1,000,000 or more in Class A shares which are redeemed within 12 months. See the Prospectus.
The Standard & Poor’s 500 Index is an unmanaged index of approximately 500 widely held U.S. equity securities chosen for market size, liquidity, and industry group representation.
An investment cannot be made directly in an index.
46
Sentinel Sustainable Core Opportunities Fund
Fund Profile
at November 30, 2016
Top Sectors*
| Sector | Percent of Net Assets |
| Information Technology | 21.5% |
| Financials | 16.5% |
| Health Care | 15.3% |
| Consumer Discretionary | 13.4% |
| Consumer Staples | 9.0% |
Top 10 Holdings**
| Description | Percent of Net Assets |
| Microsoft Corp. | 3.2% |
| Visa, Inc. | 2.7% |
| Apple, Inc. | 2.3% |
| Alphabet, Inc. | 2.2% |
| UnitedHealth Group, Inc. | 2.1% |
| Sector | Percent of Net Assets |
| Industrials | 9.0% |
| Energy | 7.4% |
| Materials | 1.9% |
| Telecommunication Services | 1.6% |
| Real Estate | 1.2% |
| Description | Percent of Net Assets |
| Signature Bank | 2.0% |
| TJX Cos., Inc. | 1.9% |
| Accenture PLC | 1.9% |
| PepsiCo, Inc. | 1.9% |
| EOG Resources, Inc. | 1.9% |
| Total of Net Assets | 22.1% |
*“Top Sectors” includes Domestic Common Stocks, Foreign Stocks & ADRs and Real Estate Investment Trusts.
**“Top 10 Holdings” excludes any short-term investments and money market funds. Portfolio composition and holdings are subject to change. More complete holdings follow.
Schedule of Investments
at November 30, 2016
| | | Shares | | Value
(Note 2) | |
| Domestic Common Stocks 91.4% |
| Consumer Discretionary 13.4% |
| BorgWarner, Inc. | | 82,040 | | $ | 2,920,624 | |
| Coach, Inc. | | 90,000 | | | 3,275,100 | |
| Comcast Corp. | | 95,000 | | | 6,603,450 | |
| Goodyear Tire & Rubber Co. | | 100,000 | | | 3,069,000 | |
| Home Depot, Inc. | | 35,000 | | | 4,529,000 | |
| Marriott Int’l., Inc. | | 46,200 | | | 3,639,636 | |
| McDonald’s Corp. | | 51,000 | | | 6,082,770 | |
| Omnicom Group, Inc. | | 50,000 | | | 4,347,000 | |
| Priceline Group, Inc.* | | 1,700 | | | 2,556,256 | |
| Time Warner, Inc. | | 50,000 | | | 4,591,000 | |
| TJX Cos., Inc. | | 90,000 | | | 7,050,600 | |
| | | | | | 48,664,436 | |
| Consumer Staples 7.3% |
| CVS Health Corp. | | 50,000 | | | 3,844,500 | |
| Estee Lauder Cos, Inc. | | 50,000 | | | 3,885,000 | |
| Kraft Heinz Co. | | 40,000 | | | 3,266,000 | |
| McCormick & Co., Inc. | | 25,000 | | | 2,280,000 | |
| PepsiCo, Inc. | | 70,000 | | | 7,007,000 | |
| Procter & Gamble Co. | | 75,000 | | | 6,184,500 | |
| | | | | | 26,467,000 | |
| Energy 7.4% |
| Baker Hughes, Inc. | | 40,000 | | | 2,573,200 | |
| ConocoPhillips | | 63,000 | | | 3,056,760 | |
| Core Laboratories NV | | 35,070 | | | 3,919,423 | |
| EOG Resources, Inc. | | 66,500 | | | 6,817,580 | |
| | | Shares | | | Value
(Note 2) | |
| Noble Energy, Inc. | | 140,000 | | $ | 5,342,400 | |
| Schlumberger Ltd. | | 60,000 | | | 5,043,000 | |
| | | | | | 26,752,363 | |
| Financials 16.5% |
| American Express Co. | | 50,000 | | | 3,602,000 | |
| Chubb Ltd. | | 40,000 | | | 5,120,000 | |
| CME Group, Inc. | | 57,000 | | | 6,435,870 | |
| Discover Financial Services | | 90,000 | | | 6,099,300 | |
| M&T Bank Corp. | | 11,000 | | | 1,583,340 | |
| Morgan Stanley | | 160,000 | | | 6,617,600 | |
| PNC Financial Services Group, Inc. | | 60,000 | | | 6,632,400 | |
| Raymond James Financial, Inc. | | 37,910 | | | 2,727,246 | |
| S&P Global, Inc. | | 55,000 | | | 6,544,450 | |
| Signature Bank* | | 47,500 | | | 7,120,725 | |
| The Travelers Cos., Inc. | | 40,000 | | | 4,534,000 | |
| Wells Fargo & Co. | | 55,000 | | | 2,910,600 | |
| | | | | | 59,927,531 | |
| Health Care 14.4% |
| Amgen, Inc. | | 25,000 | | | 3,601,750 | |
| Becton Dickinson & Co. | | 20,000 | | | 3,382,000 | |
| Biogen, Inc.* | | 10,000 | | | 2,940,700 | |
| Bristol-Myers Squibb Co. | | 60,000 | | | 3,386,400 | |
| Danaher Corp. | | 52,000 | | | 4,064,840 | |
| DENTSPLY SIRONA, Inc. | | 59,790 | | | 3,478,582 | |
| Eli Lilly & Co. | | 35,000 | | | 2,349,200 | |
| Johnson & Johnson | | 22,500 | | | 2,504,250 | |
| | | Shares | | | Value
(Note 2) | |
| Medtronic PLC(a) | | 65,000 | | $ | 4,745,650 | |
| Merck & Co., Inc. | | 110,000 | | | 6,730,900 | |
| STERIS PLC | | 25,250 | | | 1,656,653 | |
| Stryker Corp. | | 22,000 | | | 2,500,520 | |
| UnitedHealth Group, Inc. | | 48,000 | | | 7,599,360 | |
| Zoetis, Inc. | | 62,000 | | | 3,123,560 | |
| | | | | | 52,064,365 | |
| Industrials 8.1% |
| 3M Co. | | 25,000 | | | 4,293,500 | |
| Ametek, Inc. | | 54,520 | | | 2,581,522 | |
| Canadian Pacific Railway Ltd. | | 19,000 | | | 2,911,750 | |
| Fortive Corp. | | 26,000 | | | 1,429,740 | |
| Johnson Controls Int’l. plc | | 71,625 | | | 3,221,692 | |
| Masco Corp. | | 63,820 | | | 2,019,903 | |
| Parker Hannifin Corp. | | 22,000 | | | 3,056,460 | |
| United Parcel Service, Inc. | | 20,000 | | | 2,318,400 | |
| Verisk Analytics, Inc.* | | 40,000 | | | 3,323,200 | |
| Waste Connections, Inc. | | 56,170 | | | 4,293,635 | |
| | | | | | 29,449,802 | |
| Information Technology 20.8% |
| Accenture PLC | | 59,000 | | | 7,046,370 | |
| Alphabet, Inc.* | | 10,500 | | | 8,146,740 | |
| Apple, Inc. | | 75,000 | | | 8,289,000 | |
| Check Point Software | | | | | | |
| Technologies Ltd.* | | 25,000 | | | 2,058,250 | |
| Cisco Systems, Inc. | | 160,000 | | | 4,771,200 | |
| Cognizant Technology | | | | | | |
| Solutions Corp.* | | 50,000 | | | 2,754,000 | |
The accompanying notes are an integral part of the financial statements.
47
Sentinel Sustainable Core Opportunities Fund
| | | Shares | | Value
(Note 2) | |
| Microchip Technology, Inc. | | 78,700 | | $ | 5,208,366 | |
| Microsoft Corp. | | 190,000 | | | 11,449,400 | |
| Open Text Corp. | | 63,580 | | | 4,041,145 | |
| Skyworks Solutions, Inc. | | 42,970 | | | 3,302,244 | |
| Synopsys, Inc.* | | 40,000 | | | 2,419,200 | |
| Texas Instruments, Inc. | | 85,000 | | | 6,284,050 | |
| Visa, Inc. | | 125,000 | | | 9,665,000 | |
| | | | | | 75,434,965 | |
| Materials 1.9% | | | | | | |
| Ecolab, Inc. | | 38,000 | | | 4,435,740 | |
| Praxair, Inc. | | 20,000 | | | 2,406,000 | |
| | | | | | 6,841,740 | |
| Telecommunication Services 1.6% |
| Verizon Communications, Inc. | | 120,000 | | | 5,988,000 | |
Total Domestic Common Stocks
(Cost $239,963,438) | | 331,590,202 | |
| Foreign Stocks & ADR’s 4.2% |
| Denmark 0.9% |
Vestas Wind Systems A/S
ADR | | 150,000 | | | 3,285,000 | |
| Israel 0.7% | | | | | | |
| NICE Systems Ltd. ADR | | 37,690 | | | 2,479,625 | |
| Netherlands 1.7% |
| Unilever NV ADR | | 160,000 | | | 6,372,800 | |
| Switzerland 0.9% |
| Roche Holding AG ADR | | 120,000 | | | 3,327,600 | |
Total Foreign Stocks & ADR’s
(Cost $16,004,241) | | | | | 15,465,025 | |
| Real Estate Investment Trusts 1.2% |
| Real Estate 1.2% |
Equinix, Inc.
(Cost $4,037,499) | | 12,500 | | | 4,234,500 | |
| Institutional Money Market Funds 2.9% |
| State Street Institutional U.S. |
| Government Money Market Fund |
Premier Class
(Cost $10,378,898) | | 10,378,898 | | | 10,378,898 | |
Total Investments 99.7%
(Cost $270,384,076)† | | 361,668,625 | |
| Other Assets in Excess of Liabilities 0.3% | | 923,635 | |
| Net Assets 100.0% | $ | 362,592,260 | |
| | * | Non-income producing. |
| | | |
| | † | Cost for federal income tax purposes is $270,681,346. At November 30, 2016 unrealized appreciation for federal income tax purposes aggregated $90,987,279 of which $98,213,491 related to appreciated securities and $7,226,212 related to depreciated securities. |
| | | |
| | (a) | Return of capital paid during the fiscal period. |
| | | |
| | ADR | - American Depositary Receipt |
The accompanying notes are an integral part of the financial statements
48
Sentinel Total Return Bond Fund
(Unaudited)

Jason Doiron, FRM, PRM Portfolio Manager | Performance Highlights The Sentinel Total Return Bond Fund Class I shares produced a total return of 1.40% for the fiscal year ending November 30, 2016. This compares to returns of 2.17% for the Bloomberg Barclays U.S. Aggregate Bond Index and 2.36% for the Morningstar Intermediate-Term Bond category average for the same time period. Bond Market Review Following a period of election and central bank induced volatility in financial markets early in Q4 2016, risk assets recovered significantly in anticipation of material fiscal stimulus following the surprise victory for President-Elect Trump. As the calendar moved past the election market, participants celebrated accelerating Global Purchasing Managers’ Indexes (PMIs), a strong pick-up in U.S. growth and an OPEC/non-OPEC agreement to cut crude oil production. Higher readings for inflation and less accommodative talk from global central banks such as the U.S. Federal Reserve Bank, European Central Bank and the Bank of England were more than offset by the prospect for stronger global and U.S. growth in the future and did not lead to the market jitters experienced in Q3 2016. The Bloomberg Barclays U.S. Corporate High Yield Index ended the month of November 25 basis points (bps) tighter from its Q3 close while the S&P 500 rose more than 1.4%. U.S. Treasury securities moved significantly higher in yield in the first two months of Q4 2016 with the 10-year U.S. Treasury yield rising 79 bps to 2.38% from 1.59%. Realized inflation began to accelerate globally while the surprise victory for President-Elect Trump saw markets anticipate a significant increase in fiscal stimulus. Inflation expectations accelerated in the U.S. with 5-year inflation break even rising 32 bps by the end of November from 1.48% to 1.80%. The 30-year U.S. Treasury yield slightly underperformed the 5-year U.S. Treasury yield by 3 bps at the end of November from the start of the quarter, as the market weighed the potential for greater fiscal stimulus, inflation and long-end treasury issuance versus a potentially faster pace of U.S. Federal Reserve Bank interest rate increases. Relative to developed global markets, U.S. Treasury security and spread products continue to offer a superior yield advantage, resulting in them being particularly attractive to foreign and global investors. Key Performance Attribution The Total Return Bond Fund Class I shares returned 1.40% during the 12 months ending November 30, 2016, underperforming the Bloomberg Barclays U.S. Aggregate Bond Index by 0.77%. During the year, the yield on the 10-year U.S. Treasury rose 18 bps to 2.38% from 2.21%, while the Fund was, on average, short duration* vs. the benchmark by 1.03 years. The Fund’s short duration position resulted in 26 bps of underperformance vs. the benchmark. In addition, the Fund had limited exposure to U.S. Treasury securities as an asset class, which contributed 39 bps of positive allocation effects to overall performance. Risk assets performed quite well during the year with the Option Adjusted Spread (OAS) on the Bloomberg Barclays U.S. Corporate Index tightening by 26 bps, and the OAS on the Bloomberg Barclays U.S. Corporate High Yield Index tightening by 148 bps. Largely due to the strong performance of risk assets, the Fund’s asset allocation call contributed 103 bps |
| * | Effective duration is a measure of the sensitivity of a bond’s price to changes in interest rates. The shorter (longer) the duration, the lower (higher) the interest rate risk and price volatility. |
The Standard & Poor’s 500 Index is an unmanaged index of approximately 500 widely held U.S. equity securities chosen for market size, liquidity, and industry group representation.
The Bloomberg Barclays U.S. Aggregate Bond Index is an unmanaged index of the U.S. investment grade fixed-rate bond market, with components for government and corporate securities, mortgage pass-through securities, and asset-backed securities.
The Bloomberg Barclays U.S. Corporate High Yield Index is an unmanaged index of U.S. dollar-denominated, non-investment grade, fixed-rate, taxable corporate bonds. Securities are classified as high yield if the middle rating of Moody’s, Fitch, and S&P is Ba1/BB+/BB+ or below, excluding emerging market debt.
The Bloomberg Barclays U.S. Corporate Index (Investment Grade) is a broad-based benchmark that measures the investment grade, U.S. dollar-dominated fixed-rate, taxable corporate bond market. It includes USD-denominated securities publicly issued by U.S. and non-U.S. industrial, utility, and financial issuers that meet specified maturity, liquidity, and quality requirements.
An investment cannot be made directly in an index.
The return for the Morningstar category is an average of funds within the particular category as determined by Morningstar based on investment styles as measured by their underlying portfolio holdings.
49
Sentinel Total Return Bond Fund
| | to outperformance, with 72 bps coming from a 7.3% average overweight to high yield credit. Negative sector allocation effects within investment-grade credit detracted somewhat, costing the Fund 11 bps in relative underperformance. Security selection within high yield credit also contributed 6 bps positively to performance, while security selection within investment grade resulted in 47 bps of underperformance. In addition, security selection within the Fund’s Agency Mortgage Backed Securities (MBS) portfolio resulted in 5 bps of underperformance. During the fiscal year, the Fund’s usage of U.S. Treasury Futures resulted in 34 basis points of underperformance relative to the Bloomberg Barclays U.S. Aggregate Bond Index. Because the Fund utilizes U.S. Treasury Futures for hedging purposes only, the impact of any U.S. Treasury Futures transaction will shorten the Fund’s effective duration. Of the underperformance, 12 basis points was due to the impact of the trades on the Fund’s effective duration, while 22 basis points was due to the impact of intra-day price moves on days where a trade occurred. In addition, the Fund utilized Standard & Poor’s 500 Index Futures at various points during the year as a way of hedging the Fund’s exposure to high yield corporate credit. Overall, the Fund’s utilization of Standard & Poor’s 500 Index Futures resulted in less than 1 basis point of outperformance relative to the Bloomberg Barclays U.S. Aggregate Bond Index. Portfolio Positioning and Outlook Looking ahead into Q1 2017, there is growing optimism amongst market participants that U.S. growth and inflation will accelerate as the incoming Trump Administration attempts to implement a number of fiscal stimulus measures including infrastructure investment, tax cuts, de-regulation and the repatriation of foreign earnings held abroad. At the same time the U.S. Federal Reserve Board is likely to take additional steps towards normalizing interest rates while the European Central Bank and Bank of England take additional steps towards unwinding their quantitative easing programs. For the first time in years, markets are likely to continue to experience rising headline inflation across most developed market Consumer Price Indexes (CPI) in the coming quarters due in part to favorable base effects from the Energy sector that already existed prior to an OPEC and non-OPEC agreement to curb crude oil production. While central banks are likely to initially dismiss this rising inflation as “transitory” with more time needed to judge its sustainability, a faster rate of policy removal may occur should realized inflation start to prove stronger than that assumed in forward projections. Even though U.S. growth and inflation were showing signs of acceleration in Q3 and the early parts of Q4, 2016, financial markets have currently priced a very optimistic view of stronger U.S. growth due to fiscal stimulus expectations. Should the incoming administration not deliver as quickly on some or all of these growth measures at the same time the markets are experiencing faster inflation and less accommodative global central bank policy, interest rate and risk markets may experience a period of price discovery. Investment strategies that are able to remain flexible in anticipation of a potential increase in volatility associated with these unknowns are likely to be favored in this environment. 
|
50
Sentinel Total Return Bond Fund
Performance Notes (Unaudited)
Graph and total return data assumes reinvestment of all distributions. Fund performance in the graphs and table reflects expenses and management fees but does not reflect the effect of any taxes on fund distributions or redemptions. Growth of Class A shares in the graph reflects the 2.25% maximum sales charge. Growth of Class C shares in the graph does not reflect the 1% contingent deferred sales charge (CDSC) applicable to redemptions within the first year, because none would apply if the shares were held for the full period. Index performance does not reflect any sales charges, fees or expenses. Data shown represents past performance; past performance does not guarantee future results; current performance may be higher or lower than that shown. Investment return and principal value will vary so that you may have a gain or loss when you sell shares. Before investing, carefully consider a fund’s objectives, risks, charges and expenses. Summary and full prospectuses containing this and other information are available from sentinelinvestments.com. Please read them carefully. Visit www.sentinelinvestments.com for the most current month-end performance information.
Growth of a $10,000 Investment (Class A shares and Class C shares)
From Inception – November 30, 2016
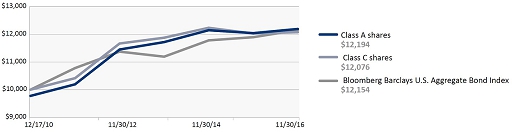
Growth of a $1,000,000 Investment (Class I shares, Class R3 shares and Class R6 shares)
From Inception – November 30, 2016

Average Annual Total Returns (as of November 30, 2016)
| | | Class A shares | | Class C shares | | Class I shares | | Class R3 shares | | Class R6 shares | |
| | | Without
Sales Charge | | With 2.25%
Sales Charge | | Without
CDSC | | With 1%
CDSC | | No
Sales Charge | | No
Sales Charge | | No
Sales Charge | |
| 1 year | | 1.26 | % | | -1.04 | % | | 0.40 | % | | -0.60 | % | | 1.40 | % | | 1.16 | % | | 1.36 | % | |
| 3 years | | 1.33 | | | 0.55 | | | 0.56 | | | 0.56 | | | 1.48 | | | 1.14 | | | 1.46 | | |
| 5 years | | 3.65 | | | 3.19 | | | 3.00 | | | 3.00 | | | 3.81 | | | 3.35 | | | 3.72 | | |
| Since inception | | 3.78 | | | 3.39 | | | 3.22 | | | 3.22 | | | 3.94 | | | 3.46 | | | 3.85 | | |
| | | |
| | | |
| Class | | Symbol |
| A | | SATRX |
| C | | SCTRX |
| I | | SITRX |
| R3 | | SBRRX |
| R6 | | STRRX |
Inception Date of the Fund – 12/17/10
Performance of the Class R3 and Class R6 shares prior to their inception on December 23, 2014 is based on the performance of the Fund’s Class A shares, adjusted to reflect that Class R3 and Class R6 shares do not charge a front-end sales charge and, in the case of the Class R3 shares, adjusted for Class R3’s estimated higher expenses. The “since inception” performance data for Class R3 and Class R6 shares is calculated from December 17, 2010, which was the inception date of the Fund. Class I shares, Class R3 shares and Class R6 shares do not impose a sales charge. Only eligible investors may purchase Class I, Class R3 and Class R6 shares, as described in the prospectus.
The following are total annual operating expense ratios for Sentinel Total Return Bond Fund Class A, C, I, R3 & R6 shares: A – 0.97%, C – 1.78%, I – 0.77%, R3 – 3.40%, R6 – 2.90%. Expense ratio data is sourced from the Fund’s most recent prospectus.
Fixed income securities are subject to credit and interest rate risk. Bond values will generally decrease when interest rates rise and will generally increase when interest rates fall. Bonds with lower credit ratings are more speculative and likely to default than higher quality bonds and tend to fluctuate more widely in value. Mortgage-backed securities (MBS) are subject to prepayment risks. These risks may result in greater share price volatility. International securities are subject to political influences, currency fluctuations and economic cycles that may be unrelated to those affecting the domestic financial markets and may experience wider price fluctuations than U.S. domestic securities. Fund shares are not insured or guaranteed by the U.S. government or its agencies.
The Fund may use derivatives, which are financial contracts whose value depends upon or is derived from the value of an underlying asset, reference rate, or index. The Fund may use derivatives as part of a strategy designed to reduce exposure to certain risks, such as risks associated with changes in interest rates, or currency or credit risk (“hedging”). The use of derivatives may reduce the Fund’s return and increase the volatility in movements in the Fund’s net asset value. For additional information regarding the use of derivatives, please see the Fund’s current Prospectus.
A CDSC of up to 0.50% may apply to investments of $500,000 or more in Class A shares which are redeemed within 12 months. See the Prospectus.
The Bloomberg Barclays U.S. Aggregate Bond Index is an unmanaged index of the U.S. investment grade fixed-rate bond market, with components for government and corporate securities, mortgage pass-through securities, and asset-backed securities.
An investment cannot be made directly in an index.
51
Sentinel Total Return Bond Fund
Fund Profile
at November 30, 2016
Average Effective Duration (Unaudited)
| Duration | Percent of
Fixed Income Holdings |
| Less than 1 yr. | 35.1% |
| 1 yr. to 2.99 yrs. | 5.8% |
| 3 yrs. to 3.99 yrs. | 4.4% |
Average Effective Duration (for all Fixed Income Holdings) 3.8 years**
| Duration | Percent of
Fixed Income Holdings |
| 4 yrs. to 5.99 yrs. | 18.7% |
| 6 yrs. to 7.99 yrs. | 4.9% |
| 8 yrs. and over | 31.1% |
Top 10 Holdings**
| Description | | Coupon | | Maturity
Date | | Percent of
Net Assets |
| iShares iBoxx $ Investment Grade Corporate Bond ETF | | | | | | 28.4% |
| SPDR Barclays Short Term Corporate Bond ETF | | | | | | 3.7% |
| FHLMC Q33006 | | 3.50% | | 04/01/45 | | 3.5% |
| FNMA TBA 15 YR Dec | | 2.50% | | 12/16/31 | | 2.8% |
| FHLMC Q32917 | | 3.00% | | 04/01/45 | | 2.7% |
| | | | | | | |
| Description | | Coupon | | Maturity
Date | | Percent of
Net Assets |
| FHLMC Q29056 | | 4.00% | | 10/01/44 | | 2.3% |
| FNMA AT2016 | | 3.00% | | 04/01/43 | | 2.2% |
| FNMA AX0884 | | 4.50% | | 10/01/44 | | 1.8% |
| FNMA 890310 | | 4.50% | | 12/01/40 | | 1.5% |
| FNMA BC1809 | | 3.50% | | 05/01/46 | | 1.3% |
| Total of Net Assets | | | | | | 50.2% |
*The average effective duration considers the call and put dates of applicable fixed income investments and the pre-payment risks of mortgage-backed bonds to measure the sensitivity of the value of the Fund’s portfolio to changes in interest rates.
** “Top 10 Holdings” excludes any short-term investments and money market funds. Portfolio composition and holdings are subject to change. More complete holdings follow.
Schedule of Investments
at November 30, 2016
| | | Principal
Amount
(M=$1,000) | | Value
(Note 2) |
| U.S. Government Obligations 57.3% |
| U.S. Government Agency Obligations 45.2% |
| Federal Home Loan Bank 21.5% |
| Agency Discount Notes: | | | | | | |
| 0.1%, 12/01/16 | | 87,000 M | | $ | 87,000,000 | |
| Federal Home Loan Mortgage Corporation 9.4% |
| Collateralized Mortgage Obligations: |
FHR 3859 JB
5%, 05/15/41 | | 2,263 M | | | 2,491,612 | |
| Mortgage-Backed Securities: |
| 15-Year: | | | | | | |
FHLMC J22900
2.5%, 03/01/28 | | 1,161 M | | | 1,167,327 | |
| 30-Year: | | | | | | |
FHLMC Q29056
4%, 10/01/44 | | 8,691 M | | | 9,140,014 | |
FHLMC Q32917
3%, 04/01/45 | | 11,127 M | | | 11,101,621 | |
FHLMC Q33006
3.5%, 04/01/45 | | 13,746 M | | | 14,096,667 | |
| | | | | | 34,338,302 | |
| Total Federal Home Loan Mortgage Corporation | | | | | 37,997,241 | |
| | | Principal
Amount
(M=$1,000) | | Value
(Note 2) |
| Federal National Mortgage Association 11.5% |
| Mortgage-Backed Securities: |
| 15-Year: | | | | | | |
FNMA TBA 15 YR Dec
2.5%, 12/16/31(a) | | 11,400 M | | $ | 11,439,633 | |
| 30-Year: | | | | | | |
FNMA 725423
5.5%, 05/01/34 | | 690 M | | | 776,551 | |
FNMA 725610
5.5%, 07/01/34 | | 620 M | | | 696,963 | |
FNMA AD9193
5%, 09/01/40 | | 1,938 M | | | 2,130,484 | |
FNMA 890310
4.5%, 12/01/40 | | 5,437 M | | | 5,875,943 | |
FNMA AT2016
3%, 04/01/43 | | 9,046 M | | | 9,044,801 | |
FNMA AS0779
4%, 10/01/43 | | 3,592 M | | | 3,823,819 | |
FNMA AX0884
4.5%, 10/01/44 | | 6,863 M | | | 7,400,331 | |
FNMA BC1809
3.5%, 05/01/46 | | 5,212 M | | | 5,349,886 | |
| | | | | | 35,098,778 | |
| Total Federal National Mortgage Association | | | | | 46,538,411 | |
| | | Principal
Amount
(M=$1,000) | | Value
(Note 2) |
| Government National Mortgage Corporation 2.8% |
| Collateralized Mortgage Obligations: |
GNR 10-33 PX
5%, 09/20/38 | | 5,000 M | | $ | 5,266,627 | |
GNR 10-169 AW
4.5%, 12/20/40 | | 2,750 M | | | 2,982,800 | |
GNR 12-147 Interest Only
0.584%, 04/16/54 | | 9,563 M | | | 377,079 | |
| | | | | | 8,626,506 | |
| Mortgage-Backed Securities: | | | | | | |
| 30-Year: | | | | | | |
GNMA II 005175
4.5%, 09/20/41 | | 2,503 M | | | 2,728,307 | |
| Total Government National Mortgage Corporation | | | | | 11,354,813 | |
| Total U.S. Government Agency Obligations | | | | | 182,890,465 | |
| U.S. Treasury Obligations 12.1% |
| U.S. Treasury Bill 0.155%, 12/01/16 | | 49,000 M | | | 49,000,000 | |
Total U.S. Government Obligations
(Cost $232,790,096) | | | | | 231,890,465 | |
| Domestic Corporate Bonds 9.4% |
| Basic Industry 0.5% | | | | | | |
CF Industries, Inc.
4.95%, 06/01/43 | | 2,660 M | | | 2,108,050 | |
The accompanying notes are an integral part of the financial statements.
52
Sentinel Total Return Bond Fund
| | | Principal
Amount
(M=$1,000) | | Value
(Note 2) | |
| Capital Goods 0.3% | | | | | | |
LafargeHolcim Finance US LLC
3.5%, 09/22/26(b) | | 1,150 M | | $ | 1,116,075 | |
| Communications 2.9% |
AMC Networks, Inc.
5%, 04/01/24 | | 2,880 M | | | 2,887,200 | |
AT&T, Inc.
3.8%, 03/15/22 | | 5,231 M | | | 5,337,221 | |
CSC Holdings LLC
10.875%, 10/15/25(b) | | 1,900 M | | | 2,213,500 | |
GCI, Inc.
6.875%, 04/15/25 | | 1,434 M | | | 1,430,415 | |
| | | | | | 11,868,336 | |
| Consumer Cyclical 1.0% |
General Motors Financial Co., Inc.
3.2%, 07/06/21 | | 2,150 M | | | 2,124,088 | |
QVC, Inc.
5.45%, 08/15/34 | | 2,325 M | | | 2,037,895 | |
| | | | | | 4,161,983 | |
| Consumer Non-Cyclical 1.6% |
Cardinal Health, Inc.
4.9%, 09/15/45 | | 2,010 M | | | 2,108,380 | |
Express Scripts Holding Co.
3.4%, 03/01/27 | | 3,000 M | | | 2,838,159 | |
Zoetis, Inc.
3.25%, 02/01/23 | | 1,386 M | | | 1,372,870 | |
| | | | | | 6,319,409 | |
| Energy 0.1% | | | | | | |
Westmoreland Coal Co.
8.75%, 01/01/22(b) | | 625 M | | | 532,813 | |
| Financials 1.1% | | | | | | |
Brookfield Asset Management, Inc.
4%, 01/15/25 | | 3,696 M | | | 3,603,870 | |
Citizens Financial Group, Inc.
4.3%, 12/03/25 | | 824 M | | | 832,200 | |
| | | | | | 4,436,070 | |
| Insurance 0.4% | | | | | | |
Manulife Financial Corp.
4.15%, 03/04/26 | | 1,570 M | | | 1,640,254 | |
| Real Estate 0.6% | | | | | | |
Retail Opportunity Investments Partnership LP
5%, 12/15/23 | | 2,300 M | | | 2,361,530 | |
| Technology 0.9% | | | | | | |
Diamond 1 Finance Corp / Diamond 2 Finance Corp.
7.125%, 06/15/24(b) | | 1,290 M | | | 1,408,411 | |
Ingram Micro, Inc.
4.95%, 12/15/24 | | 2,310 M | | | 2,267,226 | |
| | | | | | 3,675,637 | |
Total Domestic Corporate Bonds
(Cost $39,207,584) | | | | | 38,220,157 | |
| Asset Backed Securities 0.5% | | | | | | |
Taco Bell Funding, LLC
3.832%, 05/25/26(b)
(Cost $1,995,000) | | 1,995 M | | | 2,010,425 | |
| | | Principal
Amount
(M=$1,000) | | Value
(Note 2) |
| Bank Loans 0.8% | | | | | | |
| Energy 0.4% | | | | | | |
Westmoreland Coal Co.
7.3357%, 12/16/20(c) | | 1,975 M | | $ | 1,688,625 | |
| Technology 0.4% | | | | | | |
Micron Technology, Inc.
6.8579%, 04/26/22(d) | | 1,426 M | | | 1,441,459 | |
Total Bank Loans
(Cost $2,866,733) | | | | | 3,130,084 | |
| | | | | | | |
| | | | | | Value | |
| | | Shares | | | (Note 2) | |
| Domestic Exchange Traded Funds 32.1% | | | | | | |
| Bond Funds 32.1% | | | | | | |
| iShares iBoxx $ Investment Grade Corporate Bond ETF(e) | | 983,088 | | | 114,864,002 | |
| SPDR Barclays Short Term Corporate Bond ETF | | 486,517 | | | 14,858,229 | |
Total Domestic Exchange Traded Funds
(Cost $126,895,434) | | | | | 129,722,231 | |
| Institutional Money Market Funds 2.9% |
| State Street Institutional U.S. Government Money Market Fund | | | | | | |
Premier Class
(Cost $11,832,940) | | 11,832,940 | | | 11,832,940 | |
Total Investments 103.0%
(Cost $415,587,787)† | | | | | 416,806,302 | |
| | | | | | | |
| Excess of Liabilities Over Other Assets (3.0)% | | | | | (12,320,036) | |
| | | | | | | |
| Net Assets 100.0% | | | | $ | 404,486,266 | |
| | | | | | | |
| † | Cost for federal income tax purposes is $415,731,276. At November 30, 2016 unrealized appreciation for federal income tax purposes aggregated $1,075,026 of which $3,839,133 related to appreciated securities and $2,764,107 related to depreciated securities. |
| | |
| (a) | The actual mortgage-backed security that will be delivered is not designated until 48 hours prior to the established trade settlement date with the broker. |
| | |
| (b) | Security exempt from registration under Rule 144A of the Securities Act of 1933, as amended. These securities may be resold in transactions exempt from registration, normally to qualified institutional buyers. At November 30, 2016, the market value of rule 144A securities amounted to $7,281,224 or 1.80% of net assets. |
| | |
| (c) | Westmoreland Coal Co. has a variable interest rate that floats quarterly on March, June, September, and December. The interest rate is based on the 3-month Libor rate plus 6.50%. |
| | |
| (d) | Micron Technologies, Inc. has a variable interest rate that floats quarterly in January, April, July, and October. The interest rate is based on the 3-month Libor rate plus 6.00%. |
| | |
| (e) | All or a portion of this security was on loan at November 30, 2016. The aggregate cost and market value of securities on loan at November 30, 2016 is $1,286,713 and $1,320,292, respectively. |
At November 30, 2016, the following futures contracts were outstanding with $460,131 in cash segregated with the broker for margin maintenance purposes: |
| Contract Description | | Contract
Expiration | | Contract
Value | | | Unrealized
Appreciation/
(Depreciation) | |
| | | | | | | | |
| Short, 210 U.S. Treasury 10-Year Note futures contracts | | 3/17 | | $ | 26,145,000 | | | $ | 115,693 | |
| | | | | | | | | | | |
| Net payments of variation margin and/or brokerage fees | | | | | | | | | 790 | |
| | | | | | | | | | | |
| Variation margin receivable on open futures contracts | | | | | | | | $ | 116,483 | |
| | | | | | | | | | | |
| | | | | | | | | | | |
| | | | | | | | | | | |
The accompanying notes are an integral part of the financial statements.
53
Sentinel Unconstrained Bond Fund
(Unaudited)
 Jason Doiron, FRM, PRM Portfolio Manager | Performance Highlights |
| The Sentinel Unconstrained Bond Fund’s Class I shares produced a total return of 2.16% for the fiscal year ending November 30, 2016. This compares to returns of 0.59% for the Bank of America/Merrill Lynch U.S. Dollar 3-Month LIBOR Constant Maturity Index and 3.67% for the Morningstar Nontraditional Bond category average for the same time period. |
| Bond Market Review |
| Following a period of election and central bank induced volatility in financial markets early in Q4 2016, risk assets recovered significantly in anticipation of material fiscal stimulus following the surprise victory for President-Elect Trump. As the calendar moved past the election market, participants celebrated accelerating Global Purchasing Managers’ Indexes (PMIs), a strong pick-up in U.S. growth and an OPEC/non-OPEC agreement to cut crude oil production. Higher readings for inflation and less accommodative talk from global central banks such as the U.S. Federal Reserve Bank, European Central Bank and the Bank of England were more than offset by the prospect for stronger global and U.S. growth in the future and did not lead to the market jitters experienced in Q3 2016. The Bloomberg Barclays U.S. Corporate High Yield Index ended the month of November 25 basis points (bps) tighter from its Q3 close while the S&P 500 rose more than 1.4%. |
| | U.S. Treasury securities moved significantly higher in yield in the first two months of Q4 2016 with the 10-year U.S. Treasury yield rising 79 bps to 2.38% from 1.59%. Realized inflation began to accelerate globally while the surprise victory for President-Elect Trump saw markets anticipate a significant increase in fiscal stimulus. Inflation expectations accelerated in the U.S. with 5-year inflation break even rising 32 bps by the end of November from 1.48% to 1.80%. The 30-year U.S. Treasury yield slightly underperformed the 5-year U.S. Treasury yield by 3 bps at the end of November from the start of the quarter, as the market weighed the potential for greater fiscal stimulus, inflation and long-end treasury issuance versus a potentially faster pace of U.S. Federal Reserve Bank interest rate increases. Relative to developed global markets, U.S. Treasury security and spread products continued to offer a superior yield advantage, resulting in them being particularly attractive to foreign and global investors. |
| | |
| | Key Performance Attribution |
| | |
| | The Unconstrained Bond Fund Class I shares returned 2.16% during the 12 months ending November 30, 2016 outperforming the Bank of America/Merrill Lynch U.S. Dollar 3-Month LIBOR Constant Maturity Index by 1.46%. During the year, the yield on the 10-year U.S. Treasury rose 18 bps to 2.38% from 2.21%, while the Fund was, on average, long duration* vs. the benchmark by 2.55 years. The Fund’s long duration position resulted in 81 bps of outperformance vs. the benchmark. Risk assets performed quite well during the year with the Option Adjusted Spread (OAS) on the Bloomberg Barclays U.S. Corporate Index tightening by 26 bps, and the OAS on the Bloomberg Barclays U.S. Corporate High Yield Index tightening by 148 bps. Largely due to the strong performance of risk assets, the Fund’s asset allocation call contributed 246 bps to outperformance, with 152 bps coming from a 15.1% average overweight to high yield credit and 34.9 bps coming from a 22.9% overweight to investment grade credit. Security selection within high yield credit was modestly positive contributing 1 bp to relative performance, while security selection within investment grade resulted in 55 bps of underperformance. In addition, security selection within the Fund’s Agency Mortgage Backed Securities (MBS) portfolio resulted in 5 bps of underperformance. |
| | |
| * | Effective duration is a measure of the sensitivity of a bond’s price to changes in interest rates. The shorter (longer) the duration, the lower (higher) the interest rate risk and price volatility. |
The Standard & Poor’s 500 Index is an unmanaged index of approximately 500 widely held U.S. equity securities chosen for market size, liquidity, and industry group representation.
The Bank of America/Merrill Lynch U.S. Dollar 3-Month LIBOR Constant Maturity Index represents the London interbank offered rate (LIBOR) with a constant 3-month average maturity. LIBOR, published by the British Bankers’ Association, is a composite of the rates of interest at which banks borrow from one another in the London market, and is a widely used benchmark for short-term interest rates.
The Bloomberg Barclays U.S. Corporate High Yield Index is an unmanaged index of U.S. dollar-denominated, non-investment grade, fixed-rate, taxable corporate bonds. Securities are classified as high yield if the middle rating of Moody’s, Fitch, and S&P is Ba1/BB+/BB+ or below, excluding emerging market debt.
The Bloomberg Barclays U.S. Corporate Index (Investment Grade) is a broad-based benchmark that measures the investment grade, U.S. dollar-dominated fixed-rate, taxable corporate bond market. It includes USD-denominated securities publicly issued by U.S. and non-U.S. industrial, utility, and financial issuers that meet specified maturity, liquidity, and quality requirements.
An investment cannot be made directly in an index.
The return for the Morningstar category is an average of funds within the particular category as determined by Morningstar based on investment styles as measured by their underlying portfolio holdings.
54
Sentinel Unconstrained Bond Fund
| | During the fiscal year, the Fund’s usage of U.S. Treasury Futures resulted in 10 basis points of underperformance relative to the Bank of America/Merrill Lynch U.S. Dollar 3-Month LIBOR Constant Maturity Index. Of the underperformance, 4 basis points was due to the impact of the trades on the Fund’s effective duration, while 6 basis points was due to other effects. In addition, the Fund utilized Standard & Poor’s 500 Index Futures at various points during the year as a way of hedging the Fund’s exposure to high yield corporate credit. Overall, the Fund’s utilization of Standard & Poor’s 500 Index Futures resulted in 13 basis points of outperformance relative to Bank of America/Merrill Lynch U.S. Dollar 3-Month LIBOR Constant Maturity Index. |
| | |
| | Portfolio Positioning and Outlook |
| | |
| | Looking ahead into Q1 2017, there is growing optimism amongst market participants that U.S. growth and inflation will accelerate as the incoming Trump Administration attempts to implement a number of fiscal stimulus measures including infrastructure investment, tax cuts, de-regulation and the repatriation of foreign earnings held abroad. At the same time the U.S. Federal Reserve Board is likely to take additional steps towards normalizing interest rates while the European Central Bank and Bank of England take additional steps towards unwinding their quantitative easing programs. For the first time in years, markets are likely to continue to experience rising headline inflation across most developed market Consumer Price Indexes (CPI) in the coming quarters due in part to favorable base effects from the Energy sector that already existed prior to an OPEC and non-OPEC agreement to curb crude oil production. While central banks are likely to initially dismiss this rising inflation as “transitory” with more time needed to judge its sustainability, a faster rate of policy removal may occur should realized inflation start to prove stronger than that assumed in forward projections. Even though U.S. growth and inflation were showing signs of acceleration in Q3 and the early parts of Q4, 2016, financial markets have currently priced a very optimistic view of stronger U.S. growth due to fiscal stimulus expectations. Should the incoming administration not deliver as quickly on some or all of these growth measures at the same time the markets are experiencing faster inflation and less accommodative global central bank policy, interest rate and risk markets may experience a period of price discovery. Investment strategies that are able to remain flexible in anticipation of a potential increase in volatility associated with these unknowns are likely to be favored in this environment. |
| | |
| |  |
55
Sentinel Unconstrained Bond Fund
Performance Notes (Unaudited)
Graph and total return data assumes reinvestment of all distributions. Fund performance in the graphs and table reflects expenses and management fees but does not reflect the effect of any taxes on fund distributions or redemptions. Growth of Class A shares in the graph reflects the 2.25% maximum sales charge. Growth of Class C shares in the graph does not reflect the 1% contingent deferred sales charge (CDSC) applicable to redemptions within the first year, because none would apply if the shares were held for the full period. Index performance does not reflect any sales charges, fees or expenses. Data shown represents past performance; past performance does not guarantee future results; current performance may be higher or lower than that shown. Investment return and principal value will vary so that you may have a gain or loss when you sell shares. Before investing, carefully consider a fund’s objectives, risks, charges and expenses. Summary and full prospectuses containing this and other information are available from sentinelinvestments.com. Please read them carefully. Visit www.sentinelinvestments.com for the most current month-end performance information.
Growth of a $10,000 Investment (Class A shares and Class C shares)
From Inception – November 30, 2016
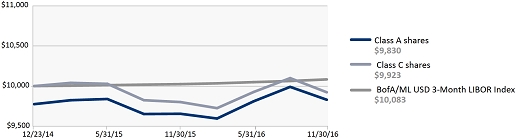
Growth of a $1,000,000 Investment (Class I shares)
From Inception – November 30, 2016

Average Annual Total Returns (as of November 30, 2016)
| | | Class A shares | Class C shares | Class I shares | | | | |
| | | Without | | With 2.25% | | Without | | With 1% | | No | | | | |
| | | Sales Charge | | Sales Charge | | CDSC | | CDSC | | Sales Charge | | Class | | Symbol |
| 1 year | | 1.81 | % | | -0.44 | % | | 1.24 | % | | 0.24 | % | | 2.16 | % | | A | | SUBAX |
| Since inception | | 0.29 | | | -0.88 | | | -0.40 | | | -0.40 | | | 0.51 | | | C | | SUBCX |
Inception Date of the Fund – 12/23/14 | | | | | | | | | I | | SUBIX |
Class I shares do not impose a sales charge. Only eligible investors may purchase Class I shares, as described in the Prospectus.
The following are total annual operating expense ratios for Sentinel Unconstrained Bond Fund Class A, C & I shares: A – 1.41%, C – 2.85%, I – 1.05%. Expense ratio data is sourced from the Fund’s most recent prospectus.
Fixed income securities are subject to credit and interest rate risk. Bond values will generally decrease when interest rates rise and will generally increase when interest rates fall. Bonds with lower credit ratings are more speculative and likely to default than higher quality bonds and tend to fluctuate more widely in value. Mortgage-backed securities (MBS) are subject to pre-payment risks. These risks may result in greater share price volatility. Fund shares are not insured or guaranteed by the US government or its agencies. International securities are subject to political influences, currency fluctuations and economic cycles that may be unrelated to those affecting the domestic financial markets and may experience wider price fluctuations than US domestic securities. The Fund may invest in distressed securities, which are securities that are near, or currently going through, bankruptcy. These securities tend to offer higher yields, but may have greater risk that may result in the Fund’s share price declining. An active trading approach increases the Fund’s costs and may reduce the Fund’s performance. It may also increase the amount of capital gains that the Fund pays. The Fund may engage in short sales. Short selling involves certain risks, including potential additional costs associated with covering short positions and a possibility of unlimited losses on certain short sale positions. The Fund may engage in certain transactions, such as derivative transactions, that may result in the Fund becoming leveraged. Leverage risk may expose the Fund to potential losses that exceed the amount originally invested by the Fund. At times, due to adverse market conditions, the Fund may not be able to sell certain securities without a substantial loss in price, if at all. The Fund has an absolute return orientation and is therefore not managed relative to an index. However, the Fund’s primary benchmark, as noted in the current prospectus, is the BofA Merrill Lynch U.S. Dollar 3-Month LIBOR Constant Maturity Index
The Fund may use derivatives, which are financial contracts whose value depends upon or is derived from the value of an underlying asset, reference rate, or index. The Fund may use derivatives as part of a strategy designed to reduce exposure to certain risks, such as risks associated with changes in interest rates, or currency or credit risk (“hedging”). The use of derivatives may reduce the Fund’s return and increase the volatility in movements in the Fund’s net asset value. For additional information regarding the use of derivatives, please see the Fund’s current prospectus.
A CDSC of up to 0.50% may apply to investments of $500,000 or more in Class A shares which are redeemed within 12 months. See the Prospectus.
The BofA/Merrill Lynch U.S. Dollar 3-Month LIBOR Constant Maturity Index represents the London interbank offered rate (LIBOR) with a constant 3-month average maturity. LIBOR, published by the British Bankers’ Association, is a composite of the rates of interest at which banks borrow from one another in the London market, and is a widely used benchmark for short-term interest rates. An investment cannot be made directly in an index.
56
Sentinel Unconstrained Bond Fund
Fund Profile
at November 30, 2016
Average Effective Duration (Unaudited)
| | Percent of |
| Duration | Fixed Income Holdings |
| Less than 1 yr. | 53.6% |
| 1 yr. to 2.99 yrs. | 8.7% |
| 3 yrs. to 3.99 yrs. | 4.9% |
Average Effective Duration (for all Fixed Income Holdings) 1.3 years**
| | Percent of |
| Duration | Fixed Income Holdings |
| 4 yrs. to 5.99 yrs. | 18.8% |
| 6 yrs. to 7.99 yrs. | 2.7% |
| 8 yrs. and over | 11.3% |
Top 10 Holdings*
| | | | | | Maturity | | Percent of | |
| Description | | Coupon | | | Date | | Net Assets | |
| FNMA AS7106 | | | 3.50 | % | | 05/01/46 | | | 3.7 | % |
| FNMA AU1628 | | | 3.00 | % | | 07/01/43 | | | 3.2 | % |
| FNMA AH8925 | | | 4.50 | % | | 03/01/41 | | | 2.4 | % |
| FHLMC Q33006 | | | 3.50 | % | | 04/01/45 | | | 2.3 | % |
| FNMA AZ5591 | | | 4.00 | % | | 08/01/45 | | | 2.0 | % |
| | | | | | | | | |
| | | | | | | | | |
| | | | | | Maturity | | Percent of | |
| Description | | Coupon | | | Date | | Net Assets | |
| FNMA BC4492 | | | 4.50 | % | | 12/01/39 | | | 1.9 | % |
| FHLMC G08637 | | | 4.00 | % | | 04/01/45 | | | 1.9 | % |
| FNMA TBA 15 YR Dec | | | 2.50 | % | | 12/16/31 | | | 1.7 | % |
| FHLMC Q32917 | | | 3.00 | % | | 04/01/45 | | | 1.7 | % |
| FNMA 890739 | | | 2.50 | % | | 08/01/31 | | | 1.6 | % |
| Total of Net Assets | | | | | | | | | 22.4 | % |
*The average effective duration considers the call and put dates of applicable fixed income investments and the pre-payment risks of mortgage-backed bonds to measure the sensitivity of the value of the Fund’s portfolio to changes in interest rates.
** “Top 10 Holdings” excludes any short-term investments and money market funds. Portfolio composition and holdings are subject to change. More complete holdings follow.
Schedule of Investments
at November 30, 2016
| | | Principal | | | |
| | | Amount | | Value | |
| | | (M=$1,000) | | (Note 2) | |
| U.S. Government Obligations 38.9% |
| U.S. Government Agency Obligations 38.9% |
| Federal Home Loan Bank 15.1% | | | |
| Agency Discount Notes: | | | | | | | | |
| 0.1%, 12/01/16 | | | 4,000 M | | | $ | 4,000,000 | |
| Federal Home Loan Mortgage Corporation 5.9% | | | |
| Mortgage-Backed Securities: |
| 30-Year: | | | | | | | | |
FHLMC Q32917
3%, 04/01/45 | | | 445 M | | | | 444,065 | |
FHLMC Q33006
3.5%, 04/01/45 | | | 590 M | | | | 604,627 | |
FHLMC G08637
4%, 04/01/45 | | | 486 M | | | | 510,687 | |
| Total Federal Home Loan Mortgage Corporation | | | | 1,559,379 | |
| Federal National Mortgage Association 17.9% | | | | | |
| Mortgage-Backed Securities: |
| 15-Year: | | | | | | | | |
FNMA TBA 15 YR Dec
2.5%, 12/16/31(a) | | | 450 M | | | | 451,565 | |
| 20-Year: | | | | | | | | |
FNMA 890739
2.5%, 08/01/31 | | | 417 M | | | | 419,378 | |
| | | Principal | | | |
| | | Amount | | Value | |
| | | (M=$1,000) | | (Note 2) | |
| 30-Year: | | | | | | | | |
FNMA BC4492
4.5%, 12/01/39 | | | 480 M | | | $ | 517,940 | |
FNMA AH8925
4.5%, 03/01/41 | | | 586 M | | | | 634,091 | |
FNMA AU1628
3%, 07/01/43 | | | 847 M | | | | 846,607 | |
| FNMA AZ5591 4%, 08/01/45 | | | 509 M | | | | 535,241 | |
FNMA AZ7347
3%, 11/01/45 | | | 366 M | | | | 363,905 | |
FNMA AS7106
3.5%, 05/01/46 | | | 951 M | | | | 976,243 | |
| | | | | | | | 3,874,027 | |
| Total Federal National Mortgage Association | | | | 4,744,970 | |
Total U.S. Government Obligations
(Cost $10,444,172) | | | | 10,304,349 | |
| Domestic Corporate Bonds 6.5% | | | | | |
| Basic Industry 0.5% | | | | | | | | |
CF Industries, Inc.
4.95%, 06/01/43 | | | 170 M | | | | 134,725 | |
| Capital Goods 0.3% | | | | | | | | |
LafargeHolcim Finance US LLC
3.5%, 09/22/26(b) | | | 75 M | | | | 72,787 | |
| Communications 1.8% | | | | | |
AMC Networks, Inc.
5%, 04/01/24 | | | 135 M | | | | 135,337 | |
AT&T, Inc.
3.8%, 03/15/22 | | | 152 M | | | | 155,087 | |
| | | Principal | | | |
| | | Amount | | Value | |
| | | (M=$1,000) | | (Note 2) | |
CSC Holdings LLC
10.875%, 10/15/25(b) | | | 100 M | | | $ | 116,500 | |
GCI, Inc.
6.875%, 04/15/25 | | | 74 M | | | | 73,815 | |
| | | | | | | | 480,739 | |
| Consumer Cyclical 0.8% | | | | | |
General Motors Financial Co., Inc.
3.2%, 07/06/21 | | | 100 M | | | | 98,795 | |
QVC, Inc.
5.45%, 08/15/34 | | | 140 M | | | | 122,712 | |
| | | | | | | | 221,507 | |
| Consumer Non-Cyclical 1.1% | | | | | |
Cardinal Health, Inc.
4.9%, 09/15/45 | | | 120 M | | | | 125,873 | |
Express Scripts Holding Co.
3.4%, 03/01/27 | | | 150 M | | | | 141,908 | |
Zoetis, Inc.
3.25%, 02/01/23 | | | 35 M | | | | 34,669 | |
| | | | | | | | 302,450 | |
| Energy 0.2% | | | | | | | | |
Westmoreland Coal Co.
8.75%, 01/01/22(b) | | | 50 M | | | | 42,625 | |
| Financials 0.2% | | | | | | | | |
Citizens Financial Group, Inc.
4.3%, 12/03/25 | | | 49 M | | | | 49,488 | |
| Insurance 0.3% | | | | | | | | |
Manulife Financial Corp.
4.15%, 03/04/26 | | | 85 M | | | | 88,804 | |
The accompanying notes are an integral part of the financial statements.
57
Sentinel Unconstrained Bond Fund
| | | Principal | | | |
| | | Amount | | Value | |
| | | (M=$1,000) | | (Note 2) | |
| Real Estate 0.5% | | | | | | |
Retail Opportunity Investments Partnership LP
5%, 12/15/23 | | | 125 M | | | $ | 128,344 | |
| Technology 0.8% | | | | | | | | |
Diamond 1 Finance Corp / Diamond 2 Finance Corp.
7.125%, 06/15/24(b) | | | 60 M | | | | 65,507 | |
| Ingram Micro, Inc. 4.95%, 12/15/24 | | | 140 M | | | | 137,408 | |
| | | | | | | | 202,915 | |
Total Domestic Corporate Bonds
(Cost $1,775,984) | | | | 1,724,384 | |
| Bank Loans 0.6% | | | | | |
| Energy 0.3% | | | | | | | | |
| Westmoreland Coal Co. 7.3357%, 12/16/20(c) | | | 90 M | | | | 76,562 | |
| Technology 0.3% | | | | | | |
| Micron Technology, Inc. | | | | | |
| 6.8579%, 04/26/22(d) | | | 70 M | | | | 70,561 | |
Total Bank Loans
(Cost $135,153) | | | | 147,123 | |
| Asset Backed Securities 0.4% | | | | | |
Taco Bell Funding, LLC
3.832%, 05/25/26(b)
(Cost $99,750) | | | 100 M | | | | 100,521 | |
| | | | | | Value | |
| | | Shares | | | (Note 2) | |
| Domestic Exchange Traded Funds 15.8% |
| Bond Funds 15.8% | | | | | |
| iShares iBoxx $ Investment Grade Corporate Bond ETF | | | 20,567 | | | | 2,403,048 | |
| SPDR Barclays Short Term Corporate Bond ETF | | | 58,924 | | | | 1,799,539 | |
Total Domestic Exchange Traded Funds
(Cost $4,163,528) | | 4,202,587 | |
| Institutional Money Market Funds 38.5% |
| State Street Institutional U.S. Government Money Market Fund |
Premier Class
(Cost $10,192,447) | | | 10,192,447 | | | | 10,192,447 | |
Total Investments 100.7%
(Cost $26,811,034)† | | | | 26,671,411 | |
| Excess of Liabilities Over Other Assets (0.7)% | | | | (176,744) | |
| Net Assets 100.0% | | | | $ | 26,494,667 | |
| | | |
| † | | Cost for federal income tax purposes is $26,875,288. At November 30, 2016 unrealized depreciation for federal income tax purposes aggregated $203,877 of which $20,932 related to appreciated securities and $224,809 related to depreciated securities. |
| | | |
| (a) | | The actual mortgage-backed security that will be delivered is not designated until 48 hours prior to the established trade settlement date with the broker. |
| | | |
| (b) | | Security exempt from registration under Rule 144A of the Securities Act of 1933, as amended. These securities may be resold in transactions exempt from registration, normally to qualified institutional buyers. At November 30, 2016, the market value of rule 144A securities amounted to $397,940 or 1.50% of net assets. |
| | | |
| (c) | | Westmoreland Coal Co. has a variable interest rate that floats quarterly on March, June, September, and December. The interest rate is based on the 3-month Libor rate plus 6.50%. |
| | | |
| (d) | | Micron Technologies, Inc. has a variable interest rate that floats quarterly in January, April, July, and October. The interest rate is based on the 3-month Libor rate plus 6.00%. |
At November 30, 2016, the following futures contracts were outstanding with $249,549 in cash segregated with the broker for margin maintenance purposes:
| | | | | | | | Unrealized |
| | | Contract | | Contract | | Appreciation/ |
| Contract Description | | Expiration | | Value | | (Depreciation) |
| | | | | | | |
| Short, 40 U.S. Treasury 10-Year Note futures contracts | | 3/17 | | $ | 4,980,000 | | | | $22,037 | |
| | | | | | | | | | | |
| Net payments of variation margin and/or brokerage fees | | | | | | | | | 150 | |
| | | | | | | | | | | |
| Variation margin receivable on open futures contracts | | | | | | | | | $22,187 | |
The accompanying notes are an integral part of the financial statements.
58
Page intentionally left blank.
59
Statement of Assets and Liabilities
at November 30, 2016
| | | Balanced | | Common
Stock | | Government
Securities | | International
Equity |
| Assets | | | | | | | | | | | | | | | | |
| Investments at value | | $ | 327,011,037 | | | $ | 2,009,482,604 | | | $ | 204,850,992 | | | $ | 160,417,062 | |
| Cash | | | – | | | | – | | | | – | | | | 32,197 | |
| Foreign cash (Cost $1,912,286) | | | – | | | | – | | | | – | | | | 1,910,195 | |
| Receivable for securities sold | | | 410,569 | | | | 15,273,490 | | | | – | | | | 916,345 | |
| Receivable for fund shares sold | | | 213,873 | | | | 643,807 | | | | 76,219 | | | | 646,007 | |
| Receivable for interest | | | 141,522 | | | | – | | | | 587,573 | | | | – | |
| Receivable for dividends | | | 494,251 | | | | 4,703,613 | | | | – | | | | 134,407 | |
| Receivable for dividend tax reclaims | | | – | | | | 258,479 | | | | – | | | | 391,024 | |
| Receivable from Fund Advisor | | | – | | | | 3,581 | | | | – | | | | – | |
| Total Assets | | | 328,271,252 | | | | 2,030,365,574 | | | | 205,514,784 | | | | 164,447,237 | |
| | | | | | | | | | | | | | | | | |
| Liabilities | | | | | | | | | | | | | | | | |
| Payable for securities purchased | | | 4,992,455 | | | | – | | | | 5,864,604 | | | | 1,911,782 | |
| Payable for fund shares repurchased | | | 313,358 | | | | 11,052,021 | | | | 515,710 | | | | 1,218,365 | |
| Accrued expenses | | | 109,481 | | | | 451,803 | | | | 123,909 | | | | 85,672 | |
| Management fee payable | | | 139,778 | | | | 960,995 | | | | 74,626 | | | | 92,894 | |
| Distribution fee payable (Class A Shares) | | | 54,145 | | | | 275,272 | | | | 25,681 | | | | 23,898 | |
| Distribution fee payable (Class C Shares) | | | 35,091 | | | | 67,632 | | | | 17,664 | | | | 4,694 | |
| Fund accounting fee payable | | | 9,716 | | | | 61,087 | | | | 6,123 | | | | 4,900 | |
| Directors’ and Chief Compliance Officer’s fees payable | | | 1,565 | | | | 2,968 | | | | 2,538 | | | | 1,129 | |
| Deferred compensation (see note 3) | | | 162,156 | | | | 850,139 | | | | 235,538 | | | | 83,540 | |
| Total Liabilities | | | 5,817,745 | | | | 13,721,917 | | | | 6,866,393 | | | | 3,426,874 | |
| Net Assets | | $ | 322,453,507 | | | $ | 2,016,643,657 | | | $ | 198,648,391 | | | $ | 161,020,363 | |
| | | | | | | | | | | | | | | | | |
| Net Assets Represent | | | | | | | | | | | | | | | | |
| Capital stock at par value | | $ | 163,835 | | | $ | 477,915 | | | $ | 203,705 | | | $ | 104,149 | |
| Paid-in capital | | | 223,192,008 | | | | 934,428,727 | | | | 255,614,145 | | | | 156,511,653 | |
| Accumulated undistributed (distributions in excess of) net investment income (loss) | | | 590,626 | | | | 6,778,552 | | | | (4,682 | ) | | | 475,407 | |
| Accumulated undistributed net realized gain (loss) on investments and foreign currency transactions | | | 2,015,293 | | | | 113,154,487 | | | | (58,457,105 | ) | | | (229,676 | ) |
| Unrealized appreciation (depreciation) of investments and foreign exchange | | | 96,491,745 | | | | 961,803,976 | | | | 1,292,328 | | | | 4,158,830 | |
| Net Assets | | $ | 322,453,507 | | | $ | 2,016,643,657 | | | $ | 198,648,391 | | | $ | 161,020,363 | |
| Investments at Cost | | $ | 230,519,292 | | | $ | 1,047,678,628 | | | $ | 203,558,664 | | | $ | 156,212,890 | |
| | | | | | | | | | | | | | | | | |
| Net Asset Value and Maximum Offering Price Per Share | | | | | | | | | | | | | | | | |
| Class A Shares* | | | | | | | | | | | | | | | | |
| Net Assets Applicable to Class A Shares/ | | $ | 264,910,339 | | | $ | 1,350,860,586 | | | $ | 154,133,005 | | | $ | 114,616,241 | |
| Shares Outstanding | | | 13,461,269 | | | | 31,949,509 | | | | 15,808,530 | | | | 7,382,771 | |
| Net Asset Value per Share | | $ | 19.68 | | | $ | 42.28 | | | $ | 9.75 | | | $ | 15.52 | |
| Sales Charge | | | 1.04 | | | | 2.23 | | | | 0.22 | | | | 0.82 | |
| Maximum Offering Price** | | $ | 20.72 | | | $ | 44.51 | | | $ | 9.97 | | | $ | 16.34 | |
| Class C Shares* | | | | | | | | | | | | | | | | |
| Net Assets Applicable to Class C Shares/ | | $ | 43,066,223 | | | $ | 83,245,707 | | | $ | 20,953,783 | | | $ | 5,876,112 | |
| Shares Outstanding | | | 2,182,307 | | | | 2,058,538 | | | | 2,146,146 | | | | 400,805 | |
| Net Asset Value per Share*** | | $ | 19.73 | | | $ | 40.44 | | | $ | 9.76 | | | $ | 14.66 | |
| Class I Shares* | | | | | | | | | | | | | | | | |
| Net Assets Applicable to Class I Shares/ | | $ | 14,476,945 | | | $ | 552,610,573 | | | $ | 23,561,603 | | | $ | 40,528,010 | |
| Shares Outstanding | | | 739,906 | | | | 13,076,341 | | | | 2,415,857 | | | | 2,631,322 | |
| Net Asset Value per Share*** | | $ | 19.57 | | | $ | 42.26 | | | $ | 9.75 | | | $ | 15.40 | |
| Class R6 Shares* | | | | | | | | | | | | | | | | |
| Net Assets Applicable to Class R6 Shares/ | | | N/A | | | $ | 29,926,791 | | | | N/A | | | | N/A | |
| Shares Outstanding | | | N/A | | | | 707,129 | | | | N/A | | | | N/A | |
| Net Asset Value per Share*** | | | N/A | | | $ | 42.32 | | | | N/A | | | | N/A | |
See notes to Statement of Assets and Liabilities at the end of the schedule.
Amounts designated as “-” are either $0 or have been rounded to $0.
The accompanying notes are an integral part of the financial statements.
60
Statement of Assets and Liabilities
| | | Low Duration
Bond | | Multi-Asset
Income | | Small
Company | | Sustainable Core
Opportunities |
| Assets | | | | | | | | | | | | | | | | |
| Investments at value | | $ | 354,425,643 | | | $ | 320,484,163 | | | $ | 1,018,239,877 | | | $ | 361,668,625 | |
| Cash | | | 43,589 | | | | 70,172 | | | | – | | | | – | |
| Receivable for securities sold | | | 11,572,959 | | | | 13,643,986 | | | | 54,512,560 | | | | 752,401 | |
| Receivable for fund shares sold | | | 281,604 | | | | 489,430 | | | | 1,636,343 | | | | 22,182 | |
| Receivable for interest | | | 479,597 | | | | 400,600 | | | | – | | | | – | |
| Receivable for dividends | | | – | | | | – | | | | 1,711,592 | | | | 698,066 | |
| Receivable for dividend tax reclaims | | | – | | | | 21,868 | | | | – | | | | – | |
| Receivable for securities lending income | | | 53 | | | | 15,850 | | | | – | | | | – | |
| Receivable from Fund Advisor | | | – | | | | – | | | | 3,330 | | | | – | |
| Total Assets | | | 366,803,445 | | | | 335,126,069 | | | | 1,076,103,702 | | | | 363,141,274 | |
| | | | | | | | | | | | | | | | | |
| Liabilities | | | | | | | | | | | | | | | | |
| Payable to custodian bank | | | – | | | | – | | | | 6 | | | | – | |
| Payable for collateral on securities loaned | | | – | | | | 10,672,850 | | | | – | | | | – | |
| Payable for securities purchased | | | 11,681,310 | | | | 20,695,935 | | | | 6,051,435 | | | | – | |
| Payable for fund shares repurchased | | | 3,180,057 | | | | 613,882 | | | | 1,032,856 | | | | 88,933 | |
| Accrued expenses | | | 150,350 | | | | 116,066 | | | | 339,667 | | | | 97,675 | |
| Management fee payable | | | 133,946 | | | | 132,745 | | | | 557,552 | | | | 205,630 | |
| Distribution fee payable (Class A Shares) | | | 20,391 | | | | 25,808 | | | | 136,108 | | | | 69,082 | |
| Distribution fee payable (Class C Shares) | | | – | | | | 87,580 | | | | 87,976 | | | | – | |
| Distribution fee payable (Class S Shares) | | | 97,781 | | | | – | | | | – | | | | – | |
| Fund accounting fee payable | | | 10,990 | | | | 9,197 | | | | 31,184 | | | | 10,846 | |
| Directors’ and Chief Compliance Officer’s fees payable | | | 2,645 | | | | 1,829 | | | | 4,828 | | | | 1,388 | |
| Deferred compensation (see note 3) | | | 423,678 | | | | 109,743 | | | | 730,211 | | | | 75,460 | |
| Total Liabilities | | | 15,701,148 | | | | 32,465,635 | | | | 8,971,823 | | | | 549,014 | |
| Net Assets | | $ | 351,102,297 | | | $ | 302,660,434 | | | $ | 1,067,131,879 | | | $ | 362,592,260 | |
| | | | | | | | | | | | | | | | | |
| Net Assets Represent | | | | | | | | | | | | | | | | |
| Capital stock at par value | | $ | 416,863 | | | $ | 249,908 | | | $ | 2,137,605 | | | $ | 170,965 | |
| Paid-in capital | | | 478,824,680 | | | | 301,281,627 | | | | 780,671,415 | | | | 264,520,893 | |
| Accumulated undistributed (distributions in excess of) net investment income (loss) | | | (156,919 | ) | | | (87,379 | ) | | | (3,393,354 | ) | | | 2,532,666 | |
| Accumulated undistributed net realized gain (loss) on investments and foreign currency transactions | | | (127,247,329 | ) | | | 2,244,280 | | | | 85,716,246 | | | | 4,083,187 | |
| Unrealized appreciation (depreciation) of investments and foreign exchange | | | (734,998 | ) | | | (1,028,002 | ) | | | 201,999,967 | | | | 91,284,549 | |
| Net Assets | | $ | 351,102,297 | | | $ | 302,660,434 | | | $ | 1,067,131,879 | | | $ | 362,592,260 | |
| Investments at Cost | | $ | 355,160,641 | | | $ | 321,509,590 | | | $ | 816,239,910 | | | $ | 270,384,076 | |
| | | | | | | | | | | | | | | | | |
| Net Asset Value and Maximum Offering Price Per Share | | | | | | | | | | | | | | | | |
| Class A Shares* | | | | | | | | | | | | | | | | |
| Net Assets Applicable to Class A Shares/ | | $ | 98,167,194 | | | $ | 125,475,420 | | | $ | 685,806,556 | | | $ | 340,814,857 | |
| Shares Outstanding | | | 11,668,177 | | | | 10,336,147 | | | | 132,266,573 | | | | 16,074,268 | |
| Net Asset Value per Share | | $ | 8.41 | | | $ | 12.14 | | | $ | 5.19 | | | $ | 21.20 | |
| Sales Charge | | | 0.08 | | | | 0.64 | | | | 0.27 | | | | 1.12 | |
| Maximum Offering Price** | | $ | 8.49 | | | $ | 12.78 | | | $ | 5.46 | | | $ | 22.32 | |
| Class C Shares* | | | | | | | | | | | | | | | | |
| Net Assets Applicable to Class C Shares/ | | | N/A | | | $ | 105,852,101 | | | $ | 110,842,167 | | | | N/A | |
| Shares Outstanding | | | N/A | | | | 8,763,637 | | | | 32,673,484 | | | | N/A | |
| Net Asset Value per Share*** | | | N/A | | | $ | 12.08 | | | $ | 3.39 | | | | N/A | |
| Class I Shares* | | | | | | | | | | | | | | | | |
| Net Assets Applicable to Class I Shares/ | | $ | 17,802,289 | | | $ | 71,332,913 | | | $ | 257,483,006 | | | $ | 21,777,403 | |
| Shares Outstanding | | | 2,112,126 | | | | 5,891,037 | | | | 46,340,118 | | | | 1,022,261 | |
| Net Asset Value per Share*** | | $ | 8.43 | | | $ | 12.11 | | | $ | 5.56 | | | $ | 21.30 | |
| Class R6 Shares* | | | | | | | | | | | | | | | | |
| Net Assets Applicable to Class R6 Shares/ | | | N/A | | | | N/A | | | $ | 13,000,150 | | | | N/A | |
| Shares Outstanding | | | N/A | | | | N/A | | | | 2,480,292 | | | | N/A | |
| Net Asset Value per Share*** | | | N/A | | | | N/A | | | $ | 5.24 | | | | N/A | |
| Class S Shares* | | | | | | | | | | | | | | | | |
| Net Assets Applicable to Class S Shares/ | | $ | 235,132,814 | | | | N/A | | | | N/A | | | | N/A | |
| Shares Outstanding | | | 27,905,988 | | | | N/A | | | | N/A | | | | N/A | |
| Net Asset Value per Share*** | | $ | 8.43 | | | | N/A | | | | N/A | | | | N/A | |
See notes to Statement of Assets and Liabilities at the end of the schedule.Amounts designated as “-” are either $0 or have been rounded to $0.
The accompanying notes are an integral part of the financial statements.
61
Statement of Assets and Liabilities
| | | Total Return
Bond | | Unconstrained
Bond |
| Assets | | | | | | | | |
| Investments at value | | $ | 416,806,302 | | | $ | 26,671,411 | |
| Cash | | | 5,093 | | | | 205 | |
| Cash collateral with futures commission merchant | | | 460,131 | | | | 249,549 | |
| Receivable for securities sold | | | 9,970,556 | | | | – | |
| Receivable for fund shares sold | | | 287,904 | | | | – | |
| Receivable for interest | | | 919,947 | | | | 48,472 | |
| Receivable for securities lending income | | | 2,290 | | | | – | |
| Variation margin receivable on futures contracts | | | 116,483 | | | | 22,187 | |
| Receivable from Fund Advisor | | | 5,811 | | | | – | |
| Total Assets | | | 428,574,517 | | | | 26,991,824 | |
| | | | | | | | | |
| Liabilities | | | | | | | | |
| Payable for collateral on securities loaned | | | 1,353,175 | | | | – | |
| Payable for securities purchased | | | 21,551,073 | | | | 456,627 | |
| Payable for fund shares repurchased | | | 692,179 | | | | – | |
| Accrued expenses | | | 174,619 | | | | 20,953 | |
| Management fee payable | | | 179,142 | | | | 16,377 | |
| Distribution fee payable (Class A Shares) | | | 15,434 | | | | 17 | |
| Distribution fee payable (Class C Shares) | | | 25,943 | | | | 140 | |
| Fund accounting fee payable | | | 12,680 | | | | 806 | |
| Directors’ and Chief Compliance Officer’s fees payable | | | 3,697 | | | | 233 | |
| Deferred compensation (see note 3) | | | 80,309 | | | | 2,004 | |
| Total Liabilities | | | 24,088,251 | | | | 497,157 | |
| Net Assets | | $ | 404,486,266 | | | $ | 26,494,667 | |
| | | | | | | | | |
| Net Assets Represent | | | | | | | | |
| Capital stock at par value | | $ | 394,946 | | | $ | 27,060 | |
| Paid-in capital | | | 437,385,916 | | | | 27,003,831 | |
| Accumulated undistributed (distributions in excess of) net investment income (loss) | | | (58,425 | ) | | | (1,007 | ) |
| Accumulated undistributed net realized gain (loss) on investments | | | (34,570,379 | ) | | | (417,631 | ) |
| Unrealized appreciation (depreciation) of investments | | | 1,334,208 | | | | (117,586 | ) |
| Net Assets | | $ | 404,486,266 | | | $ | 26,494,667 | |
| Investments at Cost | | $ | 415,587,787 | | | $ | 26,811,034 | |
| | | | | | | | | |
| Net Asset Value and Maximum Offering Price Per Share | | | | | | | | |
| Class A Shares* | | | | | | | | |
| Net Assets Applicable to Class A Shares/ | | $ | 92,331,093 | | | $ | 5,130,897 | |
| Shares Outstanding | | | 9,020,100 | | | | 524,525 | |
| Net Asset Value per Share | | $ | 10.24 | | | $ | 9.78 | |
| Sales Charge | | | 0.24 | | | | 0.23 | |
| Maximum Offering Price** | | $ | 10.48 | | | $ | 10.01 | |
| Class C Shares* | | | | | | | | |
| Net Assets Applicable to Class C Shares/ | | $ | 30,865,813 | | | $ | 1,648,065 | |
| Shares Outstanding | | | 3,023,333 | | | | 169,045 | |
| Net Asset Value per Share*** | | $ | 10.21 | | | $ | 9.75 | |
| Class I Shares* | | | | | | | | |
| Net Assets Applicable to Class I Shares/ | | $ | 280,081,352 | | | $ | 19,715,705 | |
| Shares Outstanding | | | 27,333,228 | | | | 2,012,396 | |
| Net Asset Value per Share*** | | $ | 10.25 | | | $ | 9.80 | |
| Class R3 Shares* | | | | | | | | |
| Net Assets Applicable to Class R3 Shares/ | | $ | 603,020 | | | | N/A | |
| Shares Outstanding | | | 58,918 | | | | N/A | |
| Net Asset Value per Share*** | | $ | 10.23 | | | | N/A | |
| Class R6 Shares* | | | | | | | | |
| Net Assets Applicable to Class R6 Shares/ | | $ | 604,988 | | | | N/A | |
| Shares Outstanding | | | 59,057 | | | | N/A | |
| Net Asset Value per Share*** | | $ | 10.24 | | | | N/A | |
See notes to Statement of Assets and Liabilities at the end of the schedule.
Amounts designated as “-” are either $0 or have been rounded to $0.
The accompanying notes are an integral part of the financial statements.
62
Statement of Assets and Liabilities
| * | The redemption price per share is equal to the net asset value less any applicable contingent deferred sales charge. |
| | |
| ** | For the Balanced Fund, Common Stock Fund, International Equity Fund, Multi-Asset Income Fund, Small Company Fund and Sustainable Core Opportunities Fund, the maximum offering price is 1000/950 times the net asset value per share. For the Government Securities Fund, Total Return Bond Fund and Unconstrained Bond Fund, the maximum offering price is 1000/977.5 times the net asset value per share. For the Low Duration Bond Fund, the maximum offering price is 1000/990 times the net asset value per share. |
| | |
| *** | The maximum offering price is equal to the net asset value. |
The accompanying notes are an integral part of the financial statements.
63
Statement of Operations
for the fiscal year ended November 30, 2016
| | | Balanced | | Common
Stock | | Government
Securities | | International
Equity | | Low Duration
Bond |
| Investment Income | | | | | | | | | | | | | | | | | | | | |
| Dividends | | $ | 5,550,015 | * | | $ | 48,464,360 | * | | $ | 9,590 | | | $ | 3,711,929 | * | | $ | 4,428,539 | |
| Interest | | | 1,349,442 | | | | 51,960 | | | | 5,861,703 | | | | 8,081 | | | | 5,747,816 | |
| Securities Lending (Net of lending agent fees) | | | – | | | | – | | | | – | | | | – | | | | 126,382 | |
| Total Income | | $ | 6,899,457 | | | $ | 48,516,320 | | | $ | 5,871,293 | | | $ | 3,720,010 | | | $ | 10,302,737 | |
| Expenses | | | | | | | | | | | | | | | | | | | | |
| Management advisory fee | | | 1,660,856 | | | | 12,005,685 | | | | 1,040,626 | | | | 1,059,783 | | | | 1,852,106 | |
| Transfer agent fees (Class A Shares) | | | 323,990 | | | | 1,284,757 | | | | 252,848 | | | | 269,816 | | | | 130,971 | |
| Transfer agent fees (Class C Shares) | | | 46,193 | | | | 97,595 | | | | 28,708 | | | | 20,614 | | | | – | |
| Transfer agent fees (Class I Shares) | | | 7,282 | | | | 365,035 | | | | 24,665 | | | | 24,322 | | | | 9,328 | |
| Transfer agent fees (Class R3 Shares) | | | – | | | | – | | | | – | | | | – | | | | – | |
| Transfer agent fees (Class R6 Shares) | | | – | | | | 59 | | | | – | | | | – | | | | – | |
| Transfer agent fees (Class S Shares) | | | – | | | | – | | | | – | | | | – | | | | 84,553 | |
| Custodian fees | | | 34,250 | | | | 115,300 | | | | 28,000 | | | | 50,000 | | | | 45,000 | |
| Distribution expense (Class A Shares) | | | 652,950 | | | | 3,378,438 | | | | 349,634 | | | | 290,665 | | | | 266,340 | |
| Distribution expense (Class C Shares) | | | 393,169 | | | | 848,794 | | | | 240,377 | | | | 53,378 | | | | – | |
| Distribution expense (Class R3 Shares) | | | – | | | | – | | | | – | | | | – | | | | – | |
| Distribution expense (Class S Shares) | | | – | | | | – | | | | – | | | | – | | | | 1,335,805 | |
| Accounting and administration services | | | 115,005 | | | | 769,602 | | | | 85,188 | | | | 55,779 | | | | 151,611 | |
| Auditing fees | | | 28,300 | | | | 151,750 | | | | 25,500 | | | | 18,300 | | | | 35,100 | |
| Legal fees | | | 12,000 | | | | 90,000 | | | | 10,300 | | | | 7,750 | | | | 15,750 | |
| Reports and notices to shareholders | | | 15,750 | | | | 69,650 | | | | 14,600 | | | | 12,800 | | | | 19,800 | |
| Registration and filing fees (Class A Shares) | | | 23,367 | | | | 34,100 | | | | 20,274 | | | | 19,707 | | | | 19,513 | |
| Registration and filing fees (Class C Shares) | | | 12,531 | | | | 12,483 | | | | 11,616 | | | | 11,148 | | | | – | |
| Registration and filing fees (Class I Shares) | | | 15,463 | | | | 24,550 | | | | 12,364 | | | | 18,768 | | | | 12,578 | |
| Registration and filing fees (Class R3 Shares) | | | – | | | | – | | | | – | | | | – | | | | – | |
| Registration and filing fees (Class R6 Shares) | | | – | | | | 13,522 | | | | – | | | | – | | | | – | |
| Registration and filing fees (Class S Shares) | | | – | | | | – | | | | – | | | | – | | | | 24,996 | |
| Directors’ and Chief Compliance Officer’s fees and expenses | | | 59,234 | | | | 385,698 | | | | 49,571 | | | | 29,533 | | | | 88,571 | |
| Other | | | 22,884 | | | | 103,263 | | | | 22,326 | | | | 60,709 | | | | 32,180 | |
| Total Expenses | | | 3,423,224 | | | | 19,750,281 | | | | 2,216,597 | | | | 2,003,072 | | | | 4,124,202 | |
| Expense Reimbursements/Waivers | | | – | | | | (16,833 | ) | | | – | | | | – | | | | – | |
| Net Expenses | | | 3,423,224 | | | | 19,733,448 | | | | 2,216,597 | | | | 2,003,072 | | | | 4,124,202 | |
| Net Investment Income (Loss) | | | 3,476,233 | | | | 28,782,872 | | | | 3,654,696 | | | | 1,716,938 | | | | 6,178,535 | |
| |
| Realized and Unrealized Gain (Loss) on Investments, Futures Contracts and Foreign Currency Transactions or Translations |
| Net realized gain (loss) from: | | | | | | | | | | | | | | | | | | | | |
| Investments | | | 2,962,825 | | | | 115,784,099 | | | | 74,503 | | | | (229,675 | ) | | | (2,727,040 | ) |
| Futures contracts | | | (186,717 | ) | | | – | | | | 11,404 | | | | – | | | | (3,231,308 | ) |
| Short sales | | | – | | | | – | | | | (77,500 | ) | | | – | | | | – | |
| Foreign currency transactions | | | (504 | ) | | | (4,238 | ) | | | – | | | | (304,981 | ) | | | – | |
| Net realized gain (loss) | | | 2,775,604 | | | | 115,779,861 | | | | 8,407 | | | | (534,656 | ) | | | (5,958,348 | ) |
| Net change in unrealized appreciation (depreciation) during the period: | | | | | | | | | | | | | | | | | | | | |
| Investments | | | 8,122,265 | | | | 5,723,736 | | | | (2,350,516 | ) | | | (9,067,167 | ) | | | 2,073,168 | |
| Futures contracts | | | – | | | | – | | | | – | | | | – | | | | (733,228 | ) |
| Foreign currency translations | | | – | | | | – | | | | – | | | | (12,391 | ) | | | – | |
| Net change in unrealized appreciation (depreciation) | | | 8,122,265 | | | | 5,723,736 | | | | (2,350,516 | ) | | | (9,079,558 | ) | | | 1,339,940 | |
| Net Realized and Unrealized Gain (Loss) on Investments, Futures Contracts and Foreign Currency Transactions or Translations | | | 10,897,869 | | | | 121,503,597 | | | | (2,342,109 | ) | | | (9,614,214 | ) | | | (4,618,408 | ) |
| Net Increase (Decrease) in Net Assets from Operations | | $ | 14,374,102 | | | $ | 150,286,469 | | | $ | 1,312,587 | | | $ | (7,897,276 | ) | | $ | 1,560,127 | |
Amounts designated as “-” are either $0 or have been rounded to $0.
| * | Net of foreign tax withholding of $36,899 in the Sentinel Balanced Fund, $239,244 in the Sentinel Common Stock Fund, $372,045 in the Sentinel International Equity Fund, $486 in the Sentinel Multi-Asset Income Fund, $138,001 in the Sentinel Small Company Fund and $66,895 in the Sentinel Sustainable Core Opportunities Fund. |
The accompanying notes are an integral part of the financial statements.
64
Statement of Operations
Multi-Asset
Income | | Small
Company | | Sustainable Core
Opportunities | | Total Return
Bond | | Unconstrained
Bond |
| | | | | | | | | |
| $ | 8,276,801 | * | | $ | 7,825,606 | * | | $ | 6,443,742 | * | | $ | 5,684,706 | | | $ | 278,304 | |
| | 3,009,878 | | | | 102,648 | | | | 14,288 | | | | 10,190,953 | | | | 331,541 | |
| | 200,600 | | | | – | | | | – | | | | 104,244 | | | | 5,644 | |
| $ | 11,487,279 | | | $ | 7,928,254 | | | $ | 6,458,030 | | | $ | 15,979,903 | | | $ | 615,489 | |
| | | | | | | | | | | | | | | | | | | |
| | 1,546,635 | | | | 6,279,690 | | | | 2,206,505 | | | | 2,992,393 | | | | 197,129 | |
| | 142,830 | | | | 1,175,021 | | | | 406,010 | | | | 434,069 | | | | 338 | |
| | 110,527 | | | | 173,454 | | | | – | | | | 36,653 | | | | 412 | |
| | 75,048 | | | | 246,656 | | | | 8,778 | | | | 551,998 | | | | 273 | |
| | – | | | | – | | | | – | | | | 9 | | | | – | |
| | – | | | | 113 | | | | – | | | | 9 | | | | – | |
| | – | | | | – | | | | – | | | | – | | | | – | |
| | 34,300 | | | | 63,375 | | | | 23,800 | | | | 70,655 | | | | 17,500 | |
| | 311,491 | | | | 1,610,933 | | | | 740,442 | | | | 349,702 | | | | 180 | |
| | 1,063,985 | | | | 1,028,218 | | | | – | | | | 364,802 | | | | 2,074 | |
| | – | | | | – | | | | – | | | | – | + | | | – | |
| | – | | | | – | | | | – | | | | – | | | | – | |
| | 106,591 | | | | 346,252 | | | | 116,139 | | | | 220,370 | | | | 9,683 | |
| | 28,850 | | | | 81,550 | | | | 25,250 | | | | 50,950 | | | | 11,500 | |
| | 12,850 | | | | 76,050 | | | | 13,850 | | | | 27,060 | | | | 1,300 | |
| | 21,500 | | | | 75,150 | | | | 23,300 | | | | 51,550 | | | | 2,400 | |
| | 16,821 | | | | 27,986 | | | | 22,254 | | | | 22,168 | | | | 14,435 | |
| | 15,477 | | | | 14,440 | | | | – | | | | 11,929 | | | | 12,710 | |
| | 16,723 | | | | 18,952 | | | | 11,900 | | | | 24,167 | | | | 17,557 | |
| | – | | | | – | | | | – | | | | 13,364 | | | | – | |
| | – | | | | 13,428 | | | | – | | | | 13,389 | | | | – | |
| | – | | | | – | | | | – | | | | – | | | | – | |
| | | | | | | | | | | | | | | | | | | |
| | 53,589 | | | | 192,299 | | | | 57,288 | | | | 102,927 | | | | 4,591 | |
| | 30,040 | | | | 56,935 | | | | 26,379 | | | | 48,766 | | | | 7,421 | |
| | 3,587,257 | | | | 11,480,502 | | | | 3,681,895 | | | | 5,386,930 | | | | 299,503 | |
| | – | | | | (15,217 | ) | | | – | | | | (331,829 | ) | | | – | |
| | 3,587,257 | | | | 11,465,285 | | | | 3,681,895 | | | | 5,055,101 | | | | 299,503 | |
| | 7,900,022 | | | | (3,537,031 | ) | | | 2,776,135 | | | | 10,924,802 | | | | 315,986 | |
| | | | | | | | | | | | | | | | | | | |
| | | | | | | | | | | | | | | | | | | |
| | 2,834,425 | | | | 89,651,921 | | | | 4,319,614 | | | | (8,233,155 | ) | | | (336,391 | ) |
| | (17,459 | ) | | | – | | | | – | | | | (4,020,816 | ) | | | (21,108 | ) |
| | – | | | | – | | | | – | | | | – | | | | – | |
| | 0 | | | | – | | | | (235 | ) | | | – | | | | – | |
| | 2,816,966 | | | | 89,651,921 | | | | 4,319,379 | | | | (12,253,971 | ) | | | (357,499 | ) |
| | | | | | | | | | | | | | | | | | | |
| | 2,207,962 | | | | 34,009,436 | | | | 14,727,631 | | | | 11,009,805 | | | | 459,701 | |
| | (40,750 | ) | | | – | | | | – | | | | 1,035,679 | | | | 96,084 | |
| | 374 | | | | – | | | | – | | | | – | | | | – | |
| | 2,167,586 | | | | 34,009,436 | | | | 14,727,631 | | | | 12,045,484 | | | | 555,785 | |
| | | | | | | | | | | | | | | | | | | |
| | 4,984,552 | | | | 123,661,357 | | | | 19,047,010 | | | | (208,487 | ) | | | 198,286 | |
| | | | | | | | | | | | | | | | | | | |
| $ | 12,884,574 | | | $ | 120,124,326 | | | $ | 21,823,145 | | | $ | 10,716,315 | | | $ | 514,272 | |
| + | The Sentinel Total Return Bond Class R3 did not incur any distribution expense for the fiscal year ended November 30, 2016 because NLV Financial Corporation and its affiliates owned 100% of the shares outstanding for the entire the period and do not get charged a distribution fee. |
The accompanying notes are an integral part of the financial statements.
65
Statement of Changes in Net Assets
| | | Balanced | | Common Stock |
| | | | | |
| | | For the Fiscal
Year Ended
11/30/16 | | For the Fiscal
Year Ended
11/30/15 | | For the Fiscal
Year Ended
11/30/16 | | For the Fiscal
Year Ended
11/30/15 |
| Increase (Decrease) in Net Assets from Operations | | | | | | | | | | | | | | | | |
| Net investment income (loss) | | $ | 3,476,233 | | | $ | 6,646,659 | | | $ | 28,782,872 | | | $ | 57,228,159 | |
| Net realized gain (loss) on investments, futures contracts and foreign currency transactions | | | 2,775,604 | | | | 10,192,601 | | | | 115,779,861 | | | | 138,152,598 | |
| Net change in unrealized appreciation (depreciation) | | | 8,122,265 | | | | (15,372,594 | ) | | | 5,723,736 | | | | (150,347,812 | ) |
| Net increase (decrease) in net assets from operations | | | 14,374,102 | | | | 1,466,666 | | | | 150,286,469 | | | | 45,032,945 | |
| | | | | | | | | | | | | | | | | |
| Distributions to Shareholders | | | | | | | | | | | | | | | | |
| From net investment income | | | | | | | | | | | | | | | | |
| Class A Shares | | | (5,903,448 | ) | | | (4,062,686 | ) | | | (35,777,405 | ) | | | (15,612,830 | ) |
| Class C Shares | | | (557,296 | ) | | | (237,186 | ) | | | (1,690,016 | ) | | | (379,386 | ) |
| Class I Shares | | | (306,472 | ) | | | (255,394 | ) | | | (19,023,933 | ) | | | (10,302,768 | ) |
| Class R6 Shares | | | – | | | | – | | | | (588,231 | ) | | | (4,506 | )^ |
| Class S Shares | | | – | | | | – | | | | – | | | | – | |
| From net realized gain on investments, futures contracts and foreign currency transactions |
| Class A Shares | | | (8,375,703 | ) | | | (11,763,488 | ) | | | (88,022,127 | ) | | | (604,559 | ) |
| Class C Shares | | | (1,138,389 | ) | | | (1,356,821 | ) | | | (5,826,909 | ) | | | (36,258 | ) |
| Class I Shares | | | (402,692 | ) | | | (708,771 | ) | | | (42,756,022 | ) | | | (358,148 | ) |
| Class R6 Shares | | | – | | | | – | | | | (1,116,259 | ) | | | – | ^ |
| Total distributions to shareholders | | | (16,684,000 | ) | | | (18,384,346 | ) | | | (194,800,902 | ) | | | (27,298,455 | ) |
| | | | | | | | | | | | | | | | | |
| From Capital Share Transactions (see Note 4) | | | | | | | | | | | | | | | | |
| Net proceeds from sales of shares | | | | | | | | | | | | | | | | |
| Class A Shares | | | 29,691,528 | | | | 23,861,729 | | | | 79,630,789 | | | | 84,981,083 | |
| Class C Shares | | | 12,858,314 | | | | 9,011,518 | | | | 8,735,036 | | | | 9,956,513 | |
| Class I Shares | | | 7,158,331 | | | | 4,072,939 | | | | 95,152,331 | | | | 85,436,343 | |
| Class R6 Shares | | | – | | | | – | | | | 21,445,402 | | | | 18,271,227 | ^ |
| Class S Shares | | | – | | | | – | | | | – | | | | – | |
| Net asset value of shares in reinvestment of dividends and distributions |
| Class A Shares | | | 13,537,834 | | | | 15,102,868 | | | | 108,807,856 | | | | 13,880,529 | |
| Class C Shares | | | 1,594,901 | | | | 1,483,968 | | | | 7,117,912 | | | | 389,957 | |
| Class I Shares | | | 607,739 | | | | 829,281 | | | | 49,976,190 | | | | 8,456,949 | |
| Class R6 Shares | | | – | | | | – | | | | 1,704,490 | | | | 4,506 | ^ |
| Class S Shares | | | – | | | | – | | | | – | | | | – | |
| | | | 65,448,647 | | | | 54,362,303 | | | | 372,570,006 | | | | 221,377,107 | |
| Less: Payments for shares reacquired (less any redemption fees, if applicable) |
| Class A Shares | | | (39,491,955 | ) | | | (39,681,584 | ) | | | (227,322,184 | ) | | | (270,288,496 | ) |
| Class C Shares | | | (6,674,997 | ) | | | (5,488,684 | ) | | | (20,322,699 | ) | | | (11,752,833 | ) |
| Class I Shares | | | (5,727,660 | ) | | | (8,513,296 | ) | | | (266,012,904 | ) | | | (344,571,754 | ) |
| Class R6 Shares | | | – | | | | – | | | | (11,518,479 | ) | | | (5,991 | )^ |
| Class S Shares | | | – | | | | – | | | | – | | | | – | |
| Increase (decrease) in net assets from capital stock transactions | | | 13,554,035 | | | | 678,739 | | | | (152,606,260 | ) | | | (405,241,967 | ) |
| Total Increase (Decrease) in Net Assets for period | | | 11,244,137 | | | | (16,238,941 | ) | | | (197,120,693 | ) | | | (387,507,477 | ) |
| Net Assets: Beginning of period | | $ | 311,209,370 | | | $ | 327,448,311 | | | $ | 2,213,764,350 | | | $ | 2,601,271,827 | |
| Net Assets: End of period | | $ | 322,453,507 | | | $ | 311,209,370 | | | $ | 2,016,643,657 | | | $ | 2,213,764,350 | |
| Accumulated Undistributed Net Investment Income (Loss) | | $ | 590,626 | | | $ | 3,231,368 | | | $ | 6,778,552 | | | $ | 35,077,185 | |
Amounts designated as “-” are either $0 or have been rounded to $0. ^Commenced operations December 23, 2014.
The accompanying notes are an integral part of the financial statements.
66
Statement of Changes in Net Assets
| Government Securities | | International Equity | | Low Duration Bond |
| | | | | |
For the Fiscal
Year Ended
11/30/16 | | For the Fiscal
Year Ended
11/30/15 | | For the Fiscal
Year Ended
11/30/16 | | For the Fiscal
Year Ended
11/30/15 | | For the Fiscal
Year Ended
11/30/16 | | For the Fiscal
Year Ended
11/30/15 |
| | | | | | | | | | | | | | | | | | | | | | | |
| $ | 3,654,696 | | | $ | 4,881,801 | | | $ | 1,716,938 | | | $ | 966,930 | | | $ | 6,178,535 | | | $ | 11,057,346 | |
| | 8,407 | | | | 1,127,259 | | | | (534,656 | ) | | | 3,749,006 | | | | (5,958,348 | ) | | | (11,806,918 | ) |
| | (2,350,516 | ) | | | (3,818,948 | ) | | | (9,079,558 | ) | | | 515,061 | | | | 1,339,940 | | | | (1,107,422 | ) |
| | 1,312,587 | | | | 2,190,112 | | | | (7,897,276 | ) | | | 5,230,997 | | | | 1,560,127 | | | | (1,856,994 | ) |
| | | | | | | | | | | | | | | | | | | | | | | |
| | | | | | | | | | | | | | | | | | | | | | | |
| | (4,307,434 | ) | | | (5,217,805 | ) | | | (813,762 | ) | | | (1,982,769 | ) | | | (2,130,933 | ) | | | (3,168,959 | ) |
| | (399,329 | ) | | | (451,781 | ) | | | – | | | | (13,523 | ) | | | – | | | | – | |
| | (870,054 | ) | | | (883,603 | ) | | | (163,018 | ) | | | (245,170 | ) | | | (860,829 | ) | | | (1,082,534 | ) |
| | – | | | | – | | | | – | | | | – | | | | – | | | | – | |
| | – | | | | – | | | | – | | | | – | | | | (4,922,936 | ) | | | (8,012,454 | ) |
| | – | | | | – | | | | (3,278,878 | ) | | | (17,301,096 | ) | | | – | | | | – | |
| | – | | | | – | | | | (146,299 | ) | | | (570,781 | ) | | | – | | | | – | |
| | – | | | | – | | | | (435,123 | ) | | | (1,639,546 | ) | | | – | | | | – | |
| | – | | | | – | | | | – | | | | – | | | | – | | | | – | |
| | (5,576,817 | ) | | | (6,553,189 | ) | | | (4,837,080 | ) | | | (21,752,885 | ) | | | (7,914,698 | ) | | | (12,263,947 | ) |
| | | | | | | | | | | | | | | | | | | | | | | |
| | | | | | | | | | | | | | | | | | | | | | | |
| | 24,614,152 | | | | 21,695,540 | | | | 25,111,407 | | | | 11,784,319 | | | | 19,495,835 | | | | 30,710,943 | |
| | 2,068,296 | | | | 2,874,086 | | | | 2,310,222 | | | | 1,737,380 | | | | – | | | | – | |
| | 21,195,509 | | | | 6,459,081 | | | | 41,542,080 | | | | 9,561,873 | | | | 5,124,239 | | | | 15,797,045 | |
| | – | | | | – | | | | – | | | | – | | | | – | | | | – | |
| | – | | | | – | | | | – | | | | – | | | | 49,214,306 | | | | 69,466,806 | |
| | | | | | | | | | | | | | | | | | | | | | | |
| | 3,325,630 | | | | 3,836,963 | | | | 3,919,623 | | | | 18,620,092 | | | | 1,923,945 | | | | 2,841,554 | |
| | 307,980 | | | | 363,583 | | | | 142,064 | | | | 559,229 | | | | – | | | | – | |
| | 800,621 | | | | 784,908 | | | | 545,916 | | | | 1,557,978 | | | | 810,670 | | | | 1,042,531 | |
| | – | | | | – | | | | – | | | | – | | | | – | | | | – | |
| | – | | | | – | | | | – | | | | – | | | | 4,718,391 | | | | 7,533,589 | |
| | | | | | | | | | | | | | | | | | | | | | | |
| | 52,312,188 | | | | 36,014,161 | | | | 73,571,312 | | | | 43,820,871 | | | | 81,287,386 | | | | 127,392,468 | |
| | | | | | | | | | | | | | | | | | | | | | | |
| | (60,102,480 | ) | | | (100,863,010 | ) | | | (17,785,789 | ) | | | (17,904,016 | ) | | | (39,542,564 | ) | | | (99,706,460 | ) |
| | (6,635,019 | ) | | | (12,523,239 | ) | | | (835,594 | ) | | | (650,957 | ) | | | – | | | | – | |
| | (27,001,119 | ) | | | (28,186,104 | ) | | | (14,105,725 | ) | | | (5,626,383 | ) | | | (35,348,983 | ) | | | (12,339,622 | ) |
| | – | | | | – | | | | – | | | | – | | | | – | | | | – | |
| | – | | | | – | | | | – | | | | – | | | | (157,013,852 | ) | | | (241,351,230 | ) |
| | (41,426,430 | ) | | | (105,558,192 | ) | | | 40,844,204 | | | | 19,639,515 | | | | (150,618,013 | ) | | | (226,004,844 | ) |
| | (45,690,660 | ) | | | (109,921,269 | ) | | | 28,109,848 | | | | 3,117,627 | | | | (156,972,584 | ) | | | (240,125,785 | ) |
| $ | 244,339,051 | | | $ | 354,260,320 | | | $ | 132,910,515 | | | $ | 129,792,888 | | | $ | 508,074,881 | | | $ | 748,200,666 | |
| $ | 198,648,391 | | | $ | 244,339,051 | | | $ | 161,020,363 | | | $ | 132,910,515 | | | $ | 351,102,297 | | | $ | 508,074,881 | |
| $ | (4,682 | ) | | $ | (38,208 | ) | | $ | 475,407 | | | $ | 40,326 | | | $ | (156,919 | ) | | $ | 10,959 | |
The accompanying notes are an integral part of the financial statements.
67
Statement of Changes in Net Assets
| | | Multi-Asset Income | | Small Company |
| | | | | |
| | | For the Fiscal
Year Ended
11/30/16 | | For the Fiscal
Year Ended
11/30/15 | | For the Fiscal
Year Ended
11/30/16 | | For the Fiscal
Year Ended
11/30/15 |
| Increase (Decrease) in Net Assets from Operations | | | | | | | | | | | | | | | | |
| Net investment income (loss) | | $ | 7,900,022 | | | $ | 7,910,510 | | | $ | (3,537,031 | ) | | $ | (5,951,214 | ) |
| Net realized gain (loss) on investments, futures contracts and foreign currency transactions | | | 2,816,966 | | | | 18,768,639 | | | | 89,651,921 | | | | 159,761,226 | |
| Net change in unrealized appreciation (depreciation) | | | 2,167,586 | | | | (27,212,616 | ) | | | 34,009,436 | | | | (101,340,354 | ) |
| Net increase (decrease) in net assets from operations | | | 12,884,574 | | | | (533,467 | ) | | | 120,124,326 | | | | 52,469,658 | |
| | | | | | | | | | | | | | | | | |
| Distributions to Shareholders | | | | | | | | | | | | | | | | |
| From net investment income | | | | | | | | | | | | | | | | |
| Class A Shares | | | (3,804,134 | ) | | | (3,943,620 | ) | | | – | | | | (92,932 | ) |
| Class C Shares | | | (2,493,853 | ) | | | (2,544,321 | ) | | | – | | | | – | |
| Class I Shares | | | (1,952,874 | ) | | | (1,763,263 | ) | | | – | | | | (583,908 | ) |
| Class R3 Shares | | | – | | | | – | | | | – | | | | – | |
| Class R6 Shares | | | – | | | | – | | | | – | | | | – | ^ |
| From net realized gain on investments, futures contracts and foreign currency transactions |
| Class A Shares | | | (8,370,582 | ) | | | (9,334,234 | ) | | | (99,287,043 | ) | | | (173,084,804 | ) |
| Class C Shares | | | (7,183,716 | ) | | | (7,803,468 | ) | | | (24,962,262 | ) | | | (36,860,930 | ) |
| Class I Shares | | | (3,316,347 | ) | | | (3,755,350 | ) | | | (34,832,569 | ) | | | (59,912,873 | ) |
| Class R6 Shares | | | – | | | | – | | | | (106,313 | ) | | | – | ^ |
| Return of capital | | | | | | | | | | | | | | | | |
| Class A Shares | | | – | | | | – | | | | – | | | | – | |
| Class C Shares | | | – | | | | – | | | | – | | | | – | |
| Class I Shares | | | – | | | | – | | | | – | | | | – | |
| Class R3 Shares | | | – | | | | – | | | | – | | | | – | |
| Class R6 Shares | | | – | | | | – | | | | – | | | | – | ^ |
| Total distributions to shareholders | | | (27,121,506 | ) | | | (29,144,256 | ) | | | (159,188,187 | ) | | | (270,535,447 | ) |
| | | | | | | | | | | | | | | | | |
| From Capital Share Transactions (see Note 4) | | | | | | | | | | | | | | | | |
| Net proceeds from sales of shares | | | | | | | | | | | | | | | | |
| Class A Shares | | | 32,131,589 | | | | 20,393,271 | | | | 61,857,550 | | | | 76,523,359 | |
| Class C Shares | | | 16,899,594 | | | | 19,476,870 | | | | 9,681,443 | | | | 13,800,621 | |
| Class I Shares | | | 39,644,173 | | | | 21,607,310 | | | | 81,203,549 | | | | 84,252,510 | |
| Class R3 Shares | | | – | | | | – | | | | – | | | | – | |
| Class R6 Shares | | | – | | | | – | | | | 12,035,697 | | | | 607,092 | ^ |
| Net asset value of shares issued in share reorganizations (see Note 5) |
| Class A Shares | | | – | | | | – | | | | 97,558,873 | | | | – | |
| Class C Shares | | | – | | | | – | | | | 8,942,615 | | | | – | |
| Class I Shares | | | – | | | | – | | | | 5,382,625 | | | | – | |
| Net asset value of shares in reinvestment of dividends and distributions |
| Class A Shares | | | 11,049,560 | | | | 12,028,645 | | | | 91,333,636 | | | | 157,165,559 | |
| Class C Shares | | | 8,013,354 | | | | 8,214,943 | | | | 23,881,812 | | | | 34,890,466 | |
| Class I Shares | | | 3,640,014 | | | | 3,664,751 | | | | 27,513,172 | | | | 47,549,623 | |
| Class R3 Shares | | | – | | | | – | | | | – | | | | – | |
| Class R6 Shares | | | – | | | | – | | | | 106,313 | | | | – | ^ |
| | | | 111,378,284 | | | | 85,385,790 | | | | 419,497,285 | | | | 414,789,230 | |
| Less: Payments for shares reacquired (less any redemption fees, if applicable) |
| Class A Shares | | | (38,002,917 | ) | | | (33,229,372 | ) | | | (140,182,495 | ) | | | (180,775,547 | ) |
| Class C Shares | | | (22,793,696 | ) | | | (24,854,347 | ) | | | (26,656,802 | ) | | | (24,144,511 | ) |
| Class I Shares | | | (20,111,918 | ) | | | (25,235,719 | ) | | | (71,757,069 | ) | | | (111,368,391 | ) |
| Class R3 Shares | | | – | | | | – | | | | – | | | | – | |
| Class R6 Shares | | | – | | | | – | | | | (902,962 | ) | | | – | ^ |
| Increase (decrease) in net assets from capital stock transactions | | | 30,469,753 | | | | 2,066,352 | | | | 179,997,957 | | | | 98,500,781 | |
| Total Increase (Decrease) in Net Assets for period | | | 16,232,821 | | | | (27,611,371 | ) | | | 140,934,096 | | | | (119,565,008 | ) |
| Net Assets: Beginning of period | | $ | 286,427,613 | | | $ | 314,038,984 | | | $ | 926,197,783 | | | $ | 1,045,762,791 | |
| Net Assets: End of period | | $ | 302,660,434 | | | $ | 286,427,613 | | | $ | 1,067,131,879 | | | $ | 926,197,783 | |
| Accumulated Undistributed Net Investment Income (Loss) | | $ | (87,379 | ) | | $ | (70,077 | ) | | $ | (3,393,354 | ) | | $ | (5,143,678 | ) |
Amounts designated as “-” are either $0 or have been rounded to $0. ^Commenced operations December 23, 2014.
The accompanying notes are an integral part of the financial statements.
68
Statement of Changes in Net Assets
| Sustainable Core Opportunities | | Total Return Bond | | Unconstrained Bond |
For the Fiscal
Year Ended
11/30/16 | | For the Fiscal
Year Ended
11/30/15 | | For the Fiscal
Year Ended
11/30/16 | | For the Fiscal
Year Ended
11/30/15 | | For the Fiscal
Year Ended
11/30/16 | | For the Fiscal
Period
From 12/23/2014^
To 11/30/15 |
| | | | | | | | | | | | | | | | | | | | | | | |
| $ | 2,776,135 | | | $ | 4,604,997 | | | $ | 10,924,802 | | | $ | 15,049,095 | | | $ | 315,986 | | | $ | 294,369 | |
| | 4,319,379 | | | | 15,830,816 | | | | (12,253,971 | ) | | | (6,567,316 | ) | | | (357,499 | ) | | | 76,093 | |
| | 14,727,631 | | | | (20,857,725 | ) | | | 12,045,484 | | | | (16,183,443 | ) | | | 555,785 | | | | (673,371 | ) |
| | 21,823,145 | | | | (421,912 | ) | | | 10,716,315 | | | | (7,701,664 | ) | | | 514,272 | | | | (302,909 | ) |
| | | | | | | | | | | | | | | | | | | | | | | |
| | | | | | | | | | | | | | | | | | | | | | | |
| | (4,474,311 | ) | | | (1,906,452 | ) | | | (3,815,602 | ) | | | (5,426,418 | ) | | | (71,662 | ) | | | (60,026 | ) |
| | – | | | | – | | | | (497,955 | ) | | | (542,061 | ) | | | (12,684 | ) | | | (13,526 | ) |
| | (337,144 | ) | | | (157,936 | ) | | | (8,927,701 | ) | | | (10,927,682 | ) | | | (300,800 | ) | | | (243,281 | ) |
| | – | | | | – | | | | (13,448 | ) | | | (8,076 | )^ | | | – | | | | – | |
| | – | | | | – | | | | (14,632 | ) | | | (8,815 | )^ | | | – | | | | – | |
| | (2,179,023 | ) | | | – | | | | – | | | | – | | | | (8,936 | ) | | | – | |
| | – | | | | – | | | | – | | | | – | | | | (2,951 | ) | | | – | |
| | (143,886 | ) | | | – | | | | – | | | | – | | | | (33,721 | ) | | | – | |
| | – | | | | – | | | | – | | | | – | ^ | | | – | | | | – | |
| | – | | | | – | | | | – | | | | (24,847 | ) | | | – | | | | – | |
| | – | | | | – | | | | – | | | | (2,482 | ) | | | – | | | | – | |
| | – | | | | – | | | | – | | | | (50,038 | ) | | | – | | | | – | |
| | – | | | | – | | | | – | | | | (37 | )^ | | | – | | | | – | |
| | – | | | | – | | | | – | | | | (40 | )^ | | | – | | | | – | |
| | (7,134,364 | ) | | | (2,064,388 | ) | | | (13,269,338 | ) | | | (16,990,496 | ) | | | (430,754 | ) | | | (316,833 | ) |
| | | | | | | | | | | | | | | | | | | | | | | |
| | | | | | | | | | | | | | | | | | | | | | | |
| | 8,022,869 | | | | 6,704,855 | | | | 41,880,984 | | | | 235,695,135 | | | | 35,764 | | | | 5,072,430 | |
| | – | | | | – | | | | 4,139,515 | | | | 8,931,684 | | | | 70,000 | | | | 1,678,001 | |
| | 3,820,607 | | | | 1,476,714 | | | | 128,444,099 | | | | 253,896,698 | | | | 466,495 | | | | 19,095,591 | |
| | – | | | | – | | | | – | | | | 600,000 | ^ | | | – | | | | – | |
| | – | | | | – | | | | – | | | | 600,000 | ^ | | | – | | | | – | |
| | 116,823,960 | | | | – | | | | – | | | | – | | | | – | | | | – | |
| | – | | | | – | | | | – | | | | – | | | | – | | | | – | |
| | 5,888,166 | | | | – | | | | – | | | | – | | | | – | | | | – | |
| | | | | | | | | | | | | | | | | | | | | | | |
| | 6,451,037 | | | | 1,846,836 | | | | 3,566,841 | | | | 5,201,907 | | | | 80,597 | | | | 60,026 | |
| | – | | | | – | | | | 480,800 | | | | 521,360 | | | | 15,636 | | | | 13,526 | |
| | 437,802 | | | | 143,388 | | | | 6,633,825 | | | | 8,371,324 | | | | 331,845 | | | | 243,240 | |
| | – | | | | – | | | | 13,448 | | | | 8,113 | ^ | | | – | | | | – | |
| | – | | | | – | | | | 14,632 | | | | 8,855 | ^ | | | – | | | | – | |
| | 141,444,441 | | | | 10,171,793 | | | | 185,174,144 | | | | 513,835,076 | | | | 1,000,337 | | | | 26,162,814 | |
| | | | | | | | | | | | | | | | | | | | | | | |
| | (29,175,550 | ) | | | (21,053,868 | ) | | | (268,245,578 | ) | | | (120,570,679 | ) | | | (5,803 | ) | | | (989 | ) |
| | – | | | | – | | | | (15,791,469 | ) | | | (12,827,350 | ) | | | (93,167 | ) | | | – | |
| | (4,153,690 | ) | | | (1,826,046 | ) | | | (326,207,389 | ) | | | (259,980,272 | ) | | | (30,345 | ) | | | (1,956 | ) |
| | – | | | | – | | | | – | | | | – | ^ | | | – | | | | – | |
| | – | | | | – | | | | – | | | | – | ^ | | | – | | | | – | |
| | 108,115,201 | | | | (12,708,121 | ) | | | (425,070,292 | ) | | | 120,456,775 | | | | 871,022 | | | | 26,159,869 | |
| | 122,803,982 | | | | (15,194,421 | ) | | | (427,623,315 | ) | | | 95,764,615 | | | | 954,540 | | | | 25,540,127 | |
| $ | 239,788,278 | | | $ | 254,982,699 | | | $ | 832,109,581 | | | $ | 736,344,966 | | | $ | 25,540,127 | | | $ | – | |
| $ | 362,592,260 | | | $ | 239,788,278 | | | $ | 404,486,266 | | | $ | 832,109,581 | | | $ | 26,494,667 | | | $ | 25,540,127 | |
| $ | 2,532,666 | | | $ | 4,554,938 | | | $ | (58,425 | ) | | $ | (59,212 | ) | | $ | (1,007 | ) | | $ | (1,005 | ) |
The accompanying notes are an integral part of the financial statements.
69
Financial Highlights
Selected per share data and ratios. Selected data for a share of capital stock outstanding throughout each fiscal period.
| | | | | | | Income from Investment Operations | | Less Distributions | | |
| | | | | | | | | | | | | | | | | | | |
Fund/
Share
Class | | Fiscal year
(period
ended) | | Net asset
value,
beginning
of period | | Net
investment
income
(loss) | | Net gains or
losses on
securities (both
realized and
unrealized) | | Total from
investment
operations | | Dividends (from net
investment
income) | | Distributions
(from
realized
gains) | | Total
distributions | | Net asset
value, end
of period |
| Balanced Class A | | | | | | | | | | | | | | | | | | | | | | | | | | | | | | | | |
| | | 11/30/12 | | $ | 17.10 | | | $ | 0.23 | | | $ | 1.77 | | | $ | 2.00 | | | $ | 0.30 | | | $ | 0.77 | | | $ | 1.07 | | | $ | 18.03 | |
| | | 11/30/13 | | | 18.03 | | | | 0.23 | | | | 2.91 | | | | 3.14 | | | | 0.26 | | | | 0.68 | | | | 0.94 | | | | 20.23 | |
| | | 11/30/14 | | | 20.23 | | | | 0.26 | | | | 1.50 | | | | 1.76 | | | | 0.26 | | | | 0.75 | | | | 1.01 | | | | 20.98 | |
| | | 11/30/15 | | | 20.98 | | | | 0.43 | | | | (0.35 | ) | | | 0.08 | | | | 0.30 | | | | 0.89 | | | | 1.19 | | | | 19.87 | |
| | | 11/30/16 | | | 19.87 | | | | 0.23 | | | | 0.66 | | | | 0.89 | | | | 0.44 | | | | 0.64 | | | | 1.08 | | | | 19.68 | |
| Balanced Class C | | | | | | | | | | | | | | | | | | | | | | | | | | | | | | | | |
| | | 11/30/12 | | | 17.15 | | | | 0.08 | | | | 1.78 | | | | 1.86 | | | | 0.17 | | | | 0.77 | | | | 0.94 | | | | 18.07 | |
| | | 11/30/13 | | | 18.07 | | | | 0.08 | | | | 2.91 | | | | 2.99 | | | | 0.11 | | | | 0.68 | | | | 0.79 | | | | 20.27 | |
| | | 11/30/14 | | | 20.27 | | | | 0.11 | | | | 1.51 | | | | 1.62 | | | | 0.10 | | | | 0.75 | | | | 0.85 | | | | 21.04 | |
| | | 11/30/15 | | | 21.04 | | | | 0.28 | | | | (0.35 | ) | | | (0.07 | ) | | | 0.15 | | | | 0.89 | | | | 1.04 | | | | 19.93 | |
| | | 11/30/16 | | | 19.93 | | | | 0.08 | | | | 0.66 | | | | 0.74 | | | | 0.30 | | | | 0.64 | | | | 0.94 | | | | 19.73 | |
| Balanced Class I | | | | | | | | | | | | | | | | | | | | | | | | | | | | | | | | |
| | | 11/30/12 | | | 17.04 | | | | 0.23 | | | | 1.76 | | | | 1.99 | | | | 0.31 | | | | 0.77 | | | | 1.08 | | | | 17.95 | |
| | | 11/30/13 | | | 17.95 | | | | 0.28 | | | | 2.89 | | | | 3.17 | | | | 0.29 | | | | 0.68 | | | | 0.97 | | | | 20.15 | |
| | | 11/30/14 | | | 20.15 | | | | 0.31 | | | | 1.50 | | | | 1.81 | | | | 0.31 | | | | 0.75 | | | | 1.06 | | | | 20.90 | |
| | | 11/30/15 | | | 20.90 | | | | 0.47 | | | | (0.34 | ) | | | 0.13 | | | | 0.36 | | | | 0.89 | | | | 1.25 | | | | 19.78 | |
| | | 11/30/16 | | | 19.78 | | | | 0.27 | | | | 0.65 | | | | 0.92 | | | | 0.49 | | | | 0.64 | | | | 1.13 | | | | 19.57 | |
| Common Stock Class A | | | | | | | | | | | | | | | | | | | | | | | | | | | | | | | | |
| | | 11/30/12 | | | 31.33 | | | | 0.38 | | | | 3.93 | | | | 4.31 | | | | 0.37 | | | | 0.43 | | | | 0.80 | | | | 34.84 | |
| | | 11/30/13 | | | 34.84 | | | | 0.44 | | | | 9.50 | | | | 9.94 | | | | 0.43 | | | | 1.04 | | | | 1.47 | | | | 43.31 | |
| | | 11/30/14 | | | 43.31 | | | | 0.56 | | | | 4.97 | | | | 5.53 | | | | 0.58 | | | | 5.47 | | | | 6.05 | | | | 42.79 | |
| | | 11/30/15 | | | 42.79 | | | | 1.01 | | | | (0.25 | ) | | | 0.76 | | | | 0.45 | | | | 0.02 | | | | 0.47 | | | | 43.08 | |
| | | 11/30/16 | | | 43.08 | | | | 0.53 | | | | 2.43 | | | | 2.96 | | | | 1.08 | | | | 2.68 | | | | 3.76 | | | | 42.28 | |
| Common Stock Class C | | | | | | | | | | | | | | | | | | | | | | | | | | | | | | | | |
| | | 11/30/12 | | | 30.35 | | | | 0.09 | | | | 3.81 | | | | 3.90 | | | | 0.12 | | | | 0.43 | | | | 0.55 | | | | 33.70 | |
| | | 11/30/13 | | | 33.70 | | | | 0.12 | | | | 9.18 | | | | 9.30 | | | | 0.14 | | | | 1.04 | | | | 1.18 | | | | 41.82 | |
| | | 11/30/14 | | | 41.82 | | | | 0.21 | | | | 4.78 | | | | 4.99 | | | | 0.19 | | | | 5.47 | | | | 5.66 | | | | 41.15 | |
| | | 11/30/15 | | | 41.15 | | | | 0.64 | | | | (0.24 | ) | | | 0.40 | | | | 0.17 | | | | 0.02 | | | | 0.19 | | | | 41.36 | |
| | | 11/30/16 | | | 41.36 | | | | 0.21 | | | | 2.33 | | | | 2.54 | | | | 0.78 | | | | 2.68 | | | | 3.46 | | | | 40.44 | |
| Common Stock Class I | | | | | | | | | | | | | | | | | | | | | | | | | | | | | | | | |
| | | 11/30/12 | | | 31.33 | | | | 0.49 | | | | 3.94 | | | | 4.43 | | | | 0.48 | | | | 0.43 | | | | 0.91 | | | | 34.85 | |
| | | 11/30/13 | | | 34.85 | | | | 0.56 | | | | 9.50 | | | | 10.06 | | | | 0.56 | | | | 1.04 | | | | 1.60 | | | | 43.31 | |
| | | 11/30/14 | | | 43.31 | | | | 0.68 | | | | 4.97 | | | | 5.65 | | | | 0.73 | | | | 5.47 | | | | 6.20 | | | | 42.76 | |
| | | 11/30/15 | | | 42.76 | | | | 1.12 | | | | (0.25 | ) | | | 0.87 | | | | 0.55 | | | | 0.02 | | | | 0.57 | | | | 43.06 | |
| | | 11/30/16 | | | 43.06 | | | | 0.64 | | | | 2.43 | | | | 3.07 | | | | 1.19 | | | | 2.68 | | | | 3.87 | | | | 42.26 | |
| Common Stock Class R6 | | | | | | | | | | | | | | | | | | | | | | | | | | | | | | | | |
| | | 11/30/15(A) | | | 43.01 | | | | 1.07 | | | | (0.51 | ) | | | 0.56 | | | | 0.46 | | | | – | | | | 0.46 | | | | 43.11 | |
| | | 11/30/16 | | | 43.11 | | | | 0.70 | | | | 2.41 | | | | 3.11 | | | | 1.22 | | | | 2.68 | | | | 3.90 | | | | 42.32 | |
See notes to Financial Highlights at the end of the schedule.
70
Financial Highlights
| | | | | | | Ratios/Supplemental Data | | | |
| | | | | | | | | | | | | |
Total
return
(%)* | | Net assets at
end of
period (000
omitted) | | Ratio of expenses
to average net
assets (%) | | Ratio of expenses to average
net assets before
contractual and voluntary
expense reimbursements
(%)** | | Ratio of net
investment income
(loss) to average
net assets (%) | | Ratio of net investment
income (loss) to average net
assets before contractual and
voluntary expense
reimbursements (%)** | | Portfolio
turnover
rate (%) |
| | | | | | | | | | | | | | | | | | | | | | | | | | | |
| | 12.30 | | | $ | 221,036 | | | | 1.11 | | | | 1.11 | | | | 1.30 | | | | 1.30 | | | | 146 | |
| | 18.15 | | | | 267,627 | | | | 1.06 | | | | 1.06 | | | | 1.22 | | | | 1.22 | | | | 154 | |
| | 9.10 | | | | 278,385 | | | | 1.07 | | | | 1.07 | | | | 1.29 | | | | 1.29 | | | | 94 | |
| | 0.56 | | | | 263,276 | | | | 1.04 | | | | 1.04 | | | | 2.17 | ^ | | | 2.17 | ^ | | | 86 | |
| | 4.75 | | | | 264,910 | | | | 1.01 | | | | 1.01 | | | | 1.20 | | | | 1.20 | | | | 45 | |
| | | | | | | | | | | | | | | | | | | | | | | | | | | |
| | 11.30 | | | | 16,635 | | | | 1.94 | | | | 1.94 | | | | 0.48 | | | | 0.48 | | | | 146 | |
| | 17.19 | | | | 30,647 | | | | 1.86 | | | | 1.86 | | | | 0.42 | | | | 0.42 | | | | 154 | |
| | 8.34 | | | | 32,002 | | | | 1.82 | | | | 1.82 | | | | 0.53 | | | | 0.53 | | | | 94 | |
| | (0.23) | | | | 35,344 | | | | 1.82 | | | | 1.82 | | | | 1.39 | ^ | | | 1.39 | ^ | | | 86 | |
| | 3.91 | | | | 43,066 | | | | 1.78 | | | | 1.78 | | | | 0.43 | | | | 0.43 | | | | 45 | |
| | | | | | | | | | | | | | | | | | | | | | | | | | | |
| | 12.25 | | | | 5,748 | | | | 1.11 | | | | 1.11 | | | | 1.31 | | | | 1.31 | | | | 146 | |
| | 18.46 | | | | 20,468 | | | | 0.77 | | | | 0.77 | | | | 1.50 | | | | 1.50 | | | | 154 | |
| | 9.43 | | | | 17,062 | | | | 0.80 | | | | 0.80 | | | | 1.55 | | | | 1.55 | | | | 94 | |
| | 0.79 | | | | 12,589 | | | | 0.81 | | | | 0.81 | | | | 2.39 | ^ | | | 2.39 | ^ | | | 86 | |
| | 4.94 | | | | 14,477 | | | | 0.81 | | | | 0.81 | | | | 1.41 | | | | 1.41 | | | | 45 | |
| | | | | | | | | | | | | | | | | | | | | | | | | | | |
| | 13.99 | | | | 1,193,721 | | | | 1.09 | | | | 1.09 | | | | 1.12 | | | | 1.12 | | | | 8 | |
| | 29.53 | | | | 1,454,446 | | | | 1.03 | | | | 1.03 | | | | 1.15 | | | | 1.15 | | | | 12 | |
| | 13.30 | | | | 1,577,546 | | | | 1.00 | | | | 1.00 | | | | 1.28 | | | | 1.28 | | | | 19 | |
| | 1.79 | | | | 1,416,147 | | | | 0.99 | | | | 0.99 | | | | 2.36 | ^ | | | 2.36 | ^ | | | 11 | |
| | 7.53 | | | | 1,350,861 | | | | 1.00 | | | | 1.00 | | | | 1.32 | | | | 1.32 | | | | 8 | |
| | | | | | | | | | | | | | | | | | | | | | | | | | | |
| | 13.03 | | | | 51,460 | | | | 1.93 | | | | 1.93 | | | | 0.28 | | | | 0.28 | | | | 8 | |
| | 28.47 | | | | 78,259 | | | | 1.84 | | | | 1.84 | | | | 0.32 | | | | 0.32 | | | | 12 | |
| | 12.40 | | | | 90,784 | | | | 1.79 | | | | 1.79 | | | | 0.50 | | | | 0.50 | | | | 19 | |
| | 0.98 | | | | 89,890 | | | | 1.78 | | | | 1.78 | | | | 1.57 | ^ | | | 1.57 | ^ | | | 11 | |
| | 6.71 | | | | 83,246 | | | | 1.79 | | | | 1.79 | | | | 0.54 | | | | 0.54 | | | | 8 | |
| | | | | | | | | | | | | | | | | | | | | | | | | | | |
| | 14.38 | | | | 684,658 | | | | 0.75 | | | | 0.75 | | | | 1.47 | | | | 1.47 | | | | 8 | |
| | 29.93 | | | | 941,223 | | | | 0.72 | | | | 0.72 | | | | 1.45 | | | | 1.45 | | | | 12 | |
| | 13.61 | | | | 932,941 | | | | 0.72 | | | | 0.72 | | | | 1.55 | | | | 1.55 | | | | 19 | |
| | 2.07 | | | | 689,502 | | | | 0.71 | | | | 0.71 | | | | 2.63 | ^ | | | 2.63 | ^ | | | 11 | |
| | 7.84 | | | | 552,611 | | | | 0.72 | | | | 0.72 | | | | 1.60 | | | | 1.60 | | | | 8 | |
| | | | | | | | | | | | | | | | | | | | | | | | | | | |
| | 1.31++ | | | | 18,225 | | | | 0.61+ | | | | 1.76 | + | | | 2.65+ | ^ | | | 1.50 | +^ | | | 11 | ++ |
| | 7.92 | | | | 29,927 | | | | 0.65 | | | | 0.72 | | | | 1.72 | | | | 1.65 | | | | 8 | |
The accompanying notes are an integral part of the financial statements.
71
Financial Highlights
Selected per share data and ratios. Selected data for a share of capital stock outstanding throughout each fiscal period.
| | | | | | | Income from Investment Operations | | Less Distributions | | | | |
| | | | | | | | | | | | | | | | | | | | | |
Fund/
Share
Class | | Fiscal
year
(period
ended) | | Net asset
value,
beginning
of period | | Net
investment
income
(loss) | | Net gains or
losses on
securities (both
realized and
unrealized) | | Total from
investment operations | | Dividends
(from net
investment
income) | | Distributions
(from
realized
gains) | | Return of
capital | | Total
distributions | | Net asset
value, end
of period |
| Government Securities Class A | | | | | | | | | | | | | | | | | | | | | | | | | | | | | | | | | | | | |
| | | 11/30/12 | | $ | 10.72 | | | $ | 0.14 | | | $ | 0.28 | | | $ | 0.42 | | | $ | 0.31 | | | $ | – | | | $ | – | | | $ | 0.31 | | | $ | 10.83 | |
| | | 11/30/13 | | | 10.83 | | | | 0.16 | | | | (0.66 | ) | | | (0.50 | ) | | | 0.26 | | | | 0.03 | | | | – | | | | 0.29 | | | | 10.04 | |
| | | 11/30/14 | | | 10.04 | | | | 0.18 | | | | 0.17 | | | | 0.35 | | | | 0.26 | | | | – | | | | – | | | | 0.26 | | | | 10.13 | |
| | | 11/30/15 | | | 10.13 | | | | 0.18 | | | | (0.10 | ) | | | 0.08 | | | | 0.24 | | | | – | | | | – | | | | 0.24 | | | | 9.97 | |
| | | 11/30/16 | | | 9.97 | | | | 0.16 | | | | (0.13 | ) | | | 0.03 | | | | 0.25 | | | | – | | | | – | | | | 0.25 | | | | 9.75 | |
| Government Securities Class C | | | | | | | | | | | | | | | | | | | | | | | | | | | | | | | | | | | | |
| | | 11/30/12 | | | 10.72 | | | | 0.05 | | | | 0.30 | | | | 0.35 | | | | 0.23 | | | | – | | | | – | | | | 0.23 | | | | 10.84 | |
| | | 11/30/13 | | | 10.84 | | | | 0.08 | | | | (0.68 | ) | | | (0.60 | ) | | | 0.17 | | | | 0.03 | | | | – | | | | 0.20 | | | | 10.04 | |
| | | 11/30/14 | | | 10.04 | | | | 0.10 | | | | 0.17 | | | | 0.27 | | | | 0.17 | | | | – | | | | – | | | | 0.17 | | | | 10.14 | |
| | | 11/30/15 | | | 10.14 | | | | 0.10 | | | | (0.11 | ) | | | (0.01 | ) | | | 0.15 | | | | – | | | | – | | | | 0.15 | | | | 9.98 | |
| | | 11/30/16 | | | 9.98 | | | | 0.08 | | | | (0.13 | ) | | | (0.05 | ) | | | 0.17 | | | | – | | | | – | | | | 0.17 | | | | 9.76 | |
| Government Securities Class I | | | | | | | | | | | | | | | | | | | | | | | | | | | | | | | | | | | | |
| | | 11/30/12 | | | 10.72 | | | | 0.16 | | | | 0.28 | | | | 0.44 | | | | 0.33 | | | | – | | | | – | | | | 0.33 | | | | 10.83 | |
| | | 11/30/13 | | | 10.83 | | | | 0.19 | | | | (0.67 | ) | | | (0.48 | ) | | | 0.28 | | | | 0.03 | | | | – | | | | 0.31 | | | | 10.04 | |
| | | 11/30/14 | | | 10.04 | | | | 0.21 | | | | 0.16 | | | | 0.37 | | | | 0.28 | | | | – | | | | – | | | | 0.28 | | | | 10.13 | |
| | | 11/30/15 | | | 10.13 | | | | 0.20 | | | | (0.10 | ) | | | 0.10 | | | | 0.26 | | | | – | | | | – | | | | 0.26 | | | | 9.97 | |
| | | 11/30/16 | | | 9.97 | | | | 0.19 | | | | (0.14 | ) | | | 0.05 | | | | 0.27 | | | | – | | | | – | | | | 0.27 | | | | 9.75 | |
| International Equity Class A | | | | | | | | | | | | | | | | | | | | | | | | | | | | | | | | | | | | |
| | | 11/30/12 | | | 15.03 | | | | 0.18 | | | | 0.98 | | | | 1.16 | | | | 0.16 | | | | – | | | | – | | | | 0.16 | | | | 16.03 | |
| | | 11/30/13 | | | 16.03 | | | | 0.16 | | | | 4.13 | | | | 4.29 | | | | 0.14 | | | | – | | | | – | | | | 0.14 | | | | 20.18 | |
| | | 11/30/14 | | | 20.18 | | | | 0.25 | | | | (0.61 | ) | | | (0.36 | ) | | | 0.21 | | | | – | | | | – | | | | 0.21 | | | | 19.61 | |
| | | 11/30/15 | | | 19.61 | | | | 0.13 | | | | 0.47 | | | | 0.60 | | | | 0.34 | | | | 2.95 | | | | – | | | | 3.29 | | | | 16.92 | |
| | | 11/30/16 | | | 16.92 | | | | 0.18 | | | | (0.97 | ) | | | (0.79 | ) | | | 0.12 | | | | 0.49 | | | | – | | | | 0.61 | | | | 15.52 | |
| International Equity Class C | | | | | | | | | | | | | | | | | | | | | | | | | | | | | | | | | | | | |
| | | 11/30/12 | | | 14.59 | | | | (0.06 | ) | | | 0.96 | | | | 0.90 | | | | – | | | | – | | | | – | | | | – | | | | 15.49 | |
| | | 11/30/13 | | | 15.49 | | | | (0.11 | ) | | | 3.97 | | | | 3.86 | | | | 0.01 | | | | – | | | | – | | | | 0.01 | | | | 19.34 | |
| | | 11/30/14 | | | 19.34 | | | | (0.04 | ) | | | (0.59 | ) | | | (0.63 | ) | | | – | | | | – | | | | – | | | | – | | | | 18.71 | |
| | | 11/30/15 | | | 18.71 | | | | (0.10 | ) | | | 0.47 | | | | 0.37 | | | | 0.07 | | | | 2.95 | | | | – | | | | 3.02 | | | | 16.06 | |
| | | 11/30/16 | | | 16.06 | | | | (0.01 | ) | | | (0.90 | ) | | | (0.91 | ) | | | – | | | | 0.49 | | | | – | | | | 0.49 | | | | 14.66 | |
| International Equity Class I | | | | | | | | | | | | | | | | | | | | | | | | | | | | | | | | | | | | |
| | | 11/30/12 | | | 14.99 | | | | 0.26 | | | | 0.98 | | | | 1.24 | | | | 0.24 | | | | – | | | | – | | | | 0.24 | | | | 15.99 | |
| | | 11/30/13 | | | 15.99 | | | | 0.26 | | | | 4.11 | | | | 4.37 | | | | 0.23 | | | | – | | | | – | | | | 0.23 | | | | 20.13 | |
| | | 11/30/14 | | | 20.13 | | | | 0.38 | | | | (0.65 | ) | | | (0.27 | ) | | | 0.33 | | | | – | | | | – | | | | 0.33 | | | | 19.53 | |
| | | 11/30/15 | | | 19.53 | | | | 0.18 | | | | 0.47 | | | | 0.65 | | | | 0.44 | | | | 2.95 | | | | – | | | | 3.39 | | | | 16.79 | |
| | | 11/30/16 | | | 16.79 | | | | 0.23 | | | | (0.95 | ) | | | (0.72 | ) | | | 0.18 | | | | 0.49 | | | | – | | | | 0.67 | | | | 15.40 | |
See notes to Financial Highlights at the end of the schedule.
72
Financial Highlights
| | | | | | | Ratios/Supplemental Data | | | | | | |
| | | | | | | | | | | | | |
Total
return
(%)* | | Net assets at
end of
period (000
omitted) | | Ratio of expenses
to average net
assets (%) | | Ratio of expenses to average
net assets before
contractual and voluntary
expense reimbursements
(%)** | | Ratio of net
investment income
(loss) to average
net assets (%) | | Ratio of net investment
income (loss) to average net
assets before contractual and
voluntary expense
reimbursements (%)** | | Portfolio
turnover
rate (%) |
| | | | | | | | | | | | | | | | | | | | | | | | | | | |
| | 3.94 | | | $ | 791,599 | | | | 0.81 | | | | 0.81 | | | | 1.29 | | | | 1.29 | | | | 581 | |
| | (4.75) | | | | 429,416 | | | | 0.83 | | | | 0.83 | | | | 1.54 | | | | 1.54 | | | | 795 | |
| | 3.50 | | | | 268,380 | | | | 0.92 | | | | 0.92 | | | | 1.80 | | | | 1.80 | | | | 161 | |
| | 0.77 | | | | 189,623 | | | | 0.96 | | | | 0.96 | | | | 1.76 | | | | 1.76 | | | | 150 | |
| | 0.24 | | | | 154,133 | | | | 0.91 | | | | 0.91 | | | | 1.63 | | | | 1.63 | | | | 59 | |
| | | | | | | | | | | | | | | | | | �� | | | | | | | | | |
| | 3.26 | | | | 120,709 | | | | 1.59 | | | | 1.59 | | | | 0.50 | | | | 0.50 | | | | 581 | |
| | (5.61) | | | | 58,371 | | | | 1.63 | | | | 1.63 | | | | 0.73 | | | | 0.73 | | | | 795 | |
| | 2.73 | | | | 35,387 | | | | 1.73 | | | | 1.73 | | | | 0.99 | | | | 0.99 | | | | 161 | |
| | (0.07) | | | | 25,668 | | | | 1.74 | | | | 1.74 | | | | 0.98 | | | | 0.98 | | | | 150 | |
| | (0.56) | | | | 20,954 | | | | 1.72 | | | | 1.72 | | | | 0.82 | | | | 0.82 | | | | 59 | |
| | | | | | | | | | | | | | | | | | | | | | | | | | | |
| | 4.21 | | | | 145,869 | | | | 0.57 | | | | 0.57 | | | | 1.52 | | | | 1.52 | | | | 581 | |
| | (4.51) | | | | 70,078 | | | | 0.60 | | | | 0.60 | | | | 1.76 | | | | 1.76 | | | | 795 | |
| | 3.73 | | | | 50,493 | | | | 0.68 | | | | 0.68 | | | | 2.05 | | | | 2.05 | | | | 161 | |
| | 0.99 | | | | 29,048 | | | | 0.73 | | | | 0.73 | | | | 1.98 | | | | 1.98 | | | | 150 | |
| | 0.44 | | | | 23,562 | | | | 0.68 | | | | 0.68 | | | | 1.88 | | | | 1.88 | | | | 59 | |
| | | | | | | | | | | | | | | | | | | | | | | | | | | |
| | 7.84 | | | | 106,173 | | | | 1.49 | | | | 1.49 | | | | 1.17 | | | | 1.17 | | | | 37 | |
| | 26.93 | | | | 122,646 | | | | 1.44 | | | | 1.44 | | | | 0.91 | | | | 0.91 | | | | 52 | |
| | (1.81) | | | | 115,216 | | | | 1.41 | | | | 1.41 | | | | 1.22 | | | | 1.22 | | | | 50 | |
| | 4.49 | | | | 113,212 | | | | 1.41 | | | | 1.41 | | | | 0.76 | | | | 0.76 | | | | 55 | |
| | (4.81) | | | | 114,616 | | | | 1.36 | | | | 1.36 | | | | 1.11 | | | | 1.11 | | | | 36 | |
| | | | | | | | | | | | | | | | | | | | | | | | | | | |
| | 6.17 | | | | 2,953 | | | | 3.05 | | | | 3.05 | | | | (0.40 | ) | | | (0.40 | ) | | | 37 | |
| | 24.92 | | | | 3,634 | | | | 3.04 | | | | 3.04 | | | | (0.66 | ) | | | (0.66 | ) | | | 52 | |
| | (3.26) | | | | 3,581 | | | | 2.86 | | | | 2.86 | | | | (0.23 | ) | | | (0.23 | ) | | | 50 | |
| | 3.14 | | | | 4,732 | | | | 2.70 | | | | 2.70 | | | | (0.60 | ) | | | (0.60 | ) | | | 55 | |
| | (5.82) | | | | 5,876 | | | | 2.49 | | | | 2.49 | | | | (0.04 | ) | | | (0.04 | ) | | | 36 | |
| | | | | | | | | | | | | | | | | | | | | | | | | | | |
| | 8.45 | | | | 27,887 | | | | 0.94 | | | | 0.94 | | | | 1.72 | | | | 1.72 | | | | 37 | |
| | 27.64 | | | | 34,561 | | | | 0.89 | | | | 0.89 | | | | 1.48 | | | | 1.48 | | | | 52 | |
| | (1.39) | | | | 10,997 | | | | 0.92 | | | | 0.92 | | | | 1.91 | | | | 1.91 | | | | 50 | |
| | 4.89 | | | | 14,967 | | | | 1.02 | | | | 1.02 | | | | 1.05 | | | | 1.05 | | | | 55 | |
| | (4.41) | | | | 40,528 | | | | 0.99 | | | | 0.99 | | | | 1.45 | | | | 1.45 | | | | 36 | |
The accompanying notes are an integral part of the financial statements.
73
Financial Highlights
Selected per share data and ratios. Selected data for a share of capital stock outstanding throughout each fiscal period.
| | | | | | | Income from Investment Operations | | Less Distributions | | |
| | | | | | | | | | | | | | | | | | | |
Fund/
Share
Class | | Fiscal year
(period
ended) | | Net asset
value,
beginning
of period | | Net
investment
income
(loss) | | Net gains or
losses on
securities (both
realized and
unrealized) | | Total from
investment
operations | | Dividends (from net
investment
income) | | Distributions
(from
realized
gains) | | Total
distributions | | Net asset
value, end
of period |
| Low Duration Bond Class A | | | | | | | | | | | | | | | | | | | | | | | | | | | | | | | | |
| | | 11/30/12 | | $ | 9.20 | | | $ | 0.06 | | | $ | (0.02 | ) | | $ | 0.04 | | | $ | 0.18 | | | $ | – | | | $ | 0.18 | | | $ | 9.06 | |
| | | 11/30/13 | | | 9.06 | | | | 0.03 | | | | (0.10 | ) | | | (0.07 | ) | | | 0.15 | | | | – | | | | 0.15 | | | | 8.84 | |
| | | 11/30/14 | | | 8.84 | | | | 0.12 | | | | (0.07 | ) | | | 0.05 | | | | 0.16 | | | | – | | | | 0.16 | | | | 8.73 | |
| | | 11/30/15 | | | 8.73 | | | | 0.17 | | | | (0.18 | ) | | | (0.01 | ) | | | 0.19 | | | | – | | | | 0.19 | | | | 8.53 | |
| | | 11/30/16 | | | 8.53 | | | | 0.13 | | | | (0.08 | ) | | | 0.05 | | | | 0.17 | | | | – | | | | 0.17 | | | | 8.41 | |
| Low Duration Bond Class I | | | | | | | | | | | | | | | | | | | | | | | | | | | | | | | | |
| | | 11/30/14(B) | | | 8.82 | | | | 0.13 | | | | (0.06 | ) | | | 0.07 | | | | 0.16 | | | | – | | | | 0.16 | | | | 8.73 | |
| | | 11/30/15 | | | 8.73 | | | | 0.20 | | | | (0.19 | ) | | | 0.01 | | | | 0.21 | | | | – | | | | 0.21 | | | | 8.53 | |
| | | 11/30/16 | | | 8.53 | | | | 0.17 | | | | (0.08 | ) | | | 0.09 | | | | 0.19 | | | | – | | | | 0.19 | | | | 8.43 | |
| Low Duration Bond Class S | | | | | | | | | | | | | | | | | | | | | | | | | | | | | | | | |
| | | 11/30/12 | | | 9.20 | | | | 0.02 | | | | (0.01 | ) | | | 0.01 | | | | 0.14 | | | | – | | | | 0.14 | | | | 9.07 | |
| | | 11/30/13 | | | 9.07 | | | | 0.01 | | | | (0.12 | ) | | | (0.11 | ) | | | 0.12 | | | | – | | | | 0.12 | | | | 8.84 | |
| | | 11/30/14 | | | 8.84 | | | | 0.11 | | | | (0.06 | ) | | | 0.05 | | | | 0.15 | | | | – | | | | 0.15 | | | | 8.74 | |
| | | 11/30/15 | | | 8.74 | | | | 0.16 | | | | (0.18 | ) | | | (0.02 | ) | | | 0.18 | | | | – | | | | 0.18 | | | | 8.54 | |
| | | 11/30/16 | | | 8.54 | | | | 0.12 | | | | (0.07 | ) | | | 0.05 | | | | 0.16 | | | | – | | | | 0.16 | | | | 8.43 | |
| Multi-Asset Income Class A | | | | | | | | | | | | | | | | | | | | | | | | | | | | | | | | |
| | | 11/30/12 | | | 11.74 | | | | 0.16 | | | | 0.86 | | | | 1.02 | | | | 0.21 | | | | – | | | | 0.21 | | | | 12.55 | |
| | | 11/30/13 | | | 12.55 | | | | 0.21 | | | | 1.12 | | | | 1.33 | | | | 0.23 | | | | – | | | | 0.23 | | | | 13.65 | |
| | | 11/30/14 | | | 13.65 | | | | 0.26 | | | | 0.50 | | | | 0.76 | | | | 0.28 | | | | – | | | | 0.28 | | | | 14.13 | |
| | | 11/30/15 | | | 14.13 | | | | 0.37 | | | | (0.39 | ) | | | (0.02 | ) | | | 0.39 | | | | 0.94 | | | | 1.33 | | | | 12.78 | |
| | | 11/30/16 | | | 12.78 | | | | 0.36 | | | | 0.21 | | | | 0.57 | | | | 0.37 | | | | 0.84 | | | | 1.21 | | | | 12.14 | |
| Multi-Asset Income Class C | | | | | | | | | | | | | | | | | | | | | | | | | | | | | | | | |
| | | 11/30/12 | | | 11.70 | | | | 0.08 | | | | 0.86 | | | | 0.94 | | | | 0.14 | | | | – | | | | 0.14 | | | | 12.50 | |
| | | 11/30/13 | | | 12.50 | | | | 0.11 | | | | 1.13 | | | | 1.24 | | | | 0.13 | | | | – | | | | 0.13 | | | | 13.61 | |
| | | 11/30/14 | | | 13.61 | | | | 0.17 | | | | 0.48 | | | | 0.65 | | | | 0.18 | | | | – | | | | 0.18 | | | | 14.08 | |
| | | 11/30/15 | | | 14.08 | | | | 0.28 | | | | (0.40 | ) | | | (0.12 | ) | | | 0.30 | | | | 0.94 | | | | 1.24 | | | | 12.72 | |
| | | 11/30/16 | | | 12.72 | | | | 0.27 | | | | 0.21 | | | | 0.48 | | | | 0.28 | | | | 0.84 | | | | 1.12 | | | | 12.08 | |
| Multi-Asset Income Class I | | | | | | | | | | | | | | | | | | | | | | | | | | | | | | | | |
| | | 11/30/12 | | | 11.71 | | | | 0.18 | | | | 0.85 | | | | 1.03 | | | | 0.22 | | | | – | | | | 0.22 | | | | 12.52 | |
| | | 11/30/13 | | | 12.52 | | | | 0.24 | | | | 1.13 | | | | 1.37 | | | | 0.25 | | | | – | | | | 0.25 | | | | 13.64 | |
| | | 11/30/14 | | | 13.64 | | | | 0.31 | | | | 0.48 | | | | 0.79 | | | | 0.32 | | | | – | | | | 0.32 | | | | 14.11 | |
| | | 11/30/15 | | | 14.11 | | | | 0.41 | | | | (0.39 | ) | | | 0.02 | | | | 0.43 | | | | 0.94 | | | | 1.37 | | | | 12.76 | |
| | | 11/30/16 | | | 12.76 | | | | 0.38 | | | | 0.22 | | | | 0.60 | | | | 0.41 | | | | 0.84 | | | | 1.25 | | | | 12.11 | |
See notes to Financial Highlights at the end of the schedule.
74
Financial Highlights
| | | | | | | Ratios/Supplemental Data | | | | | | |
| | | | | | | | | | | | | |
Total
return
(%)* | | Net assets at
end of
period (000
omitted) | | Ratio of expenses
to average net
assets (%) | | Ratio of expenses to average
net assets before
contractual and voluntary
expense reimbursements
(%)** | | Ratio of net
investment income
(loss) to average
net assets (%) | | Ratio of net investment
income (loss) to average net
assets before contractual and
voluntary expense
reimbursements (%)** | | Portfolio
turnover
rate (%) |
| | | | | | | | | | | | | |
| | 0.40 | | | $ | 554,187 | | | | 0.86 | | | | 0.86 | | | | 0.65 | | | | 0.65 | | | | 27 | |
| | (0.82) | | | | 307,959 | | | | 0.89 | | | | 0.89 | | | | 0.37 | | | | 0.37 | | | | 16 | |
| | 0.54 | | | | 187,430 | | | | 0.95 | | | | 0.95 | | | | 1.33 | | | | 1.33 | | | | 51 | |
| | (0.12) | | | | 117,770 | | | | 0.97 | | | | 0.97 | | | | 1.92 | | | | 1.92 | | | | 27 | |
| | 0.58 | | | | 98,167 | | | | 0.94 | | | | 0.94 | | | | 1.54 | | | | 1.54 | | | | 117 | |
| | | | | | | | | | | | | | | | | | | | | | | | | | | |
| | 0.75++ | | | | 44,267 | | | | 0.68+ | | | | 0.68 | + | | | 1.83 | + | | | 1.83 | + | | | 51 | ++ |
| | 0.14 | | | | 47,788 | | | | 0.63 | | | | 0.63 | | | | 2.29 | | | | 2.29 | | | | 27 | |
| | 1.08 | | | | 17,802 | | | | 0.60 | | | | 0.60 | | | | 2.03 | | | | 2.03 | | | | 117 | |
| | | | | | | | | | | | | | | | | | | | | | | | | | | |
| | 0.11 | | | | 1,535,093 | | | | 1.25 | | | | 1.25 | | | | 0.27 | | | | 0.27 | | | | 27 | |
| | (1.19) | | | | 691,645 | | | | 1.13 | | | | 1.27 | | | | 0.12 | | | | (0.03 | ) | | | 16 | |
| | 0.53 | | | | 516,503 | | | | 1.08 | | | | 1.13 | | | | 1.23 | | | | 1.19 | | | | 51 | |
| | (0.29) | | | | 342,516 | | | | 1.09 | | | | 1.09 | | | | 1.81 | | | | 1.81 | | | | 27 | |
| | 0.54 | | | | 235,133 | | | | 1.08 | | | | 1.08 | | | | 1.41 | | | | 1.41 | | | | 117 | |
| | | | | | | | | | | | | | | | | | | | | | | | | | | |
| | 8.78 | | | | 134,682 | | | | 1.12 | | | | 1.12 | | | | 1.33 | | | | 1.33 | | | | 315 | |
| | 10.67 | | | | 166,168 | | | | 1.03 | | | | 1.03 | | | | 1.58 | | | | 1.58 | | | | 279 | |
| | 5.61 | | | | 140,670 | | | | 1.04 | | | | 1.04 | | | | 1.89 | | | | 1.89 | | | | 166 | |
| | 0.01 | | | | 126,591 | | | | 1.04 | | | | 1.04 | | | | 2.86 | | | | 2.86 | | | | 198 | |
| | 4.99 | | | | 125,475 | | | | 1.01 | | | | 1.01 | | | | 2.97 | | | | 2.97 | | | | 228 | |
| | | | | | | | | | | | | | | | | | | | | | | | | | | |
| | 8.04 | | | | 70,037 | | | | 1.81 | | | | 1.81 | | | | 0.65 | | | | 0.65 | | | | 315 | |
| | 9.99 | | | | 97,839 | | | | 1.77 | | | | 1.77 | | | | 0.83 | | | | 0.83 | | | | 279 | |
| | 4.83 | | | | 117,373 | | | | 1.76 | | | | 1.76 | | | | 1.19 | | | | 1.19 | | | | 166 | |
| | (0.78) | | | | 109,108 | | | | 1.77 | | | | 1.77 | | | | 2.13 | | | | 2.13 | | | | 198 | |
| | 4.26 | | | | 105,852 | | | | 1.75 | | | | 1.75 | | | | 2.23 | | | | 2.23 | | | | 228 | |
| | | | | | | | | | | | | | | | | | | | | | | | | | | |
| | 8.87 | | | | 17,882 | | | | 1.00 | | | | 1.00 | | | | 1.47 | | | | 1.47 | | | | 315 | |
| | 11.01 | | | | 29,833 | | | | 0.80 | | | | 0.80 | | | | 1.79 | | | | 1.79 | | | | 279 | |
| | 5.86 | | | | 55,996 | | | | 0.75 | | | | 0.75 | | | | 2.24 | | | | 2.24 | | | | 166 | |
| | 0.29 | | | | 50,728 | | | | 0.77 | | | | 0.77 | | | | 3.13 | | | | 3.13 | | | | 198 | |
| | 5.22 | | | | 71,333 | | | | 0.79 | | | | 0.79 | | | | 3.14 | | | | 3.14 | | | | 228 | |
The accompanying notes are an integral part of the financial statements.
75
Financial Highlights
Selected per share data and ratios. Selected data for a share of capital stock outstanding throughout each fiscal period.
| | | | | | | | Income from Investment Operations | | | Less Distributions | | | | |
Fund/
Share
Class | | Fiscal year
(period
ended) | | Net asset
value,
beginning
of period | | Net
investment
income
(loss) | | Net gains or
losses on
securities (both
realized and
unrealized) | | Total from
investment
operations | | Dividends
(from net
investment
income) | | Distributions
(from
realized
gains) | | Total
distributions | | Net asset
value, end
of period |
| Small Company Class A | | | | | | | | | | | | | | | | | | | | | | | | | | | | | | |
| | | 11/30/12 | | $ | 7.95 | | | $ | – | | | $ | 0.70 | | | $ | 0.70 | | | $ | – | | | $ | 0.69 | | | $ | 0.69 | | | $ | 7.96 | |
| | | 11/30/13 | | | 7.96 | | | | (0.02 | ) | | | 2.25 | | | | 2.23 | | | | – | | | | 1.67 | | | | 1.67 | | | | 8.52 | |
| | | 11/30/14 | | | 8.52 | | | | – | | | | 0.38 | | | | 0.38 | | | | – | | | | 1.71 | | | | 1.71 | | | | 7.19 | |
| | | 11/30/15 | | | 7.19 | | | | (0.03 | ) | | | 0.26 | | | | 0.23 | | | | – | | | | 1.84 | | | | 1.84 | | | | 5.58 | |
| | | 11/30/16 | | | 5.58 | | | | (0.02 | ) | | | 0.57 | | | | 0.55 | | | | – | | | | 0.94 | | | | 0.94 | | | | 5.19 | |
| Small Company Class C | | | | | | | | | | | | | | | | | | | | | | | | | | | | | | |
| | | 11/30/12 | | | 7.12 | | | | (0.05 | ) | | | 0.61 | | | | 0.56 | | | | – | | | | 0.69 | | | | 0.69 | | | | 6.99 | |
| | | 11/30/13 | | | 6.99 | | | | (0.06 | ) | | | 1.91 | | | | 1.85 | | | | – | | | | 1.67 | | | | 1.67 | | | | 7.17 | |
| | | 11/30/14 | | | 7.17 | | | | (0.04 | ) | | | 0.30 | | | | 0.26 | | | | – | | | | 1.71 | | | | 1.71 | | | | 5.72 | |
| | | 11/30/15 | | | 5.72 | | | | (0.05 | ) | | | 0.18 | | | | 0.13 | | | | – | | | | 1.84 | | | | 1.84 | | | | 4.01 | |
| | | 11/30/16 | | | 4.01 | | | | (0.03 | ) | | | 0.35 | | | | 0.32 | | | | – | | | | 0.94 | | | | 0.94 | | | | 3.39 | |
| Small Company Class I | | | | | | | | | | | | | | | | | | | | | | | | | | | | | | |
| | | 11/30/12 | | | 8.11 | | | | 0.02 | | | | 0.72 | | | | 0.74 | | | | – | | | | 0.69 | | | | 0.69 | | | | 8.16 | |
| | | 11/30/13 | | | 8.16 | | | | 0.01 | | | | 2.32 | | | | 2.33 | | | | 0.04 | | | | 1.67 | | | | 1.71 | | | | 8.78 | |
| | | 11/30/14 | | | 8.78 | | | | 0.03 | | | | 0.38 | | | | 0.41 | | | | – | | | | 1.71 | | | | 1.71 | | | | 7.48 | |
| | | 11/30/15 | | | 7.48 | | | | (0.01 | ) | | | 0.28 | | | | 0.27 | | | | 0.02 | | | | 1.84 | | | | 1.86 | | | | 5.89 | |
| | | 11/30/16 | | | 5.89 | | | | – | | | | 0.61 | | | | 0.61 | | | | – | | | | 0.94 | | | | 0.94 | | | | 5.56 | |
| Small Company Class R6 | | | | | | | | | | | | | | | | | | | | | | | | | | | | | | |
| | | 11/30/15(A) | | | 5.44 | | | | (0.01 | ) | | | 0.17 | | | | 0.16 | | | | – | | | | – | | | | – | | | | 5.60 | |
| | | 11/30/16 | | | 5.60 | | | | 0.01 | | | | 0.57 | | | | 0.58 | | | | – | | | | 0.94 | | | | 0.94 | | | | 5.24 | |
| Sustainable Core Opportunities Class A | | | | | | | | | | | | | | | | | | | | | | | | | | |
| | | 11/30/12 | | | 12.57 | | | | 0.09 | | | | 1.66 | | | | 1.75 | | | | 0.06 | | | | – | | | | 0.06 | | | | 14.26 | |
| | | 11/30/13 | | | 14.26 | | | | 0.11 | | | | 4.25 | | | | 4.36 | | | | 0.11 | | | | – | | | | 0.11 | | | | 18.51 | |
| | | 11/30/14 | | | 18.51 | | | | 0.16 | | | | 2.27 | | | | 2.43 | | | | 0.11 | | | | – | | | | 0.11 | | | | 20.83 | |
| | | 11/30/15 | | | 20.83 | | | | 0.38 | | | | (0.41 | ) | | | (0.03 | ) | | | 0.17 | | | | – | | | | 0.17 | | | | 20.63 | |
| | | 11/30/16 | | | 20.63 | | | | 0.17 | | | | 1.01 | | | | 1.18 | | | | 0.41 | | | | 0.20 | | | | 0.61 | | | | 21.20 | |
| Sustainable Core Opportunities Class I | | | | | | | | | | | | | | | | | | | | | | | | | | | | |
| | | 11/30/12 | | | 12.62 | | | | 0.13 | | | | 1.67 | | | | 1.80 | | | | 0.11 | | | | – | | | | 0.11 | | | | 14.31 | |
| | | 11/30/13 | | | 14.31 | | | | 0.15 | | | | 4.25 | | | | 4.40 | | | | 0.14 | | | | – | | | | 0.14 | | | | 18.57 | |
| | | 11/30/14 | | | 18.57 | | | | 0.22 | | | | 2.27 | | | | 2.49 | | | | 0.13 | | | | – | | | | 0.13 | | | | 20.93 | |
| | | 11/30/15 | | | 20.93 | | | | 0.44 | | | | (0.42 | ) | | | 0.02 | | | | 0.22 | | | | – | | | | 0.22 | | | | 20.73 | |
| | | 11/30/16 | | | 20.73 | | | | 0.23 | | | | 1.01 | | | | 1.24 | | | | 0.47 | | | | 0.20 | | | | 0.67 | | | | 21.30 | |
See notes to Financial Highlights at the end of the schedule.
76
Financial Highlights
| | | | | | | | | | Ratios/Supplemental Data | | | | | | |
| | | | | | | | | | | | | | | | | | |
| | | | | | | | | | Ratio of expenses to average | | | | | Ratio of net investment | | | |
| | | | Net assets at | | | | | net assets before | | Ratio of net | | income (loss) to average net | | | |
| Total | | | end of | | Ratio of expenses | | | contractual and voluntary | | investment income | | assets before contractual and | | Portfolio | |
| return | | | period (000 | | to average net | | | expense reimbursements | | (loss) to average | | voluntary expense | | turnover | |
| | (%)* | | | omitted) | | | assets (%) | | | (%)** | | net assets (%) | | reimbursements (%)** | | rate (%) |
| | | | | | | | | | | | | | | | | |
| | 9.63 | | | $ | 815,661 | | | | 1.14 | | | | 1.14 | | | | (0.05 | ) | | | (0.05 | ) | | | 33 | |
| | 34.79 | | | | 808,145 | | | | 1.21 | | | | 1.21 | | | | (0.24 | ) | | | (0.24 | ) | | | 23 | |
| | 5.40 | | | | 682,481 | | | | 1.20 | | | | 1.20 | | | | 0.06 | | | | 0.06 | | | | 59 | |
| | 5.32 | | | | 596,864 | | | | 1.25 | | | | 1.25 | | | | (0.61 | ) | | | (0.61 | ) | | | 70 | |
| | 12.52 | | | | 685,807 | | | | 1.22 | | | | 1.22 | | | | (0.38 | ) | | | (0.38 | ) | | | 61 | |
| | | | | | | | | | | | | | | | | | | | | | | | | | | |
| | 8.70 | | | | 119,594 | | | | 1.89 | | | | 1.89 | | | | (0.79 | ) | | | (0.79 | ) | | | 33 | |
| | 33.94 | | | | 128,521 | | | | 1.93 | | | | 1.93 | | | | (0.97 | ) | | | (0.97 | ) | | | 23 | |
| | 4.55 | | | | 115,642 | | | | 1.91 | | | | 1.91 | | | | (0.66 | ) | | | (0.66 | ) | | | 59 | |
| | 4.72 | | | | 108,192 | | | | 1.94 | | | | 1.94 | | | | (1.30 | ) | | | (1.30 | ) | | | 70 | |
| | 11.48 | | | | 110,842 | | | | 1.95 | | | | 1.95 | | | | (1.10 | ) | | | (1.10 | ) | | | 61 | |
| | | | | | | | | | | | | | | | | | | | | | | | | | | |
| | 9.96 | | | | 523,540 | | | | 0.79 | | | | 0.79 | | | | 0.31 | | | | 0.31 | | | | 33 | |
| | 35.40 | | | | 385,692 | | | | 0.81 | | | | 0.81 | | | | 0.17 | | | | 0.17 | | | | 23 | |
| | 5.62 | | | | 247,639 | | | | 0.85 | | | | 0.85 | | | | 0.46 | | | | 0.46 | | | | 59 | |
| | 5.71 | | | | 220,543 | | | | 0.87 | | | | 0.87 | | | | (0.24 | ) | | | (0.24 | ) | | | 70 | |
| | 12.95 | | | | 257,483 | | | | 0.89 | | | | 0.89 | | | | (0.04 | ) | | | (0.04 | ) | | | 61 | |
| | 2.94++ | | | | 599 | | | | 0.73+ | | | | 2.96+ | | | | (0.18 | )+ | | | (2.41 | )+ | | | 70 | ++ |
| | 13.07 | | | | 13,000 | | | | 0.73 | | | | 0.99 | | | | 0.16 | | | | (0.10 | ) | | | 61 | |
| | | | | | | | | | | | | | | | | | | | | | | | | | | |
| | 14.00 | | | | 182,345 | | | | 1.32 | | | | 1.32 | | | | 0.66 | | | | 0.66 | | | | 4 | |
| | 30.74 | | | | 224,489 | | | | 1.26 | | | | 1.26 | | | | 0.67 | | | | 0.67 | | | | 14 | |
| | 13.18 | | | | 239,707 | | | | 1.24 | | | | 1.24 | | | | 0.85 | | | | 0.85 | | | | 20 | |
| | (0.13)# | | | | 224,862 | | | | 1.21 | | | | 1.21 | | | | 1.85 | ^ | | | 1.85 | ^ | | | 20 | |
| | 5.92 | | | | 340,815 | | | | 1.18 | | | | 1.18 | | | | 0.86 | | | | 0.86 | | | | 33 | |
| | | | | | | | | | | | | | | | | | | | | | | | | | | |
| | 14.38 | | | | 8,194 | | | | 1.04 | | | | 1.04 | | | | 0.94 | | | | 0.94 | | | | 4 | |
| | 31.05 | | | | 12,418 | | | | 1.00 | | | | 1.00 | | | | 0.93 | | | | 0.93 | | | | 14 | |
| | 13.50 | | | | 15,275 | | | | 0.97 | | | | 0.97 | | | | 1.13 | | | | 1.13 | | | | 20 | |
| | 0.12# | | | | 14,926 | | | | 0.93 | | | | 0.93 | | | | 2.13 | ^ | | | 2.13 | ^ | | | 20 | |
| | 6.20 | | | | 21,777 | | | | 0.91 | | | | 0.91 | | | | 1.14 | | | | 1.14 | | | | 33 | |
The accompanying notes are an integral part of the financial statements.
77
Financial Highlights
Selected per share data and ratios. Selected data for a share of capital stock outstanding throughout each fiscal period.
| | | | | | | | Income from Investment Operations | | | | | | Less Distributions | | | | |
| | | | | | | | | | | Net gains or | | | | | | | | | | | | | | | | | | |
| | | | | Net asset | | Net | | losses on | | | | | Dividends | | | Distributions | | | | | | | | | |
| Fund/ | | Fiscal year | | value, | | investment | | securities (both | | Total from | | (from net | | (from | | | | | | | Net asset | |
| Share | | (period | | beginning | | income | | realized and | | investment | | investment | | realized | | Return of | | Total | | value, end | |
| Class | | ended) | | of period | | (loss) | | unrealized) | | operations | | income) | | gains) | | Capital | | distributions | | of period | |
| Total Return Bond Class A | | | | | | | | | | | | | | | | | | | | | | | | | | | | | | |
| | | 11/30/12 | | $ | 10.14 | | | $ | 0.21 | | | $ | 1.01 | | | $ | 1.22 | | | $ | 0.25 | | | $ | 0.18 | | | $ | – | | | $ | 0.43 | | | $ | 10.93 | |
| | | 11/30/13 | | | 10.93 | | | | 0.25 | | | | – | | | | 0.25 | | | | 0.28 | | | | 0.25 | | | | – | | | | 0.53 | | | | 10.65 | |
| | | 11/30/14 | | | 10.65 | | | | 0.24 | | | | 0.15 | | | | 0.39 | | | | 0.27 | | | | 0.13 | | | | – | | | | 0.40 | | | | 10.64 | |
| | | 11/30/15 | | | 10.64 | | | | 0.19 | | | | (0.28 | ) | | | (0.09 | ) | | | 0.21 | | | | – | | | | – | | | | 0.21 | | | | 10.34 | |
| | | 11/30/16 | | | 10.34 | | | | 0.18 | | | | (0.05 | ) | | | 0.13 | | | | 0.23 | | | | – | | | | – | | | | 0.23 | | | | 10.24 | |
| Total Return Bond Class C | | | | | | | | | | | | | | | | | | | | | | | | | | | | | | |
| | | 11/30/12 | | | 10.13 | | | | 0.17 | | | | 1.02 | | | | 1.19 | | | | 0.23 | | | | 0.18 | | | | – | | | | 0.41 | | | | 10.91 | |
| | | 11/30/13 | | | 10.91 | | | | 0.20 | | | | (0.01 | ) | | | 0.19 | | | | 0.22 | | | | 0.25 | | | | – | | | | 0.47 | | | | 10.63 | |
| | | 11/30/14 | | | 10.63 | | | | 0.18 | | | | 0.14 | | | | 0.32 | | | | 0.21 | | | | 0.13 | | | | – | | | | 0.34 | | | | 10.61 | |
| | | 11/30/15 | | | 10.61 | | | | 0.10 | | | | (0.28 | ) | | | (0.18 | ) | | | 0.12 | | | | – | | | | – | | | | 0.12 | | | | 10.31 | |
| | | 11/30/16 | | | 10.31 | | | | 0.10 | | | | (0.06 | ) | | | 0.04 | | | | 0.14 | | | | – | | | | – | | | | 0.14 | | | | 10.21 | |
| Total Return Bond Class I | | | | | | | | | | | | | | | | | | | | | | | | | | | | | | |
| | | 11/30/12 | | | 10.14 | | | | 0.23 | | | | 1.02 | | | | 1.25 | | | | 0.27 | | | | 0.18 | | | | – | | | | 0.45 | | | | 10.94 | |
| | | 11/30/13 | | | 10.94 | | | | 0.29 | | | | (0.03 | ) | | | 0.26 | | | | 0.29 | | | | 0.25 | | | | – | | | | 0.54 | | | | 10.66 | |
| | | 11/30/14 | | | 10.66 | | | | 0.25 | | | | 0.15 | | | | 0.40 | | | | 0.28 | | | | 0.13 | | | | – | | | | 0.41 | | | | 10.65 | |
| | | 11/30/15 | | | 10.65 | | | | 0.20 | | | | (0.27 | ) | | | (0.07 | ) | | | 0.23 | | | | – | | | | – | | | | 0.23 | | | | 10.35 | |
| | | 11/30/16 | | | 10.35 | | | | 0.20 | | | | (0.05 | ) | | | 0.15 | | | | 0.25 | | | | – | | | | – | | | | 0.25 | | | | 10.25 | |
| Total Return Bond Class R3 | | | | | | | | | | | | | | | | | | | | | | | | | | | | | | |
| | | 11/30/15(A) | | | 10.53 | | | | 0.18 | | | | (0.18 | ) | | | – | | | | 0.19 | | | | – | | | | – | | | | 0.19 | | | | 10.34 | |
| | | 11/30/16 | | | 10.34 | | | | 0.18 | | | | (0.06 | ) | | | 0.12 | | | | 0.23 | | | | – | | | | – | | | | 0.23 | | | | 10.23 | |
| Total Return Bond Class R6 | | | | | | | | | | | | | | | | | | | | | | | | | | | | | | |
| | | 11/30/15(A) | | | 10.53 | | | | 0.20 | | | | (0.17 | ) | | | 0.03 | | | | 0.21 | | | | – | | | | – | | | | 0.21 | | | | 10.35 | |
| | | 11/30/16 | | | 10.35 | | | | 0.20 | | | | (0.06 | ) | | | 0.14 | | | | 0.25 | | | | – | | | | – | | | | 0.25 | | | | 10.24 | |
| Unconstrained Bond Class A | | | | | | | | | | | | | | | | | | | | | | | | | | | | | | |
| | | 11/30/15(A) | | | 10.00 | | | | 0.11 | | | | (0.23 | ) | | | (0.12 | ) | | | 0.12 | | | | – | | | | – | | | | 0.12 | | | | 9.76 | |
| | | 11/30/16 | | | 9.76 | | | | 0.10 | | | | 0.08 | | | | 0.18 | | | | 0.14 | | | | 0.02 | | | | – | | | | 0.16 | | | | 9.78 | |
| Unconstrained Bond Class C | | | | | | | | | | | | | | | | | | | | | | | | | | | | | | |
| | | 11/30/15(A) | | | 10.00 | | | | 0.06 | | | | (0.26 | ) | | | (0.20 | ) | | | 0.08 | | | | – | | | | – | | | | 0.08 | | | | 9.72 | |
| | | 11/30/16 | | | 9.72 | | | | 0.04 | | | | 0.08 | | | | 0.12 | | | | 0.07 | | | | 0.02 | | | | – | | | | 0.09 | | | | 9.75 | |
| Unconstrained Bond Class I | | | | | | | | | | | | | | | | | | | | | | | | | | | | | | |
| | | 11/30/15(A) | | | 10.00 | | | | 0.13 | | | | (0.24 | ) | | | (0.11 | ) | | | 0.13 | | | | – | | | | – | | | | 0.13 | | | | 9.76 | |
| | | 11/30/16 | | | 9.76 | | | | 0.13 | | | | 0.08 | | | | 0.21 | | | | 0.15 | | | | 0.02 | | | | – | | | | 0.17 | | | | 9.80 | |
Per share net investment (income) loss for each Fund is calculated utilizing the average shares method unless otherwise noted.
Amounts designated as “–” are either zero or represent less than $0.005 or $(0.005).
* Total return is calculated assuming an initial investment made at the net asset value at the beginning of the period, reinvestment of all distributions at net asset value during the period, and a redemption on the last day of the period. Neither an initial sales charge nor a CDSC is reflected in the calculation of total return. Total returns would have been lower in applicable years where the Advisor had not waived a portion of its fee.
** Expense reductions are comprised of the contractual and voluntary expense reimbursements as described in Note (3), if applicable.
+ Annualized.
++ Not Annualized.
(A) Commenced operations December 23, 2014.
(B) Commenced operations January 31, 2014.
See notes to Financial Highlights at the end of the schedule.
78
Financial Highlights
| | | | | | | | | | Ratios/Supplemental Data | | | | | | | |
| | | | | | | | | | | | | | | | | |
| | | | | | | | | | Ratio of expenses to average | | | | | Ratio of net investment | | | |
| | | | Net assets at | | | | | net assets before | | Ratio of net | | income (loss) to average net | | | |
| Total | | | end of | | Ratio of expenses | | contractual and voluntary | | investment income | | assets before contractual and | | Portfolio | |
| return | | | period (000 | | to average net | | expense reimbursements | | (loss) to average | | voluntary expense | | turnover | |
| (%)* | | | omitted) | | assets (%) | | (%)** | | net assets (%) | | reimbursements (%)** | | rate (%) | |
| | | | | | | | | | | | | | | | | | | | | | | | | | | |
| | 12.34 | | | $ | 111,263 | | | | 0.94 | | | | 0.96 | | | | 2.00 | | | | 1.98 | | | | 915 | |
| | 2.33 | | | | 102,138 | | | | 0.89 | | | | 0.95 | | | | 2.38 | | | | 2.32 | | | | 499 | |
| | 3.66 | | | | 203,871 | | | | 0.89 | | | | 0.93 | | | | 2.25 | | | | 2.21 | | | | 432 | |
| | (0.87) | | | | 315,820 | | | | 0.89 | | | | 0.94 | | | | 1.76 | | | | 1.71 | | | | 441 | |
| | 1.26 | | | | 92,331 | | | | 0.89 | | | | 1.07 | | | | 1.79 | | | | 1.61 | | | | 240 | |
| | | | | | | | | | | | | | | | | | | | | | | | | | | |
| | 12.02 | | | | 29,323 | | | | 1.35 | | | | 1.37 | | | | 1.62 | | | | 1.60 | | | | 915 | |
| | 1.79 | | | | 26,222 | | | | 1.42 | | | | 1.48 | | | | 1.88 | | | | 1.81 | | | | 499 | |
| | 3.01 | | | | 47,015 | | | | 1.49@ | | | | 1.53 | @ | | | 1.68 | | | | 1.64 | | | | 432 | |
| | (1.69) | | | | 42,316 | | | | 1.70 | | | | 1.75 | | | | 0.93 | | | | 0.88 | | | | 441 | |
| | 0.40 | | | | 30,866 | | | | 1.73 | | | | 1.73 | | | | 0.94 | | | | 0.94 | | | | 240 | |
| | | | | | | | | | | | | | | | | | | | | | | | | | | |
| | 12.59 | | | | 22,792 | | | | 0.77 | | | | 0.79 | | | | 2.20 | | | | 2.19 | | | | 915 | |
| | 2.46 | | | | 61,268 | | | | 0.73 | | | | 0.79 | | | | 2.69 | | | | 2.63 | | | | 499 | |
| | 3.79 | | | | 485,459 | | | | 0.74 | | | | 0.78 | | | | 2.31 | | | | 2.27 | | | | 432 | |
| | (0.70) | | | | 472,782 | | | | 0.69 | | | | 0.74 | | | | 1.94 | | | | 1.89 | | | | 441 | |
| | 1.40 | | | | 280,081 | | | | 0.74 | | | | 0.74 | | | | 1.93 | | | | 1.93 | | | | 240 | |
| | | | | | | | | | | | | | | | | | | | | | | | | | | |
| | 0.00++ | | | | 596 | | | | 0.89+@ | | | | 2.87+ | @ | | | 1.86+ | | | | (0.12 | )+ | | | 441 | ++ |
| | 1.16 | | | | 603 | | | | 0.89@ | | | | 2.91 | @ | | | 1.77 | | | | (0.25 | ) | | | 240 | |
| | | | | | | | | | | | | | | | | | | | | | | | | | | |
| | 0.26++ | | | | 596 | | | | 0.69+ | | | | 2.87 | + | | | 2.06 | + | | | (0.12 | )+ | | | 441 | ++ |
| | 1.36 | | | | 605 | | | | 0.69 | | | | 2.90 | | | | 1.97 | | | | (0.24 | ) | | | 240 | |
| | | | | | | | | | | | | | | | | | | | | | | | | | | |
| | (1.23)++ | | | | 5,008 | | | | 1.16+@ | | | | 1.16+ | @ | | | 1.19 | + | | | 1.19 | + | | | 1153 | ++ |
| | 1.81 | | | | 5,131 | | | | 1.28@ | | | | 1.28 | @ | | | 1.07 | | | | 1.07 | | | | 472 | |
| | | | | | | | | | | | | | | | | | | | | | | | | | | |
| | (1.99)++ | | | | 1,649 | | | | 1.88+@ | | | | 1.88+ | @ | | | 0.64 | + | | | 0.64 | + | | | 1153 | ++ |
| | 1.24 | | | | 1,648 | | | | 1.91@ | | | | 1.91 | @ | | | 0.43 | | | | 0.43 | | | | 472 | |
| | | | | | | | | | | | | | | | | | | | | | | | | | | |
| | (1.14)++ | | | | 18,883 | | | | 1.00+ | | | | 1.00 | + | | | 1.35 | + | | | 1.35 | + | | | 1153 | ++ |
| | 2.16 | | | | 19,716 | | | | 1.04 | | | | 1.04 | | | | 1.30 | | | | 1.30 | | | | 472 | |
# Includes the impact of proceeds received and credited to the Funds resulting from class action settlements, which enhanced the performance for the Sentinel Sustainable Core Opportunities Fund Class A by 0.05% and Sentinel Sustainable Core Opportunities Fund Class I by 0.04% for the fiscal year ended November 30, 2015.
^ Includes the impact of special dividends resulting from an acquisition of Covidien plc by Medtronic, Inc. on January 26, 2015 through the formation of a new holding company, Medtronic plc, incorporated in Ireland. These special dividends enhanced the ratios of net investment income for the Sentinel Balanced Fund Class A by 0.86%, Sentinel Balanced Fund Class C by 0.86%, Sentinel Balanced Fund Class I by 0.86%, the Sentinel Common Stock Fund Class A by 1.22%, Sentinel Common Stock Fund Class C by 1.22%, Sentinel Common Stock Fund Class I by 1.22%, Sentinel Common Stock Fund Class R6 by 1.30%, Sentinel Sustainable Core Opportunities Fund Class A by 1.07% and Sentinel Sustainable Core Opportunities Fund Class I by 1.07% for the fiscal year ended November 30, 2015.
@ Includes the impact of the shares owned by NLV Financial Corporation and its affiliates, who do not get charged a distribution fee, which decreases the ratio by 0.20% for the Sentinel Total Return Bond Fund Class C for the fiscal year ended November 30, 2014; 0.30% for the ratio of expenses to average net assets on Sentinel Total Return Bond Fund Class R3, 0.50% for the ratio of expenses to average net assets before contractual and voluntary expense reimbursements on Sentinel Total Return Bond Fund Class R3, 0.20% for the Sentinel Unconstrained Bond Fund Class A, 0.18% for the ratio of expenses to average net assets on Sentinel Unconstrained Bond Fund Class C and 0.92% for the ratio of expenses to average net assets before contractual and voluntary expense reimbursements on Sentinel Unconstrained Bond Fund Class C for the fiscal period from December 23, 2014 to November 30, 2015; 0.30% for the ratio of expenses to average net assets on Sentinel Total Return Bond Fund Class R3, 0.50% for the ratio of expenses to average net assets before contractual and voluntary expense reimbursements on Sentinel Total Return Bond Fund Class R3, 0.20% for the Sentinel Unconstrained Bond Fund Class A, 0.15% for the ratio of expenses to average net assets on Sentinel Unconstrained Bond Fund Class C and 0.88% for the ratio of expenses to average net assets before contractual and voluntary expense reimbursements on Sentinel Unconstrained Bond Fund Class C for the fiscal year ended November 30, 2016.
The accompanying notes are an integral part of the financial statements.
79
Notes to Financial Statements
(1) Organization:
Sentinel Group Funds, Inc. (“Company”) is registered as an open-end investment company under the Investment Company Act of 1940, as amended. The Company currently consists of ten separate series (each individually referred to as a “Fund”) with the following share classes offered:
| FUND NAME | SHARE CLASSES OFFERED |
| Sentinel Balanced Fund | Class A, Class C and Class I |
| Sentinel Common Stock Fund | Class A, Class C, Class I and Class R6 |
| Sentinel Government Securities Fund | Class A, Class C and Class I |
| Sentinel International Equity Fund | Class A, Class C and Class I |
| Sentinel Low Duration Bond Fund | Class A, Class I and Class S |
| Sentinel Multi-Asset Income Fund | Class A, Class C and Class I |
| Sentinel Small Company Fund | Class A, Class C, Class I and Class R6 |
| Sentinel Sustainable Core Opportunities Fund | Class A and Class I |
| Sentinel Total Return Bond Fund | Class A, Class C, Class I, Class R3 and Class R6 |
| Sentinel Unconstrained Bond Fund | Class A, Class C and Class I |
Each Fund has its own investment objectives. Each class of shares has identical voting, dividend, liquidation and other rights, except that the classes bear different distribution fees, registration fees and transfer agency expenses. Each class has exclusive voting rights with respect to its distribution plan, as applicable.
(2) Significant Accounting Policies:
The financial statements have been prepared in conformity with accounting principles generally accepted in the United States of America (“GAAP”), which require management to make certain estimates and assumptions at the date of the financial statements that affect the reported amounts and disclosures on the financial statements. Actual results could differ from the estimates. The Funds are investment companies and, accordingly, follow the investment company accounting and reporting guidance of the Financial Accounting Standards Board (“FASB”) Codification Topic 946 – Investment Companies, which is part of GAAP. The following is a summary of significant accounting policies followed by the Funds in the preparation of their financial statements.
A. Security Valuation:
Equity securities, including Exchange Traded Funds (“ETFs”), that are traded on a national or foreign securities exchange and over-the-counter (“OTC”) securities listed in the NASDAQ National Market System are valued at the last reported sales price or official closing price on the principal exchange on which they are traded on the date of determination as of the close of business of the New York Stock Exchange (“NYSE”), usually 4:00 p.m. Eastern time, each day that the NYSE is open for business. Foreign equity securities traded on a foreign securities exchange are subject to fair value pricing when appropriate, using valuations provided by an independent pricing service. Securities for which no sale was reported on the valuation date are valued at the mean between the last reported bid and asked prices. OTC securities not listed on the NASDAQ National Market System are valued at the mean of the current bid and asked prices. Fixed-income securities with original maturities of greater than 60 days, including short-term securities with more than 60 days left to maturity, are valued on the basis of valuations provided by an independent pricing service. The bid price is generally used for valuation purposes. Fixed-income securities with maturities of less than 60 days remaining to maturity (including long-term and short-term fixed income securities with original maturities greater than 60 days) are valued at amortized cost, which approximates market value, and are reviewed to determine that no material variation exists between cost and market. The amortized cost method values a security at cost on the date of purchase and thereafter assumes a constant amortization to maturity of any discount or premium. Investments in mutual funds are valued at the net asset value per share on the day of valuation. Investments in exchange traded derivatives are valued at the settlement price determined by the relevant exchange. Investments in cleared or non-exchange traded derivatives are valued on the basis of prices supplied by an independent pricing service, if available, or quotes obtained from brokers and dealers. Securities for which market quotations are not readily available, or whose values have been materially affected by events occurring before the Fund’s pricing time but after the close of the securities’ primary markets, including an unscheduled early closing of a primary exchange or when trading in a particular security is halted during the day and does not resume prior to the time a Fund’s net asset value is calculated, will be fair valued under procedures adopted by the Funds’ Board of Directors (the “Board”). The Board has delegated this responsibility to the Sentinel Valuation Committee (the “Valuation Committee”), established by Sentinel Asset Management, Inc. (“SAMI”), a subsidiary of NLV Financial Corporation, and subject to its review and supervision. Fair value represents a good faith approximation of the value of a security. The fair value of one or more securities may not, in retrospect, be the price at which those assets could have been sold during the period in which the particular fair values were used in determining a Fund’s net asset value.
The Funds may use one or more independent pricing services, as approved by the Board. Such independent pricing services shall provide their daily evaluations directly to the Funds’ custodian bank and fund accounting service provider, State Street Bank and Trust Company (“SSB”). Sentinel Administrative Services, Inc. (“SASI”), the Funds’ administrator and a subsidiary of SAMI, shall have an oversight role over the daily accounting process. Portfolio securities for which market quotations are readily available shall be valued at current market value; other securities and assets shall be valued at fair value as determined in good faith by SAMI, which may act through its Valuation Committee, subject to the overall oversight of the Board or its Audit Committee.
The Valuation Committee, SSB and SASI perform a series of activities to provide reasonable comfort over the accuracy of prices including: 1) periodic vendor due diligence meetings to review underlying methodologies, policies and procedures with respect to valuations, 2) daily monitoring of significant events that may impact markets and valuations, 3) daily comparisons of security valuations versus prior day valuations for all securities with additional follow-up procedures implemented for those that exceed established thresholds, and 4) daily reviews of stale valuations and manually priced securities which may be subjected to additional procedures at the discretion of the Valuation Committee.
In addition, there are several processes outside of the pricing process that are used to monitor valuation issues including: 1) performance and performance attribution reports are monitored by SAMI for anomalous impacts based upon benchmark performance, and 2) portfolio managers review all portfolios for performance and analytics.
80
Notes to Financial Statements
B. Fair Value Measurement:
In June 2013, FASB issued Accounting Standards Update (“ASU”) No. 2013-08 “Investment Companies: Amendments to the Scope, Measurement and Disclosure Requirements” that creates a two-tiered approach to assess whether an entity is an investment company. Under ASU 2013-08, an entity that is registered under the 1940 Act automatically qualifies as an investment company. The guidance also requires an investment company to measure non-controlling ownership interests in other investment companies at fair value and will require additional disclosures relating to investment company status, any changes thereto and information about financial support provided or contractually required to be provided to any of the investment company’s investees.
In response to FASB’s issuance of ASU 2011-4, which contains amendments designed to improve the comparability of fair value measurements presented and disclosed in financial statements prepared in accordance with GAAP and International Financial Reporting Standards, management has evaluated the implications of these amendments on the financial statements and included disclosures, where applicable, to address the following concerns:
| | (1) | Information about transfers between Level 1 and Level 2 of the fair value hierarchy. |
| | | |
| | (2) | Information about the sensitivity of a fair value measurement categorized within Level 3 of the fair value hierarchy to changes in unobservable inputs and any interrelationships between those unobservable inputs. |
| | | |
| | (3) | The categorization by level of the fair value hierarchy for items that are not measured at fair value in the statement of financial position, but for which the fair value of such items is required to be disclosed. |
In accordance with GAAP regarding fair value measurements, fair value is defined as the price that the Funds would receive to sell an asset or pay to transfer a liability in an orderly transaction between market participants at the measurement date. GAAP disclosure requirements establish a framework for measuring fair value, and a three-level hierarchy for fair value measurements based upon the transparency of inputs to the valuation of an asset or liability. Inputs may be observable or unobservable and refer broadly to the assumptions that market participants would use in pricing the asset or liability. Observable inputs reflect the assumptions market participants would use in pricing the asset or liability based on market data obtained from sources independent of the Funds. Unobservable inputs reflect the Funds’ own assumptions about the assumptions that market participants would use in pricing the asset or liability based on the best information available in the circumstances. Each investment is assigned a level based upon the observability of the inputs which are significant to the overall valuation. The three-tier hierarchy of inputs is summarized below:
| | • | Level 1 – Quoted prices (unadjusted) in active markets for identical assets at the time of the NYSE close (normally 4:00 PM Eastern). Includes most domestic equities, American Depository Receipts (“ADRs”), domestic ETFs, Standard & Poor’s Depository Receipts and exchange traded derivatives that rely on unadjusted or official closing prices based on actual trading activity which coincides with the close of the NYSE. |
| | | |
| | • | Level 2 – Other significant observable inputs (evaluated prices factoring in observable inputs using some type of model, matrix or other calculation methodology which takes into consideration factors such as quoted prices for similar securities, interest rates, prepayment speeds, credit risk, etc.). Includes most long-term and short-term fixed income investments, most foreign equities trading on foreign exchanges, foreign ETFs, forward foreign currency contracts, cleared derivatives, non-exchange traded derivatives and OTC securities (including some ADRs) not listed on the NASDAQ National Market System that rely on a mean price which falls between the last bid and asked quotes coinciding with the close of the NYSE. Investments in other Registered Investment Companies (RICs) that rely on calculated Net Asset Values (NAV’s) would also generally be considered Level 2. |
| | | |
| | • | Level 3 – Significant unobservable inputs (including non-binding broker quotes or the Valuation Committee’s own assumptions in determining the fair value of investments). |
Valuations of mortgage-backed or other asset backed securities, by pricing vendors, are based on both proprietary and industry recognized models and discounted cash flow techniques. Significant inputs to the valuation of these instruments are value of the collateral, the rates and timing of delinquencies, the rates and timing of prepayments, and default and loss expectations, which are driven in part by housing prices for residential mortgages. Significant inputs are determined based on relative value analyses, which incorporate comparisons to instruments with similar collateral and risk profiles, including relevant indices. Mortgage and asset backed securities for which management has collected current observable data through brokers or pricing services are generally categorized within Level 2. Those investments for which current data has not been provided would be classified as Level 3.
Other fixed income investments, including non-U.S. government and corporate debt, are generally valued using quoted market prices, if available, which are typically impacted by current interest rates, maturity dates and any perceived credit risk of the issuer. Additionally, in the absence of quoted market prices, these inputs are used by pricing vendors to derive a valuation based upon industry or proprietary models which incorporate issuer specific data with relevant yield/spread comparisons with more widely quoted bonds with similar key characteristics. Those investments for which there are observable inputs are classified as Level 2. Where the inputs are not observable, the investments would be classified as Level 3.
The inputs or methodologies used for valuing securities are not necessarily an indication of the risk associated with investing in those securities. For example, money market securities are normally valued using amortized cost, which approximates the current fair value of a security, but since this value is not obtained from a quoted price in an active market, such securities are reflected as Level 2.
The methods described above may produce a fair value calculation that may not be indicative of net realizable value or reflective of future fair values. Furthermore, while the Company believes its valuation methods are appropriate and consistent with other market participants, the use of different methodologies or assumptions to determine the fair value of certain financial instruments could result in a different estimate of fair value at the reporting date. Effective March 30, 2016, one significant change to the valuation techniques was a move from mean to bid pricing with respect to fixed-income securities with maturities of greater than 60 days. In addition, the Valuation Committee considers factors such as few recent transactions, inconsistent price quotes and wider bid-ask spreads when determining if transactions are not orderly for fair valuation purposes.
81
Notes to Financial Statements
The fair value measurements as of November 30, 2016 were as follows:
| Sentinel Fund / Category | | Quoted Prices
(Unadjusted) in Active
Markets for Identical
Assets
(Level 1) | | Other
Significant
Observable
Inputs
(Level 2) | | | Significant
Unobservable
Inputs
(Level 3) | | Total | |
| Investments in Securities - Assets: | | | | | | | | | | | | | | | | |
| Balanced: | | | | | | | | | | | | | | | | |
| Agency Collateralized Mortgage Obligations | | $ | – | | | $ | 3,242,924 | | | $ | – | | | $ | 3,242,924 | |
| Agency Discount Notes | | | – | | | | 20,000,000 | | | | – | | | | 20,000,000 | |
| Agency Mortgage-Backed Securities | | | – | | | | 38,953,049 | | | | – | | | | 38,953,049 | |
| Domestic Common Stocks | | | 200,219,896 | | | | – | | | | – | | | | 200,219,896 | |
| Domestic Corporate Bonds | | | – | | | | 1,377,615 | | | | – | | | | 1,377,615 | |
| Domestic Exchange Traded Funds | | | 25,879,944 | | | | – | | | | – | | | | 25,879,944 | |
| Foreign Stocks & ADRs: | | | | | | | | | | | | | | | | |
| Netherlands | | | 3,584,700 | | | | – | | | | – | | | | 3,584,700 | |
| Switzerland | | | – | | | | 1,663,800 | | | | – | | | | 1,663,800 | |
| Institutional Money Market Funds | | | – | | | | 10,395,309 | | | | – | | | | 10,395,309 | |
| Real Estate Investment Trusts | | | 1,693,800 | | | | – | | | | – | | | | 1,693,800 | |
| U.S. Treasury Obligations | | | – | | | | 20,000,000 | | | | – | | | | 20,000,000 | |
| Totals | | $ | 231,378,340 | | | $ | 95,632,697 | | | $ | – | | | $ | 327,011,037 | |
| | | | | | | | | | | | | | | | | |
| Common Stock: | | | | | | | | | | | | | | | | |
| Agency Discount Notes | | $ | – | | | $ | 14,000,000 | | | $ | – | | | $ | 14,000,000 | |
| Domestic Common Stocks | | | 1,913,906,844 | | | | – | | | | – | | | | 1,913,906,844 | |
| Foreign Stocks & ADRs: | | | | | | | | | | | | | | | | |
| Netherlands | | | 33,855,500 | | | | – | | | | – | | | | 33,855,500 | |
| Switzerland | | | – | | | | 23,698,058 | | | | – | | | | 23,698,058 | |
| Institutional Money Market Funds | | | – | | | | 10,471,802 | | | | – | | | | 10,471,802 | |
| Real Estate Investment Trusts | | | 13,550,400 | | | | – | | | | – | | | | 13,550,400 | |
| Totals | | $ | 1,961,312,744 | | | $ | 48,169,860 | | | $ | – | | | $ | 2,009,482,604 | |
| | | | | | | | | | | | | | | | | |
| Government Securities: | | | | | | | | | | | | | | | | |
| Agency Collateralized Mortgage Obligations | | $ | – | | | $ | 19,087,182 | | | $ | – | | | $ | 19,087,182 | |
| Agency Discount Notes | | | – | | | | 4,000,000 | | | | – | | | | 4,000,000 | |
| Agency Mortgage-Backed Securities | | | – | | | | 171,233,766 | | | | – | | | | 171,233,766 | |
| Institutional Money Market Funds | | | – | | | | 10,530,044 | | | | – | | | | 10,530,044 | |
| Totals | | $ | – | | | $ | 204,850,992 | | | $ | – | | | $ | 204,850,992 | |
| | | | | | | | | | | | | | | | | |
| International Equity: | | | | | | | | | | | | | | | | |
| Domestic Common Stocks | | $ | 21,519,630 | | | $ | – | | | $ | – | | | $ | 21,519,630 | |
| Foreign Stocks & ADRs: | | | | | | | | | | | | | | | | |
| Canada | | | 4,287,129 | | | | – | | | | – | | | | 4,287,129 | |
| All Others | | | – | | | | 128,840,164 | | | | – | | | | 128,840,164 | |
| Institutional Money Market Funds | | | – | | | | 5,770,139 | | | | – | | | | 5,770,139 | |
| Totals | | $ | 25,806,759 | | | $ | 134,610,303 | | | $ | – | | | $ | 160,417,062 | |
| | | | | | | | | | | | | | | | | |
| Low Duration Bond: | | | | | | | | | | | | | | | | |
| Agency Collateralized Mortgage Obligations | | $ | – | | | $ | 85,363,541 | | | $ | – | | | $ | 85,363,541 | |
| Agency Discount Notes | | | – | | | | 85,000,000 | | | | – | | | | 85,000,000 | |
| Agency Mortgage-Backed Securities | | | – | | | | 1,082,428 | | | | – | | | | 1,082,428 | |
| Asset Backed Securities | | | – | | | | 1,608,340 | | | | – | | | | 1,608,340 | |
| Bank Loans | | | – | | | | 1,789,224 | | | | – | | | | 1,789,224 | |
| Commercial Mortgage-Backed Securities | | | – | | | | 5,922,565 | | | | – | | | | 5,922,565 | |
| Domestic Corporate Bonds | | | – | | | | 16,774,691 | | | | – | | | | 16,774,691 | |
| Domestic Exchange Traded Funds | | | 81,569,165 | | | | – | | | | – | | | | 81,569,165 | |
| Institutional Money Market Funds | | | – | | | | 10,548,807 | | | | – | | | | 10,548,807 | |
| Residential Mortgage-Backed Securities | | | – | | | | 14,766,882 | | | | – | | | | 14,766,882 | |
| U.S. Treasury Obligations | | | – | | | | 50,000,000 | | | | – | | | | 50,000,000 | |
| Totals | | $ | 81,569,165 | | | $ | 272,856,478 | | | $ | – | | | $ | 354,425,643 | |
| | | | | | | | | | | | | | | | | |
82
Notes to Financial Statements
| Sentinel Fund / Category | | Quoted Prices
(Unadjusted) in Active
Markets for Identical
Assets
(Level 1) | | Other
Significant
Observable
Inputs
(Level 2) | | | Significant
Unobservable
Inputs
(Level 3) | | Total | |
| Multi-Asset Income: | | | | | | | | | | | | | | | | |
| Agency Collateralized Mortgage Obligations | | $ | – | | | $ | 352,907 | | | $ | – | | | $ | 352,907 | |
| Agency Discount Notes | | | – | | | | 36,000,000 | | | | – | | | | 36,000,000 | |
| Agency Mortgage-Backed Securities | | | – | | | | 17,109,912 | | | | – | | | | 17,109,912 | |
| Asset Backed Securities | | | – | | | | 301,564 | | | | – | | | | 301,564 | |
| Bank Loans | | | – | | | | 2,072,108 | | | | – | | | | 2,072,108 | |
| Domestic Corporate Bonds | | | – | | | | 19,541,319 | | | | – | | | | 19,541,319 | |
| Domestic Exchange Traded Funds | | | 194,339,890 | | | | – | | | | – | | | | 194,339,890 | |
| Institutional Money Market Funds | | | – | | | | 20,766,463 | | | | – | | | | 20,766,463 | |
| U.S. Treasury Obligations | | | – | | | | 30,000,000 | | | | – | | | | 30,000,000 | |
| Totals | | $ | 194,339,890 | | | $ | 126,144,273 | | | $ | – | | | $ | 320,484,163 | |
| | | | | | | | | | | | | | | | | |
| Small Company: | | | | | | | | | | | | | | | | |
| Agency Discount Notes | | $ | – | | | $ | 50,000,000 | | | $ | – | | | $ | 50,000,000 | |
| Domestic Common Stocks | | | 873,644,035 | | | | – | | | | – | | | | 873,644,035 | |
| Foreign Stocks & ADRs | | | 13,152,737 | | | | – | | | | – | | | | 13,152,737 | |
| Institutional Money Market Funds | | | – | | | | 15,054,755 | | | | – | | | | 15,054,755 | |
| Real Estate Investment Trusts | | | 18,388,350 | | | | – | | | | – | | | | 18,388,350 | |
| U.S. Treasury Obligations | | | – | | | | 48,000,000 | | | | – | | | | 48,000,000 | |
| Totals | | $ | 905,185,122 | | | $ | 113,054,755 | | | $ | – | | | $ | 1,018,239,877 | |
| | | | | | | | | | | | | | | | | |
| Sustainable Core Opportunities: | | | | | | | | | | | | | | | | |
| Domestic Common Stocks | | $ | 331,590,202 | | | $ | – | | | $ | – | | | $ | 331,590,202 | |
| Foreign Stocks & ADRs: | | | | | | | | | | | | | | | | |
| Denmark | | | 3,285,000 | | | | – | | | | – | | | | 3,285,000 | |
| Israel | | | 2,479,625 | | | | – | | | | – | | | | 2,479,625 | |
| Netherlands | | | 6,372,800 | | | | – | | | | – | | | | 6,372,800 | |
| Switzerland | | | – | | | | 3,327,600 | | | | – | | | | 3,327,600 | |
| Institutional Money Market Funds | | | – | | | | 10,378,898 | | | | – | | | | 10,378,898 | |
| Real Estate Investment Trusts | | | 4,234,500 | | | | – | | | | – | | | | 4,234,500 | |
| Totals | | $ | 347,962,127 | | | $ | 13,706,498 | | | $ | – | | | $ | 361,668,625 | |
| | | | | | | | | | | | | | | | | |
| Total Return Bond: | | | | | | | | | | | | | | | | |
| Agency Collateralized Mortgage Obligations | | $ | – | | | $ | 11,118,118 | | | $ | – | | | $ | 11,118,118 | |
| Agency Discount Notes | | | – | | | | 87,000,000 | | | | – | | | | 87,000,000 | |
| Agency Mortgage-Backed Securities | | | – | | | | 84,772,347 | | | | – | | | | 84,772,347 | |
| Asset Backed Securities | | | – | | | | 2,010,425 | | | | – | | | | 2,010,425 | |
| Bank Loans | | | – | | | | 3,130,084 | | | | – | | | | 3,130,084 | |
| Domestic Corporate Bonds | | | – | | | | 38,220,157 | | | | – | | | | 38,220,157 | |
| Domestic Exchange Traded Funds | | | 129,722,231 | | | | – | | | | – | | | | 129,722,231 | |
| Institutional Money Market Funds | | | – | | | | 11,832,940 | | | | – | | | | 11,832,940 | |
| U.S. Treasury Obligations | | | – | | | | 49,000,000 | | | | – | | | | 49,000,000 | |
| Totals | | $ | 129,722,231 | | | $ | 287,084,071 | | | $ | – | | | $ | 416,806,302 | |
| | | | | | | | | | | | | | | | | |
| Unconstrained Bond: | | | | | | | | | | | | | | | | |
| Agency Discount Notes | | $ | – | | | $ | 4,000,000 | | | $ | – | | | $ | 4,000,000 | |
| Agency Mortgage-Backed Securities | | | – | | | | 6,304,349 | | | | – | | | | 6,304,349 | |
| Asset Backed Securities | | | – | | | | 100,521 | | | | – | | | | 100,521 | |
| Bank Loans | | | – | | | | 147,123 | | | | – | | | | 147,123 | |
| Domestic Corporate Bonds | | | – | | | | 1,724,384 | | | | – | | | | 1,724,384 | |
| Domestic Exchange Traded Funds | | | 4,202,587 | | | | – | | | | – | | | | 4,202,587 | |
| Institutional Money Market Funds | | | – | | | | 10,192,447 | | | | – | | | | 10,192,447 | |
| Totals | | $ | 4,202,587 | | | $ | 22,468,824 | | | $ | – | | | $ | 26,671,411 | |
| | | | | | | | | | | | | | | | | |
| Investments in Securities - Liabilities: | | | | | | |
| None. | | | | | | | | | | | | | | | | |
83
Notes to Financial Statements
| Sentinel Fund / Category | | Quoted Prices
(Unadjusted) in Active
Markets for Identical
Assets
(Level 1) | | Other
Significant
Observable
Inputs
(Level 2) | | | Significant
Unobservable
Inputs
(Level 3) | | Total | |
| Derivatives - Assets: | | | | | | | | | | | | | | | | |
| Total Return Bond: | | | | | | | | | | | | | | | | |
| Futures Contracts | | $ | 115,693 | * | | $ | – | | | $ | – | | | $ | 115,693 | * |
| | | | | | | | | | | | | | | | | |
| Unconstrained Bond: | | | | | | | | | | | | | | | | |
| Futures Contracts | | $ | 22,037 | * | | $ | – | | | $ | – | | | $ | 22,037 | * |
| | | | | | | | | | | | | | | | | |
| Derivatives - Liabilities: | | | | | | | | | | | | | | | | |
| None. | | | | | | | | | | | | | | | | |
| | | | | | | | | | | | | | | | | |
*The fair value represents the cumulative unrealized appreciation (depreciation) on open futures contracts; however, the value reflected on the accompanying Statement of Assets and Liabilities is only the unsettled variation margin receivable or payable at that date.
Please refer to each Fund’s Schedule of Investments for more detailed information on specific securities, including industry classifications.
There was no reportable Fair Value Level 3 activity for the fiscal year ended November 30, 2016.
There were no reportable transfers between Level 1, Level 2 and Level 3 investments for the fiscal year ended November 30, 2016.
C. Securities Transactions and Related Investment Income:
For purposes of the Funds’ financial statements, securities transactions are accounted for on trade date. For purposes of calculating the net asset values (NAVs), securities transactions are accounted for on the next business day following trade date (trade date plus one). Under certain circumstances, exceptions are made so that purchases and sales are booked on trade date. These exceptions include:
| | (1) | when trades occur on a day that happens to coincide with the last business day of a calendar month; or |
| | | |
| | (2) | on occasion, if SASI believes significant price movements are deemed large enough to impact the calculation of the net asset value per share. |
Interest income and expenses are recorded on an accrual basis, which includes the amortization of bond premiums on fixed-income securities. Dividend income is recorded on the ex-dividend date when verified by two independent sources and adjusted daily for foreign tax withholding, reclaims and currency fluctuations, when applicable. The cost of securities sold is determined, and realized gains and losses are computed, using the identified cost method. Market discount and original issue discount are accreted to income. Distributions received from the Funds’ investments in real estate investment trusts (“REITs”) and master limited partnerships often include a “return of capital” which is recorded by the Funds as a reduction of the cost basis of the securities held.
D. Dividends and Distributions:
Dividends and distributions to shareholders are recorded on the ex-dividend date. Income distributions and capital gain distributions are determined in accordance with federal income tax regulations, which may differ from GAAP. These differences are primarily due to differing treatments for gains and losses on mortgage-backed securities payment receipts, foreign currency transactions, the reclassification of net investment losses, the expiration of capital loss carry forwards to paid-in capital, returns of capital from underlying investments and tax attributes from acquired funds. The following reclassifications were made to reflect these differences as of November 30, 2016:
| Sentinel Fund | | Accumulated
Undistributed
Net Investment
Income (Loss) | | Accumulated
Undistributed
Net Realized Gain
(Loss) on
Investments and
Foreign Currency
Transactions | | Paid-in Capital |
| Balanced | | $ | 650,241 | | | $ | (650,241 | ) | | $ | - | |
| Common Stock | | | (1,920 | ) | | | 1,920 | | | | - | |
| Government Securities | | | 1,955,647 | | | | (1,955,647 | ) | | | - | |
| International Equity | | | (305,077 | ) | | | 305,077 | | | | - | |
| Low Duration Bond | | | 1,568,285 | | | | (1,062,857 | ) | | | (505,428 | ) |
| Multi-Asset Income | | | 333,537 | | | | (333,537 | ) | | | - | |
| Small Company | | | 5,287,355 | | | | (359,543 | ) | | | (4,927,812 | ) |
| Sustainable Core Opportunities | | | 13,048 | | | | (168,665 | ) | | | 155,617 | |
| Total Return Bond | | | 2,345,323 | | | | (2,345,323 | ) | | | - | |
| Unconstrained Bond | | | 69,158 | | | | (69,158 | ) | | | - | |
84
Notes to Financial Statements
E. Federal Income Taxes:
Each Fund is treated as a separate entity for federal income tax purposes. Each Fund intends to continue to comply with the requirements of Subchapter M of the Internal Revenue Code of 1986 as they apply to regulated investment companies. By so complying, each Fund will not be subject to federal and state income taxes to the extent that all of its income is distributed. The Funds may be subject to taxes imposed by countries in which they invest. Such taxes are generally based on income and/or capital gains earned or repatriated. Taxes are accrued and applied to net investment income, net realized gains and net unrealized appreciation/depreciation as such income and/or gains are earned based on management’s understanding of applicable local tax law.
In accordance with U.S. GAAP requirements regarding accounting for uncertainties in income taxes, management has analyzed the Funds’ tax positions taken or expected to be taken on federal and state income tax returns for all open tax years (the current and the prior three tax years) and has concluded that no provision for income tax is required in the Funds’ financial statements as a result of these uncertainties. As of November 30, 2016, the Funds did not have any unrecognized tax benefits.
F. Foreign Currency Translations:
The books and records of the Funds are maintained in U.S. dollars. Foreign currency amounts are translated into U.S. dollars at the mean between the buying and selling rates on the following basis:
| | (1) | market value of investment securities, assets and liabilities at the closing daily rate of exchange; and |
| | | |
| | (2) | purchases and sales of investment securities, income and expenses at the rate of exchange prevailing on the respective dates of such transactions. |
The Funds do not isolate the portion of gains and losses on investments in securities that is due to changes in the foreign exchange rates from that due to changes in market prices of such securities for purposes of the Funds’ financial statements. However, pursuant to United States federal income tax regulations, gains and losses from certain foreign currency transactions are treated as ordinary income for federal income tax purposes.
G. Forward Foreign Currency Contracts:
Sentinel Balanced Fund, Sentinel Common Stock Fund, Sentinel International Equity Fund, Sentinel Low Duration Bond Fund, Sentinel Multi-Asset Income Fund, Sentinel Small Company Fund, Sentinel Sustainable Core Opportunities Fund, Sentinel Total Return Bond Fund and Sentinel Unconstrained Bond Fund may enter into forward foreign exchange contracts in connection with planned purchases or sales of securities or to hedge the U.S. dollar value of portfolio securities denominated in a foreign currency. Forward contracts are valued at the forward rate and are marked-to-market daily. The daily change in the market value is recorded as an unrealized gain or loss. The Funds realize a gain or loss when the forward contract is closed on delivery of the currency. Risks may arise with respect to entering into forward contracts from potential inability of counterparties to meet the terms of the forward contracts and from unanticipated movements in the value of foreign currencies relative to the U.S. dollar. A Fund’s risk of loss from forward currency contracts may exceed the related amounts reflected on the Statement of Assets and Liabilities. No forward foreign currency contracts were entered into during the fiscal year ended November 30, 2016.
H. Options Contracts:
Each Fund may enter into options contracts.
Purchasing Put Options. By purchasing a put option, a Fund obtains the right (but not the obligation) to sell the instrument underlying the option at a fixed strike price. In return for this right, the Fund pays the current market price for the option (known as the option premium). Options have various types of underlying instruments, including specific securities, indices of securities and indices of securities prices. A Fund may terminate its position in a put position it has purchased by allowing it to expire or by exercising the option. A Fund may also close out a put option position by entering into an offsetting transaction, if a liquid market exists. If the option is allowed to expire, the Fund will lose the entire premium it paid. If a Fund exercises a put option on a security, it will sell the instrument underlying the option at the strike price. If a Fund exercises an option on an index, settlement is in cash and does not involve the actual sale of securities. If an option is American Style, it may be exercised on any day up to its expiration date. A European Style option may be exercised only on its expiration date. The buyer of a typical put option can expect to realize a gain if the price of the underlying instrument falls substantially. However, if the price of the instrument underlying the option does not fall enough to offset the cost of purchasing the option, a put buyer can expect to suffer a loss (limited to the amount of the premium paid, plus related transaction costs). The Funds may purchase put options, but will not sell, or write, put options on individual securities, except to close out put options previously purchased.
Selling (Writing) Call Options. When a Fund writes an option, an amount equal to the premium received by the Fund is recorded as a liability and is subsequently adjusted daily to the current fair value of the option written. Premiums received from writing options that expire unexercised are treated by the Fund on the expiration date as realized gains from investments. The difference between the premium and the amount paid on effecting a closing purchase transaction is also treated as a realized gain, or, if the premium is less than the amount paid for the closing purchase transaction, as a realized loss. If a call option written by a Fund is exercised, the premium is added to the proceeds from the sale of the underlying security in determining whether the Fund has realized a gain or loss. If a put option written by a Fund is exercised, the premium reduces the cost basis of the securities purchased by the Fund.
The risk associated with purchasing put and call options is limited to the premium paid. The features of call options are essentially the same as those of put options, except that the purchaser of a call option obtains the right to purchase, rather than sell, the instrument underlying the option at the option’s strike price. A call buyer typically attempts to participate in potential price increases of the instrument underlying the option with risk limited to the cost of the option if security prices fall. At the same time, the buyer can expect to suffer a loss if the underlying security price does not rise sufficiently to offset the cost of the option. The Funds will not purchase call options on individual securities, except to close out call options previously sold, but may sell, or write, call options on individual securities. Writing a call option obligates a Fund to sell or deliver the option’s underlying instrument in return for the strike price upon exercise of the option. The characteristics of writing call options are similar to those writing put options, except that writing calls generally is a profitable strategy if prices remain the same or fall. Through receipt of the option premium a call writer offsets part of the effect of a price decline. At the same time, because a call writer must be prepared to deliver the underlying instrument in return for the strike price, even if its current value is greater, a call writer gives up some ability to participate in security price increases. The writer of an exchange traded put or call option on a security or an index of securities is required to deposit cash or securities or a letter of credit as margin to make mark-to-market payments of variation margin as the position becomes unprofitable. Written call options have an unlimited risk of loss if the value of the underlying investment increases.
85
Notes to Financial Statements
Options on Indices. Each Fund that is permitted to enter into options transactions may purchase and sell (write) put and call options on any securities index based on securities in which the Fund may invest. Options on securities indices are similar to options on securities, except that the exercise of security index options is settled by cash payment and does not involve the actual purchase or sale of securities. In addition, these options are designed to reflect price fluctuations in a group of securities or segment of the securities market rather than price fluctuations in a single security. A Fund, in purchasing or selling index options, is subject to the risk that the value of its portfolio securities may not change as much as an index because the Fund’s investments generally will not match the composition of an index.
For a number of reasons, a liquid market may not exist and thus a Fund may not be able to close out an option position that it has previously entered into. When a Fund purchases an over-the-counter option, it will be relying on its counterparty to perform its obligations, and a Fund may incur additional losses if the counterparty is unable to perform.
During the fiscal year ended November 30, 2016, none of the Funds entered into options contracts.
I. Futures Contracts:
Each Fund may enter into futures contracts.
When a Fund purchases a futures contract, it agrees to purchase a specified quantity of an underlying instrument at a specified future date or to make a cash payment based on the value of a securities index. When a Fund sells a futures contract, it agrees to sell a specified quantity of the underlying instrument at a specified future date or to receive a cash payment based on the value of a securities index. The price at which the purchase and sale will take place is fixed when a Fund enters into the contract. Any open contract would be recorded as variation margin receivable or payable on the statement of assets and liabilities to the extent such variation margin has not been received or paid and unrealized gain or loss on the statement of operations. When the contract is closed, the Fund realizes a gain or loss equal to the difference between the value of the contract at the time it was opened and the time it was closed. This amount is included in net realized gain or loss on futures contracts in the statement of operations. Futures can be held until their delivery dates or the position can be (and normally is) closed out before then. There is no assurance, however, that a liquid market will exist when a Fund wishes to close out a particular position.
When a Fund purchases a futures contract, the value of the futures contract tends to increase and decrease in tandem with the value of its underlying instrument. Therefore, purchasing futures contracts tends to increase a Fund’s exposure to positive and negative price fluctuations in the underlying instrument, much as if it had purchased the underlying instrument directly. When a Fund sells a futures contract, by contrast, the value of its futures position tends to move in a direction contrary to the value of the underlying instrument. Selling futures contracts, therefore, tends to offset both positive and negative market price changes, much as if the underlying instrument has been sold. During the fiscal year ended November 30, 2016, the Sentinel Balanced, Sentinel Multi-Asset Income, Sentinel Total Return Bond and Sentinel Unconstrained Bond Funds sold varying combinations of futures contracts in U.S. Treasury 10-Year Notes and U.S. Treasury 30-Year Bonds to manage duration by hedging interest rate risk; the Sentinel Government Securities Fund sold futures contracts in U.S. Treasury 30-Year Bonds to manage duration by hedging interest rate risk; the Sentinel Low Duration Bond, Sentinel Multi-Asset Income, Sentinel Total Return Bond and Sentinel Unconstrained Bond Funds sold futures contracts in U.S. Treasury 5-Year Notes to manage duration by hedging interest rate risk; the Sentinel Multi-Asset Income Fund sold futures contracts on the Standard & Poor’s 500 Index to hedge equity market risk; and the Sentinel Total Return Bond and Sentinel Unconstrained Bond Funds sold futures contracts on the Standard & Poor’s 500 Index to hedge high yield market risk associated with corporate bonds.
The purchaser or seller of a futures contract is not required to deliver or pay for the underlying instrument unless the contract is held until the delivery date. However, when a Fund buys or sells a futures contract it is required to deposit “initial margin” with its custodian in a segregated account in the name of its futures broker, known as a futures commission merchant (“FCM”). Initial margin deposits are typically equal to a small percentage of the contract’s value. If the value of either party’s position declines, that party is required to make additional “variation margin” payments equal to the change in value on a daily basis. The party that has a gain may be entitled to receive all or a portion of this amount. A Fund may be obligated to make payments of variation margin at a time when it is disadvantageous to do so. Furthermore, it may not always be possible for a Fund to close out its futures positions. Until it closes out a futures position, a Fund is obligated to continue to pay variation margin. In the event of the bankruptcy of an FCM that holds margin on behalf of a Fund, the Fund may be entitled to return of margin owed to it only in proportion to the amount received by the FCMs other customers, potentially resulting in losses to the Fund. Futures contracts involve, to varying degrees, off-balance sheet risk of loss in excess of the variation margin disclosed on the Statement of Assets and Liabilities.
J. Swaps:
The Sentinel Balanced, Sentinel Government Securities, Sentinel Low Duration Bond, Sentinel Multi-Asset Income, Sentinel Total Return Bond and Sentinel Unconstrained Bond Funds may enter into swaps agreements.
Swaps are privately negotiated over-the-counter derivative products in which two parties agree to exchange payment streams calculated in relation to a rate, index, instrument or certain securities and a particular “notional amount”. Swaps may involve an interest rate (fixed or floating), a commodity price index, or a security, securities index or a combination thereof. A great deal of flexibility is possible in the way the products may be structured, with the effect being that the parties may have exchanged amounts equal to the return on one rate, index or group of securities for another. For example, in a simple fixed-to-floating interest rate swap, one party makes payments equivalent to a fixed interest rate, and the other make payments equivalent to a specified interest rate index. A fixed-income Fund may engage in simple or more complex swap transactions involving a wide variety of underlying instruments or rates.
Swaps are credit-intensive products. A Fund that enters into a swap transaction bears the risk of default (i.e., nonpayment) by the other party to the swap. The internal limitation below which deals with counterparty risk is intended to reduce this risk to the extent reasonably practicable, but it cannot eliminate entirely the risk that a counter-party to a swap, or another OTC derivative, will default. Consistent with current market practices, a Fund will generally enter into swap transactions on a net basis, and all swap transactions with the same party will be documented under a single master agreement to provide for a net payment upon default. In addition, a Fund’s obligations under an agreement will be accrued daily (offset against any amounts owing to the Fund) and any accrued, but unpaid, net amounts owed to the other party to a master agreement will be covered by the maintenance of a segregated account consisting of cash or liquid securities.
Interest rate and total return swaps generally do not involve the delivery of securities, other underlying assets, or principal. In such case, if the other party to an interest rate or total return swap defaults, a Fund’s risk of loss will consist of the payments that a Fund is contractually entitled to receive from the other party. If there is a default by the other party, a Fund may have contractual remedies under the agreements related to the transaction. A credit default swap involves a protection buyer and a protection seller. The Fund may be either a protection buyer or seller. The protection buyer makes periodic premium payments to the protection seller during the swap term in exchange for the protection seller agreeing to make certain defined payments to the protection buyer in the event certain defined credit events occur with respect to a particular security, issuer or basket of securities.
During the fiscal year ended November 30, 2016, none of the Funds entered into swaps agreements.
86
Notes to Financial Statements
K. Derivatives Transactions:
The following table summarizes the fair value of each Fund’s futures contracts held as of November 30, 2016 along with the related location on the accompanying Statement of Assets and Liabilities presented by primary underlying risk exposure:
| Sentinel Fund | | Purpose and Primary
Underlying Risk Exposure | | Location on the
Statement of Assets and Liabilities* | | | Fair Value of Assets* | | | Fair Value of Liabilities* | |
| Total Return Bond | | Hedge interest rate risk. | | Unrealized appreciation (depreciation) of investments and foreign exchange | | | $115,693 | | | $ - | |
| | | | | | | | | | | | |
| Unconstrained Bond | | Hedge interest rate risk. | | Unrealized appreciation (depreciation) of investments and foreign exchange | | | $ 22,037 | | | $ - | |
| | | | | | | | | | | | |
*The fair value represents the cumulative unrealized appreciation (depreciation) on open futures contracts; however, the value reflected on the accompanying Statement of Assets and Liabilities is only the unsettled variation margin receivable or payable at that date.
Additionally, the amounts of realized and unrealized gains and losses on futures contracts recognized in each Fund’s earnings during the fiscal year ended November 30, 2016 along with the related location on the accompanying Statement of Operations presented by primary underlying risk exposure are summarized as follows:
| Sentinel Fund | | Purpose and Primary
Underlying Risk Exposure | | Location of Realized and Unrealized Gain
(Loss) on the Statement of Operations | | Net Realized
Gain (Loss) | | | Net Change in Unrealized
Appreciation (Depreciation) | |
| Balanced | | Hedge interest rate risk. | | Futures contracts | | $ | (186,717 | ) | | | $ | - | | |
| | | | | | | | | | | | | | | |
| Government Securities | | Hedge interest rate risk. | | Futures contracts | | $ | 11,404 | | | | $ | - | | |
| | | | | | | | | | | | | | | |
| Low Duration Bond | | Hedge interest rate risk. | | Futures contracts | | $ | (3,231,308 | ) | | | $ | (733,228 | ) | |
| | | | | | | | | | | | | | | |
| Multi-Asset Income | | Hedge interest rate risk. | | Futures contracts | | $ | (118,222 | ) | | | $ | - | | |
| | | Hedge equity market risk. | | Futures contracts | | $ | 100,763 | | | | $ | (40,750 | ) | |
| | | | | Total | | $ | (17,459 | ) | | | $ | (40,750 | ) | |
| | | | | | | | | | | | | | | |
| Total Return Bond | | Hedge interest rate risk. | | Futures contracts | | $ | (4,041,648 | ) | | | $ | 1,043,829 | | |
| | | Hedge high yield market risk. | | Futures contracts | | $ | 20,832 | | | | $ | (8,150 | ) | |
| | | | | Total | | $ | (4,020,816 | ) | | | $ | 1,035,679 | | |
| | | | | | | | | | | | | | | |
| Unconstrained Bond | | Hedge interest rate risk. | | Futures contracts | | $ | (59,123 | ) | | | $ | 101,517 | | |
| | | Hedge high yield market risk. | | Futures contracts | | $ | 38,015 | | | | $ | (5,433 | ) | |
| | | | | Total | | $ | (21,108 | ) | | | $ | 96,084 | | |
| | | | | | | | | | | | | | | |
During the fiscal year ended November 30, 2016, the average monthly notional value of short futures contracts for the months held was as follows:
| Sentinel Fund | | Average Monthly
Notional Value |
| Low Duration Bond | | $91,018,604 | |
| Multi-Asset Income | | 11,398,922 | |
| Total Return Bond | | 39,478,751 | |
| Unconstrained Bond | | 5,496,501 | |
L. Repurchase Agreements:
Each Fund may enter into repurchase agreements as a means of making short-term investments, of seven days or less, and in aggregate amounts of not more than 25% of the net assets of a Fund. Each Fund, through its custodian, takes possession of the securities collateralizing repurchase agreements. The Funds’ policies require that all repurchase agreements entered into by the Funds provide that the market value of the collateral underlying the repurchase agreement at the time of purchase, and each subsequent business day, will always be at least equal to 102% of the repurchase agreement amount including accrued interest. If the seller defaults and the value of the collateral declines or if bankruptcy proceedings are commenced with respect to the seller of the security, realization of the collateral by the Fund may be delayed or limited. There were no repurchase agreements outstanding at November 30, 2016.
M. Dollar Rolls:
Sentinel Balanced Fund, Sentinel Government Securities Fund, Sentinel Low Duration Bond Fund, Sentinel Multi-Asset Income Fund, Sentinel Total Return Bond Fund and Sentinel Unconstrained Bond Fund may enter into dollar rolls in which the Funds sell securities for delivery in the current month, and simultaneously contract to repurchase similar (same type, coupon and maturity) securities on a specified future date. During the roll period, the Funds forego principal and interest paid on the securities. The Funds are compensated by the interest earned on the cash proceeds of the initial sale and by the lower repurchase price at the future date. Realized gains and losses on sales, if applicable, are recorded on trade date plus one or trade date. There were no dollar roll transactions during the fiscal year ended November 30, 2016.
87
Notes to Financial Statements
N. Short Sales:
Sentinel Balanced Fund, Sentinel Government Securities Fund, Sentinel Low Duration Bond Fund, Sentinel Multi-Asset Income Fund, Sentinel Total Return Bond Fund and Sentinel Unconstrained Bond Fund may enter into short sales of agency mortgage-backed securities (“MBS”) that the Funds do not own, primarily as part of to-be-announced (“TBA”) swap transactions. A TBA swap transaction involves an agreement to purchase one agency MBS and a simultaneous agreement to sell a different agency MBS. Generally, a short sale involves the sale by a Fund of a security that it does not own with the hope of purchasing the same security at a later date at a lower price. A Fund may also enter into a short position through a forward commitment or a short derivative position through a futures contract or swap agreement. If the price of the security or derivative has increased during this time, then the Fund will incur a loss equal to the increase in price from the time that the short sale was entered into plus any premiums and interest paid to a third party. Therefore, short sales involve the risk that a Fund’s losses may be exaggerated (without a limit). By contrast, a loss on a long position arises from decreases in the value of the security and is limited by the fact that a security’s value cannot decrease below zero. The Fund is also subject to the risk that it may be unable to reacquire a security to terminate a short position except at a price substantially in excess of the last quoted price. Securities sold in short sale transactions and the interest payable on such transactions, if any, are reflected as a liability on the Statement of Assets and Liabilities. The Sentinel Government Securities Fund was the only Fund that executed short sale transactions during the fiscal year ended November 30, 2016 with an average monthly market value for the months held of $6,226,406 and no counter-party collateral requirements.
O. Securities Lending:
Under an agreement with SSB, the Funds may lend their securities, up to 50% of each Fund’s portfolio before taking into account the securities on loan, to certain approved brokers, dealers and other financial institutions. Each loan is collateralized by cash in an amount equivalent to 102% (domestic) or 105% (foreign) of the market value of the loaned securities. Any adjustments in collateral required to maintain those levels due to market value fluctuations are made the next business day. The cash collateral is invested in a registered money market fund advised by State Street Global Advisors, a subsidiary of SSB. A portion of the income generated by the investment of the collateral, net of any rebates paid by SSB to the borrowers, is remitted to SSB as lending agent, and the remainder is retained by the Fund. The Fund receives from the borrower all accrued dividend and interest amounts while the securities are out on loan. The Fund retains certain ownership rights as to the loaned securities when retaining such rights is considered to be in the Fund’s best interest. Generally, in the event of borrower default, the Fund has the right to use the collateral to offset any losses incurred. In the event the Fund is delayed or prevented from exercising its right to dispose of the collateral, there may be a potential loss to the Fund. The Fund bears the risk of loss with respect to the investment of the collateral. The income earned by each Fund from securities lending is included in its Statement of Operations.
At November 30, 2016 the following Funds had securities on loan:
| Sentinel Fund | Market Value
Loaned Securities | Market Value
Collateral |
| Multi-Asset Income | | $10,407,037 | | | $10,672,850 | |
| Total Return Bond | | 1,320,292 | | | 1,353,175 | |
P. Line of Credit:
The Company has obtained access to an unsecured line of credit of up to $20,000,000 from SSB for temporary borrowing purposes. Each Fund may borrow up to 5% of its net assets, as calculated using net assets from the previous business day, with a maximum aggregate limit of $20,000,000. Borrowings under this arrangement bear interest at the current overnight Federal Funds rate or the London InterBank Offered Rate (LIBOR), whichever is greater, plus an additional 1.25%. In addition, a commitment fee equal to 0.25% per annum on the daily unused balance is paid quarterly to SSB and is included in Custodian fees on the Statement of Operations. The average amount outstanding and weighted average interest rate for each Fund that utilized the line of credit during the fiscal year ended November 30, 2016 was as follows:
| Sentinel Fund | Daily Average
Amount Outstanding | Weighted Average
Interest Rate |
| Low Duration Bond | | $16,596 | | | 1.79% | |
| Small Company | | 16,698 | | | 1.65% | |
| Total Return Bond | | 30,254 | | | 1.80% | |
At November 30, 2016, none of the Funds had an outstanding balance against this line of credit.
Q. Other:
Direct expenses of a Fund are charged to that Fund while common expenses of the Company are allocated proportionately based upon the Funds’ respective average net assets or number of shareholder accounts.
Expenses not charged to a specific Class of each Fund are allocated on the basis of daily net assets or number of shareholder accounts on a pro rata basis. Class specific expenses such as 12b-1 distribution fees, blue sky registration fees, certain transfer agency fees and NASDAQ listing fees are charged to the appropriate class.
Investment income and realized and unrealized gains and losses are allocated pro rata based on the value of shares outstanding for each Class within a Fund.
Earnings credits are received from SSB on cash balances and are reflected in the Statement of Operations as an expense offset. There were no expense offsets for the fiscal year ended November 30, 2016.
The Sentinel International Equity and Sentinel Small Company Funds are subject to redemption fees of 2% on shares held 30 calendar days or less. The Sentinel Balanced, Sentinel Common Stock, Sentinel Government Securities, Sentinel Low Duration Bond, Sentinel Multi-Asset Income, Sentinel Sustainable Core Opportunities, Sentinel Total Return Bond and Sentinel Unconstrained Bond Funds are subject to, under certain circumstances, an excessive trading fee of 2% of the amount redeemed. Both the redemption fee and excessive trading fee are subject to certain exceptions under which they may not be charged. For the fiscal year ended November 30, 2016 these fees totaled $7,501.
88
Notes to Financial Statements
(3) Management Advisory Fee and Other Transactions with Affiliates:
Pursuant to Investment Advisory Agreements (“Advisory Agreements”), SAMI provides general supervision of the Funds’ investments. Under the Advisory Agreements, each Fund pays SAMI a monthly fee based on the annual rates shown below:
| Sentinel Fund | | Advisory
Fee Rate | | Average Daily Net Assets |
| Each subject to: | | | |
| Balanced | | 0.55% | | | First $200 million |
| Multi-Asset Income | | 0.50% | | | Next $200 million |
| Total Return Bond | | 0.45% | | | Next $600 million |
| | | 0.40% | | | Next $1 billion |
| | | 0.35% | | | In excess of $2 billion |
| Each subject to: | | | |
| Common Stock | | 0.70% | | | First $500 million |
| International Equity | | 0.65% | | | Next $300 million |
| Small Company | | 0.60% | | | Next $200 million |
| Sustainable Core Opportunities | | 0.50% | | | Next $1 billion |
| | | 0.40% | | | In excess of $2 billion |
| Each subject to: | | | |
| Government Securities | | 0.45% | | | First $500 million |
| Low Duration Bond | | 0.40% | | | Next $500 million |
| | | 0.35% | | | Next $1 billion |
| | | 0.30% | | | Next $2 billion |
| | | 0.25% | | | In excess of $4 billion |
| Unconstrained Bond | | 0.75% | | | First $200 million |
| | | 0.70% | | | Next $200 million |
| | | 0.65% | | | Next $600 million |
| | | 0.60% | | | Next $1 billion |
| | | 0.55% | | | In excess of $2 billion |
The Class A shares of all Funds have adopted a distribution plan pursuant to Rule 12b-1 under the 1940 Act. These distribution plans are herein referred to as the “A Plans”. Each of the Funds that offer Class C shares has also adopted a Class C distribution plan applicable to its Class C shares referred to as the “C Plans”. Sentinel Low Duration Bond Fund has adopted a distribution plan for its Class S shares referred to as the “S Plan” and Sentinel Total Return Bond Fund has adopted a distribution plan for its Class R3 shares referred to as the “R3 Plan”
Under the A Plans, each participating Fund pays to Sentinel Financial Services Company (the “Distributor”, a company in which SAMI and Sentinel Financial Services, Inc., a wholly owned subsidiary of SAMI, are partners), a monthly fee at the maximum annual rate of (a) 0.25% of average daily net assets relating to Class A shares outstanding in the case of the Sentinel Balanced, Sentinel Common Stock, Sentinel International Equity, Sentinel Low Duration Bond, Sentinel Multi-Asset Income, Sentinel Small Company and Sentinel Sustainable Core Opportunities Funds or (b) 0.20% of average daily net assets relating to Class A shares outstanding in the case of the Sentinel Government Securities, Sentinel Total Return Bond and Sentinel Unconstrained Bond Funds. Prior to March 30, 2016, the Distributor was paid a monthly fee at the maximum annual rate of 0.30% of average daily net assets relating to Class A shares outstanding in the case of the Sentinel Small Company Fund. Such fees are used to reimburse the Distributor for eligible expenses incurred in connection with distribution and promotion of the shares and, up to 0.25%, for the servicing of shareholders of each participating Fund. No fee is paid with respect to any Fund shares purchased prior to March 1, 1993.
Under the C Plans applicable to the Class C shares, the Class C shares of each of the Sentinel Balanced, Sentinel Common Stock, Sentinel Government Securities, Sentinel International Equity, Sentinel Multi-Asset Income, Sentinel Small Company, Sentinel Total Return Bond and Sentinel Unconstrained Bond Funds pay to the Distributor a monthly fee at an annual rate of up to a total of 1.00% of average daily net assets. Such fees are used to reimburse the Distributor for eligible expenses incurred in connection with distribution and promotion of the shares and, up to 0.25%, for the servicing of shareholders of each participating Fund. In the first year after the purchase, this fee is designed to recover the initial sales commission of 1.00% paid by the Distributor to the selling financial intermediary. In subsequent years, the entire 1.00% may be paid to the financial intermediary as additional commission and/or, up to 0.25%, for service fees.
Under the R3 Plan applicable to the Sentinel Total Return Bond Fund Class R3 shares, these shares pay to the Distributor a monthly fee at an annual rate of up to a total of 0.50% of average daily net assets. Such fees are used to reimburse the Distributor for eligible expenses incurred in connection with distribution and promotion of the shares and, up to 0.25%, for the servicing of shareholders of the Fund. The entire distribution fee may be paid to the selling dealer.
Under the S Plan applicable to the Sentinel Low Duration Bond Fund Class S shares, these shares pay to the Distributor a monthly fee at an annual rate of up to a total of 0.50% of average daily net assets. Such fees are used to reimburse the Distributor for eligible expenses incurred in connection with distribution and promotion of the shares and, up to 0.25%, for the servicing of shareholders of the Fund. The entire distribution fee may be paid to the selling dealer.
The Class I shares and Class R6 shares do not pay distribution fees.
The Funds are not assessed distribution fees on shares owned by NLV Financial Corporation and its affiliates. Where NLV Financial Corporation and its affiliates held an investment for part of or all of the reporting period, this potentially results in overall distribution fees for that share class of less than the maximum limits involved. NLV Financial Corporation and its affiliates held investments for the entire period in the Sentinel Total Return Bond Fund Class R3 and Sentinel Unconstrained Bond Fund Classes A and C.
These asset-based fees, except the service fee component, are subject to aggregate limits imposed by the Financial Industry Regulatory Authority, Inc. (“FINRA”).
89
Notes to Financial Statements
The Distributor will not be reimbursed for any un-reimbursed eligible expenses from any other Fund, or in any future year from any of the Funds.
The Distributor also receives a sales charge added to the net asset value received by the Funds on the sale of Class A shares. This compensation is not an expense of the Funds and does not affect their operating results. The Distributor has advised the Funds that it received sales charges aggregating $3,043,739 for the fiscal year ended November 30, 2016. The Funds have been advised that the total distribution charges retained by the Distributor on the sale of shares amounted to $279,898 after allowances of $543,372 to Equity Services, Inc., a subsidiary of NLV Financial Corporation, and $2,220,469 to other investment dealers. During this same period, the distributor advised the Funds that it received $31,136 in contingent deferred sales charges from certain redemptions of Class A shares, $26,579 in contingent deferred sales charges from redemptions of Class C shares and no contingent deferred sales charges from redemptions of Class I, R3, R6 or S shares.
Effective January 1, 2016, each Director who is not an affiliate of SAMI receives an annual fee of $89,000 from the Company. The Lead Independent Director and chairs of the Audit and Governance Committees are each paid an additional annual fee of $8,000. The Fees paid to Directors are generally distributed quarterly on a pro rata basis. Directors are also reimbursed for travel and other out-of-pocket expenses incurred by them in connection with attending such meetings. Certain Directors of the Funds have chosen to have their fees deferred in accordance with the Funds’ deferred compensation plan. This plan is intended to enable any eligible Director of the Company to forego a portion of current compensation in exchange for the promise by the Company to pay a benefit at a later time as set forth in this plan. These amounts are included in Directors’ and Chief Compliance Officer’s fees and expenses and Deferred compensation expenses on the Statement of Operations and Statement of Assets and Liabilities, respectively.
The Funds’ Chief Compliance Officer also serves as Chief Compliance Officer of Sentinel Variable Products Trust (“SVP”), a series investment company also advised by SAMI, SAMI itself, and the separate accounts of National Life Insurance Company which fund the variable life insurance and annuity products of SVP. Pursuant to an amended and restated agreement as of November 26, 2007, the Funds and SVP pay 50% of the costs incurred by these Chief Compliance Officer functions, including the salary and benefits of the Funds’ Chief Compliance Officer and his administrative assistant, and the other costs incurred by the Chief Compliance Officer. The Funds and SVP allocate their 50% share of these costs in proportion to net assets. Out-of-pocket costs which can be specifically allocated to a particular entity are so allocated.
Directors’ and Chief Compliance Officer’s fees and expenses for the fiscal year ended November 30, 2016 were $1,023,301.
Pursuant to a Transfer Agency and Service Agreement between the Company and Boston Financial Data Services, Inc. (“BFDS”), BFDS serves as the transfer agent for the Funds. The Company also has an Amended and Restated Administration Agreement with SASI under which SASI provides a) general administrative services and b) transfer agency administrative and oversight services on behalf of the Company. Under the general administrative services portion of the agreement, the Funds receive administration services and pay SASI a monthly fee at an annual rate of 0.0375% of the first $4 billion of the Company’s aggregate average daily net assets; 0.035% of the next $3 billion of the Company’s aggregate average daily net assets and 0.0325% of the Company’s aggregate average daily net assets in excess of $7 billion. Under the transfer agency administrative and oversight services portion of the agreement, the Funds receive monitoring and oversight of transfer agency vendor services and are responsible for all costs and expenses relating to the individuals designated by SASI to perform such services on behalf of SASI. The number of such individuals to be designated by SASI to perform services is subject to approval by the Board of Directors. The Funds are also responsible for all charges of outside pricing services and other out-of-pocket expenses incurred by SASI in connection with the performance of its duties. The Funds may also reimburse SASI for subtransfer agency, plan agent and similar fees paid by SASI to other entities that provide services to accounts underlying an omnibus account of record in accordance with policies approved by the Board of Directors.
Fees paid to SASI under the provisions of the Amended and Restated Administration Agreement for the fiscal year ended November 30, 2016 were $2,876,551.
SAMI has contractually agreed to reimburse certain expenses paid by the Class I shares of each Fund to the extent necessary to prevent the total annual fund operating expense ratios of the Class I shares of each Fund, on an annualized basis, from exceeding the total annual fund operating expense ratio of the respective Class A shares of the same Fund, where applicable. This agreement will continue through March 31, 2017. This agreement may be terminated upon 90 days’ notice by a majority of the non-interested directors of the Funds. For the fiscal year ended November 30, 2016, none of the Funds were required to be reimbursed under this agreement.
SAMI has contractually agreed to waive fees and/or reimburse certain expenses in order to limit Total Annual Fund Operating Expenses After Fee Waiver and/or Expense Reimbursement for Sentinel Common Stock Fund Class R6 shares, on an annualized basis, to 0.65% of average daily net assets attributable to Class R6 shares through March 31, 2017. This agreement may be terminated upon 90 days’ notice by a majority of the non-interested directors of the Fund. For the fiscal year ended November 30, 2016, the total amount reimbursed under this agreement to Sentinel Common Stock Fund Class R6 was $16,833.
SAMI has contractually agreed to waive fees and/or reimburse certain expenses in order to limit Total Annual Fund Operating Expenses After Fee Waiver and/or Expense Reimbursement for Sentinel Small Company Fund Class R6 shares, on an annualized basis, to 0.73% of average daily net assets attributable to Class R6 shares through March 31, 2017. This agreement may be terminated upon 90 days’ notice by a majority of the non-interested directors of the Fund. For the fiscal year ended November 30, 2016, the total amount reimbursed under this agreement to Sentinel Small Company Fund Class R6 was $15,217.
SAMI has contractually agreed to waive fees and/or reimburse certain expenses in order to limit Total Annual Fund Operating Expenses After Fee Waiver and/or Expense Reimbursement for Class A Shares of the Sentinel Total Return Bond Fund, on an annualized basis, to 0.89% of average daily net assets attributable to Class A shares until March 31, 2017. The Class C, Class I, Class R3 and Class R6 shares of this Fund also benefitted from this arrangement to the extent SAMI waived its advisory fees to meet this commitment. In addition, the Fund’s investment advisor has contractually agreed to waive fees and/or reimburse certain expenses in order to limit Total Annual Fund Operating Expenses After Fee Waiver and/or Expense Reimbursement for Class R3 shares, on an annualized basis, to 1.19% of average daily net assets attributable to Class R3 shares through March 31, 2017, and to waive fees and/or reimburse certain expenses in order to limit Total Annual Fund Operating Expenses After Fee Waiver and/or Expense Reimbursement for Class R6 shares, on an annualized basis, to 0.69% of average daily net assets attributable to Class R6 shares through March 31, 2017. Each of these agreements may be terminated upon 90 days’ notice by a majority of the non-interested directors of the Fund. For the fiscal year ended November 30, 2016, the total amount reimbursed under these agreements to Sentinel Total Return Bond Fund Class A was $306,198, Sentinel Total Return Bond Fund Class R3 was $12,216 and Sentinel Total Return Bond Fund Class R6 was $13,415.
90
Notes to Financial Statements
SAMI has contractually agreed to waive fees and/or reimburse certain expenses in order to limit Total Annual Fund Operating Expenses After Fee Waiver and/or Expense Reimbursement for Sentinel Unconstrained Bond Fund Class C shares, on an annualized basis, to 2.06% of average daily net assets attributable to Class C shares through March 31, 2017. This agreement may be terminated upon 90 days’ notice by a majority of the non-interested directors of the Fund. For the fiscal year ended November 30, 2016, no reimbursements were required to Sentinel Unconstrained Bond Fund Class C.
Certain of the fee waiver agreements contain provisions allowing for recoupment of waived fees or expenses reimbursed under certain circumstances. Recoupment of fees waived and expenses reimbursed is limited to the lesser of the applicable expense cap, if any, in effect at the time of the waiver and the applicable expense cap, if any, in effect at the time of recoupment, and any recoupment must occur within three years from the date of the related waiver or reimbursement.
As of November 30, 2016, NLV Financial Corporation and its affiliates held ownership in the Funds as follows:
| Sentinel Fund | | Approximate %
Ownership |
| Balanced - I | | 13.21% | |
| Common Stock – R6 | | 2.18% | |
| International Equity - I | | 0.44% | |
| Low Duration Bond - I | | 28.44% | |
| Small Company – R6 | | 5.18% | |
| Sustainable Core Opportunities – I | | 9.37% | |
| Total Return Bond – R3 | | 100.00% | |
| Total Return Bond – R6 | | 100.00% | |
| Unconstrained Bond – A | | 98.01% | |
| Unconstrained Bond – C | | 90.47% | |
| Unconstrained Bond – I | | 97.30% | |
(4) Fund Shares:
At November 30, 2016, 2.94 billion shares of one cent par value were authorized as follows:
| Class A | | Authorized Shares |
| Balanced | | | 40,000,000 | |
| Common Stock | | | 75,000,000 | |
| Government Securities | | | 170,000,000 | |
| International Equity | | | 20,000,000 | |
| Low Duration Bond | | | 200,000,000 | |
| Multi-Asset Income | | | 25,000,000 | |
| Small Company | | | 300,000,000 | |
| Sustainable Core Opportunities | | | 40,000,000 | |
| Total Return Bond | | | 50,000,000 | |
| Unconstrained Bond | | | 40,000,000 | |
| | | | 960,000,000 | |
| Class C | | | | |
| Balanced | | | 10,000,000 | |
| Common Stock | | | 10,000,000 | |
| Government Securities | | | 20,000,000 | |
| International Equity | | | 10,000,000 | |
| Multi-Asset Income | | | 15,000,000 | |
| Small Company | | | 50,000,000 | |
| Total Return Bond | | | 40,000,000 | |
| Unconstrained Bond | | | 40,000,000 | |
| | | | 195,000,000 | |
| | | | | |
| | | | | |
| | | | | |
| | | | | |
| | | | | |
| | | | | |
| | | | | |
| Class I | | Authorized Shares |
| Balanced | | | 40,000,000 | |
| Common Stock | | | 40,000,000 | |
| Government Securities | | | 40,000,000 | |
| International Equity | | | 40,000,000 | |
| Low Duration Bond | | | 40,000,000 | |
| Multi-Asset Income | | | 40,000,000 | |
| Small Company | | | 250,000,000 | |
| Sustainable Core Opportunities | | | 40,000,000 | |
| Total Return Bond | | | 300,000,000 | |
| Unconstrained Bond | | | 40,000,000 | |
| | | | 870,000,000 | |
| Class R3 | | | | |
| Total Return Bond | | | 40,000,000 | |
| | | | | |
| Class R6 | | | | |
| Common Stock | | | 40,000,000 | |
| Small Company | | | 40,000,000 | |
| Total Return Bond | | | 40,000,000 | |
| | | | 120,000,000 | |
| Class S | | | | |
| Low Duration Bond | | | 200,000,000 | |
| | | | | |
| Total Allocated Shares | | | 2,385,000,000 | |
| | | | | |
| Total Unallocated Shares | | | 555,000,000 | |
| | | | | |
91
Notes to Financial Statements
Proceeds from sales and payments for redemptions on Fund shares as shown in the statement of changes in net assets are represented by the following number of shares.
| | | | | | | Shares Issued in | | | | |
| | | | | Shares issued in Fund | | Reinvestment of | | | | Net Increase |
| | | | | Reorganizations | | Dividends and | | | | (Decrease) in |
| Sentinel Fund | | Shares sold | | (see note 5) | | Distributions | | Shares Reacquired | | Shares Outstanding |
| Fiscal Year Ended November 30, 2016 | | | | | | | | | | | | | | | | | |
| Balanced – A | | | 1,565,029 | | | | – | | | | 714,717 | | | | 2,065,116 | | | | 214,630 | |
| Balanced – C | | | 674,076 | | | | – | | | | 83,917 | | | | 348,665 | | | | 409,328 | |
| Balanced – I | | | 375,707 | | | | – | | | | 32,255 | | | | 304,459 | | | | 103,503 | |
| Common Stock – A | | | 2,011,742 | | | | – | | | | 2,743,659 | | | | 5,680,117 | | | | (924,716 | ) |
| Common Stock – C | | | 229,138 | | | | – | | | | 187,505 | | | | 531,259 | | | | (114,616 | ) |
| Common Stock – I | | | 2,399,401 | | | | – | | | | 1,261,092 | | | | 6,597,450 | | | | (2,936,957 | ) |
| Common Stock – R6 | | | 519,016 | | | | – | | | | 42,879 | | | | 277,504 | | | | 284,391 | |
| Government Securities – A | | | 2,458,054 | | | | – | | | | 333,249 | | | | 6,009,143 | | | | (3,217,840 | ) |
| Government Securities – C | | | 206,410 | | | | – | | | | 30,818 | | | | 662,910 | | | | (425,682 | ) |
| Government Securities – I | | | 2,117,702 | | | | – | | | | 80,169 | | | | 2,696,642 | | | | (498,771 | ) |
| International Equity – A | | | 1,553,659 | | | | – | | | | 243,606 | | | | 1,107,176 | | | | 690,089 | |
| International Equity – C | | | 151,705 | | | | – | | | | 9,255 | | | | 54,798 | | | | 106,162 | |
| International Equity – I | | | 2,607,571 | | | | – | | | | 34,334 | | | | 901,887 | | | | 1,740,018 | |
| Low Duration Bond - A | | | 2,301,935 | | | | – | | | | 227,761 | | | | 4,672,752 | | | | (2,143,056 | ) |
| Low Duration Bond – I | | | 604,135 | | | | – | | | | 95,923 | | | | 4,188,836 | | | | (3,488,778 | ) |
| Low Duration Bond - S | | | 5,791,345 | | | | – | | | | 558,086 | | | | 18,564,883 | | | | (12,215,452 | ) |
| Multi-Asset Income – A | | | 2,647,803 | | | | – | | | | 935,383 | | | | 3,154,025 | | | | 429,161 | |
| Multi-Asset Income – C | | | 1,410,297 | | | | – | | | | 682,264 | | | | 1,905,183 | | | | 187,378 | |
| Multi-Asset Income – I | | | 3,292,797 | | | | – | | | | 307,771 | | | | 1,686,342 | | | | 1,914,226 | |
| Small Company – A | | | 13,503,919 | | | | 21,750,338 | * | | | 20,377,103 | | | | 30,416,453 | | | | 25,214,907 | |
| Small Company – C | | | 3,214,030 | | | | 3,030,573 | * | | | 8,091,895 | | | | 8,674,499 | | | | 5,661,999 | |
| Small Company – I | | | 16,511,503 | | | | 1,122,267 | * | | | 5,753,132 | | | | 14,489,625 | | | | 8,897,277 | |
| Small Company – R6 | | | 2,539,283 | | | | –* | | | | 23,450 | | | | 189,301 | | | | 2,373,432 | |
| Sustainable Core Opportunities – A | | | 402,241 | | | | 5,893,856 | ** | | | 324,336 | | | | 1,446,834 | | | | 5,173,599 | |
| Sustainable Core Opportunities – I | | | 188,554 | | | | 296,222 | ** | | | 21,956 | | | | 204,492 | | | | 302,240 | |
| Total Return Bond – A | | | 4,068,123 | | | | – | | | | 345,735 | | | | 25,938,355 | | | | (21,524,497 | ) |
| Total Return Bond – C | | | 400,482 | | | | – | | | | 46,433 | | | | 1,527,315 | | | | (1,080,400 | ) |
| Total Return Bond – I | | | 12,386,007 | | | | – | | | | 639,377 | | | | 31,360,953 | | | | (18,335,569 | ) |
| Total Return Bond – R3 | | | – | | | | – | | | | 1,296 | | | | – | | | | 1,296 | |
| Total Return Bond – R6 | | | – | | | | – | | | | 1,409 | | | | – | | | | 1,409 | |
| Unconstrained Bond – A | | | 3,630 | | | | – | | | | 8,233 | | | | 583 | | | | 11,280 | |
| Unconstrained Bond – C | | | 7,377 | | | | – | | | | 1,606 | | | | 9,469 | | | | (486 | ) |
| Unconstrained Bond – I | | | 47,594 | | | | – | | | | 33,861 | | | | 3,088 | | | | 78,367 | |
* Please see note 5 for specific details of the Plan of Reorganization. The reorganization was completed following the close of business on March 30, 2016 by a tax-free exchange of 5,792,669 shares of the Sentinel Mid Cap Fund Class A for 21,750,338 shares of the Sentinel Small Company Fund Class A , a merger conversion ratio of 3.75480448; 746,855 shares of the Sentinel Mid Cap Fund Class C for 3,030,573 shares of the Sentinel Small Company Fund Class C, a merger conversion ratio of 4.05778094; 306,597 shares of the Sentinel Mid Cap Fund Class I for 1,122,267 shares of the Sentinel Small Company Fund Class I, a merger conversion ratio of 3.66039781; and none for the Sentinel Small Company Fund Class R6 because the Sentinel Mid Cap Fund did not offer a comparable share class.
** Please see note 5 for specific details of the Plan of Reorganization. The reorganization was completed following the close of business on March 30, 2016 by a tax-free exchange of 7,459,256 shares of the Sentinel Sustainable Mid Cap Opportunities Fund Class A for 5,893,856 shares of the Sentinel Sustainable Core Opportunities Fund Class A , a merger conversion ratio of 0.79013990; and 357,360 shares of the Sentinel Sustainable Mid Cap Opportunities Fund Class I for 296,222 shares of the Sentinel Sustainable Core Opportunities Fund Class I, a merger conversion ratio of 0.82891798.
92
Notes to Financial Statements
| | | | | Shares Issued in | | | | |
| | | | | Reinvestment of | | | | Net Increase |
| | | | | Dividends and | | | | (Decrease) in |
| Sentinel Fund | | Shares sold | | Distributions | | Shares Reacquired | | Shares Outstanding |
| Fiscal Year Ended November 30, 2015 | | | | | | | | | | | | | | | | |
| Balanced – A | | | 1,197,542 | | | | 778,124 | | | | 1,995,335 | | | | (19,669 | ) |
| Balanced – C | | | 450,192 | | | | 76,223 | | | | 274,453 | | | | 251,962 | |
| Balanced – I | | | 205,096 | | | | 42,922 | | | | 427,929 | | | | (179,911 | ) |
| Common Stock – A | | | 1,992,072 | | | | 329,803 | | | | 6,314,314 | | | | (3,992,439 | ) |
| Common Stock – C | | | 243,115 | | | | 9,655 | | | | 285,724 | | | | (32,954 | ) |
| Common Stock – I | | | 2,009,397 | | | | 201,109 | | | | 8,015,164 | | | | (5,804,658 | ) |
| Common Stock – R6^ | | | 422,770 | | | | 107 | | | | 139 | | | | 422,738 | |
| Government Securities – A | | | 2,154,747 | | | | 381,091 | | | | 10,004,792 | | | | (7,468,954 | ) |
| Government Securities – C | | | 285,094 | | | | 36,073 | | | | 1,240,309 | | | | (919,142 | ) |
| Government Securities – I | | | 641,488 | | | | 77,949 | | | | 2,790,050 | | | | (2,070,613 | ) |
| International Equity – A | | | 689,585 | | | | 1,193,596 | | | | 1,066,302 | | | | 816,879 | |
| International Equity – C | | | 106,588 | | | | 37,282 | | | | 40,555 | | | | 103,315 | |
| International Equity – I | | | 558,561 | | | | 100,971 | | | | 331,164 | | | | 328,368 | |
| Low Duration Bond - A | | | 3,557,740 | | | | 329,897 | | | | 11,548,028 | | | | (7,660,391 | ) |
| Low Duration Bond – I | | | 1,838,405 | | | | 121,109 | | | | 1,430,670 | | | | 528,844 | |
| Low Duration Bond - S | | | 8,045,666 | | | | 873,878 | | | | 27,927,083 | | | | (19,007,539 | ) |
| Multi-Asset Income – A | | | 1,558,553 | | | | 936,004 | | | | 2,542,346 | | | | (47,789 | ) |
| Multi-Asset Income – C | | | 1,502,771 | | | | 642,339 | | | | 1,907,112 | | | | 237,998 | |
| Multi-Asset Income – I | | | 1,655,772 | | | | 285,470 | | | | 1,932,818 | | | | 8,424 | |
| Small Company – A | | | 13,733,300 | | | | 30,458,442 | | | | 32,089,950 | | | | 12,101,792 | |
| Small Company – C | | | 3,409,420 | | | | 9,354,012 | | | | 5,959,653 | | | | 6,803,779 | |
| Small Company – I | | | 14,211,985 | | | | 8,756,837 | | | | 18,612,382 | | | | 4,356,440 | |
| Small Company – R6^ | | | 106,860 | | | | – | | | | – | | | | 106,860 | |
| Sustainable Core Opportunities – A | | | 325,809 | | | | 93,369 | | | | 1,023,879 | | | | (604,701 | ) |
| Sustainable Core Opportunities – I | | | 72,116 | | | | 7,235 | | | | 89,174 | | | | (9,823 | ) |
| Total Return Bond – A | | | 22,322,082 | | | | 496,079 | | | | 11,439,658 | | | | 11,378,503 | |
| Total Return Bond – C | | | 848,106 | | | | 49,813 | | | | 1,226,922 | | | | (329,003 | ) |
| Total Return Bond – I | | | 23,975,928 | | | | 796,113 | | | | 24,698,242 | | | | 73,799 | |
| Total Return Bond – R3^ | | | 56,845 | | | | 777 | | | | – | | | | 57,622 | |
| Total Return Bond – R6^ | | | 56,801 | | | | 847 | | | | – | | | | 57,648 | |
| Unconstrained Bond – A^ | | | 507,273 | | | | 6,073 | | | | 101 | | | | 513,245 | |
| Unconstrained Bond – C^ | | | 168,158 | | | | 1,373 | | | | – | | | | 169,531 | |
| Unconstrained Bond – I^ | | | 1,909,628 | | | | 24,598 | | | | 197 | | | | 1,934,029 | |
^ Commenced operations December 23, 2014.
From time to time the Funds may have a concentration of several shareholders holding a significant percentage of shares outstanding. Investment activities of these shareholders could have a material impact on the Funds. The latest Statement of Additional Information has more details about the Fund’s shareholders that own beneficially 5% or more of the voting stock of any class of any Fund or 25% or more of a Fund and is available, without charge, upon request by calling (800) 282-3863 or on-line at www.sentinelinvestments.com.
93
Notes to Financial Statements
(5) Reorganizations:
Pursuant to a Plan of Reorganization approved by the Board on December 3, 2015, as of the close of business on March 30, 2016, Sentinel Small Company Fund acquired 100% of the voting equity interests, substantially all of the assets and assumed substantially all of the liabilities of Sentinel Mid Cap Fund, a separate series of the Company, in a tax-free reorganization in exchange for shares of the Sentinel Small Company Fund. The primary reason for the transaction was to combine a smaller Fund into a larger Fund with similar investment strategies and policies. For financial reporting purposes, the net assets received and shares issued by the Sentinel Small Company Fund were recorded at fair value; however, the Sentinel Mid Cap Fund’s cost of investments were carried forward to align ongoing reporting of the Sentinel Small Company Fund’s realized and unrealized gains and losses with amounts distributable to shareholders for tax purposes. The merger conversion ratios and number of shares are presented in Note (4) and the value of shares issued by the Sentinel Small Company Fund is presented in the Statement of Changes in Net Assets and in the schedule below. Net assets and acquired unrealized appreciation (depreciation) as of the reorganization date were as follows:
| | | | | | | | | | Total | | | |
| | | | | | | | | | Net Assets of | | | Acquired | |
| | | | | | Total | | | Total | | | Acquiring Fund | | | Fund Unrealized | |
| Acquiring | | Acquired | | | Net Assets of | | | Net Assets of | | | After the | | | Appreciation/ | |
| Fund | | Fund | | | Acquiring Fund | | | Acquired Fund | | | Acquisition | | | (Depreciation) | |
| Sentinel Small Company | | Sentinel Mid Cap | | | | | | | | | | | | | |
| Fund Class A | | Fund Class A | | | $546,804,192 | | | $97,558,873 | | | $644,363,065 | | | $9,958,785 | |
| | | | | | | | | | | | | | | | |
| Sentinel Small Company | | Sentinel Mid Cap | | | 97,641,067 | | | 8,942,615 | | | 106,583,682 | | | (5,233,947 | ) |
| Fund Class C | | Fund Class C | | | | | | | | | | | | | |
| | | | | | | | | | | | | | | | |
| Sentinel Small Company | | Sentinel Mid Cap | | | 209,050,954 | | | 5,382,625 | | | 214,433,579 | | | 7,617,354 | |
| Fund Class I | | Fund Class I | | | | | | | | | | | | | |
| | | | | | | | | | | | | | | | |
| Sentinel Small Company | | None | | | 2,116,165 | | | - | | | 2,116,165 | | | - | |
| Fund Class R6 | | | | | | | | | | | | | | | |
| | | | | | $855,612,378 | | | $111,884,113 | * | | $967,496,491 | | | $12,342,192 | |
| | | | | | | | | | | | | | | | |
* The net assets of the Sentinel Mid Cap Fund were primarily comprised of investments with a fair value of $112,084,254 just prior to the reorganization.
The financial statements reflect the operations of the Sentinel Small Company Fund for the period prior to the acquisition and the combined fund for the period subsequent to the acquisition. Assuming the acquisition had been completed on December 1, 2015, the beginning of the fiscal annual reporting period of the Sentinel Small Company Fund, Sentinel Small Company Fund’s pro forma results of operations for the year ended November 30, 2016 would be estimated as follows:
| Increase (Decrease) in Net Assets from Operations | | | |
| Net investment income (loss) | | $ (3,621,210 | ) |
| Net realized gain (loss) on investments, futures contracts and foreign currency transactions | | 95,636,043 | |
| Net change in unrealized appreciation (depreciation) | | 27,441,323 | |
| Net increase (decrease) in net assets from operations | | $119,456,156 | |
| | | | |
Because the combined investment portfolios have been managed as a single integrated portfolio since the acquisition was completed, it is not practicable to separate the amounts of revenue and earnings of Sentinel Mid Cap Fund that have been included in the Sentinel Small Company Fund’s statement of operations since March 30, 2016.
Pursuant to a Plan of Reorganization approved by the Board on December 3, 2015, as of the close of business on March 30, 2016, Sentinel Sustainable Core Opportunities Fund acquired 100% of the voting equity interests, substantially all of the assets and assumed substantially all of the liabilities of Sentinel Sustainable Mid Cap Opportunities Fund, a separate series of the Company, in a tax-free reorganization in exchange for shares of the Sentinel Sustainable Core Opportunities Fund. The primary reason for the transaction was to combine a smaller Fund into a larger Fund with similar investment strategies and policies. For financial reporting purposes, the net assets received and shares issued by the Sentinel Sustainable Core Opportunities Fund were recorded at fair value; however, the Sentinel Sustainable Mid Cap Opportunities Fund’s cost of investments were carried forward to align ongoing reporting of the Sentinel Sustainable Core Opportunities Fund’s realized and unrealized gains and losses with amounts distributable to shareholders for tax purposes. The merger conversion ratios and number of shares are presented in Note (4) and the value of shares issued by the Sentinel Sustainable Core Opportunities Fund is presented in the Statement of Changes in Net Assets and in the schedule below. Net assets and acquired unrealized appreciation (depreciation) as of the reorganization date were as follows:
| | | | | | | | | | Total | | | |
| | | | | | | | | | Net Assets of | | | Acquired | |
| | | | | | Total | | | Total | | | Acquiring Fund | | | Fund Unrealized | |
| Acquiring | | Acquired | | | Net Assets of | | | Net Assets of | | | After the | | | Appreciation/ | |
| Fund | | Fund | | | Acquiring Fund | | | Acquired Fund | | | Acquisition | | | (Depreciation) | |
| Sentinel Sustainable | | Sentinel Sustainable | | | | | | | | | | | | | |
| Core Opportunities | | Mid Cap Opportunities | | | $218,441,256 | | | $116,823,960 | | | $335,265,216 | | | $6,526,618 | |
| Fund Class A | | Fund Class A | | | | | | | | | | | | | |
| | | | | | | | | | | | | | | | |
| Sentinel Sustainable | | Sentinel Sustainable | | | | | | | | | | | | | |
| Core Opportunities | | Mid Cap Opportunities | | | 14,715,877 | | | 5,888,166 | | | 20,604,043 | | | 1,664,519 | |
| Fund Class I | | Fund Class I | | | | | | | | | | | | | |
| | | | | | $233,157,133 | | | $122,712,126 | * | | $355,869,259 | | | $8,191,137 | |
| | | | | | | | | | | | | | | | |
| * | The net assets of the Sentinel Sustainable Mid Cap Opportunities Fund were primarily comprised of investments with a fair value of $122,910,546 just prior to the reorganization. |
94
Notes to Financial Statements
The financial statements reflect the operations of the Sentinel Sustainable Core Opportunities Fund for the period prior to the acquisition and the combined fund for the period subsequent to the acquisition. Assuming the acquisition had been completed on December 1, 2015, the beginning of the fiscal annual reporting period of the Sentinel Sustainable Core Opportunities Fund, Sentinel Sustainable Core Opportunities Fund’s pro forma results of operations for the year ended November 30, 2016 would be estimated as follows:
| | | | |
| Increase (Decrease) in Net Assets from Operations | | | |
| Net investment income (loss) | | $ 2,720,870 | |
| Net realized gain (loss) on investments, futures contracts and foreign currency transactions | | 7,257,185 | |
| Net change in unrealized appreciation (depreciation) | | 10,499,733 | |
| Net increase (decrease) in net assets from operations | | $20,477,788 | |
| | | | |
Because the combined investment portfolios have been managed as a single integrated portfolio since the acquisition was completed, it is not practicable to separate the amounts of revenue and earnings of Sentinel Sustainable Mid Cap Opportunities Fund that have been included in the Sentinel Sustainable Core Opportunities Fund’s statement of operations since March 30, 2016.
(6) Investment Transactions:
Purchases and sales of investment securities (excluding short term obligations, forward foreign currency contracts, futures contracts, swaps and written options) for the fiscal year ended November 30, 2016 were as follows:
| | | | Purchases of Other | | | Purchases of U.S. | | | Sales of Other than | | | Sales of U.S. | |
| | | | than U.S. Government | | | Government Direct | | | U.S. Government | | | Government Direct | |
| | | | Direct and Agency | | | and Agency | | | Direct and Agency | | | and Agency | |
| Sentinel Fund | | | Obligations | | | Obligations | | | Obligations | | | Obligations | |
| Balanced | | $ | 47,010,059 | | $ | 78,366,455 | | $ | 56,963,182 | | $ | 85,956,651 | |
| Common Stock | | | 173,728,104 | | | – | | | 483,773,508 | | | – | |
| Government Securities | | | 1,845,000 | | | 125,758,470 | | | 1,880,000 | | | 162,371,645 | |
| International Equity | | | 92,077,048 | | | – | | | 51,293,864 | | | – | |
| Low Duration Bond | | | 283,471,313 | | | 116,877,960 | | | 482,242,648 | | | 154,331,149 | |
| Multi-Asset Income | | | 476,845,236 | | | 105,655,606 | | | 498,629,018 | | | 117,802,382 | |
| Small Company | | | 536,607,633 | | | – | | | 760,823,113 | | | – | |
| Sustainable Core Opportunities | | | 102,715,255 | | | – | | | 111,642,996 | | | – | |
| Total Return Bond | | | 454,495,439 | | | 737,600,813 | | | 649,617,962 | | | 921,506,644 | |
| Unconstrained Bond | | | 23,615,902 | | | 52,850,275 | | | 30,982,715 | | | 49,929,329 | |
(7) Investment Transactions with Affiliated Investment Companies:
Pursuant to Section 17a-7 of the Investment Company Act of 1940, as amended, purchases and sales of investment securities are permitted among affiliated investment companies for the purposes of executing trades consistent with each Fund’s investment strategies and also minimizing or eliminating trading costs associated with external brokers. Compliance with Section 17a-7 is monitored internally by qualified personnel and reported to the Board at regular intervals. Section 17a-7 purchases and sales along with associated net realized gains or losses for the fiscal year ended November 30, 2016 were as follows:
| | | | Aggregate | | | Aggregate | | | Net Realized | |
| Sentinel Fund | | | Purchases | | | Sales | | | Gain (Loss) | |
| Balanced | | $ | 1,144,121 | | $ | 501,062 | | $ | 11,934 | |
| Low Duration Bond | | | 11,403,650 | | | 27,675,704 | | | 346,188 | |
| Multi-Asset Income | | | 26,998,714 | | | 2,288,243 | | | (256,363 | ) |
| Total Return Bond | | | 1,843,1340 | | | 10,265,563 | | | 443,142 | |
| Unconstrained Bond | | | 90,374 | | | 732,015 | | | 31,821 | |
95
Notes to Financial Statements
(8) Distributions to Shareholders:
Under the Regulated Investment Company Modernization Act of 2010 (the “Act”), net capital losses recognized by a Fund after November 30, 2011, may get carried forward indefinitely, and retain their character as short-term and/or long-term losses. Prior to the Act, pre-enactment net capital losses incurred by a Fund were carried forward for eight years and treated as short-term losses. The Act requires that post-enactment net capital losses be used before pre-enactment net capital losses. Pre-enactment losses may be more likely to expire unused since the Act prescribes that post-enactment losses must be utilized first.
At November 30, 2016, the Company had tax basis capital losses which may be used to offset future capital gains as follows:
| | Capital Loss | |
| Sentinel Fund | Carry Forward | Expiring on 11/30 |
| Government Securities | $ | 45,630,221 | No Expiration (Short-Term) |
| | | 12,826,885 | No Expiration (Long-Term) |
| Total | $ | 58,457,106 | |
| | | | |
| International Equity | $ | 229,675 | No Expiration (Long-Term) |
| | | | |
| Low Duration Bond | $ | 2,065,072 | 2017 |
| | | 16,447,278 | 2018 |
| | | 32,731,463 | 2019 |
| | | 20,336,624 | No Expiration (Short-Term) |
| | | 55,664,865 | No Expiration (Long-Term) |
| Total | $ | 127,245,302 | |
| | | | |
| Total Return Bond | $ | 6,884,255 | No Expiration (Short-Term) |
| | | 27,426,941 | No Expiration (Long-Term) |
| Total | $ | 34,311,196 | |
| | | | |
| Unconstrained Bond | $ | 126,768 | No Expiration (Short-Term) |
| | | 204,572 | No Expiration (Long-Term) |
| Total | $ | 331,340 | |
| | | | |
During the fiscal year ended November 30, 2016, the Funds utilized capital losses as follows:
| | Capital Losses |
| Sentinel Fund | Utilized |
| Low Duration Bond | $5,208,454 |
| Total Return Bond | 1,216,511 |
It is unlikely that a capital gains distribution will be paid to shareholders of the Funds until net gains have been realized in excess of such capital loss carry forwards or the carry forwards expire. The following Funds had capital loss carry forwards expire last fiscal year:
| | Capital Losses |
| Sentinel Fund | Expired |
| Low Duration Bond | $505,428 |
Net ordinary losses incurred after December 31st and within the taxable year are deemed to arise on the first business day of the Fund’s next taxable year. For the period from December 1, 2015 to November 30, 2016, the Funds elected to defer until the first business day of the next fiscal year for U.S. Federal income tax purposes net ordinary losses as stated below:
| | Ordinary Losses |
| Sentinel Fund | Deferred |
| Small Company | $2,834,460 |
The tax character of distributions paid during the fiscal year ended November 30, 2016 were as follows:
| | | | Ordinary | | | | Long Term | | | | Return of | | | | | |
| Sentinel Fund | | | Income | | | | Capital Gain | | | | Capital | | | | Total | |
| Balanced | | $ | 6,767,216 | | | $ | 9,916,784 | | | $ | - | | | $ | 16,684,000 | |
| Common Stock | | | 57,077,267 | | | | 137,723,635 | | | | - | | | | 194,800,902 | |
| Government Securities | | | 5,576,817 | | | | - | | | | - | | | | 5,576,817 | |
| International Equity | | | 976,876 | | | | 3,860,204 | | | | - | | | | 4,837,080 | |
| Low Duration Bond | | | 7,914,698 | | | | - | | | | - | | | | 7,914,698 | |
| Multi-Asset Income | | | 12,533,676 | | | | 14,587,830 | | | | - | | | | 27,121,506 | |
| Small Company | | | - | | | | 159,188,187 | | | | - | | | | 159,188,187 | |
| Sustainable Core Opportunities | | | 4,798,172 | | | | 2,336,192 | | | | - | | | | 7,134,364 | |
| Total Return Bond | | | 13,269,338 | | | | | | | | - | | | | 13,269,338 | |
| Unconstrained Bond | | | 430,754 | | | | | | | | - | | | | 430,754 | |
96
Notes to Financial Statements
The tax character of distributions paid during the fiscal year ended November 30, 2015 were as follows:
| | | | Ordinary | | | | Long Term | | | | Return of | | | | | |
| Sentinel Fund | | | Income | | | | Capital Gain | | | | Capital | | | | Total | |
| Balanced | | $ | 4,538,159 | | | $ | 13,846,187 | | | $ | - | | | $ | 18,384,346 | |
| Common Stock | | | 26,299,490 | | | | 998,965 | | | | - | | | | 27,298,455 | |
| Government Securities | | | 6,553,189 | | | | - | | | | - | | | | 6,553,189 | |
| International Equity | | | 2,241,462 | | | | 19,511,422 | | | | - | | | | 21,752,884 | |
| Low Duration Bond | | | 12,263,947 | | | | - | | | | - | | | | 12,263,947 | |
| Multi-Asset Income | | | 8,251,204 | | | | 20,893,052 | | | | - | | | | 29,144,256 | |
| Small Company | | | 2,604,516 | | | | 267,930,931 | | | | - | | | | 270,535,447 | |
| Sustainable Core Opportunities | | | 2,064,388 | | | | - | | | | - | | | | 2,064,388 | |
| Total Return Bond | | | 16,913,052 | | | | 0 | | | | 77,444 | | | | 16,990,496 | |
| Unconstrained Bond^ | | | 316,833 | | | | 0 | | | | - | | | | 316,833 | |
^Commenced operations December 23, 2014.
As of November 30, 2016, the components of distributable earnings on a tax basis were as follows:
| | Currently | | Currently | | | | |
| | Distributable | | Distributable Long | | Unrealized | |
| | Ordinary | | Term Capital Gain or | | Appreciation | |
| Fund | Income | | Capital Loss Carryover | | (Depreciation) | |
| Balanced | $ | 740,417 | | $ | 2,124,196 | | $ | 96,365,867 | |
| Common Stock | | 7,615,136 | | | 115,781,742 | | | 959,075,887 | |
| Government Securities | | 179,494 | | | (58,457,106 | ) | | 1,292,328 | |
| International Equity | | 539,432 | | | (229,675 | ) | | 4,204,172 | |
| Low Duration Bond | | 163,920 | | | (127,245,302 | ) | | (737,025 | ) |
| Multi-Asset Income | | 2,299,107 | | | - | | | (1,069,198 | ) |
| Small Company | | - | | | 89,358,006 | | | 198,358,212 | |
| Sustainable Core Opportunities | | 2,595,035 | | | 4,380,458 | | | 90,987,279 | |
| Total Return Bond | | 15,455 | | | (34,311,196 | ) | | 1,075,026 | |
| Unconstrained Bond | | 903 | | | (331,340 | ) | | (203,877 | ) |
The difference between book basis and tax basis unrealized appreciation/(depreciation) is attributable primarily due to wash sales recognized for tax purposes and return of capital distributions from portfolio investments.
(9) Post Retirement Benefits:
Sentinel Group Funds, Inc. provides certain health care and life insurance benefits to certain of its retirees. The projected obligations for such benefits have been accrued and the total estimated liabilities as of November 30, 2016 included in the line item Accrued expenses on the Statement of Assets and Liabilities are as follows:
| Sentinel Fund | |
| Balanced – A | $ 7,581 |
| Common Stock – A | 61,939 |
| Government Securities – A | 6,503 |
| Small Company – A* | 6,227 |
| * | This specific accrued liability was assumed from the Sentinel Mid Cap Fund Class A following the reorganization completed after the close of business on March 30, 2016. |
(10) Indemnifications:
In the normal course of business, the Funds enter into contracts that contain a variety of representations, which provide general indemnifications. The Funds’ maximum exposure under these contracts is unknown as this would involve future claims that may be made against the Funds that have not yet occurred. However, based on experience, the Funds expect the risk of loss to be remote.
(11) Subsequent Events:
In preparing these financial statements, management has evaluated events and transactions for potential recognition or disclosure through the date the financial statements were issued.
On December 15, 2016, the Sentinel Funds paid the following dividends and distributions per share (unaudited):
| | | | Net | | | | | | | | | |
| | | | Investment | | | | Short-Term | | | | Long-Term | |
| Sentinel Fund | | | Income | | | | Capital Gain | | | | Capital Gain | |
| Balanced - A | | $ | 0 .079 | | | $ | - | | | $ | 0 .13019 | |
| Balanced - C | | | 0 .041 | | | | - | | | | 0 .13019 | |
| Balanced - I | | | 0 .091 | | | | - | | | | 0 .13019 | |
| Common Stock - A | | | 0 .163 | | | | - | | | | 2 .45933 | |
| Common Stock - C | | | 0 .084 | | | | - | | | | 2 .45933 | |
| Common Stock - I | | | 0 .194 | | | | - | | | | 2 .45933 | |
| Common Stock - R6 | | | 0 .202 | | | | - | | | | 2 .45933 | |
| Government Securities - A | | | 0 .029 | | | | - | | | | - | |
| Government Securities - C | | | 0 .021 | | | | - | | | | - | |
| Government Securities - I | | | 0 .030 | | | | - | | | | - | |
| International Equity - A | | | 0 .104 | | | | - | | | | - | |
| International Equity - C | | | - | | | | - | | | | - | |
| International Equity - I | | | 0 .180 | | | | - | | | | - | |
| Low Duration Bond - A | | | 0 .006 | | | | - | | | | - | |
| Low Duration Bond - I | | | 0 .009 | | | | - | | | | - | |
| Low Duration Bond - S | | | 0 .005 | | | | - | | | | - | |
| | | | Net | | | | | | | | | |
| | | | Investment | | | | Short-Term | | | | Long-Term | |
| Sentinel Fund | | | Income | | | | Capital Gain | | | | Capital Gain | |
| Multi-Asset Income - A | | $ | 0 .053 | | | $ | 0.09223 | | | $ | - | |
| Multi-Asset Income - C | | | 0 .044 | | | | 0.09223 | | | | - | |
| Multi-Asset Income - I | | | 0 .056 | | | | 0.09223 | | | | - | |
| Small Company - A | | | - | | | | - | | | | 0 .41838 | |
| Small Company - C | | | - | | | | - | | | | 0 .41838 | |
| Small Company - I | | | - | | | | - | | | | 0 .41838 | |
| Small Company - R6 | | | - | | | | - | | | | 0 .41838 | |
| Sustainable Core Opportunities - A | | | 0 .149 | | | | - | | | | 0 .25704 | |
| Sustainable Core Opportunities - I | | | 0 .204 | | | | - | | | | 0 .25704 | |
| Total Return Bond - A | | | 0 .023 | | | | - | | | | - | |
| Total Return Bond - C | | | 0 .015 | | | | - | | | | - | |
| Total Return Bond - I | | | 0 .025 | | | | - | | | | - | |
| Total Return Bond - R3 | | | 0 .023 | | | | - | | | | - | |
| Total Return Bond - R6 | | | 0 .025 | | | | - | | | | - | |
| Unconstrained Bond - A | | | 0 .007 | | | | - | | | | - | |
| Unconstrained Bond - C | | | 0 .001 | | | | - | | | | - | |
| Unconstrained Bond - I | | | 0 .010 | | | | - | | | | - | |
There were no other subsequent events identified that require recognition or disclosure.
97
Report of Independent Registered Public Accounting Firm
To the Board of Directors and Shareholders of Sentinel Group Funds, Inc.
In our opinion, the accompanying statements of assets and liabilities, including the schedules of investments, and the related statements of operations and of changes in net assets and the financial highlights present fairly, in all material respects, the financial position of Sentinel Balanced Fund, Sentinel Common Stock Fund, Sentinel Government Securities Fund, Sentinel International Equity Fund, Sentinel Low Duration Bond Fund, Sentinel Multi-Asset Income Fund, Sentinel Small Company Fund, Sentinel Sustainable Core Opportunities Fund, Sentinel Total Return Bond Fund and Sentinel Unconstrained Bond Fund, comprising Sentinel Group Funds, Inc. (hereafter referred to as the “Funds”) at November 30, 2016, the results of each of their operations for the year then ended, and the changes in each of their net assets and each of their financial highlights for each of the periods presented, in conformity with accounting principles generally accepted in the United States of America. These financial statements and financial highlights (hereafter referred to as “financial statements”) are the responsibility of the Funds’ management. Our responsibility is to express an opinion on these financial statements based on our audits. We conducted our audits of these financial statements in accordance with the standards of the Public Company Accounting Oversight Board (United States). Those standards require that we plan and perform the audit to obtain reasonable assurance about whether the financial statements are free of material misstatement. An audit includes examining, on a test basis, evidence supporting the amounts and disclosures in the financial statements, assessing the accounting principles used and significant estimates made by management, and evaluating the overall financial statement presentation. We believe that our audits, which included confirmation of securities at November 30, 2016 by correspondence with the custodian and brokers, provide a reasonable basis for our opinion.
PricewaterhouseCoopers LLP
New York, New York
January 19, 2017
98
Actual and Hypothetical Expenses for Comparison Purposes
(Unaudited)
Example
As a shareholder of one or more of the Sentinel Funds, you incur two types of costs: (1) transaction costs, including sales charges (loads) on purchase payments; redemption fees; and exchange fees; and (2) ongoing costs, including management fees; distribution and service (12b-1) fees; and other Fund expenses. The example for each share class is intended to help you understand your ongoing costs (in dollars) of investing in the Funds and to compare these costs with the ongoing costs of investing in other mutual funds.
Each example is based on an investment of $1,000 invested at the beginning of the period and held for the entire period from 06/01/16 through 11/30/16.
Actual Expenses
The first line of each share class entry in the table beginning on the next page provides information about actual account values and actual expenses. You may use the information in this line, together with the amount you invested, to estimate the expenses that you paid over the period. Simply divide your account value by $1,000 (for example, an $8,600 account value divided by $1,000 = 8.6), then multiply the result by the number in the first line under the heading entitled “Expenses Paid from 06/01/16 through 11/30/16” to estimate the expenses you paid on your account during this period.
Certain Account Fees and Minimum Account Size
Certain participant accounts are subject to the following recurring annual fees that are not included in the expenses shown in the table. If your account was subject to these fees, then the actual account values at the end of the period would be lower and the actual expenses for the period would be higher. Due to the expense of maintaining accounts with small balances, we reserve the right to liquidate and currently charge an annual maintenance fee of $25 to any account that has a current value less than $1,000 and that has been open for at least 24 months. This fee is deducted automatically from each such shareholder account on a quarterly pro-rated basis.
Miscellaneous Recurring Fees:
| Retirement Custodial Accounts: | |
| Annual Custodial Fee per Social Security Number | $15.00 |
| Closeout Fee per Account | $15.00 |
| Transfer of Assets per Transaction | $25.00 |
| Service Fees: | |
| Express Mail Deliveries | $15.00 |
| Federal Funds Wire | $20.00 |
| Bounced check-writing checks | $25.00 |
| Bounced check received for deposit | $25.00 |
| Copy of check-writing check written prior to March 2008 | $10.00 |
Recurring Fees for Services for Employee Benefit Plans
The Sentinel Destinations platform offers participant record keeping services to employer-sponsored retirement plans such as 401(k), pension or profit sharing plans. Plans using the Sentinel Destinations platform will be subject to additional fees for the services provided. Contact your financial advisor or Sentinel Administrative Services, Inc. for more information regarding Sentinel Destinations.
Hypothetical Example for Comparison Purposes
The second line of each share class entry in the table beginning on the next page provides information about hypothetical account values and hypothetical expenses based on the actual expense ratio of the share class and an assumed rate of return of 5% per year before expenses, which is not the actual return of the share class. The hypothetical account values and expenses may not be used to estimate the actual ending account balance or expenses you paid for the period. You may use this information to compare the ongoing costs of investing in a specific Sentinel Fund share class to other funds. To do so, compare this 5% hypothetical example with the 5% hypothetical examples that appear in the shareholder reports of the other funds. As with actual account values and expenses, the hypothetical account values and expenses shown in the table do not reflect any of the recurring fees outlined above. If your account is subject to such fees, then the hypothetical account values at the end of the period shown and the hypothetical expenses paid for the period should be increased before comparing these amounts to the corresponding amounts for other funds.
Please note that the expenses shown in the table are meant to highlight your ongoing costs only and do not reflect any transactional costs, such as sales charges (loads) or redemption fees. Therefore, the second line of the table is useful in comparing ongoing costs only, and will not help you determine the relative total costs of owning different funds. In addition, if these transactional costs were included, your costs would have been higher.
99
Expenses
| | Actual and hypothetical expenses for each Sentinel Fund share class are provided in this table. |
| (Unaudited) | More detailed expenses data is contained the accompanying Financial Statements and related Notes. |
| | | | | | | Total | | Beginning | | Ending | | Annualized | | Expenses Paid |
| | | | | Total Return | | Return | | Account Value | | Account Value | | Expense | | from 06/01/16 |
| Sentinel Fund | | Fund Class | | Description | | Percentage | | 06/01/16 | | 11/30/16 | | Ratio | | through 11/30/16* |
| Balanced | | | | | | | | | | | | | | | | | | | | | | | | |
| | | A Shares | | Actual | | | 3.27 | | | | $1,000.00 | | | | $1,032.74 | | | | 0.98 | | | | $4.98 | |
| | | | | Hypothetical+ | | | 2.01 | | | | 1,000.00 | | | | 1,020.10 | | | | 0.98 | | | | 4.95 | |
| | | C Shares | | Actual | | | 2.84 | | | | 1,000.00 | | | | 1,028.43 | | | | 1.74 | | | | 8.82 | |
| | | | | Hypothetical+ | | | 1.63 | | | | 1,000.00 | | | | 1,016.30 | | | | 1.74 | | | | 8.77 | |
| | | I Shares | | Actual | | | 3.37 | | | | 1,000.00 | | | | 1,033.67 | | | | 0.80 | | | | 4.07 | |
| | | | | Hypothetical+ | | | 2.10 | | | | 1,000.00 | | | | 1,021.00 | | | | 0.80 | | | | 4.04 | |
| Common Stock | | | | | | | | | | | | | | | | | | | | | | | | |
| | | A Shares | | Actual | | | 5.54 | | | | 1,000.00 | | | | 1,055.39 | | | | 1.00 | | | | 5.14 | |
| | | | | Hypothetical+ | | | 2.00 | | | | 1,000.00 | | | | 1,020.00 | | | | 1.00 | | | | 5.05 | |
| | | C Shares | | Actual | | | 5.15 | | | | 1,000.00 | | | | 1,051.48 | | | | 1.77 | | | | 9.08 | |
| | | | | Hypothetical+ | | | 1.61 | | | | 1,000.00 | | | | 1,016.15 | | | | 1.77 | | | | 8.92 | |
| | | I Shares | | Actual | | | 5.69 | | | | 1,000.00 | | | | 1,056.91 | | | | 0.72 | | | | 3.70 | |
| | | | | Hypothetical+ | | | 2.14 | | | | 1,000.00 | | | | 1,021.40 | | | | 0.72 | | | | 3.64 | |
| | | R6 Shares | | Actual | | | 5.74 | | | | 1,000.00 | | | | 1,057.42 | | | | 0.65 | | | | 3.34 | |
| | | | | Hypothetical+ | | | 2.17 | | | | 1,000.00 | | | | 1,021.75 | | | | 0.65 | | | | 3.29 | |
| Government Securities | | | | | | | | | | | | | | | | | | | | | | | | |
| | | A Shares | | Actual | | | -1.30 | | | | 1,000.00 | | | | 986.99 | | | | 0.89 | | | | 4.42 | |
| | | | | Hypothetical+ | | | 2.05 | | | | 1,000.00 | | | | 1,020.55 | | | | 0.89 | | | | 4.50 | |
| | | C Shares | | Actual | | | -1.68 | | | | 1,000.00 | | | | 983.16 | | | | 1.69 | | | | 8.38 | |
| | | | | Hypothetical+ | | | 1.66 | | | | 1,000.00 | | | | 1,016.55 | | | | 1.69 | | | | 8.52 | |
| | | I Shares | | Actual | | | -1.19 | | | | 1,000.00 | | | | 988.07 | | | | 0.65 | | | | 3.23 | |
| | | | | Hypothetical+ | | | 2.17 | | | | 1,000.00 | | | | 1,021.75 | | | | 0.65 | | | | 3.29 | |
| International Equity | | | | | | | | | | | | | | | | | | | | | | | | |
| | | A Shares | | Actual | | | -5.08 | | | | 1,000.00 | | | | 949.24 | | | | 1.33 | | | | 6.48 | |
| | | | | Hypothetical+ | | | 1.84 | | | | 1,000.00 | | | | 1,018.35 | | | | 1.33 | | | | 6.71 | |
| | | C Shares | | Actual | | | -5.54 | | | | 1,000.00 | | | | 944.59 | | | | 2.31 | | | | 11.23 | |
| | | | | Hypothetical+ | | | 1.35 | | | | 1,000.00 | | | | 1,013.45 | | | | 2.31 | | | | 11.63 | |
| | | I Shares | | Actual | | | -4.94 | | | | 1,000.00 | | | | 950.62 | | | | 0.97 | | | | 4.73 | |
| | | | | Hypothetical+ | | | 2.01 | | | | 1,000.00 | | | | 1,020.15 | | | | 0.97 | | | | 4.90 | |
| Low Duration Bond | | | | | | | | | | | | | | | | | | | | | | | | |
| | | A Shares | | Actual | | | 0.36 | | | | 1,000.00 | | | | 1,003.58 | | | | 1.01 | | | | 5.06 | |
| | | | | Hypothetical+ | | | 2.00 | | | | 1,000.00 | | | | 1,019.95 | | | | 1.01 | | | | 5.10 | |
| | | I Shares | | Actual | | | 0.62 | | | | 1,000.00 | | | | 1,006.18 | | | | 0.58 | | | | 2.91 | |
| | | | | Hypothetical+ | | | 2.21 | | | | 1,000.00 | | | | 1,022.10 | | | | 0.58 | | | | 2.93 | |
| | | S Shares | | Actual | | | 0.39 | | | | 1,000.00 | | | | 1,003.95 | | | | 1.07 | | | | 5.36 | |
| | | | | Hypothetical+ | | | 1.96 | | | | 1,000.00 | | | | 1,019.65 | | | | 1.07 | | | | 5.40 | |
100
Expenses
| | | | | | | Total | | Beginning | | Ending | | Annualized | | Expenses Paid |
| | | | | Total Return | | Return | | Account Value | | Account Value | | Expense | | from 06/01/16 |
| Sentinel Fund | | Fund Class | | Description | | Percentage | | 06/01/16 | | 11/30/16 | | Ratio | | through 11/30/16* |
| Multi-Asset Income | | | | | | | | | | | | | | | | | | | | | | | | |
| | | A Shares | | Actual | | | 2.04 | | | | $1,000.00 | | | | $1,020.36 | | | | 0.99 | | | | $5.00 | |
| | | | | Hypothetical+ | | | 2.00 | | | | 1,000.00 | | | | 1,020.05 | | | | 0.99 | | | | 5.00 | |
| | | C Shares | | Actual | | | 1.68 | | | | 1,000.00 | | | | 1,016.81 | | | | 1.72 | | | | 8.67 | |
| | | | | Hypothetical+ | | | 1.64 | | | | 1,000.00 | | | | 1,016.40 | | | | 1.72 | | | | 8.67 | |
| | | I Shares | | Actual | | | 2.19 | | | | 1,000.00 | | | | 1,021.89 | | | | 0.80 | | | | 4.04 | |
| | | | | Hypothetical+ | | | 2.10 | | | | 1,000.00 | | | | 1,021.00 | | | | 0.80 | | | | 4.04 | |
| Small Company | | | | | | | | | | | | | | | | | | | | | | | | |
| | | A Shares | | Actual | | | 12.43 | | | | 1,000.00 | | | | 1,124.33 | | | | 1.18 | | | | 6.27 | |
| | | | | Hypothetical+ | | | 1.91 | | | | 1,000.00 | | | | 1,019.10 | | | | 1.18 | | | | 5.96 | |
| | | C Shares | | Actual | | | 12.03 | | | | 1,000.00 | | | | 1,120.27 | | | | 1.92 | | | | 10.18 | |
| | | | | Hypothetical+ | | | 1.54 | | | | 1,000.00 | | | | 1,015.40 | | | | 1.92 | | | | 9.67 | |
| | | I Shares | | Actual | | | 12.64 | | | | 1,000.00 | | | | 1,126.40 | | | | 0.86 | | | | 4.57 | |
| | | | | Hypothetical+ | | | 2.07 | | | | 1,000.00 | | | | 1,020.70 | | | | 0.86 | | | | 4.34 | |
| | | R6 Shares | | Actual | | | 12.54 | | | | 1,000.00 | | | | 1,125.41 | | | | 0.73 | | | | 3.88 | |
| | | | | Hypothetical+ | | | 2.14 | | | | 1,000.00 | | | | 1,021.35 | | | | 0.73 | | | | 3.69 | |
| Sustainable Core Opportunities | | | | | | | | | | | | | | | | | | | | | | | | |
| | | A Shares | | Actual | | | 5.11 | | | | 1,000.00 | | | | 1,051.07 | | | | 1.17 | | | | 6.00 | |
| | | | | Hypothetical+ | | | 1.92 | | | | 1,000.00 | | | | 1,019.15 | | | | 1.17 | | | | 5.91 | |
| | | I Shares | | Actual | | | 5.24 | | | | 1,000.00 | | | | 1,052.37 | | | | 0.87 | | | | 4.46 | |
| | | | | Hypothetical+ | | | 2.07 | | | | 1,000.00 | | | | 1,020.65 | | | | 0.87 | | | | 4.39 | |
| Total Return Bond | | | | | | | | | | | | | | | | | | | | | | | | |
| | | A Shares | | Actual | | | -0.02 | | | | 1,000.00 | | | | 999.78 | | | | 0.89 | | | | 4.45 | |
| | | | | Hypothetical+ | | | 2.05 | | | | 1,000.00 | | | | 1,020.55 | | | | 0.89 | | | | 4.50 | |
| | | C Shares | | Actual | | | -0.56 | | | | 1,000.00 | | | | 994.42 | | | | 1.83 | | | | 9.12 | |
| | | | | Hypothetical+ | | | 1.58 | | | | 1,000.00 | | | | 1,015.85 | | | | 1.83 | | | | 9.22 | |
| | | I Shares | | Actual | | | -0.05 | | | | 1,000.00 | | | | 999.48 | | | | 0.85 | | | | 4.25 | |
| | | | | Hypothetical+ | | | 2.08 | | | | 1,000.00 | | | | 1,020.75 | | | | 0.85 | | | | 4.29 | |
| | | R3 Shares | | Actual | | | -0.12 | | | | 1,000.00 | | | | 998.81 | | | | 0.89 | | | | 4.45 | |
| | | | | Hypothetical+ | | | 2.05 | | | | 1,000.00 | | | | 1,020.55 | | | | 0.89 | | | | 4.50 | |
| | | R6 Shares | | Actual | | | -0.02 | | | | 1,000.00 | | | | 999.76 | | | | 0.69 | | | | 3.45 | |
| | | | | Hypothetical+ | | | 2.16 | | | | 1,000.00 | | | | 1,021.55 | | | | 0.69 | | | | 3.49 | |
| Unconstrained Bond | | | | | | | | | | | | | | | | | | | | | | | | |
| | | A Shares | | Actual | | | 0.20 | | | | 1,000.00 | | | | 1,002.03 | | | | 1.28 | | | | 6.41 | |
| | | | | Hypothetical+ | | | 1.86 | | | | 1,000.00 | | | | 1,018.60 | | | | 1.28 | | | | 6.46 | |
| | | C Shares | | Actual | | | -0.03 | | | | 1,000.00 | | | | 999.73 | | | | 1.80 | | | | 9.00 | |
| | | | | Hypothetical+ | | | 1.60 | | | | 1,000.00 | | | | 1,016.00 | | | | 1.80 | | | | 9.07 | |
| | | I Shares | | Actual | | | 0.38 | | | | 1,000.00 | | | | 1,003.76 | | | | 1.05 | | | | 5.26 | |
| | | | | Hypothetical+ | | | 1.97 | | | | 1,000.00 | | | | 1,019.75 | | | | 1.05 | | | | 5.30 | |
*Expenses are equal to the annualized expense ratio for the share class, multiplied by the average account value over the period, multiplied by 183/365 to reflect the one-half year period.
+ Hypothetical assumes a 5.00% annual return less expenses for the period.
101
Additional Information for Shareholders (Unaudited)
Federal Tax Status of Dividends and Distributions (unaudited)
Certain tax information for the Sentinel Funds is required to be provided to shareholders based upon the Funds’ income and distributions for the taxable year ended November 30, 2016. The information and distributions reported in this annual report may differ from the information and taxable distributions reported to shareholders for the calendar year ended December 31, 2016. The information required to complete your income tax returns for the calendar year will be sent to you in February 2017.
The following table represents the percentage of ordinary income distributions eligible for the dividends received deduction and the percentage of its ordinary income distributions treated as qualified dividend income along with the dollar amount of long-term capital gains distributed by the Funds.
| | | Dividends | Qualified | Long-Term |
| | | Received | Dividend | Capital Gain |
| Sentinel Fund | | Deduction | Income | Distributions |
| Balanced | | 97.70% | 100.00% | $ 9,916,784 |
| Common Stock | | 100.00% | 100.00% | 137,723,635 |
| International Equity | | 0.00% | 100.00% | 3,860,204 |
| Mid Cap* | | - | - | 16,669,509 |
| Multi-Asset Income | | 1.94% | 16.81% | 14,587,830 |
| Small Company | | - | - | 159,188,187 |
| Sustainable Core Opportunities | | 100.00% | 100.00% | 2,336,192 |
| Sustainable Mid Cap Opportunities** | | - | - | 12,371,039 |
| | | |
| * | | The Sentinel Mid Cap Fund reorganized into the Sentinel Small Company Fund following the close of business on March 30, 2016. |
| ** | | The Sentinel Sustainable Mid Cap Opportunities Fund reorganized into the Sentinel Sustainable Core Opportunities Fund following the close of business on March 30, 2016. |
Portfolio Proxy Voting Guidelines and Voting Record
Sentinel Funds portfolio proxy voting guidelines, and information on how the Funds voted proxies relating to portfolio securities during the most recent 12-month period ended June 30th, are available without charge on-line at www.sentinelinvestments.com and at www.sec.gov, or by calling 1-800-282-FUND (3863).
Availability of Quarterly Schedule of Investments
Each Fund files its complete schedule of portfolio holdings with the Securities and Exchange Commission for the first and third quarters of each fiscal year on Form N-Q. The Funds’ Forms N-Q are available on the SEC’s website at www.sec.gov and may be reviewed and copied at the SEC’s Public Reference Room in Washington, D.C. (Call 1-800-SEC-0330 for more information.)
102
Board Approval of Investment Advisory Agreements (Unaudited)
Sentinel Group Funds, Inc. (the “Company”) has entered into advisory agreements (collectively, “Advisory Agreements”) with Sentinel Asset Management, Inc. (“Advisor”) for each of its series funds (each a “Fund” and collectively, “Funds”). As required by the Investment Company Act of 1940 (the “Investment Company Act”), the Board of Directors of the Company (the “Board” or the “Directors”) considers on an annual basis whether to approve the continuance of these agreements for an additional year. The Advisory Agreements were last approved by the Board on August 17, 2016.
Contract Review Process
In anticipation of the annual consideration of the renewal of the Advisory Agreements, the Directors who are not interested persons of any Fund (as such persons are defined in the Investment Company Act) (the “Independent Directors”) considered, at meetings held in March and June 2016, the process to be followed in connection with the 2016 review of the Advisory Agreements. The Funds’ counsel, which is independent of the Advisor, participated in those discussions. Prior to the June 2016 meeting, and as part of this process, the Governance, Contracts and Nominating Committee of the Board submitted a letter to the Advisor requesting specific information to be provided to the Independent Directors for review as part of their deliberations.
The Independent Directors met to consider the continuance of the Advisory Agreements on July 21, 2016. Prior to that meeting, the Advisor provided the Independent Directors with information described below relating to the Advisor and its affiliates, and the Advisory Agreements. In addition, also prior to such meeting, the Funds’ counsel provided the Independent Directors with a memorandum discussing the legal standards for their consideration of the Advisory Agreements. Following the July 21, 2016 meeting, the Independent Directors requested and received additional information from the Advisor. The Board, including all of the Independent Directors, met on August 15-17, 2016 to further consider the continuance of the Advisory Agreements. The Funds’ counsel participated in the July 21 and August 15-17 meetings.
The Board’s approvals were based on its consideration, at those meetings and throughout the preceding year, of the advisory related services provided by the Advisor and its affiliates, and the personnel who provide these services. In reaching its determinations, the Board considered all factors it believed to be relevant, including performance information provided by Morningstar Inc. (“Morningstar”) for each Fund’s Class A shares as compared to the Class A shares of similar mutual funds not managed by the Advisor; the nature, extent and quality of services rendered by the Advisor and its affiliates; revenue received by the Advisor and its affiliates from the Funds; the costs borne by, and profitability of, the Advisor and its affiliates in providing services to each of the Funds; Fund advisory fees and Class A share expense information provided by Morningstar as compared to those of similar mutual funds not managed by the Advisor; the extent to which economies of scale would be realized as the Funds grow and whether fee levels reflect these economies of scale for the benefit of investors; the policies and practices of the Advisor regarding execution of portfolio transactions of the Funds, including the extent to which the Advisor benefits from soft dollar arrangements; indirect (so-called “fallout”) benefits that the Advisor and its affiliates may receive from their relationships to the Funds; information about fees charged by the Advisor to other clients with similar objectives; the professional experience and qualifications of each Fund’s portfolio manager(s) and other senior personnel of the Advisor; the compliance record of the Advisor and affiliates under applicable laws and under their respective internal compliance programs; and the terms of the Advisory Agreements.
The Board’s conclusions on a series of points relating to the Advisor, the services it provides and the Advisory Agreements are summarized below. The conclusions were based on the review described above.
Advisor Personnel and Investment Process
Each quarter the Directors discuss with senior management of the Advisor the strategies being used to achieve each Fund’s stated objectives. Among other things, the Board considers the size, education and experience of each Fund’s portfolio management team.
Throughout the year, the Board requested and received information that included sales and redemption data for each Fund, a discussion on investment strategies used by the Fund and the valuation and pricing of each Fund’s portfolio holdings. The Board also considered the material provided by the Advisor at the Board’s request discussed above that included performance and expense information (including advisory fees) for other similar mutual funds provided by Morningstar. The Board also discussed with the Advisor details regarding the Advisor’s hiring plan to expand the number of its investment professionals.
The Board determined the Advisor was an asset management firm with appropriate knowledge and experience to manage the Funds. In addition, the Board noted that it appeared the Advisor’s resources, organization and history would allow it to provide consistent services to the Funds.
Fund Performance
The Board receives performance data at least quarterly and discusses with the Advisor portfolio manager effectiveness in terms of Fund performance. At the July and August, 2016 meetings, the Board considered the Funds’ 1-, 3- and 5-year net returns as of May 31, 2016 as compared to net return information provided by Morningstar for each Fund’s peer group and category identified by Morningstar. The Board also considered information prepared by Morningstar covering other time periods and reviewed each Fund’s most recent quarterly performance.
The Board discussed with the Advisor the portfolio management of each of the Funds, including the relatively poorer performing Funds in relation to their Morningstar peers and the specific reasons for any underperformance. Management advised the Board that, in its opinion, as reflected in Morningstar materials provided to the Board, the International Equity, Multi-Asset Income, Small Company and Sustainable Core Funds have generated strong peer group rankings over the past year, and in the case of the International Equity Fund and Small Company Fund, strong relative performance for the prior 1-, 3- and 5- year time frames.
103
Board Approval of Investment Advisory Agreements
With respect to the relatively poorer performing Funds, including the Government Securities Fund, the Low Duration Bond Fund and the Total Return Bond Fund, management provided supplemental information relating to the Funds’ investment strategies or other factors (such as relative size) that had impacted relative performance and the steps the Advisor had taken or proposes to take to improve the performance.
After reviewing the supplemental information, steps to be undertaken by the Advisor, and related factors, the Directors concluded, within the context of their overall conclusions regarding each of the advisory agreements, that the performance and related information for each of the Funds and the Advisor supported the approval of the Advisory Agreements.
Advisory Fees and Expenses
The Board reviewed each Fund’s total expense ratio for the fiscal year ended November 30, 2015 (including advisory fees) compared to those of the other funds in its Morningstar peer group. The Board noted instances where expense ratios for individual Funds were higher than the median expense ratio in the peer group information provided by Morningstar. The Independent Directors requested and received information from the Advisor regarding the reasons for any increase or material decrease in any of the Funds’ operating expense ratios (net of any reimbursements) as compared to the ratio for the prior year. The Advisor noted that four funds, the Government Securities Fund, the Low Duration Bond Fund, the Sustainable Core Opportunities Fund and the Total Return Bond Fund were in the 4th or 5th quintile for total expenses (net of any reimbursements). For the Low Duration Bond Fund, it was noted that the expense ratio difference of the fund compared to peer funds was primarily due to the average net asset size of the fund. The Advisor noted steps taken to manage Fund expenses. The Independent Directors also noted that the Advisor had entered into various agreements to limit its advisory fee or cap expenses to certain Funds or specified shares classes. After reviewing this and related information, including information regarding advisory fees the Advisor charges to other clients, the Directors concluded, within the context of their overall conclusions regarding each of the advisory agreements, that the fees and expenses of the Funds supported the approval of the Advisory Agreements.
Profitability
The Board reviewed information prepared by the Advisor regarding the profits of the Advisor attributable to its advisory relationship with each Fund, as well as the overall profitability to the Advisor and its affiliates of their relationships with the Funds. The Independent Directors also reviewed with the Advisor the methodology it used to allocate expenses for purposes of such profitability analysis and noted that no one allocation methodology is widely accepted across the business. The Board reviewed the 2015 pre- and post-tax, and pre- and post-distribution profitability of the Advisor and its affiliates in providing services to the Funds as compared to information prepared by SNL Financial regarding the pre-tax profitability of several publicly held investment management companies. After reviewing these and related factors, the Directors concluded, within the context of their overall conclusions regarding each of the advisory agreements, that the cost allocation methodologies were reasonable and that the profitability of the Advisor was not inconsistent with industry data.
Economies of Scale
The Board considered whether there had been economies of scale with respect to the management of the Funds, how economies might be generated, and whether the Funds had appropriately benefitted from any available economies of scale. The Board noted that all of the Funds were currently subject to an advisory fee breakpoint schedule. It also considered the current level of assets of each Fund.
After reviewing these and related factors, the Board concluded, within the context of its overall conclusions regarding each of the Advisory Agreements, that the Funds appropriately participate in economies of scale.
Conclusion
After several meetings of the Board, including deliberations by the Independent Directors without the presence of employees of the Advisor or its affiliates, the Board, including all of the Independent Directors, approved the continuance of the Advisory Agreements. In arriving at its decision, the Board did not identify any single factor or group of factors as all-important or controlling, but considered all factors together and different Directors may have attributed different weights to the various factors considered.
104
Directors (Unaudited)
There are eight Directors of Sentinel Group Funds, Inc. Their names and other information about the six independent Directors currently responsible for the oversight of the ten Funds currently comprising Sentinel Group Funds, Inc. are set forth below. Information concerning the two affiliated Directors is set forth under “Officers” on the next page. The Statement of Additional Information has additional information about the Fund’s Directors and is available, without charge, upon request by calling (800) 282-3863.
| | Position and Length | | |
| Name, Address, Age | of Time Served | Principal Occupation(s) During Past Five Years | Public Directorships |
Gary Dunton (61)
National Life Drive Montpelier, VT 05604 | Director, since 2013 | Dunton Consulting (an insurance industry consulting firm) – Principal, since 2008; MBIA, Inc. – Chairperson, President and Chief Executive Officer, from 2004 to 2008; Sentinel Variable Products Trust (“SVPT”) – Trustee, since May 2016 | None |
Deborah G. Miller (67)
National Life Drive Montpelier, VT 05604 | Director, since 1995; Governance, Contracts and Nominating Committee Chairperson, from 2009 to 2011 | Enterprise Catalyst Group (a management consulting firm) – Chief Executive Officer, since 2003; Ascendent Systems (a voice and messaging systems company) – Chief Executive Officer, from 2005 to 2007; SVPT – Trustee, since May 2016 | Libby Glass – Director, since 2003; Wittenberg University – Director, since 1998 |
John Pelletier (53)
National Life Drive Montpelier, VT 05604 | Director, since 2013 | Center for Financial Literacy at Champlain College – Director, since 2010; Sterling Valley Consulting LLC (a financial services consulting firm) – Principal, since 2009; Vermont Financial Literacy Commission – Co-Chairperson, since November 2015; Vermont’s Universal Children’s Higher Education Savings Account Program Advisory Committee – Chairperson, since November 2015; Eaton Vance Corporation – Chief Legal Officer, from 2007 to 2008; Natixis Global Associates – Chief Operating Officer, from 2004 to 2007; General Counsel, from 1997 to 2004; SVPT – Trustee, since May 2016 | None |
John Raisian, Ph.D. (67)
National Life Drive Montpelier, VT 05604 | Director, since 1996; Lead Independent Director, since 2013 | Hoover Institution at Stanford University – Senior Fellow, since 1986; Director, from 1989 to 2015; SVPT – Trustee, since May 2015; Lead Independent Trustee, since June 2016 | None |
Richard H. Showalter (69)
National Life Drive Montpelier, VT 05604 | Director, since 2003; Audit, Compliance and Valuation Committee Chairperson, since 2012; Lead Independent Director, from 2005 to 2012 | Dartmouth-Hitchcock – Senior Vice President and Treasurer, from 2007 to 2010; Dartmouth-Hitchcock Medical Center – Treasurer, from 1995 to 2010; Dartmouth-Hitchcock Alliance – Senior Vice President and Chief Financial Officer, from 1985 to 2008; Mary Hitchcock Memorial Hospital - Senior Vice President and Chief Financial Officer, from 1985 to 2007; Dartmouth-Hitchcock Clinic - Senior Vice President and Chief Financial Officer, from 1999 to 2007; SVPT – Trustee, since May 2016; Audit, Compliance and Valuation Committee Chairperson, since June 2016 | None |
Angela E. Vallot (60)
National Life Drive Montpelier, VT 05604 | Director, since 1996; Governance, Contracts and Nominating Committee Chairperson, since 2013 and from 2004 to 2009 | VallotKarp Consulting (a diversity and inclusion consulting firm) – President, since 2004; Colgate-Palmolive Company (a consumer products company) – Vice President, from 2001 to 2003; Texaco, Inc. (an integrated energy company) – Director of Diversity, from 1997 to 2001; SVPT – Trustee, since May 2016; Governance, Contracts and Nominating Committee Chairperson, since June 2016 | None |
105
Officers (Unaudited)
The names of and other information relating to the Directors who are officers and “interested persons” of the Funds as defined in the 1940 Act, as amended, and to the other officers of the Funds is set forth below.
| | Position and Length | | |
| Name, Address, Age | of Time Served* | Principal Occupation(s) During Past Five Years | Public Directorships |
| Mehran Assadi (58)** National Life Drive Montpelier, VT 05604 | Director and Chairperson, since 2015 | National Life Holding Company (a mutual insurance company) and National Life Insurance Company (“National Life”) – President and Chief Executive Officer, since 2009; President – Life and Annuity, from 2005 to 2009; Interim Chief Information Officer, from 2003 to 2005; NLV Financial Corporation - President and Chief Executive Officer, since 2009; Executive Vice President, from 2008 to 2009; SVPT – Trustee and Chairperson, since 2009 | None |
| Thomas H. Brownell (56)** National Life Drive Montpelier, VT 05604 | Director, since 2015; President and Chief Executive Officer, since 2013 | National Life – Executive Vice President, since 2013; Executive Vice President and Chief Investment Officer, from 2013 to May 2016; Senior Vice President and Chief Investment Officer, from 2005 to 2013; Sentinel Asset Management, Inc. (“Advisor”) – President and Chief Executive Officer, since 2013; SVPT – Trustee, since May 2016; President, since 2013 | None |
| Gregory D. Teese (49) National Life Drive Montpelier, VT 05604 | Chief Compliance Officer, since March 2016 | Advisor; National Variable Annuity Account II; National Variable Life Insurance Account – Chief Compliance Officer, since March 2016; SVPT – Chief Compliance Officer, since March 2016; Sentinel Financial Services Company(“SFSC”) – Chief Compliance Officer, since 2004; Vice President, since 1997; Equity Services, Inc. – Chief Compliance Officer, since 2004; Senior Vice President, since June 2009 | N/A |
Lisa F. Muller (49)
National Life Drive Montpelier, VT 05604 | Secretary, since 2008 | SASI – President, Chief Executive Officer and Senior Counsel, since 2015; Advisor – Senior Counsel and Chief Operating Officer, since 2015; SFSC – Senior Counsel, since 2011; Counsel, from 2008 to 2011; National Life; Advisor; SASI – Senior Counsel, from 2011 to 2015; Counsel, from 2008 to 2011; SVPT – Secretary, since 2008; State of Vermont, Department of Banking and Insurance – Assistant General Counsel, from 2006 to 2008; Davis, Polk and Wardwell – Associate, from 2005 to 2006 and from 1999 to 2002; U.S. District Court N.D. Illinois – Law Clerk, from 2002 to 2004 | N/A |
John K. Landy (57)
National Life Drive Montpelier, VT 05604 | Vice President, since 2002 | SASI – Senior Vice President, since 2006; SVPT – Vice President, since 2004; SASC – Senior Vice President, from 2004 to 2006; Vice President, from 1997 to 2004 | N/A |
| Philip G. Partridge, Jr. (40) National Life Drive Montpelier, VT 05604 | Chief Financial Officer, since 2014 | Advisor – Vice President, since 2015; Chief Financial Officer, since 2014; SFSC – Vice President and Chief Financial Officer, since 2015; Vice President and Assistant Treasurer, from 2006 to 2015; Sentinel Administrative Services, Inc. (“SASI”) – Vice President and Chief Financial Officer, since 2015; SVPT – Vice President and Treasurer, since June 2016 | N/A |
| Thomas P. Malone (60) National Life Drive Montpelier, VT 05604 | Vice President and Treasurer, since 1997 | SASI– Vice President, since 2006; SVPT – Assistant Vice President and Assistant Treasurer, since June 2016; Vice President and Treasurer, from 2000 to June 2016; SASC – Vice President, from 1998 to 2006 | N/A |
| Scott G. Wheeler (51) National Life Drive Montpelier, VT 05604 | Assistant Vice President and Assistant Treasurer, since 1998 | SASI – Vice President, since 2007; Assistant Vice President, from 2006 to 2007; SVPT – Assistant Vice President and Assistant Treasurer, from 2004 to June 2016; SASC – Assistant Vice President, from 1998 to 2006 | N/A |
| Lindsay E. Staples (35) National Life Drive Montpelier, VT 05604 | Assistant Secretary, since 2010 and from 2007 to 2009 | National Life – Senior Securities Paralegal, since 2010; SVPT – Assistant Secretary, since 2010 and from 2007 to 2009; National Life – Senior Compliance Associate, from 2009 to 2010; National Life – Securities Paralegal, from 2007 to 2009; Holman Immigration – Paralegal, from 2006 to 2007; Wilmer Cutler Pickering Hale and Dorr – Paralegal, from 2004 to 2006 | N/A |
| | |
| * | | Each Officer is elected by, and serves at the pleasure of, the Board of the Funds. |
| ** | | Mr. Assadi is an “interested person” of the Funds because he is the President and Chief Executive Officer of the Advisor’s parent company and Mr. Brownell is an “interested person” of the Funds because he is the President and Chief Executive Officer of the Advisor. |
106
Investment Advisor
Sentinel Asset Management, Inc.
Principal Underwriter
Sentinel Financial Services Company
Counsel
Sidley Austin LLP
Custodian and Dividend Paying Agent
State Street Bank & Trust Company -
Kansas City
Transfer Agent and Shareholder Servicing Agent
Boston Financial Data Services, Inc.
Administrator
Sentinel Administrative Services, Inc.
107

One National Life Drive, Montpelier, VT 05604
NOT FDIC INSURED • MAY LOSE VALUE • NO BANK GUARANTEE
This annual report is authorized for distribution to prospective investors only when preceded by an effective Prospectus.
Before investing, carefully consider a fund’s objectives, risks, charges and expenses. Summary and full prospectuses containing this and other information are available from sentinelinvestments.com. Please read them carefully.
Sentinel Investments is the unifying brand name for Sentinel Financial Services Company, Sentinel Asset Management, Inc., and Sentinel Administrative Services, Inc. Sentinel Funds are distributed by Sentinel Financial Services Company, One National Life Drive, Montpelier, VT 05604, 800-282-FUND, www.sentinelinvestments.com. National Life Group® is a trade name of National Life Insurance Company, founded in Montpelier, VT in 1848 and its affiliates.
43602 SF0104(0117)
April 10, 2017
TOUCHSTONE FUNDS GROUP TRUST
Touchstone Active Bond Fund
Touchstone Arbitrage Fund
Touchstone Emerging Markets Small Cap Fund
Touchstone High Yield Fund
Touchstone Merger Arbitrage Fund
Touchstone Mid Cap Fund
Touchstone Mid Cap Value Fund
Touchstone Premium Yield Equity Fund
Touchstone Sands Capital Select Growth Fund
Touchstone Small Cap Fund
Touchstone Small Cap Value Fund
Touchstone Total Return Bond Fund
Touchstone Ultra Short Duration Fixed Income Fund
Supplement to Prospectus, Summary Prospectus and Statement of Additional
Information dated January 30, 2017
The information in this Supplement contains new and additional information beyond that in the Prospectus and Summary Prospectus and should be read in conjunction with the aforementioned.
Effective immediately, the following replaces the last sentence in the paragraph of each Fund’s summary under “The Fund’s Fee and Expenses” section:
More information about these and other discounts is available from your financial professional and in the section entitled “Choosing a Class of Shares” in the Fund’s prospectus on page 89, in Appendix A – Intermediary-Specific Sales Charge Waivers and Discounts to the Fund’s prospectus and in the Fund’s Statement of Additional Information (“SAI”) on page 80.
Effective immediately, the following statement will be added to the “Waiver of Class A Sales Charge,” “Reduced Class A Sales Charge,” “Rights of Accumulation Program,” “Letter of Intent,” “Class C Shares,” “Contingent Deferred Sales Charge (“CDSC”), “Additional Information on the CDSC” and “Waiver of Class A Sales Charge for Clients of Financial Intermediaries” disclosure in the Prospectus, Summary Prospectus and Statement of Additional Information (as applicable):
Please see Appendix A – Intermediary-Specific Sales Charge Waivers and Discounts for a description of variations in sales charges and waivers for Fund shares purchased through Merrill Lynch.
Effective immediately, the following is added to the back page of the Prospectus:
Appendix A: Appendix A – Intermediary-Specific Sales Charge Waivers and Discounts is a separate document that provides additional information about the availability of certain sales charge waivers and discounts and is incorporated into this prospectus, which means it is legally a part of this prospectus.
Effective immediately, the following is added as Appendix A of the Prospectus:
Appendix A to Prospectus dated January 30, 2017
Intermediary-Specific Sales Charge Waivers and Discounts
As noted in the Fund’s prospectus, the availability of certain sales charge waivers and discounts will depend on whether you purchase your shares directly from the Fund or through a financial intermediary. Intermediaries may have different policies and procedures regarding the availability of front-end sales load waivers or contingent deferred (back-end) sales load (“CDSC”) waivers, which are discussed below. In all instances, it is the purchaser’s responsibility to notify the Fund or the purchaser’s financial intermediary at the time of purchase of any relationship or other facts qualifying the purchaser for sales charge waivers or discounts. The sales charge waivers and discounts described in this Appendix A are available only if you purchase shares through the designated intermediary. The information disclosed in this Appendix A is part of, and incorporated in, the Fund’s prospectus.
* * * * *
Shareholders Purchasing Fund Shares Through Merrill Lynch
The following information is provided by Merrill, Lynch, Pierce, Fenner & Smith Incorporated (“Merrill Lynch: Effective April 10, 2017, shareholders purchasing Fund shares through a Merrill Lynch platform or account will be eligible only for the following load waivers (front-end sales charge waivers and contingent deferred, or back-end, sales charge waivers) and discounts, which may differ from those disclosed elsewhere in the Funds’ prospectus or SAI.
Front-end Sales Load Waivers on Class A Shares Available at Merrill Lynch
| | • | Employer-sponsored retirement, deferred compensation and employee benefit plans (including health savings accounts) and trusts used to fund those plans, provided that the shares are not held in a commission-based brokerage account and shares are held for the benefit of the plan |
| | • | Shares purchased by or through a 529 Plan |
| | • | Shares purchased through a Merrill Lynch affiliated investment advisory program |
| | • | Shares purchased through the Merrill Edge Self-Directed platform |
| | • | Shares purchased through reinvestment of capital gains distributions and dividend reinvestment when purchasing shares of the same fund (but not any other fund within the fund family) |
| | • | Shares exchanged from Class C (i.e. level-load) shares of the same fund in the month of or following the 10-year anniversary of the purchase date |
| | • | Employees and registered representatives of Merrill Lynch or its affiliates and their family members |
| | • | Trustees of the Fund, and employees of Touchstone Advisors or any of its affiliates, as described in this Prospectus |
| | • | Shares purchased from the proceeds of redemptions within the Touchstone family of mutual funds, provided (1) the repurchase occurs within 90 days following the redemption, (2) the redemption and purchase occur in the same account, and (3) redeemed shares were subject to a front-end or deferred sales load (known as rights of reinstatement) |
CDSC Waivers on Class A Shares and Class C Shares Available at Merrill Lynch
| | • | Death or disability of the shareholder |
| | • | Shares sold as part of a systematic withdrawal plan as described in this Prospectus |
| | • | Return of excess contributions from an IRA Account |
| | • | Shares sold as part of a required minimum distribution for IRA and retirement accounts due to the shareholder reaching age 70½ |
| | • | Shares sold to pay Merrill Lynch fees but only if the transaction is initialed by Merrill Lynch |
| | • | Shares acquired through a right of reinstatement |
| | • | Shares held in retirement brokerage accounts, that are exchanged for a lower cost share class due to transfer to certain fee based accounts or platforms (applicable to Class A shares and Class C shares only) |
Front-end Load Discounts Available at Merrill Lynch: Breakpoints, Rights of Accumulation, and Letters of Intent
| | • | Breakpoints as described in this Prospectus |
| | • | Rights of Accumulation (ROA), which entitle shareholders to breakpoint discounts will be automatically calculated based on the aggregated holding of fund family assets held by accounts within the purchaser’s household at Merrill Lynch. Eligible fund family assets not held at Merrill Lynch may be included in the ROA calculation only if the shareholder notifies his or her financial advisor about such assets |
| | • | Letters of Intent (LOI) which allow for breakpoint discounts based on anticipated purchases within a fund family, through Merrill Lynch, over a 13-month period of time (if applicable) |
Please contact your financial advisor or Touchstone at 800.543.0407 if you have any questions.
P.O. Box 9878 · Providence, RI 02940-8078
Ph: 800.543.0407 · TouchstoneInvestments.com
Touchstone Funds are distributed by Touchstone Securities, Inc.*
*A registered broker-dealer and member FINRA and SIPC
A Member of Western & Southern Financial Group
Please retain this Supplement for future reference.
TSF-56-TFGT-S1-1704
April 4, 2017
TOUCHSTONE FUNDS GROUP TRUST
Touchstone Sands Capital Select Growth Fund
Supplement to Prospectus, Summary Prospectus and Statement of Additional
Information dated January 30, 2017
Effective immediately, all classes of the Touchstone Sands Capital Select Growth Fund (the “Fund”) are open to investments by new and existing investors, subject to minimum investment and other requirements as described in the Fund’s Prospectus, Summary Prospectus, and Statement of Additional Information. Touchstone reserves the right to close the Fund to new or subsequent investments at a future date and to modify the foregoing policy for any reason.
Please contact your financial advisor or Touchstone at 800.543.0407 if you have any questions.
P.O. Box 9878 · Providence, RI 02940-8078
Ph: 800.543.0407 · TouchstoneInvestments.com
Touchstone Funds are distributed by Touchstone Securities, Inc.*
*A registered broker-dealer and member FINRA and SIPC
A Member of Western & Southern Financial Group
Please retain this Supplement for future reference.
TSF-56-TFGT-PTSGX-S1-1704
January 30, 2017
Prospectus
Touchstone Funds Group Trust
| | | Class A | | Class C | | Class Y | | Class Z | | Institutional Class |
| Touchstone Active Bond Fund | | TOBAX | | TODCX | | TOBYX | | | | TOBIX |
| Touchstone Arbitrage Fund | | TMARX | | TMACX | | TMAYX | | | | TARBX |
| Touchstone Emerging Markets Small Cap Fund | | TEMAX | | TEFCX | | TEMYX | | | | TMEIX |
| Touchstone High Yield Fund | | THYAX | | THYCX | | THYYX | | | | THIYX |
| Touchstone Merger Arbitrage Fund | | TMGAX | | TMGCX | | TMGYX | | | | TMGLX |
| Touchstone Mid Cap Fund | | TMAPX | | TMCJX | | TMCPX | | TMCTX | | TMPIX |
| Touchstone Mid Cap Value Fund | | TCVAX | | TMFCX | | TCVYX | | | | TCVIX |
| Touchstone Premium Yield Equity Fund | | TPYAX | | TPYCX | | TPYYX | | | | |
| Touchstone Sands Capital Select Growth Fund | | TSNAX | | TSNCX | | CFSIX | | PTSGX | | |
| Touchstone Small Cap Fund | | TSFAX | | TSFCX | | TSFYX | | | | TSFIX |
| Touchstone Small Cap Value Fund | | TVOAX | | TVOCX | | TVOYX | | | | TVOIX |
| Touchstone Total Return Bond Fund | | TCPAX | | TCPCX | | TCPYX | | | | TCPNX |
| Touchstone Ultra Short Duration Fixed Income Fund | | TSDAX | | TSDCX | | TSYYX | | TSDOX | | TSDIX |
The Securities and Exchange Commission has not approved or disapproved these securities or determined if this prospectus is accurate or complete. Any representation to the contrary is a criminal offense.
Table of Contents
TOUCHSTONE ACTIVE BOND FUND SUMMARY
The Fund’s Investment Goal
The Touchstone Active Bond Fund (the “Fund”) seeks to provide as high a level of current income as is consistent with the preservation of capital. Capital appreciation is a secondary goal.
The Fund’s Fees and Expenses
This table describes the fees and expenses that you may pay if you buy and hold shares of the Fund. You may qualify for sales charge discounts for Class A shares if you and your family invest, or agree to invest in the future, at least $50,000 or more in the Touchstone Funds. More information about these and other discounts is available from your financial professional and in the section entitled “Choosing a Class of Shares” in the Fund’s prospectus on page 89 and in the Fund’s Statement of Additional Information (“SAI”) on page 80.
| | | Class A | | Class C | | Class Y | | Institutional
Class |
| Shareholder Fees (fees paid directly from your investment) | | | | | | | | | | | | | | | | |
| Maximum Sales Charge (Load) Imposed on Purchases (as a percentage of offering price) | | | 4.75 | % | | | None | | | | None | | | | None | |
| Maximum Deferred Sales Charge (Load) (as a percentage of original purchase price or the amount redeemed, whichever is less) | | | None | | | | 1.00 | % | | | None | | | | None | |
| Wire Redemption Fee | | Up to $15 | | | | Up to $15 | | | | Up to $15 | | | | Up to $15 | |
| Annual Fund Operating Expenses (expenses that you pay each year as a percentage of the value of your investment) | | | | | | | | | | | | | | | | |
| Management Fees | | | 0.40 | % | | | 0.40 | % | | | 0.40 | % | | | 0.40 | % |
| Distribution and/or Shareholder Service (12b-1) Fees | | | 0.25 | % | | | 1.00 | % | | | None | | | | None | |
| Other Expenses | | | 0.54 | % | | | 0.69 | % | | | 0.50 | % | | | 0.60 | % |
| Acquired Fund Fees and Expenses (AFFE) | | | 0.01 | % | | | 0.01 | % | | | 0.01 | % | | | 0.01 | % |
| Total Annual Fund Operating Expenses(1) | | | 1.20 | % | | | 2.10 | % | | | 0.91 | % | | | 1.01 | % |
| Fee Waiver and/or Expense Reimbursement(2) | | | (0.29 | )% | | | (0.44 | )% | | | (0.25 | )% | | | (0.43 | )% |
| Total Annual Fund Operating Expenses After Fee Waiver and/or Expense Reimbursement(2) | | | 0.91 | % | | | 1.66 | % | | | 0.66 | % | | | 0.58 | % |
(1)Total Annual Fund Operating Expenses have been restated to reflect Acquired Fund Fees and Expenses and will differ from the ratio of expenses to average net assets that is included in the Fund’s annual report for the fiscal year ended September 30, 2016.
(2)Touchstone Advisors, Inc. (the “Advisor” or “Touchstone Advisors”) and the Trust have entered into a contractual expense limitation agreement whereby Touchstone Advisors will waive a portion of its fees or reimburse certain Fund expenses (excluding dividend and interest expenses relating to short sales; interest; taxes; brokerage commissions and other transaction costs; portfolio transactions and investment related expenses; other expenditures which are capitalized in accordance with U.S. generally accepted accounting principles; the cost of “Acquired Fund Fees and Expenses,” if any; and other extraordinary expenses not incurred in the ordinary course of business) in order to limit annual Fund operating expenses to 0.90%, 1.65%, 0.65%, and 0.57% of average daily net assets for Classes A, C, Y and Institutional Class shares, respectively. This contractual expense limitation is effective through January 29, 2018, but can be terminated by a vote of the Board of Trustees of the Trust (the “Board”) if it deems the termination to be beneficial to the Fund’s shareholders. The terms of the contractual expense limitation agreement provide that Touchstone Advisors is entitled to recoup, subject to approval by the Board, such amounts waived or reimbursed for a period of up to three years from the year in which Touchstone Advisors reduced its compensation or assumed expenses for the Fund. No recoupment will occur unless the Fund’s expenses are below the lesser of the expense limitation amount in effect (a) at the time of the waiver, or (b) at the time of the reimbursement.
Example. This example is intended to help you compare the cost of investing in the Fund with the cost of investing in other mutual funds. The example assumes that you invest $10,000 in the Fund for the time periods indicated and then, except as indicated, redeem all of your shares at the end of those periods. The example also assumes that your investment has a 5% return each year,
that the Fund’s operating expenses remain the same and that all fee waivers or expense limits for the Fund will expire after one year. Although your actual costs may be higher or lower, based on these assumptions your costs would be:
| | | Assuming Redemption at End of Period | | Assuming No Redemption | |
| | | Class A | | Class C | | Class Y | | Institutional Class | | Class C | |
| 1 Year | | $ | 563 | | $ | 269 | | $ | 67 | | $ | 59 | | $ | 169 | |
| 3 Years | | $ | 811 | | $ | 615 | | $ | 265 | | $ | 279 | | $ | 615 | |
| 5 Years | | $ | 1,077 | | $ | 1,088 | | $ | 479 | | $ | 516 | | $ | 1,088 | |
| 10 Years | | $ | 1,836 | | $ | 2,396 | | $ | 1,097 | | $ | 1,197 | | $ | 2,396 | |
Portfolio Turnover. The Fund pays transaction costs, such as brokerage commissions, when it buys and sells securities (or “turns over” its portfolio). A higher portfolio turnover rate may indicate higher transaction costs and may result in higher taxes when Fund shares are held in a taxable account. These costs, which are not reflected in annual fund operating expenses or in the example, affect the Fund’s performance. During the most recent fiscal year, the Predecessor Fund’s portfolio turnover rate was 590% of the average value of its portfolio.
The Fund’s Principal Investment Strategies
Under normal circumstances, the Fund invests at least 80% of its assets in bonds. This is a non-fundamental investment policy that the Fund can change upon 60 days’ prior notice to shareholders. Bonds include mortgage-related securities, asset-backed securities, government securities (both U.S. government securities and foreign sovereign debt), and corporate debt securities. The Fund may engage in frequent and active trading as part of its principal investment strategies.
In deciding what securities to buy and sell for the Fund, the Fund’s sub-advisor, Fort Washington Investment Advisors, Inc. (“Fort Washington” or the “Sub-Advisor”), analyzes the overall investment opportunities and risks in different sectors of the debt securities markets by focusing on maximizing total return while reducing volatility of the Fund’s portfolio. Fort Washington follows a disciplined sector allocation process in order to build a diversified portfolio of investments.
In building the Fund’s portfolio, the Sub-Advisor primarily invests in investment-grade debt securities, but may invest up to 30% of the Fund’s total assets in non-investment-grade debt securities rated as low as B by a Nationally Recognized Statistical Rating Organization (“NRSRO”). Non-investment-grade debt securities are often referred to as “junk bonds” and are considered speculative. The Fund may also invest up to 20% of its total assets in foreign-issued debt securities denominated in either the U.S. dollar or a foreign currency. Foreign-issued debt securities may include debt securities of emerging market countries.
Additionally, in order to implement its investment strategy, the Fund may invest in mortgage dollar-roll transactions and reverse repurchase agreements, and in derivatives, including forwards, futures contracts, interest rate and credit default swap agreements, and options. These investments may be used to gain or hedge market exposure, to adjust the Fund’s duration, to manage interest rate risk, and for any other purposes consistent with the Fund’s investment strategies and limitations.
The Fund’s Principal Risks
The Fund’s share price will fluctuate. You could lose money on your investment in the Fund and the Fund could also return less than other investments. Investments in the Fund are not bank guaranteed, are not deposits, and are not insured by the FDIC or any other federal government agency.
As with any mutual fund, there is no guarantee that the Fund will achieve its investment goal. You can find more information about the Fund’s investments and risks under the “Principal Investment Strategies and Risks” section of the Fund’s prospectus. The Fund is subject to the principal risks summarized below.
Derivatives Risk: The use of derivatives may expose the Fund to additional risks that it would not be subject to if it invested directly in the securities underlying those derivatives. Risks associated with derivatives may include the risk that the derivative does not correlate well with the security, index, or currency to which it relates, the risk that the Fund will be unable to sell or close out the derivative due to an illiquid market, the risk that the counterparty may be unwilling or unable to meet its obligations, and the risk that the derivative could expose the Fund to the risk of magnified losses resulting from leverage. These additional risks could cause the Fund to experience losses to which it would otherwise not be subject.
| | • | Forward Currency Exchange Contract Risk: Forward foreign currency exchange contracts may reduce the risk of loss from a change in value of a currency, but they also limit any potential gains and do not protect against fluctuations in the value of the underlying position. |
| | | |
| | • | Futures Contracts Risk: The risks associated with the Fund’s futures positions include liquidity and counterparty risks associated with derivative instruments. |
| | | |
| | • | Options Risk: The value of options can be highly volatile. The successful use of options for hedging purposes can depend in part on the ability of the advisor or sub-advisor to predict future price fluctuations and the degree of correlation between the options and securities markets. When options are purchased over-the-counter, the Fund becomes exposed to counterparty risk. Options, whether exchange traded or over-the-counter, may also be illiquid. |
| | | |
| | • | Swap Agreements Risk: Swap agreements (“swaps”) are individually negotiated and structured to include exposure to a variety of different types of investments or market factors. Swaps may increase or decrease the overall volatility of the investments of the Fund and its share price. The performance of swaps may be affected by a change in the specific interest rate, currency, or other factors that determine the amounts of payments due to and from the Fund. A swap can be a form of leverage, which can magnify the Fund’s gains or losses. |
Fixed-Income Risk: The market values of the Fund’s fixed-income securities respond to economic developments, particularly interest rate changes, as well as to perceptions about the creditworthiness of individual issuers, including governments. Generally, the Fund’s fixed-income securities will decrease in value if interest rates rise and increase in value if interest rates fall. Normally, the longer the maturity or duration of the fixed-income securities the Fund owns, the more sensitive the value of the Fund’s shares will be to changes in interest rates.
| | • | Asset-Backed Securities Risk: Asset-backed securities are fixed-income securities backed by other assets such as credit card, automobile or consumer loan receivables, retail installment loans, or participations in pools of leases. The values of these securities are sensitive to changes in the credit quality of the underlying collateral, the credit strength of any credit enhancement feature, changes in interest rates, and, at times, the financial condition of the issuer. |
| | | |
| | • | Credit Risk: The fixed-income securities in the Fund’s portfolio are subject to the possibility that a deterioration, whether sudden or gradual, in the financial condition of an issuer, or a deterioration in general economic conditions, could cause an issuer to fail to make timely payments of principal or interest, when due. This may cause the issuer’s securities to decline in value. |
| | | |
| | • | Interest Rate Risk: In general, when interest rates rise, the prices of debt securities fall, and when interest rates fall, the prices of debt securities rise. The price volatility of a debt security also depends on its maturity. Longer-term securities are generally more volatile, so the longer the average maturity or duration of these securities, the greater their price risk. |
| | | |
| | • | Investment-Grade Debt Securities Risk: Investment-grade debt securities may be downgraded by a NRSRO to below-investment-grade status, which would increase the risk of holding these securities. Investment-grade debt securities rated in the lowest rating category by a NRSRO involve a higher degree of risk than fixed-income securities with higher credit ratings. |
| | | |
| | • | Mortgage-Backed Securities Risk: Mortgage-backed securities are fixed-income securities representing an interest in a pool of underlying mortgage loans. Mortgage-backed securities are sensitive to changes in interest rates, but may respond to these changes differently from other fixed-income securities due to the possibility of prepayment of the underlying mortgage loans. Mortgage-backed securities may fluctuate in price based on deterioration in the perceived or actual value of the collateral underlying the pool of mortgage loans, which may result in the collateral being worth less than the remaining principal amount owed on the mortgages in the pool. |
| | | |
| | • | Non-Investment-Grade Debt Securities Risk: Non-investment-grade debt securities are sometimes referred to as “junk bonds” and are considered speculative with respect to their issuers’ ability to make payments of interest and principal. There is a high risk that the Fund could suffer a loss from investments in non-investment-grade debt securities caused by the default of an issuer of such securities. Non-investment-grade debt securities may also be less liquid than investment-grade debt securities. |
Foreign Securities Risk: Investing in foreign securities poses additional risks since political and economic events unique in a country or region will affect those markets and their issuers, while such events may not necessarily affect the U.S. economy or issuers located in the United States. In addition, investments in foreign securities are generally denominated in foreign currency.
As a result, changes in the value of those currencies compared to the U.S. dollar may affect the value of the Fund’s investments. Foreign markets may be less liquid and more volatile than U.S. markets and offer less protection to investors.
| | • | Emerging Markets Risk: Emerging markets may be more likely to experience political turmoil or rapid changes in market or economic conditions than more developed countries. In addition, the financial stability of issuers (including governments) in emerging market countries may be more precarious than that of issuers in other countries. |
| | | |
| | • | Sovereign Debt Risk: The actions of foreign governments concerning their respective economies could have an important effect on their ability or willingness to service their sovereign debt. Such actions could have significant effects on market conditions and on the prices of securities and instruments held by the Fund, including the securities and instruments of foreign private issuers. |
Leverage Risk: Leverage occurs when the Fund uses borrowings, derivatives (such as futures or options), or similar instruments or techniques to gain exposure to investments in an amount that exceeds the Fund’s initial investment. The use of leverage magnifies changes in the Fund’s net asset value and thus may result in increased portfolio volatility and increased risk of loss. Leverage can create an interest expense that may lower the Fund’s overall returns. There can be no guarantee that a leveraging strategy will be successful.
Management Risk: In managing the Fund’s portfolio, the Advisor engages one or more sub-advisors to make investment decisions for a portion of or the entire portfolio. There is a risk that the Advisor may be unable to identify and retain sub-advisors who achieve superior investment returns relative to other similar sub-advisors.
Mortgage Dollar Roll Risk: Mortgage “dollar rolls” are transactions in which mortgage-backed securities are sold for delivery in the current month and the seller simultaneously contracts to repurchase substantially similar securities on a specified future date. If the broker-dealer to whom the Fund sells the security becomes insolvent, the Fund’s right to repurchase the security may be restricted. Other risks involved in entering into mortgage dollar rolls include the risk that the value of the security may change adversely over the term of the mortgage dollar roll and that the security the Fund is required to repurchase may be worth less than the security that the Fund held.
Portfolio Turnover Risk: Frequent and active trading may result in greater expenses to the Fund, which may lower the Fund’s performance and may result in the realization of substantial capital gains, including net short-term capital gains. As a result, high portfolio turnover may reduce the Fund’s returns.
U.S. Government Agencies Securities Risk: Certain U.S. government agency securities are backed by the right of the issuer to borrow from the U.S. Treasury while others are supported only by the credit of the issuer or instrumentality. While the U.S. government is able to provide financial support to U.S. government-sponsored agencies or instrumentalities, no assurance can be given that it will always do so.
The Fund’s Performance
The Fund is a new series of Touchstone Funds Group Trust (the “Trust”). On January 27, 2017, the Touchstone Active Bond Fund, previously a series of Touchstone Investment Trust (the “Predecessor Fund”), was reorganized into the Fund. As a result of the reorganization, the performance and accounting history of the Predecessor Fund was assumed by the Fund. Certain financial and performance information included herein is that of the Predecessor Fund.
The bar chart and performance table below illustrate the risks and volatility of investing in the Predecessor Fund by showing changes in the Predecessor Fund’s performance from year to year and by showing how the Predecessor Fund’s average annual total returns for one year, five years, and ten years compared with the Bloomberg Barclays U.S. Aggregate Bond Index. The bar chart does not reflect any sales charges, which would reduce your return. The performance table does reflect any applicable sales charges. Past performance of the Predecessor Fund (before and after taxes) does not necessarily indicate how the Fund will perform in the future. More recent performance is available at no cost by visiting TouchstoneInvestments.com or by calling 1.800.543.0407.
Touchstone Active Bond Fund — Class A Shares Total Returns as of December 31
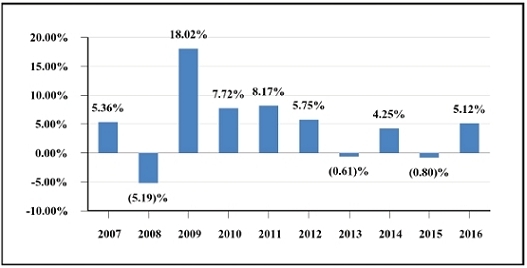
| Best Quarter: Third Quarter 2009 7.14% | | Worst Quarter: Third Quarter 2008 (2.68)% |
After-tax returns are calculated using the historical highest individual federal marginal income tax rates and do not reflect the impact of state and local taxes. Your actual after-tax returns may differ from those shown and depend on your tax situation. The after-tax returns do not apply to shares held in an individual retirement account (“IRA”), 401(k), or other tax-advantaged account. After-tax returns are only shown for Class A shares and after-tax returns for other classes of shares offered by the Fund will differ from the Class A shares after-tax return.
The inception dates of Class A shares, Class C shares, Class Y shares and Institutional Class shares of the Predecessor Fund were October 3, 1994, October 3, 1994, April 12, 2012 and April 12, 2012, respectively. Class Y and Institutional Class shares performance information was calculated using the historical performance of Class A shares for the periods prior to April 12, 2012. Performance for these periods has been restated to reflect the impact of the fees and expenses applicable to Class Y and Institutional Class shares.
Average Annual Total Returns
For the periods ended December 31, 2016
| | 1 Year | | 5 Years | | 10 Years |
| Predecessor Fund - Class A | | | | | | |
| Return Before Taxes | 0.14 | % | | 1.70% | | 4.10% |
| Return After Taxes on Distributions | (1.00 | )% | | 0.36% | | 2.61% |
| Return After Taxes on Distributions and Sale of Fund Shares | 0.08 | % | | 0.72% | | 2.57% |
| Predecessor Fund - Class C | | | | | | |
| Return Before Taxes | 3.32 | % | | 1.94% | | 3.83% |
| Predecessor Fund - Class Y | | | | | | |
| Return Before Taxes | 5.28 | % | | 2.94% | | 4.73% |
| Predecessor Fund - Institutional Class | | | | | | |
| Return Before Taxes | 5.47 | % | | 3.02% | | 4.77% |
| Bloomberg Barclays U.S. Aggregate Bond Index | | | | | | |
| (reflects no deductions for fees, expenses or taxes) | 2.65 | % | | 2.23% | | 4.34% |
The Fund’s Management
Investment Advisor
Touchstone Advisors, Inc.
| Sub-Advisor | | Portfolio
Managers | | Investment Experience
with the Predecessor Fund and
the Fund | | Primary Title with Sub-Advisor |
| Fort Washington Investment Advisors, Inc. | | Timothy J. Policinski, CFA | | Managed the Predecessor Fund from 2001 to 2017; managing the Fund since 2017 | | Managing Director and Senior Portfolio Manager |
| | | Daniel J. Carter, CFA | | Managed the Predecessor Fund from 2001 to 2017; managing the Fund since 2017 | | Assistant Vice President and Portfolio Manager |
Buying and Selling Fund Shares
Minimum Investment Requirements
| | | Classes A, C, and Y | |
| | | Initial Investment | | | Additional Investment | |
| Regular Account | | $ | 2,500 | | | $ | 50 | |
| Retirement Account or Custodial Account under the Uniform Gifts/Transfers to Minors Act | | $ | 1,000 | | | $ | 50 | |
| Investments through the Automatic Investment Plan | | $ | 100 | | | $ | 50 | |
| | | Institutional Class | |
| | | Initial Investment | | | Additional Investment | |
| Regular Account | | $ | 500,000 | | | $ | 50 | |
You may buy and sell shares in the Fund on a day when the New York Stock Exchange is open for trading. Classes A and C shares may be purchased and sold directly through Touchstone Securities, Inc. (“Touchstone Securities”) or through your financial intermediary. Class Y shares are available only through financial intermediaries who have appropriate selling agreements in place with Touchstone Securities. Institutional Class shares are available through Touchstone Securities or your financial intermediary. Shares may be purchased or sold by writing to Touchstone Securities at P.O. Box 9878, Providence, Rhode Island 02940, calling 1.800.543.0407, or visiting the Touchstone Funds’ website: TouchstoneInvestments.com. You may only sell shares over the telephone or via the Internet if the value of the shares sold is less than or equal to $100,000. Shares held in IRAs and qualified retirement plans cannot be sold by telephone or via the Internet. If your shares are held by a processing organization or financial intermediary you will need to follow its purchase and redemption procedures. For more information about buying and selling shares, see the section “Investing with Touchstone” of the Fund’s prospectus or call 1.800.543.0407.
Tax Information
The Fund intends to make distributions that may be taxed as ordinary income or capital gains except when shares are held through a tax-advantaged account, such as a 401(k) plan or an IRA. Withdrawals from a tax-advantaged account, however, may be taxable.
Financial Intermediary Compensation
If you purchase shares in the Fund through a broker-dealer or other financial intermediary (such as a bank), the Fund and its related companies may pay the financial intermediary for the sale of Fund shares and related services. These payments may create a conflict of interest by influencing the broker-dealer or other financial intermediary and your salesperson to recommend the Fund over another investment. Ask your salesperson or visit your financial intermediary’s website for more information.
TOUCHSTONE ARBITRAGE FUND SUMMARY
The Fund’s Investment Goal
The Touchstone Arbitrage Fund (the “Fund”) seeks to achieve positive absolute returns over the long-term regardless of market conditions.
The Fund’s Fees and Expenses
This table describes the fees and expenses that you may pay if you buy and hold shares of the Fund. You may qualify for sales charge discounts for Class A shares if you and your family invest, or agree to invest in the future, at least $50,000 or more in the Touchstone Funds. More information about these and other discounts is available from your financial professional and in the section entitled “Choosing a Class of Shares” in the Fund’s prospectus on page 89 and in the Fund’s Statement of Additional Information (“SAI”) on page 80.
| | | | | | | | | | | Institutional |
| | Class A | | Class C | | Class Y | | Class |
| Shareholder Fees (fees paid directly from your investment) | | | | | | | | | | | |
| Maximum Sales Charge (Load) Imposed on Purchases (as a percentage of offering price) | 5.75 | % | | None | | | None | | | None | |
| Maximum Deferred Sales Charge (Load) (as a percentage of original purchase price or the amount redeemed, whichever is less) | None | | | 1.00 | % | | None | | | None | |
| Wire Redemption Fee | Up to $15 | | | Up to $15 | | | Up to $15 | | | Up to $15 | |
| Annual Fund Operating Expenses (expenses that you pay each year as a percentage of the value of your investment) | | | | | | | | | | | |
| Management Fees | 1.05 | % | | 1.05 | % | | 1.05 | % | | 1.05 | % |
| Distribution and/or Shareholder Service (12b-1) Fees | 0.25 | % | | 1.00 | % | | None | | | None | |
| Other Expenses | | | | | | | | | | | |
| Dividend and Interest Expenses on Securities Sold Short | 1.12 | % | | 1.12 | % | | 1.12 | % | | 1.12 | % |
| Other Operating Expenses | 0.61 | % | | 0.45 | % | | 0.34 | % | | 0.31 | % |
| Total Other Expenses | 1.73 | % | | 1.57 | % | | 1.46 | % | | 1.43 | % |
| Acquired Fund Fees and Expenses (AFFE) | 0.02 | % | | 0.02 | % | | 0.02 | % | | 0.02 | % |
| Total Annual Fund Operating Expenses(1) | 3.05 | % | | 3.64 | % | | 2.53 | % | | 2.50 | % |
| Fee Waiver or Expense Reimbursement(2) | (0.23 | )% | | (0.07 | )% | | 0.00 | % | | (0.08 | )% |
| Total Annual Fund Operating Expenses After Fee Waiver or Expense Reimbursement(2) | 2.82 | % | | 3.57 | % | | 2.53 | % | | 2.42 | % |
(1)Total Annual Fund Operating Expenses have been restated to reflect Acquired Fund Fees and Expenses and will differ from the ratio of expenses to average net assets that is included in the Fund’s annual report for the fiscal year ended September 30, 2016. (2)Touchstone Advisors, Inc. (the “Advisor” or “Touchstone Advisors”) and Touchstone Funds Group Trust (the “Trust”) have entered into a contractual expense limitation agreement whereby Touchstone Advisors will waive a portion of its fees or reimburse certain Fund expenses (excluding dividend and interest expenses relating to short sales; interest; taxes; brokerage commissions and other transaction costs; portfolio transactions and investment related expenses; other expenditures which are capitalized in accordance with U.S. generally accepted accounting principles; the cost of “Acquired Fund Fees and Expenses,” if any; and other extraordinary expenses not incurred in the ordinary course of business) in order to limit annual Fund operating expenses to 1.68%, 2.43%, 1.43%, and 1.28% of average daily net assets for Classes A, C, Y and Institutional Class shares, respectively. This contractual expense limitation is effective through January 29, 2018, but can be terminated by a vote of the Board of Trustees of the Trust (the “Board”) if it deems the termination to be beneficial to the Fund’s shareholders. The terms of the contractual expense limitation agreement provide that Touchstone Advisors is entitled to recoup, subject to approval by the Board, such amounts waived or reimbursed for a period of up to three years from the year in which Touchstone Advisors reduced its compensation or assumed expenses for the Fund. No recoupment will occur unless the Fund’s expenses are below the lesser of the expense limitation amount in effect (a) at the time of the waiver, or (b) at the time of the reimbursement.
Example. This example is intended to help you compare the cost of investing in the Fund with the cost of investing in other mutual funds. The example assumes that you invest $10,000 in the Fund for the time periods indicated and then, except as indicated,
redeem all of your shares at the end of those periods. The example also assumes that your investment has a 5% return each year and that the Fund’s operating expenses remain the same and that all fee waivers or expense limits for the Fund will expire after one year. Although your actual costs may be higher or lower, based on these assumptions your costs would be:
| | | Assuming Redemption at End of Period | | Assuming No Redemption | |
| | | | Class A | | | Class C | | | Class Y | | | Institutional Class | | Class C | |
| 1 Year | | $ | 844 | | $ | 460 | | $ | 256 | | $ | 245 | | $ | 360 | |
| 3 Years | | $ | 1,443 | | $ | 1,108 | | $ | 788 | | $ | 771 | | $ | 1,108 | |
| 5 Years | | $ | 2,065 | | $ | 1,877 | | $ | 1,345 | | $ | 1,323 | | $ | 1,877 | |
| 10 Years | | $ | 3,731 | | $ | 3,893 | | $ | 2,866 | | $ | 2,830 | | $ | 3,893 | |
Portfolio Turnover. The Fund pays transaction costs, such as brokerage commissions, when it buys and sells securities (or “turns over” its portfolio). A higher portfolio turnover rate may indicate higher transaction costs and may result in higher taxes when Fund shares are held in a taxable account. These costs, which are not reflected in annual fund operating expenses or in the example, affect the Fund’s performance. During the most recent fiscal year, the Fund’s portfolio turnover rate was 451% of the average value of its portfolio.
The Fund’s Principal Investment Strategies
The Fund primarily invests, under normal market conditions, in equity securities of U.S. and foreign issuers. This is a non-fundamental investment policy that the Fund can change upon 60 days’ prior notice to shareholders. Equity securities include common stock and preferred stock.
The Fund’s sub-advisor, Longfellow Investment Management Co. (“Longfellow” or “Sub-Advisor”), seeks to purchase securities of companies that are involved in corporate reorganizations, such as publicly announced mergers, takeovers, tender offers, debt restructurings, minority purchases, leveraged buyouts, spin-offs, and liquidations. Merger arbitrage is an investment strategy designed to profit from the successful completion of these types of transactions. Longfellow may also participate in other forms of arbitrage. The Fund is permitted to hold long and short equity positions, foreign securities including foreign depositary receipts, restricted securities including 144A securities (securities issued pursuant to Rule 144A under the Securities Act of 1933), and convertible securities. The Fund may invest in companies of any size in seeking to achieve its investment goal.
In acting on merger arbitrage opportunities, Longfellow primarily buys securities of companies being acquired (the “target company”) in publicly announced transactions where the terms of the transaction have been largely defined and disclosed. Longfellow may engage in selling securities short when the terms of a proposed corporate reorganization require the exchange of common stock and/or other securities. In such a case, the common stock of the target company may be purchased and, at approximately the same time, some amount of the acquiring company’s common stock and/or other securities may be sold short depending on the terms of the transaction. The Fund’s investment strategy is designed to capture the arbitrage spread represented by the difference between the market price of the securities of the target company and the value that is offered for these securities by the acquiring company. Under normal market conditions, merger arbitrage investments are expected to represent 60% or more of the Fund’s assets under management. The Fund may engage in active and frequent trading of portfolio securities as a part of its principal investment strategy.
Dependent upon the level of corporate restructuring activity, the market, or other conditions and as determined by Longfellow, in addition to equities, the Fund may invest in any combination of cash, cash equivalents and/or fixed-income securities, including investment-grade corporate bonds, non-investment-grade debt securities (also known as junk bonds), and convertible bonds. The Fund may also gain exposure to fixed-income securities through investments in other registered investment companies, specifically closed-end funds.
The Fund is non-diversified and may invest a significant percentage of its assets in the securities of a single company.
The Fund’s Principal Risks
The Fund’s share price will fluctuate. You could lose money on your investment in the Fund and the Fund could also return less than other investments. Investments in the Fund are not bank guaranteed, are not deposits, and are not insured by the FDIC or any other federal government agency.
This Fund should only be purchased by investors seeking positive absolute returns who can withstand the share price volatility of arbitrage investing. As with any mutual fund, there is no guarantee that the Fund will achieve its investment goal. You can find
more information about the Fund’s investments and risks under the “Principal Investment Strategies and Risks” section of the Fund’s prospectus. The Fund is subject to the principal risks summarized below.
Convertible Securities Risk: Convertible securities are subject to the risks of both debt securities and equity securities. The values of convertible securities tend to decline as interest rates rise and, due to the conversion feature, tend to vary with fluctuations in the market value of the underlying security.
Equity Securities Risk: The Fund is subject to the risk that stock prices will fall (or rise with respect to short positions) over short or extended periods of time. Individual companies may report poor results or be negatively affected by industry or economic trends and developments. The prices of securities issued by these companies may decline in response to such developments, which could result in a decline in the value of the Fund’s shares.
| • | Large-Cap Risk: Large-cap companies may be unable to respond quickly to new competitive challenges, such as changes in technology and consumer tastes, and also may not be able to attain the high growth rate of successful smaller companies, especially during extended periods of economic expansion. |
| | |
| • | Mid-Cap Risk: Stocks of mid-sized companies may be subject to more abrupt or erratic market movements than stocks of larger, more established companies. Mid-sized companies may have limited product lines or financial resources, and may be dependent upon a particular niche of the market. |
| | |
| • | Small-Cap Risk: Stocks of smaller companies may be subject to more abrupt or erratic market movements than stocks of larger, more established companies. Small companies may have limited product lines or financial resources, or may be dependent upon a small or inexperienced management group. |
Fixed-Income Risk: The market value of the Fund’s fixed-income securities responds to economic developments, particularly interest rate changes, as well as to perceptions about the creditworthiness of individual issuers, including governments. Generally, the Fund’s fixed-income securities will decrease in value if interest rates rise and increase in value if interest rates fall. Normally, the longer the maturity or duration of the fixed-income securities the Fund owns, the more sensitive the value of the Fund’s shares will be to changes in interest rates.
| • | Credit Risk: The fixed-income securities in the Fund’s portfolio are subject to the possibility that a deterioration, whether sudden or gradual, in the financial condition of an issuer, or a deterioration in general economic conditions, could cause an issuer to fail to make timely payments of principal or interest, when due. This may cause the issuer’s securities to decline in value. |
| | |
| • | Interest Rate Risk: In general, when interest rates rise, the prices of debt securities fall, and when interest rates fall, the prices of debt securities rise. The price volatility of a debt security also depends on its maturity. Longer-term securities are generally more volatile, so the longer the average maturity or duration of these securities, the greater their price risk. |
| | |
| • | Non-Investment-Grade Debt Securities Risk: Non-investment-grade debt securities are sometimes referred to as “junk bonds” and are considered speculative with respect to their issuers’ ability to make payments of interest and principal. There is a high risk that the Fund could suffer a loss from investments in non-investment-grade debt securities caused by the default of an issuer of such securities. Non-investment-grade debt securities may also be less liquid than investment-grade debt securities. |
Foreign Securities Risk: Investing in foreign securities poses additional risks since political and economic events unique in a country or region will affect those markets and their issuers, while such events may not necessarily affect the U.S. economy or issuers located in the United States. In addition, investments in foreign securities are generally denominated in foreign currency. As a result, changes in the value of those currencies compared to the U.S. dollar may affect the value of the Fund’s investments. Foreign markets may be less liquid and more volatile than U.S. markets and offer less protection to investors.
| • | Depositary Receipts Risk: Foreign receipts, which include American Depository Receipts (“ADRs”), Global Depositary Receipts and European Depositary Receipts, are securities that evidence ownership interests in a security or a pool of securities issued by a foreign issuer. The risks of depositary receipts include many risks associated with investing directly in foreign securities. |
Management Risk: In managing the Fund’s portfolio, the Advisor engages one or more sub-advisors to make investment decisions for a portion of or the entire portfolio. There is a risk that the Advisor may be unable to identify and retain sub-advisors who achieve superior investment returns relative to other similar sub-advisors.
Merger Arbitrage Risk: Investments in companies that are expected to be, or already are, the subject of a publicly announced transaction carry the risk that the proposed or expected transaction may not be completed or may be completed on less favorable terms than originally expected.
Non-Diversification Risk: The Fund is non-diversified, which means that it may invest a greater percentage of its assets than a diversified mutual fund in the securities of a limited number of issuers. The use of a non-diversified investment strategy may increase the volatility of the Fund’s investment performance, as the Fund may be more susceptible to risks associated with a single economic, political, or regulatory event than a diversified fund.
Other Investment Companies Risk: The Fund’s investments in other investment companies will be subject to substantially the same risks as those associated with the direct ownership of the securities comprising the portfolios of such investment companies, and the value of the Fund’s investment will fluctuate in response to the performance of such portfolios. In addition, if the Fund acquires shares of investment companies, shareholders of the Fund will bear their proportionate share of the fees and expenses of the Fund and, indirectly, the fees and expenses of the investment companies.
Portfolio Turnover Risk: Frequent and active trading may result in greater expenses to the Fund, which may lower the Fund’s performance and may result in the realization of substantial capital gains, including net short-term capital gains. As a result, high portfolio turnover may reduce the Fund’s returns.
Preferred Stock Risk: In the event an issuer is liquidated or declares bankruptcy, the claims of owners of bonds take precedence over the claims of those who own preferred and common stock. If interest rates rise, the fixed dividend on preferred stocks may be less attractive, causing the price of preferred stocks to decline.
Rule 144A Securities Risk: Rule 144A securities are restricted securities that may be purchased only by qualified institutional buyers in reliance on an exemption from federal registration requirements. Investing in Rule 144A securities may reduce the liquidity of the Fund’s portfolio if an adequate institutional trading market for these securities does not exist. The Fund may be unable to sell Rule 144A securities at advantageous prices or times, or at all, if an insufficient number of qualified institutional buyers is interested in purchasing such securities. Prices of Rule 144A securities often reflect a discount, which may be significant, from the market price of comparable exchange-listed securities for which a liquid trading market exists.
Short Sale Risk: In a short sale, the Fund sells a security or other financial instrument, such as a futures contract, that it does not own. To complete the transaction, the Fund must borrow the security to make delivery to the buyer. The Fund is then obligated to replace the borrowed security by purchasing the security at the market price at the time of replacement. If the price of the security sold short rises between the time the Fund sells the security short and the time the Fund replaces the security sold short, the Fund will realize a loss on the transaction.
The Fund’s Performance
The bar chart and performance table below illustrate some indication of the risks and volatility of investing in the Fund by showing how the Fund’s average annual total returns for one year and since inception compare with the BofA Merrill Lynch 3-Month U.S. Treasury Bill Index. The bar chart does not reflect any sales charges, which would reduce your return. The performance table does reflect any applicable sales charges. The Fund’s past performance (before and after taxes) does not necessarily indicate how the Fund will perform in the future. More recent performance is available at no cost by visiting TouchstoneInvestments.com or by calling 1.800.543.0407.
Touchstone Arbitrage Fund — Class A Total Return as of December 31
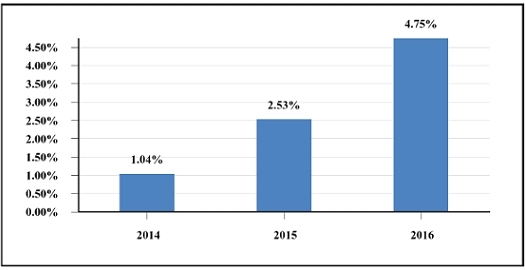
| Best Quarter: Fourth Quarter 2015 2.33% | Worst Quarter: Second Quarter 2014 (1.00)% |
After-tax returns are calculated using the historical highest individual federal marginal income tax rates and do not reflect the impact of state and local taxes. Your actual after-tax returns may differ from those shown and depend on your tax situation. The after-tax returns do not apply to shares held in an individual retirement account (“IRA”), 401(k), or other tax-advantaged account. The after-tax returns shown in the table are for Class A shares only. The after-tax returns for other classes of shares offered by the Fund will differ from the Class A shares after-tax returns.
Average Annual Total Returns
For the periods ended December 31, 2016
| | | | Since Inception |
| | 1 Year | | (09-30-13) |
| Touchstone Arbitrage Fund — Class A | | | |
| Return Before Taxes | (1.27)% | | 0.15% |
| Return After Taxes on Distributions | (2.38)% | | (0.36)% |
| Return After Taxes on Distributions and Sale of Fund Shares | (0.62)% | | (0.06)% |
| Touchstone Arbitrage Fund — Class C | | | |
| Return Before Taxes | 3.12% | | 1.29% |
| Touchstone Arbitrage Fund — Class Y | | | |
| Return Before Taxes | 5.23% | | 2.32% |
| Touchstone Arbitrage Fund — Institutional Class | | | |
| Return Before Taxes | 5.22% | | 2.42% |
| BofA Merrill Lynch 3-Month U.S. Treasury Bill Index (reflects no deductions for fees, expenses or taxes) | 0.33% | | 0.13% |
The Fund’s Management
Investment Advisor
Touchstone Advisors, Inc.
| Sub-Advisor | | Portfolio
Manager(s) | | Investment Experience
with the Fund | | Primary Title with
Sub-Advisor |
| Longfellow Investment Management Co. | | Barbara J. McKenna, CFA | | Managing the Fund since its inception in 2013 | | Managing Principal and Portfolio Manager |
| | | | | | | |
| | | David C. Stuehr, CFA | | Managing the Fund since its inception in 2013 | | Principal, Portfolio Manager |
| | | | | | | |
| | | Andrew G. Bail | | Managing the Fund since 2017 | | Portfolio Manager and Senior Analyst |
| | | | | | | |
| | | Alexander R. Graham, CAIA | | Managing the Fund since its inception in 2013 | | Portfolio Manager and Senior Analyst |
Buying and Selling Fund Shares
Minimum Investment Requirements
| | Classes A, C, and Y | |
| | Initial | | Additional | |
| | Investment | | Investment | |
| Regular Account | $ | 2,500 | | $ | 50 | |
| Retirement Account or Custodial Account under the Uniform Gifts/Transfers to Minors Act | $ | 1,000 | | $ | 50 | |
| Investments through the Automatic Investment Plan | $ | 100 | | $ | 50 | |
| | Institutional Class | |
| | Initial | | Additional | |
| | Investment | | Investment | |
| Regular Account | $ | 500,000 | | $ | 50 | |
You may buy and sell shares in the Fund on a day when the New York Stock Exchange is open for trading. Class A and C shares may be purchased and sold directly through Touchstone Securities, Inc. (“Touchstone Securities”) or through your financial intermediary. Class Y shares are available only through financial intermediaries who have appropriate selling agreements in place with Touchstone Securities. Institutional Class shares are available through Touchstone Securities or your financial intermediary. Shares may be purchased or sold by writing to Touchstone Securities at P.O. Box 9878, Providence, Rhode Island 02940, calling 1.800.543.0407, or visiting the Touchstone Funds’ website: TouchstoneInvestments.com. You may only sell shares over the telephone or via the Internet if the value of the shares sold is less than or equal to $100,000. Shares held in IRAs and qualified retirement plans cannot be sold by telephone or via the Internet. If your shares are held by a processing organization or financial intermediary you will need to follow its purchase and redemption procedures. For more information about buying and selling shares, see the section “Investing with Touchstone” of the Fund’s prospectus or call 1.800.543.0407.
Tax Information
The Fund intends to pay dividends and make distributions that may be taxed as ordinary income or capital gains, except when shares are held through a tax-advantaged account, such as a 401(k) plan or an IRA. Withdrawals from a tax-advantaged account, however, may be taxable.
Financial Intermediary Compensation
If you purchase shares in the Fund through a broker-dealer or other financial intermediary (such as a bank), the Fund and its related companies may pay the intermediary for the sale of Fund shares and related services. These payments may create a conflict of interest by influencing the broker-dealer or other financial intermediary and your salesperson to recommend the Fund over another investment. Ask your salesperson or visit your financial intermediary’s website for more information.
TOUCHSTONE EMERGING MARKETS SMALL CAP FUND SUMMARY
The Fund’s Investment Goal
The Touchstone Emerging Markets Small Cap Fund (formerly, the Touchstone Emerging Markets Equity Fund) (the “Fund”) seeks capital appreciation.
The Fund’s Fees and Expenses
This table describes the fees and expenses that you may pay if you buy and hold shares of the Fund. You may qualify for sales charge discounts for Class A shares if you and your family invest, or agree to invest in the future, at least $50,000 or more in the Touchstone Funds. More information about these and other discounts is available from your financial professional and in the section entitled “Choosing a Class of Shares” in the Fund’s prospectus on page 89 and in the Fund’s Statement of Additional Information (“SAI”) on page 80.
| | Class A | | Class C | | Class Y | | Institutional
Class |
| Shareholder Fees (fees paid directly from your investment) | | | | | | | | | | | |
| Maximum Sales Charge (Load) Imposed on Purchases (as a percentage of offering price) | 5.75 | % | | None | | | None | | | None | |
| Maximum Deferred Sales Charge (Load) (as a percentage of original purchase price or the amount redeemed, whichever is less) | None | | | 1.00 | % | | None | | | None | |
| Wire Redemption Fee | Up to $15 | | | Up to $15 | | | Up to $15 | | | Up to $15 | |
| Annual Fund Operating Expenses (expenses that you pay each year as a percentage of the value of your investment) | | | | | | | | | | | |
| Management Fees | 1.05 | % | | 1.05 | % | | 1.05 | % | | 1.05 | % |
| Distribution and/or Shareholder Service (12b-1) Fees | 0.25 | % | | 1.00 | % | | None | | | None | |
| Other Expenses | 2.21 | % | | 2.75 | % | | 1.22 | % | | 1.11 | % |
| Total Annual Fund Operating Expenses | 3.51 | % | | 4.80 | % | | 2.27 | % | | 2.16 | % |
| Fee Waiver or Expense Reimbursement(1) | (1.82 | )% | | (2.36 | )% | | (0.83 | )% | | (0.87 | )% |
| Total Annual Fund Operating Expenses After Fee Waiver or Expense Reimbursement(1) | 1.69 | % | | 2.44 | % | | 1.44 | % | | 1.29 | % |
(1)Touchstone Advisors, Inc. (the “Advisor” or “Touchstone Advisors”) and Touchstone Funds Group Trust (the “Trust”) have entered into a contractual expense limitation agreement whereby Touchstone Advisors will waive a portion of its fees or reimburse certain Fund expenses (excluding dividend and interest expenses relating to short sales; interest; taxes; brokerage commissions and other transaction costs; portfolio transactions and investment related expenses; other expenditures which are capitalized in accordance with U.S. generally accepted accounting principles; the cost of “Acquired Fund Fees and Expenses,” if any; and other extraordinary expenses not incurred in the ordinary course of business) in order to limit annual Fund operating expenses to 1.69%, 2.44%, 1.44%, and 1.29% of average daily net assets for Classes A, C, Y and Institutional Class shares, respectively. This contractual expense limitation is effective through January 29, 2018, but can be terminated by a vote of the Board of Trustees of the Trust (the “Board”) if it deems the termination to be beneficial to the Fund’s shareholders. The terms of the contractual expense limitation agreement provide that Touchstone Advisors is entitled to recoup, subject to approval by the Board, such amounts waived or reimbursed for a period of up to three years from the year in which Touchstone Advisors reduced its compensation or assumed expenses for the Fund. No recoupment will occur unless the Fund’s expenses are below the lesser of the expense limitation amount in effect (a) at the time of the waiver, or (b) at the time of the reimbursement.
Example. This example is intended to help you compare the cost of investing in the Fund with the cost of investing in other mutual funds. The example assumes that you invest $10,000 in the Fund for the time periods indicated and then, except as indicated, redeem all of your shares at the end of those periods. The example also assumes that your investment has a 5% return each year and that the Fund’s operating expenses remain the same and that all fee waivers or expense limits for the Fund will expire after one year. Although your actual costs may be higher or lower, based on these assumptions your costs would be:
| | | Assuming Redemption at End of Period | | Assuming No Redemption | |
| | | | | | | | | | | | | Institutional | | | | |
| | | | Class A | | | Class C | | | Class Y | | | Class | | | Class C | |
| 1 Year | | $ | 737 | | $ | 347 | | $ | 147 | | $ | 131 | | $ | 247 | |
| 3 Years | | $ | 1,431 | | $ | 1,234 | | $ | 630 | | $ | 592 | | $ | 1,234 | |
| 5 Years | | $ | 2,145 | | $ | 2,224 | | $ | 1,139 | | $ | 1,080 | | $ | 2,224 | |
| 10 Years | | $ | 4,027 | | $ | 4,718 | | $ | 2,541 | | $ | 2,424 | | $ | 4,718 | |
Portfolio Turnover. The Fund pays transaction costs, such as brokerage commissions, when it buys and sells securities (or “turns over” its portfolio). A higher portfolio turnover rate may indicate higher transaction costs and may result in higher taxes when Fund shares are held in a taxable account. These costs, which are not reflected in annual fund operating expenses or in the example, affect the Fund’s performance. During the most recent fiscal year, the Fund’s portfolio turnover rate was 68% of the average value of its portfolio.
The Fund’s Principal Investment Strategies
The Fund invests, under normal market conditions, at least 80% of its net assets (including borrowings for investment purposes) in equity securities of small-cap companies located in emerging markets. This is a non-fundamental investment policy that can be changed by the Fund upon 60 days’ prior notice to shareholders. For purposes of this Fund, small-cap companies are those companies with market capitalizations at the time of investment either (1) below $5 billion, or (2) below the market capitalization of the largest company within the Morgan Stanley Capital International (“MSCI”) Emerging Markets Small Cap Index, whichever is higher. The size of the companies in the MSCI Emerging Markets Small Cap Index will change with market conditions. Equity securities include common stocks and American Depositary Receipts (“ADRs”). The Fund generally expects to invest in a portfolio of approximately 80 to 100 issuers.
The Fund classifies emerging markets using the MSCI definition. As of December 31, 2016, the countries defined by MSCI as emerging markets were: Brazil, Chile, China, Colombia, Czech Republic, Egypt, Greece, Hungary, India, Indonesia, Korea, Malaysia, Mexico, Peru, Philippines, Poland, Russia, Qatar, South Africa, Taiwan, Thailand, Turkey and United Arab Emirates. The composition of the countries considered emerging markets by MSCI may change from time to time. The Fund will generally consider qualifying investments to be in companies that are organized under the laws of, or maintain their principal place of business in, an emerging market country; have securities that are principally traded in such countries; or derive at least 50% of revenues or profits from, or have at least 50% of their assets in, such countries.
The Fund’s Principal Risks
The Fund’s share price will fluctuate. You could lose money on your investment in the Fund and the Fund could also return less than other investments. Investments in the Fund are not bank guaranteed, are not deposits, and are not insured by the FDIC or any other federal government agency.
This Fund should only be purchased by investors seeking capital appreciation who can withstand the share price volatility of emerging markets investing. As with any mutual fund, there is no guarantee that the Fund will achieve its investment goal. You can find more information about the Fund’s investments and risks under the “Principal Investment Strategies and Risks” section of the Fund’s prospectus. The Fund is subject to the principal risks summarized below.
Equity Securities Risk: The Fund is subject to the risk that stock prices will fall over short or extended periods of time. Individual companies may report poor results or be negatively affected by industry and/or economic trends and developments. The prices of securities issued by these companies may decline in response to such developments, which could result in a decline in the value of the Fund’s shares.
| • | Mid-Cap Risk: Mid-sized companies may have limited product lines, or financial resources, and may be dependent upon a particular niche of the market. Small-cap stocks in the Fund’s portfolio may become mid-cap stocks based on market movement. In addition, the Fund may invest up to 20% of its net assets directly in mid-cap stocks. |
| | |
| • | Small-Cap Risk: Stocks of smaller companies may be subject to more abrupt or erratic market movements than stocks of larger, more established companies. Small companies may have limited product lines or financial resources, or may be dependent upon a small or inexperienced management group. |
Foreign Securities Risk: Investing in foreign securities poses additional risks since political and economic events unique in a country or region will affect those markets and their issuers. These events may not necessarily affect the U.S. economy or similar issuers located in the United States. In addition, investments in foreign securities are generally denominated in foreign currency. As a result, changes in the value of those currencies compared to the U.S. dollar may affect the value of the Fund’s investments. In addition, the Fund generally does not intend to hedge foreign currency risk. Foreign markets may be less liquid and more volatile than U.S. markets and offer less protection to investors.
| | • | Depositary Receipts Risk: Foreign receipts, which include ADRs, Global Depositary Receipts and European Depositary Receipts, are securities that evidence ownership interests in a security or a pool of securities issued by a foreign issuer. The risks of depositary receipts include many risks associated with investing directly in foreign securities. |
| | | |
| | • | Emerging Markets Risk: Emerging markets may be more likely to experience political turmoil or rapid changes in market or economic conditions than more developed countries. In addition, the financial stability of issuers (including governments) in emerging market countries may be more precarious than that of issuers in other countries. |
Management Risk: In managing the Fund’s portfolio, the Advisor engages one or more sub-advisors to make investment decisions for a portion of or the entire portfolio. There is a risk that the Advisor may be unable to identify and retain sub-advisors who achieve superior investment returns relative to other similar sub-advisors.
The Fund’s Performance
The bar chart and performance table below illustrate some indication of the risks and volatility of investing in the Fund by showing changes in the Fund’s performance from year to year and by showing how the Fund’s average annual total returns for one year, five years and since inception compare with the MSCI Emerging Markets Index and the MSCI Emerging Markets Small Cap Index. The bar chart does not reflect any sales charges, which would reduce your return. The performance table does reflect any applicable sales charges. The Fund’s past performance (before and after taxes) does not necessarily indicate how the Fund will perform in the future. More recent performance is available at no cost by visiting TouchstoneInvestments.com or by calling 1.800.543.0407.
On April 19, 2016, the Fund changed its name, principal investment strategies and sub-advisor. Consequently, prior performance may have been different if the Fund had not been managed by the prior sub-advisor using that sub-advisor’s emerging market strategy. In addition, future performance may be different as a result of the change in sub-advisor and investment strategy.
Touchstone Emerging Markets Small Cap Fund — Class A Total Return as of December 31
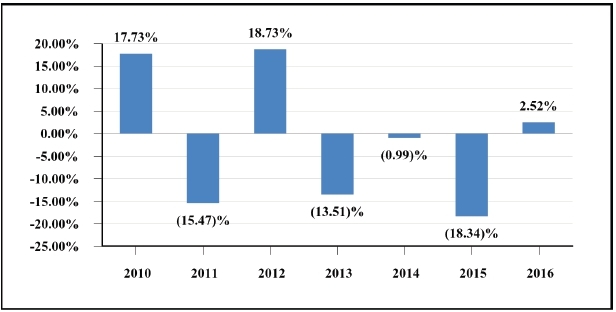
| Best Quarter: Third Quarter 2010 18.39% | | Worst Quarter: Third Quarter 2011 (18.02)% |
After-tax returns are calculated using the historical highest individual federal marginal income tax rates and do not reflect the impact of state and local taxes. Your actual after-tax returns may differ from those shown and depend on your tax situation. The after-tax returns do not apply to shares held in an individual retirement account (“IRA”), 401(k), or other tax-advantaged account. The after-tax returns shown in the table are for Class A shares only. The after-tax returns for other classes of shares offered by the Fund will differ from the Class A shares after-tax returns.
Average Annual Total Returns
For the periods ended December 31, 2016
| | | | | | | | | Since Inception |
| | | 1 Year | | 5 Years | | (9-30-09) |
| Touchstone Emerging Markets Small Cap Fund — Class A | | | | | | | | | | | | |
| Return Before Taxes | | | (3.40 | )% | | | (4.31 | )% | | | (1.45 | )% |
| Return After Taxes on Distributions | | | (3.40 | )% | | | (4.41 | )% | | | (1.55 | )% |
| Return After Taxes on Distributions and Sale of Fund Shares | | | (1.92 | )% | | | (2.90 | )% | | | (0.83 | )% |
| Touchstone Emerging Markets Small Cap Fund — Class C | | | | | | | | | | | | |
| Return Before Taxes | | | 0.71 | % | | | (3.91 | )% | | | (1.39 | )% |
| Touchstone Emerging Markets Small Cap Fund — Class Y | | | | | | | | | | | | |
| Return Before Taxes | | | 2.64 | % | | | (2.91 | )% | | | (0.37 | )% |
| Touchstone Emerging Markets Small Cap Fund — Institutional Class | | | | | | | | | | | | |
| Return Before Taxes | | | 2.91 | % | | | (2.79 | )% | | | (0.24 | )% |
| MSCI Emerging Markets Index (reflects no deductions for fees or expenses) | | | 11.19 | % | | | 1.28 | % | | | 1.59 | % |
| MSCI Emerging Markets Small Cap Index* (reflects no deductions for fees or expenses) | | | 2.28 | % | | | 3.51 | % | | | 2.96 | % |
*The Fund changed its benchmark from the MSCI Emerging Markets Index to the MSCI Emerging Markets Small Cap Index on April 19, 2016, in conjunction with the Fund’s name change, change in sub-advisor and change in principal investment strategies.
The Fund’s Management
Investment Advisor
Touchstone Advisors, Inc.
| | | | | Investment Experience | | Primary Title with |
| Sub-Advisor | | Portfolio Manager | | with the Fund | | Sub-Advisor |
| Copper Rock Capital Partners | | Stephen Dexter | | Managing the Fund since | | Partner, Chief |
| LLC | | | | 2016 | | Investment Officer and |
| | | | | | | Portfolio Manager |
| | | | | | | |
| | | | | | | |
| | | H. David Shea, CFA | | Managing the Fund since | | Partner and Portfolio |
| | | | | 2016 | | Manager |
Buying and Selling Fund Shares
Minimum Investment Requirements
| | | Classes A, C, and Y | |
| | | Initial Investment | | Additional Investment | |
| Regular Account | | $ | 2,500 | | $ | 50 | |
| Retirement Account or Custodial Account under the Uniform Gifts/Transfers to Minors Act | | $ | 1,000 | | $ | 50 | |
| Investments through the Automatic Investment Plan | | $ | 100 | | $ | 50 | |
| | | | | | | | |
| | | Institutional Class | |
| | | Initial Investment | | Additional Investment | |
| Regular Account | | $ | 500,000 | | $ | 50 | |
You may buy and sell shares in the Fund on a day when the New York Stock Exchange is open for trading. Class A and C shares may be purchased and sold directly through Touchstone Securities, Inc. (“Touchstone Securities”) or through your financial intermediary. Class Y shares are available only through financial intermediaries who have appropriate selling agreements in place with Touchstone Securities. Institutional Class shares are available through Touchstone Securities or your financial intermediary. Shares may be purchased or sold by writing to Touchstone Securities at P.O. Box 9878, Providence, Rhode Island 02940, calling 1.800.543.0407, or visiting the Touchstone Funds’ website: TouchstoneInvestments.com. You may only sell shares over the telephone or via the Internet if the value of the shares sold is less than or equal to $100,000. Shares held in IRAs and qualified retirement plans cannot be sold by telephone or via the Internet. If your shares are held by a processing organization or financial intermediary you will need to follow its purchase and redemption procedures. For more information about buying and selling shares, see the section “Investing with Touchstone” of the Fund’s prospectus or call 1.800.543.0407.
Tax Information
The Fund intends to pay dividends and make distributions that may be taxed as ordinary income or capital gains, except when shares are held through a tax-advantaged account, such as a 401(k) plan or an IRA. Withdrawals from a tax-advantaged account, however, may be taxable.
Financial Intermediary Compensation
If you purchase shares in the Fund through a broker-dealer or other financial intermediary (such as a bank), the Fund and its related companies may pay the intermediary for the sale of Fund shares and related services. These payments may create a conflict of interest by influencing the broker-dealer or other financial intermediary and your salesperson to recommend the Fund over another investment. Ask your salesperson or visit your financial intermediary’s website for more information.
TOUCHSTONE HIGH YIELD FUND SUMMARY
The Fund’s Investment Goal
The Touchstone High Yield Fund (the “Fund”) seeks to achieve a high level of income as its main goal. Capital appreciation is a secondary consideration.
The Fund’s Fees and Expenses
This table describes the fees and expenses that you may pay if you buy and hold shares of the Fund. You may qualify for sales charge discounts for Class A shares if you and your family invest, or agree to invest in the future, at least $50,000 or more in the Touchstone Funds. More information about these and other discounts is available from your financial professional and in the section entitled “Choosing a Class of Shares” in the Fund’s prospectus on page 89 and in the Fund’s Statement of Additional Information (“SAI”) on page 80.
| | | | | | | | | | | | Institutional |
| | | Class A | | Class C | | Class Y | | Class |
| Shareholder Fees (fees paid directly from your investment) | | | | | | | | | | | | | | | | |
| Maximum Sales Charge (Load) Imposed on Purchases (as a percentage of offering price) | | | 4.75 | % | | | None | | | | None | | | | None | |
| Maximum Deferred Sales Charge (Load) (as a percentage of original purchase price or the amount redeemed, whichever is less) | | | None | | | | 1.00 | % | | | None | | | | None | |
| Wire Redemption Fee | | | Up to $15 | | | | Up to $15 | | | | Up to $15 | | | | Up to $15 | |
| Annual Fund Operating Expenses (expenses that you pay each year as a percentage of the value of your investment) | | | | | | | | | | | | | | | | |
| Management Fees | | | 0.52 | % | | | 0.52 | % | | | 0.52 | % | | | 0.52 | % |
| Distribution and/or Shareholder Service (12b-1) Fees | | | 0.25 | % | | | 1.00 | % | | | None | | | | None | |
| Other Expenses | | | 0.46 | % | | | 0.42 | % | | | 0.39 | % | | | 0.25 | % |
| Total Annual Fund Operating Expenses | | | 1.23 | % | | | 1.94 | % | | | 0.91 | % | | | 0.77 | % |
| Fee Waiver and/or Expense Reimbursement(1) | | | (0.18 | )% | | | (0.14 | )% | | | (0.11 | )% | | | (0.05 | )% |
| Total Annual Fund Operating Expenses After Fee Waiver and/or Expense Reimbursement(1) | | | 1.05 | % | | | 1.80 | % | | | 0.80 | % | | | 0.72 | % |
(1)Touchstone Advisors, Inc. (the “Advisor” or “Touchstone Advisors”) and the Trust have entered into a contractual expense limitation agreement whereby Touchstone Advisors will waive a portion of its fees or reimburse certain Fund expenses (excluding dividend and interest expenses relating to short sales; interest; taxes; brokerage commissions and other transaction costs; portfolio transactions and investment related expenses; other expenditures which are capitalized in accordance with U.S. generally accepted accounting principles; the cost of “Acquired Fund Fees and Expenses,” if any; and other extraordinary expenses not incurred in the ordinary course of business) in order to limit annual Fund operating expenses to 1.05%, 1.80%, 0.80%, and 0.72% of average daily net assets for Classes A, C, Y and Institutional Class shares, respectively. This contractual expense limitation is effective through January 29, 2018, but can be terminated by a vote of the Board of Trustees of the Trust (the “Board”) if it deems the termination to be beneficial to the Fund’s shareholders. The terms of the contractual expense limitation agreement provide that Touchstone Advisors is entitled to recoup, subject to approval by the Board, such amounts waived or reimbursed for a period of up to three years from the year in which Touchstone Advisors reduced its compensation or assumed expenses for the Fund. No recoupment will occur unless the Fund’s expenses are below the lesser of the expense limitation amount in effect (a) at the time of the waiver, or (b) at the time of the reimbursement.
Example. This example is intended to help you compare the cost of investing in the Fund with the cost of investing in other mutual funds. The example assumes that you invest $10,000 in the Fund for the time periods indicated and then, except as indicated, redeem all of your shares at the end of those periods. The example also assumes that your investment has a 5% return each year, that the Fund’s operating expenses remain the same and that all fee waivers or expense limits for the Fund will expire after one year. Although your actual costs may be higher or lower, based on these assumptions your costs would be:
| | | Assuming Redemption at End of Period | | | Assuming No Redemption | |
| | | | | | | | | | | | Institutional | | | | |
| | | Class A | | | Class C | | | Class Y | | | Class | | | Class C | |
| 1 Year | | $ | 577 | | | $ | 283 | | | $ | 82 | | | $ | 74 | | | $ | 183 | |
| 3 Years | | $ | 830 | | | $ | 596 | | | $ | 279 | | | $ | 241 | | | $ | 596 | |
| 5 Years | | $ | 1,102 | | | $ | 1,034 | | | $ | 493 | | | $ | 423 | | | $ | 1,034 | |
| 10 Years | | $ | 1,878 | | | $ | 2,253 | | | $ | 1,109 | | | $ | 949 | | | $ | 2,253 | |
Portfolio Turnover. The Fund pays transaction costs, such as brokerage commissions, when it buys and sells securities (or “turns over” its portfolio). A higher portfolio turnover rate may indicate higher transaction costs and may result in higher taxes when Fund shares are held in a taxable account. These costs, which are not reflected in annual fund operating expenses or in the example, affect the Fund’s performance. During the most recent fiscal year, the Predecessor Fund’s portfolio turnover rate was 56% of the average value of its portfolio.
The Fund’s Principal Investment Strategies
The Fund normally invests at least 80% of its net assets (including borrowings for investment purposes) in non-investment-grade debt securities. This is a non-fundamental policy that can be changed by the Fund upon 60 days’ prior notice to shareholders. The Fund generally invests in non-investment-grade debt securities of domestic corporations. Non-investment-grade debt securities are higher risk, lower quality securities, often referred to as “junk bonds,” and are considered speculative. They are rated below BBB- by Standard & Poor’s Ratings Services and Fitch Ratings, Inc. or below Baa3 by Moody’s Investors Services, Inc.
In selecting securities for the Fund, the sub-advisor, Fort Washington Investment Advisors, Inc., analyzes the overall investment opportunities and risks in different industry sectors focusing on those industries that exhibit stability and predictability. Having developed certain industry biases resulting from the current macroeconomic environment, Fort Washington implements a process of elimination through which certain types of securities are removed from the list of initially selected securities due to their structure. The next step is to apply a rigorous credit selection process in order to identify securities that offer attractive investment opportunities. Once a security has been purchased, the credit analysis process is re-applied to each individual security in the Fund’s portfolio on a periodic basis or as new information becomes available to determine whether or not to keep a security in the Fund’s portfolio.
The Fund’s Principal Risks
The Fund’s share price will fluctuate. You could lose money on your investment in the Fund and the Fund could also return less than other investments. Investments in the Fund are not bank guaranteed, are not deposits, and are not insured by the FDIC or any other federal government agency.
As with any mutual fund, there is no guarantee that the Fund will achieve its investment goal. You can find more information about the Fund’s investments and risks under the “Principal Investment Strategies and Risks” section of the Fund’s prospectus. The Fund is subject to the principal risks summarized below.
Fixed-Income Risk: The market value of the Fund’s fixed-income securities responds to economic developments, particularly interest rate changes, as well as to perceptions about the creditworthiness of individual issuers, including governments. Generally, the Fund’s fixed-income securities will decrease in value if interest rates rise and increase in value if interest rates fall. Normally, the longer the maturity or duration of the fixed-income securities the Fund owns, the more sensitive the value of the Fund’s shares will be to changes in interest rates.
| | • | Credit Risk: The fixed-income securities in the Fund’s portfolio are subject to the possibility that a deterioration, whether sudden or gradual, in the financial condition of an issuer, or a deterioration in general economic conditions, could cause an issuer to fail to make timely payments of principal or interest, when due. This may cause the issuer’s securities to decline in value. |
| | | |
| | • | Interest Rate Risk: In general, when interest rates rise, the prices of debt securities fall, and when interest rates fall, the prices of debt securities rise. The price volatility of a debt security also depends on its maturity. Longer-term securities are generally more volatile, so the longer the average maturity or duration of these securities, the greater their price risk. |
| | • | Non-Investment-Grade Debt Securities Risk: Non-investment-grade debt securities are sometimes referred to as “junk bonds” and are considered speculative with respect to their issuers’ ability to make payments of interest and principal. There is a high risk that the Fund could suffer a loss from investments in non-investment-grade debt securities caused by the default of an issuer of such securities. Non-investment-grade debt securities may also be less liquid than investment-grade debt securities. |
Management Risk: In managing the Fund’s portfolio, the Advisor engages one or more sub-advisors to make investment decisions for a portion of or the entire portfolio. There is a risk that the Advisor may be unable to identify and retain sub-advisors who achieve superior investment returns relative to other similar sub-advisors.
The Fund’s Performance
The Fund is a new series of Touchstone Funds Group Trust (the “Trust”). On January 27, 2017, the Touchstone High Yield Fund, previously a series of Touchstone Investment Trust (the “Predecessor Fund”), was reorganized into the Fund. As a result of the reorganization, the performance and accounting history of the Predecessor Fund was assumed by the Fund. Certain financial and performance information included herein is that of the Predecessor Fund.
The bar chart and performance table below illustrate some indication of the risks and volatility of investing in the Fund by showing changes in the Predecessor Fund’s performance from year to year and by showing how the Predecessor Fund’s average annual total returns for one year, five years, and ten years compared with the BofA Merrill Lynch High Yield Cash Pay Index. The bar chart does not reflect any sales charges, which would reduce your return. The performance table does reflect any applicable sales charges. The Predecessor Fund’s past performance (before and after taxes) does not necessarily indicate how the Fund will perform in the future. More recent performance is available at no cost by visiting TouchstoneInvestments.com or by calling 1.800.543.0407.
Touchstone High Yield Fund — Class A Shares Total Returns as of December 31
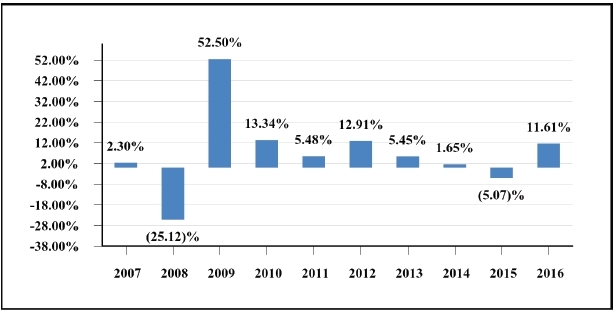
| Best Quarter: Second Quarter 2009 22.23% | Worst Quarter: Fourth Quarter 2008 (20.40)% | |
After-tax returns are calculated using the historical highest individual federal marginal income tax rates and do not reflect the impact of state and local taxes. Your actual after-tax returns may differ from those shown and depend on your tax situation. The after-tax returns do not apply to shares held in an individual retirement account (“IRA”), 401(k), or other tax-advantaged account. After-tax returns are only shown for Class A shares and after-tax returns for other classes of shares offered by the Fund will differ from the Class A shares after-tax return.
The inception dates of Class A shares, Class C shares, Class Y shares and Institutional Class shares of the Predecessor Fund were May 1, 2000, May 23, 2000, February 1, 2007 and January 27, 2012, respectively. Class Y and Institutional Class shares performance information was calculated using the historical performance of Class A shares for the periods prior to February 1, 2007 and January 27, 2012, respectively. Performance for these periods has been restated to reflect the impact of the fees and expenses applicable to Class Y and Institutional Class shares.
Average Annual Total Returns
For the periods ended December 31, 2016
| | | 1 Year | | 5 Years | | 10 Years |
| Predecessor Fund - Class A | | | | | | | | | | | | |
| Return Before Taxes | | | 6.37 | % | | | 4.09 | % | | | 5.49 | % |
| Return After Taxes on Distributions | | | 4.05 | % | | | 1.71 | % | | | 2.70 | % |
| Return After Taxes on Distributions and Sale of Fund Shares | | | 3.53 | % | | | 2.11 | % | | | 3.04 | % |
| Predecessor Fund - Class C | | | | | | | | | | | | |
| Return Before Taxes | | | 9.67 | % | | | 4.32 | % | | | 5.21 | % |
| Predecessor Fund - Class Y | | | | | | | | | | | | |
| Return Before Taxes | | | 11.89 | % | | | 5.39 | % | | | 6.31 | % |
| Predecessor Fund - Institutional Class | | | | | | | | | | | | |
| Return Before Taxes | | | 11.98 | % | | | 5.49 | % | | | 6.20 | % |
| BofA Merrill Lynch High Yield Cash Pay Index (reflects no deductions for fees, expenses or taxes) | | | 17.34 | % | | | 7.30 | % | | | 7.27 | % |
The Fund’s Management
Investment Advisor
Touchstone Advisors, Inc.
| | | | | Investment Experience with | | |
| | | Portfolio | | the Predecessor Fund and the | | |
| Sub-Advisor | | Managers | | Fund | | Primary Title with Sub-Advisor |
| Fort Washington | | Brendan M. White, CFA | | Managed the Predecessor | | Senior Vice President and |
| Investment Advisors, Inc. | | | | Fund from 2000 to 2017; | | Co-Chief Investment |
| | | | | managing the Fund since | | Officer |
| | | | | its inception in 2017 | | |
| | | | | | | |
| | | Timothy Jossart, CFA | | Managed the Predecessor | | Vice President, Portfolio |
| | | | | Fund from 2011 to 2017; | | Manager and Senior Credit |
| | | | | managing the Fund since | | Analyst |
| | | | | its inception in 2017 | | |
| | | | | | | |
| | | Garrick T. Bauer, CFA | | Managing the Fund since | | Assistant Vice President, |
| | | | | its inception in 2017 | | Portfolio Manager and |
| | | | | | | Senior Credit Analyst |
Buying and Selling Fund Shares
Minimum Investment Requirements
| | | Classes A, C, and Y | |
| | | Initial | | Additional | |
| | | Investment | | Investment | |
| Regular Account | | $ | 2,500 | | $ | 50 | |
| Retirement Account or Custodial Account under the Uniform Gifts/Transfers to Minors Act | | $ | 1,000 | | $ | 50 | |
| Investments through the Automatic Investment Plan | | $ | 100 | | $ | 50 | |
| | | | | | | | |
| | | Institutional Class | |
| | | Initial | | Additional | |
| | | Investment | | Investment | |
| Regular Account | | $ | 500,000 | | $ | 50 | |
You may buy and sell shares in the Fund on a day when the New York Stock Exchange is open for trading. Classes A and C shares may be purchased and sold directly through Touchstone Securities, Inc. (“Touchstone Securities”) or through your financial intermediary. Class Y shares are available only through financial intermediaries who have appropriate selling agreements in place with Touchstone Securities. Institutional Class shares are available through Touchstone Securities or your financial intermediary. Shares may be purchased or sold by writing to Touchstone Securities at P.O. Box 9878, Providence, Rhode Island 02940, calling 1.800.543.0407, or visiting the Touchstone Funds’ website: TouchstoneInvestments.com. You may only sell shares over the telephone or via the Internet if the value of the shares sold is less than or equal to $100,000. Shares held in IRAs and qualified retirement plans cannot be sold by telephone or via the Internet. If your shares are held by a processing organization or financial intermediary you will need to follow its purchase and redemption procedures. For more information about buying and selling shares, see the section “Investing with Touchstone” of the Fund’s prospectus or call 1.800.543.0407.
Tax Information
The Fund intends to make distributions that may be taxed as ordinary income or capital gains except when shares are held through a tax-advantaged account, such as a 401(k) plan or an IRA. Withdrawals from a tax-advantaged account, however, may be taxable.
Financial Intermediary Compensation
If you purchase shares in the Fund through a broker-dealer or other financial intermediary (such as a bank), the Fund and its related companies may pay the intermediary for the sale of Fund shares and related services. These payments may create a conflict of interest by influencing the broker-dealer or other financial intermediary and your salesperson to recommend the Fund over another investment. Ask your salesperson or visit your financial intermediary’s website for more information.
TOUCHSTONE MERGER ARBITRAGE FUND SUMMARY
The Fund’s Investment Goal
The Touchstone Merger Arbitrage Fund (the “Fund”) seeks to achieve positive absolute returns regardless of market conditions over the long-term.
The Fund’s Fees and Expenses
This table describes the fees and expenses that you may pay if you buy and hold shares of the Fund. You may qualify for sales charge discounts for Class A shares if you and your family invest, or agree to invest in the future, at least $50,000 or more in the Touchstone Funds. More information about these and other discounts is available from your financial professional and in the section entitled “Choosing a Class of Shares” in the Fund’s prospectus on page 89 and in the Fund’s Statement of Additional Information (“SAI”) on page 80.
| | | | | | | | | | | | Institutional |
| | | Class A | | Class C | | Class Y | | Class |
| Shareholder Fees (fees paid directly from your investment) | | | | | | | | | | | | | | | | |
| Maximum Sales Charge (Load) Imposed on Purchases (as a percentage of offering price) | | | 5.75 | % | | | None | | | | None | | | | None | |
| Maximum Deferred Sales Charge (Load) (as a percentage of original purchase price or the amount redeemed, whichever is less) | | | None | | | | 1.00 | % | | | None | | | | None | |
| Wire Redemption Fee | | | Up to $15 | | | | Up to $15 | | | | Up to $15 | | | | Up to $15 | |
| Annual Fund Operating Expenses (expenses that you pay each year as a percentage of the value of your investment) | | | | | | | | | | | | | | | | |
| Management Fees | | | 1.05 | % | | | 1.05 | % | | | 1.05 | % | | | 1.05 | % |
| Distribution and/or Shareholder Service (12b-1) Fees | | | 0.25 | % | | | 1.00 | % | | | None | | | | None | |
| Other Expenses | | | | | | | | | | | | | | | | |
| Dividend and Interest Expenses on Securities Sold Short | | | 0.84 | % | | | 0.84 | % | | | 0.84 | % | | | 0.84 | % |
| Other Operating Expenses | | | 0.41 | % | | | 0.39 | % | | | 0.32 | % | | | 0.23 | % |
| Total Other Expenses | | | 1.25 | % | | | 1.23 | % | | | 1.16 | % | | | 1.07 | % |
| Acquired Fund Fees and Expenses (AFFE) | | | 0.06 | % | | | 0.06 | % | | | 0.06 | % | | | 0.06 | % |
| Total Annual Fund Operating Expenses(1) | | | 2.61 | % | | | 3.34 | % | | | 2.27 | % | | | 2.18 | % |
| Fee Waiver or Expense Reimbursement(2) | | | (0.03 | )% | | | (0.01 | )% | | | 0.00 | % | | | 0.00 | % |
| Total Annual Fund Operating Expenses After Fee Waiver or Expense Reimbursement(2) | | | 2.58 | % | | | 3.33 | % | | | 2.27 | % | | | 2.18 | % |
(1)Total Annual Fund Operating Expenses have been restated to reflect Acquired Fund Fees and Expenses and will differ from the ratio of expenses to average net assets that is included in the Fund’s annual report for the fiscal year ended September 30, 2016.
(2)Touchstone Advisors, Inc. (the “Advisor” or “Touchstone Advisors”) and Touchstone Funds Group Trust (the “Trust”) have entered into a contractual expense limitation agreement whereby Touchstone Advisors will waive a portion of its fees or reimburse certain Fund expenses (excluding dividend and interest expenses relating to short sales; interest; taxes; brokerage commissions and other transaction costs; portfolio transactions and investment related expenses; other expenditures which are capitalized in accordance with U.S. generally accepted accounting principles; the cost of “Acquired Fund Fees and Expenses,” if any; and other extraordinary expenses not incurred in the ordinary course of business) in order to limit annual Fund operating expenses to 1.68%, 2.43%, 1.43%, and 1.28% of average daily net assets for Classes A, C, Y and Institutional Class shares, respectively. This contractual expense limitation is effective through January 29, 2018, but can be terminated by a vote of the Board of Trustees of the Trust (the “Board”) if it deems the termination to be beneficial to the Fund’s shareholders. The terms of the contractual expense limitation agreement provide that Touchstone Advisors is entitled to recoup, subject to approval by the Board, such amounts waived or reimbursed for a period of up to three years from the year in which Touchstone Advisors reduced its compensation or assumed expenses for the Fund. No recoupment will occur unless the Fund’s expenses are below the lesser of the expense limitation amount in effect (a) at the time of the waiver, or (b) at the time of the reimbursement.
Example. This example is intended to help you compare the cost of investing in the Fund with the cost of investing in other mutual funds. The example assumes that you invest $10,000 in the Fund for the time periods indicated and then, except as indicated, redeem all of your shares at the end of those periods. The example also assumes that your investment has a 5% return each year and that the Fund’s operating expenses remain the same and that all fee waivers or expense limits for the Fund will expire after one year. Although your actual costs may be higher or lower, based on these assumptions your costs would be:
| | | Assuming Redemption at End of Period | | | Assuming No Redemption | |
| | | | | | | | | | | | Institutional | | | | |
| | | Class A | | | Class C | | | Class Y | | | Class | | | Class C | |
| 1 Year | | $ | 821 | | | $ | 436 | | | $ | 230 | | | $ | 221 | | | $ | 336 | |
| 3 Years | | $ | 1,337 | | | $ | 1,026 | | | $ | 709 | | | $ | 682 | | | $ | 1,026 | |
| 5 Years | | $ | 1,878 | | | $ | 1,740 | | | $ | 1,215 | | | $ | 1,169 | | | $ | 1,740 | |
| 10 Years | | $ | 3,348 | | | $ | 3,630 | | | $ | 2,605 | | | $ | 2,513 | | | $ | 3,630 | |
Portfolio Turnover. The Fund pays transaction costs, such as brokerage commissions, when it buys and sells securities (or “turns over” its portfolio). A higher portfolio turnover rate may indicate higher transaction costs and may result in higher taxes when Fund shares are held in a taxable account. These costs, which are not reflected in annual fund operating expenses or in the example, affect the Fund’s performance. During the most recent fiscal year, the Fund’s portfolio turnover rate was 400% of the average value of its portfolio.
The Fund’s Principal Investment Strategies
The Fund primarily invests, under normal market conditions, in equity securities of U.S. and foreign issuers. This is a non-fundamental investment policy that the Fund can change upon 60 days’ prior notice to shareholders. Equity securities include common stock, preferred stock, and warrants.
The Fund’s sub-advisor, Longfellow Investment Management Co., seeks to purchase companies that are involved in publicly announced mergers, takeovers, tender offers, debt restructurings, minority purchases, leveraged buyouts, spin-offs, liquidations, and other corporate reorganizations. Merger arbitrage is an investment strategy designed to profit from the successful completion of such transactions. The Fund is permitted to hold long and short equity positions, foreign securities including foreign depositary receipts and restricted securities including Rule 144A securities (securities issued pursuant to Rule 144A of the Securities Act of 1933). The Fund may invest in companies of any size in seeking to achieve its investment goal and the Fund will regularly invest in small to medium capitalization companies.
The Fund may engage in active and frequent trading of portfolio securities as part of its principal investment strategy.
Dependent upon the level of corporate restructuring activity, the market, or other conditions and as determined by Longfellow, the Fund may invest in any combination of cash, cash equivalents and/or fixed-income securities, including investment-grade corporate bonds, non-investment-grade debt securities (also known as junk bonds), and convertible bonds. The Fund may also gain exposure to fixed-income securities through investments in other registered investment companies, specifically closed-end funds.
The Fund is non-diversified and may invest a significant percentage of its assets in the securities of a single company.
The Fund’s Principal Risks
The Fund’s share price will fluctuate. You could lose money on your investment in the Fund and the Fund could also return less than other investments. Investments in the Fund are not bank guaranteed, are not deposits, and are not insured by the FDIC or any other federal government agency.
This Fund should only be purchased by investors seeking positive absolute returns who can withstand the share price volatility of merger arbitrage investing. As with any mutual fund, there is no guarantee that the Fund will achieve its investment goal. You can find more information about the Fund’s investments and risks under the “Principal Investment Strategies and Risks” section of the Fund’s prospectus. The Fund is subject to the principal risks summarized below.
Convertible Securities Risk: Convertible securities are subject to the risks of both debt securities and equity securities. The values of convertible securities tend to decline as interest rates rise and, due to the conversion feature, tend to vary with fluctuations in the market value of the underlying security.
Equity Securities Risk: The Fund is subject to the risk that stock prices will fall (or rise with respect to short positions) over short or extended periods of time. Individual companies may report poor results or be negatively affected by industry and/or economic trends and developments. The prices of securities issued by these companies may decline in response to such developments, which could result in a decline in the value of the Fund’s shares.
| | • | Large-Cap Risk: Large-cap companies may be unable to respond quickly to new competitive challenges, such as changes in technology and consumer tastes, and also may not be able to attain the high growth rate of successful smaller companies, especially during extended periods of economic expansion. |
| | | |
| | • | Mid-Cap Risk: Stocks of mid-sized companies may be subject to more abrupt or erratic market movements than stocks of larger, more established companies. Mid-sized companies may have limited product lines or financial resources, and may be dependent upon a particular niche of the market. |
| | | |
| | • | Small-Cap Risk: Stocks of smaller companies may be subject to more abrupt or erratic market movements than stocks of larger, more established companies. Small companies may have limited product lines or financial resources, and may be dependent upon a small or inexperienced management group. |
Fixed-Income Risk: The market values of the Fund’s fixed-income securities respond to economic developments, particularly interest rate changes, as well as to perceptions about the creditworthiness of individual issuers, including governments. Generally, the Fund’s fixed-income securities will decrease in value if interest rates rise and increase in value if interest rates fall. Normally, the longer the maturity or duration of the fixed-income securities the Fund owns, the more sensitive the value of the Fund’s shares will be to changes in interest rates.
| | • | Credit Risk: The fixed-income securities in the Fund’s portfolio are subject to the possibility that a deterioration, whether sudden or gradual, in the financial condition of an issuer, or a deterioration in general economic conditions, could cause an issuer to fail to make timely payments of principal or interest, when due. This may cause the issuer’s securities to decline in value. |
| | | |
| | • | Interest Rate Risk: In general, when interest rates rise, the prices of debt securities fall, and when interest rates fall, the prices of debt securities rise. The price volatility of a debt security also depends on its maturity. Longer-term securities are generally more volatile, so the longer the average maturity or duration of these securities, the greater their price risk. |
| | | |
| | • | Non-Investment-Grade Debt Securities Risk: Non-investment-grade debt securities are sometimes referred to as “junk bonds” and are considered speculative with respect to their issuers’ ability to make payments of interest and principal. There is a high risk that the Fund could suffer a loss from investments in non-investment-grade debt securities caused by the default of an issuer of such securities. Non-investment-grade debt securities may also be less liquid than investment- grade debt securities. |
Foreign Securities Risk: Investing in foreign securities poses additional risks since political and economic events unique in a country or region will affect those markets and their issuers, while such events may not necessarily affect the U.S. economy or issuers located in the United States. In addition, investments in foreign securities are generally denominated in foreign currency. As a result, changes in the value of those currencies compared to the U.S. dollar may affect the value of the Fund’s investments. Foreign markets may be less liquid and more volatile than U.S. markets and offer less protection to investors.
| | • | Depositary Receipts Risk: Foreign receipts, which include American Depository Receipts (“ADRs”), Global Depositary Receipts and European Depositary Receipts, are securities that evidence ownership interests in a security or a pool of securities issued by a foreign issuer. The risks of depositary receipts include many risks associated with investing directly in foreign securities. |
Management Risk: In managing the Fund’s portfolio, the Advisor engages one or more sub-advisors to make investment decisions for a portion of or the entire portfolio. There is a risk that the Advisor may be unable to identify and retain sub-advisors who achieve superior investment returns relative to other similar sub-advisors.
Merger Arbitrage Risk: Investments in companies that are expected to be, or already are, the subject of a publicly announced transaction carry the risk that the proposed or expected transaction may not be completed or may be completed on less favorable terms than originally expected.
Non-Diversification Risk: The Fund is non-diversified, which means that it may invest a greater percentage of its assets than a diversified mutual fund in the securities of a limited number of issuers. The use of a non-diversified investment strategy may increase the volatility of the Fund’s investment performance, as the Fund may be more susceptible to risks associated with a single economic, political or regulatory event than a diversified fund.
Other Investment Companies Risk: The Fund’s investments in other investment companies will be subject to substantially the same risks as those associated with the direct ownership of the securities comprising the portfolios of such investment companies, and the value of the Fund’s investment will fluctuate in response to the performance of such portfolios. In addition, if the Fund acquires shares of investment companies, shareholders of the Fund will bear their proportionate share of the fees and expenses of the Fund and, indirectly, the fees and expenses of the investment companies.
Portfolio Turnover Risk: Frequent and active trading may result in greater expenses to the Fund, which may lower the Fund’s performance and may result in the realization of substantial capital gains, including net short-term capital gains. As a result, high portfolio turnover may reduce the Fund’s returns.
Preferred Stock Risk: Preferred stock represents an equity or ownership interest in an issuer that pays dividends at a specified rate and that has precedence over common stock in the payment of dividends. In the event an issuer is liquidated or declares bankruptcy, the claims of owners of bonds take precedence over the claims of those who own preferred and common stock. If interest rates rise, the fixed dividend on preferred stocks may be less attractive, causing the price of preferred stocks to decline.
Rule 144A Securities Risk: Rule 144A securities are restricted securities that may be purchased only by qualified institutional buyers in reliance on an exemption from federal registration requirements. Investing in Rule 144A securities may reduce the liquidity of the Fund’s portfolio if an adequate institutional trading market for these securities does not exist. The Fund may be unable to sell Rule 144A securities at advantageous prices or times, or at all, if an insufficient number of qualified institutional buyers is interested in purchasing such securities. Prices of Rule 144A securities often reflect a discount, which may be significant, from the market price of comparable exchange-listed securities for which a liquid trading market exists.
Short Sale Risk: In a short sale, the Fund sells a security or other financial instrument, such as a futures contract, that it does not own. To complete the transaction, the Fund must borrow the security to make delivery to the buyer. The Fund is then obligated to replace the borrowed security by purchasing the security at the market price at the time of replacement. If the price of the security sold short rises between the time the Fund sells the security short and the time the Fund replaces the security sold short, the Fund will realize a loss on the transaction.
The Fund’s Performance
The bar chart and performance table below illustrate some indication of the risks and volatility of investing in the Fund by showing changes in the Fund’s performance from year to year and by showing how the Fund’s average annual total returns for one year and since inception compare with the BofA Merrill Lynch 3-Month U.S. Treasury Bill Index. The bar chart does not reflect any sales charges, which would reduce your return. The performance table does reflect any applicable sales charges. The Fund’s past performance (before and after taxes) does not necessarily indicate how the Fund will perform in the future. More recent performance is available at no cost by visiting TouchstoneInvestments.com or by calling 1.800.543.0407.
Touchstone Merger Arbitrage Fund — Class A Total Return as of December 31
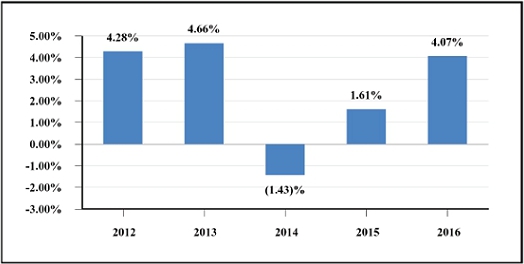
| Best Quarter: First Quarter 2012 2.14% | Worst Quarter: Second Quarter 2014 (1.22)% |
After-tax returns are calculated using the historical highest individual federal marginal income tax rates and do not reflect the impact of state and local taxes. Your actual after-tax returns may differ from those shown and depend on your tax situation. The after-tax returns do not apply to shares held in an individual retirement account (“IRA”), 401(k), or other tax-advantaged account. The after-tax returns shown in the table are for Class A shares only. The after-tax returns for other classes of shares offered by the Fund will differ from the Class A shares after-tax returns.
Average Annual Total Returns
For the periods ended December 31, 2016
| | | | | | Since Inception |
| | 1 Year | | 5 Years | | (8-09-11) |
| Touchstone Merger Arbitrage Fund — Class A | | | | | |
| Return Before Taxes | (1.88)% | | 1.40% | | 1.89% |
| Return After Taxes on Distributions | (3.02)% | | 0.83% | | 1.35% |
| Return After Taxes on Distributions and Sale of Fund Shares | (0.97)% | | 0.87% | | 1.26% |
| Touchstone Merger Arbitrage Fund — Class C | | | | | |
| Return Before Taxes | 2.24% | | 1.79% | | 2.18% |
| Touchstone Merger Arbitrage Fund — Class Y | | | | | |
| Return Before Taxes | 4.41% | | 2.88% | | 3.27% |
| Touchstone Merger Arbitrage Fund — Institutional Class | | | | | |
| Return Before Taxes | 4.48% | | 2.94% | | 3.35% |
| BofA Merrill Lynch 3-Month U.S. Treasury Bill Index (reflects no deductions for fees, expenses or taxes) | 0.33% | | 0.12% | | 0.11% |
The Fund’s Management
Investment Advisor
Touchstone Advisors, Inc.
| | | | | Investment Experience | | Primary Title with |
| Sub-Advisor | | Portfolio Managers | | with the Fund | | Sub-Advisor |
| Longfellow Investment Management Co. | | Barbara J. McKenna, CFA | | Managing the Fund since its inception in 2011 | | Managing Principal and Portfolio Manager |
| | | | | | | |
| | | David C. Stuehr, CFA | | Managing the Fund since 2014 | | Principal and Portfolio Manager |
| | | | | | | |
| | | Andrew G. Bail | | Managing the Fund since 2017 | | Portfolio Manager and Senior Analyst |
| | | | | | | |
| | | Alexander R. Graham, CAIA | | Managing the Fund since its inception in 2011 | | Portfolio Manager and Senior Analyst |
Buying and Selling Fund Shares
Minimum Investment Requirements
| | Classes A, C, and Y | |
| | | Initial | | | Additional | |
| | | Investment | | | Investment | |
| Regular Account | $ | 2,500 | | $ | 50 | |
| Retirement Account or Custodial Account under the Uniform Gifts/Transfers to Minors Act | $ | 1,000 | | $ | 50 | |
| Investments through the Automatic Investment Plan | $ | 100 | | $ | 50 | |
| | Institutional Class | |
| | | Initial | | | Additional | |
| | | Investment | | | Investment | |
| Regular Account | $ | 500,000 | | $ | 50 | |
You may buy and sell shares in the Fund on a day when the New York Stock Exchange is open for trading. Class A and C shares may be purchased and sold directly through Touchstone Securities, Inc. (“Touchstone Securities”) or through your financial intermediary. Class Y shares are available only through financial intermediaries who have appropriate selling agreements in place with Touchstone Securities. Institutional Class shares are available through Touchstone Securities or your financial intermediary. Shares may be purchased or sold by writing to Touchstone Securities at P.O. Box 9878, Providence, Rhode Island 02940, calling 1.800.543.0407, or visiting the Touchstone Funds’ website: TouchstoneInvestments.com. You may only sell shares over the telephone or via the Internet if the value of the shares sold is less than or equal to $100,000. Shares held in IRAs and qualified retirement plans cannot be sold by telephone or via the Internet. If your shares are held by a processing organization or financial intermediary you will need to follow its purchase and redemption procedures. For more information about buying and selling shares, see the section “Investing with Touchstone” of the Fund’s prospectus or call 1.800.543.0407.
Tax Information
The Fund intends to pay dividends and make distributions that may be taxed as ordinary income or capital gains, except when shares are held through a tax-advantaged account, such as a 401(k) plan or an IRA. Withdrawals from a tax-advantaged account, however, may be taxable.
Financial Intermediary Compensation
If you purchase shares in the Fund through a broker-dealer or other financial intermediary (such as a bank), the Fund and its related companies may pay the intermediary for the sale of Fund shares and related services. These payments may create a conflict of interest by influencing the broker-dealer or other financial intermediary and your salesperson to recommend the Fund over another investment. Ask your salesperson or visit your financial intermediary’s website for more information.
TOUCHSTONE MID CAP FUND SUMMARY
The Fund’s Investment Goal
The Touchstone Mid Cap Fund (the “Fund”) seeks long-term capital growth.
The Fund’s Fees and Expenses
This table describes the fees and expenses that you may pay if you buy and hold shares of the Fund. You may qualify for sales charge discounts for Class A shares if you and your family invest, or agree to invest in the future, at least $50,000 or more in the Touchstone Funds. More information about these and other discounts is available from your financial professional and in the section entitled “Choosing a Class of Shares” in the Fund’s prospectus on page 89 and in the Fund’s Statement of Additional Information (“SAI”) on page 80.
| | Class A | | Class C | | Class Y | | Class Z | | Institutional
Class |
| Shareholder Fees (fees paid directly from your investment) | | | | | | | | | | | | | | |
| Maximum Sales Charge (Load) Imposed on Purchases (as a percentage of offering price) | 5.75 | % | | None | | | None | | | None | | | None | |
| Maximum Deferred Sales Charge (Load) (as a percentage of original purchase price or the amount redeemed, whichever is less) | None | | | 1.00 | % | | None | | | None | | | None | |
| Wire Redemption Fee | Up to $15 | | | Up to $15 | | | Up to $15 | | | Up to $15 | | | Up to $15 | |
| Annual Fund Operating Expenses (expenses that you pay each year as a percentage of the value of your investment) | | | | | | | | | | | | | | |
| Management Fees | 0.79 | % | | 0.79 | % | | 0.79 | % | | 0.79 | % | | 0.79 | % |
| Distribution and/or Shareholder Service (12b-1) Fees | 0.25 | % | | 1.00 | % | | None | | | 0.25 | % | | None | |
| Other Expenses | 0.31 | % | | 0.34 | % | | 0.28 | % | | 0.42 | % | | 0.20 | % |
| Total Annual Fund Operating Expenses | 1.35 | % | | 2.13 | % | | 1.07 | % | | 1.46 | % | | 0.99 | % |
| Fee Waiver and/or Expense Reimbursement(1) | (0.11 | )% | | (0.14 | )% | | (0.08 | )% | | (0.22 | )% | | (0.07 | )% |
| Total Annual Fund Operating Expenses After Fee Waiver and/or Expense Reimbursement(1) | 1.24 | % | | 1.99 | % | | 0.99 | % | | 1.24 | % | | 0.92 | % |
(1)Touchstone Advisors, Inc. (the “Advisor” or “Touchstone Advisors”) and Touchstone Funds Group Trust (the “Trust”) have entered into a contractual expense limitation agreement whereby Touchstone Advisors will waive a portion of its fees or reimburse certain Fund expenses (excluding dividend and interest expenses relating to short sales; interest; taxes; brokerage commissions and other transaction costs; portfolio transactions and investment related expenses; other expenditures which are capitalized in accordance with U.S. generally accepted accounting principles; the cost of “Acquired Fund Fees and Expenses,” if any; and other extraordinary expenses not incurred in the ordinary course of business) in order to limit annual Fund operating expenses to 1.24%, 1.99%, 0.99%, 1.24%, and 0.92% of average daily net assets for Classes A, C, Y, Z and Institutional Class shares, respectively. This contractual expense limitation is effective through January 29, 2018, but can be terminated by a vote of the Board of Trustees of the Trust (the “Board”) if it deems the termination to be beneficial to the Fund’s shareholders. The terms of the contractual expense limitation agreement provide that Touchstone Advisors is entitled to recoup, subject to approval by the Board, such amounts waived or reimbursed for a period of up to three years from the year in which Touchstone Advisors reduced its compensation or assumed expenses for the Fund. No recoupment will occur unless the Fund’s expenses are below the lesser of the expense limitation amount in effect (a) at the time of the waiver, or (b) at the time of the reimbursement.
Example. This example is intended to help you compare the cost of investing in the Fund with the cost of investing in other mutual funds. The example assumes that you invest $10,000 in the Fund for the time periods indicated and then, except as indicated, redeem all of your shares at the end of those periods. The example also assumes that your investment has a 5% return each year and that the Fund’s operating expenses remain the same and that all fee waivers or expense limits for the Fund will expire after one year. Although your actual costs may be higher or lower, based on these assumptions your costs would be:
| | | Assuming Redemption at End of Period | | Assuming No Redemption | |
| | | Class A | | Class C | | Class Y | | Class Z | | Institutional Class | | Class C | |
| 1 Year | | $ | 694 | | $ | 302 | | $ | 101 | | $ | 126 | | $ | 94 | | $ | 202 | |
| 3 Years | | $ | 968 | | $ | 654 | | $ | 332 | | $ | 440 | | $ | 308 | | $ | 654 | |
| 5 Years | | $ | 1,262 | | $ | 1,131 | | $ | 582 | | $ | 777 | | $ | 540 | | $ | 1,131 | |
| 10 Years | | $ | 2,096 | | $ | 2,451 | | $ | 1,298 | | $ | 1,727 | | $ | 1,207 | | $ | 2,451 | |
Portfolio Turnover. The Fund pays transaction costs, such as brokerage commissions, when it buys and sells securities (or “turns over” its portfolio). A higher portfolio turnover rate may indicate higher transaction costs and may result in higher taxes when Fund shares are held in a taxable account. These costs, which are not reflected in annual fund operating expenses or in the example, affect the Fund’s performance. During the most recent fiscal year, the Fund’s portfolio turnover rate was 19% of the average value of its portfolio.
The Fund’s Principal Investment Strategies
The Fund invests, under normal market conditions, at least 80% of its assets in common stocks of medium capitalization U.S. listed companies. This is a non-fundamental investment policy that can be changed by the Fund upon 60 days’ prior notice to shareholders. For purposes of the Fund, a medium capitalization company has a market capitalization found within the range of market capitalization represented in the Russell Midcap® Index (between $643 million to $57.53 billion as of December 31, 2016) at the time of purchase. The size of the companies in the Russell Midcap® Index will change with market conditions.
The Fund’s sub-advisor, London Company of Virginia d/b/a/ The London Company (“The London Company” or “Sub-Advisor”) seeks to purchase financially stable mid-cap companies that The London Company believes are consistently generating high returns on unleveraged operating capital, run by shareholder-oriented management, and trading at a discount to their respective market prices. Guiding principles of The London Company’s mid-cap philosophy include (1) a focus on cash return on tangible capital, not earnings per share, (2) balance sheet optimization, (3) optimal diversification is essential to good investment results, and (4) low turnover and tax sensitivity enhances real returns.
The Fund will typically hold securities of approximately 30 to 40 companies. The London Company invests for the long term and attempts to minimize turnover in an effort to reduce transaction costs and taxes.
The Fund’s Principal Risks
The Fund’s share price will fluctuate. You could lose money on your investment in the Fund and the Fund could also return less than other investments. Investments in the Fund are not bank guaranteed, are not deposits, and are not insured by the FDIC or any other federal government agency.
This Fund should only be purchased by investors seeking long-term capital growth who can withstand the share price volatility of mid-sized company investing. As with any mutual fund, there is no guarantee that the Fund will achieve its investment goal. You can find more information about the Fund’s investments and risks under the “Principal Investment Strategies and Risks” section of the Fund’s prospectus. The Fund is subject to the principal risks summarized below.
Equity Securities Risk: The Fund is subject to the risk that stock prices will fall over short or extended periods of time. Individual companies may report poor results or be negatively affected by industry and/or economic trends and developments. The prices of securities issued by these companies may decline in response to such developments, which could result in a decline in the value of the Fund’s shares.
| • | Mid-Cap Risk: Stocks of mid-sized companies may be subject to more abrupt or erratic market movements than stocks of larger, more established companies. Mid-sized companies may have limited product lines or financial resources, and may be dependent upon a particular niche of the market. |
Management Risk: In managing the Fund’s portfolio, the Advisor engages one or more sub-advisors to make investment decisions for a portion of or the entire portfolio. There is a risk that the Advisor may be unable to identify and retain sub-advisors who achieve superior investment returns relative to other similar sub-advisors.
The Fund’s Performance
The bar chart and performance table below illustrate some indication of the risks and volatility of investing in the Fund by showing changes in the Fund’s performance from year to year and by showing how the Fund’s average annual total returns for one year, five years, and ten years compare with the Russell Midcap® Index. The bar chart does not reflect any sales charges, which would reduce your return. The performance table does reflect any applicable sales charges. The Fund’s past performance (before and after taxes) does not necessarily indicate how the Fund will perform in the future. More recent performance is available at no cost by visiting TouchstoneInvestments.com or by calling 1.800.543.0407.
Touchstone Mid Cap Fund - Class Y Total Return as of December 31
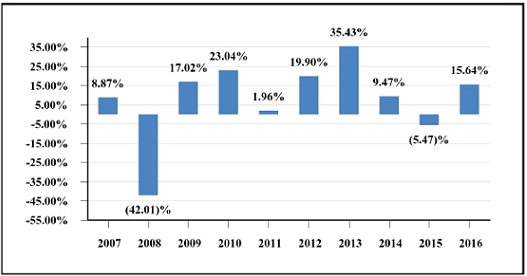
| Best Quarter: Third Quarter 2009 19.68% | Worst Quarter: Fourth Quarter 2008 (23.35)% |
After-tax returns are calculated using the historical highest individual federal marginal income tax rates and do not reflect the impact of state and local taxes. Your actual after-tax returns may differ from those shown and depend on your tax situation. The after-tax returns do not apply to shares held in an individual retirement account (“IRA”), 401(k), or other tax-advantaged account. The after-tax returns shown in the table are for Class Y shares only. The after-tax returns for other classes of shares offered by the Fund will differ from the Class Y shares after-tax returns.
The inception dates of Class A shares, Class C shares, Class Y shares, Class Z shares and Institutional Class shares were May 14, 2007, May 14, 2007, January 2, 2003, April 24, 2006 and January 27, 2012, respectively. Class A shares, Class C shares and Institutional Class shares performance was calculated using the historical performance of Class Y shares for the periods prior to May 14, 2007, May 14, 2007 and January 27, 2012, respectively. Performance for these periods has been restated to reflect the impact of the fees and expenses applicable to Class A, Class C and Institutional Class shares.
For information on the prior history of the Fund, please see the section entitled “The Trust” in the Fund’s SAI.
Average Annual Total Returns
For the periods ended December 31, 2016
| | 1 Year | | 5 Years | | 10 Years |
| Touchstone Mid Cap Fund — Class Y | | | | | |
| Return Before Taxes | 15.64% | | 14.21% | | 6.06% |
| Return After Taxes on Distributions | 15.48% | | 14.09% | | 5.93% |
| Return After Taxes on Distributions and Sale of Fund Shares | 8.98% | | 11.44% | | 4.85% |
| Touchstone Mid Cap Fund — Class A | | | | | |
| Return Before Taxes | 8.72% | | 12.58% | | 5.23% |
| Touchstone Mid Cap Fund — Class C | | | | | |
| Return Before Taxes | 13.50% | | 13.06% | | 5.16% |
| Touchstone Mid Cap Fund — Class Z | | | | | |
| Return Before Taxes | 15.37% | | 13.90% | | 5.78% |
| Touchstone Mid Cap Fund — Institutional Class | | | | | |
| Return Before Taxes | 15.71% | | 14.28% | | 6.09% |
| Russell Midcap® Index (reflects no deductions for fees, expenses or taxes) | 13.80% | | 14.72% | | 7.86% |
The Fund’s Management
Investment Advisor
Touchstone Advisors, Inc.
| Sub-Advisor | | Portfolio
Managers | | Investment Experience
with the Fund | | Primary Title with
Sub-Advisor |
| London Company of Virginia d/b/a/ The London Company | | Stephen Goddard, CFA | | Managing the Fund since 2011 | | President, CIO and Lead Portfolio Manager |
| | | | | | | |
| | | Jonathan Moody, CFA | | Managing the Fund since 2011 | | Principal and Portfolio Manager |
| | | | | | | |
| | | J. Brian Campbell, CFA | | Managing the Fund since 2011 | | Portfolio Manager |
| | | | | | | |
| | | Mark E. DeVaul, CFA, CPA | | Managing the Fund since 2011 | | Portfolio Manager |
Buying and Selling Fund Shares
Minimum Investment Requirements
| | Classes A, C, Y, and Z | |
| | Initial | | Additional | |
| | Investment | | Investment | |
| Regular Account | $ | 2,500 | | $ | 50 | |
| Retirement Account or Custodial Account under the Uniform Gifts/Transfers to Minors Act | $ | 1,000 | | $ | 50 | |
| Investments through the Automatic Investment Plan | $ | 100 | | $ | 50 | |
| | Institutional Class | |
| | Initial | | Additional | |
| | Investment | | Investment | |
| Regular Account | $ | 500,000 | | $ | 50 | |
You may buy and sell shares in the Fund on a day when the New York Stock Exchange is open for trading. Class A and C shares may be purchased and sold directly from Touchstone Securities, Inc. (“Touchstone Securities”) or through your financial intermediary. Class Y shares are available only through financial institutions and financial intermediaries who have appropriate selling agreements in place with Touchstone Securities. Class Z shares are available only through a financial intermediary or
financial institutions such as retirement plans, fee based platforms and brokerage accounts. Institutional Class shares are available through Touchstone Securities or your financial institution. Shares may be purchased or sold by writing to Touchstone Securities at P.O. Box 9878, Providence, Rhode Island 02940, calling 1.800.543.0407, or visiting the Touchstone Funds’ website: TouchstoneInvestments.com. You may only sell shares over the telephone or via the Internet if the value of the shares sold is less than or equal to $100,000. Shares held in IRAs and qualified retirement plans cannot be sold by telephone or via the Internet. If your shares are held by a processing organization or financial intermediary you will need to follow its purchase and redemption procedures. For more information about buying and selling shares see the section “Investing with Touchstone” of the Fund’s prospectus or call 1.800.543.0407.
Tax Information
The Fund intends to pay dividends and make distributions that may be taxed as ordinary income or capital gains except when shares are held through a tax-advantaged account, such as a 401(k) plan or an IRA. Withdrawals from a tax-advantaged account, however, may be taxable.
Financial Intermediary Compensation
If you purchase shares in the Fund through a broker-dealer or other financial intermediary (such as a bank), the Fund and its related companies may pay the intermediary for the sale of Fund shares and related services. These payments may create a conflict of interest by influencing the broker-dealer or other financial intermediary and your salesperson to recommend the Fund over another investment. Ask your salesperson or visit your financial intermediary’s website for more information.
TOUCHSTONE MID CAP VALUE FUND SUMMARY
The Fund’s Investment Goal
The Touchstone Mid Cap Value Fund (the “Fund”) seeks capital appreciation.
The Fund’s Fees and Expenses
This table describes the fees and expenses that you may pay if you buy and hold shares of the Fund. You may qualify for sales charge discounts for Class A shares if you and your family invest, or agree to invest in the future, at least $50,000 or more in the Touchstone Funds. More information about these and other discounts is available from your financial professional and in the section entitled “Choosing a Class of Shares” in the Fund’s prospectus on page 89 and in the Fund’s Statement of Additional Information (“SAI”) on page 80.
| | | | | | | | | | | Institutional |
| | Class A | | Class C | | Class Y | | Class |
| Shareholder Fees (fees paid directly from your investment) | | | | | | | | | | | |
| Maximum Sales Charge (Load) Imposed on Purchases (as a percentage of offering price) | 5.75 | % | | None | | | None | | | None | |
| Maximum Deferred Sales Charge (Load) (as a percentage of original purchase price or the amount redeemed, whichever is less) | None | | | 1.00 | % | | None | | | None | |
| Wire Redemption Fee | Up to $15 | | | Up to $15 | | | Up to $15 | | | Up to $15 | |
| Annual Fund Operating Expenses (expenses that you pay each year as a percentage of the value of your investment) | | | | | | | | | | | |
| Management Fees | 0.81 | % | | 0.81 | % | | 0.81 | % | | 0.81 | % |
| Distribution and/or Shareholder Service (12b-1) Fees | 0.25 | % | | 1.00 | % | | None | | | None | |
| Other Expenses | 0.53 | % | | 0.94 | % | | 0.32 | % | | 0.22 | % |
| Total Annual Fund Operating Expenses | 1.59 | % | | 2.75 | % | | 1.13 | % | | 1.03 | % |
| Fee Waiver and/or Expense Reimbursement(1) | (0.32 | )% | | (0.73 | )% | | (0.11 | )% | | (0.14 | )% |
| Total Annual Fund Operating Expenses After Fee Waiver and/or Expense Reimbursement(1) | 1.27 | % | | 2.02 | % | | 1.02 | % | (2) | 0.89 | % |
(1)Touchstone Advisors, Inc. (the “Advisor” or “Touchstone Advisors”) and Touchstone Funds Group Trust (the “Trust”) have entered into a contractual expense limitation agreement whereby Touchstone Advisors will waive a portion of its fees or reimburse certain Fund expenses (excluding dividend and interest expenses relating to short sales; interest; taxes; brokerage commissions and other transaction costs; portfolio transactions and investment related expenses; other expenditures which are capitalized in accordance with U.S. generally accepted accounting principles; the cost of “Acquired Fund Fees and Expenses,” if any; and other extraordinary expenses not incurred in the ordinary course of business) in order to limit annual Fund operating expenses to 1.27%, 2.02%, 1.02%, and 0.89% of average daily net assets for Classes A, C, Y and Institutional Class shares, respectively. This contractual expense limitation is effective through January 29, 2018, but can be terminated by a vote of the Board of Trustees of the Trust (the “Board”) if it deems the termination to be beneficial to the Fund’s shareholders. The terms of the contractual expense limitation agreement provide that Touchstone Advisors is entitled to recoup, subject to approval by the Board, such amounts waived or reimbursed for a period of up to three years from the year in which Touchstone Advisors reduced its compensation or assumed expenses for the Fund. No recoupment will occur unless the Fund’s expenses are below the lesser of the expense limitation amount in effect (a) at the time of the waiver, or (b) at the time of the reimbursement.
(2)Total Annual Fund Operating Expenses After Fee Waiver or Expense Reimbursement differs from the ratio of net expenses to average net assets shown in the annual report for the fiscal year ended September 30, 2016 due to a contractual change in the expense limitation agreement.
Example. This example is intended to help you compare the cost of investing in the Fund with the cost of investing in other mutual funds. The example assumes that you invest $10,000 in the Fund for the time periods indicated and then, except as indicated, redeem all of your shares at the end of those periods. The example also assumes that your investment has a 5% return each year and that the Fund’s operating expenses remain the same and that all fee waivers or expense limits for the Fund will expire after one year. Although your actual costs may be higher or lower, based on these assumptions your costs would be:
| | | | Assuming Redemption at End of Period | | | Assuming No Redemption | |
| | | | | | | | | | | | | Institutional | | | | |
| | | | | Class A | | | Class C | | | Class Y | | | Class | | | Class C | |
| 1 Year | | | | $ | 697 | | | $ | 305 | | | $ | 104 | | | $ | 91 | | | $ | 205 | |
| 3 Years | | | | $ | 1,019 | | | $ | 784 | | | $ | 348 | | | $ | 314 | | | $ | 784 | |
| 5 Years | | | | $ | 1,362 | | | $ | 1,390 | | | $ | 612 | | | $ | 555 | | | $ | 1,390 | |
| 10 Years | | | | $ | 2,330 | | | $ | 3,027 | | | $ | 1,365 | | | $ | 1,247 | | | $ | 3,027 | |
Portfolio Turnover. The Fund pays transaction costs, such as brokerage commissions, when it buys and sells securities (or “turns over” its portfolio). A higher portfolio turnover rate may indicate higher transaction costs and may result in higher taxes when Fund shares are held in a taxable account. These costs, which are not reflected in annual fund operating expenses or in the example, affect the Fund’s performance. During the most recent fiscal year, the Fund’s portfolio turnover rate was 45% of the average value of its portfolio.
The Fund’s Principal Investment Strategies
The Fund invests, under normal conditions, at least 80% of its net assets (including borrowings for investment purposes) in common stocks of medium capitalization companies. This is a non-fundamental policy that the Fund can change upon 60 days’ prior notice to shareholders. For purposes of the Fund, a medium capitalization company has a market capitalization within the range of market capitalization represented in the Russell Midcap® Index (between $643 million to $57.53 billion as of December 31, 2016) at the time of purchase. The size of the companies in the Russell Midcap Index will change with market conditions. The Fund will hold approximately 60 to 80 securities.
The Fund’s Principal Risks
The Fund’s share price will fluctuate. You could lose money on your investment in the Fund and the Fund could also return less than other investments. Investments in the Fund are not bank guaranteed, are not deposits, and are not insured by the FDIC or any other federal government agency.
This Fund should only be purchased by investors seeking capital appreciation who can withstand the share price volatility of mid cap equity investing. As with any mutual fund, there is no guarantee that the Fund will achieve its investment goal. You can find more information about the Fund’s investments and risks under the “Principal Investment Strategies and Risks” section of the Fund’s prospectus. The Fund is subject to the principal risks summarized below.
Equity Securities Risk: The Fund is subject to the risk that stock prices will fall over short or extended periods of time. Individual companies may report poor results or be negatively affected by industry and/or economic trends and developments. The prices of securities issued by these companies may decline in response to such developments, which could result in a decline in the value of the Fund’s shares.
| | • | Mid-Cap Risk: Stocks of mid-sized companies may be subject to more abrupt or erratic market movements than stocks of larger, more established companies. Mid-sized companies may have limited product lines or financial resources, and may be dependent upon a particular niche of the market. |
| | | |
Management Risk: In managing the Fund’s portfolio, the Advisor engages one or more sub-advisors to make investment decisions for a portion of or the entire portfolio. There is a risk that the Advisor may be unable to identify and retain sub-advisors who achieve superior investment returns relative to other similar sub-advisors.
Value Investing Risk: Value investing presents the risk that the Fund’s security holdings may never reach their full market value because the market fails to recognize what the portfolio managers consider the true business value or because the portfolio managers have misjudged those values. In addition, value investing may fall out of favor and underperform growth or other styles of investing during given periods.
The Fund’s Performance
The bar chart and performance table below illustrate some indication of the risks and volatility of investing in the Fund by showing changes in the Fund’s performance from year to year and by showing how the Fund’s average annual total returns for one year, five years and since inception compare with the Russell Midcap® Value Index. The bar chart does not reflect any sales charges, which would reduce your return. The performance table does reflect any applicable sales charges. The Fund’s past performance (before and after taxes) does not necessarily indicate how the Fund will perform in the future. More recent performance is available at no cost by visiting TouchstoneInvestments.com or by calling 1.800.543.0407.
Touchstone Mid Cap Value Fund — Class A Shares Total Return as of December 31
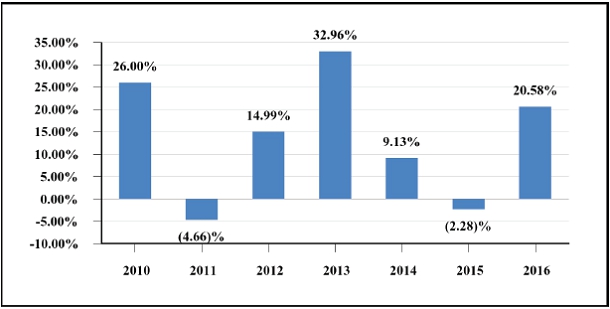
| Best Quarter: Fourth Quarter 2011 14.14% | Worst Quarter: Third Quarter 2011 (20.13)% |
After-tax returns are calculated using the historical highest individual federal marginal income tax rates and do not reflect the impact of state and local taxes. Your actual after-tax returns may differ from those shown and depend on your tax situation. The after-tax returns do not apply to shares held in an individual retirement account (“IRA”), 401(k), or other tax-advantaged account. The after-tax returns shown in the table are for Class A shares only. The after-tax returns for other classes of shares offered by the Fund will differ from the Class A shares after-tax returns.
Average Annual Total Returns
For the periods ended December 31, 2016
| | | | | | | | | Since Inception |
| | | 1 Year | | 5 Years | | (9-30-09) |
| Touchstone Mid Cap Value Fund — Class A | | | | | | | | | | | | |
| Return Before Taxes | | | 13.62 | % | | | 13.13 | % | | | 12.62 | % |
| Return After Taxes on Distributions | | | 12.43 | % | | | 11.62 | % | | | 11.21 | % |
| Return After Taxes on Distributions and Sale of Fund Shares | | | 8.47 | % | | | 10.14 | % | | | 9.89 | % |
| Touchstone Mid Cap Value Fund — Class C | | | | | | | | | | | | |
| Return Before Taxes | | | 18.68 | % | | | 13.63 | % | | | 12.70 | % |
| Touchstone Mid Cap Value Fund — Class Y | | | | | | | | | | | | |
| Return Before Taxes | | | 20.95 | % | | | 14.76 | % | | | 13.84 | % |
| Touchstone Mid Cap Value Fund — Institutional Class | | | | | | | | | | | | |
| Return Before Taxes | | | 21.03 | % | | | 14.92 | % | | | 14.00 | % |
| Russell MidCap® Value Index (reflects no deductions for fees, expenses or taxes) | | | 20.00 | % | | | 15.70 | % | | | 14.59 | % |
The Fund’s Management
Investment Advisor
Touchstone Advisors, Inc.
| | | | | Investment Experience | | Primary Title with Sub- |
| Sub-Advisor | | Portfolio Manager | | with the Fund | | Advisor |
| LMCG Investments, LLC | | R. Todd Vingers, CFA | | Managing the Fund since 2014 | | Portfolio Manager |
| | | | | | | |
| | | Jay Willadsen, CFA | | Managing the Fund since 2014 | | Portfolio Manager |
Buying and Selling Fund Shares
Minimum Investment Requirements
| | | Classes A, C, and Y | |
| | | Initial Investment | | Additional Investment | |
| Regular Account | | $ | 2,500 | | | $ | 50 | |
| Retirement Account or Custodial Account under the Uniform Gifts/Transfers to Minors Act | | $ | 1,000 | | | $ | 50 | |
| Investments through the Automatic Investment Plan | | $ | 100 | | | $ | 50 | |
| | | | | | | | | |
| | | Institutional Class | |
| | | Initial Investment | | Additional Investment | |
| Regular Account | | $ | 500,000 | | | $ | 50 | |
You may buy and sell shares in the Fund on a day when the New York Stock Exchange is open for trading. Class A and C shares may be purchased and sold directly through Touchstone Securities, Inc. (“Touchstone Securities”) or through your financial intermediary. Class Y shares are available only through financial intermediaries who have appropriate selling agreements in place with Touchstone Securities. Institutional Class shares are available through Touchstone Securities or your financial intermediary. Shares may be purchased or sold by writing to Touchstone Securities at P.O. Box 9878, Providence, Rhode Island 02940, calling 1.800.543.0407, or visiting the Touchstone Funds’ website: TouchstoneInvestments.com. You may only sell shares over the telephone or via the Internet if the value of the shares sold is less than or equal to $100,000. Shares held in IRAs and qualified retirement plans cannot be sold by telephone or via the Internet. If your shares are held by a processing organization or financial intermediary you will need to follow its purchase and redemption procedures. For more information about buying and selling shares, see the section “Investing with Touchstone” of the Fund’s prospectus or call 1.800.543.0407.
Tax Information
The Fund intends to pay dividends and make distributions that may be taxed as ordinary income or capital gains except when shares are held through a tax-advantaged account, such as a 401(k) plan or an IRA. Withdrawals from a tax-advantaged account may, however, be taxable.
Financial Intermediary Compensation
If you purchase shares in the Fund through a broker-dealer or other financial intermediary (such as a bank), the Fund and its related companies may pay the intermediary for the sale of Fund shares and related services. These payments may create a conflict of interest by influencing the broker-dealer or other financial intermediary and your salesperson to recommend the Fund over another investment. Ask your salesperson or visit your financial intermediary’s website for more information.
TOUCHSTONE PREMIUM YIELD EQUITY FUND SUMMARY
The Fund’s Investment Goal
The Touchstone Premium Yield Equity Fund (the “Fund”) seeks long-term growth of capital and high-current income.
The Fund’s Fees and Expenses
This table describes the fees and expenses that you may pay if you buy and hold shares of the Fund. You may qualify for sales charge discounts for Class A shares if you and your family invest, or agree to invest in the future, at least $50,000 or more in the Touchstone Funds. More information about these and other discounts is available from your financial professional and in the section entitled “Choosing a Class of Shares” in the Fund’s prospectus on page 89 and in the Fund’s Statement of Additional Information (“SAI”) on page 80.
| | | Class A | | Class C | | Class Y |
| Shareholder Fees (fees paid directly from your investment) | | | | | | | | | | | | |
| Maximum Sales Charge (Load) Imposed on Purchases (as a percentage of offering price) | | | 5.75 | % | | | None | | | | None | |
| Maximum Deferred Sales Charge (Load) (as a percentage of original purchase price or the amount redeemed, whichever is less) | | | None | | | | 1.00 | % | | | None | |
| Wire Redemption Fee | | | Up to $15 | | | | Up to $15 | | | | Up to $15 | |
| Annual Fund Operating Expenses (expenses that you pay each year as a percentage of the value of your investment) | | | | | | | | | | | | |
| Management Fees | | | 0.68 | % | | | 0.68 | % | | | 0.68 | % |
| Distribution and/or Shareholder Service (12b-1) Fees | | | 0.25 | % | | | 1.00 | % | | | None | |
| Other Expenses | | | 0.41 | % | | | 0.37 | % | | | 0.35 | % |
| Acquired Fund Fees and Expenses (AFFE) | | | 0.04 | % | | | 0.04 | % | | | 0.04 | % |
| Total Annual Fund Operating Expenses(1) | | | 1.38 | % | | | 2.09 | % | | | 1.07 | % |
| Fee Waiver and/or Expense Reimbursement(2) | | | (0.14 | )% | | | (0.10 | )% | | | (0.08 | )% |
| Total Annual Fund Operating Expenses After Fee Waiver and/or Expense Reimbursement(2) | | | 1.24 | % | | | 1.99 | % | | | 0.99 | % |
(1)Total Annual Fund Operating Expenses have been restated to reflect Acquired Fund Fees and Expenses and will differ from the ratio of expenses to average net assets that is included in the Fund’s annual report for the fiscal year ended September 30, 2016.
(2)Touchstone Advisors, Inc. (the “Advisor” or “Touchstone Advisors”) and Touchstone Funds Group Trust (the “Trust”) have entered into a contractual expense limitation agreement whereby Touchstone Advisors will waive a portion of its fees or reimburse certain Fund expenses (excluding dividend and interest expenses relating to short sales; interest; taxes; brokerage commissions and other transaction costs; portfolio transactions and investment related expenses; other expenditures which are capitalized in accordance with U.S. generally accepted accounting principles; the cost of “Acquired Fund Fees and Expenses,” if any; and other extraordinary expenses not incurred in the ordinary course of business) in order to limit annual Fund operating expenses to 1.20%, 1.95%, and 0.95% of average daily net assets for Classes A, C and Y shares, respectively. This contractual expense limitation is effective through January 29, 2018, but can be terminated by a vote of the Board of Trustees of the Trust (the “Board”) if it deems the termination to be beneficial to the Fund’s shareholders. The terms of the contractual expense limitation agreement provide that Touchstone Advisors is entitled to recoup, subject to approval by the Board, such amounts waived or reimbursed for a period of up to three years from the year in which Touchstone Advisors reduced its compensation or assumed expenses for the Fund. No recoupment will occur unless the Fund’s expenses are below the lesser of the expense limitation amount in effect (a) at the time of the waiver, or (b) at the time of the reimbursement.
Example. This example is intended to help you compare the cost of investing in the Fund with the cost of investing in other mutual funds. The example assumes that you invest $10,000 in the Fund for the time periods indicated and then, except as indicated, redeem all of your shares at the end of those periods. The example also assumes that your investment has a 5% return each year and that the Fund’s operating expenses remain the same and that all fee waivers or expense limits for the Fund will expire after one year. Although your actual costs may be higher or lower, based on these assumptions your costs would be:
| | | | Assuming Redemption at End of Period | | | Assuming No Redemption | |
| | | | Class A | | | Class C | | | Class Y | | | Class C | |
| 1 Year | | | | $ | 694 | | | $ | 302 | | | $ | 101 | | | $ | 202 | |
| 3 Years | | | | $ | 974 | | | $ | 645 | | | $ | 332 | | | $ | 645 | |
| 5 Years | | | | $ | 1,274 | | | $ | 1,115 | | | $ | 582 | | | $ | 1,115 | |
| 10 Years | | | | $ | 2,126 | | | $ | 2,413 | | | $ | 1,298 | | | $ | 2,413 | |
Portfolio Turnover. The Fund pays transaction costs, such as brokerage commissions, when it buys and sells securities (or “turns over” its portfolio). A higher portfolio turnover rate may indicate higher transaction costs and may result in higher taxes when Fund shares are held in a taxable account. These costs, which are not reflected in annual fund operating expenses or in the example, affect the Fund’s performance. During the most recent fiscal year, the Fund’s portfolio turnover rate was 38% of the average value of its portfolio.
The Fund’s Principal Investment Strategies
The Fund invests, under normal market conditions, at least 80% of its assets in equity securities without regard to market capitalization. This is a non-fundamental policy that can be changed by the Fund upon 60 days’ prior notice to shareholders. For purposes of the Fund, equity securities include common stock, depositary receipts, and real estate investment trusts (“REITs”). The Fund focuses on dividend-paying equity securities of U.S. companies and foreign companies that the sub-advisor, Miller/ Howard Investments Inc. (“Miller/Howard” or “Sub-Advisor”), believes possess attractive long-term return potential, primarily due to lower than average valuations and an improving business outlook. The Fund may invest up to 40% of its assets in both sponsored and unsponsored American Depositary Receipts (“ADRs”) and other depositary receipts representing interests in foreign securities, including emerging market securities.
The Sub-Advisor’s analytical process includes evaluation of a comprehensive Socially Responsible Investing (“SRI”) profile and assessment of the financial strength of the company.
The Fund’s Principal Risks
The Fund’s share price will fluctuate. You could lose money on your investment in the Fund and the Fund could also return less than other investments. Investments in the Fund are not bank guaranteed, are not deposits, and are not insured by the FDIC or any other federal government agency.
This Fund should only be purchased by investors seeking long-term growth of capital and high current income who can withstand the share price volatility of equity investing. As with any mutual fund, there is no guarantee that the Fund will achieve its investment goal. You can find more information about the Fund’s investments and risks under the “Principal Investment Strategies and Risks” section of the Fund’s prospectus. The Fund is subject to the principal risks summarized below.
Equity Securities Risk: The Fund is subject to the risk that stock prices will fall over short or extended periods of time. Individual companies may report poor results or be negatively affected by industry and/or economic trends and developments. The prices of securities issued by these companies may decline in response to such developments, which could result in a decline in the value of the Fund’s shares.
| | • | Large-Cap Risk: Large-cap companies may be unable to respond quickly to new competitive challenges, such as changes in technology and consumer tastes, and also may not be able to attain the high growth rate of successful smaller companies, especially during extended periods of economic expansion. |
| | | |
| | • | Mid-Cap Risk: Stocks of mid-sized companies may be subject to more abrupt or erratic market movements than stocks of larger, more established companies. Mid-sized companies may have limited product lines, or financial resources, and may be dependent upon a particular niche of the market. |
| | | |
| | • | Small-Cap Risk: Stocks of smaller companies may be subject to more abrupt or erratic market movements than stocks of larger, more established companies. Small companies may have limited product lines or financial resources, and may be dependent upon a small or inexperienced management group. |
| | | |
Foreign Securities Risk: Investing in foreign securities poses additional risks since political and economic events unique in a country or region will affect those markets and their issuers, while such events may not necessarily affect the U.S. economy or issuers located in the United States. In addition, investments in foreign securities are generally denominated in foreign currency.
As a result, changes in the value of those currencies compared to the U.S. dollar may affect the value of the Fund’s investments. Foreign markets may be less liquid and more volatile than U.S. markets and offer less protection to investors.
| | • | Depositary Receipts Risk: Foreign receipts, which include ADRs, Global Depositary Receipts and European Depositary Receipts, are securities that evidence ownership interests in a security or a pool of securities issued by a foreign issuer. The risks of depositary receipts include many risks associated with investing directly in foreign securities. |
| | | |
| | • | Emerging Markets Risk: Emerging markets may be more likely to experience political turmoil or rapid changes in market or economic conditions than more developed countries. In addition, the financial stability of issuers (including governments) in emerging market countries may be more precarious than that of issuers in other countries. |
Management Risk: In managing the Fund’s portfolio, the Advisor engages one or more sub-advisors to make investment decisions for a portion of or the entire portfolio. There is a risk that the Advisor may be unable to identify and retain sub-advisors who achieve superior investment returns relative to other similar sub-advisors.
REITs Risk: REITs are pooled investment vehicles that primarily invest in commercial real estate or real estate-related loans. REITs are susceptible to the risks associated with direct ownership of real estate, such as declines in property values and rental rates and increases in property taxes. REITs typically incur fees that are separate from those of the Fund.
Socially Responsible Investing Risk: The Fund’s social and environmental screening criteria may cause the Fund to forgo opportunities to buy certain securities, or forgo opportunities to gain exposure to certain industries, sectors, regions and countries. In addition, the Fund may be required to sell a security when it might otherwise be disadvantageous for it to do so.
The Fund’s Performance
The bar chart and performance table below illustrate some indication of the risks and volatility of investing in the Fund by showing changes in the Fund’s performance from year to year and by showing how the Fund’s average annual total returns for one year, five years, and since inception compare with the Russell 3000® Value Index and the Dow Jones U.S. Select Dividend Index. The bar chart does not reflect any sales charges, which would reduce your return. The performance table does reflect any applicable sales charges. The Fund’s past performance (before and after taxes) does not necessarily indicate how the Fund will perform in the future. More recent performance is available at no cost by visiting TouchstoneInvestments.com or by calling 1.800.543.0407.
Touchstone Premium Yield Equity Fund — Class A Total Return as of December 31
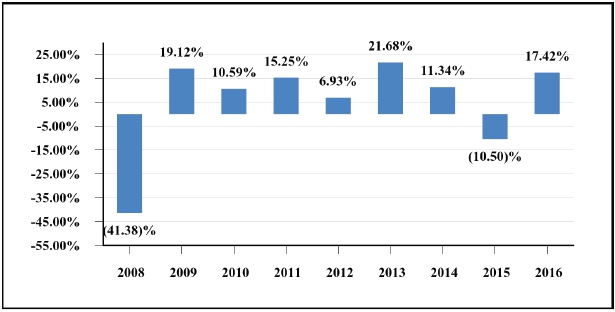
| Best Quarter: Third Quarter 2009 13.77% | Worst Quarter: Fourth Quarter 2008 (25.99)% |
For information on the prior history of the Fund, please see the section entitled “The Trust” in the Fund’s SAI.
After-tax returns are calculated using the historical highest individual federal marginal income tax rates and do not reflect the impact of state and local taxes. Your actual after-tax returns may differ from those shown and depend on your tax situation. The after-tax returns do not apply to shares held in an individual retirement account (“IRA”), 401(k), or other tax-advantaged account.
The after-tax returns shown in the table are for Class A shares only. The after-tax returns for other classes of shares offered by the Fund will differ from the Class A shares after-tax returns.
The inception dates of Class A shares, Class C shares and Class Y shares were December 3, 2007, December 3, 2007 and August 12, 2008, respectively. Class Y shares performance was calculated using the historical performance of Class A shares for the periods prior to August 12, 2008. Performance for these periods has been restated to reflect the impact of the fees and expenses applicable to Class Y shares.
Average Annual Total Returns
For the periods ended December 31, 2016
| | | | | | | | | Since Inception |
| | | 1 Year | | 5 Years | | (12-3-07) |
| Touchstone Premium Yield Equity Fund — Class A | | | | | | | | | | | | |
| Return Before Taxes | | | 10.67 | % | | | 7.50 | % | | | 2.63 | % |
| Return After Taxes on Distributions | | | 9.99 | % | | | 6.19 | % | | | 1.63 | % |
| Return After Taxes on Distributions and Sale of Fund Shares | | | 6.54 | % | | | 5.80 | % | | | 1.94 | % |
| Touchstone Premium Yield Equity Fund — Class C | | | | | | | | | | | | |
| Return Before Taxes | | | 15.56 | % | | | 7.96 | % | | | 2.54 | % |
| Touchstone Premium Yield Equity Fund — Class Y | | | | | | | | | | | | |
| Return Before Taxes | | | 17.76 | % | | | 9.03 | % | | | 3.52 | % |
| Russell 3000® Value Index (reflects no deductions for fees, expenses or taxes) | | | 18.40 | % | | | 14.81 | % | | | 6.44 | % |
| Dow Jones U.S. Select Dividend Index (reflects no deductions for fees, expenses or taxes) | | | 21.98 | % | | | 14.64 | % | | | 7.70 | % |
The Fund’s Management
Investment Advisor
Touchstone Advisors, Inc.
| | | Portfolio | | Investment Experience | | Primary Title with |
| Sub-Advisor | | Managers | | with the Fund | | Sub-Advisor |
| Miller/Howard Investments Inc. | | Lowell G. Miller | | Managing the Fund since 2008 | | Founder, Chief Investment Officer and Director of Research |
| | | | | | | |
| | | John E. Leslie III, CFA | | Managing the Fund since 2008 | | Research Analyst and Portfolio Manager |
| | | | | | | |
| | | Bryan J. Spratt, CFA | | Managing the Fund since 2008 | | Research Analyst and Portfolio Manager |
| | | | | | | |
| | | Roger G. Young, CFA | | Managing the Fund since 2009 | | Research Analyst and Portfolio Manager |
| | | | | | | |
| | | Deepak Ahuja, CFA | | Managing the Fund since 2017 | | Senior Research Analyst |
Buying and Selling Fund Shares
Minimum Investment Requirements
| | | Classes A, C, and Y | |
| | | Initial | | | Additional | |
| | | Investment | | | Investment | |
| Regular Account | | $ | 2,500 | | | $ | 50 | |
| Retirement Account or Custodial Account under the Uniform Gifts/Transfers to Minors Act | | $ | 1,000 | | | $ | 50 | |
| Investments through the Automatic Investment Plan | | $ | 100 | | | $ | 50 | |
You may buy and sell shares in the Fund on a day when the New York Stock Exchange is open for trading. Classes A and C shares may be purchased and sold directly from Touchstone Securities, Inc. (“Touchstone Securities”) or through your financial advisor. Class Y shares are available only through financial institutions and financial intermediaries who have appropriate selling agreements in place with Touchstone Securities. Shares may be purchased or sold by writing to Touchstone Securities at P.O. Box 9878, Providence, Rhode Island 02940, calling 1.800.543.0407, or visiting the Touchstone Funds’ website: TouchstoneInvestments.com. You may only sell shares over the telephone or via the Internet if the value of the shares sold is less than or equal to $100,000. Shares held in IRAs and qualified retirement plans cannot be sold by telephone or via the Internet. If your shares are held by a processing organization or financial intermediary you will need to follow its purchase and redemption procedures. For more information about buying and selling shares see the section “Investing with Touchstone” of the Fund’s prospectus or call 1.800.543.0407.
Tax Information
The Fund intends to pay dividends and make distributions that may be taxed as ordinary income or capital gains except when shares are held through a tax-advantaged account, such as a 401(k) plan or an IRA. Withdrawals from a tax-advantaged account may, however, be taxable.
Financial Intermediary Compensation
If you purchase shares in the Fund through a broker-dealer or other financial intermediary (such as a bank), the Fund and its related companies may pay the intermediary for the sale of Fund shares and related services. These payments may create a conflict of interest by influencing the broker-dealer or other financial intermediary and your salesperson to recommend the Fund over another investment. Ask your salesperson or visit your financial intermediary’s website for more information.
TOUCHSTONE SANDS CAPITAL SELECT GROWTH FUND SUMMARY
The Fund’s Investment Goal
The Touchstone Sands Capital Select Growth Fund (the “Fund”) seeks long-term capital appreciation.
The Fund’s Fees and Expenses
This table describes the fees and expenses that you may pay if you buy and hold shares of the Fund. You may qualify for sales charge discounts for Class A shares if you and your family invest, or agree to invest in the future, at least $50,000 or more in the Touchstone Funds. More information about these and other discounts is available from your financial professional and in the section entitled “Choosing a Class of Shares” in the Fund’s prospectus on page 89 and in the Fund’s Statement of Additional Information (“SAI”) on page 80.
| | | Class A | | Class C | | Class Y | | Class Z |
| Shareholder Fees (fees paid directly from your investment) | | | | | | | | | | | | |
| Maximum Sales Charge (Load) Imposed on Purchases (as a percentage of offering price) | | | 5.75 | % | | | None | | | | None | | | | None | |
| Maximum Deferred Sales Charge (Load) (as a percentage of original purchase price or the amount redeemed, whichever is less) | | | None | | | | 1.00 | % | | | None | | | | None | |
| Wire Redemption Fee | | | Up to $15 | | | | Up to $15 | | | | Up to $15 | | | | Up to $15 | |
| Annual Fund Operating Expenses (expenses that you pay each year as a percentage of the value of your investment) | | | | | | | | | | | | | | | | |
| Management Fees(1) | | | 0.57 | % | | | 0.57 | % | | | 0.57 | % | | | 0.57 | % |
| Distribution and/or Shareholder Service (12b-1) Fees | | | 0.25 | % | | | 1.00 | % | | | None | | | | 0.23 | % |
| Other Expenses | | | 0.27 | % | | | 0.27 | % | | | 0.25 | % | | | 0.31 | % |
| Total Annual Fund Operating Expenses | | | 1.09 | % | | | 1.84 | % | | | 0.82 | % | | | 1.11 | % |
| Fee Waiver and/or Expense Reimbursement(2) | | | (0.02 | )% | | | (0.02 | )% | | | 0.00 | % | | | (0.07 | )% |
| Total Annual Fund Operating Expenses After Fee Waiver and/or Expense Reimbursement(2) | | | 1.07 | % | | | 1.82 | % | | | 0.82 | % | | | 1.04 | % |
(1)The advisory fee is subject to adjustment, up or down, based on the Fund’s performance relative to the performance of the Russell 1000® Growth Index (the “Benchmark Index”), and this fee may range from 0.55% to 1.00% depending on the Fund’s performance and assets. See “The Funds’ Management” section of the Fund’s prospectus for additional information.
(2)Touchstone Advisors, Inc. (the “Advisor” or “Touchstone Advisors”) and Touchstone Funds Group Trust (the “Trust”) have entered into a contractual expense limitation agreement whereby Touchstone Advisors will waive a portion of its fees or reimburse certain Fund expenses (excluding dividend and interest expenses relating to short sales; interest; taxes; brokerage commissions and other transaction costs; portfolio transactions and investment related expenses; other expenditures which are capitalized in accordance with U.S. generally accepted accounting principles; the cost of “Acquired Fund Fees and Expenses,” if any; and other extraordinary expenses not incurred in the ordinary course of business) in order to limit “Other Expenses” to 0.25% for each class of shares. This contractual expense limitation is effective through January 29, 2018, but can be terminated by a vote of the Board of Trustees of the Trust (the “Board”) if it deems the termination to be beneficial to the Fund’s shareholders. The terms of the contractual expense limitation agreement provide that Touchstone Advisors is entitled to recoup, subject to approval by the Board, such amounts waived or reimbursed for a period of up to three years from the year in which Touchstone Advisors reduced its compensation or assumed expenses for the Fund. No recoupment will occur unless the Fund’s expenses are below the lesser of the expense limitation amount in effect (a) at the time of the waiver, or (b) at the time of the reimbursement.
Example. This example is intended to help you compare the cost of investing in the Fund with the cost of investing in other mutual funds. The example assumes that you invest $10,000 in the Fund for the time periods indicated and then, except as indicated, redeem all of your shares at the end of those periods. The example also assumes that your investment has a 5% return each year and that the Fund’s operating expenses remain the same and that all fee waivers or expense limits for the Fund will expire after one year. Although your actual costs may be higher or lower, based on these assumptions your costs would be:
| | | | Assuming Redemption at End of Period | | Assuming No Redemption | |
| | | | Class A | | | Class C | | | Class Y | | | Class Z | | | Class C | |
| 1 Year | | | | $ | 678 | | | $ | 285 | | | $ | 84 | | | $ | 106 | | | $ | 185 | |
| 3 Years | | | | $ | 900 | | | $ | 577 | | | $ | 262 | | | $ | 346 | | | $ | 577 | |
| 5 Years | | | | $ | 1,139 | | | $ | 994 | | | $ | 455 | | | $ | 605 | | | $ | 994 | |
| 10 Years | | | | $ | 1,826 | | | $ | 2,157 | | | $ | 1,014 | | | $ | 1,345 | | | $ | 2,157 | |
Portfolio Turnover. The Fund pays transaction costs, such as commissions, when it buys and sells securities (or “turns over” its portfolio). A higher portfolio turnover rate may indicate higher transaction costs and may result in higher taxes when Fund shares are held in a taxable account. These costs, which are not reflected in annual fund operating expenses or in the example, affect the Fund’s performance. During the most recent fiscal year, the Fund’s portfolio turnover rate was 46% of the average value of its portfolio.
The Fund’s Principal Investment Strategies
The Fund invests, under normal market conditions, at least 80% of its assets in common stocks of U.S. companies that the sub-advisor, Sands Capital Management, LLC, believes have above-average potential for revenue or earnings growth. This is a non-fundamental investment policy that the Fund can change upon 60 days’ prior notice to shareholders. The Fund emphasizes investments in large capitalization growth companies. The weighted-average market capitalization of these companies is generally in excess of $25 billion, and the Fund generally does not invest in companies that have a market capitalization of less than $2 billion. The Fund will typically own between 25 and 35 companies.
The Fund is non-diversified and may invest a significant percentage of its assets in the securities of a single company. The Fund may invest a high percentage of its assets in specific sectors of the market in order to achieve a potentially greater investment return.
The Fund’s Principal Risks
The Fund’s share price will fluctuate. You could lose money on your investment in the Fund and the Fund could also return less than other investments. Investments in the Fund are not bank guaranteed, are not deposits, and are not insured by the FDIC or any other federal government agency.
This Fund should only be purchased by investors seeking long-term capital appreciation who can withstand the share price volatility of concentrated, growth stock investing. As with any mutual fund, there is no guarantee that the Fund will achieve its investment goal. You can find more information about the Fund’s investments and risks under the “Principal Investment Strategies and Risks” section of the Fund’s prospectus. The Fund is subject to the principal risks summarized below.
Equity Securities Risk: The Fund is subject to the risk that stock prices will fall over short or extended periods of time. Individual companies may report poor results or be negatively affected by industry and/or economic trends and developments. The prices of securities issued by these companies may decline in response to such developments, which could result in a decline in the value of the Fund’s shares.
| | • | Large-Cap Risk: Large-cap companies may be unable to respond quickly to new competitive challenges, such as changes in technology and consumer tastes, and also may not be able to attain the high growth rate of successful smaller companies, especially during extended periods of economic expansion. |
Growth Investing Risk: Growth oriented funds may underperform when value investing is in favor and growth stocks may be more volatile than other stocks because they are more sensitive to investor perceptions of the issuing company’s growth of earnings potential.
Management Risk: In managing the Fund’s portfolio, the Advisor engages one or more sub-advisors to make investment decisions for a portion of or the entire portfolio. There is a risk that the Advisor may be unable to identify and retain sub-advisors who achieve superior investment returns relative to other similar sub-advisors.
Non-Diversification Risk: The Fund is non-diversified, which means that it may invest a greater percentage of its assets than a diversified mutual fund in the securities of a limited number of issuers. The use of a non-diversified investment strategy may increase the volatility of the Fund’s investment performance, as the Fund may be more susceptible to risks associated with a single economic, political, or regulatory event than a diversified fund.
Sector Focus Risk: The Fund may invest a high percentage of its assets in specific sectors of the market in order to achieve a potentially greater investment return. As a result, the Fund may be more susceptible to economic, political, and regulatory developments in a particular sector of the market, positive or negative than a fund that does not invest a high percentage of its assets in specific sectors.
The Fund’s Performance
The bar chart and performance table below illustrate some indication of the risks and volatility of investing in the Fund by showing changes in the Fund’s performance from year to year and by showing how the Fund’s average annual total returns for one year, five years, and ten years compare with the Russell 1000® Growth Index. The bar chart does not reflect any sales charges, which would reduce your return. The performance table does reflect any applicable sales charges. The Fund’s past performance (before and after taxes) does not necessarily indicate how the Fund will perform in the future. More recent performance is available at no cost by visiting TouchstoneInvestments.com or by calling 1.800.543.0407.
Touchstone Sands Capital Select Growth Fund — Class Z Total Return as of December 31
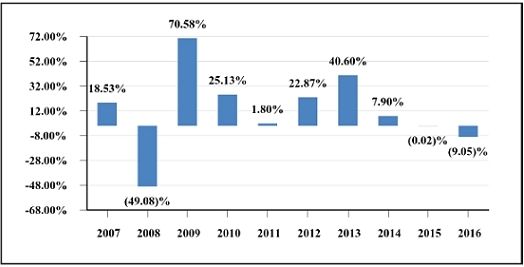
| Best Quarter: First Quarter 2012 23.75% | Worst Quarter: Fourth Quarter 2008 (30.93)% |
After-tax returns are calculated using the historical highest individual federal marginal income tax rates and do not reflect the impact of state and local taxes. Your actual after-tax returns may differ from those shown and depend on your tax situation. The after-tax returns do not apply to shares held in an individual retirement account (“IRA”), 401(k), or other tax-advantaged account. The after-tax returns shown in the table are for Class Z shares only. The after-tax returns for other classes of shares offered by the Fund will differ from the Class Z shares after-tax returns.
The inception dates of Class A shares, Class C shares, Class Y shares and Class Z shares were November 15, 2010, November 15, 2010, August 27, 2004 and August 11, 2000, respectively. Class A shares and Class C shares performance was calculated using the historical performance of Class Z shares for the periods prior to November 15, 2010. Performance for these periods has been restated to reflect the impact of the fees and expenses applicable to Class A and Class C shares.
For information on the prior history of the Fund, please see the section entitled “The Trust” in the Fund’s SAI.
Average Annual Total Returns
For the periods ended December 31, 2016
| | | | 1 Year | | | 5 Years | | | 10 Years |
| Touchstone Sands Capital Select Growth Fund — Class Z | | | | | | | | | | | | |
| Return Before Taxes | | | (9.05 | )% | | | 11.13 | % | | | 8.32 | % |
| Return After Taxes on Distributions | | | (12.12 | )% | | | 9.63 | % | | | 7.58 | % |
| Return After Taxes on Distributions and Sale of Fund Shares | | | (2.50 | )% | | | 8.94 | % | | | 6.84 | % |
| Touchstone Sands Capital Select Growth Fund — Class A | | | | | | | | | | | | |
| Return Before Taxes | | | (14.28 | )% | | | 9.83 | % | | | 7.67 | % |
| Touchstone Sands Capital Select Growth Fund — Class C | | | | | | | | | | | | |
| Return Before Taxes | | | (10.49 | )% | | | 10.29 | % | | | 7.55 | % |
| Touchstone Sands Capital Select Growth Fund — Class Y | | | | | | | | | | | | |
| Return Before Taxes | | | (8.82 | )% | | | 11.41 | % | | | 8.57 | % |
| Russell 1000® Growth Index (reflects no deductions for fees, expenses or taxes) | | | 7.08 | % | | | 14.50 | % | | | 8.33 | % |
The Fund’s Management
Investment Advisor
Touchstone Advisors, Inc.
| Sub-Advisor | | Portfolio
Manager | | Investment Experience
with the Fund | | Primary Title with
Sub-Advisor |
| Sands Capital Management, LLC | | Frank M. Sands, CFA | | Managing the Fund since 2000 | | Chief Investment Officer and Chief Executive Officer |
| | | A. Michael Sramek, CFA | | Managing the Fund since 2015 | | Senior Portfolio Manager |
| | | Wesley A. Johnston, CFA | | Managing the Fund since 2016 | | Portfolio Manager |
Buying and Selling Fund Shares
Minimum Investment Requirements
| | Classes A, C, Y, and Z |
| | Initial
Investment | | Additional
Investment | |
| Regular Account | $ | 2,500 | | $ | 50 | |
| Retirement Account or Custodial Account under the Uniform Gifts/Transfers to Minors Act | $ | 1,000 | | $ | 50 | |
| Investments through the Automatic Investment Plan | $ | 100 | | $ | 50 | |
Due to asset growth, the Fund was closed to new accounts, with certain exceptions, on April 8, 2013. Effective as of the close of business on October 21, 2013, the Fund was further closed to new accounts except as noted in the section titled “Investing with Touchstone” in the Fund’s prospectus.
Subject to the above limitations, you may buy and sell shares in the Fund on a day when the New York Stock Exchange is open for trading. Classes A and C shares may be purchased and sold directly from Touchstone Securities, Inc. (“Touchstone Securities”) or through your financial intermediary. Class Y shares are available only through financial institutions and financial intermediaries who have appropriate selling agreements in place with Touchstone Securities. Class Z Shares are available only through a financial intermediary or financial institutions such as retirement plans, fee based platforms and brokerage accounts. Shares may be purchased or sold by writing to Touchstone Securities at P.O. Box 9878, Providence, Rhode Island 02940, calling 1.800.543.0407, or visiting the Touchstone Funds’ website: TouchstoneInvestments.com. You may only sell shares over the telephone or via the Internet if the value of the shares sold is less than or equal to $100,000. Shares held in IRAs and qualified retirement plans cannot be sold
by telephone or via the Internet. If your shares are held by a processing organization or financial intermediary you will need to follow its purchase and redemption procedures. For more information about buying and selling shares see the section “Investing with Touchstone” of the Fund’s prospectus or call 1.800.543.0407.
Tax Information
The Fund intends to pay dividends and make distributions that may be taxed as ordinary income or capital gains except when shares are held through a tax-advantaged account, such as a 401(k) plan or an IRA. Withdrawals from a tax-advantaged account, however, may be taxable.
Financial Intermediary Compensation
If you purchase shares in the Fund through a broker-dealer or other financial intermediary (such as a bank), the Fund and its related companies may pay the intermediary for the sale of Fund shares and related services. These payments may create a conflict of interest by influencing the broker-dealer or other financial intermediary and your salesperson to recommend the Fund over another investment. Ask your salesperson or visit your financial intermediary’s website for more information.
TOUCHSTONE SMALL CAP FUND SUMMARY
The Fund’s Investment Goal
The Touchstone Small Cap Fund (formerly the Touchstone Small Cap Core Fund) (the “Fund”) seeks capital appreciation.
The Fund’s Fees and Expenses
This table describes the fees and expenses that you may pay if you buy and hold shares of the Fund. You may qualify for sales charge discounts for Class A shares if you and your family invest, or agree to invest in the future, at least $50,000 or more in the Touchstone Funds. More information about these and other discounts is available from your financial professional and in the section entitled “Choosing a Class of Shares” in the Fund’s prospectus on page 89 and in the Fund’s Statement of Additional Information (“SAI”) on page 80.
| | | | | | | | | | | | Institutional | |
| | | Class A | | | Class C | | | Class Y | | | Class | |
| Shareholder Fees (fees paid directly from your investment) | | | | | | | | | | | | | | | | |
| Maximum Sales Charge (Load) Imposed on Purchases (as a percentage of offering price) | | | 5.75 | % | | | None | | | | None | | | | None | |
| Maximum Deferred Sales Charge (Load) (as a percentage of original purchase price or the amount redeemed, whichever is less) | | | None | | | | 1.00 | % | | | None | | | | None | |
| Wire Redemption Fee | | | Up to $15 | | | | Up to $15 | | | | Up to $15 | | | | Up to $15 | |
| Annual Fund Operating Expenses (expenses that you pay each year as a percentage of the value of your investment) | | | | | | | | | | | | | | | | |
| Management Fees | | | 0.85 | % | | | 0.85 | % | | | 0.85 | % | | | 0.85 | % |
| Distribution and/or Shareholder Service (12b-1) Fees | | | 0.25 | % | | | 1.00 | % | | | None | | | | None | |
| Other Expenses | | | 0.35 | % | | | 0.38 | % | | | 0.29 | % | | | 0.19 | % |
| Total Annual Fund Operating Expenses | | | 1.45 | % | | | 2.23 | % | | | 1.14 | % | | | 1.04 | % |
| Fee Waiver and/or Expense Reimbursement(1) | | | (0.07 | )% | | | (0.10 | )% | | | (0.01 | )% | | | 0.00 | % |
| Total Annual Fund Operating Expenses After Fee Waiver and/or Expense Reimbursement(1) | | | 1.38 | % | | | 2.13 | % | | | 1.13 | % | | | 1.04 | % |
(1)Touchstone Advisors, Inc. (the “Advisor” or “Touchstone Advisors”) and Touchstone Funds Group Trust (the “Trust”) have entered into a contractual expense limitation agreement whereby Touchstone Advisors will waive a portion of its fees or reimburse certain Fund expenses (excluding dividend and interest expenses relating to short sales; interest; taxes; brokerage commissions and other transaction costs; portfolio transactions and investment related expenses; other expenditures which are capitalized in accordance with U.S. generally accepted accounting principles; the cost of “Acquired Fund Fees and Expenses,” if any; and other extraordinary expenses not incurred in the ordinary course of business) in order to limit annual Fund operating expenses to 1.38%, 2.13%, 1.13%, and 1.05% of average daily net assets for Classes A, C, Y and Institutional Class shares, respectively. This contractual expense limitation is effective through January 29, 2018, but can be terminated by a vote of the Board of Trustees of the Trust (the “Board”) if it deems the termination to be beneficial to the Fund’s shareholders. The terms of the contractual expense limitation agreement provide that Touchstone Advisors is entitled to recoup, subject to approval by the Board, such amounts waived or reimbursed for a period of up to three years from the year in which Touchstone Advisors reduced its compensation or assumed expenses for the Fund. No recoupment will occur unless the Fund’s expenses are below the lesser of the expense limitation amount in effect (a) at the time of the waiver, or (b) at the time of the reimbursement.
Example. This example is intended to help you compare the cost of investing in the Fund with the cost of investing in other mutual funds. The example assumes that you invest $10,000 in the Fund for the time periods indicated and then, except as indicated, redeem all of your shares at the end of those periods. The example also assumes that your investment has a 5% return each year and that the Fund’s operating expenses remain the same and that all fee waivers or expense limits for the Fund will expire after one year. Although your actual costs may be higher or lower, based on these assumptions your costs would be:
| | Assuming Redemption at End of Period | | Assuming No Redemption | |
| | | | | | | | Institutional | | | |
| | Class A | | Class C | | Class Y | | Class | | Class C | |
| 1 Year | $ | 707 | | $ | 316 | | $ | 115 | | $ | 106 | | $ | 216 | |
| 3 Years | $ | 1,001 | | $ | 688 | | $ | 361 | | $ | 331 | | $ | 688 | |
| 5 Years | $ | 1,315 | | $ | 1,186 | | $ | 627 | | $ | 574 | | $ | 1,186 | |
| 10 Years | $ | 2,205 | | $ | 2,557 | | $ | 1,385 | | $ | 1,271 | | $ | 2,557 | |
Portfolio Turnover. The Fund pays transaction costs, such as commissions, when it buys and sells securities (or “turns over” its portfolio). A higher portfolio turnover rate may indicate higher transaction costs and may result in higher taxes when Fund shares are held in a taxable account. These costs, which are not reflected in annual fund operating expenses or in the example, affect the Fund’s performance. During the most recent fiscal year, the Fund’s portfolio turnover rate was 17% of the average value of its portfolio.
The Fund’s Principal Investment Strategies
The Fund invests, under normal conditions, at least 80% of its net assets (including borrowings for investment purposes) in common stocks of small capitalization U.S. companies. This is a non-fundamental policy that the Fund can change upon 60 days’ prior notice to shareholders. For purposes of the Fund, a small capitalization company has a market capitalization within the range of market capitalization represented in the Russell 2000® Index (between $21 million to $10.51 billion as of December 31, 2016), the S&P SmallCap 600 Index (between $51.5 million and $4.513 billion as of December 31, 2016), or the Dow Jones U.S. Small Cap Total Stock Market Index (between $0 to $8.6 billion as of December 31, 2016) at the time of purchase. The size of the companies in these indices will change with market conditions.
The sub-advisor, London Company of Virginia d/b/a The London Company (“The London Company” or “Sub-Advisor”), seeks to purchase financially stable small-cap companies that The London Company believes are consistently generating high returns on unleveraged operating capital, run by shareholder-oriented management, and trading at a discount to their respective market prices. Guiding principles of The London Company’s small-cap philosophy include: (1) a focus on cash return on tangible capital, not earnings per share, (2) the value of a company is determined by cash inflows and outflows discounted by the optimal cost of capital, (3) a focused investment approach (not diversifying excessively) is essential to good investment results, and (4) low turnover and tax sensitivity enhances real returns.
The Fund will hold securities of approximately 30 to 40 companies. The London Company invests for the long term and attempts to minimize turnover in an effort to reduce transaction costs and taxes.
The Fund is non-diversified and may invest a significant percentage of its assets in the securities of one issuer.
The Fund’s Principal Risks
The Fund’s share price will fluctuate. You could lose money on your investment in the Fund and the Fund could also return less than other investments. Investments in the Fund are not bank guaranteed, are not deposits, and are not insured by the FDIC or any other federal government agency.
This Fund should only be purchased by investors seeking capital appreciation who can withstand the share price volatility of small-cap equity investing. As with any mutual fund, there is no guarantee that the Fund will achieve its investment goal. You can find more information about the Fund’s investments and risks under the “Principal Investment Strategies and Risks” section of the Fund’s prospectus. The Fund is subject to the principal risks summarized below.
Equity Securities Risk: The Fund is subject to the risk that stock prices will fall over short or extended periods of time. Individual companies may report poor results or be negatively affected by industry and/or economic trends and developments. The prices of securities issued by these companies may decline in response to such developments, which could result in a decline in the value of the Fund’s shares.
| • | Small-Cap Risk: Stocks of smaller companies may be subject to more abrupt or erratic market movements than stocks of larger, more established companies. Small companies may have limited product lines or financial resources, and may be dependent upon a small or inexperienced management group. |
Management Risk: In managing the Fund’s portfolio, the Advisor engages one or more sub-advisors to make investment decisions for a portion of or the entire portfolio. There is a risk that the Advisor may be unable to identify and retain sub-advisors who achieve superior investment returns relative to other similar sub-advisors.
Non-Diversification Risk: The Fund is non-diversified, which means that it may invest a greater percentage of its assets than a diversified mutual fund in the securities of a limited number of issuers. The use of a non-diversified investment strategy may increase the volatility of the Fund’s investment performance, as the Fund may be more susceptible to risks associated with a single economic, political, or regulatory event than a diversified fund.
The Fund’s Performance
The bar chart and performance table below illustrate some indication of the risks and volatility of investing in the Fund by showing changes in the Fund’s performance from year to year and by showing how the Fund’s average annual total returns for one year, five years and since inception compare with the Russell 2000® Index. The bar chart does not reflect any sales charges, which would reduce your return. The performance table does reflect any applicable sales charges. The Fund’s past performance (before and after taxes) does not necessarily indicate how the Fund will perform in the future. More recent performance is available at no cost by visiting TouchstoneInvestments.com or by calling 1.800.543.0407.
Touchstone Small Cap Fund — Class A Total Return as of December 31

| Best Quarter: Fourth Quarter 2011 16.94% | Worst Quarter: Third Quarter 2011 (15.32)% |
After-tax returns are calculated using the historical highest individual federal marginal income tax rates and do not reflect the impact of state and local taxes. Your actual after-tax returns may differ from those shown and depend on your tax situation. The after-tax returns do not apply to shares held in an individual retirement account (“IRA”), 401(k), or other tax-advantaged account. The after-tax returns shown in the table are for Class A shares only. The after-tax returns for other classes of shares offered by the Fund will differ from the Class A shares after-tax returns.
Average Annual Total Returns
For the periods ended December 31, 2016
| | | | | | Since Inception |
| | 1 Year | | 5 Years | | (9-30-09) |
| Touchstone Small Cap Fund — Class A | | | | | |
| Return Before Taxes | 4.78% | | 8.79% | | 10.98% |
| Return After Taxes on Distributions | 4.78% | | 7.54% | | 10.07% |
| Return After Taxes on Distributions and Sale of Fund Shares | 2.71% | | 6.88% | | 8.88% |
| Touchstone Small Cap Fund — Class C | | | | | |
| Return Before Taxes | 9.43% | | 9.26% | | 11.08% |
| Touchstone Small Cap Fund — Class Y | | | | | |
| Return Before Taxes | 11.43% | | 10.39% | | 12.22% |
| Touchstone Small Cap Fund — Institutional Class | | | | | |
| Return Before Taxes | 11.55% | | 10.49% | | 12.32% |
| Russell 2000® Index (reflects no deductions for fees, expenses or taxes) | 21.31% | | 14.46% | | 13.35% |
The Fund’s Management
Investment Advisor
Touchstone Advisors, Inc.
| | | Portfolio | | Investment Experience | | Primary Title with |
| Sub-Advisor | | Managers | | with the Fund | | Sub-Advisor |
| London Company of Virginia d/b/a The London Company | | Stephen Goddard, CFA | | Managing the Fund since its inception in 2009 | | President, Chief Investment Officer and Lead Portfolio Manager |
| | | | | | | |
| | | Jonathan Moody, CFA | | Managing the Fund since its inception in 2009 | | Principal and Portfolio Manager |
| | | | | | | |
| | | J. Brian Campbell, CFA | | Managing the Fund since 2010 | | Portfolio Manager |
| | | | | | | |
| | | Mark DeVaul, CFA, CPA | | Managing the Fund since 2011 | | Portfolio Manager |
Buying and Selling Fund Shares
Minimum Investment Requirements
| | Classes A, C, and Y | |
| | | Initial | | | Additional | |
| | | Investment | | | Investment | |
| Regular Account | $ | 2,500 | | $ | 50 | |
| Retirement Account or Custodial Account under the Uniform Gifts/Transfers to Minors Act | $ | 1,000 | | $ | 50 | |
| Investments through the Automatic Investment Plan | $ | 100 | | $ | 50 | |
| | Institutional Class | |
| | | Initial | | | Additional | |
| | | Investment | | | Investment | |
| Regular Account | $ | 500,000 | | $ | 50 | |
All classes of the Fund were closed to new accounts effective as of the close of business on September 21, 2012, except that the Fund continues to accept investments from certain institutional investors and systematic contributions from defined contribution and similar plans. Additional investments will not be accepted in the Fund until further notice. Touchstone Funds reserves the right to reopen the Fund to new investors at a future date, to make additional exceptions, to limit the above exceptions or otherwise to modify the foregoing closure policy for any reason. You may obtain additional information by calling Touchstone Securities at 1.800.543.0407.
Subject to the above limitations, you may buy and sell shares in the Fund on a day when the New York Stock Exchange is open for trading. Class A shares and Class C shares may be purchased and sold directly from Touchstone Securities, Inc. (“Touchstone Securities”) or through your financial advisor. Class Y shares are available only through financial institutions and financial intermediaries who have appropriate selling agreements in place with Touchstone Securities. Institutional Class shares are available through Touchstone Securities or your financial institution. Shares may be purchased or sold by writing to Touchstone Securities at P.O. Box 9878, Providence, Rhode Island 02940, calling 1.800.543.0407, or visiting the Touchstone Funds’ website: TouchstoneInvestments.com. You may only sell shares over the telephone or via the Internet if the value of the shares sold is less than or equal to $100,000. Shares held in IRAs and qualified retirement plans cannot be sold by telephone or via the Internet. If your shares are held by a processing organization or financial intermediary you will need to follow its purchase and redemption procedures. For more information about buying and selling shares see the section “Investing with Touchstone” of the Fund’s prospectus or call 1.800.543.0407.
Tax Information
The Fund intends to pay dividends and make distributions that may be taxed as ordinary income or capital gains, except when shares are held through a tax-advantaged account, such as a 401(k) plan or an IRA. Withdrawals from a tax-advantaged account, however, may be taxable.
Financial Intermediary Compensation
If you purchase shares in the Fund through a broker-dealer or other financial intermediary (such as a bank), the Fund and its related companies may pay the intermediary for the sale of Fund shares and related services. These payments may create a conflict of interest by influencing the broker-dealer or other financial intermediary and your salesperson to recommend the Fund over another investment. Ask your salesperson or visit your financial intermediary’s website for more information.
TOUCHSTONE SMALL CAP VALUE FUND SUMMARY
The Fund’s Investment Goal
The Touchstone Small Cap Value Fund (the “Fund”) seeks long-term capital growth.
The Fund’s Fees and Expenses
This table describes the fees and expenses that you may pay if you buy and hold shares of the Fund. You may qualify for sales charge discounts for Class A shares if you and your family invest, or agree to invest in the future, at least $50,000 or more in the Touchstone Funds. More information about these and other discounts is available from your financial professional and in the section entitled “Choosing a Class of Shares” in the Fund’s prospectus on page 89 and in the Fund’s Statement of Additional Information (“SAI”) on page 80.
| | | | | | | | | | | | | | | | Institutional |
| | | | Class A | | | Class C | | | Class Y | | | Class |
| Shareholder Fees (fees paid directly from your investment) | | | | | | | | | | | | | | | | |
| Maximum Sales Charge (Load) Imposed on Purchases (as a percentage of offering price) | | | 5.75 | % | | | None | | | | None | | | | None | |
| Maximum Deferred Sales Charge (Load) (as a percentage of original purchase price or the amount redeemed, whichever is less) | | | None | | | | 1.00 | % | | | None | | | | None | |
| Wire Redemption Fee | | | Up to $15 | | | | Up to $15 | | | | Up to $15 | | | | Up to $15 | |
| Annual Fund Operating Expenses (expenses that you pay each year as a percentage of the value of your investment) | | | | | | | | | | | | | | | | |
| Management Fees | | | 0.90 | % | | | 0.90 | % | | | 0.90 | % | | | 0.90 | % |
| Distribution and/or Shareholder Service (12b-1) Fees | | | 0.25 | % | | | 1.00 | % | | | None | | | | None | |
| Other Expenses | | | 0.52 | % | | | 1.49 | % | | | 0.80 | % | | | 0.32 | % |
| Acquired Fund Fees and Expenses (AFFE) | | | 0.01 | % | | | 0.01 | % | | | 0.01 | % | | | 0.01 | % |
| Total Annual Fund Operating Expenses(1) | | | 1.68 | % | | | 3.40 | % | | | 1.71 | % | | | 1.23 | % |
| Fee Waiver and/or Expense Reimbursement(2) | | | (0.29 | )% | | | (1.26 | )% | | | (0.57 | )% | | | (0.24 | )% |
| Total Annual Fund Operating Expenses After Fee Waiver and/or Expense Reimbursement(2) | | | 1.39 | % | | | 2.14 | % | | | 1.14 | % | | | 0.99 | % |
(1)Total Annual Fund Operating Expenses have been restated to reflect Acquired Fund Fees and Expenses and will differ from the ratio of expenses to average net assets that is included in the Fund’s annual report for the fiscal year ended September 30, 2016.
(2)Touchstone Advisors, Inc. (the “Advisor” or “Touchstone Advisors”) and Touchstone Funds Group Trust (the “Trust”) have entered into a contractual expense limitation agreement whereby Touchstone Advisors will waive a portion of its fees or reimburse certain Fund expenses (excluding dividend and interest expenses relating to short sales; interest; taxes; brokerage commissions and other transaction costs; portfolio transactions and investment related expenses; other expenditures which are capitalized in accordance with U.S. generally accepted accounting principles; the cost of “Acquired Fund Fees and Expenses,” if any; and other extraordinary expenses not incurred in the ordinary course of business) in order to limit annual Fund operating expenses to 1.38%, 2.13%, 1.13%, and 0.98% of average daily net assets for Classes A, C, Y and Institutional Class shares, respectively. This contractual expense limitation is effective through January 29, 2018, but can be terminated by a vote of the Board of Trustees of the Trust (the “Board”) if it deems the termination to be beneficial to the Fund’s shareholders. The terms of the contractual expense limitation agreement provide that Touchstone Advisors is entitled to recoup, subject to approval by the Board, such amounts waived or reimbursed for a period of up to three years from the year in which Touchstone Advisors reduced its compensation or assumed expenses for the Fund. No recoupment will occur unless the Fund’s expenses are below the lesser of the expense limitation amount in effect (a) at the time of the waiver, or (b) at the time of the reimbursement.
Example. This example is intended to help you compare the cost of investing in the Fund with the cost of investing in other mutual funds. The example assumes that you invest $10,000 in the Fund for the time periods indicated and then, except as indicated, redeem all of your shares at the end of those periods. The example also assumes that your investment has a 5% return each year and that the Fund’s operating expenses remain the same and that all fee waivers or expense limits for the Fund will expire after one year. Although your actual costs may be higher or lower, based on these assumptions your costs would be:
| | | | | Assuming Redemption at End of Period | | Assuming No Redemption | |
| | | | | Class A | | | Class C | | | Class Y | | | Institutional
Class | | | Class C | |
| 1 Year | | | | $ | 708 | | | $ | 317 | | | $ | 116 | | | $ | 101 | | | $ | 217 | |
| 3 Years | | | | $ | 1,047 | | | $ | 928 | | | $ | 483 | | | $ | 367 | | | $ | 928 | |
| 5 Years | | | | $ | 1,409 | | | $ | 1,661 | | | $ | 875 | | | $ | 653 | | | $ | 1,661 | |
| 10 Years | | | | $ | 2,425 | | | $ | 3,601 | | | $ | 1,972 | | | $ | 1,467 | | | $ | 3,601 | |
Portfolio Turnover. The Fund pays transaction costs, such as brokerage commissions, when it buys and sells securities (or “turns over” its portfolio). A higher portfolio turnover rate may indicate higher transaction costs and may result in higher taxes when Fund shares are held in a taxable account. These costs, which are not reflected in annual fund operating expenses or in the example, affect the Fund’s performance. During the most recent fiscal year, the Fund’s portfolio turnover rate was 155% of the average value of its portfolio.
The Fund’s Principal Investment Strategies
The Fund invests, under normal market conditions, at least 80% of its assets in common stocks of companies with small market capitalizations that the sub-advisor, LMCG Investments, LLC, believes have the potential for growth and that appear to be trading below their intrinsic value. This is a non-fundamental investment policy that can be changed by the Fund upon 60 days’ prior notice to shareholders. For purposes of the Fund, a small capitalization company has a market capitalization at the time of purchase within the range represented in the Russell 2000® Value Index (between approximately $40 million and $10.51 billion as of December 31, 2016). The market capitalization range of the Russell 2000® Value Index will change with market conditions. The Fund generally will hold approximately 80 to 115 securities.
The Fund’s Principal Risks
The Fund’s share price will fluctuate. You could lose money on your investment in the Fund and the Fund could also return less than other investments. Investments in the Fund are not bank guaranteed, are not deposits, and are not insured by the FDIC or any other federal government agency.
This Fund should only be purchased by investors seeking long-term capital growth who can withstand the share price volatility of small cap investing. As with any mutual fund, there is no guarantee that the Fund will achieve its investment goal. You can find more information about the Fund’s investments and risks under the “Principal Investment Strategies and Risks” section of the Fund’s prospectus. The Fund is subject to the principal risks summarized below.
Equity Securities Risk: The Fund is subject to the risk that stock prices will fall over short or extended periods of time. Individual companies may report poor results or be negatively affected by industry and/or economic trends and developments. The prices of securities issued by these companies may decline in response to such developments, which could result in a decline in the value of the Fund’s shares.
| • | Small-Cap Risk: Stocks of smaller companies may be subject to more abrupt or erratic market movements than stocks of larger, more established companies. Small companies may have limited product lines or financial resources, and may be dependent upon a small or inexperienced management group. |
Management Risk: In managing the Fund’s portfolio, the Advisor engages one or more sub-advisors to make investment decisions for a portion of or the entire portfolio. There is a risk that the Advisor may be unable to identify and retain sub-advisors who achieve superior investment returns relative to other similar sub-advisors.
Portfolio Turnover Risk: Frequent and active trading may result in greater expenses to the Fund, which may lower the Fund’s performance and may result in the realization of substantial capital gains, including net short-term capital gains. As a result, high portfolio turnover may reduce the Fund’s returns.
Value Investing Risk: Value investing presents the risk that the Fund’s security holdings may never reach their full market value because the market fails to recognize what the portfolio managers consider the true business value or because the portfolio managers have misjudged those values. In addition, value investing may fall out of favor and underperform growth or other styles of investing during given periods.
The Fund’s Performance
The bar chart and performance table below illustrate some indication of the risks and volatility of investing in the Fund by showing changes in the Fund’s performance from year to year and by showing how the Fund’s average annual total returns for one year, five years, and ten years compare with the Russell 2000® Value Index. The bar chart does not reflect any sales charges, which would reduce your return. The performance table does reflect any applicable sales charges. The Fund’s past performance (before and after taxes) does not necessarily indicate how the Fund will perform in the future. More recent performance is available at no cost by visiting TouchstoneInvestments.com or by calling 1.800.543.0407.
On July 1, 2016, the Fund changed its investment sub-advisor. Consequently, prior period performance may have been different if the Fund had not been managed by the prior sub-advisor using that sub-advisor’s small cap value strategy.
Touchstone Small Cap Value Fund — Class A Total Return as of December 31
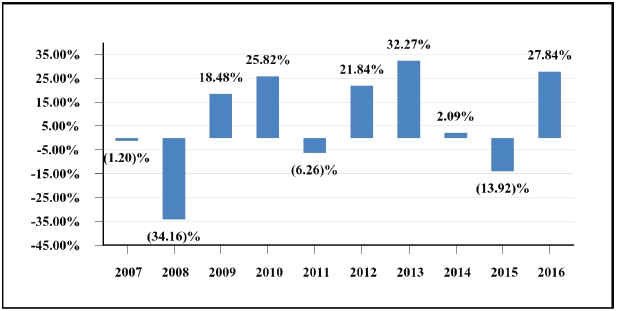
| Best Quarter: Third Quarter 2009 17.14% | Worst Quarter: Fourth Quarter 2008 (24.10)% |
After-tax returns are calculated using the historical highest individual federal marginal income tax rates and do not reflect the impact of state and local taxes. Your actual after-tax returns may differ from those shown and depend on your tax situation. The after-tax returns do not apply to shares held in an individual retirement account (“IRA”), 401(k), or other tax-advantaged account. The after-tax returns shown in the table are for Class A shares only. The after-tax returns for other classes of shares offered by the Fund will differ from the Class A shares after-tax returns.
The inception dates of Class A shares, Class C shares, Class Y shares, Class Z shares and Institutional Class shares were March 1, 2011, March 1, 2011, March 1, 2011, March 4, 2002 and March 1, 2011, respectively. On June 10, 2011, Class Z shares were converted to Class A shares. Class A shares, Class C shares, Class Y shares and Institutional Class shares performance was calculated using the historical performance of Class Z shares for the periods prior to March 1, 2011. Performance for these periods has been restated to reflect the impact of the fees and expenses applicable to Class A, Class C, Class Y and Institutional Class shares.
For information on the prior history of the Fund, please see the section entitled “The Trust” in the Fund’s SAI.
Average Annual Total Returns
For the periods ended December 31, 2016
| | | 1 Year | | 5 Years | | 10 Years |
| Touchstone Small Cap Value Fund — Class A | | | | | | | | | | | | |
| Return Before Taxes | | | 20.48 | % | | | 11.28 | % | | | 4.49 | % |
| Return After Taxes on Distributions | | | 20.31 | % | | | 10.56 | % | | | 3.91 | % |
| Return After Taxes on Distributions and Sale of Fund Shares | | | 11.70 | % | | | 8.91 | % | | | 3.48 | % |
| Touchstone Small Cap Value Fund — Class C | | | | | | | | | | | | |
| Return Before Taxes | | | 25.88 | % | | | 11.78 | % | | | 4.33 | % |
| Touchstone Small Cap Value Fund — Class Y | | | | | | | | | | | | |
| Return Before Taxes | | | 28.15 | % | | | 12.88 | % | | | 5.28 | % |
| Touchstone Small Cap Value Fund — Institutional Class | | | | | | | | | | | | |
| Return Before Taxes | | | 28.31 | % | | | 13.06 | % | | | 5.35 | % |
| Russell 2000® Value Index (reflects no deductions for fees, expenses or taxes) | | | 31.74 | % | | | 15.07 | % | | | 6.26 | % |
The Fund’s Management
Investment Advisor
Touchstone Advisors, Inc.
| Sub-Advisor | | Portfolio Manager | | Investment Experience
with the Fund | | Primary Title with
Sub-Advisor |
| LMCG Investments, LLC | | R. Todd Vingers, CFA | | Managing the Fund since 2016 | | Managing Director, Value Equities |
Buying and Selling Fund Shares
Minimum Investment Requirements
| | | Classes A, C, and Y |
| | | Initial | | Additional |
| | | Investment | | Investment |
| Regular Account | | $ | 2,500 | | | $ | 50 | |
| Retirement Account or Custodial Account under the Uniform Gifts/Transfers to Minors Act | | $ | 1,000 | | | $ | 50 | |
| Investments through the Automatic Investment Plan | | $ | 100 | | | $ | 50 | |
| | | | | | | | | |
| | | Institutional Class | |
| | | Initial | | | Additional | |
| | | Investment | | | Investment | |
| Regular Account | | $ | 500,000 | | | $ | 50 | |
You may buy and sell shares in the Fund on a day when the New York Stock Exchange is open for trading. Classes A and C shares may be purchased and sold directly from Touchstone Securities, Inc. (“Touchstone Securities”) or through your financial advisor. Class Y shares are available only through financial institutions and financial intermediaries who have appropriate selling agreements in place with Touchstone Securities. Institutional Class shares are available through Touchstone Securities or your financial institution. Shares may be purchased or sold by writing to Touchstone Securities at P.O. Box 9878, Providence, Rhode Island 02940, calling 1.800.543.0407, or visiting the Touchstone Funds’ website: TouchstoneInvestments.com. You may only sell shares over the telephone or via the Internet if the value of the shares sold is less than or equal to $100,000. Shares held in IRAs and qualified retirement plans cannot be sold by telephone or via the Internet. If your shares are held by a processing organization or financial intermediary you will need to follow its purchase and redemption procedures. For more information about buying and selling shares see the section “Investing with Touchstone” of the Fund’s prospectus or call 1.800.543.0407.
Tax Information
The Fund intends to pay dividends and make distributions that may be taxed as ordinary income or capital gains, except when shares are held through a tax-advantaged account, such as a 401(k) plan or an IRA. Withdrawals from a tax-advantaged account, however, may be taxable.
Financial Intermediary Compensation
If you purchase shares in the Fund through a broker-dealer or other financial intermediary (such as a bank), the Fund and its related companies may pay the intermediary for the sale of Fund shares and related services. These payments may create a conflict of interest by influencing the broker-dealer or other financial intermediary and your salesperson to recommend the Fund over another investment. Ask your salesperson or visit your financial intermediary’s website for more information.
TOUCHSTONE TOTAL RETURN BOND FUND SUMMARY
The Fund’s Investment Goal
The Touchstone Total Return Bond Fund (the “Fund”) seeks current income. Capital appreciation is a secondary goal.
The Fund’s Fees and Expenses
This table describes the fees and expenses that you may pay if you buy and hold shares of the Fund. You may qualify for sales charge discounts for Class A shares if you and your family invest, or agree to invest in the future, at least $50,000 or more in the Touchstone Funds. More information about these and other discounts is available from your financial professional and in the section entitled “Choosing a Class of Shares” in the Fund’s prospectus on page 89 and in the Fund’s Statement of Additional Information (“SAI”) on page 80.
| | | Class A | | Class C | | Class Y | | Institutional
Class |
| Shareholder Fees (fees paid directly from your | | | | | | | | | | | | |
| investment) | | | | | | | | | | | | |
| Maximum Sales Charge (Load) Imposed on Purchases (as a percentage of offering price) | | 4.75 | % | | None | | | None | | | None | |
| Maximum Deferred Sales Charge (Load) (as a percentage of original purchase price or the amount redeemed, whichever is less) | | None | | | 1.00 | % | | None | | | None | |
| Wire Redemption Fee | | Up to $15 | | | Up to $15 | | | Up to $15 | | | Up to $15 | |
| Annual Fund Operating Expenses (expenses that you pay each year as a percentage of the value of your investment) | | | | | | | | | | | | |
| Management Fees | | 0.35 | % | | 0.35 | % | | 0.35 | % | | 0.35 | % |
| Distribution and/or Shareholder Service (12b-1) Fees | | 0.25 | % | | 1.00 | % | | None | | | None | |
| Other Expenses | | 0.65 | % | | 0.84 | % | | 0.36 | % | | 0.25 | % |
| Acquired Fund Fees and Expenses (AFFE) | | 0.01 | % | | 0.01 | % | | 0.01 | % | | 0.01 | % |
| Total Annual Fund Operating Expenses(1) | | 1.26 | % | | 2.20 | % | | 0.72 | % | | 0.61 | % |
| Fee Waiver and/or Expense Reimbursement(2) | | (0.40 | )% | | (0.59 | )% | | (0.11 | )% | | (0.10 | )% |
| Total Annual Fund Operating Expenses After Fee Waiver and/or Expense Reimbursement(2) | | 0.86 | % | (3) | 1.61 | % | (3) | 0.61 | % | (3) | 0.51 | % |
(1)Total Annual Fund Operating Expenses have been restated to reflect Acquired Fund Fees and Expenses and will differ from the ratio of expenses to average net assets that is included in the Fund’s annual report for the fiscal year ended September 30, 2016.
(2)Touchstone Advisors, Inc. (the “Advisor” or “Touchstone Advisors”) and Touchstone Funds Group Trust (the “Trust”) have entered into a contractual expense limitation agreement whereby Touchstone Advisors will waive a portion of its fees or reimburse certain Fund expenses (excluding dividend and interest expenses relating to short sales; interest; taxes; brokerage commissions and other transaction costs; portfolio transactions and investment related expenses; other expenditures which are capitalized in accordance with U.S. generally accepted accounting principles; the cost of “Acquired Fund Fees and Expenses,” if any; and other extraordinary expenses not incurred in the ordinary course of business) in order to limit annual Fund operating expenses to 0.85%, 1.60%, 0.60%, and 0.50% of average daily net assets for Classes A, C, Y and Institutional Class shares, respectively. This contractual expense limitation is effective through January 29, 2018, but can be terminated by a vote of the Board of Trustees of the Trust (the “Board”) if it deems the termination to be beneficial to the Fund’s shareholders. The terms of the contractual expense limitation agreement provide that Touchstone Advisors is entitled to recoup, subject to approval by the Board, such amounts waived or reimbursed for a period of up to three years from the year in which Touchstone Advisors reduced its compensation or assumed expenses for the Fund. No recoupment will occur unless the Fund’s expenses are below the lesser of the expense limitation amount in effect (a) at the time of the waiver, or (b) at the time of the reimbursement.
(3)Total Annual Fund Operating Expenses After Fee Waiver or Expense Reimbursement excluding Acquired Fund Fees and Expenses differs from the ratio of net expenses to average net assets shown in the annual report for the fiscal year ended September 30, 2016 due to a contractual change in the expense limitation agreement.
Example. This example is intended to help you compare the cost of investing in the Fund with the cost of investing in other mutual funds. The example assumes that you invest $10,000 in the Fund for the time periods indicated and then, except as indicated, redeem all of your shares at the end of those periods. The example also assumes that your investment has a 5% return each year
and that the Fund’s operating expenses remain the same and that all fee waivers or expense limits for the Fund will expire after one year. Although your actual costs may be higher or lower, based on these assumptions your costs would be:
| | | Assuming Redemption at End of Period | | | Assuming No Redemption | |
| | | Class A | | | Class C | | | Class Y | | | Institutional
Class | | | Class C | |
| 1 Year | | $ | 559 | | | $ | 264 | | | $ | 62 | | | $ | 52 | | | $ | 164 | |
| 3 Years | | $ | 818 | | | $ | 631 | | | $ | 219 | | | $ | 185 | | | $ | 631 | |
| 5 Years | | $ | 1,097 | | | $ | 1,126 | | | $ | 390 | | | $ | 330 | | | $ | 1,126 | |
| 10 Years | | $ | 1,892 | | | $ | 2,488 | | | $ | 884 | | | $ | 753 | | | $ | 2,488 | |
Portfolio Turnover. The Fund pays transaction costs, such as brokerage commissions, when it buys and sells securities (or “turns over” its portfolio). A higher portfolio turnover rate may indicate higher transaction costs and may result in higher taxes when Fund shares are held in a taxable account. These costs, which are not reflected in annual fund operating expenses or in the example, affect the Fund’s performance. During the most recent fiscal year, the Fund’s portfolio turnover rate was 12% of the average value of its portfolio.
The Fund’s Principal Investment Strategies
The Fund invests, under normal circumstances, at least 80% of its net assets (including borrowings for investment purposes) in fixed-income securities. This is a non-fundamental investment policy that can be changed by the Fund upon 60 days’ prior notice to shareholders. Fixed-income securities primarily consist of U.S. government obligations, corporate debt obligations (including non-investment-grade corporate debt obligations), mortgage-backed securities, and asset-backed securities. U.S. government obligations include direct government obligations and those of government agencies and instrumentalities. Corporate debt obligations include corporate bonds, debentures, notes and other similar instruments of U.S. corporations. Investment-grade fixed-income securities include securities rated BBB- or higher by Standard & Poor’s Corporation (“S&P”) or Baa3 or higher by Moody’s Investors Services, Inc. (“Moody’s”) or, if unrated by S&P or Moody’s, determined by the sub-advisor, EARNEST Partners LLC, to be of comparable quality.
The Fund will generally invest at least 80% of its total assets in investment-grade debt securities, but may invest up to 20% of its total assets in non-investment-grade debt securities, which are sometimes referred to as “junk bonds.”
The securities in which the Fund invests may pay interest at fixed rates, variable rates, or subject to reset terms. In addition, these securities may make principal payments that are fixed, variable, or both. The Fund may also invest in mortgage dollar rolls and zero coupon securities. The Fund can invest in securities of any maturity.
The Fund’s Principal Risks
The Fund’s share price will fluctuate. You could lose money on your investment in the Fund and the Fund could also return less than other investments. Investments in the Fund are not bank guaranteed, are not deposits, and are not insured by the FDIC or any other federal government agency.
This Fund should only be purchased by investors seeking current income with reasonable risk to capital who can withstand share price volatility, and who seek exposure to fixed-income securities. As with any mutual fund, there is no guarantee that the Fund will achieve its investment goal. You can find more information about the Fund’s investments and risks under the “Principal Investment Strategies and Risks” section of the Fund’s prospectus. The Fund is subject to the principal risks summarized below.
Asset-Backed Securities Risk: Asset-backed securities are fixed-income securities backed by other assets such as credit card, automobile or consumer loan receivables, retail installment loans, or participations in pools of leases. Credit support for these securities may be based on the structural features such as subordination or overcollateralization or provided through credit enhancements by a third party. Even with a credit enhancement by a third party, there is still risk of loss. There could be inadequate collateral or no collateral for asset-backed securities. The values of these securities are sensitive to changes in the credit quality of the underlying collateral, the credit strength of any credit enhancement feature, changes in interest rates and, at times, the financial condition of the issuer.
Fixed-Income Risk: The market values of the Fund’s fixed-income securities respond to economic developments, particularly interest rate changes, as well as to perceptions about the creditworthiness of individual issuers, including governments. Generally,
the Fund’s fixed-income securities will decrease in value if interest rates rise and increase in value if interest rates fall. Normally, the longer the maturity or duration of the fixed-income securities the Fund owns, the more sensitive the value of the Fund’s shares will be to changes in interest rates.
| | • | Credit Risk: The fixed-income securities in the Fund’s portfolio are subject to the possibility that a deterioration, whether sudden or gradual, in the financial condition of an issuer, or a deterioration in general economic conditions, could cause an issuer to fail to make timely payments of principal or interest, when due. This may cause the issuer’s securities to decline in value. |
| | | |
| | • | Interest Rate Risk: In general, when interest rates rise, the prices of debt securities fall, and when interest rates fall, the prices of debt securities rise. The price volatility of a debt security also depends on its maturity. Longer-term securities are generally more volatile, so the longer the average maturity or duration of these securities, the greater their price risk. |
| | | |
| | • | Investment-Grade Debt Securities Risk: Investment-grade debt securities may be downgraded by a nationally recognized statistical rating organization (“NRSRO”) to below-investment-grade status, which would increase the risk of holding these securities. Investment-grade debt securities rated in the lowest rating category by a NRSRO involve a higher degree of risk than fixed-income securities with higher credit ratings. |
| | | |
| | • | Non-Investment-Grade Debt Securities Risk: Non-investment-grade debt securities are sometimes referred to as “junk bonds” and are considered speculative with respect to their issuers’ ability to make payments of interest and principal. There is a high risk that the Fund could suffer a loss from investments in non-investment-grade debt securities caused by the default of an issuer of such securities. Non-investment-grade debt securities may also be less liquid than investment-grade debt securities. |
Management Risk: In managing the Fund’s portfolio, the Advisor engages one or more sub-advisors to make investment decisions for a portion of or the entire portfolio. There is a risk that the Advisor may be unable to identify and retain sub-advisors who achieve superior investment returns relative to other similar sub-advisors.
Mortgage-Backed Securities Risk: Mortgage-backed securities are fixed-income securities representing an interest in a pool of underlying mortgage loans. Mortgage-backed securities are sensitive to changes in interest rates, but may respond to these changes differently from other fixed-income securities due to the possibility of prepayment of the underlying mortgage loans. Mortgage-backed securities may fluctuate in price based on deterioration in the perceived or actual value of the collateral underlying the pool of mortgage loans, which may result in the collateral being worth less than the remaining principal amount owed on the mortgages in the pool.
Mortgage Dollar Roll Risk: Mortgage “dollar rolls” are transactions in which mortgage-backed securities are sold for delivery in the current month and the seller simultaneously contracts to repurchase substantially similar securities on a specified future date. The difference between the sale price and the purchase price (plus any interest earned on the cash proceeds of the sale) is netted against the interest income foregone on the securities sold to arrive at an implied borrowing rate. Alternatively, the sale and purchase transactions can be executed at the same price, with the Fund being paid a fee as consideration for entering into the commitment to purchase. If the broker-dealer to whom the Fund sells the security becomes insolvent, the Fund’s right to repurchase the security may be restricted. Other risks involved in entering into mortgage dollar rolls include the risk that the value of the security may change adversely over the term of the mortgage dollar roll and that the security the Fund is required to repurchase may be worth less than the security that the Fund originally held.
Prepayment Risk: Prepayment risk is the risk that a debt security may be paid off and proceeds invested earlier than anticipated. Prepayment impacts both the interest rate sensitivity of the underlying asset, such as an asset-backed or mortgage-backed security and its cash flow projections. Therefore, prepayment risk may make it difficult to calculate the average duration of the Fund’s asset- or mortgage-backed securities which in turn would make it difficult to assess the interest rate risk of the Fund.
U.S. Government Agencies Securities Risk: Certain U.S. government agency securities are backed by the right of the issuer to borrow from the U.S. Treasury while others are supported only by the credit of the issuer or instrumentality. While the U.S. government is able to provide financial support to U.S. government-sponsored agencies or instrumentalities, no assurance can be given that it will always do so.
The Fund’s Performance
On August 1, 2011, the EARNEST Partners Fixed Income Trust (the “Predecessor Fund”), a series of the Nottingham Investment Trust II, was reorganized into the Fund. Prior to the reorganization, the Predecessor Fund had an investment goal and principal
investment strategies similar to those of the Fund. Performance information presented prior to August 1, 2011 is that of the Predecessor Fund.
The bar chart and performance table below illustrate some indication of the risks and volatility of investing in the Fund by showing changes in the Fund’s performance from year to year and by showing how the Fund’s average annual total returns for one year, five years, and ten years compare with the Bloomberg Barclays U.S. Aggregate Bond Index. The bar chart does not reflect any sales charges, which would reduce your return. The performance table does reflect any applicable sales charges. The Fund’s past performance (before and after taxes) does not necessarily indicate how the Fund will perform in the future. More recent performance is available at no cost by visiting TouchstoneInvestments.com or by calling 1.800.543.0407.
Touchstone Total Return Bond Fund — Class Y Total Return as of December 31
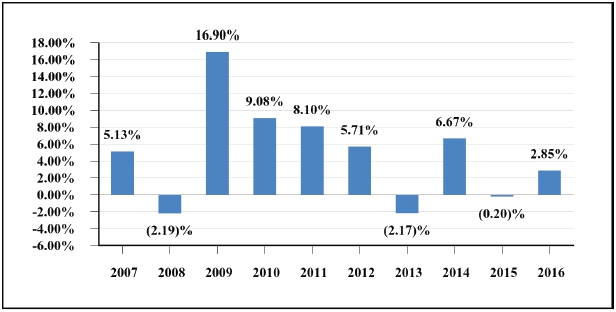
| Best Quarter: Third Quarter 2009 7.77% | Worst Quarter: Fourth Quarter 2016 (2.91)% |
After-tax returns are calculated using the historical highest individual federal marginal income tax rates and do not reflect the impact of state and local taxes. Your actual after-tax returns may differ from those shown and depend on your tax situation. The after-tax returns do not apply to shares held in an individual retirement account (“IRA”), 401(k), or other tax-advantaged account. The after-tax returns shown in the table are for Class Y shares only. The after-tax returns for other classes of shares offered by the Fund will differ from the Class Y shares after-tax returns.
The inception dates of Class A shares, Class C shares, Class Y shares and Institutional Class shares were August 16, 2010, August 1, 2011, November 15, 1991 and August 1, 2011, respectively. Class A shares, Class C shares and Institutional Class shares performance was calculated using the historical performance of Class Y shares for the periods prior to August 16, 2010, August 1, 2011 and August 1, 2011, respectively. Performance for these periods has been restated to reflect the impact of the fees and expenses applicable to Class A, Class C and Institutional Class shares.
For information on the prior history of the Fund, please see the section entitled “The Trust” in the Fund’s SAI.
Average Annual Total Returns
For the periods ended December 31, 2016
| | | 1 Year | | 5 Years | | 10 Years |
| Touchstone Total Return Bond Fund — Class Y | | | | | | |
| Return Before Taxes | | 2.85% | | 2.52% | | 4.84% |
| Return After Taxes on Distributions | | 1.56% | | 1.26% | | 3.31% |
| Return After Taxes on Distributions and Sale of Fund Shares | | 1.62% | | 1.38% | | 3.14% |
| Touchstone Total Return Bond Fund — Class A | | | | | | |
| Return Before Taxes | | (2.28)% | | 1.27% | | 4.07% |
| Touchstone Total Return Bond Fund — Class C | | | | | | |
| Return Before Taxes | | 0.94% | | 1.50% | | 3.80% |
| Touchstone Total Return Bond Fund — Institutional Class | | | | | | |
| Return Before Taxes | | 2.96% | | 2.66% | | 4.92% |
| Bloomberg Barclays U.S. Aggregate Bond Index (reflects no deductions for fees, expenses or taxes) | | 2.65% | | 2.23% | | 4.34% |
The Fund’s Management
Investment Advisor
Touchstone Advisors, Inc.
| Sub-Advisor | | Portfolio Managers | | Investment Experience
with the Fund | | Primary Title with
Sub-Advisor |
| EARNEST Partners LLC | | Douglas Folk, CFA | | Managing the Fund since 2011; managed the Predecessor Fund since 1998 | | Partner |
| | | | | | | |
| | | Chris Fitze, CFA | | Managing the Fund since 2011; managed the Predecessor Fund since 2006 | | Director |
Buying and Selling Fund Shares
Minimum Investment Requirements
| | | Classes A, C, and Y | |
| | | Initial
Investment | | | Additional
Investment | |
| Regular Account | | $ | 2,500 | | | $ | 50 | |
| Retirement Account or Custodial Account under the Uniform Gifts/Transfers to Minors Act | | $ | 1,000 | | | $ | 50 | |
| Investments through the Automatic Investment Plan | | $ | 100 | | | $ | 50 | |
| | | | | | | | | |
| | | Institutional Class | |
| | | Initial
Investment | | | Additional
Investment | |
| Regular Account | | $ | 500,000 | | | $ | 50 | |
You may buy and sell shares in the Fund on a day when the New York Stock Exchange is open for trading. Classes A and C shares may be purchased and sold directly from Touchstone Securities, Inc. (“Touchstone Securities”) or through your financial advisor. Class Y shares are available only through financial institutions and financial intermediaries who have appropriate selling agreements in place with Touchstone Securities. Institutional Class shares are available through Touchstone Securities or your financial institution. Shares may be purchased or sold by writing to Touchstone Securities at P.O. Box 9878, Providence, Rhode Island 02940, calling 1.800.543.0407, or visiting the Touchstone Funds’ website: TouchstoneInvestments.com. You may only sell shares over the telephone or via the Internet if the value of the shares sold is less than or equal to $100,000. Shares held in IRAs and qualified retirement plans cannot be sold by telephone or via the Internet. If your shares are held by a processing organization or
financial intermediary you will need to follow its purchase and redemption procedures. For more information about buying and selling shares see the section “Investing with Touchstone” of the Fund’s prospectus or call 1.800.543.0407.
Tax Information
The Fund intends to pay dividends and make distributions that may be taxed as ordinary income or capital gains, except when shares are held through a tax-advantaged account, such as a 401(k) plan or an IRA. Withdrawals from a tax-advantaged account, however, may be taxable.
Financial Intermediary Compensation
If you purchase shares in the Fund through a broker-dealer or other financial intermediary (such as a bank), the Fund and its related companies may pay the intermediary for the sale of Fund shares and related services. These payments may create a conflict of interest by influencing the broker-dealer or other financial intermediary and your salesperson to recommend the Fund over another investment. Ask your salesperson or visit your financial intermediary’s website for more information.
TOUCHSTONE ULTRA SHORT DURATION FIXED INCOME FUND SUMMARY
The Fund’s Investment Goal
The Touchstone Ultra Short Duration Fixed Income Fund (the “Fund”) seeks maximum total return consistent with the preservation of capital.
The Fund’s Fees and Expenses
This table describes the fees and expenses that you may pay if you buy and hold shares of the Fund. You may qualify for sales charge discounts for Class A shares if you and your family invest, or agree to invest in the future, at least $50,000 or more in the Touchstone Funds. More information about these and other discounts is available from your financial professional and in the section entitled “Choosing a Class of Shares” in the Fund’s prospectus on page 89 and in the Fund’s Statement of Additional Information (“SAI”) on page 80.
| | | | | | | | | | | | | | | Institutional |
| | | Class A | | Class C | | Class Y | | Class Z | | Class |
| Shareholder Fees (fees paid directly from your investment) | | | | | | | | | | | | | | | |
| Maximum Sales Charge (Load) Imposed on Purchases (as a percentage of offering price) | | 2.00 | % | | None | | | None | | | None | | | None | |
| Maximum Deferred Sales Charge (Load) (as a percentage of original purchase price or the amount redeemed, whichever is less) | | None | | | 1.00 | % | | None | | | None | | | None | |
| Wire Redemption Fee | | Up to $15 | | | Up to $15 | | | Up to $15 | | | Up to $15 | | | Up to $15 | |
| Annual Fund Operating Expenses (expenses that you pay each year as a percentage of the value of your investment) | | | | | | | | | | | | | | | |
| Management Fees | | 0.25 | % | | 0.25 | % | | 0.25 | % | | 0.25 | % | | 0.25 | % |
| Distribution and/or Shareholder Service (12b-1) Fees | | 0.25 | % | | 1.00 | % | | None | | | 0.25 | % | | None | |
| Other Expenses | | 0.47 | % | | 0.29 | % | | 0.28 | % | | 0.29 | % | | 0.21 | % |
| Total Annual Fund Operating Expenses | | 0.97 | % | | 1.54 | % | | 0.53 | % | | 0.79 | % | | 0.46 | % |
| Fee Waivers and/or Expense Reimbursement(1) | | (0.28 | )% | | (0.35 | )% | | (0.09 | )% | | (0.10 | )% | | (0.07 | )% |
| Total Annual Fund Operating Expenses After Fee Waivers and/or Expense Reimbursement(1) | | 0.69 | % | | 1.19 | % | | 0.44 | % | | 0.69 | % | | 0.39 | % |
(1)Touchstone Advisors, Inc. (the “Advisor” or “Touchstone Advisors”) and Touchstone Funds Group Trust (the “Trust”) have entered into a contractual expense limitation agreement whereby Touchstone Advisors will waive a portion of its fees or reimburse certain Fund expenses (excluding dividend and interest expenses relating to short sales; interest; taxes; brokerage commissions and other transaction costs; portfolio transactions and investment related expenses; other expenditures which are capitalized in accordance with U.S. generally accepted accounting principles; the cost of “Acquired Fund Fees and Expenses,” if any; and other extraordinary expenses not incurred in the ordinary course of business) in order to limit annual Fund operating expenses to 0.69%, 1.19%, 0.44%, 0.69%, and 0.39% of average daily net assets for Classes A, C, Y, Z and Institutional Class shares, respectively. This contractual expense limitation is effective through January 29, 2018, but can be terminated by a vote of the Board of Trustees of the Trust (the “Board”) if it deems the termination to be beneficial to the Fund’s shareholders. The terms of the contractual expense limitation agreement provide that Touchstone Advisors is entitled to recoup, subject to approval by the Board, such amounts waived or reimbursed for a period of up to three years from the year in which Touchstone Advisors reduced its compensation or assumed expenses for the Fund. No recoupment will occur unless the Fund’s expenses are below the lesser of the expense limitation amount in effect (a) at the time of the waiver, or (b) at the time of the reimbursement.
Example. This example is intended to help you compare the cost of investing in the Fund with the cost of investing in other mutual funds. The example assumes that you invest $10,000 in the Fund for the time periods indicated and then, except as indicated, redeem all of your shares at the end of those periods. The example also assumes that your investment has a 5% return each year and that the Fund’s operating expenses remain the same and that all fee waivers or expense limits for the Fund will expire after one year. Although your actual costs may be higher or lower, based on these assumptions your costs would be:
| | | | Assuming Redemption at End of Period | | | Assuming No Redemption | |
| | | | | | | | | | | | | | | | Institutional | | | |
| | | | | Class A | | | Class C | | | Class Y | | | Class Z | | | Class | | | Class C | |
| 1 Year | | | | $ | 269 | | | $ | 221 | | | $ | 45 | | | $ | 70 | | | $ | 40 | | | $ | 121 | |
| 3 Years | | | | $ | 475 | | | $ | 452 | | | $ | 161 | | | $ | 242 | | | $ | 141 | | | $ | 452 | |
| 5 Years | | | | $ | 699 | | | $ | 806 | | | $ | 287 | | | $ | 429 | | | $ | 251 | | | $ | 806 | |
| 10 Years | | | | $ | 1,341 | | | $ | 1,805 | | | $ | 656 | | | $ | 969 | | | $ | 572 | | | $ | 1,805 | |
Portfolio Turnover. The Fund pays transaction costs, such as brokerage commissions, when it buys and sells securities (or “turns over” its portfolio). A higher portfolio turnover rate may indicate higher transaction costs and may result in higher taxes when Fund shares are held in a taxable account. These costs, which are not reflected in annual fund operating expenses or in the example, affect the Fund’s performance. During the most recent fiscal year, the Fund’s portfolio turnover rate was 169% of the average value of its portfolio.
The Fund’s Principal Investment Strategies
The Fund invests, under normal market conditions, at least 80% of its assets in fixed-income securities. This is a non-fundamental investment policy that can be changed by the Fund upon 60 days’ prior notice to shareholders. The Fund invests in a diversified portfolio of securities of different maturities including U.S. Treasury securities, U.S. government agency securities, securities of U.S. government-sponsored enterprises, corporate bonds (including those of foreign issuers), mortgage-backed securities, commercial mortgage-backed securities, asset-backed securities, municipal bonds and cash equivalent securities including repurchase agreements, commercial paper and variable rate demand notes.
The Fund invests only in investment-grade debt securities and does not invest in non-investment-grade debt securities (i.e., “high yield” or “junk bonds”). Investment-grade debt securities are those having a rating of BBB-/Baa3 or higher from a nationally recognized statistical rating organization (“NRSRO”) or, if a rating is not available, deemed to be of comparable quality by the sub-advisor, Fort Washington Investment Advisors, Inc.
The Fund may engage in frequent and active trading of securities as a part of its principal investment strategy.
The Fund’s Principal Risks
The Fund’s share price will fluctuate. You could lose money on your investment in the Fund and the Fund could also return less than other investments. Investments in the Fund are not bank guaranteed, are not deposits, and are not insured by the FDIC or any other federal government agency.
This Fund should only be purchased by investors seeking maximum total return consistent with preservation of capital who can withstand a limited amount of share price volatility, and seek exposure to fixed-income securities. As with any mutual fund, there is no guarantee that the Fund will achieve its investment goal. You can find more information about the Fund’s investments and risks under the “Principal Investment Strategies and Risks” section of the Fund’s prospectus. The Fund is subject to the principal risks summarized below.
Asset-Backed Securities Risk: Asset-backed securities are fixed-income securities backed by other assets such as credit card, automobile or consumer loan receivables, retail installment loans, or participations in pools of leases. The values of these securities are sensitive to changes in the credit quality of the underlying collateral, the credit strength of any credit enhancement feature, changes in interest rates, and, at times, the financial condition of the issuer.
Fixed-Income Risk: The market values of the Fund’s fixed-income securities respond to economic developments, particularly interest rate changes, as well as to perceptions about the creditworthiness of individual issuers, including governments. Generally, the Fund’s fixed-income securities will decrease in value if interest rates rise and increase in value if interest rates fall. Normally, the longer the maturity or duration of the fixed-income securities the Fund owns, the more sensitive the value of the Fund’s shares will be to changes in interest rates.
| | • | Credit Risk: The securities in the Fund’s portfolio are subject to the possibility that a deterioration, whether sudden or gradual, in the financial condition of an issuer, or a deterioration in general economic conditions, could cause an issuer to fail to make timely payments of principal or interest, when due. This may cause the issuer’s securities to decline in value. |
| | • | Interest Rate Risk: In general, when interest rates rise, the prices of debt securities fall, and when interest rates fall, the prices of debt securities rise. The price volatility of a debt security also depends on its maturity. Longer-term securities are generally more volatile, so the longer the average maturity or duration of these securities, the greater their price risk. |
| | | |
| | • | Investment-Grade Debt Securities Risk: Investment-grade debt securities may be downgraded by a NRSRO to below investment-grade status, which would increase the risk of holding these securities. Investment-grade debt securities rated in the lowest rating category by a NRSRO involve a higher degree of risk than fixed-income securities with higher credit ratings. |
| | | |
Foreign Securities Risk: Investing in foreign securities poses additional risks since political and economic events unique in a country or region will affect those markets and their issuers, while such events may not necessarily affect the U.S. economy or issuers located in the United States. In addition, investments in foreign securities are generally denominated in foreign currency. As a result, changes in the value of those currencies compared to the U.S. dollar may affect the value of the Fund’s investments. Foreign markets may be less liquid and more volatile than U.S. markets and offer less protection to investors.
Management Risk: In managing the Fund’s portfolio, the Advisor engages one or more sub-advisors to make investment decisions for a portion of or the entire portfolio. There is a risk that the Advisor may be unable to identify and retain sub-advisors who achieve superior investment returns relative to other similar sub-advisors. The value of your investment may decrease if the sub-advisor incorrectly judges the attractiveness, value, or market trends affecting a particular security, issuer, industry, or sector.
Mortgage-Backed Securities Risk: Mortgage-backed securities are fixed-income securities representing an interest in a pool of underlying mortgage loans. Mortgage-backed securities are sensitive to changes in interest rates, but may respond to these changes differently from other fixed-income securities due to the possibility of prepayment of the underlying mortgage loans. Mortgage-backed securities may fluctuate in price based on deterioration in the perceived or actual value of the collateral underlying the pool of mortgage loans, which may result in the collateral being worth less than the remaining principal amount owed on the mortgages in the pool.
Municipal Securities Risk: The value of municipal securities may be affected by uncertainties in the municipal market related to legislation or litigation involving the taxation of municipal securities or the rights of municipal securities holders in the event of bankruptcy. In addition, a downturn in the national economy may negatively impact the economic performance of issuers of municipal securities, and may increase the likelihood that issuers of securities in which the Fund may invest may be unable to meet their obligations. Also, some municipal obligations may be backed by a letter of credit issued by a bank or other financial institution. Adverse developments affecting banks or other financial institutions could have a negative effect on the value of the Fund’s portfolio securities.
Portfolio Turnover Risk: Frequent and active trading may result in greater expenses to the Fund, which may lower the Fund’s performance and may result in the realization of substantial capital gains, including net short-term capital gains. As a result, high portfolio turnover may reduce the Fund’s returns.
Prepayment Risk: The risk that a debt security may be paid off and proceeds invested earlier than anticipated. Prepayment impacts both the interest rate sensitivity of the underlying asset, such as an asset-backed or mortgage-backed security and its cash flow projections. Therefore, prepayment risk may make it difficult to calculate the average duration of the Fund’s asset- or mortgage-backed securities which in turn would make it difficult to assess the interest rate risk of the Fund.
Repurchase Agreement Risk: Under all repurchase agreements entered into by the Fund, the Fund’s custodian or its agent must take possession of the underlying collateral. However, if the counterparty defaults, the Fund could realize a loss on the sale of the underlying security to the extent that the proceeds of sale, including accrued interest, are less than the resale price provided in the agreement including interest. In addition, even though the Bankruptcy Code provides protection for most repurchase agreements, if the seller should be involved in bankruptcy or insolvency proceedings, the Fund may incur delay and costs in selling the underlying security or may suffer a loss of principal and interest if the Fund is treated as an unsecured creditor and is required to return the underlying security to the seller’s estate. Repurchase agreements are considered loans by the Fund.
U.S. Government Agencies Securities Risk: Certain U.S. government agency securities are backed by the right of the issuer to borrow from the U.S. Treasury while others are supported only by the credit of the issuer or instrumentality. While the U.S. government is able to provide financial support to U.S. government-sponsored agencies or instrumentalities, no assurance can be given that it will always do so.
The Fund’s Performance
The bar chart and performance table below illustrate some indication of the risks and volatility of investing in the Fund by showing changes in the Fund’s performance from year to year and by showing how the Fund’s average annual total returns for one year, five years, and ten years compare with the BofA Merrill Lynch 3-Month U.S. Treasury Bill Index and BofA Merrill Lynch 1-Year U.S. Treasury Note Index, an index of funds which has similar investment objectives to the Fund’s. The bar chart does not reflect any sales charges, which would reduce your return. The performance table does reflect any applicable sales charges. The Fund’s past performance (before and after taxes) does not necessarily indicate how the Fund will perform in the future. More recent performance is available at no cost by visiting TouchstoneInvestments.com or by calling 1.800.543.0407.
Touchstone Ultra Short Duration Fixed Income Fund — Class Z Total Return as of December 31

| Best Quarter: First Quarter 2007 1.40% | Worst Quarter: Third Quarter 2008 (0.24)% |
After-tax returns are calculated using the historical highest individual federal marginal income tax rates and do not reflect the impact of state and local taxes. Your actual after-tax returns may differ from those shown and depend on your tax situation. The after-tax returns do not apply to shares held in an individual retirement account (“IRA”), 401(k), or other tax-advantaged account. The after-tax returns shown in the table are for Class Z only. The after-tax returns for the other classes of shares offered by the Fund will differ from the Class Z shares after-tax returns.
The inception dates of Class A shares, Class C shares, Class Y shares, Class Z shares and Institutional Class shares were April 12, 2012, April 12, 2012, April 12, 2012, March 1, 1994 and April 12, 2012, respectively. Class A shares, Class C shares, Class Y shares and Institutional Class shares performance was calculated using the historical performance of Class Z shares for the periods prior to April 12, 2012. Performance for these periods has been restated to reflect the impact of the fees and expenses applicable to Class A, Class C, Class Y and Institutional Class shares.
For information on the prior history of the Fund, please see the section entitled “The Trust” in the Fund’s SAI.
Average Annual Total Returns
For the periods ended December 31, 2016
| | | 1 Year | | 5 Years | | 10 years |
| Touchstone Ultra Short Duration Fixed Income Fund — Class Z | | | | | | | | | |
| Return Before Taxes | | | 1.51 | % | | | 0.97 | % | | | 1.66 | % |
| Return After Taxes on Distributions | | | 0.95 | % | | | 0.35 | % | | | 0.74 | % |
| Return After Taxes on Distributions and Sale of Fund Shares | | | 0.86 | % | | | 0.48 | % | | | 0.93 | % |
| Touchstone Ultra Short Duration Fixed Income Fund — Class A | | | | | | | | | | | | |
| Return Before Taxes | | | (0.53 | )% | | | 0.53 | % | | | 1.44 | % |
| Touchstone Ultra Short Duration Fixed Income Fund — Class C | | | | | | | | | | | | |
| Return Before Taxes | | | (0.01 | )% | | | 0.43 | % | | | 1.01 | % |
| Touchstone Ultra Short Duration Fixed Income Fund — Class Y | | | | | | | | | | | | |
| Return Before Taxes | | | 1.67 | % | | | 1.17 | % | | | 1.76 | % |
| Touchstone Ultra Short Duration Fixed Income Fund — Institutional Class | | | | | | | | | | | | |
| Return before Taxes | | | 1.72 | % | | | 1.22 | % | | | 1.78 | % |
| BofA Merrill Lynch 3-Month U.S. Treasury Bill Index (reflects no deductions for fees, expenses or taxes) | | | 0.33 | % | | | 0.12 | % | | | 0.12 | % |
| BofA Merrill Lynch 1-Year U.S. Treasury Note Index (reflects no deductions for fees, expenses or taxes) | | | 0.76 | % | | | 0.32 | % | | | 0.43 | % |
The Fund’s Management
Investment Advisor
Touchstone Advisors, Inc.
| | | Portfolio | | Investment Experience | | Primary Title with |
| Sub-Advisor | | Managers | | with the Fund | | Sub-Advisor |
| Fort Washington Investment Advisors, Inc. | | Scott D. Weston | | Managing the Fund since 2008 | | Vice President and Senior Portfolio Manager |
| | | | | | | |
| | | Brent A. Miller, CFA | | Managing the Fund since 2008 | | Portfolio Manager |
Buying and Selling Fund Shares
Minimum Investment Requirements
| | | Classes A, C, Y, and Z | |
| | | Initial | | | Additional | |
| | | Investment | | | Investment | |
| Regular Account | | $ | 2,500 | | | $ | 50 | |
| Retirement Account or Custodial Account under the Uniform Gifts/Transfers to Minors Act | | $ | 1,000 | | | $ | 50 | |
| Investments through the Automatic Investment Plan | | $ | 100 | | | $ | 50 | |
| | | | | | | | | |
| | | | | | | | | |
| | | Institutional Class | |
| | | Initial | | | Additional | |
| | | Investment | | | Investment | |
| Regular Account | | $ | 500,000 | | | $ | 50 | |
You may buy and sell shares in the Fund on a day when the New York Stock Exchange is open for trading. Classes A and C shares may be purchased and sold directly from Touchstone Securities, Inc. (“Touchstone Securities”) or through your financial advisor. Class Y shares are available only through financial institutions and financial intermediaries who have appropriate selling agreements in place with Touchstone Securities. Class Z shares are available only through a financial intermediary or financial institutions
such as retirement plans, fee based platforms and brokerage accounts. Institutional Class shares are available through Touchstone Securities or your financial institution. Shares may be purchased or sold by writing to Touchstone Securities at P.O. Box 9878, Providence, Rhode Island 02940, calling 1.800.543.0407, or visiting the Touchstone Funds’ website: TouchstoneInvestments.com. You may only sell shares over the telephone or via the Internet if the value of the shares sold is less than or equal to $100,000. Shares held in IRAs and qualified retirement plans cannot be sold by telephone or via the Internet. If your shares are held by a processing organization or financial intermediary you will need to follow its purchase and redemption procedures. For more information about buying and selling shares see the section “Investing with Touchstone” of the Fund’s prospectus or call 1.800.543.0407.
Tax Information
The Fund intends to pay dividends and make distributions that may be taxed as ordinary income or capital gains, except when shares are held through a tax-advantaged account, such as a 401(k) plan or an IRA. Withdrawals from a tax-advantaged account, however, may be taxable.
Financial Intermediary Compensation
If you purchase shares in the Fund through a broker-dealer or other financial intermediary (such as a bank), the Fund and its related companies may pay the intermediary for the sale of Fund shares and related services. These payments may create a conflict of interest by influencing the broker-dealer or other financial intermediary and your salesperson to recommend the Fund over another investment. Ask your salesperson or visit your financial intermediary’s website for more information.
PRINCIPAL INVESTMENT STRATEGIES AND RISKS
This prospectus applies to the Touchstone Active Bond Fund (the “Active Bond Fund”), Touchstone Arbitrage Fund (the “Arbitrage Fund”), Touchstone Emerging Markets Small Cap Fund (the “Emerging Markets Small Cap Fund”), Touchstone High Yield Fund (the “High Yield Fund”), Touchstone Merger Arbitrage Fund (the “Merger Arbitrage Fund”), Touchstone Mid Cap Fund (the “Mid Cap Fund”), Touchstone Mid Cap Value Fund (the “Mid Cap Value Fund”), Touchstone Premium Yield Fund ( the “Premium Yield Fund”), Touchstone Sands Capital Select Growth Fund (the “Sands Capital Select Growth Fund”), Touchstone Small Cap Fund (the “Small Cap Fund”), Touchstone Small Cap Value Fund (the “Small Cap Value Fund”), Touchstone Total Return Bond Fund (the “Total Return Bond Fund”), and Touchstone Ultra Short Duration Fixed Income Fund (the “Ultra Short Duration Fixed Income Fund”) (each a “Fund”, and collectively, the “Funds”).
How Do The Funds Pursue Their Investment Goals?
Each Fund’s investment goal and strategies are described above in the “Principal Investment Strategies” summary sections. The descriptions below provide further detail concerning how each Fund noted below pursues its investment goal.
Active Bond Fund. The Fund’s sub-advisor, Fort Washington Investment Management, Inc. (“Fort Washington”) invests in emerging market countries that are in the J.P. Morgan Emerging Market Bond Index. Foreign-issued debt securities are issued by non-U.S. companies of any size that are tied economically to foreign markets. Fort Washington will generally consider qualifying investments to be in companies that are organized under the laws of, or maintain their principal place of business in, a foreign country; have securities that are principally traded in such countries; or derive at least 50% of revenues or profits from, or have at least 50% of their assets in, such countries.
Arbitrage Fund. In undertaking other forms of arbitrage, the Fund’s sub-advisor, Longfellow Investment Management Co. (“Longfellow”), will generally buy securities and simultaneously sell securities short in amounts that are intended to result in an approximately neutral economic exposure to overall market movements. This portion of the Fund’s investment strategy is designed to capture the arbitrage spread represented by the difference between the intrinsic value of a security as determined by Longfellow and the price at which the security trades.
In selecting securities for the Fund, Longfellow, analyzes a number of factors including: proposed financing terms, the size of the transaction, anti-trust concerns, regulatory approvals and shareholder voting requirements. Longfellow will sell a position if it views the proposed transaction as having more risk than expected, the proposed transaction is cancelled or more attractive opportunities arise.
The weighted average maturity of the Fund’s fixed-income investments will normally range from 3 to 7 years, and less under certain circumstances. Longfellow believes that inefficiencies can exist with the pricing of closed-end funds and that exploiting these inefficiencies can have the potential to serve as attractive investments in the Fund.
Emerging Markets Small Cap Fund. The Fund’s sub-advisor, Copper Rock Capital Partners LLC (“Copper Rock”), seeks to construct a portfolio that is diversified across sectors and industries. Copper Rock applies a blend of fundamental and quantitative analyses to generate initial investment ideas. Copper Rock’s investment process seeks to add value through bottom-up stock selection and in-depth fundamental research. Copper Rock typically sells or reduces a position when the target price for a stock is attained, there is a change in the company’s management team or business objectives, there is deterioration in a company’s fundamentals.
Merger Arbitrage Fund. The Fund’s sub-advisor, Longfellow, primarily buys securities of companies being acquired (the “target company”) in publicly announced transactions where the terms of the transaction have been largely defined and disclosed. Longfellow may engage in selling securities short when the terms of a proposed corporate reorganization require the exchange of common stock and/or other securities. In such a case, the common stock of the target company may be purchased and, at approximately the same time, some amount of the acquiring company’s common stock and/or other securities may be sold short depending on the terms of the transaction. The Fund’s investment strategy is designed to capture the arbitrage spread represented by the difference between the market price of the securities of the target company and the value that is offered for these securities by the acquiring company.
In selecting securities for the Fund, Longfellow analyzes a number of factors including proposed financing terms, the size of the transaction, anti-trust concerns, regulatory approvals and shareholder voting requirements. Longfellow will sell a position if it views the proposed transaction as having more risk than expected, the proposed transaction is cancelled or more attractive opportunities arise.
The weighted average maturity of the Fund’s fixed-income investments will normally range from 3 to 7 years, and less under certain circumstances. Longfellow believes that inefficiencies can exist with the pricing of closed-end funds and that exploiting these inefficiencies can have the potential to serve as attractive investments in the Fund.
Mid Cap Fund. The Fund’s sub-advisor, London Company of Virginia d/b/a/ The London Company (“The London Company”), utilizes a bottom-up approach in the security selection process. The firm screens the mid-cap universe against an internally developed quantitative model, scoring companies along several dimensions including return on capital, earnings to enterprise value ratio, and free cash flow yield. The portfolio management team seeks companies that are trading a 30-40% discount to estimated intrinsic value. The London Company looks at a company’s corporate governance structure and management incentives to try to ascertain whether management’s interests are aligned with shareholders’ interests. The London Company seeks to identify the sources of a company’s competitive advantage as well as what levers management has at its disposal to increase shareholder value. Securities are ultimately added to the Fund when The London Company determines that the risk/reward profile of the security has made it attractive to warrant purchase. The London Company generally sells a security when it becomes overvalued and has reached The London Company’s price target, when the security’s fundamentals deteriorate, to adjust overall portfolio risk, when there is significant trading activity by insiders, or when there is a more promising alternative.
Mid Cap Value Fund. The Fund’s sub-advisor, LMCG Investments, LLC (“LMCG” ), employs a fundamental investment process which seeks to identify companies which it believes are selling at a discount to their intrinsic value. In the first step of the investment process, LMCG employs five valuation screens that seek to identify the most attractively priced mid-cap securities. In evaluating and selecting potential investments for the Fund, LMCG completes in-depth research and analysis on the securities that pass the valuation screens in an effort to identify leading companies selling at attractive valuations. The research and analysis include an examination of financial statements and assessments of the management team, the company’s competitive strategy and its current market position. LMCG generally limits the Fund’s weight in a sector to 10% over or under the sector’s weight in the Russell Midcap Value Index. LMCG will generally sell a security when it no longer passes the valuation screens, reaches a price target, or its prospects for appreciation have diminished.
Premium Yield Fund. The Fund’s sub-advisor, Miller/Howard Investments Inc. (“Miller/Howard”), employs quantitative screens that seek to identify stocks with above-average dividend yield plus a consistent history of dividend growth that offer high financial strength and solid appreciation potential. Miller/Howard also employs certain social and environmental screens. The portfolio management team generates a focus list of stocks through a combination of additional screens and fundamental research. Preference is given to companies with monopoly-like characteristics and recurring revenues, which may be attained through proprietary goods and services, strategic geographic positioning, and/or market dominance. Attention to diversification across economic sectors is also emphasized. An attempt is made to find stocks that are supported by Miller/Howard’s general view of the economy and its sectors, though bottom-up stock selection is of primary importance.
The Fund integrates rigorous, fundamental financial analysis with environmental, social and governance (“ESG”) analysis. The Adviser employs a multi–faceted strategy that includes screening, direct engagement with companies, and proxy voting. Stocks from all sectors of the market are considered for inclusion in the portfolio in an effort to provide diversification. Finally, technical analysis is used to attempt to identify optimal times for purchases and sales.
Sands Capital Select Growth Fund. The Fund’s sub-advisor, Sands Capital Management, LLC (“Sands Capital”), generally seeks to invest in stocks with sustainable above average earnings growth, and with capital appreciation potential. In addition, Sands Capital seeks companies that have a significant competitive advantage, a leadership position or proprietary niche, a clear mission in an understandable business, financial strength and that are valued rationally in relation to comparable companies, the market, and the business prospects for that particular company. Sands Capital generally considers selling a security when it no longer meets the investment criteria, when the issues causing such problems are not solvable within an acceptable time frame, or when other opportunities appear more attractive.
Small Cap Fund. The Fund’s sub-advisor, The London Company utilizes a bottom-up approach in the security selection process. The firm screens a small-cap index against an internally developed quantitative model, scoring companies along several dimensions including return on capital, earnings to enterprise value ratio, and free cash flow yield. The portfolio management team seeks companies that are trading a 30-40% discount to estimated intrinsic value. The London Company looks at a company’s corporate governance structure and management incentives to try to ascertain whether or not management’s interests are aligned with shareholders’ interests. The London Company seeks to identify the sources of a company’s competitive advantage as well as what levers management has at its disposal to increase shareholder value. Securities are ultimately added to the Fund when The London Company determines that the risk/reward profile of the security has made it attractive to warrant purchase. The London Company generally sells a security when it becomes overvalued and has reached The London Company’s price target, when the security’s fundamentals deteriorate, to adjust overall portfolio risk, when there is significant trading activity by insiders, or when there is a more promising alternative.
Small Cap Value Fund. The Fund’s sub-advisor, LMCG employs a fundamental investment process which seeks to identify companies which it believes are selling at a discount to their intrinsic value. In the first step of the investment process, LMCG employs five valuation screens that seek to identify the most attractively priced small-cap securities. In evaluating and selecting potential investments for the Fund, LMCG completes in-depth research and analysis on the securities that pass the valuation screens in an effort to identify leading companies selling at attractive valuations. The research and analysis include an examination of financial statements and assessments of the management team, the company’s competitive strategy and its current market position. LMCG generally limits the Fund’s weight in a sector to 10% over or under the sector’s weight in the Russell 2000® Value Index. LMCG will generally sell a security when it no longer passes the valuation screens, reaches a price target, or its prospects for appreciation have diminished.
Total Return Bond Fund. The Fund’s sub-advisor, EARNEST Partners LLC (“EARNEST”), employs a bottom–up investment process that seeks to maximize duration-adjusted total return by investing in market sectors or securities it considers undervalued for their risk characteristics. EARNEST seeks to accomplish this through the implementation of a proprietary “Gap” Framework, fundamental review and risk management process. The first step involves a screening of the investable universe applying EARNEST’s proprietary Gap Framework, which evaluates expected yield levels for various sectors and securities in comparison to actual yield levels. The Gap Framework analysis incorporates such factors as quality, duration, and structure. The second step involves in-depth, fundamental security analysis which focuses on credit risk, cash flow risk, credit spread volatility, the historical yield relationship between a security and the corresponding benchmark, and current market technical forces (i.e., supply and demand factors). EARNEST also believes that entities that are cognizant of ESG issues tend to be more successful over time. As a result, EARNEST prefers to invest in government programs and companies that have sustainable operating models. This inclusive approach views positive ESG characteristics as additive to an investment’s risk/return profile. When assessing an issue’s sustainability profile, EARNEST considers a wide range of factors, including but not limited to support for economic development, home ownership, and job creation. The third and final step of the investment process integrates EARNEST’s risk management techniques and fundamental analysis to construct a portfolio that strives to minimize spread volatility. Securities are sold once a fundamental change to EARNEST’s credit analysis occurs and/or to alter the overall risk characteristics of the portfolio.
Ultra Short Duration Fixed Income Fund. In selecting investments for the Fund, Fort Washington chooses fixed-income securities that it believes are attractively priced relative to the market or to similar instruments. In addition, Fort Washington considers the “effective duration” of the Fund’s entire portfolio. Effective duration is a measure of a security’s price volatility or the risk associated with changes in interest rates. While the Fund may invest in securities with any maturity or duration, Fort Washington seeks to maintain an effective duration for the Fund of one year or less under normal market conditions.
Can a Fund Depart From its Principal Investment Strategies?
Each Fund’s investment goal is non-fundamental, and may be changed by the Trust’s Board of Trustees (the “Board”) without shareholder approval. Shareholders will be notified at least 60 days before any change takes effect.
The investments and strategies described throughout this prospectus are those that the Funds use under normal conditions. During unusual economic or market conditions, or for temporary defensive purposes, each Fund may invest up to 100% of its assets in cash, repurchase agreements, and short-term obligations (i.e., fixed and variable rate securities and high quality debt securities of corporate and government issuers) that would not ordinarily be consistent with the Funds’ goals. This defensive investing may increase a Fund’s taxable income, and when a Fund is invested defensively, it may not achieve its investment goal. A Fund will do so only if the Fund’s sub-advisor believes that the risk of loss in using the Fund’s normal strategies and investments outweighs the opportunity for gains. Of course, there can be no guarantee that any Fund will achieve its investment goal.
Portfolio Composition
80% Investment Policy. Certain of the Funds have adopted a policy to invest, under normal circumstances, at least 80% of the value of a Fund’s “assets” in certain types of investments suggested by its name (the “80% Policy”). For purposes of this 80% Policy, the term “assets” means net assets plus the amount of borrowings for investment purposes. A Fund must comply with its 80% Policy at the time the Fund invests its assets. Accordingly, when a Fund no longer meets the 80% requirement as a result of circumstances beyond its control, such as changes in the value of portfolio holdings, it would not have to sell its holdings, but would have to make any new investments in such a way as to comply with the 80% Policy.
Change in Market Capitalization. A Fund may specify in its principal investment strategy a market capitalization range for acquiring portfolio securities. If a security that is within the range for a Fund at the time of purchase later falls outside the range, which is most likely to happen because of market fluctuation, the Fund may continue to hold the security if, in the Fund’s sub-
advisor’s judgment, the security remains otherwise consistent with the Fund’s investment goal and strategies. However, this change in market capitalization could affect the Fund’s flexibility in making new investments.
The following Funds have specified a market capitalization range: Touchstone Mid Cap Fund, Touchstone Mid Cap Value Fund, Touchstone Small Cap Fund, and Touchstone Small Cap Value Fund.
Do the Funds Have Other Investment Strategies in Addition to Their Principal Investment Strategies?
General. In addition to the investments and strategies described in this prospectus, each Fund also may invest in other securities, use other strategies and engage in other investment practices. These permitted investments and strategies are described in detail in the Funds’ Statement of Additional Information (“SAI”).
Lending of Portfolio Securities. The Funds may lend their portfolio securities to brokers, dealers and financial institutions under guidelines adopted by the Board, including a requirement that a Fund must receive collateral equal to no less than 100% of the market value of the securities loaned. The risk in lending portfolio securities, as with other extensions of credit, consists of possible loss of rights in the collateral should the borrower fail financially. In determining whether to lend securities, Touchstone Advisors, Inc. (the “Advisor”) will consider all relevant facts and circumstances, including the creditworthiness of the borrower. More information on securities lending is available in the SAI.
Other Investment Companies. A Fund may invest in securities issued by other investment companies to the extent permitted by the Investment Company Act of 1940, as amended (the “1940 Act”), the rules thereunder and applicable Securities and Exchange Commission (“SEC”) staff interpretations thereof, or applicable exemptive relief granted by the SEC.
What are the Principal Risks of Investing in the Funds?
The following is a list of principal risks that may apply to your investment in a Fund. Further information about investment risks is available in the Funds’ SAI:
| | | | | | | | | | | | | | | | | | | | | | | | | | | Ultra |
| | | | | | | | | | | | | | | | | | | Sands | | | | | | | | Short |
| | | | | | | Emerging | | | | | | | | Mid | | Premium | | Capital | | | | Small | | Total | | Duration |
| | | Active | | | | Markets | | High | | Merger | | Mid | | Cap | | Yield | | Select | | Small | | Cap | | Return | | Fixed |
| | | Bond | | Arbitrage | | Small Cap | | Yield | | Arbitrage | | Cap | | Value | | Equity | | Growth | | Cap | | Value | | Bond | | Income |
| Risks | | Fund | | Fund | | Fund | | Fund | | Fund | | Fund | | Fund | | Fund | | Fund | | Fund | | Fund | | Fund | | Fund |
| Asset-Backed | | X | | | | | | | | X | | | | | | | | | | | | | | X | | X |
| Securities Risk | | | | | | | | | | | | | | | | | | | | | | | | | | |
| | | | | | | | | | | | | | | | | | | | | | | | | | | |
| Convertible | | | | X | | | | | | | | | | | | | | | | | | | | | | |
| Securities Risk | | | | | | | | | | | | | | | | | | | | | | | | | | |
| | | | | | | | | | | | | | | | | | | | | | | | | | | |
| Credit Risk | | X | | X | | | | X | | X | | | | | | | | | | | | | | X | | X |
| | | | | | | | | | | | | | | | | | | | | | | | | | | |
| Depositary | | | | X | | X | | | | X | | | | | | X | | | | | | | | | | |
| Receipts Risk | | | | | | | | | | | | | | | | | | | | | | | | | | |
| | | | | | | | | | | | | | | | | | | | | | | | | | | |
| Derivatives Risk | | X | | | | | | | | | | | | | | | | | | | | | | | | |
| | | | | | | | | | | | | | | | | | | | | | | | | | | |
| Emerging | | X | | | | X | | | | | | | | | | X | | | | | | | | | | |
| Markets Risk | | | | | | | | | | | | | | | | | | | | | | | | | | |
| | | | | | | | | | | | | | | | | | | | | | | | | | | |
| Equity | | | | X | | X | | | | X | | X | | X | | X | | X | | X | | X | | | | |
| Securities Risk | | | | | | | | | | | | | | | | | | | | | | | | | | |
| | | | | | | | | | | | | | | | | | | | | | | | | | | |
| Fixed-Income | | X | | X | | | | X | | X | | | | | | | | | | | | | | X | | X |
| Risk | | | | | | | | | | | | | | | | | | | | | | | | | | |
| | | | | | | | | | | | | | | | | | | | | | | | | | | |
| Foreign | | X | | X | | X | | | | X | | | | | | X | | | | | | | | | | X |
| Securities Risk | | | | | | | | | | | | | | | | | | | | | | | | | | |
| | | | | | | | | | | | | | | | | | | | | | | | | | | |
| Forward | | X | | | | | | | | | | | | | | | | | | | | | | | | |
| Currency | | | | | | | | | | | | | | | | | | | | | | | | | | |
| Exchange | | | | | | | | | | | | | | | | | | | | | | | | | | |
| Contract Risk | | | | | | | | | | | | | | | | | | | | | | | | | | |
| | | | | | | | | | | | | | | | | | | | | | | | | | | |
| Futures | | X | | | | | | | | | | | | | | | | | | | | | | | | |
| Contracts Risk | | | | | | | | | | | | | | | | | | | | | | | | | | |
| | | | | | | | | | | | | | | | | | | | | | | | | | | |
| Growth | | | | | | | | | | | | | | | | | | X | | | | | | | | |
| Investing Risk | | | | | | | | | | | | | | | | | | | | | | | | | | |
| | | | | | | | | | | | | | | | | | | | | | | | | | | |
| Interest Rate | | X | | X | | | | X | | X | | | | | | | | | | | | | | X | | X |
| Risk | | | | | | | | | | | | | | | | | | | | | | | | | | |
| | | | | | | | | | | | | | | | | | | | | | | | | | | |
| Investment- | | X | | | | | | | | | | | | | | | | | | | | | | X | | X |
| Grade Debt | | | | | | | | | | | | | | | | | | | | | | | | | | |
| Securities Risk | | | | | | | | | | | | | | | | | | | | | | | | | | |
| | | | | | | | | | | | | | | | | | | | | | | | | | | |
| Large-Cap Risk | | | | X | | | | | | X | | | | | | X | | X | | | | | | | | |
| | | | | | | | | | | | | | | | | | | | | | | | | | | |
| Leverage Risk | | X | | | | | | | | | | | | | | | | | | | | | | | | |
| | | | | | | | | | | | | | | | | | | | | | | | | | | |
| Management | | X | | X | | X | | X | | X | | X | | X | | X | | X | | X | | X | | X | | X |
| Risk | | | | | | | | | | | | | | | | | | | | | | | | | | |
| | | | | | | | | | | | | | | | | | | | | | | | | | | |
| Merger | | | | X | | | | | | X | | | | | | | | | | | | | | | | |
| Arbitrage Risk | | | | | | | | | | | | | | | | | | | | | | | | | | |
| | | | | | | | | | | | | | | | | | | | | | | | | | | |
| Mid Cap Risk | | | | X | | X | | | | X | | X | | X | | X | | | | | | | | | | |
| | | | | | | | | | | | | | | | | | | | | | | | | | | |
| Mortgage- | | X | | | | | | | | | | | | | | | | | | | | | | X | | X |
| Backed | | | | | | | | | | | | | | | | | | | | | | | | | | |
| Securities Risk | | | | | | | | | | | | | | | | | | | | | | | | | | |
| | | | | | | | | | | | | | | | | | | | | | | | | | | |
| Mortgage Dollar | | X | | | | | | | | | | | | | | | | | | | | | | X | | |
| Roll Risk | | | | | | | | | | | | | | | | | | | | | | | | | | |
| | | | | | | | | | | | | | | | | | | | | | | | | | | |
| Municipal | | | | | | | | | | | | | | | | | | | | | | | | | | X |
| Securities Risk | | | | | | | | | | | | | | | | | | | | | | | | | | |
| | | | | | | | | | | | | | | | | | | | | | | | | | | |
| Non- | | | | X | | | | | | X | | | | | | | | X | | X | | | | | | |
| Diversification | | | | | | | | | | | | | | | | | | | | | | | | | | |
| Risk | | | | | | | | | | | | | | | | | | | | | | | | | | |
| | | | | | | | | | | | | | | | | | | | | | | | | | | |
| Non- | | X | | X | | | | X | | X | | | | | | | | | | | | | | X | | |
| Investment- | | | | | | | | | | | | | | | | | | | | | | | | | | |
| Grade Debt | | | | | | | | | | | | | | | | | | | | | | | | | | |
| Securities Risk | | | | | | | | | | | | | | | | | | | | | | | | | | |
| | | | | | | | | | | | | | | | | | | | | | | | | | | |
| Options Risk | | X | | | | | | | | | | | | | | | | | | | | | | | | |
| | | | | | | | | | | | | | | | | | | | | | | | | | | |
| Other | | | | X | | | | | | X | | | | | | | | | | | | | | | | |
| Investment | | | | | | | | | | | | | | | | | | | | | | | | | | |
| Companies Risk | | | | | | | | | | | | | | | | | | | | | | | | | | |
| | | | | | | | | | | | | | | | | | | | | | | | | | | |
| Portfolio | | X | | X | | | | | | X | | | | | | | | | | | | X | | | | X |
| Turnover Risk | | | | | | | | | | | | | | | | | | | | | | | | | | |
| | | | | | | | | | | | | | | | | | | | | | | | | | | |
| Preferred Stock | | | | X | | | | | | X | | | | | | | | | | | | | | | | |
| Risk | | | | | | | | | | | | | | | | | | | | | | | | | | |
| | | | | | | | | | | | | | | | | | | | | | | | | | | |
| Prepayment | | | | | | | | | | | | | | | | | | | | | | | | X | | X |
| Risk | | | | | | | | | | | | | | | | | | | | | | | | | | |
| | | | | | | | | | | | | | | | | | | | | | | | | | | |
| Real Estate | | | | | | | | | | | | | | | | | | | | | | | | | | |
| Industry Risk | | | | | | | | | | | | | | | | | | | | | | | | | | |
| | | | | | | | | | | | | | | | | | | | | | | | | | | |
| REITs Risk | | | | | | | | | | | | | | | | X | | | | | | | | | | |
| | | | | | | | | | | | | | | | | | | | | | | | | | | |
| Repurchase | | | | | | | | | | | | | | | | | | | | | | | | | | X |
| Agreement Risk | | | | | | | | | | | | | | | | | | | | | | | | | | |
| | | | | | | | | | | | | | | | | | | | | | | | | | | |
| Rule 144A | | | | X | | | | | | X | | | | | | | | | | | | | | | | |
| Securities Risk | | | | | | | | | | | | | | | | | | | | | | | | | | |
| | | | | | | | | | | | | | | | | | | | | | | | | | | |
| Sector Focus | | | | | | | | | | | | | | | | | | X | | | | | | | | |
| Risk | | | | | | | | | | | | | | | | | | | | | | | | | | |
| Short Sale Risk | | | | X | | | | | | X | | | | | | | | | | | | | | | | |
| | | | | | | | | | | | | | | | | | | | | | | | | | | |
| Sovereign Debt | | X | | | | | | | | | | | | | | | | | | | | | | | | |
| Risk | | | | | | | | | | | | | | | | | | | | | | | | | | |
| | | | | | | | | | | | | | | | | | | | | | | | | | | |
| Small Cap Risk | | | | X | | X | | | | X | | | | | | X | | | | X | | X | | | | |
| | | | | | | | | | | | | | | | | | | | | | | | | | | |
| Socially | | | | | | | | | | | | | | | | X | | | | | | | | | | |
| Responsible | | | | | | | | | | | | | | | | | | | | | | | | | | |
| Investing Risk | | | | | | | | | | | | | | | | | | | | | | | | | | |
| | | | | | | | | | | | | | | | | | | | | | | | | | | |
| Swap | | X | | | | | | | | | | | | | | | | | | | | | | | | |
| Agreements | | | | | | | | | | | | | | | | | | | | | | | | | | |
| Risk | | | | | | | | | | | | | | | | | | | | | | | | | | |
| | | | | | | | | | | | | | | | | | | | | | | | | | | |
| Value Investing | | | | | | | | | | | | | | X | | | | | | | | X | | | | |
| Risk | | | | | | | | | | | | | | | | | | | | | | | | | | |
| | | | | | | | | | | | | | | | | | | | | | | | | | | |
| U.S. | | X | | | | | | | | | | | | | | | | | | | | | | X | | X |
| Government | | | | | | | | | | | | | | | | | | | | | | | | | | |
| Agencies | | | | | | | | | | | | | | | | | | | | | | | | | | |
| Securities Risk | | | | | | | | | | | | | | | | | | | | | | | | | | |
Asset-Backed Securities Risk: Asset-backed securities are fixed-income securities backed by other assets such as credit card, automobile or consumer loan receivables, retail installment loans, or participations in pools of leases. Credit support for these securities may be based on the underlying assets and/or provided through credit enhancements by a third party. Even with a credit enhancement by a third party, there is still risk of loss. There could be inadequate collateral or no collateral for asset-backed securities. The values of these securities are sensitive to changes in the credit quality of the underlying collateral, the credit strength of the credit enhancement, changes in interest rates and, at times, the financial condition of the issuer. Some asset-backed securities also may receive prepayments that can change the securities’ effective durations.
Convertible Securities Risk: Convertible securities are subject to the risks of both debt securities and equity securities. The values of convertible securities tend to decline as interest rates rise and, due to the conversion feature, tend to vary with fluctuations in the market value of the underlying security.
Credit Risk: The fixed-income securities in the Fund’s portfolio are subject to the possibility that a deterioration, whether sudden or gradual, in the financial condition of an issuer, or a deterioration in general economic conditions, could cause an issuer to fail to make timely payments of principal or interest when due. This may cause the issuer’s securities to decline in value. Credit risk is particularly relevant to those portfolios that invest a significant amount of their assets in non-investment grade (or “junk”) bonds or lower-rated securities.
Depositary Receipts Risk: Foreign receipts, which include American Depository Receipts (“ADRs”), Global Depositary Receipts and European Depositary Receipts, are securities that evidence ownership interests in a security or a pool of securities issued by a foreign issuer. The risks of depositary receipts include many risks associated with investing directly in foreign securities, such as individual country risk and liquidity risk. Unsponsored ADRs, which are issued by a depositary bank without the participation or consent of the issuer, involve additional risks because U.S. reporting requirements do not apply and the issuing bank will recover shareholder distribution costs from movement of share prices and payment of dividends.
Derivatives Risk: In general terms, a derivative instrument is one whose value depends on (or is derived from) the value of an underlying asset, interest rate or index. The use of derivatives may expose the Fund to additional risks that it would not be subject to if it invested directly in the securities underlying those derivatives. Risks associated with derivatives may include correlation risk, which is the risk that the derivative does not correlate well with the security, index, or currency to which it relates. Other risks include liquidity risk, which is the risk that the Fund may be unable to sell or close out the derivative due to an illiquid market, counterparty risk, which is the risk that the counterparty to a derivative instrument may be unwilling or unable to make required payments or otherwise meet its obligations, and leverage risk, which is the risk that a derivative could expose the Fund to magnified losses resulting from leverage. The use of derivatives for hedging purposes may result in losses that partially or completely offset gains in portfolio positions. Using derivatives can increase the volatility of the Fund’s share price. For some derivatives, it is possible for the Fund to lose more than the amount invested in the derivative instrument. Derivatives may, for federal income tax purposes, affect the character of gain and loss realized by the Fund, accelerate recognition of income to the Fund, affect the holding periods for certain of the Fund’s assets and defer recognition of certain of the Fund’s losses. The Fund’s ability to invest in derivatives may be restricted by certain provisions of the federal income tax laws relating to the Fund’s qualification as a regulated investment company (“RIC”). These additional risks could cause the Fund to experience losses to which it would otherwise not be subject.
| • | Forward Currency Exchange Contract Risk: A forward foreign currency exchange contract is an agreement to buy or sell a specific currency at a future date and at a price set at the time of the contract. Forward foreign currency exchange contracts may reduce the risk of loss from a change in value of a currency, but they also limit any potential gains, and do not protect against fluctuations in the value of the underlying position and are subject to counterparty risk. The forecasting of currency market movement is extremely difficult, and whether any hedging strategy will be successful is highly |
| | uncertain. Moreover, it is impossible to forecast with precision the market value of portfolio securities at the expiration of a forward foreign currency contract. Accordingly, a Fund may be required to buy or sell additional currency on the spot market (and bear the expense of such transaction) if the sub-advisor’s predictions regarding the movement of foreign currency or securities markets prove inaccurate. Because foreign currency forward contracts are privately negotiated transactions, there can be no assurance that a Fund will have flexibility to rollover a forward foreign currency contract upon its expiration if it desires to do so. Additionally, there can be no assurance that the other party to the contract will perform its services under the contract. |
| | |
| • | Futures Contracts Risk: Futures contracts provide for the future sale by one party and purchase by another party of a specified amount of a specific security at a specified future time and at a specified price. An option on a futures contract gives the purchaser the right, in exchange for a premium, to assume a position in a futures contract at a specified exercise price during the term of the option. There are risks associated with these activities, including the following: (1) the success of a hedging strategy may depend on an ability to predict movements in the prices of individual securities, fluctuations in markets and movements in interest rates; (2) there may be an imperfect or no correlation between the changes in market value of the securities held by a Fund and the prices of futures and options on futures; (3) there may not be a liquid secondary market for a futures contract or option; (4) trading restrictions or limitations may be imposed by an exchange; and (5) government regulations may restrict trading in futures contracts and futures options. |
| | |
| • | Options Risk: Options trading is a highly specialized activity that involves investment techniques and risks different from those associated with ordinary portfolio securities transactions. The value of options can be highly volatile, and their use can result in loss if the Sub-Advisor is incorrect in its expectation of price fluctuations. The successful use of options for hedging purposes also depends in part on the ability of the Sub-Advisor to predict future price fluctuations and the degree of correlation between the options and securities markets. When options are purchased over the counter, the Fund bears counterparty risk, which is the risk that the counterparty that wrote the option will be unable or unwilling to perform its obligations under the option contract. Such options may also be illiquid, and in such cases, the Fund may have difficulty closing out its position. |
| | |
| • | Swap Agreements Risk: Swap agreements (“swaps”) are individually negotiated and structured to include exposure to a variety of different types of investments or market factors, such as interest rates, foreign currency rates, mortgage securities, corporate borrowing rates, security prices, indexes or inflation rates. Swaps may increase or decrease the overall volatility of the investments of the Fund and its share price. The performance of swaps may be affected by a change in the specific interest rate, currency, or other factors that determine the amounts of payments due to and from the Fund. If a swap calls for payments by the Fund, the Fund must be prepared to make such payments when due. Additionally, if the counterparty’s creditworthiness declines, the value of a swap may decline. If the counterparty is unable to meet its obligations under the contract, declares bankruptcy, defaults, or becomes insolvent, the Fund may not be able to recoup the money it expected to receive under the contract. Finally, a swap can be a form of leverage, which can magnify the Fund’s gains or losses. |
Emerging Markets Risk: Emerging markets may be more likely to experience political turmoil or rapid changes in market or economic conditions than more developed countries. In addition, the financial stability of issuers (including governments) in emerging market countries may be more precarious than that of issuers in other countries. As a result, there will tend to be an increased risk of price volatility associated with a Fund’s investments in securities of issuers located in emerging market countries, which may be magnified by currency fluctuations relative to the U.S. dollar.
Equity Securities Risk: A Fund is subject to the risk that stock prices will fall (or, for Touchstone Arbitrage Fund and Touchstone Merger Arbitrage Fund, rise with respect to short positions) over short or extended periods of time. Individual companies may report poor results or be negatively affected by industry and/or economic trends and developments. The prices of securities issued by these companies may decline in response to such developments, which could result in a decline in the value of the Fund’s shares. Conversely, the risk of price increases with respect to securities sold short will also cause a decline in the value of the Fund’s shares. These factors contribute to price volatility. In addition, common stocks represent a share of ownership in a company, and rank after bonds and preferred stock in their claim on the company’s assets in the event of liquidation.
| • | Large-Cap Risk: The Fund is subject to the risk that stocks of larger companies may underperform relative to those of small and mid-sized companies. Large-cap companies may be unable to respond quickly to new competitive challenges, such as changes in technology and consumer tastes, and also may not be able to attain the high growth rate of successful smaller companies, especially during extended periods of economic expansion. |
| | |
| • | Mid-Cap Risk: The Fund is subject to the risk that medium capitalization stocks may underperform other types of stocks or the equity markets as a whole. Stocks of mid-sized companies may be subject to more abrupt or erratic market |
| | movements than stocks of larger, more established companies. Mid-sized companies may have limited product lines or financial resources, and may be dependent upon a particular niche of the market. |
| | |
| • | Small-Cap Risk: The Fund is subject to the risk that small capitalization stocks may underperform other types of stocks or the equity markets as a whole. Stocks of smaller companies may be subject to more abrupt or erratic market movements than stocks of larger, more established companies. Small companies may have limited product lines or financial resources, or may be dependent upon a small or inexperienced management group. In addition, small cap stocks typically are traded in lower volume; may be less liquid and their issuers typically are subject to greater degrees of changes in their earnings and prospects. |
Fixed-Income Risk: The market values of the Fund’s fixed-income securities respond to economic developments, particularly interest rate changes, as well as to perceptions about the creditworthiness of individual issuers, including governments. Generally, the Fund’s fixed-income securities will decrease in value if interest rates rise and increase in value if interest rates fall. Normally, the longer the maturity or duration of the fixed-income securities the Fund owns, the more sensitive the value of the Fund’s shares will be to changes in interest rates.
Foreign Securities Risk: Investing in foreign securities poses additional risks since political and economic events unique in a country or region will affect those markets and their issuers, while such events may not necessarily affect the U.S. economy or issuers located in the United States. In addition, investments in foreign securities are generally denominated in foreign currency. As a result, changes in the value of those currencies compared to the U.S. dollar may affect the value of the Fund’s investments. These currency movements may happen separately from, or in response to, events that do not otherwise affect the value of the security in the issuer’s home country. There is a risk that issuers of foreign securities may not be subject to accounting standards or governmental supervision comparable to those to which U.S. companies are subject and that less public information about their operations may exist. There is risk associated with the clearance and settlement procedures in non-U.S. markets, which may be unable to keep pace with the volume of securities transactions and may cause delays. Foreign markets may be less liquid and more volatile than U.S. markets and offer less protection to investors. Over-the-counter securities may also be less liquid than exchange-traded securities. Investments in securities of foreign issuers may be subject to foreign withholding and other taxes. In addition. it may be more difficult and costly for the Fund to seek recovery from an issuer located outside the United States in the event of a default on a portfolio security or an issuer’s insolvency proceeding. To the extent a Fund focuses its investments in a single country or only a few countries in a particular geographic region, economic, political, regulatory or other conditions affecting such country or region may have a greater impact on Fund performance relative to a more geographically diversified fund.
Foreign securities held by a Fund may trade on exchanges that close before the time a Fund’s daily net asset value is calculated (typically the close of regular trading on the New York Stock Exchange). If an event that may change the value of a foreign security occurs after the time that the closing value of the security on the non-U.S. exchange is determined but before the calculation of a Fund’s net asset value, the closing price of the foreign security may be stale at the time a Fund calculates it net asset value, requiring such security to be fair valued. This may cause the value of the foreign security on the books of a Fund to be significantly different from the closing value on the non-U.S. exchange and may affect the calculation of the Fund’s net asset value.
Growth-Investing Risk: Growth oriented funds may underperform when value investing is in favor and growth stocks may be more volatile than other stocks because they are more sensitive to investor perceptions of the issuing company’s growth of earnings potential.
Interest Rate Risk: As interest rates rise, the value of fixed-income securities the Fund owns will likely decrease. The price of debt securities is generally linked to prevailing market interest rates. In general, when interest rates rise, the prices of debt securities fall, and when interest rates fall, the prices of debt securities rise. The price volatility of a debt security also depends on its maturity. Longer-term securities are generally more volatile, so the longer the average maturity or duration of these securities, the greater their price risk. Duration is a measure of the expected life, taking into account any prepayment or call features, of a security, that is used to determine the price sensitivity of the security for a given change in interest rates. Specifically, duration is the change in the value of a fixed-income security that will result from a 1% change in interest rates, and generally is stated in years. For example, as a general rule a 1% rise in interest rates means a 1% fall in value for every year of duration. Maturity, on the other hand, is the date on which a fixed-income security becomes due for payment of principal. There may be less governmental intervention in the securities markets in the near future. The negative impact on fixed-income securities if interest rates increase as a result could negatively impact the Fund’s net asset value.
Investment-Grade Debt Securities Risk: Investment-grade debt securities may be downgraded by a nationally recognized statistical rating organization (“NRSRO”) to below-investment-grade status, which would increase the risk of holding these securities. Investment-grade debt securities rated in the lowest rating category by a NRSRO involve a higher degree of risk than fixed-income securities with higher credit ratings. While such securities are considered investment-grade quality and are deemed
to have adequate capacity for payment of principal and interest, such securities lack outstanding investment characteristics and may share certain speculative characteristics with non-investment-grade securities.
Leverage Risk: Leverage occurs when the Fund uses borrowings, derivatives (such as futures or options), or similar instruments or techniques to gain exposure to investments in an amount that exceeds the Fund’s initial investment. The use of leverage magnifies changes in the Fund’s net asset value and thus may result in increased portfolio volatility and increased risk of loss. Leverage can create an interest expense that may lower the Fund’s overall returns. There can be no guarantee that a leveraging strategy will be successful.
Management Risk: In managing the Fund’s portfolio, the Advisor engages one or more sub-advisors to make investment decisions for a portion of or the entire portfolio. There is a risk that the Advisor may be unable to identify and retain sub-advisors who achieve superior investment returns relative to other similar sub-advisors. The value of your investment may decrease if the sub-advisor incorrectly judges the attractiveness, value, or market trends affecting a particular security, issuer, industry, or sector.
Merger Arbitrage Risk: Investments in companies that are expected to be, or already are, the subject of a publicly announced transaction carry the risk that the proposed or expected transaction may not be completed or may be completed on less favorable terms than originally expected, which may lower the Fund’s performance.
Mortgage-Backed Securities Risk: Mortgage-backed securities are fixed-income securities representing an interest in a pool of underlying mortgage loans. Mortgage-backed securities are sensitive to changes in interest rates, but may respond to these changes differently from other fixed-income securities due to the possibility of prepayment of the underlying mortgage loans. As a result, it may not be possible to determine in advance the actual maturity date or average life of a mortgage-backed security. Rising interest rates tend to discourage refinancing, with the result that the average life and volatility of the security will increase, exacerbating its decrease in market price. When interest rates fall, however, mortgage-backed securities may not gain as much in market value because of the expectation of additional mortgage prepayments that must be reinvested at lower interest rates. Prepayment risk may make it difficult to calculate the average duration of the Fund’s mortgage-backed securities and, therefore, to fully assess the interest rate risk of the Fund. An unexpectedly high rate of defaults on the mortgages held by a mortgage pool may adversely affect the value of mortgage-backed securities and could result in losses to a Fund. The risk of such defaults is generally higher in the cases of mortgage pools that include subprime mortgages. Subprime mortgages refer to loans made to borrowers with weakened credit histories or with lower capacity to make timely payments on their mortgages. In addition, mortgage-backed securities may fluctuate in price based on deterioration in the perceived or actual value of the collateral underlying the pool of mortgage loans, typically residential or commercial real estate, which may result in negative amortization or negative equity meaning that the value of the collateral would be worth less than the remaining principal amount owed on the mortgages in the pool.
Mortgage Dollar Roll Risk: Mortgage “dollar rolls” are transactions in which mortgage-backed securities are sold for delivery in the current month and the seller simultaneously contracts to repurchase substantially similar securities on a specified future date. The difference between the sale price and the purchase price (plus any interest earned on the cash proceeds of the sale) is netted against the interest income foregone on the securities sold to arrive at an implied borrowing rate. Alternatively, the sale and purchase transactions can be executed at the same price, with the Fund being paid a fee as consideration for entering into the commitment to purchase. If the broker-dealer to whom the Fund sells the security becomes insolvent, the Fund’s right to repurchase the security may be restricted. Other risks involved in entering into mortgage dollar rolls include the risk that the value of the security may change adversely over the term of the mortgage dollar roll and that the security the Fund is required to repurchase may be worth less than the security that the Fund originally held.
Municipal Securities Risk: The value of municipal securities may be affected by uncertainties in the municipal market related to legislation or litigation involving the taxation of municipal securities or the rights of municipal securities holders in the event of bankruptcy. In addition, a downturn in the national economy may negatively impact the economic performance of issuers of municipal securities, and may increase the likelihood that issuers of securities in which the Fund may invest may be unable to meet their obligations. Also, some municipal obligations may be backed by a letter of credit issued by a bank or other financial institution. Adverse developments affecting banks or other financial institutions could have a negative effect on the value of the Fund’s portfolio securities.
Non-Diversification Risk: A non-diversified Fund may invest a significant percentage of its assets in the securities of a single issuer or limited number of issuers. As a result, the Fund may be more sensitive to economic, political, and regulatory developments relating to the issuer or group of issuers in which it invests than a diversified fund. This may increase the volatility of the Fund’s investment performance.
Non-Investment-Grade Debt Securities Risk: Non-investment-grade debt securities are sometimes referred to as “junk bonds” and are considered speculative with respect to their issuers’ ability to make payments of interest and principal. There is a high risk that the Fund could suffer a loss from investments in non-investment-grade debt securities caused by the default of an issuer of such securities. Part of the reason for this high risk is that non-investment grade debt securities are generally unsecured and therefore, in the event of a default or bankruptcy, holders of non-investment-grade debt securities generally will not receive payments until the holders of all other debt have been paid. In addition, the market for non-investment-grade debt securities has, in the past, had more frequent and larger price changes than the markets for other securities. Changes in economic conditions or other circumstances are more likely to lead to a weakened capacity to make principal and interest payments than is the case with higher-grade securities. Non-investment-grade debt securities can also be more difficult to sell for good value. These securities are often thinly traded and can be more difficult to sell and value accurately than investment grade securities. Because objective pricing data may be less readily available, judgment may play a greater role in the valuation process.
Other Investment Companies Risk: The Fund’s investments in other investment companies, such as exchange-traded funds (“ETFs”) and closed-end funds, will be subject to substantially the same risks as those associated with the direct ownership of the securities comprising the portfolios of such investment companies, and the value of the Fund’s investment will fluctuate in response to the performance of such portfolios. The value of the shares of closed-end funds may be lower than the value of the portfolio securities held by the closed-end fund. Also, although many ETFs seek to provide investment results that correspond generally to the price and yield performance of a particular market index, the price movement of an ETF may not track the underlying index. In addition, if the Fund acquires shares of investment companies, shareholders of the Fund will bear both their proportionate share of the fees and expenses of the Fund (including management and advisory fees) and, indirectly, the fees and expenses of the investment companies. There may also not be an active trading market available for shares of some investment companies. Additionally, trading of investment company shares may be halted or delisted by the listing exchange. To the extent the Fund is held by an affiliated fund, the ability of the Fund itself to hold other investment companies may be limited.
Portfolio Turnover Risk: Each Fund may sell its portfolio securities, regardless of the length of time that they have been held, if the sub-advisor determines that it would be in the Fund’s best interest to do so. It may be appropriate to buy or sell portfolio securities due to economic, market, or other factors that are not within the sub-advisor’s control. These transactions will increase a Fund’s “portfolio turnover.” A 100% portfolio turnover rate would occur if all of the securities in the Fund were replaced during a given period. Frequent and active trading may result in greater expenses to the Fund, which may lower the Fund’s performance and may result in the realization of substantial capital gains, including net short-term capital gains. As a result, high portfolio turnover may reduce the Fund’s returns.
Preferred Stock Risk: Preferred stock represents an equity interest in an issuer that pays dividends at a specified rate and that has precedence over common stock in the payment of dividends. In the event an issuer is liquidated or declares bankruptcy, the claims of owners of bonds take precedence over the claims of those who own preferred and common stock. If interest rates rise, the fixed dividend on preferred stocks may be less attractive, causing the price of preferred stocks to decline. Preferred stock may have mandatory sinking fund provisions, as well as provisions allowing the stock to be called or redeemed prior to its maturity, both of which can have a negative impact on the stock’s price when interest rates decline.
Prepayment Risk: Prepayment risk is the risk that a debt security may be paid off and proceeds invested earlier than anticipated. Prepayment impacts both the interest rate sensitivity of the underlying asset, such as an asset-backed or mortgage-backed security, and its cash flow projections. Prepayment risk is more prevalent during periods of falling interest rates. When interest rates decline it is more likely that the borrower will refinance the loan that is included in the security. This means the Fund would receive a larger-than-expected cash flow and it must then reinvest the cash received upon prepayment when yields have fallen (i.e., at a rate lower than the rate paid by the previous security). Therefore, prepayment risk may make it difficult to calculate the average duration of the Fund’s asset- or mortgage-backed securities which in turn would make it difficult to assess the interest rate risk of the Fund.
Real Estate Industry Risk: Since the Fund’s investments are concentrated in the real estate industry, they are subject to the risk that the real estate industry will underperform the broader market, as well as the risk that issuers in the industry will be similarly impacted by market conditions, legislative or regulatory changes, or competition. Risks associated with investments in the real estate industry include, among others: possible declines in the value of real estate; possible declines in rental rates; risks related to general and local economic conditions; possible lack of availability of mortgage financing, variations in rental income, neighborhood values or the appeal of property to tenants; interest rates; overbuilding; extended vacancies of properties; increases in competition, property taxes and operating expenses; and changes in zoning laws. The securities of issuers that own, construct, manage or sell commercial real estate (e.g. shopping malls, office buildings, apartment buildings, warehouses, hotels, etc.) may be affected by economic conditions, generally, and specifically by changes in real estate values and property taxes, overbuilding, variations in rental income and vacancy rates in terms of supply and demand, interest rates and changes in tax and regulatory requirements, such as those relating to the environment. Performance of a particular real estate security also may depend on the structure, cash flow, and management skill of the particular company. The real estate industry is particularly sensitive to economic
downturns and changes in credit markets. The values of companies in the real estate industry may go through cycles of relative under-performance in comparison to equity securities markets in general.
REITs Risk: REITs are pooled investment vehicles that primarily invest in commercial real estate or real estate-related loans. REITs are susceptible to the risks associated with direct ownership of real estate, such as declines in property values and rental rates, increases in property taxes, operating expenses, rising interest rates or competition, overbuilding, zoning changes, and losses from casualty or condemnation. REITs typically incur fees that are separate from those of the Fund. Accordingly, the Fund’s investments in REITs will result in the layering of expenses, such that shareholders will indirectly bear a proportionate share of the REITs’ operating expenses, in addition to paying Fund expenses. Mortgage REITs may be affected by the quality of the credit extended. Furthermore, REITs are dependent on specialized management skills. Some REITs may have limited diversification and may be subject to risks inherent in financing a limited number of properties. REITs depend generally on their ability to generate cash flow to make distributions to shareholders or unitholders, and may be subject to defaults by borrowers and to self-liquidations. In addition, a REIT may be affected by its failure to qualify for tax-free pass-through of income under the Internal Revenue Code of 1986, as amended, or its failure to maintain exemption from registration under the 1940 Act.
Repurchase Agreement Risk: Under all repurchase agreements entered into by the Fund, the Fund’s custodian or its agent must take possession of the underlying collateral. However, if the counterparty defaults, the Fund could realize a loss on the sale of the underlying security to the extent that the proceeds of sale, including accrued interest, are less than the resale price provided in the agreement including interest. In addition, even though the Bankruptcy Code provides protection for most repurchase agreements, if the seller should be involved in bankruptcy or insolvency proceedings, the Fund may incur delay and costs in selling the underlying security or may suffer a loss of principal and interest if the Fund is treated as an unsecured creditor and is required to return the underlying security to the seller’s estate. Repurchase agreements are considered loans by the Fund.
Rule 144A Securities Risk: Rule 144A securities are restricted securities that may be purchased only by qualified institutional buyers in reliance on an exemption from federal registration requirements. Investing in Rule 144A securities may reduce the liquidity of the Fund’s portfolio if an adequate institutional trading market for these securities does not exist. The Fund may be unable to sell Rule 144A securities at advantageous prices or times, or at all, if an insufficient number of qualified institutional buyers is interested in purchasing such securities. Prices of Rule 144A securities often reflect a discount, which may be significant, from the market price of comparable exchange-listed securities for which a liquid trading market exists. The Fund may also have to bear the expense of registering Rule 144A securities for resale and the risk of substantial delays in effecting the registration.
Sector Focus Risk: The Fund may invest a high percentage of its assets in specific sectors of the market in order to achieve a potentially greater investment return. As a result, the Fund may be more susceptible to economic, political, and regulatory developments in a particular sector of the market, positive or negative, and may experience increased volatility of the Fund’s net asset value with a magnified effect on the total return.
Short Sales Risk: In a short sale, the Fund sells a security or other financial instrument, such as a futures contract, that it does not own. To complete the transaction, the Fund must borrow the security to make delivery to the buyer. The Fund is then obligated to replace the borrowed security by purchasing the security at the market price at the time of replacement. If the price of the security sold short rises between the time the Fund sells the security short and the time the Fund replaces the security sold short, the Fund will realize a loss on the transaction. Although the Fund’s potential gain on a short sale is limited to the amount at which the Fund sells the security short, the Fund’s potential loss on a short sale is limited only by the maximum attainable price of the security less the price at which the security was sold short.
Short sales may also be used as part of an arbitrage strategy in which a Fund purchases one security while simultaneously short selling a related security in order to capture the price discrepancies between the two securities. For example, a Fund may purchase an issuer’s convertible bond while simultaneously short selling that issuer’s common stock. To close the transaction, the Fund must purchase the security that was being sold short in order to make delivery to the buyer.
If a Fund is only short selling the security and not engaging in an arbitrage strategy, then it is obligated to replace the security borrowed by purchasing the security at the market price at the time of replacement. The price at such time may be higher or lower than the price at which the security was sold by the Fund. If the underlying security goes down in price between the time the Fund sells the security and buys it back, the Fund will realize a gain on the transaction. Conversely, if the underlying security goes up in price during the period, the Fund will realize a loss on the transaction. Any such loss is increased by the amount of premium or interest the Fund must pay to the lender of the security. Likewise, any gain will be decreased by the amount of premium or interest the Fund must pay to the lender of the security. The Fund is also required to segregate or earmark other assets on its books to cover its obligation to return the security to the lender, which means that those other assets may not be available to meet the Fund’s needs for immediate cash or other liquidity. The Fund’s investment performance may also suffer if the Fund is required to close out a short position earlier than it had intended. This would occur if the securities lender required the Fund to deliver the
borrowed securities and the Fund was unable to borrow the securities from another securities lender or otherwise obtain the securities by other means. In addition, the Fund may be subject to expenses related to short sales that are not typically associated with investing in securities directly, such as costs of borrowing and margin account maintenance costs associated with the Fund’s open short positions. These expenses negatively impact the performance of the Fund. For example, when the Fund short sells an interest-bearing security, such as a bond, it is obligated to pay the interest on the security it has sold. This cost is partially offset by the interest earned by the Fund on the investment of the cash generated by the short sale. When the Fund sells short an equity security that pays a dividend, the Fund must pay out the dividend rate of the equity security to the lender, record this as an expense of the Fund and reflect the expense in the financial statements. However, a dividend paid on a security sold short generally has the effect of reducing the market value of the shorted security and thus increases the Fund’s unrealized gain or reduces the Fund’s unrealized loss on its short sale transaction. To the extent that the interest rate or dividend that the Fund is obligated to pay is greater than the interest earned by the Fund on investments, the performance of the Fund will be negatively impacted. These types of short sales expenses are sometimes referred to as the “negative cost of carry,” and will tend to cause the Fund to lose money on a short sale even in instances where the price of the underlying security sold short does not change over the duration of the short sale.
If a Fund is using short sales as part of an arbitrage strategy, then in addition to the risks above it is also exposed to the risk that both the short position and long position may simultaneously decline in their respective values, thereby increasing the potential losses to the Fund when compared with just a long only or short only position.
Socially Responsible Investing Risk: The Fund’s social and environmental screening criteria may cause the Fund to forgo opportunities to buy certain securities, or forgo opportunities to gain exposure to certain industries, sectors, regions and countries. In addition, the Fund may be required to sell a security when it might otherwise be disadvantageous for it to do so.
Value Investing Risk: Value investing presents the risk that the Fund’s securities holdings may never reach their full market value because the market fails to recognize what the portfolio managers consider the true business value or because the portfolio manager has misjudged those values. In addition, value investing may fall out of favor and underperform growth or other styles of investing during given certain periods.
U.S. Government Agencies Securities Risk: Certain U.S. government agency securities are backed by the right of the issuer to borrow from the U.S. Treasury while others are supported only by the credit of the issuer or instrumentality. While the U.S. government is able to provide financial support to U.S. government-sponsored agencies or instrumentalities, no assurance can be given that it will always do so. Such securities are neither issued nor guaranteed by the U.S. Treasury.
Where Can I Find Information About the Funds’ Portfolio Holdings Disclosure Policies?
A description of the Funds’ policies and procedures for disclosing portfolio securities to any person is available in the SAI and can also be found on the Funds’ website at TouchstoneInvestments.com.
THE FUNDS’ MANAGEMENT
Investment Advisor
Touchstone Advisors, Inc. (“Touchstone Advisors”)
303 Broadway, Suite 1100, Cincinnati, Ohio 45202
Touchstone Advisors has been a registered investment advisor since 1994. As of December 31, 2016, Touchstone Advisors had approximately $14.4 billion in assets under management. As the Funds’ Advisor, Touchstone Advisors reviews, supervises, and administers the Funds’ investment programs and also ensures compliance with the Funds’ investment policies and guidelines.
Touchstone Advisors is responsible for selecting each Fund’s sub-advisor(s), subject to approval by the Board. Touchstone Advisors selects a sub-advisor that has shown good investment performance in its areas of expertise. Touchstone Advisors considers various factors in evaluating a sub-advisor, including:
| • | Level of knowledge and skill; |
| • | Performance as compared to its peers or benchmark; |
| • | Consistency of performance over 5 years or more; |
| • | Level of compliance with investment rules and strategies; |
| • | Employees’ facilities and financial strength; and |
| • | Quality of service. |
Touchstone Advisors will also continually monitor each sub-advisor’s performance through various analyses and through in-person, telephone, and written consultations with a sub-advisor. Touchstone Advisors discusses its expectations for performance with each sub-advisor and provides evaluations and recommendations to the Board of Trustees, including whether or not a sub-advisor’s contract should be renewed, modified, or terminated.
The SEC has granted an exemptive order that permits Touchstone Funds Group Trust (the “Trust”), of which each Fund described in this prospectus is a series, or Touchstone Advisors, under certain conditions, to select or change unaffiliated sub-advisors, enter into new sub-advisory agreements, or amend existing sub-advisory agreements without first obtaining shareholder approval. The Funds must still obtain shareholder approval of any sub-advisory agreement with a sub-advisor affiliated with the Trust or Touchstone Advisors other than by reason of serving as a sub-advisor to one or more Funds.
Two or more sub-advisors may manage a Fund, from time to time, with each managing a portion of the Fund’s assets. If a Fund has more than one sub-advisor, Touchstone Advisors allocates how much of a Fund’s assets are managed by each sub-advisor. Touchstone Advisors may change these allocations from time to time, often based upon the results of its evaluations of the sub-advisors.
Touchstone Advisors is also responsible for running all of the operations of the Funds, except those that are subcontracted to a sub-advisor, custodian, transfer agent, sub-administrative agent or other parties. For its services, Touchstone Advisors is entitled to receive an investment advisory fee from each Fund at an annualized rate, based on the average daily net assets of the Fund. The Annual Fee Rate below is the fee paid to Touchstone Advisors by each Fund for the fiscal year ended September 30, 2016. Touchstone Advisors pays sub-advisory fees to each sub-advisor from its advisory fee.
| Fund | | Annual Fee Rate |
| Touchstone Active Bond Fund | | 0.40% of average daily net assets |
| Touchstone Arbitrage Fund | | 1.05% of average daily net assets |
| Touchstone Emerging Markets Small Cap Fund | | 1.05% of average daily net assets |
| Touchstone High Yield Fund | | 0.52% of average daily net assets |
| Touchstone Merger Arbitrage Fund | | 1.05% of average daily net assets |
| Touchstone Mid Cap Fund | | 0.79% of average daily net assets |
| Touchstone Mid Cap Value Fund | | 0.81% of average daily net assets |
| Touchstone Premium Yield Equity Fund | | 0.68% of average daily net assets |
| Touchstone Sands Capital Select Growth Fund | | 0.57%* of average daily net assets |
| Touchstone Small Cap Fund | | 0.85% of average daily net assets |
| Touchstone Small Cap Value Fund | | 0.90% of average daily net assets |
| Touchstone Total Return Bond Fund | | 0.35% of average daily net assets |
| Touchstone Ultra Short Duration Fixed Income Fund | | 0.25% of average daily net assets |
*The Touchstone Sands Capital Select Growth Fund’s base advisory fee is 0.85% on the first $1 billion of assets, 0.80% on the next $500 million of assets, 0.75% on the next $500 million of assets and 0.70% on assets above $2 billion, and this fee may range from 0.55% to 1.00% depending on the Fund’s performance relative to the Russell 1000® Growth Index. Fee adjustments apply if the Fund outperforms or underperforms its benchmark by 2.50% or more over the performance period.
Touchstone Advisors and Sands Capital Management will receive performance fees (as described above) if the relevant benchmark index is surpassed, and the base fee will be adjusted downward for negative performance. Under certain market conditions, it is possible that the performance fee adjustment (upward or downward) will apply as a result of random moves in the market as opposed to the Touchstone Sands Capital Select Growth Fund’s underperformance or outperformance of the market. The performance comparison is made for a rolling 12-month period, consisting of the current month for which performance is available plus the previous 11 months. This comparison is made at the end of each month, with appropriate performance-based adjustments added to (or subtracted from) the base advisory fee. Because any adjustment to the Fund’s base advisory fee is based upon the Fund’s performance compared to the investment record of the Russell 1000® Growth Index, a performance adjustment will be made not when the Fund’s performance is up or down, but when it is up or down more or less than the performance of the Russell 1000® Growth Index. For purposes of this performance adjustment mechanism, the investment performance of the Fund for any period is expressed as a percentage of the Fund’s net asset value per share at the beginning of the period. This percentage is equal to the sum of: (i) the change in the Fund’s net asset value per share during the period; (ii) the value of the Fund’s cash distributions per share; and (iii) the per share amount of capital gains taxes paid or accrued during the period by the Fund for undistributed
realized long-term capital gains. The investment record for the Russell 1000® Growth Index is expressed as a percentage of the starting level of the Index at the beginning of the period, as modified by the change in the level of the Index during the period and by the value computed consistently with the Index, of cash distributions having an ex-dividend date occurring within the period made by issuers whose securities are included in the Index.
Advisory and Sub-Advisory Agreement Approval. A discussion of the basis for the Board of Trustees’ approval of the Funds’ advisory and sub-advisory agreements can be found in the Trust’s March 31, 2016 Semi-Annual Report and September 30, 2016 Annual Report; an updated discussion will also be included in the Trust’s March 31, 2017 Semi-Annual Report.
Fort Washington Investment Advisors, Inc. (“Fort Washington”) is an affiliate of Touchstone Advisors. Therefore, Touchstone Advisors may have a conflict of interest when making decisions to keep Fort Washington as Touchstone Active Bond Fund, Touchstone High Yield Fund and Touchstone Ultra Short Duration Fixed Income Fund’s Sub-Advisor. The Board reviews Touchstone Advisors’ decisions, with respect to the retention of Fort Washington, to reduce the possibility of a conflict of interest situation.
Additional Information
The Trustees of the Trust oversee generally the operations of the Fund and the Trust. The Trust enters into contractual arrangements with various parties, including, among others, the Fund’s investment adviser, custodian, transfer agent, accountants and distributor, who provide services to the Fund. Shareholders are not parties to, or intended (or “third-party”) beneficiaries of, any of those contractual arrangements, and those contractual arrangements are not intended to create in any individual shareholder or group of shareholders any right to enforce the terms of the contractual arrangements against the service providers or to seek any remedy under the contractual arrangements against the service providers, either directly or on behalf of the Trust.
This prospectus provides information concerning the Trust and the Fund that you should consider in determining whether to purchase shares of a Fund. The Fund may make changes to this information from time to time. Neither this prospectus, the SAI or any document filed as an exhibit to the Trust’s registration statement, is intended to, nor does it, give rise to an agreement or contract between the Trust or the Fund and any shareholder, or give rise to any contract or other rights in any individual shareholder, group of shareholders or other person other than any rights conferred explicitly by federal or state securities laws that may not be waived.
Sub-Advisors and Portfolio Managers
Copper Rock Capital Partners LLC (“Copper Rock”), an SEC-registered advisor located at 200 Clarendon Street, 51st Floor, Boston, Massachusetts 02116, serves as sub-advisor to the Emerging Markets Small Cap Fund. As sub-advisor, Copper Rock makes investment decisions for the Fund and also ensures compliance with the Fund’s investment policies and guidelines. Copper Rock was established in 2005 and also manages discretionary equity portfolios for institutional accounts. As of September 31, 2016, Copper Rock managed approximately $5.2 billion in assets. Stephen Dexter is the Chairman and Chief Investment Officer of Copper Rock. For the Fund, he serves as Co-Portfolio Manager with David Shea. David Shea, CFA, serves as the Co-Lead Portfolio Manager on Copper Rock’s Emerging Markets Small Cap strategy.
Touchstone Emerging Markets Small Cap Fund
Stephen Dexter serves as Partner and Chief Investment Officer for the Global Equities Team, positions he has held since joining Copper Rock in November 2008. Prior to joining Copper Rock, Mr. Dexter served as Managing Director and as Chief Investment Officer for the Global and International Growth Equity Team at Putnam Investments from 1999 to October 2008.
H. David Shea, CFA, serves as Partner and Portfolio Manager on the Global Equities Team, positions he has held since joining Copper Rock in November 2008. Prior to joining Copper Rock, Mr. Shea served as Senior Vice President and as Portfolio Manager on the Global and International Growth Equity Team at Putnam Investments from 2006 to October 2008.
EARNEST Partners LLC (“EARNEST”), located at 1180 Peachtree Street, Suite 2300, Atlanta, Georgia, 30309, serves as the sub-advisor to the Total Return Bond Fund. As the sub-advisor, EARNEST makes investment decisions for the Fund and also monitors compliance with the Fund’s investment policies and guidelines. EARNEST was founded in 1998 and is independently owned and operated. EARNEST is controlled by Paul Viera. Westchester Limited, LLC owns greater than 75% of EARNEST and is controlled by Paul Viera. As of September 30, 2016, EARNEST had approximately $21 billion in assets under management.
Touchstone Total Return Bond Fund
Douglas Folk, CFA, Partner, has been with EARNEST since 1999 and is jointly and primarily responsible for the management of the Fund. His prior experience includes ten years of portfolio management with Southern Farm Bureau Life Insurance Company, where he was responsible for the company’s fixed income portfolio. He has over 30 years of investment experience.
Chris Fitze, CFA, Director, is part of the Investment Management team and has been with EARNEST since 2003 and is jointly and primarily responsible for the management of the Fund. He has over 10 years of investment experience.
Fort Washington Investment Advisors, Inc. (“Fort Washington”), located at 303 Broadway, Suite 1200, Cincinnati, Ohio 45202, serves as the sub-advisor to the Touchstone Active Bond Fund, Touchstone High Yield Fund and Touchstone Ultra Short Duration Fixed Income Fund. As the sub-advisor, Fort Washington makes investment decisions for the Funds and also ensures compliance with the Touchstone Funds’ investment policies and guidelines. Fort Washington is controlled by Western & Southern. Jill T. McGruder, an interested Trustee of the Trust, may be deemed to be an affiliate of Fort Washington. As of September 30, 2016, Fort Washington had approximately $49.5 billion in assets under management.
Touchstone Active Bond Fund
Timothy J. Policinski, CFA, is the primary manager of the Touchstone Active Bond Fund. Mr. Policinski is a Managing Director and Senior Portfolio Manager. He has worked at Fort Washington and managed the Fund since 2001. Mr. Policinski has over 20 years of fixed income management experience.
Daniel J. Carter, CFA, is the secondary manager of the Touchstone Active Bond Fund. Mr. Carter began as an Assistant Portfolio Manager of Fort Washington in 2000 and has been an Assistant Vice President and Portfolio Manager since 2007. He has managed the Fund since September 2001.
Touchstone High Yield Fund
Brendan M. White, CFA, is primarily responsible for managing the Touchstone High Yield Fund and has managed the Fund since its inception. Mr. White is a Senior Vice President and Co-Chief Investment Officer and has worked at Fort Washington since 1993.
Timothy Jossart, CFA, has research responsibilities for certain sectors and has assisted Brendan White with the management of the Touchstone High Yield Fund since 2011. Mr. Jossart is a Vice President, Portfolio Manager and Senior Credit Analyst and has been employed by Fort Washington since 1996.
Garrick Bauer, CFA, has research responsibilities for certain sectors and has assisted Brendan White with the management of the High Yield Fund since 2016. Mr. Bauer is an Assistant Vice President, Portfolio Manager and Senior Credit Analyst and has been employed by Fort Washington since 2013.
Touchstone Ultra Short Duration Fixed Income Fund
Scott D. Weston, Managing Director and Senior Portfolio Manager, joined Fort Washington in September 1999. He is also Fort Washington’s lead sector specialist in mortgage-backed and asset-backed securities. Mr. Weston is a graduate of the University of Utah with a BS in Political Science and the University of Cincinnati with an MBA in Finance. He has investment experience dating back to 1992 and is jointly and primarily responsible for the management of the Fund.
Brent A. Miller, CFA, Senior Portfolio Manager, joined Fort Washington in June 2001 and is jointly and primarily responsible for the management of the Fund. He became a portfolio manager in 2008 and was an assistant portfolio manager prior to 2008. Mr. Miller graduated Magna Cum Laude from the University of Evansville with a BS in Mathematics. He has investment experience dating back to 1999.
LMCG Investments, LLC (“LMCG”), located at 200 Clarendon Street, 28th Floor, Boston, Massachusetts, 02116, an investment advisor registered with the Securities and Exchange Commission, serves as the sub-advisor to the Touchstone Mid Cap Value Fund and the Touchstone Small Cap Value Fund. As the sub-advisor, LMCG makes investment decisions for the Fund and also ensures compliance with the Fund’s investment policies and guidelines. LMCG is a board-managed limited liability company owned by its employees, Lee P. Munder, and Royal Bank of Canada (“RBC”). LMCG operates independently of RBC, a publicly
held Canadian bank that on November 2, 2015 acquired City National Corporation, LMCG’s former majority owner. As of September 30, 2016, LMCG had approximately $7.4 billion in assets under management.
Touchstone Mid Cap Value Fund
R. Todd Vingers, CFA, Portfolio Manager, joined LMCG in 2002. Mr. Vingers is the Managing Director of Value Equities at LMCG and is jointly and primarily responsible for the management of the Fund. Previously, Mr. Vingers served as portfolio manager at American Century Investments.
Jay Willadsen, CFA, Portfolio Manager, joined LMCG in 2003 as a research analyst and is jointly and primarily responsible for the management of the Fund. Previously, Mr. Willadsen served as a research analyst at Independence Investments.
Touchstone Small Cap Value Fund
R. Todd Vingers, CFA, Portfolio Manager, joined LMCG in 2002. Mr. Vingers is the Managing Director of Value Equities at LMCG and is responsible for the management of the Fund. Previously, Mr. Vingers served as portfolio manager at American Century Investments.
London Company of Virginia d/b/a The London Company (“The London Company”), located at 1800 Bayberry Court, Suite 301, Richmond, Virginia, 23226, serves as sub-advisor to the Touchstone Small Cap Fund and Touchstone Mid Cap Fund. As sub-advisor, The London Company makes investment decisions for the Fund and also ensures compliance with the Fund’s investment policies and guidelines. The London Company was founded in 1994 and is majority employee owned. Stephen Goddard may be deemed to be a control person of The London Company through his ownership in TLC Holdings LLC, which owns a majority of The London Company. As of September 30, 2016, The London Company had approximately $11.7 billion in assets under management.
Touchstone Mid Cap Fund and Touchstone Small Cap Fund
Stephen Goddard, CFA, President, Chief Investment Officer and Lead Portfolio Manager, founded The London Company in 1994 and is jointly and primarily responsible for the management of the Fund. Previously, he held Senior Portfolio Management positions at CFB Advisory and Flippin, Bruce & Porter. He has over 25 years of investment experience.
Jonathan Moody, CFA, Principal and Portfolio Manager, joined The London Company in 2002 and is jointly and primarily responsible for the management of the Fund. Previously, he founded Primary Research Group. He has over 20 years of investment experience.
J. Brian Campbell, CFA and Portfolio Manager, joined The London Company in 2010 and is jointly and primarily responsible for the management of the Fund. Previously he spent six years as Portfolio Manager and the Director of Research at Hilliard Lyons Capital Management. He has over 10 years of investment experience.
Mark E. DeVaul, CFA, CPA and Portfolio Manager, joined The London Company in 2011 and is jointly and primarily responsible for the management of the Fund. Previously, he spent eight years as an Equity Research Analyst at Nuveen Investments. He has over 15 years of investment experience.
Longfellow Investment Management Co. (“Longfellow”), located at 20 Winthrop Square, Boston, Massachusetts 02110, serves as sub-advisor to the Touchstone Arbitrage Fund and Touchstone Merger Arbitrage Fund. As sub-advisor, Longfellow makes investment decisions for the Fund and also ensures compliance with the Fund’s investment policies and guidelines. Longfellow was founded in 1986 and is 100% employee owned. Barbara J. McKenna, John E. Villela and David C. Stuehr are owners of the firm. As of September 30, 2016, Longfellow had approximately $8.9 billion in assets under management.
Touchstone Arbitrage Fund and Touchstone Merger Arbitrage Fund
Barbara J. McKenna, CFA, Principal and Portfolio Manager, has over 20 years of fixed income investment experience and is jointly and primarily responsible for the management of the Fund. Prior to joining Longfellow, from 2001 to 2005, Ms. McKenna was a director and senior portfolio manager at State Street Research, responsible for managing $14 billion of institutional fixed income accounts. As director of corporate bond strategy, she was responsible for directing and leading the implementation of corporate bond strategy across all mandates.
David C. Stuehr, CFA, Principal, Portfolio Manager, and Senior Analyst since September 2009, has over 25 years of investment experience and is jointly and primarily responsible for the management of the Fund. From 2005 to 2009, he was a portfolio manager and analyst at Hanover Strategic Management. Prior to his tenure there, he served as a portfolio manager at Seneca Capital Management, where he was responsible for the firm’s high-yield investment portfolio. Prior to joining Seneca, from 1990 to 2001, Mr. Stuehr was a Partner with Standish, Ayer & Wood, serving as a portfolio manager and Director of Corporate Bond Research.
Andrew G. Bail, Portfolio Manager and Senior Analyst, is responsible for developing and implementing strategies for the firm’s event driven portfolios and is jointly and primarily responsible for the management of the Fund. Before joining LIM in 2016, Andrew worked as an equity derivatives strategist at J.P. Morgan where he focused on single-stock derivatives. Prior to J.P. Morgan he was a director at Babson Capital where he focused on derivative strategies for the firm’s Event-Driven Hedge Fund. Previously, Andrew served as a generalist equity and equity derivatives analyst for The Flatley Company, where he helped build and oversee the expansion of the company’s equity portfolios across several strategies (Core Equity, Special Situations and Dividend Growth). He was also a research associate at Peak6 Investments, a volatility-arbitrage hedge fund, where he focused on special situations and dividend arbitrage within the automotive, chemical and paper & packaging industries. Andrew received his Bachelor of Arts from Johns Hopkins University and his Master in Business Administration and Master of Science in Finance from Boston College.
Alexander R. Graham, CAIA, Portfolio Manager and Senior Analyst, joined Longfellow in 1997 and is jointly and primarily responsible for the management of the Fund. He has served as Senior Analyst since 2006 and Portfolio Manager since 2011. Prior to joining Longfellow, he worked in portfolio accounting at Boston Safe Deposit & Trust and worked in client service at Pioneer Group.
Miller/Howard Investments Inc. (“Miller/Howard”), located at 10 Dixon Avenue, Woodstock, New York, 12498, serves as sub-advisor to the Touchstone Premium Yield Equity Fund. As sub-advisor, Miller/Howard makes investment decisions for the Fund and also ensures compliance with the Fund’s investment policies and guidelines. Miller/Howard was founded in 1984 and is 100% employee owned. As of September 30, 2016, Miller/Howard had approximately $6.3 billion in assets under management.
Miller/Howard’s Socially Responsible Investing Guidelines. Socially Responsible Investing (“SRI”) is a commonly-used phrase which involves the integration of environmental, social, and corporate governance (“ESG”) criteria with financial standards when making investment decisions. Miller/Howard believes, as do many others, that this integrated approach provides a framework for achieving better long-term investment returns while building sustainable global economies and markets.
Many industry professionals hold that all companies, through their business activities, can be analyzed with ESG criteria, resulting in a profile that can be compared to others with regard to their corporate citizenship. Miller/Howard’s social research involves a comprehensive process that uses exclusion and inclusion screens, case-by-case analysis, and assertion of basic principles of fairness and environmental stewardship. A company must pass Miller/Howard’s social evaluation in order to be eligible for investment. Miller/Howard views this extra layer of due diligence as a risk control measure.
The main factors considered for each potential investment are governance and ethics; environmental record; workplace issues; human rights, especially regarding international operations; products and services and their contribution to revenues. Miller/ Howard does not invest in companies that produce alcohol, tobacco, gambling equipment or firearms. Companies whose sales of such products are ancillary such as restaurants, hotels, convenience stores or other similar entities are not automatically excluded. Miller/Howard also does not invest in companies involved in nuclear power production or companies that have a history of environmental negligence or a pattern of violations of environmental regulations.
A company must meet Miller/Howard’s basic social criteria to be eligible for investment; however, the final investment decision takes into consideration the financial and social profile of each candidate.
Touchstone Premium Yield Equity Fund
Lowell G. Miller is Founder, Chief Investment Officer and Director of Research for Miller/Howard, which was founded in 1984 and is jointly and primarily responsible for the management of the Fund. He has investment experience dating back to 1977.
John E. Leslie III, CFA, Research Analyst and Portfolio Manager joined Miller/Howard in 2004 and is jointly and primarily responsible for the management of the Fund. Prior to joining Miller/Howard, Jack was a portfolio manager at Value Line Asset Management, M&T Capital Advisors Group (Division of M&T Bank) and Dewey Square Investors (Division of UAM). He has investment experience dating back to 1984.
Bryan J. Spratt, CFA, Research Analyst and Portfolio Manager joined Miller/Howard in 2004 and is jointly and primarily responsible for the management of the Fund. Prior to joining Miller/Howard, from 2001 through 2004, Bryan was responsible for the utilities and telecom sectors for the Value Team at Banc One Investment Advisors and the One Group Funds. He has investment experience dating back to 1990.
Roger G. Young, CFA, Research Analyst and Portfolio Manager joined Miller/Howard in 2008 and is jointly and primarily responsible for the management of the Fund. Prior to joining Miller/Howard, Roger was a portfolio manager for the Kenneth King Foundation from 2003 to 2007 and was President of Young Asset Adviser, Inc. from 2007 to 2008. He has been a portfolio manager of the Fund since February 2009. He has investment experience dating back to 1971.
Deepak Ahuja, CFA, Senior Research Analyst joined Miller/Howard in October 2015 and is jointly and primarily responsible for the management of the Fund. Prior to joining Miller/Howard Investments, Deepak was a securities analyst at SKBA Capital Management covering consumer, banks, technology, industrials, REITS, healthcare, and asset management companies, among others. He has investment experience dating back to 2005.
Sands Capital Management, LLC (“Sands Capital”), located at 1000 Wilson Boulevard, Suite 3000, Arlington, Virginia 22209, serves as sub-advisor to the Touchstone Sands Capital Select Growth Fund. As sub-advisor, Sands Capital makes investment decisions for the Fund and also ensures compliance with the Fund’s investment policies and guidelines. Sands Capital is controlled by Frank M. Sands, Sr. and Frank M. Sands. As of September 30, 2016, Sands Capital had approximately $40.6 billion in assets under management.
Touchstone Sands Capital Select Growth Fund
Frank M. Sands, CFA, Chief Investment Officer and Chief Executive Officer, joined Sands Capital in June 2000. Prior to 2008, Mr. Sands was President, Director of Research and Sr. Portfolio Manager. He has investment experience dating back to 1994.
A. Michael Sramek, CFA, Senior Portfolio Manager, Research Analyst, and Managing Director, joined Sands Capital in April 2001 and is jointly and primarily responsible for the management of the Fund. He has investment experience dating back to 1997.
Wesley A. Johnston, CFA, Portfolio Manager and a Senior Research Analyst, joined Sands Capital in 2004. He has investment experience dating back to 2004.
Additional Information. The SAI provides additional information about each portfolio manager’s compensation structure, other managed accounts and ownership of securities in their managed Funds.
CHOOSING A CLASS OF SHARES
Share Class Offerings. Each class of shares has different sales charges and distribution fees. The amount of sales charges and distribution fees you pay will depend on which class of shares you decide to purchase. Each Fund offers the following classes of shares.
| | | | | | | | | | | Institutional |
| Fund | | Class A | | Class C | | Class Y | | Class Z | | Class |
| Touchstone Active Bond Fund | | X | | X | | X | | | | X |
| Touchstone Arbitrage Fund | | X | | X | | X | | | | X |
| Touchstone Emerging Markets Small Cap Fund | | X | | X | | X | | | | X |
| Touchstone High Yield Fund | | X | | X | | X | | | | X |
| Touchstone Merger Arbitrage Fund | | X | | X | | X | | | | X |
| Touchstone Mid Cap Fund | | X | | X | | X | | X | | X |
| Touchstone Mid Cap Value Fund | | X | | X | | X | | | | X |
| Touchstone Premium Yield Equity Fund | | X | | X | | X | | | | |
| Touchstone Sands Capital Select Growth Fund | | X | | X | | X | | X | | |
| Touchstone Small Cap Fund | | X | | X | | X | | | | X |
| Touchstone Small Cap Value Fund | | X | | X | | X | | | | X |
| Touchstone Total Return Bond Fund | | X | | X | | X | | | | X |
| Touchstone Ultra Short Duration Fixed Income Fund | | X | | X | | X | | X | | X |
Class A Shares
The offering price of Class A shares of each Fund is equal to its net asset value (“NAV”) plus a front-end sales charge that you pay when you buy your shares. The front-end sales charge is generally deducted from the amount of your investment. Class A shares are subject to a Rule 12b-1 distribution fee of up to 0.25% of the Fund’s average daily net assets allocable to Class A shares.
Class A Sales Charge. The following tables show the amount of front-end sales charge you will pay on purchases of Class A shares for the Funds. The amount of front-end sales charge is shown as a percentage of (1) offering price; and (2) the net amount invested after the charge has been subtracted. Note that the front-end sales charge gets lower as your investment amount gets larger. The first table applies to all Funds except Touchstone Active Bond Fund, Touchstone High Yield Fund, Touchstone Total Return Bond Fund and Touchstone Ultra Short Duration Fixed Income Fund.
| | | Sales Charge as % of | | Sales Charge as % of | | Dealer Reallowance as % |
| Amount of Your Investment | | Offering Price | | | Net Amount Invested | | | of Offering Price |
| Under $50,000 | | | 5.75 | % | | | 6.10 | % | | | 5.00 | % |
| $50,000 but less than $100,000 | | | 4.50 | % | | | 4.71 | % | | | 3.75 | % |
| $100,000 but less than $250,000 | | | 3.50 | % | | | 3.63 | % | | | 2.75 | % |
| $250,000 but less than $500,000 | | | 2.95 | % | | | 3.04 | % | | | 2.25 | % |
| $500,000 but less than $1 million | | | 2.25 | % | | | 2.30 | % | | | 1.75 | % |
| $1 million or more | | | 0.00 | % | | | 0.00 | % | | | None |
Touchstone Active Bond Fund, Touchstone High Yield Fund and Touchstone Total Return Bond Fund
| | | Sales Charge as % of | | Sales Charge as % of | | Dealer Reallowance as % |
| Amount of Your Investment | | Offering Price | | Net Amount Invested | | of Offering Price |
| Under $50,000 | | | 4.75 | % | | | 4.99 | % | | | 4.00 | % |
| $50,000 but less than $100,000 | | | 4.50 | % | | | 4.71 | % | | | 3.75 | % |
| $100,000 but less than $250,000 | | | 3.50 | % | | | 3.63 | % | | | 2.75 | % |
| $250,000 but less than $500,000 | | | 2.95 | % | | | 3.04 | % | | | 2.25 | % |
| $500,000 but less than $1 million | | | 2.25 | % | | | 2.30 | % | | | 1.75 | % |
| $1 million or more | | | 0.00 | % | | | 0.00 | % | | | None |
Touchstone Ultra Short Duration Fixed Income Fund
| | | Sales Charge as % of | | Sales Charge as % of | | Dealer Reallowance as % |
| Amount of Your Investment | | Offering Price | | Net Amount Invested | | of Offering Price |
| Under $50,000 | | | 2.00 | % | | | 2.04 | % | | | 1.75 | % |
| $50,000 but less than $100,000 | | | 1.50 | % | | | 1.52 | % | | | 1.25 | % |
| $100,000 but less than $250,000 | | | 1.00 | % | | | 1.01 | % | | | 0.85 | % |
| $250,000 but less than $500,000 | | | 0.50 | % | | | 0.50 | % | | | 0.40 | % |
| $500,000 or more | | | 0.00 | % | | | 0.00 | % | | | None |
Waiver of Class A Sales Charge. There is no front-end sales charge if you invest $1 million or more in any share class of the Touchstone Funds ($500,000 for Ultra Short Duration Fixed Income Fund). If you redeem shares that were part of the $1 million breakpoint purchase within one year, you may pay a contingent deferred sales charge (“CDSC”) of up to 1% on the shares redeemed, if a commission was paid by Touchstone Securities, Inc. (the “Distributor” or “Touchstone Securities”) to a participating unaffiliated broker-dealer. There is no front-end sales charge on exchanges between Funds with the same load schedule or from a higher load schedule to a lower load schedule. In addition, there is no front-end sales charge on the following purchases:
| | • | Purchases by registered representatives or other employees* (and their immediate family members**) of financial intermediaries having selling agreements with Touchstone Securities. |
| | • | Purchases in accounts as to which a broker-dealer or other financial intermediary charges an asset management fee economically comparable to a sales charge, provided the broker-dealer or other financial intermediary has a selling agreement with Touchstone Securities. |
| | • | Purchases by a trust department of any financial intermediary serving in a fiduciary capacity as trustee to any trust over which it has discretionary trading authority. |
| | • | Purchases through a financial intermediary that has agreements with Touchstone Securities, or whose programs are available through financial intermediaries that have agreements with Touchstone Securities relating to mutual fund supermarket programs, fee-based wrap or asset allocation programs. |
| | • | Purchases by an employee benefit plan having more than 25 eligible employees or a minimum of $250,000 in plan assets. This waiver applies to any investing employee benefit plan meeting the minimum eligibility requirements and whose transactions are executed through a financial intermediary that has entered into an agreement with Touchstone Securities to use the Touchstone Funds in connection with the plan’s accounts. The term “employee benefit plan” applies to qualified pension, profit-sharing, or other employee benefit plans. |
| | • | Purchases by an employee benefit plan that is provided administrative services by a third party administrator that has entered into a special service arrangement with Touchstone Securities. |
| | • | Reinvestment of redemption proceeds from Class A shares of any Touchstone Fund if the reinvestment occurs within 90 days of redemption. |
* The term “employee” is deemed to include current and retired employees.
**Immediate family members are defined as the parents, mother-in-law or father-in-law, spouse, brother or sister, brother-in-law or sister-in-law, son-in-law or daughter-in-law and children of a registered representative or employee, and any other individual to whom the registered representative or employee provides material support.
In addition, Class A shares may be purchased with no front-end sales charge through certain mutual fund programs sponsored by qualified intermediaries, such as broker-dealers and investment advisors. In each case, the intermediary has entered into an agreement with Touchstone Securities to include the Touchstone Funds in their program where the intermediary provides investors participating in the program with additional services, including advisory, asset allocation, recordkeeping or other services. You should ask your financial intermediary if it offers and you are eligible to participate in such a mutual fund program and whether participation in the program is consistent with your investment goals. The intermediaries sponsoring or participating in these mutual fund programs may also offer their clients other classes of shares of the funds and investors may receive different levels of services or pay different fees depending upon the class of shares included in the program. Investors should carefully consider any separate transaction fee or other fees charged by these programs in connection with investing in each available share class before selecting a share class.
Sales charge waivers must be satisfied at the time of purchase. For direct purchases through Touchstone Securities you may apply for a waiver by marking the appropriate section on the investment application and completing the “Special Account Options” form. You can obtain the application and form by calling Touchstone Securities at 1.800.543.0407 or by visiting the Touchstone Funds’ website: TouchstoneInvestments.com. Purchases at NAV may be made for investment only, and the shares may not be resold except through redemption by or on behalf of the Fund. At the option of the Fund, the front-end sales charge may be included on future purchases.
Reduced Class A Sales Charge. You may also purchase Class A shares of a Fund at the reduced sales charges shown in the table above through the Rights of Accumulation Program or by signing a Letter of Intent. The following purchasers (“Qualified Purchasers”) may qualify for a reduced sales charge under the Rights of Accumulation Program or Letter of Intent:
| | • | an individual, an individual’s spouse, or an individual’s children under the age of 21; or |
| | • | a trustee or other fiduciary purchasing shares for a single fiduciary account although more than one beneficiary is involved. |
The following accounts (“Qualified Accounts”) held in any Touchstone Fund sold with a sales charge may be grouped together to qualify for the reduced sales charge under the Rights of Accumulation Program or Letter of Intent:
| | • | Individual accounts |
| | • | Joint tenant with rights of survivorship accounts |
| | • | Uniform Gifts/Transfers to Minors Act (“UGTMA”) Accounts |
| | • | Trust accounts |
| | • | Estate accounts |
| | • | Guardian/Conservator accounts |
| | • | Individual Retirement Accounts (“IRAs”), including Traditional, Roth, Simplified Employee Pension Plans (“SEP”) and Savings Incentive Match Plan for Employees (“SIMPLE”) |
| | • | Coverdell Education Savings Accounts (“Education IRAs”) |
Rights of Accumulation Program. Under the Rights of Accumulation Program, you may qualify for a reduced sales charge by aggregating all of your investments held in a Qualified Account. You or your dealer must notify Touchstone Securities at the time of purchase that a purchase qualifies for a reduced sales charge under the Rights of Accumulation Program and must provide either a list of account numbers or copies of account statements verifying your qualification. If your shares are held directly in a Touchstone Fund or through a dealer, you may combine the historical cost or current NAV (whichever is higher) of your existing shares of any Touchstone Fund sold with a sales charge with the amount of your current purchase in order to take advantage of the reduced sales charge. Historical cost is the price you actually paid for the shares you own, plus your reinvested dividends and capital gains. If you are using historical cost to qualify for a reduced sales charge, you should retain any records to substantiate your historical costs since the Fund, its transfer agent or your broker-dealer may not maintain this information.
If your shares are held through financial intermediaries you may combine the current NAV of your existing shares of any Touchstone Fund sold with a front-end sales charge with the amount of your current purchase in order to take advantage of the reduced sales charge. You or your financial intermediary must notify Touchstone at the time of purchase that a purchase qualifies for a reduced sales charge under the Rights of Accumulation Program and must provide copies of account statements dated within three months of your current purchase verifying your qualification.
Upon receipt of the above referenced supporting documentation, Touchstone Securities will calculate the combined value of all of the Qualified Purchaser’s Qualified Accounts to determine if the current purchase is eligible for a reduced sales charge. Purchases made for nominee or street name accounts (securities held in the name of a dealer or another nominee such as a bank trust department instead of the customer) may not be aggregated with purchases for other accounts and may not be aggregated with other nominee or street name accounts unless otherwise qualified as described above.
Letter of Intent. If you plan to invest at least $50,000 (excluding any reinvestment of dividends and capital gains distributions) during the next 13 months in Class A shares of any Touchstone Fund sold with a front-end sales charge, you may qualify for a reduced sales charge by completing the Letter of Intent section of your account application. A Letter of Intent indicates your intent to purchase at least $50,000 in Class A shares of any Touchstone Fund sold with a front-end sales charge over the next 13 months in exchange for a reduced sales charge indicated on the above chart. The minimum initial investment under a Letter of Intent is $10,000. You are not obligated to purchase additional shares if you complete a Letter of Intent. If you do not buy enough shares to qualify for the projected level of sales charge by the end of the 13-month period (or when you sell your shares, if earlier), then your sales charge will be recalculated to reflect your actual purchase level. During the term of the Letter of Intent, shares representing 5% of your intended purchase will be held in escrow. If you do not purchase enough shares during the 13-month period to qualify for the projected reduced sales charge, the additional sales charge will be deducted from your escrow account. If you have purchased Class A shares of any Touchstone Fund sold with a front-end sales charge within 90 days prior to signing a Letter of Intent, they may be included as part of your intended purchase, however, previous purchase transactions will not be recalculated with the proposed new breakpoint. You must provide either a list of account numbers or copies of account statements verifying your purchases within the past 90 days.
Other Information. Information about sales charges and breakpoints is also available in a clear and prominent format on the Touchstone Funds’ website: TouchstoneInvestments.com. You can access this information by selecting “Sales Charges and
Breakpoints” under the “Pricing and Performance” link. For more information about qualifying for a reduced or waived sales charge, contact your financial intermediary or contact Touchstone Securities at 1.800.543.0407.
Class C Shares
Class C shares of the Funds are sold at NAV without an initial sales charge so that the full amount of your purchase payment may be immediately invested in the Funds. Class C shares are subject to a Rule 12b-1 fee. A CDSC of 1.00% will be charged on Class C shares redeemed within 1 year after you purchased them. In most cases it is more advantageous to purchase Class A shares for amounts of $1 million or more ($500,000 or more for the Ultra Short Duration Fixed Income Fund). Therefore, a request to purchase Class C shares for $1 million or more (or $500,000 or more for the Ultra Short Duration Fixed Income Fund) will be considered as a purchase request for Class A shares or declined.
Class Y Shares
Class Y shares of the Funds are sold at NAV without an initial sales charge so that the full amount of your purchase payment may be immediately invested in the Funds. Class Y shares are not subject to a Rule 12b-1 fee or CDSC. In addition, Class Y shares may be purchased through certain mutual fund programs sponsored by qualified intermediaries, such as broker-dealers and investment advisors. In each case, the intermediary has entered into an agreement with Touchstone Securities to include the Touchstone Funds in their program where the intermediary provides investors participating in their program with additional services, including advisory, asset allocation, recordkeeping or other services. You should ask your financial institution if it offers and you are eligible to participate in such a mutual fund program and whether participation in the program is consistent with your investment goals. The intermediaries sponsoring or participating in these mutual fund programs may also offer their clients other classes of shares of the funds and investors may receive different levels of services or pay different fees depending upon the class of shares included in the program. Investors should carefully consider any separate transaction fee or other fees charged by these programs in connection with investing in each available share class before selecting a share class.
Institutional Class Shares
Institutional Class shares of the Funds are sold at NAV without an initial sales charge so that the full amount of your purchase payment may be immediately invested in the Funds. Institutional Class shares are not subject to a Rule 12b-1 fee or CDSC.
Class Z Shares
Class Z shares of the Funds are sold at NAV without an initial sales charge so that the full amount of your purchase payment may be immediately invested in the Fund. Class Z shares are not subject to a 12b-1 fee or CDSC.
DISTRIBUTION AND SHAREHOLDER SERVICING ARRANGEMENTS
12b-1 Distribution Plans. Each Fund offering Class A shares and Class C shares has adopted a distribution plan under Rule 12b-1 of the 1940 Act. The plans allow each Fund to pay distribution and other fees for the sale and distribution of its shares and for services provided to shareholders. Under the Class A plan, the Funds pay an annual fee of up to 0.25% of average daily net assets that are attributable to Class A shares. Under the Class C plan, the Funds pay an annual fee of up to 1.00% of average daily net assets that are attributable to Class C shares (of which up to 0.75% is a distribution fee and up to 0.25% is a shareholder servicing fee). The Touchstone Ultra Short Duration Fixed Income Fund intends to limit the amount of the 12b-1 fees for Class C shares to 0.75% of average daily net assets for at least one year from the date of this prospectus. Because these fees are paid out of a Fund’s assets on an ongoing basis, they will increase the cost of your investment and over time may cost you more than paying other types of sales charges.
Additional Compensation to Financial Intermediaries. Touchstone Securities, the Trust’s principal underwriter, at its expense (from a designated percentage of its income) currently provides additional compensation to certain dealers. Touchstone Securities pursues a focused distribution strategy with a limited number of dealers who have sold shares of a Fund or other Touchstone Funds. Touchstone Securities reviews and makes changes to the focused distribution strategy on a periodic basis. These payments are generally based on a pro rata share of a dealer’s sales. Touchstone Securities may also provide compensation in connection with conferences, sales or training programs for employees, seminars for the public, advertising and other dealer-sponsored programs.
Touchstone Advisors, at its own expense, may also provide additional compensation to certain affiliated and unaffiliated dealers, financial intermediaries or service providers for certain services including distribution, administrative, sub-accounting, sub-transfer agency and/or shareholder servicing activities. These additional cash payments to a financial intermediary are payments over and above sales commissions or reallowances, distribution fees or servicing fees (including networking, administration and sub-transfer
agency fees). These additional cash payments also may be made as an expense reimbursement in cases where the financial intermediary bears certain costs in connection with providing shareholder services to Fund shareholders. Touchstone Advisors may also reimburse Touchstone Securities for making these payments.
Touchstone Advisors and its affiliates may also pay cash compensation in the form of finders’ fees or referral fees that vary depending on the dollar amount of shares sold. The amount and value of additional cash payments vary for each financial intermediary. The additional cash payment arrangement between a particular financial intermediary and Touchstone Advisors or its affiliates may provide for increased rates of compensation as the dollar value of the Fund’s shares or particular class of shares sold or invested through such financial intermediary increases. The availability of these additional cash payments, the varying fee structure within a particular additional cash payment arrangement and the basis for and manner in which a financial intermediary compensates its sales representatives may create a financial incentive for a particular financial intermediary and its sales representatives to recommend a Fund’s shares over the shares of other mutual funds based, at least in part, on the level of compensation paid. You should consult with your financial intermediary and review carefully any disclosure by the financial firm as to compensation received by your financial intermediary. Although the Funds may use financial firms that sell the Funds’ shares to effect portfolio transactions for the Funds, the Funds and Touchstone Advisors will not consider the sale of a Fund’s shares as a factor when choosing financial firms to effect those transactions. For more information on payment arrangements, please see the section entitled “The Distributor” in the SAI.
Shareholder Servicing Plan. The Trust has adopted a shareholder services plan (the “Plan”) with respect to the Class Z shares of the Touchstone Mid Cap Fund, the Touchstone Sands Capital Select Growth Fund, and the Touchstone Ultra Short Duration Fixed Income Fund, providing that the Trust may obtain the services of Touchstone Advisors and other qualified financial institutions to act as shareholder servicing agents for their customers. Under the Plan, the Trust (or the Trust’s agents) may enter into agreements pursuant to which the shareholder servicing agent performs certain shareholder services not otherwise provided by the Transfer Agent. For these services, the Trust pays the shareholder servicing agent a fee of up to 0.25% of the average daily net assets attributable to the Class Z shares owned by investors for which the shareholder servicing agent maintains a servicing relationship.
The Trust may use payments under this aspect of the Plan to provide or enter into agreements with organizations (“Service Providers”) who will provide one or more of the following shareholder services: (i) establishing and maintaining customer accounts and records; (ii) aggregating and processing purchase and redemption requests from customers and placing net purchase and redemption orders with the Distributor; (iii) automatically investing customer account cash balances; (iv) providing periodic statements to their customers; (v) arranging for bank wires; (vi) answering routine customer inquiries concerning their investments in the shares offered in connection with this Plan and related distribution agreement; (vii) assisting customers in changing dividend options, account designations and addresses; (viii) performing sub-accounting functions; (ix) processing dividend payments from the Fund on behalf of customers; (x) forwarding certain shareholder communications from the Fund (such as proxies, shareholder reports and dividend, distribution and tax notices) to customers; and (xi) providing such other similar services as may be reasonably requested to the extent they are permitted to do so under applicable statutes, rules and regulations. Because these fees are paid out of the Fund’s assets on an on-going basis, over time these fees will increase the cost of your investment.
INVESTING WITH TOUCHSTONE
Choosing the Appropriate Investments to Match Your Goals. Investing well requires a plan. We recommend that you meet with your financial advisor to plan a strategy that will best meet your financial goals.
Purchasing Your Shares
Please read this prospectus carefully and then determine how much you want to invest.
Classes A and C shares may be purchased directly through Touchstone Securities or through your financial advisor.
Class Y shares are available through certain financial intermediaries who have appropriate selling agreements in place with Touchstone Securities.
Class Z shares are available through a financial intermediary or financial institutions such as retirement plans, fee based platforms, and brokerage accounts (who may impose transaction charges in addition to those described in this prospectus). Class Z shares are not available directly from Touchstone Securities and may not be available through certain financial intermediaries who do not have appropriate agreements in place with Touchstone Securities.
Institutional Class shares may be purchased directly through Touchstone Securities or through your financial intermediary.
In order to open an account you must complete an investment application. You can obtain an investment application from Touchstone Securities, your financial advisor or other financial intermediary, or by visiting the Touchstone Funds’ website: TouchstoneInvestments.com. You may purchase shares in the Fund on a day when the New York Stock Exchange (“NYSE”) is open for trading (“Business Day”). For more information about how to purchase shares, call Touchstone Securities at 1.800.543.0407.
Investor Alert: Each Touchstone Fund reserves the right to restrict or reject any purchase request, including exchanges from other Touchstone Funds, which it regards as disruptive to efficient portfolio management. For example, a purchase request could be rejected because of the timing of the investment or because of a history of excessive trading by the investor. (See “Market Timing Policy” in this prospectus.) Touchstone Securities may change applicable initial and additional investment minimums at any time.
Sands Capital Select Growth Fund Closure. Due to asset growth, all classes of the Touchstone Sands Capital Select Growth Fund (the “Fund”) were closed to new accounts, with certain exceptions, on April 8, 2013. Further revisions to the Fund’s availability became effective on October 21, 2013. The Fund’s investment advisor, Touchstone Advisors, Inc. (the “Advisor”), continually monitors Fund asset levels relative to market conditions in conjunction with the Fund’s sub-advisor, Sands Capital Management (“Sands Capital”). With due consideration, the Advisor determined to re-open the Fund for sales to investors making purchases in an account or relationship related to a fee-based, advisory platform as of May 18, 2016.
Additional investments will not be accepted in the Sands Capital Select Growth Fund until further notice, with the following exceptions:
| | • | Existing shareholders may add to an existing account through the purchase of additional shares of the Fund, including the reinvestment of dividends and cash distributions from shares owned in the Fund. Please note: Selling agents who transact in the Fund through an omnibus account are not permitted to purchase shares of the Funds on behalf of clients who do not currently own shares of the Fund. |
| | • | An employee of the Advisor or Sands Capital may purchase shares of the Fund (a) through an account in his or her own name or jointly held with another individual or as trustee for another individual, or (b) as beneficial owner of shares held in another name by opening (i) a new individual account or IRA in his or her own name, (ii) a trust account, (iii) a joint account with another party, or (iv) an account on behalf of an immediate family member. |
| | • | Beneficiaries of shares of the Fund (e.g., through an IRA or transfer on death account) or recipients of shares of the Fund through a transfer who wish to use the proceeds of that account to open up a new account in the Fund. |
| | • | Investors making purchases in an account or relationship related to a fee-based, advisory platform. |
If you believe you are eligible to purchase shares of the Fund, you may be required to provide appropriate proof of eligibility. The Fund reserves the right to: (i) reject any purchase order if it believes that acceptance of such order would interfere with its ability to be effectively managed; (ii) reopen to new investors at a future date; and (iii) make additional exceptions, to limit the above exceptions, or otherwise to modify the foregoing closure policy for any reason. You may obtain additional information by calling Touchstone at 1.800.543.0407.
Small Cap Fund Closure.All classes of the Touchstone Small Cap Fund (the “Fund”) were closed to new accounts effective as of the close of business on September 21, 2012 (the “Closing Date”). Additional investments will not be accepted in the Fund after the Closing Date until further notice, with the following exceptions:
• Existing shareholders may add to an existing account through the purchase of additional shares of the Fund, including the reinvestment of dividends and cash distributions from shares owned in the Fund. Please note: Selling agents who transact in the Fund through an omnibus account are not permitted to purchase shares of the Fund on behalf of clients who do not currently own shares of the Fund.
• You are the beneficiary of shares of the Fund (e.g., through an IRA or transfer on death account) or are the recipient of shares of the Fund through a transfer and wish to use the proceeds of that account to open up a new account in your name in the Fund.
• You sponsor a retirement plan or benefit plan that currently invests in the Fund as an investment option. Each such plan may open up new participant accounts within the Plan. The sponsor may also offer the Fund as an investment option in other retirement or benefit plans offered by the same company, its subsidiaries and affiliates.
• Investors who invest through existing discretionary fee–based or wrap programs (through a broker/ dealer, bank or registered investment adviser) that currently utilize the Fund as an investment option in firm research–driven or asset allocation model portfolios.
• Centrally–managed asset allocation models or discretionary model portfolios that have approved the inclusion of the Fund as an investment option for their clients and the inclusion was approved by the Fund prior to the Closing Date.
If you believe you are eligible to purchase shares of the Fund, you may be required to provide appropriate proof of eligibility. The Fund reserves the right to reject any purchase order if it believes that acceptance of such order would interfere with its ability to effectively manage the Fund. The Fund reserves the right to reopen to new investors at a future date, to make additional exceptions, to limit the above exceptions or otherwise to modify the foregoing closure policy for any reason. You may obtain additional information by calling Touchstone at 1.800.543.0407.
Opening an Account
Important Information About Procedures for Opening an Account. Federal law requires all financial institutions to obtain, verify, and record information that identifies each person who opens an account. When you open an account, we will ask for your name, residential address, date of birth, government identification number and other information that will allow us to identify you. We may also ask to see your driver’s license or other identifying documents. If we do not receive these required pieces of information, there will be a delay in processing your investment request, which could subject your investment to market risk. If we are unable to immediately verify your identity, the Fund may restrict further investment until your identity is verified. However, if we are unable to completely verify your identity through our verification process, the Fund reserves the right to close your account without notice and return your investment to you at the price determined at the end of business (usually 4:00 p.m. Eastern time ), on the day that your account is closed. If we close your account because we are unable to completely verify your identity, your investment will be subject to market fluctuation, which could result in a loss of a portion of your principal investment.
Investing in the Funds
By mail or through your financial advisor
| | • | Please make your check (drawn on a U.S. bank and payable in U.S. dollars) payable to Touchstone Funds. We do not accept third party checks for initial investments. |
| | • | Send your check with the completed investment application by regular mail to Touchstone Investments, P.O. Box 9878, Providence, Rhode Island 02940, or by overnight mail to Touchstone Investments, c/o BNY Mellon Investment Servicing (US) Inc., 4400 Computer Drive, Westborough, Massachusetts 01581. |
| | • | Your application will be processed subject to your check clearing. If your check is returned for insufficient funds or uncollected funds, you may be charged a fee and you will be responsible for any resulting loss to the Fund. |
| | • | You may also open an account through your financial advisor. |
By wire or Automated Clearing House (“ACH”)
| | • | You may open an account by purchasing shares by wire or ACH transfer. Call Touchstone Investments at 1.800.543.0407 for wire or ACH instructions. |
| | • | Touchstone Securities will not process wire or ACH purchases until it receives a completed investment application. |
| | • | There is no charge imposed by the Funds to make a wire or ACH purchase. Your bank, financial intermediary or processing organization may charge a fee to send a wire or ACH purchase to Touchstone Securities. |
Through your financial intermediary
| | • | You may invest in certain share classes by establishing an account through financial intermediaries that have appropriate selling agreements with Touchstone Securities. |
| | • | Your financial intermediary will act as the shareholder of record of your shares. |
| | • | Financial intermediaries may set different minimum initial and additional investment requirements, may impose other restrictions or may charge you fees for their services. |
| | • | Financial intermediaries may designate intermediaries to accept purchase and sales orders on the Funds’ behalf. |
| | • | Your financial intermediary may receive compensation from the Funds, Touchstone Securities, Touchstone Advisors or their affiliates. |
| | • | Before investing in the Funds through your financial intermediary, you should read any materials provided by your financial intermediary together with this prospectus. |
By exchange. Other Touchstone Funds may be exchanged pursuant to the exchange rules outlined below:
| | • | Class A shares may be exchanged into Class A shares of any other Touchstone Fund at NAV, although Touchstone Funds that are closed to new investors may not accept exchanges. |
| | • | Class C shares may be exchanged into Class C shares of any other Touchstone Fund, although Touchstone Funds that are closed to new investors may not accept exchanges. |
| | • | Class Y shares of the Funds are exchangeable for Class Y shares of any other Touchstone Fund as long as investment minimums and proper selling agreement requirements are met. Class Y shares may be available through financial intermediaries that have appropriate selling agreements with Touchstone Securities, or through “processing organizations” (e.g., mutual fund supermarkets) that purchase shares for their customers. Touchstone Funds that are closed to new investors may not accept exchanges. |
| | • | Institutional Class shares of the Funds are exchangeable for Institutional Class shares of any other Touchstone Fund as long as investment minimums and proper selling agreement requirements are met, although Touchstone Funds that are closed to new investors may not accept exchanges. |
| | • | Class Z shares may be exchanged into any other existing Class Z shares of a Touchstone Fund at NAV, although Touchstone Funds that are closed to new investors may not accept exchanges. |
| | • | Class A, C, and Y shareholders who are eligible to invest in Institutional Class shares are eligible to exchange their Class A shares, Class C shares, and Class Y shares for Institutional Class shares of the same Fund, if offered in their state; and such an exchange can be accommodated by their financial intermediary. Please see the Statement of Additional Information for more information under “Choosing a Class of Shares.” |
| | • | Shares otherwise subject to a CDSC will not be charged a CDSC in an exchange. However, when you redeem the shares acquired through the exchange, the shares you redeem may be subject to a CDSC, depending on when you originally purchased the exchanged shares. For purposes of computing the CDSC, the length of time you have owned your shares will be measured from the date of original purchase and will not be affected by any exchange. |
| | • | Before making an exchange of your Fund shares, you should carefully review the disclosure provided in the prospectus of the Touchstone Fund into which you are exchanging. Touchstone Funds that are closed to new investors may not accept exchanges. |
| | • | You may realized a taxable gain if you exchange shares of a Fund for shares of another Fund. See “Distributions and Taxes — Federal Income Tax Information” for more information and the federal income tax consequences of such an exchange. |
Through retirement plans. You may invest in certain Touchstone Funds through various retirement plans. These include individual retirement plans and employer sponsored retirement plans.
Individual Retirement Plans
| | • | Traditional IRAs |
| | • | SIMPLE IRAs |
| | • | Spousal IRAs |
| | • | Roth IRAs |
| | • | Education IRAs |
| | • | SEP IRAs |
Employer Sponsored Retirement Plans
| | • | Defined benefit plans |
| | • | Defined contribution plans (including 401(k) plans, profit sharing plans and money purchase plans) |
| | • | 457 plans |
To determine which type of retirement plan is appropriate for you, please contact your tax advisor.
For further information about any of the plans, agreements, applications and annual fees, contact Touchstone Securities at 1.800.543.0407 or contact your financial intermediary.
Through a processing organization. You may also purchase shares of the Funds through a “processing organization,” (e.g., a mutual fund supermarket) which is a broker-dealer, bank or other financial institution that purchases shares for its customers. Some of the Touchstone Funds have authorized certain processing organizations (“Authorized Processing Organizations”) to receive purchase and sales orders on their behalf. Before investing in the Funds through a processing organization, you should read any materials provided by the processing organization together with this prospectus. You should also ask the processing organization if they are authorized by Touchstone Securities to receive purchase and sales orders on their behalf. If the processing organization is not authorized, then your purchase order could be rejected which could subject your investment to market risk. When shares are purchased through an Authorized Processing Organization, there may be various differences compared to investing directly with Touchstone Securities. The Authorized Processing Organization may:
| | • | Charge a fee for its services |
| | • | Act as the shareholder of record of the shares |
| | • | Set different minimum initial and additional investment requirements |
| | • | Impose other charges and restrictions |
| | • | Designate intermediaries to accept purchase and sales orders on the Funds’ behalf |
Touchstone Securities considers a purchase or sales order as received when an Authorized Processing Organization, or its authorized designee, receives the order in proper form.
Shares held through an Authorized Processing Organization may be transferred into your name following procedures established by your Authorized Processing Organization and Touchstone Securities. Certain Authorized Processing Organizations may receive compensation from the Funds, Touchstone Securities, Touchstone Advisors or their affiliates. It is the responsibility of an Authorized Processing Organization to transmit properly completed orders so that they will be received by Touchstone Securities in a timely manner.
Pricing of Purchases
Purchase orders received in proper form by Touchstone Securities, an Authorized Processing Organization, or a financial intermediary, by the close of the regular session of trading on the NYSE, generally 4:00 p.m. Eastern time, are processed at that day’s public offering price (NAV plus any applicable sales charge). Purchase orders received after the close of the regular session of trading on the NYSE are processed at the public offering price determined on the following business day. It is the responsibility of the financial intermediary or Authorized Processing Organization to transmit orders that will be received by Touchstone Securities in proper form and in a timely manner.
Adding to Your Account
By check
| | • | Complete the investment form provided with a recent account statement. |
| | • | Make your check (drawn on a U.S. bank and payable in U.S. dollars) payable to Touchstone Funds. |
| | • | Write your account number on the check. |
| | • | Either (1) Mail the check with the investment form to Touchstone Securities; or (2) Mail the check directly to your financial intermediary at the address printed on your account statement. Your financial intermediary is responsible for forwarding payment promptly to Touchstone Securities. |
| | • | If your check is returned for insufficient funds or uncollected funds, you may be charged a fee and you will be responsible for any resulting loss to the Fund. |
Through Touchstone Securities — By telephone or Internet
| | • | You can exchange your shares over the telephone by calling Touchstone Securities at 1.800.543.0407, unless you have specifically declined this option. If you do not wish to have this ability, you must mark the appropriate section of the investment application. |
| | • | You may also exchange your shares online via the Touchstone Funds’ website TouchstoneInvestments.com. You may only sell shares over the telephone or via the Internet if the value of the shares sold is less than $100,000. |
| | • | In order to protect your investment assets, Touchstone Securities will only follow instructions received by telephone that it reasonably believes to be genuine. However, there is no guarantee that the instructions relied upon will always be genuine and Touchstone Securities will not be liable, in those cases. Touchstone Securities has certain procedures to confirm that telephone instructions are genuine. If it does not follow such procedures in a particular case, it may be liable for any losses due to unauthorized or fraudulent instructions. Some of these procedures may include: |
| | | • | Requiring personal identification. |
| | | • | Making checks payable only to the owner(s) of the account shown on Touchstone Securities’ records. |
| | | • | Mailing checks only to the account address shown on Touchstone Securities’ records. |
| | | • | Directing wires only to the bank account shown on Touchstone Securities’ records. |
| | | • | Providing written confirmation for transactions requested by telephone. |
| | | • | Digitally recording instructions received by telephone. |
By wire or ACH
| | • | Contact your bank and ask it to wire or ACH funds to Touchstone Securities. Specify your name and account number when remitting the funds. |
| | • | Your bank may charge a fee for handling wire transfers. ACH transactions take 2-3 business days but can be transferred from most banks without a fee. |
| | • | If you hold your shares directly with Touchstone Securities and have ACH instructions on file for your non-retirement individual or joint account you may initiate a purchase transaction through the Touchstone Funds’ website at TouchstoneInvestments.com. |
| | • | Purchases in the Funds will be processed at that day’s NAV (or public offering price, if applicable) if Touchstone Securities receives a properly executed wire or ACH by the close of the regular session of trading on the NYSE, generally 4:00 p.m. Eastern time, on a day when the NYSE is open for regular trading. |
| | • | Contact Touchstone Securities or your financial intermediary for further instructions. |
By exchange
| | • | You may add to your account by exchanging shares from another Touchstone Fund. |
| | • | For information about how to exchange shares among the Touchstone Funds, see “Investing in the Funds - By exchange” in this prospectus. |
| | • | Exchange transactions can also be initiated for non-retirement individual or joint accounts via the Touchstone Funds’ website at TouchstoneInvestments.com. |
Purchases with Securities
Shares may be purchased by tendering payment in-kind in the form of marketable securities, including but not limited to, shares of common stock, provided the acquisition of such securities is consistent with the applicable Fund’s investment goal and is otherwise acceptable to Touchstone Advisors. Transactions of this type are generally a taxable transaction. Shareholders should consult with their personal tax advisor regarding their particular tax situation.
Automatic Investment Options
The various ways that you can automatically invest in the Funds are outlined below. Touchstone Securities does not charge any fees for these services. For further details about these services, call Touchstone Securities at 1.800.543.0407. If you hold your shares through a financial intermediary or Authorized Processing Organization, please contact them for further details on automatic investment options.
Automatic Investment Plan. You can pre-authorize monthly investments in a Fund of $50 or more to be processed electronically from a checking or savings account. You will need to complete the appropriate section in the investment application or special account options form to do this. Amounts that are automatically invested in a Fund will not be available for redemption until three business days after the automatic reinvestment.
Reinvestment/Cross Reinvestment. Dividends and capital gains can be automatically reinvested in the Fund that pays them or in another Touchstone Fund within the same class of shares without a fee or sales charge. Dividends and capital gains will be reinvested in the Fund that pays them, unless you indicate otherwise on your investment application. You may also choose to have your dividends or capital gains paid to you in cash if such amounts are greater than $25; lesser amounts will be automatically reinvested in the Fund. Dividends are taxable for federal income tax purposes whether you reinvest such dividends in additional shares of a Fund or choose to receive cash. If you elect to receive dividends and distributions in cash and the payment (1) is returned and marked as “undeliverable” or (2) is not cashed for six months, your cash election will be changed automatically and future dividends will be reinvested in the Fund at the per share NAV determined as of the date of payment. In addition, any undeliverable checks or checks that are not cashed for six months will be cancelled and then reinvested in the Fund at the per share NAV determined as of the date of cancellation.
Direct Deposit Purchase Plan. You may automatically invest Social Security checks, private payroll checks, pension payouts or any other pre-authorized government or private recurring payments in our Funds.
Dollar Cost Averaging. Our dollar cost averaging program allows you to diversify your investments by investing the same amount on a regular basis. You can set up periodic automatic exchanges of at least $50 from one Touchstone Fund to any other Touchstone Fund. The applicable sales charge, if any, will be assessed.
Selling Your Shares
You may sell some or all of your shares on any day that the Fund calculates its NAV. If your request is received by Touchstone Securities, an Authorized Processing Organization, financial advisor or financial institution, in proper form by the close of regular trading on the NYSE (usually 4:00 p.m. Eastern time), you will receive a price based on that day’s NAV for the shares you sell. Otherwise, the price you receive will be based on the NAV that is next calculated.
If you elect to receive your redemption proceeds in cash and the payment is not cashed for six months, your account will be coded as a lost shareholder account and correspondence will be sent to you requesting that you contact the Fund in order to remove this coding. If the Fund does not hear from you within 30 days of the mailing of this notice, the redemption check will be cancelled and then reinvested in the Fund at the per share NAV determined as of the date of cancellation.
Through Touchstone Securities - By telephone or Internet
| | • | You can sell your shares over the telephone by calling Touchstone Securities at 1.800.543.0407, unless you have specifically declined this option. If you do not wish to have this ability, you must mark the appropriate section of the investment application. |
| | •. | You may also sell your shares online via the Touchstone Funds’ website: TouchstoneInvestments.com. |
| | • | You may sell shares over the telephone or via Internet only if the value of the shares sold is less than or equal to $100,000. |
| | • | Shares held in IRA accounts and qualified retirement plans cannot be sold by telephone or via Internet. |
| | • | If we receive your sale request by the close of the regular session of trading on the NYSE, generally 4:00 p.m. Eastern time, on a day when the NYSE is open for regular trading, the sale of your shares will be processed at the next determined NAV on that Business Day. Otherwise it will occur on the next Business Day. |
| | • | Interruptions in telephone or Internet service could prevent you from selling your shares when you want to. When you have difficulty making telephone or Internet sales, you should mail to Touchstone Securities (or send by overnight delivery) a written request for the sale of your shares. |
| | • | In order to protect your investment assets, Touchstone Securities will only follow instructions received by telephone that it reasonably believes to be genuine. However, there is no guarantee that the instructions relied upon will always be genuine and Touchstone Securities will not be liable, in those cases. Touchstone Securities has certain procedures to confirm that telephone instructions are genuine. If it does not follow such procedures in a particular case, it may be liable for any losses due to unauthorized or fraudulent instructions. Some of these procedures may include: |
| | • | Requiring personal identification. |
| | • | Making checks payable only to the owner(s) of the account shown on Touchstone Securities’ records. |
| | • | Mailing checks only to the account address shown on Touchstone Securities’ records. |
| | • | Directing wires only to the bank account shown on Touchstone Securities’ records. |
| | • | Providing written confirmation for transactions requested by telephone. |
| | • | Digitally recording instructions received by telephone. |
Through Touchstone Securities - By mail
| | • | Write to Touchstone Securities, P.O. Box 9878, Providence, Rhode Island 02940. |
| | • | Indicate the number of shares or dollar amount to be sold. |
| | • | Include your name and account number. |
| | • | Sign your request exactly as your name appears on your investment application. |
| | • | You may be required to have your signature guaranteed. (See “Signature Guarantees” in this prospectus for more information). |
Through Touchstone Securities - By wire
| | • | Complete the appropriate information on the investment application. |
| | • | If your proceeds are $1,000 or more, you may request that Touchstone Securities wire them to your bank account. |
| | • | You may be charged a fee of up to $15 by a Fund or a Fund’s Authorized Processing Organization for wiring redemption proceeds. You may also be charged a fee by your bank. Certain institutional shareholders who trade daily are not charged wire redemption fees. |
| | • | Your redemption proceeds may be deposited directly into your bank account through an ACH transaction. There is no fee imposed by the Funds for ACH transactions, however, you may be charged a fee by your bank to receive an ACH transaction. Contact Touchstone Securities for more information. |
| | • | If you hold your shares directly with Touchstone Securities and have ACH or wire instructions on file for your non-retirement account you may transact through the Touchstone Funds’ website at TouchstoneInvestments.com. |
Through Touchstone Securities - Through a systematic withdrawal plan
| | • | You may elect to receive, or send to a third party, systematic withdrawals of $50 or more if your account value is at least $5,000. |
| | • | Systematic withdrawals can be made monthly, quarterly, semiannually or annually. |
| | • | There is no fee for this service. |
| | • | There is no minimum account balance required for retirement plans. |
Through your financial intermediary or Authorized Processing Organization
| | • | You may also sell shares by contacting your financial intermediary or Authorized Processing Organization, which may charge you a fee for this service. Shares held in street name must be sold through your financial intermediary or, if applicable, the Authorized Processing Organization. |
| | • | Your financial intermediary or Authorized Processing Organization is responsible for making sure that sale requests are transmitted to Touchstone Securities in proper form and in a timely manner. |
| | • | Your financial intermediary may charge you a fee for selling your shares. |
| | • | Redemption proceeds will only be wired to your account at the financial intermediary. |
Investor Alert: Unless otherwise specified, proceeds will be sent to the record owner at the address shown on Touchstone Securities’ records.
Pricing of Redemptions
Redemption orders received in proper form by Touchstone Securities, an Authorized Processing Organization, or a financial intermediary, by the close of the regular session of trading on the NYSE, generally 4:00 p.m. Eastern time, are processed at that day’s NAV. Redemption orders received after the close of the regular session of trading on the NYSE are processed at the NAV determined on the following business day. It is the responsibility of the financial intermediary or Authorized Processing Organization to transmit orders that will be received by Touchstone Securities in proper form and in a timely manner.
Contingent Deferred Sales Charge (“CDSC”)
If you purchase $1 million or more in Class A shares at NAV and a commission was paid by Touchstone Securities to a participating unaffiliated dealer, a CDSC of up to 1.00% may be charged on redemptions made within 1 year of your purchase. Additionally, when an upfront commission is paid to a participating dealer on transactions of $1 million or more in Class A Shares, the Fund will withhold any 12b-1 fee for the first 12 months following the purchase date. If you redeem Class C shares within 12 months of your purchase, a CDSC of 1.00% will be charged.
The CDSC will not apply to redemptions of shares you received through reinvested dividends or capital gains distributions and may be waived under certain circumstances described below. The CDSC will be assessed on the lesser of your shares’ NAV at the time of redemption or the time of purchase. The CDSC is paid to Touchstone Securities to reimburse expenses incurred in providing distribution-related services to the Funds.
All sales charges imposed on redemptions are paid to Touchstone Securities. In determining whether the CDSC is payable, it is assumed that shares not subject to the CDSC are the first redeemed followed by other shares held for the longest period of time. The CDSC will not be imposed upon shares representing reinvested dividends or capital gains distributions, or upon amounts representing share appreciation.
No CDSC is applied if:
| | • | The redemption is due to the death or post-purchase disability of a shareholder. Touchstone Securities may require documentation prior to waiver of the charge. |
| | • | Any partial or complete redemption following death or disability (as defined in the Internal Revenue Code of 1986, as amended (the “Code”)) of a shareholder (including one who owns the shares with his or her spouse as a joint tenant with rights of survivorship) from an account in which the deceased or disabled is named. Touchstone Securities may require documentation prior to waiver of the charge, including death certificates, physicians’ certificates, etc. |
| | • | Redemptions from a systematic withdrawal plan. If the systematic withdrawal plan is based on a fixed dollar amount or number of shares, systematic withdrawal redemptions are limited to no more than 10% of your account value or number of shares per year, as of the date the transfer agent receives your request. If the systematic withdrawal plan is based on a fixed percentage of your account value, each redemption is limited to an amount that would not exceed 10% of your annual account value at the time of withdrawal. |
| | • | Redemptions from retirement plans qualified under Section 401 of the Code. The CDSC will be waived for benefit payments made by Touchstone Securities directly to plan participants. Benefit payments will include, but are not limited to, payments resulting from death, disability, retirement, separation from service, required minimum distributions (as described under Section 401(a)(9) of the Code), in-service distributions, hardships, loans and qualified domestic relations orders. The CDSC waiver will not apply in the event of termination of the plan or transfer of the plan to another financial intermediary. |
| | • | The redemption is for a mandatory withdrawal from a traditional IRA account after age 70½. |
The above mentioned CDSC waivers do not apply to redemptions made within one year for purchases of $1 million or more in Class A shares of the Touchstone Funds where a commission was paid by Touchstone Securities to a participating broker-dealer.
The SAI contains further details about the CDSC and the conditions for waiving the CDSC.
Signature Guarantees
Some circumstances require that your request to sell shares be made in writing accompanied by an original Medallion Signature Guarantee. A Medallion Signature Guarantee helps protect you against fraud. You can obtain one from most banks or securities dealers, but not from a notary public. Each Fund reserves the right to require a signature guarantee for any request related to your account including, but not limited to:
| | • | Proceeds to be paid when information on your account has been changed within the last 30 days (including a change in your name or your address, or the name or address of a payee). |
| | • | Proceeds are being sent to an address other than the address of record. |
| | • | Proceeds or shares are being sent/transferred from unlike registrations such as a joint account to an individual’s account. |
| | • | Sending proceeds via wire or ACH when bank instructions have been added or changed within 30 days of your redemption request. |
| | • | Proceeds or shares are being sent/transferred between accounts with different account registrations. |
Market Timing Policy
Market timing or excessive trading in accounts that you own or control may disrupt portfolio investment strategies, may increase brokerage and administrative costs, and may negatively impact investment returns for all shareholders, including long-term shareholders who do not generate these costs. The Funds will take reasonable steps to discourage excessive short-term trading and will not knowingly accommodate frequent purchases and redemptions of Fund shares by shareholders. The Board has adopted the following policies and procedures with respect to market timing of the Funds by shareholders. The Funds will monitor selected trades on a daily basis in an effort to deter excessive short-term trading. If a Fund has reason to believe that a shareholder has engaged in excessive short-term trading, the Fund may ask the shareholder to stop such activities or restrict or refuse to process purchases or exchanges in the shareholder’s accounts. While a Fund cannot assure the prevention of all excessive trading and market timing, by making these judgments the Funds believes they are acting in a manner that is in the best interests of shareholders. However, because the Funds cannot prevent all market timing, shareholders may be subject to the risks described above.
Generally, a shareholder may be considered a market timer if he or she has (i) requested an exchange or redemption out of any of the Touchstone Funds within 2 weeks of an earlier purchase or exchange request out of any Touchstone Fund, or (ii) made more than 2 “round-trip” exchanges within a rolling 90 day period. A “round-trip” exchange occurs when a shareholder exchanges from one Touchstone Fund to another Touchstone Fund and back to the original Touchstone Fund. If a shareholder exceeds these limits, the Funds may restrict or suspend that shareholder’s exchange privileges and subsequent exchange requests during the suspension will not be processed. The Funds may also restrict or refuse to process purchases by the shareholder. These exchange limits and excessive trading policies generally do not apply to systematic purchases and redemptions.
Financial intermediaries (such as investment advisors and broker-dealers) often establish omnibus accounts in the Funds for their customers through which transactions are placed. If a Fund identifies excessive trading in such an account, the Fund may instruct the intermediary to restrict the investor responsible for the excessive trading from further trading in the Fund. In accordance with Rule 22c-2 under the 1940 Act, the Funds have entered into information sharing agreements with certain financial intermediaries. Under these agreements, a financial intermediary is obligated to: (1) enforce during the term of the agreement, the Funds’ market-timing policy; (2) furnish the Funds, upon their request, with information regarding customer trading activities in shares of the Funds; and (3) enforce the Funds’ market-timing policy with respect to customers identified by the Funds as having engaged in market timing. When information regarding transactions in the Funds’ shares is requested by a Fund and such information is in the possession of a person that is itself a financial intermediary to a financial intermediary (an “indirect intermediary”), any financial intermediary with whom the Funds have an information sharing agreement is obligated to obtain transaction information from the
indirect intermediary or, if directed by the Funds, to restrict or prohibit the indirect intermediary from purchasing shares of the Funds on behalf of other persons.
The Funds apply these policies and procedures uniformly to all shareholders believed to be engaged in market timing or excessive trading. The Funds have no arrangements to permit any investor to trade frequently in shares of the Funds, nor will they enter into any such arrangements in the future.
Householding Policy (Only applicable for shares held directly through Touchstone Securities ). Each Fund you invest in will send one copy of its prospectuses and shareholder reports to households containing multiple shareholders with the same last name. This process, known as “householding,” reduces costs and provides a convenience to shareholders. If you share the same last name and address with another shareholder and you prefer to receive separate prospectuses and shareholder reports, call Touchstone Investments at 1.800.543.0407 and we will begin separate mailings to you within 30 days of your request. If you or others in your household invest in the Funds through a financial intermediary, you may receive separate prospectuses and shareholder reports, regardless of whether or not you have consented to householding on your investment application.
In addition, eDelivery is available for statements, confirms and regulatory documents (annual and semi-annual reports, prospectuses, information statements and proxy materials) for shareholders holding accounts directly with Touchstone Securities, please contact Shareholder Services at 1.800.534.0407 for more information. If you hold your account through a broker-dealer or financial intermediary, please contact them directly to inquire about eDelivery opportunities.
Receiving Sale Proceeds
Touchstone Securities will forward the proceeds of your sale to you (or to your financial intermediary) within 7 days (normally within 3 business days) after receipt of a proper request.
Proceeds Sent to Financial Intermediaries or Authorized Processing Organizations. Proceeds that are sent to your Authorized Processing Organization or financial intermediary will not usually be reinvested for you unless you provide specific instructions to do so. Therefore, the financial advisor, Authorized Processing Organization or financial intermediary may benefit from the use of your money.
Fund Shares Purchased by Check (Only applicable for shares held directly through Touchstone Securities ). We may delay the processing and payment of redemption proceeds for shares you recently purchased by check until your check clears, which may take up to 15 days. If you believe you may need your money sooner, you should purchase shares by bank wire.
Reinstatement Privilege (Classes A and C shares only). You may, within 90 days of redemption, including redemption proceeds reinvested from an unaffiliated money market fund, reinvest all or part of your sale proceeds by sending a written request and a check to Touchstone Securities. If the redemption proceeds were from the sale of Class A shares and the sales load that you incurred on the initial purchase is less than the sales charge for the Fund in which you are reinvesting, you will incur a sales charge representing the difference. If the redemption proceeds were from the sale of your Class A shares, and the sales load that you incurred on the initial purchase is equal to or more than the sales charge for the Fund in which you are reinvesting you can reinvest into Class A shares of any applicable Touchstone Fund at NAV. If the redemption proceeds were from the sale of Class A shares and the sales load that you incurred on the initial purchase is less than the sales charge for the Fund in which you are reinvesting, you will incur a sales charge representing the difference. Reinvestment will be at the NAV next calculated after Touchstone Securities receives your request. If the reinvestment proceeds were from the sale of your Class C shares, you can reinvest those proceeds into Class C shares of any Touchstone Fund. If you paid a CDSC on the reinstated amount, that CDSC will be reimbursed to you upon reinvestment. For federal income tax purposes, an exchange of Fund shares is treated as the sale of the shares of one Fund and the purchase of the shares of the other Fund. As a result, the exchange may result in a tax consequence if you have a capital gain or loss in the Fund shares you are selling.
Low Account Balances (Only applicable for shares held directly through Touchstone Securities ). If your balance falls below the minimum amount required for your account, based on actual amounts you have invested (as opposed to a reduction from market changes), Touchstone Securities may sell your shares and send the proceeds to you. This involuntary sale does not apply to retirement accounts or custodian accounts under the UGTMA. Touchstone Securities will notify you if your shares are about to be sold and you will have 30 days to increase your account balance to the minimum amount.
Delay of Payment. It is possible that the payment of your sale proceeds could be postponed or your right to sell your shares could be suspended during certain circumstances. These circumstances can occur:
| | • | When the NYSE is closed on days other than customary weekends and holidays; |
| | • | When trading on the NYSE is restricted; or |
| | • | During any other time when the SEC, by order, permits. |
Redemption in Kind. Under unusual circumstances (such as a period of unusually high market volatility), when the Board deems it appropriate, a Fund may make payment for shares redeemed in portfolio securities of the Fund taken at current value in order to meet redemption requests. Shareholders may incur transaction and brokerage costs when they sell these portfolio securities. Until such time as the shareholder sells the securities they receive in kind, the securities are subject to market risk. Redemptions in kind are taxable for federal income tax purposes in the same manner as redemptions for cash.
Pricing of Fund Shares
Each Fund’s share price (also called “NAV”) and public offering price (NAV plus a sales charge, if applicable) is determined as of the close of trading (normally 4:00 p.m. Eastern time) every day the NYSE is open. Each Fund calculates its NAV per share for each class, generally using market prices, by dividing the total value of its net assets by the number of shares outstanding.
The Funds’ equity investments are valued based on market value or, if no market value is available, based on fair value as determined by the Board (or under its direction). The Funds may use pricing services to determine market value for investments. Some specific pricing strategies follow:
| | • | All short-term dollar-denominated investments that mature in 60 days or less typically are valued on the basis of amortized cost which the Board has determined as fair value. |
| | • | Securities mainly traded on a U.S. exchange are valued at the last sale price on that exchange or, if no sales occurred during the day, at the last quoted bid price. |
Any foreign securities held by a Fund will be priced as follows:
| | • | All assets and liabilities initially expressed in foreign currency values will be converted into U.S. dollar values. |
| | • | Securities mainly traded on a non-U.S. exchange are generally valued according to the preceding closing values on that exchange. However, if an event that may change the value of a security occurs after the time that the closing value on the non-U.S. exchange was determined, but before the close of regular trading on the NYSE, the security may be priced based on fair value. This may cause the value of the security on the books of the Fund to be significantly different from the closing value on the non-U.S. exchange and may affect the calculation of the NAV. |
| | • | Because portfolio securities that are primarily listed on a non-U.S. exchange may trade on weekends or other days when a Fund does not price its shares, a Fund’s NAV may change on days when shareholders will not be able to buy or sell shares. |
Securities held by a Fund that do not have readily available market quotations are priced at their fair value using procedures approved by the Board. Any debt securities held by a Fund for which market quotations are not readily available are generally priced at their most recent bid prices as obtained from one or more of the major market makers for such securities. The Funds may use fair value pricing under the following circumstances, among others:
| | • | If the value of a security has been materially affected by events occurring before the Fund’s pricing time but after the close of the primary markets on which the security is traded. |
| | • | If a security, such as a small cap or micro-cap security, is so thinly traded that reliable market quotations are unavailable due to infrequent trading. |
| | • | If the exchange on which a portfolio security is principally traded closes early or if trading in a particular portfolio security was halted during the day and did not resume prior to the Fund’s NAV calculation. |
| | • | If the validity of market quotations is not reliable. |
The use of fair value pricing has the effect of valuing a security based upon the price a Fund might reasonably expect to receive if it sold that security but does not guarantee that the security can be sold at the fair value price. The Funds have established fair value policies and procedures that delegate fair value responsibilities to the Advisor. These policies and procedures outline the fair value method for the Advisor. The Advisor’s determination of a security’s fair value price often involves the consideration of a number of subjective factors established by the Board, and is therefore subject to the unavoidable risk that the value that the Fund assigns to a security may be higher or lower than the security’s value would be if a reliable market quotation for the security was readily available. With respect to any portion of a Fund’s assets that is invested in other mutual funds, that portion of the Fund’s NAV is calculated based on the NAV of that mutual fund. The prospectus for the other mutual fund explains the circumstances and effects of fair value pricing for that fund.
DISTRIBUTIONS AND TAXES
Each Fund intends to distribute to its shareholders substantially all of its net investment income and capital gains. The table below outlines when net investment income dividends are declared and paid by each Fund:
| Fund | | Dividends Declared | | Dividends Paid |
| Touchstone Active Bond Fund | | Monthly | | Monthly |
| Touchstone Arbitrage Fund | | Annually | | Annually |
| Touchstone Emerging Markets Small Cap Fund | | Annually | | Annually |
| Touchstone High Yield Fund | | Monthly | | Monthly |
| Touchstone Merger Arbitrage Fund | | Annually | | Annually |
| Touchstone Mid Cap Fund | | Annually | | Annually |
| Touchstone Mid Cap Value Fund | | Quarterly | | Quarterly |
| Touchstone Premium Yield Equity Fund | | Monthly | | Monthly |
| Touchstone Sands Capital Select Growth Fund | | Quarterly | | Quarterly |
| Touchstone Small Cap Fund | | Annually | | Annually |
| Touchstone Small Cap Value Fund | | Quarterly | | Quarterly |
| Touchstone Total Return Bond Fund | | Monthly | | Monthly |
| Touchstone Ultra Short Duration Fixed Income Fund | | Daily | | Monthly |
Each Fund makes distributions of capital gains, if any, at least annually. If you own shares on a Fund’s distribution record date, you will be entitled to receive the distribution.
You will receive income dividends and distributions of capital gains in the form of additional Fund shares unless you elect to receive payment in cash. Cash payments will only be made for amounts equal to or exceeding $25; for amounts less than $25, the dividends and distributions will be automatically reinvested in the paying Fund and class. To elect cash payments, you must notify the Funds in writing or by phone prior to the date of distribution. Your election will be effective for dividends and distributions paid after we receive your notice. To cancel your election, simply send written notice to Touchstone Investments, P.O. Box 9878, Providence, Rhode Island 02940, or by overnight mail to Touchstone Investments, c/o BNY Mellon Investment Servicing (US) Inc., 4400 Computer Drive, Westborough, Massachusetts 01581, or call Touchstone Securities at 1.800.543.0407. If you hold your shares through a financial institution, you must contact the institution to elect cash payment. If you elect to receive dividends and distributions in cash and the payment (1) is returned and marked as “undeliverable” or (2) is not cashed for six months, your cash election will be changed automatically and future dividends will be reinvested in the Fund at the per share NAV determined as of the date of cancellation.
A Fund’s dividends and other distributions are taxable to shareholders (other than retirement plans and other tax-exempt investors) whether received in cash or reinvested in additional shares of the Fund. A dividend or distribution paid by a Fund has the effect of reducing the NAV per share on the ex-dividend date by the amount of the dividend or distribution. A dividend or distribution declared shortly after a purchase of shares by an investor would, therefore, represent, in substance, a return of capital to the shareholder with respect to such shares even though it would be subject to federal income taxes.
For most shareholders, a statement will be sent to you within 60 days after the end of each year detailing the federal income tax status of your distributions. Please see “Federal Income Tax Information” below for more information on the federal income tax consequences of dividends and other distributions made by a Fund.
Federal Income Tax Information
The tax information in this prospectus is provided only for general information purposes for U.S. taxpayers and should not be considered as tax advice or relied on by a shareholder or prospective investor.
General. The Funds intend to qualify annually to be treated as regulated investment companies (“RICs”) under the Code. As such, the Funds will not be subject to federal income taxes on the earnings they distribute to shareholders provided they satisfy certain requirements and restrictions of the Code, one of which is to distribute to shareholders substantially all of the Fund’s net investment income and net short-term capital gains each year. If for any taxable year a Fund fails to qualify as a RIC: (1) it will be subject to tax in the same manner as an ordinary corporation and thus will be subject to taxation on a graduated basis at the corporate tax rate; and (2) distributions from its earnings and profits (as determined under federal income tax principles) will be
taxable as ordinary dividend income eligible for the dividends-received deduction for corporate shareholders and for “qualified dividend income” treatment for non-corporate shareholders.
Distributions. The Funds will make distributions to you that may be taxed as ordinary income or capital gains. The dividends and distributions you receive may be subject to federal, foreign, state and local taxation, depending upon your tax situation. Distributions are taxable whether you reinvest such distributions in additional shares of the Fund or choose to receive cash. Taxable Fund distributions are taxable to a shareholder even if the distributions are paid from income or gains earned by a Fund prior to the shareholder’s investment and, thus, were included in the price the shareholder paid for the shares. For example, a shareholder who purchases shares on or just before the record date of a Fund distribution will pay full price for the shares and may receive a portion of the investment back as a taxable distribution. Distributions declared by a Fund during October, November or December to shareholders of record during such month and paid by January 31 of the following year are treated for federal income tax purposes as if received by shareholders and paid by the Fund on December 31 of the year in which the distribution was declared.
Ordinary Income. Net investment income, except for qualified dividend income and income designated as tax-exempt, and short-term capital gains that are distributed to you are taxable as ordinary income for federal income tax purposes regardless of how long you have held your Fund shares. Certain dividends distributed to non-corporate shareholders and designated by a Fund as “qualified dividend income” are eligible for the long-term capital gains rate, provided certain holding period and other requirements are satisfied.
Net Capital Gains. Net capital gains (i.e., the excess of net long-term capital gains over net short-term capital losses) distributed to you, if any, are taxable as long-term capital gains for federal income tax purposes regardless of how long you have held your Fund shares.
Sale or Exchange of Shares. It is a taxable event for you if you sell shares of a Fund or exchange shares of a Fund for shares of another Touchstone Fund. Depending on the purchase price and the sale price of the shares you sell or exchange, you may have a taxable gain or loss on the transaction. Any realized gain or loss generally will be a capital gain or loss, assuming you held the shares of the Fund as a capital asset. The capital gain will be long-term or short-term depending on how long you have held your shares in the Fund. Sales of shares of a Fund that you have held for twelve months or less will be a short-term capital gain or loss and if held for more than twelve months will constitute a long-term capital gain or loss. Any loss realized by a shareholder on a disposition of shares held for six months or less will be treated as a long-term capital loss to the extent of any distributions of capital gain dividends received by the shareholder and disallowed to the extent of any distributions of exempt-interest dividends, if any, received by the shareholder with respect to such shares.
Returns of Capital. If a Fund makes a distribution in excess of its current and accumulated earnings and profits, the excess will be treated as a return of capital to the extent of a shareholder’s basis in his or her shares, and thereafter as capital gain. A return of capital is not taxable, but it reduces a shareholder’s basis in his or her shares, thus reducing any loss or increasing any gain on a subsequent taxable disposition by the shareholder of such shares.
Backup Withholding. A Fund may be required to withhold U.S. federal income tax on all distributions and sales proceeds payable to shareholders who fail to provide their correct taxpayer identification number or to make required certifications, or who have been notified by the Internal Revenue Service (the “IRS”) that they are subject to backup withholding.
Medicare Tax. An additional 3.8% Medicare tax is imposed on certain net investment income (including dividends and distributions received from a Fund and net gains from redemptions or other taxable dispositions of Fund shares) of U.S. individuals, estates and trusts to the extent that such person’s “modified adjusted gross income” (in the case of an individual) or “adjusted gross income” (in the case of an estate or trust) exceeds a threshold amount.
Foreign Taxes. Income received by a Fund or underlying Fund from sources within foreign countries may be subject to foreign withholding and other taxes. If a Fund qualifies (by having more than 50% of the value of its total assets at the close of the taxable year consist of stock or securities in foreign corporations or by being a qualified fund of funds) and elects to pass through foreign taxes paid on its investments during the year, such taxes will be reported to you as income. You may, however, be able to claim an offsetting tax credit or deduction on your federal income tax return, depending on your particular circumstances and provided you meet certain holding period and other requirements. Tax-exempt holders of Fund shares, such as qualified tax-advantaged retirement plans, will not benefit from such a deduction or credit.
Non-U.S. Shareholders. Non-U.S. shareholders may be subject to U.S. tax as a result of an investment in a Fund. This prospectus does not discuss the U.S. or foreign tax consequences of an investment by a non-U.S. shareholder in a Fund. Accordingly, non-U.S. shareholders are urged and advised to consult their own tax advisors as to the U.S. and foreign tax consequences of an investment in a Fund.
Statements and Notices. You will receive an annual statement outlining the tax status of your distributions. You may also receive written notices of certain foreign taxes paid by a Fund during the prior taxable year.
Important Tax Reporting Considerations. The Funds are required to report cost basis and holding period information to both the IRS and shareholders for gross proceeds from the sales of shares purchased on or after January 1, 2012 (“covered shares”). However, cost basis reporting by a mutual fund is not required if the shares were acquired in a reorganization, such as the reorganizations of the respective Predecessor Funds into the Active Bond Fund and the High Yield Fund, and the basis of the acquired shares is determined from the basis of shares that were not covered shares. Cost basis and holding period information is reported on Form 1099-B. The average cost method will be used to determine the cost basis of Fund shares that are covered shares unless the shareholder instructs a Fund in writing that the shareholder wants to use another available method for cost basis reporting (for example, First In, First Out (FIFO), Last In, First Out (LIFO), Specific Lot Identification (SLID) or High Cost, First Out (HIFO)). If the shareholder designates SLID as the shareholder’s tax cost basis method, the shareholder will also need to designate a secondary cost basis method (Secondary Method). If a Secondary Method is not provided, a Fund will designate FIFO as the Secondary Method and will use the Secondary Method with respect to systematic withdrawals. If you hold shares of a Fund through a financial intermediary, the financial intermediary will be responsible for this reporting and the financial intermediary’s default cost basis method may apply. Please consult your tax adviser for additional information regarding cost basis reporting and your situation.
Redemptions by S corporations of covered shares are required to be reported to the IRS on Form 1099-B. If a shareholder is a corporation and has not instructed the Fund that it is a C corporation in its Account Application or by written instruction, the Fund will treat the shareholder as an S corporation and file a Form 1099-B.
This section is only a summary of some important federal income tax considerations that may affect your investment in a Fund. More information regarding these considerations is included in the Funds’ SAI. You are urged and advised to consult your own tax advisor regarding the effects of an investment in a Fund on your tax situation, including the application of foreign, state, local and other tax laws to your particular situation.
FINANCIAL HIGHLIGHTS
The financial highlights tables are intended to help you understand each Fund’s financial performance for the past five years, or if shorter, the period of each Fund’s operations. Certain information reflects financial results for a single Fund share. The total returns in the tables represent the rate an investor would have earned (or lost) on an investment in a Fund, assuming reinvestment of all dividends and distributions. The financial highlights for each Fund were audited by Ernst & Young LLP, an independent registered public accounting firm, whose report, along with each Fund’s financial statements and related notes, is included in the Funds’ September 30, 2016 annual report. The financial highlights for the Predecessor Funds were also audited by Ernst & Young LLP, whose report, along with the Predecessor Funds’ financial statements and related notes, are included in the Predecessor Funds’ September 30, 2016 annual report. You can obtain the annual reports at no charge by calling 1.800.543.0407 or by downloading a copy from the Touchstone Investments website at: TouchstoneInvestments.com/home/formslit/. The annual reports have been incorporated by reference into the SAI.
Touchstone Active Bond Fund—Class A
Selected Data for a Share Outstanding Throughout Each Period
| | | Year Ended September 30, | |
| | | 2016 | | 2015 | | 2014 | | 2013 | | 2012 | |
| Net asset value at beginning of period | | $ | 10.20 | | | $ | 10.45 | | | $ | 10.33 | | | $ | 10.89 | | | $ | 10.46 | | |
| Income (loss) from investment operations: | | | | | | | | | | | | | | | | | | | | | |
| Net investment income | | | 0.26 | | | | 0.26 | | | | 0.32 | | | | 0.30 | | | | 0.30 | | |
| Net realized and unrealized gains (losses) on investments | | | 0.43 | | | | (0.23 | ) | | | 0.13 | | | | (0.38 | ) | | | 0.46 | | |
| Total from investment operations | | | 0.69 | | | | 0.03 | | | | 0.45 | | | | (0.08 | ) | | | 0.76 | | |
| Distributions from: | | | | | | | | | | | | | | | | | | | | | |
| Net investment income | | | (0.30 | ) | | | (0.28 | ) | | | (0.33 | ) | | | (0.36 | ) | | | (0.33 | ) | |
| Realized capital gains | | | — | | | | — | | | | — | | | | (0.12 | ) | | | — | | |
| Total distributions | | | (0.30 | ) | | | (0.28 | ) | | | (0.33 | ) | | | (0.48 | ) | | | (0.33 | ) | |
| Net asset value at end of period | | $ | 10.59 | | | $ | 10.20 | | | $ | 10.45 | | | $ | 10.33 | | | $ | 10.89 | | |
| Total return(A) | | | 6.90 | % | | | 0.24 | % | | | 4.41 | % | | | (0.85 | )% | | | 7.47 | % | |
| Ratios and supplemental data: | | | | | | | | | | | | | | | | | | | | | |
| Net assets at end of period (000’s) | | $ | 25,324 | | | $ | 29,135 | | | $ | 28,920 | | | $ | 34,635 | | | $ | 79,208 | | |
| Ratio to average net assets: | | | | | | | | | | | | | | | | | | | | | |
| Net expenses | | | 0.90 | % | | | 0.90 | % | | | 0.86 | % | | | 0.83 | % | | | 0.87 | % | |
| Gross expenses | | | 1.19 | % | | | 1.19 | % | | | 1.28 | % | | | 1.18 | % | | | 1.23 | % | |
| Net investment income | | | 2.52 | % | | | 2.50 | % | | | 2.99 | % | | | 2.94 | % | | | 2.72 | % | |
| Portfolio turnover rate | | | 590 | % | | | 349 | % | | | 281 | % | | | 353 | % | | | 525 | % | (B) |
Touchstone Active Bond Fund—Class C
Selected Data for a Share Outstanding Throughout Each Period
| | | Year Ended September 30, | |
| | | 2016 | | 2015 | | 2014 | | 2013 | | 2012 | |
| Net asset value at beginning of period | | $ | 9.48 | | | $ | 9.73 | | | $ | 9.64 | | | $ | 10.20 | | | $ | 9.82 | | |
| Income (loss) from investment operations: | | | | | | | | | | | | | | | | | | | | | |
| Net investment income | | | 0.16 | | | | 0.17 | | | | 0.21 | | | | 0.20 | | | | 0.22 | | |
| Net realized and unrealized gains (losses) on investments | | | 0.41 | | | | (0.21 | ) | | | 0.14 | | | | (0.35 | ) | | | 0.42 | | |
| Total from investment operations | | | 0.57 | | | | (0.04 | ) | | | 0.35 | | | | (0.15 | ) | | | 0.64 | | |
| Distributions from: | | | | | | | | | | | | | | | | | | | | | |
| Net investment income | | | (0.23 | ) | | | (0.21 | ) | | | (0.26 | ) | | | (0.29 | ) | | | (0.26 | ) | |
| Realized capital gains | | | — | | | | — | | | | — | | | | (0.12 | ) | | | — | | |
| Total distributions | | | (0.23 | ) | | | (0.21 | ) | | | (0.26 | ) | | | (0.41 | ) | | | (0.26 | ) | |
| Net asset value at end of period | | $ | 9.82 | | | $ | 9.48 | | | $ | 9.73 | | | $ | 9.64 | | | $ | 10.20 | | |
| Total return(A) | | | 6.03 | % | | | (0.47 | )% | | | 3.65 | % | | | (1.55 | )% | | | 6.59 | % | |
| Ratios and supplemental data: | | | | | | | | | | | | | | | | | | | | | |
| Net assets at end of period (000’s) | | $ | 6,513 | | | $ | 6,946 | | | $ | 8,725 | | | $ | 11,337 | | | $ | 19,386 | | |
| Ratio to average net assets: | | | | | | | | | | | | | | | | | | | | | |
| Net expenses | | | 1.65 | % | | | 1.65 | % | | | 1.61 | % | | | 1.58 | % | | | 1.62 | % | |
| Gross expenses | | | 2.09 | % | | | 2.06 | % | | | 2.15 | % | | | 1.98 | % | | | 2.10 | % | |
| Net investment income | | | 1.77 | % | | | 1.75 | % | | | 2.24 | % | | | 2.19 | % | | | 1.98 | % | |
| Portfolio turnover rate | | | 590 | % | | | 349 | % | | | 281 | % | | | 353 | % | | | 525 | % | (B) |
| (A) | Total returns shown exclude the effect of applicable sales loads. If these charges were included, the returns would be lower. |
| (B) | Portfolio turnover excludes the purchases and sales of the Funds acquired on April 16, 2012 and September 10, 2012. If these transactions were included, portfolio turnover would have been higher. |
Touchstone Active Bond Fund—Class Y
Selected Data for a Share Outstanding Throughout Each Period
| | | | | | | | | | | Period | |
| | | | | | | | | | | Ended | |
| | | Year Ended September 30, | | September 30, | |
| | | 2016 | | 2015 | | 2014 | | 2013 | | 2012(A) | |
| Net asset value at beginning of period | | $ | 10.20 | | | $ | 10.45 | | | $ | 10.32 | | | $ | 10.89 | | | $ | 10.69 | | |
| Income (loss) from investment operations: | | | | | | | | | | | | | | | | | | | | | |
| Net investment income | | | 0.29 | | | | 0.29 | | | | 0.34 | | | | 0.33 | | | | 0.18 | | |
| Net realized and unrealized gains (losses) on investments | | | 0.43 | | | | (0.24 | ) | | | 0.15 | | | | (0.39 | ) | | | 0.19 | | |
| Total from investment operations | | | 0.72 | | | | 0.05 | | | | 0.49 | | | | (0.06 | ) | | | 0.37 | | |
| Distributions from: | | | | | | | | | | | | | | | | | | | | | |
| Net investment income | | | (0.33 | ) | | | (0.30 | ) | | | (0.36 | ) | | | (0.39 | ) | | | (0.17 | ) | |
| Realized capital gains | | | — | | | | — | | | | — | | | | (0.12 | ) | | | — | | |
| Total distributions | | | (0.33 | ) | | | (0.30 | ) | | | (0.36 | ) | | | (0.51 | ) | | | (0.17 | ) | |
| Net asset value at end of period | | $ | 10.59 | | | $ | 10.20 | | | $ | 10.45 | | | $ | 10.32 | | | $ | 10.89 | | |
| Total return | | | 7.18 | % | | | 0.49 | % | | | 4.78 | % | | | (0.60 | )% | | | (3.46 | )% | (B) |
| Ratios and supplemental data: | | | | | | | | | | | | | | | | | | | | | |
| Net assets at end of period (000’s) | | $ | 76,544 | | | $ | 57,394 | | | $ | 59,764 | | | $ | 58,944 | | | $ | 78,575 | | |
| Ratio to average net assets: | | | | | | | | | | | | | | | | | | | | | |
| Net expenses | | | 0.65 | % | | | 0.65 | % | | | 0.61 | % | | | 0.58 | % | | | 0.58 | % | (C) |
| Gross expenses | | | 0.90 | % | | | 0.91 | % | | | 0.95 | % | | | 0.88 | % | | | 0.97 | % | (C) |
| Net investment income | | | 2.77 | % | | | 2.75 | % | | | 3.24 | % | | | 3.19 | % | | | 2.97 | % | (C) |
| Portfolio turnover rate | | | 590 | % | | | 349 | % | | | 281 | % | | | 353 | % | | | 525 | % | (D) |
| (A) | Represents the period from commencement of operations (April 16, 2012) through September 30, 2012. |
| (B) | Not annualized. |
| (C) | Annualized. |
| (D) | Portfolio turnover excludes the purchases and sales of the Funds acquired on April 16, 2012 and September 10, 2012. If these transactions were included, portfolio turnover would have been higher. |
Touchstone Active Bond Fund—Institutional Class
Selected Data for a Share Outstanding Throughout Each Period
| | | | | | | | | | | Period | |
| | | | | | | | | | | Ended | |
| | | Year Ended September 30, | | September 30, | |
| | | 2016 | | 2015 | | 2014 | | 2013 | | 2012(A) | |
| Net asset value at beginning of period | | $ | 10.19 | | | $ | 10.44 | | | $ | 10.32 | | | $ | 10.89 | | | $ | 10.69 | | |
| Income (loss) from investment operations: | | | | | | | | | | | | | | | | | | | | | |
| Net investment income | | | 0.33 | | | | 0.30 | | | | 0.35 | | | | 0.34 | | | | 0.18 | | |
| Net realized and unrealized gains (losses) on investments | | | 0.40 | | | | (0.24 | ) | | | 0.14 | | | | (0.39 | ) | | | 0.19 | | |
| Total from investment operations | | | 0.73 | | | | 0.06 | | | | 0.49 | | | | (0.05 | ) | | | 0.37 | | |
| Distributions from: | | | | | | | | | | | | | | | | | | | | | |
| Net investment income | | | (0.34 | ) | | | (0.31 | ) | | | (0.37 | ) | | | (0.40 | ) | | | (0.17 | ) | |
| Realized capital gains | | | — | | | | — | | | | — | | | | (0.12 | ) | | | — | | |
| Total distributions | | | (0.34 | ) | | | (0.31 | ) | | | (0.37 | ) | | | (0.52 | ) | | | (0.17 | ) | |
| Net asset value at end of period | | $ | 10.58 | | | $ | 10.19 | | | $ | 10.44 | | | $ | 10.32 | | | $ | 10.89 | | |
| Total return | | | 7.27 | % | | | 0.57 | % | | | 4.76 | % | | | (0.52 | )% | | | 3.50 | % | (B) |
| Ratios and supplemental data: | | | | | | | | | | | | | | | | | | | | | |
| Net assets at end of period (000’s) | | $ | 6,841 | | | $ | 6,788 | | | $ | 7,393 | | | $ | 7,606 | | | $ | 12,311 | | |
| Ratio to average net assets: | | | | | | | | | | | | | | | | | | | | | |
| Net expenses | | | 0.57 | % | | | 0.57 | % | | | 0.53 | % | | | 0.50 | % | | | 0.50 | % | (C) |
| Gross expenses | | | 1.00 | % | | | 0.95 | % | | | 1.09 | % | | | 0.95 | % | | | 1.11 | % | (C) |
| Net investment income | | | 2.85 | % | | | 2.83 | % | | | 3.32 | % | | | 3.27 | % | | | 3.05 | % | (C) |
| Portfolio turnover rate | | | 590 | % | | | 349 | % | | | 281 | % | | | 353 | % | | | 525 | % | (D) |
| (A) | Represents the period from commencement of operations (April 16, 2012) through September 30, 2012. |
| (B) | Not annualized. |
| (C) | Annualized. |
| (D) | Portfolio turnover excludes the purchases and sales of the Funds acquired on April 16, 2012 and September 10, 2012. If these transactions were included, portfolio turnover would have been higher. |
Touchstone Arbitrage Fund—Class A
Selected Data for a Share Outstanding Throughout Each Period
| | | Year Ended September 30, |
| | | 2016 | | 2015 | | 2014(A) |
| Net asset value at beginning of period | | $ | 9.93 | | | $ | 9.87 | | | $ | 10.00 | |
| Income (loss) from investments operations: | | | | | | | | | | | | |
| Net investment loss(B) | | | (0.11 | ) | | | (0.08 | ) | | | (0.10 | ) |
| Net realized and unrealized gains (losses) on investments | | | 0.66 | | | | 0.16 | | | | (0.03 | ) |
| Total from investment operations | | | 0.55 | | | | 0.08 | | | | (0.13 | ) |
| Distributions from: | | | | | | | | | | | | |
| Net investment income | | | (0.02 | ) | | | — | | | | — | |
| Realized capital gains | | | (0.15 | ) | | | (0.02 | ) | | | — | |
| Total distributions | | | (0.17 | ) | | | (0.02 | ) | | | — | |
| Net asset value at end of period | | $ | 10.31 | | | $ | 9.93 | | | $ | 9.87 | |
| Total return(C) | | | 5.61 | % | | | 0.77 | % | | | (1.30 | )% |
| Ratios and supplemental data: | | | | | | | | | | | | |
| Net assets at end of period (000’s) | | $ | 10,003 | | | $ | 20,672 | | | $ | 22,725 | |
| Ratio to average net assets: | | | | | | | | | | | | |
| Net expenses (including dividend and interest expense on securities sold short)(D) | | | 2.80 | % | | | 2.42 | % | | | 2.51 | % |
| Gross expenses (including dividend and interest expense on securities sold short)(E) | | | 3.03 | % | | | 2.44 | % | | | 2.51 | % |
| Net investment loss | | | (1.06 | )% | | | (0.83 | )% | | | (1.01 | )% |
| Portfolio turnover rate | | | 451 | % | | | 276 | % | | | 293 | % |
| (A) | Represents the period from commencement of operations (October 1, 2013) through September 30, 2014. |
| (B) | The net investment loss per share is based on average shares outstanding for the period. |
| (C) | Total returns shown exclude the effect of applicable sales loads. If these charges were included, the returns would be lower. |
| (D) | The ratio of net expenses to average net assets excluding dividend and interest expense on securities sold short for Class A is 1.68%, 1.68% and 1.67% for the years ended September 30, 2016, 2015 and 2014, respectively. |
| (E) | The ratio of gross expenses to average net assets excluding dividend and interest expense on securities sold short for Class A is 1.91%, 1.70% and 1.67% for the years ended September 30, 2016, 2015 and 2014, respectively. |
Touchstone Arbitrage Fund—Class C
Selected Data for a Share Outstanding Throughout Each Period
| | | Year Ended September 30, |
| | | 2016 | | 2015 | | 2014(A) |
| Net asset value at beginning of period | | $ | 9.80 | | | $ | 9.82 | | | $ | 10.00 | |
| Income (loss) from investments operations: | | | | | | | | | | | | |
| Net investments loss(B) | | | (0.18 | ) | | | (0.15 | ) | | | (0.17 | ) |
| Net realized and unrealized gains (losses) on investments | | | 0.65 | | | | 0.15 | | | | (0.01 | ) |
| Total from investment operations | | | 0.47 | | | | — | | | | (0.18 | ) |
| Distributions from: | | | | | | | | | | | | |
| Net investment income | | | (0.01 | ) | | | — | | | | — | |
| Realized capital gains | | | (0.15 | ) | | | (0.02 | ) | | | — | |
| Total distributions | | | (0.16 | ) | | | (0.02 | ) | | | — | |
| Net asset value at end of period | | $ | 10.11 | | | $ | 9.80 | | | $ | 9.82 | |
| Total return(C) | | | 4.81 | % | | | (0.05 | )% | | | (1.80 | )% |
| Ratios and supplemental data: | | | | | | | | | | | | |
| Net assets at end of period (000’s) | | $ | 7,930 | | | $ | 8,694 | | | $ | 11,113 | |
| Ratio to average net assets: | | | | | | | | | | | | |
| Net expenses (including dividend and interest expense on securities sold short)(D) | | | 3.55 | % | | | 3.14 | % | | | 3.27 | % |
| Gross expenses (including dividend and interest expense on securities sold short)(E) | | | 3.62 | % | | | 3.14 | % | | | 3.29 | % |
| Net investment loss | | | (1.81 | )% | | | (1.55 | )% | | | (1.77 | )% |
| Portfolio turnover rate | | | 451 | % | | | 276 | % | | | 293 | % |
| (A) | Represents the period from commencement of operations (October 1, 2013) through September 30, 2014. |
| (B) | The net investment loss per share is based on average shares outstanding for the period. |
| (C) | Total returns shown exclude the effect of applicable sales loads. If these charges were included, the returns would be lower. |
| (D) | The ratio of net expenses to average net assets excluding dividend and interest expense on securities sold short for Class C is 2.43%, 2.40% and 2.43% for the years ended September 30, 2016, 2015 and 2014, respectively. |
| (E) | The ratio of gross expenses to average net assets excluding dividend and interest expense on securities sold short for Class C is 2.50%, 2.40% and 2.45% for the years ended September 30, 2016, 2015 and 2014, respectively. |
Touchstone Arbitrage Fund—Class Y
Selected Data for a Share Outstanding Throughout Each Period
| | | Year Ended September 30, | |
| | | 2016 | | 2015 | | 2014(A) |
| Net asset value at beginning of period | | $ | 9.99 | | | $ | 9.91 | | | $ | 10.00 | |
| Income (loss) from investment operations: | | | | | | | | | | | | |
| Net investment loss(B) | | | (0.08 | ) | | | (0.05 | ) | | | (0.07 | ) |
| Net realized and unrealized gains (losses) on investments | | | 0.67 | | | | 0.15 | | | | (0.02 | ) |
| Total from investment operations | | | 0.59 | | | | 0.10 | | | | (0.09 | ) |
| Distributions from: | | | | | | | | | | | | |
| Net investment income | | | (0.03 | ) | | | — | | | | — | |
| Realized capital gains | | | (0.15 | ) | | | (0.02 | ) | | | — | |
| Total distributions | | | (0.18 | ) | | | (0.02 | ) | | | — | |
| Net asset value at end of period | | $ | 10.40 | | | $ | 9.99 | | | $ | 9.91 | |
| Total return | | | 6.00 | % | | | 0.97 | % | | | (0.90 | )% |
| Ratios and supplemental data: | | | | | | | | | | | | |
| Net assets at end of period (000’s) | | $ | 121,794 | | | $ | 87,427 | | | $ | 117,589 | |
| Ratio to average net assets: | | | | | | | | | | | | |
| Net expenses (including dividend and interest expense on securities sold short)(C) | | | 2.51 | % | | | 2.10 | % | | | 2.19 | % |
| Gross expenses (including dividend and interest expense on securities sold short(D) | | | 2.51 | % | | | 2.10 | % | | | 2.19 | % |
| Net investment loss | | | (0.77 | )% | | | (0.51 | )% | | | (0.69 | )% |
| Portfolio turnover rate | | | 451 | % | | | 276 | % | | | 293 | % |
| (A) | Represents the period from commencement of operations (October 1, 2013) through September 30, 2014. |
| (B) | The net investment loss per share is based on average shares outstanding for the period. |
| (C) | The ratio of net expenses to average net assets excluding dividend and interest expense on securities sold short for Class Y is 1.39%, 1.36% and 1.35% for the years ended September 30, 2016, 2015 and 2014, respectively. |
| (D) | The ratio of gross expenses to average net assets excluding dividend and interest expense on securities sold short for Class Y is 1.39%, 1.36% and 1.35% for the years ended September 30, 2016, 2015 and 2014, respectively. |
Touchstone Arbitrage Fund—Institutional Class
Selected Data for a Share Outstanding Throughout Each Period
| | | Year Ended September 30, |
| | | 2016 | | 2015 | | 2014(A) |
| Net asset value at beginning of period | | $ | 10.01 | | | $ | 9.92 | | | $ | 10.00 | |
| Income (loss) from investment operations: | | | | | | | | | | | | |
| Net investment loss(B) | | | (0.07 | ) | | | (0.04 | ) | | | (0.06 | ) |
| Net realized and unrealized gains (losses) on investments | | | 0.68 | | | | 0.15 | | | | (0.02 | ) |
| Total from investment operations | | | 0.61 | | | | 0.11 | | | | (0.08 | ) |
| Distributions from: | | | | | | | | | | | | |
| Net investment income | | | (0.04 | ) | | | — | | | | — | |
| Realized capital gains | | | (0.15 | ) | | | (0.02 | ) | | | — | |
| Total distributions | | | (0.19 | ) | | | (0.02 | ) | | | — | |
| Net asset value at end of period | | $ | 10.43 | | | $ | 10.01 | | | $ | 9.92 | |
| Total return | | | 6.12 | % | | | 1.06 | % | | | (0.80 | )% |
| Ratios and supplemental data: | | | | | | | | | | | | |
| Net assets at end of period (000’s) | | $ | 13,782 | | | $ | 8,735 | | | $ | 47,763 | |
| Ratio to average net assets: | | | | | | | | | | | | |
| Net expenses (including dividend and interest expense on securities sold short)(C) | | | 2.40 | % | | | 2.02 | % | | | 2.12 | % |
| Gross expenses (including dividend and interest expense on securities sold short)(D) | | | 2.48 | % | | | 2.03 | % | | | 2.12 | % |
| Net investment loss | | | (0.66 | )% | | | (0.43 | )% | | | (0.62 | )% |
| Portfolio turnover rate | | | 451 | % | | | 276 | % | | | 293 | % |
| (A) | Represents the period from commencement of operations (October 1, 2013) through September 30, 2014. |
| (B) | The net investment loss per share is based on average shares outstanding for the period. |
| (C) | The ratio of net expenses to average net assets excluding dividend and interest expense on securities sold short for Institutional Class is 1.28%, 1.28% and 1.28% for the years ended September 30, 2016, 2015 and 2014, respectively. |
| (D) | The ratio of gross expenses to average net assets excluding dividend and interest expense on securities sold short for Institutional Class is 1.36%, 1.29% and 1.28% for the years ended September 30, 2016, 2015 and 2014, respectively. |
Touchstone Emerging Markets Small Cap Fund—Class A
Selected Data for a Share Outstanding Throughout Each Period
| | | | | Year Ended September 30, | |
| | | 2016 | | 2015 | | 2014 | | 2013 | | 2012 | |
| Net asset value at beginning of period | | $ | 9.15 | | | $ | 11.67 | | | $ | 11.52 | | | $ | 12.24 | | | $ | 10.69 | | |
| Income (loss) from investment operations: | | | | | | | | | | | | | | | | | | | | | |
| Net investment income (loss) | | | (0.03) | | (A) | | 0.07 | | (A) | | 0.09 | | (A) | | 0.09 | | (A) | | 0.11 | | |
| Net realized and unrealized gains (losses) on investments | | | 0.87 | | | | (2.53 | ) | | | 0.09 | | | | (0.80 | ) | | | 1.68 | | |
| Total from investment operations | | | 0.84 | | | | (2.46 | ) | | | 0.18 | | | | (0.71 | ) | | | 1.79 | | |
| Distributions from: | | | | | | | | | | | | | | | | | | | | | |
| Net investment income | | | (0.70 | ) | | | (0.06 | ) | | | (0.03 | ) | | | (0.01 | ) | | | (0.15 | ) | |
| Realized capital gains | | | — | | | | — | | | | — | | | | — | | | | (0.09 | ) | |
| Total distributions | | | (0.70 | ) | | | (0.06 | ) | | | (0.03 | ) | | | (0.01 | ) | | | (0.24 | ) | |
| Net asset value at end of period | | $ | 9.29 | | | $ | 9.15 | | | $ | 11.67 | | | $ | 11.52 | | | $ | 12.24 | | |
| Total return(B) | | | 10.01 | % | | | (21.18 | )% | | | 1.61 | % | | | (5.69 | )% | | | 16.71 | % | |
| Ratios and supplemental data: | | | | | | | | | | | | | | | | | | | | | |
| Net assets at end of period (000’s) | | $ | 2,376 | | | $ | 3,022 | | | $ | 5,307 | | | $ | 9,843 | | | $ | 34,369 | | |
| Ratio to average net assets: | | | | | | | | | | | | | | | | | | | | | |
| Net expenses | | | 1.69 | % | | | 1.69 | % | | | 1.69 | % | | | 1.69 | % | | | 1.72 | % | |
| Gross expenses | | | 3.51 | % | | | 2.41 | % | | | 2.20 | % | | | 1.93 | % | | | 1.99 | % | |
| Net investment income (loss) | | | (0.40 | )% | | | 0.66 | % | | | 0.75 | % | | | 0.71 | % | | | 0.94 | % | |
| Portfolio turnover rate | | | 68 | % | | | 28 | % | | | 38 | % | | | 25 | % | | | 33 | % | (C) |
| (A) | The net investment income (loss) per share is based on average shares outstanding for the period. |
| (B) | Total returns shown exclude the effect of applicable sales loads. If these charges were included, the returns would be lower. |
| (C) | Portfolio turnover excludes the purchases and sales of the Touchstone Emerging Markets Equity Fund II acquired on September 17, 2012. If these transactions were included, portfolio turnover would have been higher. |
Touchstone Emerging Markets Small Cap Fund—Class C
Selected Data for a Share Outstanding Throughout Each Period
| | | | | Year Ended September 30, | |
| | | 2016 | | 2015 | | 2014 | | 2013 | | 2012 | |
| Net asset value at beginning of period | | $ | 8.94 | | | $ | 11.43 | | | $ | 11.33 | | | $ | 12.13 | | | $ | 10.54 | | |
| Income gain (loss) from investment operations: | | | | | | | | | | | | | | | | | | | | | |
| Net investment income (loss) | | | (0.10) | | (A) | | (0.01) | | (A) | | (— | ) | (A)(D) | | (— | ) | (A)(D) | | 0.04 | | |
| Net realized and unrealized gains (losses) on investments | | | 0.86 | | | | (2.48 | ) | | | 0.10 | | | | (0.80 | ) | | | 1.64 | | |
| Total from investment operations | | | 0.76 | | | | (2.49 | ) | | | 0.10 | | | | (0.80 | ) | | | 1.68 | | |
| Distributions from: | | | | | | | | | | | | | | | | | | | | | |
| Net investment income | | | (0.60 | ) | | | — | | | | — | | | | — | | | | — | | (D) |
| Realized capital gains | | | — | | | | — | | | | — | | | | — | | | | (0.09 | ) | |
| Total distributions | | | (0.60 | ) | | | — | | | | — | | | | — | | | | (0.09 | ) | |
| Net asset value at end of period | | $ | 9.10 | | | $ | 8.94 | | | $ | 11.43 | | | $ | 11.33 | | | $ | 12.13 | | |
| Total return(B) | | | 9.18 | % | | | (21.79 | )% | | | 0.88 | % | | | (6.44 | )% | | | 15.84 | % | |
| Ratios and supplemental data: | | | | | | | | | | | | | | | | | | | | | |
| Net assets at end of period (000’s) | | $ | 912 | | | $ | 1,566 | | | $ | 2,874 | | | $ | 3,719 | | | $ | 4,903 | | |
| Ratio to average net assets: | | | | | | | | | | | | | | | | | | | | | |
| Net expenses | | | 2.44 | % | | | 2.44 | % | | | 2.44 | % | | | 2.44 | % | | | 2.47 | % | |
| Gross expenses | | | 4.80 | % | | | 3.19 | % | | | 3.03 | % | | | 2.84 | % | | | 2.85 | % | |
| Net investment income (loss) | | | (1.15 | )% | | | (0.09 | )% | | | 0.00 | % | (D) | | (0.04 | )% | | | 0.19 | % | |
| Portfolio turnover rate | | | 68 | % | | | 28 | % | | | 38 | % | | | 25 | % | | | 33 | % | (C) |
| (A) | The net investment income (loss) per share is based on average shares outstanding for the period. |
| (B) | Total returns shown exclude the effect of applicable sales loads. If these charges were included, the returns would be lower. |
| (C) | Portfolio turnover excludes the purchases and sales of the Touchstone Emerging Markets Equity Fund II acquired on September 17, 2012. If these transactions were included, portfolio turnover would have been higher. |
| (D) | Less than $0.005 per share or 0.005%. |
Touchstone Emerging Markets Small Cap Fund—Class Y
Selected Data for a Share Outstanding Throughout Each Period
| | | Year Ended September 30, | |
| | | 2016 | | 2015 | | 2014 | | 2013 | | 2012 | |
| Net asset value at beginning of period | | $ | 9.10 | | | $ | 11.63 | | | $ | 11.54 | | | $ | 12.27 | | | $ | 10.74 | | |
| Income (loss) from investment operations: | | | | | | | | | | | | | | | | | | | | | |
| Net investment income (loss) | | | (0.01) | | (A) | | 0.10 | | (A) | | 0.12 | | (A) | | 0.13 | | (A) | | 0.14 | | |
| Net realized and unrealized gains (losses) on investments | | | 0.88 | | | | (2.52 | ) | | | 0.10 | | | | (0.81 | ) | | | 1.70 | | |
| Total from investment operations | | | 0.87 | | | | (2.42 | ) | | | 0.22 | | | | (0.68 | ) | | | 1.84 | | |
| Distributions from: | | | | | | | | | | | | | | | | | | | | | |
| Net investment income | | | (0.65 | ) | | | (0.11 | ) | | | (0.13 | ) | | | (0.05 | ) | | | (0.22 | ) | |
| Realized capital gains | | | — | | | | — | | | | — | | | | — | | | | (0.09 | ) | |
| Total distributions | | | (0.65 | ) | | | (0.11 | ) | | | (0.13 | ) | | | (0.05 | ) | | | (0.31 | ) | |
| Net asset value at end of period | | $ | 9.32 | | | $ | 9.10 | | | $ | 11.63 | | | $ | 11.54 | | | $ | 12.27 | | |
| Total return | | | 10.37 | % | | | (20.98 | )% | | | 1.99 | % | | | (5.45 | )% | | | 17.12 | % | |
| Ratios and supplemental data: | | | | | | | | | | | | | | | | | | | | | |
| Net assets at end of period (000’s) | | $ | 4,796 | | | $ | 70,066 | | | $ | 105,641 | | | $ | 138,451 | | | $ | 219,717 | | |
| Ratio to average net assets: | | | | | | | | | | | | | | | | | | | | | |
| Net expenses | | | 1.44 | % | | | 1.40 | % | | | 1.38 | % | | | 1.37 | % | | | 1.41 | % | |
| Gross expenses | | | 2.27 | % | | | 1.40 | % | | | 1.38 | % | | | 1.35 | % | | | 1.44 | % | |
| Net investment income (loss) | | | (0.15 | )% | | | 0.95 | % | | | 1.06 | % | | | 1.04 | % | | | 1.25 | % | |
| Portfolio turnover rate | | | 68 | % | | | 28 | % | | | 38 | % | | | 25 | % | | | 33 | % | (B) |
| (A) | The net investment income (loss) per share is based on average shares outstanding for the period. |
| (B) | Portfolio turnover excludes the purchases and sales of the Touchstone Emerging Markets Equity Fund II acquired on September 17, 2012. If these transactions were included, portfolio turnover would have been higher. |
Touchstone Emerging Markets Small Cap Fund—Institutional Class
Selected Data for a Share Outstanding Throughout Each Period
| | | Year Ended September 30, | |
| | | 2016 | | 2015 | | 2014 | | 2013 | | 2012 | |
| Net asset value at beginning of period | | $ | 9.11 | | | $ | 11.64 | | | $ | 11.55 | | | $ | 12.28 | | | $ | 10.76 | | |
| Income (loss) from investment operations: | | | | | | | | | | | | | | | | | | | | | |
| Net investment income (loss) | | | (— | ) | (A)(C) | | 0.12 | | (A) | | 0.13 | | (A) | | 0.14 | | (A) | | 0.18 | | |
| Net realized and unrealized gains (losses) on investments | | | 0.88 | | | | (2.53 | ) | | | 0.11 | | | | (0.81 | ) | | | 1.67 | | |
| Total from investment operations | | | 0.88 | | | | (2.41 | ) | | | 0.24 | | | | (0.67 | ) | | | 1.85 | | |
| Distributions from: | | | | | | | | | | | | | | | | | | | | | |
| Net investment income | | | (0.75 | ) | | | (0.12 | ) | | | (0.15 | ) | | | (0.06 | ) | | | (0.24 | ) | |
| Realized capital gains | | | — | | | | — | | | | — | | | | — | | | | (0.09 | ) | |
| Total distributions | | | (0.75 | ) | | | (0.12 | ) | | | (0.15 | ) | | | (0.06 | ) | | | (0.33 | ) | |
| Net asset value at end of period | | $ | 9.24 | | | $ | 9.11 | | | $ | 11.64 | | | $ | 11.55 | | | $ | 12.28 | | |
| Total return | | | 10.52 | % | | | (20.87 | )% | | | 2.13 | % | | | (5.43 | )% | | | 17.28 | % | |
| Ratios and supplemental data: | | | | | | | | | | | | | | | | | | | | | |
| Net assets at end of period (000’s) | | $ | 667 | | | $ | 184,841 | | | $ | 234,019 | | | $ | 218,523 | | | $ | 271,186 | | |
| Ratio to average net assets: | | | | | | | | | | | | | | | | | | | | | |
| Net expenses | | | 1.29 | % | | | 1.29 | % | | | 1.29 | % | | | 1.29 | % | | | 1.32 | % | |
| Gross expenses | | | 2.16 | % | | | 1.33 | % | | | 1.31 | % | | | 1.29 | % | | | 1.37 | % | |
| Net investment income (loss) | | | 0.00 | % | (C) | | 1.06 | % | | | 1.15 | % | | | 1.11 | % | | | 1.34 | % | |
| Portfolio turnover rate | | | 68 | % | | | 28 | % | | | 38 | % | | | 25 | % | | | 33 | % | (B) |
| (A) | The net investment income (loss) per share is based on average shares outstanding for the period. |
| (B) | Portfolio turnover excludes the purchases and sales of the Touchstone Emerging Markets Equity Fund II acquired on September 17, 2012. If these transactions were included, portfolio turnover would have been higher. |
| (C) | Less than $0.005 per share or 0.005%. |
Touchstone High Yield Fund—Class A
Selected Data for a Share Outstanding Throughout Each Period
| | | Year Ended September 30, | |
| | | 2016 | | 2015 | | 2014 | | 2013 | | 2012 | |
| Net asset value at beginning of period | | $ | 7.95 | | | $ | 8.91 | | | $ | 8.80 | | | $ | 8.90 | | | $ | 8.13 | | |
| Income (loss) from investment operations: | | | | | | | | | | | | | | | | | | | | | |
| Net investment income | | | 0.41 | | | | 0.43 | | | | 0.45 | | | | 0.51 | | | | 0.57 | | |
| Net realized and unrealized gains (losses) on investments | | | 0.26 | | | | (0.81 | ) | | | 0.12 | | | | (0.10 | ) | | | 0.76 | | |
| Total from investment operations | | | 0.67 | | | | (0.38 | ) | | | 0.57 | | | | 0.41 | | | | 1.33 | | |
| Distributions from: | | | | | | | | | | | | | | | | | | | | | |
| Net investment income | | | (0.41 | ) | | | (0.44 | ) | | | (0.46 | ) | | | (0.51 | ) | | | (0.56 | ) | |
| Realized capital gains | | | — | | | | (0.14 | ) | | | — | | | | — | | | | — | | |
| Total distributions | | | (0.41 | ) | | | (0.58 | ) | | | (0.46 | ) | | | (0.51 | ) | | | (0.56 | ) | |
| Net asset value at end of period | | $ | 8.21 | | | $ | 7.95 | | | $ | 8.91 | | | $ | 8.80 | | | $ | 8.90 | | |
| Total return(A) | | | 8.78 | % | | | (4.54 | )% | | | 6.54 | % | | | 4.68 | % | | | 16.80 | % | |
| Ratios and supplemental data: | | | | | | | | | | | | | | | | | | | | | |
| Net assets at end of period (000’s) | | $ | 20,995 | | | $ | 26,797 | | | $ | 39,671 | | | $ | 54,845 | | | $ | 96,667 | | |
| Ratio to average net assets: | | | | | | | | | | | | | | | | | | | | | |
| Net expenses | | | 1.05 | % | | | 1.05 | % | | | 1.03 | % | | | 0.99 | % | | | 0.99 | % | |
| Gross expenses | | | 1.23 | % | | | 1.15 | % | | | 1.14 | % | | | 1.13 | % | | | 1.10 | % | |
| Net investment income | | | 5.19 | % | | | 4.92 | % | | | 4.95 | % | | | 5.60 | % | | | 6.48 | % | |
| Portfolio turnover rate | | | 56 | % | | | 35 | % | | | 40 | % | | | 47 | % | | | 48 | % | (B) |
| (A) | Total returns shown exclude the effect of applicable sales loads. If these charges were included, the returns would be lower. |
| (B) | Portfolio turnover excludes the purchases and sales of the Fund acquired on September 10, 2012. If these transactions were included, portfolio turnover would have been higher. |
Touchstone High Yield Fund—Class C
Selected Data for a Share Outstanding Throughout Each Period
| | | Year Ended September 30, | |
| | | 2016 | | 2015 | | 2014 | | 2013 | | 2012 | |
| Net asset value at beginning of period | | $ | 7.93 | | | $ | 8.90 | | | $ | 8.79 | | | $ | 8.89 | | | $ | 8.12 | | |
| Income (loss) from investment operations: | | | | | | | | | | | | | | | | | | | | | |
| Net investment income | | | 0.35 | | | | 0.36 | | | | 0.38 | | | | 0.44 | | | | 0.49 | | |
| Net realized and unrealized gains (losses) on investments | | | 0.26 | | | | (0.82 | ) | | | 0.12 | | | | (0.09 | ) | | | 0.78 | | |
| Total from investment operations | | | 0.61 | | | | (0.46 | ) | | | 0.50 | | | | 0.35 | | | | 1.27 | | |
| Distributions from: | | | | | | | | | | | | | | | | | | | | | |
| Net investment income | | | (0.35 | ) | | | (0.37 | ) | | | (0.39 | ) | | | (0.45 | ) | | | (0.50 | ) | |
| Realized capital gains | | | — | | | | (0.14 | ) | | | — | | | | — | | | | — | | |
| Total distributions | | | (0.35 | ) | | | (0.51 | ) | | | (0.39 | ) | | | (0.45 | ) | | | (0.50 | ) | |
| Net asset value at end of period | | $ | 8.19 | | | $ | 7.93 | | | $ | 8.90 | | | $ | 8.79 | | | $ | 8.89 | | |
| Total return(A) | | | 7.99 | % | | | (5.28 | )% | | | 5.64 | % | | | 3.92 | % | | | 15.93 | % | |
| Ratios and supplemental data: | | | | | | | | | | | | | | | | | | | | | |
| Net assets at end of period (000’s) | | $ | 16,372 | | | $ | 24,755 | | | $ | 32,163 | | | $ | 34,661 | | | $ | 42,626 | | |
| Ratio to average net assets: | | | | | | | | | | | | | | | | | | | | | |
| Net expenses | | | 1.80 | % | | | 1.80 | % | | | 1.78 | % | | | 1.74 | % | | | 1.80 | % | |
| Gross expenses | | | 1.94 | % | | | 1.87 | % | | | 1.86 | % | | | 1.87 | % | | | 1.92 | % | |
| Net investment income | | | 4.44 | % | | | 4.17 | % | | | 4.21 | % | | | 4.86 | % | | | 5.67 | % | |
| Portfolio turnover rate | | | 56 | % | | | 35 | % | | | 40 | % | | | 47 | % | | | 48 | % | (B) |
| (A) | Total returns shown exclude the effect of applicable sales loads. If these charges were included, the returns would be lower. |
| (B) | Portfolio turnover excludes the purchases and sales of the Fund acquired on September 10, 2012. If these transactions were included, portfolio turnover would have been higher. |
Touchstone High Yield Fund—Class Y
Selected Data for a Share Outstanding Throughout Each Period
| | | Year Ended September 30, | |
| | | 2016 | | 2015 | | 2014 | | 2013 | | 2012 | |
| Net asset value at beginning of period | | $ | 8.16 | | | $ | 9.14 | | | $ | 9.01 | | | $ | 9.10 | | | $ | 8.30 | | |
| Income (loss) from investment operations | | | | | | | | | | | | | | | | | | | | | |
| Net investment income | | | 0.46 | | | | 0.47 | | | | 0.50 | | | | 0.56 | | | | 0.59 | | |
| Net realized and unrealized gains (losses) on investments | | | 0.25 | | | | (0.85 | ) | | | 0.12 | | | | (0.11 | ) | | | 0.79 | | |
| Total from investment operations | | | 0.71 | | | | (0.38 | ) | | | 0.62 | | | | 0.45 | | | | 1.38 | | |
| Distributions from: | | | | | | | | | | | | | | | | | | | | | |
| Net investment income | | | (0.43 | ) | | | (0.46 | ) | | | (0.49 | ) | | | (0.54 | ) | | | (0.58 | ) | |
| Realized capital gains | | | — | | | | (0.14 | ) | | | — | | | | — | | | | — | | |
| Total distributions | | | (0.43 | ) | | | (0.60 | ) | | | (0.49 | ) | | | (0.54 | ) | | | (0.58 | ) | |
| Net asset value at end of period | | $ | 8.44 | | | $ | 8.16 | | | $ | 9.14 | | | $ | 9.01 | | | $ | 9.10 | | |
| Total return | | | 9.11 | % | | | (4.42 | )% | | | 6.91 | % | | | 5.00 | % | | | 17.10 | % | |
| Ratios and supplemental data: | | | | | | | | | | | | | | | | | | | | | |
| Net assets at end of period (000’s) | | $ | 85,739 | | | $ | 119,505 | | | $ | 166,071 | | | $ | 187,463 | | | $ | 222,866 | | |
| Ratio to average net assets: | | | | | | | | | | | | | | | | | | | | | |
| Net expenses | | | 0.80 | % | | | 0.80 | % | | | 0.74 | % | | | 0.69 | % | | | 0.75 | % | |
| Gross expenses | | | 0.91 | % | | | 0.87 | % | | | 0.78 | % | | | 0.83 | % | | | 0.86 | % | |
| Net investment income | | | 5.44 | % | | | 5.17 | % | | | 5.24 | % | | | 5.90 | % | | | 6.72 | % | |
| Portfolio turnover rate | | | 56 | % | | | 35 | % | | | 40 | % | | | 47 | % | | | 48 | % | (A) |
| (A) | Portfolio turnover excludes the purchases and sales of the Fund acquired on September 10, 2012. If these transactions were included, portfolio turnover would have been higher. |
Touchstone High Yield Fund—Institutional Class
Selected Data for a Share Outstanding Throughout Each Period
| | | | | | | | | | | | | | | | | | | Period | |
| | | | | | | | | | | | | | | | | | | Ended | |
| | | | | | | | | | | | | | | | | | | September | |
| | | Year Ended September 30, | | 30, | |
| | | 2016 | | 2015 | | 2014 | | 2013 | | 2012(B) | |
| Net asset value at beginning of period | | $ | 8.16 | | | $ | 9.13 | | | $ | 9.00 | | | $ | 9.10 | | | $ | 8.88 | | |
| Income (loss) from investment operations: | | | | | | | | | | | | | | | | | | | | | |
| Net Investment income | | | 0.44 | | | | 0.46 | | | | 0.49 | | | | 0.54 | | | | 0.43 | | |
| Net realized and unrealized gains (losses) on investments | | | 0.27 | | | | (0.82 | ) | | | 0.13 | | | | (0.09 | ) | | | 0.23 | | |
| Total from investment operations | | | 0.71 | | | | (0.36 | ) | | | 0.62 | | | | 0.45 | | | | 0.66 | | |
| Distributions from: | | | | | | | | | | | | | | | | | | | | | |
| Net Investment income | | | (0.44 | ) | | | (0.47 | ) | | | (0.49 | ) | | | (0.55 | ) | | | (0.44 | ) | |
| Realized capital gains | | | — | | | | (0.14 | ) | | | — | | | | — | | | | — | | |
| Total distributions | | | (0.44 | ) | | | (0.61 | ) | | | (0.49 | ) | | | (0.55 | ) | | | (0.44 | ) | |
| Net asset value at end of period | | $ | 8.43 | | | $ | 8.16 | | | $ | 9.13 | | | $ | 9.00 | | | $ | 9.10 | | |
| Total return | | | 9.19 | % | | | (4.23 | )% | | | 6.99 | % | | | 5.00 | % | | | 7.66 | % | (C) |
| Ratios and supplemental data: | | | | | | | | | | | | | | | | | | | | | |
| Net assets at end of period (000’s) | | $ | 93,267 | | | $ | 59,037 | | | $ | 56,228 | | | $ | 53,844 | | | $ | 15,735 | | |
| Ratio to average net assets: | | | | | | | | | | | | | | | | | | | | | |
| Net expenses | | | 0.72 | % | | | 0.72 | % | | | 0.68 | % | | | 0.59 | % | | | 0.65 | % | (D) |
| Gross expenses | | | 0.77 | % | | | 0.75 | % | | | 0.75 | % | | | 0.75 | % | | | 0.95 | % | (D) |
| Net investment income | | | 5.52 | % | | | 5.25 | % | | | 5.31 | % | | | 6.00 | % | | | 6.82 | % | (D) |
| Portfolio turnover rate | | | 56 | % | | | 35 | % | | | 40 | % | | | 47 | % | | | 48 | % | (A) |
| (A) | Portfolio turnover excludes the purchases and sales of the Fund acquired on September 10, 2012. If these transactions were included, portfolio turnover would have been higher. |
| (B) | Represents the period from commencement of operations (January 27, 2012) through September 30, 2012. |
Touchstone Merger Arbitrage Fund—Class A
Selected Data for a Share Outstanding Throughout Each Period
| | | Year Ended September 30, | |
| | | 2016 | | 2015 | | 2014 | | 2013 | | 2012 | |
| Net asset value at beginning of period | | $ | 10.54 | | | $ | 10.49 | | | $ | 11.05 | | | $ | 10.65 | | | $ | 10.02 | | |
| Income (loss) from investment operations: | | | | | | | | | | | | | | | | | | | | | |
| Net investment income (loss)(A) | | | (0.08 | ) | | | (0.11 | ) | | | (0.13 | ) | | | 0.07 | | | | (0.09 | ) | |
| Net realized and unrealized gains (losses) on investments | | | 0.54 | | | | 0.21 | | | | (0.05 | ) | | | 0.44 | | | | 0.73 | | |
| Total from investment operations | | | 0.46 | | | | 0.10 | | | | (0.18 | ) | | | 0.51 | | | | 0.64 | | |
| Distributions from: | | | | | | | | | | | | | | | | | | | | | |
| Net investment income | | | — | | | | — | | | | (0.05 | ) | | | — | | | | (— | ) | (B) |
| Realized capital gains | | | — | | | | (0.05 | ) | | | (0.33 | ) | | | (0.11 | ) | | | (0.01 | ) | |
| Total distributions | | | — | | | | (0.05 | ) | | | (0.38 | ) | | | (0.11 | ) | | | (0.01 | ) | |
| Net asset value at end of period | | $ | 11.00 | | | $ | 10.54 | | | $ | 10.49 | | | $ | 11.05 | | | $ | 10.65 | | |
| Total return(C) | | | 4.37 | % | | | 0.92 | % | | | (1.75 | )% | | | 4.84 | % | | | 6.35 | % | |
| Ratios and supplemental data: | | | | | | | | | | | | | | | | | | | | | |
| Net assets at end of period (000’s) | | $ | 15,711 | | | $ | 21,858 | | | $ | 96,916 | | | $ | 275,858 | | | $ | 150,148 | | |
| Ratio to average net assets: | | | | | | | | | | | | | | | | | | | | | |
| Net expenses (including dividend and interest expense on securities sold short)(D) | | | 2.52 | % | | | 2.47 | % | | | 2.52 | % | | | 2.27 | % | | | 1.96 | % | |
| Gross expenses (including dividend and interest expense on securities sold short)(E) | | | 2.55 | % | | | 2.47 | % | | | 2.52 | % | | | 2.27 | % | | | 1.97 | % | |
| Net investment income (loss) | | | (0.74 | )% | | | (0.99 | )% | | | (1.25 | )% | | | 0.65 | % | | | (0.90 | )% | |
| Portfolio turnover rate | | | 400 | % | | | 227 | % | | | 271 | % | | | 288 | % | | | 307 | % | |
| (A) | The net investment income (loss) per share is based on average shares outstanding for the period. |
| (B) | Less than $0.005 per share. |
| (C) | Total returns shown exclude the effect of applicable sales loads. If these charges were included, the returns would be lower. |
| (D) | The ratio of net expenses to average net assets excluding dividend and interest expense on securities sold short is 1.68%, 1.60%, 1.57%, 1.64% and 1.65% for the years ended September 30, 2016, 2015, 2014, 2013 and 2012, respectively. |
| (E) | The ratio of gross expenses to average net assets excluding dividend and interest expense on securities sold short is 1.71%, 1.60%, 1.57%, 1.64% and 1.66% for the years ended September 30, 2016, 2015, 2014, 2013 and 2012, respectively. |
Touchstone Merger Arbitrage Fund—Class C
Selected Data for a Share Outstanding Throughout Each Period
| | | Year Ended September 30, | |
| | | 2016 | | 2015 | | 2014 | | 2013 | | 2012 | |
| Net asset value at beginning of period | | $ | 10.22 | | | $ | 10.26 | | | $ | 10.85 | | | $ | 10.54 | | | $ | 10.01 | | |
| Income (loss) from investment operations: | | | | | | | | | | | | | | | | | | | | | |
| Net investment loss(A) | | | (0.16 | ) | | | (0.18 | ) | | | (0.22 | ) | | | (0.01 | ) | | | (0.17 | ) | |
| Net realized and unrealized gains (losses) on investments | | | 0.54 | | | | 0.19 | | | | (0.04 | ) | | | 0.43 | | | | 0.71 | | |
| Total from investment operations | | | 0.38 | | | | 0.01 | | | | (0.26 | ) | | | 0.42 | | | | 0.54 | | |
| Distributions from: | | | | | | | | | | | | | | | | | | | | | |
| Net investment income | | | — | | | | — | | | | — | | | | — | | | | (— | ) | (B) |
| Realized capital gains | | | — | | | | (0.05 | ) | | | (0.33 | ) | | | (0.11 | ) | | | (0.01 | ) | |
| Total distributions | | | — | | | | (0.05 | ) | | | (0.33 | ) | | | (0.11 | ) | | | (0.01 | ) | |
| Net asset value at end of period | | $ | 10.60 | | | $ | 10.22 | | | $ | 10.26 | | | $ | 10.85 | | | $ | 10.54 | | |
| Total return(C) | | | 3.62 | % | | | 0.06 | % | | | (2.51 | )% | | | 3.93 | % | | | 5.56 | % | |
| Ratios and supplemental data: | | | | | | | | | | | | | | | | | | | | | |
| Net assets at end of period (000’s) | | $ | 14,300 | | | $ | 18,868 | | | $ | 35,737 | | | $ | 50,001 | | | $ | 25,739 | | |
| Ratio to average net assets: | | | | | | | | | | | | | | | | | | | | | |
| Net expenses (including dividend and interest expense on securities sold short)(D) | | | 3.27 | % | | | 3.26 | % | | | 3.32 | % | | | 3.05 | % | | | 2.74 | % | |
| Gross expenses (including dividend and interest expense on securities sold short)(E) | | | 3.28 | % | | | 3.26 | % | | | 3.32 | % | | | 3.05 | % | | | 2.75 | % | |
| Net investment loss | | | (1.49 | )% | | | (1.79 | )% | | | (2.05 | )% | | | (0.13 | )% | | | (1.68 | )% | |
| Portfolio turnover rate | | | 400 | % | | | 227 | % | | | 271 | % | | | 288 | % | | | 307 | % | |
| (A) | The net investment loss per share is based on average shares outstanding for the period. |
| (B) | Less than $0.005 per share. |
| (C) | Total returns shown exclude the effect of applicable sales loads. If these charges were included, the returns would be lower. |
| (D) | The ratio of net expenses to average net assets excluding dividend and interest expense on securities sold short is 2.43%, 2.39%, 2.37%, 2.42%, and 2.43% for the years ended September 30, 2016, 2015, 2014, 2013 and 2012, respectively. |
| (E) | The ratio of gross expenses to average net assets excluding dividend and interest expense on securities sold short is 2.44%, 2.39%, 2.37%, 2.42% and 2.44% for the years ended September 30, 2016, 2015, 2014, 2013 and 2012, respectively. |
Touchstone Merger Arbitrage Fund—Class Y
Selected Data for a Share Outstanding Throughout Each Period
| | | Year Ended September 30, | |
| | | 2016 | | 2015 | | 2014 | | 2013 | | 2012 | |
| Net asset value at beginning of period | | $ | 10.62 | | | $ | 10.55 | | | $ | 11.10 | | | $ | 10.68 | | | $ | 10.02 | | |
| Income (loss) from investment operations: | | | | | | | | | | | | | | | | | | | | | |
| Net investment income (loss)(A) | | | (0.05 | ) | | | (0.08 | ) | | | (0.10 | ) | | | 0.10 | | | | (0.07 | ) | |
| Net realized and unrealized gains (losses) on investments | | | 0.56 | | | | 0.20 | | | | (0.05 | ) | | | 0.43 | | | | 0.74 | | |
| Total from investment operations | | | 0.51 | | | | 0.12 | | | | (0.15 | ) | | | 0.53 | | | | 0.67 | | |
| Distributions from: | | | | | | | | | | | | | | | | | | | | | |
| Net investment income | | | — | | | | — | | | | (0.07 | ) | | | — | | | | (— | ) | (B) |
| Realized capital gains | | | — | | | | (0.05 | ) | | | (0.33 | ) | | | (0.11 | ) | | | (0.01 | ) | |
| Total distributions | | | — | | | | (0.05 | ) | | | (0.40 | ) | | | (0.11 | ) | | | (0.01 | ) | |
| Net asset value at end of period | | $ | 11.13 | | | $ | 10.62 | | | $ | 10.55 | | | $ | 11.10 | | | $ | 10.68 | | |
| Total return | | | 4.71 | % | | | 1.10 | % | | | (1.41 | )% | | | 5.01 | % | | | 6.75 | % | |
| Ratios and supplemental data: | | | | | | | | | | | | | | | | | | | | | |
| Net assets at end of period (000’s) | | $ | 85,841 | | | $ | 88,677 | | | $ | 178,305 | | | $ | 192,095 | | | $ | 90,741 | | |
| Ratio to average net assets: | | | | | | | | | | | | | | | | | | | | | |
| Net expenses (including dividend and interest expense on securities sold short)(C) | | | 2.21 | % | | | 2.20 | % | | | 2.24 | % | | | 2.02 | % | | | 1.68 | % | |
| Gross expenses (including dividend and interest expense on securities sold short)(D) | | | 2.21 | % | | | 2.20 | % | | | 2.24 | % | | | 2.01 | % | | | 1.70 | % | |
| Net investment income (loss) | | | (0.43 | )% | | | (0.73 | )% | | | (0.97 | )% | | | 0.90 | % | | | (0.62 | )% | |
| Portfolio turnover rate | | | 400 | % | | | 227 | % | | | 271 | % | | | 288 | % | | | 307 | % | |
| (A) | The net investment income (loss) per share is based on average shares outstanding for the period. |
| (B) | Less than $0.005 per share. |
| (C) | The ratio of net expenses to average net assets excluding dividend and interest expense on securities sold short is 1.37%, 1.33%, 1.29%, 1.39% and 1.37% for the years ended September 30, 2016, 2015, 2014, 2013 and 2012, respectively. |
| (D) | The ratio of gross expenses to average net assets excluding dividend and interest expense on securities sold short is 1.37%, 1.33%, 1.29%, 1.38% and 1.39% for the years ended September 30, 2016, 2015, 2014, 2013 and 2012, respectively. |
Touchstone Merger Arbitrage Fund—Institutional Class
Selected Data for a Share Outstanding Throughout Each Period
| | | Year Ended September 30, | |
| | | 2016 | | 2015 | | 2014 | | 2013 | | 2012 | |
| Net asset value at beginning of period | | $ | 10.65 | | | $ | 10.57 | | | $ | 11.13 | | | $ | 10.69 | | | $ | 10.03 | | |
| Income (loss) from investment operations: | | | | | | | | | | | | | | | | | | | | | |
| Net investment income (loss)(A) | | | (0.04 | ) | | | (0.07 | ) | | | (0.10 | ) | | | 0.11 | | | | (0.06 | ) | |
| Net realized and unrealized gains (losses) on investments | | | 0.55 | | | | 0.20 | | | | (0.05 | ) | | | 0.44 | | | | 0.73 | | |
| Total from investment operations | | | 0.51 | | | | 0.13 | | | | (0.15 | ) | | | 0.55 | | | | 0.67 | | |
| Distributions from: | | | | | | | | | | | | | | | | | | | | | |
| Net investment income | | | — | | | | — | | | | (0.08 | ) | | | — | | | | (— | ) | (B) |
| Realized capital gains | | | — | | | | (0.05 | ) | | | (0.33 | ) | | | (0.11 | ) | | | (0.01 | ) | |
| Total distributions | | | — | | | | (0.05 | ) | | | (0.41 | ) | | | (0.11 | ) | | | (0.01 | ) | |
| Net asset value at end of period | | $ | 11.16 | | | $ | 10.65 | | | $ | 10.57 | | | $ | 11.13 | | | $ | 10.69 | | |
| Total return | | | 4.79 | % | | | 1.19 | % | | | (1.44 | )% | | | 5.20 | % | | | 6.75 | % | |
| Ratios and supplemental data: | | | | | | | | | | | | | | | | | | | | | |
| Net assets at end of period (000’s) | | $ | 76,910 | | | $ | 82,858 | | | $ | 119,727 | | | $ | 170,930 | | | $ | 79,164 | | |
| Ratio to average net assets: | | | | | | | | | | | | | | | | | | | | | |
| Net expenses (including dividend and interest expense on securities sold short)(C) | | | 2.12 | % | | | 2.13 | % | | | 2.21 | % | | | 1.91 | % | | | 1.59 | % | |
| Gross expenses (including dividend and interest expense on securities sold short)(D) | | | 2.12 | % | | | 2.13 | % | | | 2.20 | % | | | 1.92 | % | | | 1.62 | % | |
| Net investment income (loss) | | | (0.34 | )% | | | (0.66 | )% | | | (0.94 | )% | | | 1.01 | % | | | (0.53 | )% | |
| Portfolio turnover rate | | | 400 | % | | | 227 | % | | | 271 | % | | | 288 | % | | | 307 | % | |
| (A) | The net investment income (loss) per share is based on average shares outstanding for the period. |
| (B) | Less than $0.005 per share. |
| (C) | The ratio of net expenses to average net assets excluding dividend and interest expense on securities sold short is 1.28%, 1.26%, 1.26%, 1.28% and 1.28% for the years ended September 30, 2016, 2015, 2014, 2013 and 2012, respectively. |
| (D) | The ratio of gross expenses to average net assets excluding dividend and interest expense on securities sold short is 1.28%, 1.26%, 1.25%, 1.29% and 1.31% for the years ended September 30, 2016, 2015, 2014, 2013 and 2012, respectively. |
Touchstone Mid Cap Fund—Class A
Selected Data for a Share Outstanding Throughout Each Period
| | | Year Ended September 30, | |
| | | 2016 | | 2015 | | 2014 | | 2013 | | 2012 | |
| Net asset value at beginning of period | | $ | 23.22 | | | $ | 23.68 | | | $ | 20.87 | | | $ | 16.55 | | | $ | 13.16 | | |
| Income (loss) from investment operations: | | | | | | | | | | | | | | | | | | | | | |
| Net investment income (loss) | | | 0.12 | | | | (0.02 | ) | (A) | | — | | (B) | | 0.12 | | (A) | | 0.10 | | (A) |
| Net realized and unrealized gains (losses) on investments | | | 2.57 | | | | (0.44 | ) | | | 2.83 | | | | 4.51 | | | | 3.31 | | |
| Total from investment operations | | | 2.69 | | | | (0.46 | ) | | | 2.83 | | | | 4.63 | | | | 3.41 | | |
| Distributions from: | | | | | | | | | | | | | | | | | | | | | |
| Net investment income | | | — | | | | — | | | | (0.02 | ) | | | (0.31 | ) | | | (0.02 | ) | |
| Net asset value at end of period | | $ | 25.91 | | | $ | 23.22 | | | $ | 23.68 | | | $ | 20.87 | | | $ | 16.55 | | |
| Total return(C) | | | 11.58 | % | | | (1.94 | )% | | | 13.57 | % | | | 28.43 | % | | | 25.95 | % | |
| Ratios and supplemental data: | | | | | | | | | | | | | | | | | | | | | |
| Net assets at end of period (000’s) | | $ | 53,044 | | | $ | 62,717 | | | $ | 35,513 | | | $ | 43,611 | | | $ | 905 | | |
| Ratio to average net assets: | | | | | | | | | | | | | | | | | | | | | |
| Net expenses | | | 1.24 | % | | | 1.24 | % | | | 1.23 | % | | | 1.21 | % | | | 1.21 | % | |
| Gross expenses | | | 1.35 | % | | | 1.35 | % | | | 1.40 | % | | | 1.50 | % | | | 3.50 | % | |
| Net investment income (loss) | | | 0.43 | % | | | (0.07 | )% | | | 0.01 | % | | | 0.61 | % | | | 0.66 | % | |
| Portfolio turnover rate | | | 19 | % | | | 17 | % | | | 26 | % | | | 20 | % | | | 152 | % | |
Touchstone Mid Cap Fund—Class C
Selected Data for a Share Outstanding Throughout Each Period
| | | Year Ended September 30, | |
| | | 2016 | | 2015 | | 2014 | | 2013 | | 2012 | |
| Net asset value at beginning of period | | $ | 22.35 | | | $ | 22.97 | | | $ | 20.37 | | | $ | 16.21 | | | $ | 12.96 | | |
| Income (loss) from investment operations: | | | | | | | | | | | | | | | | | | | | | |
| Net investment loss | | | (0.12 | ) | | | (0.20 | ) | (A) | | (0.15 | ) | | | (0.03 | ) | (A) | | (0.01 | ) | (A) |
| Net realized and unrealized gains (losses) on investments | | | 2.53 | | | | (0.42 | ) | | | 2.75 | | | | 4.42 | | | | 3.26 | | |
| Total from investment operations | | | 2.41 | | | | (0.62 | ) | | | 2.60 | | | | 4.39 | | | | 3.25 | | |
| Distributions from: | | | | | | | | | | | | | | | | | | | | | |
| Net investment income | | | — | | | | — | | | | — | | | | (0.23 | ) | | | — | | |
| Net asset value at end of period | | $ | 24.76 | | | $ | 22.35 | | | $ | 22.97 | | | $ | 20.37 | | | $ | 16.21 | | |
| Total return(C) | | | 10.78 | % | | | (2.70 | )% | | | 12.76 | % | | | 27.43 | % | | | 25.08 | % | |
| Ratios and supplemental data: | | | | | | | | | | | | | | | | | | | | | |
| Net assets at end of period (000’s) | | $ | 59,431 | | | $ | 60,815 | | | $ | 41,433 | | | $ | 25,018 | | | $ | 962 | | |
| Ratio to average net assets: | | | | | | | | | | | | | | | | | | | | | |
| Net expenses | | | 1.99 | % | | | 1.99 | % | | | 1.98 | % | | | 1.96 | % | | | 1.96 | % | |
| Gross expenses | | | 2.13 | % | | | 2.12 | % | | | 2.16 | % | | | 2.37 | % | | | 4.62 | % | |
| Net investment loss | | | (0.32 | )% | | | (0.82 | )% | | | (0.75 | )% | | | (0.14 | )% | | | (0.09 | )% | |
| Portfolio turnover rate | | | 19 | % | | | 17 | % | | | 26 | % | | | 20 | % | | | 152 | % | |
| (A) | The net investment income (loss) per share is based on average shares outstanding for the period. |
| (B) | Less than $0.005 per share. |
| (C) | Total return shown exclude the effect of applicable sales loads. If these charges were included, the returns would be lower. |
Touchstone Mid Cap Fund—Class Y
Selected Data for a Share Outstanding Throughout Each Period
| | | Year Ended September 30, | |
| | | 2016 | | 2015 | | 2014 | | 2013 | | 2012 | |
| Net asset value at beginning of period | | $ | 23.38 | | | $ | 23.83 | | | $ | 20.98 | | | $ | 16.60 | | | $ | 13.17 | | |
| Income (loss) from investment operations: | | | | | | | | | | | | | | | | | | | | | |
| Net investment income | | | 0.18 | | | | 0.05 | | (A) | | 0.06 | | | | 0.17 | | (A) | | 0.15 | | (A) |
| Net realized and unrealized gains (losses) on investments | | | 2.59 | | | | (0.45 | ) | | | 2.84 | | | | 4.53 | | | | 3.31 | | |
| Total from investment operations | | | 2.77 | | | | (0.40 | ) | | | 2.90 | | | | 4.70 | | | | 3.46 | | |
| Distributions from: | | | | | | | | | | | | | | | | | | | | | |
| Net investment income | | | (0.01 | ) | | | (0.05 | ) | | | (0.05 | ) | | | (0.32 | ) | | | (0.03 | ) | |
| Net asset value at end of period | | $ | 26.14 | | | $ | 23.38 | | | $ | 23.83 | | | $ | 20.98 | | | $ | 16.60 | | |
| Total return | | | 11.87 | % | | | (1.69 | )% | | | 13.83 | % | | | 28.78 | % | | | 26.29 | % | |
| Ratios and supplemental data: | | | | | | | | | | | | | | | | | | | | | |
| Net assets at end of period (000’s) | | $ | 476,831 | | | $ | 481,735 | | | $ | 266,446 | | | $ | 181,276 | | | $ | 47,419 | | |
| Ratio to average net assets: | | | | | | | | | | | | | | | | | | | | | |
| Net expenses | | | 0.99 | % | | | 0.99 | % | | | 0.98 | % | | | 0.95 | % | | | 0.92 | % | |
| Gross expenses | | | 1.07 | % | | | 1.11 | % | | | 1.06 | % | | | 1.09 | % | | | 1.08 | % | |
| Net investment income | | | 0.68 | % | | | 0.18 | % | | | 0.26 | % | | | 0.87 | % | | | 0.95 | % | |
| Portfolio turnover rate | | | 19 | % | | | 17 | % | | | 26 | % | | | 20 | % | | | 152 | % | |
Touchstone Mid Cap Fund—Class Z
Selected Data for a Share Outstanding Throughout Each Period
| | | Year Ended September 30, | |
| | | 2016 | | 2015 | | 2014 | | 2013 | | 2012 | |
| Net asset value at beginning of period | | $ | 23.08 | | | $ | 23.54 | | | $ | 20.73 | | | $ | 16.45 | | | $ | 13.08 | | |
| Income (loss) from investment operations: | | | | | | | | | | | | | | | | | | | | | |
| Net investment income (loss) | | | 0.12 | | | | (0.02) | | (A) | | 0.01 | | | | 0.12 | | (A) | | 0.10 | | (A) |
| Net realized and unrealized gains (losses) on investments | | | 2.55 | | | | (0.44 | ) | | | 2.81 | | | | 4.48 | | | | 3.28 | | |
| Total from investment operations | | | 2.67 | | | | (0.46 | ) | | | 2.82 | | | | 4.60 | | | | 3.38 | | |
| Distributions from: | | | | | | | | | | | | | | | | | | | | | |
| Net investment income | | | (— | ) | (B) | | — | | | | (0.01 | ) | | | (0.32 | ) | | | (0.01 | ) | |
| Net asset value at end of period | | $ | 25.75 | | | $ | 23.08 | | | $ | 23.54 | | | $ | 20.73 | | | $ | 16.45 | | |
| Total return | | | 11.58 | % | | | (1.95 | )% | | | 13.58 | % | | | 28.45 | % | | | 25.89 | % | |
| Ratios and supplemental data: | | | | | | | | | | | | | | | | | | | | | �� |
| Net assets at end of period (000’s) | | $ | 18,934 | | | $ | 18,693 | | | $ | 11,593 | | | $ | 12,858 | | | $ | 267 | | |
| Ratio to average net assets: | | | | | | | | | | | | | | | | | | | | | |
| Net expenses | | | 1.24 | % | | | 1.24 | % | | | 1.23 | % | | | 1.21 | % | | | 1.21 | % | |
| Gross expenses | | | 1.46 | % | | | 1.44 | % | | | 1.55 | % | | | 1.55 | % | | | 3.67 | % | |
| Net investment income (loss) | | | 0.43 | % | | | (0.07 | )% | | | 0.01 | % | | | 0.61 | % | | | 0.66 | % | |
| Portfolio turnover rate | | | 19 | % | | | 17 | % | | | 26 | % | | | 20 | % | | | 152 | % | |
| (A) | The net investment income (loss) per share is based on average shares outstanding for the period. |
| (B) | Less than $0.005 per share. |
Touchstone Mid Cap Fund—Institutional Class
Selected Data for a Share Outstanding Throughout Each Period
| | | | | | | | | | | Period | |
| | | | | | | | | | | Ended | |
| | | Year Ended September 30, | | September 30, | |
| | | 2016 | | 2015 | | 2014 | | 2013 | | 2012(A) | |
| Net asset value at beginning of period | | $ | 23.40 | | | $ | 23.85 | | | $ | 20.99 | | | $ | 16.61 | | | $ | 15.36 | | |
| Income (loss) from investment operations: | | | | | | | | | | | | | | | | | | | | | |
| Net investment income | | | 0.19 | | | | 0.06 | | (B) | | 0.08 | | | | 0.19 | | (B) | | 0.10 | | (B) |
| Net realized and unrealized gains (losses) on investments | | | 2.61 | | | | (0.44 | ) | | | 2.84 | | | | 4.52 | | | | 1.15 | | |
| Total from investment operations | | | 2.80 | | | | (0.38 | ) | | | 2.92 | | | | 4.71 | | | | 1.25 | | |
| Distributions from: | | | | | | | | | | | | | | | | | | | | | |
| Net investment income | | | (0.02 | ) | | | (0.07 | ) | | | (0.06 | ) | | | (0.33 | ) | | | — | | |
| Net asset value at end of period | | $ | 26.18 | | | $ | 23.40 | | | $ | 23.85 | | | $ | 20.99 | | | $ | 16.61 | | |
| Total return | | | 11.92 | % | | | (1.62 | )% | | | 13.91 | % | | | 28.85 | % | | | 8.14 | % | (C) |
| Ratios and supplemental data: | | | | | | | | | | | | | | | | | | | | | |
| Net assets at end of period (000’s) | | $ | 77,775 | | | $ | 76,324 | | | $ | 90,998 | | | $ | 74,170 | | | $ | 12,231 | | |
| Ratio to average net assets: | | | | | | | | | | | | | | | | | | | | | |
| Net expenses | | | 0.92 | % | | | 0.92 | % | | | 0.91 | % | | | 0.89 | % | | | 0.89 | % | (D) |
| Gross expenses | | | 0.99 | % | | | 1.00 | % | | | 1.01 | % | | | 1.07 | % | | | 1.38 | % | (D) |
| Net investment income | | | 0.75 | % | | | 0.25 | % | | | 0.33 | % | | | 0.93 | % | | | 0.98 | % | (D) |
| Portfolio turnover rate | | | 19 | % | | | 17 | % | | | 26 | % | | | 20 | % | | | 152 | % | |
| (A) | Represents the period from commencement of operations (January 27, 2012) through September 30, 2012. |
| (B) | The net investment income per share is based on average shares outstanding for the period. |
| (C) | Not Annualized. |
| (D) | Annualized. |
Touchstone Mid Cap Value Fund—Class A
Selected Data for a Share Outstanding Throughout Each Period
| | | Year Ended September 30, |
| | | 2016 | | 2015 | | 2014 | | 2013 | | 2012 |
| Net asset value at beginning of period | | $ | 15.70 | | | $ | 16.60 | | | $ | 16.09 | | | $ | 12.98 | | | $ | 10.86 | |
| Income (loss) from investment operations: | | | | | | | | | | | | | | | | | | | | |
| Net investment income | | | 0.09 | | (A) | | 0.12 | | | | 0.05 | | | | 0.10 | | | | 0.09 | |
| Net realized and unrealized gains (losses) on investments | | | 2.76 | | | | (0.28 | ) | | | 1.85 | | | | 3.26 | | | | 2.78 | |
| Total from investment operations | | | 2.85 | | | | (0.16 | ) | | | 1.90 | | | | 3.36 | | | | 2.87 | |
| Distributions from: | | | | | | | | | | | | | | | | | | | | |
| Net investment income | | | (0.10 | ) | | | (0.10 | ) | | | (0.05 | ) | | | (0.10 | ) | | | (0.09 | ) |
| Realized capital gains | | | (0.96 | ) | | | (0.64 | ) | | | (1.34 | ) | | | (0.15 | ) | | | (0.66 | ) |
| Total distributions | | | (1.06 | ) | | | (0.74 | ) | | | (1.39 | ) | | | (0.25 | ) | | | (0.75 | ) |
| Net asset value at end of period | | $ | 17.49 | | | $ | 15.70 | | | $ | 16.60 | | | $ | 16.09 | | | $ | 12.98 | |
| Total return(B) | | | 19.20 | % | | | (1.14 | )% | | | 12.49 | % | | | 26.26 | % | | | 27.55 | % |
| Ratios and supplemental data: | | | | | | | | | | | | | | | | | | | | |
| Net assets at end of period (000’s) | | $ | 21,867 | | | $ | 7,663 | | | $ | 14,029 | | | $ | 5,307 | | | $ | 3,409 | |
| Ratio to average net assets: | | | | | | | | | | | | | | | | | | | | |
| Net expenses | | | 1.27 | % | | | 1.29 | % | | | 1.29 | % | | | 1.29 | % | | | 1.29 | % |
| Gross expenses | | | 1.59 | % | | | 1.66 | % | | | 1.58 | % | | | 1.75 | % | | | 1.97 | % |
| Net investment income | | | 0.56 | % | | | 0.55 | % | | | 0.41 | % | | | 0.73 | % | | | 0.77 | % |
| Portfolio turnover rate | | | 45 | % | | | 54 | % | | | 85 | % | (C) | | 68 | % | | | 42 | % |
| (A) | The net investment income (loss) per share is based on average shares outstanding for the period. |
| (B) | Total returns shown exclude the effect of applicable sales loads. If these charges were included, the returns would be lower. |
| (C) | Portfolio turnover excludes the purchases and sales of the Touchstone Mid Cap Value Opportunities Fund acquired on March 21, 2014. If these transactions were included, portfolio turnover would have been higher. |
Touchstone Mid Cap Value Fund—Class C
Selected Data for a Share Outstanding Throughout Each Period
| | | Year Ended September 30, | |
| | | 2016 | | 2015 | | 2014 | | 2013 | | 2012 | |
| Net asset value at beginning of period | | $ | 15.49 | | | $ | 16.42 | | | $ | 16.00 | | | $ | 12.92 | | | $ | 10.82 | | |
| Income (loss) from investment operations: | | | | | | | | | | | | | | | | | | | | | |
| Net investment income (loss) | | | (0.03) | | (A) | | (0.04 | ) | | | (0.04 | ) | | | (— | ) | (D) | | — | | (D) |
| Net realized and unrealized gains (losses) on investments | | | 2.73 | | | | (0.25 | ) | | | 1.80 | | | | 3.24 | | | | 2.77 | | |
| Total from investment operations | | | 2.70 | | | | (0.29 | ) | | | 1.76 | | | | 3.24 | | | | 2.77 | | |
| Distributions from: | | | | | | | | | | | | | | | | | | | | | |
| Net investment income | | | — | | | | — | | | | — | | | | (0.01 | ) | | | (0.01 | ) | |
| Realized capital gains | | | (0.96 | ) | | | (0.64 | ) | | | (1.34 | ) | | | (0.15 | ) | | | (0.66 | ) | |
| Total distributions | | | (0.96 | ) | | | (0.64 | ) | | | (1.34 | ) | | | (0.16 | ) | | | (0.67 | ) | |
| Net asset value at end of period | | $ | 17.23 | | | $ | 15.49 | | | $ | 16.42 | | | $ | 16.00 | | | $ | 12.92 | | |
| Total return(B) | | | 18.32 | % | | | (1.91 | )% | | | 11.62 | % | | | 25.32 | % | | | 26.64 | % | |
| Ratios and supplemental data: | | | | | | | | | | | | | | | | | | | | | |
| Net assets at end of period (000’s) | | $ | 4,088 | | | $ | 1,752 | | | $ | 2,002 | | | $ | 719 | | | $ | 292 | | |
| Ratio to average net assets: | | | | | | | | | | | | | | | | | | | | | |
| Net expenses | | | 2.02 | % | | | 2.04 | % | | | 2.04 | % | | | 2.04 | % | | | 2.04 | % | |
| Gross expenses | | | 2.75 | % | | | 2.83 | % | | | 3.05 | % | | | 4.17 | % | | | 7.90 | % | |
| Net investment income (loss) | | | (0.19 | )% | | | (0.20 | )% | | | (0.34 | )% | | | (0.02 | )% | | | 0.02 | % | |
| Portfolio turnover rate | | | 45 | % | | | 54 | % | | | 85 | % | (C) | | 68 | % | | | 42 | % | |
| (A) | The net investment income (loss) per share is based on average shares outstanding for the period. |
| (B) | Total returns shown exclude the effect of applicable sales loads. If these charges were included, the returns would be lower. |
| (C) | Portfolio turnover excludes the purchases and sales of the Touchstone Mid Cap Value Opportunities Fund acquired on March 21, 2014. If these transactions were included, portfolio turnover would have been higher. |
| (D) | Less than $0.005 per share. |
Touchstone Mid Cap Value Fund—Class Y
Selected Data for a Share Outstanding Throughout Each Period
| | | Year Ended September 30, |
| | | 2016 | | 2015 | | 2014 | | 2013 | | 2012 |
| Net asset value at beginning of period | | $ | 15.76 | | | $ | 16.67 | | | $ | 16.15 | | | $ | 13.03 | | | $ | 10.89 | |
| Income (loss) from investment operations: | | | | | | | | | | | | | | | | | | | | |
| Net investment income | | | 0.13 | | (A) | | 0.14 | | | | 0.07 | | | | 0.15 | | | | 0.11 | |
| Net realized and unrealized gains (losses) on investments | | | 2.78 | | | | (0.27 | ) | | | 1.88 | | | | 3.26 | | | | 2.81 | |
| Total from investment operations | | | 2.91 | | | | (0.13 | ) | | | 1.95 | | | | 3.41 | | | | 2.92 | |
| Distributions from: | | | | | | | | | | | | | | | | | | | | |
| Net investment income | | | (0.14 | ) | | | (0.14 | ) | | | (0.09 | ) | | | (0.14 | ) | | | (0.12 | ) |
| Realized capital gains | | | (0.96 | ) | | | (0.64 | ) | | | (1.34 | ) | | | (0.15 | ) | | | (0.66 | ) |
| Total distributions | | | (1.10 | ) | | | (0.78 | ) | | | (1.43 | ) | | | (0.29 | ) | | | (0.78 | ) |
| Net asset value at end of period | | $ | 17.57 | | | $ | 15.76 | | | $ | 16.67 | | | $ | 16.15 | | | $ | 13.03 | |
| Total return | | | 19.51 | % | | | (0.91 | )% | | | 12.77 | % | | | 26.53 | % | | | 27.97 | % |
| Ratios and supplemental data: | | | | | | | | | | | | | | | | | | | | |
| Net assets at end of period (000’s) | | $ | 292,978 | | | $ | 208,525 | | | $ | 213,404 | | | $ | 15,782 | | | $ | 13,785 | |
| Ratio to average net assets: | | | | | | | | | | | | | | | | | | | | |
| Net expenses | | | 1.03 | % | | | 1.04 | % | | | 1.04 | % | | | 1.04 | % | | | 1.04 | % |
| Gross expenses | | | 1.13 | % | | | 1.13 | % | | | 1.14 | % | | | 1.37 | % | | | 1.46 | % |
| Net investment income | | | 0.81 | % | | | 0.81 | % | | | 0.66 | % | | | 0.98 | % | | | 1.02 | % |
| Portfolio turnover rate | | | 45 | % | | | 54 | % | | | 85 | % | (B) | | 68 | % | | | 42 | % |
Touchstone Mid Cap Value Fund—Institutional Class
Selected Data for a Share Outstanding Throughout Each Period
| | | Year Ended September 30, |
| | | 2016 | | 2015 | | 2014 | | 2013 | | 2012 |
| Net asset value at beginning of period | | $ | 15.82 | | | $ | 16.73 | | | $ | 16.20 | | | $ | 13.07 | | | $ | 10.92 | |
| Income (loss) from investment operations: | | | | | | | | | | | | | | | | | | | | |
| Net investment income | | | 0.16 | | (A) | | 0.17 | | | | 0.13 | | | | 0.16 | | | | 0.13 | |
| Net realized and unrealized gains (losses) on investments | | | 2.78 | | | | (0.27 | ) | | | 1.85 | | | | 3.28 | | | | 2.82 | |
| Total from investment operations | | | 2.94 | | | | (0.10 | ) | | | 1.98 | | | | 3.44 | | | | 2.95 | |
| Distributions from: | | | | | | | | | | | | | | | | | | | | |
| Net investment income | | | (0.16 | ) | | | (0.17 | ) | | | (0.11 | ) | | | (0.16 | ) | | | (0.14 | ) |
| Realized capital gains | | | (0.96 | ) | | | (0.64 | ) | | | (1.34 | ) | | | (0.15 | ) | | | (0.66 | ) |
| Total distributions | | | (1.12 | ) | | | (0.81 | ) | | | (1.45 | ) | | | (0.31 | ) | | | (0.80 | ) |
| Net asset value at end of period | | $ | 17.64 | | | $ | 15.82 | | | $ | 16.73 | | | $ | 16.20 | | | $ | 13.07 | |
| Total return | | | 19.71 | % | | | (0.76 | )% | | | 12.90 | % | | | 26.71 | % | | | 28.17 | % |
| Ratios and supplemental data: | | | | | | | | | | | | | | | | | | | | |
| Net assets at end of period (000’s) | | $ | 185,989 | | | $ | 124,592 | | | $ | 134,259 | | | $ | 144,965 | | | $ | 75,240 | |
| Ratio to average net assets: | | | | | | | | | | | | | | | | | | | | |
| Net expenses | | | 0.89 | % | | | 0.89 | % | | | 0.89 | % | | | 0.89 | % | | | 0.89 | % |
| Gross expenses | | | 1.03 | % | | | 1.03 | % | | | 1.04 | % | | | 1.09 | % | | | 1.12 | % |
| Net investment income | | | 0.94 | % | | | 0.96 | % | | | 0.81 | % | | | 1.13 | % | | | 1.17 | % |
| Portfolio turnover rate | | | 45 | % | | | 54 | % | | | 85 | % | (B) | | 68 | % | | | 42 | % |
| (A) | The net investment income per share is based on average shares outstanding for the period. |
| (B) | Portfolio turnover excludes the purchases and sales of the Touchstone Mid Cap Value Opportunities Fund acquired on March 21, 2014. If these transactions were included, portfolio turnover would have been higher. |
Touchstone Premium Yield Equity Fund—Class A
Selected Data for a Share Outstanding Throughout Each Period
| | | Year Ended September 30, | |
| | | 2016 | | 2015 | | 2014 | | 2013 | | 2012 | |
| Net asset value at beginning of period | | $ | 8.27 | | | $ | 9.98 | | | $ | 8.92 | | | $ | 8.11 | | | $ | 6.76 | | |
| Income (loss) from investment operations: | | | | | | | | | | | | | | | | | | | | | |
| Net investment income | | | 0.22 | | | | 0.24 | | | | 0.40 | | (A) | | 0.24 | | | | 0.24 | | |
| Net realized and unrealized gains (losses) on investments | | | 1.04 | | | | (1.25 | ) | | | 1.07 | | | | 0.80 | | | | 1.36 | | |
| Total from investment operations | | | 1.26 | | | | (1.01 | ) | | | 1.47 | | | | 1.04 | | | | 1.60 | | |
| Distributions from: | | | | | | | | | | | | | | | | | | | | | |
| Net investment income | | | (0.21 | ) | | | (0.25 | ) | | | (0.41 | ) | | | (0.23 | ) | | | (0.24 | ) | |
| Realized capital gains | | | (0.55 | ) | | | (0.45 | ) | | | — | | | | — | | | | — | | |
| Return of capital | | | — | | | | — | | | | — | | | | — | | | | (0.01 | ) | |
| Total distributions | | | (0.76 | ) | | | (0.70 | ) | | | (0.41 | ) | | | (0.23 | ) | | | (0.25 | ) | |
| Net asset value at end of period | | $ | 8.77 | | | $ | 8.27 | | | $ | 9.98 | | | $ | 8.92 | | | $ | 8.11 | | |
| Total return(B) | | | 16.80 | % | | | (10.79 | )% | | | 16.79 | % | | | 12.97 | % | | | 23.98 | % | |
| Ratios and supplemental data: | | | | | | | | | | | | | | | | | | | | | |
| Net assets at end of period (000’s) | | $ | 26,907 | | | $ | 36,023 | | | $ | 45,124 | | | $ | 86,171 | | | $ | 68,780 | | |
| Ratio to average net assets: | | | | | | | | | | | | | | | | | | | | | |
| Net expenses | | | 1.20 | % | | | 1.20 | % | | | 1.20 | % | | | 1.20 | % | | | 1.20 | % | |
| Gross expenses | | | 1.34 | % | | | 1.25 | % | | | 1.29 | % | | | 1.29 | % | | | 1.30 | % | |
| Net investment income | | | 2.57 | % | | | 2.57 | % | | | 4.24 | % | (A) | | 2.74 | % | | | 3.26 | % | |
| Portfolio turnover rate | | | 38 | % | | | 31 | % | | | 26 | % | | | 56 | % | | | 16 | % | |
| (A) | Reflects the impact of a corporate action event that resulted in a one-time increase to net investment income. If the corporate action event had not occurred, the Class A net investment income per share and ratio of net investment income to average net assets would have been lower by $0.16 and 1.70%, respectively. |
| (B) | Total returns shown exclude the effect of applicable sales loads. If these charges were included, the returns would be lower. |
Touchstone Premium Yield Equity Fund—Class C
Selected Data for a Share Outstanding Throughout Each Period
| | | Year Ended September 30, | |
| | | 2016 | | 2015 | | 2014 | | 2013 | | 2012 | |
| Net asset value at beginning of period | | $ | 8.26 | | | $ | 9.97 | | | $ | 8.90 | | | $ | 8.10 | | | $ | 6.76 | | |
| Income (loss) from investment operations: | | | | | | | | | | | | | | | | | | | | | |
| Net investment income | | | 0.15 | | | | 0.17 | | | | 0.33 | | (A) | | 0.16 | | | | 0.18 | | |
| Net realized and unrealized gains (losses) on investments | | | 1.04 | | | | (1.24 | ) | | | 1.07 | | | | 0.80 | | | | 1.35 | | |
| Total from investment operations | | | 1.19 | | | | (1.07 | ) | | | 1.40 | | | | 0.96 | | | | 1.53 | | |
| Distributions from: | | | | | | | | | | | | | | | | | | | | | |
| Net investment income | | | (0.15 | ) | | | (0.19 | ) | | | (0.33 | ) | | | (0.16 | ) | | | (0.18 | ) | |
| Realized capital gains | | | (0.55 | ) | | | (0.45 | ) | | | — | | | | — | | | | — | | |
| Return of capital | | | — | | | | — | | | | — | | | | — | | | | (0.01 | ) | |
| Total distributions | | | (0.70 | ) | | | (0.64 | ) | | | (0.33 | ) | | | (0.16 | ) | | | (0.19 | ) | |
| Net asset value at end of period | | $ | 8.75 | | | $ | 8.26 | | | $ | 9.97 | | | $ | 8.90 | | | $ | 8.10 | | |
| Total return(B) | | | 15.81 | % | | | (11.45 | )% | | | 15.99 | % | | | 12.03 | % | | | 22.93 | % | |
| Ratios and supplemental data: | | | | | | | | | | | | | | | | | | | | | |
| Net assets at end of period (000’s) | | $ | 25,781 | | | $ | 31,405 | | | $ | 31,190 | | | $ | 24,009 | | | $ | 15,680 | | |
| Ratio to average net assets: | | | | | | | | | | | | | | | | | | | | | |
| Net expenses | | | 1.95 | % | | | 1.95 | % | | | 1.95 | % | | | 1.95 | % | | | 1.95 | % | |
| Gross expenses | | | 2.05 | % | | | 2.00 | % | | | 2.02 | % | | | 2.08 | % | | | 2.14 | % | |
| Net investment income | | | 1.82 | % | | | 1.82 | % | | | 3.49 | % | (A) | | 1.99 | % | | | 2.51 | % | |
| Portfolio turnover rate | | | 38 | % | | | 31 | % | | | 26 | % | | | 56 | % | | | 16 | % | |
| (A) | Reflects the impact of a corporate action event that resulted in a one-time increase to net investment income. If the corporate action event had not occurred, the Class C net investment income per share and ratio of net investment income to average net assets would have been lower by $0.16 and 1.70%, respectively. |
| (B) | Total returns shown exclude the effect of applicable sales loads. If these charges were included, the returns would be lower. |
Touchstone Premium Yield Equity Fund—Class Y
Selected Data for a Share Outstanding Throughout Each Period
| | | Year Ended September 30, | |
| | | 2016 | | 2015 | | 2014 | | 2013 | | 2012 | |
| Net asset value at beginning of period | | $ | 8.25 | | | $ | 9.97 | | | $ | 8.90 | | | $ | 8.10 | | | $ | 6.75 | | |
| Income (loss) from investment operations: | | | | | | | | | | | | | | | | | | | | | |
| Net investment income | | | 0.23 | | | | 0.26 | | | | 0.43 | | (A) | | 0.25 | | | | 0.27 | | |
| Net realized and unrealized gains (losses) on investments | | | 1.05 | | | | (1.25 | ) | | | 1.07 | | | | 0.80 | | | | 1.35 | | |
| Total from investment operations | | | 1.28 | | | | (0.99 | ) | | | 1.50 | | | | 1.05 | | | | 1.62 | | |
| Distributions from: | | | | | | | | | | | | | | | | | | | | | |
| Net investment income | | | (0.23 | ) | | | (0.28 | ) | | | (0.43 | ) | | | (0.25 | ) | | | (0.26 | ) | |
| Realized capital gains | | | (0.55 | ) | | | (0.45 | ) | | | — | | | | — | | | | — | | |
| Return of capital | | | — | | | | — | | | | — | | | | — | | | | (0.01 | ) | |
| Total distributions | | | (0.78 | ) | | | (0.73 | ) | | | (0.43 | ) | | | (0.25 | ) | | | (0.27 | ) | |
| Net asset value at end of period | | $ | 8.75 | | | $ | 8.25 | | | $ | 9.97 | | | $ | 8.90 | | | $ | 8.10 | | |
| Total return | | | 17.13 | % | | | (10.58 | )% | | | 17.13 | % | | | 13.14 | % | | | 24.31 | % | |
| Ratios and supplemental data: | | | | | | | | | | | | | | | | | | | | | |
| Net assets at end of period (000’s) | | $ | 99,953 | | | $ | 100,772 | | | $ | 109,201 | | | $ | 66,644 | | | $ | 33,185 | | |
| Ratio to average net assets: | | | | | | | | | | | | | | | | | | | | | |
| Net expenses | | | 0.95 | % | | | 0.95 | % | | | 0.95 | % | | | 0.95 | % | | | 0.95 | % | |
| Gross expenses | | | 1.03 | % | | | 0.97 | % | | | 0.96 | % | | | 1.04 | % | | | 1.18 | % | |
| Net investment income | | | 2.82 | % | | | 2.82 | % | | | 4.49 | % | (A) | | 2.99 | % | | | 3.51 | % | |
| Portfolio turnover rate | | | 38 | % | | | 31 | % | | | 26 | % | | | 56 | % | | | 16 | % | |
| (A) | Reflects the impact of a corporate action event that resulted in a one-time increase to net investment income. If the corporate action event had not occurred, the Class Y net investment income per share and ratio of net investment income to average net assets would have been lower by $0.16 and 1.70%, respectively. |
Touchstone Sands Capital Select Growth Fund—Class A
Selected Data for a Share Outstanding Throughout Each Period
| | | Year Ended September 30, | |
| | | 2016 | | 2015 | | 2014 | | 2013 | | 2012 | |
| Net asset value at beginning of period | | $ | 16.48 | | | $ | 18.15 | | | $ | 16.08 | | | $ | 12.65 | | | $ | 9.39 | | |
| Income (loss) from investment operations: | | | | | | | | | | | | | | | | | | | | | |
| Net investment loss | | | (0.28 | ) | | | (0.15 | ) | | | (0.29 | ) | | | (0.05 | ) | | | (0.09 | ) | (A) |
| Net realized and unrealized gains (losses) on investments | | | 1.47 | | | | (0.64 | ) | | | 2.49 | | | | 3.48 | | | | 3.35 | | |
| Total from investment operations | | | 1.19 | | | | (0.79 | ) | | | 2.20 | | | | 3.43 | | | | 3.26 | | |
| Distributions from: | | | | | | | | | | | | | | | | | | | | | |
| Realized capital gains | | | (1.53 | ) | | | (0.88 | ) | | | (0.13 | ) | | | — | | | | — | | |
| Net asset value at end of period | | $ | 16.14 | | | $ | 16.48 | | | $ | 18.15 | | | $ | 16.08 | | | $ | 12.65 | | |
| Total return(B) | | | 7.17 | % | | | (4.70 | )% | | | 13.73 | % | | | 27.11 | % | | | 34.72 | % | |
| Ratios and supplemental data: | | | | | | | | | | | | | | | | | | | | | |
| Net assets at end of period (000’s) | | $ | 138,315 | | | $ | 230,783 | | | $ | 289,506 | | | $ | 416,396 | | | $ | 186,384 | | |
| Ratio to average net assets: | | | | | | | | | | | | | | | | | | | | | |
| Net expenses | | | 1.07 | % | | | 1.10 | % | | | 1.31 | % | | | 1.28 | % | | | 1.37 | % | |
| Gross expenses | | | 1.09 | % | | | 1.10 | % | | | 1.33 | % | | | 1.37 | % | | | 1.47 | % | |
| Net investment loss | | | (0.81 | )% | | | (0.65 | )% | | | (0.91 | )% | | | (0.62 | )% | | | (0.74 | )% | |
| Portfolio turnover rate | | | 46 | % | | | 29 | % | | | 30 | % | | | 37 | % | | | 19 | % | |
Touchstone Sands Capital Select Growth Fund—Class C
Selected Data for a Share Outstanding Throughout Each Period
| | | Year Ended September 30, | |
| | | 2016 | | 2015 | | 2014 | | 2013 | | 2012 | |
| Net asset value at beginning of period | | $ | 15.86 | | | $ | 17.62 | | | $ | 15.74 | | | $ | 12.47 | | | $ | 9.33 | | |
| Income (loss) from investment operations: | | | | | | | | | | | | | | | | | | | | | |
| Net investment loss | | | (0.52 | ) | | | (0.30 | ) | | | (0.32 | ) | | | (0.13 | ) | | | (0.17 | ) | (A) |
| Net realized and unrealized gains (losses) on investments | | | 1.55 | | | | (0.58 | ) | | | 2.33 | | | | 3.40 | | | | 3.31 | | |
| Total from investment operations | | | 1.03 | | | | (0.88 | ) | | | 2.01 | | | | 3.27 | | | | 3.14 | | |
| Distributions from: | | | | | | | | | | | | | | | | | | | | | |
| Realized capital gains | | | (1.53 | ) | | | (0.88 | ) | | | (0.13 | ) | | | — | | | | — | | |
| Net asset value at end of period | | $ | 15.36 | | | $ | 15.86 | | | $ | 17.62 | | | $ | 15.74 | | | $ | 12.47 | | |
| Total return(B) | | | 6.32 | % | | | (5.38 | )% | | | 12.89 | % | | | 26.14 | % | | | 33.66 | % | |
| Ratios and supplemental data: | | | | | | | | | | | | | | | | | | | | | |
| Net assets at end of period (000’s) | | $ | 111,951 | | | $ | 163,237 | | | $ | 203,865 | | | $ | 198,584 | | | $ | 88,931 | | |
| Ratio to average net assets: | | | | | | | | | | | | | | | | | | | | | |
| Net expenses | | | 1.82 | % | | | 1.85 | % | | | 2.06 | % | | | 2.03 | % | | | 2.12 | % | |
| Gross expenses | | | 1.84 | % | | | 1.85 | % | | | 2.09 | % | | | 2.14 | % | | | 2.22 | % | |
| Net investment loss | | | (1.56 | )% | | | (1.40 | )% | | | (1.65 | )% | | | (1.37 | )% | | | (1.49 | )% | |
| Portfolio turnover rate | | | 46 | % | | | 29 | % | | | 30 | % | | | 37 | % | | | 19 | % | |
| (A) | The net investment loss per share is based on average shares outstanding for the period. |
| (B) | Total returns shown exclude the effect of applicable sales loads. If these charges were included, the returns would be lower. |
Touchstone Sands Capital Select Growth Fund—Class Y
Selected Data for a Share Outstanding Throughout Each Period
| | | Year Ended September 30, | |
| | | 2016 | | 2015 | | 2014 | | 2013 | | 2012 | |
| Net asset value at beginning of period | | $ | 16.96 | | | $ | 18.61 | | | $ | 16.44 | | | $ | 12.90 | | | $ | 9.56 | | |
| Income (loss) from investment operations: | | | | | | | | | | | | | | | | | | | | | |
| Net investment loss | | | (0.11 | ) | | | (0.08 | ) | | | (0.10 | ) | | | (0.02 | ) | | | (0.06 | ) | (A) |
| Net realized and unrealized gains (losses) on investments | | | 1.38 | | | | (0.69 | ) | | | 2.40 | | | | 3.56 | | | | 3.40 | | |
| Total from investment operations | | | 1.27 | | | | (0.77 | ) | | | 2.30 | | | | 3.54 | | | | 3.34 | | |
| Distributions from: | | | | | | | | | | | | | | | | | | | | | |
| Realized capital gains | | | (1.53 | ) | | | (0.88 | ) | | | (0.13 | ) | | | — | | | | — | | |
| Net asset value at end of period | | $ | 16.70 | | | $ | 16.96 | | | $ | 18.61 | | | $ | 16.44 | | | $ | 12.90 | | |
| Total return | | | 7.46 | % | | | (4.46 | )% | | | 14.04 | % | | | 27.44 | % | | | 34.94 | % | |
| Ratios and supplemental data: | | | | | | | | | | | | | | | | | | | | | |
| Net assets at end of period (000’s) | | $ | 2,209,841 | | | $ | 3,198,758 | | | $ | 3,473,661 | | | $ | 2,684,731 | | | $ | 1,215,124 | | |
| Ratio to average net assets: | | | | | | | | | | | | | | | | | | | | | |
| Net expenses | | | 0.82 | % | | | 0.83 | % | | | 1.06 | % | | | 1.03 | % | | | 1.11 | % | |
| Gross expenses | | | 0.82 | % | | | 0.83 | % | | | 1.03 | % | | | 1.06 | % | | | 1.18 | % | |
| Net investment loss | | | (0.56 | )% | | | (0.39 | )% | | | (0.66 | )% | | | (0.37 | )% | | | (0.49 | )% | |
| Portfolio turnover rate | | | 46 | % | | | 29 | % | | | 30 | % | | | 37 | % | | | 19 | % | |
Touchstone Sands Capital Select Growth Fund—Class Z
Selected Data for a Share Outstanding Throughout Each Period
| | | Year Ended September 30, | |
| | | 2016 | | 2015 | | 2014 | | 2013 | | 2012 | |
| Net asset value at beginning of period | | $ | 16.49 | | | $ | 18.15 | | | $ | 16.08 | | | $ | 12.65 | | | $ | 9.39 | | |
| Income (loss) from investment operations: | | | | | | | | | | | | | | | | | | | | | |
| Net investment loss | | | (0.29 | ) | | | (0.19 | ) | | | (0.17 | ) | | | (0.10 | ) | | | (0.08 | ) | (A) |
| Net realized and unrealized gains (losses) on investments | | | 1.48 | | | | (0.59 | ) | | | 2.37 | | | | 3.53 | | | | 3.34 | | |
| Total from investment operations | | | 1.19 | | | | (0.78 | ) | | | 2.20 | | | | 3.43 | | | | 3.26 | | |
| Distributions from: | | | | | | | | | | | | | | | | | | | | | |
| Realized capital gains | | | (1.53 | ) | | | (0.88 | ) | | | (0.13 | ) | | | — | | | | — | | |
| Net asset value at end of period | | $ | 16.15 | | | $ | 16.49 | | | $ | 18.15 | | | $ | 16.08 | | | $ | 12.65 | | |
| Total return | | | 7.24 | % | | | (4.70 | )% | | | 13.73 | % | | | 27.11 | % | | | 34.72 | % | |
| Ratios and supplemental data: | | | | | | | | | | | | | | | | | | | | | |
| Net assets at end of period (000’s) | | $ | 777,930 | | | $ | 1,292,853 | | | $ | 2,302,038 | | | $ | 2,140,884 | | | $ | 1,836,957 | | |
| Ratio to average net assets: | | | | | | | | | | | | | | | | | | | | | |
| Net expenses | | | 1.04 | % | | | 1.08 | % | | | 1.31 | % | | | 1.28 | % | | | 1.32 | % | |
| Gross expenses | | | 1.11 | % | | | 1.13 | % | | | 1.35 | % | | | 1.37 | % | | | 1.39 | % | |
| Net investment loss | | | (0.79 | )% | | | (0.64 | )% | | | (0.90 | )% | | | (0.62 | )% | | | (0.70 | )% | |
| Portfolio turnover rate | | | 46 | % | | | 29 | % | | | 30 | % | | | 37 | % | | | 19 | % | |
| (A) | The net investment loss per share is based on average shares outstanding for the period. |
Touchstone Small Cap Fund—Class A
Selected Data for a Share Outstanding Throughout Each Period
| | | Year Ended September 30, | |
| | | 2016 | | 2015 | | 2014 | | 2013 | | 2012 | |
| Net asset value at beginning of period | | $ | 17.73 | | | $ | 20.55 | | | $ | 19.44 | | | $ | 16.02 | | | $ | 11.94 | | |
| Income (loss) from investment operations: | | | | | | | | | | | | | | | | | | | | | |
| Net investment income (loss) | | | — | | (A) | | 0.15 | | (B) | | (0.09 | ) | (C) | | 0.44 | | | | 0.05 | | |
| Net realized and unrealized gains (losses) on investments | | | 0.59 | | | | (1.38 | ) | | | 1.80 | | | | 3.28 | | | | 4.20 | | |
| Total from investment operations | | | 0.59 | | | | (1.23 | ) | | | 1.71 | | | | 3.72 | | | | 4.25 | | |
| Distributions from: | | | | | | | | | | | | | | | | | | | | | |
| Net investment income | | | (0.13 | ) | | | (— | ) | (A) | | (0.31 | ) | | | (0.18 | ) | | | (— | ) | (A) |
| Realized capital gains | | | (1.95 | ) | | | (1.59 | ) | | | (0.29 | ) | | | (0.12 | ) | | | (0.17 | ) | |
| Total distributions | | | (2.08 | ) | | | (1.59 | ) | | | (0.60 | ) | | | (0.30 | ) | | | (0.17 | ) | |
| Net asset value at end of period | | $ | 16.24 | | | $ | 17.73 | | | $ | 20.55 | | | $ | 19.44 | | | $ | 16.02 | | |
| Total return(D) | | | 3.74 | % | | | (6.36 | )% | | | 8.80 | % | | | 23.60 | % | | | 35.86 | % | |
| Ratios and supplemental data: | | | | | | | | | | | | | | | | | | | | | |
| Net assets at end of period (000’s) | | $ | 37,942 | | | $ | 62,423 | | | $ | 60,246 | | | $ | 122,394 | | | $ | 84,539 | | |
| Ratio to average net assets: | | | | | | | | | | | | | | | | | | | | | |
| Net expenses | | | 1.38 | % | | | 1.38 | % | | | 1.36 | % | | | 1.34 | % | | | 1.34 | % | |
| Gross expenses | | | 1.45 | % | | | 1.42 | % | | | 1.43 | % | | | 1.53 | % | | | 1.58 | % | |
| Net investment income (loss) | | | 0.00 | % | (A) | | 0.75 | % | (B) | | (0.45 | )% | | | 2.47 | % | | | 0.37 | % | |
| Portfolio turnover rate | | | 17 | % | | | 42 | % | | | 17 | % | | | 15 | % | | | 11 | % | |
| (A) | Less than $0.005 per share or 0.005%. |
| (B) | Reflects the impact of a corporate action event that resulted in a one-time increase to net investment income. If the corporate action event had not occurred, the Class A net investment income per share and ratio of net investment income to average net assets would have been lower by $0.13 and 0.65%, respectively. |
| (C) | The net investment loss per share is based on average shares outstanding for the period. |
| (D) | Total returns shown exclude the effect of applicable sales loads. If these charges were included, the returns would be lower. |
Touchstone Small Cap Fund—Class C
Selected Data for a Share Outstanding Throughout Each Period
| | | Year Ended September 30, | |
| | | 2016 | | 2015 | | 2014 | | 2013 | | 2012 | |
| Net asset value at beginning of period | | $ | 17.16 | | | $ | 20.07 | | | $ | 19.01 | | | $ | 15.69 | | | $ | 11.79 | | |
| Income (loss) from investment operations: | | | | | | | | | | | | | | | | | | | | | |
| Net investment income (loss) | | | (0.16 | ) | | | — | | (A)(B) | | (0.24 | ) | (C) | | 0.30 | | | | (0.01 | ) | |
| Net realized and unrealized gains (losses) on investments | | | 0.60 | | | | (1.32 | ) | | | 1.75 | | | | 3.22 | | | | 4.08 | | |
| Total from investment operations | | | 0.44 | | | | (1.32 | ) | | | 1.51 | | | | 3.52 | | | | 4.07 | | |
| Distributions from: | | | | | | | | | | | | | | | | | | | | | |
| Net investment income | | | (0.02 | ) | | | — | | | | (0.16 | ) | | | (0.08 | ) | | | (— | ) | (A) |
| Realized capital gains | | | (1.95 | ) | | | (1.59 | ) | | | (0.29 | ) | | | (0.12 | ) | | | (0.17 | ) | |
| Total distributions | | | (1.97 | ) | | | (1.59 | ) | | | (0.45 | ) | | | (0.20 | ) | | | (0.17 | ) | |
| Net asset value at end of period | | $ | 15.63 | | | $ | 17.16 | | | $ | 20.07 | | | $ | 19.01 | | | $ | 15.69 | | |
| Total return(D) | | | 2.92 | % | | | (7.01 | )% | | | 7.96 | % | | | 22.69 | % | | | 34.78 | % | |
| Ratios and supplemental data: | | | | | | | | | | | | | | | | | | | | | |
| Net assets at end of period (000’s) | | $ | 14,957 | | | $ | 21,562 | | | $ | 27,104 | | | $ | 28,685 | | | $ | 24,278 | | |
| Ratio to average net assets: | | | | | | | | | | | | | | | | | | | | | |
| Net expenses | | | 2.13 | % | | | 2.13 | % | | | 2.12 | % | | | 2.09 | % | | | 2.09 | % | |
| Gross expenses | | | 2.23 | % | | | 2.17 | % | | | 2.17 | % | | | 2.24 | % | | | 2.30 | % | |
| Net investment income (loss) | | | (0.75 | )% | | | 0.00 | % | (A)(B) | | (1.20 | )% | | | 1.72 | % | | | (0.38 | )% | |
| Portfolio turnover rate | | | 17 | % | | | 42 | % | | | 17 | % | | | 15 | % | | | 11 | % | |
| (A) | Less than $0.005 per share or 0.005%. |
| (B) | Reflects the impact of a corporate action event that resulted in a one-time increase to net investment income. If the corporate action event had not occurred, the Class C net investment income per share and ratio of net investment income to average net assets would have been lower by 0.13% and 0.65%, respectively. |
| (C) | The net investment loss per share is based on average shares outstanding for the period. |
| (D) | Total returns shown exclude the effect of applicable sales loads. If these charges were included, the returns would be lower. |
Touchstone Small Cap Fund—Class Y
Selected Data for a Share Outstanding Throughout Each Period
| | | Year Ended September 30, |
| | | 2016 | | 2015 | | 2014 | | 2013 | | 2012 |
| Net asset value at beginning of period | | $ | 17.93 | | | $ | 20.72 | | | $ | 19.59 | | | $ | 16.13 | | | $ | 12.00 | |
| Income (loss) from investment operations: | | | | | | | | | | | | | | | | | | | | |
| Net investment income (loss) | | | 0.05 | | | | 0.18 | | (A) | | (0.03 | ) | (B) | | 0.46 | | | | 0.07 | |
| Net realized and unrealized gains (losses) on investments | | | 0.58 | | | | (1.37 | ) | | | 1.81 | | | | 3.34 | | | | 4.24 | |
| Total from investment operations | | | 0.63 | | | | (1.19 | ) | | | 1.78 | | | | 3.80 | | | | 4.31 | |
| Distributions from: | | | | | | | | | | | | | | | | | | | | |
| Net investment income | | | (0.17 | ) | | | (0.01 | ) | | | (0.36 | ) | | | (0.22 | ) | | | (0.01 | ) |
| Realized capital gains | | | (1.95 | ) | | | (1.59 | ) | | | (0.29 | ) | | | (0.12 | ) | | | (0.17 | ) |
| Total distributions | | | (2.12 | ) | | | (1.60 | ) | | | (0.65 | ) | | | (0.34 | ) | | | (0.18 | ) |
| Net asset value at end of period | | $ | 16.44 | | | $ | 17.93 | | | $ | 20.72 | | | $ | 19.59 | | | $ | 16.13 | |
| Total return | | | 3.97 | % | | | (6.11 | )% | | | 9.12 | % | | | 24.01 | % | | | 36.23 | % |
| Ratios and supplemental data: | | | | | | | | | | | | | | | | | | | | |
| Net assets at end of period (000’s) | | $ | 295,198 | | | $ | 333,971 | | | $ | 309,367 | | | $ | 258,024 | | | $ | 168,987 | |
| Ratio to average net assets: | | | | | | | | | | | | | | | | | | | | |
| Net expenses | | | 1.13 | % | | | 1.11 | % | | | 1.06 | % | | | 1.03 | % | | | 1.04 | % |
| Gross expenses | | | 1.14 | % | | | 1.11 | % | | | 1.08 | % | | | 1.14 | % | | | 1.17 | % |
| Net investment income (loss) | | | 0.25 | % | | | 1.02 | % | (A) | | (0.15 | )% | | | 2.78 | % | | | 0.66 | % |
| Portfolio turnover rate | | | 17 | % | | | 42 | % | | | 17 | % | | | 15 | % | | | 11 | % |
| (A) | Reflects the impact of a corporate action event that resulted in a one-time increase to net investment income. If the corporate action event had not occurred, the Class Y net investment income per share and ratio of net investment income to average net assets would have been lower by $0.13 and 0.65%, respectively. |
| (B) | The net investment loss per share is based on average shares outstanding for the period. |
Touchstone Small Cap Fund—Institutional Class
Selected Data for a Share Outstanding Throughout Each Period
| | | Year Ended September 30, |
| | | 2016 | | 2015 | | 2014 | | 2013 | | 2012 |
| Net asset value at beginning of period | | $ | 17.92 | | | $ | 20.69 | | | $ | 19.57 | | | $ | 16.11 | | | $ | 11.99 | |
| Income (loss) from investment operations: | | | | | | | | | | | | | | | | | | | | |
| Net investment income (loss) | | | 0.07 | | | | 0.24 | | (A) | | (0.02 | ) | (B) | | 0.49 | | | | 0.06 | |
| Net realized and unrealized gains (losses) on investments | | | 0.57 | | | | (1.41 | ) | | | 1.81 | | | | 3.32 | | | | 4.26 | |
| Total from investment operations | | | 0.64 | | | | (1.17 | ) | | | 1.79 | | | | 3.81 | | | | 4.32 | |
| Distributions from: | | | | | | | | | | | | | | | | | | | | |
| Net investment income | | | (0.18 | ) | | | (0.01 | ) | | | (0.38 | ) | | | (0.23 | ) | | | (0.03 | ) |
| Realized capital gains | | | (1.95 | ) | | | (1.59 | ) | | | (0.29 | ) | | | (0.12 | ) | | | (0.17 | ) |
| Total distributions | | | (2.13 | ) | | | (1.60 | ) | | | (0.67 | ) | | | (0.35 | ) | | | (0.20 | ) |
| Net asset value at end of period | | $ | 16.43 | | | $ | 17.92 | | | $ | 20.69 | | | $ | 19.57 | | | $ | 16.11 | |
| Total return | | | 4.05 | % | | | (6.01 | )% | | | 9.17 | % | | | 24.13 | % | | | 36.32 | % |
| Ratios and supplemental data: | | | | | | | | | | | | | | | | | | | | |
| Net assets at end of period (000’s) | | $ | 255,422 | | | $ | 301,868 | | | $ | 393,287 | | | $ | 395,770 | | | $ | 247,876 | |
| Ratio to average net assets: | | | | | | | | | | | | | | | | | | | | |
| Net expenses | | | 1.04 | % | | | 1.04 | % | | | 1.01 | % | | | 0.94 | % | | | 0.94 | % |
| Gross expenses | | | 1.04 | % | | | 1.04 | % | | | 1.04 | % | | | 1.07 | % | | | 1.09 | % |
| Net investment income (loss) | | | 0.34 | % | | | 1.10 | % | (A) | | (0.10 | )% | | | 2.87 | % | | | 0.77 | % |
| Portfolio turnover rate | | | 17 | % | | | 42 | % | | | 17 | % | | | 15 | % | | | 11 | % |
| (A) | Reflects the impact of a corporate action event that resulted in a one-time increase to net investment income. If the corporate action event had not occurred, the Institutional Class net investment income per share and ratio of net investment income to average net assets would have been lower by 0.13% and 0.65%, respectively. |
| (B) | The net investment loss per share is based on average shares outstanding for the period. |
Touchstone Small Cap Value Fund—Class A
Selected Data for a Share Outstanding Throughout Each Period
| | | Year Ended September 30, | |
| | | 2016 | | 2015 | | 2014 | | 2013 | | 2012 | |
| Net asset value at beginning of period | | $ | 20.17 | | | $ | 23.23 | | | $ | 22.79 | | | $ | 18.33 | | | $ | 13.85 | | |
| Income (loss) from investment operations: | | | | | | | | | | | | | | | | | | | | | |
| Net investment income | | | 0.23 | | | | 0.36 | | | | 0.36 | | | | 0.41 | | | | 0.21 | | (A) |
| Net realized and unrealized gains (losses) on investments | | | 2.80 | | | | (2.15 | ) | | | 0.39 | | | | 4.45 | | | | 4.60 | | |
| Total from investment operations | | | 3.03 | | | | (1.79 | ) | | | 0.75 | | | | 4.86 | | | | 4.81 | | |
| Distributions from: | | | | | | | | | | | | | | | | | | | | | |
| Net investment income | | | (0.27 | ) | | | (0.35 | ) | | | (0.31 | ) | | | (0.40 | ) | | | (0.33 | ) | |
| Realized capital gains | | | (0.73 | ) | | | (0.92 | ) | | | — | | | | — | | | | — | | |
| Total distributions | | | (1.00 | ) | | | (1.27 | ) | | | (0.31 | ) | | | (0.40 | ) | | | (0.33 | ) | |
| Net asset value at end of period | | $ | 22.20 | | | $ | 20.17 | | | $ | 23.23 | | | $ | 22.79 | | | $ | 18.33 | | |
| Total return(B) | | | 15.63 | % | | | (8.32 | )% | | | 3.19 | % | | | 26.82 | % | | | 34.87 | % | |
| Ratios and supplemental data: | | | | | | | | | | | | | | | | | | | | | |
| Net assets at end of period (000’s) | | $ | 150,081 | | | $ | 24,659 | | | $ | 31,773 | | | $ | 34,826 | | | $ | 32,115 | | |
| Ratio to average net assets: | | | | | | | | | | | | | | | | | | | | | |
| Net expenses | | | 1.38 | % | | | 1.38 | % | | | 1.43 | % | | | 1.43 | % | | | 1.43 | % | |
| Gross expenses | | | 1.67 | % | | | 1.60 | % | | | 1.67 | % | | | 1.78 | % | | | 1.77 | % | |
| Net investment income | | | 1.05 | % | | | 1.51 | % | | | 1.44 | % | | | 1.98 | % | | | 1.26 | % | |
| Portfolio turnover rate | | | 155 | % | | | 112 | % | | | 100 | % | (C)(D) | | 98 | % | | | 109 | % | |
| (A) | The net investment income per share is based on average shares outstanding for the period. |
| (B) | Total returns shown exclude the effect of applicable sales loads. If these charges were included, the returns would be lower. |
| (C) | Portfolio turnover rate excludes securities received from a subscription-in-kind. |
| (D) | Portfolio turnover excludes the purchases and sales of the Touchstone Small Company Value Fund acquired on March 21, 2014. If these transactions were included, portfolio turnover would have been higher. |
Touchstone Small Cap Value Fund—Class C
Selected Data for a Share Outstanding Throughout Each Period
| | | Year Ended September 30, | |
| | | 2016 | | 2015 | | 2014 | | 2013 | | 2012 | |
| Net asset value at beginning of period | | $ | 19.98 | | | $ | 23.00 | | | $ | 22.61 | | | $ | 18.23 | | | $ | 13.82 | | |
| Income (loss) from investment operations: | | | | | | | | | | | | | | | | | | | | | |
| Net investment income | | | 0.06 | | | | 0.17 | | | | 0.16 | | | | 0.29 | | | | 0.09 | | (A) |
| Net realized and unrealized gains (losses) on investments | | | 2.77 | | | | (2.10 | ) | | | 0.40 | | | | 4.39 | | | | 4.58 | | |
| Total from investment operations | | | 2.83 | | | | (1.93 | ) | | | 0.56 | | | | 4.68 | | | | 4.67 | | |
| Distributions from: | | | | | | | | | | | | | | | | | | | | | |
| Net investment income | | | (0.13 | ) | | | (0.17 | ) | | | (0.17 | ) | | | (0.30 | ) | | | (0.26 | ) | |
| Realized capital gains | | | (0.73 | ) | | | (0.92 | ) | | | — | | | | — | | | | — | | |
| Total distributions | | | (0.86 | ) | | | (1.09 | ) | | | (0.17 | ) | | | (0.30 | ) | | | (0.26 | ) | |
| Net asset value at end of period | | $ | 21.95 | | | $ | 19.98 | | | $ | 23.00 | | | $ | 22.61 | | | $ | 18.23 | | |
| Total return(B) | | | 14.72 | % | | | (9.01 | )% | | | 2.46 | % | | | 25.90 | % | | | 33.95 | % | |
| Ratios and supplemental data: | | | | | | | | | | | | | | | | | | | | | |
| Net assets at end of period (000’s) | | $ | 1,376 | | | $ | 1,396 | | | $ | 2,169 | | | $ | 841 | | | $ | 104 | | |
| Ratio to average net assets: | | | | | | | | | | | | | | | | | | | | | |
| Net expenses | | | 2.13 | % | | | 2.13 | % | | | 2.18 | % | | | 2.18 | % | | | 2.18 | % | |
| Gross expenses | | | 3.39 | % | | | 3.13 | % | | | 3.25 | % | | | 5.19 | % | | | 28.35 | % | |
| Net investment income | | | 0.30 | % | | | 0.76 | % | | | 0.69 | % | | | 1.23 | % | | | 0.51 | % | |
| Portfolio turnover rate | | | 155 | % | | | 112 | % | | | 100 | % | (C)(D) | | 98 | % | | | 109 | % | |
| (A) | The net investment income per share is based on average shares outstanding for the period. |
| (B) | Total returns shown exclude the effect of applicable sales loads. If these charges were included, the returns would be lower. |
| (C) | Portfolio turnover rate excludes securities received from a subscription-in-kind. |
| (D) | Portfolio turnover excludes the purchases and sales of the Touchstone Small Company Value Fund acquired on March 21, 2014. If these transactions were included, portfolio turnover would have been higher. |
Touchstone Small Cap Value Fund—Class Y
Selected Data for a Share Outstanding Throughout Each Period
| | | Year Ended September 30, | |
| | | 2016 | | 2015 | | 2014 | | 2013 | | 2012 | |
| Net asset value at beginning of period | | $ | 20.20 | | | $ | 23.25 | | | $ | 22.82 | | | $ | 18.36 | | | $ | 13.89 | | |
| Income (loss) from investment operations: | | | | | | | | | | | | | | | | | | | | | |
| Net investment income | | | 0.24 | | | | 0.42 | | | | 0.35 | | | | 0.48 | | | | 0.26 | | (A) |
| Net realized and unrealized gains (losses) on investments | | | 2.84 | | | | (2.14 | ) | | | 0.46 | | | | 4.44 | | | | 4.59 | | |
| Total from investment operations | | | 3.08 | | | | (1.72 | ) | | | 0.81 | | | | 4.92 | | | | 4.85 | | |
| Distributions from: | | | | | | | | | | | | | | | | | | | | | |
| Net investment income | | | (0.31 | ) | | | (0.41 | ) | | | (0.38 | ) | | | (0.46 | ) | | | (0.38 | ) | |
| Realized capital gains | | | (0.73 | ) | | | (0.92 | ) | | | — | | | | — | | | | — | | |
| Total distributions | | | (1.04 | ) | | | (1.33 | ) | | | (0.38 | ) | | | (0.46 | ) | | | (0.38 | ) | |
| Net asset value at end of period | | $ | 22.24 | | | $ | 20.20 | | | $ | 23.25 | | | $ | 22.82 | | | $ | 18.36 | | |
| Total return | | | 15.86 | % | | | (8.08 | )% | | | 3.47 | % | | | 27.11 | % | | | 35.19 | % | |
| Ratios and supplemental data: | | | | | | | | | | | | | | | | | | | | | |
| Net assets at end of period (000’s) | | $ | 3,080 | | | $ | 4,419 | | | $ | 9,097 | | | $ | 769 | | | $ | 222 | | |
| Ratio to average net assets: | | | | | | | | | | | | | | | | | | | | | |
| Net expenses | | | 1.13 | % | | | 1.13 | % | | | 1.18 | % | | | 1.18 | % | | | 1.18 | % | |
| Gross expenses | | | 1.70 | % | | | 1.44 | % | | | 1.65 | % | | | 3.45 | % | | | 22.47 | % | |
| Net investment income | | | 1.30 | % | | | 1.76 | % | | | 1.70 | % | | | 2.23 | % | | | 1.51 | % | |
| Portfolio turnover rate | | | 155 | % | | | 112 | % | | | 100 | % | (B)(C) | | 98 | % | | | 109 | % | |
Touchstone Small Cap Value Fund—Institutional Class
Selected Data for a Share Outstanding Throughout Each Period
| | | Year Ended September 30, | |
| | | 2016 | | 2015 | | 2014 | | 2013 | | 2012 | |
| Net asset value at beginning of period | | $ | 20.19 | | | $ | 23.24 | | | $ | 22.81 | | | $ | 18.35 | | | $ | 13.86 | | |
| Income (loss) from investment operations: | | | | | | | | | | | | | | | | | | | | | |
| Net investment income | | | 0.30 | | | | 0.45 | | | | 0.40 | | | | 0.48 | | | | 0.29 | | (A) |
| Net realized and unrealized gains (losses) on investments | | | 2.80 | | | | (2.13 | ) | | | 0.44 | | | | 4.47 | | | | 4.60 | | |
| Total from investment operations | | | 3.10 | | | | (1.68 | ) | | | 0.84 | | | | 4.95 | | | | 4.89 | | |
| Distributions from: | | | | | | | | | | | | | | | | | | | | | |
| Net investment income | | | (0.34 | ) | | | (0.45 | ) | | | (0.41 | ) | | | (0.49 | ) | | | (0.40 | ) | |
| Realized capital gains | | | (0.73 | ) | | | (0.92 | ) | | | — | | | | — | | | | — | | |
| Total distributions | | | (1.07 | ) | | | (1.37 | ) | | | (0.41 | ) | | | (0.49 | ) | | | (0.40 | ) | |
| Net asset value at end of period | | $ | 22.22 | | | $ | 20.19 | | | $ | 23.24 | | | $ | 22.81 | | | $ | 18.35 | | |
| Total return | | | 16.05 | % | | | (7.93 | )% | | | 3.59 | % | | | 27.30 | % | | | 35.56 | % | |
| Ratios and supplemental data: | | | | | | | | | | | | | | | | | | | | | |
| Net assets at end of period (000’s) | | $ | 23,740 | | | $ | 25,968 | | | $ | 29,831 | | | $ | 2,665 | | | $ | 1,160 | | |
| Ratio to average net assets: | | | | | | | | | | | | | | | | | | | | | |
| Net expenses | | | 0.98 | % | | | 0.98 | % | | | 1.03 | % | | | 1.03 | % | | | 1.03 | % | |
| Gross expenses | | | 1.22 | % | | | 1.19 | % | | | 1.30 | % | | | 1.83 | % | | | 1.87 | % | |
| Net investment income | | | 1.45 | % | | | 1.91 | % | | | 1.84 | % | | | 2.38 | % | | | 1.66 | % | |
| Portfolio turnover rate | | | 155 | % | | | 112 | % | | | 100 | % | (B)(C) | | 98 | % | | | 109 | % | |
| (A) | The net investment income per share is based on average shares outstanding for the period. |
| (B) | Portfolio turnover rate excludes securities received from a subscription-in-kind. |
| (C) | Portfolio turnover excludes the purchases and sales of the Touchstone Small Company Value Fund acquired on March 21, 2014. If these transactions were included, portfolio turnover would have been higher. |
Touchstone Total Return Bond Fund—Class A
Selected Data for a Share Outstanding Throughout Each Period
| | | Year Ended September 30, | |
| | | 2016 | | 2015 | | 2014 | | 2013 | | 2012 | |
| Net asset value at beginning of period | | $ | 10.19 | | | $ | 10.23 | | | $ | 10.07 | | | $ | 10.50 | | | $ | 10.13 | | |
| Income (loss) from investment operations: | | | | | | | | | | | | | | | | | | | | | |
| Net investment income | | | 0.24 | | | | 0.22 | | | | 0.23 | | | | 0.21 | | | | 0.23 | | |
| Net realized and unrealized gains (losses) on investments | | | 0.22 | | | | 0.01 | | | | 0.22 | | | | (0.36 | ) | | | 0.41 | | |
| Total from investment operations | | | 0.46 | | | | 0.23 | | | | 0.45 | | | | (0.15 | ) | | | 0.64 | | |
| Distributions from: | | | | | | | | | | | | | | | | | | | | | |
| Net investment income | | | (0.27 | ) | | | (0.27 | ) | | | (0.29 | ) | | | (0.27 | ) | | | (0.27 | ) | |
| Realized capital gains | | | — | | | | — | | | | — | | | | (0.01 | ) | | | — | | |
| Total distributions | | | (0.27 | ) | | | (0.27 | ) | | | (0.29 | ) | | | (0.28 | ) | | | (0.27 | ) | |
| Net asset value at end of period | | $ | 10.38 | | | $ | 10.19 | | | $ | 10.23 | | | $ | 10.07 | | | $ | 10.50 | | |
| Total return(A) | | | 4.57 | % | | | 2.24 | % | | | 4.53 | % | | | (1.48 | )% | | | 6.42 | % | |
| Ratios and supplemental data: | | | | | | | | | | | | | | | | | | | | | |
| Net assets at end of period (000’s) | | $ | 8,639 | | | $ | 5,749 | | | $ | 5,144 | | | $ | 12,167 | | | $ | 10,210 | | |
| Ratio to average net assets: | | | | | | | | | | | | | | | | | | | | | |
| Net expenses | | | 0.87 | % | | | 0.90 | % | | | 0.90 | % | | | 0.90 | % | | | 0.90 | % | |
| Gross expenses | | | 1.25 | % | | | 1.26 | % | | | 1.25 | % | | | 1.10 | % | | | 1.22 | % | |
| Net investment income | | | 2.26 | % | | | 2.10 | % | | | 2.32 | % | | | 2.07 | % | | | 2.26 | % | |
| Portfolio turnover rate | | | 12 | % | | | 19 | % | | | 5 | % | | | 35 | % | | | 79 | % | (B) |
Touchstone Total Return Bond Fund—Class C
Selected Data for a Share Outstanding Throughout Each Period
| | | Year Ended September 30, | |
| | | 2016 | | 2015 | | 2014 | | 2013 | | 2012 | |
| Net asset value at beginning of period | | $ | 10.18 | | | $ | 10.21 | | | $ | 10.05 | | | $ | 10.49 | | | $ | 10.12 | | |
| Income (loss) from investment operations: | | | | | | | | | | | | | | | | | | | | | |
| Net investment income | | | 0.15 | | | | 0.14 | | | | 0.15 | | | | 0.11 | | | | 0.14 | | |
| Net realized and unrealized gains (losses) on investments | | | 0.22 | | | | 0.02 | | | | 0.22 | | | | (0.35 | ) | | | 0.42 | | |
| Total from investment operations | | | 0.37 | | | | 0.16 | | | | 0.37 | | | | (0.24 | ) | | | 0.56 | | |
| Distributions from: | | | | | | | | | | | | | | | | | | | | | |
| Net investment income | | | (0.19 | ) | | | (0.19 | ) | | | (0.21 | ) | | | (0.19 | ) | | | (0.19 | ) | |
| Realized capital gains | | | — | | | | — | | | | — | | | | (0.01 | ) | | | — | | |
| Total distributions | | | (0.19 | ) | | | (0.19 | ) | | | (0.21 | ) | | | (0.20 | ) | | | (0.19 | ) | |
| Net asset value at end of period | | $ | 10.36 | | | $ | 10.18 | | | $ | 10.21 | | | $ | 10.05 | | | $ | 10.49 | | |
| Total return(A) | | | 3.70 | % | | | 1.60 | % | | | 3.75 | % | | | (2.33 | )% | | | 5.63 | % | |
| Ratios and supplemental data: | | | | | | | | | | | | | | | | | | | | | |
| Net assets at end of period (000’s) | | $ | 2,813 | | | $ | 2,368 | | | $ | 1,634 | | | $ | 2,455 | | | $ | 3,257 | | |
| Ratio to average net assets: | | | | | | | | | | | | | | | | | | | | | |
| Net expenses | | | 1.62 | % | | | 1.65 | % | | | 1.65 | % | | | 1.65 | % | | | 1.65 | % | |
| Gross expenses | | | 2.19 | % | | | 2.27 | % | | | 2.47 | % | | | 2.10 | % | | | 2.03 | % | |
| Net investment income | | | 1.51 | % | | | 1.35 | % | | | 1.57 | % | | | 1.32 | % | | | 1.51 | % | |
| Portfolio turnover rate | | | 12 | % | | | 19 | % | | | 5 | % | | | 35 | % | | | 79 | % | (B) |
| (A) | Total returns shown exclude the effect of applicable sales loads. If these charges were included, the returns would be lower. |
| (B) | Portfolio turnover excludes the purchases and sales of the Old Mutual Barrow Hanley Core Bond Fund acquired on April 16, 2012. If these transactions were included, portfolio turnover would have been higher. |
Touchstone Total Return Bond Fund—Class Y
Selected Data for a Share Outstanding Throughout Each Period
| | | Year Ended September 30, | |
| | | 2016 | | 2015 | | 2014 | | 2013 | | 2012 | |
| Net asset value at beginning of period | | $ | 10.20 | | | $ | 10.24 | | | $ | 10.08 | | | $ | 10.52 | | | $ | 10.15 | | |
| Income (loss) from investment operations: | | | | | | | | | | | | | | | | | | | | | |
| Net investment income | | | 0.26 | | | | 0.25 | | | | 0.26 | | | | 0.23 | | | | 0.25 | | |
| Net realized and unrealized gains (losses) on investments | | | 0.23 | | | | 0.01 | | | | 0.22 | | | | (0.36 | ) | | | 0.42 | | |
| Total from investment operations | | | 0.49 | | | | 0.26 | | | | 0.48 | | | | (0.13 | ) | | | 0.67 | | |
| Distributions from: | | | | | | | | | | | | | | | | | | | | | |
| Net investment income | | | (0.30 | ) | | | (0.30 | ) | | | (0.32 | ) | | | (0.30 | ) | | | (0.30 | ) | |
| Realized capital gains | | | — | | | | — | | | | — | | | | (0.01 | ) | | | — | | |
| Total distributions | | | (0.30 | ) | | | (0.30 | ) | | | (0.32 | ) | | | (0.31 | ) | | | (0.30 | ) | |
| Net asset value at end of period | | $ | 10.39 | | | $ | 10.20 | | | $ | 10.24 | | | $ | 10.08 | | | $ | 10.52 | | |
| Total return | | | 4.82 | % | | | 2.51 | % | | | 4.84 | % | | | (1.32 | )% | | | 6.72 | % | |
| Ratios and supplemental data: | | | | | | | | | | | | | | | | | | | | | |
| Net assets at end of period (000’s) | | $ | 49,484 | | | $ | 39,751 | | | $ | 19,397 | | | $ | 19,635 | | | $ | 29,716 | | |
| Ratio to average net assets: | | | | | | | | | | | | | | | | | | | | | |
| Net expenses | | | 0.62 | % | | | 0.65 | % | | | 0.61 | % | | | 0.62 | % | | | 0.58 | % | |
| Gross expenses | | | 0.71 | % | | | 0.70 | % | | | 0.68 | % | | | 0.71 | % | | | 0.70 | % | |
| Net investment income | | | 2.51 | % | | | 2.35 | % | | | 2.61 | % | | | 2.34 | % | | | 2.59 | % | |
| Portfolio turnover rate | | | 12 | % | | | 19 | % | | | 5 | % | | | 35 | % | | | 79 | % | (A) |
Touchstone Total Return Bond Fund — Institutional Class
Selected Data for a Share Outstanding Throughout Each Period
| | | Year Ended September 30, | |
| | | 2016 | | 2015 | | 2014 | | 2013 | | 2012 | |
| Net asset value at beginning of period | | $ | 10.20 | | | $ | 10.24 | | | $ | 10.08 | | | $ | 10.51 | | | $ | 10.14 | | |
| Income (loss) from investment operations: | | | | | | | | | | | | | | | | | | | | | |
| Net investment income | | | 0.28 | | | | 0.26 | | | | 0.27 | | | | 0.25 | | | | 0.22 | | |
| Net realized and unrealized gains (losses) on investments | | | 0.22 | | | | 0.01 | | | | 0.22 | | | | (0.36 | ) | | | 0.46 | | |
| Total from investment operations | | | 0.50 | | | | 0.27 | | | | 0.49 | | | | (0.11 | ) | | | 0.68 | | |
| Distributions from: | | | | | | | | | | | | | | | | | | | | | |
| Net investment income | | | (0.31 | ) | | | (0.31 | ) | | | (0.33 | ) | | | (0.31 | ) | | | (0.31 | ) | |
| Realized capital gains | | | — | | | | — | | | | — | | | | (0.01 | ) | | | — | | |
| Total distributions | | | (0.31 | ) | | | (0.31 | ) | | | (0.33 | ) | | | (0.32 | ) | | | (0.31 | ) | |
| Net asset value at end of period | | $ | 10.39 | | | $ | 10.20 | | | $ | 10.24 | | | $ | 10.08 | | | $ | 10.51 | | |
| Total return | | | 4.94 | % | | | 2.65 | % | | | 4.96 | % | | | (1.09 | )% | | | 6.81 | % | |
| Ratios and supplemental data: | | | | | | | | | | | | | | | | | | | | | |
| Net assets at end of period (000’s) | | $ | 166,008 | | | $ | 134,877 | | | $ | 116,404 | | | $ | 133,051 | | | $ | 148,341 | | |
| Ratio to average net assets: | | | | | | | | | | | | | | | | | | | | | |
| Net expenses | | | 0.50 | % | | | 0.50 | % | | | 0.50 | % | | | 0.50 | % | | | 0.50 | % | |
| Gross expenses | | | 0.60 | % | | | 0.61 | % | | | 0.60 | % | | | 0.60 | % | | | 0.67 | % | |
| Net investment income | | | 2.63 | % | | | 2.50 | % | | | 2.72 | % | | | 2.47 | % | | | 2.66 | % | |
| Portfolio turnover rate | | | 12 | % | | | 19 | % | | | 5 | % | | | 35 | % | | | 79 | % | (A) |
| (A) | Portfolio turnover excludes the purchases and sales of the Old Mutual Barrow Hanley Core Bond Fund acquired on April 16, 2012. If these transactions were included, portfolio turnover would have been higher. |
Touchstone Ultra Short Duration Fixed Income Fund—Class A
Selected Data for a Share Outstanding Throughout Each Period
| | | | | | | | | | | | | | | | | | | Period | |
| | | | | | | | | | | | | | | | | | | Ended | |
| | | Year Ended September 30, | | September 30, | |
| | | 2016 | | 2015 | | 2014 | | 2013 | | 2012(A) | |
| Net asset value at beginning of period | | $ | 9.32 | | | $ | 9.41 | | | $ | 9.45 | | | $ | 9.56 | | | $ | 9.57 | | |
| Income (loss) from investment operations: | | | | | | | | | | | | | | | | | | | | | |
| Net investment income | | | 0.10 | | | | 0.06 | | | | 0.06 | | | | 0.09 | | | | 0.09 | | |
| Net realized and unrealized gains (losses) on investments | | | 0.02 | | | | (0.03 | ) | | | 0.03 | | | | (0.04 | ) | | | (0.01 | ) | |
| Total from investment operations | | | 0.12 | | | | 0.03 | | | | 0.09 | | | | 0.05 | | | | 0.08 | | |
| Distributions from: | | | | | | | | | | | | | | | | | | | | | |
| Net investment income | | | (0.12 | ) | | | (0.12 | ) | | | (0.13 | ) | | | (0.16 | ) | | | (0.09 | ) | |
| Net asset value at end of period | | $ | 9.32 | | | $ | 9.32 | | | $ | 9.41 | | | $ | 9.45 | | | $ | 9.56 | | |
| Total return(B) | | | 1.35 | % | | | 0.31 | % | | | 0.92 | % | | | 0.48 | % | | | 0.85 | | (C) |
| Ratios and supplemental data: | | | | | | | | | | | | | | | | | | | | | |
| Net assets at end of period (000’s) | | $ | 16,946 | | | $ | 10,675 | | | $ | 10,596 | | | $ | 32,088 | | | $ | 34,228 | | |
| Ratio to average net assets: | | | | | | | | | | | | | | | | | | | | | |
| Net expenses | | | 0.69 | % | | | 0.69 | % | | | 0.69 | % | | | 0.69 | % | | | 0.69 | % | (D) |
| Gross expenses | | | 0.97 | % | | | 0.99 | % | | | 0.93 | % | | | 0.83 | % | | | 1.19 | % | (D) |
| Net investment income | | | 1.09 | % | | | 0.54 | % | | | 0.79 | % | | | 0.85 | % | | | 1.40 | % | (D) |
| Portfolio turnover rate | | | 169 | % | | | 132 | % | | | 142 | % | | | 107 | % | (E) | | 169 | % | (F) |
| (A) | Represents the period from commencement of operations (April 16, 2012) through September 30, 2012. |
| (B) | Total returns shown exclude the effect of applicable sales loads. If these charges were included, the returns would be lower. |
| (E) | Portfolio turnover excludes the purchases and sales of the Touchstone Short Duration Fixed Income Fund acquired on May 17, 2013. If these transactions were included, portfolio turnover would have been higher. |
| (F) | Portfolio turnover excludes the purchases and sales of the Old Mutual Dwight Short Term Fixed Income Fund and Fifth Third Short Term Bond Fund acquired on April 16, 2012 and September 10, 2012, respectively. If these transactions were included, portfolio turnover would have been higher. |
Touchstone Ultra Short Duration Fixed Income Fund—Class C
Selected Data for a Share Outstanding Throughout Each Period
| | | | | | | | | | | | | | | | | | | Period | |
| | | | | | | | | | | | | | | | | | | Ended | |
| | | Year Ended September 30, | | September 30, | |
| | | 2016 | | 2015 | | 2014 | | 2013 | | 2012(A) | |
| Net asset value at beginning of period | | $ | 9.32 | | | $ | 9.41 | | | $ | 9.45 | | | $ | 9.56 | | | $ | 9.57 | | |
| Income (loss) from investment operations: | | | | | | | | | | | | | | | | | | | | | |
| Net investment income | | | 0.06 | | | | — | | (G) | | 0.02 | | | | 0.04 | | | | 0.05 | | |
| Net realized and unrealized gains (losses) on investments | | | 0.02 | | | | (0.02 | ) | | | 0.02 | | | | (0.04 | ) | | | 0.01 | | |
| Total from investment operations | | | 0.08 | | | | (0.02 | ) | | | 0.04 | | | | — | | | | 0.06 | | |
| Distributions from: | | | | | | | | | | | | | | | | | | | | | |
| Net investment income | | | (0.08 | ) | | | (0.07 | ) | | | (0.08 | ) | | | (0.11 | ) | | | (0.07 | ) | |
| Net asset value at end of period | | $ | 9.32 | | | $ | 9.32 | | | $ | 9.41 | | | $ | 9.45 | | | $ | 9.56 | | |
| Total return(B) | | | 0.84 | % | | | (0.19 | )% | | | 0.42 | % | | | (0.02 | )% | | | 0.62 | % | (C) |
| Ratios and supplemental data: | | | | | | | | | | | | | | | | | | | | | |
| Net assets at end of period (000’s) | | $ | 7,961 | | | $ | 8,291 | | | $ | 11,272 | | | $ | 13,568 | | | $ | 11,517 | | |
| Ratio to average net assets: | | | | | | | | | | | | | | | | | | | | | |
| Net expenses | | | 1.19 | % | | | 1.19 | % | | | 1.19 | % | | | 1.19 | % | | | 1.19 | % | (D) |
| Gross expenses | | | 1.54 | % | | | 1.48 | % | | | 1.44 | % | | | 1.39 | % | | | 1.68 | % | (D) |
| Net investment income | | | 0.59 | % | | | 0.04 | % | | | 0.29 | % | | | 0.35 | % | | | 0.90 | % | (D) |
| Portfolio turnover rate | | | 169 | % | | | 132 | % | | | 142 | % | | | 107 | % | (E) | | 169 | % | (F) |
| (A) | Represents the period from commencement of operations (April 16, 2012) through September 30, 2012. |
| (B) | Total returns shown exclude the effect of applicable sales loads. If these charges were included, the returns would be lower. |
| (C) | Not annualized. |
| (D) | Annualized. |
| (E) | Portfolio turnover excludes the purchases and sales of the Touchstone Short Duration Fixed Income Fund acquired on May 17, 2013. If these transactions were included, portfolio turnover would have been higher. |
| (F) | Portfolio turnover excludes the purchases and sales of the Old Mutual Dwight Short Term Fixed Income Fund and Fifth Third Short Term Bond Fund acquired on April 16, 2012 and September 10, 2012, respectively. If these transactions were included, portfolio turnover would have been higher. |
| (G) | Less than $0.005 per share. |
Touchstone Ultra Short Duration Fixed Income Fund—Class Y
Selected Data for a Share Outstanding Throughout Each Period
| | | | | | | | | | | | | | | | | | | Period | |
| | | | | | | | | | | | | | | | | | | Ended | |
| | | Year Ended September 30, | | September 30, | |
| | | 2016 | | 2015 | | 2014 | | 2013 | | 2012(A) | |
| Net asset value at beginning of period | | $ | 9.32 | | | $ | 9.41 | | | $ | 9.45 | | | $ | 9.56 | | | $ | 9.57 | | |
| Income (loss) from investment operations: | | | | | | | | | | | | | | | | | | | | | |
| Net investment income | | | 0.13 | | | | 0.07 | | | | 0.10 | | | | 0.12 | | | | 0.08 | | |
| Net realized and unrealized gains (losses) on investments | | | 0.02 | | | | (0.02 | ) | | | 0.01 | | | | (0.05 | ) | | | 0.01 | | |
| Total from investment operations | | | 0.15 | | | | 0.05 | | | | 0.11 | | | | 0.07 | | | | 0.09 | | |
| Distributions from: | | | | | | | | | | | | | | | | | | | | | |
| Net investment income | | | (0.15 | ) | | | (0.14 | ) | | | (0.15 | ) | | | (0.18 | ) | | | (0.10 | ) | |
| Net asset value at end of period | | $ | 9.32 | | | $ | 9.32 | | | $ | 9.41 | | | $ | 9.45 | | | $ | 9.56 | | |
| Total return | | | 1.60 | % | | | 0.56 | % | | | 1.17 | % | | | 0.74 | % | | | 0.97 | % | (B) |
| Ratios and supplemental data: | | | | | | | | | | | | | | | | | | | | | |
| Net assets at end of period (000’s) | | $ | 206,313 | | | $ | 200,456 | | | $ | 244,885 | | | $ | 249,250 | | | $ | 190,515 | | |
| Ratio to average net assets: | | | | | | | | | | | | | | | | | | | | | |
| Net expenses | | | 0.44 | % | | | 0.44 | % | | | 0.44 | % | | | 0.44 | % | | | 0.44 | % | (C) |
| Gross expenses | | | 0.53 | % | | | 0.52 | % | | | 0.49 | % | | | 0.51 | % | | | 0.55 | % | (C) |
| Net investment income | | | 1.34 | % | | | 0.79 | % | | | 1.04 | % | | | 1.10 | % | | | 1.65 | % | (C) |
| Portfolio turnover rate | | | 169 | % | | | 132 | % | | | 142 | % | | | 107 | % | (D) | | 169 | % | (E) |
| (A) | Represents the period from commencement of operations (April 16, 2012) through September 30, 2012. |
| (B) | Not annualized. |
| (C) | Annualized. |
| (D) | Portfolio turnover excludes the purchases and sales of the Touchstone Short Duration Fixed Income Fund acquired on May 17, 2013. If these transactions were included, portfolio turnover would have been higher. |
| (E) | Portfolio turnover excludes the purchases and sales of the Old Mutual Dwight Short Term Fixed Income Fund and Fifth Third Short Term Bond Fund acquired on April 16, 2012 and September 10, 2012, respectively. If these transactions were included, portfolio turnover would have been higher. |
Touchstone Ultra Short Duration Fixed Income Fund—Class Z
Selected Data for a Share Outstanding Throughout Each Period
| | | Year Ended September 30, | | | |
| | | 2016 | | 2015 | | 2014 | | 2013 | | 2012 | |
| Net asset value at beginning of period | | $ | 9.32 | | | $ | 9.41 | | | $ | 9.45 | | | $ | 9.56 | | | $ | 9.58 | | |
| Income (loss) from investment operations: | | | | | | | | | | | | | | | | | | | | | |
| Net investment income | | | 0.10 | | | | 0.05 | | | | 0.08 | | | | 0.09 | | | | 0.14 | | |
| Net realized and unrealized gains (losses) on investment | | | 0.02 | | | | (0.02 | ) | | | 0.01 | | | | (0.04 | ) | | | 0.06 | | |
| Total from investment operations | | | 0.12 | | | | 0.03 | | | | 0.09 | | | | 0.05 | | | | 0.20 | | |
| Distributions from: | | | | | | | | | | | | | | | | | | | | | |
| Net investment income | | | (0.12 | ) | | | (0.12 | ) | | | (0.13 | ) | | | (0.16 | ) | | | (0.22 | ) | |
| Net asset value at end of period | | $ | 9.32 | | | $ | 9.32 | | | $ | 9.41 | | | $ | 9.45 | | | $ | 9.56 | | |
| Total return | | | 1.35 | % | | | 0.31 | % | | | 0.91 | % | | | 0.52 | % | | | 2.10 | % | |
| Ratios and supplemental data: | | | | | | | | | | | | | | | | | | | | | |
| Net assets at end of period (000’s) | | $ | 245,252 | | | $ | 304,553 | | | $ | 401,851 | | | $ | 381,554 | | | $ | 338,669 | | |
| Ratio to average net assets: | | | | | | | | | | | | | | | | | | | | | |
| Net expenses | | | 0.69 | % | | | 0.69 | % | | | 0.69 | % | | | 0.65 | % | | | 0.64 | % | |
| Gross expenses | | | 0.79 | % | | | 0.76 | % | | | 0.76 | % | | | 0.73 | % | | | 0.73 | % | |
| Net Investment Income | | | 1.09 | % | | | 0.54 | % | | | 0.79 | % | | | 0.89 | % | | | 1.45 | % | |
| Portfolio turnover rate | | | 169 | % | | | 132 | % | | | 142 | % | | | 107 | % | (A) | | 169 | % | (B) |
| (A) | Portfolio turnover excludes the purchases and sales of the Touchstone Short Duration Fixed Income Fund acquired on May 17, 2013. If these transactions were included, portfolio turnover would have been higher. |
| (B) | Portfolio turnover excludes the purchases and sales of the Old Mutual Dwight Short Term Fixed Income Fund and Fifth Third Short Term Bond Fund acquired on April 16, 2012 and September 10, 2012, respectively. If these transactions were included, portfolio turnover would have been higher. |
Touchstone Ultra Short Duration Fixed Income Fund—Institutional Class
Selected Data for a Share Outstanding Throughout Each Period
| | | | | | | | | | | Period | |
| | | | | | | | | | | Ended | |
| | | Year Ended September 30, | | September 30, | |
| | | 2016 | | 2015 | | 2014 | | 2013 | | 2012(A) | |
| Net asset value at beginning of period | | $ | 9.32 | | | $ | 9.41 | | | $ | 9.45 | | | $ | 9.56 | | | $ | 9.57 | | |
| Income (loss) from investment operations: | | | | | | | | | | | | | | | | | | | | | |
| Net investment income | | | 0.13 | | | | 0.08 | | | | 0.10 | | | | 0.14 | | | | 0.09 | | |
| Net realized and unrealized gains (losses) on investments | | | 0.02 | | | | (0.02 | ) | | | 0.01 | | | | (0.07 | ) | | | — | | (B) |
| Total from investment operations | | | 0.15 | | | | 0.06 | | | | 0.11 | | | | 0.07 | | | | 0.09 | | |
| Distributions from: | | | | | | | | | | | | | | | | | | | | | |
| Net investment income | | | (0.15 | ) | | | (0.15 | ) | | | (0.15 | ) | | | (0.18 | ) | | | (0.10 | ) | |
| Net asset value at end of period | | $ | 9.32 | | | $ | 9.32 | | | $ | 9.41 | | | $ | 9.45 | | | $ | 9.56 | | |
| Total return | | | 1.54 | % | | | 0.61 | % | | | 1.22 | % | | | 0.78 | % | | | 0.99 | % | (C) |
| Ratios and supplemental data: | | | | | | | | | | | | | | | | | | | | | |
| Net assets at end of period (000’s) | | $ | 142,913 | | | $ | 49,389 | | | $ | 50,853 | | | $ | 59,662 | | | $ | 6,697 | | |
| Ratio to average net assets: | | | | | | | | | | | | | | | | | | | | | |
| Net expenses | | | 0.39 | % | | | 0.39 | % | | | 0.39 | % | | | 0.39 | % | | | 0.39 | % | (D) |
| Gross expenses | | | 0.46 | % | | | 0.48 | % | | | 0.48 | % | | | 0.52 | % | | | 1.23 | % | (D) |
| Net investment income | | | 1.39 | % | | | 0.84 | % | | | 1.09 | % | | | 1.15 | % | | | 1.70 | % | (D) |
| Portfolio turnover rate | | | 169 | % | | | 132 | % | | | 142 | % | | | 107 | % | (E) | | 169 | % | (F) |
| (A) | Represents the period from commencement of operations (April 16, 2012) through September 30, 2012. |
| (B) | Less than $0.005 per share. |
| (C) | Not annualized. |
| (D) | Annualized. |
| (E) | Portfolio turnover excludes the purchases and sales of the Touchstone Short Duration Fixed Income Fund acquired on May 17, 2013. If these transactions were included, portfolio turnover would have been higher. |
| (F) | Portfolio turnover excludes the purchases and sales of the Old Mutual Dwight Short Term Fixed Income Fund and Fifth Third Short Term Bond Fund acquired on April 16, 2012 and September 10, 2012, respectively. If these transactions were included, portfolio turnover would have been higher. |
TOUCHSTONE INVESTMENTS*
DISTRIBUTOR
Touchstone Securities, Inc.*
303 Broadway, Suite 1100
Cincinnati, Ohio 45202-4203
1.800.638.8194
TouchstoneInvestments.com
INVESTMENT ADVISOR
Touchstone Advisors, Inc.*
303 Broadway, Suite 1100
Cincinnati, Ohio 45202-4203
TRANSFER AGENT
BNY Mellon Investment Servicing (US) Inc.
4400 Computer Drive
Westborough, Massachusetts 01581
SHAREHOLDER SERVICES
1.800.543.0407
*A Member of Western & Southern Financial Group
The following are federal trademark registrations and applications owned by IFS Financial Services, Inc. (a holding company), a member of Western & Southern Financial Group: Touchstone, Touchstone Funds, Touchstone Investments, Touchstone Family of Funds and Touchstone Select.

303 Broadway, Suite 1100
Cincinnati, Ohio 45202-4203
Go paperless, sign up today at:
TouchstoneInvestments.com/home
For investors who want more information about the Funds, the following documents are available free upon request:
Statement of Additional Information (“SAI”): The SAI provides more detailed information about the Funds and is incorporated herein by reference and is legally a part of this prospectus.
Annual/Semiannual Reports (“Financial Reports”): The Funds’ Financial Reports provide additional information about the Funds’ investments. In the annual report, you will find a discussion of the market conditions and investment strategies that significantly affected a Fund’s performance during its last fiscal year.
You can get free copies of the SAI, the Financial Reports, other information and answers to your questions about the Funds by contacting your financial advisor or by contacting Touchstone Investments at 1.800.543.0407. The SAI and Financial Reports are also available on the Touchstone Investments website at: TouchstoneInvestments.com/home/formslit/
Information about the Funds (including the SAI) can be reviewed and copied at the Securities and Exchange Commission’s Public Reference Room in Washington, D.C. You can receive information about the operation of the Public Reference Room by calling the SEC at 1.202.551.8090.
Reports and other information about the Funds are available on the EDGAR database of the SEC’s internet site at http://www.sec.gov. For a fee, you can get text-only copies of reports and other information by writing to the Public Reference Section of the SEC, Washington, D.C. 20549-1520 or by sending an e-mail request to: publicinfo@sec.gov.
Investment Company Act file no. 811-08104
TSF-56-TFGT-1701
April 10, 2017
TOUCHSTONE FUNDS GROUP TRUST
Touchstone Active Bond Fund
Touchstone Arbitrage Fund
Touchstone Emerging Markets Small Cap Fund
Touchstone High Yield Fund
Touchstone Merger Arbitrage Fund
Touchstone Mid Cap Fund
Touchstone Mid Cap Value Fund
Touchstone Premium Yield Equity Fund
Touchstone Sands Capital Select Growth Fund
Touchstone Small Cap Fund
Touchstone Small Cap Value Fund
Touchstone Total Return Bond Fund
Touchstone Ultra Short Duration Fixed Income Fund
Supplement to Prospectus, Summary Prospectus and Statement of Additional Information dated January 30, 2017
The information in this Supplement contains new and additional information beyond that in the Prospectus and Summary Prospectus and should be read in conjunction with the aforementioned.
Effective immediately, the following replaces the last sentence in the paragraph of each Fund’s summary under “The Fund’s Fee and Expenses” section:
More information about these and other discounts is available from your financial professional and in the section entitled “Choosing a Class of Shares” in the Fund’s prospectus on page 89, in Appendix A – Intermediary-Specific Sales Charge Waivers and Discounts to the Fund’s prospectus and in the Fund’s Statement of Additional Information (“SAI”) on page 80.
Effective immediately, the following statement will be added to the “Waiver of Class A Sales Charge,” “Reduced Class A Sales Charge,” “Rights of Accumulation Program,” “Letter of Intent,” “Class C Shares,” “Contingent Deferred Sales Charge (“CDSC”), “Additional Information on the CDSC” and “Waiver of Class A Sales Charge for Clients of Financial Intermediaries” disclosure in the Prospectus, Summary Prospectus and Statement of Additional Information (as applicable):
Please see Appendix A – Intermediary-Specific Sales Charge Waivers and Discounts for a description of variations in sales charges and waivers for Fund shares purchased through Merrill Lynch.
Effective immediately, the following is added to the back page of the Prospectus:
Appendix A: Appendix A – Intermediary-Specific Sales Charge Waivers and Discounts is a separate document that provides additional information about the availability of certain sales charge waivers and discounts and is incorporated into this prospectus, which means it is legally a part of this prospectus.
Effective immediately, the following is added as Appendix A of the Prospectus:
Appendix A to Prospectus dated January 30, 2017
Intermediary-Specific Sales Charge Waivers and Discounts
As noted in the Fund’s prospectus, the availability of certain sales charge waivers and discounts will depend on whether you purchase your shares directly from the Fund or through a financial intermediary. Intermediaries may have different policies and procedures regarding the availability of front-end sales load waivers or contingent deferred (back-end) sales load (“CDSC”) waivers, which are discussed below. In all instances, it is the purchaser’s responsibility to notify the Fund or the purchaser’s financial intermediary at the time of purchase of any relationship or other facts qualifying the purchaser for sales charge waivers or discounts. The sales charge waivers and discounts described in this Appendix A are available only if you purchase shares through the designated intermediary. The information disclosed in this Appendix A is part of, and incorporated in, the Fund’s prospectus.
* * * * *
Shareholders Purchasing Fund Shares Through Merrill Lynch
The following information is provided by Merrill, Lynch, Pierce, Fenner & Smith Incorporated (“Merrill Lynch: Effective April 10, 2017, shareholders purchasing Fund shares through a Merrill Lynch platform or account will be eligible only for the following load waivers (front-end sales charge waivers and contingent deferred, or back-end, sales charge waivers) and discounts, which may differ from those disclosed elsewhere in the Funds’ prospectus or SAI.
Front-end Sales Load Waivers on Class A Shares Available at Merrill Lynch
| • | Employer-sponsored retirement, deferred compensation and employee benefit plans (including health savings accounts) and trusts used to fund those plans, provided that the shares are not held in a commission-based brokerage account and shares are held for the benefit of the plan |
| • | Shares purchased by or through a 529 Plan |
| • | Shares purchased through a Merrill Lynch affiliated investment advisory program |
| • | Shares purchased through the Merrill Edge Self-Directed platform |
| • | Shares purchased through reinvestment of capital gains distributions and dividend reinvestment when purchasing shares of the same fund (but not any other fund within the fund family) |
| • | Shares exchanged from Class C (i.e. level-load) shares of the same fund in the month of or following the 10-year anniversary of the purchase date |
| • | Employees and registered representatives of Merrill Lynch or its affiliates and their family members |
| • | Trustees of the Fund, and employees of Touchstone Advisors or any of its affiliates, as described in this Prospectus |
| • | Shares purchased from the proceeds of redemptions within the Touchstone family of mutual funds, provided (1) the repurchase occurs within 90 days following the redemption, (2) the redemption and purchase occur in the same account, and (3) redeemed shares were subject to a front-end or deferred sales load (known as rights of reinstatement) |
CDSC Waivers on Class A Shares and Class C Shares Available at Merrill Lynch
| • | Death or disability of the shareholder |
| • | Shares sold as part of a systematic withdrawal plan as described in this Prospectus |
| • | Return of excess contributions from an IRA Account |
| • | Shares sold as part of a required minimum distribution for IRA and retirement accounts due to the shareholder reaching age 70½ |
| • | Shares sold to pay Merrill Lynch fees but only if the transaction is initialed by Merrill Lynch |
| • | Shares acquired through a right of reinstatement |
| • | Shares held in retirement brokerage accounts, that are exchanged for a lower cost share class due to transfer to certain fee based accounts or platforms (applicable to Class A shares and Class C shares only) |
Front-end Load Discounts Available at Merrill Lynch: Breakpoints, Rights of Accumulation, and Letters of Intent
| • | Breakpoints as described in this Prospectus |
| • | Rights of Accumulation (ROA), which entitle shareholders to breakpoint discounts will be automatically calculated based on the aggregated holding of fund family assets held by accounts within the purchaser’s household at Merrill Lynch. Eligible fund family assets not held at Merrill Lynch may be included in the ROA calculation only if the shareholder notifies his or her financial advisor about such assets |
| • | Letters of Intent (LOI) which allow for breakpoint discounts based on anticipated purchases within a fund family, through Merrill Lynch, over a 13-month period of time (if applicable) |
Please contact your financial advisor or Touchstone at 800.543.0407 if you have any questions.
P.O. Box 9878 · Providence, RI 02940-8078
Ph: 800.543.0407 · TouchstoneInvestments.com
Touchstone Funds are distributed by Touchstone Securities, Inc.*
*A registered broker-dealer and member FINRA and SIPC
A Member of Western & Southern Financial Group
Please retain this Supplement for future reference.
TSF-56-TFGT-S1-1704
April 4, 2017
TOUCHSTONE FUNDS GROUP TRUST
Touchstone Sands Capital Select Growth Fund
Supplement to Prospectus, Summary Prospectus and Statement of Additional Information dated January 30, 2017
Effective immediately, all classes of the Touchstone Sands Capital Select Growth Fund (the “Fund”) are open to investments by new and existing investors, subject to minimum investment and other requirements as described in the Fund’s Prospectus, Summary Prospectus, and Statement of Additional Information. Touchstone reserves the right to close the Fund to new or subsequent investments at a future date and to modify the foregoing policy for any reason.
Please contact your financial advisor or Touchstone at 800.543.0407 if you have any questions.
P.O. Box 9878 · Providence, RI 02940-8078
Ph: 800.543.0407 · TouchstoneInvestments.com
Touchstone Funds are distributed by Touchstone Securities, Inc.*
*A registered broker-dealer and member FINRA and SIPC
A Member of Western & Southern Financial Group
Please retain this Supplement for future reference.
TSF-56-TFGT-PTSGX-S1-1704
TOUCHSTONE FUNDS GROUP TRUST
STATEMENT OF ADDITIONAL INFORMATION
January 30, 2017
| | Class A | | Class C | | Class Y | | Class Z | | Institutional Class | |
| Touchstone Active Bond Fund | TOBAX | | TODCX | | TOBYX | | | | TOBIX | |
| Touchstone Arbitrage Fund | TMARX | | TMACX | | TMAYX | | | | TARBX | |
| Touchstone Emerging Markets Small Cap Fund | TEMAX | | TEFCX | | TEMYX | | | | TMEIX | |
| Touchstone High Yield Fund | THYAX | | THYCX | | THYYX | | | | THIYX | |
| Touchstone Merger Arbitrage Fund | TMGAX | | TMGCX | | TMGYX | | | | TMGLX | |
| Touchstone Mid Cap Fund | TMAPX | | TMCJX | | TMCPX | | TMCTX | | TMPIX | |
| Touchstone Mid Cap Value Fund | TCVAX | | TMFCX | | TCVYX | | | | TCVIX | |
| Touchstone Premium Yield Equity Fund | TPYAX | | TPYCX | | TPYYX | | | | | |
| Touchstone Sands Capital Select Growth Fund | TSNAX | | TSNCX | | CFSIX | | PTSGX | | | |
| Touchstone Small Cap Fund | TSFAX | | TSFCX | | TSFYX | | | | TSFIX | |
| Touchstone Small Cap Value Fund | TVOAX | | TVOCX | | TVOYX | | | | TVOIX | |
| Touchstone Total Return Bond Fund | TCPAX | | TCPCX | | TCPYX | | | | TCPNX | |
| Touchstone Ultra Short Duration Fixed Income Fund | TSDAX | | TSDCX | | TSYYX | | TSDOX | | TSDIX | |
This Statement of Additional Information (“SAI”) is not a prospectus and relates only to the above-referenced funds (each a “Fund” and, together, the “Funds”). It is intended to provide additional information regarding the activities and operations of Touchstone Funds Group Trust (the “Trust”) and should be read in conjunction with the Funds’ prospectus dated January 30, 2017, as may be amended. The Trust’s audited financial statements for the fiscal year ended September 30, 2016, including the notes thereto and the report of Ernst & Young LLP thereon, included in the annual report to shareholders (the “Annual Report”), are hereby incorporated into this SAI by reference. The audited financial statements of Touchstone Active Bond Fund and Touchstone High Yield Fund, each a series of Touchstone Investment Trust, for the fiscal year ended September 30, 2016, including the notes thereto and the report of Ernst & Young LLP thereon, included in the annual report to shareholders (the Annual Report”), are hereby incorporated into this SAI by reference. A copy of the Trust’s prospectus and Annual Reports may be obtained without charge by writing to the Trust at P.O. Box 9878, Providence, Rhode Island 02940, by calling 1.800.543.0407, or by downloading a copy at TouchstoneInvestments.com.
TABLE OF CONTENTS
THE TRUST
Touchstone Funds Group Trust (the “Trust”), an open-end management investment company, was organized as a Delaware statutory trust under an Agreement and Declaration of Trust dated October 25, 1993, (as amended the “Declaration of Trust”). Prior to November 20, 2006, the name of the Trust was Constellation Funds. Effective November 20, 2006, the Trust’s name changed to Touchstone Funds Group Trust. The Declaration of Trust permits the Trust to offer separate series of units of beneficial interest (the “shares”) and separate classes of shares. Each Fund is a separate mutual fund and each share of each Fund represents an equal proportionate interest in that Fund. This SAI relates to the following separate series of the Trust: Touchstone Active Bond Fund (the “Active Bond Fund”), Touchstone Arbitrage Fund (the “Arbitrage Fund”), Touchstone Emerging Markets Small Cap Fund (the “Emerging Markets Small Cap Fund”), Touchstone High Yield Fund (the “High Yield Fund”), Touchstone Merger Arbitrage Fund (the “Merger Arbitrage Fund”), Touchstone Mid Cap Fund (the “Mid Cap Fund”), Touchstone Mid Cap Value Fund (the “Mid Cap Value Fund”), Touchstone Premium Yield Equity Fund (the “Premium Yield Equity Fund”), Touchstone Sands Capital Select Growth Fund (the “Sands Capital Select Growth Fund”), Touchstone Small Cap Fund (the “Small Cap Fund”), Touchstone Small Cap Value Fund (the “Small Cap Value Fund”), Touchstone Total Return Bond Fund (the” Total Return Bond Fund”), and Touchstone Ultra Short Duration Fixed Income Fund (the “Ultra Short Duration Fixed Income Fund”). Each of the Trusts’ Funds are diversified except for the Arbitrage Fund, the Merger Arbitrage Fund, Sands Capital Select Growth Fund, and the Small Cap Fund.
Touchstone Advisors, Inc. (the “Advisor”) is the investment advisor and administrator for each Fund. The Advisor has selected one or more sub-advisor(s) to manage, on a daily basis, the assets of each Fund. The Advisor has sub-contracted certain administrative and accounting services to BNY Mellon Investment Servicing (US) Inc. (“BNY Mellon”). Touchstone Securities, Inc. (“Touchstone Securities” or the “Distributor”) is the principal distributor of the Funds’ shares. The Distributor is an affiliate of the Advisor.
The Trust offers five separate classes of shares: Classes A, C, Y, Z, and Institutional Class. The shares of a Fund represent an interest in the same assets of that Fund.
The shares have the same rights and are identical in all material respects except that: (i) each class of shares may bear different (or no) distribution fees; (ii) each class of shares may be subject to different (or no) sales charges; (iii) certain other class specific expenses will be borne solely by the class to which such expenses are attributable, including transfer agent fees attributable to a specific class of shares, printing and postage expenses related to preparing and distributing materials to current shareholders of a specific class, registration fees incurred by a specific class of shares, the expenses of administrative personnel and services required to support the shareholders of a specific class, litigation or other legal expenses relating to a class of shares, Trustees’ fees or expenses incurred as a result of issues relating to a specific class of shares and accounting fees and expenses relating to a specific class of shares; (iv) each class has exclusive voting rights with respect to matters relating to its own distribution arrangements; and (v) certain classes offer different features and services to shareholders and may have different investment minimums. The Board of Trustees (the “Board”) may classify and reclassify the shares of a Fund into additional classes of shares at a future date.
The Trust’s Funds and Classes that are currently offered are listed below:
| Funds | | Class A | | Class C | | Class Y | | Class Z | | Institutional
Class |
| Active Bond Fund | | x | | x | | x | | | | x |
| Arbitrage Fund | | x | | x | | x | | | | x |
| Emerging Markets Small Cap Fund | | x | | x | | x | | | | x |
| High Yield Fund | | x | | x | | x | | | | x |
| Merger Arbitrage Fund | | x | | x | | x | | | | x |
| Mid Cap Fund | | x | | x | | x | | x | | x |
| Mid Cap Value Fund | | x | | x | | x | | | | x |
| Premium Yield Equity Fund | | x | | x | | x | | | | |
| Sands Capital Select Growth Fund | | x | | x | | x | | x | | |
| Small Cap Fund | | x | | x | | x | | | | x |
| Small Cap Value Fund | | x | | x | | x | | | | x |
| Total Return Bond Fund | | x | | x | | x | | | | x |
| Ultra Short Duration Fixed Income Fund | | x | | x | | x | | x | | x |
History of the Funds
Active Bond Fund. Before the Fund commenced operations, the assets of the Active Bond Fund, a series of Touchstone Investment Trust (the “Active Bond Predecessor Fund”), were acquired by the Fund in a tax-free reorganization as set forth in an agreement and plan of reorganization (the “Active Bond Reorganization”) between the Trust, on behalf of the Fund, and Touchstone Investment Trust, a Massachusetts business trust, on behalf of the Active Bond Predecessor Fund. The Active Bond Reorganization occurred on January 27, 2017. The Active Bond Reorganization occurred within the Touchstone family of mutual funds. The only material change between the Active Bond Predecessor Fund and the Fund is the state of domicile: the Active Bond Predecessor Fund was a series of a Massachusetts business trust, while the Fund is a series of a Delaware statutory trust. As a result of the Active Bond Reorganization, the performance and accounting history of the Active Bond Predecessor Fund were assumed by the Fund. Financial and performance information included herein is that of the Active Bond Predecessor Fund.
Emerging Markets Small Cap Fund. Effective on April 19, 2016, the Fund changed its name from Touchstone Emerging Markets Equity Fund to Touchstone Emerging Markets Small Cap Fund. Also on April 19, 2016, the Emerging Markets Small Cap Fund replaced its sub–advisor, AFG Investments America, Inc., with Copper Rock Capital Partners, LLC.
High Yield Fund. Before the Fund commenced operations, the assets of the High Yield Fund, a series of Touchstone Investment Trust, a Massachusetts business trust (the “High Yield Predecessor Fund” and together with the Active Bond Predecessor Fund, the “Predecessor Funds”), were acquired by the Fund in a tax-free reorganization as set forth in an agreement and plan of reorganization (the “High Yield Reorganization” and together with the Active Bond Reorganization, the “Reorganizations”) between the Trust, on behalf of the Fund, and Touchstone Investment Trust, on behalf of the High Yield Predecessor Fund. The High Yield Reorganization occurred on January 27, 2017. The High Yield Reorganization occurred within the Touchstone family of mutual funds. The only material change between the High Yield Predecessor Fund and the Fund is the state of domicile: the High Yield Predecessor Fund was a series of a Massachusetts business trust, while the Fund is a series of a Delaware statutory trust. As a result of the High Yield Reorganization, the performance and accounting history of the High Yield Predecessor Fund were assumed by the Fund. Financial and performance information included herein is that of the High Yield Predecessor Fund.
Mid Cap Fund. From the Mid Cap Fund’s inception on January 2, 2003 until April 14, 2005, the Fund operated as the Midcap Core Portfolio, a separate series of Constellation Institutional Portfolios. Turner Investment Partners, Inc. (“TIP”) served as the Midcap Core Portfolio’s investment advisor from January 2, 2003 until March 1, 2004, and as the Midcap Core Portfolio’s investment sub-advisor with day-to-day portfolio management responsibility from March 1, 2004 until April 14, 2005. On April 14, 2005, the Midcap Core Portfolio was reorganized into the Constellation TIP Mid Cap Fund. On November 20, 2006, the Constellation TIP Mid Cap Fund was renamed the Touchstone Mid Cap Fund. TIP remained as the sub-advisor after these changes. On February 2, 2009, the Fund’s Class Y shares were renamed the Institutional Class shares. On January 28, 2010, the Institutional Class shares were renamed the Class Y shares. On December 8, 2011, the Mid Cap Fund replaced its sub-advisor, TIP, with The London Company of Virginia d/b/a The London Company (“The London Company”).
Sands Capital Select Growth Fund. From the Sands Capital Select Growth Fund’s inception on August 11, 2000 until August 1, 2004, the Fund operated as the Pitcairn Select Growth Fund and was managed by Sands Capital. On August 1, 2004, the Pitcairn Select Growth Fund was reorganized into the Constellation Sands Capital Select Growth Fund. On November 20, 2006, the Constellation Sands Capital Select Growth Fund was renamed the Touchstone Sands Capital Select Growth Fund. Sands Capital remained as the sub-advisor after the change.
Small Cap Fund. Effective on January 30, 2016, the Fund changed its name from Touchstone Small Cap Core Fund to Touchstone Small Cap Fund.
Small Cap Value Fund. From the Small Cap Value Fund’s inception on March 4, 2002 until May 7, 2004, the Fund operated as the Turner Small Cap Value Opportunities Fund, a portfolio of the Turner Funds and was advised by Turner Investment Management, LLC, a majority-owned subsidiary of TIP. On May 7, 2004, the Turner Small Cap Value Opportunities Fund was reorganized into the Constellation TIP Small Cap Value Opportunities Fund. Effective December 22, 2005, the Fund’s name was changed to Constellation Small Cap Value Opportunities Fund. On November 20, 2006, the Constellation Small Cap Value Opportunities Fund was renamed the Touchstone Small Cap Value Opportunities Fund. Turner Investment Partners, Inc. and Diamond Hill Capital Management, Inc. remained as the sub-advisors to the Fund after the change. James Investment Research, Inc. became a sub-advisor to the Fund on June 20, 2007. Diamond Hill Capital Management, Inc. and James Investment Research, Inc. were removed as sub-advisors to the Fund on June 16, 2008. Turner Investment Partners, Inc. was replaced as sub-advisor to the Fund on December 6, 2010 by DePrince, Race and Zollo, Inc. (“DRZ”). On December 6, 2010, the Touchstone Small Cap Value Opportunities Fund was renamed the Touchstone Small Cap Value Fund. On July 1, 2016, the Small Cap Value Fund replaced its sub–advisor, DRZ, with LMCG Investments, LLC.
Total Return Bond Fund. On April 19, 2011, the Core Plus Fixed Income Fund replaced its sub-advisor, Bradford & Marzec LLC (“Bradford & Marzec”), with EARNEST Partners LLC and changed its name to the Touchstone Total Return Bond Fund. On August 1, 2011, the EARNEST Partners Fixed Income Trust (the “EARNEST Trust”), a series of the Nottingham Investment Trust II, was reorganized into the Touchstone Total Return Bond Fund (the “Reorganization”). Prior to the Reorganization, the EARNEST Trust had an investment goal and principal investment strategies similar to those of the Fund. Performance information presented prior to August 1, 2011 refers to the Fund’s performance as the EARNEST Trust.
On April 16, 2012, the Total Return Bond Fund acquired all of the assets and liabilities of the Old Mutual Barrow Hanley Core Bond Fund pursuant to an Agreement and Plan of Reorganization dated October 4, 2011.
Ultra Short Duration Fixed Income Fund. From the Ultra Short Duration Fixed Income Fund’s inception on March 1, 1994 until July 1, 1999, the Fund operated as the Alpha Select Short Duration Government Funds — One Year Portfolio. On July 1, 1999, the Fund converted to the TIP Funds (now Turner Funds) Turner Short Duration Government Funds — One Year Portfolio, and later the Turner Ultra Short Duration Fixed Income Fund. On May 7, 2004, the Turner Ultra Short Duration Fixed Income Fund was reorganized into the Constellation Chartwell Ultra Short Duration Fixed Income Fund. On November 20, 2006 the Constellation Chartwell Ultra Short Duration Fixed Income Fund was renamed the Touchstone Ultra Short Duration Fixed Income Fund. In October 2008, the Fund replaced its previous sub-advisor with Fort Washington Investment Advisors, Inc. The performance shown prior to October 2008 represents the performance of the previous sub-advisor. On May 17, 2013, the Touchstone Short Duration Fixed Income Fund was reorganized into the Ultra Short Duration Fixed Income Fund.
On April 16, 2012, the Ultra Short Duration Fixed Income Fund acquired all of the assets and liabilities of the Old Mutual Dwight Short Term Fixed Income Fund pursuant to an Agreement and Plan of Reorganization dated October 4, 2011.
PERMITTED INVESTMENTS AND RISK FACTORS
Each Fund’s principal investment strategies and principal risks are described in the Funds’ prospectus. The following supplements the information contained in the prospectus concerning each Fund’s principal investment strategies and principal risks. In addition, although not principal strategies of the Funds, the Funds may invest in other types of securities and engage in other investment practices as described in the prospectus or in this SAI. Unless otherwise indicated, each Fund is permitted to invest in each of the investments listed below, or engage in each of the investment techniques listed below consistent with the Fund’s investment goals, policies and strategies. The investment limitations below are considered to be non-fundamental policies which may be changed at any time by a vote of the Trust’s Board, unless designated as a “fundamental” policy. In addition, any stated percentage limitations are measured at the time of the purchase of a security.
Adjustable-Rate Mortgage Securities (“ARMS”). Generally, ARMS have a specified maturity date and amortize principal over their life. In periods of declining interest rates there is a reasonable likelihood that ARMS will experience increased rates of prepayment of principal. However, the major difference between ARMS and fixed-rate mortgage securities is that the interest rate can and does change in accordance with movements in a particular, pre-specified, published interest rate index. There are two main categories of indices: those based on U.S. Treasury obligations and those derived from a calculated measure, such as a cost of funds index or a moving average of mortgage rates. The amount of interest on an adjustable rate mortgage is calculated by adding a specified amount to the applicable index, subject to limitations on the maximum and minimum interest that is charged during the life of the mortgage or to maximum and minimum changes to that interest rate during a given period.
The underlying mortgages which collateralize the ARMS will frequently have caps and floors which limit the maximum amount by which the loan rate to the residential borrower may change up or down (1) per reset or adjustment interval and (2) over the life of the loan. Some residential mortgage loans restrict periodic adjustments by limiting changes in the borrower’s monthly principal and interest payments rather than limiting interest rate changes. These payment caps may result in negative amortization. The value of mortgage-related securities in which a Fund invests may be affected if market interest rates rise or fall faster and farther than the allowable caps or floors on the underlying residential mortgage loans. Additionally, even though the interest rates on the underlying residential mortgages are adjustable, amortization and prepayments may occur, thereby causing the effective maturities of the mortgage-related securities in which a Fund invests to be shorter than the maturities stated in the underlying mortgages.
American Depositary Receipts (“ADRs”). ADRs, American Depositary Shares (“ADSs”), Global Depositary Receipts (“GDRs”), European Depositary Receipts (“EDRs”), and Continental Depositary Receipts (“CDRs”) are U.S. dollar-denominated receipts typically issued by domestic banks or trust companies that represent the deposit with those entities of securities of a foreign issuer. They are publicly traded on exchanges or over-the-counter in the United States. EDRs, which are sometimes referred to as CDRs, and GDRs may also be purchased by the Funds. EDRs, CDRs and GDRs are generally issued by foreign banks and evidence ownership of either foreign or domestic securities. Certain institutions issuing ADRs, ADSs, GDRs or EDRs may not be sponsored by the issuer of the underlying foreign securities. A non-sponsored depositary may not provide the same shareholder information
that a sponsored depositary is required to provide under its contractual arrangements with the issuer of the underlying foreign securities. Holders of an unsponsored depositary receipt generally bear all the costs of the unsponsored facility. The depositary of an unsponsored facility frequently is under no obligation to distribute shareholder communications received from the issuer of the deposited security or to pass through to the holders of the receipts voting rights with respect to the deposited securities.
The Ultra Short Duration Fixed Income Fund does not invest in depositary receipts. The Mid Cap Value Fund may invest up to 10% of its assets in depositary receipts.
Asset-Backed Securities (“ABS”). The Active Bond Fund may invest in certain ABS such as securities whose assets consist of a pool of motor vehicle retail installment sales contracts and security interests in the vehicles securing the contracts or a pool of credit card loan receivables. The credit quality of an ABS transaction depends on the performance of the underlying assets. To protect ABS investors from the possibility that some borrowers could miss payments or even default on their loans, ABS may include various forms of credit enhancement. Some ABS are subject to interest-rate risk and prepayment risk. A change in interest rates can affect the pace of payments on the underlying loans, which in turn, affects total return on the securities. ABS also carry credit or default risk. If many borrowers on the underlying loans default, losses could exceed the credit enhancement level and result in losses to investors in an ABS transaction. Finally, ABS have structure risk due to a unique characteristic known as early amortization, or early payout, risk. Built into the structure of most ABS are triggers for early payout, designed to protect investors from losses. These triggers are unique to each transaction and can include: a big rise in defaults on the underlying loans, a sharp drop in the credit enhancement level, or even the bankruptcy of the originator. Once early amortization begins, all incoming loan payments (after expenses are paid) are used to pay investors as quickly as possible based upon a predetermined priority of payment.
Bank Debt Instruments. Bank debt instruments in which the Funds may invest consist of certificates of deposit, bankers’ acceptances and time deposits issued by national banks and state banks, trust companies and mutual savings banks, or of banks or institutions the accounts of which are insured by the Federal Deposit Insurance Corporation. Certificates of deposit are negotiable certificates evidencing the indebtedness of a commercial bank to repay funds deposited with it for a definite period of time (usually from fourteen days one year, although certificates of deposit may have longer terms) at a stated or variable interest rate. Bankers’ acceptances are credit instruments evidencing the obligation of a bank to pay a draft that has been drawn on it by a customer, which instruments reflect the obligation both of the bank and of the drawer to pay the face amount of the instrument upon maturity. Time deposits are nonnegotiable deposits maintained in a banking institution for a specified period of time at a stated interest rate. Investments in time deposits maturing in more than seven days will be subject to the Funds’ restrictions on illiquid investments (see “Investment Limitations”).
The Active Bond Fund may invest in certificates of deposit, bankers’ acceptances and time deposits issued by foreign branches of national banks. Eurodollar certificates of deposit are negotiable U.S. dollar denominated certificates of deposit issued by foreign branches of major U.S. commercial banks. Eurodollar bankers’ acceptances are U.S. dollar denominated bankers’ acceptances “accepted” by foreign branches of major U.S. commercial banks. Investments in the obligations of foreign branches of U.S. commercial banks may be subject to special risks, including future political and economic developments, imposition of withholding taxes on income, establishment of exchange controls or other restrictions, less governmental supervision and the lack of uniform accounting, auditing and financial reporting standards that might affect an investment adversely. Payment of interest and principal upon these obligations may also be affected by governmental action in the country of domicile of the branch (generally referred to as sovereign risk). In addition, evidences of ownership of portfolio securities may be held outside of the U.S. and the Funds may be subject to the risks associated with the holding of such property overseas. Various provisions of federal law governing the establishment and operation of domestic branches do not apply to foreign branches of domestic banks. The Sub-Advisor, subject to the oversight of the Board, considers these factors when making investments. The Funds do not limit the amount of their assets that can be invested in any one type of instrument or in any foreign country in which a branch of a U.S. bank or the parent of a U.S. branch is located. Investments in obligations of foreign banks are subject to the overall limit of 25% of total assets that may be invested in a single industry.
Borrowing. Borrowing may exaggerate changes in the net asset value (“NAV”) of a Fund’s shares and in the return on the Fund’s portfolio. Although the principal of any borrowing will be fixed, a Fund’s assets may change in value during the time the borrowing is outstanding. The Funds may be required to liquidate portfolio securities at a time when it would be disadvantageous to do so in order to make payments with respect to any borrowing. The Funds may be required to earmark or segregate liquid assets in an amount sufficient to meet their obligations in connection with such borrowings. In an interest rate arbitrage transaction, a Fund borrows money at one interest rate and lends the proceeds at another, higher interest rate. These transactions involve a number of risks including the risk that the borrower will fail or otherwise become insolvent or that there will be a significant change in prevailing interest rates.
The Funds have adopted fundamental limitations and non-fundamental limitations which restrict circumstances in which and degree to which the Funds can engage in borrowing. See the section entitled “Investment Limitations,” below.
Borrowing and Pledging. Each Fund may borrow money from banks (including their custodian bank) or from other lenders to the extent permitted by applicable law. The Investment Company Act of 1940 Act, as amended (the “1940 Act”) requires the Funds to maintain asset coverage (total assets, including assets acquired with borrowed funds, less liabilities exclusive of borrowings) of at least 300% for all such borrowings. If at any time the value of a Fund’s assets should fail to meet this 300% coverage test, the Fund, within 3 days (not including Sundays and holidays), will reduce the amount of its borrowings to the extent necessary to meet this test. A Fund will not make any borrowing or enter into a reverse repurchase agreement or dollar roll transaction that would cause its outstanding borrowings to exceed one-third of the value of its total assets.
To reduce its borrowings, a Fund might be required to sell securities at a time when it would be disadvantageous to do so. In addition, because interest on money borrowed is a Fund expense that it would not otherwise incur, the Fund may have less net investment income during periods when its borrowings are substantial. The interest paid by a Fund on borrowings may be more or less than the yield on the securities purchased with borrowed funds, depending on prevailing market conditions. Borrowing magnifies the potential for gain or loss on a Fund’s portfolio securities and, therefore, if employed, increases the possibility of fluctuation in its NAV. This is the speculative factor known as leverage. To reduce the risks of borrowing, the Funds will limit their borrowings as described below. In addition, the Active Bond Fund may enter into reverse repurchase agreements and dollar roll transactions that are treated as borrowings by the Fund.
The Funds have adopted non-fundamental limitations which restrict circumstances in which and the degree to which the Funds can engage in borrowing. As a matter of current operating policy, and except for the use of reverse repurchase agreements and dollar rolls, the Active Bond Fund may borrow money from banks or other persons in an amount not exceeding 10% of its total assets, as a temporary measure for extraordinary or emergency purposes. The Active Bond Fund may pledge assets in connection with such borrowings but will not pledge more than 10% of its total assets. The Active Bond Fund will not make any additional purchases of portfolio securities if outstanding borrowings, other than reverse repurchase agreements and dollar rolls, exceed 5% of the value of its total assets. These operating policies are not fundamental and may be changed by the Board without shareholder approval.
As a matter of current operating policy, the High Yield Fund may borrow money from banks or other persons in an amount not exceeding 10% of its total assets, as a temporary measure for extraordinary or emergency purposes. The High Yield Fund may pledge assets in connection with such borrowings but will not pledge more than 10% of its total assets. The High Yield Fund will not make any additional purchases of portfolio securities if outstanding borrowings exceed 5% of the value of its total assets. These operating policies are not fundamental and may be changed by the Board without shareholder approval.
Business Development Companies (“BDCs”). BDCs are a type of closed-end fund regulated under the 1940 Act. BDCs are publicly-traded mezzanine/private equity funds that typically invest in and lend to small and medium-sized private companies that may not have access to public equity markets for capital raising. BDCs are unique in that at least 70% of their investments must be made to private U.S. businesses, and BDCs are required to make available significant managerial assistance to their portfolio companies. BDCs are not taxed on income distributed to shareholders provided they comply with the applicable requirements of the Internal Revenue Code of 1986, as amended (the “Code”). BDCs have expenses associated with their operations. Accordingly, a Fund will indirectly bear its proportionate share of any management and other expenses, and of any performance based fees, charged by the BDCs in which it invests.
Investments in BDCs are subject to various risks, including management’s ability to meet the BDC’s investment objective, and to manage the BDC’s portfolio when the underlying securities are redeemed or sold, during periods of market turmoil and as investors’ perceptions regarding a BDC or its underlying investments change. BDC shares are not redeemable at the option of the BDC shareholder and, as with shares of other closed-end funds, they may trade in the secondary market at a discount to their NAV.
The Premium Yield Equity Fund may invest up to 10% of its net assets in BDCs.
Canadian Income Trusts. A Canadian Income Trust is a qualified income trust as designated by the Canada Revenue Agency that operates as a profit-seeking corporation. This type of income trust, which pays out all earnings to unit holders before paying taxes, is usually traded publicly on a securities exchange. Canadian Income Trusts enjoy special corporate tax privileges.
The Premium Yield Equity Fund may invest up to 10% of its net assets in Canadian Income Trusts.
Collateralized Mortgage Obligations (“CMOs”). The Funds may invest in CMOs. CMOs are fully-collateralized bonds that are the general obligations of the issuer thereof. CMOs may be less liquid and may exhibit greater price volatility than other types of mortgage-or asset-backed securities.
The key feature of the CMO structure is the prioritization of the cash flows from a pool of mortgages among the several classes of CMO holders, thereby creating a series of obligations with varying rates and maturities appealing to a wide range of investors. CMOs generally are secured by an assignment to a trustee under an indenture pursuant to which the bonds are issued for collateral consisting of a pool of mortgages. Payments with respect to the underlying mortgages generally are made to the trustee under the indenture. Payments of principal and interest on the underlying mortgages are not passed through to the holders of the CMOs as such (that is, the character of payments of principal and interest is not passed through and therefore payments to holders of CMOs attributable to interest paid and principal repaid on the underlying mortgages do not necessarily constitute income and return of capital, respectively, to such holders), but such payments are dedicated to payment of interest on, and repayment of, principal of the CMOs. CMOs are issued in two or more classes or series with varying maturities and stated rates of interest determined by the issuer. Because interest and principal payments on the underlying mortgages are not passed through to holders of CMOs, CMOs of varying maturities may be secured by the same pool of mortgages, the payments on which are used to pay interest on each class and to retire successive maturities in sequence. CMOs are designed to be retired as the underlying mortgages are repaid. In the event of sufficient early prepayments on such mortgages, the class or series of CMO first to mature generally will be retired prior to maturity. Therefore, although in most cases the issuer of CMOs will not supply additional collateral in the event of such prepayments, there will be sufficient collateral to secure CMOs that remain outstanding.
Since Federal Home Loan Mortgage Corporation (FHLMC) (“Freddie Mac”) CMOs are the general obligations of Freddie Mac, it will be obligated to use its general funds to make payments thereon if payments generated by the underlying mortgages are insufficient to pay principal and interest in its CMOs. In addition, CMOs are issued by private entities, such as financial institutions, mortgage bankers and subsidiaries of homebuilding companies. The structural features of privately issued CMOs will vary considerably from issue to issue, and the Sub-Advisor will consider such features, together with the character of the underlying mortgage pool and the liquidity and credit rating of the issue.
Several classes of securities are issued against a pool of mortgage collateral. The most common structure contains four classes of securities; the first three classes pay interest at their stated rates beginning with the issue date and the final class is typically an accrual class (or Z bond). The cash flows from the underlying mortgage collateral are applied first to pay interest and then to retire securities. The classes of securities are retired sequentially. All principal payments are directed first to the shortest-maturity class (or A bonds). When those securities are completely retired, all principal payments are then directed to the next-shortest-maturity security (or B bond). This process continues until all of the classes have been paid off. Because the cash flow is distributed sequentially instead of pro rata as with pass-through securities, the cash flows and average lives of CMOs are more predictable, and there is a period of time during which the investors into the longer maturity classes receive no principal paydowns.
One or more tranches of a CMO may have coupon rates that reset periodically at a specified increment over an index, such as the London Interbank Offered Rate (“LIBOR”). These adjustable rate tranches, known as “floating-rate CMOs,” will be treated as Adjustable Rate Mortgage Securities (“ARMS”). Floating-rate CMOs may be backed by fixed-rate or adjustable-rate mortgages. Floating-rate CMOs are typically issued with lifetime “caps” on the coupon rate. These caps, similar to the caps on ARMS, represent a ceiling beyond which the coupon rate may not be increased, regardless of increases in the underlying interest rate index.
Mortgage-related securities such as CMOs may not be readily marketable. To the extent any of these securities are not readily marketable in the judgment of the Sub-Advisor, the Active Bond Fund and the High Yield Fund may not invest more than 15% of total assets in such securities and other illiquid securities.
Commercial Paper and Other Short-Term Obligations. Commercial paper (including variable amount master demand notes) consists of short-term unsecured promissory notes issued by U.S. corporations, partnerships, trusts or other entities in order to finance short-term credit needs and non-convertible debt securities (e.g., bonds and debentures) with no more than 397 days remaining to maturity at the date of purchase. Certain notes may have floating or variable rates. Variable and floating rate notes with a demand notice period exceeding seven days will be subject to the Funds’ restrictions on illiquid investments (see “Investment Limitations”) unless, in the judgment of the Sub-Advisor, subject to the oversight of the Board, such note is liquid.
Commodity Futures Trading Commission Regulation. The Funds and the Advisor claimed exclusion or exemption from registering with the Commodity Futures Trading Commission (the “CFTC”). The Funds comply with Rule 4.5 under the Commodity Exchange Act (the “CEA”), which allows a mutual fund to be conditionally excluded from the definition of the term “commodity pool.” Similarly, so long as the Funds satisfy this conditional exclusion, the Advisor intends to comply with Rule 4.5, which allows the Advisor to be conditionally excluded from the definition of “commodity pool operator” (“CPO”), and Rule 4.14(a)(5), which provides a conditional exemption from registering as a “commodity trading advisor.” The Advisor, on behalf of the Funds and itself, has filed a claim with the CFTC claiming the CPO exemption. Therefore, neither the Funds nor the Advisor expect to become subject to registration under the CEA.
Common Stocks. Common stocks are securities that represent units of ownership in a company. Common stocks usually carry voting rights and earn dividends. Unlike preferred stocks, which are described below, dividends on common stocks are not fixed but are declared at the discretion of the board of directors of the issuing company.
Convertible Securities. Convertible securities are corporate securities that are exchangeable for a set number of another security at a pre-stated price. Convertible securities typically have characteristics of both fixed-income and equity securities. Because of the conversion feature, the market value of a convertible security tends to move with the market value of the underlying stock. The value of a convertible security is also affected by prevailing interest rates, the credit quality of the issuer and any call provisions.
A synthetic convertible security is a combination investment in which a Fund purchases both (i) high-grade cash equivalents or a high grade debt obligation of an issuer or U.S. government securities and (ii) call options or warrants on the common stock of the same or different issuer with some or all of the anticipated interest income from the associated debt obligation that is earned over the holding period of the option or warrant.
While providing a fixed-income stream (generally higher in yield than the income derivable from common stock but lower than that afforded by a similar non-convertible security), a convertible security also affords a shareholder the opportunity, through its conversion feature, to participate in the capital appreciation attendant upon a market price advance in the convertible security’s underlying common stock. A synthetic convertible position has similar investment characteristics, but may differ with respect to credit quality, time to maturity, trading characteristics and other factors. Because a Fund will create synthetic convertible positions only out of high grade fixed-income securities, the credit rating associated with a Fund’s synthetic convertible investments is generally expected to be higher than that of the average convertible security, many of which are rated below high grade. However, because the options used to create synthetic convertible positions will generally have expirations between one month and three years of the time of purchase, the maturity of these positions will generally be shorter than average for convertible securities. Since the option component of a convertible security or synthetic convertible position is a wasting asset (in the sense of losing “time value” as maturity approaches), a synthetic convertible position may lose such value more rapidly than a convertible security of longer maturity; however, the gain in option value due to appreciation of the underlying stock may exceed such time value loss. The market price of the option component generally reflects these differences in maturities, and the Advisor and applicable sub-advisor take such differences into account when evaluating such positions. When a synthetic convertible position “matures” because of the expiration of the associated option, a Fund may extend the maturity by investing in a new option with longer maturity on the common stock of the same or different issuer. If a Fund does not so extend the maturity of a position, it may continue to hold the associated fixed-income security.
Each Fund, other than the Active Bond Fund, High Yield Fund and Ultra Short Duration Fixed Income Fund, may invest in convertible securities.
Corporate Debt Securities. Corporate debt securities are obligations of a corporation to pay interest and repay principal. Corporate debt securities include commercial paper, notes and bonds.
Covered Dollar Rolls. The Active Bond Fund may enter into dollar rolls in which the Fund sells mortgage-based or other fixed-income securities and simultaneously commits to repurchase substantially similar, but not identical, securities on a specified future date. In a simple dollar-roll transaction, the cash proceeds from this sale will be reinvested in high quality, short-term instruments, the maturity of which will coincide with the settlement date of the roll transaction. A strategy may also be used with respect to the dollar roll, where a series of 6-12 consecutive dollar-roll transactions (approximately 30 days per transaction) are executed.
This allows the Fund to purchase a slightly longer duration security with the cash proceeds from the sale and capitalize on potentially higher available yields. The additional duration from this strategy would be minimal.
The Fund will not use such transactions for leveraging purposes and, accordingly, at the time the Fund enters into a dollar roll, it will segregate liquid assets to satisfy its obligation for the forward commitment to buy the securities. The value of such segregated assets must be at least equal to the value of the forward commitment or repurchase obligation (principal plus accrued interest), as applicable. The segregated assets effectively collateralize the Fund’s right to receive the securities at the end of the roll period(s), and also serve to minimize the leveraging effect of the transaction.
In the case of dollar rolls involving mortgage-related securities, the mortgage-related securities that are purchased typically will be of the same type and will have the same or similar interest rate and maturity as those sold, but will be supported by different pools of mortgages. The Fund forgoes principal and interest, including prepayments, paid during the roll period on the securities sold in a dollar roll, but it is compensated by the difference between the current sales price and the price for the future purchase as well as by any interest earned on the proceeds of the securities sold. The Fund could also be compensated through receipt of
fee income. Dollar rolls may be renewed over a period of several months with a different repurchase price and a cash settlement made at each renewal without physical delivery of securities. Moreover, the transaction may be preceded by a firm commitment agreement pursuant to which the Fund agrees to buy a security on a future date.
Dollar-roll transactions are considered to be borrowings by the Fund and the use of such transactions will be subject to the Fund’s investment limitations on borrowings. See “Borrowing and Pledging” and “Investment Limitations.”
The risks associated with dollar rolls are market risk, since the price of the securities could drop lower than the agreed upon repurchase price during the roll period, or the securities that the Fund is required to repurchase may be worth less than the securities that the Fund originally held; and credit risk, since the counterparty to the transaction could fail to deliver the securities. If the counterparty to whom the Fund sells the securities becomes insolvent, the Fund’s right to purchase or repurchase the securities may be restricted. Finally, there can be no assurance that the Fund’s use of the cash that it receives from a dollar roll will provide a return that exceeds borrowing costs. Further, although the Fund can estimate the amount of expected principal prepayment over the term of the dollar roll, a variation in the actual amount of prepayment could increase or decrease the cost of the Fund’s borrowing.
Cyber Security Risk. The Funds and their service providers may be subject to operational and information security risks resulting from cyber security breaches. Cyber security breaches may result from deliberate cyber attacks, although unintentional events may have effects similar to those caused by cyber attacks. Cyber attacks may include the stealing or corrupting of data maintained online or digitally, denial-of-service attacks on Fund websites, the unauthorized release of confidential information or other operational disruption. Successful cyber attacks against, or security breaches of, a Fund or the Advisor, a Sub-Advisor, the Funds’ distributor, custodians, the transfer agent, selling agents and/or other third party service providers may adversely impact the Funds or its shareholders. Similar types of cyber security risks are also present for issuers of securities or other instruments in which the Funds invest, which could result in material adverse consequences for such issuers, and may cause the Funds’ investment therein to lose value.
Derivatives. The Funds may invest in various instruments that are commonly known as derivatives. Generally, a derivative is a financial arrangement, the value of which is based on, or “derived” from, a traditional security, asset, or market index. Some “derivatives” such as certain mortgage-related and other asset-backed securities are in many respects like any other investment, although they may be more volatile or less liquid than more traditional debt securities. There are, in fact, many different types of derivatives and many different ways to use them. There is a range of risks associated with those uses. Futures and options are commonly used for traditional hedging purposes to attempt to protect a Fund from exposure to changing interest rates, securities prices, or currency exchange rates and as a low cost method of gaining exposure to a particular securities market without investing directly in those securities. However, some derivatives are used for leverage, which tends to magnify the effects of an instrument’s price changes as market conditions change. Leverage involves the use of a small amount of money to control a large amount of financial assets, and can in some circumstances, lead to significant losses. The Sub-Advisor will use derivatives only in circumstances where the Sub-Advisor believes they offer the most economic means of improving the risk/reward profile of a Fund. Derivatives will not be used to increase portfolio risk above the level that could be achieved using only traditional investment securities or to acquire exposure to changes in the value of assets or indexes that by themselves would not be purchased for the Fund. The use of derivatives for non-hedging purposes may be considered speculative. A description of the specific derivatives that the Funds may use and some of their associated risks is discussed below under the captions “Forward Foreign Currency Contracts” and “Futures Contracts and Options on Futures Contracts.”
Emerging Market Securities. Emerging market countries are generally countries that are included in the Morgan Stanley Capital International (“MSCI”) Emerging Markets Index, or otherwise excluded from the MSCI World Index. As of December 31, 2016, the countries in the MSCI World Index included: Australia, Austria, Belgium, Canada, Denmark, Finland, France, Germany, Hong Kong, Ireland, Israel, Italy, Japan, the Netherlands, New Zealand, Norway, Portugal, Singapore, Spain, Sweden, Switzerland, the United Kingdom, and the United States. The country composition of the MSCI Emerging Markets Index and the MSCI World Index can change over time. Frontier market countries, which are those emerging market countries that have the smallest, least mature economies and least developed capital markets, are generally countries that are included in the MSCI Frontier Markets Index.
Investments in the securities of issuers domiciled in countries with emerging capital markets involve certain additional risks that do not generally apply to investments in securities of issuers in more developed capital markets, such as (i) low or non-existent trading volume, resulting in a lack of liquidity and increased volatility in prices for such securities, as compared to securities of comparable issuers in more developed capital markets; (ii) uncertain national policies and social, political and economic instability, increasing the potential for expropriation of assets, confiscatory taxation, high rates of inflation or unfavorable diplomatic developments; (iii) possible fluctuations in exchange rates, differing legal systems and the existence or possible imposition of exchange controls, custodial restrictions or other foreign or U.S. governmental laws or restrictions applicable to such investments; (iv) national policies that may limit a Fund’s investment opportunities such as restrictions on investment in issuers or industries
deemed sensitive to national interests; and (v) the lack or relatively early development of legal structures governing private and foreign investments and private property. In addition to withholding taxes on investment income, some countries with emerging markets may impose differential capital gains taxes on foreign investors.
Political and economic structures in emerging market countries may be undergoing significant evolution and rapid development, and these countries may lack the social, political and economic stability characteristic of more developed countries. In such a dynamic environment, there can be no assurance that any or all of these capital markets will continue to present viable investment opportunities for a Fund. Some of these countries may have in the past failed to recognize private property rights and have at times nationalized or expropriated the assets of private companies. There is no assurance that such expropriations will not reoccur. In such an event, it is possible that a Fund could lose the entire value of its investments in the affected market. As a result, the risks described above, including the risks of nationalization or expropriation of assets, may be heightened. In addition, unanticipated political or social developments may affect the value of investments in these countries and the availability to a Fund of additional investments. The small size and inexperience of the securities markets in certain of these countries and the limited volume of trading in securities in these countries may make investments in the countries illiquid and more volatile than investments in Japan or most Western European countries.
Also, there may be less publicly available information about issuers in emerging markets than would be available about issuers in more developed capital markets, and such issuers may not be subject to accounting, auditing and financial reporting standards and requirements comparable to those to which U.S. companies are subject. In certain countries with emerging capital markets, reporting standards vary widely. As a result, traditional investment measurements used in the United States, such as price/earnings ratios, may not be applicable. Emerging market securities may be substantially less liquid and more volatile than those of mature markets, and company shares may be held by a limited number of persons. This may adversely affect the timing and pricing of a Fund’s acquisition or disposal of securities.
Practices in relation to settlement of securities transactions in emerging markets involve higher risks than those in developed markets, in part because a Fund will need to use brokers and counterparties that are less well capitalized, and custody and registration of assets in some countries may be unreliable. The possibility of fraud, negligence, undue influence being exerted by the issuer or refusal to recognize ownership exists in some emerging markets, and, along with other factors, could result in ownership registration being completely lost. A Fund would absorb any loss resulting from such registration problems and may have no successful claim for compensation.
Some emerging market countries currently prohibit direct foreign investment in the securities of their companies. Certain emerging market countries, however, permit indirect foreign investment in the securities of companies listed and traded on their stock exchanges through investment funds that they have specifically authorized. Investments in these investment funds may be subject to the provisions of the 1940 Act limiting investments in other investment companies. Shareholders of a Fund that invests in such investment funds will bear not only their proportionate share of the expenses of a Fund (including operating expenses and the fees of the adviser), but also will indirectly bear similar expenses of the underlying investment funds. In addition, these investment funds may trade at a discount or premium to the fund’s NAV.
Participatory notes (commonly known as P-notes) are offshore derivative instruments issued to foreign institutional investors and their sub-accounts against underlying Indian securities listed on the Indian bourses. These securities are not registered with the Securities and Exchange Board of India. Participatory notes are similar to American depositary receipts (“ADRs”), which are negotiable certificates issued by a U.S. bank and traded on U.S. exchanges. ADRs are denominated in U.S. dollars and represent a specified number of shares in a foreign security held by a U.S. financial institution located in a foreign country. Both P-notes and ADRs are subject to the risks discussed above with respect to securities of foreign issuers in general.
The Active Bond Fund and the High Yield Fund may invest up to 10% of their total assets at the time of purchase in emerging market securities.
Equity-Linked Notes (“ELNs”). A Fund may purchase ELNs. The principal or coupon payment on an ELN is linked to the performance of an underlying security or index. ELNs may be used, among other things, to provide a Fund with exposure to international markets while providing a mechanism to reduce foreign tax or regulatory restrictions imposed on foreign investors. The risks associated with purchasing ELNs include the creditworthiness of the issuer and the risk of counterparty default. Further, a Fund’s ability to dispose of an ELN will depend on the availability of liquid markets in the instruments. The purchase and sale of an ELN is also subject to the risks regarding adverse market movements, possible intervention by governmental authorities, and the effects of other political and economic events.
Equity-Linked Warrants. Equity-linked warrants provide a way for investors to access markets where entry is difficult and time consuming due to regulation. Typically, a broker issues warrants to an investor and then purchases shares in the local market and
issues a call warrant hedged on the underlying holding. If the investor exercises his call and closes his position, the shares are sold and the warrant is redeemed with the proceeds.
Each warrant represents one share of the underlying stock. Therefore, the price, performance and liquidity of the warrant are all directly linked to the underlying stock. The warrants can be redeemed for 100% of the value of the underlying stock (less transaction costs). The Funds invest in American style warrants, which can be exercised at any time. The warrants in which the Funds invest are U.S. dollar denominated and priced daily on several international stock exchanges.
Eurobonds. A Eurobond is a bond denominated in U.S. dollars or another currency and sold to investors outside of the country whose currency is used. Eurobonds may be issued by government or corporate issuers, and are typically underwritten by banks and brokerage firms from numerous countries. While Eurobonds typically pay principal and interest in Eurodollars (U.S. dollars held in banks outside of the United States), they may pay principal and interest in other currencies.
Exchange-Traded Funds (“ETFs”). An ETF is a fund that holds a portfolio of common stocks designed to track the performance of a particular securities index or sector of an index, such as the S&P 500® Index, or a portfolio of bonds that may be designed to track a bond index. Because they may be traded like stocks on a securities exchange (e.g., the New York Stock Exchange; the NYSE MKT or the NASDAQ Stock Market), ETFs may be purchased and sold throughout the trading day based on their market price. Each share of an ETF represents an undivided ownership interest in the portfolio held by an ETF. ETFs that track indices or sectors of indices hold either:
| | • | shares of all of the companies (or, for a fixed-income ETF, bonds) that are represented by a particular index in the same proportion that is represented in the index itself; or |
| | • | shares of a sampling of the companies (or, for a fixed-income ETF, bonds) that are represented by a particular index in a proportion meant to track the performance of the entire index. |
ETFs are generally registered as investment companies and issue large blocks of shares (typically 50,000) called “creation units” in exchange for a specified portfolio of the ETF’s underlying securities, plus a cash payment generally equal to accumulated dividends of the securities (net of expenses) up to the time of deposit. Creation units are redeemed in kind for a portfolio of the underlying securities (based on the ETF’s NAV), together with a cash payment generally equal to accumulated dividends as of the date of redemption. As investment companies, ETFs incur fees and expenses such as advisory fees, trustee fees, operating expenses, licensing fees, registration fees, and marketing expenses, each of which will be reflected in the NAV of ETFs. Accordingly, ETF shareholders (including a Fund) pay their proportionate share of these expenses.
Foreign Securities. Foreign companies are companies that meet all of the following criteria: they are organized under the laws of a foreign country; they maintain their principal place of business in a foreign country; the principal trading market for their securities is located in a foreign country; they derive at least 50% of their revenues or profits from operations in foreign countries; and they have at least 50% of their assets located in foreign countries. Investing in securities issued by foreign companies and governments involves considerations and potential risks not typically associated with investing in obligations issued by the U.S. government and domestic corporations. Less information may be available about foreign companies than about domestic companies and foreign companies generally are not subject to uniform accounting, auditing and financial reporting standards or to other regulatory practices and requirements comparable to those applicable to domestic companies. The values of foreign investments are affected by changes in currency rates or exchange control regulations, restrictions or prohibitions on the repatriation of foreign currencies, application of foreign tax laws, including withholding taxes, changes in governmental administration or economic or monetary policy (in the United States or abroad) or changed circumstances in dealings between nations. Costs are also incurred in connection with conversions between various currencies. In addition, foreign brokerage commissions and custody fees are generally higher than those charged in the United States, and foreign securities markets may be less liquid, more volatile and less subject to governmental supervision than in the United States. Investments in foreign countries could be affected by other factors not present in the United States, including expropriation, confiscatory taxation, lack of uniform accounting and auditing standards and potential difficulties in enforcing contractual obligations and could be subject to extended clearance and settlement periods.
In addition, there are risks relating to ongoing concerns regarding the economies of certain European countries and their sovereign debt, as well as the potential for one or more countries to leave the European Union. In June 2016, the United Kingdom held a referendum resulting in a vote in favor of the United Kingdom leaving the European Union. These circumstances and potential future developments could have a negative effect on the United Kingdom’s and other European countries’ economies and may result in greater volatility in global financial and currency markets.
Foreign Market Risk. A Fund is subject to the risk that, because there are generally fewer investors on foreign exchanges and a smaller number of shares traded each day, it may be difficult for a Fund to buy and sell securities on those exchanges. In addition, prices of foreign securities may fluctuate more than prices of securities traded in the United States. Investments in foreign markets
may also be adversely affected by governmental actions such as the imposition of punitive taxes. In addition, the governments of certain countries may prohibit or impose substantial restrictions on foreign investing in their capital markets or in certain industries. Any of these actions could severely affect security prices, impair a Fund’s ability to purchase or sell foreign securities or transfer a Fund’s assets or income back into the United States or otherwise adversely affect a Fund’s operations. Other potential foreign market risks include exchange controls, difficulties in pricing securities, defaults on foreign government securities, difficulties in enforcing favorable legal judgments in foreign courts and political and social conditions, such as diplomatic relations, confiscatory taxation, expropriation, limitation on the removal of funds or assets or imposition of (or change in) exchange control regulations. Legal remedies available to investors in certain foreign countries may be less extensive than those available to investors in the United States or other foreign countries. In addition, changes in government administrations or economic or monetary policies in the United States or abroad could result in appreciation or depreciation of portfolio securities and could favorably or adversely affect a Fund’s operations.
Public Availability of Information. In general, less information is publicly available with respect to foreign issuers than is available with respect to U.S. companies. Most foreign companies are also not subject to the uniform accounting and financial reporting requirements applicable to issuers in the United States. A Fund’s foreign investments may be less liquid and their prices may be more volatile than comparable investments in securities in U.S. companies. In addition, there is generally less government supervision and regulation of securities exchanges, brokers and issuers in foreign countries than in the United States.
Settlement Risk. Settlement and clearance procedures in certain foreign markets differ significantly from those in the United States. Foreign settlement procedures and trade regulations also may involve certain risks (such as delays in payment for or delivery of securities) not typically generated by the settlement of U.S. investments. Communications between the United States and certain non-U.S. countries may be unreliable, increasing the risk of delayed settlements or losses of security certificates in markets that still rely on physical settlement. Settlements in certain foreign countries at times have not kept pace with the number of securities transactions; these problems may make it difficult for a Fund to carry out transactions. If a Fund cannot settle or is delayed in settling a purchase of securities, it may miss attractive investment opportunities and certain of its assets may be uninvested with no return earned thereon for some period. If a Fund cannot settle or is delayed in settling a sale of securities, it may lose money if the value of the security then declines or, if it has contracted to sell the security to another party, a Fund could be liable to that party for any losses incurred. Dividends or interest on, or proceeds from the sale of, foreign securities may be subject to foreign taxes on income from sources in such countries.
Governmental Supervision and Regulation/Accounting Standards. Many foreign governments supervise and regulate stock exchanges, brokers and the sale of securities less than the United States does. Some countries may not have laws to protect investors comparable to the U.S. securities laws. For example, some foreign countries may have no laws or rules against insider trading. Insider trading occurs when a person buys or sells a company’s securities based on nonpublic information about that company. In addition, the U.S. government has from time to time in the past imposed restrictions, through penalties and otherwise, on foreign investments by U.S. investors such as a Fund. Accounting standards in other countries are not necessarily the same as in the United States. If the accounting standards in another country do not require as much detail as U.S. accounting standards, it may be harder for a Fund to completely and accurately determine a company’s financial condition. Also, brokerage commissions and other costs of buying or selling securities often are higher in foreign countries than they are in the United States. This reduces the amount a Fund can earn on its investments.
Foreign Currency Risk. While a Fund’s net assets are valued in U.S. dollars, the securities of foreign companies are frequently denominated in foreign currencies. Thus, a change in the value of a foreign currency against the U.S. dollar will result in a corresponding change in value of securities denominated in that currency. Some of the factors that may impair the investments denominated in a foreign currency are: (1) it may be expensive to convert foreign currencies into U.S. dollars and vice versa; (2) complex political and economic factors may significantly affect the values of various currencies, including U.S. dollars, and their exchange rates; (3) government intervention may increase risks involved in purchasing or selling foreign currency options, forward contracts and futures contracts, since exchange rates may not be free to fluctuate in response to other market forces; (4) there may be no systematic reporting of last sale information for foreign currencies or regulatory requirement that quotations available through dealers or other market sources be firm or revised on a timely basis; (5) available quotation information is generally representative of very large round-lot transactions in the inter-bank market and thus may not reflect exchange rates for smaller odd-lot transactions (less than $1 million) where rates may be less favorable; and (6) the inter-bank market in foreign currencies is a global, around-the-clock market. To the extent that a market is closed while the markets for the underlying currencies remain open, certain markets may not always reflect significant price and rate movements.
The Active Bond Fund may invest in debt securities denominated in foreign currencies (up to 20% of total assets). The High Yield Fund may invest in securities of foreign companies (up to 15% of total assets), but only up to 5% of its total assets in securities of foreign companies that are denominated in a currency other than the U.S. dollar.
Forward Foreign Currency Contracts. The Funds may enter into forward foreign currency contracts to manage foreign currency exposure and as a hedge against possible variations in foreign exchange rates. A Fund may enter into forward foreign currency contracts to hedge a specific security transaction or to hedge a portfolio position.
These contracts may be bought or sold to protect a Fund, to some degree, against possible losses resulting from an adverse change in the relationship between foreign currencies and the U.S. dollar. A Fund also may invest in foreign currency futures and in options on currencies. A forward contract involves an obligation to purchase or sell a specific currency amount at a future date, agreed upon by the parties, at a price set at the time of the contract. A Fund may enter into a contract to sell, for a fixed amount of U.S. dollars or other appropriate currency, the amount of foreign currency approximating the value of some or all of a Fund’s securities denominated in such foreign currency.
By entering into forward foreign currency contracts, a Fund will seek to protect the value of its investment securities against a decline in the value of a currency. However, these forward foreign currency contracts will not eliminate fluctuations in the underlying prices of the securities. Rather, they simply establish a rate of exchange which one can obtain at some future point in time. Although such contracts tend to minimize the risk of loss due to a decline in the value of the hedged currency, they also tend to limit any potential gain which might result should the value of such currency increase. At the maturity of a forward contract, a Fund may either sell a portfolio security and make delivery of the foreign currency, or it may retain the security and terminate its contractual obligation to deliver the foreign currency by purchasing an “offsetting” contract with the same currency trader, obligating it to purchase, on the same maturity date, the same amount of the foreign currency. A Fund may realize a gain or loss from currency transactions.
When entering into a contract for the purchase or sale of a security in a foreign currency, a Fund may enter into a forward foreign currency contract for the amount of the purchase or sale price to protect against variations, between the date the security is purchased or sold and the date on which payment is made or received, in the value of the foreign currency relative to the U.S. dollar or other foreign currency.
Also, when a Fund’s portfolio manager anticipates that a particular foreign currency may decline substantially relative to the U.S. dollar or other leading currencies, in order to reduce risk, a Fund may enter into a forward contract to sell, for a fixed amount, the amount of foreign currency approximating the value of its securities denominated in such foreign currency. With respect to any such forward foreign currency contract, it will not generally be possible to match precisely the amount covered by that contract and the value of the securities involved due to changes in the values of such securities resulting from market movements between the date the forward contract is entered into and the date it matures. In addition, while forward foreign currency contracts may offer protection from losses resulting from declines in value of a particular foreign currency, they also limit potential gains which might result from increases in the value of such currency. A Fund will also incur costs in connection with forward foreign currency contracts and conversions of foreign currencies into U.S. dollars. A Fund will place assets in a segregated account or otherwise earmark assets as cover to ensure that its obligations under forward foreign currency contracts are covered.
The forecasting of currency market movement is extremely difficult, and whether any hedging strategy will be successful is highly uncertain. Moreover, it is impossible to forecast with precision the market value of portfolio securities at the expiration of a forward foreign currency contract. Accordingly, a Fund may be required to buy or sell additional currency on the spot market (and bear the expense of such transaction) if the Sub-Advisor’s predictions regarding the movement of foreign currency or securities markets prove inaccurate. Because foreign currency forward contracts are privately negotiated transactions, there can be no assurance that a Fund will have flexibility to roll-over a forward foreign currency contract upon its expiration if it desires to do so. Additionally, there can be no assurance that the other party to the contract will perform its services thereunder.
Futures Contracts and Options on Futures Contracts. Futures contracts provide for the future sale by one party and purchase by another party of a specified amount of a specific security at a specified future time and at a specified price. An option on a futures contract gives the purchaser the right, in exchange for a premium, to assume a position in a futures contract at a specified exercise price during the term of the option. A Fund may use futures contracts and related options for bona fide hedging purposes, to offset changes in the value of securities held or expected to be acquired or be disposed of, to minimize fluctuations in foreign currencies, or to gain exposure to a particular market or instrument. Some strategies reduce a Fund’s exposure to price fluctuations, while others tend to increase its exposure. A Fund will minimize the risk that it will be unable to close out a futures contract by only entering into futures contracts which are traded on national futures exchanges. In addition, a Fund will only sell covered futures contracts and options on futures contracts.
Stock and bond index futures are futures contracts for various stock and bond indices that are traded on registered securities exchanges. Stock and bond index futures contracts obligate the seller to deliver (and the purchaser to take) an amount of cash equal to a specific dollar amount times the difference between the value of a specific stock or bond index at the close of the last trading day of the contract and the price at which the agreement is made.
Stock and bond index futures contracts are bilateral agreements pursuant to which two parties agree to take or make delivery of an amount of cash equal to a specified dollar amount times the difference between the stock or bond index value at the close of trading of the contract and the price at which the futures contract is originally struck. No physical delivery of the stocks or bonds comprising the index is made; generally contracts are closed out prior to the expiration date of the contracts.
No price is paid upon entering into futures contracts. Instead, a Fund would be required to deposit an amount of cash or U.S. Treasury securities known as “initial margin.” Subsequent payments, called “variation margin,” to and from the broker, would be made on a daily basis as the value of the futures position varies (a process known as “marking to market”). The margin is in the nature of a performance bond or good-faith deposit on a futures contract.
There are risks associated with these activities, including the following: (1) the success of a hedging strategy may depend on an ability to predict movements in the prices of individual securities, fluctuations in markets and movements in interest rates; (2) there may be an imperfect or no correlation between the changes in market value of the securities held by a Fund and the prices of futures and options on futures; (3) there may not be a liquid secondary market for a futures contract or option; (4) trading restrictions or limitations may be imposed by an exchange; and (5) government regulations may restrict trading in futures contracts and futures options.
A Fund may buy and sell futures contracts and related options to manage its exposure to changing interest rates and securities prices. Some strategies reduce a Fund’s exposure to price fluctuations, while others tend to increase its market exposure. Futures and options on futures can be volatile instruments and involve certain risks that could negatively impact a Fund’s return. When a Fund purchases or sells a futures contract, or sells an option thereon, the Fund is required to “cover” its position in order to limit the risk associated with the use of leverage and other related risks. To cover its position, the Fund may maintain with its custodian bank (and marked-to-market on a daily basis), a segregated account consisting of cash or liquid securities that, when added to any amounts deposited with a futures commission merchant as margin, are equal to the market value of the futures contract or otherwise “cover” its position in a manner consistent with the 1940 Act or the rules and interpretations of the staff of the Securities and Exchange Commission (“SEC”) thereunder. If the Fund continues to engage in the described investment techniques and properly covers its investment in the manner described above, the segregated account or other form of coverage will function as a practical limit on the amount of leverage which the Fund may undertake and on the potential increase in the speculative character of the Fund’s outstanding investments. Additionally, such coverage will generally assure the availability of adequate funds to meet the obligations of the Fund arising from such investment activities.
Each Fund, other than the Total Return Bond Fund, may invest in futures contracts and options on futures contracts.
Government Pass-Through Securities. Government pass-through securities are securities that are issued or guaranteed by a U.S. government agency representing an interest in a pool of mortgage loans. The primary issuers or guarantors of these mortgage-backed securities are the Government National Mortgage Association (GNMA) (“Ginnie Mae”), the Federal National Mortgage Association (FNMA) (“Fannie Mae”) and Freddie Mac. Ginnie Mae, Fannie Mae and Freddie Mac guarantee timely distributions of interest to certificate holders. Ginnie Mae and Fannie Mae also guarantee timely distributions of scheduled principal. Freddie Mac generally guarantees only the ultimate collection of principal of the underlying mortgage loan. Certain federal agencies, such as Ginnie Mae, have been established as instrumentalities of the United States government to supervise and finance certain types of activities. Issues of these agencies, while not direct obligations of the United States government, are either backed by the full faith and credit of the United States (e.g., Ginnie Mae securities) or supported by the issuing agencies’ right to borrow from the U.S. Treasury. The issues of other agencies are supported by the credit of the instrumentality (e.g., Fannie Mae securities). Government and private guarantees do not extend to the securities’ value, which is likely to vary inversely with fluctuations in interest rates.
There are a number of important differences among the agencies and instrumentalities of the U.S. government that issue mortgage-backed securities and among the securities that they issue. Mortgage-related securities issued by Ginnie Mae include GNMA Mortgage Pass-Through Certificates (also known as “Ginnie Mae Pass-Throughs”), which are guaranteed as to the timely payment of principal and interest by Ginnie Mae and such guarantee is backed by the full faith and credit of the U.S. Government. Ginnie Mae Pass-Throughs are created by an “issuer,” which is a Federal Housing Administration (“FHA”) approved mortgagee that also meets criteria imposed by Ginnie Mae. The issuer assembles a pool of FHA, Farmers’ Home Administration or Veterans’ Administration (“VA”) insured or guaranteed mortgages which are homogeneous as to interest rate, maturity and type of dwelling. Upon application by the issuer, and after approval by Ginnie Mae of the pool, Ginnie Mae provides its commitment to guarantee timely payment of principal and interest on the Ginnie Mae Pass-Throughs backed by the mortgages included in the pool. The Ginnie Mae Pass-Throughs, endorsed by Ginnie Mae, then are sold by the issuer through securities dealers. Ginnie Mae Pass-Throughs bear a stated “coupon rate” which represents the effective FHA-VA mortgage rate at the time of issuance, less fees from Ginnie Mae and the issuer. Ginnie Mae is authorized under the National Housing Act to guarantee timely payment of principal
and interest on Ginnie Mae Pass-Throughs. This guarantee is backed by the full faith and credit of the U.S. government. Ginnie Mae may borrow U.S. Treasury funds to the extent needed to make payments under its guarantee. When mortgages in the pool underlying a Ginnie Mae Pass-Through are prepaid by mortgagors or by result of foreclosure, such principal payments are passed through to the certificate holders. Accordingly, the life of the Ginnie Mae Pass-Through is likely to be substantially shorter than the stated maturity of the mortgages in the underlying pool. Because of such variation in prepayment rates, it is not possible to predict the life of a particular Ginnie Mae Pass-Through. Payments to holders of Ginnie Mae Pass-Throughs consist of the monthly distributions of interest and principal less fees from Ginnie Mae and the issuer. The actual yield to be earned by a holder of a Ginnie Mae Pass-Through is calculated by dividing interest payments by the purchase price paid for the Ginnie Mae Pass-Through (which may be at a premium or a discount from the face value of the certificate). Monthly distributions of interest, as contrasted to semi-annual distributions which are common for other fixed interest investments, have the effect of compounding and thereby raising the effective annual yield earned on Ginnie Mae Pass-Throughs.
Mortgage-related securities issued by Fannie Mae include Fannie Mae Guaranteed Mortgage Pass-Through Certificates (also known as “Fannie Mae Pass-Throughs”) that are solely the obligations of Fannie Mae and are not backed by or entitled to the full faith and credit of the United States. Fannie Mae Pass-Throughs are guaranteed as to timely payment of the principal and interest by Fannie Mae.
Mortgage-related securities issued by Freddie Mac include FHLMC Mortgage Participation Certificates (also known as “Freddie Mac PCs”). Freddie Mac PCs are not guaranteed by the United States or by any Federal Home Loan Banks and do not constitute a debt or obligation of the United States or of any Federal Home Loan Bank. Freddie Macs entitle the holder to timely payment of interest, which is guaranteed by Freddie Mac. Freddie Mac guarantees either ultimate collection or timely payment of all principal payments on the underlying mortgage loans. When Freddie Mac does not guarantee timely payment of principal, Freddie Mac may remit the amount due on account of its guarantee of ultimate payment of principal at any time after default on an underlying mortgage, but in no event later than one year after it becomes payable.
Illiquid Securities. Subject to the limitations in the 1940 Act and the rules and interpretations of the staff of the SEC thereunder, the Funds may invest in illiquid securities. Illiquid securities are securities that cannot be disposed of within seven business days at approximately the price at which they are being carried on a Fund’s books.
Illiquid securities include demand instruments with demand notice periods exceeding seven days, securities for which there is no active secondary market, and repurchase agreements with maturities of over seven days in length. The Funds may invest in securities that are neither listed on a stock exchange nor traded over-the-counter, including privately placed securities. Investing in unlisted securities, including investments in new and early stage companies, may involve a high degree of business and financial risk that can result in substantial losses. As a result of the absence of a public trading market for these securities, they may be less liquid than publicly traded securities. Because these types of securities are thinly traded, if at all, and market prices for these types of securities are generally not readily available, the Fund typically determines the price for these types of securities in good faith in accordance with policies and procedures adopted by the Board. Although these securities may be resold in privately negotiated transactions, the prices realized from these sales could be less than those originally paid by a Fund, or less than what may be considered the fair value of such securities. Further, companies whose securities are not publicly traded may not be subject to the disclosure and other investor protection requirements which might be applicable if their securities were publicly traded. If such securities are required to be registered under the securities laws of one or more jurisdictions before being resold, a Fund may be required to bear the expenses of registration.
In addition, the Funds believe that certain investments in joint ventures, cooperatives, partnerships, private placements, unlisted securities and other similar situations (collectively, “special situations”) could enhance the Funds’ capital appreciation potential. To the extent these investments are deemed illiquid, the Funds’ investment in them will be consistent with their applicable restriction on investment in illiquid securities. Investments in special situations and certain other instruments may be liquid, as determined by the Funds’ Advisor or sub-advisors based on criteria approved by the Board.
Inflation-Indexed Bonds. The Active Bond Fund may invest in inflation-indexed bonds, which are fixed-income securities whose return is periodically adjusted according to the rate of inflation as indicated by the Consumer Price Index (“CPI”). Inflation-indexed bonds may be issued by the U.S. government and agencies or instrumentalities of the U.S. government and by corporations. There are two common accrual structures for inflation-indexed bonds. The U.S. Treasury and some other issuers use a structure that accrues inflation into the principal value of the bond. Most other issuers pay out the CPI accruals as part of a semiannual coupon.
Inflation-indexed securities are issued with various maturities. The securities issued by the U.S. Treasury, called Treasury Inflation Protected Securities, or “TIPS”, pay interest on a semiannual basis, equal to a fixed percentage of the inflation-adjusted principal amount. For example, if the Fund purchased an inflation-indexed bond with a par value of $1,000 and a 3% real rate of return
coupon (payable 1.5% semiannually), and inflation over the first six months were 1%, the mid-year par value of the bond would be $1,010 and the first semiannual interest payment would be $15.15 ($1,010 times 1.5%). If inflation during the second half of the year reached 3%, the end-of-year par value of the bond would be $1,030 and the second semiannual interest payment would be $15.45 ($1,030 times 1.5%).
If the periodic adjustment rate measuring inflation falls, the principal value of inflation-indexed bonds will be adjusted downward, and consequently the interest payable on these securities (calculated with respect to a smaller principal amount) will be reduced. Repayment of the original bond principal upon maturity (as adjusted for inflation) is guaranteed in the case of U.S. Treasury inflation-indexed bonds, even during a period of deflation. However, the current market value of the bonds is not guaranteed, and will fluctuate. The Fund may also invest in other inflation related bonds, which may or may not provide a similar guarantee. If a guarantee of principal is not provided, the adjusted principal value of the bond repaid at maturity may be less than the original principal.
The value of inflation-indexed bonds is expected to change in response to changes in real interest rates. Real interest rates in turn are tied to the relationship between nominal interest rates and the rate of inflation. Therefore, if inflation were to rise at a faster rate than nominal interest rates, real interest rates might decline, leading to an increase in value of inflation-indexed bonds. In contrast, if nominal interest rates increased at a faster rate than inflation, real interest rates might rise, leading to a decrease in value of inflation-indexed bonds.
While these securities are expected to be protected from long-term inflationary trends, short-term increases in inflation may lead to a decline in value. If interest rates rise due to reasons other than inflation, investors in these securities may not be protected to the extent that the increase is not reflected in the bond’s inflation measure.
The periodic adjustment of U.S. inflation-indexed bonds is tied to the Consumer Price Index for Urban Consumers (“CPI-U”), which is calculated monthly by the U.S. Bureau of Labor Statistics. The CPI-U is a measurement of changes in the cost of living, made up of components such as housing, food, transportation and energy.
Any increase in the principal amount of an inflation-indexed bond will be considered taxable ordinary income, even though investors do not receive their principal until maturity.
Initial Public Offerings (“IPOs”). Due to the typically small size of the IPO allocation available to the Funds and the nature and market capitalization of the companies involved in IPOs, the sub-advisors will often purchase IPO shares that would qualify as a permissible investment for a Fund but will instead decide to allocate those IPO purchases to other funds they advise. Any such allocation will be done in a fair and equitable manner according to a specific and consistent process. Because IPO shares frequently are volatile in price, a Fund may hold IPO shares for a very short period of time. This may increase the turnover of a Fund’s portfolio and may lead to increased expenses to a Fund, such as commissions and transaction costs. By selling shares of an IPO, a Fund may realize taxable capital gains that it will subsequently distribute to shareholders.
Most IPOs involve a high degree of risk not normally associated with offerings of more seasoned companies. Companies involved in IPOs generally have limited operating histories, and their prospects for future profitability are uncertain. These companies often are engaged in new and evolving businesses and are particularly vulnerable to competition and to changes in technology, markets and economic conditions. They may be dependent on certain key managers and third parties, need more personnel and other resources to manage growth and require significant additional capital. They may also be dependent on limited product lines and uncertain property rights and need regulatory approvals. Investors in IPOs can be affected by substantial dilution in the value of their shares, by sales of additional shares and by concentration of control in existing management and principal shareholders. Stock prices of IPOs can also be highly unstable, due to the absence of a prior public market, the small number of shares available for trading and limited investor information.
Investment Company Shares. Investment companies include open- and closed-end funds, ETFs, and any other pooled investment vehicle that meets the definition of an investment company under the 1940 Act, whether such companies are required to register under the 1940 Act or not. These investment companies typically incur fees that are separate from those fees incurred directly by a Fund. A Fund’s purchase of such investment company securities results in the layering of expenses, such that shareholders would indirectly bear a proportionate share of the operating expenses of such investment companies, including advisory fees, in addition to paying Fund expenses. Investments in registered investment company shares are subject to limitations prescribed by the 1940 Act and its rules, and applicable SEC staff interpretations or applicable exemptive relief granted by the SEC. The 1940 Act currently provides, in part, that a Fund generally may not purchase shares of a registered investment company if (a) such a purchase would cause a Fund to own in the aggregate more than 3% of the total outstanding voting stock of the investment company or (b) such a purchase would cause a Fund to have more than 5% of its total assets invested in the investment company or (c) more than 10%
of a Fund’s total assets would be invested in the aggregate in all registered investment companies. See also “Investment Limitations” and “Exchange-Traded Funds.”
Leveraging. Leveraging a Fund through borrowing or other means (e.g., certain uses of derivatives) creates an opportunity for increased net income, but, at the same time, creates special risk considerations. For example, leveraging may exaggerate changes in the NAV of a Fund’s shares and in the yield on the Fund’s portfolio. Although the principal amount of such borrowings will be fixed, a Fund’s assets may change in value during the time the borrowing is outstanding. Leveraging creates interest expenses for a Fund which could exceed the income from the assets retained. To the extent the income derived from securities purchased with borrowed funds exceeds the interest that a Fund will have to pay, the Fund’s net income will be greater than if leveraging were not used. Conversely, if the income from the assets retained with borrowed funds is not sufficient to cover the cost of leveraging, the net income of a Fund will be less than if leveraging were not used, and therefore the amount available for distribution to shareholders as dividends will be reduced.
Because the SEC staff believes that, among other transactions, reverse repurchase agreements and dollar roll transactions are collateralized borrowings, the SEC staff believes that they create leverage. The requirement that such transactions be fully collateralized by assets segregated by the Funds’ custodian or otherwise subject to “covering” techniques imposes a practical limit on the leverage these transactions create.
Loan Participations. The Active Bond Fund may invest, subject to an overall 33% limit on loans, in loan participations, typically made by a syndicate of banks to U.S. and non-U.S. corporate or governmental borrowers for a variety of purposes. The underlying loans may be secured or unsecured, and will vary in term and legal structure. When purchasing such instruments, the Fund may assume the credit risks associated with the original bank lender as well as the credit risks associated with the borrower. Investments in loan participations present the possibility that the Fund could be held liable as a co-lender under emerging legal theories of lender liability. In addition, if the loan is foreclosed, the Fund could be part owner of any collateral, and could bear the costs and liabilities of owning and disposing of the collateral. Loan participations are generally not rated by major rating agencies and may not be protected by securities laws. Also, loan participations are generally considered to be illiquid and are therefore subject to the Fund’s overall 15% limitation on illiquid securities.
Lower-Rated and Unrated Securities. The Funds may invest in higher yielding (and, therefore, higher risk), lower-rated fixed-income securities, including non-investment-grade securities, or “junk bonds,” and unrated securities. Securities rated in the fourth highest category by S&P or Moody’s, BBB and Baa, respectively, although considered investment grade, may possess speculative characteristics, and changes in economic or other conditions are more likely to impair the ability of issuers of these securities to make interest and principal payments than is the case with respect to issuers of higher grade bonds.
Generally, medium or lower-rated securities and unrated securities of comparable quality, sometimes referred to as “junk bonds,” offer a higher current yield than is offered by higher rated securities, but also (i) will likely have some quality and protective characteristics that, in the judgment of the rating organizations, are outweighed by large uncertainties or major risk exposures to adverse conditions and (ii) are predominantly speculative with respect to the issuer’s capacity to pay interest and repay principal in accordance with the terms of the obligation. The yield of junk bonds will fluctuate over time.
The market values of certain of these securities also tend to be more sensitive to individual corporate developments and changes in economic conditions than higher quality bonds. In addition, medium and lower-rated securities and comparable unrated securities generally present a higher degree of credit risk. The risk of loss due to default by these issuers is significantly greater because medium and lower-rated securities and unrated securities of comparable quality generally are unsecured and frequently are subordinated to the prior payment of senior indebtedness. Since the risk of default is higher for lower-rated debt securities, the Sub-Advisor’s research and credit analysis are an especially important part of managing securities of this type held by a Fund. In light of these risks, the Sub-Advisor, in evaluating the creditworthiness of an issue, whether rated or unrated, will take various factors into consideration, which may include, as applicable, the issuer’s financial resources, its sensitivity to economic conditions and trends, the operating history of and the community support for the facility financed by the issue, the ability of the issuer’s management and regulatory matters.
In addition, the market value of securities in lower-rated categories is more volatile than that of higher quality securities, and the markets in which medium and lower-rated or unrated securities are traded are more limited than those in which higher rated securities are traded. The existence of limited markets may make it more difficult for the Funds to obtain accurate market quotations for purposes of valuing their respective portfolios and calculating their respective NAVs. Moreover, the lack of a liquid trading market may restrict the availability of securities for the Funds to purchase and may also have the effect of limiting the ability of a Fund to sell securities at their fair value either to meet redemption requests or to respond to changes in the economy or the financial markets.
Lower-rated debt obligations also present risks based on payment expectations. If an issuer calls the obligation for redemption, a Fund may have to replace the security with a lower yielding security, resulting in a decreased return for shareholders. Also, as the principal value of bonds moves inversely with movements in interest rates, in the event of rising interest rates the value of lower-rated securities held by a Fund may decline relatively proportionately more than a portfolio consisting of higher rated securities. If a Fund experiences unexpected net redemptions, it may be forced to sell its higher rated bonds, resulting in a decline in the overall credit quality of the securities held by the Fund and increasing the exposure of the Fund to the risks of lower-rated securities.
Subsequent to its purchase by a Fund, a security may cease to be rated or its rating may be reduced. Neither event will require sale of the security by the Fund, but the Sub-Advisor will consider this event in its determination of whether the Fund should continue to hold the security.
The market for lower-rated debt securities may be thinner and less active than that for higher-rated debt securities, which can adversely affect the prices at which the former are sold. If market quotations are not available, lower-rated debt securities will be valued in accordance with procedures established by the Board, including the use of outside pricing services. Judgment plays a greater role in valuing high yield corporate debt securities than is the case for securities for which more external sources for quotations and last sale information is available. Adverse publicity and changing investor perception may affect the ability of outside pricing services to value lower-rated debt securities and the ability of holders of such securities to dispose of them.
In considering investments for a Fund, the Sub-Advisor will attempt to identify those issuers of high yielding debt securities whose financial condition is adequate to meet future obligations, has improved or is expected to improve in the future. The Sub-Advisor’s analysis focuses on relative values based on such factors as interest or dividend coverage, asset coverage, earnings prospects and the experience and managerial strength of the issuer.
A Fund may choose, at its expense or in conjunction with others, to pursue litigation or otherwise exercise its rights as a security holder to seek to protect the interest of security holders if it determines this to be in the best interest of the Fund.
Market Disruption. During periods of extreme market volatility, prices of securities held by the Funds may be negatively impacted due to imbalances between market participants seeking to sell the same or similar securities and market participants willing or able to buy such securities. As a result, the market prices of securities held by the Funds could go down, at times without regard to the financial condition of or specific events impacting the issuer of the security.
Instability in financial markets has in the past led governments to take a number of unprecedented actions designed to support certain financial institutions and segments of the financial markets that have experienced extreme volatility, and in some cases a lack of liquidity. Federal, state, and other governments, their regulatory agencies, or self-regulatory organizations may take actions that affect the regulation of the instruments in which the Fund invests, or the issuers of such instruments, in ways that are unforeseeable. Legislation or regulation may also change the way in which the Funds themselves are regulated. Such legislation or regulation could limit or preclude the Funds’ ability to achieve their investment goals.
Master Limited Partnerships (“MLPs”). MLPs are limited partnerships in which the ownership units are publicly traded. MLP units are registered with the SEC and are freely traded on a securities exchange or in the over-the-counter market. MLPs often own several properties or businesses (or own interests) that are related to oil and gas industries, but they also may finance research and development and other projects. Generally, an MLP is operated under the supervision of one or more managing general partners. Limited partners (like the Fund that invests in a MLP) are not involved in the day-to-day management of the partnership. They are allocated income and capital gains associated with the partnership project in accordance with the terms established in the partnership agreement. Generally speaking, MLP investment returns are enhanced during periods of declining/low interest rates and tend to be negatively influenced when interest rates are rising. As an income vehicle, the unit price can be influenced by general interest rate trends independent of specific underlying fundamentals. In addition, most MLPs are leveraged and typically carry a portion of “floating” rate debt. As such, a significant upward swing in interest rates would also drive interest expense higher. Furthermore, most MLPs grow by acquisitions partly financed by debt, and higher interest rates could make it more difficult to transact accretive acquisitions. To the extent that an MLP’s interests are all in a particular industry, the MLP will, accordingly, be negatively impacted by economic events impacting that industry. For instance, a decline in commodity prices may negatively affect the business and market value of an MLP that owns assets related to the oil and gas industries. The risks of investing in an MLP typically more closely resemble those involved in investing in a partnership as opposed to a corporation. For example, state law governing partnerships is often less restrictive than state law governing corporations. Accordingly, there may be fewer protections afforded to investors in an MLP than investors in a corporation. In addition, MLPs may be subject to state taxation in certain jurisdictions which will have the effect of reducing the amount of income paid by the MLP to its investors. An MLP may be taxed as a corporation, contrary to its intention to be taxed as a partnership, resulting in decreased returns to the Fund invested in the MLP. A Fund’s investment in an MLP may generate unrelated business taxable income (“UBTI”) to tax-exempt
shareholders of the Fund. Tax-exempt shareholders are urged and advised to consult their own tax advisors to determine the impact on them of a Fund’s investment in an MLP.
Micro-Cap Securities. The Funds may invest in companies whose total market capitalization at the time of investment is generally between $30 million and $500 million, referred to as micro-cap companies. Micro-cap companies may not be well-known to the investing public, may not have significant institutional ownership and may have cyclical, static or only moderate growth prospects. Micro-cap companies may have greater risk and volatility than large companies and may lack the management depth of larger, mature issuers. Micro-cap companies may have relatively small revenues and limited product lines, markets, or financial resources, and their securities may trade less frequently and in more limited volume than those of larger, more mature companies. In addition, micro-cap companies may be developing or marketing new products or services for which markets are not yet established and may never become established. As a result, the prices of their securities may fluctuate more than those of larger issuers.
Mortgage-Related and Other Asset-Backed Securities. Each Fund may invest in mortgage-related securities. Mortgage-related securities represent groups of mortgage loans that are combined for sale to investors. The loans may be grouped together by U.S. government agencies and sponsored entities, such as Ginnie Mae, Fannie Mae and Freddie Mac. The loans may also be grouped together by private issuers such as: commercial banks; savings and loan institutions; mortgage bankers; and private mortgage insurance companies. Mortgage-related securities include CMOs and Real Estate Mortgage Investment Conduits (“REMICs”).
Interests in pools of mortgage-related securities differ from other forms of debt securities, which normally provide for periodic payment of interest in fixed amounts with principal payments at maturity or specified call dates. Instead, these securities provide a monthly payment which consists of both interest and principal payments. In effect, these payments are a “pass-through” of the monthly payments made by the individual borrowers on their residential or commercial mortgage loans, net of any fees paid to the issuer or guarantor of such securities. Additional payments are caused by repayments of principal resulting from the sale of the underlying property, refinancing or foreclosure, net of fees or costs which may be incurred. Some mortgage-related securities are described as “modified pass-through.” These securities entitle the holder to receive all interest and principal payments owed on the mortgage pool, net of certain fees, at the scheduled payment dates regardless of whether or not the mortgagor actually makes the payment.
There are several risks associated with mortgage-related securities generally. One is that the monthly cash inflow from the underlying loans may not be sufficient to meet the monthly payment requirements of the mortgage-related security. Another is prepayment of principal by mortgagors or mortgage foreclosures.
The rate of prepayments on underlying mortgages will affect the price and volatility of a mortgage-related security, and may have the effect of shortening or extending the effective duration of the security relative to what was anticipated at the time of purchase. To the extent that unanticipated rates of prepayment on underlying mortgages increase the effective duration of a mortgage-related security, the volatility of such security can be expected to increase. But prepayment may also shorten the term of the underlying mortgage pool for a mortgage-related security. Early returns of principal will affect the average life of the mortgage-related securities remaining in a Fund. The occurrence of mortgage prepayments is affected by factors including the level of interest rates, general economic conditions, the location and age of the mortgage and other social and demographic conditions. In periods of rising interest rates, the rate of prepayment tends to decrease, thereby lengthening the average life of a pool of mortgage-related securities. Conversely, in periods of falling interest rates the rate of prepayment tends to increase, thereby shortening the average life of a pool. Reinvestment of prepayments may occur at higher or lower interest rates than the original investment, thus affecting the yield of a Fund. Because prepayments of principal generally occur when interest rates are declining, it is likely that a Fund will have to reinvest the proceeds of prepayments at lower interest rates than those at which the assets were previously invested. If this occurs, a Fund’s yield will correspondingly decline. Thus, mortgage-related securities may have less potential for capital appreciation in periods of falling interest rates than other fixed-income securities of comparable maturity, although these securities may have a comparable risk of decline in market value in periods of rising interest rates. To the extent that a Fund purchases mortgage-related securities at a premium, unscheduled prepayments, which are made at par, will result in a loss equal to any unamortized premium.
Finally, mortgage-related securities may also be subject to liquidity risks due to tightening markets. Delinquencies and losses on residential mortgage loans (especially subprime and second-lien mortgage loans) and a decline in or flattening of housing values may exacerbate such delinquencies and losses. Borrowers with adjustable rate mortgage loans are more sensitive to changes in interest rates, which affect their monthly mortgage payments, and may be unable to secure replacement mortgages at comparably low interest rates. Also, residential mortgage loan originators may experience serious financial difficulties or bankruptcy during tighter markets. In summary, reduced investor demand for mortgage loans and mortgage-related securities and increased investor yield requirements may limit liquidity in the secondary market for mortgage-related securities, which can adversely affect the market value of mortgage-related securities.
Asset-Backed Securities (“ABS”). ABS are secured by non-mortgage assets such as company receivables, truck and auto loans, leases and credit card receivables. Such securities are generally issued as pass-through certificates, which represent undivided fractional ownership interests in the underlying pools of assets. Such securities also may be debt instruments, which are also known as collateralized loan obligations and are generally issued as the debt of a special purpose entity, such as a trust, organized solely for the purpose of owning such assets and issuing such debt. Covered bonds are a type of asset backed security that is created from public sector loans or mortgage loans where the security is backed by a separate group of loans. Covered bonds typically carry a 2 to 10 year maturity rate and enjoy relatively high credit ratings, depending on the quality of the pool of loans backing the bond.
The credit quality of an ABS transaction depends on the performance of the underlying assets. ABS can be structured with various forms of credit enhancement to address the possibility that some borrowers could miss payments or even default on their loans. Some ABS are subject to interest-rate risk and prepayment risk. A change in interest rates can affect the pace of payments on the underlying loans, which in turn, affects total return on the securities. ABS also carry credit or default risk. If many borrowers on the underlying loans default, losses could exceed the credit enhancement level and result in losses to investors in an ABS transaction. Finally, ABS have structure risk due to a unique characteristic known as early amortization, or early payout, risk. Built into the structure of most ABS are triggers for early payout, designed to protect investors from losses. These triggers are unique to each transaction and can include: a big rise in defaults on the underlying loans, a sharp drop in the credit enhancement level, or even the bankruptcy of the originator. Once early amortization begins, all incoming loan payments (after expenses are paid) are used to pay investors as quickly as possible based upon a predetermined priority of payment.
Mortgage Pass-Through Securities. Interests in pools of mortgage-related securities differ from other forms of debt securities, which normally provide for periodic payment of interest in fixed amounts with principal payments at maturity or specified call dates. Instead, these securities provide a monthly payment which consists of both interest and principal payments. In effect, these payments are a “pass-through” of the monthly payments made by the individual borrowers on their residential or commercial mortgage loans, net of any fees paid to the issuer or guarantor of such securities. Additional payments are caused by repayments of principal resulting from the sale of the underlying property, refinancing or foreclosure, net of fees or costs which may be incurred. Some mortgage-related securities (such as securities issued by Government National Mortgage Association (GNMA) (“Ginnie Mae”)) are described as “modified pass-through.” These securities entitle the holder to receive all interest and principal payments owed on the mortgage pool, net of certain fees, at the scheduled payment dates regardless of whether or not the mortgagor actually makes the payment.
Government Pass-Through Securities. Government pass-through securities are securities that are issued or guaranteed by a U.S. government agency representing an interest in a pool of mortgage loans. The primary issuers or guarantors of these mortgage-backed securities are Ginnie Mae, Federal National Mortgage Association (FNMA) (“Fannie Mae”) and Federal Home Loan Mortgage Corporation (FHLMC) (“Freddie Mac”). Ginnie Mae, Fannie Mae and Freddie Mac guarantee timely distributions of interest to certificate holders. Ginnie Mae and Fannie Mae also guarantee timely distributions of scheduled principal. Freddie Mac generally guarantees only the ultimate collection of principal of the underlying mortgage loan. Certain federal agencies, such as Ginnie Mae, have been established as instrumentalities of the United States government to supervise and finance certain types of activities. Issues of these agencies, while not direct obligations of the United States government, are either backed by the full faith and credit of the United States (e.g., Ginnie Mae securities) or supported by the issuing agencies’ right to borrow from the U.S. Treasury. The issues of other agencies are supported by the credit of the instrumentality (e.g., Fannie Mae securities). Government and private guarantees do not extend to the securities’ value, which is likely to vary inversely with fluctuations in interest rates.
There are a number of important differences among the agencies and instrumentalities of the U.S. government that issue mortgage-backed securities and among the securities that they issue. Mortgage-related securities issued by Ginnie Mae include GNMA Mortgage Pass-Through Certificates (also known as “Ginnie Mae Pass-Throughs”) which are guaranteed as to the timely payment of principal and interest by Ginnie Mae and such guarantee is backed by the full faith and credit of the U.S. Government. Ginnie Mae Pass-Throughs are created by an “issuer,” which is a Federal Housing Administration (“FHA”) approved mortgagee that also meets criteria imposed by Ginnie Mae. The issuer assembles a pool of FHA, Farmers’ Home Administration or Veterans’ Administration (“VA”) insured or guaranteed mortgages which are homogeneous as to interest rate, maturity and type of dwelling. Upon application by the issuer, and after approval by Ginnie Mae of the pool, Ginnie Mae provides its commitment to guarantee timely payment of principal and interest on the Ginnie Mae Pass-Throughs backed by the mortgages included in the pool. The Ginnie Mae Pass-Throughs, endorsed by Ginnie Mae, then are sold by the issuer through securities dealers. Ginnie Mae Pass-Throughs bear a stated “coupon rate” which represents the effective FHA-VA mortgage rate at the time of issuance, less fees from Ginnie Mae and the issuer. Ginnie Mae is authorized under the National Housing Act to guarantee timely payment of principal and interest on Ginnie Mae Pass-Throughs. This guarantee is backed by the full faith and credit of the U.S. Government. Ginnie Mae may borrow Treasury funds to the extent needed to make payments under its guarantee. When mortgages in the pool underlying a Ginnie Mae Pass-Through are prepaid by mortgagors or by result of foreclosure, such principal payments are passed through to
the certificate holders. Accordingly, the life of the Ginnie Mae Pass-Through is likely to be substantially shorter than the stated maturity of the mortgages in the underlying pool. Because of such variation in prepayment rates, it is not possible to predict the life of a particular Ginnie Mae Pass-Through. Payments to holders of Ginnie Mae Pass-Throughs consist of the monthly distributions of interest and principal less the fees of Ginnie Mae and the issuer. The actual yield to be earned by a holder of a Ginnie Mae Pass-Through is calculated by dividing interest payments by the purchase price paid for the Ginnie Mae Pass-Through (which may be at a premium or a discount from the face value of the certificate). Monthly distributions of interest, as contrasted to semi-annual distributions which are common for other fixed interest investments, have the effect of compounding and thereby raising the effective annual yield earned on Ginnie Mae Pass-Throughs.
Mortgage-related securities issued by Fannie Mae include Fannie Mae Guaranteed Mortgage Pass-Through Certificates (also known as “Fannie Mae Pass-Throughs”) that are solely the obligations of Fannie Mae and are not backed by or entitled to the full faith and credit of the United States. Fannie Mae Pass-Throughs are guaranteed as to timely payment of the principal and interest by Fannie Mae.
Mortgage-related securities issued by Freddie Mac include FHLMC Mortgage Participation Certificates (also known as “Freddie Mac PCs”). Freddie Mac PCs are not guaranteed by the United States or by any Federal Home Loan Banks and do not constitute a debt or obligation of the United States or of any Federal Home Loan Bank. Freddie Mac PCs entitle the holder to timely payment of interest, which is guaranteed by Freddie Mac. Freddie Mac guarantees either ultimate collection or timely payment of all principal payments on the underlying mortgage loans. When Freddie Mac does not guarantee timely payment of principal, Freddie Mac may remit the amount due on account of its guarantee of ultimate payment of principal at any time after default on an underlying mortgage, but in no event later than one year after it becomes payable.
Real Estate Mortgage Investment Conduits (“REMICs”). REMICs are private entities formed for the purpose of holding a fixed pool of mortgages secured by interests in real property. For Freddie Mac REMIC certificates, Freddie Mac guarantees the timely payment of interest, and also guarantees the payment of principal as payments are required to be made on the underlying mortgage participation certificates. Fannie Mae REMIC certificates are issued and guaranteed as to timely distribution of principal and interest by Fannie Mae.
The Total Return Bond Fund may invest up to 25% of its net assets in REMICs.
Collateralized Mortgage Obligations (“CMOs”). A CMO is a debt obligation of a legal entity that is collateralized by mortgages and divided into classes. Similar to a bond, interest and prepaid principal is paid, in most cases, on a monthly basis. CMOs may be collateralized by whole mortgage loans or private mortgage bonds, but are more typically collateralized by portfolios of mortgage pass-through securities guaranteed by GNMA, Freddie Mac, or Fannie Mae, and their income streams.
CMOs are structured into multiple classes, often referred to as “tranches,” with each class bearing a different stated maturity and entitled to a different schedule for payments of principal and interest, including pre-payments. Actual maturity and average life will depend upon the pre-payment experience of the collateral. In the case of certain CMOs (known as “sequential pay” CMOs), payments of principal received from the pool of underlying mortgages, including pre-payments, are applied to the classes of CMOs in the order of their respective final distribution dates. Thus, no payment of principal will be made on any class of sequential pay CMOs until all other classes having an earlier final distribution date have been paid in full.
The Total Return Bond Fund may invest up to 25% of its net assets in CMOs.
Commercial Mortgage-Backed Securities (“CMBS”). CMBS are mortgage-backed securities that reflect an interest in, and are secured by, mortgage loans on commercial real property. The market for CMBS developed more recently and in terms of total outstanding principal amount of issues is relatively small compared to the market for residential single-family mortgage-backed securities. Many of the risks of investing in CMBS reflect the risks of investing in the real estate securing the underlying mortgage loans. These risks reflect the effects of local and other economic conditions on real estate markets, the ability of tenants to make loan payments, and the ability of a property to attract and retain tenants. CMBS may be less liquid and exhibit greater price volatility than other types of mortgage- or asset-backed securities.
Because CMBS are generally considered to be illiquid, they are subject to a Fund’s overall 15% limitation on illiquid securities. The Total Return Bond Fund may invest up to 15% of its net assets in CMBS.
Mortgage Dollar Rolls. Mortgage “dollar rolls” are transactions in which mortgage-backed securities are sold for delivery in the current month and the seller simultaneously contracts to repurchase substantially similar securities on a specified future date. The difference between the sale price and the purchase price (plus any interest earned on the cash proceeds of the sale) is netted against the interest income foregone on the securities sold to arrive at an implied borrowing rate. Alternatively, the sale and purchase
transactions can be executed at the same price, with a Fund being paid a fee as consideration for entering into the commitment to purchase. Mortgage dollar rolls may be renewed prior to cash settlement and initially may involve only a firm commitment agreement by a Fund to buy a security. If the broker-dealer to whom a Fund sells the security becomes insolvent, the Fund’s right to repurchase the security may be restricted. Other risks involved in entering into mortgage dollar rolls include the risk that the value of the security may change adversely over the term of the mortgage dollar roll and that the security a Fund is required to repurchase may be worth less than the security that the Fund originally held. A Fund will place U.S. government or other liquid securities in a segregated account in an amount sufficient to cover its repurchase obligation or otherwise “cover” its position in a manner consistent with the 1940 Act or the rules and SEC interpretations thereunder. The Total Return Bond Fund may invest up to 45% of its net assets in mortgage dollar rolls.
Stripped Mortgage-Backed Securities (“SMBS”). SMBS are derivative multi-class mortgage securities. SMBS may be issued by agencies or instrumentalities of the U.S. Government, or by private originators of, or investors in, mortgage loans, including savings and loan associations, mortgage banks, commercial banks, investment banks and special purpose entities of the foregoing. SMBS are usually structured with two classes that receive different proportions of the interest and principal distributions on a pool of mortgage assets. A common type of SMBS will have one class receiving some of the interest and most of the principal from the mortgage assets, while the other class will receive most of the interest and the remainder of the principal.
In the most extreme case, one class will receive all of the interest (the interest-only or “IO” class), while the other class will receive the entire principal (the principal-only or “PO” class). The yield to maturity on an IO class is extremely sensitive to the rate of principal payments (including pre-payments) on the related underlying mortgage assets, and a rapid rate of principal payments may have a material adverse effect on a Fund’s yield to maturity from these securities. If the assets underlying the interest-only securities experience greater than anticipated prepayments of principal, a Fund may fail to recoup fully its initial investment in these securities. Conversely, principal-only securities tend to increase in value if prepayments are greater than anticipated and decline if prepayments are slower than anticipated. The secondary market for SMBS may be more volatile and less liquid than that for other mortgage-backed securities, potentially limiting a Fund’s ability to buy or sell these securities at any particular time.
The Total Return Bond Fund may invest up to 5% of its net assets in interest-only SMBS and up to 5% of its net assets in principal-only SMBS.
Municipal Securities. The Active Bond Fund may invest in taxable and tax-exempt municipal securities. Municipal securities consist of (i) debt obligations issued by or on behalf of public authorities to obtain funds to be used for various public facilities, for refunding outstanding obligations, for general operating expenses, and for lending such funds to other public institutions and facilities; and (ii) certain private activity and industrial development bonds issued by or on behalf of public authorities to obtain funds to provide for the construction, equipment, repair, or improvement of privately operated facilities. Municipal notes include general obligation notes, tax anticipation notes, revenue anticipation notes, bond anticipation notes, certificates of indebtedness, demand notes and construction loan notes and participation interests in municipal notes. Municipal bonds include general obligation bonds, revenue or special obligation bonds, private activity and industrial development bonds, and participation interests in municipal bonds. General obligation bonds are backed by the taxing power of the issuing municipality. Revenue bonds are backed by the revenues of a project or facility. The payment of principal and interest on private activity and industrial development bonds generally is dependent solely on the ability of the facility’s user to meet its financial obligations and the pledge, if any, of real and personal property so financed as security for such payment. Yields on municipal securities are the product of a variety of factors, including the general conditions of the money market and of the municipal bond and municipal note markets, the size of a particular offering, the maturity of the obligation and the rating of the issue. Although the interest on municipal securities may be exempt from federal income tax, dividends paid by the Fund to its shareholders may not be tax-exempt.
Obligations of Supranational Entities. Obligations of supranational entities are obligations of entities established through the joint participation of several governments, such as the Asian Development Bank, the Inter-American Development Bank, International Bank of Reconstruction and Development (World Bank), African Development Bank, European Economic Community, European Investment Bank and the Nordic Investment Bank.
Options. A put option gives the purchaser of the option the right to sell, and the writer of the option the obligation to buy, the underlying security at any time during the option period. A call option gives the purchaser of the option the right to buy, and the writer of the option the obligation to sell, the underlying security at any time during the option period. The premium paid to the writer is the consideration for undertaking the obligations under the option contract. The initial purchase (sale) of an option contract is an “opening transaction.” In order to close out an option position, a Fund may enter into a “closing transaction,” which is simply the sale (purchase) of an option contract on the same security with the same exercise price and expiration date as the option contract originally opened. If a Fund is unable to effect a closing purchase transaction with respect to an option it has written, it will not be able to sell the underlying security until the option expires or the Fund delivers the security upon exercise.
A Fund may purchase put and call options to protect against a decline in the market value of the securities in its portfolio or to anticipate an increase in the market value of securities that the Fund may seek to purchase in the future. A Fund will pay a premium when purchasing put and call options. If price movements in the underlying securities are such that exercise of the options would not be profitable for a Fund, loss of the premium paid may be offset by an increase in the value of the Fund’s securities or by a decrease in the cost of acquisition of securities by the Fund.
A Fund may write both covered call and put options. A Fund may write covered call options as a means of increasing the yield on its portfolio and as a means of providing limited protection against decreases in its market value. When a Fund sells an option, if the underlying securities do not increase or decrease to a price level that would make the exercise of the option profitable to the holder thereof, the option generally will expire without being exercised and the Fund will realize as profit the premium received for such option. When a call option written by a Fund is exercised, the Fund will be required to sell the underlying securities to the option holder at the strike price, and will not participate in any increase in the price of such securities above the strike price. When a put option written by a Fund is exercised, the Fund will be required to purchase the underlying securities at the strike price, which may be in excess of the market value of such securities.
A Fund may purchase and write options on an exchange or over-the-counter. Over-the-counter options (“OTC options”) differ from exchange-traded options in several respects. They are transacted directly with dealers and not with a clearing corporation, and therefore entail the risk of non-performance by the dealer. OTC options are available for a greater variety of securities and for a wider range of expiration dates and exercise prices than are available for exchange-traded options. Because OTC options are not traded on an exchange, pricing is done normally by reference to information from a market maker. It is the position of the staff of the SEC that OTC options are generally illiquid.
A Fund may purchase and write put and call options on foreign currencies (traded on U.S. and foreign exchanges or over-the-counter markets) to manage its exposure to exchange rates. Call options on foreign currencies written by a Fund will be “covered,” which means that the Fund will own an equal amount of the underlying foreign currency. With respect to put options on foreign currency written by a Fund, the Fund will establish a segregated account with its custodian consisting of cash or liquid, high grade debt securities in an amount equal to the amount the Fund would be required to pay upon exercise of the put, earmark assets as cover, or otherwise “cover” its position in a manner consistent with the 1940 Act or the rules and SEC interpretations.
Buyers and sellers of foreign currency options are subject to the same risks that apply to options generally. There are certain additional risks associated with foreign currency options. The markets in foreign currency options are relatively new, and a Fund’s ability to establish and close out positions on such options is subject to the maintenance of a liquid secondary market. There can be no assurance that a liquid secondary market will exist for a particular option at any specific time. In addition, options on foreign currencies are affected by all of those factors that influence foreign exchange rates and investments generally.
The value of a foreign currency option depends upon the value of the underlying currency relative to the U.S. dollar. As a result, the price of the option position may vary with changes in the value of either or both currencies and may have no relationship to the investment merits of a foreign security. Because foreign currency transactions occurring in the interbank market involve substantially larger amounts than those that may be involved in the use of foreign currency options, investors may be disadvantaged by having to deal in an odd lot market (generally consisting of transactions of less than $1 million) for the underlying foreign currencies at prices that are less favorable than for round lots.
There is no systematic reporting of last sale information for foreign currencies or any regulatory requirement that quotations available through dealers or other market sources be firm or revised on a timely basis. Available quotation information is generally representative of very large transactions in the interbank market and thus may not reflect relatively smaller transactions (i.e., less than $1 million) where rates may be less favorable. The interbank market in foreign currencies is a global, around-the-clock market. To the extent that the U.S. option markets are closed while the markets for the underlying currencies remain open, significant price and rate movements may take place in the underlying markets that cannot be reflected in the options markets until they reopen.
A Fund may purchase and write put and call options on indices and enter into related closing transactions. Put and call options on indices are similar to options on securities except that options on an index give the holder the right to receive, upon exercise of the option, an amount of cash if the closing level of the underlying index is greater than (or less than, in the case of puts) the exercise price of the option. This amount of cash is equal to the difference between the closing price of the index and the exercise price of the option, expressed in dollars multiplied by a specified number. Thus, unlike options on individual securities, all settlements are in cash, and gain or loss depends on price movements in the particular market represented by the index generally, rather than the price movements in individual securities. A Fund may choose to terminate an option position by entering into a closing transaction. The ability of a Fund to enter into closing transactions depends upon the existence of a liquid secondary market for such transactions.
All options written on indices must be covered. When a Fund writes an option on an index, it will establish a segregated account containing cash or liquid securities with its custodian in an amount at least equal to the market value of the option and will maintain the account while the option is open or will otherwise cover the transaction.
A Fund will not engage in transactions involving interest rate futures contracts for speculation but only as a hedge against changes in the market values of debt securities held or intended to be purchased by the Fund and where the transactions are appropriate to reduce the Fund’s interest rate risks. There can be no assurance that hedging transactions will be successful. A Fund also could be exposed to risks if it cannot close out its futures or options positions because of any illiquid secondary market.
Futures and options have effective durations that, in general, are closely related to the effective duration of the securities that underlie them. Holding purchased futures or call option positions (backed by segregated cash or other liquid securities) will lengthen the duration of a Fund’s portfolio.
Risks associated with options transactions include: (1) the success of a hedging strategy may depend on an ability to predict movements in the prices of individual securities, fluctuations in markets and movements in interest rates; (2) there may be an imperfect correlation between the movement in prices of options and the securities underlying them; (3) there may not be a liquid secondary market for options; and (4) while a Fund will receive a premium when it writes covered call options, it may not participate fully in a rise in the market value of the underlying security.
The Total Return Bond Fund will not invest in options. The Emerging Markets Small Cap Fund and Mid Cap Value Fund may invest in options for hedging purposes only.
Caps, Collars and Floors. Caps and floors have an effect similar to buying or writing options. In a typical cap or floor agreement, one party agrees to make payments only under specified circumstances, usually in return for payment of a fee by the other party. For example, the buyer of an interest rate cap obtains the right to receive payments to the extent that a specified interest rate exceeds an agreed-upon level. The seller of an interest rate floor is obligated to make payments to the extent that a specified interest rate falls below an agreed-upon level. An interest rate collar combines elements of buying a cap and selling a floor.
Inverse Floaters. A Fund may invest in inverse floaters. Inverse floaters are derivative securities whose interest rates vary inversely to changes in short-term interest rates and whose values fluctuate inversely to changes in long-term interest rates. The value of certain inverse floaters will fluctuate substantially more in response to a given change in long-term rates than would a traditional debt security. These securities have investment characteristics similar to leverage, in that interest rate changes have a magnified effect on the value of inverse floaters.
Ordinary Shares. Ordinary shares are shares of foreign issuers that are traded abroad and on a United States exchange. Ordinary shares may be purchased with and sold for U.S. dollars. Investing in foreign companies may involve risks not typically associated with investing in United States companies. See “Securities of Foreign Issuers.”
Other Investment Companies. Investment companies include open- and closed-end funds, exchange-traded funds, and any other pooled investment vehicle that meets the definition of an investment company under the 1940 Act, whether such companies are required to register under the 1940 Act or not. These investment companies typically incur fees that are separate from those fees incurred directly by a Fund. A Fund’s purchase of such investment company securities results in the layering of expenses, such that shareholders would indirectly bear a proportionate share of the operating expenses of such investment companies, including advisory fees, in addition to paying Fund expenses. Investments in registered investment company shares are subject to limitations prescribed by the 1940 Act and its rules, and applicable SEC staff interpretations or applicable exemptive relief granted by the SEC. The 1940 Act currently provides, in part, that a Fund generally may not purchase shares of a registered investment company if (a) such a purchase would cause a Fund to own in the aggregate more than 3% of the total outstanding voting stock of the investment company or (b) such a purchase would cause a Fund to have more than 5% of its total assets invested in the investment company or (c) more than 10% of a Fund’s total assets would be invested in the aggregate in all registered investment companies.
Overseas Private Investment Corporation Certificates. The Funds may invest in Certificates of Participation issued by the Overseas Private Investment Corporation (“OPIC”). OPIC is a U.S. government agency that sells political risk insurance and loans to help U.S. businesses invest and compete in over 150 emerging markets and developing nations worldwide. OPIC provides medium to long-term loans and guaranties to projects involving significant equity or management participation. OPIC can lend on either a project finance or a corporate finance basis in countries where conventional institutions are often unable or unwilling to lend on such a basis. OPIC issues Certificates of Participation to finance projects undertaken by U.S. companies. These certificates are guaranteed by OPIC and backed by the full faith and credit of the U.S. government.
Over-The-Counter Stocks. A Fund may invest in over-the-counter stocks. In contrast to the securities exchanges, the over-the-counter market is not a centralized facility that limits trading activity to securities of companies which initially satisfy certain defined standards. Generally, the volume of trading in an unlisted or over-the-counter common stock is less than the volume of trading in a listed stock. This means that the depth of market liquidity of some stocks in which a Fund invests may not be as great as that of other securities and, if a Fund were to dispose of such a stock, it might have to offer the shares at a discount from recent prices, or sell the shares in small lots over an extended period of time.
Participation Interests. A Fund may invest in participation interests in fixed-income securities. A participation interest provides the certificate holder with a specified interest in an issue of fixed-income securities.
Some participation interests give the holders differing interests in the underlying securities, depending upon the type or class of certificate purchased. For example, coupon strip certificates give the holder the right to receive a specific portion of interest payments on the underlying securities; principal strip certificates give the holder the right to receive principal payments and the portion of interest not payable to coupon strip certificate holders. Holders of certificates of participation in interest payments may be entitled to receive a fixed rate of interest, a variable rate that is periodically reset to reflect the current market rate or an auction rate that is periodically reset at auction. Asset-backed residuals represent interests in any excess cash flow remaining after required payments of principal and interest have been made.
More complex participation interests involve special risk considerations. Since these instruments have only recently been developed, there can be no assurance that any market will develop or be maintained for the instruments. Generally, the fixed-income securities that are deposited in trust for the holders of these interests are the sole source of payments on the interests; holders cannot look to the sponsor or trustee of the trust or to the issuers of the securities held in trust or to any of their affiliates for payment.
Participation interests purchased at a discount may experience price volatility. Certain types of interests are sensitive to fluctuations in market interest rates and to prepayments on the underlying securities. A rapid rate of prepayment can result in the failure to recover the holder’s initial investment.
The extent to which the yield to maturity of a participation interest is sensitive to prepayments depends, in part, upon whether the interest was purchased at a discount or premium, and if so, the size of that discount or premium. Generally, if a participation interest is purchased at a premium and principal distributions occur at a rate faster than that anticipated at the time of purchase, the holder’s actual yield to maturity will be lower than that assumed at the time of purchase. Conversely, if a participation interest is purchased at a discount and principal distributions occur at a rate faster than that assumed at the time of purchase, the investor’s actual yield to maturity will be higher than that assumed at the time of purchase.
Participation interests in pools of fixed-income securities backed by certain types of debt obligations involve special risk considerations. The issuers of securities backed by automobile and truck receivables typically file financing statements evidencing security interests in the receivables, and the servicers of those obligations take and retain custody of the obligations. If the servicers, in contravention of their duty to the holders of the securities backed by the receivables, were to sell the obligations, the third party purchasers could acquire an interest superior to the interest of the security holders. Also, most states require that a security interest in a vehicle must be noted on the certificate of title and the certificate of title may not be amended to reflect the assignment of the lender’s security interest. Therefore, the recovery of the collateral in some cases may not be available to support payments on the securities. Securities backed by credit card receivables are generally unsecured, and both federal and state consumer protection laws may allow set-offs against certain amounts owed.
Pay-In-Kind Bonds. Pay-in-kind bonds are securities which, at the issuer’s option, pay interest in either cash or additional securities for a specified period. Pay-in-kind bonds, like zero coupon bonds, are designed to give an issuer flexibility in managing cash flow. Pay-in-kind bonds are expected to reflect the market value of the underlying debt plus an amount representing accrued interest since the last payment. Pay-in-kind bonds are usually less volatile than zero coupon bonds, but more volatile than cash pay securities.
The Total Return Bond Fund may invest up to 5% of its net assets in pay-in-kind bonds.
Preferred Stock. Preferred stock has a preference over common stock in liquidation (and generally for dividend receipts as well) but is subordinated to the liabilities of the issuer in all respects. As a general rule, the market value of preferred stock with a fixed dividend rate and no conversion element varies inversely with interest rates and perceived credit risk, while the market price of convertible preferred stock generally also reflects some element of conversion value. Because preferred stock is junior to debt securities and other obligations of the issuer, deterioration in the credit quality of the issuer will cause greater changes in the value of a preferred stock than in a more senior debt security with similar stated yield characteristics. Unlike interest payments on debt
securities, preferred stock dividends generally are payable only if declared by the issuer’s board of directors. Preferred stock also may be subject to optional or mandatory redemption provisions.
The Total Return Bond Fund and Mid Cap Value Fund may invest up to 10% of their net assets in preferred stock.
Private Placement Investments. The Funds may invest in commercial paper issued in reliance on the exemption from registration afforded by Section 4(a)(2) of the 1933 Act. Section 4(a)(2) commercial paper is restricted as to disposition under federal securities laws and is generally sold to institutional investors who agree that they are purchasing the paper for investment purposes and not with a view to public distribution. Any resale by the purchaser must be in an exempt transaction. Section 4(a)(2) commercial paper is normally resold to other institutional investors through or with the assistance of the issuer or investment dealers who make a market in Section 4(a)(2) commercial paper, thus providing liquidity. If a sub-advisor determines that Section 4(a)(2) commercial paper and other restricted securities that meet the criteria for liquidity established pursuant to procedures approved by the Board are sufficiently liquid, then the Funds may exclude such restricted securities from the investment limitation applicable to illiquid securities. In addition, because Section 4(a)(2) commercial paper is liquid, the Funds do not intend to subject such paper to the limitation applicable to restricted securities.
The Board has adopted procedures that require a sub-advisor to consider the following criteria in determining the liquidity of certain restricted securities (including Section 4(a)(2) commercial paper): the frequency of trades and quotes for the security; the number of dealers willing to purchase or sell the security and the number of other potential buyers; dealer undertakings to make a market in the security; and the nature of the security and the nature of the marketplace trades. The Board has delegated to the Sub-Advisor the daily function of determining and monitoring the liquidity of restricted securities pursuant to the above criteria and guidelines adopted by the Board. The Board will monitor and periodically review the sub-advisor’s determinations as to its liquidity.
Privatization. Privatizations are foreign government programs for selling all or part of the interests in government owned or controlled enterprises. The ability of a U.S. entity to participate in privatizations in certain foreign countries may be limited by local law, or the terms on which a Fund may be permitted to participate may be less advantageous than those applicable for local investors. There can be no assurance that foreign governments will continue to sell their interests in companies currently owned or controlled by them or that privatization programs will be successful.
Rating Agencies. The Nationally Recognized Statistical Rating Organization (“NRSRO”) ratings applicable to the Funds’ fixed-income investments appear in the Appendix A to this SAI.
Receipts. Receipts are sold as zero coupon securities, which means that they are sold at a substantial discount and redeemed at face value at their maturity date without interim cash payments of interest or principal. This discount is accreted over the life of the security, and such accretion will constitute the income earned on a security for both accounting and federal income tax purposes. Because of these features, such securities may be subject to greater interest rate volatility than interest paying investments.
Real Estate Investment Trusts (“REITs”). The Funds may invest in REITs, which pool investors’ money for investment in income producing commercial real estate or real estate related loans or interests.
A REIT is not subject to federal income tax on income distributed to its shareholders or unitholders if it complies with regulatory requirements relating to its organization, ownership, assets and income, and with a regulatory requirement that it distribute to its shareholders or unitholders at least 90% of its taxable income for each taxable year. Generally, REITs can be classified as Equity REITs, Mortgage REITs and Hybrid REITs. Equity REITs invest the majority of their assets directly in real property and derive their income primarily from rents and capital gains from appreciation realized through property sales. Mortgage REITs invest the majority of their assets in real estate mortgages and derive their income primarily from interest payments. Hybrid REITs combine the characteristics of both Equity and Mortgage REITs. A shareholder in a Fund should realize that by investing in REITs indirectly through the Fund, he or she will bear not only his or her proportionate share of the expenses of the Fund, but also indirectly, similar expenses of underlying REITs.
A Fund may be subject to certain risks associated with the direct investments of the REITs. REITs may be affected by changes in their underlying properties and by defaults by borrowers or tenants. Mortgage REITs may be affected by the quality of the credit extended. Furthermore, REITs are dependent on specialized management skills. Some REITs may have limited diversification and may be subject to risks inherent in financing a limited number of properties. REITs depend generally on their ability to generate cash flow to make distributions to shareholders or unitholders, and may be subject to defaults by borrowers and to self-liquidations. In addition, the performance of a REIT may be affected by its failure to qualify for tax-free pass-through of income under the Code or its failure to maintain exemption from registration under the 1940 Act.
The Emerging Markets Small Cap Fund may invest up to 25% of its net assets in REITs.
Real Estate Mortgage Investment Conduits (“REMICs”). REMICs are private entities formed to hold a fixed pool of mortgages secured by an interest in real property. For Freddie Mac REMIC Certificates, Freddie Mac guarantees the timely payment of interest, and also guarantees the payment of principal as payments are required to be made on the underlying mortgage participation certificates. Fannie Mae REMIC Certificates are issued and guaranteed as to timely distribution of principal and interest by Fannie Mae. A REMIC is a type of CMO that qualifies for special tax treatment under the Internal Revenue Code of 1986, as amended (the “Code”).
Repurchase Agreements. Repurchase agreements are transactions by which a Fund purchases a security and simultaneously commits to resell that security to the seller at an agreed upon time and price, thereby determining the yield during the term of the agreement. In the event of a bankruptcy or other default of the seller of a repurchase agreement, a Fund could experience both delays in liquidating the underlying security and losses. To minimize these possibilities, each Fund intends to enter into repurchase agreements only with its custodian, with banks having assets in excess of $10 billion and with broker-dealers who are recognized as primary dealers in U.S. government obligations by the Federal Reserve Bank of New York. Collateral for repurchase agreements is held in safekeeping in the customer-only account of a Fund’s custodian at the Federal Reserve Bank. A Fund will not enter into a repurchase agreement not terminable within seven days if, as a result thereof, more than 15% of the value of its net assets would be invested in such securities and other illiquid securities.
Although the securities subject to a repurchase agreement might bear maturities exceeding one year, settlement for the repurchase would never be more than one year after a Fund’s acquisition of the securities and normally would be within a shorter period of time. The resale price will be in excess of the purchase price, reflecting an agreed upon market rate effective for the period of time a Fund’s money will be invested in the securities, and will not be related to the coupon rate of the purchased security. At the time a Fund enters into a repurchase agreement, the value of the underlying security, including accrued interest, will equal or exceed the value of the repurchase agreement, and in the case of a repurchase agreement exceeding one day, the seller will agree that the value of the underlying security, including accrued interest, will at all times equal or exceed the value of the repurchase agreement. The collateral securing the seller’s obligation must consist of cash or securities that are issued or guaranteed by the United States government or its agencies. The collateral will be held by the custodian or in the Federal Reserve Book Entry System.
For purposes of the 1940 Act, a repurchase agreement is deemed to be a loan from a Fund to the seller subject to the repurchase agreement and is therefore subject to that Fund’s investment restriction applicable to loans. It is not clear whether a court would consider the securities purchased by a Fund subject to a repurchase agreement as being owned by that Fund or as being collateral for a loan by the Fund to the seller. In the event of the commencement of bankruptcy or insolvency proceedings with respect to the seller of the securities before repurchase of the security under a repurchase agreement, a Fund may encounter delays and incur costs before being able to sell the security. Delays may involve loss of interest or decline in price of the security. If a court characterized the transaction as a loan and a Fund has not perfected a security interest in the security, that Fund may be required to return the security to the seller’s estate and be treated as an unsecured creditor of the seller. As an unsecured creditor, a Fund would be at risk of losing some or all of the principal and income involved in the transaction. As with any unsecured debt obligation purchased for a Fund, the sub-advisor seeks to minimize the risk of loss through repurchase agreements by analyzing the creditworthiness of the obligor, in this case, the seller. Apart from the risk of bankruptcy or insolvency proceedings, there is also the risk that the seller may fail to repurchase the security, in which case a Fund may incur a loss if the proceeds to that Fund of the sale of the security to a third party are less than the repurchase price. However, if the market value of the securities subject to the repurchase agreement becomes less than the repurchase price (including interest), the Fund involved will direct the seller of the security to deliver additional securities so that the market value of all securities subject to the repurchase agreement will equal or exceed the repurchase price. It is possible that a Fund will be unsuccessful in seeking to enforce the seller’s contractual obligation to deliver additional securities.
The Ultra Short Duration Fixed Income Fund may invest in repurchase agreements as part of its principal investment strategy described in the prospectus.
Restricted Securities. Each Fund may invest up to 10% of its total assets in restricted securities (other than securities deemed to be liquid pursuant to procedures approved by the Fund’s Board). Restricted securities cannot be sold to the public without registration under the 1933 Act. The absence of a trading market can make it difficult to ascertain a market value of illiquid investments. Disposing of illiquid investments may involve time-consuming negotiation and legal expenses. Restricted securities generally can be sold in a privately negotiated transaction, pursuant to an exemption from registration under the 1933 Act, or in a registered public offering. Where registration is required, a Fund may be obligated to pay all or part of the registration expense and a considerable period may elapse between the time it decides to seek registration and the time the Fund may be permitted to sell a security under an effective registration statement. If, during such a period, adverse market conditions were to develop, a
Fund might obtain a less favorable price than prevailed when it decided to seek registration of the shares. However, in general, the Funds anticipate holding restricted securities to maturity or selling them in an exempt transaction.
Reverse Repurchase Agreement, Dollar Roll, and Reverse Dollar Roll Transactions. A reverse repurchase agreement involves a sale by a Fund of securities that it holds to a bank, broker-dealer or other financial institution concurrently with an agreement by the Fund to repurchase the same securities at an agreed-upon price and date. Reverse repurchase agreements are considered borrowing by a Fund and are subject to a Fund’s limitations on borrowing. A dollar roll transaction involves a sale by a Fund of an eligible security to a financial institution concurrently with an agreement by the Fund to repurchase a similar eligible security from the institution at a later date at an agreed-upon price. A reverse dollar roll transaction involves a purchase by a Fund of an eligible security from a financial institution concurrently with an agreement by the Fund to resell a similar security to the institution at a later date at an agreed-upon price. Each Fund will fully collateralize its reverse repurchase agreements, dollar roll and reverse dollar roll transactions in an amount at least equal to the Fund’s obligations under the reverse repurchase agreement, dollar roll or reverse dollar roll transaction by segregating cash or other liquid securities, earmarking cash or other liquid securities, or otherwise “cover” its position in a manner consistent with the 1940 Act or the rules and SEC interpretations.
The Total Return Bond Fund may invest up to 5% of its net assets in reverse repurchase agreements.
Royalty Trusts. Royalty trusts are structured similarly to REITs. A royalty trust generally acquires an interest in natural resource companies or chemical companies and distributes the income it receives to the investors of the royalty trust. A sustained decline in demand for crude oil, natural gas and refined petroleum products could adversely affect income and royalty trust revenues and cash flows. Factors that could lead to a decrease in market demand include a recession or other adverse economic conditions, an increase in the market price of the underlying commodity, higher taxes or other regulatory actions that increase costs, or a shift in consumer demand for such products. A rising interest rate environment could adversely impact the performance of royalty trusts. Rising interest rates could limit the capital appreciation of royalty trusts because of the increased availability of alternative investments at more competitive yields.
The Premium Yield Equity Fund may invest up to 10% of its net assets in royalty income trusts.
Rule 144A Securities. Rule 144A securities are securities exempt from registration on resale pursuant to Rule 144A under the 1933 Act. Rule 144A securities are traded in the institutional market pursuant to this registration exemption, and, as a result, may not be as liquid as exchange-traded securities since they may only be resold to certain qualified institutional investors. Due to the relatively limited size of this institutional market, these securities may affect the liquidity of Rule 144A securities to the extent that qualified institutional buyers become, for a time, uninterested in purchasing such securities. Nevertheless, Rule 144A securities may be treated as liquid securities pursuant to procedures adopted by the Trust’s Board.
The Mid Cap Fund may not purchase Rule 144A securities. The Total Return Bond Fund may invest up to 25% of its net assets in Rule 144A securities. The Emerging Markets Small Cap Fund may invest up to 10% of its net assets in Rule 144A securities.
Securities Lending. In order to generate additional income, a Fund may lend its securities pursuant to agreements requiring that the loan be continuously secured by collateral consisting of: (1) cash in U.S. dollars; (2) securities issued or fully guaranteed by the United States government or issued and unconditionally guaranteed by any agencies thereof; or (3) irrevocable performance letters of credit issued by banks approved by each Fund. All collateral must equal at least 100% of the market value of the loaned securities. A Fund continues to receive interest on the loaned securities while simultaneously earning interest on the investment of cash collateral. Collateral is marked to market daily. There may be risks of delay in recovery of the securities or even loss of rights in the collateral should the borrower of the securities fail financially or become insolvent. In addition, cash collateral invested by the lending Fund is subject to investment risk and the Fund may experience losses with respect to its collateral investments. The SEC currently requires that the following conditions must be met whenever a Fund’s portfolio securities are loaned: (1) the Fund must receive at least 100% cash collateral from the borrower; (2) the borrower must increase such collateral whenever the market value of the securities rises above the level of such collateral; (3) the Fund must be able to terminate the loan at any time; (4) the Fund must receive reasonable interest on the loan, as well as any dividends, interest or other distributions on the loaned securities, and any increase in market value; (5) the Fund may pay only reasonable custodian fees approved by the Board in connection with the loan; (6) while voting rights on the loaned securities may pass to the borrower, the Board must terminate the loan and regain the right to vote the securities if a material event adversely affecting the investment occurs, and (7) the Fund may not loan its portfolio securities so that the value of the loaned securities is more than one-third of its total asset value, including collateral received from such loans.
Securities of Foreign Issuers. Except as expressly set forth herein and in the prospectus, the Funds may invest in securities of foreign issuers and in sponsored and unsponsored depositary receipts. Investments in the securities of foreign issuers may subject the Funds to investment risks that differ in some respects from those related to investments in securities of U.S. issuers. Such
risks include future adverse political and economic developments, possible imposition of withholding taxes on income, possible seizure, nationalization or expropriation of foreign deposits, possible establishment of exchange controls or taxation at the source or greater fluctuation in value due to changes in exchange rates. Foreign issuers of securities often engage in business practices different from those of domestic issuers of similar securities, and there may be less information publicly available about foreign issuers. In addition, foreign issuers are, generally speaking, subject to less government supervision and regulation than are those in the United States. Investments in securities of foreign issuers are frequently denominated in foreign currencies and the value of a Fund’s assets measured in U.S. dollars may be affected favorably or unfavorably by changes in currency rates and in exchange control regulations, and the Funds may incur costs in connection with conversions between various currencies.
The Emerging Markets Small Cap Fund invests in securities of foreign issuers as part of its principal investment strategy as more fully described in the prospectus. The Mid Cap Value Fund may invest up to 10% of its net assets in foreign securities. The Total Return Bond Fund may invest up to 50% of its net assets in securities of foreign issuers of which up to 20% may be denominated in a foreign currency.
Foreign Market Risk. A Fund is subject to the risk that, because there are generally fewer investors on foreign exchanges and a smaller number of shares traded each day, it may be difficult for a Fund to buy and sell securities on those exchanges. In addition, prices of foreign securities may fluctuate more than prices of securities traded in the United States. Investments in foreign markets may also be adversely affected by governmental actions such as the imposition of punitive taxes. In addition, the governments of certain countries may prohibit or impose substantial restrictions on foreign investing in their capital markets or in certain industries. Any of these actions could severely affect security prices, impair a Fund’s ability to purchase or sell foreign securities or transfer a Fund’s assets or income back into the United States or otherwise adversely affect a Fund’s operations. Other potential foreign market risks include exchange controls, difficulties in pricing securities, defaults on foreign government securities, difficulties in enforcing favorable legal judgments in foreign courts and political and social conditions, such as diplomatic relations, confiscatory taxation, expropriation, limitation on the removal of funds or assets or imposition of (or change in) exchange control regulations. Legal remedies available to investors in certain foreign countries may be less extensive than those available to investors in the United States or other foreign countries. In addition, changes in government administrations or economic or monetary policies in the United States or abroad could result in appreciation or depreciation of portfolio securities and could favorably or adversely affect a Fund’s operations.
Public Availability of Information. In general, less information is publicly available with respect to foreign issuers than is available with respect to U.S. companies. Most foreign companies are also not subject to the uniform accounting and financial reporting requirements applicable to issuers in the United States. While the volume of transactions effected on foreign stock exchanges has increased in recent years, it remains appreciably below that of the New York Stock Exchange. Accordingly, the Fund’s foreign investments may be less liquid and their prices may be more volatile than comparable investments in securities in U.S. companies. In addition, there is generally less government supervision and regulation of securities exchanges, brokers and issuers in foreign countries than in the United States.
Settlement Risk. Settlement and clearance procedures in certain foreign markets differ significantly from those in the United States. Foreign settlement procedures and trade regulations also may involve certain risks (such as delays in payment for or delivery of securities) not typically generated by the settlement of U.S. investments. Communications between the United States and emerging market countries may be unreliable, increasing the risk of delayed settlements or losses of security certificates in markets that still rely on physical settlement. Settlements in certain foreign countries at times have not kept pace with the number of securities transactions; these problems may make it difficult for a Fund to carry out transactions. If a Fund cannot settle or is delayed in settling a purchase of securities, it may miss attractive investment opportunities and certain of its assets may be uninvested with no return earned thereon for some period. If a Fund cannot settle or is delayed in settling a sale of securities, it may lose money if the value of the security then declines or, if it has contracted to sell the security to another party; the Fund could be liable to that party for any losses incurred. Dividends or interest on, or proceeds from the sale of, foreign securities may be subject to foreign taxes on income from sources in such countries.
Governmental Supervision and Regulation/Accounting Standards. Many foreign governments supervise and regulate stock exchanges, brokers and the sale of securities less than does the United States. Some countries may not have laws to protect investors comparable to the U.S. securities laws. For example, some foreign countries may have no laws or rules against insider trading. Insider trading occurs when a person buys or sells a company’s securities based on nonpublic information about that company. In addition, the U.S. government has from time to time in the past imposed restrictions, through penalties and otherwise, on foreign investments by U.S. investors. Accounting standards in other countries are not necessarily the same as in the United States. If the accounting standards in another country do not require as much detail as U.S. accounting standards, it may be harder for a Fund to completely and accurately determine a company’s financial condition. Also, brokerage commissions and other costs of buying or selling securities often are higher in foreign countries than they are in the United States. This reduces the amount a Fund can earn on its investments.
Foreign Currency Risk. While a Fund’s net assets are valued in U.S. dollars, the securities of foreign companies are frequently denominated in foreign currencies. Thus, a change in the value of a foreign currency against the U.S. dollar will result in a corresponding change in value of securities denominated in that currency. Some of the factors that may impair the investments denominated in a foreign currency are: (1) It may be expensive to convert foreign currencies into U.S. dollars and vice versa; (2) Complex political and economic factors may significantly affect the values of various currencies, including U.S. dollars, and their exchange rates; (3) Government intervention may increase risks involved in purchasing or selling foreign currency options, forward contracts and futures contracts, since exchange rates may not be free to fluctuate in response to other market forces; (4) There may be no systematic reporting of last sale information for foreign currencies or regulatory requirement that quotations available through dealers or other market sources be firm or revised on a timely basis; (5) Available quotation information is generally representative of very large round-lot transactions in the inter-bank market and thus may not reflect exchange rates for smaller odd-lot transactions (less than $1 million) where rates may be less favorable; and (6) The inter-bank market in foreign currencies is a global, around-the-clock market. To the extent that a market is closed while the markets for the underlying currencies remain open, certain markets may not always reflect significant price and rate movements.
Forward Foreign Currency Contracts. The Funds may enter into forward foreign currency contracts to manage foreign currency exposure and as a hedge against possible variations in foreign exchange rates. The Funds may enter into forward foreign currency contracts to hedge a specific security transaction or to hedge a portfolio position. These contracts may be bought or sold to protect the Funds, to some degree, against possible losses resulting from an adverse change in the relationship between foreign currencies and the U.S. dollar. The Funds also may invest in foreign currency futures and in options on currencies. A forward contract involves an obligation to purchase or sell a specific currency amount at a future date, agreed upon by the parties, at a price set at the time of the contract. A Fund may enter into a contract to sell, for a fixed amount of U.S. dollars or other appropriate currency, the amount of foreign currency approximating the value of some or all of a Fund’s securities denominated in such foreign currency.
By entering into forward foreign currency contracts, a Fund will seek to protect the value of its investment securities against a decline in the value of a currency. However, these forward foreign currency contracts will not eliminate fluctuations in the underlying prices of the securities. Rather, they simply establish a rate of exchange which one can obtain at some future point in time. Although such contracts tend to minimize the risk of loss due to a decline in the value of the hedged currency, they also tend to limit any potential gain which might result should the value of such currency increase. At the maturity of a forward contract, a Fund may either sell a portfolio security and make delivery of the foreign currency, or it may retain the security and terminate its contractual obligation to deliver the foreign currency by purchasing an “offsetting” contract with the same currency trader, obligating it to purchase, on the same maturity date, the same amount of the foreign currency. A Fund may realize a gain or loss from currency transactions.
When entering into a contract for the purchase or sale of a security in a foreign currency, a Fund may enter into a forward foreign currency contract for the amount of the purchase or sale price to protect against variations, between the date the security is purchased or sold and the date on which payment is made or received, in the value of the foreign currency relative to the U.S. dollar or other foreign currency.
Also, when a Fund’s portfolio manager anticipates that a particular foreign currency may decline substantially relative to the U.S. dollar or other leading currencies, in order to reduce risk, a Fund may enter into a forward contract to sell, for a fixed amount, the amount of foreign currency approximating the value of its securities denominated in such foreign currency. With respect to any such forward foreign currency contract, it will not generally be possible to match precisely the amount covered by that contract and the value of the securities involved due to changes in the values of such securities resulting from market movements between the date the forward contract is entered into and the date it matures. In addition, while forward foreign currency contracts may offer protection from losses resulting from declines in value of a particular foreign currency, they also limit potential gains which might result from increases in the value of such currency. A Fund will also incur costs in connection with forward foreign currency contracts and conversions of foreign currencies into U.S. dollars. A Fund will place assets in a segregated account or otherwise earmark assets as cover to ensure that its obligations under forward foreign currency contracts are covered.
Emerging Market Securities. Emerging market countries are generally countries that are included in the Morgan Stanley Capital International (“MSCI”) Emerging Markets Index, or otherwise excluded from the MSCI World Index. As of December 31, 2015 ,the countries in the MSCI World Index included: Australia, Austria, Belgium, Canada, Denmark, Finland, France, Germany, Hong Kong, Ireland, Israel, Italy, Japan, the Netherlands, New Zealand, Norway, Portugal, Singapore, Spain, Sweden, Switzerland, the United Kingdom, and the United States. The country composition of the MSCI Emerging Markets Index and the MSCI World Index can change over time.
With respect to the Emerging Markets Small Cap Fund, emerging market countries include those that are included in the MSCI Emerging Markets Index; are considered by the Sub-Advisor to have an economy and financial system comparable to countries
included in the MSCI Emerging Markets Index; or whose economic activity and capital markets are dependent on emerging market countries (examples include Hong Kong and Singapore). When the Fund invests in securities of a company in an emerging market country, it invests in securities issued by a company that (i) is organized under the laws of an emerging market country, (ii) maintains its principal place of business in an emerging market country, (iii) has its principal trading market for its securities in an emerging market country, or (iv) derives at least 50% of its revenues or profits from operations within emerging market countries, or has at least 50% of its assets located in emerging market countries.
Investments in the securities of issuers domiciled in countries with emerging capital markets involve certain additional risks that do not generally apply to investments in securities of issuers in more developed capital markets, such as (i) low or non-existent trading volume, resulting in a lack of liquidity and increased volatility in prices for such securities, as compared to securities of comparable issuers in more developed capital markets; (ii) uncertain national policies and social, political and economic instability, increasing the potential for nationalization or expropriation of assets, confiscatory taxation, high rates of inflation or unfavorable diplomatic developments; (iii) possible fluctuations in exchange rates, differing legal systems and the existence or possible imposition of exchange controls, custodial restrictions or other foreign or U.S. governmental laws or restrictions applicable to such investments; (iv) national policies that may limit the Fund’s investment opportunities such as restrictions on investment in issuers or industries deemed sensitive to national interests; and (v) the lack or relatively early development of legal structures governing private and foreign investments and private property. In addition to withholding taxes on investment income, some countries with emerging markets may impose differential capital gains taxes on foreign investors.
Political and economic structures in emerging market countries may be undergoing significant evolution and rapid development, and these countries may lack the social, political and economic stability characteristic of more developed countries. In such a dynamic environment, there can be no assurance that any or all of these capital markets will continue to present viable investment opportunities for the Fund. Some of these countries may have in the past failed to recognize private property rights and have at times nationalized or expropriated the assets of private companies. There is no assurance that such expropriations will not reoccur. In such an event, it is possible that the Fund could lose the entire value of its investments in the affected market. As a result, the risks described above, including the risks of nationalization or expropriation of assets, may be heightened. In addition, unanticipated political or social developments may affect the value of investments in these countries and the availability to a Fund of additional investments. The small size and inexperience of the securities markets in certain of these countries and the limited volume of trading in securities in these countries may make investments in the countries illiquid and more volatile than investments in Japan or most Western European countries.
Also, there may be less publicly available information about issuers in emerging markets than would be available about issuers in more developed capital markets, and such issuers may not be subject to accounting, auditing and financial reporting standards and requirements comparable to those to which U.S. companies are subject. In certain countries with emerging capital markets, reporting standards vary widely. As a result, traditional investment measurements used in the United States, such as price/earnings ratios, may not be applicable. Emerging market securities may be substantially less liquid and more volatile than those of mature markets, and company shares may be held by a limited number of persons. This may adversely affect the timing and pricing of the Fund’s acquisition or disposal of securities.
Practices in relation to settlement of securities transactions in emerging markets involve higher risks than those in developed markets, in part because the Fund will need to use brokers and counterparties that are less well capitalized, and custody and registration of assets in some countries may be unreliable. The possibility of fraud, negligence, undue influence being exerted by the issuer or refusal to recognize ownership exists in some emerging markets, and, along with other factors, could result in ownership registration being completely lost. The Fund would absorb any loss resulting from such registration problems and may have no successful claim for compensation.
The Premium Yield Equity Fund may invest up to 40% of its total assets in emerging market securities. The Mid Cap Value Fund may invest up to 10% of its net assets in depositary receipts representing interests in securities of emerging market issuers. The Total Return Bond Fund may invest up to 10% of its net assets in investment-grade emerging-market debt securities and up to 10% of its net assets in non-investment-grade emerging-market debt securities. The Emerging Markets Small Cap Fund may also invest up to 20% of its net assets in participatory notes (commonly known as P-notes), which are offshore derivative instruments issued to foreign institutional investors and their sub-accounts against underlying Indian securities listed on the Indian bourses. These securities are not registered with the Securities and Exchange Board of India. Participatory notes are similar to depositary receipts and the risks of investing in participatory notes are similar to those discussed above with respect to securities of foreign issuers in general.
Sovereign Debt. Investment in sovereign debt can involve a high degree of risk. The governmental entity that controls the repayment of sovereign debt may not be able or willing to repay the principal or interest when due in accordance with the terms of such debt. A governmental entity’s willingness or ability to repay principal and interest due in a timely manner may be affected
by, among other factors, its cash flow situation, the extent of its foreign reserves, the availability of sufficient foreign exchange on the date a payment is due, the relative size of the debt service burden to the economy as a whole, the governmental entity’s policy towards the International Monetary Fund and the political constraints to which a governmental entity may be subject. Governmental entities may also be dependent on expected disbursements from foreign governments, multilateral agencies and others abroad to reduce principal and interest arrearages on their debt. The commitment on the part of these governments, agencies and others to make such disbursements may be conditioned on the implementation of economic reforms or economic performance and the timely service of such debtor’s obligations. Failure to implement such reforms, achieve such levels of economic performance or repay principal or interest when due may result in the cancellation of such third parties’ commitments to lend funds to the governmental entity, which may further impair such debtor’s ability or willingness to timely service its debts. Consequently, governmental entities may default on their sovereign debt.
Holders of sovereign debt may be requested to participate in the rescheduling of such debt and to extend further loans to governmental entities. In the event of a default by a governmental entity, there may be few or no effective legal remedies for collecting on such debt.
Short Sales. In a short sale, a Fund sells a security, which it does not own, in anticipation of a decline in the market value of the security. To complete the sale, the Fund must borrow the security (generally from the broker through which the short sale is made) in order to make delivery to the buyer. The Fund must replace the security borrowed by purchasing it at the market price at the time of replacement. The Fund is said to have a “short position” in the securities sold until it delivers them to the broker. The period during which the Fund has a short position can range from one day to more than a year. Until the Fund replaces the security, the proceeds of the short sale are retained by the broker, and the Fund must pay to the broker a negotiated portion of any dividends or interest, which accrues during the period of the loan. A short sale is “against the box” if at all times during which the short position is open, a Fund owns at least an equal amount of the securities or securities convertible into, or exchangeable without further consideration for, securities of the same issue as the securities that are sold short. A short sale against the box is a taxable transaction to the Fund with respect to the securities that are sold short.
In the view of the SEC, a short sale involves the creation of a “senior security” as such term is defined in the 1940 Act, unless the sale is “against the box” and the securities sold short are placed in a segregated account (not with the broker), or unless the Fund’s obligation to deliver the securities sold short is otherwise “covered,” whether by placing assets in a segregated account or otherwise earmarking assets as cover in an amount equal to the difference between the market value of the securities sold short at the time of the short sale and any such collateral required to be deposited with a broker in connection with the sale (not including the proceeds from the short sale), which difference is adjusted daily for changes in the value of the securities sold short, or otherwise. Any Fund that engages in short sales will comply with these requirements.
Stripped Mortgage-Backed Securities (“SMBs”). SMBs may be issued by agencies or instrumentalities of the U.S. government, or by private originators of, or investors in, mortgage loans, including savings and loan associations, mortgage banks, commercial banks, investment banks and special purpose entities of the foregoing. SMBs are usually structured with two classes that receive different proportions of the interest and principal distributions on a pool of mortgage assets. A common type of SMBs will have one class receiving some of the interest and most of the principal from the mortgage assets, while the other class will receive most of the interest and the remainder of the principal.
In the most extreme case, one class will receive all of the interest (the interest-only or “IO” class), while the other class will receive the entire principal (the principal-only or “PO” class). The yield to maturity on an IO class is extremely sensitive to the rate of principal payments (including prepayments) on the related underlying mortgage assets, and a rapid rate of principal payments may have a material adverse effect on a Fund’s yield to maturity from these securities. If the assets underlying the IO securities experience greater than anticipated prepayments of principal, a Fund may fail to recoup fully its initial investment in these securities. Conversely, PO securities tend to increase in value if prepayments are greater than anticipated and decline if prepayments are slower than anticipated. The secondary market for SMBs may be more volatile and less liquid than that for other mortgage-backed securities, potentially limiting a Fund’s ability to buy or sell these securities at any particular time.
Separate Trading of Registered Interest and Principal Securities (“STRIPS”). STRIPS are U.S. Treasury bills, notes, and bonds that have been issued without interest coupons or stripped of their unmatured interest coupons, interest coupons that have been stripped from such U.S. Treasury securities, and receipts or certificates representing interests in such stripped U.S. Treasury securities and coupons. A STRIPS security pays no interest in cash to its holder during its life although interest is accrued for federal income tax purposes. Its value to an investor consists of the difference between its face value at the time of maturity and the price for which it was acquired, which is generally an amount significantly less than its face value. Investing in STRIPS may help to preserve capital during periods of declining interest rates. For example, if interest rates decline, Ginnie Mae Certificates owned by a Fund which were purchased at greater than par are more likely to be prepaid, which would cause a loss of principal.
In anticipation of this, a Fund might purchase STRIPS, the value of which would be expected to increase when interest rates decline.
STRIPS do not entitle the holder to any periodic payments of interest prior to maturity. Accordingly, such securities usually trade at a deep discount from their face or par value and will be subject to greater fluctuations of market value in response to changing interest rates than debt obligations of comparable maturities that make periodic distributions of interest. On the other hand, because there are no periodic interest payments to be reinvested prior to maturity, STRIPS eliminate the reinvestment risk and lock in a rate of return to maturity. Current federal income tax law requires that a holder of a STRIPS security accrue a portion of the discount at which the security was purchased as income each year even though the Fund received no interest payment in cash on the security during the year.
Swap Agreements. A swap is a financial instrument that typically involves the exchange of cash flows between two parties on specified dates (settlement dates), where the cash flows are based on agreed-upon prices, rates, indices, etc. The nominal amount on which the cash flows are calculated is called the notional amount. Swaps are individually negotiated and structured to include exposure to a variety of different types of investments or market factors, such as interest rates, foreign currency rates, mortgage securities, corporate borrowing rates, security prices, indexes or inflation rates.
Swap agreements may increase or decrease the overall volatility of the investments of a Fund and its share price. The performance of swap agreements may be affected by a change in the specific interest rate, currency, or other factors that determine the amounts of payments due to and from a Fund. If a swap agreement calls for payments by a Fund, the Fund must be prepared to make such payments when due. In addition, if the counterparty’s creditworthiness declines, the value of a swap agreement would be likely to decline, potentially resulting in losses.
Generally, swap agreements have a fixed maturity date that will be agreed upon by the parties. The agreement can be terminated before the maturity date only under limited circumstances, such as default by one of the parties or insolvency, among others, and can be transferred by a party only with the prior written consent of the other party. A Fund may be able to eliminate its exposure under a swap agreement either by assignment or by other disposition, or by entering into an offsetting swap agreement with the same party or a similarly creditworthy party. If the counter-party is unable to meet its obligations under the contract, declares bankruptcy, defaults or becomes insolvent, a Fund may not be able to recover the money it expected to receive under the contract.
A swap agreement can be a form of leverage, which can magnify a Fund’s gains or losses. If a Fund enters into a swap agreement on a net basis, it will segregate assets with a daily value at least equal to the excess, if any, of the Fund’s accrued obligations under the swap agreement over the accrued amount the Fund is entitled to receive under the agreement. If a Fund enters into a swap agreement on other than a net basis, it will segregate assets with a value equal to the full amount of the Fund’s accrued obligations under the agreement.
Equity Swaps. In a typical equity swap, one party agrees to pay another party the return on a stock, stock index or basket of stocks in return for a specified interest rate. By entering into an equity index swap, for example, the index receiver can gain exposure to stocks making up the index of securities without actually purchasing those stocks. Equity index swaps involve not only the risk associated with investment in the securities represented in the index, but also the risk that the performance of such securities, including dividends, will not exceed the return on the interest rate that a Fund will be committed to pay.
Interest Rate Swaps. Interest rate swaps are financial instruments that involve the exchange of one type of interest rate for another type of interest rate cash flow on specified dates in the future. Some of the different types of interest rate swaps are “fixed-for floating rate swaps,” “termed basis swaps” and “index amortizing swaps.” Fixed-for floating rate swaps involve the exchange of fixed interest rate cash flows for floating rate cash flows. Termed basis swaps entail cash flows to both parties based on floating interest rates, where the interest rate indices are different. Index amortizing swaps are typically fixed-for floating swaps where the notional amount changes if certain conditions are met.
Like a traditional investment in a debt security, a Fund could lose money by investing in an interest rate swap if interest rates change adversely. For example, if a Fund enters into a swap where it agrees to exchange a floating rate of interest for a fixed rate of interest, a Fund may have to pay more money than it receives. Similarly, if a Fund enters into a swap where it agrees to exchange a fixed rate of interest for a floating rate of interest, a Fund may receive less money than it has agreed to pay.
Currency Swaps. A currency swap is an agreement between two parties in which one party agrees to make interest rate payments in one currency and the other promises to make interest rate payments in another currency. A Fund may enter into a currency swap when it has one currency and desires a different currency. Typically the interest rates that determine the currency swap payments are fixed, although occasionally one or both parties may pay a floating rate of interest. Unlike an interest rate swap, however, the
principal amounts are exchanged at the beginning of the contract and returned at the end of the contract. Changes in foreign exchange rates and changes in interest rates, as described above, may negatively affect currency swaps.
Credit Default Swaps (“CDSs”). A CDS is an agreement between a Fund and a counterparty that enables a Fund to buy or sell protection against a credit event related to a referenced debt obligation. One party, acting as a “protection buyer,” makes periodic payments to the other party, a “protection seller,” in exchange for a promise by the protection seller to make a payment to the protection buyer if a negative credit event (such as a delinquent payment or default) occurs with respect to a referenced bond or group of bonds. Acting as a protection seller allows a Fund to create an investment exposure similar to owning a bond. Acting as a protection buyer allows a Fund potentially to reduce its credit exposure to a bond it owns or to take a “short” position in a bond it does not own.
As the protection buyer in a CDS, a Fund may pay a premium (by means of periodic payments) in return for the right to deliver specified bonds or loans to the protection seller and receive the par (or other agreed-upon) value upon default or similar events by the issuer of the underlying reference obligation. If no default occurs, the protection seller would keep the stream of payments and would have no further obligations to the Fund. As the protection buyer, a Fund bears the risk that the investment might expire worthless or that the protection seller may fail to satisfy its payment obligations to a Fund in the event of a default or similar event. In addition, when a Fund is a protection buyer, the Fund’s investment would only generate income in the event of an actual default or similar event by the issuer of the underlying reference obligation. A Fund may also use credit default swaps for investment purposes by selling a CDS, in which case, the Fund, as the protection seller, would be required to pay the par (or other agreed-upon) value of a referenced debt obligation to the protection buyer in the event of a default or similar event by the third-party issuer of the underlying reference obligation. In return for its obligation, a Fund would receive from the protection buyer a periodic stream of payments over the term of the contract. If no credit event occurs, a Fund would keep the stream of payments and would have no payment obligations. As the protection seller in a CDS, a Fund effectively adds economic leverage to its portfolio because, in addition to its total net assets, the Fund is subject to investment exposure on the notional amount of the swap. Consistent with SEC staff guidance, if a Fund sells a CDS it will segregate assets equal to the full notional amount of the swap in order to cover its obligations under the instrument.
In addition to the risks applicable to derivatives generally, CDSs involve special risks because they may be difficult to value, are highly susceptible to liquidity and credit risk, and generally pay a return to the party that has paid the premium only in the event of an actual default by the issuer of the underlying obligation (as opposed to a credit downgrade or other indication of financial difficulty).
Options on Swap Agreements (“swaptions”). The Funds also may enter into swaptions. A swaption is a contract that gives a counterparty the right (but not the obligation) to enter into a new swap agreement or to shorten, extend, cancel or otherwise modify an existing swap agreement, at some designated future time on specified terms. The Funds may write (sell) and purchase put and call swaptions. Depending on the terms of the particular swaption, a Fund will generally incur a greater degree of risk when it writes a swaption than it will incur when it purchases a swaption. When a Fund purchases a swaption, it risks losing only the amount of the premium it has paid should it decide to let the option expire unexercised. However, when a Fund writes a swaption, upon exercise of the option by the buyer of the option, the Fund will become obligated according to the terms of the underlying swap agreement.
Whether a Fund’s use of swap agreements or swaptions will be successful in furthering its investment goals will depend on the sub-advisors’ ability to predict correctly whether certain types of investments are likely to produce greater returns than other investments. Moreover, a Fund bears the risk of loss of the amount expected to be received under a swap agreement in the event of the default or bankruptcy of a swap agreement counterparty.
Technology Securities. The value of technology securities may fluctuate dramatically and technology securities may be subject to greater than average financial and market risk. Investments in the high technology sector include the risk that certain products may be subject to competitive pressures and aggressive pricing and may become obsolete and the risk that new products will not meet expectations or even reach the market.
Temporary Defensive Positions. A Fund may take temporary defensive positions that are inconsistent with the Fund’s normal investment strategies in response to adverse or unusual market, economic, political, or other conditions as determined by a Fund’s sub-advisor. Such positions could include, but are not limited to, investments in (1) highly liquid short-term fixed-income securities issued by or on behalf of municipal or corporate issuers, obligations of the U.S. government and its agencies, commercial paper, and bank certificates of deposit; (2) repurchase agreements involving any such securities; and (3) other money market instruments. In addition, a Fund may hold uninvested cash on a temporary basis if, in a sub-advisor’s discretion, market conditions warrant. A Fund’s uninvested cash balances may or may not earn interest while maintained at the Fund’s custodian. There is no limit on
the extent to which a Fund may take temporary defensive positions. In taking such positions, the Fund may fail to achieve its investment goals.
Tender Option Bonds. A tender option bond is a municipal security (generally held pursuant to a custodial arrangement) having a relatively long maturity and bearing interest at a fixed rate substantially higher than prevailing short-term tax-exempt rates, that has been coupled with the agreement of a third party, such as a bank, broker-dealer or other financial institution, pursuant to which such institution grants the security holders the option, at periodic intervals, to tender their securities to the institution and receive the face value thereof. As consideration for providing the option, the financial institution receives periodic fees equal to the difference between the municipal security’s fixed coupon rate and the rate, as determined by a remarketing or similar agent at or near the commencement of such period, that would cause the securities, coupled with the tender option, to trade at par on the date of such determination. Thus, after payment of this fee, the security holder effectively holds a demand obligation that bears interest at the prevailing short-term tax exempt rate. The Advisor or sub-advisor as the case may be, will consider on an ongoing basis the creditworthiness of the issuer of the underlying municipal securities, of any custodian, and of the third-party provider of the tender option. In certain instances and for certain tender option bonds, the option may be terminable in the event of a default in payment of principal of interest on the underlying municipal securities and for other reasons.
Time Deposits. Time deposits are non-negotiable receipts issued by a bank in exchange for the deposit of funds. Like a certificate of deposit, it earns a specified rate of interest over a definite period of time; however, it cannot be traded in the secondary market. Time deposits with a withdrawal penalty are considered to be illiquid securities.
U.S. Government Securities. U.S. government securities include: securities issued directly by the U.S. Treasury such as Treasury bills, notes and bonds; securities issued by agencies or instrumentalities of the U.S. government, such as Ginnie Mae, Fannie Mae, Freddie Mac, Federal Government Loan Mortgage Corporation (“FGLMC”), Student Loan Marketing Association (“SLMA”), Small Business Administration (“SBA”), Tennessee Valley Authority (“TVA”) and OPIC; STRIPS and TIPS.
Some U.S. government securities are backed by the full faith and credit of the U.S. government, meaning that payment of principal and interest is guaranteed by the U.S. government. Other U.S. government securities are backed only by the credit of the agency or instrumentality issuing the security, which may include the right of the issuer to borrow from the U.S. Treasury. Securities backed by the full faith and credit of the U.S. government include U.S. Treasury bills, U.S. Treasury notes, U.S. Treasury bonds, Ginnie Mae securities and OPIC securities. Securities backed only by the credit of the government agency issuing the security include securities issued by the Fannie Mae, Freddie Mac, FGLMC, SLMA, SBA and TVA.
U.S. Treasury Obligations. U.S. Treasury Obligations are bills, notes and bonds issued by the U.S. Treasury, and separately traded interest and principal component parts of such obligations that are transferable through the federal book-entry system known as STRIPS and coupons under book entry safekeeping (“CUBES”). They also include TIPS.
Variable and Floating Rate Instruments. Certain obligations may carry variable or floating rates of interest, and may involve a conditional or unconditional demand feature. Such instruments bear interest at rates which are not fixed, but which vary with changes in specified market rates or indices. The interest rates on these securities may be reset daily, weekly, quarterly, or some other reset period, and may have a floor or ceiling on interest rate changes. There is a risk that the current interest rate on such obligations may not accurately reflect existing market interest rates. A demand instrument with a demand notice exceeding seven days may be considered illiquid if there is no secondary market for such security.
Variable-Rate Demand Instruments. The Funds may purchase variable-rate demand instruments. Variable-rate demand instruments that the Funds will purchase are obligations that provide for a periodic adjustment in the interest rate paid on the instrument and permit the holder to demand payment of the unpaid principal balance plus accrued interest at specified intervals upon a specific number of days’ notice either from the issuer or by drawing on a bank letter of credit, a guarantee, insurance or other credit facility issued with respect to such instrument.
The variable-rate demand instruments in which the Funds may invest are payable on not more than thirty calendar days’ notice either on demand or at specified intervals not exceeding thirteen months depending upon the terms of the instrument. The terms of the instruments provide that interest rates are adjustable at intervals ranging from daily to up to thirteen months and their adjustments are based upon LIBOR or other prevailing interest rates as provided in the respective instruments. A security is priced at a coupon rate that causes its value to approximate par. Each Fund may only purchase variable rate demand instruments which have received a short-term rating meeting that Fund’s quality standards from an NRSRO or unrated variable rate demand instruments determined by the Sub-Advisor to be of comparable quality. If such an instrument does not have a demand feature exercisable by a Fund in the event of default in the payment of principal or interest on the underlying securities, then the Fund will also require that the instrument have a rating as long-term debt in one of the top two categories by any NRSRO. The Sub-Advisor may determine that an unrated variable rate demand instrument meets a Fund’s quality criteria if it is backed by a letter of credit or guarantee or
insurance or other credit facility that meets the quality criteria for the Fund or on the basis of a credit evaluation of the underlying obligor. If an instrument is ever deemed to not meet a Fund’s quality standards, such Fund either will sell it in the market or exercise the demand feature as soon as practicable.
While the value of the underlying variable-rate demand instruments may change with changes in interest rates generally, the variable rate nature of the underlying variable rate demand instruments should minimize changes in value of the instruments. Accordingly, as interest rates decrease or increase, the potential for capital depreciation is less than would be the case with a portfolio of fixed-income securities. Each Fund may hold variable-rate demand instruments on which stated minimum or maximum rates limit the degree to which interest on such variable rate-demand instruments may fluctuate; to the extent an instruments has such limits, increases or decreases in its value may be greater than would be the case without such limits. Because the adjustment of interest rates on the variable-rate demand instruments is made in relation to movements of the applicable banks’ “prime rate,” or other interest rate adjustment index, the variable rate demand instruments are not comparable to long-term fixed-rate securities. Accordingly, interest rates on the variable-rate demand instruments may be higher or lower than current market rates for fixed rate obligations or obligations of comparable quality with similar maturities.
As a matter of current operating policy, each of the Active Bond Fund and the High Yield Fund will not invest more than 15%, of its net assets in (1) variable rate demand instruments as to which it cannot exercise the demand feature on not more than seven days’ notice if it is determined that there is no secondary market available for these obligations and (2) all other illiquid securities. These operating policies are not fundamental and may be changed by the Board without shareholder approval. The Funds intend to exercise the demand repurchase feature only (1) upon a default under the terms of the bond documents, (2) as needed to provide liquidity to a Fund in order to make redemptions of its shares, or (3) to maintain the quality standards of a Fund’s investment portfolio.
Warrants and Rights. Warrants are instruments giving holders the right, but not the obligation, to buy equity or fixed-income securities of a company at a given price during a specified period. Rights are similar to warrants but normally have a short life span to expiration. The purchase of warrants or rights involves the risk that a Fund could lose the purchase value of a warrant or right if the right to subscribe to additional shares is not exercised prior to the warrants’ or rights’ expiration. Also, the purchase of warrants and/or rights involves the risk that the effective price paid for the warrants and/or rights added to the subscription price of the related security may exceed the value of the subscribed security’s market price such as when there is no movement in the level of the underlying security. Buying a warrant does not make a Fund a shareholder of the underlying stock. The warrant holder has no voting or dividend rights with respect to the underlying stock. A warrant does not carry any right to assets of the issuer, and for this reason investment in warrants may be more speculative than other equity-based investments.
When-Issued, Delayed Delivery Securities and Forward Commitment Transactions. A Fund may purchase securities on a when-issued or delayed-delivery basis, in which case delivery of the securities occurs beyond the normal settlement period; payment for or delivery of the securities would be made prior to the reciprocal delivery or payment by the other party to the transaction. When-issued or delayed delivery securities are subject to market fluctuations due to changes in market interest rates and it is possible that the market value at the time of settlement could be higher or lower than the purchase price if the general level of interest rates has changed. Although a Fund generally purchases securities on a when-issued or forward commitment basis with the intention of actually acquiring the securities for its investment portfolio, a Fund may dispose of a when-issued security or forward commitment prior to settlement if it deems appropriate.
When-Issued Securities and Securities Purchased on a To-Be-Announced Basis. The Funds will only make commitments to purchase securities on a when-issued or to-be-announced (“TBA”) basis with the intention of actually acquiring the securities. A Fund may sell the securities before the settlement date if it is otherwise deemed advisable as a matter of investment strategy or in order to meet its obligations, although it would not normally expect to do so. When-issued securities are securities purchased for delivery beyond the normal settlement date at a stated price and yield and involve the risk that the yield obtained in the transaction will be less than that available in the market when delivery takes place. In a TBA transaction, a Fund has committed to purchasing or selling securities for which all specific information is not yet known at the time of the trade, particularly the face amount in transactions involving mortgage-related securities.
TBA securities are paid for and delivered within 15 to 45 days from their date of purchase. In connection with these investments, each Fund will direct the custodian to segregate cash or liquid securities in an amount sufficient to make payment for the securities to be purchased. When a segregated account is maintained because a Fund purchases securities on a when-issued or TBA basis, the assets deposited in the segregated account will be valued daily at market for the purpose of determining the adequacy of the securities in the account. If the market value of such securities declines, additional cash or securities will be placed in the account on a daily basis so that the market value of the account will equal the amount of a Fund’s commitments to purchase securities on a when-issued or TBA basis. To the extent funds are in a segregated account, they will not be available for new investment or to meet redemptions. Securities purchased on a when-issued or TBA basis and the securities held in a Fund’s portfolio are subject
to changes in market value based upon changes in the level of interest rates (which will generally result in all of those securities changing in value in the same way, i.e., all those securities experiencing appreciation when interest rates decline and depreciation when interest rates rise). Therefore, if in order to achieve higher returns, a Fund remains substantially fully invested at the same time that it has purchased securities on a when-issued or TBA basis, there will be a possibility that the market value of the Fund’s assets will experience greater fluctuation. The purchase of securities on a when-issued or TBA basis may involve a risk of loss if the seller fails to deliver after the value of the securities has risen.
When the time comes for a Fund to make payment for securities purchased on a when-issued or TBA basis, the Fund will do so by using then available cash flow, by sale of the securities held in the segregated account, by sale of other securities or, although it would not normally expect to do so, by directing the sale of the securities purchased on a when-issued or TBA basis themselves (which may have a market value greater or less than the Fund’s payment obligation).
The Active Bond Fund may invest up to 33% of its assets in dollar-roll transactions involving when-issued securities.
Yankee Obligations. Yankee obligations (“Yankees”) are U.S. dollar-denominated instruments of foreign issuers who either register with the SEC or issue securities under Rule 144A under the 1933 Act. These consist of debt securities (including preferred or preference stock of non-governmental issuers), certificates of deposit, fixed time deposits and bankers’ acceptances issued by foreign banks, and debt obligations of foreign governments or their subdivisions, agencies and instrumentalities, international agencies and supranational entities. Some securities issued by foreign governments or their subdivisions, agencies and instrumentalities may not be backed by the full faith and credit of the foreign government. Yankee obligations, as obligations of foreign issuers, are subject to the same types of risks discussed above in “Securities of Foreign Issuers.”
The Yankee obligations selected for the Funds will adhere to the same quality standards as those utilized for the selection of domestic debt obligations.
Zero Coupon Securities. The Funds may invest in zero coupon bonds of governmental or private issuers that generally pay no interest to their holders prior to maturity. Since zero coupon bonds do not make regular interest payments, they allow an issuer to avoid the need to generate cash to meet current interest payments and may involve greater credit risks than bonds paying interest currently. The Code requires that a Fund accrue interest income on zero coupon bonds for each taxable year, even though no cash has been paid on the bonds, and generally requires the Fund to distribute such income (net of deductible expenses, if any) to avoid being subject to federal income tax and to continue to maintain its status as a regulated investment company under the Code. Because no cash is generally received at the time of accrual, a Fund may be required to sell investments (even if such sales are not advantageous) to obtain sufficient cash to satisfy the distribution requirements applicable to the Fund under the Code. See “Taxes.”
Zero coupon securities may include treasury securities that have had their interest payments (“coupons”) separated from the underlying principal (“corpus”) by their holder, typically a custodian bank or investment brokerage firm. Once the holder of the security has stripped or separated corpus and coupons, it may sell each component separately. The principal or corpus is then sold at a deep discount because the buyer receives only the right to receive a future fixed payment on the security and does not receive any rights to periodic interest (cash) payments. Typically, the coupons are sold separately or grouped with other coupons with like maturity dates and sold bundled in such form. The underlying treasury security is held in book-entry form at the Federal Reserve Bank or, in the case of bearer securities (i.e., unregistered securities which are owned ostensibly by the bearer or holder thereof), in trust on behalf of the owners thereof. Purchasers of stripped obligations acquire, in effect, discount obligations that are economically identical to the zero coupon securities that the U.S. Treasury sells itself.
The U.S. Treasury has facilitated transfers of ownership of zero coupon securities by accounting separately for the beneficial ownership of particular interest coupon and corpus payments on Treasury securities through the Federal Reserve book-entry record keeping system. Under a Federal Reserve program known as “STRIPS” or “Separate Trading of Registered Interest and Principal of Securities,” the Fund may record its beneficial ownership of the coupon or corpus directly in the book-entry record-keeping system.
INVESTMENT LIMITATIONS
Fundamental Investment Limitations. Below are each Fund’s fundamental investment limitations (or policies), which the Fund cannot change without the consent of the holders of a majority of its outstanding shares. The term “majority of the outstanding shares” means the vote of (i) 67% or more of a Fund’s shares present at a meeting, if more than 50% of the outstanding shares of a Fund are present or represented by proxy, or (ii) more than 50% of a Fund’s outstanding shares, whichever is less.
For the bank borrowing policy, which contains percentage limits, the Fund must meet these percentage limits at all times, regardless of whether a portfolio transaction is occurring or the changes are caused by market conditions or other circumstances beyond the Fund’s control. For all other fundamental policies with a percentage limit (collectively, the “Other Policies”), a Fund must apply each policy to each proposed portfolio transaction. For example, both the initial purchase of a security and each subsequent addition to that position must satisfy the Other Policies. However, if a Fund satisfies the Other Policies at the time of a transaction, then later changes in percentages resulting from market conditions or other circumstances beyond the Fund’s control will not violate those policies; but the Fund would not be able to make subsequent additions to that position and other similar positions until the Other Policies are satisfied.
Several of these fundamental investment limitations include the defined term “1940 Act Laws, Interpretations and Exemptions.” This term means the 1940 Act and the rules and regulations promulgated thereunder, as such statutes, rules and regulations are amended from time to time or are interpreted from time to time by the staff of the SEC and any exemptive order or similar relief applicable to a Fund.
The Ultra Short Duration Fixed Income Fund may not, except as otherwise provided below:
| 1. | With respect to 75% of the Fund’s assets: (i) purchase securities of any issuer (except securities issued or guaranteed by the United States government, its agencies or instrumentalities and repurchase agreements involving such securities) if, as a result, more than 5% of the total assets of the Fund would be invested in the securities of such issuer; or (ii) acquire more than 10% of the outstanding voting securities of any one issuer. |
| | |
| 2. | Invest more than 25% of the Fund’s assets in securities issued by companies in a single industry or related group of industries. |
| | |
| 3. | Borrow money in an amount exceeding 33⅓% of the value of its total assets, provided that, for purposes of this limitation, investment strategies which either obligate a Fund to purchase securities or require a fund to segregate assets are not considered to be borrowings. Asset coverage of at least 300% is required for all borrowings, except where the Fund has borrowed money for temporary purposes in amounts not exceeding 5% of its total assets. Each Fund will not purchase securities while its borrowings exceed 5% of its total assets. |
| | |
| 4. | Make loans to other persons except through the lending of its portfolio securities, provided that this limitation does not apply to the purchase of debt securities and loan participations or engaging in direct corporate loans or repurchase agreements in accordance with its investment objectives and policies. The loans cannot exceed 33⅓% of a Fund’s assets. A Fund may also make loans to other investment companies to the extent permitted by the 1940 Act or any exemptions which may be granted to the Fund by the SEC. |
| | |
| | For example, at a minimum, a Fund will not make any such loans unless all requirements regarding common control and ownership of Fund shares are met. |
| | |
| 5. | Purchase or sell real estate, physical commodities, or commodities contracts, except that each Fund may purchase (i) marketable securities issued by companies which own or invest in real estate (including REITs), commodities, or commodities contracts; and (ii) commodities contracts relating to financial instruments, such as financial futures contracts and options on such contracts. |
| | |
| 6. | Issue senior securities as defined in the 1940 Act except as permitted by rule, regulation, or order of the SEC. |
| | |
| 7. | Act as an underwriter of securities of other issuers except as it may be deemed an underwriter in selling a portfolio security. |
| | |
| 8. | Invest in interests in oil, gas, or other mineral exploration or development programs and oil, gas, or mineral leases. |
The Sands Capital Select Growth Fund and Premium Yield Equity Fund may not:
| 1. | Purchase any securities which would cause 25% or more of the net assets of a Fund to be invested in the securities of one or more issuers conducting their principal business activities in the same industry, provided that this limitation does not apply to investments in obligations issued or guaranteed by the United States government, its agencies or instrumentalities. |
| | |
| 2. | Borrow money from banks in an amount which exceeds 33⅓% of the value of its total assets (including the amount borrowed) less a Fund’s liabilities (other than borrowings), except that a Fund may borrow up to an additional 5% of its total assets (not including the amount borrowed) from a bank for temporary or emergency purposes. |
| 3. | Purchase or sell real estate, although it may purchase or sell securities secured by real estate or interests therein, or securities issued by companies which invest in real estate, or interests therein (including REITs). |
| | |
| 4. | Purchase or sell physical commodities (which shall not, for purposes of this restriction, include currencies), or commodities contracts, except that each Fund may (i) purchase or sell marketable securities issued by companies which own or invest in commodities (including currencies), or commodities contracts; and (ii) enter into commodities and futures contracts relating to securities, currencies, indexes or any other financial instruments, such as financial futures contracts and options on such contracts. |
| | |
| 5. | Make loans to other persons except through the lending of its portfolio securities, provided that this limitation does not apply to the purchase of debt securities and loan participations or engaging in direct corporate loans or repurchase agreements in accordance with its investment objectives and policies. The loans cannot exceed 33⅓% of a Fund’s assets. A Fund may also make loans to other investment companies to the extent permitted by the 1940 Act or any exemptions which may be granted to the Fund by the SEC. |
| | |
| | For example, at a minimum, a Fund will not make any such loans unless all requirements regarding common control and ownership of Fund shares are met. |
| | |
| 6. | Issue senior securities (as defined in the 1940 Act) except as permitted by rule, regulation, or order of the SEC, or SEC staff interpretation. |
| | |
| 7. | Act as an underwriter of securities of other issuers except as it may be deemed an underwriter in selling a portfolio security or when selling its own shares. |
| | |
| 8. | The Premium Yield Equity Fund may not, with respect to 75% of its total assets, (i) purchase the securities of any issuer (except securities issued or guaranteed by the United States government, its agencies or instrumentalities or cash items) if, as a result, more than 5% of its total assets would be invested in the securities of such issuer; or (ii) acquire more than 10% of the outstanding voting securities of any one issuer. |
The Mid Cap Fund may not:
| 1. | Invest 25% or more of the value of its total assets in the securities (other than U.S. government securities) of issuers engaged in any single industry. |
| | |
| 2. | Issue senior securities representing stock, except to the extent permitted by the 1940 Act. In addition, the Fund will not issue senior securities representing indebtedness, except as otherwise permitted under the 1940 Act. |
| | |
| 3. | Underwrite securities of other issuers, except insofar as the Fund may be deemed an underwriter under the Securities Act in connection with the disposition of its portfolio securities. |
| | |
| 4. | Make loans of money or securities to other persons, except through purchasing fixed-income securities, lending portfolio securities or entering into repurchase agreements in a manner consistent with the Fund’s investment policies. |
| | |
| 5. | Purchase or sell physical commodities or commodity contracts, except that the Fund may purchase commodities contracts relating to financial instruments, such as financial futures contracts and options on such contracts. |
| | |
| 6. | Purchase or sell real estate or interests therein, except that it may invest in securities of issuers engaged in the real estate industry and may invest in securities secured by real estate or interests therein. |
| | |
| 7. | Purchase securities of an issuer, except as consistent with the maintenance of its status as an open-end diversified company under the 1940 Act, the rules, or regulations or any exemption, as such statute, rules, or regulations may be interpreted from time to time. |
| | |
| 8. | Borrow money except from banks and then in an amount which does not exceed 33⅓% of the value of its total assets (including the amount borrowed) less the Fund’s liabilities (other than borrowings), except that the Fund may borrow up to an additional 5% of its total assets (not including the amount borrowed) from a bank for temporary or emergency purposes. |
The Active Bond Fund, Arbitrage Fund, Emerging Markets Small Cap Fund, High Yield Fund, Merger Arbitrage Fund, Mid Cap Value Fund, Small Cap Fund, and Total Return Bond Fund may not:
| 1. | Diversification. For each diversified fund only, the Funds may not purchase securities of an issuer that would cause the Funds to fail to satisfy the diversification requirement for a diversified management company under the 1940 Act, the rules, or regulations or any exemption, as such statute, rules, or regulations may be amended or interpreted from time to time. |
| | |
| 2. | Borrowing Money. The Funds may not engage in borrowing except as permitted by the 1940 Act, any rule, regulation, or order under the 1940 Act or any SEC staff interpretation of the 1940 Act. |
| | |
| 3. | Underwriting. The Funds may not underwrite securities issued by other persons, except to the extent that, in connection with the sale or disposition of portfolio securities, a Fund may be deemed to be an underwriter under certain federal securities laws or in connection with investments in other investment companies. |
| | |
| 4. | Loans. The Funds may not make loans to other persons except that a Fund may (1) engage in repurchase agreements, (2) lend portfolio securities, (3) purchase debt securities, (4) purchase commercial paper, and (5) enter into any other lending arrangement permitted by the 1940 Act, any rule, regulation, or order under the 1940 Act or any SEC staff interpretation of the 1940 Act. |
| | |
| 5. | Real Estate. The Funds may not purchase or sell real estate except that a Fund may (1) hold and sell real estate acquired as a result of the Fund’s ownership of securities or other instruments (2) purchase or sell securities or other instruments backed by real estate or interests in real estate and (3) purchase or sell securities of entities or investment vehicles, including real estate investment trusts that invest, deal or otherwise engage in transactions in real estate or interests in real estate. |
| | |
| 6. | Commodities. The Funds may not purchase or sell physical commodities except that a Fund may (1) hold and sell physical commodities acquired as a result of the Fund’s ownership of securities or other instruments, (2) purchase or sell securities or other instruments backed by physical commodities, (3) purchase or sell options, and (4) purchase or sell futures contracts. |
| | |
| 7. | Concentration of Investments (except Active Bond Fund and High Yield Fund). The Funds may not purchase the securities of an issuer (other than securities issued or guaranteed by the United States government, its agencies or its instrumentalities) if, as a result, more than 25% of the Fund’s total assets would be invested in the securities of companies in the same industry or group of industries. |
| | |
| | Concentration (Active Bond Fund and High Yield Fund only). The Funds may not purchase the securities of an issuer (other than securities issued or guaranteed by the United States government, its agencies or its instrumentalities) if, as a result, more than 25% of a Fund’s total assets would be invested in the securities of companies whose principal business activities are in the same industry. |
| | |
| 8. | Senior Securities. The Funds may not issue senior securities except as permitted by the 1940 Act, any rule, regulation, or order under the 1940 Act or any SEC staff interpretation of the 1940 Act. |
The fundamental limitations for the Small Cap Value Fund are:
| 1. | Diversification. The Fund may not purchase securities of an issuer that would cause the Fund to fail to satisfy the diversification requirement for a diversified management company under the 1940 Act, the rules or regulations thereunder or any exemption therefrom, as such statute, rules or regulations may be amended or interpreted from time to time. |
| | |
| 2. | Borrowing Money. The Fund may not engage in borrowing except as permitted by the 1940 Act, any rule, regulation, or order under the 1940 Act or any SEC staff interpretation of the 1940 Act. |
| | |
| 3. | Underwriting. The Fund may not underwrite securities issued by other persons, except to the extent that, in connection with the sale or disposition of portfolio securities, the Fund may be deemed to be an underwriter under certain federal securities laws or in connection with investments in other investment companies. |
| | |
| 4. | Loans. The Fund may not make loans to other persons except that the Fund may (1) engage in repurchase agreements, (2) lend portfolio securities, (3) purchase debt securities, (4) purchase commercial paper, and (5) enter into any other |
| | lending arrangement permitted by the 1940 Act, any rule, regulation or order under the 1940 Act or any SEC staff interpretation of the 1940 Act. |
| | |
| 5. | Real Estate. The Fund may not purchase or sell real estate except that the Fund may (1) hold and sell real estate acquired as a result of the Fund’s ownership of securities or other instruments (2) purchase or sell securities or other instruments backed by real estate or interests in real estate and (3) purchase or sell securities of entities or investment vehicles, including real estate investment trusts that invest, deal or otherwise engage in transactions in real estate or interests in real estate. |
| | |
| 6. | Commodities. The Fund may not purchase or sell physical commodities except that the Fund may (1) hold and sell physical commodities acquired as a result of the Fund’s ownership of securities or other instruments, (2) purchase or sell securities or other instruments backed by physical commodities, (3) purchase or sell options, and (4) purchase or sell futures contracts. |
| | |
| 7. | Concentration of Investments. The Fund may not purchase the securities of an issuer (other than securities issued or guaranteed by the United States Government, its agencies or its instrumentalities) if, as a result, more than 25% of the Fund’s total assets would be invested in the securities of companies whose principal business activities are in the same industry. |
| | |
| 8. | Senior Securities. The Fund may not issue senior securities except as permitted by the 1940 Act, any rule, regulation or order under the 1940 Act or any SEC staff interpretation of the 1940 Act. |
Non-Fundamental Investment Limitations. Each Fund also has adopted certain non-fundamental investment limitations. A non-fundamental investment limitation may be amended by the Board without a vote of shareholders.
For the illiquid securities policy, which contains percentage limits, the Fund must meet these percentage limits at all times, regardless of whether a portfolio transaction is occurring or the changes are caused by market conditions or other circumstances beyond the Fund’s control. For all other non-fundamental policies with a percentage limit (collectively, the “Other Policies”), a Fund must apply each policy to each proposed portfolio transaction. For example, both the initial purchase of a security and each subsequent addition to that position must satisfy the Other Policies. However, if a Fund satisfies the Other Policies at the time of a transaction, then later changes in percentages resulting from market conditions or other circumstances beyond the Fund’s control will not violate those policies; but the Fund would not be able to make subsequent additions to that position and other similar positions until the Other Policies are satisfied.
The following non-fundamental investment limitations are apply to the Mid Cap Fund, Premium Yield Equity Fund, Sands Capital Select Growth Fund, Small Cap Value Fund, and Ultra Short Duration Fixed Income Fund. None of the Funds may:
| 1. | Pledge, mortgage, or hypothecate assets except to secure borrowings (not to exceed 33⅓% of a Fund’s assets) permitted by the Fund’s fundamental limitation on borrowing. |
| | |
| 2. | Purchase securities on margin or effect short sales, except that each Fund may (i) obtain short-term credits as necessary for the clearance of security transactions; (ii) provide initial and variation margin payments in connection with transactions involving futures contracts and options on such contracts; and (iii) make short sales “against the box” or in compliance with the SEC’s position regarding the asset segregation requirements imposed by Section 18 of the 1940 Act. |
| | |
| 3. | Purchase or hold illiquid securities, i.e., securities that cannot be disposed of for their approximate carrying value in seven days or less (which term includes repurchase agreements and time deposits maturing in more than seven days) if, in the aggregate, more than 15% (or 10%, with respect to the Ultra Short Duration Fixed Income Fund) of its net assets would be invested in illiquid securities. Unregistered securities sold in reliance on the exemption from registration in Section 4 (a)(2) of the 1933 Act and securities exempt from registration on re-sale pursuant to Rule 144A under the 1933 Act may be treated as liquid securities under procedures adopted by the Board. |
| | |
| 4. | The Ultra Short Duration Fixed Income Fund, Small Cap Value Fund, and Mid Cap Fund may not invest in companies for the purpose of exercising control. |
| | |
| 5. | The Ultra Short Duration Fixed Income Fund, Small Cap Value Fund, and Mid Cap Fund may not invest its assets in securities of any investment company, except as permitted by the 1940 Act. |
| | |
| 6. | The Ultra Short Duration Fixed Income Fund, Small Cap Value Fund, and Mid Cap Fund may not enter into futures contracts and options on futures contracts except as permitted by guidelines in the Funds’ SAI. |
| 7. | Make investments in securities when outstanding borrowings exceed 5% of a Fund’s total assets. |
The following non-fundamental investment policies apply to the Mid Cap Fund, Premium Yield Equity Fund, Sands Capital Select Growth Fund, Small Cap Value Fund, and Ultra Short Duration Fixed Income Fund:
| 1. | Each Fund may purchase securities on a when-issued basis and borrow money (borrowing money is permitted by the Funds’ fundamental limitation on borrowing). |
| | |
| 2. | Each Fund may enter into futures and options transactions. |
| | |
| 3. | Each Fund may hold up to 15% (10% for the Ultra Short Duration Fixed Income Fund) of its net assets in illiquid securities. |
| | |
| 4. | Each Fund, except the Ultra Short Duration Fixed Income Fund, may purchase convertible securities. |
| | |
| 5. | Each Fund may enter into repurchase agreements not to exceed 33⅓% of a Fund’s assets. |
| | |
| 6. | Each Fund may purchase fixed-income securities, including variable- and floating-rate instruments and zero coupon securities. |
| | |
| 7. | Each Fund, except for the Mid Cap Fund, may purchase Rule 144A securities and other restricted securities. |
| | |
| 8. | Each Fund may purchase obligations of supranational entities in an amount totaling less than 25% of the Fund’s total assets. |
| | |
| 9. | Each Fund may, for temporary defensive purposes, invest up to 100% of its total assets in money market instruments (including U.S. government securities, bank obligations, commercial paper rated in the highest rating category by an NRSRO and repurchase agreements involving the foregoing securities), shares of money market investment companies (to the extent permitted by applicable law and subject to certain restrictions) and cash. |
The following are non-fundamental investment limitations for each of the Active Bond Fund and the High Yield Fund as applicable (except that Item 1 below applies only to the High Yield Fund and Item 2 below applies only to the Active Bond Fund). The Active Bond Fund and High Yield Fund do not intend to pledge, mortgage or hypothecate their assets.
| 1. | Borrow money (including through reverse repurchase agreements or forward-roll transactions involving mortgage-backed securities or similar investment techniques entered into for leveraging purposes), except that the Fund may borrow for temporary or emergency purposes up to 10% of its total assets; provided, however, that no Fund may purchase any security while outstanding borrowings exceed 5%. This limitation applies only to the High Yield Fund; |
| | |
| 2. | Borrow money, except through reverse repurchase agreements and dollar rolls, and except that the Fund may borrow through means other than reverse repurchase agreements or dollar rolls for temporary or emergency purposes up to 10% of its total assets; provided, however, that no Fund may purchase any security while outstanding borrowings, excluding dollar rolls and reverse repurchase agreements, exceed 5%. This limitation applies only to the Active Bond Fund; |
| | |
| 3. | Pledge, mortgage, or hypothecate for any purpose in excess of 10% of a Fund’s total assets (taken at market value), provided that collateral arrangements with respect to options and futures, including deposits of initial deposit and variation margin, dollar rolls, and reverse repurchase agreements are not considered a pledge of assets for purposes of this restriction; |
| | |
| 4. | Purchase any security or evidence of interest therein on margin, except that such short-term credit as may be necessary for the clearance of purchases and sales of securities may be obtained and except that deposits of initial deposit and variation margin may be made in connection with the purchase, ownership, holding or sale of futures; |
| | |
| 5. | Sell any security which it does not own unless by virtue of its ownership of other securities it has at the time of sale a right to obtain securities, without payment of further consideration, equivalent in kind and amount to the securities sold and provided that if such right is conditional the sale is made upon the same conditions; |
| | |
| 6. | Invest for the purpose of exercising control or management; |
| | |
| 7. | Hold more than 15% of a Fund’s net assets (taken at the greater of cost or market value) in securities that are illiquid or not readily marketable (defined as a security that cannot be sold in the ordinary course of business within seven days at |
| | approximately the value at which the Fund has valued the security) not including (a) Rule 144A securities that have been determined to be liquid by the Board; and (b) commercial paper that is sold under section 4(a)(2) of the 1933 Act which is not traded flat or in default as to interest or principal and either (i) is rated in one of the two highest categories by at least two nationally recognized statistical rating organizations and the Fund’s Board has determined the commercial paper to be liquid; or (ii) is rated in one of the two highest categories by one nationally recognized statistical rating organization and the Fund’s Board has determined that the commercial paper is equivalent quality and is liquid; |
| | |
| 8. | Invest more than 10% of a Fund’s total assets in securities that are restricted from being sold to the public without registration under the 1933 Act (other than Rule 144A Securities deemed liquid by the Fund’s Board); |
| | |
| 9. | Purchase securities of any issuer if such purchase at the time thereof would cause the Fund to hold more than 10% of any class of securities of such issuer, for which purposes all indebtedness of an issuer shall be deemed a single class and all preferred stock of an issuer shall be deemed a single class, except that futures or option contracts shall not be subject to this restriction; |
| | |
| 10. | Make short sales of securities or maintain a short position, unless at all times when a short position is open it owns an equal amount of such securities or securities convertible into or exchangeable, without payment of any further consideration, for securities of the same issue and equal in amount to, the securities sold short, and unless not more than 10% of a Fund’s net assets (taken at market value) is represented by such securities, or securities convertible into or exchangeable for such securities, at any one time (the Funds have no current intention to engage in short selling); and |
| | |
| 11. | Purchase puts, calls, straddles, spreads, and any combination thereof if by reason thereof the value of the Fund’s aggregate investment in such classes of securities will exceed 5% of its total assets. |
The following descriptions of certain provisions of the 1940 Act may assist investors in understanding the above policies and restrictions. The following are also non-fundamental investment limitations of the Active Bond Fund and High Yield Fund.
| 1. | Diversification. Under the 1940 Act, a diversified investment management company may not, with respect to 75% of its total assets, (i) purchase securities of any issuer (except securities issued or guaranteed by the U.S. government, its agents or instrumentalities, cash item or, in certain circumstances, securities of other investment companies) if, as a result, more than 5% of its total assets would be invested in the securities of such issuer; or (ii) acquire more than 10% of the outstanding voting securities of any one issuer. |
| | |
| 2. | Borrowing. The 1940 Act allows a fund to borrow from any bank (including pledging, mortgaging or hypothecating assets) in an amount up to 33⅓% of its total assets (not including temporary borrowings not in excess of 5% of its total assets). |
| | |
| 3. | Underwriting. Under the 1940 Act, underwriting securities involves a fund purchasing securities directly from an issuer for the purpose of selling (distributing) them or participating in any such activity either directly or indirectly. Under the 1940 Act, a diversified fund may not make any commitment as underwriter, if immediately thereafter the amount of its outstanding underwriting commitments, plus the value of its investments in securities of issuers (other than investment companies) of which it owns more than 10% of the outstanding voting securities, exceeds 25% of the value of its total assets. |
| | |
| 4. | Lending. Under the 1940 Act, a Fund may only make loans if expressly permitted by its investment policies. The Fund’s current investment policy on lending is as follows: the Fund may not make loans if, as a result, more than 33⅓% of its total assets would be lent to other parties, except that the Fund may: (i) purchase or hold debt instruments in accordance with its investment objective and policies; (ii) enter into repurchase agreements that are collateralized fully; and (iii) engage in securities lending as described in its SAI. |
| | |
| 5. | Senior Securities. Senior securities may include any obligation or instrument issued by a fund evidencing indebtedness. The 1940 Act generally prohibits funds from issuing senior securities, although it does not treat certain transactions as senior securities, such as certain borrowings, short sales, reverse repurchase agreements, firm commitment agreements and standby commitments, with appropriate earmarking or segregation of assets to cover such obligation. |
A Fund will determine compliance with the fundamental and non-fundamental investment restriction percentages above (with the exception of the restriction relating to borrowing) and other investment restrictions in this SAI immediately after and as a result of its acquisition of such security or other asset. Accordingly, a Fund will not consider changes in values, net assets, or other circumstances when determining whether the investment complies with its investment restrictions.
TRUSTEES AND OFFICERS OF THE TRUST
The following is a list of the Trustees and executive officers of the Trust, the length of time served, principal occupations for the past five years, number of funds overseen in the Touchstone Fund Complex and other directorships held. All Funds managed by the Advisor are part of the “Touchstone Fund Complex.” The Touchstone Fund Complex consists of the Trust, Touchstone Institutional Funds Trust, Touchstone Strategic Trust and Touchstone Variable Series Trust. The Trustees, who are not interested persons of the Trust, as defined in the 1940 Act, are referred to as “Independent Trustees.”
Interested Trustees(1):
| | | | | Term of | | | | | | |
| | | | | Office | | | | Number of Funds | | |
| | | Position | | And | | Principal | | Overseen | | |
| Name | | Held | | Length of | | Occupation(s) | | in the | | Other Directorships |
| Address | | with | | Time | | During | | Touchstone | | Held During the Past 5 |
| Year of Birth | | Trust | | Served | | Past 5 Years | | Fund Complex(2) | | Years(3) |
Jill T. McGruder
Touchstone Advisors, Inc.
303 Broadway
Suite 1100
Cincinnati, Ohio
45202
Year of Birth: 1955 | | Trustee and President | | Until retirement at age 75 or until she resigns or is removed
Trustee since 1999 | | President and CEO of IFS Financial Services, Inc. (a holding company). | | 41 | | IFS Financial Services, Inc. (a holding company) from 1999 to the present; Integrity and National Integrity Life Insurance Co. from 2005 to the present; Touchstone Securities (the Trust’s distributor) from 1999 to the present; Touchstone Advisors (the Trust’s investment advisor and administrator) from 1999 to the present; W&S Brokerage Services (a brokerage company) from 1999 to the present; W&S Financial Group Distributors (a distribution company) from 1999 to the present; Cincinnati Analysts, Inc. from 2012 to present; Columbus Life Insurance Co. from 2016 to present; and The Lafayette Life Insurance Co. from 2016 to present. |
Independent Trustees:
| | | | | Term of | | | | | | |
| | | | | Office | | | | | | |
| | | Position | | And | | Principal | | Number of Funds | | Other |
| Name | | Held | | Length of | | Occupation | | Overseen in the | | Directorships |
| Address | | with | | Time | | (s) During | | Touchstone Fund | | Held During the Past 5 |
| Year of Birth | | Trust | | Served | | Past 5 Years | | Complex(2) | | Years(3) |
Phillip R. Cox
c/o Touchstone
Advisors, Inc.
303 Broadway
Suite 1100
Cincinnati, Ohio
45202
Year of Birth: 1947 | | Trustee | | Until retirement at age 75 or until he resigns or is removed
Trustee since 1999 | | President and Chief Executive Officer of Cox Financial Corp. (a financial services company) from 1971 to the present. | | 41 | | Director of Cincinnati Bell (a communications company) from 1994 to the present; Bethesda Inc. (a hospital) from 2005 to the present; Timken Co. (a manufacturing company) from 2004 to the 2014; TimkenSteel from 2014 to the present; Diebold, Inc. (a technology solutions company) from 2004 to the present; and Ohio Business Alliance for Higher Education and the Economy from 2005 to the present. |
| | | | | | | | | | | |
William C. Gale
c/o Touchstone
Advisors, Inc.
303 Broadway
Suite 1100
Cincinnati, Ohio
45202
Year of Birth: 1952 | | Trustee | | Until retirement at age 75 or until he resigns or is removed
Trustee since 2013 | | Retired; formerly Senior Vice President and Chief Financial Officer (from 2003 to January 2015) of Cintas Corporation (a business services company). | | 41 | | None. |
| | | | | | | | | | | |
Susan J.
Hickenlooper
c/o Touchstone
Advisors, Inc.
303 Broadway
Suite 1100
Cincinnati, Ohio
Year of Birth: 1946 | | Trustee | | Until retirement at age 75 or until she resigns or is removed
Trustee since 2009 | | Retired; formerly Financial Analyst for Impact 100 (charitable organization) from November 2012 to 2013. | | 41 | | Trustee of Diocese of Southern Ohio from 2014 to the present; and Trustee of Cincinnati Parks Foundation from 2000 to 2016. |
| | | | | | | | | | | |
Kevin A. Robie
c/o Touchstone
Advisors, Inc.
303 Broadway
Suite 1100
Cincinnati, Ohio
45202
Year of Birth: 1956 | | Trustee | | Until retirement at age 75 or until he resigns or is removed
Trustee since 2013 | | Vice President of Portfolio Management at Soin International LLC (a private multinational holding company) from 2004 to the present. | | 41 | | SaverSystems, Inc. from 2015 to present; Director of Buckeye EcoCare, Inc. (a lawn care company) from 2013 to the present; Trustee of Dayton Region New Market Fund, LLC (a private fund) from 2010 to the present; Trustee of the Entrepreneurs Center, Inc. (a small business incubator) from 2006 to the present; Leadership Dayton - Dayton Area Chamber of Commerce from 2011 to present. |
| | | | | Term of | | | | | | |
| | | | | Office | | | | | | |
| | | Position | | And | | Principal | | Number of Funds | | Other |
| Name | | Held | | Length of | | Occupation | | Overseen in the | | Directorships |
| Address | | with | | Time | | (s) During | | Touchstone Fund | | Held During the Past 5 |
| Year of Birth | | Trust | | Served | | Past 5 Years | | Complex(2) | | Years(3) |
Edward J.
VonderBrink
c/o Touchstone
Advisors, Inc.
303 Broadway
Suite 1100
Cincinnati, Ohio
45202
Year of Birth: 1944 | | Trustee | | Until retirement at age 75 or until he resigns or is removed
Trustee since 2013 | | Consultant, VonderBrink Consulting LLC from 2000 to the present. | | 41 | | Director of Streamline Health Solutions, Inc. (healthcare IT) from 2006 to 2015; Mercy Health from 2013 to the present; Mercy Health Foundation (healthcare nonprofit) from 2006 to the present; and Al Neyer Inc. (a construction company) from 2013 to the present; and BASCO Shower Door from 2010 to the present. |
| (1) | Ms. McGruder, as a director of the Advisor and the Distributor and an officer of affiliates of the Advisor and the Distributor, is an “interested person” of the Trust within the meaning of Section 2(a)(19) of the 1940 Act. |
| (2) | As of January 27, 2017, the Touchstone Fund Complex consists of 13 series of the Trust, 1 series of Touchstone Institutional Funds Trust, 21 series of Touchstone Strategic Trust and 6 variable annuity series of Touchstone Variable Series Trust. |
| (3) | Each Trustee is also a Trustee of Touchstone Institutional Funds Trust, Touchstone Strategic Trust and Touchstone Variable Series Trust. |
Principal Officers:
| Name | | | | | | |
| Address | | Position | | Term of Office and Length of | | Principal Occupation(s) During |
| Year of Birth | | Held with Trust(1) | | Time Served | | Past 5 Years |
Jill T. McGruder
Touchstone
Advisors, Inc.
303 Broadway
Suite 1100
Cincinnati, Ohio 45202
Year of Birth: 1955 | | President and Trustee | | Until resignation, removal or disqualification
President since 2006 | | See biography above. |
| | | | | | | |
Steven M. Graziano
Touchstone Advisors, Inc.
303 Broadway
Suite 1100
Cincinnati, Ohio 45202
Year of Birth: 1954 | | Vice President | | Until resignation, removal or disqualification
Vice President since 2009 | | President of Touchstone Advisors, Inc. |
| | | | | | | |
Timothy D. Paulin
Touchstone Advisors, Inc.
303 Broadway
Suite 1100
Cincinnati, Ohio 45202
Year of Birth: 1963 | | Vice President | | Until resignation, removal or disqualification
Vice President since 2010 | | Senior Vice President of Investment Research and Product Management of Touchstone Advisors, Inc. |
| Name | | | | | | |
| Address | | Position | | Term of Office and Length of | | Principal Occupation(s) During |
| Year of Birth | | Held with Trust(1) | | Time Served | | Past 5 Years |
Timothy S. Stearns
Touchstone Advisors Inc.
303 Broadway
Suite 1100
Cincinnati, Ohio 45202
Year of Birth: 1963 | | Chief Compliance Officer | | Until resignation, removal or disqualification
Chief Compliance Officer since 2013 | | Chief Compliance Officer of Touchstone Advisors, Inc.; Chief Compliance Officer of Envestnet Asset Management, Inc. (2009 to 2013). |
| | | | | | | |
Terrie A. Wiedenheft
Touchstone
Advisors, Inc.
303 Broadway
Suite 1100
Cincinnati, Ohio 45202
Year of Birth: 1962 | | Controller and Treasurer | | Until resignation, removal or disqualification
Controller and Treasurer since 2006 | | Senior Vice President, Chief Financial Officer, and Chief Operations Officer of IFS Financial Services, Inc. (a holding company). |
| | | | | | | |
Ellen Blanchard
BNY Mellon Investment
Servicing (US) Inc.
201 Washington Street,
34th Fl
Boston, Massachusetts
02108
Year of Birth: 1973 | | Secretary | | Until resignation, removal or disqualification
Secretary since 2015 | | Director of BNY Mellon Investment Servicing (US) Inc. |
| (1) | Each officer also holds the same office with Touchstone Institutional Funds Trust, Touchstone Strategic Trust and Touchstone Variable Series Trust. |
Additional Information about the Trustees
The Board believes that each Trustee’s experience, qualifications, attributes, or skills on an individual basis and in combination with those of the other Trustees lead to the conclusion that the Trustees possess the requisite experience, qualifications, attributes, and skills to serve on the Board. The Board believes that the Trustees’ ability to review critically, evaluate, question and discuss information provided to them; to interact effectively with the Advisor, sub-advisors, other service providers, counsel and independent auditors; and to exercise effective business judgment in the performance of their duties, support this conclusion. The Board has also considered the contributions that each Trustee can make to the Board and the Funds.
In addition, the following specific experience, qualifications, attributes and skills apply as to each Trustee: Ms. McGruder has experience as a chief executive officer of a financial services company and director of various other businesses, as well as executive and leadership roles within the Advisor; Mr. Cox has experience as a chief executive officer of a financial services company and as a director of companies from varied industries; Mr. Gale has experience as a chief financial officer, an internal auditor of various global companies, and has accounting experience as a manager at a major accounting firm; Ms. Hickenlooper has executive and board experience at various businesses, foundations and charitable organizations; Mr. Robie has portfolio management experience at a private multinational holding company; and Mr. VonderBrink has experience as a consultant and director of other corporations. In its periodic self-assessment of its effectiveness, the Board considers the complementary individual skills and experience of the individual Trustees primarily in the broader context of the Board’s overall composition so that the Board, as a body, possesses the appropriate (and appropriately diverse) skills and experience to oversee the business of the Funds. References to the qualifications, attributes and skills of Trustees are pursuant to requirements of the SEC, do not constitute holding out the Board or any Trustee as having any special expertise or experience, and shall not impose any greater responsibility on any Trustee or on the Board by reason thereof.
Board Structure
The Board is composed of five Independent Trustees and one Interested Trustee, Jill T. McGruder, who is Chairperson of the Board. The full Board has appointed Phillip R. Cox to serve as the Lead Independent Trustee. Ms. McGruder oversees the day-to-day business affairs of the Trust and communicates with Mr. Cox regularly on various Trust issues, as appropriate. Mr. Cox, among other things, chairs meetings of the Independent Trustees, serves as a spokesperson for the Independent Trustees and serves
as a liaison between the Independent Trustees and the Trust’s management between Board meetings. Except for any duties specified, the designation of Lead Independent Trustee does not impose on such Independent Trustee any duties, obligations or liability that is greater than the duties, obligations or liability imposed on such person as a member of the Board, generally. The Independent Trustees are advised at these meetings, as well as at other times, by separate, independent legal counsel.
The Board holds four regular meetings each year to consider and address matters involving the Trust and its Funds. The Board also may hold special meetings to address matters arising between regular meetings. The Independent Trustees also regularly meet outside the presence of management and are advised by independent legal counsel. These meetings may take place in-person or by telephone.
The Board has established a committee structure that includes an Audit Committee and a Governance Committee (discussed in more detail below). The Board conducts much of its work through these Committees. Each Committee is comprised entirely of Independent Trustees, which ensures that the Funds have effective and independent governance and oversight.
The Board reviews its structure regularly and believes that its leadership structure, including having a super-majority of Independent Trustees, coupled with an Interested Chairperson and a Lead Independent Trustee, is appropriate and in the best interests of the Trust because it allows the Board to exercise informed and independent judgment over matters under its purview, and it allocates areas of responsibility among committees and the full Board in a manner that enhances effective oversight. The Board believes that having an Interested Chairperson is appropriate and in the best interests of the Trust given: (1) the extensive oversight provided by the Trust’s Advisor over the affiliated and unaffiliated sub-advisors that conduct the day-to-day management of the Funds of the Trust, (2) the extent to which the work of the Board is conducted through the standing Committees, (3) the extent to which the Independent Trustees meet regularly, together with independent legal counsel, in the absence of the Interested Chairperson and (4) the Interested Chairperson’s additional roles as a director of the Advisor and the Distributor and senior executive of IFS Financial Services, Inc., the Advisor’s parent company, and of other affiliates of the Advisor, which enhance the Board’s understanding of the operations of the Advisor and the role of the Trust and the Advisor within Western & Southern Financial Group, Inc. The Board also believes that the role of the Lead Independent Trustee within the leadership structure is integral to promoting independent oversight of the Funds’ operations and meaningful representation of the shareholders’ interests. In addition, the Board believes its leadership structure facilitates the orderly and efficient flow of information to the Independent Trustees from the Trust’s management.
Board Oversight of Risk
Consistent with its responsibilities for oversight of the Trust and its Funds, the Board, among other things, oversees risk management of each Fund’s investment program and business affairs directly and through the committee structure that it has established. Risks to the Funds include, among others, investment risk, credit risk, liquidity risk, valuation risk and operational risk, as well as the overall business risk relating to the Funds. The Board has adopted, and periodically reviews, policies and procedures designed to address these risks. Under the overall oversight of the Board, the Advisor, sub-advisors, and other key service providers to the Funds, including the administrator, the distributor, the transfer agent, the custodian, and the independent auditors, have also implemented a variety of processes, procedures and controls to address these risks. Different processes, procedures and controls are employed with respect to different types of risks. These processes include those that are embedded in the conduct of regular business by the Board and in the responsibilities of officers of the Trust and other service providers.
The Board requires senior officers of the Trust, including the Chief Compliance Officer (“CCO”), to report to the Board on a variety of matters at regular and special meetings of the Board, including matters relating to risk management. The Board and the Audit Committee receive regular reports from the Trust’s independent auditors on internal control and financial reporting matters. On at least a quarterly basis, the Board meets with the Trust’s CCO, including meetings in executive sessions, to discuss issues related to portfolio compliance and, on at least an annual basis, receives a report from the CCO regarding the effectiveness of the Trust’s compliance program. In addition, the Board also receives reports from the Advisor on the investments and securities trading of the Funds, including their investment performance and asset weightings compared to appropriate benchmarks, as well as reports regarding the valuation of those investments. The Board also receives reports from the Trust’s primary service providers on a periodic or regular basis, including the sub-advisors to the Funds.
Standing Committees of the Board
The Board is responsible for overseeing the operations of the Trust in accordance with the provisions of the 1940 Act and other applicable laws and the Trust’s Declaration of Trust. The Board has established the following Committees to assist in its oversight functions. Each Committee is composed entirely of Independent Trustees.
Audit Committee. All of the Independent Trustees are members of the Audit Committee. The Audit Committee is responsible for overseeing the Trust’s accounting and financial reporting policies, practices and internal controls. Mr. Gale is the Chair of the Audit Committee. During the fiscal year ended September 30, 2016, the Audit Committee held four meetings.
Governance Committee. All of the Independent Trustees are members of the Governance Committee. The Governance Committee is responsible for overseeing the Trust’s compliance program and compliance issues, procedures for valuing securities and responding to any pricing issues. Ms. Hickenlooper is the Chair of the Governance Committee. The Governance Committee held four meetings during the fiscal year ended September 30, 2016.
In addition, the Governance Committee is responsible for recommending candidates to serve on the Board. The Governance Committee will consider shareholder recommendations for nomination to the Board only in the event that there is a vacancy on the Board. Shareholders who wish to submit recommendations for nominations to the Board to fill the vacancy must submit their recommendations in writing to Ms. Susan J. Hickenlooper, Chair of the Governance Committee, c/o Touchstone Funds, 303 Broadway, Suite 1100, Cincinnati, Ohio 45202. Shareholders should include appropriate information on the background and qualifications of any person recommended to the Governance Committee (e.g., a resume), as well as the candidate’s contact information and a written consent from the candidate to serve if nominated and elected. Shareholder recommendations for nominations to the Board will be accepted on an ongoing basis and such recommendations will be kept on file for consideration in the event of a future vacancy on the Board.
Trustee Ownership in the Touchstone Funds
The following table reflects the Trustees’ beneficial ownership in the Funds (i.e., dollar range of securities in each Fund) and the Touchstone Fund Complex as of December 31, 2016.
| | | Interested Trustee | | | | | | Independent Trustees | | | | |
| | | Jill T. | | Phillip R. | | William C. | | Susan J. | | Kevin A. | | Edward J. |
| Funds | | McGruder | | Cox | | Gale | | Hickenlooper | | Robie | | VonderBrink |
| Active Bond Fund(1) | | Over $100,000 | | None | | None | | None | | None | | | None | |
| Arbitrage Fund | | None | | None | | None | | None | | None | | | None | |
| Emerging Markets Small Cap Fund | | $1-$10,000 | | None | | None | | None | | None | | | None | |
| High Yield Fund(1) | | Over $100,000 | | None | | None | | None | | None | | | $10,000-
$50,000 | |
| Merger Arbitrage Fund | | None | | None | | None | | $10,000-$50,000 | | None | | | None | |
| Mid Cap Fund | | None | | None | | None | | $50,000-$100,000 | | None | | | None | |
| Mid Cap Value Fund | | $50,001-$100,000 | | None | | None | | $50,000-$100,000 | | None | | | None | |
| Premium Yield Equity Fund | | None | | None | | None | | None | | None | | | None | |
| Sands Capital Select Growth Fund | | $10,000-$50,000 | | None | | None | | $50,000-$100,000 | | None | | | $10,000-
$50,000 | |
| Small Cap Fund | | Over $100,000 | | None | | None | | $50,000-$100,000 | | None | | | None | |
| Small Cap Value Fund | | None | | None | | None | | None | | None | | | None | |
| Total Return Bond Fund | | None | | None | | None | | None | | None | | | None | |
| Ultra Short Duration Fixed Income Fund | | None | | None | | None | | None | | None | | | None | |
| Aggregate Dollar Range of Securities in the Touchstone Fund Complex(2) | | Over $100,000 | | None | | None | | Over $100,000 | | None | | | Over
$100,000 | |
| (1) | On January 27, 2017, the Active Bond Fund and the High Yield Fund, each previously a series of Touchstone Investment Trust, were reorganized into the Touchstone Funds Group Trust. |
| (2) | As of January 27, 2017, the Touchstone Fund Complex consisted of 13 series of the Trust, 1 series of Touchstone Institutional Funds Trust, 21 series of Touchstone Strategic Trust and 6 variable annuity series of Touchstone Variable Series Trust. |
Trustee Compensation
The following table shows the compensation paid to the Trustees by the Trust and the aggregate compensation paid by the Touchstone Fund Complex during the fiscal year ended September 30, 2016.
| Name | | Compensation from the Trust | | Aggregate Compensation from the Touchstone Fund Complex(1) |
| Interested Trustee | | | | | | | | |
| Jill T. McGruder | | $ | 0 | | | $ | 0 | |
| Independent Trustees(2) | | | | | | | | |
| Phillip R. Cox | | $ | 40,282 | | | $ | 145,500 | |
| William C. Gale | | $ | 36,947 | | | $ | 129,000 | |
| Susan J. Hickenlooper | | $ | 36,947 | | | $ | 129,000 | |
| Kevin A. Robie | | $ | 33,611 | | | $ | 122,500 | |
| Edward J. VonderBrink | | $ | 33,611 | | | $ | 122,500 | |
(1) As of January 27, 2017, the Touchstone Fund Complex consists of 13 series of the Trust, 1 series of Touchstone Institutional Funds Trust, 21 series of Touchstone Strategic Trust and 6 variable annuity series of Touchstone Variable Series Trust.
(2) The Independent Trustees are eligible to participate in the Touchstone Trustee Deferred Compensation Plan, which allows them to defer payment of a specific amount of their Trustee compensation, subject to a minimum quarterly reduction of $1,000. There was $95,000 deferred compensation accrued by the Independent Trustees from the Touchstone Fund Complex during the fiscal year ended September 30, 2016.
The following table shows the Trustee quarterly compensation schedule:
| | | Quarterly
Retainer | | | Governance
Committee | | | Audit
Committee | | | Board
Meeting Fees | |
| Compensation | | | | | | | | | | | | | | | | |
| Beginning 1/1/16 | | | $15,500 | | | | $4,500 | | | | $4,500 | | | | $5,000 | |
| 1/1/14-12/31/15 | | | $13,500 | | | | $4,500 | | | | $4,500 | | | | $5,000 | |
| | | | | | | | | | | | | | | | | |
| Lead Independent Trustee Fees | | | | | | | | | | | | | | | | |
| Beginning 1/1/16 | | | $6,000 | | | | | | | | | | | | | |
| 1/1/14-12/31/15 | | | $5,000 | | | | | | | | | | | | | |
| | | | | | | | | | | | | | | | | |
| Committee Chair Fees | | | | | | | | | | | | | | | | |
| Beginning 1/1/16 | | | $1,000 | | | | $2,000 | | | | $2,000 | | | | | |
| 1/1/14-12/31/15 | | | $1,000 | | | | $1,500 | | | | $1,500 | | | | | |
Telephonic Meeting Attendance Fee = $1,500
All fees are typically divided equally among the Funds comprising the Touchstone Fund Complex.
THE ADVISOR
Touchstone Advisors, Inc. (the “Advisor” or “Touchstone Advisors”), is the Funds’ investment advisor under the terms of an advisory agreement (the “Advisory Agreement”) dated February 17, 2006. Under the Advisory Agreement, the Advisor reviews, supervises, and administers the Funds’ investment program, subject to the oversight of, and policies established by, the Board of the Trust (the “Trustees”). The Advisor determines the appropriate allocation of assets to each Fund’s sub-advisor(s).
The Advisory Agreement provides that the Advisor shall not be liable for any error of judgment or mistake of law or for any loss arising out of any investment or for any act or omission in carrying out its duties, but shall not be protected against any liability to the Trust or its shareholders by reason of willful misfeasance, bad faith or gross negligence on its part in the performance of its duties or from reckless disregard of its obligations or duties.
The continuance of the Advisory Agreement as to the Funds after the first two years must be specifically approved at least annually (i) by the vote of the Board or by a vote of the shareholders of the Fund, and, in either case, (ii) by the vote of a majority of the Board who are not parties to the Advisory Agreement or “interested persons” (as defined in the 1940 Act) of any party thereto, cast in person at a meeting called for the purpose of voting on such approval. The Advisory Agreement will terminate automatically in the event of its assignment, and is terminable at any time without penalty by the Board or, with respect to a Fund, by a majority of the outstanding shares of the Fund, on not less than 30 days’ nor more than 60 days’ written notice to the Advisor, or by the Advisor on 90 days’ written notice to the Trust.
The Advisor is a wholly-owned subsidiary of IFS Financial Services, Inc., which is a wholly-owned subsidiary of Western-Southern Life Assurance Company. Western-Southern Life Assurance Company is a wholly-owned subsidiary of The Western and Southern
Life Insurance Company, which is a wholly-owned subsidiary of Western & Southern Financial Group, Inc. Western & Southern Financial Group is a wholly-owned subsidiary of Western & Southern Mutual Holding Company (“Western & Southern”). Western & Southern is located at 400 Broadway, Cincinnati, Ohio 45202. Ms. Jill T. McGruder may be deemed to be an affiliate of the Advisor because she is a Director of the Advisor and an officer of affiliates of the Advisor. Ms. McGruder, by reason of these affiliations, may directly or indirectly receive benefits from the advisory fees paid to the Advisor.
Manager-of-Managers Structure
The SEC has granted an exemptive order that permits the Trust or the Advisor, under certain circumstances, to select or change unaffiliated sub-advisors, enter into new sub-advisory agreements or amend existing sub-advisory agreements without first obtaining shareholder approval (a “manager-of-managers structure”). The Trust, on behalf of each Fund, seeks to achieve its investment goal by using a “manager-of-managers” structure. Under a manager-of-managers structure, the Advisor acts as investment advisor, subject to direction from and oversight by the Board, to allocate and reallocate the Fund’s assets among sub-advisors, and to recommend that the Trustees hire, terminate or replace unaffiliated sub-advisors without shareholder approval. By reducing the number of shareholder meetings that may have to be held to approve new or additional sub-advisors for the Fund, the Trust anticipates that there will be substantial potential cost savings, as well as the opportunity to achieve certain management efficiencies, with respect to any Fund in which the manager-of-managers approach is chosen. Shareholders of a Fund will be notified of a change in its sub-advisor.
Fees Paid to the Advisor
For its services, the Advisor is entitled to receive an investment advisory fee from each Fund at an annualized rate, based on the average daily net assets of the Fund, as set forth below. Each Fund’s advisory fee is accrued daily and paid monthly, based on the Fund’s average net assets during the current month.
| Fund | | Investment Advisory Fee |
| Active Bond Fund | | 0.40% on the first $300 million of assets; |
| | | 0.35% on assets over $300 million |
| | | |
| Arbitrage Fund | | 1.05% on the first $500 million of assets; |
| | | 1.00% on the next $500 million of assets; and |
| | | 0.95% on assets over $1 billion |
| | | |
| Emerging Markets Small Cap Fund | | 1.05% on the first $200 million of assets; |
| | | 1.00% on the next $200 million of assets; and |
| | | 0.90% on assets over $400 million |
| | | |
| High Yield Fund | | 0.60% on the first $50 million of assets; |
| | | 0.50% on the next $250 million of assets; and |
| | | 0.45% on assets over $300 million |
| | | |
| Merger Arbitrage Fund | | 1.05% |
| | | |
| Mid Cap Fund | | 0.80% on the first $500 million; |
| | | 0.75% on the next $500 million; and |
| | | 0.70% on assets over $1 billion |
| | | |
| Mid Cap Value Fund | | 0.85% on the first $100 million of assets; |
| | | 0.80% on the next $300 million of assets; and |
| | | 0.75% on assets over $400 million |
| | | |
| Premium Yield Equity Fund | | 0.70% on the first $100 million of assets; and |
| | | 0.65% on assets over $100 million |
| | | |
| Small Cap Fund | | 0.85% |
| | | |
| Small Cap Value Fund | | 0.90% |
| | | |
| Total Return Bond Fund | | 0.35% |
| | | |
| Ultra Short Duration Fixed Income Fund | | 0.25% |
As described in the prospectus, the Sands Capital Select Growth Fund is subject to base investment advisory fees that may be adjusted if the Fund outperforms or under-performs a stated benchmark. The “Highest/Lowest Possible Advisory Fee” column represents the maximum and minimum amount that the Advisor may receive pursuant to the performance fee under the Advisory Agreement. Set forth below is information about the advisory fee arrangements of the Sands Capital Select Growth Fund:
| Fund | | Benchmark | | Required Excess Performance | | Base Advisory Fee | | Annual
Adjustment
Rate | | Highest /
Lowest
Possible
Advisory Fee |
| Sands Capital Select Growth Fund | | Russell 1000®
Growth Index | | | +/-2.50% | | | 0.85% on the first $1 billion of assets;
0.80% on the next $500 million of assets;
0.75% on the next $500 million of assets;
0.70% on assets above $2 billion | | +/-0.15% | | 1.00% / 0.55% |
The Sands Capital Select Growth Fund’s performance adjustment is calculated and paid monthly by comparing the Fund’s performance to the performance of the Fund’s benchmark over a “performance period.” The performance period consists of a rolling 12-month period that includes the most current month for which performance is available plus the previous 11 months. The Fund’s annual performance adjustment rate is multiplied by the average net assets of the Fund over the performance period, which is then multiplied by a fraction, the numerator of which is the number of days in the current month and the denominator of which is 365 (366 in leap years). The resulting amount is then added (in the case of over-performance) or subtracted from (in the case of underperformance) to the Fund’s base fee.
For example, assume that the Sands Capital Select Growth Fund’s average net assets as of March 31 were $55,000,000, the average net assets of the Fund over the 12-month period ending March 31 was $50,000,000, and that it is not a leap year. The Fund’s base fee for March is $39,705 ($55,000,000 x 0.85%, x 31/365). If the Fund outperformed (or underperformed) the Russell 1000® Growth Index by less than 2.50% over this performance period, then there is no adjustment to the Fund’s base fee. If the Fund outperformed (or underperformed) the Russell 1000® Growth Index by 2.50% or more over this performance period, then the Advisor’s advisory fee would increase (or decrease) by a maximum of $6,370 ($50,000,000 x 0.15%, x 31/365).
Because the adjustment to the Sands Capital Select Growth Fund’s base advisory fee is based upon the Fund’s performance compared to the investment record of its stated benchmark, the controlling factor as to whether a performance adjustment will be made is not whether the Fund’s performance is up or down per se, but whether it is up or down more or less than the record of its respective benchmark. Moreover, the comparative investment performance of the Fund is based solely on the relevant performance period without regard to relative performance over a longer or shorter period of time.
Each Fund shall pay the expenses of its operation, including but not limited to (i) charges and expenses of outside pricing services, (ii) the charges and expenses of auditors; (iii) the charges and expenses of its custodian, transfer agent and administrative agent appointed by the Trust with respect to a Fund; (iv) brokers’ commissions, and issue and transfer taxes chargeable to a Fund in connection with securities transactions to which a Fund is a party; (v) insurance premiums, interest charges, dues and fees for membership in trade associations and all taxes and fees payable to federal, state or other governmental agencies; (vi) fees and expenses involved in registering and maintaining registrations of the Funds with the SEC, state or blue sky securities agencies and foreign countries; (vii) all expenses of meetings of Trustees and of shareholders of the Trust and of preparing, printing and distributing prospectuses, notices, proxy statements and all reports to shareholders and to governmental agencies; (viii) charges and expenses of legal counsel to the Trust and the Independent Trustees; (ix) compensation of the Independent Trustees of the Trust; (x) compliance fees and expenses; and (xi) interest on borrowed money, if any. The compensation and expenses of any officer, Trustee or employee of the Trust who is an affiliated person of the Advisor is paid by the Advisor.
By its terms, the Funds’ investment advisory agreement will remain in force for an initial period of two years and from year to year thereafter, subject to annual approval by (a) the Board or (b) a vote of the majority of a Fund’s outstanding voting securities; provided that in either event continuance is also approved by a majority of the Independent Trustees, by a vote cast in person at a meeting called for the purpose of voting such approval. The Funds’ investment advisory agreement may be terminated at any time, on sixty days’ written notice, without the payment of any penalty, by the Board, by a vote of a majority of a Fund’s outstanding voting securities, or by the Advisor. The investment advisory agreement automatically terminates in the event of its assignment, as defined by the 1940 Act and the rules thereunder. Each class of shares of a Fund pays its respective pro rata portion of the advisory fee payable by the Fund.
Expense Limitation Agreement. Touchstone Advisors has contractually agreed to waive fees and reimburse expenses to the extent necessary to ensure a Fund’s expenses do not exceed the contractual limits set forth in the Funds’ fee table. Expenses that are not waived or reimbursed by the Advisor include dividend and interest expenses relating to short sales; interest; taxes; brokerage commissions and other transaction costs; portfolio transactions and investment related expenses; other expenditures which are capitalized in accordance with U.S. generally accepted accounting principles; the cost of “Acquired Fund Fees and Expenses,” if any; other extraordinary expenses not incurred in the ordinary course of business; amounts, if any, payable pursuant to a shareholder servicing plan; and amounts, if any, payable pursuant to a plan adopted in accordance with Rule 12b-1 under the 1940 Act (“Excluded
Expenses”). The Fund bears the costs of these Excluded Expenses. The contractual limits set forth in the fee table have been adjusted to include the effect of Rule 12b-1 fees, shareholder servicing fees and other anticipated class specific expenses, if applicable. Fee waivers or expense reimbursements are calculated and applied monthly, based on the Fund’s average net assets during the month. The terms of Touchstone Advisors’ contractual waiver agreement provide that Touchstone Advisors is entitled to recoup, subject to approval by the Fund’s Board, such amounts waived or reimbursed for a period of up to three years from the year in which Touchstone Advisors reduced its compensation or assumed expenses for the Fund. No recoupment will occur unless the Fund’s expenses are below the contractual expense limitation amount in effect at the time of the waiver or reimbursement.
Advisory Fees and Fee Waivers or Reimbursements. For the fiscal years ended September 30, 2014, 2015 and 2016, the Trust paid advisory fees and received waivers or reimbursements as shown in the following table:
| | | Advisory Fees Paid | | Fee Waivers or Reimbursements |
| Fund | | 2014 | | 2015 | | 2016 | | 2014 | | 2015 | | 2016 |
| Active Bond Fund* | | $ | 525,290 | | | $ | 464,359 | | | $ | 417,361 | | | $ | 421,423 | | | $ | 304,005 | | | $ | 292,704 | |
| Arbitrage Fund | | $ | 1,811,565 | | | $ | 1,598,028 | | | $ | 1,327,181 | | | $ | 2,497 | | | $ | 7,282 | | | $ | 35,383 | |
| Emerging Markets Small Cap Fund** | | $ | 3,757,871 | | | $ | 3,349,536 | | | $ | 405,474 | | | $ | 104,673 | | | $ | 145,098 | | | $ | 371,480 | |
| High Yield Fund* | | $ | 1,668,225 | | | $ | 1,383,148 | | | $ | 1,085,856 | | | $ | 207,481 | | | $ | 177,038 | | | $ | 209,551 | |
| Merger Arbitrage Fund | | $ | 6,422,890 | | | $ | 3,187,301 | | | $ | 2,103,187 | | | $ | 0 | | | $ | 0 | | | $ | 8,474 | |
| Mid Cap Fund | | $ | 3,370,468 | | | $ | 4,854,261 | | | $ | 5,567,483 | | | $ | 467,705 | | | $ | 721,862 | | | $ | 657,760 | |
| Mid Cap Value Fund | | $ | 1,851,195 | | | $ | 2,889,296 | | | $ | 3,084,251 | | | $ | 359,416 | | | $ | 448,793 | | | $ | 476,709 | |
| Premium Yield Equity Fund | | $ | 1,115,182 | | | $ | 1,336,085 | | | $ | 1,023,138 | | | $ | 82,007 | | | $ | 66,988 | | | $ | 138,887 | |
| Sands Capital Select Growth Fund | | $ | 48,650,087 | | | $ | 35,695,416 | | | $ | 22,940,604 | | | $ | 1,033,092 | | | $ | 946,970 | | | $ | 831,974 | |
| Small Cap Fund | | $ | 7,318,982 | | | $ | 6,781,951 | | | $ | 5,543,019 | | | $ | 293,082 | | | $ | 38,284 | | | $ | 92,604 | |
| Small Cap Value Fund | | $ | 555,080 | | | $ | 643,163 | | | $ | 685,757 | | | $ | 181,500 | | | $ | 176,031 | | | $ | 234,463 | |
| Total Return Bond Fund | | $ | 531,579 | | | $ | 602,913 | | | $ | 713,723 | | | $ | 176,962 | | | $ | 196,165 | | | $ | 235,052 | |
| Ultra Short Duration Fixed Income Fund | | $ | 1,760,825 | | | $ | 1,544,932 | | | $ | 1,444,677 | | | $ | 509,400 | | | $ | 512,896 | | | $ | 552,999 | |
*Predecessor Funds paid advisory fees and received waivers and/or reimbursements.
**Prior to April 19, 2016, the Fund was known as Touchstone Emerging Markets Equity Fund.
THE SUB-ADVISORS AND PORTFOLIO MANAGERS
The Advisor has selected sub-advisors (the “Sub-Advisors”) to manage all or a portion of a Fund’s assets, as determined by the Advisor. The Sub-Advisors make the investment decisions for the Fund assets allocated to them, and continuously review, supervise and administer a separate investment program, subject to the oversight of, and policies established by, the Board.
Each Sub-Advisory Agreement provides that a Sub-Advisor shall not be protected against any liability to the Trust or its shareholders by reason of willful misfeasance, bad faith or gross negligence on its part in the performance of its duties, or from reckless disregard of its obligations or duties thereunder.
For their respective services, the Sub-Advisors receive a fee from the Advisor. As described in the prospectus, each Sub-Advisor receives sub-advisory fees with respect to each Fund that it sub-advises, except Sands Capital Management, LLC which receives a base investment sub-advisory fee that may be adjusted if the Fund outperforms or under performs its stated benchmark. Each Sub-Advisor’s fee with respect to each Fund is accrued daily and paid monthly, based on the Fund’s average net assets allocated to the Sub-Advisor during the current month. The performance adjustment for the Sands Capital Select Growth Fund is calculated as set forth above.
The Advisor pays sub-advisory fees to the Sub-Advisors from its advisory fee. The compensation of any officer, director or employee of a Sub-Advisor who is rendering services to a Fund is paid by the Sub-Advisor. For the fiscal years ended September 30, 2014, 2015 and 2016, the Advisor paid the Sub-Advisors received the following sub-advisory fees:
| | | | 2014 | | | 2015 | | | 2016 | | | | |
| Active Bond Fund* | | | $ | 316,860 | | | $ | 270,137 | | | $ | 234,915 | | | | |
| Arbitrage Fund | | | $ | 1,121,445 | | | $ | 989,255 | | | $ | 822,113 | | | | |
| Emerging Markets Small Cap Fund** | | | $ | 1,928,936 | | | $ | 1,724,768 | | | $ | 205,930 | | | | |
| High Yield Fund* | | | $ | 1,015,694 | | | $ | 849,986 | | | $ | 672,027 | | | | |
| Merger Arbitrage Fund | | | $ | 3,770,223 | | | $ | 1,921,315 | | | $ | 1,301,844 | | | | |
| Mid Cap Fund | | | $ | 1,895,889 | | | $ | 2,703,231 | | | $ | 3,088,192 | | | | |
| Mid Cap Value Fund | | | $ | 1,029,182 | | | $ | 1,444,716 | | | $ | 1,522,582 | | | | |
| Premium Yield Equity Fund | | | $ | 623,560 | | | $ | 742,507 | | | $ | 574,432 | | | | |
| Sands Capital Select Growth Fund | | | $ | 31,564,291 | | | $ | 31,446,266 | | | $ | 20,781,135 | | | | |
| Small Cap Fund | | | $ | 4,305,283 | | | $ | 3,989,383 | | | $ | 3,263,077 | | | | |
| Small Cap Value Fund*** | | | $ | 308,378 | | | $ | 357,313 | | | $ | 347,454 | | | | |
| Total Return Bond Fund | | | $ | 341,729 | | | $ | 387,587 | | | $ | 459,116 | | | | |
| Ultra Short Duration Fixed Income Fund | | | $ | 791,830 | | | $ | 705,473 | | | $ | 665,817 | | | | |
*Fees paid to the Predecessor Funds’ Sub-Advisor.
**Prior to April 19, 2016, the Fund was known as Touchstone Emerging Markets Equity Fund and was sub-advised by another sub-advisor. For the period February 20, 2016 through April 18, 2016, the Emerging Markets Small Cap Fund was sub–advised by an interim sub–advisor.
***Prior to July 1, 2016, the Small Cap Value Fund was sub-advised by another sub-advisor. For the period May 20, 2016 through June 30, 2016, Small Cap Value Fund was sub-advised by an interim sub-advisor.
A description of certain information with respect to each Sub-Advisor is below. In addition, the following charts list the Funds’ portfolio managers, the number of their other managed accounts per investment category, the total assets in each category of managed accounts and their beneficial ownership in their managed Fund(s) at the end of the September 30, 2016 fiscal year. Listed below the charts is (i) a description of each portfolio manager’s compensation structure as of September 30, 2016, and (ii) a description of any material conflicts that may arise in connection with each portfolio manager’s management of the Fund’s investments and the investments of the other accounts included in the chart and any material conflicts in allocation of investment opportunities between the Fund and other accounts managed by each portfolio manager as of September 30, 2016. Also as of September 30, 2016, for some of the Sub-Advisors, certain portfolio managers managed accounts subject to both an advisory and a performance fee.
Emerging Markets Small Cap Fund
Sub-Advisor: Copper Rock Capital Partners LLC
| Portfolio Manager/ Types of Accounts | | Total
Number of
Other
Accounts
Managed | | Total Other
Assets
(million) | | Number of
Other Accounts
Managed subject
to a Performance
Based Advisory
Fee | | Total Other
Assets
Managed subject
to a Performance
Based Advisory
Fee (million) | |
| Stephen Dexter | | | | | | | | | |
| Registered Investment Companies | | 7 | | $784 | | 0 | | $0 | |
| Other Pooled Investment Vehicles | | 3 | | $1,538 | | 0 | | $0 | |
| Other Accounts | | 23 | | $2,322 | | 3 | | $612 | |
| H. David Shea | | | | | | | | | |
| Registered Investment Companies | | 7 | | $784 | | 0 | | $0 | |
| Other Pooled Investment Vehicles | | 3 | | $1,538 | | 0 | | $0 | |
| Other Accounts | | 23 | | $2,322 | | 3 | | $612 | |
Material Conflicts of Interest. The portfolio managers manage other accounts for other clients of Copper Rock. These client accounts may include registered investment companies, other types of pooled accounts, and separate accounts (i.e., accounts managed on behalf of individuals or public or private institutions). The portfolio managers provide services for multiple clients simultaneously. A summary of certain portfolio conflicts of interest is provided below. Please note, however, that this summary is not intended to describe every possible conflict of interest that members of the portfolio management teams may face.
Copper Rock may receive differential compensation from different advisory clients and each advisory client may be more or less profitable to Copper Rock than other advisory clients (e.g., clients also may demand different levels of service or have larger, smaller, or multiple relationships with Copper Rock). The portfolio managers may also make personal investments in accounts they manage or support.
Portfolios within the same product type are managed substantially the same, all portfolios have substantially the same percentage ownership, other than client specific restrictions and rounding.
The portfolio managers may not be able to acquire enough of a certain security to fill all the orders across all client portfolios. Copper Rock has a written procedure that requires the available shares to be distributed on a pro-rata basis across the appropriate portfolios.
Compensation. Copper Rock is committed to retaining all members of its senior management team by offering a competitive salary, broad distribution of equity, and partnership bonuses.
| | • | Base Salary. Each investment professional is paid a fixed base salary, which varies among investment professional depending on the experience and responsibilities of the portfolio manager as well as the market forces at the time the portfolio manager is hired or upon any renewal period. |
| | | |
| | • | Bonus. Each investment professional is eligible to receive an annual bonus. Bonus amounts are principally tied to firm profitability and the individual’s contribution to the team. Greater emphasis is placed on investment performance and a smaller portion of the bonus is based on qualitative factors, which may include marketing and client service activities. |
| | | |
| | • | Equity Distribution. The majority of all investment professionals have a substantial equity stake in the firm. |
Fund Ownership. The following table indicates for the Emerging Markets Small Cap Fund the dollar range of shares beneficially owned by the Funds’ portfolio manager as of September 30, 2016.
| Portfolio Manager | | Dollar Range of Beneficial Ownership |
| Stephen Dexter | | None |
| H. David Shea | | None |
Total Return Bond Fund
Sub-Advisor: EARNEST Partners LLC
| Portfolio Manager/ Types of Accounts | | Total
Number of
Other
Accounts
Managed | | Total Other
Assets
(million) | | Number of
Other Accounts
Managed subject
to a Performance
Based Advisory
Fee | | Total Other
Assets
Managed subject
to a Performance
Based Advisory
Fee (million) | |
| Douglas Folk | | | | | | | | | |
| Registered Investment Companies | | 1 | | $236 | | 0 | | $0 | |
| Other Pooled Investment Vehicles | | 6 | | $46.6 | | 0 | | $0 | |
| Other Accounts | | 80 | | $5,982.6 | | 0 | | $0 | |
| Chris Fitze | | | | | | | | | |
| Registered Investment Companies | | 1 | | $236 | | 0 | | $0 | |
| Other Pooled Investment Vehicles | | 6 | | $46.6 | | 0 | | $0 | |
| Other Accounts | | 80 | | $5,982.6 | | 0 | | $0 | |
Compensation. EARNEST personnel are paid a salary and a discretionary bonus. A portion of the bonus may consist of profit sharing or deferred compensation. EARNEST also matches a portion of employees’ 401(k) contributions, if any. The bonus is a function of client satisfaction with respect to investment results and service. Equity ownership is another component of compensation for certain portfolio managers. EARNEST is employee-owned.
Conflicts of Interest. EARNEST is responsible for managing the Total Return Bond Fund in addition to other client accounts which may include, but are not limited to, proprietary accounts, separate accounts and other pooled investment vehicles. EARNEST may manage other client accounts which may have higher fee arrangements than the Total Return Bond Fund or may also have
performance-based fees. Side-by-side management of these other client accounts may create potential conflicts of interest which may relate to, among other things, the allocation of investment opportunities and the aggregation and allocation of transactions. EARNEST has adopted policies and procedures it believes are reasonably designed to address such conflicts.
EARNEST seeks best execution with respect to all securities transactions and to aggregate and allocate the securities to client accounts in a manner that EARNEST believes to be fair and equitable. EARNEST has implemented policies and procedures that it believes are reasonably designed to mitigate and manage the potential conflicts of interest that may arise from side-by-side management. Specifically, EARNEST manages client accounts to model portfolios that are approved by its investment committee, and aggregates and then allocates securities transactions to client accounts in a manner that EARNEST believes to be fair and equitable.
Fund Ownership. The following table indicates for the Total Return Bond Fund, the dollar range of shares beneficially owned by the Fund’s portfolio managers as of September 30, 2016.
| Portfolio Managers | | Dollar Range of Beneficial Ownership |
| Douglas Folk | | $10,001 - $50,000 |
| Chris Fitze | | None |
Ultra Short Duration Fixed Income Fund
Sub-Advisor: Fort Washington Investment Advisors, Inc.
| Portfolio Manager/ Types of Accounts | | Total
Number of
Other Accounts
Managed | | Total Other
Assets
(million) | | Number of
Other Accounts
Managed subject
to a Performance
Based Advisory
Fee | | Total Other
Assets
Managed subject
to a Performance
Based Advisory
Fee (million) | |
| Scott D. Weston | | | | | | | | | |
| Registered Investment Companies | | 0 | | $0 | | 0 | | $0 | |
| Other Pooled Investment Vehicles | | 0 | | $0 | | 0 | | $0 | |
| Other Accounts | | 46 | | $7,889 | | 0 | | $0 | |
| Brent A. Miller | | | | | | | | | |
| Registered Investment Companies | | 0 | | $0 | | 0 | | $0 | |
| Other Pooled Investment Vehicles | | 0 | | $0 | | 0 | | $0 | |
| Other Accounts | | 46 | | $7,889 | | 0 | | $0 | |
Ownership of Shares of the Fund. The following table indicates for the Ultra Short Duration Fixed Income Fund the dollar range of shares beneficially owned by the portfolio managers as of September 30, 2016:
| Portfolio Managers | | Dollar Range of Beneficial Ownership |
| Scott D. Weston | | None |
| Brent A. Miller | | None |
Active Bond Fund (Predecessor Fund)
Sub-Advisor: Fort Washington Investment Advisors, Inc.
| Portfolio Manager/ Types of Accounts | | Total
Number of
Other
Accounts
Managed | | Total Other
Assets
(million) | | Number of
Other Accounts
Managed subject
to a Performance
Based Advisory
Fee | | Total Other
Assets
Managed subject
to a Performance
Based Advisory
Fee (million) | |
| Timothy J. Policinski | | | | | | | | | |
| Registered Investment Companies | | 1 | | $56 | | 0 | | $0 | |
| Other Pooled Investment Vehicles | | 1 | | $454 | | 0 | | $0 | |
| Other Accounts | | 54 | | $1,450 | | 0 | | $0 | |
| Daniel J. Carter | | | | | | | | | |
| Registered Investment Companies | | 1 | | $56 | | 0 | | $0 | |
| Other Pooled Investment Vehicles | | 1 | | $454 | | 0 | | $0 | |
| Other Accounts | | 54 | | $1,450 | | 0 | | $0 | |
Ownership of Shares of the Fund. The following table indicates for the Fund, the dollar range of shares beneficially owned by the portfolio managers as of September 30, 2016:
| Portfolio Managers | | Dollar Range of Beneficial Ownership |
| Timothy J. Policinski | | $1 - $10,000 |
| Daniel J. Carter | | $1 - $10,000 |
High Yield Fund (Predecessor Fund)
Sub-Advisor: Fort Washington Investment Advisors, Inc.
| Portfolio Manager/ Types of Accounts | | Total
Number of
Other
Accounts
Managed | | Total Other
Assets
(million) | | Number of
Other Accounts
Managed subject
to a Performance
Based Advisory
Fee | | Total Other
Assets
Managed subject
to a Performance
Based Advisory
Fee (million) | |
| Brendan M. White | | | | | | | | | |
| Registered Investment Companies | | 1 | | $423 | | 0 | | $0 | |
| Other Pooled Investment Vehicles | | 2 | | $576 | | 0 | | $0 | |
| Other Accounts | | 28 | | $3,474 | | 0 | | $0 | |
| Timothy Jossart | | | | | | | | | |
| Registered Investment Companies | | 1 | | $423 | | 0 | | $0 | |
| Other Pooled Investment Vehicles | | 2 | | $576 | | 0 | | $0 | |
| Other Accounts | | 28 | | $3,474 | | 0 | | $0 | |
| Garrick Bauer | | | | | | | | | |
| Registered Investment Companies | | 1 | | $423 | | 0 | | $0 | |
| Other Pooled Investment Vehicles | | 2 | | $576 | | 0 | | $0 | |
| Other Accounts | | 28 | | $3,474 | | 0 | | $0 | |
Ownership of Shares of the Fund. The following table indicates for the Fund, the dollar range of shares beneficially owned by the portfolio managers as of September 30, 2016:
| Portfolio Managers | | Dollar Range of Beneficial Ownership |
| Timothy J. Policinski | | $100,001 - $500,000 |
| Daniel J. Carter | | $25,000 - $50,000 |
| Garrick Bauer | | None |
Compensation. All of Fort Washington’s portfolio managers receive a fixed base salary and annual performance bonuses. Bonuses are based primarily on the overall performance of Fort Washington as well as the pre-tax performance (relative to the appropriate
benchmark: Barclays US Aggregate Bond Index for Active Bond Fund, Barclays Ba/B Index, with longer term deference to Barclays US High Yield Index for High Yield Fund, and Merrill Lynch 3 Month T-Bill Index for Ultra Short Fixed Income Fund) of their respective asset category over a one-year and a three-year time horizon. Secondarily, portfolio managers are also assessed on their ability to retain clients and attract new clients. Additionally, a long-term retention plan was instituted in 2000, whereby certain investment professionals are periodically granted participation units with a 7-year cliff vesting schedule. The structure includes long-term vesting provisions. The percentage of compensation allocated to performance bonuses, asset-increase incentives and long-term incentive compensation is determined annually by the firm’s president and approved by the Board of Directors.
Fort Washington’s parent company also provides all personnel a defined benefit retirement plan, which provides a lifetime annuity upon retirement that is based on a percentage of final average pay and years of service under the plan.
Associates are also eligible to participate in a 401(k) plan. The 401(k) company match is 50% of the first 6% of earnings saved.
Conflicts of Interest. Actual or potential conflicts of interest may arise when a portfolio manager has management responsibilities to more than one account (including the Funds). This would include devotion of unequal time and attention to the management of the accounts, inability to allocate limited investment opportunities across a broad array of accounts and incentive to allocate opportunities to an account where the portfolio manager has a greater financial incentive, such as allocation opportunities for performance based accounts. Fort Washington has adopted policies and procedures it believes are reasonably designed to address such conflicts.
Mid Cap Value Fund
Sub-Advisor: LMCG Investments, LLC.
| Portfolio Manager/Types of Accounts | | Total
Number of
Other
Accounts
Managed | | Total Other
Assets
(million) | | Number of
Other Accounts
Managed subject
to a Performance
Based Advisory
Fee | | Total Other
Assets
Managed subject
to a Performance
Based Advisory
Fee (million) | |
| R. Todd Vingers | | | | | | | | | |
| Registered Investment Companies | | 5 | | $713.3 | | 0 | | $0 | |
| Other Pooled Investment Vehicles | | 15 | | $216.1 | | 0 | | $0 | |
| Other Accounts | | 76 | | $1,190.5 | | 0 | | $0 | |
| Jay C. Willadsen | | | | | | | | | |
| Registered Investment Companies | | 1 | | $64.1 | | 0 | | $0 | |
| Other Pooled Investment Vehicles | | 14 | | $152.7 | | 0 | | $0 | |
| Other Accounts | | 20 | | $187.4 | | 0 | | $0 | |
Fund Ownership. The following table indicates for the Mid Cap Value Fund, the dollar range of shares beneficially owned by the Fund’s portfolio manager as of September 30, 2016.
| Portfolio Manager | | Dollar Range of Beneficial Ownership |
| R. Todd Vingers | | $100,001 - $500,000 |
| Jay C. Willadsen | | $100,001 - $500,000 |
Small Cap Value Fund
Sub-Advisor: LMCG Investments, LLC.
| Portfolio Manager/Types of Accounts | | Total
Number of
Other
Accounts
Managed | | Total Other
Assets
(million) | | Number of
Other Accounts
Managed subject
to a Performance
Based Advisory
Fee | | Total Other
Assets
Managed subject
to a Performance
Based Advisory
Fee (million) | |
| R. Todd Vingers | | | | | | | | | |
| Registered Investment Companies | | 5 | | $1,053.4 | | 0 | | $0 | |
| Other Pooled Investment Vehicles | | 15 | | $216.1 | | 0 | | $0 | |
| Other Accounts | | 76 | | $1,190.5 | | 0 | | $0 | |
The following table indicates for the Fund the dollar range of shares beneficially owned by the portfolio manager as of September 30, 2016:
| Portfolio Manager | | Dollar Range of Beneficial Ownership |
| R. Todd Vingers | | None |
Compensation. Portfolio managers at LMCG are compensated through a combination of base salary and incentive bonus. LMCG’s incentive bonus plan for investment teams is a revenue-share model based on strategy performance relative to a peer group universe of retail and institutional managers. The incentive formula is based on the teams’ performance rankings within the universe for a blended time period which includes one year, three years, five years and since inception performance. Incentive bonuses are not calculated on specific client or specific Fund assets.
Potential Conflicts of Interest. LMCG’s portfolio managers are often responsible for managing one or more funds as well as other accounts, including proprietary accounts, separate accounts and other pooled investment vehicles. A portfolio manager may also manage a separate account or other pooled investment vehicle which may have materially higher fee arrangements than the fund and may also have a performance-based fee. The side-by-side management of these funds and accounts may raise potential conflicts of interest relating to the allocation of investment opportunities and the aggregation and allocation of trades. LMCG has fiduciary responsibility to manage all client accounts in a fair and equitable manner. It seeks to provide best execution of all securities transactions and aggregate and then allocate securities to client accounts in a fair and timely manner. Similarly, trading in securities by LMCG personnel for their own accounts potentially could conflict with the interest of clients. LMCG has policies and procedures in place to detect, monitor and resolve these and other potential conflicts of interest that are inherent to its business as a registered investment adviser.
Small Cap Fund
Sub-Advisor: London Company of Virginia d/b/a The London Company.
| Portfolio Manager/Types of Accounts | | Total
Number of
Other
Accounts
Managed | | Total Other
Assets
(million) | | Number of
Other Accounts
Managed subject
to a Performance
Based Advisory
Fee | | Total Other Assets
Managed subject
to a Performance
Based Advisory
Fee (million) | |
| Stephen Goddard | | | | | | | | | |
| Registered Investment Companies | | 4 | | $2,273 | | 0 | | $0 | |
| Other Pooled Investment Vehicles | | 0 | | $0 | | 0 | | $0 | |
| Other Accounts | | 647 | | $8,774 | | 2 | | $6.7 | |
| Jonathan Moody | | | | | | | | | |
| Registered Investment Companies | | 4 | | $2,273 | | 0 | | $0 | |
| Other Pooled Investment Vehicles | | 0 | | $0 | | 0 | | $0 | |
| Other Accounts | | 647 | | $8,774 | | 0 | | $0 | |
| J. Brian Campbell | | | | | | | | | |
| Registered Investment Companies | | 4 | | $2,273 | | 0 | | $0 | |
| Other Pooled Investment Vehicles | | 0 | | $0 | | 0 | | $0 | |
| Other Accounts | | 647 | | $8,774 | | 0 | | $0 | |
| Mark E. DeVaul | | | | | | | | | |
| Registered Investment Companies | | 4 | | $2,273 | | 0 | | $0 | |
| Other Pooled Investment Vehicles | | 0 | | $0 | | 0 | | $0 | |
| Other Accounts | | 647 | | $8,774 | | 0 | | $0 | |
Mid Cap Fund
Sub-Advisor: London Company of Virginia d/b/a The London Company.
| Portfolio Manager/Types of Accounts | | Total
Number of
Other
Accounts
Managed | | Total Other
Assets
(million) | | Number of
Other Accounts
Managed subject
to a Performance
Based Advisory
Fee | | Total Other Assets
Managed subject
to a Performance
Based Advisory
Fee (million) | |
| Stephen Goddard | | | | | | | | | |
| Registered Investment Companies | | 4 | | $2,192 | | 0 | | $0 | |
| Other Pooled Investment Vehicles | | 0 | | $0 | | 0 | | $0 | |
| Other Accounts | | 647 | | $8,774 | | 2 | | $6.7 | |
| Jonathan Moody | | | | | | | | | |
| Registered Investment Companies | | 4 | | $2,192 | | 0 | | $0 | |
| Other Pooled Investment Vehicles | | 0 | | $0 | | 0 | | $0 | |
| Other Accounts | | 647 | | $8,774 | | 0 | | $0 | |
| J. Brian Campbell | | | | | | | | | |
| Registered Investment Companies | | 4 | | $2,192 | | 0 | | $0 | |
| Other Pooled Investment Vehicles | | 0 | | $0 | | 0 | | $0 | |
| Other Accounts | | 647 | | $8,774 | | 0 | | $0 | |
| Mark E. DeVaul | | | | | | | | | |
| Registered Investment Companies | | 4 | | $2,192 | | 0 | | $0 | |
| Other Pooled Investment Vehicles | | 0 | | $0 | | 0 | | $0 | |
| Other Accounts | | 647 | | $8,774 | | 0 | | $0 | |
| | | Dollar Range of Beneficial Ownership |
| Portfolio Managers | | Mid Cap Fund | | Small Cap Fund |
| Stephen Goddard | | None | | Over $1,000,000 |
| Jonathan Moody | | None | | None |
| J. Brian Campbell | | None | | None |
| Mark E. DeVaul | | None | | None |
Compensation. Portfolio managers are compensated through salary and bonus. In addition to base salaries, portfolio managers are eligible to receive bonus compensation based on their individual contribution to the research effort as well as client retention, sales and overall firm performance. They also have a potential for ownership after a reasonable tenure with the firm.
Conflicts of Interest. Actual or potential conflicts of interest may arise when the portfolio manager has management responsibilities for more than one client account including and not limited to the execution and allocation of investment opportunities, use of soft dollars and other brokerage practices, and personal securities trading. The London Company has adopted policies and procedures it believes are reasonably designed to address such conflicts.
Arbitrage Fund
Sub-Advisor: Longfellow Investment Management Co.
| Portfolio Manager/ Types of Accounts | | Total
Number of
Other
Accounts
Managed | | Total
Other
Assets
(million) | | Number of
Other Accounts
Managed subject
to a Performance
Based Advisory
Fee | | Total Other
Assets
Managed subject
to a Performance
Based Advisory
Fee (million) | |
| Barbara J. McKenna | | | | | | | | | |
| Registered Investment Companies | | 3 | | $318 | | 0 | | $0 | |
| Other Pooled Investment Vehicles | | 2 | | $432 | | 0 | | $0 | |
| Other Accounts | | 42 | | $4,696 | | 1 | | $4 | |
| David C. Stuehr | | | | | | | | | |
| Registered Investment Companies | | 3 | | $318 | | 0 | | $0 | |
| Other Pooled Investment Vehicles | | 2 | | $432 | | 0 | | $0 | |
| Other Accounts | | 32 | | $169 | | 1 | | $4 | |
| Andrew G. Bail* | | | | | | | | | |
| Registered Investment Companies | | 1 | | $193 | | 0 | | $0 | |
| Other Pooled Investment Vehicles | | 1 | | $26 | | 0 | | $0 | |
| Other Accounts | | 1 | | $4 | | 1 | | $4 | |
| Alexander R. Graham | | | | | | | | | |
| Registered Investment Companies | | 1 | | $193 | | 0 | | $0 | |
| Other Pooled Investment Vehicles | | 1 | | $26 | | 0 | | $0 | |
| Other Accounts | | 1 | | $4 | | 1 | | $4 | |
*Mr. Bail began managing the Fund in 2017.
Merger Arbitrage Fund
Sub-Advisor: Longfellow Investment Management Co.
| Portfolio Manager/ Types of Accounts | | Total
Number of
Other
Accounts
Managed | | Total
Other
Assets
(million) | | Number of
Other Accounts
Managed subject
to a Performance
Based Advisory
Fee | | Total Other
Assets
Managed subject
to a Performance
Based Advisory
Fee (million) | |
| Barbara J. McKenna | | | | | | | | | |
| Registered Investment Companies | | 3 | | $276 | | 0 | | $0 | |
| Other Pooled Investment Vehicles | | 2 | | $432 | | 0 | | $0 | |
| Other Accounts | | 42 | | $4,696 | | 1 | | $4 | |
| David C. Stuehr | | | | | | | | | |
| Registered Investment Companies | | 3 | | $276 | | 0 | | $0 | |
| Other Pooled Investment Vehicles | | 2 | | $432 | | 0 | | $0 | |
| Other Accounts | | 32 | | $169 | | 1 | | $4 | |
| Andrew G. Bail* | | | | | | | | | |
| Registered Investment Companies | | 1 | | $151 | | 0 | | $0 | |
| Other Pooled Investment Vehicles | | 1 | | $26 | | 0 | | $0 | |
| Other Accounts | | 1 | | $4 | | 1 | | $4 | |
| Alexander R. Graham | | | | | | | | | |
| Registered Investment Companies | | 1 | | $151 | | 0 | | $0 | |
| Other Pooled Investment Vehicles | | 1 | | $26 | | 0 | | $0 | |
| Other Accounts | | 1 | | $4 | | 1 | | $4 | |
* Mr. Bail began managing the Fund in 2017.
| | | Dollar Range of Beneficial Ownership |
| Portfolio Managers | | Arbitrage Fund | | Merger Arbitrage
Fund |
| Barbara J. McKenna | | None | | None |
| David C. Stuehr | | $1 - $10,000 | | $1 - $10,000 |
| Andrew G. Bail | | None | | None |
| Alexander R. Graham | | $50,001 - $100,000 | | $10,001 - $50,000 |
Compensation. Longfellow’s professionals receive a base salary that considers their responsibilities and their experience. They also are awarded a significant annual bonus based upon their specific contributions to the success and profitability of the firm. Longfellow is 100% owned by 8 employees. Owners receive a portion of the firm’s profits in addition to base salary and bonus.
Conflicts of Interest. Actual or potential conflicts of interest may arise when a portfolio manager has management responsibilities to more than one account (including the Arbitrage Fund and Merger Arbitrage Fund). This would include devotion of unequal time and attention to the management of the accounts and the inability to allocate limited investment opportunities across a broad array of accounts. Longfellow has adopted policies and procedures it believes are reasonably designed to address such conflicts.
Premium Yield Equity Fund
Sub-Advisor: Miller/Howard Investments
| Portfolio Manager/ Types of Accounts | | Total
Number of
Other
Accounts
Managed | | Total
Other
Assets
(million) | | Number of
Other Accounts
Managed subject
to a Performance
Based Advisory
Fee | | Total Other
Assets
Managed subject
to a Performance
Based Advisory
Fee (million) | |
| Lowell G. Miller | | | | | | | | | |
| Registered Investment Companies | | 5 | | $458.2 | | 0 | | $0 | |
| Other Pooled Investment Vehicles | | 2 | | $51.5 | | 0 | | $0 | |
| Other Accounts | | 3,810 | | $5,813.2 | | 0 | | $0 | |
| Bryan J. Spratt | | | | | | | | | |
| Registered Investment Companies | | 5 | | $458.2 | | 0 | | $0 | |
| Other Pooled Investment Vehicles | | 2 | | $51.5 | | 0 | | $0 | |
| Other Accounts | | 3,810 | | $5,813.2 | | 0 | | $0 | |
| John E. Leslie III | | | | | | | | | |
| Registered Investment Companies | | 5 | | $458.2 | | 0 | | $0 | |
| Other Pooled Investment Vehicles | | 2 | | $51.5 | | 0 | | $0 | |
| Other Accounts | | 3,810 | | $5,813.2 | | 0 | | $0 | |
| Roger G. Young | | | | | | | | | |
| Registered Investment Companies | | 5 | | $458.2 | | 0 | | $0 | |
| Other Pooled Investment Vehicles | | 2 | | $51.5 | | 0 | | $0 | |
| Other Accounts | | 3,810 | | $5,813.2 | | 0 | | $0 | |
| Deepak Ahuja | | | | | | | | | |
| Registered Investment Companies | | 5 | | $458.2 | | 0 | | $0 | |
| Other Pooled Investment Vehicles | | 2 | | $51.5 | | 0 | | $0 | |
| Other Accounts | | 3,810 | | $5,813.2 | | 0 | | $0 | |
Compensation. Miller/Howard’s investment professionals receive a base salary in line with industry and geographic standards, bonus based on performance, company contribution to a retirement plan, participation in the company health insurance plan and profit sharing based on ownership. Investment professionals are evaluated annually by the company’s Board of Directors for their contribution to portfolio performance as well as participation in proprietary research projects that the firm conducts on an ongoing basis. Mr. Miller, Mr. Spratt and Mr. Leslie are currently equity owners in the firm, and each receives an annual share of firm profits available after all expenses are paid. Each member of the Investment Team shares in the progress of the firm and shares responsibility for that progress through stock selection, monitoring, and the development of the firm’s information and research expertise. The firm makes no real distinction between “portfolio manager” and “analyst,” and each member of the investment team is evaluated based on his or her performance with regard to management, analysis, and basic research.
Fund Ownership. The following table indicates for the Premium Yield Equity Fund, the dollar range of shares beneficially owned by the Fund’s portfolio managers as of September 30, 2016.
| Portfolio Managers | | Dollar Range of Beneficial Ownership |
| Lowell G. Miller | | None |
| Bryan J. Spratt | | None |
| John E. Leslie III | | None |
| Roger G. Young | | None |
| Deepak Ahuja | | None |
Conflicts of Interest. As an investment advisor to multiple types of clients, Miller/Howard recognizes that actual or potential conflicts of interest may arise. For example, conflicts of interest could result from a portfolio managers’ management of multiple accounts for multiple clients, the allocation and execution of investment opportunities, multiple fee arrangements, and personal trading. Miller/Howard addresses potential conflicts by developing policies and procedures it believes are reasonably designed
to treat all clients in a fair and equitable manner. Miller/Howard’s policies and procedures cover such issues as execution of portfolio transactions, aggregation and allocation of trades, brokerage and soft dollars. Miller/Howard has adopted a Code of Ethics that addresses rules on personal trading and insider information which all employees are required to observe. Miller/Howard has also adopted policies and procedures it believes are reasonably designed to address such conflicts.
Sands Capital Select Growth Fund
Sub-Advisor: Sands Capital Management, LLC.
| Portfolio Manager/ Types of Accounts | | Total
Number of
Other
Accounts
Managed | | Total
Other
Assets
(million) | | Number of
Other Accounts
Managed subject
to a Performance
Based Advisory
Fee | | Total Other
Assets
Managed subject
to a Performance
Based Advisory
Fee (million) | |
| Frank M. Sands, CFA | | | | | | | | | |
| Registered Investment Companies* | | 3 | | $3,430 | | 0 | | $0 | |
| Other Pooled Investment Vehicles | | 10 | | $1,038 | | 0 | | $0 | |
| Other Accounts | | 447 | | $16,063 | | 8 | | $4,834 | |
| A. Michael Sramek, CFA | | | | | | | | | |
| Registered Investment Companies* | | 3 | | $3,430 | | 0 | | $0 | |
| Other Pooled Investment Vehicles | | 10 | | $1,038 | | 0 | | $0 | |
| Other Accounts | | 447 | | $16,063 | | 8 | | $4,834 | |
| Wesley A. Johnston, CFA | | | | | | | | | |
| Registered Investment Companies* | | 3 | | $3,430 | | 0 | | $0 | |
| Other Pooled Investment Vehicles | | 10 | | $1,038 | | 0 | | $0 | |
| Other Accounts | | 442 | | $15,926 | | 7 | | $4,812 | |
*Touchstone Sands Capital Select Growth Fund is not included in the count.
Other Accounts. Sands Capital Management, LLC (“Sands Capital”) employs a growth strategy for all investors called the Sands Capital Large Cap Growth Equity strategy (“Select Growth”) which is its primary strategy. As of September 30, 2016 the Select Growth’s assets under management totaled $23.7 billion of the firm’s $40.6 billion assets under management.
Compensation. Investment professionals benefit from a salary competitive in the industry, an annual qualitative bonus based on subjective review of the employees’ overall contribution, and a standard profit sharing plan and 401(k) plan. Additional incentives include equity participation. The investment professionals also participate in an investment results bonus. The investment results bonus is calculated from the pre-tax performance variance of the Sands Capital composite returns and their respective benchmarks over 1, 3, and 5 year periods, weighted towards the 3 and 5 year results.
Fund Ownership. The following table indicates for the Sands Capital Select Growth Fund, the dollar range of shares beneficially owned by the Fund’s portfolio manager as of September 30, 2016.
| Portfolio Manager | | Dollar Range of Beneficial Ownership |
| Frank M. Sands | | None |
| A. Michael Sramek | | None |
| Wesley A. Johnston | | None |
Sands Capital’s performance adjustment with respect to the Sands Capital Select Growth Fund’s performance is calculated and paid monthly by comparing the Fund’s performance to the performance of the Fund’s benchmark, the Russell 1000® Growth Index, over a “performance period.” The performance period consists of a rolling 12-month period that includes the current month for which performance is available plus the previous 11 months. The Fund’s annual performance adjustment rate is multiplied by the average net assets of the Fund over the performance period, which is then multiplied by a fraction, the numerator of which is the number of days in the current month and the denominator of which is 365 (366 in leap years). The resulting amount is then added to (in the case of over-performance) or subtracted from (in the case of underperformance) the Sands Capital’s base fee, provided such over-performance or underperformance exceeds a designated “hurdle rate.”
Conflicts of Interest. As an investment advisor to a variety of clients, Sands Capital recognizes there may be actual or potential conflicts of interest inherent in its business. For example, conflicts of interest could result from a portfolio managers’ management of multiple accounts for multiple clients, the execution and allocation of investment opportunities, the use of brokerage commission to obtain research, and personal trading by firm employees. Sands Capital has addressed these conflicts by developing policies and procedures it believes are reasonably designed to treat all clients in a fair and equitable manner over time. Sands Capital’s policies and procedures address such issues as execution of portfolio transactions, aggregation and allocation of trades, directed brokerage, and the use of brokerage commissions. Additionally, Sands Capital maintains a Code of Ethics that addresses rules on personal trading and insider information. Sands Capital has also adopted policies and procedures it believes are reasonably designed to address such conflicts.
THE ADMINISTRATOR
The Advisor entered into an Administration Agreement with the Trust, whereby the Advisor is responsible for: supplying executive and regulatory compliance services; supervising the preparation of tax returns; coordinating the preparation of reports to shareholders and reports to, and filings with, the SEC and state securities authorities, as well as materials for meetings of the Board of Trustees; calculating the daily NAV per share; and maintaining the financial books and records of each Fund.
For its services through December 31, 2014, the Advisor’s annual administration fee was:
0.20% on the first $6 billion of the aggregate average daily net assets;
0.16% on the next $4 billion of aggregate average daily net assets; and
0.12% on the aggregate average daily net assets over $10 billion.
The fee was computed and allocated among the Touchstone Fund Complex (excluding Touchstone Institutional Money Market Fund, Touchstone Institutional Funds Trust, and Touchstone Variable Series Trust) on the basis of relative daily net assets.
Effective as of January 1, 2015, the Advisor’s annual administration fee is:
0.145% on the first $20 billion of the aggregate average daily net assets;
0.11% on the next $10 billion of aggregate average daily net assets;
0.09% on the next $10 billion of aggregate average daily net assets; and
0.07% on the aggregate average daily net assets over $40 billion.
The fee is computed and allocated among the Touchstone Fund Complex (excluding Touchstone Institutional Funds Trust) on the basis of relative daily net assets.
The Advisor has engaged BNY Mellon as the Sub-Administrator to the Trust. BNY Mellon provides administrative and accounting services to the Trust and is compensated directly by the Advisor, not the Trust. (See “Transfer and Sub-Administrative Agent” in this SAI).
For the fiscal years ended September 30, 2014, 2015 and 2016, each of the Funds paid the following administration fees as shown below:
| | | Administration Fees Paid | |
| Fund | | 2014 | | | 2015 | | | 2016 | |
| Active Bond Fund* | | $ | 169,824 | | | $ | 156,874 | | | $ | 151,294 | |
| Arbitrage Fund | | $ | 276,566 | | | $ | 227,764 | | | $ | 183,277 | |
| Emerging Markets Small Cap Fund** | | $ | 588,070 | | | $ | 484,082 | | | $ | 56,131 | |
| High Yield Fund* | | $ | 524,660 | | | $ | 397,704 | | | $ | 300,398 | |
| Merger Arbitrage Fund | | $ | 984,189 | | | $ | 455,127 | | | $ | 290,440 | |
| Mid Cap Fund | | $ | 676,957 | | | $ | 908,700 | | | $ | 1,028,047 | |
| Mid Cap Value Fund | | $ | 361,926 | | | $ | 528,342 | | | $ | 551,588 | |
| Premium Yield Equity Fund | | $ | 263,394 | | | $ | 294,151 | | | $ | 217,084 | |
| Sands Capital Select Growth Fund | | $ | 9,655,647 | | | $ | 8,921,142 | | | $ | 5,843,408 | |
| Small Cap Fund | | $ | 1,384,341 | | | $ | 1,186,303 | | | $ | 945,574 | |
| Small Cap Value Fund | | $ | 99,095 | | | $ | 106,472 | | | $ | 110,483 | |
| Total Return Bond Fund | | $ | 244,294 | | | $ | 255,348 | | | $ | 295,685 | |
| Ultra Short Duration Fixed Income Fund | | $ | 1,132,456 | | | $ | 922,569 | | | $ | 837,913 | |
*Fees paid by the Predecessor Funds
**Prior to April 19, 2016, the Fund was known as Touchstone Emerging Markets Equity Fund.
TOUCHSTONE SECURITIES (“THE DISTRIBUTOR”)
Touchstone Securities, Inc. (“Touchstone Securities” or the “Distributor”) and the Trust are parties to a distribution agreement (“Distribution Agreement”) with respect to the Funds. The Distributor’s principal place of business is 303 Broadway, Suite 1100, Cincinnati, Ohio 45202. The Distributor is a registered broker-dealer, and an affiliate of the Advisor by reason of common ownership. The Distributor is obligated to sell shares on a best efforts basis only against purchase orders for the shares. Shares of each Fund are offered to the public on a continuous basis. The Distributor currently allows concessions to dealers who sell shares of the Funds. The Distributor retains that portion of the sales charge that is not re-allowed to dealers who sell shares of a Fund. The Distributor retains the entire sales charge on all direct initial investments in a Fund and on all investments in accounts with no designated dealer of record.
The table below sets forth the aggregate underwriting commissions on sales of the Funds, including the amounts the Distributor paid to broker-dealers, the amounts the Distributor earned as a broker-dealer in the selling network, and the amounts of underwriting commissions retained by the Distributor for the three most recent fiscal years ended September 30, 2016, 2015 and 2014.
| | | | | | | Amount Retained in |
| | | Aggregate Underwriting | | Underwriting |
| Fund | | Commissions on Sales | | Commissions |
| Active Bond Fund* | | | | | | | | |
| 2016 | | $ | 10,641 | | | $ | 2,136 | |
| 2015 | | $ | 42,843 | | | $ | 12,675 | |
| 2014 | | $ | 27,360 | | | $ | 5,145 | |
| | | | | | | | | |
| Arbitrage Fund | | | | | | | | |
| 2016 | | $ | 22,846 | | | $ | 4,183 | |
| 2015 | | $ | 11,252 | | | $ | 1,948 | |
| 2014 | | $ | 1,369,895 | | | $ | 193,380 | |
| | | | | | | | | |
| Emerging Markets Small Cap Fund** | | | | | | | | |
| 2016 | | $ | 6,371 | | | $ | 1,365 | |
| 2015 | | $ | 2,820 | | | $ | 478 | |
| 2014 | | $ | 12,203 | | | $ | 1,779 | |
| | | | | | | | | |
| High Yield Fund* | | | | | | | | |
| 2016 | | $ | 22,793 | | | $ | 4,106 | |
| 2015 | | $ | 31,788 | | | $ | 5,576 | |
| 2014 | | $ | 63,493 | | | $ | 12,775 | |
| | | | | | | | | |
| Merger Arbitrage Fund | | | | | | | | |
| 2016 | | $ | 581 | | | $ | 124 | |
| 2015 | | $ | 1,100 | | | $ | 141 | |
| 2014 | | $ | 10,115 | | | $ | 1,591 | |
| | | | | | | | | |
| Mid Cap Fund | | | | | | | | |
| 2016 | | $ | 106,184 | | | $ | 15,460 | |
| 2015 | | $ | 317,921 | | | $ | 47,592 | |
| 2014 | | $ | 212,928 | | | $ | 31,761 | |
| | | | | | | | | |
| Mid Cap Value Fund | | | | | | | | |
| 2016 | | $ | 27,193 | | | $ | 3,869 | |
| 2015 | | $ | 65,505 | | | $ | 10,381 | |
| 2014 | | $ | 57,322 | | | $ | 10,475 | |
| | | | | | | | | |
| Premium Yield Equity Fund | | | | | | | | |
| 2016 | | $ | 24,680 | | | $ | 3,688 | |
| 2015 | | $ | 143,725 | | | $ | 22,131 | |
| 2014 | | $ | 130,411 | | | $ | 19,235 | |
| | | | | | | | | |
| Sands Capital Select Growth Fund | | | | | | | | |
| 2016 | | $ | 27,092 | | | $ | 4,870 | |
| 2015 | | $ | 84,522 | | | $ | 14,045 | |
| 2014 | | $ | 213,815 | | | $ | 39,781 | |
| | | | | | | Amount Retained in |
| | | Aggregate Underwriting | | Underwriting |
| Fund | | Commissions on Sales | | Commissions |
| Small Cap Fund | | | | | | | | |
| 2016 | | $ | 4,563 | | | $ | 739 | |
| 2015 | | $ | 10,649 | | | $ | 2,096 | |
| 2014 | | $ | 13,532 | | | $ | 2,338 | |
| | | | | | | | | |
| Small Cap Value Fund | | | | | | | | |
| 2016 | | $ | 2,983 | | | $ | 559 | |
| 2015 | | $ | 12,567 | | | $ | 1,730 | |
| 2014 | | $ | 9,096 | | | $ | 1,277 | |
| | | | | | | | | |
| Total Return Bond Fund | | | | | | | | |
| 2016 | | $ | 9,255 | | | $ | 1,529 | |
| 2015 | | $ | 44,776 | | | $ | 9,391 | |
| 2014 | | $ | 7,308 | | | $ | 1,666 | |
| | | | | | | | | |
| Ultra Short Duration Fixed Income Fund | | | | | | | | |
| 2016 | | $ | 8,819 | | | $ | 1,129 | |
| 2015 | | $ | 8,735 | | | $ | 1,137 | |
| 2014 | | $ | 5,426 | | | $ | 937 | |
| * | Amounts shown are for the Predecessor Funds. |
| ** | Prior to April 19, 2016, the Fund was known as Touchstone Emerging Markets Equity Fund. |
The Distributor retained $504 in contingent deferred sales charges on redemptions of Class A shares of the Active Bond Fund.
The Distributor retains the contingent deferred sales charge on redemptions of Class C shares of the Funds that are subject to a contingent deferred sales charge. For the three most recent fiscal years ended September 30, 2016, 2015 and 2014, the Distributor retained the following contingent deferred sales charges:
| | | Amount Retained from CDSC on Class C Shares |
| Fund | | 2016 | | 2015 | | 2014 |
| Active Bond Fund* | | $ | 1,030 | | | $ | 115 | | | $ | 42 | |
| Arbitrage Fund | | $ | 0 | | | $ | 1,202 | | | $ | 758 | |
| Emerging Markets Small Cap Fund** | | $ | 2 | | | $ | 756 | | | $ | 101 | |
| High Yield Fund* | | $ | 84 | | | $ | 593 | | | $ | 603 | |
| Merger Arbitrage Fund | | $ | 0 | | | $ | 118 | | | $ | 1,249 | |
| Mid Cap Fund | | $ | 1,992 | | | $ | 1,852 | | | $ | 3,144 | |
| Mid Cap Value Fund | | $ | 390 | | | $ | 0 | | | $ | 95 | |
| Premium Yield Equity Fund | | $ | 133 | | | $ | 618 | | | $ | 1,388 | |
| Sands Capital Select Growth Fund | | $ | 721 | | | $ | 4,650 | | | $ | 3,974 | |
| Small Cap Fund | | $ | 130 | | | $ | 97 | | | $ | 129 | |
| Small Cap Value Fund | | $ | 0 | | | $ | 20 | | | $ | 400 | |
| Total Return Bond Fund | | $ | 39 | | | $ | 1 | | | $ | 42 | |
| Ultra Short Duration Fixed Income Fund | | $ | 306 | | | $ | 3,501 | | | $ | 13 | |
| * | Amounts shown are for the Predecessor Funds. |
| ** | Prior to April 19, 2016, the Fund was known as Touchstone Emerging Markets Equity Fund. |
Ms. McGruder may be deemed to be an affiliate of the Distributor because she is a Director of the Distributor and an officer of affiliates of the Distributor. Ms. McGruder, by reason of such affiliation, may directly or indirectly be deemed to receive benefits from the underwriting fees paid to the Distributor.
The Distribution Agreement shall remain in effect for a period of two years after the effective date of the agreement and is renewable annually thereafter. The Distribution Agreement may be terminated as to any Fund at any time by (i) the Trust, (a) by the vote of a majority of the Trustees of the Trust who are not “interested persons” of the Trust or the Distributor, (b) by vote of the Board of the Trust, or (c) by the “vote of majority of the outstanding voting securities” of the Fund, or (ii) by the Distributor, in any case without payment of any penalty on not more than 60 days’ nor less than 30 days’ written notice to the other party. The Distribution Agreement shall also automatically terminate in the event of its assignment.
Touchstone Securities may pay from its own resources cash bonuses or other incentives to selected dealers in connection with the sale of shares of the Funds. On some occasions, such bonuses or incentives may be conditioned upon the sale of a specified minimum dollar amount of the shares of the Funds or other funds in the Touchstone Funds during a specific period of time. Such bonuses or incentives may include financial assistance to dealers in connection with conferences, sales or training programs for their employees, seminars for the public, advertising, sales campaigns and other dealer-sponsored programs or events. The Advisor, at its expense, may also provide additional compensation to certain affiliated and unaffiliated dealers, financial intermediaries or service providers for distribution, administrative or shareholder servicing activities. The Advisor may also reimburse the Distributor for making these payments.
Touchstone Securities, at its expense, may provide additional compensation to financial intermediaries which sell or arrange for the sale of shares of the Touchstone Funds. Other compensation may be offered to the extent not prohibited by federal or state laws or any self-regulatory agency, such as the Financial Industry Regulatory Authority (“FINRA”).
Touchstone Securities makes payments for entertainment events it deems appropriate, subject to its guidelines and applicable law. These payments may vary depending upon the nature of the event or the relationship. As of December 31, 2016, the Distributor anticipates that the following broker-dealers or their affiliates will receive additional payments as described in the Fund’s prospectus and SAI:
| Name of Broker-Dealer |
| American Enterprise Investment Services Inc. |
| Fifth Third Securities Inc. |
| First Clearing LLC / Wells Fargo Advisors LLC |
| First Command Financial Planning, Inc. |
| Hewitt Financial Services, LLC |
| Janney Montgomery Scott LLC |
| LPL Financial Services |
| Merrill Lynch, Pierce, Fenner & Smith Inc. |
| Morgan Stanley Wealth Management |
| Pershing LLC |
| Raymond James & Associates, Inc. |
| RBC Capital Markets Corporation |
| UBS Financial Services, Inc. |
Touchstone Securities is motivated to make payments to the broker-dealers described above because they promote the sale of Fund shares and the retention of those investments by clients of financial advisors. To the extent financial advisors sell more shares of the Funds or retain shares of the Funds in their clients’ accounts, the Advisor benefits from the incremental management and other fees paid to the Advisor by the Funds with respect to those assets.
Your financial intermediary may charge you additional fees or commissions other than those disclosed in this SAI. You can ask your financial intermediary about any payments it receives from Touchstone Securities or the Funds, as well as about fees or commissions it charges. You should consult disclosures made by your financial intermediary at the time of purchase.
The Funds may compensate dealers, including the Distributor and its affiliates, based on the average balance of all accounts in the Funds for which the dealer is designated as the party responsible for the account.
DISTRIBUTION PLANS AND SHAREHOLDER SERVICE ARRANGEMENTS
Certain Funds have adopted a distribution or shareholder servicing plan for certain classes of shares which permits a Fund to pay for expenses incurred in the distribution and promotion of its shares pursuant to Rule 12b-1 under the 1940 Act and account
maintenance and other shareholder services in connection with maintaining such account. Touchstone Securities may provide those services itself or enter into arrangements under which third parties provide such services and are compensated by the Distributor.
Class A Shares. With respect to its Class A shares, each Fund has adopted a plan of distribution and shareholder service (the “Class A Plan”) under which the Distributor is paid up to, but not exceeding, twenty-five basis points (0.25%) for distribution payments. Of the total compensation authorized, the Fund may pay for shareholder services in an amount up to 0.25%.
Class C Shares. With respect to its Class C shares, each Fund has adopted a plan of distribution and shareholder service (the “Class C Plan” and, together with the Class A Plan, the “Plans”) under which the Distributor is paid up to, but not exceeding one hundred basis points (1.00%) in the aggregate, with twenty-five basis points (0.25%) for shareholder service fees and seventy-five basis points (0.75%) for distribution payments. The Ultra Short Duration Fixed Income Fund intends to limit the amount of the 12b-1 fees for Class C shares to seventy-five basis points (0.75%) for at least one year from the date of the prospectus relating to the Fund.
Class Z Shares. With respect to its Class Z shares, each Fund has adopted a shareholder service plan (the “Class Z Plan”) under which the Distributor is paid up to, but not exceeding, twenty-five basis points (0.25%) for shareholder service fees.
General Information. In connection with the distribution of shares, the Distributor may use the payments for: (i) compensation for its services in distribution assistance; or (ii) payments to financial institutions and intermediaries such as banks, savings and loan associations, insurance companies and investment counselors, broker-dealers, mutual fund supermarkets and the Distributor’s affiliates and subsidiaries as compensation for services or reimbursement of expenses incurred in connection with distribution assistance.
In addition, the Distributor may use payments to provide or enter into written agreements with service providers who will provide shareholder services, including: (i) maintaining accounts relating to shareholders that invest in shares; (ii) arranging for bank wires; (iii) responding to client inquiries relating to the services performed by the Distributor or service providers; (iv) responding to inquiries from shareholders concerning their investment in shares; (v) assisting shareholders in changing dividend options, account designations and addresses; (vi) providing information periodically to shareholders showing their position in shares; (vii) forwarding shareholder communications from the Funds such as proxies, shareholder reports, annual reports, dividend distribution and tax notices to shareholders; (viii) processing purchase, exchange and redemption requests from shareholders and placing orders with the Funds or the service providers; (ix) processing dividend payments from the Funds on behalf of shareholders; and (x) providing such other similar services as a Fund may reasonably request.
Agreements implementing the Plans (the “Implementation Agreements”), including agreements with dealers wherein such dealers agree for a fee to act as agents for the sale of the Funds’ shares, are in writing and have been approved by the Board. All payments made pursuant to the Plans are made in accordance with written Implementation Agreements. Some financial intermediaries charge fees in excess of the amounts available under the Plans, in which case the Advisor pays the additional fees.
The continuance of the Plans and the Implementation Agreements must be specifically approved at least annually by a vote of the Trust’s Board and by a vote of the Independent Trustees who have no direct or indirect financial interest in the Plans or any Implementation Agreement at a meeting called for the purpose of voting on such continuance. A Plan may be terminated at any time by a vote of a majority of the Independent Trustees or by a vote of the holders of a majority of the outstanding shares of a Fund or the applicable class of a Fund. In the event a Plan is terminated in accordance with its terms, the affected Fund (or class) will not be required to make any payments for expenses incurred by the Distributor after the termination date. Each Implementation Agreement terminates automatically in the event of its assignment and may be terminated at any time by a vote of a majority of the Independent Trustees or by a vote of the holders of a majority of the outstanding shares of a Fund (or the applicable class) on not more than 60 days’ written notice to any other party to the Implementation Agreement. The Plans may not be amended to increase materially the amount to be spent for distribution without shareholder approval. All material amendments to the Plans must be approved by a vote of the Trust’s Board and by a vote of the Independent Trustees.
In approving the Plans, the Trustees determined, in the exercise of their business judgment and in light of their fiduciary duties as Trustees, that there is a reasonable likelihood that the Plans will benefit the Funds and their shareholders. The Board believes that expenditure of the Funds’ assets for distribution expenses under the Plans should assist in the growth of the Funds, which will benefit each Fund and its shareholders through increased economies of scale, greater investment flexibility, greater portfolio diversification and less chance of disruption of planned investment strategies. The Plans will be renewed only if the Trustees make a similar determination for each subsequent year of the Plans. There can be no assurance that the benefits anticipated from the expenditure of the Funds’ assets for distribution will be realized. While the Plans are in effect, all amounts spent by the Funds pursuant to the Plans and the purposes for which such expenditures were made must be reported quarterly to the Board for its
review. Distribution expenses attributable to the sale of more than one class of shares of a Fund will be allocated at least annually to each class of shares based upon the ratio in which the sales of each class of shares bears to the sales of all the shares of the Fund. In addition, the selection and nomination of those Trustees who are not interested persons of the Trust are committed to the discretion of the Independent Trustees during such period.
Jill T. McGruder, as an interested person of the Trust, may be deemed to have a financial interest in the operation of the Plans and the Implementation Agreements.
The Funds paid the following in Distribution and Shareholder Servicing fees for the fiscal year ended September 30, 2016:
| | | 12b-1 Plan Expenses |
| | | | | | | Compensation | | Compensation | | | | |
| | | Printing and | | Distribution | | to Broker | | to Sales | | Service | | |
| Fund | | Mailing | | Services | | Dealers | | Personnel | | Providers | | Total |
| Active Bond Fund* | | | | | | | | | | | | | | | | | | | | |
| Class A | | $ | 257 | | | $ | 26,556 | | | $ | 36,529 | | | $ | 4,439 | | | $ | 0 | | | $ | 67,781 | |
| Class C | | $ | 88 | | | $ | 10,650 | | | $ | 55,840 | | | $ | 878 | | | $ | 0 | | | $ | 67,456 | |
| Arbitrage Fund | | | | | | | | | | | | | | | | | | | | | |
| Class A | | $ | 59 | | | $ | 7,396 | | | $ | 9,637 | | | $ | 6,238 | | | $ | 0 | | | $ | 23,330 | |
| Class C | | $ | 103 | | | $ | 25,572 | | | $ | 56,614 | | | $ | 3,680 | | | $ | 0 | | | $ | 85,969 | |
| Emerging Markets Small Cap Fund** | | | | | | | | | | | | | | | | | | |
| Class A | | $ | 24 | | | $ | 2,134 | | | $ | 3,800 | | | $ | 426 | | | $ | 0 | | | $ | 6,384 | |
| Class C | | $ | 15 | | | $ | 1,886 | | | $ | 9,164 | | | $ | 84 | | | $ | 0 | | | $ | 11,149 | |
| High Yield Fund* | | | | | | | | | | | | | | | | | | | | | |
| Class A | | $ | 204 | | | $ | 17,727 | | | $ | 33,298 | | | $ | 7,120 | | | $ | 0 | | | $ | 58,349 | |
| Class C | | $ | 241 | | | $ | 34,420 | | | $ | 151,918 | | | $ | 1,921 | | | $ | 0 | | | $ | 188,500 | |
| Merger Arbitrage Fund | | | | | | | | | | | | | | | | | | | | | |
| Class A | | $ | 219 | | | $ | 12,337 | | | $ | 32,227 | | | $ | 3,162 | | | $ | 0 | | | $ | 47,945 | |
| Class C | | $ | 207 | | | $ | 30,776 | | | $ | 135,130 | | | $ | 820 | | | $ | 0 | | | $ | 166,933 | |
| Mid Cap Fund | | | | | | | | | | | | | | | | | | | | | |
| Class A | | $ | 399 | | | $ | 56,748 | | | $ | 66,964 | | | $ | 19,763 | | | $ | 0 | | | $ | 143,874 | |
| Class C | | $ | 744 | | | $ | 240,532 | | | $ | 344,022 | | | $ | 27,642 | | | $ | 0 | | | $ | 612,940 | |
| Mid Cap Value Fund | | | | | | | | | | | | | | | | | | | | | |
| Class A | | $ | 58 | | | $ | 6,252 | | | $ | 9,395 | | | $ | 10,420 | | | $ | 0 | | | $ | 26,125 | |
| Class C | | $ | 24 | | | $ | 8,634 | | | $ | 10,935 | | | $ | 4,587 | | | $ | 0 | | | $ | 24,180 | |
| Premium Yield Equity Fund | | | | | | | | | | | | | | | | | | | | | |
| Class A | | $ | 236 | | | $ | 27,780 | | | $ | 39,504 | | | $ | 4,090 | | | $ | 0 | | | $ | 71,610 | |
| Class C | | $ | 356 | | | $ | 67,160 | | | $ | 204,883 | | | $ | 4,613 | | | $ | 0 | | | $ | 277,012 | |
| Sands Capital Select Growth Fund | | | | | | | | | | | | | | | | | | | | | |
| Class A | | $ | 1,702 | | | $ | 174,770 | | | $ | 272,592 | | | $ | 5,763 | | | $ | 0 | | | $ | 454,827 | |
| Class C | | $ | 1,795 | | | $ | 235,847 | | | $ | 1,154,973 | | | $ | 2,226 | | | $ | 0 | | | $ | 1,394,841 | |
| Small Cap Fund | | | | | | | | | | | | | | | | | | | | | |
| Class A | | $ | 496 | | | $ | 37,998 | | | $ | 81,686 | | | $ | 4,894 | | | $ | 0 | | | $ | 125,074 | |
| Class C | | $ | 234 | | | $ | 29,258 | | | $ | 151,483 | | | $ | 758 | | | $ | 0 | | | $ | 181,733 | |
| Small Cap Value Fund | | | | | | | | | | | | | | | | | | | | | |
| Class A | | $ | 373 | | | $ | 26,114 | | | $ | 63,946 | | | $ | 29,044 | | | $ | 0 | | | $ | 119,477 | |
| Class C | | $ | 16 | | | $ | 2,844 | | | $ | 10,900 | | | $ | 398 | | | $ | 0 | | | $ | 14,158 | |
| Total Return Bond Fund | | | | | | | | | | | | | | | | | | | | | |
| Class A | | $ | 41 | | | $ | 5,787 | | | $ | 6,041 | | | $ | 2,935 | | | $ | 0 | | | $ | 14,804 | |
| Class C | | $ | 33 | | | $ | 7,036 | | | $ | 16,542 | | | $ | 1,489 | | | $ | 0 | | | $ | 25,100 | |
Ultra Short Duration Fixed Income
Fund | | | | | | | | | | | | | | | | | | | | | |
| Class A | | $ | 95 | | | $ | 9,254 | | | $ | 15,883 | | | $ | 1,190 | | | $ | 0 | | | $ | 26,422 | |
| Class C | | $ | 105 | | | $ | 15,144 | | | $ | 49,254 | | | $ | 146 | | | $ | 0 | | | $ | 64,649 | |
*Amounts shown are for the Predecessor Funds.
**Prior to April 19, 2016, the Fund was known as Touchstone Emerging Markets Equity Fund.
BROKERAGE TRANSACTIONS
Decisions to buy and sell securities for the Funds and the placing of the Funds’ securities transactions and negotiation of commission rates where applicable are made by the sub-advisors and are subject to oversight by the Advisor and the Board. In the purchase and sale of portfolio securities, the sub-advisor’s primary objective will be to obtain the most favorable price and execution for a Fund, taking into account such factors as the overall direct net economic result to a Fund (including commissions, which may not be the lowest available but ordinarily should not be higher than the generally prevailing competitive range), the financial strength and stability of the broker, the efficiency with which the transaction will be effected, the ability to effect the transaction at all where a large block is involved and the availability of the broker or dealer to stand ready to execute possibly difficult transactions in the future.
Each sub-advisor is specifically authorized, subject to certain limitations, to pay a trading commission to a broker who provides research services that is higher than the amount of trading commission another broker would have charged for the same transaction. This excess commission recognizes the additional research services rendered by the broker, but only if the sub-advisor determines in good faith that the excess commission is reasonable in relation to the value of the research services provided and that a Fund derives or will derive a reasonably significant benefit from such research services.
Research services include securities and economic analyses, reports on issuers’ financial conditions and future business prospects, newsletters and opinions relating to interest trends, general advice on the relative merits of possible investment securities for the Funds and statistical services and information with respect to the availability of securities or purchasers or sellers of securities. Although this information is useful to the Funds and the sub-advisors, it is not possible to place a dollar value on it. Research services furnished by brokers through whom a Fund effects securities transactions may be used by the sub-advisor in servicing all of its accounts and not all such services may be used by the sub-advisor in connection with a Fund.
The Funds have no obligation to deal with any broker or dealer in the execution of securities transactions. However, the Funds may execute securities transactions on a national securities exchange or in the over-the-counter market conducted on an agency basis. A Fund will not execute any brokerage transactions in its portfolio securities with an affiliated broker if such transactions would be unfair or unreasonable to its shareholders. Over-the-counter transactions will be placed either directly with principal market makers or with broker-dealers. Although the Funds do not anticipate any ongoing arrangements with other brokerage firms, brokerage business may be transacted with other firms. Affiliated broker-dealers of the Trust will not receive reciprocal brokerage business as a result of the brokerage business transacted by the Funds with other brokers. The Funds may direct transactions to certain brokers in order to reduce brokerage commissions through commission recapture programs offered by Frank Russell Securities, Inc. and Convergex Execution Solutions LLC.
In certain instances, there may be securities that are suitable for a Fund as well as for one or more of the respective sub-advisor’s other clients. The sub-advisor makes investment decisions for a Fund and for its other clients to achieve their respective investment objectives. The sub-advisor may buy or sell a particular security for one client even though it is buying, selling, or holding the same security for another client. Some simultaneous transactions are inevitable when several clients receive investment advice from the same investment advisor, particularly when the same security is suitable for the investment objectives of more than one client. When two or more clients are simultaneously engaged in the purchase or sale of the same security, the sub-advisor will allocate the securities among clients in a fair and equitable manner. This system may detrimentally affect the price of a security purchased, sold, or held by the Fund, but this detrimental effect may be offset by a Fund’s ability to participate in volume transactions, which could lead to better executions for the Fund.
For the fiscal years ended September 30, 2016, 2015 and 2014, the Funds paid the following in aggregate brokerage commissions on portfolio transactions:
| | | Aggregate Brokerage Commissions |
| Fund | | 2016 | | 2015 | | 2014 |
| Active Bond Fund* | | $ | 14,717 | | | $ | 2,039 | | | $ | 386 | |
| Arbitrage Fund | | $ | 368,196 | | | $ | 247,848 | | | $ | 160,985 | |
| Emerging Markets Small Cap Fund** | | $ | 329,901 | | | $ | 300,847 | | | $ | 404,828 | |
| High Yield Fund* | | $ | — | | | $ | — | | | $ | — | |
| Merger Arbitrage Fund | | $ | 424,132 | | | $ | 392,724 | | | $ | 938,755 | |
| Mid Cap Fund | | $ | 270,101 | | | $ | 264,148 | | | $ | 188,243 | |
| Mid Cap Value Fund | | $ | 231,904 | | | $ | 200,494 | | | $ | 228,242 | |
| Premium Yield Equity Fund | | $ | 122,912 | | | $ | 114,363 | | | $ | 82,328 | |
| Sands Capital Select Growth Fund*** | | $ | 1,711,687 | | | $ | 1,798,848 | | | $ | 967,781 | |
| Small Cap Fund | | $ | 359,383 | | | $ | 439,502 | | | $ | 325,203 | |
| Small Cap Value Fund | | $ | 265,279 | | | $ | 190,853 | | | $ | 147,141 | |
| Total Return Bond Fund | | | N/A | | | | N/A | | | | N/A | |
| Ultra Short Duration Fixed Income Fund | | | N/A | | | | N/A | | | | N/A | |
| * | All payments were made by the Predecessor Funds. |
| ** | Prior to April 19, 2016, the Fund was known as Touchstone Emerging Markets Equity Fund. |
| *** | For the period from October 1, 2014 through December 31, 2014, Sands Capital did not have in place any contractual arrangements with any brokerage firms that required it to direct a certain amount of commissions. During that period, Sands Capital accepted proprietary bundled research from its approved brokers. |
Effective January 1, 2015 (the “Effective Date”), Sands Capital entered into client commission sharing arrangements (“CSAs”) that are consistent with the requirements of Section 28(e) of the Securities Exchange Act of 1934. Sands Capital obtains some of its soft dollar benefits through CSAs with selected brokers. Under CSAs, Sands Capital arranges with executing brokers to allocate a portion of total commissions paid to a pool of “credits” maintained by the broker that can be used to obtain soft dollar benefits made available by third-party service providers. After accumulating a number of credits within the pool, Sands Capital may direct the broker to use those credits to pay appropriate third-party service providers for eligible soft dollar benefits made available to Sands Capital by the broker.
During the fiscal year ended September 30, 2016, the amount of brokerage transactions and related commissions for the Funds directed to brokers in return for research services were:
| | | Amount of Transactions to Brokers | | |
| Fund | | Providing Research | | Related Commission |
| Active Bond Fund | | $ | 0 | | | $ | 0 | |
| Arbitrage Fund | | $ | 0 | | | $ | 0 | |
| Emerging Markets Small Cap Fund | | $ | 2,378,956 | | | $ | 2,474 | |
| High Yield Fund | | $ | 0 | | | $ | 0 | |
| Merger Arbitrage Fund | | $ | 0 | | | $ | 0 | |
| Mid Cap Fund | | $ | 119,041,740 | | | $ | 46,053 | |
| Mid Cap Value Fund | | $ | 347,110,338 | | | $ | 185,143 | |
| Premium Yield Equity Fund | | $ | 0 | | | $ | 0 | |
| Sands Capital Select Growth Fund* | | $ | 4,419,897,263 | | | $ | 1,200,112 | |
| Small Cap Fund | | $ | 116,983,675 | | | $ | 104,016 | |
| Small Cap Value Fund | | $ | 119,584,487 | | | $ | 88,474 | |
| Total Return Bond Fund | | $ | 0 | | | $ | 0 | |
| Ultra Short Duration Fixed Income Fund | | $ | 0 | | | $ | 0 | |
| * | Dollar amount reflects the amount of directed Fund’s brokerage transactions to a broker due to research service provided through an agreement or understanding with a broker, or otherwise through an internal allocation procedure. |
The total amount of securities of regular broker-dealers held by certain Funds as of September 30, 2016, were:
| Fund | | Broker/Dealer | | Aggregate Value |
| Active Bond Fund* | | Bank of America | | $ | 1,280,997 | |
| | | Barclays PLC | | $ | 376,056 | |
| | | Citigroup, Inc | | $ | 1,092,625 | |
| | | Goldman Sachs & Co. | | $ | 230,263 | |
| | | Morgan Stanley & Co. | | $ | 181,764 | |
| High Yield Fund* | | Bank of America | | $ | 1,175,940 | |
| | | Citigroup, Inc | | $ | 3,742,008 | |
| | | Goldman Sachs & Co. | | $ | 813,023 | |
| Total Return Bond Fund | | Goldman Sachs & Co. | | $ | 2,154,791 | |
| Ultra Short Duration Fixed Income Fund | | Bank of America | | $ | 8,131,655 | |
| | | Goldman Sachs & Co. | | $ | 6,386,451 | |
*Amounts shown are the for the Predecessor Funds.
PROXY VOTING
The Funds have adopted the Sub-Advisors’ policies and procedures for voting proxies relating to portfolio securities held by the Funds, including procedures used when a vote presents a conflict between the interests of a Fund’s shareholders and those of the Sub-Advisor or its affiliates. A copy or summary of each sub-advisor’s proxy voting policies is included in Appendix B. Information about how the Funds voted proxies relating to their portfolio securities during the most recent year ending June 30 is available by August 31st of that year without charge, upon request by calling 1.800.543.0407 and on the SEC’s website at Sec.gov. Each Fund’s N-PX will also be available on the SEC’s website at Sec.gov and on the Touchstone website at TouchstoneInvestments.com.
CODE OF ETHICS
The Trust has adopted a Code of Ethics pursuant to Rule 17j-1 under the 1940 Act. In addition, the Advisor, each Sub-Advisor and Distributor have adopted Codes of Ethics pursuant to Rule 17j-1. These Codes of Ethics apply to the personal investing activities of Trustees, officers, and certain employees (“access persons”). Rule 17j-1 and the Codes of Ethics are designed to prevent unlawful practices in connection with the purchase or sale of securities by access persons. Under each Code of Ethics, access persons are permitted to invest in securities (including securities that may be purchased or held by a Fund), but are required to report their personal securities transactions for monitoring purposes. In addition, certain access persons are required to obtain approval before investing in initial public offerings or private placements. Copies of these Codes of Ethics are on file with the SEC, and are available to the public.
PORTFOLIO TURNOVER
A Fund’s portfolio turnover rate is calculated by dividing the lesser of purchases or sales of portfolio securities for the fiscal year by the monthly average of the value of the portfolio securities owned by the Fund during the fiscal year. High portfolio turnover involves correspondingly greater brokerage commissions and other transaction costs, which will be borne directly by the Fund. High turnover may result in a Fund recognizing greater amounts of income and capital gains, which would increase the amount of taxes payable by shareholders and increase the amount of commissions paid by the Fund. A 100% turnover rate would occur if all of a Fund’s portfolio securities were replaced once within a one-year period. The rate of portfolio turnover will depend upon market and other conditions, and will not be a limiting factor when the Sub-Advisor believes that portfolio changes are appropriate. A Fund may engage in active trading to achieve its investment goals and, as a result, may have substantial portfolio turnover.
During the two most recent fiscal years ended September 30, the portfolio turnover rate for each Fund was as follows:
| Fund | | 2015 | | 2016 |
| Active Bond Fund*, ** | | | 349 | % | | | 590 | % |
| Arbitrage Fund | | | 276 | % | | | 451 | % |
| Emerging Markets Small Cap Fund*** | | | 28 | % | | | 68 | % |
| High Yield Fund* | | | 35 | % | | | 56 | % |
| Merger Arbitrage Fund | | | 227 | % | | | 400 | % |
| Mid Cap Fund | | | 17 | % | | | 19 | % |
| Mid Cap Value Fund | | | 54 | % | | | 45 | % |
| Premium Yield Equity Fund | | | 31 | % | | | 38 | % |
| Sands Capital Select Growth Fund | | | 29 | % | | | 46 | % |
| Small Cap Fund | | | 42 | % | | | 17 | % |
| Small Cap Value Fund | | | 112 | % | | | 155 | % |
| Total Return Bond Fund | | | 19 | % | | | 12 | % |
| Ultra Short Duration Fixed Income Fund | | | 132 | % | | | 169 | % |
*The portfolio turnover rates reflected are those of the Predecessor Funds.
**Differences in the Fund’s portfolio turnover rate in 2016 as compared with 2015 were due to changing market conditions year-over-year, particularly market conditions and volatility of interest rates and inflation expectations in the government bond sector (U.S. Treasuries and TIPS).
***Prior to April 19, 2016, the Fund was known as Touchstone Emerging Markets Equity Fund.
DISCLOSURE OF PORTFOLIO HOLDINGS
The Touchstone Funds have adopted policies and procedures for disclosing the Funds’ portfolio holdings to any person requesting this information. These policies and procedures are monitored by the Board through periodic reporting by the Funds’ Chief Compliance Officer. No compensation will be received by a Fund, the Advisor, any Sub-Advisor, or any other party in connection with the disclosure of information about portfolio securities.
The procedures prohibit the disclosure of portfolio holdings except under the following conditions:
| 1) | A request made by a sub-advisor for a Fund (or that portion of a Fund) that it manages. |
| 2) | A request by executive officers of the Advisor for routine oversight and management purposes. |
| 3) | For use in preparing and distributing routine shareholder reports, including disclosure to the Funds’ independent registered public accounting firm, typesetter and printer. Routine shareholder reports are filed as of the end of each fiscal quarter with the SEC within 60 days after the quarter end and routine shareholder reports are distributed to shareholders within 60 days after the applicable six-month semi-annual period. The Funds provide their full holdings to their independent registered public accounting firm annually, as of the end of their fiscal year, within one to ten business days after fiscal year end. The Funds provide their full holdings to their typesetter at least 50 days after the end of the calendar quarter. The Funds provide their full holdings to their printer at least 50 days after the applicable six-month semi-annual period. |
| 4) | A request by service providers to fulfill their contractual duties relating to the Fund, subject to approval by the Chief Compliance Officer. |
| 5) | A request by a newly hired sub-advisor or sub-advisor candidate prior to the commencement of its duties to facilitate its transition as a new sub-advisor, subject to the conditions set forth in Item 8. |
| 6) | A request by a potential merger candidate for the purpose of conducting due diligence, subject to the conditions set forth in Item 8. |
| 7) | A request by a rating or ranking agency, subject to the conditions set forth in Item 8. |
Other portfolio holdings disclosure policies of the Funds include:
| • | The Funds (except the Sands Capital Select Growth Fund) provide their top ten holdings on their publicly available website and to market data agencies monthly, as of the end of a calendar month, at least seven business days after month end. |
| • | The Funds (except the Sands Capital Select Growth Fund) provide their full holdings on their publicly available website, and to market data agencies, their typesetter and printer, quarterly, as of the end of a calendar quarter, at least fifteen days after quarter end. |
| • | The Sands Capital Select Growth Fund provides its full holdings on its publicly available website and to market data agencies quarterly, as of the end of a quarter, at least thirty days after quarter end. |
The Sands Capital Select Growth Fund provides its top five holdings on its publicly available website and to market data agencies quarterly, as of the end of a calendar quarter, at least seven business days after quarter end.
| • | The Sands Capital Select Growth Fund provides its full holdings to its typesetter and printer quarterly, as of the end of a calendar quarter, at least fifteen days after quarter end. |
You may access the public website at TouchstoneInvestments.com.
| 8) | The Chief Compliance Officer may authorize disclosing non-public portfolio holdings to third parties more frequently or at different periods than as described above prior to when such information is made public, provided that certain conditions are met. The third-party must (i) specifically request in writing the more current non-public portfolio holdings, providing a reasonable basis for the request; (ii) execute an agreement to keep such information confidential, to only use the information for the authorized purpose, and not to use the information for their personal benefit; (iii) agree not to trade on such information, either directly or indirectly; and (iv) unless specifically approved by the Chief Compliance Officer in writing, the non-public portfolio holdings are subject to a ten day time delay before dissemination. Any non-public portfolio holdings that are disclosed will not include any material information about a Fund’s trading strategies or pending portfolio transactions. |
As of December 31, 2016, one or more Touchstone Funds may currently disclose portfolio holdings information at least monthly based on ongoing arrangements to the following parties:
| | Bloomberg LP
Morningstar, Inc. |
Employees of the Advisor and the Funds’ Sub-Advisors that are access persons under the Funds’ Code of Ethics have access to Fund holdings on a regular basis, but are subject to confidentiality requirements and trading prohibitions in the Code of Ethics. In addition, custodians of the Funds’ assets and the Funds’ accounting services agent, each of whose agreements contains a confidentiality provision (which includes a duty not to trade on non-public information), have access to the current Fund holdings on a daily basis.
The Chief Compliance Officer is authorized to determine whether disclosure of a Fund’s portfolio securities is for a legitimate business purpose and is in the best interests of a Fund and its shareholders. Any conflict between the interests of shareholders and the interests of the Advisor, Touchstone Securities, or any affiliates, will be reported to the Board, which will make a determination that is in the best interests of shareholders.
DETERMINATION OF NET ASSET VALUE
The securities of each Fund are valued under the direction of the Advisor and under the general oversight of the Trustees. The Advisor or its delegates may use independent pricing services to obtain valuations of securities. The pricing services rely primarily on prices of actual market transactions as well as on trade quotations obtained from third parties. Prices are generally determined using readily available market prices. If market prices are unavailable or believed to be unreliable, the Sub-Administrator will initiate a process by which the Trust’s Fair Value Committee will make a good faith determination as to the “fair value” of the security using procedures approved by the Trustees. The pricing services may use a matrix system to determine valuations of fixed-income securities when market prices are not readily available. This system considers such factors as security prices, yields, maturities, call features, ratings and developments relating to specific securities in arriving at valuations. The procedures used by any such pricing service and its valuation results are reviewed by the officers of the Trust under the general oversight of the Trustees.
Some Funds may hold portfolio securities that are listed on foreign exchanges. Under certain circumstances these investments may be valued under the Fund’s fair value policies and procedures, such as when U.S. exchanges are open but a foreign exchange is closed.
Securities with remaining maturities of 60 days or less may be valued by the amortized cost method, which involves valuing a security at its cost on the date of purchase and thereafter (absent unusual circumstances) assuming a constant amortization of maturity of any discount or premium, provided such amount approximates market value.
DESCRIPTION OF SHARES
The Trust’s Declaration of Trust authorizes the issuance of an unlimited number of Funds and shares of each Fund. Each share of a Fund represents an equal proportionate interest in that Fund with each other share. Upon liquidation, shares are entitled to a pro rata share in the net assets of the Fund, after taking into account additional distribution and shareholder servicing expenses attributable to the Class. Shareholders have no preemptive rights. The Declaration of Trust provides that the Trustees of the Trust may create additional series of shares or separate classes of funds. All consideration received by the Trust for shares of any portfolio or separate class and all assets in which such consideration is invested would belong to that portfolio or separate class and would be subject to the liabilities related thereto. Share certificates representing shares will not be issued.
The Trust is an entity of the type commonly known as a Delaware statutory trust. The Trust’s Declaration of Trust states that neither the Trust nor the Trustees, nor any officer, employee or agent of the Trust shall have any power to bind personally any shareholder, nor, except as specifically provided therein, to call upon any shareholder for the payment of any sum of money or assessment whatsoever other than such as the shareholder may at any time personally agree to pay.
The Declaration of Trust provides that a Trustee shall be liable only for his or her own willful defaults and, if reasonable care has been exercised in the selection of officers, agents, employees or investment advisors, shall not be liable for any neglect or wrongdoing of any such person. The Declaration of Trust also provides that the Trust will indemnify its Trustees and officers against liabilities and expenses incurred in connection with actual or threatened litigation in which they may be involved because of their offices with the Trust unless it is determined in the manner provided in the Declaration of Trust that they have not acted in good faith in the reasonable belief that their actions were in the best interests of the Trust. However, nothing in the Declaration of Trust shall protect or indemnify a Trustee against any liability for his or her willful misfeasance, bad faith, gross negligence or reckless disregard of his or her duties.
Each whole share shall be entitled to one vote as to any matter on which it is entitled to vote and each fractional share shall be entitled to a proportionate fractional vote. Shares issued by each Fund have no preemptive, conversion, or subscription rights. Voting rights are not cumulative. Each Fund, as a separate series of the Trust, votes separately on matters affecting only that Fund. Shareholders of each Class of each Fund will vote separately on matters pertaining solely to that Fund or that Class. As a Delaware statutory trust, the Trust is not required to hold annual meetings of shareholders, but approval will be sought for certain changes in the operation of the Trust and for the election of Trustees under certain circumstances.
In addition, a Trustee may be removed by the remaining Trustees or by shareholders at a special meeting called upon written request of shareholders owning at least 10% of the outstanding shares of the Trust. In the event that such a meeting is requested, the Trust will provide appropriate assistance and information to the shareholders requesting the meeting.
Derivative Claims of Shareholders.
The Trust’s Amended and Restated By-Laws (the “By-Laws”) contain provisions regarding derivative claims of shareholders. Under these provisions, a shareholder must make a pre-suit demand upon the Trustees to bring the subject action unless an effort to cause the Trustees to bring such an action is not likely to succeed. For purposes of the foregoing sentence, a demand on the Trustees shall only be deemed not likely to succeed and therefore excused if a majority of the Board, or a majority of any committee of the Board established to consider the merits of such action, has a personal financial interest in the transaction at issue, and a Trustee shall not be deemed interested in a transaction or otherwise disqualified from ruling on the merits of a shareholder demand by virtue of the fact that such Trustee receives remuneration for his service on the Board or on the boards of one or more Trusts that are under common management with or otherwise affiliated with the Trust.
Unless a demand is not required under the foregoing paragraph, (a) shareholders eligible to bring such derivative action under the Delaware Statutory Trust Act who hold at least 10% of the outstanding shares of the Trust, or 10% of the outstanding shares of the Fund or class to which such action relates, shall join in the request for the Trustees to commence such action; and (b) the Trustees must be afforded a reasonable amount of time to consider such shareholder request and to investigate the basis of such claim. The Trustees shall be entitled to retain counsel or other advisors in considering the merits of the request and shall require
an undertaking by the shareholders making such request to reimburse the Trust for the expense of any such advisors in the event that the Trustees determine not to bring such action.
Forum for Adjudication of Disputes.
The By-Laws provide that, unless the Trust consents in writing to the selection of an alternative forum, the sole and exclusive forum for (i) any derivative action or proceeding brought on behalf of the Trust, (ii) any action asserting a claim of breach of a fiduciary duty owed by any Trustee, officer, or other employee of the Trust to the Trust or the Trust’s shareholders, (iii) any action asserting a claim arising pursuant to any provision of the Delaware Statutory Trust Act, the Declaration of Trust or the By-Laws, (iv) any action to interpret, apply, enforce or determine the validity of the Declaration of Trust or the By-Laws, or (v) any action asserting a claim governed by the internal affairs doctrine shall be the U.S. District Court for the District of Delaware or the Court of Chancery of the State of Delaware, or, if the Court of Chancery of the State of Delaware does not have jurisdiction, the Superior Court of the State of Delaware (each, a “Covered Action”). The By-Laws further provide that if any Covered Action is filed in a court other than the U.S. District Court for the District of Delaware, the Court of Chancery of the State of Delaware or the Superior Court of the State of Delaware (a “Foreign Action”) in the name of any shareholder, such shareholder shall be deemed to have consented to (i) the personal jurisdiction of the U.S. District Court for the District of Delaware or the Superior Court of the State of Delaware in connection with any action brought in any such courts to enforce the preceding sentence (an “Enforcement Action”) and (ii) having service of process made upon such shareholder in any such Enforcement Action by service upon such shareholder’s counsel in the Foreign Action as agent for such shareholder.
The By-Laws provide that any person purchasing or otherwise acquiring or holding any interest in shares of beneficial interest of the Trust shall be (i) deemed to have notice of and consented to the provisions of the foregoing paragraph and (ii) deemed to have waived any argument relating to the inconvenience of the forums referenced above in connection with any action or proceeding described in the foregoing paragraph.
This forum selection provision may limit a shareholder’s ability to bring a claim in a judicial forum that it finds favorable for disputes with Trustees, officers or other agents of the Trust and its service providers, which may discourage such lawsuits with respect to such claims. If a court were to find the forum selection provision contained in the By-Laws to be inapplicable or unenforceable in an action, the Trust may incur additional costs associated with resolving such action in other jurisdictions.
CHOOSING A CLASS OF SHARES
Each Fund offers the following classes of shares.
| | | Class A | | Class C | | Class Y | | Class Z | | Institutional Class |
| Active Bond Fund | | X | | X | | X | | | | X |
| Arbitrage Fund | | X | | X | | X | | | | X |
| Emerging Markets Small Cap Fund | | X | | X | | X | | | | X |
| High Yield Fund | | X | | X | | X | | | | X |
| Merger Arbitrage Fund | | X | | X | | X | | | | X |
| Mid Cap Fund | | X | | X | | X | | X | | X |
| Mid Cap Value Fund | | X | | X | | X | | | | X |
| Premium Yield Equity Fund | | X | | X | | X | | | | |
| Sands Capital Select Growth Fund | | X | | X | | X | | X | | |
| Small Cap Fund | | X | | X | | X | | | | X |
| Small Cap Value Fund | | X | | X | | X | | | | X |
| Total Return Bond Fund | | X | | X | | X | | | | X |
| Ultra Short Duration Fixed Income Fund | | X | | X | | X | | X | | X |
The Funds participate in fund “supermarket” arrangements. In such an arrangement, a program is made available by a broker or other institution (a sponsor) that allows investors to purchase and redeem shares of the Funds through the sponsor of the fund supermarket.
In connection with these supermarket arrangements, each Fund has authorized one or more brokers to accept on its behalf purchase and redemption orders. In turn, the brokers are authorized to designate other intermediaries to accept purchase and redemption orders on the Funds’ behalf. As such, a Fund will be deemed to have received a purchase or redemption order when an authorized broker or, if applicable, a broker’s authorized designee, accepts the order. The customer order will be priced at the Fund’s NAV
next computed after acceptance by an authorized broker or the broker’s authorized designee. In addition, a broker may charge transaction fees on the purchase or sale of Fund shares. Also in connection with fund supermarket arrangements, the performance of a participating Fund may be compared in publications to the performance of various indices and investments for which reliable performance data is available and compared in publications to averages, performance rankings, or other information prepared by recognized mutual fund statistical services. The Funds’ annual report contains additional performance information and will be made available to investors upon request and without charge.
The Touchstone Funds are intended for sale to residents of the U.S. and, with very limited exceptions, are not registered or otherwise offered for sale in other jurisdictions. The above restrictions are generally not applicable to sales in U.S. territories or to diplomatic staff members or members of the U.S. military with an APO or FPO address outside of the U.S. Investors are responsible for compliance with tax, securities, currency exchange or other regulations applicable to redemption and purchase transactions in any state or jurisdiction to which they may be subject. Investors should consult with their financial intermediary and appropriate tax and legal advisors to obtain information on the rules applicable to these transactions.
The shares of the Funds may not be directly or indirectly offered or distributed in any country outside of the United States. If an investor becomes a resident of another jurisdiction after purchasing shares of the Touchstone Funds, the investor will not be able to purchase any additional shares of the Funds (other than reinvestment of dividends and capital gains) or exchange shares of the Touchstone Funds for other U.S. registered Touchstone Funds.
Class A Shares. For initial purchases of Class A shares(1) of $1 million or more and subsequent purchases further increasing the size of an individual shareholder account, participating dealers may receive compensation of up to 1.00% (a “Finder’s Fee”) of such purchases from Touchstone Securities according to the following schedule:
| Amount of Investment | | Finder’s Fee |
| $1 million but less than $3 million | | | 1.00 | % |
| $3 million but less than $5 million | | | 0.75 | % |
| $5 million but less than $25 million | | | 0.50 | % |
| $25 million or more | | | 0.25 | % |
(1) This does not apply to the Ultra Short Duration Fixed Income Fund.
The Distributor does not have an annual reset for Finder’s Fees. In determining a dealer’s eligibility for a Finder’s Fee, purchases of Class A shares of an individual shareholder account in a Touchstone Fund may be aggregated with concurrent purchases of Class A shares of other Touchstone Funds for that individual shareholder. If a Finder’s Fee was paid to a participating dealer that dealer is not eligible to receive 12b-1 fees on the shares that were used to generate the Finder’s Fee until they have aged for a period of one year. Additionally, if a Finder’s Fee was paid and the Class A shares are redeemed within a year of their purchase, a contingent deferred sales charge (“CDSC”) of up to 1.00% will be charged on the redemption. Dealers should contact the Distributor for more information on the calculation of the dealer’s commission in the case of combined purchases.
A dealer is eligible for a Finder’s Fee only if the dealer has not previously received a Finder’s Fee on the assets used to meet the required investment amount. Similarly, an exchange from any other Touchstone Fund will not qualify for a Finder’s Fee unless the dealer did not receive any compensation on those assets at the time of the initial investment. In all cases Touchstone Securities reserves the right to deny payment of a Finder’s Fee if it reasonably believes such a fee has already been paid on those assets.
Share Class Conversions. Class A and Class C shareholders who are eligible to invest in Class Y shares or Institutional Class shares are eligible to exchange their Class A shares and/or Class C shares for Class Y shares or Institutional Class shares of the same Fund, if offered in their state and such an exchange can be accommodated by their financial institution. Class Y shares may be available through financial institutions that have appropriate selling agreements with Touchstone Securities, or through “processing organizations” (e.g., mutual fund supermarkets) that purchase shares for their customers. No front-end sales charges will apply to any such exchange. However, if the Class C share assets have been held less than 12 months and a 1% commission was paid to the broker at the time of purchase, a CDSC of 1% will be assessed on the exchange transaction, which may be processed as a liquidation and a purchase. Class Y shareholders that meet the required minimum for Institutional Class shares may exchange their Class Y shares for Institutional Class shares within the same Fund if offered in their state and if such an exchange can be accommodated by their financial institution.
For federal income tax purposes, exchanges of one share class for a different share class of the same fund (even if processed as a liquidation and a purchase) should not result in the realization by the investor of a capital gain or loss. There can be no assurance of any particular tax treatment and you are urged and advised to consult with your own tax advisor before entering into a share class exchange.
Financial intermediaries may convert shares in a customer or client’s account to a more expensive share class if prior to the conversion the intermediary determines that the higher priced share class is more suitable to the customer’s interests and the intermediary discloses any additional compensation to the customer, including revenue sharing arrangements with the Advisor or Distributor.
If a financial institution, processing organization or intermediary (a “converting entity”) is initiating a share class conversion(s) for Touchstone Funds on a platform, then the converting entity should contact Touchstone Securities at least 60 days in advance and obtain Touchstone Securities’ approval of the share class conversion.
Additional Information on the CDSC. The CDSC is waived under the following circumstances:
| • | Any partial or complete redemption following death or disability (as defined in the Code) of a shareholder (including one who owns the shares with his or her spouse as a joint tenant with rights of survivorship) from an account in which the deceased or disabled is named. Touchstone Securities may require documentation prior to waiver of the charge, including death certificates, physicians’ certificates, etc. |
| • | Redemptions from a systematic withdrawal plan. If the systematic withdrawal plan is based on a fixed dollar amount or number of shares, systematic withdrawal redemptions are limited to no more than 10% of your account value or number of shares per year, as of the date the transfer agent receives your request. If the systematic withdrawal plan is based on a fixed percentage of your account value, each redemption is limited to an amount that would not exceed 10% of your annual account value at the time of withdrawal. |
| • | Redemptions from retirement plans qualified under Section 401 of the Code. The CDSC will be waived for benefit payments made by Touchstone directly to plan participants. Benefit payments will include, but are not limited to, payments resulting from death, disability, retirement, separation from service, required minimum distributions (as described under Section 401(a)(9) of the Code), in-service distributions, hardships, loans and qualified domestic relations orders. The CDSC waiver will not apply in the event of termination of the plan or transfer of the plan to another financial institution. |
| • | Redemptions that are mandatory withdrawals from a traditional IRA account after age 70½. |
General. All sales charges imposed on redemptions are paid to the Distributor. In determining whether the CDSC is payable, it is assumed that shares not subject to the CDSC are the first redeemed followed by other shares held for the longest period of time. The CDSC will not be imposed upon shares representing reinvested dividends or capital gains distributions, or upon amounts representing share appreciation.
CDSC for Certain Redemptions of Class A Shares. A CDSC is imposed upon certain redemptions of Class A shares of the Funds (or shares into which such Class A shares were exchanged) purchased at NAV in amounts totaling $1 million or more, if the dealer’s commission described above was paid by the Distributor and the shares are redeemed within one year from the date of purchase. The CDSC will be paid to the Distributor and will be equal to the commission percentage paid at the time of purchase as applied to the lesser of (1) the NAV at the time of purchase of the Class A shares being redeemed, or (2) the NAV of such Class A shares at the time of redemption. If a purchase of Class A shares is subject to the CDSC, you will be notified on the confirmation you receive for your purchase. Redemptions of such Class A shares of the Funds held for at least one year will not be subject to the CDSC.
Examples. The following example will illustrate the operation of the CDSC. Assume that you open an account and purchase 1,000 shares at $10 per share and that six months later the NAV per share is $12 and, during such time, you have acquired then 50 additional shares through reinvestment of distributions. If, at such time you should redeem 450 shares (totaling proceeds of $5,400), 50 shares will not be subject to the charge because of dividend reinvestment. With respect to the remaining 400 shares, the charge is applied only to the original cost of $10 per share and not to the increase in NAV of $2 per share. Therefore, $4,000 of the $5,400 redemption proceeds will pay the charge. At the rate of 1.00%, the CDSC would be $40 for redemptions of Class C shares. In determining whether an amount is available for redemption without incurring a deferred sales charge, the purchase payments made for all shares in your account are aggregated.
OTHER PURCHASE AND REDEMPTION INFORMATION
Waiver of Minimum Investment Requirements. The minimum and subsequent investment requirements for purchases in the Funds may not apply to:
| 1. | Any director, officer or other employee* (and their immediate family members**) of Western & Southern Financial Group, Inc. or any of its affiliates or any portfolio advisor or service provider to the Trust. |
| 2. | Any employee benefit plan that is provided administrative services by a third-party administrator that has entered into a special service arrangement with Touchstone Securities. |
The minimum investment waivers are not available for Institutional Class shares of the Funds.
Waiver of Class A Sales Charges. In addition to the categories of purchasers described in the prospectus for whom the sales charge on purchases of Class A shares of the Funds may be waived, Class A shares issued or purchased in the following transactions are not subject to sales charges (and no concessions are paid by the Distributor on such purchases):
| 1. | Purchases into a Fund by any director, officer, employee* (and their immediate family members**, as defined below), or current separate account client of or referral by a sub-advisor to that particular Fund; |
| 2. | Purchases by any director, officer or other employee* (and their immediate family members**) of Western & Southern Financial Group or any of its affiliates; and |
| 3. | Purchases by any employees of BNY Mellon Investment Servicing (US), Inc. who provide services for the Touchstone Funds, Touchstone Advisors, or Touchstone Securities. |
Exemptions must be qualified in advance by the Distributor. At the option of the Trust, the front-end sales charge may be included on purchases by such persons in the future.
*The term “employee” is deemed to include current and retired employees.
**Immediate family members are defined as the parents, mother-in-law or father-in-law, spouse, brother-in-law or sister-in-law, son-in-law or daughter-in-law, and children, of a registered representative or employee and any other individual to whom the registered representative or employee provides material support.
Waiver of Class A Sales Charge for Clients of Financial Intermediaries. Touchstone Securities has agreed to waive the Class A sales charge for clients of financial intermediaries that have entered into an agreement with Touchstone Securities to offer shares to self-directed investment brokerage accounts that may or may not charge a transaction fee to their customers. Touchstone Securities has entered into an agreement with Merrill Lynch to make this arrangement available to shareholders purchasing Fund shares through the Merrill Lynch Self-Directed Brokerage Service platform.
Waiver of Class A Sales Charge for former Constellation Shareholders. Shareholders who owned shares of the Trust as of November 17, 2006 who are purchasing additional shares for their accounts or opening new accounts in any Touchstone Fund are not subject to the front-end sales charge for purchases of Class A shares. If you are purchasing shares through a financial intermediary, you must notify the intermediary at the time of purchase that a purchase qualifies for a sales load waiver and you may be required to provide copies of account statements verifying your qualification.
Waiver of Class A Sales Charge for former Navellier Shareholders. Shareholders who owned shares of the Navellier International Growth Portfolio as of September 26, 2008 who are purchasing additional shares for their accounts or opening new accounts in any Touchstone Fund are not subject to the front-end sales charge for purchases of Class A shares. If you are purchasing shares through a financial intermediary, you must notify the intermediary at the time of purchase that a purchase qualifies for a sales load waiver and you may be required to provide copies of account statements verifying your qualification.
Waiver of Small Cap Value Fund Class A Sales Charge for Former Class Z Shareholders. Shareholders who owned Class Z shares of the Small Cap Value Fund as of June 10, 2011 who are purchasing additional shares for their accounts or opening new accounts in the Small Cap Value Fund are not subject to the front-end sales charge for purchases of Class A shares of the Small Cap Value Fund. If you are purchasing shares through a financial intermediary, you must notify the intermediary at the time of purchase that a purchase qualifies for a sales load waiver and you may be required to provide copies of account statements verifying your qualification.
Shareholders who are eligible for the sales charge waivers listed above may open an account with the Fund directly to receive the sales charge waiver.
Class Y Shares “Grandfather” Clause. New purchases of the Class Y shares are no longer available directly through Touchstone Securities. Those shareholders who owned Class Y shares purchased directly through Touchstone Securities prior to February 2,
2009, or those former Old Mutual shareholders who owned Class Z shares which became Class Y shares on April 16, 2012, or those former Fifth Third Mutual Fund Shareholders who owned Institutional Class shares which became Class Y shares on September 10, 2012 may continue to hold Class Y shares of the corresponding Fund(s). In addition, those shareholders may continue to make subsequent purchases into existing accounts of Class Y shares of the Fund(s) they owned prior to February 2, 2009, April 16, 2012, and September 10, 2012, respectively.
Purchases in-Kind. In limited circumstances and subject to the prior consent of the Fund, the Fund may accept payment for shares in securities. Shares may be purchased by tendering payment in-kind in the form of marketable securities, including but not limited to shares of common stock, provided the acquisition of such securities is consistent with the applicable Fund’s investment goal and is otherwise acceptable to the Advisor. Transactions of this type are generally a taxable transaction. Before purchasing shares by tendering payment in-kind, investors are urged and advised to consult with their own tax advisor regarding the tax consequences of such a transaction.
Redemptions in-Kind. Under unusual circumstances, when the Board deems it in the best interests of a Fund’s shareholders, the Fund may make payment for shares repurchased or redeemed in whole or in part in securities of the Fund taken at current value. Should payment be made in securities, the redeeming shareholder will bear the market risk until the securities are sold and the redeeming shareholder will generally incur brokerage costs and other costs in converting such securities to cash. Portfolio securities that are issued in an in-kind redemption will be readily marketable. The Trust has filed an irrevocable election with the SEC under Rule 18f-1 of the 1940 Act wherein the Funds are committed to pay redemptions in cash, rather than in kind, to any shareholder of record of a Fund who redeems during any ninety day period, the lesser of $250,000 or 1% of a Fund’s NAV at the beginning of such period. Redemptions in kind are taxable for federal income tax purposes in the same manner as redemptions for cash.
Undeliverable Checks. Dividend and distribution checks issued from non-retirement accounts for less than $25 will be automatically reinvested in the Fund that pays them. If you elect to receive your dividends and distributions of $25 or more in cash, and the payment is returned as “undeliverable”, the outstanding payment on your account will be cancelled and the proceeds will be reinvested in the Fund at the per share NAV determined as of the date of cancellation. If your redemption proceeds are returned as “undeliverable”, your account will be considered a lost shareholder account, correspondence will be sent to you requesting that you contact the Fund, and the outstanding payment will be deposited into an account for potential escheatment to your state of residence. Upon contact, the Fund will no longer consider your account to be a lost shareholder account, and your outstanding payment will be reissued to your corrected address.
Uncashed Checks. All uncashed checks on your account will appear with your monthly or quarterly statement for your convenience. If your redemption proceeds, dividend, or distribution check is not cashed within six months (an “outstanding payment”), the outstanding payment on your account will be cancelled and the proceeds will be reinvested in the Fund at the per share NAV determined as of the date of cancellation. In the event the proceeds represent a full liquidation or a distribution from a retirement account, the proceeds will be deposited into a nonretirement account for you and invested in the Touchstone Ultra Short Duration Fixed Income Fund. In addition, if the payment was for dividends or distributions, your cash election will be automatically changed and future dividends and distributions will be reinvested in the Fund at the per share NAV determined as of the date of payment. For redemption checks returned as “undeliverable”, the check will be voided and deposited into a lost shareholder account for the Fund. If the account holder contacts the Fund and provides proper documentation to update the address on the account, a check for the previously voided amount will be re-issued to the shareholder and sent to the new address of record.
Fund Shares Purchased by Check. We may delay the processing and payment of a redemption request for shares you recently purchased by check until your check clears, which may take up to 15 days. If you need your money sooner, you should purchase shares by bank wire.
Low Account Balances. (Only applicable for shares held through Touchstone Securities directly). If your balance falls below the minimum amount required for your account, based on actual amounts you have invested (as opposed to a reduction from market changes), Touchstone Securities may sell your shares and send the proceeds to you. Touchstone Securities will notify you if your shares are about to be sold and you will have 30 days to increase your account balance to the minimum amount.
Facilitated Transfers. In the event an existing Touchstone shareholder wishes to move money between their Touchstone mutual fund account and a money market fund, Touchstone has partnered with The Dreyfus Corporation to help facilitate this type of transaction pursuant to certain limitations. Please contact Touchstone Shareholder Services at 1.800.543.0407 for more information if you are interested in pursuing this type of transaction.
DISTRIBUTIONS
A Fund’s dividends and other distributions are taxable to shareholders (other than retirement plans and other tax-exempt investors) whether received in cash or reinvested in additional shares of the Fund. A dividend or distribution paid by a Fund has the effect of reducing the NAV per share on the ex-dividend date by the amount of the dividend or distribution. A dividend or distribution declared shortly after a purchase of shares by an investor would, therefore, represent, in substance, a return of capital to the shareholder with respect to such shares even though it would be subject to federal income taxes.
For most shareholders, a statement will be sent to you within 60 days after the end of each year detailing the federal income tax status of your distributions. Please see “ Taxes” below for more information on the federal income tax consequences of dividends and other distributions made by the Funds.
FEDERAL INCOME TAXES
The following discussion summarizes certain U.S. federal income tax considerations affecting the Funds and their shareholders. This discussion is for general information only and does not purport to consider all aspects of U.S. federal income taxation that might be relevant to beneficial owners of shares of the Funds. Therefore, the summary discussion that follows may not be considered to be individual tax advice and may not be relied upon by any shareholder. The summary is based upon current provisions of the Internal Revenue Code of 1986, as amended (the “Code”), applicable U.S. Treasury Regulations (the “Regulations”), and administrative and judicial interpretations thereof, all of which are subject to change, which change could be retroactive, and may affect the conclusions expressed herein. The summary applies only to beneficial owners of a Fund’s shares in whose hands such shares are capital assets within the meaning of Section 1221 of the Code, and may not apply to certain types of beneficial owners of a Fund’s shares, including, but not limited to insurance companies, tax-exempt organizations, shareholders holding a Fund’s shares through tax-advantaged accounts (such as an individual retirement account (an “IRA”), a 401(k) plan account, or other qualified retirement account), financial institutions, pass-through entities, broker-dealers, entities that are not organized under the laws of the United States or a political subdivision thereof, persons who are neither a citizen nor resident of the United States, shareholders holding a Fund’s shares as part of a hedge, straddle or conversion transaction, and shareholders who are subject to the alternative minimum tax. Persons who may be subject to tax in more than one country should consult the provisions of any applicable tax treaty to determine the potential tax consequences to them.
No Fund has requested nor will any Fund request an advance ruling from the Internal Revenue Service (the “IRS”) as to the federal income tax matters described below. The IRS could adopt positions contrary to those discussed below and such positions could be sustained. In addition, the following discussion applicable to shareholders of a Fund addresses only some of the federal income tax considerations generally affecting investments in such Fund.
Shareholders are urged and advised to consult their own tax advisor with respect to the tax consequences of the ownership, purchase and disposition of an investment in a Fund including, but not limited to, the applicability of state, local, foreign and other tax laws affecting the particular shareholder and to possible effects of changes in federal or other tax laws.
General. For federal income tax purposes, each Fund is treated as a separate corporation. Each Fund has elected, and intends to continue to qualify for, taxation as a regulated investment company (a “RIC”) under the Code. By qualifying as a RIC, a Fund (but not the shareholders) will not be subject to federal income tax on that portion of its investment company taxable income and realized net capital gains that it distributes to its shareholders.
Shareholders should be aware that investments made by a Fund, some of which are described below, may involve complex tax rules some of which may result in income or gain recognition by the Fund without the concurrent receipt of cash. Although each Fund seeks to avoid significant noncash income, such noncash income could be recognized by a Fund, in which case it may distribute cash derived from other sources in order to meet the minimum distribution requirements described below. Cash to make the required minimum distributions may be obtained from sales proceeds of securities held by a Fund (even if such sales are not advantageous) or, if permitted by its governing documents and other regulatory restrictions, through borrowing the amounts required to be distributed.
Qualification As A Regulated Investment Company. Qualification as a RIC under the Code requires, among other things, that each Fund: (a) derive at least 90% of its gross income for each taxable year from (i) dividends, interest, payments with respect to securities loans and gains from the sale or other disposition of stock, securities or foreign currencies, or other income (including but not limited to gains from options, futures and forward contracts) derived with respect to its business of investing in such stock, securities or currencies, and (ii) net income from interests in qualified publicly traded partnerships (together with (i), the “Qualifying Income Requirement”); (b) diversify its holdings so that, at the close of each quarter of the taxable year: (i) at least 50% of the value of its assets is comprised of cash, cash items (including receivables), U.S. government securities, securities of other RICs
and other securities, with those other securities limited, in respect of any one issuer, to an amount that does not exceed 5% of the value of its total assets and that does not represent more than 10% of the outstanding voting securities of such issuer; and (ii) not more than 25% of the value of its assets is invested in the securities (other than U.S. government securities or securities of other RICs) of any one issuer or the securities (other than the securities of other RICs) of two or more issuers controlled by it and engaged in the same, similar or related trades or businesses, or the securities of one or more “qualified publicly traded partnerships” (together with (i) the “Diversification Requirement”); and (c) distribute for each taxable year at least the sum of (i) 90% of its investment company taxable income (which includes dividends, taxable interest, taxable original issue discount income, market discount income, income from securities lending, net short-term capital gain in excess of net long-term capital loss, certain net realized foreign currency exchange gains, and any other taxable income other than “net capital gain” as defined below and is reduced by deductible expenses) determined without regard to any deduction for dividends paid; and (ii) 90% of its tax-exempt interest, if any, net of certain expenses allocable thereto (“net tax-exempt interest”).
The U.S. Treasury Department is authorized to promulgate regulations under which gains from foreign currencies (and options, futures, and forward contracts on foreign currency) would constitute qualifying income for purposes of the Qualifying Income Requirement only if such gains are directly related to the principal business of a Fund of investing in stock or securities or options and futures with respect to stock or securities. To date, the U.S. Treasury Department has not issued such regulations.
As a RIC, a Fund generally will not be subject to U.S. federal income tax on the portion of its income and capital gains that it distributes to its shareholders in any taxable year for which it distributes, in compliance with the Code’s timing and other requirements at least 90% of its investment company taxable income (determined without regard to the deduction for dividends paid) and at least 90% of its net tax-exempt interest. Each Fund may retain for investment all or a portion of its net capital gain (i.e., the excess of its net long-term capital gain over its net short-term capital loss). If a Fund retains any investment company taxable income or net capital gain, it will be subject to tax at regular corporate rates on the amount retained. If a Fund retains any net capital gain, it may designate the retained amount as undistributed net capital gain in a notice to its shareholders, who will be (i) required to include in income for federal income tax purposes, as long-term capital gain, their shares of such undistributed amount; and (ii) entitled to credit their proportionate shares of tax paid by such Fund against their federal income tax liabilities, if any, and to claim refunds to the extent the credit exceeds such liabilities. For federal income tax purposes, the tax basis of the shares owned by a shareholder of a Fund will be increased by the amount of undistributed net capital gain included in the shareholder’s gross income and decreased by the federal income tax paid by such Fund on that amount of capital gain.
The Qualifying Income Requirement and Diversification Requirement that must be met under the Code in order for a Fund to qualify as a RIC, as described above, may limit the extent to which it will be able to engage in derivative transactions. Rules governing the federal income tax aspects of derivatives, including swap agreements, are not entirely clear in certain respects, particularly in light of two IRS revenue rulings issued in 2006. Revenue Ruling 2006-1 held that income from a derivative contract with respect to a commodity index is not qualifying income for a RIC. Subsequently, the IRS issued Revenue Ruling 2006-31 in which it stated that the holding in Revenue Ruling 2006-1 “was not intended to preclude a conclusion that the income from certain instruments (such as certain structured notes) that create a commodity exposure for the holder is qualifying income.” Accordingly, the Qualifying Income Requirement may limit each Fund’s ability to invest in commodity related derivative transactions and other derivative transactions. Each Fund will account for any investments in commodity derivative transactions in a manner it deems to be appropriate; the IRS, however, might not accept such treatment. If the IRS did not accept such treatment, the status of such Fund as a RIC might be jeopardized.
In general, for purposes of the Qualifying Income Requirement described above, income derived from a partnership is treated as qualifying income only to the extent such income is attributable to items of income of the partnership which would be qualifying income if realized directly by the RIC. However, all of the net income of a RIC derived from an interest in a qualified publicly traded partnership (defined as a partnership (x) the interests in which are traded on an established securities market or are readily tradable on a secondary market or the substantial equivalent thereof, and (y) that derives less than 90% of its income from the qualifying income described in clause (i) of the Qualifying Income Requirement described above) will be treated as qualifying income. In general, such entities will be treated as partnerships for federal income tax purposes if they meet the passive income requirement under Section 7704(c)(2) of the Code. In addition, although in general the passive loss rules of the Code do not apply to RICs, such rules do apply to a RIC with respect to items attributable to an interest in a qualified publicly traded partnership.
For purposes of the Diversification Requirement described above, the term “outstanding voting securities of such issuer” will include the equity securities of a qualified publicly traded partnership.
If a Fund fails to satisfy the Qualifying Income Requirement or the Diversification Requirement in any taxable year, such Fund may be eligible for relief provisions if the failures are due to reasonable cause and not willful neglect and if a penalty tax is paid with respect to each failure to satisfy the applicable requirements. Additionally, relief is provided for certain de minimis failures to satisfy the Diversification Requirements where the Fund corrects the failure within a specified period of time. If the applicable
relief provisions are not available or cannot be met, such Fund will fail to qualify as a RIC and will be subject to tax in the same manner as an ordinary corporation subject to tax on a graduated basis with a maximum tax rate of 35% and all distributions from earnings and profits (as determined under U.S. federal income tax principles) to its shareholders will be taxable as ordinary dividend income eligible for the dividends-received deduction for corporate shareholders and for qualified dividend income treatment for non-corporate shareholders.
Excise Tax. If a Fund fails to distribute by December 31 of each calendar year an amount equal to the sum of (1) at least 98% of its taxable ordinary income (excluding capital gains and losses) for such year, (2) at least 98.2% of the excess of its capital gains over its capital losses (as adjusted for certain ordinary losses) for the twelve month period ending on October 31 of such year, and (3) all taxable ordinary income and the excess of capital gains over capital losses for the prior year that were not distributed during such year and on which it did not pay federal income tax, such Fund will be subject to a nondeductible 4% excise tax (the “Excise Tax”) on the undistributed amounts. A distribution will be treated as paid on December 31 of the calendar year if it is declared by a Fund in October, November, or December of that year to shareholders of record on a date in such month and paid by it during January of the following year. Such distributions will be taxable to shareholders (other than those not subject to federal income tax) in the calendar year in which the distributions are declared, rather than the calendar year in which the distributions are received. Each Fund generally intends to actually distribute or be deemed to have distributed substantially all of its net income and gain, if any, by the end of each calendar year in compliance with these requirements so that it will generally not be required to pay the Excise Tax. A Fund may in certain circumstances be required to liquidate its investments in order to make sufficient distributions to avoid the Excise Tax liability at a time when its Advisor might not otherwise have chosen to do so. Liquidation of investments in such circumstances may affect the ability of a Fund to satisfy the requirements for qualification as a RIC. However, no assurances can be given that a Fund will not be subject to the Excise Tax and, in fact, in certain instances if warranted, a Fund may choose to pay the Excise Tax as opposed to making an additional distribution.
Capital Loss Carryforwards. For losses arising from tax years beginning on or before December 22, 2010, a Fund is permitted to carry forward a net capital loss from any year to offset its capital gains, if any, realized during the eight years following the year of the loss and such Fund’s capital loss carryforward is treated as a short-term capital loss in the year to which it is carried. For capital losses realized with respect to tax years of a Fund beginning after December 22, 2010, such Fund may carry capital losses forward indefinitely. For capital losses realized in taxable years beginning after December 22, 2010, the excess of a Fund’s net short-term capital losses over its net long-term capital gain is treated as short-term capital losses arising on the first day of the Fund’s next taxable year and the excess of a Fund’s net long-term capital losses over its net short-term capital gain is treated as long-term capital losses arising on the first day of the Fund’s next taxable year. If carried forward capital losses offset future capital gains, such future capital gains are not subject to Fund-level federal income taxation, regardless of whether they are distributed to shareholders. A Fund cannot carry back or carry forward any net operating losses.
Original Issue Discount And Market Discount. A Fund may acquire debt securities that are treated as having original issue discount (“OID”) (generally a debt obligation with a purchase price less than its principal amount, such as a zero coupon bond). Generally, a Fund will be required to include the OID in income over the term of the debt security, even though it will not receive cash payments for such OID until a later time, usually when the debt security matures. A Fund may make one or more of the elections applicable to debt securities having OID which could affect the character and timing of recognition of income. Inflation-protected bonds generally can be expected to produce OID income as their principal amounts are adjusted upward for inflation. The IRS may treat a portion of the OID includible in income with respect to certain high-yield corporate debt securities as a dividend for federal income tax purposes.
A debt security acquired in the secondary market by a Fund may be treated as having market discount if acquired at a price below redemption value or adjusted issue price if issued with original issue discount. The Fund’s market discount accrues ratably, on a daily basis, over the period from the date of acquisition to the date of maturity even though the Fund will not receive cash. Absent an election by a Fund to include the market discount in income as it accrues, gain on its disposition of such an obligation will be treated as ordinary income rather than capital gain to the extent of the accrued market discount.
In addition, pay-in-kind securities will give rise to income which is required to be distributed and is taxable even though a Fund holding such securities receives no interest payments in cash on such securities during the year.
Each Fund generally will be required to make distributions to shareholders representing the income accruing on the securities, described above, that is currently includable in income, even though cash representing such income may not have been received by such Fund. Cash to pay these distributions may be obtained from sales proceeds of securities held by a Fund (even if such sales are not advantageous) or, if permitted by such Fund’s governing documents, through borrowing the amounts required to be distributed. In the event a Fund realizes net capital gains from such transactions, its shareholders may receive a larger capital gain distribution, if any, than they would have in the absence of such transactions.
Options, Futures, And Forward Contracts. The writing (selling) and purchasing of options and futures contracts and entering into forward currency contracts, involves complex rules that will determine for federal income tax purposes the amount, character and timing of recognition of the gains and losses a Fund realizes in connection with such transactions.
Gains and losses on the sale, lapse, or other termination of options and futures contracts, options thereon and certain forward contracts (except certain foreign currency options, forward contracts and futures contracts) will generally be treated as capital gains and losses. Some regulated futures contracts, certain foreign currency contracts, and certain non-equity options (such as certain listed options or options on broad based securities indexes) held by a Fund (“Section 1256 contracts”), other than contracts on which it has made a “mixed-straddle election”, will be required to be “marked-to-market” for federal income tax purposes, that is, treated as having been sold at their market value on the last day of such Fund’s taxable year. These provisions may require a Fund to recognize income or gains without a concurrent receipt of cash. Any gain or loss recognized on actual or deemed sales of Section 1256 contracts will be treated as 60% long-term capital gain or loss and 40% short-term capital gain or loss, although certain foreign currency gains and losses from such contracts may be treated as ordinary income or loss as described below. Transactions that qualify as designated hedges are exempt from the mark-to-market rule, but may require a Fund to defer the recognition of losses on futures contracts, foreign currency contracts and certain options to the extent of any unrecognized gains on related positions held by it.
The tax provisions described above applicable to options, futures and forward contracts may affect the amount, timing, and character of a Fund’s distributions to its shareholders. For example, the Section 1256 rules described above may operate to increase the amount a Fund must distribute to satisfy the minimum distribution requirement for the portion treated as short-term capital gain which will be taxable to its shareholders as ordinary income, and to increase the net capital gain it recognizes, without, in either case, increasing the cash available to it. A Fund may elect to exclude certain transactions from the operation of Section 1256, although doing so may have the effect of increasing the relative proportion of net short-term capital gain (taxable as ordinary income) and thus increasing the amount of dividends it must distribute. Section 1256 contracts also may be marked-to-market for purposes of the Excise Tax.
When a covered call or put option written (sold) by a Fund expires such Fund will realize a short-term capital gain equal to the amount of the premium it received for writing the option. When a Fund terminates its obligations under such an option by entering into a closing transaction, it will realize a short-term capital gain (or loss), depending on whether the cost of the closing transaction is less than (or exceeds) the premium received when it wrote the option. When a covered call option written by a Fund is exercised, such Fund will be treated as having sold the underlying security, producing long-term or short-term capital gain or loss, depending upon the holding period of the underlying security and whether the sum of the option price received upon the exercise plus the premium received when it wrote the option is more or less than the basis of the underlying security.
Straddles. Section 1092 deals with the taxation of straddles which also may affect the taxation of options in which a Fund may invest. Offsetting positions held by a Fund involving certain derivative instruments, such as options, futures and forward currency contracts, may be considered, for federal income tax purposes, to constitute “straddles.” Straddles are defined to include offsetting positions in actively traded personal property. In certain circumstances, the rules governing straddles override or modify the provisions of Section 1256, described above. If a Fund is treated as entering into a straddle and at least one (but not all) of its positions in derivative contracts comprising a part of such straddle is governed by Section 1256, then such straddle could be characterized as a “mixed straddle.” A Fund may make one or more elections with respect to mixed straddles. Depending on which election is made, if any, the results with respect to a Fund may differ. Generally, to the extent the straddle rules apply to positions established by a Fund, losses realized by it may be deferred to the extent of unrealized gain in any offsetting positions. Moreover, as a result of the straddle rules, short-term capital loss on straddle positions may be characterized as long-term capital loss, and long-term capital gain may be characterized as short-term capital gain. In addition, the existence of a straddle may affect the holding period of the offsetting positions and cause such sales to be subject to the “wash sale” and “short sale” rules. As a result, the straddle rules could cause distributions that would otherwise constitute “qualified dividend income” to fail to satisfy the applicable holding period requirements, described below, and therefore to be taxed as ordinary income. Further, a Fund may be required to capitalize, rather than deduct currently, any interest expense and carrying charges applicable to a position that is part of a straddle. Because the application of the straddle rules may affect the character and timing of gains and losses from affected straddle positions, the amount which must be distributed to shareholders, and which will be taxed to shareholders as ordinary income or long-term capital gain, may be increased or decreased substantially as compared to the situation where a Fund had not engaged in such transactions.
In circumstances where a Fund has invested in certain pass-through entities, the amount of long-term capital gain that it may recognize from certain derivative transactions with respect to interests in such pass-through entities is limited under the Code’s constructive ownership rules. The amount of long-term capital gain is limited to the amount of such gain a Fund would have had if it directly invested in the pass-through entity during the term of the derivative contract. Any gain in excess of this amount is treated as ordinary income. An interest charge is imposed on the amount of gain that is treated as ordinary income.
Swaps And Derivatives. As a result of entering into swap or derivative agreements, a Fund may make or receive periodic net payments. A Fund may also make or receive a payment when a swap or derivative is terminated prior to maturity through an assignment of the swap or derivative or other closing transaction. Periodic net payments will generally constitute ordinary income or deductions, while termination of a swap or derivative will generally result in capital gain or loss (which will be a long-term capital gain or loss if the Fund has been a party to a swap or derivative for more than one year). With respect to certain types of swaps or derivatives, a Fund may be required to currently recognize income or loss with respect to future payments on such swaps or derivatives or may elect under certain circumstances to mark such swaps or derivatives to market annually for tax purposes as ordinary income or loss.
Rules governing the tax aspects of swap or derivative agreements are not entirely clear in certain respects, in particular whether income generated is Qualifying Income. Accordingly, while each Fund intends to account for such transactions in a manner it deems appropriate, the IRS might not accept such treatment. If the IRS did not accept such treatment, the status of the Fund as a RIC might be adversely affected. The Funds intend to monitor developments in this area. Certain requirements that must be met under the Code in order for each Fund to qualify as a RIC may limit the extent to which a Fund will be able to engage in swap agreements and certain derivatives.
Constructive Sales. Certain rules may affect the timing and character of gain if a Fund engages in transactions that reduce or eliminate its risk of loss with respect to appreciated financial positions. If a Fund enters into certain transactions (including a short sale, an offsetting notional principal contract, a futures or forward contract, or other transactions identified in U.S. Treasury regulations) in property while holding an appreciated financial position in substantially identical property, it will be treated as if it had sold and immediately repurchased the appreciated financial position and will be taxed on any gain (but not loss) from the constructive sale. The character of gain from a constructive sale will depend upon a Fund’s holding period in the appreciated financial position. Loss from a constructive sale would be recognized when the position was subsequently disposed of, and its character would depend on a Fund’s holding period and the application of various loss deferral provisions of the Code.
In addition, if the appreciated financial position is itself a short sale, acquisition of the underlying property or substantially identical property by a Fund will be deemed a constructive sale. The foregoing will not apply, however, to a Fund’s transaction during any taxable year that otherwise would be treated as a constructive sale if the transaction is closed within 30 days after the end of that year and such Fund holds the appreciated financial position unhedged for 60 days after that closing (i.e., at no time during that 60-day period is such Fund’s risk of loss regarding the position reduced by reason of certain specified transactions with respect to substantially identical or related property, such as having an option to sell, being contractually obligated to sell, making a short sale or granting an option to buy substantially identical stock or securities).
Wash Sales. A Fund may in certain circumstances be impacted by special rules relating to “wash sales.” In general, the wash sale rules prevent the recognition of a loss by a Fund from the disposition of stock or securities at a loss in a case in which identical or substantially identical stock or securities (or an option to acquire such property) is or has been acquired by it within 30 days before or 30 days after the sale.
Short Sales. A Fund may make short sales of securities. Short sales may increase the amount of short-term capital gain realized by a Fund, which is taxed as ordinary income when distributed to its shareholders. Short sales also may be subject to the “Constructive Sales” rules, discussed above.
Tax Credit Bonds. If a Fund holds (directly or indirectly) one or more “tax credit bonds” (defined below) on one or more specified dates during a Fund’s taxable year, and it satisfies the minimum distribution requirement, it may elect for U.S. federal income tax purposes to pass through to shareholders tax credits otherwise allowable to it for that year with respect to such tax credit bonds. A tax credit bond is defined in the Code as a “qualified tax credit bond” (which includes a qualified forestry conservation bond, a new clean renewable energy bond, a qualified energy conservation bond, or a qualified zone academy bond, each of which must meet certain requirements specified in the Code), a “build America bond” (which includes certain qualified bonds issued before January 1, 2011) or certain other bonds specified in the Code. If a Fund were to make an election, a shareholder of such Fund would be required to include in gross income an amount equal to such shareholder’s proportionate share of the interest income attributable to such credits and would be entitled to claim as a tax credit an amount equal to a proportionate share of such credits. Certain limitations may apply on the extent to which the credit may be claimed.
Other Regulated Investment Companies. Generally, the character of the income or capital gains that a Fund receives from another investment company will pass through to the Fund’s shareholders as long as the Fund and the other investment company each qualify as RICs under the Code. However, to the extent that another investment company that qualifies as a RIC realizes net losses on its investments for a given taxable year, a Fund will not be able to recognize its share of those losses until it disposes of shares of such investment company. Moreover, even when a Fund does make such a disposition, a portion of its loss may be
recognized as a long-term capital loss, which will not be treated as favorably for federal income tax purposes as an ordinary deduction. In particular, a Fund will not be able to offset any capital losses from its dispositions of shares of other investment companies against its ordinary income. As a result of the foregoing rules, and certain other special rules, it is possible that the amounts of net investment income and net capital gains that a Fund will be required to distribute to shareholders will be greater than such amounts would have been had the Fund invested directly in the securities held by the investment companies in which it invests, rather than investing in shares of the investment companies. For similar reasons, the character of distributions from a Fund (e.g., long-term capital gain, qualified dividend income, etc.) will not necessarily be the same as it would have been had the Fund invested directly in the securities held by the investment companies in which it invests.
Passive Foreign Investment Companies. A Fund may invest in a non-U.S. corporation, which could be treated as a passive foreign investment company (a “PFIC”) or become a PFIC under the Code. A PFIC is generally defined as a foreign corporation that meets either of the following tests: (1) at least 75% of its gross income for its taxable year is income from passive sources (such as interest, dividends, certain rents and royalties, or capital gains); or (2) an average of at least 50% of its assets produce, or are held for the production of, such passive income. If a Fund acquires any equity interest in a PFIC, such Fund could be subject to federal income tax and interest charges on “excess distributions” received with respect to such PFIC stock or on any gain from the sale of such PFIC stock (collectively “PFIC income”), even if such Fund distributes the PFIC income as a taxable dividend to its shareholders. The balance of the PFIC income will be included in such Fund’s investment company taxable income and, accordingly, will not be taxable to it to the extent it distributes that income to its shareholders. A Fund’s distributions of PFIC income will be taxable as ordinary income even though, absent the application of the PFIC rules, some portion of the distributions may have been classified as capital gain.
A Fund will not be permitted to pass through to its shareholders any credit or deduction for taxes and interest charges incurred with respect to a PFIC. Payment of this tax would therefore reduce a Fund’s economic return from its investment in PFIC shares. To the extent a Fund invests in a PFIC, it may elect to treat the PFIC as a “qualified electing fund” (“QEF”), then instead of the tax and interest obligation described above on excess distributions, such Fund would be required to include in income each taxable year its pro rata share of the QEF’s annual ordinary earnings and net capital gain. As a result of a QEF election, a Fund would likely have to distribute to its shareholders an amount equal to the QEF’s annual ordinary earnings and net capital gain to satisfy the Code’s minimum distribution requirement described herein and avoid imposition of the Excise Tax, even if the QEF did not distribute those earnings and gain to such Fund. In most instances it will be very difficult, if not impossible, to make this election because of certain requirements in making the election.
A Fund may elect to “mark-to-market” its stock in any PFIC. “Marking-to-market,” in this context, means including in ordinary income each taxable year the excess, if any, of the fair market value of the PFIC stock over such Fund’s adjusted basis therein as of the end of that year. Pursuant to the election, a Fund also may deduct (as an ordinary, not capital, loss) the excess, if any, of its adjusted basis in the PFIC stock over the fair market value thereof as of the taxable year-end, but only to the extent of any net mark-to-market gains with respect to that stock it included in income for prior taxable years under the election. A Fund’s adjusted basis in its PFIC stock subject to the election would be adjusted to reflect the amounts of income included and deductions taken thereunder. In either case, a Fund may be required to recognize taxable income or gain without the concurrent receipt of cash.
Foreign Currency Transactions. Foreign currency gains and losses realized by a Fund in connection with certain transactions involving foreign currency-denominated debt instruments, certain options, futures contracts, forward contracts, and similar instruments relating to foreign currency, foreign currencies, and foreign currency-denominated payables and receivables are subject to Section 988 of the Code, which causes such gains and losses to be treated as ordinary income or loss and may affect the amount and timing of recognition of such Fund’s income. In some cases elections may be available that would alter this treatment, but such elections could be detrimental to a Fund by creating current recognition of income without the concurrent recognition of cash. If a foreign currency loss treated as an ordinary loss under Section 988 were to exceed a Fund’s investment company taxable income (computed without regard to such loss) for a taxable year the resulting loss would not be deductible by it or its shareholders in future years. The foreign currency income or loss will also increase or decrease a Fund’s investment company income distributable to its shareholders.
Foreign Taxation. Income received by a Fund from sources within foreign countries may be subject to foreign withholding and other taxes. Tax conventions between certain countries and the United States may reduce or eliminate such taxes. If more than 50% of a Fund’s total assets at the close of any taxable year consist of stock or securities of foreign corporations, or if a Fund is a qualified fund of funds (i.e., a RIC that invests at least 50% of its total assets in other RICs at the close of each quarter of its taxable year) and the Fund meets the distribution requirements described above, such Fund may file an election (the “pass-through election”) with the IRS pursuant to which shareholders of the Fund would be required to (i) include in gross income (in addition to taxable dividends actually received) their pro rata shares of foreign income taxes paid by the Fund, or in the case of a qualified fund of funds, such taxes paid by an underlying fund that has made the pass-through election, even though not actually received by such shareholders; and (ii) treat such respective pro rata portions as foreign income taxes paid by them. Each Fund will furnish
its shareholders with a written statement providing the amount of foreign taxes paid by the Fund that will “pass-through” for the year, if any.
Generally, a credit for foreign taxes is subject to the limitation that it may not exceed the shareholder’s U.S. tax attributable to his or her total foreign source taxable income. For this purpose, if the pass-through election is made, the source of a Fund’s income will flow through to shareholders. The limitation on the foreign tax credit is applied separately to foreign source passive income, and to certain other types of income. Shareholders may be unable to claim a credit for the full amount of their proportionate share of the foreign taxes paid by a Fund. Various limitations, including a minimum holding period requirement, apply to limit the credit and deduction for foreign taxes for purposes of regular federal income tax and alternative minimum tax.
REITs. A Fund may invest in REITs. Investments in REIT equity securities may require a Fund to accrue and distribute taxable income without the concurrent receipt of cash. To generate sufficient cash to make the requisite distributions, a Fund may be required to sell securities in its portfolio (including when it is not advantageous to do so) that it otherwise would have continued to hold. A Fund’s investments in REIT equity securities may at other times result in its receipt of cash in excess of the REIT’s earnings; if such Fund distributes these amounts, these distributions could constitute a return of capital to its shareholders for federal income tax purposes. Dividends received by a Fund from a REIT generally will not constitute qualified dividend income.
A Fund may invest in REITs that hold residual interests in REMICs or taxable mortgage pools (TMPs), or such REITs may themselves constitute TMPs. Under an IRS notice, and U.S. Treasury regulations that have yet to be issued but may apply retroactively, a portion of a Fund’s income from a REIT that is attributable to the REIT’s residual interest in a REMIC or a TMP (referred to in the Code as an “excess inclusion”) will be subject to federal income tax in all events. This notice also provides, and the regulations are expected to provide, that excess inclusion income of a RIC, such as the Funds, will be allocated to shareholders of the RIC in proportion to the dividends received by such shareholders, with the same consequences as if the shareholders held the related REMIC residual interest or invested in the TMP directly. As a result, the Fund may not be a suitable investment for certain tax exempt-shareholders, including a qualified pension plan, an individual retirement account, a 401(k) plan, a Keogh plan and other tax-exempt entities. See “Tax-Exempt Shareholders.”
Distributions. Distributions paid out of a Fund’s current and accumulated earnings and profits (as determined at the end of the year), whether reinvested in additional shares or paid in cash, are generally taxable and must be reported by each shareholder who is required to file a federal income tax return. Distributions in excess of a Fund’s current and accumulated earnings and profits, as computed for federal income tax purposes, will first be treated as a return of capital up to the amount of a shareholder’s tax basis in his or her Fund shares and then as capital gain.
For federal income tax purposes, distributions of net investment income are generally taxable as ordinary income, and distributions of gains from the sale of investments that a Fund owned for one year or less will be taxable as ordinary income. Distributions designated by a Fund as “capital gain dividends” (distributions from the excess of net long-term capital gain over net short-term capital losses) will be taxable to shareholders as long-term capital gain regardless of the length of time they have held their shares of such Fund. Such dividends do not qualify as dividends for purposes of the dividends received deduction or for qualified dividend income purposes as described below.
Distributions of “qualified dividend income” received by non-corporate shareholders of a Fund may be eligible for the long-term capital gain rate. A Fund’s distribution will be treated as qualified dividend income and therefore eligible for the long-term capital gain rate to the extent the Fund receives dividend income from taxable domestic corporations and certain qualified foreign corporations, provided that certain holding period and other requirements are met. A corporate shareholder of a Fund may be eligible for the dividends received deduction on such Fund’s distributions attributable to dividends received by such Fund from domestic corporations, which, if received directly by the corporate shareholder, would qualify for such a deduction. For eligible corporate shareholders, the dividends received deduction may be subject to certain reductions, and a distribution by a Fund attributable to dividends of a domestic corporation will be eligible for the deduction only if certain holding period and other requirements are met.
An additional 3.8% Medicare tax is imposed on certain net investment income (including dividends and capital gain distributions received from a Fund and net gains from redemptions or other taxable dispositions of shares of a Fund) of U.S. individuals, estates and trusts to the extent that such person’s “modified adjusted gross income” (in the case of an individual) or “adjusted gross income” (in the case of an estate or trust) exceeds a threshold amount.
Each Fund will furnish a statement to shareholders providing the federal income tax status of its dividends and distributions including the portion of such dividends, if any, that qualifies as long-term capital gain.
Different tax treatment, including penalties on certain excess contributions and deferrals, certain pre-retirement and post-retirement distributions, and certain prohibited transactions, is accorded to accounts maintained as qualified retirement plans.
Shareholders are urged and advised to consult their own tax advisors for more information.
Purchases of Fund Shares. Prior to purchasing shares in a Fund, the impact of dividends or distributions which are expected to be or have been declared, but not paid, should be carefully considered. Any dividend or distribution declared shortly after a purchase of shares of a Fund prior to the record date will have the effect of reducing the per share NAV by the per share amount of the dividend or distribution, and to the extent the distribution consists of the Fund’s taxable income, the purchasing shareholder will be taxed on the taxable portion of the dividend or distribution received even though some or all of the amount distributed is effectively a return of capital.
Sales, Exchanges or Redemptions. Upon the disposition of shares of a Fund (whether by redemption, sale or exchange), a shareholder may realize a capital gain or loss. Such capital gain or loss will be long-term or short-term depending upon the shareholder’s holding period for the shares. The capital gain will be long-term if the shares were held for more than 12 months and short-term if held for 12 months or less. If a shareholder sells or exchanges Fund shares within 90 days of having acquired such shares and if, before January 31 of the calendar year following the calendar year of the sale or exchange, as a result of having initially acquired those shares, the shareholder subsequently pays a reduced sales charge on a new purchase of shares of the Fund or another Fund, the sales charge previously incurred in acquiring the Fund’s shares generally shall not be taken into account (to the extent the previous sales charges do not exceed the reduction in sales charges on the new purchase) for the purpose of determining the amount of gain or loss on the disposition, but generally will be treated as having been incurred in the new purchase. Any loss realized on a disposition will be disallowed under the “wash sale” rules to the extent that the shares disposed of by the shareholder are replaced by the shareholder (including through dividend reinvestment) within a period of 61 days beginning 30 days before and ending 30 days after the date of disposition. In such a case, the basis of the shares acquired will be adjusted to reflect the disallowed loss. Any loss realized by a shareholder on a disposition of shares held by the shareholder for six months or less will be treated as a long-term capital loss to the extent of any distributions of capital gain dividends received by the shareholder and disallowed to the extent of any distributions of exempt-interest dividends received by the shareholder with respect to such shares unless the Fund declared exempt-interest dividends on a daily basis in an amount equal to at least 90% of its net tax-exempt interest and distributes such dividends on a monthly or more frequent basis. Capital losses are generally deductible only against capital gains except that individuals may deduct up to $3,000 of capital losses against ordinary income.
The 3.8% Medicare contribution tax (described above) will apply to gains from the sale or exchange of a Fund’s shares.
Backup Withholding. Each Fund generally is required to withhold, and remit to the U.S. Treasury, subject to certain exemptions, an amount equal to 28% of all distributions and redemption proceeds paid or credited to a shareholder of such Fund if (i) the shareholder fails to furnish such Fund with the correct taxpayer identification number (“TIN”) certified under penalties of perjury, (ii) the shareholder fails to provide a certified statement that the shareholder is not subject to backup withholding, or (iii) the IRS or a broker has notified such Fund that the number furnished by the shareholder is incorrect or that the shareholder is subject to backup withholding as a result of failure to report interest or dividend income. If the backup withholding provisions are applicable, any such distributions or proceeds, whether taken in cash or reinvested in shares, will be reduced by the amounts required to be withheld. Backup withholding is not an additional tax. Any amounts withheld may be credited against a shareholder’s U.S. federal income tax liability.
State And Local Taxes. State and local laws often differ from federal income tax laws with respect to the treatment of specific items of income, gain, loss, deduction and credit. Shareholders are urged and advised to consult their own tax advisors for more information.
Non-U.S. Shareholders. Distributions made to non-U.S. shareholders attributable to net investment income generally are subject to U.S. federal income tax withholding at a 30% rate (or such lower rate provided under an applicable income tax treaty). However, a Fund will generally not be required to withhold tax on any amounts paid to a non-U.S. investor with respect to dividends attributable to “qualified short-term gain” (i.e., the excess of net short-term capital gain over net long-term capital loss) designated as such by the Fund and dividends attributable to certain U.S. source interest income that would not be subject to federal withholding tax if earned directly by a non-U.S. person, provided such amounts are properly designated by the Fund. A Fund may choose not to designate such amounts.
Notwithstanding the foregoing, if a distribution described above is effectively connected with the conduct of a trade or business carried on by a non-U.S. shareholder within the United States (or, if an income tax treaty applies, is attributable to a permanent establishment in the United States), federal income tax withholding and exemptions attributable to foreign persons will not apply
and such distribution will be subject to the federal income tax, reporting and withholding requirements generally applicable to U.S. persons described above.
Under U.S. federal tax law, a non-U.S. shareholder is not, in general, subject to federal income tax or withholding tax on capital gains (and is not allowed a deduction for losses) realized on the sale of shares of a Fund or on capital gain dividends, provided that the Fund obtains a properly completed and signed certificate of foreign status, unless (i) such gains or distributions are effectively connected with the conduct of a trade or business carried on by the non-U.S. shareholder within the United States (or, if an income tax treaty applies, are attributable to a permanent establishment in the United States of the non-U.S. shareholder); (ii) in the case of an individual non-U.S. shareholder, the shareholder is present in the United States for a period or periods aggregating 183 days or more during the year of the sale and certain other conditions are met; or (iii) the shares of the Fund constitute U.S. real property interests (USRPIs), as described below.
Special rules apply to foreign persons who receive distributions from a Fund that are attributable to gain from “United States real property interests” (“USRPIs”). The Code defines USRPIs to include direct holdings of U.S. real property and any interest (other than an interest solely as a creditor) in a “United States real property holding corporation” or former United States real property holding corporation. The Code defines a United States real property holding corporation as any corporation whose USRPIs make up 50% or more of the fair market value of its USRPIs, its interests in real property located outside the United States, plus any other assets it uses in a trade or business. In general, if a Fund is a United States real property holding company (determined without regard to certain exceptions), distributions by the Fund that are attributable to (a) gains realized on the disposition of USRPIs by the Fund and (b) distributions received by the Fund from a lower-tier RIC or REIT that the Fund is required to treat as USRPI gain in its hands will retain their character as gains realized from USRPIs in the hands of the foreign persons. If the foreign shareholder holds (or has held at any time during the prior year) more than a 5% interest in a class of stock of a Fund, such distributions received by the shareholder with respect to such class of stock will be treated as gains “effectively connected” with the conduct of a “U.S. trade or business,” and subject to tax at graduated rates. Moreover, such shareholders will be required to file a U.S. income tax return for the year in which the gain was recognized and the Fund will be required to withhold 35% of the amount of such distribution. In the case of all other foreign persons (i.e., those whose interest in the Fund did not exceed 5% at any time during the prior year), the USRPI distribution will be treated as ordinary income (regardless of any designation by the Fund that such distribution is qualified short-term gain or net capital gain) and the Fund must withhold 30% (or a lower applicable treaty rate) of the amount of the distribution paid to such foreign persons.
In addition, if a Fund is a United States real property holding corporation or former United States real property holding corporation, the Fund may be required to withhold U.S. tax upon a redemption of shares by a greater-than-5% shareholder that is a foreign person, and that shareholder would be required to file a U.S. income tax return for the year of the disposition of the USRPI and pay any additional tax due on the gain. However, no withholding is generally required with respect to amounts paid in redemption of shares of a fund if the fund is a domestically controlled qualified investment entity, or, in certain other limited cases, if a fund (whether or not domestically controlled) holds substantial investments in RICs that are domestically controlled qualified investment entities.
Subject to the additional rules described herein, federal income tax withholding will apply to distributions attributable to dividends and other investment income distributed by the Funds. The federal income tax withholding rate may be reduced (and, in some cases, eliminated) under an applicable tax treaty between the United States and the non-U.S. shareholder’s country of residence or incorporation. In order to qualify for treaty benefits, a non-U.S. shareholder must comply with applicable certification requirements relating to its foreign status (generally by providing a Fund with a properly completed Form W-8BEN).
Sections 1471-1474 of the Code and the U.S. Treasury and IRS guidance issued thereunder (collectively, “FATCA”) generally require a Fund to obtain information sufficient to identify the status of each of its shareholders. If a shareholder fails to provide this information or otherwise fails to comply with FATCA, a Fund may be required to withhold under FATCA at a rate of 30% with respect to that shareholder on Fund dividends and distributions and on the proceeds of the sale, redemption, or exchange of Fund shares. A Fund may disclose the information that it receives from (or concerning) its shareholders to the IRS, non-U.S. taxing authorities or other parties as necessary to comply with FATCA, related intergovernmental agreements or other applicable law or regulation. Each investor is urged to consult its tax advisor regarding the applicability of FATCA and any other reporting requirements with respect to the investor’s own situation, including investments through an intermediary.
Foreign Bank And Financial Accounts And Foreign Financial Assets Reporting Requirements. A shareholder that owns directly or indirectly more than 50% by vote or value of a Fund, is urged and advised to consult its own tax advisor regarding its filing obligations with respect to FinCen Form 114, Report of Foreign Bank and Financial Accounts.
Tax-Exempt Shareholders. A tax-exempt shareholder could realize unrelated business taxable income (“UBTI”) by virtue of its investment in a Fund if shares in the Fund constitute debt financed property in the hands of the tax-exempt shareholder within the meaning of Code Section 514(b).
It is possible that a tax-exempt shareholder of a Fund will also recognize UBTI if such Fund recognizes “excess inclusion income” (as described above) derived from direct or indirect investments in REMIC residual interests or TMPs. Furthermore, any investment in a residual interest of a CMO that has elected to be treated as a REMIC can create complex tax consequences, especially if a Fund has state or local governments or other tax-exempt organizations as shareholders.
In addition, special tax consequences apply to charitable remainder trusts (“CRTs”) that invest in RICs that invest directly or indirectly in residual interests in REMICs or in TMPs.
Tax Shelter Reporting Regulations. Under U.S. Treasury regulations, if a shareholder recognizes a loss of $2 million or more for an individual shareholder or $10 million or more for a corporate shareholder, the shareholder must file with the IRS a disclosure statement on Form 8886. The fact that a loss is reportable under these regulations does not affect the legal determination of whether the taxpayer’s treatment of the loss is proper. Shareholders are urged and advised to consult their own tax advisors to determine the applicability of these regulations in light of their individual circumstances.
Shareholders are urged and advised to consult their own tax advisor with respect to the tax consequences of an investment in a Fund including, but not limited to, the applicability of state, local, foreign and other tax laws affecting the particular shareholder and to possible effects of changes in federal or other tax laws.
CONTROL PERSONS AND PRINCIPAL SECURITY HOLDERS
Persons or organizations beneficially owning more than 25% of the outstanding shares of a Fund are presumed to “control” the Fund. As a result, those persons or organizations could have the ability to influence an action taken by a Fund if such action requires a shareholder vote.
As of January 3, 2017 the name, address, and percentage ownership of each entity or person that owned of record or beneficially 5% or more of the outstanding shares of any class of a Fund are as follows:
| Fund and Share Class | | Name and Address of Account Owner | | Percent of Class | |
| ACTIVE BOND CLASS A | | NO 5% OR GREATER BENEFICIAL OWNERS | | | |
| | | TO REPORT | | | |
| | | | | | |
| ACTIVE BOND CLASS C | | MLPF & S THE SOLE BENEFIT OF FOR ITS | | 29.19% | |
| | | CUSTOMERS | | | |
| | | ATTN FUND ADMINISTRATION | | | |
| | | 4800 DEER LAKE DR EAST-2ND FLR | | | |
| | | JACKSONVILLE FL 32246 | | | |
| | | | | | |
| | | WELLS FARGO CLEARING SVCS LLC | | 21.81% | |
| | | SPECIAL CUSTODY ACCT FBO | | | |
| | | EXCLUSIVE BENEFIT OF CUSTOMER | | | |
| | | 2801 MARKET ST | | | |
| | | SAINT LOUIS MO 63103-2523 | | | |
| | | | | | |
| | | UBS WM USA | | 11.72% | |
| | | FBO SPEC CDY A/C EXL BEN CUSTOMERS | | | |
| | | OF UBSFSI | | | |
| | | 1000 HARBOR BLVD | | | |
| | | WEEHAWKEN, NJ 07086 | | | |
| | | | | | |
| | | PERSHING LLC | | 11.17% | |
| | | 1 PERSHING PLAZA | | | |
| | | JERSEY CITY NJ 07399 | | | |
| | | | | | |
| | | RAYMOND JAMES | | 6.75% | |
| | | OMNIBUS FOR MUTUAL FUNDS | | | |
| | | HOUSE ACCT FIRM | | | |
| | | 880 CARILLON PARKWAY | | | |
| | | ST PETERSBURG FL 33716 | | | |
| | | MORGAN STANLEY SMITH BARNEY | | 5.01% | |
| | | HARBORSIDE FINANCIAL CENTER | | | |
| | | PLAZA 2 3RD FLOOR | | | |
| | | JERSEY CITY NJ 07311 | | | |
| | | | | | |
| ACTIVE BOND CLASS Y | | FIFTH THIRD BANK TTEE | | 26.49% | |
| | | FBO WESTERN & SOUTHERN LIFE INS CO | | | |
| | | 401K SAVINGS PLAN | | | |
| | | 8515 E ORCHARD RD 2T2 | | | |
| | | CENTENNIAL CO 80111 | | | |
| | | | | | |
| | | BAND & CO | | 16.59% | |
| | | C/O US BANK NA | | | |
| | | 1555 N. RIVERCENTER DRIVE STE. 302 | | | |
| | | MILWAUKEE WI 53212 | | | |
| | | | | | |
| | | FIFTH THIRD BANK TTEE VARIOUS | | 5.51% | |
| | | FASCORE LLC RECORDKEPT PLAN | | | |
| | | C/O FASCORE LLC | | | |
| | | 8515 E ORCHARD RD 2T2 | | | |
| | | GREENWOOD VILLAGE CO 80111 | | | |
| | | | | | |
| | | CHARLES SCHWAB & CO INC | | 5.10% | |
| | | REINVEST ACCOUNT | | | |
| | | ATTN MUTUAL FUND DEPARTMENT | | | |
| | | 101 MONTGOMERY ST | | | |
| | | SAN FRANCISCO CA 94104-4151 | | | |
| | | | | | |
| ACTIVE BOND INSTITUTIONAL | | BAND & CO | | 83.88% | |
| CLASS SHARES | | C/O US BANK NA | | | |
| | | 1555 N. RIVERCENTER DRIVE STE. 302 | | | |
| | | MILWAUKEE WI 53212 | | | |
| | | | | | |
| | | FIFTH THIRD BANK | | 15.75% | |
| | | TTEE VARIOUS | | | |
| | | FASCORE LLC RECORDKEPT PLAN | | | |
| | | C/O FASCORE LLC | | | |
| | | 8515 E ORCHARD RD 2T2 | | | |
| | | GREENWOOD VILLAGE CO 80111 | | | |
| | | | | | |
| ARBITRAGE FUND CLASS A | | MORGAN STANLEY SMITH BARNEY | | 33.84% | |
| | | HARBORSIDE FINANCIAL CENTER | | | |
| | | PLAZA 2 3RD FLOOR | | | |
| | | JERSEY CITY NJ 07311 | | | |
| | | | | | |
| ARBITRAGE FUND CLASS A | | LPL FINANCIAL | | 29.53% | |
| | | OMNIBUS CUSTOMER ACCOUNT | | | |
| | | 4707 EXECUTIVE DRIVE | | | |
| | | SAN DIEGO CA 92121 | | | |
| | | | | | |
| | | PERSHING LLC | | 12.76% | |
| | | 1 PERSHING PLAZA | | | |
| | | JERSEY CITY NJ 07399 | | | |
| | | | | | |
| | | CHARLES SCHWAB & CO INC | | 11.83% | |
| | | 101 MONTGOMERY ST | | | |
| | | SAN FRANCISCO CA 94104 | | | |
| | | | | | |
| ARBITRAGE FUND CLASS C | | MORGAN STANLEY SMITH BARNEY | | 48.27% | |
| | | HARBORSIDE FINANCIAL CENTER | | | |
| | | PLAZA 2 3RD FLOOR | | | |
| | | JERSEY CITY NJ 07311 | | | |
| | | | | | |
| | | UBS FINANCIAL SERVICES INC | | 13.17% | |
| | | FBO UBS WM USA | | | |
| | | OMNI ACCOUNT M/F | | | |
| | | ATTN: DEPARTMENT MANAGER | | | |
| | | 499 WASHINGTON BLVD 9TH FL | | | |
| | | JERSEY CITY NJ 07310-2055 | | | |
| | | | | | |
| | | RAYMOND JAMES | | 6.91% | |
| | | OMNIBUS FOR MUTUAL FUNDS | | | |
| | | HOUSE ACCT FIRM | | | |
| | | 880 CARILLON PARKWAY | | | |
| | | ST PETERSBURG FL 33716 | | | |
| | | LPL FINANCIAL | | 6.07% | |
| | | OMNIBUS CUSTOMER ACCOUNT | | | |
| | | 4707 EXECUTIVE DRIVE | | | |
| | | SAN DIEGO CA 92121 | | | |
| | | | | | |
| ARBITRAGE FUND CLASS Y | | PERSHING LLC | | 42.41% | |
| | | 1 PERSHING PLAZA | | | |
| | | JERSEY CITY NJ 07399 | | | |
| | | | | | |
| | | MORGAN STANLEY SMITH BARNEY | | 31.24% | |
| | | HARBORSIDE FINANCIAL CENTER | | | |
| | | PLAZA 2 3RD FLOOR | | | |
| | | JERSEY CITY NJ 07311 | | | |
| | | | | | |
| | | UBS WM USA | | 9.89% | |
| | | FBO 3UBS WM USA | | | |
| | | FBO SPEC CDY A/C EXL BEN CUSTOMERS | | | |
| | | OF UBSFSI | | | |
| | | 1000 HARBOR BLVD | | | |
| | | WEEHAWKEN, NJ 07086 | | | |
| | | | | | |
| | | LPL FINANCIAL | | 8.83% | |
| | | OMNIBUS CUSTOMER ACCOUNT | | | |
| | | 4707 EXECUTIVE DRIVE | | | |
| | | SAN DIEGO CA 92121 | | | |
| | | | | | |
| ARBITRAGE FUND | | TOUCHSTONE CONTROLLED GROWTH | | 57.08% | *** |
| INSTITUTIONAL CLASS | | WITH INCOME FUND | | | |
| SHARES | | 303 BROADWAY ST STE 1100 | | | |
| | | CINCINNATI OH 45202-4220 | | | |
| | | | | | |
| | | MAC & CO | | 27.73% | |
| | | 525 WILLIAM PENN PLACE, RM 153-3602 | | | |
| | | 500 GRANT STREET | | | |
| | | ROOM 151-1010 | | | |
| | | PITTSBURGH PA 15258 | | | |
| | | | | | |
| | | FIFTH THIRD BANK TTEE | | 6.64% | |
| | | FBO: NATIONWIDE LASSO FUND | | | |
| | | 5001 KINGSLEY DR DEPT 3385 | | | |
| | | CINCINNATI OH 45263 | | | |
| | | | | | |
| EMERGING MARKETS SMALL | | CHARLES SCHWAB & CO INC | | 17.65% | |
| CAP FUND CLASS A | | 101 MONTGOMERY ST | | | |
| | | SAN FRANCISCO CA 94104 | | | |
| | | | | | |
| | | WELLS FARGO CLEARING SVCS LLC | | 13.23% | |
| | | SPECIAL CUSTODY ACCT | | | |
| | | FBO EXCLUSIVE BENEFIT OF CUSTOMER | | | |
| | | 2801 MARKET ST | | | |
| | | SAINT LOUIS MO 63103-2523v | | | |
| | | | | | |
| | | PERSHING LLC | | 8.44% | |
| | | 1 PERSHING PLAZA | | | |
| | | JERSEY CITY NJ 07399 | | | |
| | | LPL FINANCIAL | | 5.17% | |
| | | OMNIBUS CUSTOMER ACCOUNT | | | |
| | | ATTN LINDSAY OTOOLE | | | |
| | | 4707 EXECUTIVE DRIVE | | | |
| | | SAN DIEGO CA 92121 | | | |
| | | | | | |
| EMERGING MARKETS SMALL | | WELLS FARGO CLEARING SVCS LLC | | 36.81% | |
| CAP FUND CLASS C | | SPECIAL CUSTODY ACCT FBO | | | |
| | | EXCLUSIVE BENEFIT OF CUSTOMER | | | |
| | | 2801 MARKET ST | | | |
| | | SAINT LOUIS MO 63103-2523 | | | |
| | | | | | |
| | | UBS WM USA | | 22.22% | |
| | | FBO SPEC CDY A/C EXL BEN CUSTOMERS | | | |
| | | OF UBSFSI | | | |
| | | 1000 HARBOR BLVD | | | |
| | | WEEHAWKEN, NJ 07086 | | | |
| | | | | | |
| | | CHARLES SCHWAB & CO INC | | 9.16% | |
| | | 101 MONTGOMERY ST | | | |
| | | SAN FRANCISCO CA 94104 | | | |
| | | ST PETERSBURG FL 33716 | | | |
| | | | | | |
| | | RAYMOND JAMES | | 8.57% | |
| | | OMNIBUS FOR MUTUAL FUNDS HOUSE | | | |
| | | ACCT | | | |
| | | 880 CARILLON PARKWAY | | | |
| | | | | | |
| | | LPL FINANCIAL | | 7.23% | |
| | | OMNIBUS CUSTOMER ACCOUNT | | | |
| | | ATTN LINDSAY OTOOLE | | | |
| | | 4707 EXECUTIVE DRIVE | | | |
| | | SAN DIEGO CA 92121 | | | |
| | | | | | |
| | | PERSHING LLC | | 6.74% | |
| | | 1 PERSHING PLAZA | | | |
| | | JERSEY CITY NJ 07399 | | | |
| | | | | | |
| EMERGING MARKETS SMALL | | WELLS FARGO CLEARING SVCS LLC | | 23.58% | |
| CAP FUND CLASS Y | | SPECIAL CUSTODY ACCT | | | |
| | | FBO EXCLUSIVE BENEFIT OF CUSTOMER | | | |
| | | 2801 MARKET ST | | | |
| | | SAINT LOUIS MO 63103-2523 | | | |
| | | | | | |
| | | THE WESTERN & SOUTHERN LIFE | | 19.04% | |
| | | INSURANCE CO | | | |
| | | DEFERRED COMP PLAN FBO | | | |
| | | 134 POST 04 DEFERRALS - INSTALLMENT | | | |
| | | 400 BROADWAY | | | |
| | | CINCINNATI OH 45202 | | | |
| | | | | | |
| | | CHARLES SCHWAB & CO INC | | 18.49% | |
| | | 101 MONTGOMERY ST | | | |
| | | SAN FRANCISCO CA 94104 | | | |
| | | UBS WM USA | | 7.76% | |
| | | FBO SPEC CDY A/C EXL BEN CUSTOMERS | | | |
| | | OF UBSFSI | | | |
| | | 1000 HARBOR BLVD | | | |
| | | WEEHAWKEN, NJ 07086 | | | |
| | | | | | |
| | | NATIONAL FINANCIAL SERVICES LLC | | 7.73% | |
| | | FEBO ITS CUSTOMERS | | | |
| | | ATTN MUTUAL FUNDS DEPARTMENT | | | |
| | | 499 WASHINGTON BLVD, 4TH FL | | | |
| | | JERSEY CITY NJ 07310-2010 | | | |
| | | | | | |
| EMERGING MARKETS SMALL | | CHARLES SCHWAB & CO INC | | 79.77% | |
| CAP FUND INSTITUTIONAL | | 101 MONTGOMERY ST | | | |
| CLASS SHARES | | SAN FRANCISCO CA 94104 | | | |
| | | | | | |
| | | NATIONAL FINANCIAL SERVICES CORP | | 16.29% | |
| | | (FBO) OUR CUSTOMERS | | | |
| | | ATTN MUTUAL FUNDS DEPARTMENT | | | |
| | | 499 WASHINGTON BLVD, 4TH FL | | | |
| | | JERSEY CITY NJ 07310-2010 | | | |
| | | | | | |
| HIGH YIELD FUND CLASS A | | PERSHING LLC | | 17.13% | |
| | | 1 PERSHING PLAZA | | | |
| | | JERSEY CITY NJ 07399 | | | |
| | | | | | |
| | | TRUST COMPANY OF AMERICA | | 7.23% | |
| | | FBO #340 | | | |
| | | PO BOX 6503 | | | |
| | | ENGLEWOOD, CO 801556503 | | | |
| | | | | | |
| | | WELLS FARGO CLEARING SVCS LLC | | 5.93% | |
| | | SPECIAL CUSTODY ACCT FBO | | | |
| | | EXCLUSIVE BENEFIT OF CUSTOMER | | | |
| | | 2801 MARKET ST | | | |
| | | SAINT LOUIS MO 63103-2523 | | | |
| | | | | | |
| HIGH YIELD FUND CLASS C | | UBS WM USA | | 24.96% | |
| | | FBO 000 11011 6100 | | | |
| | | SPEC CDY A/C EXL BEN CUSTOMERS | | | |
| | | OF UBSFSI | | | |
| | | 1000 HARBOR BLVD | | | |
| | | WEEHAWKEN, NJ 07086 | | | |
| | | | | | |
| | | WELLS FARGO CLEARING SVCS LLC | | 13.68% | |
| | | SPECIAL CUSTODY ACCT | | | |
| | | FBO EXCLUSIVE BENEFIT OF CUSTOMER | | | |
| | | 2801 MARKET ST | | | |
| | | SAINT LOUIS MO 63103-2523 | | | |
| | | MLPF & S THE SOLE BENEFIT OF FOR IT'S | | 11.66% | |
| | | CUSTOMERS | | | |
| | | ATTN FUND ADMINISTRATION | | | |
| | | 4800 DEER LAKE DR EAST-2ND FLR | | | |
| | | JACKSONVILLE FL 32246 | | | |
| | | | | | |
| | | RAYMOND JAMES | | 9.41% | |
| | | OMNIBUS FOR MUTUAL FUNDS | | | |
| | | HOUSE ACCT FIRM 92500015 | | | |
| | | ATTN COURTNEY WALLER | | | |
| | | 880 CARILLON PARKWAY | | | |
| | | ST PETERSBURG FL 33716 | | | |
| | | | | | |
| | | MORGAN STANLEY SMITH BARNEY | | 7.60% | |
| | | HARBORSIDE FINANCIAL CENTER | | | |
| | | PLAZA 2 3RD FLOOR | | | |
| | | JERSEY CITY NJ 07311 | | | |
| | | | | | |
| | | PERSHING LLC | | 7.39% | |
| | | 1 PERSHING PLAZA | | | |
| | | JERSEY CITY NJ 07399 | | | |
| | | | | | |
| | | CHARLES SCHWAB & CO INC | | 5.62% | |
| | | SPECIAL CUSTODY ACCT FBO | | | |
| | | CUSTOMERS | | | |
| | | ATTN MUTUAL FUNDS | | | |
| | | 101 MONTGOMERY ST | | | |
| | | SAN FRANCISCO CA 94104-4122 | | | |
| | | | | | |
| HIGH YIELD FUND CLASS Y | | FIFTH THIRD BANK TTEE FBO WESTERN & | | 13.03% | |
| | | SOUTHERN LIFE INS CO | | | |
| | | 401K SAVINGS PLAN | | | |
| | | 8515 E ORCHARD RD 2T2 | | | |
| | | CENTENNIAL CO 80111 | | | |
| | | | | | |
| | | BAND & CO C/O US BANK NA | | 12.45% | |
| | | 1555 N. RIVERCENTER DRIVE STE. 302 | | | |
| | | MILWAUKEE WI 53212 | | | |
| | | | | | |
| | | CHARLES SCHWAB & CO INC | | 10.95% | |
| | | 101 MONTGOMERY ST | | | |
| | | SAN FRANCISCO CA 94104 | | | |
| | | | | | |
| | | UBS WM USA | | 8.78% | |
| | | FBO 000 11011 6100 | | | |
| | | SPEC CDY A/C EXL BEN CUSTOMERS | | | |
| | | OF UBSFSI | | | |
| | | 1000 HARBOR BLVD | | | |
| | | WEEHAWKEN, NJ 07086 | | | |
| | | MORGAN STANLEY SMITH BARNEY | | 7.24% | |
| | | HARBORSIDE FINANCIAL CENTER | | | |
| | | PLAZA 2 3RD FLOOR | | | |
| | | JERSEY CITY NJ 07311 | | | |
| | | | | | |
| HIGH YIELD FUND | | UBATCO & CO | | 30.64% | |
| INSTITUTIONAL | | FBO ACES TRUST FUND | | | |
| CLASS SHARES | | 6811 S 27TH ST | | | |
| | | LINCOLN NE 68512 | | | |
| | | | | | |
| | | UBS WM USA | | 29.90% | |
| | | FBO 000 11011 6100 | | | |
| | | SPEC CDY A/C EXL BEN CUSTOMERS | | | |
| | | OF UBSFSI | | | |
| | | 1000 HARBOR BLVD | | | |
| | | WEEHAWKEN, NJ 07086 | | | |
| | | | | | |
| | | CHARLES SCHWAB & CO INC | | 11.11% | |
| | | 101 MONTGOMERY ST | | | |
| | | SAN FRANCISCO CA 94104 | | | |
| | | | | | |
| | | TOUCHSTONE DYNAMIC DIVERSIFIED | | 8.16% | *** |
| | | INCOME FUND | | | |
| | | 303 BROADWAY ST STE 1100 | | | |
| | | CINCINNATI OH 45202-4220 | | | |
| | | | | | |
| | | WELLS FARGO BANK | | 6.97% | |
| | | FBO VARIOUS RETIREMENT PLANS | | | |
| | | 1525 WEST WT HARRIS BLVD | | | |
| | | CHARLOTTE, NC 28288-1076 | | | |
| | | | | | |
| MERGER ARBITRAGE FUND | | MORGAN STANLEY SMITH BARNEY | | 12.11% | |
| CLASS A | | HARBORSIDE FINANCIAL CENTER | | | |
| | | PLAZA 2 3RD FLOOR | | | |
| | | JERSEY CITY NJ 07311 | | | |
| | | | | | |
| | | ROBERT W BAIRD & CO. INC. | | 11.77% | |
| | | 777 EAST WISCONSIN AVENUE | | | |
| | | MILWAUKEE WI 53202-5391 | | | |
| | | | | | |
| | | CHARLES SCHWAB & CO INC | | 10.34% | |
| | | 101 MONTGOMERY ST | | | |
| | | SAN FRANCISCO CA 94104 | | | |
| | | | | | |
| | | PERSHING LLC | | 9.56% | |
| | | 1 PERSHING PLAZA | | | |
| | | JERSEY CITY NJ 07399 | | | |
| | | | | | |
| | | LPL FINANCIAL | | 5.46% | |
| | | OMNIBUS CUSTOMER ACCOUNT | | | |
| | | 4707 EXECUTIVE DRIVE | | | |
| | | SAN DIEGO CA 92121 | | | |
| | | | | | |
| MERGER ARBITRAGE FUND | | MORGAN STANLEY SMITH BARNEY | | 56.74% | |
| CLASS C | | HARBORSIDE FINANCIAL CENTER | | | |
| | | PLAZA 2 3RD FLOOR | | | |
| | | JERSEY CITY NJ 07311 | | | |
| | | | | | |
| | | CHARLES SCHWAB & CO INC | | 25.62% | |
| | | SPECIAL CUSTODY ACCT FBO | | | |
| | | CUSTOMERS | | | |
| | | ATTN MUTUAL FUNDS | | | |
| | | 101 MONTGOMERY ST | | | |
| | | SAN FRANCISCO CA 94104-4122 | | | |
| | | | | | |
| | | UBS WM USA FBO | | 8.79% | |
| | | SPEC CDY A/C EXL BEN CUSTOMERS | | | |
| | | OF UBSFSI | | | |
| | | 1000 HARBOR BLVD | | | |
| | | WEEHAWKEN, NJ 07086 | | | |
| MERGER ARBITRAGE FUND | | NATIONAL FINANCIAL SERVICES CORP | | 33.86% | |
| CLASS Y | | (FBO) OUR CUSTOMERS | | | |
| | | ATTN MUTUAL FUNDS DEPARTMENT | | | |
| | | 499 WASHINGTON BLVD, 4TH FL | | | |
| | | JERSEY CITY NJ 07310-2010 | | | |
| | | | | | |
| MERGER ARBITRAGE FUND | | MORGAN STANLEY SMITH BARNEY | | 26.05% | |
| CLASS Y | | HARBORSIDE FINANCIAL CENTER | | | |
| | | PLAZA 2 3RD FLOOR | | | |
| | | JERSEY CITY NJ 07311 | | | |
| | | | | | |
| | | CHARLES SCHWAB & CO INC | | 13.18% | |
| | | 101 MONTGOMERY ST | | | |
| | | SAN FRANCISCO CA 94104 | | | |
| | | | | | |
| | | UBS WM USA | | 11.98% | |
| | | FBO SPEC CDY A/C EXL BEN CUSTOMERS | | | |
| | | OF UBSFSI | | | |
| | | 1000 HARBOR BLVD | | | |
| | | WEEHAWKEN, NJ 07086 | | | |
| | | | | | |
| | | RBC CAPITAL MARKETS LLC | | 9.67% | |
| | | MUTUAL FUND OMNIBUS PROCESSING | | | |
| | | OMNIBUS | | | |
| | | ATTN MUTUAL FUND OPS MANAGER | | | |
| | | 60 SOUTH SIXTH STREET-P08 | | | |
| | | MINNEAPOLIS MN 55402-4400 | | | |
| | | | | | |
| MERGER ARBITRAGE FUND | | JHF II ALTERNATIVE ASSET ALLOC FUND | | 38.42% | |
| INSTITUTIONAL | | 601 CONGRESS ST | | | |
| CLASS SHARES | | BOSTON MA 02210-2804 | | | |
| | | | | | |
| | | NATIONAL FINANCIAL SERVICES CORP | | 20.05% | |
| | | (FBO) OUR CUSTOMERS | | | |
| | | ATTN MUTUAL FUNDS DEPARTMENT | | | |
| | | 499 WASHINGTON BLVD, 4TH FL | | | |
| | | JERSEY CITY NJ 07310-2010 | | | |
| | | | | | |
| | | GREENLEAF TRUST CASH REINVEST 3 | | 13.79% | |
| | | 211 SOUTH ROSE STREET | | | |
| | | KALAMAZOO MI 49007 | | | |
| | | | | | |
| | | GREENLEAF TRUST CASH CASH 0 | | 6.83% | |
| | | 211 SOUTH ROSE STREET | | | |
| | | KALAMAZOO MI 49007 | | | |
| | | | | | |
| | | GREENLEAF TRUST REINVEST REINVEST 1 | | 6.48% | |
| | | 211 SOUTH ROSE STREET | | | |
| | | KALAMAZOO MI 49007 | | | |
| | | | | | |
| MID CAP FUND CLASS A | | LPL FINANCIAL | | 17.46% | |
| | | 9785 TOWNE CENTRE DRIVE | | | |
| | | SAN DIEGO CA 92121-1968 | | | |
| | | | | | |
| | | UBS WM USA | | 12.77% | |
| | | FBO SPEC CDY A/C EXL BEN CUSTOMERS | | | |
| | | OF UBSFSI | | | |
| | | 1000 HARBOR BLVD | | | |
| | | WEEHAWKEN, NJ 07086 | | | |
| | | | | | |
| | | MORGAN STANLEY SMITH BARNEY | | 12.35% | |
| | | HARBORSIDE FINANCIAL CENTER | | | |
| | | PLAZA 2 3RD FLOOR | | | |
| | | JERSEY CITY NJ 07311 | | | |
| | | | | | |
| | | CHARLES SCHWAB & CO INC SPECIAL | | 5.97% | |
| | | CUSTODY ACCT FBO CUSTOMERS | | | |
| | | ATTN MUTUAL FUNDS | | | |
| | | 101 MONTGOMERY ST | | | |
| | | SAN FRANCISCO CA 94104-4122 | | | |
| | | | | | |
| MID CAP FUND CLASS C | | MORGAN STANLEY SMITH BARNEY | | 21.10% | |
| | | HARBORSIDE FINANCIAL CENTER | | | |
| | | PLAZA 2 3RD FLOOR | | | |
| | | JERSEY CITY NJ 07311 | | | |
| | | MLPF & S THE SOLE BENEFIT OF ITS | | 17.97% | |
| | | CUSTOMERS | | | |
| | | ATTN FUND ADMINISTRATION | | | |
| | | 4800 DEER LAKE DR EAST-2ND FL | | | |
| | | JACKSONVILLE FL 32246 | | | |
| | | | | | |
| | | UBS WM USA | | 15.95% | |
| | | FBO SPEC CDY A/C EXL BEN CUSTOMERS | | | |
| | | OF UBSFSI | | | |
| | | 1000 HARBOR BLVD | | | |
| | | WEEHAWKEN, NJ 07086 | | | |
| | | | | | |
| | | CHARLES SCHWAB & CO INC | | 11.68% | |
| | | SPECIAL CUSTODY ACCT FBO | | | |
| | | CUSTOMERS ATTN MUTUAL FUNDS | | | |
| | | 101 MONTGOMERY ST | | | |
| | | SAN FRANCISCO CA 94104-4122 | | | |
| | | | | | |
| | | LPL FINANCIAL | | 10.95% | |
| | | OMNIBUS CUSTOMER ACCOUNT | | | |
| | | ATTN LINDSAY OTOOLE | | | |
| | | 4707 EXECUTIVE DRIVE | | | |
| | | SAN DIEGO CA 92121 | | | |
| | | | | | |
| | | WELLS FARGO CLEARING SVCS LLC | | 6.10% | |
| | | SPECIAL CUSTODY ACCT FBO | | | |
| | | EXCLUSIVE BENEFIT OF CUSTOMER | | | |
| | | 2801 MARKET ST | | | |
| | | SAINT LOUIS MO 63103-2523 | | | |
| | | | | | |
| MID CAP FUND CLASS Y | | NATIONAL FINANCIAL SERVICES CORP | | 21.32% | |
| | | (FBO) OUR CUSTOMERS | | | |
| | | ATTN MUTUAL FUNDS DEPARTMENT | | | |
| | | 499 WASHINGTON BLVD, 4TH FL | | | |
| | | JERSEY CITY NJ 07310-2010 | | | |
| | | | | | |
| | | CHARLES SCHWAB CO INC | | 11.53% | |
| | | ATTN MUTUAL FUNDS TEAM S 4500 | | | |
| | | CHERRY CREEK 3 DR S FL | | | |
| | | DENVER CO 80209-0000 | | | |
| | | | | | |
| | | MLPF & S THE SOLE BENEFIT OF FOR IT'S | | 10.82% | |
| | | CUSTOMERS | | | |
| | | ATTN FUND ADMINISTRATION | | | |
| | | 4800 DEER LAKE DR EAST-2ND FLR | | | |
| | | JACKSONVILLE FL 32246 | | | |
| | | | | | |
| | | LPL FINANCIAL OMNIBUS CUSTOMER | | 10.41% | |
| | | ACCOUNT | | | |
| | | ATTN LINDSAY OTOOLE | | | |
| | | 4707 EXECUTIVE DRIVE | | | |
| | | SAN DIEGO CA 92121 | | | |
| | | | | | |
| | | MORGAN STANLEY SMITH BARNEY | | 10.23% | |
| | | HARBORSIDE FINANCIAL CENTER | | | |
| | | PLAZA 2 3RD FLOOR | | | |
| | | JERSEY CITY NJ 07311 | | | |
| | | | | | |
| | | WELLS FARGO BANK | | 6.46% | |
| | | SPECIAL CUSTODY ACCT FBO | | | |
| | | EXCLUSIVE BENEFIT OF CUSTOMER | | | |
| | | 2801 MARKET ST | | | |
| | | SAINT LOUIS MO 63103-2523 | | | |
| | | | | | |
| | | UBS WM USA FBO | | 5.82% | |
| | | SPEC CDY A/C EXL BEN CUSTOMERS | | | |
| | | OF UBSFSI | | | |
| | | 1000 HARBOR BLVD | | | |
| | | WEEHAWKEN, NJ 07086 | | | |
| | | | | | |
| | | WELLS FARGO BANK NA | | 5.30% | |
| | | FBO OMNIBUS ACCOUNT CASH CASH | | | |
| | | PO BOX 1533 | | | |
| | | MINNEAPOLIS MN 55480 | | | |
| MID CAP FUND CLASS Z | | NATIONAL FINANCIAL SERVICES CORP | | 35.01% | |
| | | (FBO) OUR CUSTOMERS | | | |
| | | ATTN MUTUAL FUNDS DEPARTMENT | | | |
| | | 499 WASHINGTON BLVD, 4TH FL | | | |
| | | JERSEY CITY NJ 07310-2010 | | | |
| | | | | | |
| MID CAP FUND CLASS Z | | CHARLES SCHWAB & CO INC | | 34.07% | |
| | | ATTN MUTUAL FUNDS TEAM S | | | |
| | | 4500 CHERRY CREEK 3 DR S FL | | | |
| | | DENVER CO 80209-0000 | | | |
| | | | | | |
| | | PERSHING LLC | | 22.90% | |
| | | 1 PERSHING PLAZA | | | |
| | | JERSEY CITY NJ 07399 | | | |
| | | | | | |
| MID CAP FUND INSTITUTIONAL | | FIFTH THIRD BANK | | 17.59% | |
| CLASS SHARES | | FBO 5/3 BANK PEN & | | | |
| | | P. O. BOX 3385 | | | |
| | | 5001 KINGSLEY DR DEPT 3385 | | | |
| | | CINCINNATI OH 45263 | | | |
| | | | | | |
| | | RELIANCE TRUST COMPANY | | 13.46% | |
| | | FBO RIS-100 C/R | | | |
| | | PO BOX 48529 | | | |
| | | ATLANTA GA 30362 | | | |
| | | | | | |
| | | MITRA & CO | | 11.35% | |
| | | FBO VA C/O BMO HARRIS BANK NA | | | |
| | | ATTN: MF | | | |
| | | 480 PILGRIM WAY STE 1000 | | | |
| | | GREEN BAY, WI 54304 | | | |
| | | | | | |
| | | NATIONAL FINANCIAL SERVICES CORP | | 11.02% | |
| | | (FBO) OUR CUSTOMERS | | | |
| | | ATTN MUTUAL FUNDS DEPARTMENT | | | |
| | | 499 WASHINGTON BLVD, 4TH FL | | | |
| | | JERSEY CITY NJ 07310-2010 | | | |
| | | | | | |
| | | CHARLES SCHWAB & CO INC | | 8.93% | |
| | | 101 MONTGOMERY ST | | | |
| | | SAN FRANCISCO CA 94104 | | | |
| | | | | | |
| | | WELLS FARGO BANK NA | | 6.87% | |
| | | FBO AWG RET - PRAIRIE CAPITAL | | | |
| | | PO BOX 1533 | | | |
| | | MINNEAPOLIS, MN 55480 | | | |
| | | | | | |
| | | TOUCHSTONE DYNAMIC GLOBAL | | 5.73% | *** |
| | | ALLOCATION FUND | | | |
| | | 303 BROADWAY ST STE 1100 | | | |
| | | CINCINNATI OH 45202-4220 | | | |
| | | | | | |
| | | DCGT AS TTEE AND/OR CUST FBO PLIC | | 5.15% | |
| | | VARIOUS RETIREMENT PLANS | | | |
| | | OMNIBUS | | | |
| | | ATTN NPIO TRADE DESK | | | |
| | | 711 HIGH STREET | | | |
| | | DES MOINES, IA 50392 | | | |
| | | | | | |
| MID CAP VALUE FUND CLASS A | | CHARLES SCHWAB & CO INC | | 15.96% | |
| | | 101 MONTGOMERY ST | | | |
| | | SAN FRANCISCO CA 94104-4122 | | | |
| | | | | | |
| | | LPL FINANCIAL | | 10.02% | |
| | | OMNIBUS CUSTOMER ACCOUNT | | | |
| | | ATTN LINDSAY OTOOLE | | | |
| | | 4707 EXECUTIVE DRIVE | | | |
| | | SAN DIEGO CA 92121 | | | |
| | | | | | |
| | | MLPF & S THE SOLE BENEFIT OF FOR ITS | | 9.2% | |
| | | CUSTOMERS | | | |
| | | ATTN FUND ADMINISTRATION | | | |
| | | 4800 DEER LAKE DR EAST-2ND FLR | | | |
| | | JACKSONVILLE FL 32246 | | | |
| | | MORGAN STANLEY SMITH BARNEY | | 8.65% | |
| | | HARBORSIDE FINANCIAL CENTER | | | |
| | | PLAZA 2 3RD FLOOR | | | |
| | | JERSEY CITY NJ 07311 | | | |
| | | | | | |
| | | RAYMOND JAMES | | 5.75% | |
| | | OMNIBUS FOR MUTUAL FUNDS | | | |
| | | HOUSE ACCT FIRM | | | |
| | | 880 CARILLON PARKWAY | | | |
| | | ST PETERSBURG FL 33716 | | | |
| | | | | | |
| | | PERSHING LLC | | 5.03% | |
| | | 1 PERSHING PLAZA | | | |
| | | JERSEY CITY NJ 07399 | | | |
| | | | | | |
| MID CAP VALUE FUND CLASS C | | WELLS FARGO CLEARING SVCS LLC | | 18.29% | |
| | | SPECIAL CUSTODY ACCT FBO | | | |
| | | EXCLUSIVE BENEFIT OF CUSTOMER | | | |
| | | 2801 MARKET ST | | | |
| | | SAINT LOUIS MO 63103-2523 | | | |
| | | | | | |
| | | PERSHING LLC | | 16.88% | |
| | | 1 PERSHING PLAZA | | | |
| | | JERSEY CITY NJ 07399 | | | |
| | | | | | |
| | | MORGAN STANLEY SMITH BARNEY | | 12.22% | |
| | | HARBORSIDE FINANCIAL CENTER | | | |
| | | PLAZA 2 3RD FLOOR | | | |
| | | JERSEY CITY NJ 0711 | | | |
| | | | | | |
| | | UBS WM USA | | 8.59% | |
| | | FBO 000 11011 6100 | | | |
| | | SPEC CDY A/C EXL BEN CUSTOMERS | | | |
| | | OF UBSFSI | | | |
| | | 1000 HARBOR BLVD | | | |
| | | WEEHAWKEN, NJ 07086 | | | |
| | | | | | |
| | | RBC CAPITAL MARKETS LLC | | 6.93% | |
| | | MUTUAL FUND OMNIBUS PROCESSING | | | |
| | | OMNIBUS | | | |
| | | ATTN MUTUAL FUND OPS MANAGER | | | |
| | | 60 SOUTH SIXTH STREET-P08 | | | |
| | | MINNEAPOLIS MN 55402-4400 | | | |
| | | | | | |
| | | LPL FINANCIAL OMNIBUS CUSTOMER | | 6.09% | |
| | | ACCOUNT | | | |
| | | ATTN LINDSAY OTOOLE | | | |
| | | 4707 EXECUTIVE DRIVE | | | |
| | | SAN DIEGO CA 92121 | | | |
| | | | | | |
| MID CAP VALUE FUND CLASS Y | | CHARLES SCHWAB & CO INC | | 29.66% | |
| | | 101 MONTGOMERY ST | | | |
| | | SAN FRANCISCO CA 94104 | | | |
| | | | | | |
| | | WELLS FARGO CLEARING SVCS LLC | | 28.87% | |
| | | SPECIAL CUSTODY ACCT FBO | | | |
| | | EXCLUSIVE BENEFIT OF CUSTOMER | | | |
| | | 2801 MARKET ST | | | |
| | | SAINT LOUIS MO 63103-2523 | | | |
| | | | | | |
| | | NATIONAL FINANCIAL SERVICES LLC | | 8.79% | |
| | | FEBO ITS CUSTOMERS | | | |
| | | ATTN MUTUAL FUNDS DEPARTMENT | | | |
| | | 499 WASHINGTON BLVD, 4TH FL | | | |
| | | JERSEY CITY NJ 07310-2010 | | | |
| | | | | | |
| | | MORGAN STANLEY SMITH BARNEY | | 7.51% | |
| | | HARBORSIDE FINANCIAL CENTER | | | |
| | | PLAZA 2 3RD FLOOR | | | |
| | | JERSEY CITY NJ 07311 | | | |
| | | | | | |
| MID CAP VALUE FUND | | NATIONAL FINANCIAL SERVICES CORP | | 40.05% | |
| INSTITUTIONAL | | (FBO) OUR CUSTOMERS | | | |
| CLASS SHARES | | ATTN MUTUAL FUNDS DEPARTMENT | | | |
| | | 499 WASHINGTON BLVD, 4TH FL | | | |
| | | JERSEY CITY NJ 07310-2010 | | | |
| | | WELLS FARGO BANK NA FBO OMNIBUS | | 32.05% | |
| | | ACCOUNT CASH/CASH | | | |
| | | PO BOX 1533 | | | |
| | | MINNEAPOLIS MN 55480 | | | |
| | | | | | |
| | | WELLS FARGO BANK | | 9.88% | |
| | | FBO VARIOUS RETIREMENT PLANS | | | |
| | | 1525 WEST WT HARRIS BLVD | | | |
| | | CHARLOTTE, NC 28288-1076 | | | |
| | | | | | |
| | | MERCER TRUST CO | | 8.44% | |
| | | TTEE FBO HD SUPPLY | | | |
| | | 401K RETIREMENT PLAN ATTN: DC PLAN | | | |
| | | ONE INVESTORS WAY | | | |
| | | NORWOOD MA 02062 | | | |
| | | | | | |
| PREMIUM YIELD EQUITY FUND | | NFS LLC FEBO | | 15.16% | |
| CLASS A | | ASSETMARK TRUST COMPANY | | | |
| | | FBO ASSETMARK & MUTUAL CLIENTS | | | |
| | | FBO OTHER CUSTODIAL CLIENTS | | | |
| | | 3200 N CENTRAL AVE FL 7 | | | |
| | | PHOENIX AZ 85012-2425 | | | |
| | | | | | |
| PREMIUM YIELD EQUITY FUND | | WELLS FARGO CLEARING SVCS LLC | | 10.97% | |
| CLASS A | | SPECIAL CUSTODY ACCT FBO | | | |
| | | EXCLUSIVE BENEFIT OF CUSTOMER | | | |
| | | 2801 MARKET ST | | | |
| | | SAINT LOUIS MO 63103-2523 | | | |
| | | | | | |
| | | CHARLES SCHWAB & CO INC | | 10.36% | |
| | | 101 MONTGOMERY ST | | | |
| | | SAN FRANCISCO CA 94104 | | | |
| | | | | | |
| | | MORGAN STANLEY SMITH BARNEY | | 8.59% | |
| | | HARBORSIDE FINANCIAL CENTER | | | |
| | | PLAZA 2 3RD FLOOR | | | |
| | | JERSEY CITY NJ 07311 | | | |
| | | | | | |
| | | PERSHING LLC | | 5.78% | |
| | | 1 PERSHING PLAZA | | | |
| | | JERSEY CITY NJ 07399 | | | |
| | | | | | |
| PREMIUM YIELD EQUITY FUND | | UBS WM USA | | 25.9% | |
| CLASS C | | FBO SPEC CDY A/C EXL BEN CUSTOMERS | | | |
| | | OF UBSFSI | | | |
| | | 1000 HARBOR BLVD | | | |
| | | WEEHAWKEN, NJ 07086 | | | |
| | | | | | |
| | | CHARLES SCHWAB & CO INC | | 21.17% | |
| | | 101 MONTGOMERY ST | | | |
| | | SAN FRANCISCO CA 94104 | | | |
| | | | | | |
| | | MORGAN STANLEY SMITH BARNEY | | 20.82% | |
| | | HARBORSIDE FINANCIAL CENTER | | | |
| | | PLAZA 2 3RD FLOOR | | | |
| | | JERSEY CITY NJ 07311 | | | |
| | | | | | |
| | | WELLS FARGO CLEARING SVCS LLC | | 9.14% | |
| | | SPECIAL CUSTODY ACCT FBO | | | |
| | | EXCLUSIVE BENEFIT OF CUSTOMER | | | |
| | | 2801 MARKET ST | | | |
| | | SAINT LOUIS MO 63103-2523 | | | |
| | | | | | |
| | | MLPF & S THE SOLE BENEFIT OF ITS | | 8.94% | |
| | | CUSTOMERS | | | |
| | | ATTN FUND ADMINISTRATION | | | |
| | | 4800 DEER LAKE DR EAST-2ND FLR | | | |
| | | JACKSONVILLE FL 32246 | | | |
| | | | | | |
| PREMIUM YIELD EQUITY FUND | | PERSHING LLC | | 24.24% | |
| CLASS Y | | 1 PERSHING PLAZA | | | |
| | | JERSEY CITY NJ 07399 | | | |
| | | TD AMERITRADE INC FOR THE | | 24.12% | |
| | | EXCLUSIVE BENEFIT OF OUR CLIENTS | | | |
| | | PO BOX 2226 | | | |
| | | OMAHA NE 68103-2226 | | | |
| | | | | | |
| | | UBS WM USA | | 8.17% | |
| | | FBO SPEC CDY A/C EXL BEN CUSTOMERS | | | |
| | | OF UBSFSI | | | |
| | | 1000 HARBOR BLVD | | | |
| | | WEEHAWKEN, NJ 07086 | | | |
| | | | | | |
| | | CHARLES SCHWAB & CO INC | | 7.20% | |
| | | 101 MONTGOMERY ST | | | |
| | | SAN FRANCISCO CA 94104 | | | |
| | | | | | |
| | | MORGAN STANLEY SMITH BARNEY | | 7.00% | |
| | | HARBORSIDE FINANCIAL CENTER | | | |
| | | PLAZA 2 3RD FLOOR | | | |
| | | JERSEY CITY NJ 07311 | | | |
| | | | | | |
| | | WELLS FARGO CLEARING SVCS LLC | | 6.01% | |
| | | SPECIAL CUSTODY ACCT | | | |
| | | FBO EXCLUSIVE BENEFIT OF CUSTOMER | | | |
| | | 2801 MARKET ST | | | |
| | | SAINT LOUIS MO 63103-2523 | | | |
| | | | | | |
| | | TOUCHSTONE DYNAMIC DIVERSIFIED | | 6.00% | |
| | | INCOME FUND | | | |
| | | 303 BROADWAY ST STE 1100 | | | |
| | | CINCINNATI OH 45202-4220 | | | |
| | | | | | |
| | | NATIONAL FINANCIAL SERVICES CORP | | 5.23% | |
| | | (FBO) OUR CUSTOMERS | | | |
| | | ATTN MUTUAL FUNDS DEPARTMENT | | | |
| | | 499 WASHINGTON BLVD, 4TH FL | | | |
| | | JERSEY CITY NJ 07310-2010 | | | |
| | | | | | |
| SANDS CAPITAL SELECT | | MLPF & S THE SOLE BENEFIT OF ITS | | 21.23% | |
| GROWTH FUND CLASS A | | CUSTOMERS ATTN FUND | | | |
| | | ADMINISTRATION | | | |
| | | 4800 DEER LAKE DR EAST-2ND FLR | | | |
| | | JACKSONVILLE FL 32246 | | | |
| | | | | | |
| | | MORGAN STANLEY SMITH BARNEY | | 11.84% | |
| | | HARBORSIDE FINANCIAL CENTER | | | |
| | | PLAZA 2 3RD FLOOR | | | |
| | | JERSEY CITY NJ 07311 | | | |
| | | | | | |
| | | RAYMOND JAMES | | 5.47% | |
| | | OMNIBUS FOR MUTUAL FUNDS | | | |
| | | HOUSE ACCT | | | |
| | | 880 CARILLON PARKWAY | | | |
| | | ST PETERSBURG FL 33716 | | | |
| | | | | | |
| SANDS CAPITAL SELECT | | MORGAN STANLEY SMITH BARNEY | | 24.01% | |
| GROWTH FUND CLASS C | | HARBORSIDE FINANCIAL CENTER | | | |
| | | PLAZA 2 3RD FLOOR | | | |
| | | JERSEY CITY NJ 07311 | | | |
| | | | | | |
| SANDS CAPITAL SELECT | | MLPF & S THE SOLE BENEFIT OF ITS | | 22.37% | |
| GROWTH FUND CLASS C | | CUSTOMERS | | | |
| | | ATTN FUND ADMINISTRATION | | | |
| | | 4800 DEER LAKE DR EAST-2ND FLR | | | |
| | | JACKSONVILLE FL 32246 | | | |
| | | | | | |
| | | WELLS FARGO CLEARING SVCS LLC | | 13.07% | |
| | | SPECIAL CUSTODY ACCT | | | |
| | | FBO EXCLUSIVE BENEFIT OF CUSTOMER | | | |
| | | 2801 MARKET ST | | | |
| | | SAINT LOUIS MO 63103-2523 | | | |
| | | | | | |
| | | UBS WM USA | | 7.05% | |
| | | FBO SPEC CDY A/C EXL BEN CUSTOMERS | | | |
| | | OF UBSFSI | | | |
| | | 1000 HARBOR BLVD | | | |
| | | WEEHAWKEN, NJ 07086 | | | |
| SANDS CAPITAL SELECT | | MORGAN STANLEY SMITH BARNEY | | 25.71% | |
| GROWTH FUND CLASS Y | | HARBORSIDE FINANCIAL CENTER | | | |
| | | PLAZA 2 3RD FLOOR | | | |
| | | JERSEY CITY NJ 07311 | | | |
| | | | | | |
| | | CHARLES SCHWAB CO INC | | 17.98% | |
| | | ATTN MUTUAL FUNDS TEAM S | | | |
| | | 4500 CHERRY CREEK 3 DR S FL | | | |
| | | DENVER CO 80209-0000 | | | |
| | | | | | |
| | | PERSHING LLC | | 15.07% | |
| | | 1 PERSHING PLAZA | | | |
| | | JERSEY CITY NJ 07399 | | | |
| | | | | | |
| | | SAXON & CO | | 11.11% | |
| | | P. O. BOX 7780-1888 | | | |
| | | PHILADELPHIA PA 19182 | | | |
| | | | | | |
| | | MLPF & S THE SOLE BENEFIT OF | | 9.23% | |
| | | FOR ITS CUSTOMERS | | | |
| | | ATTN FUND ADMINISTRATION | | | |
| | | 4800 DEER LAKE DR EAST-2ND FLR | | | |
| | | JACKSONVILLE FL 32246 | | | |
| | | | | | |
| | | NATIONAL FINANCIAL SERVICES CORP | | 6.63% | |
| | | (FBO) OUR CUSTOMERS ATTN MUTUAL | | | |
| | | FUNDS DEPARTMENT 4TH FL | | | |
| | | 499 WASHINGTON BLVD | | | |
| | | JERSEY CITY NJ 07310-2010 | | | |
| | | | | | |
| SANDS CAPITAL SELECT | | NATIONAL FINANCIAL SERVICES CORP | | 56.59% | |
| GROWTH FUND CLASS Z | | (FBO) OUR CUSTOMERS | | | |
| | | ATTN MUTUAL FUNDS DEPARTMENT | | | |
| | | 499 WASHINGTON BLVD, 4TH FL | | | |
| | | JERSEY CITY NJ 07310-2010 | | | |
| | | | | | |
| | | CHARLES SCHWAB & CO INC | | 20.84% | |
| | | SPECIAL CUSTODY ACCOUNT FOR THE | | | |
| | | BENEFIT OF CUSTOMERS | | | |
| | | ATTN MUTUAL FUNDS | | | |
| | | 101 MONTGOMERY ST | | | |
| | | SAN FRANCISCO CA 94104-4151 | | | |
| | | | | | |
| | | PERSHING LLC | | 9.87% | |
| | | 1 PERSHING PLAZA | | | |
| | | JERSEY CITY NJ 07399 | | | |
| | | | | | |
| SMALL CAP FUND CLASS A | | WELLS FARGO BANK | | 42.91% | |
| | | FBO VARIOUS RETIREMENT PLANS | | | |
| | | 1525 WEST WT HARRIS BLVD | | | |
| | | CHARLOTTE, NC 28288-1076 | | | |
| | | | | | |
| | | CHARLES SCHWAB & CO INC | | 11.22% | |
| | | 101 MONTGOMERY ST | | | |
| | | SAN FRANCISCO CA 94104 | | | |
| | | | | | |
| | | RAYMOND JAMES | | 6.27% | |
| | | OMNIBUS FOR MUTUAL FUNDS | | | |
| | | HOUSE ACCT FIRM | | | |
| | | 880 CARILLON PARKWAY | | | |
| | | ST PETERSBURG FL 33716 | | | |
| | | | | | |
| | | CHARLES SCHWAB & CO INC | | 5.47% | |
| | | SPECIAL CUSTODY ACCT FBO | | | |
| | | CUSTOMERS | | | |
| | | ATTN MUTUAL FUNDS | | | |
| | | 101 MONTGOMERY ST | | | |
| | | SAN FRANCISCO CA 94104-4122 | | | |
| | | | | | |
| SMALL CAP FUND CLASS C | | UBS WM USA | | 45.84% | |
| | | FBO SPEC CDY A/C EXL BEN CUSTOMERS | | | |
| | | OF UBSFSI | | | |
| | | 1000 HARBOR BLVD | | | |
| | | WEEHAWKEN, NJ 07086 | | | |
| | | CHARLES SCHWAB & CO INC | | 10.70% | |
| | | SPECIAL CUSTODY ACCT FBO | | | |
| | | CUSTOMERS ATTN MUTUAL FUNDS | | | |
| | | 101 MONTGOMERY ST | | | |
| | | SAN FRANCISCO CA 94104-4122 | | | |
| | | | | | |
| | | MLPF & S THE SOLE BENEFIT OF ITS | | 9.04% | |
| | | CUSTOMERS ATTN FUND | | | |
| | | ADMINISTRATION | | | |
| | | 4800 DEER LAKE DR EAST-2ND FLR | | | |
| | | JACKSONVILLE FL 32246 | | | |
| | | | | | |
| | | WELLS FARGO CLEARING SVCS LLC | | 8.81% | |
| | | SPECIAL CUSTODY ACCT | | | |
| | | FBO EXCLUSIVE BENEFIT OF CUSTOMER | | | |
| | | 2801 MARKET ST | | | |
| | | SAINT LOUIS MO 63103-2523 | | | |
| | | | | | |
| | | RAYMOND JAMES | | 5.72% | |
| | | OMNIBUS FOR MUTUAL FUNDS | | | |
| | | 880 CARILLON PARKWAY | | | |
| | | ST PETERSBURG FL 33716 | | | |
| | | | | | |
| SMALL CAP FUND CLASS Y | | CHARLES SCHWAB & CO INC | | 67.71% | |
| | | 101 MONTGOMERY ST | | | |
| | | SAN FRANCISCO CA 94104 | | | |
| | | | | | |
| | | UBS WM USA | | 6.93% | |
| | | FBO SPEC CDY A/C EXL BEN CUSTOMERS | | | |
| | | OF UBSFSI | | | |
| | | 1000 HARBOR BLVD | | | |
| | | WEEHAWKEN, NJ 07086 | | | |
| | | | | | |
| | | TD AMERITRADE INC | | 5.92% | |
| | | FOR THE EXCLUSIVE BENEFIT OF OUR | | | |
| | | CLIENTS | | | |
| | | PO BOX 2226 | | | |
| | | OMAHA NE 68103-2226 | | | |
| | | | | | |
| SMALL CAP FUND | | WELLS FARGO BANK NA | | 44.45% | |
| INSTITUTIONAL | | FBO OMNIBUS ACCOUNT CASH | | | |
| CLASS SHARES | | PO BOX 1533 | | | |
| | | MINNEAPOLIS MN 55480 | | | |
| | | | | | |
| | | THE BRYN MAWR TRUST COMPANY | | 18.03% | |
| | | FBO DRAPER & CO | | | |
| | | 801 LANCASTER AVENUE | | | |
| | | BRYN MAWR, PA 19010 | | | |
| | | | | | |
| | | CHARLES SCHWAB & CO INC | | 16.07% | |
| | | 101 MONTGOMERY ST | | | |
| | | SAN FRANCISCO CA 94104 | | | |
| | | | | | |
| | | NATIONAL FINANCIAL SERVICES LLC | | 6.01% | |
| | | FEBO ITS CUSTOMERS | | | |
| | | ATTN MUTUAL FUNDS DEPARTMENT | | | |
| | | 499 WASHINGTON BLVD, 4TH FL | | | |
| | | JERSEY CITY NJ 07310-2010 | | | |
| | | | | | |
| | | JOHN HANCOCK TRUST COMPANY LLC | | 5.40% | |
| | | 690 CANTON STREET, SUITE 100 | | | |
| | | WESTWOOD, MA 02090 | | | |
| | | | | | |
| SMALL CAP VALUE FUND | | NO 5% OR GREATER BENEFICIAL OWNERS | | | |
| CLASS A | | TO REPORT | | | |
| | | | | | |
| SMALL CAP VALUE FUND | | MLPF & S THE SOLE BENEFIT OF FOR ITS | | 28.13% | |
| CLASS C | | CUSTOMERS ATTN FUND | | | |
| | | ADMINISTRATION | | | |
| | | 4800 DEER LAKE DR EAST-2ND FLR | | | |
| | | JACKSONVILLE FL 32246 | | | |
| | | MORGAN STANLEY SMITH HARBORSIDE | | 18.72% | |
| | | FINANCIAL CENTER | | | |
| | | PLAZA 2 3RD FLOOR | | | |
| | | JERSEY CITY NJ 07311 | | | |
| | | | | | |
| | | PERSHING LLC | | 12.46% | |
| | | 1 PERSHING PLAZA | | | |
| | | JERSEY CITY NJ 07399 | | | |
| | | | | | |
| | | CHARLES SCHWAB & CO INC | | 10.19% | |
| | | SPECIAL CUSTODY ACCT | | | |
| | | FBO CUSTOMERS | | | |
| | | ATTN MUTUAL FUNDS | | | |
| | | 101 MONTGOMERY ST | | | |
| | | SAN FRANCISCO CA 94104-4122 | | | |
| | | | | | |
| | | WELLS FARGO CLEARING SVCS LLC | | 9.80% | |
| | | SPECIAL CUSTODY ACCT | | | |
| | | FBO EXCLUSIVE BENEFIT OF CUSTOMER | | | |
| | | 2801 MARKET ST | | | |
| | | SAINT LOUIS MO 63103-2523 | | | |
| | | | | | |
| SMALL CAP VALUE FUND | | UBS WM USA | | 21.40% | |
| CLASS Y | | FBO SPEC CDY A/C EXL BEN CUSTOMERS | | | |
| | | OF UBSFSI | | | |
| | | 1000 HARBOR BLVD | | | |
| | | WEEHAWKEN, NJ 07086 | | | |
| | | | | | |
| | | WELLS FARGO CLEARING SVCS LLC | | 10.24% | |
| | | SPECIAL CUSTODY ACCT FBO | | | |
| | | EXCLUSIVE BENEFIT OF CUSTOMER | | | |
| | | 2801 MARKET ST | | | |
| | | SAINT LOUIS MO 63103-2523 | | | |
| | | | | | |
| | | FIFTH THIRD BANK | | 8.98% | |
| | | TTEE FBO: RAND & MAUREEN MUELLER | | | |
| | | JT - RS | | | |
| | | 5001 KINGSLEY DR DEPT 3385 | | | |
| | | CINCINNATI OH 45263 | | | |
| | | | | | |
| | | FIFTH THIRD BANK | | 5.44% | |
| | | TTEE VARIOUS FASCORE LLC | | | |
| | | RECORDKEPT PLAN | | | |
| | | C/O FASCORE LLC | | | |
| | | 8515 E ORCHARD RD 2T2 | | | |
| | | GREENWOOD VILLAGE CO 80111 | | | |
| | | | | | |
| | | MORGAN STANLEY SMITH BARNEY | | 5.29% | |
| | | HARBORSIDE FINANCIAL CENTER | | | |
| | | PLAZA 2 3RD FLOOR | | | |
| | | JERSEY CITY NJ 07311 | | | |
| | | | | | |
| | | FIFTH THIRD BANK | | 5.18% | |
| | | TTEE FBO:GEORGE F. LEBOUTILIER | | | |
| | | 5001 KINGSLEY DR DEPT 3385 | | | |
| | | CINCINNATI OH 45263 | | | |
| | | | | | |
| SMALL CAP VALUE FUND | | CHARLES SCHWAB & CO INC | | 95.12% | |
| INSTITUTIONAL | | 101 MONTGOMERY ST | | | |
| CLASS SHARES | | SAN FRANCISCO CA 94104 | | | |
| | | | | | |
| TOTAL RETURN BOND FUND | | MLPF & S THE SOLE BENEFIT OF FOR ITS | | 39.7% | |
| CLASS A | | CUSTOMERS ATTN FUND | | | |
| | | ADMINISTRATION | | | |
| | | 4800 DEER LAKE DR EAST-2ND FLR | | | |
| | | JACKSONVILLE FL 32246 | | | |
| | | | | | |
| | | VOYA RETIREMENT INSURANCE AND | | 33.95% | |
| | | ANNUITY COMPANY | | | |
| | | ONE ORANGE WAY | | | |
| | | WINDSOR CT 060954774 | | | |
| | | CHARLES SCHWAB & CO | | 5.43% | |
| | | 101 MONTGOMERY ST | | | |
| | | SAN FRANCISCO CA 94104 | | | |
| | | | | | |
| TOTAL RETURN BOND FUND | | RAYMOND JAMES | | 30.15% | |
| CLASS C | | OMNIBUS FOR MUTUAL FUNDS | | | |
| | | HOUSE ACCT FIRM | | | |
| | | 880 CARILLON PARKWAY | | | |
| | | ST PETERSBURG FL 33716 | | | |
| | | | | | |
| | | MLPF & S THE SOLE BENEFIT OF | | 24.88% | |
| | | ITS CUSTOMERS | | | |
| | | ATTN FUND ADMINISTRATION | | | |
| | | 4800 DEER LAKE DR EAST-2ND FLR | | | |
| | | JACKSONVILLE FL 32246 | | | |
| | | | | | |
| | | PERSHING LLC | | 16.96% | |
| | | 1 PERSHING PLAZA | | | |
| | | JERSEY CITY NJ 07399 | | | |
| | | | | | |
| | | UBS WM USA | | 5.13% | |
| | | FBO SPEC CDY A/C EXL BEN CUSTOMERS | | | |
| | | OF UBSFSI | | | |
| | | 1000 HARBOR BLVD | | | |
| | | WEEHAWKEN, NJ 07086 | | | |
| | | | | | |
| TOTAL RETURN BOND FUND | | DC PLUS MODEL PORTFOLIOS 457 | | 29.27% | |
| CLASS Y | | C/O ICMA RETIREMENT CORPORATION | | | |
| | | 777 NORTH CAPITOL STREET, NE | | | |
| | | WASHINGTON DC 20002 | | | |
| | | | | | |
| | | MLPF & S THE SOLE BENEFIT OF FOR ITS | | 17.61% | |
| | | CUSTOMERS ATTN FUND | | | |
| | | ADMINISTRATION 4800 DEER LAKE DR | | | |
| | | EAST-2ND FLR | | | |
| | | JACKSONVILLE FL 32246 | | | |
| | | | | | |
| | | DC PLUS MODEL PORTFOLIOS 401 | | 10.80% | |
| | | C/O ICMA RETIREMENT CORPORATION | | | |
| | | 777 NORTH CAPITOL STREET, NE | | | |
| | | WASHINGTON DC 20002 | | | |
| | | | | | |
| | | RBC CAPITAL MARKETS LLC | | 8.04% | |
| | | MUTUAL FUND OMNIBUS PROCESSING | | | |
| | | OMNIBUS | | | |
| | | ATTN MUTUAL FUND OPS MANAGER | | | |
| | | 60 SOUTH SIXTH STREET-P08 | | | |
| | | MINNEAPOLIS MN 55402-4400 | | | |
| | | | | | |
| | | CHARLES SCHWAB & CO INC | | 5.95% | |
| | | 101 MONTGOMERY ST | | | |
| | | SAN FRANCISCO CA 94104 | | | |
| | | | | | |
| | | UNITED NEIGHBORHOOD HOUSES OF | | 5.44% | |
| | | NEW YORK | | | |
| | | 70 WEST 36TH STREET | | | |
| | | NEW YORK NY 10018 | | | |
| | | | | | |
| TOTAL RETURN BOND FUND | | NATIONAL FINANCIAL SERVICES LLC | | 36.76% | |
| INSTITUTIONAL | | FEBO ITS CUSTOMERS | | | |
| CLASS SHARES | | ATTN MUTUAL FUNDS DEPARTMENT | | | |
| | | 499 WASHINGTON BLVD, 4TH FL | | | |
| | | JERSEY CITY NJ 07310-2010 | | | |
| | | | | | |
| | | CHARLES SCHWAB & CO INC | | 28.94% | |
| | | 101 MONTGOMERY ST | | | |
| | | SAN FRANCISCO CA 94104 | | | |
| | | | | | |
| | | TOUCHSTONE DYNAMIC GLOBAL | | 15.99% | *** |
| | | ALLOCATION FUND | | | |
| | | 303 BROADWAY ST STE 1100 | | | |
| | | CINCINNATI OH 45202-4220 | | | |
| | | TOUCHSTONE DYNAMIC DIVERSIFIED | | 6.03% | *** |
| | | INCOME FUND | | | |
| | | 303 BROADWAY ST STE 1100 | | | |
| | | CINCINNATI OH 45202-4220 | | | |
| | | | | | |
| | | MARIL & CO | | 5.64% | |
| | | FBO JI C/O BMO HARRIS BANK NA | | | |
| | | ATTN MF | | | |
| | | 480 PILGRIM WAY, SUITE 1000 | | | |
| | | GREEN BAY, WI 54304 | | | |
| | | | | | |
| ULTRA SHORT DURATION | | LPL FINANCIAL | | 18.79% | |
| FIXED INCOME FUND CLASS A | | OMNIBUS CUSTOMER ACCOUNT | | | |
| | | ATTN LINDSAY OTOOLE | | | |
| | | 4707 EXECUTIVE DRIVE | | | |
| | | SAN DIEGO CA 92121 | | | |
| | | | | | |
| | | WELLS FARGO CLEARING SVCS LLC | | 14.84% | |
| | | SPECIAL CUSTODY ACCT | | | |
| | | FBO EXCLUSIVE BENEFIT OF CUSTOMER | | | |
| | | 2801 MARKET ST | | | |
| | | SAINT LOUIS MO 63103-2523 | | | |
| | | | | | |
| | | MORGAN STANLEY SMITH BARNEY | | 7.66% | |
| | | HARBORSIDE FINANCIAL CENTER | | | |
| | | PLAZA 2 3RD FLOOR | | | |
| | | JERSEY CITY NJ 07311 | | | |
| | | | | | |
| | | RAYMOND JAMES | | 5.61% | |
| | | OMNIBUS FOR MUTUAL FUNDS | | | |
| | | HOUSE ACCT FIRM | | | |
| | | ATTN COURTNEY WALLER | | | |
| | | 880 CARILLON PARKWAY | | | |
| | | ST PETERSBURG FL 33716 | | | |
| | | | | | |
| ULTRA SHORT DURATION | | MLPF & S THE SOLE BENEFIT OF ITS | | 28.1% | |
| FIXED INCOME FUND CLASS C | | CUSTOMERS | | | |
| | | ATTN FUND ADMINISTRATION | | | |
| | | 4800 DEER LAKE DR EAST-2ND FLR | | | |
| | | JACKSONVILLE FL 32246 | | | |
| | | | | | |
| | | MORGAN STANLEY SMITH BARNEY | | 15.98% | |
| | | HARBORSIDE FINANCIAL CENTER | | | |
| | | PLAZA 2 3RD FLOOR | | | |
| | | JERSEY CITY NJ 07311 | | | |
| | | | | | |
| | | WELLS FARGO CLEARING SVCS LLC | | 13.93% | |
| | | SPECIAL CUSTODY ACCT FBO | | | |
| | | EXCLUSIVE BENEFIT OF CUSTOMER | | | |
| | | 2801 MARKET ST | | | |
| | | SAINT LOUIS MO 63103-2523 | | | |
| | | | | | |
| | | PERSHING LLC | | 12.45% | |
| | | 1 PERSHING PLAZA | | | |
| | | JERSEY CITY NJ 07399 | | | |
| | | | | | |
| | | LPL FINANCIAL | | 5.39% | |
| | | OMNIBUS CUSTOMER ACCOUNT | | | |
| | | ATTN LINDSAY OTOOLE | | | |
| | | 4707 EXECUTIVE DRIVE | | | |
| | | SAN DIEGO CA 92121 | | | |
| | | | | | |
| ULTRA SHORT DURATION | | NATIONAL FINANCIAL SERVICES LLC | | 27.43% | |
| FIXED INCOME FUND CLASS Y | | FEBO ITS CUSTOMERS | | | |
| | | (FBO) OUR CUSTOMERS ATTN MUTUAL | | | |
| | | FUNDS DEPARTMENT 4TH FL | | | |
| | | 499 WASHINGTON BLVD | | | |
| | | JERSEY CITY NJ 07310-2010 | | | |
| | | | | | |
| | | MLPF & S THE SOLE BENEFIT OF ITS | | 24.46% | |
| | | CUSTOMERS | | | |
| | | ATTN FUND ADMINISTRATION | | | |
| | | 4800 DEER LAKE DR EAST-2ND FLR | | | |
| | | JACKSONVILLE FL 32246 | | | |
| | | CHARLES SCHWAB & CO INC | | 5.56% | |
| | | REINVEST ACCOUNT ATTN MUTUAL FUND | | | |
| | | DEPARTMENT | | | |
| | | 101 MONTGOMERY ST | | | |
| | | SAN FRANCISCO CA 94104-4151 | | | |
| | | | | | |
| ULTRA SHORT DURATION | | CHARLES SCHWAB & CO INC | | 62.39% | |
| FIXED INCOME FUND CLASS Z | | REINVEST ACCOUNT | | | |
| | | ATTN MUTUAL FUND DEPARTMENT | | | |
| | | 101 MONTGOMERY ST | | | |
| | | SAN FRANCISCO CA 94104-4151 | | | |
| | | | | | |
| | | NATIONAL FINANCIAL SERVICES LLC | | 21.74% | |
| | | FEBO ITS CUSTOMERS | | | |
| | | (FBO) OUR CUSTOMERS | | | |
| | | ATTN MUTUAL FUNDS DEPARTMENT | | | |
| | | 499 WASHINGTON BLVD, 4TH FL | | | |
| | | JERSEY CITY NJ 07310-2010 | | | |
| | | | | | |
| ULTRA SHORT DURATION | | UBS WM USA | | 53.43% | |
| FIXED INCOME FUND | | FBO SPEC CDY A/C EXL BEN CUSTOMERS | | | |
| INSTITUTIONAL | | OF UBSFSI | | | |
| CLASS SHARES | | 1000 HARBOR BLVD | | | |
| | | WEEHAWKEN, NJ 07086 | | | |
| | | | | | |
| | | CHARLES SCHWAB CO INC | | 10.14% | |
| | | 101 MONTGOMERY ST | | | |
| | | SAN FRANCISCO CA 94104-4151 | | | |
| | | | | | |
| | | RELIANCE TRUST CO | | 9.56% | |
| | | FBO CPB R/R | | | |
| | | PO BOX 48529 | | | |
| | | ATLANTA GA 30328 | | | |
| | | | | | |
| | | BAND & CO | | 8.91% | |
| | | C/O US BANK NA | | | |
| | | 1555 N. RIVERCENTER DRIVE STE. 302 | | | |
| | | MILWAUKEE WI 53212 | | | |
*Indicates that shares are held beneficially.
**May be deemed to control a Fund because it owned beneficially more than 25% of the outstanding shares of a Fund as of January 3, 2017. As a result, those persons or organizations could have the ability to influence the outcome of a vote of the Fund’s shareholders.
***The Touchstone Controlled Growth with Income Fund, the Touchstone Dynamic Diversified Income Fund and the Touchstone Dynamic Global Allocation Fund (the “Asset Allocation Funds”) are each structured as a fund-of-funds. Pursuant to the proxy voting policies of Touchstone Advisors, the Asset Allocation Funds vote their shares in the same proportion as the votes of all other shareholders in that underlying Touchstone Fund.
As of December 31, 2016, the Trustees and officers of the Trust as a group owned of record or beneficially less than 1% of the outstanding shares of the Trust and of each Fund.
CUSTODIAN
Brown Brothers Harriman & Co. (“BBH”), 50 Post Office Square, Boston, Massachusetts 02110, is the Trust’s custodian. BBH acts as the Trust’s depository, safe keeps its portfolio securities, collects all income and other payments with respect thereto, disburses money as instructed and maintains records in connection with its duties.
LEGAL COUNSEL
Vedder Price P.C., 222 North LaSalle Street, Chicago, Illinois 60601, serves as counsel to the Trust.
INDEPENDENT REGISTERED PUBLIC ACCOUNTING FIRM
The firm of Ernst & Young LLP, 312 Walnut Street, Cincinnati, Ohio 45202, has been selected as the independent registered public accounting firm for the Trust for the fiscal year ending September 30, 2017. Ernst & Young LLP will perform an annual audit of the Trust’s financial statements and advise the Trust as to certain accounting matters. Ernst & Young LLP also served as the independent registered public accounting firm for the Predecessor Funds.
TRANSFER AND SUB-ADMINISTRATIVE AGENT
Transfer Agent. The Trust’s transfer agent is BNY Mellon Investment Servicing (US) Inc. (“BNY Mellon”), 4400 Computer Drive, Westborough, Massachusetts 01581. BNY Mellon maintains the records of each shareholder’s account, answers shareholders’ inquiries concerning their accounts, processes purchases and redemptions of the Funds’ shares, acts as dividend and distribution disbursing agent and performs other shareholder servicing functions. For providing transfer agent and shareholder services to the Trust, BNY Mellon receives a monthly per account fee from each Fund, plus out-of-pocket expenses.
The Funds may also pay a fee to certain servicing organizations (such as broker-dealers and financial institutions) that provide sub-transfer agency services. These services include maintaining shareholder records, processing shareholder transactions and distributing communications to shareholders.
Sub-Administrative Agent. The Advisor provides administrative services to the Trust under an Administration Agreement and has sub-contracted certain accounting and administrative services to BNY Mellon. The sub-administrative services sub-contracted to BNY Mellon include accounting and pricing services, SEC and state security filings, providing executive and administrative services and providing reports for meetings of the Board. The Advisor pays BNY Mellon a sub-administration fee out of its administration fee. Set forth below are the sub-administration fees paid by the Advisor during the stated periods.
| | | | Sub-Administrative Fees Paid | |
| Fund | | 2014 | | | 2015 | | | 2016 | |
| Active Bond Fund* | | $ | 35,134 | | | $ | 36,550 | | | $ | 36,921 | |
| Arbitrage Fund | | $ | 51,569 | | | $ | 46,810 | | | $ | 41,345 | |
| Emerging Markets Small Cap Fund** | | $ | 98,929 | | | $ | 82,995 | | | $ | 23,759 | |
| High Yield Fund* | | $ | 89,216 | | | $ | 70,822 | | | $ | 57,676 | |
| Merger Arbitrage Fund | | $ | 159,151 | | | $ | 79,354 | | | $ | 56,166 | |
| Mid Cap Fund | | $ | 112,535 | | | $ | 142,155 | | | $ | 158,184 | |
| Mid Cap Value Fund | | $ | 64,492 | | | $ | 89,225 | | | $ | 92,286 | |
| Premium Yield Equity Fund | | $ | 49,417 | | | $ | 55,959 | | | $ | 46,021 | |
| Sands Capital Select Growth Fund | | $ | 1,481,966 | | | $ | 1,280,444 | | | $ | 824,192 | |
| Small Cap Fund | | $ | 220,314 | | | $ | 182,259 | | | $ | 146,777 | |
| Small Cap Value Fund | | $ | 24,379 | | | $ | 29,434 | | | $ | 31,277 | |
| Total Return Bond Fund | | $ | 46,466 | | | $ | 50,341 | | | $ | 56,892 | |
| Ultra Short Duration Fixed Income Fund | | $ | 181,907 | | | $ | 145,523 | | | $ | 131,887 | |
| * | | Fees paid by the Predecessor Funds. |
| ** | | Prior to April 19, 2016, the Fund was known as Touchstone Emerging Markets Equity Fund. |
FINANCIAL STATEMENTS
The Funds’ audited financial statements for the fiscal year ended September 30, 2016, including the notes thereto and the reports of Ernst & Young LLP thereon, included in the Trust’s or Predecessor Funds' Annual Reports, are incorporated into this SAI by reference. The Active Bond Fund and High Yield Fund have adopted the financial statements of the Predecessor Funds, included in the Touchstone Investment Trust's Annual Report for the fiscal year ended September 30, 2016. No other parts of the Trust’s or Predecessor Funds' Annual Reports are hereby incorporated by reference. The Annual Reports may be obtained free of charge by calling the Trust at 1.800.543.0407 or by downloading a copy at TouchstoneInvestments.com. You may also obtain the Annual Report or unaudited semi-annual report, as well as other information about Touchstone Funds Group Trust, from the EDGAR Database on the SEC’s website at sec.gov.
APPENDIX A
DESCRIPTION OF SECURITIES RATINGS
Moody’s Investors Service, Inc. (“Moody’s”), Standard &Poor’s Rating Services® (“S&P”) and Fitch Ratings, Inc. (“Fitch”) are private services that provide ratings of the credit quality of debt obligations. A description of the ratings assigned by Moody’s, S&P®, Fitch are provided below. These ratings represent the opinions of these rating services as to the quality of the securities that they undertake to rate. It should be emphasized, however, that ratings are general and are not absolute standards of quality. The Advisor or sub-advisor attempts to discern variations in credit rankings of the rating services and to anticipate changes in credit ranking. However, subsequent to purchase by the Fund, an issue of securities may cease to be rated or its rating may be reduced below the minimum rating required for purchase by the Fund. In that event, the Advisor or Sub-Advisor will consider whether it is in the best interest of the Fund to continue to hold the securities.
Moody’s credit ratings are current opinions of the relative future credit risk of entities, credit commitments, or debt or debt-like securities. Moody’s defines credit risk as the risk that an entity may not meet its contractual, financial obligations as they come due and any estimated financial loss in the event of default. Credit ratings do not address any other risk, including but not limited to: liquidity risk, market value risk, or price volatility. Credit ratings are not statements of current or historical fact. Credit ratings do not constitute investment or financial advice, and credit ratings are not recommendations to purchase, sell, or hold particular securities. Credit ratings do not comment on the suitability of an investment for any particular investor. Moody’s issues its credit ratings with the expectation and understanding that each investor will make its own study and evaluation of each security that is under consideration for purchase, holding, or sale.
An S&P issue credit rating is a forward-looking opinion about the creditworthiness of an obligor with respect to a specific financial obligation, a specific class of financial obligations, or a specific financial program (including ratings on medium-term note programs and commercial paper programs). It takes into consideration the creditworthiness of guarantors, insurers, or other forms of credit enhancement on the obligation and takes into account the currency in which the obligation is denominated. The opinion reflects S&P’s view of the obligor’s capacity and willingness to meet its financial commitments as they come due, and may assess terms, such as collateral security and subordination, which could affect ultimate payment in the event of default.
Fitch credit ratings provide an opinion on the relative ability of an entity to meet financial commitments, such as interest, preferred dividends, and repayment of principal, insurance claims or counterparty obligations. Fitch credit ratings are used by investors as indications of the likelihood of receiving their money owed to them in accordance with the terms on which they invested. Fitch’s credit-ratings cover the global spectrum of corporate, sovereign (including supranational and sub-national), financial, bank, insurance, municipal and other public finance entities and the securities or other obligations they issue, as well as structured finance securities backed by receivables or other financial assets.
Short-Term Credit Ratings
Moody’s
Moody’s short-term ratings are opinions of the ability of issuers to honor short-term financial obligations. Ratings may be assigned to issuers, short-term programs or to individual short-term debt instruments. Such obligations generally have an original maturity not exceeding thirteen months, unless explicitly noted.
Moody’s employs the following designations to indicate the relative repayment ability of rated issuers:
“P-1” - Issuers (or supporting institutions) rated Prime-1 have a superior ability to repay short-term debt obligations.
“P-2” - Issuers (or supporting institutions) rated Prime-2 have a strong ability to repay short-term debt obligations.
“P-3” - Issuers (or supporting institutions) rated Prime-3 have an acceptable ability to repay short-term obligations.
“NP” - Issuers (or supporting institutions) rated Not Prime do not fall within any of the Prime rating categories.
Note: Canadian issuers rated P-1 or P-2 have their short-term ratings enhanced by the senior-most long-term rating of the issuer, its guarantor or support-provider.
S&P
S&P’s short-term ratings are generally assigned to those obligations considered short-term in the relevant market. In the U.S., for example, that means obligations with an original maturity of no more than 365 days—including commercial paper. Short-term ratings are also used to indicate the creditworthiness of an obligor with respect to put features on long-term obligations. The result is a dual rating, in which the short-term rating addresses the put feature, in addition to the usual long-term rating.
The following summarizes the rating categories used by S&P for short-term issues:
“A-1” - Obligations are rated in the highest category and indicate that the obligor’s capacity to meet its financial commitment on the obligation is strong. Within this category, certain obligations are designated with a plus sign (+). This indicates that the obligor’s capacity to meet its financial commitment on these obligations is extremely strong.
“A-2” - Obligations are somewhat more susceptible to the adverse effects of changes in circumstances and economic conditions than obligations in higher rating categories. However, the obligor’s capacity to meet its financial commitment on the obligation is satisfactory.
“A-3” - Obligations exhibit adequate protection parameters. However, adverse economic conditions or changing circumstances are more likely to lead to a weakened capacity of the obligor to meet its financial commitment on the obligation.
“B” - Obligations are regarded as vulnerable and having significant speculative characteristics. The obligor currently has the capacity to meet its financial commitments; however, it faces major ongoing uncertainties which could lead to the obligor’s inadequate capacity to meet its financial commitments.
“C” - Obligations are currently vulnerable to nonpayment and are dependent upon favorable business, financial and economic conditions for the obligor to meet its financial commitment on the obligation.
“D” - Obligations are in payment default. The “D” rating category is used when payments on an obligation are not made on the date due, unless S&P believes that such payments will be made within any stated grace period. However, any stated grace period longer than five business days will be treated as five business days. The “D” rating also will be used upon the filing of a bankruptcy petition or the taking of a similar action if payments on an obligation are jeopardized.
Local Currency and Foreign Currency Risks - Country risk considerations are a standard part of S&P’s analysis for credit ratings on any issuer or issue. Currency of repayment is a key factor in this analysis. An obligor’s capacity to repay foreign currency obligations may be lower than its capacity to repay obligations in its local currency due to the sovereign government’s own relatively lower capacity to repay external versus domestic debt. These sovereign risk considerations are incorporated in the debt ratings assigned to specific issues. Foreign currency issuer ratings are also distinguished from local currency issuer ratings to identify those instances where sovereign risks make them different for the same issuer.
Fitch
A short-term issuer or obligation rating is based in all cases on the short-term vulnerability to default of the rated entity or security stream, and relates to the capacity to meet financial obligations in accordance with the documentation governing the relevant obligation. Short-Term Ratings are assigned to obligations whose initial maturity is viewed as “short term” based on market convention. Typically, this means up to 13 months for corporate, sovereign and structured obligations, and up to 36 months for obligations in U.S. public finance markets.
The following summarizes the rating categories used by Fitch for short-term obligations:
“F1” — Highest short-term credit quality. This designation indicates the strongest intrinsic capacity for timely payment of financial commitments; may have an added “+” to denote any exceptionally strong credit feature.
“F2” — Good short-term credit quality. This designation indicates good intrinsic capacity for timely payment of financial commitments.
“F3” — Fair short-term credit quality. This designation indicates that the intrinsic capacity for timely payment of financial commitments is adequate.
“B” — Speculative short-term credit quality. This designation indicates minimal capacity for timely payment of financial commitments, plus heightened vulnerability to near term adverse changes in financial and economic conditions.
“C” — High short-term default risk. This designation indicates that default is a real possibility.
“RD” — Restricted default. This designation indicates an entity that has defaulted on one or more of its financial commitments, although it continues to meet other financial obligations. Or, the default of a specific short-term obligation.
“D” — Default. This designation indicates a broad-based default event for an entity, or the default of all short-term obligations.
Specific limitations relevant to the Short-Term Ratings scale include:
| | • | The ratings do not predict a specific percentage of default likelihood over any given time period. |
| | | |
| | • | The ratings do not opine on the market value of any issuer’s securities or stock, or the likelihood that this value may change. |
| | | |
| | • | The ratings do not opine on the liquidity of the issuer’s securities or stock. |
| | | |
| | • | The ratings do not opine on the possible loss severity on an obligation should an obligation default. |
| | | |
| | • | The ratings do not opine on any quality related to an issuer or transaction’s profile other than the agency’s opinion on the relative vulnerability to default of the rated issuer or obligation. |
Ratings assigned by Fitch Ratings articulate an opinion on discrete and specific areas of risk. The above list is not exhaustive.
Long-Term Credit Ratings
Moody’s
Moody’s long-term ratings are opinions of the relative credit risk of financial obligations with an original maturity of one year or more. They address the possibility that a financial obligation will not be honored as promised. Such ratings use Moody’s Global Scale and reflect both the likelihood of default and any financial loss suffered in the event of default.
The following summarizes the ratings used by Moody’s for long-term debt:
“Aaa” - Obligations rated “Aaa” are judged to be of the highest quality, subject to the lowest level of credit risk.
“Aa” - Obligations rated “Aa” are judged to be of high quality and are subject to very low credit risk.
“A” - Obligations rated “A” are judged to be upper-medium grade and are subject to low credit risk.
“Baa” - Obligations rated “Baa” are judged to be medium-grade and subject to moderate credit risk and as such may possess certain speculative characteristics.
“Ba” - Obligations rated “Ba” are judged to be speculative and are subject to substantial credit risk.
“B” - Obligations rated “B” are considered speculative and are subject to high credit risk.
“Caa” - Obligations rated “Caa” are judged to be of poor standing and are subject to very high credit risk.
“Ca” - Obligations rated “Ca” are highly speculative and are likely in, or very near, default, with some prospect of recovery of principal and interest.
“C” - Obligations rated “C” are the lowest rated class and are typically in default, with little prospect for recovery of principal or interest.
Note: Moody’s appends numerical modifiers 1, 2, and 3 to each generic rating classification from “Aa” through “Caa.” The modifier 1 indicates that the obligation ranks in the higher end of its generic rating category; the modifier 2 indicates a mid-range ranking; and the modifier 3 indicates a ranking in the lower end of that generic rating category.
S&P
Issue credit ratings are based, in varying degrees, on S&P’s analysis of the following considerations:
| | • | Likelihood of payment—capacity and willingness of the obligor to meet its financial commitment on an obligation in accordance with the terms of the obligation; |
| | | |
| | • | Nature of and provisions of the obligation; |
| | | |
| | • | Protection afforded by, and relative position of, the obligation in the event of bankruptcy, reorganization, or other arrangement under the laws of bankruptcy and other laws affecting creditors’ rights. |
Issue ratings are an assessment of default risk, but may incorporate an assessment of relative seniority or ultimate recovery in the event of default. Junior obligations are typically rated lower than senior obligations, to reflect the lower priority in bankruptcy, as noted above. (Such differentiation may apply when an entity has both senior and subordinated obligations, secured and unsecured obligations, or operating company and holding company obligations.)
The following summarizes the ratings used by S&P for long-term issues:
“AAA” - An obligation rated “AAA” has the highest rating assigned by S&P. The obligor’s capacity to meet its financial commitment on the obligation is extremely strong.
“AA” - An obligation rated “AA” differs from the highest-rated obligations only to a small degree. The obligor’s capacity to meet its financial commitment on the obligation is very strong.
“A” - An obligation rated “A” is somewhat more susceptible to the adverse effects of changes in circumstances and economic conditions than obligations in higher-rated categories. However, the obligor’s capacity to meet its financial commitment on the obligation is still strong.
“BBB” - An obligation rated “BBB” exhibits adequate protection parameters. However, adverse economic conditions or changing circumstances are more likely to lead to a weakened capacity of the obligor to meet its financial commitment on the obligation.
Obligations rated “BB,” “B,” “CCC,” “CC,” and “C” are regarded as having significant speculative characteristics. “BB” indicates the least degree of speculation and “C” the highest. While such obligations will likely have some quality and protective characteristics, these may be outweighed by large uncertainties or major exposures to adverse conditions.
“BB” - An obligation rated “BB” is less vulnerable to nonpayment than other speculative issues. However, it faces major ongoing uncertainties or exposure to adverse business, financial or economic conditions which could lead to the obligor’s inadequate capacity to meet its financial commitment on the obligation.
“B” - An obligation rated “B” is more vulnerable to nonpayment than obligations rated “BB,” but the obligor currently has the capacity to meet its financial commitment on the obligation. Adverse business, financial or economic conditions will likely impair the obligor’s capacity or willingness to meet its financial commitment on the obligation.
“CCC” - An obligation rated “CCC” is currently vulnerable to nonpayment, and is dependent upon favorable business, financial and economic conditions for the obligor to meet its financial commitment on the obligation. In the event of adverse business, financial, or economic conditions, the obligor is not likely to have the capacity to meet its financial commitment on the obligation.
“CC” - An obligation rated “CC” is currently highly vulnerable to nonpayment.
“C” - A “C” rating is assigned to obligations that are currently highly vulnerable to nonpayment, obligations that have payment arrearages allowed by the terms of the documents, or obligations of an issuer that is the subject of a bankruptcy petition or similar action which have not experienced a payment default. Among others, the “C” rating may be assigned to subordinated debt, preferred stock or other obligations on which cash payments have been suspended in accordance with the instrument’s terms or when preferred stock is the subject of a distressed exchange offer, whereby some or all of the issue is either repurchased for an amount of cash or replaced by other instruments having a total value that is less than par.
“D” - An obligation rated “D” is in payment default. The “D” rating category is used when payments on an obligation are not made on the date due, unless S&P believes that such payments will be made within five business days, irrespective of any grace period. The “D” rating also will be used upon the filing of a bankruptcy petition or the taking of a similar action if payments on an obligation are jeopardized. An obligation’s rating is lowered to ‘D’ upon completion of a distressed exchange offer, whereby some or all of the issue is either repurchased for an amount of cash or replaced by other instruments having a total value that is less than par.
Plus (+) or minus (-) - The ratings from “AA” to “CCC” may be modified by the addition of a plus (+) or minus (-) sign to show relative standing within the major rating categories.
“NR” - This indicates that no rating has been requested, that there is insufficient information on which to base a rating, or that S&P does not rate a particular obligation as a matter of policy.
Local Currency and Foreign Currency Risks - Country risk considerations are a standard part of S&P’s analysis for credit ratings on any issuer or issue. Currency of repayment is a key factor in this analysis. An obligor’s capacity to repay foreign currency obligations may be lower than its capacity to repay obligations in its local currency due to the sovereign government’s own relatively lower capacity to repay external versus domestic debt. These sovereign risk considerations are incorporated in the debt ratings assigned to specific issues. Foreign currency issuer ratings are also distinguished from local currency issuer ratings to identify those instances where sovereign risks make them different for the same issuer.
Fitch
Rated entities in a number of sectors, including financial and non-financial corporations, sovereigns and insurance companies, are generally assigned Issuer Default Ratings (IDRs). IDRs opine on an entity’s relative vulnerability to default on financial obligations. The “threshold” default risk addressed by the IDR is generally that of the financial obligations whose non-payment would best reflect the uncured failure of that entity. As such, IDRs also address relative vulnerability to bankruptcy, administrative receivership or similar concepts, although the agency recognizes that issuers may also make pre-emptive and therefore voluntary use of such mechanisms.
In aggregate, IDRs provide an ordinal ranking of issuers based on the agency’s view of their relative vulnerability to default, rather than a prediction of a specific percentage likelihood of default. For historical information on the default experience of Fitch-rated issuers, please consult the transition and default performance studies available from the Fitch Ratings website.
The following summarizes long-term IDR categories used by Fitch:
“AAA” — Highest credit quality. “AAA” ratings denote the lowest expectation of default risk. They are assigned only in cases of exceptionally strong capacity for payment of financial commitments. This capacity is highly unlikely to be adversely affected by foreseeable events.
“AA” — Very high credit quality. “AA” ratings denote expectations of very low default risk. They indicate very strong capacity for payment of financial commitments. This capacity is not significantly vulnerable to foreseeable events.
“A” — High credit quality. “A” ratings denote expectations of low default risk. The capacity for payment of financial commitments is considered strong. This capacity may, nevertheless, be more vulnerable to adverse business or economic conditions than is the case for higher ratings.
“BBB” — Good credit quality. “BBB” ratings indicate that expectations of default risk are currently low. The capacity for payment of financial commitments is considered adequate but adverse business or economic conditions are more likely to impair this capacity.
“BB” — Speculative. “BB” ratings indicate an elevated vulnerability to default risk, particularly in the event of adverse changes in business or economic conditions over time; however, business or financial flexibility exists which supports the servicing of financial commitments.
“B” — Highly speculative. “B” ratings indicate that material default risk is present, but a limited margin of safety remains. Financial commitments are currently being met; however, capacity for continued payment is vulnerable to deterioration in the business and economic environment.
“CCC” — Substantial credit risk. “CCC” ratings indicate that default is a real possibility.
“CC” — Very high levels of credit risk. “CC” ratings indicate default of some kind appears probable.
“C” — Exceptionally high levels of credit risk. “C” ratings indicate default is imminent or inevitable, or the issuer is in standstill. Conditions that are indicative of a ‘C’ category rating for an issuer include:
| | a. | he issuer has entered into a grace or cure period following non-payment of a material financial obligation; |
| | | |
| | b. | the issuer has entered into a temporary negotiated waiver or standstill agreement following a payment default on a material financial obligation; or |
| | | |
| | c. | Fitch otherwise believes a condition of “RD” or “D” to be imminent or inevitable, including through the formal announcement of a distressed debt exchange. |
“RD” - Restricted default. “RD” ratings indicate an issuer that in Fitch’s opinion has experienced an uncured payment default on a bond, loan or other material financial obligation but which has not entered into bankruptcy filings, administration, receivership, liquidation or other formal winding-up procedure, and which has not otherwise ceased business. This would include:
| | a. | the selective payment default on a specific class or currency of debt; |
| | | |
| | b. | the uncured expiry of any applicable grace period, cure period or default forbearance period following a payment default on a bank loan, capital markets security or other material financial obligation; |
| | | |
| | c. | the extension of multiple waivers or forbearance periods upon a payment default on one or more material financial obligations, either in series or in parallel; or |
| | | |
| | d. | execution of a distressed debt exchange on one or more material financial obligations. |
“D” — Default. “D” ratings indicate an issuer that in Fitch Ratings’ opinion has entered into bankruptcy filings, administration, receivership, liquidation or other formal winding-up procedure, or which has otherwise ceased business.
Default ratings are not assigned prospectively to entities or their obligations; within this context, non-payment on an instrument that contains a deferral feature or grace period will generally not be considered a default until after the expiration of the deferral or grace period, unless a default is otherwise driven by bankruptcy or other similar circumstance, or by a distressed debt exchange.
“Imminent” default typically refers to the occasion where a payment default has been intimated by the issuer, and is all but inevitable. This may, for example, be where an issuer has missed a scheduled payment, but (as is typical) has a grace period during which it may cure the payment default. Another alternative would be where an issuer has formally announced a distressed debt exchange, but the date of the exchange still lies several days or weeks in the immediate future.
In all cases, the assignment of a default rating reflects the agency’s opinion as to the most appropriate rating category consistent with the rest of its universe of ratings, and may differ from the definition of default under the terms of an issuer’s financial obligations or local commercial practice.
Note: The modifiers “+” or “-” may be appended to a rating to denote relative status within major rating categories. Such suffixes are not added to the “AAA” Long-Term IDR category, or to Long-Term IDR categories below “B.”
Specific limitations relevant to the issuer credit rating scale include:
| • | The ratings do not predict a specific percentage of default likelihood over any given time period. |
| • | The ratings do not opine on the market value of any issuer’s securities or stock, or the likelihood that this value may change. |
| • | The ratings do not opine on the liquidity of the issuer’s securities or stock. |
| • | The ratings do not opine on the possible loss severity on an obligation should an issuer default. |
| • | The ratings do not opine on the suitability of an issuer as a counterparty to trade credit. |
| • | The ratings do not opine on any quality related to an issuer’s business, operational or financial profile other than the agency’s opinion on its relative vulnerability to default. |
Ratings assigned by Fitch Ratings articulate an opinion on discrete and specific areas of risk. The above list is not exhaustive.
Municipal Note Ratings
Moody’s
Moody’s uses three rating categories for short-term municipal obligations that are considered investment grade. These ratings are designated as Municipal Investment Grade (“MIG”) and are divided into three levels - “MIG 1” through “MIG 3”. In addition, those short-term obligations that are of speculative quality are designated “SG”, or speculative grade. MIG ratings expire at the maturity of the obligation.
The following summarizes the ratings used by Moody’s for these short-term obligations:
“MIG 1” - This designation denotes superior credit quality. Excellent protection is afforded by established cash flows, highly reliable liquidity support, or demonstrated broad-based access to the market for refinancing.
“MIG 2” - This designation denotes strong credit quality. Margins of protection are ample, although not as large as in the preceding group.
“MIG 3” - This designation denotes acceptable credit quality. Liquidity and cash-flow protection may be narrow, and market access for refinancing is likely to be less well-established.
“SG” - This designation denotes speculative-grade credit quality. Debt instruments in this category may lack sufficient margins of protection.
In the case of variable rate demand obligations (“VRDOs”), a two-component rating is assigned: a long or short-term debt rating and a demand obligation rating. The first element represents Moody’s evaluation of risk associated with scheduled principal and interest payments. The second element represents Moody’s evaluation of risk associated with the ability to receive purchase price upon demand (“demand feature”). The second element uses a rating from a variation of the MIG scale called the Variable Municipal Investment Grade or “VMIG” scale.
When either the long- or short-term aspect of a VRDO is not rated, that piece is designated “NR”, e.g., “Aaa/NR” or “NR/VMIG 1”.
VMIG rating expirations are a function of each issue’s specific structural or credit features.
“VMIG 1” - This designation denotes superior credit quality. Excellent protection is afforded by the superior short-term credit strength of the liquidity provider and structural and legal protections that ensure the timely payment of purchase price upon demand.
“VMIG 2” - This designation denotes strong credit quality. Good protection is afforded by the strong short-term credit strength of the liquidity provider and structural and legal protections that ensure the timely payment of purchase price upon demand.
“VMIG 3” - This designation denotes acceptable credit quality. Adequate protection is afforded by the satisfactory short-term credit strength of the liquidity provider and structural and legal protections that ensure the timely payment of purchase price upon demand.
“SG” - This designation denotes speculative-grade credit quality. Demand features rated in this category may be supported by a liquidity provider that does not have an investment grade short-term rating or may lack the structural or legal protections necessary to ensure the timely payment of purchase price upon demand.
S&P
An S&P U.S. municipal note rating reflects S&P’s opinion about the liquidity factors and market access risks unique to notes. Notes due in three years or less will likely receive a note rating. Notes with an original maturity of more than three years will most likely receive a long-term debt rating. In determining which type of rating, if any, to assign, S&P’s analysis will review the following considerations:
| | • | Amortization schedule—the larger the final maturity relative to other maturities, the more likely it will be treated as a note; and |
| | • | Source of payment—the more dependent the issue is on the market for its refinancing, the more likely it will be treated as a note. |
Note rating symbols are as follows:
“SP-1” - The issuers of these municipal notes exhibit a strong capacity to pay principal and interest. Those issues determined to possess a very strong capacity to pay debt service are given a plus (+) designation.
“SP-2” - The issuers of these municipal notes exhibit a satisfactory capacity to pay principal and interest, with some vulnerability to adverse financial and economic changes over the term of the notes.
“SP-3” - The issuers of these municipal notes exhibit speculative capacity to pay principal and interest.
Fitch
Fitch uses the same ratings for municipal securities as described above for other short-term credit ratings.
APPENDIX B — PROXY VOTING POLICIES
Copper Rock Capital Partners, LLC
Proxy Voting Policy
PROXY VOTING POLICY
RESPONSIBILITY
The CCO, or designee, has overall responsibility for monitoring the firm’s proxy voting policy to ensure compliance.
BACKGROUND
When voting proxies on behalf of our clients, Copper Rock assumes a fiduciary responsibility to vote in our clients’ best interests. In addition, with respect to benefit plans under the Employee Retirement Income Securities Act of 1974 (ERISA), Copper Rock acknowledges its responsibility as a fiduciary to vote proxies prudently and solely in the best interest of plan participants and beneficiaries. So that it may fulfill these fiduciary responsibilities to clients, Copper Rock has adopted and implemented these written policies and procedures reasonably designed to ensure that it votes proxies in the best interest of clients.
Proxy Voting Guidelines
Copper Rock acknowledges it has a duty of care to its clients that requires it to monitor corporate events and vote client proxies. To assist in this effort, Copper Rock has retained Broadridge Investor Communication Solutions, Inc. (“Broadridge”) to research and vote proxies. Broadridge provides proxy-voting analysis and votes proxies in accordance with predetermined guidelines. Relying on Broadridge to vote proxies ensures that Copper Rock votes in the best interest of its clients and insulates Copper Rock’s voting decisions from potential conflicts of interest.
There may be occasions when Copper Rock determines that not voting a proxy may be in the best interest of clients; for example, when the cost of voting the proxy exceeds the expected benefit to the client. There may also be times when clients have instructed Copper Rock not to vote proxies or direct Copper Rock to vote proxies in a certain manner. Copper Rock will maintain written instructions from clients with respect to directing proxy votes.
Copper Rock also reserves the right to override Broadridge’s vote recommendations under certain circumstances. Copper Rock will only do so if it believes that changing such vote is in the best interest of clients. All overrides will be approved by an executive officer of Copper Rock and will be documented with the reasons for voting against the Broadridge recommendation.
Conflicts of Interest
Occasions may arise during the voting process in which the best interest of clients conflicts with Copper Rock’s interests. In these situations Broadridge will continue to follow the same predetermined guidelines as formally agreed upon between Copper Rock and Broadridge before such conflict of interest existed. Conflicts of interest generally include (i) Copper Rock’s having has a substantial business relationship with, or actively soliciting business from, a company soliciting proxies or (ii) personal or family relationships involving employees of Copper Rock, such as a spouse who serves as a director of a public company. A conflict could also exist if a substantial business relationship exists with a proponent or opponent of a particular initiative.
If Copper Rock learns that a conflict of interest exists, the proxy coordinator will prepare a report to the Compliance Committee that identifies (i) the details of the conflict of interest, (ii) whether or not the conflict is material, and (iii) procedures to ensure that Copper Rock makes proxy voting decisions based on the best interests of clients. If Copper Rock determines that a material conflict exists, it will defer to Broadridge to vote the proxy in accordance with the predetermined voting policy.
Voting Policies
Copper Rock has adopted the proxy voting policies developed by Broadridge. The policies have been developed based on Broadridge’s independent, objective analysis of leading corporate governance practices and the support of long-term shareholder value. Copper Rock may change its policies from time to time without providing notice of changes to clients.
Broadridge proxy voting policies include:
Management Proposals: Proposals introduced by company management will generally be voted in accordance with management’s recommendations on the following types of routine management proposals:
| · | Election of Directors (uncontested) |
| · | Approval of Independent Auditors |
| · | Executive Compensation Plans |
| · | Routine Corporate Structure, Share Issuance, Allocations of Income, Scrip Dividend Proposals, Increases in Capital or Par Value, and Share |
| Repurchase Plans |
Shareholder Proposals: At times shareholders will submit proposals that generally seek to change some aspect of a company’s corporate governance structure or its business operations. Proxies will generally be voted against proposals motivated by political, ethical or social concerns. Proposals will be examined solely from an economic perspective. Proxies will generally be voted with management in opposition to shareholder resolutions which could negatively impact the company’s ability to conduct business, and voted in support of the shareholder initiatives concerning the maximization of shareholder value.
Other (Non-Routine) Proposals: Non-routine proposals, introduced by company management or shareholders, are examined on a case-by-case basis. These are often more complex structural changes to a company such as a reorganization or merger, in which a variety of issues are considered including the benefits to shareholders’ existing and future earnings, preservation of shareholder value, financial terms of the transaction and the strategic rationale for the proposal. The following are examples of proposals that are voted on a case-by-case basis:
| · | Reorganizations/Restructurings |
| · | Amendments to the Articles of Association |
| · | Non-Executive Director Compensation Proposals (cash and share based components) |
| · | Increasing Borrowing Powers |
| · | Debt Issuance Requests |
Voting Process
Copper Rock has appointed the manager of operations to act as proxy coordinator. The proxy coordinator acts as coordinator with Broadridge ensuring proxies Copper Rock is responsible to vote are forwarded to Broadridge and overseeing that Broadridge is voting assigned client accounts and maintaining appropriate authorization and voting records.
After Broadridge is notified by the custodian of a proxy that requires voting and/or after Broadridge cross references its database with a routine download of Copper Rock holdings and determines a proxy requires voting, Broadridge will review the proxy and make a voting proposal based on the recommendations provided by Broadridge’s research group. Any electronic proxy votes will be communicated to the proxy solicitor by Broadridge’s Global Proxy Distribution Service while non-electronic ballots, or paper ballots, will be faxed, telephoned or sent via Internet. Broadridge assumes responsibility for the proxies to be transmitted for voting in a timely fashion and maintains a record of each vote, which is provided to Copper Rock on a quarterly basis. Copper Rock will make votes available to all separately managed accountholders upon request and will communicate votes to all mutual fund clients no less frequently than once a year.
Proxy Voting Record
Copper Rock’s proxy coordinator will maintain a record, or maintain access to such records from the vendor, containing the following information regarding the voting of proxies: (i) the name of the issuer, (ii) the exchange ticker symbol, (iii) the CUSIP number, (iv) the shareholder meeting date, (v) a brief description of the matter brought to vote; (vi) whether the proposal was submitted by management or a shareholder, (vii) how Broadridge/Copper Rock voted the proxy (for, against, abstained); and (viii) whether the proxy was voted for or against management.
Obtaining a Voting Proxy Report
Clients may request a copy of these policies and procedures and/or a report on how their individual securities were voted by calling Copper Rock’s Head of Client Service, Lidney Motch, at (617) 369-7140. The report will be provided free of charge.
EARNEST PARTNERS LLC
Proxy Policies
As a general rule, EARNEST Partners (the “Advisor”) will vote against actions which would reduce the rights or options of shareholders, reduce shareholder influence over the board of directors and management, reduce the alignment of interests between management and shareholders, or reduce the value of shareholders’ investments. A partial list of issues that may require special attention are as follows: classified boards, change of state of incorporation, poison pills, unequal voting rights plans, provisions requiring supermajority approval of a merger, executive severance agreements, and provisions limiting shareholder rights.
In addition, the following will generally be adhered to unless the Advisor is instructed otherwise in writing by the client:
| | • | The Advisor will not actively engage in conduct that involves an attempt to change or influence the control of a portfolio company. |
| | • | The Advisor will not announce its voting intentions or the reasons for a particular vote. |
| | • | The Advisor will not participate in a proxy solicitation or otherwise seek proxy voting authority from any other portfolio company shareholder. |
| | • | The Advisor will not act in concert with any other portfolio company shareholders in connection with any proxy issue or other activity involving the control or management of a portfolio company. |
| | • | All communications with portfolio companies or fellow shareholders will be for the sole purpose of expressing and discussing the Advisor’s concerns for its clients’ interests and not in an attempt to influence the control of management. |
Proxy Procedures
The Advisor has designated a Proxy Director. The Proxy Director will consider each issue presented on each portfolio company proxy. The Proxy Director will also use available resources, including proxy evaluation services, to assist in the analysis of proxy issues. Proxy issues presented to the Proxy Director will be voted in accordance with the judgment of the Proxy Director, taking into account the general policies outlined above and the Advisor’s Proxy Voting Guidelines (currently ISS Taft-Hartley Advisory Services Proxy Voting Guidelines). Therefore, it is possible that actual votes may differ from these general policies and the Advisor’s Proxy Voting Guidelines. In the case where the Advisor believes it has a material conflict of interest with a Client, the Proxy Director will utilize the services of outside third party professionals (currently ISS Taft-Hartley Advisory Services) to assist in its analysis of voting issues and the actual voting of proxies to ensure that a decision to vote the proxies was based on the Client’s best interest and was not the product of a conflict of interest. In general, ISS Taft-Hartley Advisory Services Proxy Voting Guidelines are based on a worker-owner view of long-term corporate value and conform to the AFL-CIO proxy voting policy. In the event the services of an outside third party professional are not available in connection with a conflict of interest, the Advisor will seek the advice of the Client.
A detailed description of the Advisor’s specific Proxy Voting Guidelines will be furnished upon written request. You may also obtain information about how the Advisor has voted with respect to portfolio company securities by calling, writing, or emailing us at:
EARNEST Partners
1180 Peachtree Street NE, Suite 2300
Atlanta, GA 30309
invest@earnestpartners.com
404-815-8772
The Advisor reserves the right to change these policies and procedures at any time without notice.
FORT WASHINGTON INVESTMENT ADVISORS, INC.
Fort Washington’s policy is to vote proxies in the best interests of the Fund at all times. Fort Washington has adopted procedures that it believes are reasonably designed to ensure that proxies are voted in the best interests of the Fund in accordance with its fiduciary duties and SEC rules governing investment advisors. Reflecting a basic investment philosophy that good management is shareholder focused, proxy votes will generally be cast in support of management on routine corporate matters and in support of any management proposal that is plainly in the interest of all shareholders. Specifically, proxy votes generally will be cast in favor of proposals that:
| | • | maintain or strengthen the shared interests of stockholders and management; |
| | | |
| | • | increase shareholder value; and |
| | | |
| | • | maintain or increase shareholder rights generally. |
Proxy votes will generally be cast against proposals having the opposite effect of the above. Where Fort Washington perceives that a management proposal, if approved, would tend to limit or reduce the market value of the company’s securities, it will generally vote against it. Fort Washington generally supports shareholder rights and recapitalization measures undertaken unilaterally by boards of directors properly exercising their responsibilities and authority, unless we believe such measures could have the effect of reducing shareholder rights or potential shareholder value. In cases where shareholder proposals challenge such actions, Fort Washington’s voting position will generally favor not interfering with the directors’ proper function in the interest of all shareholders.
Fort Washington may delegate its responsibilities under its proxy voting procedures to a third party, provided that Fort Washington retains final authority and fiduciary responsibility for proxy voting. Fort Washington has retained Risk Metrics to assist it in the proxy voting process and will use Risk Metrics’ proxy voting guidelines as a resource in its proxy voting.
Fort Washington will review proxies to assess the extent, if any, to which there may be a material conflict between it and the interests of the Fund. If Fort Washington determines that a potential conflict may exist, it will be reported to the Proxy Voting Committee. The Proxy Voting Committee is authorized to resolve any conflict in a manner that is in the collective best interests of the Fund (excluding a potential conflict). The Proxy Voting Committee may resolve a potential conflict in any of the following manners:
| | • | If the proposal is specifically addressed in the proxy voting procedures, Fort Washington may vote the proxy in accordance with these policies, provided that such pre-determined policy involves little discretion on Fort Washington’s part; |
| | • | Fort Washington may engage an independent third party to determine how the proxy should be voted; |
| | • | Fort Washington may establish an ethical wall or other informational barriers between the person involved in the potential conflict and the persons making the voting decision in order to insulate the potential conflict from the decision maker. |
LMCG Investments, LLC (“LMCG”)
Proxy Voting Guidelines Summary
The proxy voting guidelines contained herein are a sampling of select, key guidelines and are not all inclusive. LMCG will from time to time review our proxy voting policy and guidelines and may adopt changes. Proxy questions are considered within the individual circumstances of the issuer and therefore it is possible that individual circumstances might mean that a given proxy question could be voted differently than what is generally done in other cases. Clients may contact their Client Service Officer or the Compliance Office by calling (617) 380-5600 or via e-mail at clientservice@lmcg.com or compliance@lmcg.com for a copy of our current guidelines or to obtain a record of how proxies were voted for their account.
1. Audit-related Items:
Auditor Ratification
Generally vote FOR proposals to ratify auditors unless:
| | • | An auditor has a financial interest in or association with the company and is therefore not independent; |
| | • | There is reason to believe that the independent auditor has rendered an opinion which is neither accurate nor indicative of the company’s financial position; |
| | • | Poor accounting practices are identified such as fraud, misapplication of GAAP and material weaknesses are identified; or |
| | • | Fees for non-audit services are excessive |
Vote CASE-BY-CASE on shareholder proposals asking companies to prohibit or limit their auditors from engaging in non-audit services.
2. Board of Directors:
Voting on Director Nominees in Uncontested Elections
Votes on director nominees should be determined CASE-BY-CASE.
Voting for Director Nominees in Contested Elections
Vote CASE-BY-CASE on the election of directors in contested elections, considering the following:
| | • | Management’s track record; |
| | • | Background to the proxy contest; |
| | • | Qualifications of Director nominees; |
| | • | Strategic plan of dissident slate and quality of critique against management; |
| | • | Likelihood that the proposed goals and objectives can be achieved; and |
| | • | Stock ownership positions |
Board responsiveness
Vote case-by-case on individual directors, committee members or the entire board of directors as appropriate if:
| | • | Material failures of governance, stewardship, risk oversight, or fiduciary responsibilities at the company |
| | • | Board failed to act on a shareholder proposal that received the support of a majority of shares cast in the previous year |
| | • | Board failed to act on takeover offer where majority of shares tendered |
| | • | Board failed to address issues related to a director receiving 50% or more withhold/against votes |
| | • | Board implements an advisory vote on executive compensation on a less frequent basis than the frequency that received the majority of votes |
Vote AGAINST or WITHHOLD from entire board of directors for problematic practices or material failures in the areas of accountability, independence or competence:
Board accountability, including items such as:
| | • | A classified board structure |
| | • | A supermajority vote requirement |
| | • | Inability for shareholders to call special meetings |
| | • | Inability of shareholders to act by written consent |
| | • | Dual-class capital structure |
| | • | Non-shareholder approved poison pill |
| | • | Material failures of governance, stewardship, risk oversight, fiduciary responsibility |
| | • | Failure to replace management as appropriate |
Director independence, including items such as:
| | • | Inside or affiliated director serves on key committees |
| | • | Company lacks an audit, compensation or nominating committee |
| | • | Independent directors make up less than a majority of directors |
Director competence, including items such as:
| | • | Not all director’s attended 75% of the aggregate board and committee meetings |
| | • | Sit on more than six public company boards |
Independent Chair (Separate CEO/Chair)
Generally vote FOR shareholder proposals requiring that the chairman position be filled by an independent director unless there are substantial reasons to recommend against the proposal, such as counterbalancing governance structure.
Majority Vote Shareholder Proposals
Generally vote FOR binding resolutions requesting that the board change the company’s bylaws to stipulate that directors need to be elected with an affirmative majority of votes cast.
Audit Committee related items
Generally vote AGAINST or WITHHOLD from members of the Audit Committee if:
| | • | Non-audit fees paid to auditor are excessive |
| | • | Company receives an adverse opinion on financial statements |
| | • | Evidence of inappropriate indemnification language that limits ability of the company or shareholders to pursue legal recourse against audit firm |
Vote CASE-BY-CASE on members of the Audit Committee and potentially the full board if:
| | • | Poor accounting practices result in fraud, misapplication of GAAP, and/or other material weaknesses |
Compensation Committee related items
In the absence of an Advisory vote on executive compensation, vote AGAINST or WITHHOLD on members of the Compensation Committee or potentially the full board if:
| | • | There is significant misalignment between CEO pay and company performance |
| | • | Company maintains problematic pay practices related to non-performance based compensation elements, incentives that motivate excessive risk taking and options backdating |
| | • | Board exhibits significant level of poor communication and responsiveness to shareholders |
| | • | Company fails to submit one-time transfer of stock options to shareholder vote |
| | • | Company fails to fulfill terms of burn rate commitment made to shareholders |
Vote CASE-BY-CASE on members of the Compensation Committee and the MSOP proposal if the Company’s previous say-on-pay proposal received support of less than 70% of votes cast, taking into account:
| | • | Discloser of engagement efforts with major institutional shareholders regarding issues that led to low level of support |
| | • | Specific actions to address issues that contributed to low level of support |
| | • | Other recent compensation practices |
| | • | Whether the issues raised are recurring or isolated |
| | • | Company’s ownership structure |
| | • | Whether support level was less than 50%, |
Performance/Governance Evaluation for Directors
Generally vote WITHHOLD or AGAINST on all director nominees if the board lacks accountability and oversight, coupled with sustained poor performance relative to peers.
Reimbursing Proxy Solicitation Expenses
Vote CASE-BY-CASE on proposals to reimburse proxy solicitation expenses.
| 3. | Shareholder Rights and Defenses: |
Advanced Notice Requirements for Shareholder Proposals/Nominations
Vote CASE-BY-CASE on advance notice proposals, giving support to proposals that allow shareholders to submit proposals/nominations reasonably close to the meeting date within the broadest window possible.
Poison Pills
Generally vote FOR shareholder proposals requesting that the company submit its poison pill to a shareholder vote or redeem it unless the company has (1) a shareholder approved poison pill in place or (2) the company has adopted a policy concerning the adoption of a pill in the future specifying that the board will only adopt a shareholder rights plan if shareholders have approved the adoption of the plan or the board determines that it is in the best interest of shareholders to adopt a pill without delay.
Vote CASE-BY-CASE on management proposals on poison pill ratification, focusing on the features of the shareholder rights plan.
Reincorporation Proposals
Evaluate management or shareholder proposals to change a company’s state of incorporation on a CASE-BY-CASE basis.
4. Capital and Corporate Restructurings:
Common Stock Authorization
Vote CASE-BY-CASE on proposals to increase the number of shares of common stock authorized for issuance.
Dual Class Structure
Generally vote AGAINST proposals to create a new class of common stock with superior voting rights
Share Repurchase Programs
Vote FOR management proposals to institute open market repurchase plans in which all shareholders may participate on equal terms.
Mergers and Acquisitions
Overall Approach - Vote CASE-BY-CASE
For mergers and acquisitions, review and evaluate the merits and drawbacks of the proposed transaction balancing various and sometimes countervailing factors including:
| | • | Valuation; |
| | • | Market reaction; |
| | • | Strategic rationale; |
| | • | Negotiations and process; |
| | • | Conflicts of Interest; and |
5. Compensation:
Advisory Vote on Executive Compensation (Say-on-Pay) Management Proposals
Vote CASE-BY-CASE on ballot items related to executive pay and practices
Vote AGAINST Advisory Votes on Executive Compensation (MSOP) if:
| | • | There is significant misalignment between CEO pay and company performance |
| | • | Company maintains problematic pay practices |
| | • | Board exhibits significant level of poor communication and responsiveness to shareholders |
Vote AGAINST or WITHHOLD from members of the Compensation Committee if:
| | • | There is no MSOP on the ballot |
| | • | Board fails to adequately respond to a previous MSOP proposal that received less than 70% support |
| | • | The company has poor compensation practices |
Vote FOR annual advisory votes on compensation.
Employee Stock Purchase Plans
Vote CASE-BY-CASE on non-qualified employee stock purchase plans.
Option Exchange Programs/Re-pricing Options
Vote CASE-BY-CASE on management proposals seeking approval to exchange/re-price options.
Equity Compensation Plans
Vote CASE-BY-CASE on equity-based compensation plans.
6. Corporate Social Responsibility (CSR) Issues:
General approach on CSR issues is to vote CASE-BY-CASE taking into account factors such as impact on shareholder value, significance of company’s business affected by the proposal, impact on company reputation, response by other companies to similar issue and degree to which proprietary or confidential information would be disclosed.
Some issues that fall under this topic include proposals on:
| | • | Company’s political spending, lobbying efforts and charitable contributions |
| | • | Animal welfare practices |
| | • | Energy and environmental issues |
| | • | Equal employment opportunity and discrimination |
| | • | Diversity |
| | • | Product safety and hazardous materials |
7. Conflicts of Interest:
Conflicts of interest could exist when the Firm holds a security issued by a client in client portfolios, and the Firm is required to vote that security. When there is a potential conflict with a client, the Firm will look to these guidelines and the ISS recommendation for voting guidance.
LONDON COMPANY OF VIRGINIA D/B/A THE LONDON COMPANY
The London Company of Virginia (the “Advisor”) acts as discretionary investment adviser for various clients, including clients governed by the Employee Retirement Income Security Act of 1974 (“ERISA”) and registered open-end investment companies (“mutual funds”). The Advisor’s authority to vote proxies is established through the delegation of discretionary authority under its investment advisory contracts. Therefore, unless a client (including a “named fiduciary” under ERISA) specifically reserves the right, in writing, to vote its own proxies, the Adviser will vote all proxies in a timely manner as part of its full discretionary authority over client assets in accordance with these Policies and Procedures.
When voting proxies, the Advisor’s utmost concern is that all decisions be made solely in the best interest of the client (and for ERISA accounts, plan beneficiaries and participants, in accordance with the letter and spirit of ERISA). The Advisor will act in a prudent and diligent manner intended to enhance the economic value of the assets of the client’s account.
The purpose of these Policies and Procedures is to memorialize the procedures and policies adopted by the Advisor to enable it to comply with its fiduciary responsibilities to clients and the requirements of Rule 206(4)-6 under the Investment Advisers Act of 1940, as amended (the “Advisers Act”). These Policies and Procedures also reflect the fiduciary standards and responsibilities set forth by the Department of Labor for ERISA accounts.
| | A. | The Advisor is ultimately responsible for ensuring that all proxies received by the Adviser are voted in a timely manner and in a manner consistent with the Advisor’s determination of the client’s best interests. Although many proxy proposals can be voted in accordance with the Adviser’s established guidelines (see Section V. “Guidelines” below), the Advisor recognizes that some proposals require special consideration which may dictate that the Advisor makes an exception to the Guidelines. The Advisor will vote the recommendation of Glass Lewis on all proxy votes, unless otherwise directed by the Portfolio Managers |
| | | |
Where a proxy proposal raises a material conflict between the Advisor’s interests and a client’s interest, including a mutual fund client, the Adviser will resolve such a conflict in the manner described below:
| | | 1. | Vote in Accordance with the Guidelines. To the extent that the Advisor has little or no discretion to deviate from the Guidelines with respect to the proposal in question, the Advisor shall vote in accordance with such pre-determined voting policy. |
| | | | |
| | | 2. | Obtain Consent of Clients. To the extent that the Advisor has discretion to deviate from the Guidelines with respect to the proposal in question, the Advisor will disclose the conflict to the relevant clients and obtain their consent to the proposed vote prior to voting the securities. The disclosure to the client will include sufficient detail regarding the matter to be voted on and the nature of the Advisor’s conflict that the client would be able to make an informed decision regarding the vote. If a client does not respond to such a conflict disclosure request or denies the request, the Advisor will abstain from voting the securities held by that client’s account. |
| | | | |
| | | 3. | Client Directive to Use an Independent Third Party. Alternatively, a client may, in writing, specifically direct the Advisor to forward all proxy matters in which the Advisor has a conflict of interest regarding the client’s securities to an identified independent third party for review and recommendation. Where such independent third party’s recommendations are received on a timely basis, the Advisor will vote all such proxies in accordance with such third party’s recommendation. If the third party’s recommendations are not timely received, the Advisor will abstain from voting the securities held by that client’s account. |
The Advisor will review the proxy proposal for conflicts of interest as part of the overall vote review process. All material conflict of interest so identified by the Adviser will be addressed as described above in this Section III.A.
In certain circumstances, in accordance with a client’s investment advisory contract (or other written directive) or where the Advisor has determined that it is in the client’s best interest, the Advisor will not vote proxies received. The following are certain circumstances where the Advisor will limit its role in voting proxies:
| | | 1. | Client Maintains Proxy Voting Authority: Where client specifies in writing that it will maintain the authority to vote proxies itself or that it has delegated the right to vote proxies to a third party, the Advisor will not vote the securities and will direct the relevant custodian to send the proxy material directly to the client. If any proxy material is received by the Advisor, it will promptly be forwarded to the client or specified third party. |
| | | | |
| | | 2. | Terminated Account: Once a client account has been terminated with the Advisor in accordance with its investment advisory agreement, the Advisor will not vote any proxies received after the termination. However, the client may specify in writing that proxies should be directed to the client (or a specified third party) for action. |
| | | | |
| | | 3. | Limited Value: If the Adviser determines that the value of a client’s economic interest or the value of the portfolio holding is indeterminable or insignificant, the Advisor may abstain from voting a client’s proxies. The Advisor also will not vote proxies received for securities which are no longer held by the client’s account. |
| | | | |
| | | 4. | Securities Lending Programs: When securities are out on loan, they are transferred into the borrower’s name and are voted by the borrower, in its discretion. However, where the Advisor determines that a proxy vote (or other shareholder action) is materially important to the client’s account, the Advisor may recall the security for purposes of voting. |
| | | | |
| | | 5. | Unjustifiable Costs: In certain circumstances, after doing a cost-benefit analysis, the Advisor may abstain from voting where the cost of voting a client’s proxy would exceed any anticipated benefits to the client of the proxy proposal. |
In accordance with Rule 204-2 under the Advisers Act, the Advisor will maintain for the time periods set forth in the Rule (i) these proxy voting procedures and policies, and all amendments thereto; (ii) all proxy statements received regarding client securities (provided however, that the Advisor may rely on the proxy statement filed on EDGAR as its records); (iii) a record of all votes cast on behalf of clients; (iv) records of all client requests for proxy voting information; (v) any documents prepared by the Advisor that were material to making a decision how to vote or that memorialized the basis for the decision; and (vi) all records relating to requests made to clients regarding conflicts of interest in voting the proxy.
The Advisor will describe in its Part II of Form ADV (or other brochure fulfilling the requirement of Rule 204-3) its proxy voting policies and procedures and will inform clients how they may obtain information on how the Advisor voted proxies with respect to the clients’ portfolio securities. Clients may obtain information on how their securities were voted or a copy of the Advisor’s Policies and Procedures by written request addressed to the Advisor. The Advisor will coordinate with all mutual fund clients to assist in the provision of all information required to be filed by such mutual funds on Form N-PX.
The Glass Lewis Investment Manager Guidelines are designed to maximize returns for investment managers by voting in a manner consistent with such managers’ active investment decision-making. The guidelines are designed to increase investors’ potential financial gain through the use of the shareholder vote, while also allowing management and the board discretion to direct the operations, including governance and compensation, of the firm. The guidelines will ensure that all issues brought to shareholders are analyzed in light of the fiduciary responsibilities unique to investment advisors and investment companies on behalf of individual investor clients including mutual fund shareholders. The guidelines will encourage the maximization of return for such clients through identifying and avoiding financial, audit and corporate governance risks.
Management Proposals
Election of Directors
In analyzing directors and boards, Glass Lewis’ Investment Manager Guidelines generally support the election of incumbent directors, except when a majority of the company’s directors are not independent or where directors fail to attend at least 75% of board and committee meetings. In a contested election, we will apply the standard Glass Lewis recommendation.
Auditor
The Glass Lewis Investment Manager Guidelines will generally support auditor ratification, except when the non-audit fees exceed the audit fees paid to the auditor, there have been recent restatements
Compensation
Glass Lewis recognizes the importance in designing appropriate executive compensation plans that truly reward pay for performance. We evaluate equity compensation plans based upon their specific features and will vote against plans than would result in total overhang greater than 20% or that allow the re-pricing of options without shareholder approval. The Investment Manager Guidelines will support management advisory votes on compensation with the belief that an independent compensation committee is in the best position to design an appropriate compensation program for the company.
Authorized Shares
Having sufficient available authorized shares allows management to avail itself of rapidly developing opportunities as well as to effectively operate the business. However, we believe that for significant transactions management should seek shareholders’ approval to justify the use of additional shares.
Therefore shareholders should not approve the creation of a large pool of unallocated shares without some rational of the purpose of such shares. Accordingly, where we find that the company has not provided an appropriate plan for use of the proposed shares, or where the number of shares far exceeds those needed to accomplish a detailed plan, we typically vote against the authorization of additional shares. We also vote against the creation of or increase in (i) blank check preferred shares and (ii) dual or multiple class capitalizations.
Shareholder Rights
Glass Lewis Investment Manager Guidelines will generally support proposals increasing or enhancing shareholder rights such as declassifying the board, allowing shareholders to call a special meeting, eliminating supermajority voting and adopting majority voting for the election of directors. Similarly, the Investment Manager Guidelines will generally vote against proposals to eliminate or reduce shareholder rights.
Mergers/Acquisitions
Glass Lewis undertakes a thorough examination of the economic implications of a proposed merger or acquisition to determine the transaction’s likelihood of maximizing shareholder return. We examine the process used to negotiate the transaction as well as the terms of the transaction in making our voting recommendation. The Glass Lewis Investment Manager Guidelines will vote in accordance with the standard Glass Lewis policy recommendation on mergers, acquisitions and other financing transactions.
Shareholder Proposals
We review and vote on shareholder proposals on a case-by-case basis. We recommend supporting shareholder proposals if the requested action would increase shareholder value, mitigate risk or enhance shareholder rights but generally recommend voting against those that would not ultimately impact performance.
Governance
The Glass Lewis Investment Manager Guidelines will support reasonable initiatives that seek to enhance shareholder rights, such as the introduction of majority voting to elect directors, elimination in/reduction of supermajority provisions, the declassification of the board and requiring the submission of shareholder rights’ plans to a shareholder vote. The guidelines generally support reasonable, well-targeted proposals to allow increased shareholder participation at shareholder meetings through the ability to call special meetings and ability for shareholders to nominate director candidates to a company’s board of directors. However, the Investment Manager Guidelines will vote against proposals to require separating the roles of CEO and chairman.
Compensation
The Glass Lewis Investment Manager Guidelines will generally oppose any shareholder proposals seeking to limit compensation in amount or design. However, the guidelines will vote for reasonable and properly-targeted shareholder initiatives such as to require shareholder approval to re-price options, to link pay with performance, to eliminate or require shareholder approval of golden coffins, to allow a shareholder vote on excessive golden parachutes (i.e., greater than 2.99 times annual compensation) and to clawback unearned bonuses. The Investment Manager Guidelines will vote against requiring companies to allow shareholders an advisory compensation vote.
Environment
Glass Lewis’ Investment Manager Guidelines vote against proposals seeking to cease a certain practice or take certain action related to a company’s activities or operations with environmental. Further, the Glass Lewis’ Investment Manager Guidelines generally vote against proposals regarding enhanced environment disclosure and reporting, including those seeking sustainability reporting and disclosure about company’s greenhouse gas emissions, as well as advocating compliance with international environmental conventions and adherence to environmental principles like those promulgated by CERES.
Social
Glass Lewis’ Investment Manager Guidelines generally oppose proposals requesting companies adhere to labor or worker treatment codes of conduct, such as those espoused by the International Labor Organization, relating to labor standards, human rights conventions and corporate responsibility at large conventions and principles. The guidelines will also vote against proposals seeking disclosure concerning the rights of workers, impact on local stakeholders, workers’ rights and human rights in general. Furthermore, the Investment Manager Guidelines oppose increased reporting and review of a company’s political and charitable spending as well as its lobbying practices.
LONGFELLOW INVESTMENT MANAGEMENT CO.
Proxy Voting Policy, Overview
Where the power to vote proxies has been delegated to Longfellow Investment Management Co. (LIM), LIM has the responsibility for voting in a manner that is in the best economic interests of the client. LIM shall consider only those factors that relate to the client’s investment or dictated by the client’s written instructions, including how its vote will economically impact and affect the value of the client’s investment. In some instances LIM may abstain from voting a client proxy, particularly when the effect on the client’s economic interest is insignificant or the cost of voting the proxy outweighs the benefit to the client’s portfolio. In voting on each and every issue, LIM shall vote in a prudent and timely fashion and only after a careful evaluation of the issue (s) presented on the ballot. Proxy votes will generally be cast in support of management on routine corporate matters and in support of any management proposal that is plainly in the interest of all shareholders. LIM would generally vote for proposals that increase shareholder value and maintain or increase shareholder rights. LIM will generally vote for management proposals for merger or reorganization. LIM will generally vote for the selection of independent auditors. Where LIM perceives that the proposal, if approved, would tend to limit or reduce the economic value of the client’s investment, LIM will generally vote against it. There may be instances where the interests of LIM may conflict or appear to conflict with the interests of its clients. For example: a situation where a portfolio holding is a client or an affiliate of a client of LIM. In such situations LIM, consistent with its duty of care and duty of loyalty, may engage an independent third party to determine how the proxy should be voted.
MILLER/HOWARD INVESTMENTS, INC.
APPENDIX C
PROXY VOTING POLICY AND GUIDELINES
Miller/Howard Investments (“Miller/Howard”) recognizes, as a matter of policy and as a fiduciary to our clients, that proxy voting is a valuable right of shareholders. Proxy voting is one of the best ways for an investor to communicate to a company his or her opinions on management’s policies. Miller/Howard supports voting proxies consistent with our financial, social, and environmental objectives. For more information regarding these objectives, please refer to our ESG Investment Policy.
Each proxy season, in addition to the “standard” issues placed on the ballot by management, there may be a number of other important issues put forward by shareholders in the form of shareholder resolutions. Shareholder resolutions can cover a wide range of issues, such as environmental performance, workplace diversity, sustainability reporting, genetically modified foods, labor standards, and management transparency. We actively support resolutions that target labor issues, human rights, compensation, and also those that decrease emissions and increase renewable energy sources. The primary goal of the shareholder resolution process is to engage management in a dialogue. We support the right of both shareholders and stakeholders to pursue such discussions.
PROXY ADMINISTRATION
In January 2008, Miller/Howard enlisted the help of Broadridge Financial Solutions, Inc. (“Broadridge”) to administer electronic proxy voting. By using Broadridge to administer our voting, Miller/Howard is capable of customizing proxy reports, ballot recommendations, and research tools. Because the issues related to proxy voting are complex and directly impact investment values, we have chosen Broadridge to facilitate voting ESG recommendations as provided by Glass Lewis & Company (“Glass Lewis”).
Generally, Miller/Howard will vote in accordance with Glass Lewis’s ESG proxy voting guidelines. When issues arise outside of the ESG scope, we vote in accordance with Glass Lewis’s Proxy Paper Guidelines. Where Miller/Howard determines, however, that voting in such a manner would not be in the best interest of clients, Miller/Howard will vote differently.
If there is a conflict of interest on any management or shareholder proposal, the conflict will be reviewed on a case-by-case basis and voted in a manner that is in the best interest of clients.
Proxy voting responsibility will be determined at the opening of all new client relationships. For those clients who have retained proxy-voting authority, Miller/Howard has no responsibility to receive, vote, or otherwise advise voting.
Miller/Howard maintains relevant records, through EDGAR and Broadridge, including but not limited to, proxy reconciliation, ballots and research reports. Clients can receive a history of our proxy voting record upon request.
LIMITATIONS
Miller/Howard will generally vote on all proxies it receives. However, Miller/Howard may refrain from voting a proxy if the shares are no longer held by the client at the time of the meeting. Unsupervised securities, or securities held below the line, will also be excluded.
ANNUAL REVIEW OF PROXY POLICY
On an annual basis, Miller/Howard will amend or update, as necessary, to remain consistent and current with our proxy practices. Client interests, compliance, and regulatory requirements will be reviewed and addressed.
DISCLOSURE
Miller/Howard discloses a summary of our proxy voting policy in our Form ADV Part 2.
PROXY VOTING GUIDELINES
When voting proxies, Miller/Howard looks at each company independently. We apply our ESG criteria as voting guidelines, and generally vote in accordance with Glass Lewis recommendations. However, we review each issue on the proxy ballet and vote on a case-by-case basis.
Management
Miller/Howard supports management proposals on a case-by-case review. In the past, we have voted to support the following shareholder proposals with regard to management issues:
| • | Support for disclosure of budgets dedicated to public policy lobbying activities |
| • | Support for independent board member with environmental expertise |
| • | Approval of Risk Compensation Incentive Plan |
| • | Proposals to Approve Executive Compensation-We look for the following principles to guide the design and administration of those compensation programs: |
| | |
| | • | Strong link between pay and performance |
| | • | Executives’ ‘interests should be aligned with stockholders’ interests |
| | • | Programs should reinforce business strategies and drive long-term sustained stockholder value |
| | | |
If there is an indication that the compensation program is not in best interests of shareholders or if there is not a strong link between pay and performance Miller/Howard will not support the proposal.
Miller/Howard will not support excessive bonus compensation.
Environment
Miller/Howard supports environmental proposals on a case-by-case basis. Shareholder resolutions we have supported in the past include the following:
| • | Annual sustainability reporting - including reporting by suppliers to strengthen the company’s ability to assess its suppliers’ performance |
| • | Greenhouse gas emissions - company disclosure regarding emissions from their operations and products |
| • | Water supply - company disclosure on dependency or preparation of reports pertaining to sustainable water supplies for operations |
| • | Hydraulic fracturing impacts - disclosure of chemicals, emissions, recycling/management of water, reporting/disclosure on operations, community impacts |
| • | Mountaintop removal impacts - reduction of environmental and health hazards associated with mining operations |
| • | Coal ash - reduction of environmental and health hazards associated with coal combustion waste ponds, impoundments and mines |
| • | Sustainable palm oil sourcing |
| • | Sustainable forestry |
| • | Support for energy efficiency and renewable energy |
| | |
Human Rights
Miller/Howard votes in support of shareholders resolutions with regard to human rights:
| • | Support workplace safety, and human and worker rights, using internationally recognized standards, indicators and measurement protocols |
| | |
Animals
Miller/Howard votes in support of shareholder resolutions with regard to ethical treatment of animals:
| • | Support for ethical/humane treatment of animals |
| • | Support for alternatives to animal testing |
Sands Capital Management, LLC
Most Recent Amendment: March 2015
Implementation Date: November 2006
Issue
Rule 206(4)-6 under the Advisers Act requires every registered investment adviser to adopt and implement written policies and procedures, reasonably designed to ensure that the adviser votes proxies in the best interest of its clients. The procedures must address material conflicts that may arise in connection with proxy voting. The Rule further requires the adviser to provide a concise summary of the adviser’s proxy voting process and offer to provide copies of the complete proxy voting policy and procedures to clients upon request. Lastly, the Rule requires that the adviser disclose to clients how they may obtain information on how the adviser voted their proxies.
SCM votes proxies for a significant number of its clients, and therefore has adopted and implemented this Proxy Voting Policy and Procedures.
Policy
It is the policy of SCM to vote client proxies in the best interest of our clients. Proxies are an asset of a client account, which should be treated by SCM with the same care, diligence, and loyalty as any asset belonging to a client. Consideration will be given to both the short and long term implications of each proposal to be voted on. In voting proxies, we typically are neither an activist in corporate governance nor an automatic supporter of management. However, because SCM believes that the management teams of most companies it invests in generally seek to serve shareholder interests, SCM believes that voting proxy proposals in the client’s best economic interests usually means voting with the recommendations of these management teams. Any specific voting instructions provided by an advisory client or its designated agent in writing will supersede this policy. Clients with their own general or specific proxy voting and governance policies may wish to have their proxies voted by an independent third party or other named fiduciary or agent, at the client’s expense.
Proxy Committee
SCM has established a Proxy Committee. The Proxy Committee consists of two permanent members, the Chief Administrative Officer (“CAO”) and Chief Compliance Officer (“CCO”), and one or more rotating members from the Investment Research Team (“Research Team”). The Proxy Committee meets at least annually and as necessary to fulfill its responsibilities. A majority of the members of the Proxy Committee constitutes a quorum for the transaction of business. The CAO acts as secretary of the Proxy Committee and maintains a record of Proxy Committee meetings and actions.
The Proxy Committee is responsible for (i) the oversight and administration of proxy voting on behalf of SCM’s clients, including developing, authorizing, implementing and updating this Proxy Voting Policy and Procedures; (ii) overseeing the proxy voting process; and (iii) engaging and overseeing any third-party service provider as voting agent to receive proxy statements and/or to provide information, research or other services intended to facilitate the proxy voting decisions made by SCM. The Proxy Committee reviews reports on SCM’s proxy voting activity at least annually, and as necessary, to fulfill its responsibilities.
The Proxy Committee has developed a set of criteria for evaluating proxy issues. These criteria and general voting guidelines are set forth in SCM’s Proxy Voting Guidelines (the “Guidelines”), a copy of which is attached hereto as Attachment A. The Proxy Committee may amend or supplement the Guidelines from time to time. All Guidelines are to be applied generally and not absolutely, such that the evaluation of each proposal will be performed in the context of the Guidelines giving appropriate consideration to the circumstances of the company whose proxy is being voted.
Procedures for Identification and Voting of Proxies
The following procedures are designed to enable SCM to resolve material conflicts of interest before voting client proxies.
| | 1. | SCM maintains a list of all clients for which it votes proxies. The list may be maintained either in hard copy or electronically, and is updated by the Portfolio Administration Team who obtains proxy voting information from client agreements or internal account onboarding documentation. |
| | | |
| | 2. | As part of the account opening procedure, the Portfolio Administration Team will note whether or not SCM is responsible for voting proxies for the new client. |
| | | |
| | 3. | In cases where it has been designated to vote client proxies, SCM, through its Portfolio Administration and Client Service Teams, will work with the client to ensure that SCM is the designated party to receive proxy voting materials from companies or intermediaries. |
| | | |
| | 4. | The CAO, through a proxy voting designee working as a proxy administrator, receives all proxy voting materials and has overall responsibility for ensuring that proxies are voted and submitted in a timely manner. |
| | | |
| | 5. | SCM’s Research Team is responsible for reviewing proxy proposals for portfolio securities. Prior to a proxy voting deadline, the appropriate Research Team member will make a determination as how to vote each proxy proposal based on his or her analysis of the proposal and the Guidelines. In evaluating a proxy proposal, a Research Team member may consider information from a number of sources, including management of the company, shareholder groups and independent proxy research services. |
| | | |
| | 6. | SCM Staff Members will reasonably try to assess whether there are any material conflicts between SCM’s interests and those of its clients with respect to proxy voting by considering the situations identified in the Conflicts of Interest section of this document. |
| | | |
| | 7. | So long as no material conflicts of interest have been identified, SCM will vote proxies according to SCM’s policy. SCM may also elect not to vote if it deems doing so in its clients’ best interest. (See #8 and Proxies of Certain Non-U.S. Issuers below.) The rationale for not voting a client proxy will be documented and the documentation will be maintained in SCM’s permanent files. |
| | | |
| | 8. | Upon detection of a conflict of interest, the conflict will be brought to the attention of the Proxy Committee for resolution. See Conflicts of Interest section for additional information. |
| | | |
| | 9. | SCM is not required to vote every client proxy provided that electing not to vote is consistent with SCM’s fiduciary obligations. SCM shall at no time ignore or neglect its proxy voting responsibilities. However, there may be times when refraining from voting is in the client’s best interest, such as when an analysis of a particular client proxy reveals that the cost of voting the proxy may exceed the expected benefit to the client. See Proxies of Certain Non-U.S. Issuers below. |
| | | |
| | 10. | SCM may process certain proxies without voting them or may systematically vote with management. Examples include, without limitation, proxies issued by companies SCM has decided to sell, proxies issued for securities that SCM did not select for a client portfolio, such as, securities that were selected by a previous adviser, unsupervised or non-managed securities held in a client’s custody account, money market securities, or other securities selected by clients or their representatives other than SCM. |
| | | |
| | 11. | In the event that SCM votes the same proxy in two directions, it shall maintain documentation to support its voting (this may occur if a client requires SCM to vote a certain way on an issue, while SCM deems it beneficial to vote in the opposite direction for its other clients) in SCM’s permanent files. |
| | | |
| | 12. | The CAO and the Research Team member will report any attempts by SCM’s personnel to influence the voting of client proxies in a manner that is inconsistent with SCM’s policy, as well as any attempts by persons or |
| | | entities outside SCM seeking to influence the voting of client proxies. Such report shall be made to SCM’s CCO, or if the CCO is the person attempting to influence the voting, then to SCM’s General Counsel. |
| | | |
| | 13. | All proxy votes will be recorded and the following information will be maintained: |
| | | • | The name of the issuer of the portfolio security; |
| | | • | The exchange ticker symbol of the portfolio security; |
| | | • | The Council on Uniform Securities Identification Procedures (“CUSIP”) number for the portfolio security; |
| | | • | The shareholder meeting date; |
| | | • | The number of shares SCM is voting firm-wide; |
| | | • | A brief identification of the matter voted on; |
| | | • | Whether the matter was proposed by the issuer or by a security holder; |
| | | • | Whether or not SCM cast its vote on the matter; |
| | | • | How SCM cast its vote (e.g., for or against proposal, or abstain; for or withhold regarding election of directors); |
| | | • | Whether SCM cast its vote with or against management; and |
| | | • | Whether any client requested an alternative vote of its proxy. |
Loaned Securities
When an SCM client participates in a securities lending program, SCM will not be able to vote the proxy of the shares out on loan. SCM will generally not seek to recall for voting the client shares on loan. However, under rare circumstances, for voting issues that may have a particularly significant impact on the investment, SCM may request a client to recall securities that are on loan if we determine that the benefit of voting outweighs the costs and lost revenue to the client and the administrative burden of retrieving the securities. The Research Team member who is responsible for voting the proxy will notify the Proxy Committee in the event they believe a recall of loaned securities is necessary.
In determining whether a recall of a security is warranted (“Significant Event”), SCM will take into consideration whether the benefit of the vote would be in the client’s best interest despite the costs and the lost revenue to the client and the administrative burden of retrieving the securities. SCM may utilize third-party service providers to assist it in identifying and evaluating whether an event constitutes a Significant Event. The Proxy Committee will review the proxy proposals that have been determined to be Significant Events from time to time and will adjust the foregoing standard as it deems necessary.
Proxies of Certain Non-U.S. Issuers
It is SCM’s policy to seek to vote all proxies for securities held in client accounts for which we have proxy voting authority where SCM can reasonably determine that voting such proxies will be in the best interest of its clients.
Voting proxies of issuers in non-US markets may give rise to a number of administrative/operational issues that may cause SCM to determine that voting such proxies are not in the best interest of its clients or that it is not reasonably possible to determine whether voting such proxies will be in the best interests of its clients. While not exhaustive, the following list of considerations highlights some potential instances in which a proxy vote might not be entered.
| • | SCM may receive meeting notices without enough time to fully consider the proxy or after the cut-off date for voting. |
| | | |
| | • | Some markets require SCM to provide local agents with a power of attorney or consularization prior to implementing SCM’s voting instructions. |
| | | |
| | • | Proxy material may not be available in English. |
| | • | SCM may be unable to enter an informed vote in certain circumstances due to the lack of information provided in the proxy statement or by the issuer or other resolution sponsor, and may not vote in those instances. |
| | | |
| | • | Proxy voting in certain countries requires “share blocking.” Shareholders wishing to vote their proxies must deposit their shares shortly before the date of the meeting with a designated depositary. During this blocking period, shares that will be voted at the meeting cannot be sold until the meeting has taken place and the shares are returned to the clients’ custodian banks. Absent compelling reasons to the contrary, SCM believes that the benefit to the client of exercising the vote is outweighed by the cost of voting (i.e., not being able to sell the shares during this period). Accordingly, if share blocking is required SCM generally elects not to vote those shares. The Research Team member in conjunction with the Proxy Committee retains the final authority to determine whether to block the shares in the client’s portfolio or to pass on voting the meeting. |
Conflicts of Interest
Although SCM has not currently identified any material conflicts of interest that would affect its proxy voting decisions, it is aware of the following potential conflicts that could exist in the future:
| | • | Conflict: SCM is retained by a firm, or is in the process of being retained by a firm, which is affiliated with an issuer that is held in SCM’s client portfolios; |
| | | |
| | • | Conflict: SCM is retained by an individual, or is in the process of being retained by an individual, who is an officer or director of an issuer that is held in SCM’s client portfolios; |
| | | |
| | • | Conflict: SCM’s Staff Members maintain a personal and/or business relationship (not an advisory relationship) with issuers or individuals that serve as officers or directors of issuers. For example, the spouse of an SCM Staff Member may be a high-level executive of an issuer that is held in SCM’s client portfolios. The spouse could attempt to influence SCM to vote in favor of management; and |
| | | |
| | • | Conflict: SCM or a Staff Member(s) personally owns a significant number of an issuer’s securities that are also held in SCM’s client portfolios. The Staff Member(s) may seek to vote proxies in a different direction for his/her personal holdings than would otherwise be warranted by SCM’s policy. The Staff Member(s) could oppose voting the proxies according to the policy and successfully influence SCM to vote proxies in contradiction to the policy. |
Resolution:
SCM realizes that, due to the difficulty of predicting and identifying all material conflicts, it must rely on its Staff Members to notify the CAO and/or the CCO of any material conflict that may impair SCM’s ability to vote proxies in an objective manner. Upon such notification, the CAO and/or the CCO will notify the Proxy Committee of the conflict.
In the event that the Proxy Committee determines that SCM has a conflict of interest with respect to a proxy proposal, the Proxy Committee shall also determine whether the conflict is “material” to that proposal. The Proxy Committee may determine on a case-by-case basis that a particular proposal does not involve a material conflict of interest. To make this determination, the Proxy Committee must conclude that the proposal is not directly related to SCM’s conflict with the issuer. If the Proxy Committee determines that a conflict is not material, then SCM may vote the proxy in accordance with the recommendation of the Research Team member.
In the event that the Proxy Committee determines that SCM has a material conflict of interest with respect to a proxy proposal, SCM will vote on the proposal in accordance with the determination of the Proxy Committee. Prior to voting on the proposal, SCM may (i) contact an independent third party (such as another plan fiduciary) to recommend how to vote on the proposal and vote in accordance with the recommendation of such third party (or have the third party vote such proxy); or (ii) with respect to client accounts that are not subject to ERISA, fully disclose the nature of the
conflict to the client and obtain the client’s consent as to how SCM will vote on the proposal (or otherwise obtain instructions from the client as to how to vote the proxy).
Recordkeeping
SCM must maintain the documentation described in the following section for a period of not less than five (5) years in an easily accessible place, the first two (2) years at its principal place of business. The CAO will be responsible for the following procedures and for ensuring that the required documentation is retained.
Client request to review proxy votes:
| | • | Any request, whether written (including e-mail) or oral, received by any Staff Member of SCM, must be promptly reported to the CAO. All written requests must be retained in the permanent file. |
| | | |
| | • | The CAO or designee will record the identity of the client, the date of the request, and the disposition (e.g., provided a written or oral response to client’s request, referred to third party, not a proxy voting client, other dispositions, etc.) in a suitable place. |
| | | |
| | • | Clients are permitted to request the proxy voting record for the 5-year period prior to their request. |
Proxy statements received regarding client securities:
| | • | Upon receipt of a proxy, copy or print a sample of the proxy statement or card and maintain the copy in a central file along with a sample of the proxy solicitation instructions. |
Note: SCM is permitted to rely on proxy statements filed on the SEC’s EDGAR system instead of keeping its own copies.
Proxy voting records:
| | • | Documents prepared or created by SCM that were material to making a decision on how to vote, or that memorialized the basis for the decision. |
| | | |
| | • | Documentation or notes or any communications received from third parties, other industry analysts, third-party service providers, company’s management discussions, etc. that were material in the basis for the decision. |
Disclosure
| | • | SCM will ensure that Part 2A of Form ADV is updated as necessary to reflect: (i) all material changes to the Proxy Voting Policy and Procedures; and (ii) information about how clients may obtain information on how SCM voted their securities. |
Proxy Solicitation
As a matter of practice, it is SCM’s policy to not reveal or disclose to any outside third party how SCM may have voted (or intends to vote) on a particular proxy until after such proxies have been counted at a shareholder’s meeting.
The CAO is to be promptly informed of the receipt of any solicitation from any person to vote proxies on behalf of clients. At no time may any Staff Member accept any remuneration in the solicitation of proxies. The CAO or a designee shall handle all responses to such solicitations.
Procedures for SCM’s Receipt of Class Actions
The following procedures outline SCM’s receipt of “Class Action” documents from clients and custodians:
SCM will not file “Class Actions” on behalf of any client. If “Class Action” documents are received by SCM from a client’s custodian, SCM will make a best effort to forward the documents to the client. Likewise if “Class Action” documents are received by SCM from a client, SCM will make a best effort to gather, at the client’s request, any
requisite information it has regarding the matter and forward it to the client, to enable the client to file the “Class Action.”
Responsibility
The CAO is responsible for overseeing and implementing this Proxy Voting Policy and Procedures.
TSF-56-TFGT-SAI-1701
| | | | | |
| | | | September 30, 2016 | |
| | | | | |
| | | | | |
| | Annual Report | | |
| | | | | |
| | | | | |
| | | |
| | | |
| | Touchstone Funds Group Trust Touchstone Arbitrage Fund Touchstone Emerging Markets Small Cap Fund (formerly known as Touchstone Emerging Markets Equity Fund) Touchstone Merger Arbitrage Fund Touchstone Mid Cap Fund Touchstone Mid Cap Value Fund Touchstone Premium Yield Equity Fund Touchstone Sands Capital Select Growth Fund Touchstone Small Cap Fund Touchstone Small Cap Value Fund Touchstone Total Return Bond Fund Touchstone Ultra Short Duration Fixed Income Fund | |
| | | |
| | | |
| | | |
| |  | |
This report identifies the Funds’ investments on September 30, 2016. These holdings are subject to change. Not all investments in each Fund performed the same, nor is there any guarantee that these investments will perform as well in the future. Market forecasts provided in this report may not occur.
2
| Letter from the President | |
Dear Fellow Shareholder:
We are pleased to provide you with the Touchstone Funds Group Trust Annual Report. Inside you will find key financial information, as well as manager commentaries, for the 12 months ended September 30, 2016.
The fiscal year was eventful and featured the U.S. Federal Reserve Board’s (Fed’s) first interest rate hike in a decade, volatility in energy and commodity prices and the United Kingdom’s (U.K.’s) historic decision to leave the European Union (an action dubbed “Brexit”). The U.S. economy maintained its moderate but steady growth. Strong gains in the labor market buoyed consumer confidence and spending, but overall GDP growth was restrained by continued weakness in business investment. Outside of the U.S., the economic landscape was less positive. Growth in Europe and Japan remained anemic despite monetary policy intervention from central banks. Investor concern over a slowdown in China’s economy led to further declines in commodity prices, weakness for emerging markets and increased volatility in capital markets during late 2015 and early 2016.
Dovish statements by the Fed and an apparent bottoming in commodity prices proved to be an inflection point for risk assets. From mid-February to the end of the fiscal year, markets enjoyed a broad rally, powering through the U.K.’s Brexit vote in late June and uncertainty surrounding the U.S. presidential election. Equities recaptured ground lost during the sell-off of early 2016 and ended with positive returns for the fiscal year. Though emerging and non-U.S. developed stocks posted gains, they lagged the U.S. market, perhaps reflecting the relatively greater strength of the U.S. economy.
Bond markets also enjoyed solid gains during the fiscal year. The Fed raised interest rates in December 2015, but thereafter maintained a dovish stance toward the pace of future rate hikes. Along with continued quantitative easing in Europe and Japan, this drove interest rates to historic lows and left trillions of dollars of bonds with negative yields. Credit spreads widened in the first half of the fiscal year, but as risk assets gained momentum in February, corporate bonds outperformed Treasuries. Desperately seeking income in a world of ultra-low interest rates, investors flocked to the additional yield of non-investment grade bonds in particular, generating strong gains for High Yield bonds.
For so many investors, an appropriate investment horizon is measured in years or decades, rather than weeks or months. Our belief is that achieving such distant goals requires a similarly long-term approach to investing. Unfortunately, this long-term mentality can easily be sidetracked by the powerful emotions that accompany short-term market movements. Working with a financial advisor can help investors commit to a disciplined approach across market cycles in an effort to reach their ultimate investing goals.
We appreciate the opportunity to be part of your investment plan both today and in the years ahead.
Sincerely,

Jill T. McGruder
President
Touchstone Funds Group Trust
3
| | Management’s Discussion of Fund Performance (Unaudited) |
Touchstone Arbitrage Fund
Sub-Advised by Longfellow Investment Management Co.
Investment Philosophy
The Touchstone Arbitrage Fund seeks to achieve positive absolute returns regardless of market conditions over the long term by investing primarily in securities of companies that are involved in publicly announced mergers, takeover, tender offers, debt restructurings, minority purchases, leveraged buyouts, spin-offs, liquidations and other corporate reorganizations.
Fund Performance
The Touchstone Arbitrage Fund (Class A Shares) outperformed its benchmark, the BofA Merrill Lynch 3-Month U.S. Treasury Bill Index, for the 12-month period ended September 30, 2016. The Fund’s total return was 5.61 percent (excluding the maximum sales charge) while the benchmark’s total return was 0.27 percent.
Market Environment
The prior 12 months have been marked by a continuation of strong gains across risk assets. Given uncertainties surrounding the macro environment, the market remained prone to short-lived bouts of elevated volatility. This was exhibited in the commodity-related declines in October and November 2015, the market’s early 2016 sell-off following the December 2015 rate increase and a short-lived sell-off tied to Brexit (Britain’s exit from the European Union) in June 2016.
The market rallied into the third quarter in September of calendar year 2016 following a short-lived spike in volatility in the aftermath of the U.K.’s Brexit referendum. Risk-assets led the way during this period with notable outperformance from small-cap equities relative to larger capitalization stocks. Macro headlines continued to be dominated by the “will they or won’t they” debate around the direction in U.S. interest rates along with the upcoming Presidential election. After the U.S. Federal Reserve Board (Fed) remained on hold in its September meeting, Chairwoman Yellen’s press conference and subsequent Fed Governor speeches seemed to set the table for a potential rate increase in either the November or December meetings. Even with such a hike, the Fed’s expectations for the path of future interest rates continued to move lower and suggests a very moderate tightening cycle in the years ahead.
After excluding deal outliers (e.g., regulatory uncertainty, antitrust concerns, financing issues), we do not see a broad dispersion of annualized spreads across sectors. In terms of deal activity, pockets of regional banks, semiconductors and biotechnology were the busiest industries in the Fund’s investable universe. Though the number of deals initiated remains low, the overall dollar volume of deals continued to be at relatively elevated levels. Mega-cap deals have re-emerged as financing availability remains robust. We continued to see strategic buyers entering the market driven by the blend of synergy opportunities and low financing costs.
Portfolio Review
Though macro trends contributed to the performance of the broader equity markets, they did not have a discernible impact on the Fund over the last year. Rates remained near all-time lows, though they have risen off of their post-Brexit bottom. That said, this slight increase in yields has not yet driven deal spreads higher. The Fund was not invested in any broken deals during its fiscal year, avoiding high profile terminations such as Baker Hughes Inc./Halliburton Co., Pfizer Inc./Allergan PLC and Office Depot Inc./Staples Inc.
While the strategy positioning is constantly in flux due to new deals being added and completed deals being removed, there were no significant changes to the overall positioning of the Fund. The Fund participated in 129 new deals and had 118 deals close during the year.
4
| Management’s Discussion of Fund Performance (Unaudited) (Continued) | |
The Fund benefitted from the announcement of a definitive merger agreement that called for American Financial Group Inc. (AFG) to acquire all of the outstanding common shares of National Interstate Corp. that were not currently owned by AFG’s subsidiary, Great American Insurance Company (GAIC). American Financial Group’s protracted pursuit of National Interstate stretches back to 2014, but appears to be on target for a closing sometime before the end of 2016.
The Fund also enjoyed a tailwind from the bidding war that erupted between Anbang Insurance Group Co. Ltd. and Marriott International Inc. as they battled to gain control of Starwood Hotels & Resorts Worldwide Inc. Marriott emerged as the eventual winner towards the end of 2015, and this deal closed in September of 2016.
Shire PLC completed its acquisition of Baxalta Inc., which benefited the Fund. With the deal closing, the combined company created the leading global biotechnology company focused on serving patients with rare diseases and other highly specialized conditions. The deal spread remained wide throughout the first half of calendar year 2016 based on the fear that potential government intervention on the taxation rules for spin-offs would cause the deal to fall apart. This never came to pass, and the merger closed as expected in June.
During the second quarter of fiscal year 2016, Cvent Inc. announced a definitive agreement to be acquired by Vista Equity Partners LLC. The deal spread widened in the third quarter after Cvent Inc. received a request for additional information from the Department of Justice. Given Vista’s ownership of Lanyon Solutions Inc., the approach for Cvent raises potential anti-trust issues, but we believe the deal will ultimately pass regulatory scrutiny and the Fund remains invested in the position.
In a continuing saga, Abbott Laboratories’ acquisition of Alere, Inc. was delayed due to Alere’s postponed annual report submission to the U.S. Securities and Exchange Commission (SEC) and the receipt of a subpoena from the Department of Justice related to sales practices that raise questions about U.S. Foreign Corrupt Practices Act violations. Abbott was aware of the investigation in advance of its pursuit of Alere, and we do not expect this to constitute a material adverse clause or to ultimately disrupt the completion of the deal. Additionally, Abbott has been slow to obtain anti-trust approval, prompting Alere to seek a court order that would compel Abbott to seek antitrust clearances ahead of the April 2017 expiration of the merger agreement. While the deal spread widened during the course of the fiscal year, we believe that this widening will reverse ahead of a 2017 deal close.
Lam Research Corp. and KLA-Tencor Corp.’s deal to merge came under fire from various regulatory bodies including China, South Korea and the Department of Justice in the United States. Both companies are involved in the semiconductor industry and, after its recent rulings, the Department of Justice appears to be indicating that it is not in favor of further consolidation in this industry. We believe that, while the risks to the deal remain high, the deal spread has widened to reflect the risk, leaving little additional downside to a deal break.
Outlook
Historically low short-term interest rates have depressed deal spreads and will continue to act as a headwind to the merger arbitrage strategy. Reflecting this low rate environment, spreads remain broadly in a mid-single digit range on an annualized basis, but we believe have the potential to increase should the Fed start to normalize interest rates.
However, we remain confident that the Fund’s strategy offers an attractive risk-reward profile over an entire market cycle. Historically, we have found that there has been a positive correlation between year-over-year gains in the S&P 500® Index and subsequent deal activity over the following one to two quarters. We believe this relationship should support an increase in deal activity during the fourth quarter of 2016 and into 2017. Additional environmental factors such as ample access to capital, slow global growth and strong corporate balance
5
| | Management’s Discussion of Fund Performance (Unaudited) (Continued) |
sheets are expected to further support incremental strategic merger & acquisition (M&A) activity. On balance, we see a backdrop that remains supportive for continued deal activity.
Overall, we believe the Fund is well positioned to provide positive absolute returns, low realized volatility and low sensitivity to underlying price movements within the broader equity market. The Fund’s allocation is focused on maximizing the portfolio’s return while remaining nimble as new opportunities become available. We remain opportunistic about putting incremental capital to work should deal spreads widen on the back of heightened macro-economic uncertainty or if attractive entry-points arise in the Fund’s deal universe for other reasons. We continue to believe that the strategy offers an attractive risk-reward profile and serves as a valuable diversification tool. We also believe the idiosyncratic nature of each of the positions in the Fund creates a portfolio with a low overall correlation to the broad equity and fixed income indices.
6
| Management’s Discussion of Fund Performance (Unaudited) (Continued) | |
Comparison of the Change in Value of a $10,000 Investment in the
Touchstone Arbitrage Fund - Class A* and the
BofA Merrill Lynch 3-Month U.S. Treasury Bill Index
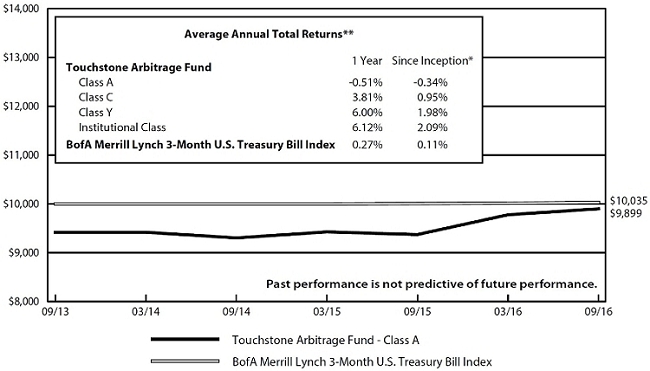
| * | The chart above represents performance of Class A shares only, which will vary from the performance of Class C shares, Class Y shares and Institutional Class shares based on the differences in sales loads and fees paid by shareholders in the different classes. The inception date of the Fund was September 30, 2013. The returns of the index listed above are based on the inception date of the Fund. | |
| | | |
| ** | The average annual total returns shown above are adjusted for maximum sales loads and fees, if applicable. The maximum offering price per share of Class A shares is equal to the net assets value (“NAV”) per share plus a sales load equal to 6.10% of the NAV (or 5.75% of the offering price). Class C shares are subject to a contingent deferred sales charge (“CDSC”) of 1.00%. The CDSC will be assessed on an amount equal to the lesser of (1) the NAV at the time of purchase of the shares being redeemed or (2) the NAV of such shares being redeemed, if redeemed within a one-year period from the date of purchase. Class Y shares and Institutional Class shares are not subject to sales charges. | |
The performance of the above Fund does not reflect the deduction of taxes that a shareholder would pay on Fund distributions or the redemption of Fund shares.
Note To Chart
BofA Merrill Lynch 3-Month U.S. Treasury Bill Index is an unmanaged index of Treasury securities maturing in 90 days that assumes reinvestment of all income.
7
| | Management’s Discussion of Fund Performance (Unaudited) |
Touchstone Emerging Markets Small Cap Fund
Sub-Advised by Copper Rock Capital Partners LLC
On April 19, 2016, Copper Rock was appointed sub-advisor to the Touchstone Emerging Markets Equity Fund. Concurrent with this change, the Fund was renamed the Touchstone Emerging Markets Small Cap Fund and its Principal Investment Strategies, Principal Risks and benchmark index were changed.
Investment Philosophy
The Touchstone Emerging Markets Small Cap Fund seeks capital appreciation by primarily investing in equity securities of emerging markets small-cap companies diversified across sectors and industries. The Fund’s investment process seeks to add value through bottom-up stock selection and in-depth fundamental research and searches for companies believed to have strong management, superior earnings growth prospects and attractive relative valuations.
Fund Performance
The Touchstone Emerging Markets Small Cap Fund (Class A Shares) underperformed its benchmarks, the MSCI Emerging Markets Small Cap Index and the MSCI Emerging Markets Index, for the 12-month period ended September 30, 2016. The Fund’s total return was 10.01 percent (calculated excluding the maximum sales charge) while the total returns of its benchmarks were 12.65 percent and 16.78 percent, respectively.
Market Environment
After the markets posted generally positive results during the final quarter of 2015, strong market movements resulting from a combination of macroeconomic concerns characterized the first quarter of 2016. While the overarching themes were slowing global growth, volatile oil prices, poor holiday retail sales and a lack of consumer confidence, the quarter could be divided into two distinct periods of performance. During the first half of the quarter, investor fears led to a severe sell-off which had a negative effect across broad market capitalizations, but was even more pronounced within the small-cap space. The latter part of the quarter was marked by a sharp rally, which was led by the mining and metals industries as well as oil and value equities. Positive U.S. economic indicators – including labor force participation and employment data – along with renewed confidence in the U.S. and European capital markets helped support the recovery.
The second quarter of 2016 began with the continued recovery in oil and mining stocks. In April and May, sovereign interest rates within the developed markets declined with some rates moving into negative territory. In May, global capital markets began to behave more normally as stock prices followed earnings and strong fundamentals. In June, performance was mixed again and the market was indiscriminate in what it rewarded. The month also presented a myriad of political events including Britain’s vote to exit the European Union (Brexit), the second-round elections in Spain and early positioning for general elections in the U.S., France and Germany. These events also introduced electoral sentiment that was increasingly important to the market. Late in the quarter, equity markets were volatile and mixed leading up to Brexit, which quickly extended to other markets as investors grew concerned about a renewed slowdown in global trade and a downtick in credit quality. Although Brexit created a mostly negative outlook for the United Kingdom (U.K.) and its major trading partners, it was modestly positive for emerging markets.
During the third quarter of 2016, an array of factors helped drive the positive turnaround in emerging market equities. In particular, there was resurgence in China’s gross domestic product as the country’s conversion to a services economy was reconfirmed and propelled by the increase in discretionary spending. Commodity prices also increased, which benefited emerging market commodity exporters. Furthermore, several governments repaired their balance sheets, and Brazil’s market in particular benefited modestly from a presidential change. Finally, the U.S. Federal Reserve Board’s decision to delay an interest rate increase on the heels of the U.K.’s referendum
8
| Management’s Discussion of Fund Performance (Unaudited) (Continued) | |
to exit the European Union, as well as slow overall growth in the U.S. and abroad, were positive catalysts for emerging markets during the quarter.
Portfolio Review
During the year, the Fund’s allocations to stocks in China, Brazil and Taiwan were the largest contributors to performance by country. At the sector level, the Fund’s performance benefited most from the Financials, Information Technology and Energy sectors. The Health Care sector was the lone detractor while the Industrials and Telecommunications Services sectors were among the laggards. Among stocks, Geely Automobile Holdings Ltd. (Consumer Discretionary sector), Sunny Optical Technology (Group) Company Ltd. (Information Technology sector) and Elite Material Company Ltd. (Information Technology sector) made the biggest positive contributions. The largest detracting stocks included BNK Financial Group Inc. (Financials sector), Eclat Textile Company Ltd. (Consumer Discretionary sector) and Chlitina Holding Ltd. (Consumer Staples sector).
Outlook
Emerging market equities have benefited from the rather dovish policy on interest rates in the U.S. and around the globe, as we continue to see negative rates in many of the major developed markets. Low interest rates have helped countries repair balance sheets and drive reinvestment, but many countries continue to face traditional emerging market risks, such as currency, macroeconomic and political risks. While these types of risks are inherent to investing in emerging markets, the small-cap segment of the market remains generally more immune to these risks than the large-cap segment. As such, we seek high-quality, attractively valued companies that have been overlooked and, more importantly, can grow within their local economies as market leaders.
9
| | Management’s Discussion of Fund Performance (Unaudited) (Continued) |
Comparison of the Change in Value of a $10,000 Investment in the
Touchstone Emerging Markets Small Cap Fund - Class A*, the
MSCI Emerging Markets Small Cap Index and the
MSCI Emerging Markets Index

| | * | The chart above represents performance of Class A shares only, which will vary from the performance of Class C shares, Class Y shares and Institutional Class shares based on the differences in sales loads and fees paid by shareholders in the different classes. The inception date of the Fund was September 30, 2009. The returns of the indexes listed above are based on the inception date of the Fund. |
| | | |
| | ** | The average annual total returns shown above are adjusted for maximum sales loads and fees, if applicable. The maximum offering price per share of Class A shares is equal to the net assets value (“NAV”) per share plus a sales load equal to 6.10% of the NAV (or 5.75% of the offering price). Class C shares are subject to a contingent deferred sales charge (“CDSC”) of 1.00% . The CDSC will be assessed on an amount equal to the lesser of (1) the NAV at the time of purchase of the shares being redeemed or (2) the NAV of such shares being redeemed, if redeemed within a one-year period from the date of purchase. Class Y shares and Institutional Class shares are not subject to sales charges. |
The performance of the above Fund does not reflect the deduction of taxes that a shareholder would pay on Fund distributions or the redemption of Fund shares.
Notes To Chart
MSCI Emerging Markets Small Cap Index is a free float-adjusted market capitalization index that is designed to measure equity market performance of small companies from emerging markets.
MSCI Emerging Markets Index is a free float-adjusted market capitalization index that is designed to measure equity market performance of emerging markets.
Source: MSCI. MSCI makes no express or implied warranties or representations and shall have no liability whatsoever with respect to any MSCI data contained herein. The MSCI data may not be further redistributed or used to create indices or financial products. This report is not approved or produced by MSCI.
10
| Management’s Discussion of Fund Performance (Unaudited) | |
Touchstone Merger Arbitrage Fund
Sub-Advised by Longfellow Investment Management Co.
Investment Philosophy
The Touchstone Merger Arbitrage Fund seeks to achieve positive absolute returns regardless of market conditions over the long term by investing primarily in securities of companies that are involved in publicly announced mergers and other corporate reorganizations. Merger arbitrage is an investment strategy that seeks to capture the “arbitrage spread” represented by the difference between the market price of the securities of the company being purchased and the value that is offered for these securities by the acquiring company. The Fund selects securities based on proposed financing terms, the size of the transaction, anti-trust concerns, regulatory approvals and shareholder voting requirements.
Fund Performance
The Touchstone Merger Arbitrage Fund (Class A Shares) outperformed its benchmark, the BofA Merrill Lynch 3-Month U.S. Treasury Bill Index, for the 12-month period ended September 30, 2016. The Fund’s total return was 4.37 percent (excluding the maximum sales charge) while the benchmark’s total return was 0.27 percent.
Market Environment
The prior 12 months have been marked by a continuation of strong gains across risk assets. Given uncertainties surrounding the macro environment, the market remained prone to short-lived bouts of elevated volatility. This was exhibited in the commodity-related declines in October and November 2015, the market’s early 2016 sell-off following the December 2015 rate increase and a short-lived sell-off tied to Brexit (Britain’s exit from the European Union) in June 2016.
The market rallied into the third quarter in September of calendar year 2016 following a short-lived spike in volatility in the aftermath of the U.K.’s Brexit referendum. Risk-assets led the way during this period with notable outperformance from small-cap equities relative to larger capitalization stocks. Macro headlines continued to be dominated by the “will they or won’t they” debate around the direction in U.S. interest rates along with the upcoming Presidential election. After the U.S. Federal Reserve Board (Fed) remained on hold in its September meeting, Chairwoman Yellen’s press conference and subsequent Fed Governor speeches seemed to set the table for a potential rate increase in either the November or December meetings. Even with such a hike, the Fed’s expectations for the path of future interest rates continued to move lower and suggests a very moderate tightening cycle in the years ahead.
After excluding deal outliers (e.g., regulatory uncertainty, antitrust concerns, financing issues), we do not see a broad dispersion of annualized spreads across sectors. In terms of deal activity, pockets of regional banks, semiconductors and biotechnology were the busiest industries in the Fund’s investable universe. Though the number of deals initiated remains low, the overall dollar volume of deals continued to be at relatively elevated levels. Mega-cap deals have re-emerged as financing availability remains robust. We continued to see strategic buyers entering the market driven by the blend of synergy opportunities and low financing costs.
Portfolio Review
Though macro trends contributed to the performance of the broader equity markets, they did not have a discernible impact on the Fund over the last year. Rates remained near all-time lows, though they have risen off of their post-Brexit bottom. That said, this slight increase in yields has not yet driven deal spreads higher. The Fund was not invested in any broken deals during its fiscal year, avoiding high profile terminations such as Baker Hughes Inc./Halliburton Co., Pfizer Inc./Allergan PLC and Office Depot Inc./Staples Inc. While the strategy
11
| | Management’s Discussion of Fund Performance (Unaudited) (Continued) |
positioning is constantly in flux due to new deals being added and completed deals being removed, there were no significant changes to the overall positioning of the Fund. The Fund participated in 145 new deals and had 133 deals close during the year.
The Fund benefitted from the announcement of a definitive merger agreement that called for American Financial Group Inc. (AFG) to acquire all of the outstanding common shares of National Interstate Corp. that were not currently owned by AFG’s subsidiary, Great American Insurance Company (GAIC). American Financial Group’s protracted pursuit of National Interstate stretches back to 2014, but appears to be on target for a closing sometime before the end of 2016.
The Fund also enjoyed a tailwind from the bidding war that erupted between Anbang Insurance Group Co. Ltd. and Marriott International Inc. as they battled to gain control of Starwood Hotels & Resorts Worldwide Inc. Marriott emerged as the eventual winner towards the end of 2015, and this deal closed in September of 2016.
Shire PLC completed its acquisition of Baxalta Inc., which benefited the Fund. With the deal closing, the combined company created the leading global biotechnology company focused on serving patients with rare diseases and other highly specialized conditions. The deal spread remained wide throughout the first half of calendar year 2016 based on the fear that potential government intervention on the taxation rules for spin-offs would cause the deal to fall apart. This never came to pass, and the merger closed as expected in June.
During the second quarter of fiscal year 2016, Cvent Inc. announced a definitive agreement to be acquired by Vista Equity Partners LLC. The deal spread widened in the third quarter after Cvent Inc. received a request for additional information from the Department of Justice. Given Vista’s ownership of Lanyon Solutions Inc., the approach for Cvent raises potential anti-trust issues, but we believe the deal will ultimately pass regulatory scrutiny and the Fund remains invested in the position.
In a continuing saga, Abbott Laboratories’ acquisition of Alere, Inc. was delayed due to Alere’s postponed annual report submission to the U.S. Securities and Exchange Commission (SEC) and the receipt of a subpoena from the Department of Justice related to sales practices that raise questions about U.S. Foreign Corrupt Practices Act violations. Abbott was aware of the investigation in advance of its pursuit of Alere, and we do not expect this to constitute a material adverse clause or to ultimately disrupt the completion of the deal. Additionally, Abbott has been slow to obtain anti-trust approval, prompting Alere to seek a court order that would compel Abbott to seek antitrust clearances ahead of the April 2017 expiration of the merger agreement. While the deal spread widened during the course of the fiscal year, we believe that this widening will reverse ahead of a 2017 deal close.
Lam Research Corp. and KLA-Tencor Corp.’s deal to merge came under fire from various regulatory bodies including China, South Korea and the Department of Justice in the United States. Both companies are involved in the semiconductor industry and, after its recent rulings, the Department of Justice appears to be indicating that it is not in favor of further consolidation in this industry. We believe that, while the risks to the deal remain high, the deal spread has widened to reflect the risk, leaving little additional downside to a deal break.
Outlook
Historically low short-term interest rates have depressed deal spreads and will continue to act as a headwind to the merger arbitrage strategy. Reflecting this low rate environment, spreads remain broadly in a mid-single digit range on an annualized basis, but we believe have the potential to increase should the Fed start to normalize interest rates.
However, we remain confident that the Fund’s strategy offers an attractive risk-reward profile over an entire market cycle. Historically, we have found that there has been a positive correlation between year-over-year
12
| Management’s Discussion of Fund Performance (Unaudited) (Continued) | |
gains in the S&P 500 Index and subsequent deal activity over the following one to two quarters. We believe this relationship should support an increase in deal activity during the fourth quarter of 2016 and into 2017. Additional environmental factors such as ample access to capital, slow global growth and strong corporate balance sheets are expected to further support incremental strategic merger & acquisition (M&A) activity. On balance, we see a backdrop that remains supportive for continued deal activity.
Overall, we believe the Fund is well positioned to provide positive absolute returns, low realized volatility and low sensitivity to underlying price movements within the broader equity market. The Fund’s allocation is focused on maximizing the portfolio’s return while remaining nimble as new opportunities become available. We remain opportunistic about putting incremental capital to work should deal spreads widen on the back of heightened macro-economic uncertainty or if attractive entry-points arise in the Fund’s deal universe for other reasons. We continue to believe that the strategy offers an attractive risk-reward profile and serves as a valuable diversification tool. We also believe the idiosyncratic nature of each of the positions in the Fund creates a portfolio with a low overall correlation to the broad equity and fixed income indices.
13
| | Management’s Discussion of Fund Performance (Unaudited) (Continued) |
Comparison of the Change in Value of a $10,000 Investment in the
Touchstone Merger Arbitrage Fund - Class A* and the
BofA Merrill Lynch 3-Month U.S. Treasury Bill Index
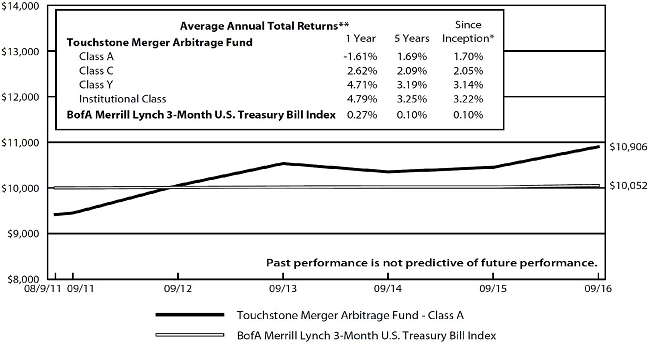
| | * | The chart above represents performance of Class A shares only, which will vary from the performance of Class C shares, Class Y shares and Institutional Class shares based on the differences in sales loads and fees paid by shareholders in the different classes. The inception date of the Fund was August 9, 2011. The returns of the index listed above are based on the inception date of the Fund. |
| | | |
| | ** | The average annual total returns shown above are adjusted for maximum sales loads and fees, if applicable. The maximum offering price per share of Class A shares is equal to the net assets value (“NAV”) per share plus a sales load equal to 6.10% of the NAV (or 5.75% of the offering price). Class C shares are subject to a contingent deferred sales charge (“CDSC”) of 1.00%. The CDSC will be assessed on an amount equal to the lesser of (1) the NAV at the time of purchase of the shares being redeemed or (2) the NAV of such shares being redeemed, if redeemed within a one-year period from the date of purchase. Class Y shares and Institutional Class shares are not subject to sales charges. |
The performance of the above Fund does not reflect the deduction of taxes that a shareholder would pay on Fund distributions or the redemption of Fund shares.
Note to Chart
BofA Merrill Lynch 3-Month U.S. Treasury Bill Index is an unmanaged index of Treasury securities maturing in 90 days that assumes reinvestment of all income.
14
| Management’s Discussion of Fund Performance (Unaudited) | |
Touchstone Mid Cap Fund
Sub-Advised by The London Company
Investment Philosophy
The Touchstone Mid Cap Fund seeks long-term capital growth by investing primarily in common stocks of mid-cap U.S.-listed companies. The Fund utilizes a bottom-up security selection process that screens potential investments against a proprietary quantitative model for return on capital, earnings-to-enterprise value ratio, and free cash flow yield. Its goal is to purchase financially stable companies that consistently generate high returns on unleveraged operating capital, are run by shareholder-oriented managements and are trading at a discount to their respective private market values.
Fund Performance
The Touchstone Mid Cap Fund (Class A Shares) underperformed its benchmark, the Russell Midcap® Index, for the 12-month period ended September 30, 2016. The Fund’s total return was 11.58 percent (excluding the maximum sales charge) while the benchmark’s total return was 14.25 percent.
Market Environment
For the one-year period, equity markets were generally robust. However, the path was not straight nor the market leadership steady. Equity returns were strong during the beginning and end of the period, though there was weakness early in 2016. From a factor perspective, the performance of growth stocks versus value stocks oscillated during the twelve months, with investors favoring growth stocks at the end of the one-year period. Economic developments were mixed, yet they were generally more positive than negative. The U.S. election process has been unpredictable and has likely caused some short-term volatility. Global risks also shifted during the period, as investors worried about oil prices, overall debt levels, China’s economy and Britain’s decision to exit the European Union (Brexit). Global gross domestic product (GDP) growth remained tepid and low interest rates helped keep equities in favor. Within the benchmark, all sectors finished in positive territory with leadership from the Materials, Information Technology and Real Estate sectors. The Consumer Discretionary sector’s gain was significantly less than all other sectors.
Portfolio Review
Within the Fund, sector allocation had a negative impact on relative performance, while stock selection contributed positively. At the sector level, the Fund’s overweight to Materials and an underweight to Health Care contributed to relative performance, which was partially offset by an overweight to Consumer Discretionary and an underweight to Real Estate.
Among the individual stocks that contributed to Fund performance were Copart Inc. (Industrials sector), Albemarle Corp. (Materials sector), Symantec Corp. (Information Technology sector), MBIA Inc. (Financials sector) and DollarTree Inc. (Consumer Discretionary sector). Copart, a provider of online auctions and vehicle remarketing services, outperformed as a result of solid industry sales, cost reductions and share gains. Lower gas prices also translated into more miles driven, and, as a result, accident frequency increased. Further, the average age of vehicles on the road has risen and technology in new cars has increased the cost of repairs. All of these factors benefited the stock during the period. Albemarle, a specialty chemical company, traded higher after the company announced improvement in its lithium and catalysts businesses. We sold the Fund’s position after the stock had a strong rally in early 2016. Symantec, a provider of security products and solutions, reported a solid start to its fiscal year and the stock rallied on the news. The company is now solely focused on the security market after the sale of Veritas and acquisition of Blue Coat Systems Inc., and operating margins have been strong. MBIA, a financial services company, outperformed after the passage of PROMESA (The Puerto Rico Oversight, Management and Economic Stability Act), which will allow Puerto Rico more flexibility in refinancing its
15
| | Management’s Discussion of Fund Performance (Unaudited) (Continued) |
obligations. We sold the Fund’s position on strength due to its smaller market cap and relatively small size in the Fund’s portfolio. DollarTree, a discount variety store chain, continued to generate industry-leading operating margins in its legacy stores and also started to show improvement at its acquired Family Dollar Stores Inc. However, we believe there is significant room for improvement at these stores, which should lead to higher margins over time.
Among the individual stocks that detracted from performance were Tempur-Sealy International Inc., H&R Block Inc., CarMax Inc. (all three from the Consumer Discretionary sector), Tenet Healthcare Corp. (Health Care sector) and VOYA Financial Inc. (Financials sector). Mattress manufacturer Tempur-Sealy was volatile during the year, but declined most recently due to weaker than expected quarterly results surrounding online competitors offering cheaper options. However, we remain attracted to the company’s industry-leading brands, strong relationship with retailers, current cost reductions and management’s incentives to improve margins while driving growth. Tax preparer H&R Block declined early in the year after reporting a weaker than anticipated tax season. Further, tax preparers across the industry faced share loss and deflationary pressures from Turbo Tax’s aggressive free online policy. Despite the weakness, we believe H&R Block still exhibits strong returns on capital and operating margins. CarMax underperformed despite strength in auto sales overall. CarMax specifically focuses on used car sales, which have been negatively impacted by aggressive promotions for new cars. In addition, weakness in subprime customers has concerned investors. We remain attracted to the company’s differentiated store format and room to open new stores across the country. Tenet Healthcare, a healthcare services company, declined due to slow growth and the company’s highly leveraged balance sheet. Weakness could also be attributed to the Health Care sector as a whole, which was down in 2016. Recent results, however, point to stabilization in admissions and we remain attracted to the company’s stable cash flow and strong geographic footprint. VOYA Financial moved lower after reporting a weaker than expected quarter, stemming from disappointing investment management results related to energy holdings. Despite the challenging equity environment, we expect valuations will rise as the company eliminates its closed block annuity business.
The Fund initiated new positions in Progressive Corp. (Financials sector), Citrix Systems Inc. (Information Technology sector) and Penske Automotive Group Inc. (Consumer Discretionary sector). Progressive, an insurance provider, has a strong brand and conservative underwriting philosophy which provides the company with a wide moat in the volatile insurance market. We believe Progressive’s market share gains and pricing power warrant multiple expansions to coincide with its book value growth. Citrix Systems, a software company, has strong returns on capital and free cash flow growth, in addition to shareholder-oriented capital allocation. Penske Automotive Group is an operator of retail automotive franchises. Penske outperformed despite a decline in same-store sales within its core auto business. The company significantly increased its ownership in its growing truck leasing division, with the insider purchase coming from the chief executive officer Roger Penske, which sent shares higher.
The Fund added to its positions in Ball Corp. (Materials sector) and Energizer Holdings Inc. (Consumer Staples sector), as both are high conviction names that have pricing power and strong free cash flow.
The Fund sold its positions in MBIA Inc. (Financials sector), Albemarle Corp. (Materials sector), NetApp Inc. (Information Technology sector), H&R Block Inc. and Cabela’s Inc. (both from the Consumer Discretionary sector). We trimmed the Fund’s position in Dollar Tree Stores Inc. (Consumer Discretionary sector) due to its large size in the Fund’s portfolio.
Outlook
Based on recent economic news, the U.S. economy appears stable with low single-digit GDP growth. Further, the labor market continues to expand while housing and manufacturing are improving. While interest rates may move slightly higher over the next few months, we believe rates will remain low relative to history for some time, which should be positive for equity markets. That said, the U.S. economic recovery has been lengthy
16
| Management’s Discussion of Fund Performance (Unaudited) (Continued) | |
and equity markets are not cheap based on traditional metrics. However, we are still finding high-conviction investment ideas with a focus on limiting downside risk in each holding. Specifically, we believe downside risk is mitigated by remaining focused on those companies with pricing power, high levels of cash generation and prudent capital allocation.
Our strategy focuses on stocks from a bottom-up standpoint. We seek companies with strong returns on capital and the flexibility to enhance shareholder value using the balance sheet. Low interest rates and relatively high equity risk premiums enable companies to increase shareholder value by adjusting the capital structure of the company. We expect investors to reward companies that wisely deploy capital including higher dividends, share repurchases and mergers and acquisitions transactions. Going forward, we believe the Fund is positioned well for a slow growth environment that rewards strong capital allocation.
17
| | Management’s Discussion of Fund Performance (Unaudited) (Continued) |
Comparison of the Change in Value of a $10,000 Investment in the Touchstone
Mid Cap Fund - Class A* and the Russell Midcap® Index

| | * | The chart above represents performance of Class A shares only, which will vary from the performance of Class C shares, Class Y shares, Class Z shares and Institutional Class shares based on the differences in sales loads and fees paid by shareholders in the different classes. The inception date of Class A shares, Class C shares, Class Y shares, Class Z shares and Institutional Class shares was May 14, 2007, May 14, 2007, January 2, 2003, April 24, 2006 and January 27, 2012, respectively. Class A shares, Class C shares, Class Z shares and Institutional Class shares performance was calculated using the historical performance of Class Y shares for the periods prior to May 14, 2007, May 14, 2007, April 24, 2006 and January 27, 2012, respectively. The returns have been restated for sales loads and fees applicable to Class A, Class C, Class Z and Institutional Class shares. The returns of the index listed above are based on the inception date of the Fund. |
| | | |
| | ** | The average annual total returns shown above are adjusted for maximum sales loads and fees, if applicable. The maximum offering price per share of Class A shares is equal to the net assets value (“NAV”) per share plus a sales load equal to 6.10% of the NAV (or 5.75% of the offering price). Class C shares are subject to a contingent deferred sales charge (“CDSC”) of 1.00%. The CDSC will be assessed on an amount equal to the lesser of (1) the NAV at the time of purchase of the shares being redeemed or (2) the NAV of such shares being redeemed, if redeemed within a one-year period from the date of purchase. Class Y shares, Class Z shares and Institutional Class shares are not subject to sales charges. |
The performance of the above Fund does not reflect the deduction of taxes that a shareholder would pay on Fund distributions or the redemption of Fund shares.
Note to Chart
Russell Midcap® Index measures the performance of the 800 smallest companies in the Russell 1000® Index.
The Frank Russell Company (FRC) is the source and owner of the Index data contained or reflected in this material and all trademarks and copyrights related thereto. The material may contain confidential information and unauthorized use, disclosure, copying, dissemination or redistribution is strictly prohibited. This is a Touchstone Investments presentation of the data, and FRC is not responsible for the formatting or configuration of this material or for any inaccuracy in the presentation thereof.
18
| Management’s Discussion of Fund Performance (Unaudited) | |
Touchstone Mid Cap Value Fund
Sub-Advised by LMCG Investments, LLC
Investment Philosophy
The Touchstone Mid Cap Value Fund seeks capital appreciation by investing primarily in common stocks of medium capitalization companies. The Fund seeks to identify companies believed to be selling at a discount to their inherent value.
Fund Performance
The Touchstone Mid Cap Value Fund (Class A Shares) outperformed its benchmark, the Russell Midcap® Value Index, for the 12-month period ended September 30, 2016. The Fund’s total return was 19.20 percent (excluding the maximum sales charge) while the benchmark’s total return was 17.26 percent.
Market Environment
The first half of the 12-month period closed amid a slowing global economic backdrop, an interest rate increase imposed by the U.S. Federal Reserve Board (Fed), a stronger U.S. dollar and a rocky ride for commodities and cyclical stocks. Company balance sheet strength also proved to be particularly important during this time, along with quality in terms of earnings and returns on equity. The start of 2016 opened with growing investor concerns about the health of the global economy, with many investors pricing in a global recession. However, midway through the first quarter of 2016, sentiment reversed as a result of better-than-expected economic news in China and commentary from the Fed that suggested a slower path to increasing interest rates. Investors interpreted the Fed’s commentary as bearish for the U.S. dollar, which benefited cyclical and commodity-related stocks.
Most recently, the impact of the narrowly decided vote by Great Britain to exit the European Union (Brexit) shocked the market during the last few weeks of June, but the overall tone was relatively muted during the final months of the period. This, along with optimistic comments from the European Central Bank and the Fed, drove the rotation out of higher quality, more defensive stocks and into smaller, lower quality stocks with higher beta1.
During the 12-month period, from a style standpoint within the mid-cap value universe, value stocks outperformed growth stocks for the period.
Portfolio Review
The Fund’s strongest contributors to performance were reported in the Materials, Energy and Health Care sectors. Primary detractors were from the Information Technology and Industrials sectors.
Stock selection drove performance in the Materials sector, with particular strength in the Fund’s chemicals holdings, including Albemarle Corp., Cabot Corp. and FMC Corp. Stock selection within the Energy sector also contributed to performance, and the Fund portfolio’s underweight to the sector was also additive. The Fund’s zero exposure to energy equipment and services companies particularly benefited the Fund’s portfolio.
The Fund’s overweight to the Health Care sector detracted from performance; however, positive stock selection outweighed the shortfall. Much of the outperformance in the sector was driven by Abbot Laboratories’ acquisition of portfolio holding St. Jude Medical Inc. at a significant premium during the second quarter of 2016. The Fund’s zero exposure to pharmaceutical companies also contributed to returns on a relative basis.
Stock selection across several industries within the Information Technology sector detracted from performance, although an overweight position helped to mitigate the shortfall. Diebold Inc. (an ATM manufacturer) and IAC/InterActiveCorp (a media and Internet company) struggled during the period; however, we continued to
19
| | Management’s Discussion of Fund Performance (Unaudited) (Continued) |
hold both companies in the Fund’s portfolio. Within the Industrials sector, stock selection in the commercial services and supplies industry detracted from performance. Stericyle Inc. (a medical and pharmaceutical waste management company) and AerCap Holdings N.V. (an aircraft leasing company) were the biggest laggards in the sector for the period. The Fund was underweight Real Estate Investment Trusts (REITs) and the Utilities sector given valuation concerns.
Outlook
From a macroeconomic standpoint, we believe an improving global economic environment would benefit the Fund on a relative basis. In the short term, these sectors historically have performed opposite of the direction of interest rates. Given how low interest rates have been globally, we believe any positive economic news could cause rates to move higher and cause these bond-proxy sectors to underperform.
Looking ahead, our greatest concern is that the market environment will continue to reward growth and visibility, irrespective of valuation and quality. However, we will not deviate from our process of buying high-quality companies that are temporarily out of favor and believe that buying growth and visibility, irrespective of valuation, is a risky strategy. We will continue to seek attractively valued investment opportunities with favorable risk-reward profiles.
The Fund utilizes a classic value-driven philosophy based on the belief that leading businesses selling at a discount to fair value have the potential to generate excess returns. The strategy focuses on stocks that are temporarily out of favor in the market, specifically, companies with higher returns on capital, free cash flow and strong balance sheets. Emphasis is placed on those companies having the cash flow characteristics as well as the balance sheet strength necessary to buffer the company from any prolonged weakness. The companies we select often dominate a particular industry niche and generally have significant barriers to entry. As a result, we believe they are able to perpetuate a higher return on capital over time. The Fund’s overall investment process utilizes fundamental bottom-up security selection, while risk-control measures ensure security and sector diversification.
1 Beta is a measure of the volatility of a portfolio relative to its benchmark.
20
| Management’s Discussion of Fund Performance (Unaudited) (Continued) | |
Comparison of the Change in Value of a $10,000 Investment in the
Touchstone Mid Cap Value Fund - Class A* and the Russell Midcap® Value Index

| * | The chart above represents performance of Class A shares only, which will vary from the performance of Class C shares, Class Y shares and Institutional Class shares based on the differences in sales loads and fees paid by shareholders in the different classes. The inception date of the Fund was September 30, 2009. The returns of the index listed above are based on the inception date of the Fund. | |
| | | |
| ** | The average annual total returns shown above are adjusted for maximum sales loads and fees, if applicable. The maximum offering price per share of Class A shares is equal to the net assets value (“NAV”) per share plus a sales load equal to 6.10% of the NAV (or 5.75% of the offering price). Class C shares are subject to a contingent deferred sales charge (“CDSC”) of 1.00%. The CDSC will be assessed on an amount equal to the lesser of (1) the NAV at the time of purchase of the shares being redeemed or (2) the NAV of such shares being redeemed, if redeemed within a one-year period from the date of purchase. Class Y shares and Institutional Class shares are not subject to sales charges. | |
The performance of the above Fund does not reflect the deduction of taxes that a shareholder would pay on Fund distributions or the redemption of Fund shares.
Note to Chart
Russell Midcap® Value Index measures the performance of those Russell Midcap companies with lower price-to-book ratios and lower forecasted growth values.
The Frank Russell Company (FRC) is the source and owner of the data contained or reflected in this material and all trademarks and copyrights related thereto. The material may contain confidential information and unauthorized use, disclosure, copying, dissemination or redistribution is strictly prohibited. This is a Touchstone Investments presentation of the data, and FRC is not responsible for the formatting or configuration of this material or for any inaccuracy in the presentation thereof.
21
| | Management’s Discussion of Fund Performance (Unaudited) |
Touchstone Premium Yield Equity Fund
Sub-Advised by Miller/Howard Investments, Inc.
Investment Philosophy
The Touchstone Premium Yield Equity Fund seeks long-term growth of capital and high current income by focusing on dividend-paying equity securities of U.S. and foreign companies believed to possess attractive long-term return potential primarily due to lower than average valuations and improving business outlooks.
Fund Performance
The Touchstone Premium Yield Equity Fund (Class A Shares) outperformed the Russell 3000® Value Index but underperformed the Dow Jones U.S. Select Dividend Index for the 12-month period ended September 30, 2016. The Fund’s total return was 16.80 percent (excluding the maximum sales charge) while the returns of its benchmarks were 16.38 percent and 22.24 percent, respectively.
Market Environment
U.S. economic data was varied during the year as lower capacity utilization, mixed manufacturing data and weak money supply pointed to a softer economy, while an improving labor market and stronger consumer sentiment were constructive. Earnings reports were largely lackluster, but not alarming, and an earnings recession in cyclical business occurred, likely triggered by weakness in commodity prices.
Monetary policy was the key theme during the year as the European Central Bank, Bank of England and Bank of Japan continued their monetary easing campaigns. The ample global liquidity supported the equity markets and the U.S. and emerging markets were the top performers. In December 2015, the U.S. Federal Reserve Board (Fed) raised interest rates by 25 basis points, and the results were not as dire as many market participants anticipated. For the rest of the year the market speculated when the next rise would be. The Fed communicated it would hold off on an interest rate increase until economic data improves, but communicated a high likelihood that an increase will occur in the near future.
In the quarter ended June 30, 2016, Great Britain voted to leave the European Union, also known as Brexit. It was a surprise outcome that triggered a spike in investor fear and a stock market sell-off, the worst ever two-day paper loss for stock markets globally. Despite the ensuing uncertainties, the capital markets quickly recovered and U.S. stocks recovered for the quarter.
Over the last year, there was a change in investor preference from growth stocks to value. General investor appetite toward dividend income stocks improved, which some argue was partly because of relief at having survived the Fed’s first interest rate increase. Despite the marginal increase in U.S. interest rates, investors continued their search for yield, bidding up the valuations of “bond-proxy” sectors such as Utilities and Real Estate.
Energy commodity prices faced a severe correction and increased volatility over the last year. WestTexas Intermediate (WTI) crude prices hit multi-year lows in both January and again in February 2016. Natural gas prices also followed a similar downward path as crude oil, hitting a bottom in the first quarter of 2016. The Energy sector faced lower drilling and production, soft earnings and, in some cases, fears of bankruptcy. However, energy prices rebounded throughout the balance of the year as rig counts decreased and production moderated, helping supply and demand to balance. The firming of hydrocarbon prices and improving investor sentiment led to a rally in the energy sector and supporting industries, such as oil field services and engineering and construction.
Portfolio Review
During the 12-month period, there was a clear trend that the highest dividend quintiles were the best performing group in the Russell 3000® Value Index, outperforming the overall market. This favored the Fund’s investment
22
| Management’s Discussion of Fund Performance (Unaudited) (Continued) | |
process of investing in stocks that yield more than the Index and increase their dividends over time. The Fund’s overweight allocation to high-yielding stocks was one of the largest relative contributors to Fund performance. Large-cap stocks outperformed small- and mid-cap stocks during the period. The Fund was overweight large-cap and underweight small- and mid-cap companies. Stock selection within large-cap was a top contributor.
As the lowest beta1 stocks within the Russell 3000® Value Index had the highest returns, the Fund’s overweight allocation to the two lowest beta quintiles added to returns.
For the year, stock selection hurt relative performance, while sector allocation helped. The Fund’s underweight allocation to the Financials sector and overweight to the Real Estate sector were top contributors. Stock selection in both sectors was also strong. The Fund’s stock selection within the Energy sector was the largest detractor to relative returns, driven by its exposure to midstream pipeline operators and zero exposure to more conservative integrated oil and gas companies.
From a stock selection standpoint, top relative contributors to performance during the period included Spectra Energy Corp. and ONEOK Inc. (both from the Energy sector), Digital Realty Trust Inc. (Real Estate sector) and Qualcomm Inc. and Microchip Technology Inc. (both from the Information Technology sector).
Among the individual stocks that detracted from performance during the period included Williams Cos. Inc. and Kinder Morgan Inc. (both from the Energy sector), Seagate Technology PLC (Information Technology sector) and Viacom Inc. and GameStop Corp. (both from the Consumer Discretionary sector).
The following stocks were added to the Fund during the period. The Toronto-Dominion Bank (Financials sector) is a high-quality Canadian bank with a long history of dividend growth, low exposure to energy lending and growth opportunities in its wealth management business and U.S. operations. JM Smucker Co. (Consumer Staples sector) reported excellent quarterly earnings and revenue. Its recent acquisitions have been accretive and we believe will contribute to a higher growth rate. United Parcel Service Inc. (Industrials sector) showed improving earnings, favorable cost inputs and a positive mix change. The company has a high yield relative to its history and we believe it is attractively valued. L Brands Inc. (Consumer Discretionary sector) was oversold despite an excellent quarterly report and dividend increase. We believe that it is a high-quality retailer that is trading at a reasonable valuation and has an attractive yield. We found Qualcomm Inc. (Information Technology sector) attractive on a number of counts: low valuation and a high yield among them. Uncertainty over the decline of royalty payments on the company’s patents is subsiding, while new corporate initiatives set it on a positive track. Wells Fargo & Co. (Financials sector), a high-quality super-regional bank, has an attractive loan book and we believe it is positioned to benefit from wider spreads when interest rates rise. PacWest Bancorp (Financials sector) is poised to benefit from an improving loan growth environment and wider potential net interest margins from higher anticipated interest rates. We have a favorable view of its acquisition of Square 1 Financial Inc. and the low cost of funding from its deposits. Abbott Laboratories (Health Care sector) possesses many strong franchises and we believe its recent acquisition of St. Jude Medical Inc. should help it compete more effectively with other medical device competitors. Abbott trades at a discount to its pre-acquisition price and has been shifting its portfolio to faster growing businesses that are more international. Though at the lower end of the strategy’s yield guidelines, Abbott has an uninterrupted commitment to quarterly dividends that date back to 1924; its solid leadership has delivered strong returns for shareholders since 1980. Johnson Controls International PLC (Consumer Discretionary sector) announced a significant merger with Tyco International Ltd. in January and a simultaneous spinoff of noncore automotive businesses. We believe the restructuring lays the groundwork for synergies and a recurring revenue powerhouse in the area of residential and commercial fire protection, HVAC, energy efficiency and security, with numerous cross-selling opportunities between the legacy-building efficiency business and Tyco’s security business. Western Digital Corp. (Information Technology sector), a hard disk drive and flash memory manufacturer, raised its revenue and earnings forecast for the third consecutive quarter. Western Digital carries a manageable level of debt following its consolidating purchase of
23
| | Management’s Discussion of Fund Performance (Unaudited) (Continued) |
competitor SanDisk Corp., a company strong in the next generation of memory storage. International Business Machines Corp (IBM). (Information Technology sector), the oldest tech company, was purchased at a high yield and an attractive valuation. Most IBM businesses now show signs of stabilization, and cloud-based offerings should provide the revenue growth sorely needed to reinvigorate earnings. We believe that even a modest turnaround could spur unusual upside potential for a company of its size. Plains GP Holdings LP (Energy sector) is backed by strong cash flows and levered to a nascent recovery in crude oil prices and production. We previously held the company but sold it in the second quarter of 2016 in advance of an expected dividend cut. Viacom Inc. (Consumer Discretionary sector) was bought as the odds of a management change increased, opportunities for asset monetization improved and a low valuation was present.
During the period, GameStop Corp. (Consumer Discretionary sector) was sold because of concerns over out-year dividend growth due to mounting pressures from direct to consumer digital video game downloads that we believe could worsen before stabilizing. Kinder Morgan Inc. (Energy sector) was sold after management announced plans to cut its dividend amid concerns of company funding issues. The RMR Group Inc. (Real Estate sector) was spun off at the end of 2015 from Fund holding Senior Housing Property Trust (SNH) and we chose to liquidate the small position. NiSource Inc. (Utilities sector) was fully valued and the Utilities sector stocks have been trading at a high valuation. Seagate Technology PLC (Information Technology sector) disappointed in its flash memory development, which had not been fast enough to overcome PC deterioration; we also exited to make room for more attractive investments. Maxim Integrated Products Inc. (Information Technology sector) was sold on diminishing potential for merger & acquisition (M&A), and also to raise cash for new technology stock purchases. Ares Capital Corp. (Financials sector) was sold due to pressures on its 2016 and 2017 estimates, following the winding down of General Electric Capital Corp. Williams Companies Inc. (Energy sector) was sold due to fears of a dividend cut. Moreover, there were concerns over declining volumes through its Master Limited Partnership (MLP), Williams Partners (not held in the Fund’s portfolio) pipelines, and potential counter-party risk with customers. STMicroelectronics NV (Information Technology sector) was sold after we trimmed it in fourth quarter 2015 due to missed earnings estimates and disappointing management guidance. American Water Works Co. Inc. (Utilities sector), a long-time portfolio holding, hit our valuation target. We also chose to redeploy the capital to better investment opportunities. Care Capital Properties Inc. (Real Estate sector), a spinoff from Ventas Inc., was sold because it was a small position. People’s United Financial Inc. (Financials sector) was sold because the stock’s valuation is high relative to its history. Estimates are coming down after an earnings-per-share (EPS) miss because of lower than expected fees and higher than forecasted expenses. HCP Inc. (Real Estate sector), a healthcare real estate investment trust (REIT), was sold because of a reduced growth outlook due to reduced tenancy prospects. Plains GP Holdings LP (Energy sector) is sensitive to the ongoing decline in domestic crude oil production. It was sold because this, coupled with the partnership’s high cost of capital, led to suggestions that the Plains family may seek strategic alternatives, including a merger of the two partnership entities and a possible distribution cut, either in the independent MLP or as part of a merger with the General Partner. While we move to the sidelines, we continue to monitor things closely. Plains possesses an unrivaled suite of assets that transports 20 percent of all U.S. crude production and management gets high marks, though the company is operating under still-tough conditions. Microsoft Corp. (Information Technology sector) had strong price appreciation which brought the yield below a level appropriate for the Fund. JM Smucker Co. (Consumer Staples sector) had too low of a dividend that could not keep pace with price appreciation, plus growth induced by recent acquisitions is subsiding and its low yield was no longer a fit. Senior Housing Properties Trust (Real Estate sector) was trading at a high valuation. Moreover, we had concerns about the increasingly competitive and over-supplied senior housing market. Host Hotels & Resorts Inc. (Real Estate sector) suffered from the drag of a strong U.S. dollar on tourism and foreign business travel to the U.S., increasing supply of new hotel rooms in major markets leading to lowered expectations for revenue per available room, and economic uncertainty. Viacom Inc. (Consumer Discretionary sector) was sold because the likelihood of M&A activity declined and fears over the safety of the dividend increased.
24
| Management’s Discussion of Fund Performance (Unaudited) (Continued) | |
Outlook
What’s most interesting about leadership this past quarter—the Information Technology sector outperformed the S&P 500 Index — is that technology remains inexpensive relative to the broad-market benchmark. While this does not guarantee outperformance, the mix outside traditional dividend-paying sectors—which includes solid yields, good cash dividend coverage, solid balance sheets and secular business trends (including consolidation)—suggests that the absence or underweight of Utilities and Consumer Staples sectors in the Fund’s portfolio is likely to last a while longer, depending on valuation changes. We believe the strange combination of low economic growth and the risk potential for rising interest rates from the Fed argues in favor of earnings and dividend growth just as much as current yield itself in this environment.
There is a lot of uncertainty in the world right now and shifting towards conservative balance sheets and cash flows, even at the cost of some current yield, seems prudent. We started making some shifts at the beginning of 2016, and may well make a few more. While we like current income, right now we are looking to emphasize stocks that offer dividend growth, such as consumer stocks that could benefit from a better employment environment and rising wages.
Dividend stocks have performed well since the Fed finally raised interest rates late last year. We find it interesting that dividend stocks started outperforming right after the rate increase. The idea that a moderate interest rate increase was good for dividend stocks supports our research indicating that marginal changes in interest rates do not have much impact on dividend stocks. What we think matters is reliable income generation and growth of that income over time. For this reason and, due to the diversification of the strategy, we believe the Fund is positioned well for a variety of market environments, including dividend-paying stocks continuing to be favored by the market.
Dividend paying investments may not experience the same price appreciation as non-dividend paying instruments, dividend-issuing companies may choose not to pay a dividend or the dividend may be less than what is anticipated.
1Beta is a measure of the volatility of a portfolio relative to its benchmark.
25
| | Management’s Discussion of Fund Performance (Unaudited) (Continued) |
Comparison of the Change in Value of a $10,000 Investment in the
Touchstone Premium Yield Equity Fund - Class A*, the Russell 3000® Value Index and the
Dow Jones U.S. Select Dividend Index
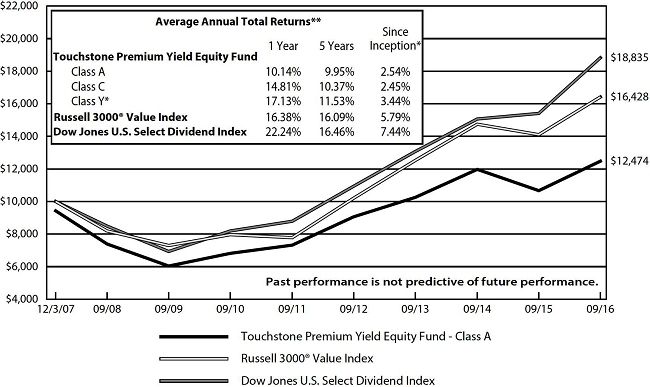
| | * | The chart above represents performance of Class A shares only, which will vary from the performance of Class C shares and Class Y shares based on the differences in sales loads and fees paid by shareholders in the different classes. The inception date of Class A shares, Class C shares and Class Y shares was December 3, 2007, December 3, 2007 and August 12, 2008, respectively. Class Y shares performance was calculated using the historical performance of Class A shares for the periods prior to August 12, 2008. The returns have been restated for sales loads and fees applicable to Class Y shares. The returns of the indexes listed above are based on the inception date of the Fund. |
| | | |
| | ** | The average annual total returns shown above are adjusted for maximum sales loads and fees, if applicable. The maximum offering price per share of Class A shares is equal to the net asset value (“NAV”) per share plus a sales load equal to 6.10% of the NAV (or 5.75% of the offering price). Class C shares are subject to a contingent deferred sales charge (“CDSC”) of 1.00%. The CDSC will be assessed on an amount equal to the lesser of (1) the NAV at the time of purchase of the shares being redeemed or (2) the NAV of such shares being redeemed, if redeemed within a one-year period from the date of purchase. Class Y shares are not subject to sales charges. |
The performance of the above Fund does not reflect the deduction of taxes that a shareholder would pay on Fund distributions or the redemption of Fund shares.
Notes to Chart
Russell 3000® Value Index measures the performance of those Russell 3000 companies with lower price-to-book ratios and lower forecasted growth values.
Dow Jones U.S. Select Dividend Index measures 100 leading U.S. dividend-paying companies.
Frank Russell Company (FRC) is the source and owner of the data contained or reflected in this material and all trademarks and copyrights related thereto. The material may contain confidential information and unauthorized use, disclosure, copying, dissemination or redistribution is strictly prohibited. This is a Touchstone Investments presentation of the data, and FRC is not responsible for the formatting or configuration of this material or for any inaccuracy in the presentation thereof.
26
| Management’s Discussion of Fund Performance (Unaudited) | |
Touchstone Sands Capital Select Growth Fund
Sub-Advised by Sands Capital Management, LLC
Investment Philosophy
The Touchstone Sands Capital Select Growth Fund primarily invests in common stocks of large capitalization U.S. companies that are believed to have above-average potential for revenue or earnings growth. The Fund invests in 25 to 35 companies. Sands Capital generally seeks stocks with sustainable above-average earnings growth and capital appreciation potential. In addition, Sands Capital looks for companies that have a significant competitive advantage, a leadership position or proprietary niche, a clear mission in an understandable business, financial strength and are valued rationally in relation to comparable companies, the market and the business prospects for that particular company.
Fund Performance
The Touchstone Sands Capital Select Growth Fund (Class A Shares) underperformed its benchmark, the Russell 1000® Growth Index, for the 12-month period ended September 30, 2016. The Fund’s total return was 7.17 percent (calculated excluding the maximum sales charge) while the total return of the benchmark was 13.76 percent.
Market Environment
The past 12 months have been a challenge for faint-hearted investors. The macroeconomic challenges that began in 2014 persisted into 2016, albeit rooted in slightly different causes. Though the U.S. dollar’s strength abated, Chinese economic data stabilized and global oil prices, based on West Texas Intermediate crude oil prices, retraced into the $40+ per barrel range. In December, the first U.S. Federal Reserve Board (Fed) rate hike since 2006 sent shock waves through the market that resulted in the worst start of the year in history. In June, the United Kingdom’s referendum to leave the European Union, or “Brexit,” ushered in a new wave of uncertainty and, with it, renewed trading volatility. During this period, market participants flooded into perceived safe haven investments, shunning the more growth-oriented end of the investment spectrum.
Absent any new acute macroeconomic shocks, the third quarter of 2016 marked a renewed focus on individual business fundamentals. The broad U.S. equity market (as measured by the S&P 500® Index) rebounded during the period, led largely by Information Technology, a traditional growth equity sector. The market is not without its risks and top-of-mind for many investors include the outcome of the heated November election in the U.S. and speculation regarding the next Fed rate hike. However, we were encouraged in the third quarter to see stock prices driven by fundamental factors such as earnings growth, and we maintain our conviction in owning companies that have the ability to grow their revenues and earnings faster than the market.
Portfolio Review
The top five relative contributors during the period were Alibaba Group Holding Ltd., Facebook Inc. and Visa Inc. (all from the Information Technology sector), Amazon.com Inc. (Consumer Discretionary sector) and Edwards Lifesciences Corp. (Health Care sector). We continued to believe that Amazon has built two increasingly dominant businesses in both its retail and web services operations. Amazon Web Services (AWS), the company’s Infrastructure as a Service (IaaS) offering, provides organizations with on-demand access to computing, storage and other services through its cloud platform. AWS continued to innovate and attract new enterprise customers and workloads, and we believe the recurring nature of revenues should result in sequential growth. Further, Salesforce.com Inc. designated AWS as its preferred public cloud architecture, and large enterprises such as General Electric Co. Oil & Gas, Kellogg Company and Lionsgate Entertainment Corp. are using SAP business-critical applications on the AWS platform. Amazon’s retail business continues to execute well, delivering its highest level of profitability since 2011 and unexpected upside in its international business. We believe Amazon’s two
27
| | Management’s Discussion of Fund Performance (Unaudited) (Continued) |
core franchises still feature a considerable growth runway, and niche offerings like Fresh and Prime Now should continue to diversify the company’s earnings growth potential.
The top five relative detractors from performance were Chipotle Mexican Grill Inc. and Netflix Inc. (both from the Consumer Discretionary sector), LendingClub Corp. (Financials sector) and Alexion Pharmaceuticals Inc. and Regeneron Pharmaceuticals Inc. (both from the Health Care sector). The stock price of Chipotle Mexican Grill suffered following several E. coli outbreaks in late 2015 and early 2016. We maintained our conviction in the long-term growth potential of the brand during this challenging period for the company, and the recovery appears to be underway. The loyalty program launched at the beginning of July, Chiptopia, is successfully driving store traffic, and we continue to believe that management is acting properly to regain customer sales. We have been encouraged by Chipotle’s guidance for new store openings, with a directed effort toward markets where the restaurant has less of a presence. Chipotle is a prime example of our willingness to accept short-term volatility in exchange for long-term wealth creation. Though a major headwind, we believe the food safety issues should prove to be but a temporary setback in Chipotle’s long-term growth story.
We diligently monitor and continually evaluate the long-term growth prospects for the Fund’s portfolio companies while simultaneously seeking opportunities to add compelling new businesses. In the past year we initiated positions in four companies: Edwards Lifesciences Corp. and Incyte Corp. (both from the Health Care sector), Netflix Inc. and Under Armour Inc. (both from the Consumer Discretionary sector). Over the same time period we eliminated six positions: ARM Holdings PLC, ASML Holding NV and LinkedIn Corp. (all from the Information Technology sector), Nike Inc. (Consumer Discretionary sector), Whole Foods Market Inc. (Consumer Staples sector) and FMC Technologies Inc. (Energy sector).
Outlook
We view secular trends, innovation and company-specific competitive advantages as key to driving growth through a variety of economic environments. For a business to possess the above-average earnings growth potential we require, it is often a key innovator or vital facilitator within an attractive industry that is benefiting from positive secular change. Secular trends are distinct from short-term economic factors as they tend to persist through market cycles and can provide powerful structural tailwinds that enhance the sustainability of a business’s growth for many years. We believe our long-term investment horizon allows us to capture the benefit of these characteristics and realize the ultimate earnings power of a company, while weathering volatility over shorter periods. Furthermore, our approach—active, concentrated and benchmark-agnostic—enables us to have outsized exposure to companies within this sphere that are the best fits with our six investment criteria.
The Fund’s sector allocations are a residual of our bottom-up, fundamental approach. Our six investment criteria typically lead us to innovative businesses that are creating new or disrupting existing markets, and/or benefiting from powerful secular tailwinds. Our approach to investment research, portfolio construction and risk management results in a portfolio that we believe is naturally diversified across industries and businesses at different stages of their respective growth lifecycles. We expect to continue to have higher weights in key growth sectors, including consumer, life sciences and technology, and lower weights in highly-cyclical sectors such as Energy, Industrials and Financials.
We believe the majority of businesses in the Fund’s portfolio benefit from one or more secular trends. However, we have identified four broad trends that together comprise a majority of the portfolio:
| | • | Retail Revolution – E-commerce: E-commerce is the fastest growing segment of retail sales, but only accounts for about seven percent of the total worldwide retail market. As a proportion of total retail sales, e-commerce is expected to nearly double by 2019. Brands now have the ability to directly interact with consumers through novel mediums such as social media and lifestyle apps, and become embedded in their daily routines. Tools such as Amazon Prime and Visa Checkout reduce the friction associated with online payment. |
28
| Management’s Discussion of Fund Performance (Unaudited) (Continued) | |
| • | Union of Healthcare and Technology: Major areas of unmet need continue to exist in the treatment of disease. However, improved understanding of disease biology and new approaches to treatment are enabling more productive drug development. Additionally, we expect genomic sequencing and healthcare information systems to facilitate precision medicine, enabling physicians to provide more targeted care. We are also witnessing the rise of minimally invasive surgical technologies, which have quality of life advantages for the patient and efficiency benefits for providers, leading them to increasingly become the standard of care. | |
| | | |
| • | Software-as-a-Service (SaaS): In our view, information technology spending is shifting toward innovations that make enterprises more agile and efficient. Cloud-based software is a key facilitator of this shift. Fast deployment, scalability, easy and frequent updates and lower total cost of ownership create a compelling customer value proposition. SaaS businesses tend to benefit from revenue visibility, “sticky” clientele, margin leverage opportunities and low customer acquisition costs. | |
| | | |
| • | Data-Driven Decision Making: We believe companies with large, proprietary pools of consumer data and tools that use this data to create unique content have sizable monetization opportunities. Advertising is already well on its way toward transformation, as access to consumer data is enabling companies to create targeted, more effective ads. At the micro level, companies are beginning to use predictive analytics to generate insights from their own pools of data. | |
We believe the Fund owns companies that are positioned to deliver strong business results and earnings growth over our five- to ten-year investment horizon. Our focus on the sustainability of a business’s future earnings growth typically steers us toward companies we believe are benefiting from secular trends that should provide powerful growth tailwinds throughout economic cycles. We have high conviction in the long-term growth estimates for the Fund’s portfolio companies and believe they can deliver the growth necessary to support above average relative and absolute returns over the next several years.
29
| | Management’s Discussion of Fund Performance (Unaudited) (Continued) |
Comparison of the Change in Value of a $10,000 Investment in the
Touchstone Sands Capital Select Growth Fund - Class A* and the Russell 1000® Growth Index
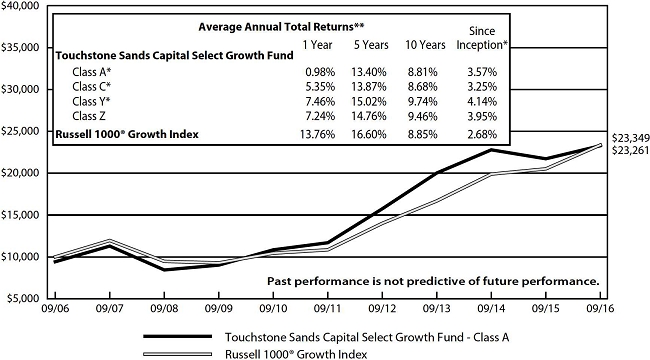
| | * | The chart above represents performance of Class A shares only, which will vary from the performance of Class C shares, Class Y shares and Class Z shares based on the differences in sales loads and fees paid by shareholders in the different classes. The inception date of Class A shares, Class C shares, Class Y shares and Class Z shares was November 15, 2010, November 15, 2010, August 27, 2004 and August 11, 2000, respectively. Class A shares, Class C shares and Class Y shares performance was calculated using the historical performance of Class Z shares for the periods prior to November 15, 2010, November 15, 2010 and August 27, 2004, respectively. The returns have been restated for sales loads and fees applicable to Class A, Class C and Class Y shares. The returns of the index listed above are based on the inception date of the Fund. |
| | | |
| | ** | The average annual total returns shown above are adjusted for maximum sales loads and fees, if applicable. The maximum offering price per share of Class A shares is equal to the net asset value (“NAV”) per share plus a sales load equal to 6.10% of the NAV (or 5.75% of the offering price). Class C shares are subject to a contingent deferred sales charge (“CDSC”) of 1.00%. The CDSC will be assessed on an amount equal to the lesser of (1) the NAV at the time of purchase of the shares being redeemed or (2) the NAV of such shares being redeemed, if redeemed within a one-year period from date of purchase. Class Y shares and Class Z shares are not subject to sales charges. |
The performance of the above Fund does not reflect the deduction of taxes that a shareholder would pay on Fund distributions or the redemption of Fund shares.
Note to Chart
Russell 1000® Growth Index measures the performance of those Russell 1000 companies with higher price-to-book ratios and higher forecasted growth values.
The Frank Russell Company (FRC) is the source and owner of the data contained or reflected in this material and all trademarks and copyrights related thereto. The material may contain confidential information and unauthorized use, disclosure, copying, dissemination or redistribution is strictly prohibited. This is a Touchstone Investments presentation of the data, and FRC is not responsible for the formatting or configuration of this material or for any inaccuracy in the presentation thereof.
30
| Management’s Discussion of Fund Performance (Unaudited) | |
Touchstone Small Cap Fund
Sub-Advised by The London Company
Investment Philosophy
The Touchstone Small Cap Fund seeks capital appreciation by investing primarily in common stocks of U.S. companies with small market capitalizations. The Fund utilizes a bottom-up security selection process that screens potential investments against a proprietary quantitative model for return on capital, earnings-to-enterprise value ratio, and free cash flow yield. The goal is to purchase financially stable companies that are believed to consistently generate high returns on unleveraged operating capital, are run by shareholder-oriented management and are trading at a discount to their respective private market values.
Fund Performance
The Touchstone Small Cap Fund (Class A Shares) underperformed its benchmark, the Russell 2000® Index, for the 12-month period ended September 30, 2016. The Fund’s total return was 3.74 percent (excluding the maximum sales charge) while the benchmark’s total return was 15.47 percent.
Market Environment
For the one-year period, equity markets were generally robust. However, the path was not straight nor the market leadership steady. Equity returns were strong during the beginning and end of the period, though there was weakness early in 2016. From a factor perspective, the performance of growth stocks versus value stocks oscillated during the twelve months, with investors typically favoring growth stocks at the end of the one-year period. Economic developments were mixed, yet they were generally more positive than negative. The U.S. election process has been unpredictable and has likely caused some short-term volatility. Global risks also shifted during the period, as investors worried about oil prices, overall debt levels, China’s economy and Britain’s decision to exit the European Union (Brexit). Global gross domestic product (GDP) growth remained tepid and low interest rates helped keep equities in favor. Within the benchmark, Materials and Information Technology were the leading sectors, while the Energy and Consumer Discretionary sectors lagged.
Portfolio Review
Within the Fund, sector allocation and stock selection had a negative impact on the Fund. At the sector level, the Fund’s underweight to Information Technology and overweight to Consumer Discretionary detracted from performance, which was partially offset by an overweight to Materials and an underweight to Health Care.
Among the individual stocks that contributed to Fund performance during the period were First Industrial Realty Trust (Financials sector), Energizer Holdings Inc. (Consumer Staples sector), Superior Energy Services Inc. (Energy sector), NewMarket Corp. (Materials sector) and Penske Automotive Group Inc. (Consumer Discretionary sector). First Industrial Realty Trust, a real estate investment trust (REIT), continued to improve its occupancy rates as well as strengthen its balance sheet. Higher dividend-yielding sectors did well, which also benefited First Industrial during the quarter. We reduced its weight in the Fund during the period as a result of the company’s higher valuation and turnover of its chief executive officer. Energizer Holdings, a consumer goods company built on the Energizer and Eveready brands, moved higher after the company posted stronger than expected results in recent quarters. The company’s battery sales and volume have stabilized and we expect industry dynamics to continue to improve, particularly since competitor Duracell is now owned by Berkshire Hathaway Inc. Superior Energy, an oilfield services and equipment company, bounced back during the period after experiencing a difficult 2014 and 2015. The rebound in oil prices as well as stabilization in the services market helped drive the stock higher. The company maintained a strong balance sheet, which provided downside protection. NewMarket, a petroleum additives company, has risen steadily over the last twelve months. The company has a solid history of price increases and higher margins. Though volume and pricing were relatively flat during the year, cost
31
| | Management’s Discussion of Fund Performance (Unaudited) (Continued) |
savings helped drive earnings and cash flow. Further, the company continued to return significant amounts of cash to shareholders via dividends and share repurchases. Penske Automotive Group is an operator of retail automotive franchises. Penske outperformed despite a decline in same-store sales within its core auto business. The company significantly increased its ownership in its growing truck leasing division, with the insider purchase coming from the chief executive officer Roger Penske, which sent the stock higher.
Among the individual stocks that detracted from Fund performance were Tempur-Sealy International Inc., Vista Outdoor Inc. (both from the Consumer Discretionary sector), Tenet Healthcare Corp. (Health Care sector), Corrections Corp. of America (Financials sector) and Atwood Oceanics Inc. (Energy sector). Mattress manufacturer Tempur-Sealy was volatile during the period, but declined most recently due to weaker than expected quarterly results surrounding online competitors offering cheaper options. However, we remain attracted to the company’s industry-leading brands, strong relationship with retailers, current cost reductions and management’s incentives to improve margins while driving growth. Vista Outdoor, a designer and manufacturer of outdoor sports and recreation products, reported weaker than expected quarterly results and the stock moved lower. The weakness reflected a shift in spending in firearms (shotguns, in particular), a shift in timing of international sales and the liquidation of a couple of large retailers. We believe the issues are largely temporary and believe the stock trades at an attractive discount to intrinsic value. Tenet Healthcare, a healthcare services company, declined due to the company’s highly leveraged balance sheet and slow growth. Weakness was also attributed to the Health Care sector as a whole, which was down in 2016. Recent results, however, point to stabilization in admissions and we remain attracted to the company’s stable cash flow and strong geographic footprint. Corrections Corp., an owner and manager of private prisons and detention centers, declined significantly due to concerns about the potential loss of some of its government clients. In particular, the Justice Department announced that the Federal Bureau of Prisons would be phasing out its use of private prisons over the next three to five years, and the Department of Homeland Security began to review private prisons as well. Atwood Oceanics, like much of the Energy sector, was pressured by the decline in energy prices and the associated reductions in capital spending. The company still owes money on drill ships under construction and cash flow is tight. We sold the stock during the first quarter of 2016 based on these concerns.
During the quarter, the Fund initiated positions in Penske Automotive Group Inc. (Consumer Discretionary sector) and Armstrong World Industries Inc. (Industrials sector). Armstrong World Industries, a global producer of flooring and ceiling systems, operates in an oligopolistic industry with high barriers to entry. Armstrong also has tremendous pricing power and competitive advantages due to exclusive long-term contracts with distributors.
The Fund added to its existing positions in Alexander & Baldwin Inc., Kaman Corp., GATX Inc. (all three from the Industrials sector) and Tempur Sealy International Inc. (Consumer Discretionary sector). The Fund trimmed its positions in First Industrial Realty Trust (Financials sector), Sturm Ruger & Co. Inc., Cabela’s Inc. (both from the Consumer Discretionary sector). The Fund sold its positions in Atwood Oceanics Inc. (Energy sector), Waddell & Reed Financial Inc. (Financials sector), MRC Global Inc. (Industrials sector), Dana Holding Corp. (Consumer Discretionary sector), Corrections Corp. of America (Financials sector) and American Eagle Outfitters (Consumer Discretionary sector).
Outlook
Based on recent economic news, the U.S. economy appears stable with low single-digit gross domestic product (GDP) growth. Further, the labor market continues to expand while housing and manufacturing are improving. While interest rates may move slightly higher over the next few months, we believe rates will remain low relative to history for some time, which should be positive for equity markets. That said, the U.S. economic recovery has been lengthy and equity markets are not cheap based on traditional metrics. However, we are still finding high-conviction investment ideas with a focus on limiting downside risk in each holding. Specifically, we believe
32
| Management’s Discussion of Fund Performance (Unaudited) (Continued) | |
downside risk is mitigated by remaining focused on those companies with pricing power, high levels of cash generation and prudent capital allocation.
Our strategy focuses on stocks from a bottom-up standpoint. We seek companies with strong returns on capital and the flexibility to enhance shareholder value using the balance sheet. Low interest rates and relatively high equity risk premiums enable companies to increase shareholder value by adjusting the capital structure of the company. We expect investors to reward companies that wisely deploy capital including higher dividends, share repurchases and mergers and acquisitions transactions. Going forward, we believe the Fund is positioned well for a slow growth environment that rewards strong capital allocation.
33
| | Management’s Discussion of Fund Performance (Unaudited) (Continued) |
Comparison of the Change in Value of a $10,000 Investment in the
Touchstone Small Cap Fund - Class A* and the
Russell 2000® Index
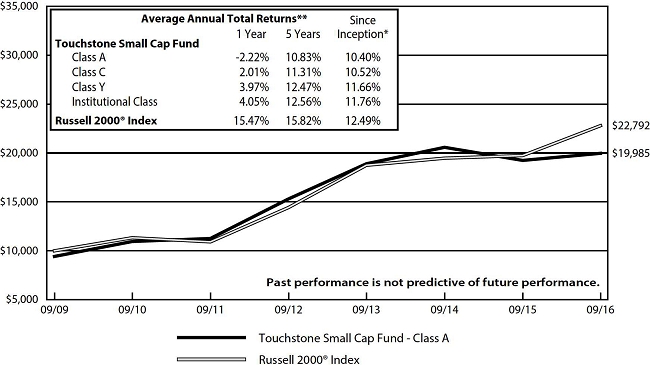
| | * | The chart above represents performance of Class A shares only, which will vary from the performance of Class C shares, Class Y shares and Institutional Class shares based on the differences in sales loads and fees paid by shareholders in the different classes. The inception date of the Fund was September 30, 2009. The returns of the index listed above are based on the inception date of the Fund. |
| | | |
| | ** | The average annual total returns shown above are adjusted for maximum sales loads and fees, if applicable. The maximum offering price per share of Class A shares is equal to the net assets value (“NAV”) per share plus a sales load equal to 6.10% of the NAV (or 5.75% of the offering price). Class C shares are subject to a contingent deferred sales charge (“CDSC”) of 1.00%. The CDSC will be assessed on an amount equal to the lesser of (1) the NAV at the time of purchase of the shares being redeemed or (2) the NAV of such shares being redeemed, if redeemed within a one-year period from the date of purchase. Class Y shares and Institutional Class shares are not subject to sales charges. |
The performance of the above Fund does not reflect the deduction of taxes that a shareholder would pay on Fund distributions or the redemption of Fund shares.
Note to Chart
Russell 2000® Index measures the performance of the small-cap segment of the U.S. equity universe.
The Frank Russell Company (FRC) is the source and owner of the data contained or reflected in this material and all trademarks and copyrights related thereto. The material may contain confidential information and unauthorized use, disclosure, copying, dissemination or redistribution is strictly prohibited. This is a Touchstone Investments presentation of the data, and FRC is not responsible for the formatting or configuration of this material or for any inaccuracy in the presentation thereof.
34
| Management’s Discussion of Fund Performance (Unaudited) | |
Touchstone Small Cap Value Fund
Sub-Advised by LMCG Investments, LLC
Effective July 1, 2016, LMCG Investments, LLC was appointed sub-advisor to the Touchstone Small Cap Value Fund. LMCG manages the Fund in accordance with its small cap value strategy, however there were no changes to the Fund’s investment goal or principal risks.
Investment Philosophy
The Touchstone Small Cap Value Fund seeks long-term capital growth by investing primarily in common stocks of small capitalization companies. The Fund seeks to identify companies believed to be selling at a discount to their intrinsic value.
Fund Performance
The Touchstone Small Cap Value Fund (Class A Shares) underperformed its benchmark, the Russell 2000® Value Index, for the 12-month period ended September 30, 2016. The Fund’s total return was 15.63 percent (excluding the maximum sales charge) while the benchmark’s total return was 18.81 percent.
Market Environment
The first half of the 12-month period closed amid a slowing global economic backdrop, an interest rate increase imposed by the U.S. Federal Reserve Board (Fed), a stronger U.S. dollar and a rocky ride for commodities and cyclical stocks. Company balance sheet strength also proved to be particularly important during this time, along with quality in terms of earnings and returns on equity. The start of 2016 opened with growing investor concerns about the health of the global economy, with many investors pricing in a global recession. However, midway through the first quarter of 2016, sentiment reversed as a result of better-than-expected economic news in China and commentary from the Fed that suggested a slower path to increasing interest rates. Investors interpreted the Fed’s commentary as bearish for the U.S. dollar, which benefited cyclical and commodity-related stocks.
Most recently, the impact of the narrowly decided vote by Great Britain to exit the European Union (Brexit) shocked the market during the last few weeks of June, but the overall tone was relatively muted during the final months of the period. This, along with optimistic comments from the European Central Bank and the Fed, drove the rotation out of higher quality, more defensive stocks and into smaller, lower quality stocks with higher beta1.
During the 12-month period, mid-cap, small-cap and large-cap stocks all posted similar returns. From a style standpoint within the small-cap universe, value stocks outperformed growth stocks for the period.
Portfolio Review
The Fund’s strongest contributors to performance were reported in the Energy, Materials and Real Estate sectors. Primary detractors were from the Consumer Staples, Consumer Discretionary and Utilities sectors.
Stock selection drove performance in the Energy sector, with particular strength in the Fund’s positions in Patterson-UTI Energy Inc. and U.S. Silica Holdings Inc. Stock selection within the Real Estate sector also contributed to performance. The Fund’s position in Corporate Office Properties, a Real Estate Investment Trust (REIT), was the sector’s leading contributor. The Fund’s overweight to the Materials sector particularly benefited the Fund’s portfolio.
The Fund’s underweight to the Consumer Staples sector along with negative stock selection detracted from performance. The Fund’s Food, Beverage & Tobacco holdings, including Treehouse Foods Inc. and Hain Celestial
35
| | Management’s Discussion of Fund Performance (Unaudited) (Continued) |
Group Inc, accounted for nearly all of the underperformance in the sector. The Fund’s underweight to Household & Personal Products companies also detracted from returns on a relative basis. The Fund’s underperformance in the Consumer Discretionary sector was due entirely to its overweight and stock selection within retailers, where stock selection decisions in Tailored Brands Inc., Chico’s FAS Inc. and The Buckle Inc. detracted the most from relative performance. Finally, the Fund’s Utilities sector holdings and its underweight to the sector overall detracted from performance. The Fund was underweight in Real Estate Investment Trusts (REITs) and the Utilities sector given valuation concerns.
Outlook
From a macroeconomic standpoint, we believe an improving global economic environment would benefit the Fund on a relative basis. In the short term, these sectors have historically performed opposite of the direction in interest rates. Given how low interest rates have been globally, we believe any positive economic news could cause rates to move higher and cause these bond-proxy sectors to underperform.
Looking ahead, our greatest concern is that the market environment will continue to reward growth and visibility, irrespective of valuation and quality. However, we will not deviate from our process of buying high-quality companies that are temporarily out of favor and believe that buying growth and visibility, irrespective of valuation, is a risky strategy. We will continue to seek attractively valued investment opportunities with favorable risk/reward profiles.
The Fund utilizes a classic value-driven philosophy based on the belief that leading businesses selling at a discount to fair value have the potential to generate excess returns. The strategy focuses on stocks that are temporarily out of favor in the market, specifically, companies with higher returns on capital, free cash flow and strong balance sheets. Emphasis is placed on those companies having the cash flow characteristics as well as the balance sheet strength necessary to buffer the company from any prolonged weakness. The companies in the Fund’s portfolio often dominate a particular industry niche and generally have significant barriers to entry. As a result, we believe they are able to perpetuate a higher return on capital over time. The Fund’s overall investment process utilizes fundamental bottom-up security selection, while risk-control measures ensure security and sector diversification.
1Beta is a measure of the volatility of a portfolio relative to its benchmark.
36
| Management’s Discussion of Fund Performance (Unaudited) (Continued) | |
Comparison of the Change in Value of a $10,000 Investment in the
Touchstone Small Cap Value Fund - Class A* and the
Russell 2000® Value Index

| * | The chart above represents performance of Class A shares only, which will vary from the performance of Class C shares, Class Y shares and Institutional Class shares based on the differences in sales loads and fees paid by shareholders in the different classes. The inception date of Class A shares, Class C shares, Class Y shares, Class Z shares and Institutional Class shares was March 1, 2011, March 1, 2011, March 1, 2011, March 4, 2002 and March 1, 2011, respectively. On June 10, 2011, Class Z shares were converted to Class A shares. Class A shares, Class C shares, Class Y shares and Institutional Class shares performance was calculated using the historical performance of Class Z shares for the periods prior to March 1, 2011. The returns have been restated for sales loads and fees applicable to Class A, Class C, Class Y and Institutional Class shares. The returns of the index listed above are based on the inception date of the Fund. | |
| | | |
| ** | The average annual total returns shown above are adjusted for maximum sales loads and fees, if applicable. The maximum offering price per share of Class A shares is equal to the net assets value (“NAV”) per share plus a sales load equal to 6.10% of the NAV (or 5.75% of the offering price). Class C shares are subject to a contingent deferred sales charge (“CDSC”) of 1.00%. The CDSC will be assessed on an amount equal to the lesser of (1) the NAV at the time of purchase of the shares being redeemed or (2) the NAV of such shares being redeemed, if redeemed within a one-year period from the date of purchase. Class Y shares and Institutional Class shares are not subject to sales charges. | |
The performance of the above Fund does not reflect the deduction of taxes that a shareholder would pay on Fund distributions or the redemption of Fund shares.
Note to Chart
Russell 2000® Value Index measures the performance of those Russell 2000 companies with lower price-to-book ratios and lower forecasted growth values.
The Frank Russell Company (FRC) is the source and owner of the data contained or reflected in this material and all trademarks and copyrights related thereto. The material may contain confidential information and unauthorized use, disclosure, copying, dissemination or redistribution is strictly prohibited. This is a Touchstone Investments presentation of the data, and FRC is not responsible for the formatting or configuration of this material or for any inaccuracy in the presentation thereof.
37
| | Management’s Discussion of Fund Performance (Unaudited) |
Touchstone Total Return Bond Fund
Sub-Advised by EARNEST Partners LLC
Investment Philosophy
The Touchstone Total Return Bond Fund seeks current income. Capital appreciation is a secondary goal. The Fund invests primarily in fixed income securities or sectors that are considered undervalued for their risk characteristics.
Fund Performance
The Touchstone Total Return Bond Fund (Class A Shares) underperformed its benchmark, the Bloomberg Barclays U.S. Aggregate Bond Index for the 12-month period ended September 30, 2016. The Fund’s total return was 4.57 percent (excluding the maximum sales charge) while the benchmark’s total return was 5.19 percent.
Market Environment
During the last 12 months, economic data was relatively volatile on a month-to-month basis but remarkably consistent when aggregated and viewed as a whole over the course of the year. Though strong U.S. job growth continued during the period, the unemployment rate fell only slightly as more workers were drawn back into the labor force, increasing the participation rate. In aggregate, the labor market tightened and drove wage increases. The solid labor market, strong home values and tepid inflation helped create an environment of confident consumers who increased their spending. While market participants across asset classes believed this could trigger higher economic growth, this scenario did not manifest as gross domestic product (GDP) growth fell during the year due to high inventories and continued weakness in business investment.
Outside of the U.S., global central banking actions, economic growth in China and Britain’s decision to exit the European Union (Brexit) dominated the macroeconomic picture. Global central banks engaged in unprecedented levels of monetary easing, sending a significant amount of global bond yields into negative territory. Higher market volatility was driven by declining growth rates for China’s economy and the historic Brexit vote, the ultimate impact of which remains largely unknown.
During the period, the month-to-month volatility mentioned above, an irreconcilable combination of economic data points and challenging global forces kept the U.S. Federal Reserve Board (Fed) largely on the sidelines. The Fed raised interest rates in December 2015, and it was widely expected that more rate increases would follow in 2016. Instead, the Fed left rates unchanged during the period and consistently pushed down expectations for the path of future rate hikes. While short rates increased, the 10-year Treasury yield and other long rates declined, flattening the yield curve.
Portfolio Review
Declining interest rates and steady economic data created a healthy environment for fixed income investments. As such, the Bloomberg Barclays U.S. Aggregate Bond Index outperformed similar duration U.S. Treasuries during the period. In the persistently low rate environment, spread sectors performed well due to investor demand for their income advantage over government bonds. The stable economic data provided a favorable backdrop for credit-sensitive securities, such as U.S. Corporate Bonds, Commercial Mortgage-Backed Securities (CMBS), and Asset-Backed Securities (ABS). Relative to Treasuries, higher quality spread sectors such as Mortgage-Backed Securities (MBS) and Agency Multi-Family MBS also outperformed due to the low interest rate environment, the strength of the housing market and robust occupancy/rent fundamentals.
The low interest rate environment helped create additional demand for spread products, which was the primary tailwind to Fund performance. Conversely, strong performance within U.S. Corporate Bonds in an environment
38
| Management’s Discussion of Fund Performance (Unaudited) (Continued) | |
of declining revenues, increasing debt loads and low economic growth was the primary headwind and detractor of Fund performance due in part to the Fund’s slight underweight to that sector. Additionally, the Fund tends to invest in bonds with less spread duration than the sector overall. While this was beneficial when credit spreads were widening during calendar year 2015, the Fund’s corporate allocation lagged amid the strong tightening of credit spreads in 2016. In general, the Fund did not decline as much in the sell-offs of 2015 and therefore had less need and room to recover.
The Fund does not make active interest rate bets. Its duration was approximately matched to that of the benchmark during the period.
Outlook
Due to the continued tightening of spreads during the period, bond investors may become more aware of corporate earnings and economic growth in the months ahead. As such, we believe these higher valuations in credit-sensitive sectors may need to be justified with stronger fundamentals. The tightening experienced thus far in 2016 could reverse if revenues continue to contract, GDP growth remains tepid and earnings growth remains reliant on buybacks fueled by debt issuance. This could be a tailwind for the Fund if credit-sensitive spread sectors are avoided in favor of higher quality spread sectors. The Fund’s credit-sensitive bonds could also perform relatively well in this type of environment. Looking ahead, we believe the Fund is well positioned across the changing interest rate and economic growth environments of a full investment cycle.
39
| | Management’s Discussion of Fund Performance (Unaudited) (Continued) |
Comparison of the Change in Value of a $10,000 Investment in the
Touchstone Total Return Bond Fund - Class A* and the
Bloomberg Barclays U.S. Aggregate Bond Index

| | * | The chart above represents performance of Class A shares only, which will vary from the performance of Class C shares, Class Y shares and Institutional Class shares based on the differences in sales loads and fees paid by shareholders in the different classes. The inception date of Class A shares, Class C shares, Class Y shares and Institutional Class shares was August 16, 2010, August 1, 2011, November 15, 1991 and August 1, 2011, respectively. Class A shares, Class C shares and Institutional Class shares performance was calculated using the historical performance of Class Y shares for the periods prior to August 16, 2010, August 1, 2011 and August 1, 2011, respectively. The returns have been restated for sales loads and fees applicable to Class A, Class C and Institutional Class shares. The returns of the index listed above are based on the inception date of the Fund. |
| | | |
| | ** | The average annual total returns shown above are adjusted for maximum sales loads and fees, if applicable. The maximum offering price per share of Class A shares is equal to the net asset value (“NAV”) per share plus a sales load equal to 4.99% of the NAV (or 4.75% of the offering price). Class C shares are subject to a contingent deferred sales charge (“CDSC”) of 1.00%. The CDSC will be assessed on an amount equal to the lesser of (1) the NAV at the time of purchase of the shares being redeemed or (2) the NAV of such shares being redeemed, if redeemed within a one-year period from date of purchase. Class Y shares and Institutional Class shares are not subject to sales charges. |
The performance of the above Fund does not reflect the deduction of taxes that a shareholder would pay on Fund distributions or the redemption of Fund shares.
Note to Chart
Bloomberg Barclays U.S. Aggregate Bond Index is an unmanaged index comprised of U.S. investment grade, fixed rate bond market securities, including government, government agency, corporate and mortgage-backed securities between one and ten years.
40
| Management’s Discussion of Fund Performance (Unaudited) | |
Touchstone Ultra Short Duration Fixed Income Fund
Sub-Advised by Fort Washington Investment Advisors, Inc.
Investment Philosophy
The Touchstone Ultra Short Duration Fixed Income Fund seeks maximum total return consistent with the preservation of capital by primarily investing in a diversified portfolio of fixed income securities of different maturities, including U.S. Treasury securities, U.S. government agency and U.S. government-sponsored enterprise securities, corporate bonds, mortgage-backed securities, commercial mortgage-backed securities, asset-backed securities, municipal bonds and cash equivalent securities including repurchase agreements and commercial paper. While the Fund may invest in securities of any maturity or duration, interest rate risk is managed by maintaining an effective duration of one year or less under normal market conditions.
Fund Performance
The Touchstone Ultra Short Duration Fixed Income Fund (Class A Shares) outperformed its benchmarks, the BofA Merrill Lynch 3-Month U.S. Treasury Bill Index and the BofA Merrill Lynch 1-Year U.S. Treasury Note Index for the 12-month period ended September 30, 2016. The Fund’s total return was 1.35 percent (excluding the maximum sales charge) while the total returns of its benchmarks were 0.27 percent and 0.54 percent, respectively.
Market Environment
The Fund’s fiscal year was characterized by increased volatility in both interest rates and credit spreads. This volatility was driven by several macroeconomic trends, including a sharp decline in commodity prices, economic weakness in China and emerging markets, Britain’s vote to exit the European Union (Brexit), and money market fund reform.
During the first half of the period, a slowdown in Chinese and emerging market growth began to weigh heavily on commodity prices. With lower expected demand out of China and a high supply from continued production by the U.S. and the Organization of Petroleum Exporting Countries (OPEC), crude oil was hit particularly hard and prices dropped dramatically. Within the U.S., solid economic growth and a strengthening labor market provided support for the U.S. Federal Reserve Board (Fed) to raise interest rates in December.
By early 2016, “risk-off” sentiment was pervasive, as the market seemed to finally recognize the gravity of falling commodity prices and weakness in Asia and emerging markets. A strong flight to quality ensued, pushing U.S. Treasury yields lower and widening credit spreads. In an effort to assuage the markets, the Fed stated that it was not in a rush to continue raising interest rates. Meanwhile, China took measures to bolster the yuan and Saudi Arabia began discussing a freeze in oil production, which caused oil prices to bottom and begin to recover. The bottoming of commodity prices seemed to be an inflection point for investor sentiment. While gross domestic product (GDP) growth remained soft, accommodative central bank policy and improved investor sentiment sparked a rally in risk assets.
By mid-year 2016, risk premiums had regained much of their previously lost ground, bolstered by recovering energy prices and economic stability overseas. A weak jobs report in May and the Brexit vote in June helped ensure that the Fed would need more time and data before resuming rate increases. This spurred a further rally in risk assets.
More specific to short duration securities, money market reform has considerably changed the landscape in the front end of the yield curve. During the past year, over $1 trillion in assets have moved out of prime money market funds (which now have floating net asset values, liquidity gates and fees) and into government money market funds (which have stable $1 net asset values and no gates or fees). The resulting demand for very short
41
| | Management’s Discussion of Fund Performance (Unaudited) (Continued) |
duration government securities has kept those rates low while corporations have been forced to offer higher commercial paper rates and seek alternative funding in the markets. The Fund has benefited from this technical dislocation by increasing exposure to high-quality, short-term corporate bonds and commercial paper.
Portfolio Review
Outperformance was primarily driven by the Fund’s favorable sector exposures (limited exposure to government securities and emphasis on structured securities) and security selection. With the labor market on solid footing and job growth continuing, consumer confidence remains near post-crisis highs, benefiting the consumer-oriented residential mortgage-backed securities (RMBS) and asset-backed securities (ABS) held by the Fund.
Credit spreads in the short duration markets were reflective of the broader fixed income market, but short duration securities did not enjoy the same move lower in interest rates that intermediate term bonds did. In fact, very short rates moved notably higher during the year. For non-U.S. Treasury securities, this increase in rates was offset by tighter spreads. The Fund employs a strategy that places greater emphasis on structured securities, such as commercial mortgage-backed securities (CMBS), ABS and Agency ABS, which seek to generate returns by investing a portion of its assets in high-quality, higher yielding spread sectors with higher liquidity premiums. Its focus on securities with low spread duration (or low price sensitivity to changes in spreads) helped to mitigate the higher volatility that is typically found in these sectors.
Sector allocations saw few meaningful changes during the fiscal year. CMBS exposure increased. Though CMBS is one of the highest-returning sub-sectors, supply remains limited and bonds with attractive risk-return profiles in this sector are difficult to source. A technical dislocation driven by money market fund reform produced attractive opportunities in very short duration corporate bonds. The Fund increased its exposure in these securities to take advantage of the mispricing. Cash exposure declined as a result of the increased allocations to CMBS and corporate bonds. The Fund’s exposure to Agency mortgage-backed securities (MBS) was at a historically low level due to the dearth of value in that market. As of the end of the fiscal year, the Corporate Bond and ABS sectors were the two most significant Fund weights.
The Fund’s interest rate risk also declined during the year. By reducing longer key rate duration and maintaining significant floating rate exposure, the Fund’s sensitivity to changing rates is lower which we believe will be beneficial in a rising interest rate environment.
Outlook
The Fund remained moderately underweight in duration and overweight in the non-Treasury sectors. In our view, domestic economic fundamentals are still supportive of credit risk, and we believe that any Asian/European idiosyncratic risks will not materially weaken U.S. economic prospects. We believe consumer, residential mortgage and commercial real estate fundamentals remain on sound footing, but corporate fundamentals have softened. As a result, the risk profile of the Fund’s corporate bond holdings has been reduced and is at a historically low level.
The short duration position reflects concern about recent volatility, low spreads and relatively low interest rates. While it is difficult to predict changes in rates, the Fed has voiced its desire to continue to increase interest rates in an effort to remove extraordinarily accommodative monetary policies. Given that the market is not positioned for increasing inflation or multiple Fed rate hikes, we believe that the yield curve could experience greater volatility going forward.
Volatility and wider spreads - a “risk off” market - tend to favor the Fund’s investment strategy. As long as U.S. economic fundamentals remain on sound footing, risk premiums could continue to oscillate as the markets react to the many extraneous influences, creating opportunities to deploy cash at more attractive levels. Against this backdrop of reasonable domestic economic growth with the potential for continued volatility, the Fund’s
42
| Management’s Discussion of Fund Performance (Unaudited) (Continued) | |
current strategy of targeting shorter duration securities with a concentrated maturity distribution, and overweighting non-government securities with select exposure to ABS sectors, should perform well. We believe the duration positioning should help to buffer the effects of a flatter curve and higher rates, while economic conditions should continue to support credit fundamentals in the non-government sectors.
43
| | Management’s Discussion of Fund Performance (Unaudited) (Continued) |
Comparison of the Change in Value of a $10,000 Investment in the
Touchstone Ultra Short Duration Fixed Income Fund - Class A*,
the BofA Merrill Lynch 3-Month U.S. Treasury Bill Index
and the BofA Merrill Lynch 1-Year U.S. Treasury Note Index

| | * | The chart above represents performance of Class A shares only, which will vary from the performance of Class C shares, Class Y shares, Institutional Class shares and Class Z shares based on the differences in sales loads and fees paid by shareholders in the different classes. The inception date of Class A shares, Class C shares, Class Y shares, Class Z shares and Institutional Class shares was April 12, 2012, April 12, 2012, April 12, 2012, March 1, 1994 and April 12, 2012, respectively. Class A shares, Class C shares, Class Y shares and Institutional Class shares performance was calculated using the historical performance of Class Z shares for the periods prior to April 12, 2012. The returns have been restated for sales loads and fees applicable to Class A, Class C, Class Y and Institutional Class shares. The returns of the indexes listed above are based on the inception date of the Fund. |
| | | |
| | ** | The average annual total returns shown above are adjusted for maximum sales loads and fees, if applicable. The maximum offering price per share of Class A shares is equal to the net asset value (“NAV”) per share plus a sales load equal to 2.04% of the NAV (or 2.00% of the offering price). Class C shares are subject to a contingent deferred sales charge (“CDSC”) of 1.00%. The CDSC will be assessed on an amount equal to the lesser of (1) the NAV at the time of purchase of the shares being redeemed or (2) the NAV of such shares being redeemed, if redeemed within a one-year period from date of purchase. Class Y shares, Class Z shares, and Institutional Class shares are not subject to sales charges. |
The performance of the above Fund does not reflect the deduction of taxes that a shareholder would pay on Fund distributions or the redemption of Fund shares.
Notes to Chart
BofA Merrill Lynch 3-Month U.S. Treasury Bill Index is an unmanaged index of Treasury securities maturing in 90 days that assumes reinvestment of all income.
BofA Merrill Lynch 1-Year U.S. Treasury Note Index is an unmanaged index comprised of a single issue purchased at the beginning of the month and held for a full month. The issue selected at each month-end rebalancing is the outstanding two-year Treasury Note Bill that matures closest to, but, not beyond one year from the rebalancing date.
44
Tabular Presentation of Portfolios of Investments (Unaudited)
September 30, 2016 | |
The tables below provide each Fund’s geographic allocation, sector allocation or credit quality. We hope it will be useful to shareholders as it summarizes key information about each Fund’s investments.
| Touchstone Arbitrage Fund | | |
| Sector Allocation* | | (% of Net Assets) | |
| Long Positions | | | | |
| Common Stocks | | | | |
| Information Technology | | | 21.4 | % |
| Health Care | | | 18.3 | |
| Financials | | | 13.7 | |
| Consumer Discretionary | | | 11.3 | |
| Consumer Staples | | | 7.7 | |
| Utilities | | | 6.6 | |
| Industrials | | | 3.0 | |
| Real Estate | | | 2.7 | |
| Materials | | | 1.2 | |
| Energy | | | 1.0 | |
| Corporate Bonds | | | 7.1 | |
| Exchange Traded Funds | | | 2.3 | |
| Commercial Mortgage-Backed Security | | | 1.0 | |
| Preferred Stock | | | 0.2 | |
| Purchased Put Options | | | 0.0 | |
| Investment Funds | | | 8.2 | |
| Cash Collateral for Securities Sold Short and Written Options | | | 23.9 | |
| Other Assets/Liabilities (Net) | | | 1.3 | |
| | | | 130.9 | |
| Short Positions | | | | |
| Common Stocks | | | | |
| Financials | | | (9.5 | ) |
| Health Care | | | (6.6 | ) |
| Information Technology | | | (3.6 | ) |
| Consumer Discretionary | | | (3.0 | ) |
| Real Estate | | | (2.7 | ) |
| Utilities | | | (1.5 | ) |
| Materials | | | (0.6 | ) |
| Exchange Traded Funds | | | (3.4 | ) |
| Written Put Options | | | (0.0 | ) |
| Written Call Options | | | (0.0 | ) |
| | | | (30.9 | ) |
| Total | | | 100.0 | % |
| Touchstone Emerging Markets Small Cap Fund | |
| Geographic Allocation | | (% of Net Assets) | |
| Common Stocks | | | | |
| South Korea | | | 17.4 | % |
| Taiwan | | | 15.4 | |
| Cayman Islands | | | 15.1 | |
| India | | | 9.4 | |
| South Africa | | | 6.6 | |
| Brazil | | | 5.3 | |
| Thailand | | | 5.0 | |
| China | | | 4.1 | |
| Indonesia | | | 3.3 | |
| Mexico | | | 2.8 | |
| Philippines | | | 2.5 | |
| Malaysia | | | 2.3 | |
| Hungary | | | 2.2 | |
| Poland | | | 2.0 | |
| Hong Kong | | | 1.5 | |
| United States | | | 1.3 | |
| Jersey | | | 1.2 | |
| United Kingdom | | | 1.0 | |
| Bermuda | | | 0.9 | |
| Russia | | | 0.7 | |
| Exchange Traded Fund | | | 1.0 | |
| Investment Funds | | | 1.4 | |
| Other Assets/Liabilities (Net) | | | (2.4 | ) |
| Total | | | 100.0 | % |
| * | Sector Classifications are based upon the Global Industry Classification Standard (GICS®). |
45
| | Tabular Presentation of Portfolios of Investments (Unaudited) (Continued) |
| Touchstone Merger Arbitrage Fund | |
| Sector Allocation* | | (% of Net Assets) | |
| Long Positions | | | | |
| Common Stocks | | | | |
| Information Technology | | | 17.8 | % |
| Health Care | | | 13.5 | |
| Financials | | | 11.5 | |
| Consumer Discretionary | | | 9.5 | |
| Consumer Staples | | | 6.1 | |
| Utilities | | | 4.8 | |
| Industrials | | | 2.0 | |
| Real Estate | | | 1.8 | |
| Energy | | | 1.0 | |
| Materials | | | 0.9 | |
| Corporate Bonds | | | 17.1 | |
| Commercial Mortgage-Backed Securities | | | 2.1 | |
| Exchange Traded Funds | | | 3.3 | |
| Preferred Stock | | | 0.3 | |
| Warrant | | | 0.1 | |
| Purchased Put Options | | | 0.0 | |
| Investment Fund | | | 26.1 | |
| Cash Collateral for Securities Sold Short and Written Options | | | 7.5 | |
| Other Assets/Liabilities (Net) | | | (0.4 | ) |
| | | | 125.0 | |
| Short Positions | | | | |
| Common Stocks | | | | |
| Financials | | | (6.7 | ) |
| Health Care | | | (4.7 | ) |
| Information Technology | | | (3.2 | ) |
| Consumer Discretionary | | | (2.3 | ) |
| Real Estate | | | (1.8 | ) |
| Utilities | | | (1.1 | ) |
| Materials | | | (0.5 | ) |
| Exchange Traded Funds | | | (4.6 | ) |
| Written Put Options | | | (0.1 | ) |
| Written Call Options | | | (0.0 | ) |
| | | | (25.0 | ) |
| Total | | | 100.0 | % |
| Touchstone Mid Cap Fund | |
| Sector Allocation* | | (% of Net Assets) | |
| Consumer Discretionary | | | 25.8 | % |
| Information Technology | | | 16.9 | |
| Industrials | | | 15.9 | |
| Financials | | | 14.0 | |
| Materials | | | 13.8 | |
| Consumer Staples | | | 9.7 | |
| Health Care | | | 1.5 | |
| Investment Funds | | | 8.2 | |
| Other Assets/Liabilities (Net) | | | (5.8 | ) |
| Total | | | 100.0 | % |
| Touchstone Mid Cap Value Fund | |
| Sector Allocation* | | (% of Net Assets) | |
| Financials | | | 20.8 | % |
| Industrials | | | 11.9 | |
| Information Technology | | | 11.6 | |
| Health Care | | | 11.1 | |
| Consumer Discretionary | | | 9.0 | |
| Utilities | | | 8.8 | |
| Energy | | | 7.8 | |
| Real Estate | | | 7.6 | |
| Materials | | | 6.9 | |
| Consumer Staples | | | 5.5 | |
| Investment Funds | | | 3.1 | |
| Other Assets/Liabilities (Net) | | | (4.1 | ) |
| Total | | | 100.0 | % |
| | * | Sector Classifications are based upon the Global Industry Classification Standard (GICS®). |
46
| Tabular Presentation of Portfolios of Investments (Unaudited) (Continued) | |
| Touchstone Premium Yield Equity Fund | |
| Sector Allocation* | | (% of Net Assets) | |
| Health Care | | | 19.9 | % |
| Information Technology | | | 14.7 | |
| Real Estate | | | 12.8 | |
| Energy | | | 11.0 | |
| Financials | | | 8.3 | |
| Telecommunication Services | | | 8.0 | |
| Industrials | | | 7.0 | |
| Consumer Discretionary | | | 6.7 | |
| Materials | | | 4.3 | |
| Consumer Staples | | | 3.1 | |
| Investment Fund | | | 4.1 | |
| Other Assets/Liabilities (Net) | | | 0.1 | |
| Total | | | 100.0 | % |
| Touchstone Small Cap Fund | |
| Sector Allocation* | | (% of Net Assets) | |
| Industrials | | | 26.0 | % |
| Consumer Discretionary | | | 24.8 | |
| Materials | | | 11.6 | |
| Real Estate | | | 10.2 | |
| Consumer Staples | | | 8.3 | |
| Financials | | | 7.4 | |
| Energy | | | 4.5 | |
| Information Technology | | | 3.9 | |
| Health Care | | | 2.1 | |
| Investment Funds | | | 11.2 | |
| Other Assets/Liabilities (Net) | | | (10.0 | ) |
| Total | | | 100.0 | % |
| Touchstone Sands Capital Select Growth Fund | |
| Sector Allocation* | | (% of Net Assets) | |
| Information Technology | | | 48.3 | % |
| Health Care | | | 22.1 | |
| Consumer Discretionary | | | 19.8 | |
| Financials | | | 3.5 | |
| Materials | | | 2.4 | |
| Energy | | | 2.0 | |
| Investment Funds | | | 7.0 | |
| Other Assets/Liabilities (Net) | | | (5.1 | ) |
| Total | | | 100.0 | % |
| Touchstone Small Cap Value Fund | |
| Sector Allocation* | | (% of Net Assets) | |
| Financials | | | 26.2 | % |
| Industrials | | | 21.0 | |
| Information Technology | | | 13.4 | |
| Consumer Discretionary | | | 9.5 | |
| Health Care | | | 5.2 | |
| Materials | | | 5.1 | |
| Utilities | | | 4.6 | |
| Consumer Staples | | | 4.5 | |
| Real Estate | | | 4.4 | |
| Energy | | | 3.4 | |
| Telecommunication Services | | | 0.7 | |
| Exchange Traded Fund | | | 0.1 | |
| Investment Funds | | | 0.7 | |
| Other Assets/Liabilities (Net) | | | 1.2 | |
| Total | | | 100.0 | % |
| * | Sector Classifications are based upon the Global Industry Classification Standard (GICS®). | |
47
| | Tabular Presentation of Portfolios of Investments (Unaudited) (Continued) |
| Touchstone Total Return Bond Fund | |
| Credit Quality* | (% of Investment Securities) | |
| AAA/Aaa | | | 56.7 | % |
| AA/Aa | | | 8.4 | |
| A/A | | | 9.7 | |
| BBB/Baa | | | 14.1 | |
| BB/Ba | | | 2.9 | |
| B/B | | | 0.8 | |
| CCC | | | 0.5 | |
| Not Rated | | | 6.9 | |
| Total | | | 100.0 | % |
Touchstone Ultra Short Duration Fixed Income
Fund | |
| Credit Quality* | (% of Investment Securities) | |
| AAA/Aaa | | | 28.9 | % |
| AA/Aa | | | 13.1 | |
| A/A | | | 17.8 | |
| BBB/Baa | | | 26.4 | |
| BB/Ba | | | 0.1 | |
| CCC | | | 0.3 | |
| Not Rated | | | 13.4 | |
| Total | | | 100.0 | % |
* Credit quality ratings are from Standard & Poor’s (“S&P”) and Moody’s Investors Service (“Moody’s”). If agency ratings differ, the higher rating will be used. Where no rating has been assigned, it may be for reasons unrelated to the creditworthiness of the issuer.
48
Portfolio of Investments
Touchstone Arbitrage Fund – September 30, 2016 | |
| | | Shares | | | Market
Value | |
| |
| Common Stocks — 86.9% | | | | | | | | |
| |
| Information Technology — 21.4% |
| Alphabet, Inc. - Class C* | | | 1,004 | | | $ | 780,399 | |
| AVG Technologies NV (Netherlands)* | | | 89,769 | | | | 2,245,123 | |
| Cvent, Inc.*†† | | | 57,410 | | | | 1,820,471 | |
| Dell Technologies, Inc. - VMware Inc. - Class V* | | | 15,983 | | | | 763,988 | |
| Fleetmatics Group PLC (Ireland)*†† | | | 90,102 | | | | 5,404,318 | |
| InContact, Inc.*†† | | | 388,175 | | | | 5,426,687 | |
| KLA-Tencor Corp.†† | | | 75,990 | | | | 5,297,263 | |
| LinkedIn Corp. - Class A*†† | | | 28,806 | | | | 5,505,403 | |
| NetSuite, Inc.* | | | 29,601 | | | | 3,276,535 | |
| Rackspace Hosting, Inc.* | | | 73,510 | | | | 2,329,532 | |
| | | | | | | | 32,849,719 | |
| |
| Health Care — 18.3% | | | | | | | | |
| Alere, Inc.*†† | | | 64,585 | | | | 2,792,655 | |
| Cepheid* | | | 87,580 | | | | 4,614,590 | |
| Cynapsus Therapeutics, Inc. (Canada)* | | | 85,190 | | | | 3,426,342 | |
| Envision Healthcare Holdings, Inc.* | | | 215,652 | | | | 4,802,570 | |
| Quintiles IMS Holdings, Inc.* | | | 37,202 | | | | 3,015,594 | |
| Raptor Pharmaceutical Corp.* | | | 515,000 | | | | 4,619,550 | |
| St Jude Medical, Inc.†† | | | 60,580 | | | | 4,831,861 | |
| | | | | | | | 28,103,162 | |
| |
| Financials — 13.7% | | | | | | | | |
| American Capital Ltd.* | | | 281,841 | | | | 4,765,931 | |
| Astoria Financial Corp.†† | | | 343,230 | | | | 5,011,158 | |
| Cardinal Financial Corp. | | | 170,870 | | | | 4,457,998 | |
| National Interstate Corp.†† | | | 60,889 | | | | 1,980,719 | |
| PrivateBancorp, Inc.†† | | | 104,650 | | | | 4,805,528 | |
| | | | | | | | 21,021,334 | |
| |
| Consumer Discretionary — 11.3% | | | | | | | | |
| Carmike Cinemas, Inc.* | | | 134,629 | | | | 4,401,022 | |
| CST Brands, Inc. | | | 109,780 | | | | 5,279,320 | |
| Media General, Inc.* | | | 180,000 | | | | 3,317,400 | |
| Starz - Class A*†† | | | 140,260 | | | | 4,374,710 | |
| | | | | | | | 17,372,452 | |
| |
| Consumer Staples — 7.7% | | | | | | | | |
| SABMiller PLC ADR | | | 20,000 | | | | 1,161,800 | |
| SABMiller PLC (United Kingdom) | | | 100,400 | | | | 5,848,217 | |
| WhiteWave Foods Co.* | | | 89,322 | | | | 4,861,796 | |
| | | | | | | | 11,871,813 | |
| |
| Utilities — 6.6% | | | | | | | | |
| ITC Holdings Corp. | | | 97,810 | | | | 4,546,209 | |
| Piedmont Natural Gas Co., Inc.†† | | | 94,124 | | | | 5,651,205 | |
| | | | | | | | 10,197,414 | |
| |
| Industrials — 3.0% | | | | | | | | |
| Virgin America, Inc.*†† | | | 85,930 | | | | 4,598,114 | |
| |
| Real Estate — 2.7% | | | | | | | | |
| Post Properties, Inc. REIT | | | 61,685 | | | | 4,079,229 | |
| | | Shares | | | Market
Value | |
| | | | | | | |
| Materials — 1.2% | | | | | | | | |
| AEP Industries, Inc. | | | 16,800 | | | $ | 1,837,416 | |
| | | | | | | | | |
| Energy — 1.0% | | | | | | | | |
| Bankers Petroleum Ltd. (Canada)* | | | 883,600 | | | | 1,481,703 | |
| Total Common Stocks | | | | | | $ | 133,412,356 | |
Principal
Amount | | | | | | |
| | | | | | | | | |
| | | | | Corporate Bonds — 7.1% | | | | |
| | | | | | | | | |
| | | | | Consumer Discretionary — 2.2% | | | | |
| $ | 250,000 | | | HD Supply, Inc., 7.500%, 7/15/20 | | | 259,650 | |
| | 760,000 | | | Landry’s Holdings II, Inc., 144a, 10.250%, 1/1/18 | | | 776,112 | |
| | 760,000 | | | Landry’s, Inc., 144a, 9.375%, 5/1/20 | | | 797,126 | |
| | 725,000 | | | LIN Television Corp., 5.875%, 11/15/22 | | | 759,437 | |
| | 675,000 | | | Lions Gate Entertainment Corp. (Canada), 5.250%, 8/1/18 | | | 717,188 | |
| | 100,000 | | | Nexstar Broadcasting, Inc., 6.875%, 11/15/20 | | | 103,875 | |
| | | | | | | | 3,413,388 | |
| | | | | | | | | |
| | | | | Information Technology — 1.5% | | | | |
| | 2,325,000 | | | EMC Corp., 1.875%, 6/1/18 | | | 2,288,200 | |
| | | | | | | | | |
| | | | | Financials — 1.0% | | | | |
| | 1,620,000 | | | PNC Preferred Funding Trust II, 144a, 2.073%, 3/29/49(A)(B) | | | 1,547,100 | |
| | | | | | | | | |
| | | | | Energy — 0.8% | | | | |
| | 480,000 | | | Devon Energy Corp., 1.390%, 12/15/16(A) | | | 479,408 | |
| | 750,000 | | | Targa Resources Partners LP / Targa Resources Partners Finance Corp., 5.000%, 1/15/18 | | | 776,250 | |
| | | | | | | | 1,255,658 | |
| | | | | | | | | |
| | | | | Materials — 0.7% | | | | |
| | 1,000,000 | | | Glencore Canada Corp. (Canada), 5.500%, 6/15/17† | | | 1,022,500 | |
| | | | | | | | | |
| | | | | Industrials — 0.6% | | | | |
| | 750,000 | | | Beverage Packaging Holdings Luxembourg II SA / Beverage Packaging Holdings II Is (Luxembourg), 144a, 5.625%, 12/15/16 | | | 748,200 | |
| | 135,000 | | | USG Corp., 144a, 7.875%, 3/30/20 | | | 140,738 | |
| | | | | | | | 888,938 | |
| | | | | | | | | |
| | | | | Consumer Staples — 0.3% | | | | |
| | 541,000 | | | Elizabeth Arden, Inc., 7.375%, 3/15/21 | | | 560,611 | |
| | | | | Total Corporate Bonds | | $ | 10,976,395 | |
49
| | Touchstone Arbitrage Fund (Continued) |
| | | Shares | | | Market
Value | |
| | | | |
| Exchange Traded Funds — 2.3% |
| Consumer Discretionary Select Sector SPDR Fund | | | 224 | | | $ | 17,929 | |
| Financial Select Sector SPDR Fund | | | 9,348 | | | | 180,416 | |
| Real Estate Select Sector SPDR Fund | | | 1,300 | | | | 42,601 | |
| SPDR S&P 500 ETF Trust | | | 14,000 | | | | 3,028,200 | |
| Technology Select Sector SPDR Fund | | | 4,535 | | | | 216,682 | |
| Total Exchange Traded Funds | | | | | | $ | 3,485,828 | |
Principal
Amount | | | | | | |
| | | | | | | |
| | | | | Commercial Mortgage-Backed Security — 1.0% | | | | |
| $ | 1,500,000 | | | CFCRE 2015-RUM Mortgage Trust, Ser 2015-RUM, Class C, 144a, 3.274%, 7/15/30(A) | | | 1,472,053 | |
| | | Shares | | | | |
| | | | |
| Preferred Stock — 0.2% | | | | | | | | |
| | | | | | | | | |
| Utilities — 0.2% | | | | | | | | |
| Dayton Power & Light Co. (The), 3.90% | | | 2,963 | | | $ | 297,782 | |
| | | Number
of
Contracts | | | | |
| | | | |
| Purchased Put Options — 0.0% | | | | | | | | |
| SPDR S&P 500 ETF Trust., Strike @ 197.00, Exp 10/16 | | | 63 | | | | 756 | |
| SPDR S&P 500 ETF Trust., Strike @ 208.00, Exp 10/16 | | | 172 | | | | 11,008 | |
| SPDR S&P 500 ETF Trust., Strike @ 218.00, Exp 10/16 | | | 109 | | | | 33,681 | |
| Total Purchased Put Options | | | | | | | 45,445 | |
| | | | | | | | | |
| | | Shares | | | | | |
| | | | | | | | | |
| Investment Funds — 8.2% | | | | | | | | |
| Dreyfus Government Cash Management, Institutional Shares, 0.30%¥W | | | 12,469,547 | | | | 12,469,547 | |
| Invesco Government & Agency Portfolio, Institutional Class, 0.31%**¥W | | | 164,688 | | | | 164,688 | |
| Total Investment Funds | | | | | | $ | 12,634,235 | |
| | | | | | | | | |
Total Long Positions
(Cost $162,239,265) | | | | | | $ | 162,324,094 | |
| | | Shares | | | Market
Value | |
| |
| Securities Sold Short — (30.9%) | | | | | | | | |
| | | | | | | | | |
| Common Stocks — (27.5%) | | | | | | | | |
| | | | | | | | | |
| Financials — (9.5%) | | | | | | | | |
| Ares Capital Corp. | | | (136,128 | ) | | $ | (2,109,984 | ) |
| Canadian Imperial Bank of Commerce (Canada) | | | (38,270 | ) | | | (2,967,073 | ) |
| New York Community Bancorp, Inc. | | | (343,230 | ) | | | (4,884,163 | ) |
| United Bankshares, Inc. | | | (121,317 | ) | | | (4,570,011 | ) |
| | | | | | | | (14,531,231 | ) |
| | | | | | | | | |
| Health Care — (6.6%) | | | | | | | | |
| Abbott Laboratories | | | (52,753 | ) | | | (2,230,924 | ) |
| Amsurg Corp.* | | | (72,026 | ) | | | (4,829,343 | ) |
| IMS Health Holdings, Inc.* | | | (96,876 | ) | | | (3,036,094 | ) |
| | | | | | | | (10,096,361 | ) |
| | | | | | | | | |
| Information Technology — (3.6%) | | | | | | | | |
| Alphabet, Inc.Class A* | | | (969 | ) | | | (779,134 | ) |
| Lam Research Corp. | | | (37,995 | ) | | | (3,598,507 | ) |
| VMware, Inc. - Class A* | | | (15,917 | ) | | | (1,167,512 | ) |
| | | | | | | | (5,545,153 | ) |
| | | | | | | | | |
| Consumer Discretionary — (3.0%) | | | | | |
| AMC Entertainment Holdings, Inc. - Class A | | | (43,694 | ) | | | (1,358,447 | ) |
| Lions Gate Entertainment Corp. (Canada) | | | (95,152 | ) | | | (1,902,089 | ) |
| Nexstar Broadcasting Group, Inc. - Class A | | | (22,482 | ) | | | (1,297,436 | ) |
| | | | | | | | (4,557,972 | ) |
| | | | | | | | | |
| Real Estate — (2.7%) | | | | | | | | |
| Mid-America Apartment Communities, Inc., REIT | | | (43,795 | ) | | | (4,116,292 | ) |
| | | | | | | | | |
| Utilities — (1.5%) | | | | | | | | |
| Fortis, Inc. (Canada) | | | (73,633 | ) | | | (2,372,050 | ) |
| | | | | | | | | |
| Materials — (0.6%) | | | | | | | | |
| Berry Plastics Group, Inc.* | | | (21,008 | ) | | | (921,201 | ) |
| Total Common Stocks | | | | | | $ | (42,140,260 | ) |
| | | | | | | | | |
| Exchange Traded Funds — (3.4%) | | | | | |
| Consumer Staples Select Sector SPDR Fund | | | (111 | ) | | | (5,906 | ) |
| Energy Select Sector SPDR Fund | | | (3,021 | ) | | | (213,313 | ) |
| iShares US Telecommunications ETF | | | (1,318 | ) | | | (42,466 | ) |
| Materials Select Sector SPDR Fund | | | (72 | ) | | | (3,438 | ) |
| SPDR S&P 500 ETF Trust | | | (22,000 | ) | | | (4,758,600 | ) |
| Utilities Select Sector SPDR Fund | | | (4,067 | ) | | | (199,242 | ) |
| Total Exchange Traded Funds | | | | | | $ | (5,222,965 | ) |
| |
| |
Total Securities Sold Short
(Proceeds $46,315,118) | | | $ | (47,363,225 | ) |
50
| Touchstone Arbitrage Fund (Continued) | |
| | | Number
of
Contracts | | | Market Value | |
| |
| Written Options — (0.0%) | | | | | | | | |
| |
| Written Put Options — (0.0%) | | | | | | | | |
| SPDR S&P 500 ETF Trust., Strike @ 216.00, Exp 09/16 | | | (58 | ) | | $ | (116 | ) |
| SPDR S&P 500 ETF Trust., Strike @ 202.00, Exp 10/16 | | | (126 | ) | | | (3,024 | ) |
| SPDR S&P 500 ETF Trust., Strike @ 212.00, Exp 10/16 | | | (218 | ) | | | (25,288 | ) |
| SPDR S&P 500 ETF Trust., Strike @ 216.00, Exp 10/16 | | | (80 | ) | | | (9,760 | ) |
| | | | | | | $ | (38,188 | ) |
| |
| Written Call Options — (0.0%) | | | | | | | | |
| Fleetmatics Group PLC, Strike @ 60.00, Exp 10/16 | | | (519 | ) | | | (20,760 | ) |
| Whitewave Foods, Strike @ 57.50, Exp 10/16 | | | (389 | ) | | | (5,835 | ) |
| | | | | | | | (26,595 | ) |
| | | | | | | | | |
Total Written Options
(Premiums received $93,336) | | | | | | $ | (64,783 | ) |
| |
| Total — 74.8% | | | | | | $ | 114,896,086 | |
| |
Cash Collateral for Securities
Sold Short and Written Options — 23.9% | | | | | | | 36,608,741 | |
| |
| Other Assets in Excess of Liabilities — 1.3% | | | | | | | 2,003,753 | |
| |
| Net Assets — 100.0% | | | | | | $ | 153,508,580 | |
| (A) | Variable rate security - Rate reflected is the rate in effect as of September 30, 2016. |
| | |
| (B) | Perpetual Bond - A Bond with no definite maturity date. |
| | |
| * | Non-income producing security. |
| | |
| ** | Represents collateral for securities loaned. |
| | |
| † | All or a portion of the security is on loan. The total market value of the securities on loan as of September 30, 2016 was $158,488. |
| | |
| †† | All or a portion of these securities are held as collateral for securities sold short and written options. The total value of the securities held as collateral as of September 30, 2016 was $52,640,647. |
| | |
| ∞ | Open-End Fund. |
| | |
| Ω | Represents the 7-day SEC yield as of September 30, 2016. |
Portfolio Abbreviations:
ADR - American Depositary Receipt
CAD - Canadian Dollar
ETF - Exchange Traded Fund
GBP - Great British Pound
PLC - Public Limited Company
REIT - Real Estate Investment Trust
SPDR - Standard & Poor’s Depositary Receipt
USD - United States Dollar
144a - This is a restricted security that was sold in a transaction qualifying for the exemption under Rule 144A of the Securities Act of 1933. This security may be sold in transactions exempt from registration, normally to qualified institutional buyers. At September 30, 2016, these securities were valued at $5,481,329 or 3.6% of net assets. These securities were deemed liquid pursuant to procedures approved by the Board of Trustees.
Other Information:
The inputs or methodology used for valuing securities may not be an indication of the risk associated with investing in those securities. For more information on valuation inputs, and their aggregation into the levels used in the table below, please refer to the security valuation section in the accompanying Notes to Financial Statements.
51
| | Touchstone Arbitrage Fund (Continued) |
| Valuation inputs at Reporting Date: |
| Description | | Level 1 | | Level 2 | | Level 3 | | Total |
| | | | | | | | | |
| Assets: | | | | | | | | | | | | | | | | |
| Common Stocks | | | | | | | | | | | | | | | | |
| Information Technology | | $ | 32,849,719 | | | $ | — | | | $ | — | | | $ | 32,849,719 | |
| Health Care | | | 28,103,162 | | | | — | | | | — | | | | 28,103,162 | |
| Financials | | | 21,021,334 | | | | — | | | | — | | | | 21,021,334 | |
| Consumer Discretionary | | | 17,372,452 | | | | — | | | | — | | | | 17,372,452 | |
| Consumer Staples | | | 6,023,596 | | | | 5,848,217 | | | | — | | | | 11,871,813 | |
| Utilities | | | 10,197,414 | | | | — | | | | — | | | | 10,197,414 | |
| Industrials | | | 4,598,114 | | | | — | | | | — | | | | 4,598,114 | |
| Real Estate | | | 4,079,229 | | | | — | | | | — | | | | 4,079,229 | |
| Materials | | | 1,837,416 | | | | — | | | | — | | | | 1,837,416 | |
| Energy | | | 1,481,703 | | | | — | | | | — | | | | 1,481,703 | |
| Corporate Bonds | | | — | | | | 10,976,395 | | | | — | | | | 10,976,395 | |
| Exchange Traded Funds | | | 3,485,828 | | | | — | | | | — | | | | 3,485,828 | |
| Commercial Mortgage-Backed Security | | | — | | | | 1,472,053 | | | | — | | | | 1,472,053 | |
| Preferred Stock | | | 297,782 | | | | — | | | | — | | | | 297,782 | |
| Purchased Options Equity Contracts | | | 45,445 | | | | — | | | | — | | | | 45,445 | |
| Investment Funds | | | 12,634,235 | | | | — | | | | — | | | | 12,634,235 | |
| Other Financial Instruments** | | | | | | | | | | | | | |
| Forward Foreign Currency Contract | | | — | | | | 80,668 | | | | — | | | | 80,668 | |
| Total Assets | | $ | 144,027,429 | | | $ | 18,377,333 | | | $ | — | | | $ | 162,404,762 | |
| Valuation inputs at Reporting Date: |
| Description | | Level 1 | | Level 2 | | Level 3 | | Total |
| | | | | | | | | |
Liabilities:
Securities Sold Short | | | | | | | | | | | | | |
| Common Stocks | | $ | (42,140,260 | ) | | $ | — | | | $ | — | | | $ | (42,140,260 | ) |
| Exchange Traded Funds | | | (5,222,965 | ) | | | — | | | | — | | | | (5,222,965 | ) |
| Other Financial Instruments** | | | | | | | | | | | | | |
| Written Options Equity Contracts | | | (64,783 | ) | | | — | | | | — | | | | (64,783 | ) |
| Forward Foreign Currency Contract | | | — | | | | (11,839 | ) | | | — | | | | (11,839 | ) |
| Total Liabilities | | $ | (47,428,008 | ) | | $ | (11,839 | ) | | $ | — | | | $ | (47,439,847 | ) |
| Total | | $ | 96,599,421 | | | $ | 18,365,494 | | | $ | — | | | $ | 114,964,915 | |
** Other Financial Instruments are derivative instruments not reflected in total investments. Amounts shown represent market value for written option equity contracts and unrealized appreciation (depreciation) on forward foreign currency contracts.
Transactions in written options for the year ended September 30, 2016.
| | | Number of Premiums |
| | | Contracts | | Received |
| | | | | | | | | |
| Beginning balance, September 30, 2015 | | | 840 | | | $ | 157,041 | |
| Call Options Written | | | 2,724 | | | | 111,992 | |
| Put Options Written | | | 3,522 | | | | 444,474 | |
| Call Options Closed | | | (126 | ) | | | (7,237 | ) |
| Put Options Closed | | | (1,931 | ) | | | (286,265 | ) |
| Call Options Expired | | | (966 | ) | | | (21,099 | ) |
| Put Options Expired | | | (1,867 | ) | | | (226,569 | ) |
| Call Options Exercised | | | (724 | ) | | | (67,095 | ) |
| Put Options Exercised | | | (82 | ) | | | (11,906 | ) |
| | | | | | | | | |
| Ending balance, September 30, 2016 | | | 1,390 | | | $ | 93,336 | |
Forward Foreign Currency Contracts
| | | | | | | | | | | | | Unrealized |
| | | | | Contract to | | Appreciation/ |
| Counterparty | | Expiration Date | | Receive | | Deliver | | | (Depreciation) |
| | | | | | | | | | |
| Brown Brothers Harriman | | 10/14/2016 | | USD | | | 7,105,274 | | | GBP | | | 5,418,000 | | | $ | 80,668 | |
| Brown Brothers Harriman | | 10/21/2016 | | USD | | | 1,470,105 | | | CAD | | | 1,943,920 | | | | (11,839 | ) |
| | | | | | | | | | | | | | | | | $ | 68,829 | |
See accompanying Notes to Financial Statements.
52
Portfolio of Investments
Touchstone Emerging Markets Small Cap Fund – September 30, 2016 | |
| | | Shares | | | Market
Value | |
| |
| Common Stocks — 100.0% | | | | | | |
| |
| South Korea — 17.4% | | | | | | |
| |
| Consumer Discretionary — 2.8% | | | | | | | | |
| Innocean Worldwide, Inc. | | | 1,218 | | | $ | 81,219 | |
| Jcontentree Corp.* | | | 19,666 | | | | 66,254 | |
| Loen Entertainment, Inc.* | | | 1,305 | | | | 92,683 | |
| |
| Consumer Staples — 2.6% | | | | | | | | |
| Able C&C Co. Ltd. | | | 2,734 | | | | 59,762 | |
| BGF retail Co. Ltd. | | | 580 | | | | 101,927 | |
| NongShim Co. Ltd. | | | 236 | | | | 67,285 | |
| |
| Financials — 2.8% | | | | | | | | |
| Dongbu Insurance Co. Ltd. | | | 1,957 | | | | 121,667 | |
| Hyundai Marine & Fire Insurance Co. Ltd. | | | 3,639 | | | | 120,139 | |
| |
| Health Care — 2.0% | | | | | | | | |
| Osstem Implant Co. Ltd.*† | | | 1,421 | | | | 79,010 | |
| Value Added Technologies Co. Ltd. | | | 2,731 | | | | 93,781 | |
| |
| Industrials — 2.3% | | | | | | | | |
| Hyundai Development Co.-Engineering & Construction | | | 2,602 | | | | 121,970 | |
| LS Corp. | | | 1,501 | | | | 79,744 | |
| |
| Information Technology — 2.1% | | | | | | | | |
| Koh Young Technology, Inc. | | | 2,804 | | | | 116,762 | |
| Silicon Works Co. Ltd. | | | 2,532 | | | | 68,926 | |
| |
| Materials — 2.8% | | | | | | | | |
| Korea Petrochemical Ind Co. Ltd. | | | 598 | | | | 116,963 | |
| Soulbrain Co. Ltd. | | | 2,346 | | | | 130,549 | |
| Total South Korea | | | | | | | 1,518,641 | |
| |
| Taiwan — 15.4% | | | | | | | | |
| |
| Consumer Discretionary — 2.6% | | | | | | | | |
| Basso Industry Corp. | | | 40,000 | | | | 127,550 | |
| Taiwan Paiho Ltd. | | | 27,000 | | | | 96,780 | |
| |
| Consumer Staples — 1.6% | | | | | | | | |
| Grape King Bio Ltd. | | | 17,000 | | | | 141,417 | |
| |
| Health Care — 1.3% | | | | | | | | |
| Bioteque Corp. | | | 23,000 | | | | 116,774 | |
| |
| Industrials — 1.1% | | | | | | | | |
| Shin Zu Shing Co. Ltd. | | | 29,000 | | | | 96,246 | |
| |
| Information Technology — 7.5% | | | | | | | | |
| Elite Material Co. Ltd. | | | 55,000 | | | | 150,657 | |
| Inventec Corp. | | | 135,000 | | | | 110,825 | |
| King Yuan Electronics Co. Ltd. | | | 99,000 | | | | 88,022 | |
| Micro-Star International Co. Ltd. | | | 35,000 | | | | 91,249 | |
| Primax Electronics Ltd. | | | 78,000 | | | | 114,806 | |
| Vanguard International Semiconductor Corp. | | | 54,000 | | | | 101,453 | |
| | | Shares | | | Market
Value | |
| |
| Taiwan — (Continued) | | | | | | |
| |
| Materials — 1.3% | | | | | | | | |
| China General Plastics Corp. | | | 169,320 | | | $ | 112,442 | |
| Total Taiwan | | | | | | | 1,348,221 | |
| |
| Cayman Islands — 15.1% | | | | | | | | |
| |
| Consumer Discretionary — 9.1% | | | | | | | | |
| China Lodging Group Ltd. ADR | | | 3,186 | | | | 143,657 | |
| Fu Shou Yuan International Group Ltd. | | | 47,889 | | | | 27,699 | |
| Geely Automobile Holdings Ltd. | | | 190,000 | | | | 171,086 | |
| Gourmet Master Co. Ltd. | | | 15,700 | | | | 156,271 | |
| Tarena International, Inc. ADR | | | 7,168 | | | | 103,793 | |
| Tianneng Power International Ltd. | | | 114,000 | | | | 97,735 | |
| Xtep International Holdings Ltd. | | | 218,000 | | | | 102,151 | |
| |
| Industrials — 1.2% | | | | | | | | |
| Bizlink Holding, Inc. | | | 20,031 | | | | 104,946 | |
| |
| Information Technology — 3.1% | | | | | | | | |
| Sunny Optical Technology Group Co. Ltd. | | | 27,000 | | | | 134,153 | |
| Tongda Group Holdings Ltd. | | | 560,000 | | | | 137,355 | |
| |
| Materials — 1.7% | | | | | | | | |
| Lee & Man Paper Manufacturing Ltd. | | | 160,000 | | | | 146,162 | |
| Total Cayman Islands | | | | | | | 1,325,008 | |
| |
| India — 9.4% | | | | | | | | |
| |
| Consumer Discretionary — 1.0% | | | | | | | | |
| Exide Industries Ltd. | | | 32,038 | | | | 88,229 | |
| |
| Energy — 1.7% | | | | | | | | |
| Hindustan Petroleum Corp. Ltd. | | | 22,644 | | | | 144,384 | |
| |
| Financials — 2.6% | | | | | | | | |
| Bharat Financial Inclusion Ltd.* | | | 8,966 | | | | 118,960 | |
| Shriram Transport Finance Co. Ltd. | | | 6,302 | | | | 110,188 | |
| |
| Health Care — 1.3% | | | | | | | | |
| Torrent Pharmaceuticals Ltd. | | | 4,529 | | | | 110,602 | |
| |
| Materials — 1.3% | | | | | | | | |
| Hindalco Industries Ltd. | | | 49,260 | | | | 113,364 | |
| |
| Utilities — 1.5% | | | | | | | | |
| Indraprastha Gas Ltd. | | | 11,450 | | | | 133,888 | |
| Total India | | | | | | | 819,615 | |
| |
| South Africa — 6.6% | | | | | | | | |
| |
| Consumer Discretionary — 2.3% | | | | | | | | |
| Foschini Group Ltd. (The) | | | 8,863 | | | | 89,942 | |
| Super Group Ltd.* | | | 34,830 | | | | 107,796 | |
| |
| Consumer Staples — 2.1% | | | | | | | | |
| AVI Ltd. | | | 14,000 | | | | 95,850 | |
| Clicks Group Ltd. | | | 9,291 | | | | 86,075 | |
53
| | Touchstone Emerging Markets Small Cap Fund (Continued) |
| | | Shares | | | Market
Value | |
| | | | | | | |
| Common Stocks — 100.0% (Continued) | | |
| | | | | | | |
| South Africa — (Continued) | | | | | | |
| | | | | | | |
| Financials — 1.3% | | | | | | |
| Capitec Bank Holdings Ltd. | | | 2,507 | | | $ | 117,476 | |
| | | | | | | |
| Health Care — 0.9% | | | | | | | | |
| Netcare Ltd. | | | 33,177 | | | | 81,308 | |
| Total South Africa | | | | | | | 578,447 | |
| | | | | | | |
| Brazil — 5.3% | | | | | | | | |
| | | | | | | |
| Consumer Staples — 3.1% | | | | | | | | |
| Hypermarcas SA | | | 15,000 | | | | 129,745 | |
| Raia Drogasil SA | | | 7,000 | | | | 143,911 | |
| | | | | | | |
| Health Care — 1.4% | | | | | | | | |
| Qualicorp SA | | | 21,400 | | | | 125,946 | |
| | | | | | | |
| Real Estate — 0.8% | | | | | | | | |
| Iguatemi Empresa de Shopping Centers SA | | | 7,500 | | | | 68,263 | |
| Total Brazil | | | | | | | 467,865 | |
| | | | | | | | | |
| Thailand — 5.0% | | | | | | | | |
| | | | | | | | | |
| Consumer Discretionary — 0.7% | | | | | | | | |
| Minor International PCL | | | 56,000 | | | | 63,253 | |
| | | | | | | | | |
| Financials — 1.4% | | | | | | | | |
| Krungthai Card PCL | | | 27,900 | | | | 119,168 | |
| | | | | | | | | |
| Information Technology — 1.1% | | | | | | | | |
| KCE Electronics PCL | | | 32,200 | | | | 98,833 | |
| | | | | | | | | |
| Real Estate — 1.8% | | | | | | | | |
| Ananda Development PCL | | | 509,800 | | | | 71,422 | |
| AP Thailand PCL | | | 399,500 | | | | 83,832 | |
| Total Thailand | | | | | | | 436,508 | |
| | | | | | | | | |
| China — 4.1% | | | | | | | | |
| | | | | | | | | |
| Industrials — 1.2% | | | | | | | | |
| Beijing Capital International Airport Co. Ltd. - Class H | | | 94,000 | | | | 107,153 | |
| | | | | | | | | |
| Information Technology — 1.4% | | | | | | | | |
| TravelSky Technology Ltd. - Class H | | | 50,000 | | | | 119,340 | |
| | | | | | | | | |
| Real Estate — 1.5% | | | | | | | | |
| Guangzhou R&F Properties Co. Ltd. - Class H | | | 83,200 | | | | 131,843 | |
| Total China | | | | | | | 358,336 | |
| | | | | | | | | |
| Indonesia — 3.3% | | | | | | | | |
| | | | | | | | | |
| Financials — 1.3% | | | | | | | | |
| Bank Tabungan Negara Persero Tbk PT | | | 782,600 | | | | 115,419 | |
| | | Shares | | | Market
Value | |
| | | | | | | |
| Indonesia — (Continued) | | | | | | |
| | | | | | | |
| Health Care — 1.1% | | | | | | |
| Mitra Keluarga Karyasehat Tbk PT | | | 438,100 | | | $ | 93,824 | |
| | | | | | | | | |
| Industrials — 0.9% | | | | | | | | |
| Waskita Karya Persero Tbk PT | | | 403,900 | | | | 81,270 | |
| Total Indonesia | | | | | | | 290,513 | |
| | | | | | | | | |
| Mexico — 2.8% | | | | | | | | |
| | | | | | | | | |
| Consumer Discretionary — 1.1% | | | | | | | | |
| Alsea SAB de CV | | | 29,600 | | | | 100,159 | |
| | | | | | | | | |
| Industrials — 1.7% | | | | | | | | |
| Grupo Aeroportuario del Sureste SAB de CV - Class B | | | 5,225 | | | | 76,430 | |
| Promotora y Operadora de Infraestructura SAB de CV | | | 6,755 | | | | 72,721 | |
| Total Mexico | | | | | | | 249,310 | |
| | | | | | | | | |
| Philippines — 2.5% | | | | | | | | |
| | | | | | | | | |
| Financials — 1.4% | | | | | | | | |
| Metro Pacific Investments Corp. | | | 845,400 | | | | 123,903 | |
| | | | | | | | | |
| Industrials — 1.1% | | | | | | | | |
| Cebu Air, Inc. | | | 40,010 | | | | 93,328 | |
| Total Philippines | | | | | | | 217,231 | |
| | | | | | | | | |
| Malaysia — 2.3% | | | | | | | | |
| | | | | | | | | |
| Industrials — 2.3% | | | | | | | | |
| AirAsia Bhd | | | 148,600 | | | | 100,418 | |
| Westports Holdings Bhd | | | 93,000 | | | | 98,723 | |
| Total Malaysia | | | | | | | 199,141 | |
| | | | | | | | | |
| Hungary — 2.2% | | | | | | | | |
| | | | | | | | | |
| Health Care — 1.1% | | | | | | | | |
| Richter Gedeon Nyrt | | | 4,901 | | | | 99,563 | |
| | | | | | | | | |
| Telecommunication Services — 1.1% | | | | |
| Magyar Telekom Telecommunications PLC | | | 56,877 | | | | 93,348 | |
| Total Hungary | | | | | | | 192,911 | |
| | | | | | | | | |
| Poland — 2.0% | | | | | | | | |
| | | | | | | | | |
| Financials — 1.1% | | | | | | | | |
| KRUK SA | | | 1,575 | | | | 98,028 | |
| | | | | | | | | |
| Information Technology — 0.9% | | | | | | | | |
| Asseco Poland SA | | | 5,077 | | | | 74,015 | |
| Total Poland | | | | | | | 172,043 | |
| | | | | | | | | |
| Hong Kong — 1.5% | | | | | | | | |
| | | | | | | | | |
| Real Estate — 1.5% | | | | | | | | |
| Shenzhen Investment Ltd. | | | 268,000 | | | | 128,636 | |
54
| Touchstone Emerging Markets Small Cap Fund (Continued) | |
| | | Shares | | | Market
Value | |
| | | | | | | |
| Common Stocks — 100.0% (Continued) | | |
| | | | | | | |
| United States — 1.3% | | | | | | |
| | | | | | | |
| Health Care — 1.3% | | | | | | |
| China Biologic Products, Inc.* | | | 917 | | | $ | 114,148 | |
| | | | | | | | | |
| Jersey — 1.2% | | | | | | | | |
| | | | | | | | | |
| Information Technology — 1.2% | | | | | | | | |
| WNS Holdings Ltd. ADR* | | | 3,577 | | | | 107,131 | |
| | | | | | | | | |
| United Kingdom — 1.0% | | | | | | | | |
| | | | | | | | | |
| Materials — 1.0% | | | | | | | | |
| Evraz PLC* | | | 43,505 | | | | 90,812 | |
| | | | | | | | | |
| Bermuda — 0.9% | | | | | | | | |
| | | | | | | | | |
| Consumer Discretionary — 0.9% | | | | | | | | |
| SMI Holdings Group Ltd.† | | | 760,000 | | | | 75,860 | |
| | | | | | | | | |
| Russia — 0.7% | | | | | | | | |
| | | | | | | | | |
| Telecommunication Services — 0.7% | | | |
| Sistema PJSC FC GDR | | | 8,404 | | | | 62,358 | |
| Total Common Stocks | | | | | | $ | 8,752,735 | |
| | | | | | | | | |
| Exchange Traded Fund — 1.0% | | | | | | | | |
| iShares MSCI Emerging Markets Small-Cap ETF | | | 2,011 | | | | 89,188 | |
| | | | | | | | | |
| Investment Funds — 1.4% | | | | | | | | |
| Dreyfus Government Cash Management, Institutional Shares, 0.30%∞Ω | | | 11 | | | | 11 | |
Invesco Government & Agency Portfolio, Institutional Class,
0.31%**∞Ω | | | 118,751 | | | | 118,751 | |
| Total Investment Funds | | | | | | $ | 118,762 | |
| |
Total Investment Securities —102.4%
(Cost $8,179,091) | | | | | | $ | 8,960,685 | |
| |
| Liabilities in Excess of Other Assets — (2.4%) | | | | (209,040 | ) |
| |
| Net Assets — 100.0% | | | | | | $ | 8,751,645 | |
| * | Non-income producing security. |
| | |
| ** | Represents collateral for securities loaned. |
| | |
| † | All or a portion of the security is on loan. The total market value of the securities on loan as of September 30, 2016 was $110,216. |
| | |
| ∞ | Open-End Fund. |
| | |
| Ω | Represents the 7-day SEC yield as of September 30, 2016. |
Portfolio Abbreviations:
ADR - American Depositary Receipt
ETF - Exchange Traded Fund
GDR - Global Depositary Receipt
PCL - Public Company Limited
PLC - Public Limited Company
Other Information:
The inputs or methodology used for valuing securities may not be an indication of the risk associated with investing in those securities. For more information on valuation inputs, and their aggregation into the levels used in the table below, please refer to the security valuation section in the accompanying Notes to Financial Statements.
| Valuation inputs at Reporting Date: |
| Description | | Level 1 | | | Level 2 | | | Level 3 | | | Total | |
| Common Stocks | | | | | | | | | | | | | | | | |
| South Korea | | $ | 67,285 | | | $ | 1,451,356 | | | $ | — | | | $ | 1,518,641 | |
| Taiwan | | | — | | | | 1,348,221 | | | | — | | | | 1,348,221 | |
| Cayman Islands | | | 403,721 | | | | 921,287 | | | | — | | | | 1,325,008 | |
| India | | | — | | | | 819,615 | | | | — | | | | 819,615 | |
| South Africa | | | 371,029 | | | | 207,418 | | | | — | | | | 578,447 | |
| Brazil | | | 467,865 | | | | — | | | | — | | | | 467,865 | |
| Thailand | | | — | | | | 436,508 | | | | — | | | | 436,508 | |
| China | | | — | | | | 358,336 | | | | — | | | | 358,336 | |
| Indonesia | | | — | | | | 290,513 | | | | — | | | | 290,513 | |
| Mexico | | | 249,310 | | | | — | | | | — | | | | 249,310 | |
| Philippines | | | — | | | | 217,231 | | | | — | | | | 217,231 | |
| Malaysia | | | 98,723 | | | | 100,418 | | | | — | | | | 199,141 | |
| Hungary | | | 192,911 | | | | — | | | | — | | | | 192,911 | |
| Poland | | | 98,028 | | | | 74,015 | | | | — | | | | 172,043 | |
| Hong Kong | | | — | | | | 128,636 | | | | — | | | | 128,636 | |
| United States | | | 114,148 | | | | — | | | | — | | | | 114,148 | |
| Jersey | | | 107,131 | | | | — | | | | — | | | | 107,131 | |
| United Kingdom | | | — | | | | 90,812 | | | | — | | | | 90,812 | |
| Bermuda | | | — | | | | 75,860 | | | | — | | | | 75,860 | |
| Russia | | | 62,358 | | | | — | | | | — | | | | 62,358 | |
| Exchange Traded Fund | | | 89,188 | | | | — | | | | — | | | | 89,188 | |
| Investment Funds | | | 118,762 | | | | — | | | | — | | | | 118,762 | |
| Total | | $ | 2,440,459 | | | $ | 6,520,226 | | | $ | — | | | $ | 8,960,685 | |
See accompanying Notes to Financial Statements.
55
| | Portfolio of Investments
Touchstone Merger Arbitrage Fund – September 30, 2016 |
| | | Shares | | Market
Value |
| | | | | |
| Common Stocks — 68.9% | | | | | | | | |
| | | | | | | | | |
| Information Technology — 17.8% | | | | | | | | |
| Alphabet, Inc. - Class C* | | | 1,294 | | | $ | 1,005,813 | |
| AVG Technologies NV (Netherlands)* | | | 83,805 | | | | 2,095,963 | |
| Cvent, Inc.*†† | | | 55,710 | | | | 1,766,564 | |
| Dell Technologies, Inc. - VMware Inc. - Class V* | | | 16,223 | | | | 775,459 | |
| Fleetmatics Group PLC (Ireland)*†† | | | 78,618 | | | | 4,715,508 | |
| InContact, Inc.*†† | | | 328,875 | | | | 4,597,672 | |
| KLA-Tencor Corp.†† | | | 85,660 | | | | 5,971,359 | |
| LinkedIn Corp. - Class A*†† | | | 28,471 | | | | 5,441,378 | |
| NetSuite, Inc.* | | | 26,078 | | | | 2,886,574 | |
| Rackspace Hosting, Inc.* | | | 62,825 | | | | 1,990,924 | |
| Silicon Graphics International Corp.* | | | 409,267 | | | | 3,151,356 | |
| | | | | | | | 34,398,570 | |
| | | | | | | | | |
| Health Care — 13.5% | | | | | | | | |
| Alere, Inc.*†† | | | 74,660 | | | | 3,228,298 | |
| Cepheid* | | | 75,970 | | | | 4,002,859 | |
| Cynapsus Therapeutics, Inc (Canada).*†† | | | 73,825 | | | | 2,969,242 | |
| Envision Healthcare Holdings, Inc.* | | | 184,272 | | | | 4,103,737 | |
| Quintiles IMS Holdings, Inc.* | | | 30,695 | | | | 2,488,137 | |
| Raptor Pharmaceutical Corp.* | | | 443,598 | | | | 3,979,074 | |
| St Jude Medical, Inc.†† | | | 66,284 | | | | 5,286,812 | |
| | | | | | | | 26,058,159 | |
| | | | | | | | | |
| Financials — 11.5% | | | | | | | | |
| American Capital Ltd.* | | | 240,793 | | | | 4,071,810 | |
| Astoria Financial Corp.†† | | | 313,270 | | | | 4,573,742 | |
| Cardinal Financial Corp. | | | 141,264 | | | | 3,685,578 | |
| Hennessy Capital Acquisition Corp. II* | | | 175,000 | | | | 1,715,000 | |
| National Interstate Corp.†† | | | 107,032 | | | | 3,481,751 | |
| PrivateBancorp, Inc.†† | | | 99,140 | | | | 4,552,509 | |
| | | | | | | | 22,080,390 | |
| | | | | | | | | |
| Consumer Discretionary — 9.5% | | | | | | | | |
| Carmike Cinemas, Inc.*†† | | | 118,297 | | | | 3,867,129 | |
| CST Brands, Inc. | | | 93,900 | | | | 4,515,651 | |
| Media General, Inc.* | | | 208,090 | | | | 3,835,099 | |
| Skullcandy, Inc.* | | | 302,948 | | | | 1,920,690 | |
| Starz - Class A*†† | | | 131,560 | | | | 4,103,356 | |
| | | | | | | | 18,241,925 | |
| | | | | | | | | |
| Consumer Staples — 6.1% | | | | | | | | |
| SABMiller PLC ADR | | | 20,000 | | | | 1,161,800 | |
| SABMiller PLC (United Kingdom) | | | 105,600 | | | | 6,151,113 | |
| WhiteWave Foods Co.*†† | | | 79,875 | | | | 4,347,596 | |
| | | | | | | | 11,660,509 | |
| | | | | | | | | |
| Utilities — 4.8% | | | | | | | | |
| ITC Holdings Corp. | | | 83,940 | | | | 3,901,531 | |
| Piedmont Natural Gas Co., Inc.†† | | | 89,018 | | | | 5,344,641 | |
| | | | | | | | 9,246,172 | |
| | | | | | | | | |
| Industrials — 2.0% | | | | | | | | |
| Virgin America, Inc.*†† | | | 73,615 | | | | 3,939,139 | |
| | | Shares | | Market
Value |
| | | | | |
| Real Estate — 1.8% | | | | | | | | |
| Post Properties, Inc. REIT | | | 52,910 | | | $ | 3,498,938 | |
| | | | | | | | | |
| Energy — 1.0% | | | | | | | | |
| Bankers Petroleum Ltd. (Canada)* | | | 1,130,000 | | | | 1,894,889 | |
| | | | | | | | | |
| Materials — 0.9% | | | | | | | | |
| AEP Industries, Inc. | | | 16,360 | | | | 1,789,293 | |
| Total Common Stocks | | | | | | $ | 132,807,984 | |
| | Principal
Amount | | | | | | | |
| | | | | | | | | |
| | | | | Corporate Bonds — 17.1% | | | | |
| | | | | | | | | |
| | | | | Consumer Discretionary — 7.1% | | | | |
| $ | 4,000,000 | | | Glencore Canada Corp. (Canada),
5.500%, 6/15/17 | | | 4,090,000 | |
| | 1,865,000 | | | HD Supply, Inc., 7.500%, 7/15/20 | | | 1,936,989 | |
| | 990,000 | | | Landry’s Holdings II, Inc., 144a,
10.250%, 1/1/18 | | | 1,010,988 | |
| | 990,000 | | | Landry’s, Inc., 144a, 9.375%, 5/1/20 | | | 1,038,362 | |
| | 900,000 | | | LIN Television Corp., 5.875%, 11/15/22 | | | 942,750 | |
| | 800,000 | | | Lions Gate Entertainment Corp.
(Canada), 5.250%, 8/1/18 | | | 850,000 | |
| | 150,000 | | | Nexstar Broadcasting, Inc.,
6.875%, 11/15/20 | | | 155,812 | |
| | 3,500,000 | | | Time Warner Cable, LLC,
5.850%, 5/1/17 | | | 3,587,395 | |
| | | | | | | | 13,612,296 | |
| | | | | | | | | |
| | | | | Financials — 4.0% | | | | |
| | 4,000,000 | | | Ally Financial, Inc., 3.600%, 5/21/18 | | | 4,060,000 | |
| | 3,845,000 | | | PNC Preferred Funding Trust II, 144a,
2.073%, 3/29/49(A)(B) | | | 3,671,975 | |
| | | | | | | | 7,731,975 | |
| | | | | | | | | |
| | | | | Information Technology — 2.1% | | | | |
| | 4,050,000 | | | EMC Corp., 1.875%, 6/1/18 | | | 3,985,897 | |
| | | | | | | | | |
| | | | | Health Care — 1.5% | | | | |
| | 2,750,000 | | | inVentiv Health, Inc., 144a,
9.000%, 1/15/18 | | | 2,823,906 | |
| | | | | | | | | |
| | | | | Energy — 1.0% | | | | |
| | 1,000,000 | | | Devon Energy Corp., | | | | |
| | | | | 1.390%, 12/15/16(A) | | | 998,767 | |
| | 975,000 | | | Targa Resources Partners LP / Targa
Resources Partners Finance Corp.,
5.000%, 1/15/18 | | | 1,009,125 | |
| | | | | | | | 2,007,892 | |
| | | | | | | | | |
| | | | | Industrials — 0.7% | | | | |
| | 1,295,000 | | | Beverage Packaging Holdings
Luxembourg II SA / Beverage
Packaging Holdings II Is
(Luxembourg), 144a,
5.625%, 12/15/16 | | | 1,291,892 | |
| | 150,000 | | | USG Corp., 144a, 7.875%, 3/30/20 | | | 156,375 | |
| | | | | | | | 1,448,267 | |
56
| Touchstone Merger Arbitrage Fund (Continued) | |
| | Principal
Amount | | | | | | Market
Value | |
| | | | | | | | | |
| | | | | Corporate Bonds — 17.1% (Continued) |
| | | | | | | | | |
| | | | | Consumer Staples — 0.5% | | | | |
| $ | 907,000 | | | Elizabeth Arden, Inc., 7.375%, 3/15/21 | | $ | 939,879 | |
| | | | | | | | | |
| | | | | Materials — 0.2% |
| | 365,000 | | | Glencore Finance Canada Ltd.
(Canada), 144a, 5.800%, 11/15/16 | | | 366,278 | |
| | | | | Total Corporate Bonds | | $ | 32,916,390 | |
| | | | | | | | | |
| | | | | Commercial Mortgage-Backed Securities — 2.1% |
| | 2,750,000 | | | CFCRE Commercial Mortgage Trust,
Ser 2015-RUM, Class C, 144a,
3.274%, 7/15/30(A) | | | 2,698,764 | |
| | 1,320,000 | | | GSCCRE Commercial Mortgage Trust,
Ser 2015-HULA, Class C, 144a,
3.274%, 8/15/32(A) | | | 1,310,679 | |
| | | | | Total Commercial
Mortgage-Backed Securities | | $ | 4,009,443 | |
| | | Shares | | |
| | | | | |
| Exchange Traded Funds — 3.3% | | | | | | | | |
Consumer Discretionary Select Sector
SPDR Fund | | | 294 | | | | 23,532 | |
| Financial Select Sector SPDR Fund | | | 12,316 | | | | 237,699 | |
| Real Estate Select Sector SPDR Fund | | | 1,713 | | | | 56,135 | |
| SPDR S&P 500 ETF Trust | | | 26,400 | | | | 5,710,320 | |
| Technology Select Sector SPDR Fund | | | 5,976 | | | | 285,533 | |
| Total Exchange Traded Funds | | | | | | $ | 6,313,219 | |
| | | | | | | | | |
| Preferred Stock — 0.3% | | | | | | | | |
| | | | | | | | | |
| Utilities — 0.3% | | | | | | | | |
| Dayton Power & Light Co. (The), 3.90% | | | 5,569 | | | | 559,685 | |
| | | | | | | | | |
| Warrant — 0.1% | | | | | | | | |
| | | | | | | | | |
| Financials — 0.1% | | | | | | | | |
Hennessy Capital Acquisition Corp. II,
Expiration 09/11/20, Price $11.50* | | | 437,500 | | | | 175,000 | |
| | | | | | | | | |
| | | | Number
of
Contracts | | | | | |
| | | | | | | | | |
| Purchased Put Options — 0.0% | | | | | | | | |
SPDR S&P 500 ETF Trust.,
Strike @ 197.00, Exp 10/16 | | | 84 | | | | 1,008 | |
SPDR S&P 500 ETF Trust.,
Strike @ 208.00, Exp 10/16 | | | 222 | | | | 14,208 | |
SPDR S&P 500 ETF Trust.,
Strike @ 218.00, Exp 10/16 | | | 138 | | | | 42,642 | |
| Total Purchased Put Options | | | | | | | 57,858 | |
| | | Shares | | Market
Value |
| | | | | |
| Investment Fund — 26.1% | | | | | | | | |
| | | | | | | | | |
Dreyfus Government Cash
Management, Institutional Shares,
0.30%¥W | | | 50,362,878 | | | $ | 50,362,878 | |
| | | | | | | | | |
| Total Long Positions | | | | | | | | |
| (Cost $226,901,663) | | | | | | $ | 227,202,457 | |
| | | | | | | | | |
| Securities Sold Short — (24.9%) | | | | | | | | |
| | | | | | | | | |
| Common Stocks — (20.3%) | | | | | | | | |
| | | | | | | | | |
| Financials — (6.7%) | | | | | | | | |
| Ares Capital Corp. | | | (116,306 | ) | | | (1,802,743 | ) |
Canadian Imperial Bank of Commerce
(Canada) | | | (36,257 | ) | | | (2,811,005 | ) |
| New York Community Bancorp, Inc. | | | (313,270 | ) | | | (4,457,832 | ) |
| United Bankshares, Inc. | | | (100,300 | ) | | | (3,778,301 | ) |
| | | | | | | | (12,849,881 | ) |
| | | | | | | | | |
| Health Care — (4.7%) | | | | | | | | |
| Abbott Laboratories | | | (57,721 | ) | | | (2,441,021 | ) |
| Amsurg Corp.* | | | (61,551 | ) | | | (4,126,995 | ) |
| IMS Health Holdings, Inc.* | | | (79,938 | ) | | | (2,505,257 | ) |
| | | | | | | | (9,073,273 | ) |
| | | | | | | | | |
| Information Technology — (3.2%) | | | | | | | | |
| Alphabet, Inc. - Class A* | | | (1,249 | ) | | | (1,004,271 | ) |
| Lam Research Corp. | | | (42,830 | ) | | | (4,056,429 | ) |
| VMware, Inc. - Class A* | | | (16,157 | ) | | | (1,185,116 | ) |
| | | | | | | | (6,245,816 | ) |
| | | | | | | | | |
| Consumer Discretionary — (2.3%) | | | | | | | | |
AMC Entertainment Holdings, Inc. -
Class A | | | (38,398 | ) | | | (1,193,794 | ) |
Lions Gate Entertainment Corp.
(Canada) | | | (89,254 | ) | | | (1,784,188 | ) |
Nexstar Broadcasting Group, Inc. -
Class A | | | (25,991 | ) | | | (1,499,941 | ) |
| | | | | | | | (4,477,923 | ) |
| | | | | | | | | |
| Real Estate — (1.8%) | | | | | | | | |
Mid-America Apartment Communities,
Inc., REIT | | | (37,570 | ) | | | (3,531,204 | ) |
| | | | | | | | | |
| Utilities — (1.1%) | | | | | | | | |
| Fortis, Inc. (Canada) | | | (63,045 | ) | | | (2,030,963 | ) |
| | | | | | | | | |
| Materials — (0.5%) | | | | | | | | |
| Berry Plastics Group, Inc.* | | | (20,462 | ) | | | (897,259 | ) |
| Total Common Stocks | | | | | | $ | (39,106,319 | ) |
57
| | Touchstone Merger Arbitrage Fund (Continued) |
| | | Shares | | Market
Value |
| | | | | |
| Exchange Traded Funds — (4.6%) | | | | | | | | |
| | | | | | | | | |
Consumer Staples Select Sector SPDR
Fund | | | (146 | ) | | $ | (7,769 | ) |
| Energy Select Sector SPDR Fund | | | (3,981 | ) | | | (281,098 | ) |
| iShares US Telecommunications ETF | | | (1,737 | ) | | | (55,966 | ) |
| Materials Select Sector SPDR Fund | | | (96 | ) | | | (4,584 | ) |
| SPDR S&P 500 ETF Trust | | | (38,400 | ) | | | (8,305,920 | ) |
| Utilities Select Sector SPDR Fund | | | (5,359 | ) | | | (262,537 | ) |
| Total Exchange Traded Funds | | | | | | $ | (8,917,874 | ) |
| | | | | | | | | |
Total Securities Sold Short
(Proceeds $46,794,156) | | | | | | $ | (48,024,193 | ) |
| | | Number
of
Contracts | | |
| Written Options — (0.1%) | | | | | | | | |
| | | | | | | | | |
| Written Put Options — (0.1%) | | | | | | | | |
SPDR S&P 500 ETF Trust.,
Strike @ 216.00, Exp 09/16 | | | (90 | ) | | | (180 | ) |
SPDR S&P 500 ETF Trust.,
Strike @ 202.00, Exp 10/16 | | | (168 | ) | | | (4,032 | ) |
SPDR S&P 500 ETF Trust.,
Strike @ 212.00, Exp 10/16 | | | (276 | ) | | | (32,016 | ) |
SPDR S&P 500 ETF Trust.,
Strike @ 216.00, Exp 10/16 | | | (120 | ) | | | (14,640 | ) |
| | | | | | | | (50,868 | ) |
| | | | | | | | | |
| Written Call Options — (0.0%) | | | | | | | | |
Fleetmatics Group PLC, Strike @ 60.00,
Exp 10/16 | | | (450 | ) | | | (18,000 | ) |
Whitewave Foods Co.,
Strike @ 57.50, Exp 10/16 | | | (337 | ) | | | (5,055 | ) |
| | | | | | | $ | (23,055 | ) |
| | | | | | | | | |
| Total Written Options | | | | | | | | |
| (Premiums received $120,236) | | | | | | $ | (73,923 | ) |
| | | | | | | | | |
| Total — 92.9% | | | | | | | 179,104,341 | |
| | | | | | | | | |
Cash Collateral for Securities
Sold Short and Written Options — 7.5% | | | | | | | 14,426,614 | |
| | | | | | | | | |
| Liabilities in Excess of Other Assets — (0.4%) | | | | | (769,117 | ) |
| | | | | | | | | |
| Net Assets — 100.0% | | | | | | $ | 192,761,838 | |
| (A) | Variable rate security - Rate reflected is the rate in effect as of September 30, 2016. |
| | |
| (B) | Perpetual Bond - A Bond with no definite maturity date. |
| | |
| * | Non-income producing security. |
| | |
| †† | All or a portion of these securities are held as collateral for securities sold short and written options. The total value of the securities held as collateral as of September 30, 2016 was $64,917,149. |
| | |
| ¥ | Open-End Fund. |
| | |
| Ω | Represents the 7-day SEC yield as of September 30, 2016. |
Portfolio Abbreviations:
ADR - American Depositary Receipt
CAD - Canadian Dollar
ETF - Exchange Traded Fund
GBP - Great British Pound
LLC - Limited Liability Company
PLC - Public Limited Company
REIT - Real Estate Investment Trust
SPDR - Standard & Poor’s Depositary Receipt
USD - United States Dollar
144a - This is a restricted security that was sold in a transaction qualifying for the exemption under Rule 144A of the Securities Act of 1933. This security may be sold in transactions exempt from registration, normally to qualified institutional buyers. At September 30, 2016, these securities were valued at $14,369,219 or 7.5% of net assets. These securities were deemed liquid pursuant to procedures approved by the Board of Trustees.
Other Information:
The inputs or methodology used for valuing securities may not be an indication of the risk associated with investing in those securities. For more information on valuation inputs, and their aggregation into the levels used in the table below, please refer to the security valuation section in the accompanying Notes to Financial Statements.
58
| Touchstone Merger Arbitrage Fund (Continued) | |
| Valuation inputs at Reporting Date: |
| Description | | Level 1 | | Level 2 | | Level 3 | | Total |
| | | | | | | | | |
| Assets: | | | | | | | | |
| Common Stocks | | | | | | | | | | | | | | | | |
| Information Technology | | $ | 34,398,570 | | | | $ – | | | $ | – | | | $ | 34,398,570 | |
| Health Care | | | 26,058,159 | | | | – | | | | – | | | | 26,058,159 | |
| Financials | | | 22,080,390 | | | | – | | | | – | | | | 22,080,390 | |
Consumer
Discretionary | | | 18,241,925 | | | | – | | | | – | | | | 18,241,925 | |
| Consumer Staples | | | 5,509,396 | | | | 6,151,113 | | | | – | | | | 11,660,509 | |
| Utilities | | | 9,246,172 | | | | – | | | | – | | | | 9,246,172 | |
| Industrials | | | 3,939,139 | | | | – | | | | – | | | | 3,939,139 | |
| Real Estate | | | 3,498,938 | | | | – | | | | – | | | | 3,498,938 | |
| Energy | | | 1,894,889 | | | | – | | | | – | | | | 1,894,889 | |
| Materials | | | 1,789,293 | | | | – | | | | – | | | | 1,789,293 | |
| Corporate Bonds | | | – | | | | 32,916,390 | | | | – | | | | 32,916,390 | |
Commercial
Mortgage-Backed Securities | | | – | | | | 4,009,443 | | | | – | | | | 4,009,443 | |
Exchange Traded
Funds | | | 6,313,219 | | | | – | | | | – | | | | 6,313,219 | |
| Preferred Stock | | | 559,685 | | | | – | | | | – | | | | 559,685 | |
| Warrant | | | 175,000 | | | | – | | | | – | | | | 175,000 | |
Purchased Options
Equity Contracts | | | 57,858 | | | | – | | | | – | | | | 57,858 | |
| Investment Fund | | | 50,362,878 | | | | – | | | | – | | | | 50,362,878 | |
| Other Financial Instruments** | | | | | | | | | | | | | |
Forward Foreign
Currency Contract | | | – | | | | 84,152 | | | | – | | | | 84,152 | |
| Total Assets | | $ | 184,125,511 | | | | $ 43,161,098 | | | | $ – | | | $ | 227,286,609 | |
| | | | | | | | | | | | | | |
Liabilities:
Securities Sold Short | | | | | | | | | | | | | |
| Common Stocks | | $ | (39,106,319 | ) | | | $ – | | | | $ – | | | $ | (39,106,319 | ) |
Exchange Traded
Funds | | | (8,917,874 | ) | | | – | | | | – | | | | (8,917,874 | ) |
| Other Financial Instruments** | | | | | | | | | | | | | |
Written Options
Equity Contracts | | | (73,923 | ) | | | – | | | | – | | | | (73,923 | ) |
Forward Foreign
Currency Contract | | | – | | | | (15,140 | ) | | | – | | | | (15,140 | ) |
| Total Liabilities | | $ | (48,098,116 | ) | | | $ (15,140 | ) | | | $ – | | | $ | (48,113,256 | ) |
| Total | | $ | 136,027,395 | | | | $ 43,145,958 | | | | $ – | | | $ | 179,173,353 | |
** Other Financial Instruments are derivative instruments not reflected in total investments. Amounts shown represent market value for written option equity contracts and unrealized appreciation (depreciation) on forward foreign currency contracts.
59
| | Touchstone Merger Arbitrage Fund (Continued) |
| Transactions in written options for the year ended September 30, 2016. |
| | | Number of
Contracts | | Premiums
Received |
| | | | | |
| Beginning balance, September 30, 2015 | | | 1,475 | | | $ | 275,757 | |
| Call Options Written | | | 2,736 | | | | 145,483 | |
| Put Options Written | | | 5,000 | | | | 650,992 | |
| Call Options Closed | | | (120 | ) | | | (9,535 | ) |
| Put Options Closed | | | (2,888 | ) | | | (433,573 | ) |
| Call Options Expired | | | (887 | ) | | | (19,483 | ) |
| Put Options Expired | | | (2,759 | ) | | | (367,658 | ) |
| Call Options Exercised | | | (942 | ) | | | (102,194 | ) |
| Put Options Exercised | | | (174 | ) | | | (19,553 | ) |
| | | | | | | | | |
| Ending balance, September 30, 2016 | | | 1,441 | | | $ | 120,236 | |
| Forward Foreign Currency Contracts | |
| | |
| | | | | | | | | | | | | | Unrealized | |
| | | | Contract to | | Appreication/ | |
| Counterparty | | Expiration Date | | Receive | | Deliver | | | (Depreciation) | |
| | | | | | | | | | | | | | | | | |
Brown Brothers
Harriman | | 10/14/2016 | | USD | | 7,412,146 | | GBP | | 5,652,000 | | | $ | 84,152 | | |
Brown Brothers
Harriman | | 10/21/2016 | | USD | | 1,880,057 | | CAD | | 2,486,000 | | | | (15,140 | ) | |
| | | | | | | | | | | | | | $ | 69,012 | | |
| | |
| See accompanying Notes to Financial Statements. | |
60
Portfolio of Investments
Touchstone Mid Cap Fund – September 30, 2016 | |
| | | | | | Market | |
| | | Shares | | | Value | |
| | | | | | | |
| Common Stocks — 97.6% | | | | | | | | |
| | | | | | | | | |
| Consumer Discretionary — 25.8% | | | | | | | | |
| CarMax, Inc.*† | | | 458,280 | | | $ | 24,449,238 | |
| Deckers Outdoor Corp.* | | | 201,840 | | | | 12,019,572 | |
| Dollar Tree, Inc.* | | | 288,100 | | | | 22,739,733 | |
| Hasbro, Inc. | | | 293,920 | | | | 23,316,674 | |
| Penske Automotive Group, Inc.† | | | 512,214 | | | | 24,678,471 | |
| PulteGroup, Inc. | | | 1,252,920 | | | | 25,108,517 | |
| Tempur Sealy International, Inc.*† | | | 411,160 | | | | 23,329,218 | |
| Whirlpool Corp. | | | 133,340 | | | | 21,622,414 | |
| | | | | | | | 177,263,837 | |
| | | | | | | | | |
| Information Technology — 16.9% | | | | | | | | |
| Amphenol Corp. - Class A | | | 530,890 | | | | 34,465,379 | |
| Citrix Systems, Inc.* | | | 323,940 | | | | 27,606,167 | |
| Paychex, Inc. | | | 528,400 | | | | 30,578,508 | |
| Symantec Corp. | | | 916,800 | | | | 23,011,680 | |
| | | | | | | | 115,661,734 | |
| | | | | | | | | |
| Industrials — 15.9% | | | | | | | | |
| Cintas Corp. | | | 374,170 | | | | 42,131,542 | |
| Copart, Inc.* | | | 477,310 | | | | 25,564,724 | |
| Dover Corp. | | | 298,171 | | | | 21,957,312 | |
| Old Dominion Freight Line, Inc.* | | | 286,710 | | | | 19,671,173 | |
| | | | | | | | 109,324,751 | |
| | | | | | | | | |
| Financials — 14.0% | | | | | | | | |
| Alleghany Corp.* | | | 60,390 | | | | 31,705,957 | |
| M&T Bank Corp. | | | 215,280 | | | | 24,994,008 | |
| Progressive Corp. (The) | | | 780,740 | | | | 24,593,310 | |
| Voya Financial, Inc. | | | 498,220 | | | | 14,358,700 | |
| | | | | | | | 95,651,975 | |
| | | | | | | | | |
| Materials — 13.8% | | | | | | | | |
| Ball Corp. | | | 417,740 | | | | 34,233,793 | |
| NewMarket Corp. | | | 77,810 | | | | 33,405,389 | |
| Vulcan Materials Co. | | | 236,290 | | | | 26,873,262 | |
| | | | | | | | 94,512,444 | |
| | | | | | | | | |
| Consumer Staples — 9.7% | | | | | | | | |
| Brown-Forman Corp. - Class B | | | 441,020 | | | | 20,921,989 | |
| Edgewell Personal Care Co.* | | | 225,030 | | | | 17,894,386 | |
| Energizer Holdings, Inc. | | | 362,671 | | | | 18,119,043 | |
| PriceSmart, Inc. | | | 115,930 | | | | 9,710,297 | |
| | | | | | | | 66,645,715 | |
| | | | | | | | | |
| Health Care — 1.5% | | | | | | | | |
| Tenet Healthcare Corp.* | | | 450,500 | | | | 10,208,330 | |
| Total Common Stocks | | | | | | $ | 669,268,786 | |
| | | | | | | Market | |
| | | Shares | | | | Value | |
| | | | | | | | | |
| Investment Funds — 8.2% | | | | | | | | |
| Dreyfus Government Cash Management, Institutional Shares, 0.30%¥Ω | | | 15,490,432 | | | $ | 15,490,432 | |
| Invesco Government & Agency Portfolio, Institutional Class, 0.31%**¥Ω | | | 41,064,072 | | | | 41,064,072 | |
| Total Investment Funds | | | | | | $ | 56,554,504 | |
| | | | | | | | | |
Total Investment Securities —105.8%
(Cost $657,791,204) | | | | | | $ | 725,823,290 | |
| | | | | | | | | |
| Liabilities in Excess of Other Assets — (5.8%) | | | | (39,808,267 | ) |
| | | | | | | | | |
| Net Assets — 100.0% | | | | | | $ | 686,015,023 | |
| * | Non-income producing security. |
| | |
| ** | Represents collateral for securities loaned. |
| | |
| † | All or a portion of the security is on loan. The total market value of the securities on loan as of September 30, 2016 was $41,122,934. |
| | |
| ∞ | Open-End Fund. |
| | |
| Ω | Represents the 7-day SEC yield as of September 30, 2016. |
Other Information:
The inputs or methodology used for valuing securities may not be an indication of the risk associated with investing in those securities. For more information on valuation inputs, and their aggregation into the levels used in the table below, please refer to the security valuation section in the accompanying Notes to Financial Statements.
| Valuation inputs at Reporting Date: |
| Description | | Level 1 | | | Level 2 | | | Level 3 | | | Total | |
| | | | | | | | | | | | | |
| Common Stocks | | $ | 669,268,786 | | | $ | — | | | $ | — | | | $ | 669,268,786 | |
| Investment Funds | | | 56,554,504 | | | | — | | | | — | | | | 56,554,504 | |
| Total | | $ | 725,823,290 | | | $ | — | | | $ | — | | | $ | 725,823,290 | |
See accompanying Notes to Financial Statements.
61
| | Portfolio of Investments
Touchstone Mid Cap Value Fund – September 30, 2016 |
| | | | | | Market | |
| | | Shares | | | Value | |
| | | | | | | | | |
| Common Stocks — 101.0% | | | | | | | | |
| | | | | | | | | |
| Financials — 20.8% | | | | | | | | |
| Allstate Corp. (The) | | | 131,503 | | | $ | 9,097,378 | |
| Ameriprise Financial, Inc. | | | 68,176 | | | | 6,801,920 | |
| Blackstone Mortgage Trust, Inc. - Class A, REIT | | | 292,887 | | | | 8,625,522 | |
| E*TRADE Financial Corp.* | | | 283,107 | | | | 8,244,076 | |
| Hancock Holding Co. | | | 229,105 | | | | 7,429,875 | |
| Hanover Insurance Group, Inc. (The) | | | 67,140 | | | | 5,063,699 | |
| Hartford Financial Services Group, Inc. (The) | | | 195,327 | | | | 8,363,902 | |
| M&T Bank Corp. | | | 65,565 | | | | 7,612,096 | |
| Reinsurance Group of America, Inc. | | | 74,310 | | | | 8,021,021 | |
| SunTrust Banks, Inc. | | | 122,054 | | | | 5,345,965 | |
| SVB Financial Group* | | | 57,815 | | | | 6,390,870 | |
| TCF Financial Corp. | | | 363,467 | | | | 5,273,906 | |
| Unum Group | | | 233,954 | | | | 8,260,916 | |
| Zions Bancorporation | | | 341,916 | | | | 10,606,234 | |
| | | | | | | | 105,137,380 | |
| | | | | | | | | |
| Industrials — 11.9% | | | | | | | | |
| Aercap Holdings N.V. (Netherlands)* | | | 219,821 | | | | 8,460,910 | |
| Clean Harbors, Inc.* | | | 83,510 | | | | 4,006,810 | |
| Dover Corp. | | | 80,899 | | | | 5,957,402 | |
| Fluor Corp. | | | 89,810 | | | | 4,609,049 | |
| KAR Auction Services, Inc. | | | 200,508 | | | | 8,653,925 | |
| Parker-Hannifin Corp. | | | 42,149 | | | | 5,290,964 | |
| Regal-Beloit Corp. | | | 123,131 | | | | 7,325,063 | |
| Stericycle, Inc.* | | | 105,227 | | | | 8,432,892 | |
| Xylem, Inc. | | | 135,938 | | | | 7,129,948 | |
| | | | | | | | 59,866,963 | |
| | | | | | | | | |
| Information Technology — 11.6% | | | | | | | | |
| Cadence Design Systems, Inc.* | | | 324,178 | | | | 8,276,264 | |
| CSRA, Inc. | | | 297,654 | | | | 8,006,893 | |
| Diebold, Inc. | | | 235,611 | | | | 5,840,797 | |
| Fidelity National Information Services, Inc. | | | 119,567 | | | | 9,210,246 | |
| IAC/InterActiveCorp. | | | 74,558 | | | | 4,657,638 | |
| Microchip Technology, Inc. | | | 114,594 | | | | 7,120,871 | |
| Qorvo, Inc.* | | | 145,801 | | | | 8,126,948 | |
| Synopsys, Inc.* | | | 121,764 | | | | 7,226,693 | |
| | | | | | | | 58,466,350 | |
| | | | | | | | | |
| Health Care — 11.1% | | | | | | | | |
| AmerisourceBergen Corp. | | | 83,801 | | | | 6,769,445 | |
| Amsurg Corp.* | | | 122,675 | | | | 8,225,359 | |
| Charles River Laboratories International, Inc.* | | | 77,750 | | | | 6,479,685 | |
| Cooper Cos, Inc. (The) | | | 39,041 | | | | 6,998,490 | |
| DENTSPLY SIRONA, Inc. | | | 119,567 | | | | 7,105,867 | |
| Patterson Cos., Inc. | | | 135,316 | | | | 6,216,417 | |
| Quest Diagnostics, Inc. | | | 93,250 | | | | 7,891,748 | |
| St. Jude Medical, Inc. | | | 78,537 | | | | 6,264,111 | |
| | | | | | | | 55,951,122 | |
| | | | | | Market | |
| | | Shares | | | Value | |
| | | | | | | | | |
| Consumer Discretionary — 9.0% | | | | | | | | |
| American Eagle Outfitters, Inc. | | | 268,933 | | | $ | 4,803,143 | |
| Aramark | | | 138,797 | | | | 5,278,450 | |
| BorgWarner, Inc. | | | 211,242 | | | | 7,431,494 | |
| Dollar General Corp. | | | 94,127 | | | | 6,587,949 | |
| Harley-Davidson, Inc. | | | 119,028 | | | | 6,259,683 | |
| LKQ Corp.* | | | 178,501 | | | | 6,329,645 | |
| Nordstrom, Inc.† | | | 83,013 | | | | 4,306,714 | |
| Ralph Lauren Corp. | | | 44,884 | | | | 4,539,568 | |
| | | | | | | | 45,536,646 | |
| | | | | | | | | |
| Utilities — 8.8% | | | | | | | | |
| DTE Energy Co. | | | 105,932 | | | | 9,922,650 | |
| Edison International | | | 118,821 | | | | 8,584,817 | |
| Great Plains Energy, Inc. | | | 221,893 | | | | 6,055,460 | |
| Pinnacle West Capital Corp. | | | 100,917 | | | | 7,668,683 | |
| Portland General Electric Co. | | | 119,526 | | | | 5,090,612 | |
| PPL Corp. | | | 202,124 | | | | 6,987,427 | |
| | | | | | | | 44,309,649 | |
| | | | | | | | | �� |
| Energy — 7.8% | | | | | | | | |
| Anadarko Petroleum Corp. | | | 133,700 | | | | 8,471,232 | |
| EQT Corp. | | | 119,235 | | | | 8,658,846 | |
| Newfield Exploration Co.* | | | 209,045 | | | | 9,085,096 | |
| Pioneer Natural Resources Co. | | | 43,309 | | | | 8,040,316 | |
| Spectra Energy Corp. | | | 123,380 | | | | 5,274,495 | |
| | | | | | | | 39,529,985 | |
| | | | | | | | | |
| Real Estate — 7.6% | | | | | | | | |
| Alexandria Real Estate Equities, Inc., REIT | | | 82,847 | | | | 9,011,268 | |
| American Campus Communities, Inc., REIT | | | 180,946 | | | | 9,204,723 | |
| Brixmor Property Group, Inc., REIT | | | 293,509 | | | | 8,156,615 | |
| Equinix, Inc., REIT | | | 17,034 | | | | 6,136,498 | |
| Host Hotels & Resorts, Inc., REIT | | | 385,516 | | | | 6,002,484 | |
| | | | | | | | 38,511,588 | |
| | | | | | | | | |
| Materials — 6.9% | | | | | | | | |
| Albemarle Corp. | | | 91,095 | | | | 7,787,712 | |
| Allegheny Technologies, Inc.† | | | 231,591 | | | | 4,184,849 | |
| Bemis Co., Inc. | | | 125,618 | | | | 6,407,774 | |
| FMC Corp. | | | 107,880 | | | | 5,214,919 | |
| Olin Corp. | | | 250,283 | | | | 5,135,807 | |
| Scotts Miracle-Gro Co. (The) - Class A | | | 72,569 | | | | 6,042,821 | |
| | | | | | | | 34,773,882 | |
| | | | | | | | | |
| Consumer Staples — 5.5% | | | | | | | | |
| Darling Ingredients, Inc.* | | | 433,715 | | | | 5,859,490 | |
| Hain Celestial Group, Inc. (The)* | | | 177,341 | | | | 6,309,793 | |
| Ingredion, Inc. | | | 50,811 | | | | 6,760,912 | |
| TreeHouse Foods, Inc.* | | | 104,150 | | | | 9,080,838 | |
| | | | | | | | 28,011,033 | |
| Total Common Stocks | | | | | | $ | 510,094,598 | |
62
| Touchstone Mid Cap Value Fund (Continued) | |
| | | | | | Market | |
| | | Shares | | | Value | |
| | | | | | | | | |
| Investment Funds — 3.1% | | | | | | | | |
| Dreyfus Government Cash Management, Institutional Shares, 0.30%¥Ω | | | 8,477,302 | | | $ | 8,477,302 | |
| Invesco Government & Agency Portfolio, Institutional Class, 0.31%**¥Ω | | | 6,925,787 | | | | 6,925,787 | |
| Total Investment Funds | | | | | | $ | 15,403,089 | |
| | | | | | | | | |
Total Investment Securities —104.1%
(Cost $469,795,903) | | | | | | $ | 525,497,687 | |
| | | | | | | | | |
| | | | | | | | | |
| Liabilities in Excess of Other Assets — (4.1%) | | | | (20,575,660 | ) |
| | | | | | | | | |
| Net Assets — 100.0% | | | | | | $ | 504,922,027 | |
| * | Non-income producing security. |
| | |
| ** | Represents collateral for securities loaned. |
| | |
| † | All or a portion of the security is on loan. The total market value of the securities on loan as of September 30, 2016 was $6,851,937. |
| | |
| ∞ | Open-End Fund. |
| | |
| Ω | Represents the 7-day SEC yield as of September 30, 2016. |
Portfolio Abbreviations:
REIT - Real Estate Investment Trust
Other Information:
The inputs or methodology used for valuing securities may not be an indication of the risk associated with investing in those securities. For more information on valuation inputs, and their aggregation into the levels used in the table below, please refer to the security valuation section in the accompanying Notes to Financial Statements.
| Valuation inputs at Reporting Date: |
| Description | | Level 1 | | | Level 2 | | | Level 3 | | | Total | |
| | | | | | | | | | | | | |
| Common Stocks | | $ | 510,094,598 | | | $ | — | | | $ | — | | | $ | 510,094,598 | |
| Investment Funds | | | 15,403,089 | | | | — | | | | — | | | | 15,403,089 | |
| Total | | $ | 525,497,687 | | | $ | — | | | $ | — | | | $ | 525,497,687 | |
See accompanying Notes to Financial Statements.
63
| | Portfolio of Investments
Touchstone Premium Yield Equity Fund – September 30, 2016 |
| | | | | | Market | |
| | | Shares | | | Value | |
| | | | | | | | | |
| Common Stocks — 95.8% | | | | | | | | |
| | | | | | | | | |
| Health Care — 19.9% | | | | | | | | |
| Abbott Laboratories | | | 75,602 | | | $ | 3,197,209 | |
| AbbVie, Inc. | | | 83,857 | | | | 5,288,861 | |
| GlaxoSmithKline PLC, ADR | | | 101,151 | | | | 4,362,643 | |
| Johnson & Johnson | | | 38,019 | | | | 4,491,184 | |
| Merck & Co., Inc. | | | 88,752 | | | | 5,539,012 | |
| Novartis AG, ADR | | | 33,935 | | | | 2,679,508 | |
| Pfizer, Inc. | | | 140,306 | | | | 4,752,164 | |
| | | | | | | | 30,310,581 | |
| | | | | | | | | |
| Information Technology — 14.7% | | | | | | | | |
| Cisco Systems, Inc. | | | 155,335 | | | | 4,927,226 | |
| International Business Machines Corp. | | | 18,996 | | | | 3,017,515 | |
| Microchip Technology, Inc. | | | 75,048 | | | | 4,663,483 | |
| QUALCOMM, Inc. | | | 91,036 | | | | 6,235,966 | |
| Western Digital Corp. | | | 62,226 | | | | 3,638,354 | |
| | | | | | | | 22,482,544 | |
| | | | | | | | | |
| Real Estate — 12.8% | | | | | | | | |
| Digital Realty Trust, Inc., REIT | | | 40,865 | | | | 3,968,809 | |
| Hospitality Properties Trust, REIT | | | 104,740 | | | | 3,112,873 | |
| Lamar Advertising Co., REIT | | | 45,857 | | | | 2,994,921 | |
| Omega Healthcare Investors, Inc., REIT | | | 40,787 | | | | 1,445,899 | |
| Ventas, Inc., REIT | | | 46,334 | | | | 3,272,570 | |
| Weyerhaeuser Co., REIT | | | 146,838 | | | | 4,690,006 | |
| | | | | | | | 19,485,078 | |
| | | | | | | | | |
| Energy — 11.0% | | | | | | | | |
| ONEOK, Inc. | | | 110,585 | | | | 5,682,963 | |
| Pembina Pipeline Corp. (Canada) | | | 45,681 | | | | 1,391,443 | |
| Plains GP Holdings LP - Class A | | | 347,633 | | | | 4,498,371 | |
| Spectra Energy Corp. | | | 122,782 | | | | 5,248,931 | |
| | | | | | | | 16,821,708 | |
| | | | | | | | | |
| Financials — 8.3% | | | | | | | | |
| Bank of Montreal (Canada) | | | 41,113 | | | | 2,695,779 | |
| CME Group, Inc. | | | 27,082 | | | | 2,830,611 | |
| PacWest Bancorp | | | 38,357 | | | | 1,645,899 | |
| Toronto-Dominion Bank (The) (Canada) | | | 69,501 | | | | 3,085,844 | |
| Wells Fargo & Co. | | | 56,381 | | | | 2,496,551 | |
| | | | | | | | 12,754,684 | |
| | | | | | | | | |
| Telecommunication Services — 8.0% | | | | | | | | |
| AT&T, Inc. | | | 109,635 | | | | 4,452,277 | |
| BCE, Inc. (Canada) | | | 28,061 | | | | 1,295,857 | |
| Verizon Communications, Inc. | | | 36,871 | | | | 1,916,555 | |
| Vodafone Group PLC, ADR | | | 154,023 | | | | 4,489,770 | |
| | | | | | | | 12,154,459 | |
| | | | | | | | | |
| Industrials — 7.0% | | | | | | | | |
| Covanta Holding Corp. | | | 69,805 | | | | 1,074,299 | |
| Eaton Corp. PLC (Ireland) | | | 39,808 | | | | 2,615,784 | |
| General Electric Co. | | | 143,849 | | | | 4,260,807 | |
| United Parcel Service, Inc. - Class B | | | 25,451 | | | | 2,783,321 | |
| | | | | | | | 10,734,211 | |
| | | | | | Market | |
| | | Shares | | | Value | |
| | | | | | | | | |
| Consumer Discretionary — 6.7% | | | | | | | | |
| Coach, Inc. | | | 99,193 | | | $ | 3,626,496 | |
| Johnson Controls International PLC (Ireland) | | | 85,393 | | | | 3,973,336 | |
| L Brands, Inc. | | | 37,524 | | | | 2,655,573 | |
| | | | | | | | 10,255,405 | |
| | | | | | | | | |
| Materials — 4.3% | | | | | | | | |
| Domtar Corp. | | | 79,289 | | | | 2,944,001 | |
| LyondellBasell Industries N.V. - Class A (Netherlands) | | | 44,702 | | | | 3,605,663 | |
| | | | | | | | 6,549,664 | |
| | | | | | | | | |
| Consumer Staples — 3.1% | | | | | | | | |
| Procter & Gamble Co. (The) | | | 52,419 | | | | 4,704,605 | |
| Total Common Stocks | | | | | | $ | 146,252,939 | |
| | | | | | | | | |
| Investment Fund — 4.1% | | | | | | | | |
| Dreyfus Government Cash Management, Institutional Shares, 0.30%¥Ω | | | 6,192,657 | | | | 6,192,657 | |
| | | | | | | | | |
Total Investment Securities —99.9%
(Cost $138,837,574) | | | | | | $ | 152,445,596 | |
| | | | | | | | | |
| | | | | | | | | |
| Other Assets in Excess of Liabilities — 0.1% | | | | | | | 195,562 | |
| | | | | | | | | |
| Net Assets — 100.0% | | | | | | $ | 152,641,158 | |
| ∞ | Open-End Fund. |
| | |
| Ω | Represents the 7-day SEC yield as of September 30, 2016. |
Portfolio Abbreviations:
ADR - American Depositary Receipt
PLC - Public Limited Company
REIT - Real Estate Investment Trust
Other Information:
The inputs or methodology used for valuing securities may not be an indication of the risk associated with investing in those securities. For more information on valuation inputs, and their aggregation into the levels used in the table below, please refer to the security valuation section in the accompanying Notes to Financial Statements.
| Valuation inputs at Reporting Date: |
| Description | | Level 1 | | | Level 2 | | | Level 3 | | | Total | |
| | | | | | | | | | | | | | | | | |
| Common Stocks | | $ | 146,252,939 | | | $ | — | | | $ | — | | | $ | 146,252,939 | |
| Investment Fund | | | 6,192,657 | | | | — | | | | — | | | | 6,192,657 | |
| Total | | $ | 152,445,596 | | | $ | — | | | $ | — | | | $ | 152,445,596 | |
See accompanying Notes to Financial Statements.
64
Portfolio of Investments
Touchstone Sands Capital Select Growth Fund – September 30, 2016 | |
| | | | | | Market | |
| | | Shares | | | Value | |
| | | | | | | | | |
| Common Stocks — 98.1% | | | | | | | | |
| | | | | | | | | |
| Information Technology — 48.3% | | | | | | | | |
| Adobe Systems, Inc.* | | | 1,346,134 | | | $ | 146,109,384 | |
| Alibaba Group Holding Ltd. ADR* | | | 1,365,867 | | | | 144,495,070 | |
| Alphabet, Inc. - Class A* | | | 169,300 | | | | 136,127,358 | |
| Alphabet, Inc. - Class C* | | | 63,500 | | | | 49,357,915 | |
| Baidu, Inc. ADR* | | | 540,780 | | | | 98,459,815 | |
| Facebook, Inc. - Class A* | | | 1,918,880 | | | | 246,134,738 | |
| Mobileye N.V. (Netherlands)*† | | | 1,305,648 | | | | 55,581,435 | |
| Palo Alto Networks, Inc.* | | | 600,400 | | | | 95,661,732 | |
| Salesforce.com, Inc.* | | | 2,948,612 | | | | 210,324,494 | |
| Splunk, Inc.* | | | 1,300,844 | | | | 76,333,526 | |
| Visa, Inc. - Class A | | | 3,686,199 | | | | 304,848,657 | |
| | | | | | | | 1,563,434,124 | |
| | | | | | | | | |
| Health Care — 22.1% | | | | | | | | |
| Alexion Pharmaceuticals, Inc.* | | | 712,230 | | | | 87,276,664 | |
| athenahealth, Inc.*† | | | 428,051 | | | | 53,985,792 | |
| Biogen, Inc.* | | | 237,590 | | | | 74,372,800 | |
| BioMarin Pharmaceutical, Inc.* | | | 968,681 | | | | 89,622,366 | |
| Cerner Corp.* | | | 1,064,331 | | | | 65,722,439 | |
| Edwards Lifesciences Corp.* | | | 778,677 | | | | 93,877,299 | |
| Illumina, Inc.* | | | 580,396 | | | | 105,434,737 | |
| Incyte Corp.* | | | 579,062 | | | | 54,599,756 | |
| Regeneron Pharmaceuticals, Inc.* | | | 222,431 | | | | 89,421,711 | |
| | | | | | | | 714,313,564 | |
| | | | | | | | | |
| Consumer Discretionary — 19.8% | | | | | | | | |
| Amazon.com, Inc.* | | | 254,000 | | | | 212,676,740 | |
| Chipotle Mexican Grill, Inc.* | | | 189,500 | | | | 80,253,250 | |
| Netflix, Inc.* | | | 1,027,000 | | | | 101,210,850 | |
| Priceline Group, Inc. (The)* | | | 127,300 | | | | 187,320,677 | |
| Under Armour, Inc. - Class A*† | | | 840,000 | | | | 32,491,200 | |
| Under Armour, Inc. - Class C* | | | 846,019 | | | | 28,646,203 | |
| | | | | | | | 642,598,920 | |
| | | | | | | | | |
| Financials — 3.5% | | | | | | | | |
| Charles Schwab Corp. (The) | | | 2,658,000 | | | | 83,913,060 | |
| LendingClub Corp.*† | | | 4,559,000 | | | | 28,174,620 | |
| | | | | | | | 112,087,680 | |
| | | | | | | | | |
| Materials — 2.4% | | | | | | | | |
| Monsanto Co. | | | 773,500 | | | | 79,051,700 | |
| | | | | | | | | |
| Energy — 2.0% | | | | | | | | |
| Schlumberger Ltd. (Curacao) | | | 838,482 | | | | 65,938,224 | |
| Total Common Stocks | | | | | | $ | 3,177,424,212 | |
| | | | | | Market | |
| | | Shares | | | Value | |
| | | | | | | | | |
| Investment Funds — 7.0% | | | | | | | | |
| Dreyfus Government Cash Management, Institutional Shares, 0.30%¥Ω | | | 123,874,168 | | | $ | 123,874,168 | |
| Invesco Government & Agency Portfolio, Institutional Class, 0.31%**¥Ω | | | 101,299,820 | | | | 101,299,820 | |
| Total Investment Funds | | | | | | $ | 225,173,988 | |
| | | | | | | | | |
Total Investment Securities —105.1%
(Cost $1,991,125,559) | | | | | | $ | 3,402,598,200 | |
| | | | | | | | | |
| Liabilities in Excess of Other Assets — (5.1%) | | | | (164,560,595 | ) |
| | | | | | | | | |
| Net Assets — 100.0% | | | | | | $ | 3,238,037,605 | |
| * | Non-income producing security. |
| | |
| ** | Represents collateral for securities loaned. |
| | |
| † | All or a portion of the security is on loan. The total market value of the securities on loan as of September 30, 2016 was $100,594,535. |
| | |
| ∞ | Open-End Fund. |
| | |
| Ω | Represents the 7-day SEC yield as of September 30, 2016. |
Portfolio Abbreviation:
ADR - American Depositary Receipt
Other Information:
The inputs or methodology used for valuing securities may not be an indication of the risk associated with investing in those securities. For more information on valuation inputs, and their aggregation into the levels used in the table below, please refer to the security valuation section in the accompanying Notes to Financial Statements.
| Valuation inputs at Reporting Date: |
| Description | | Level 1 | | | Level 2 | | | Level 3 | | | Total | |
| | | | | | | | | | | | | |
| Common Stocks | | $ | 3,177,424,212 | | | $ | — | | | $ | — | | | $ | 3,177,424,212 | |
| Investment Funds | | | 225,173,988 | | | | — | | | | — | | | | 225,173,988 | |
| Total | | $ | 3,402,598,200 | | | $ | — | | | $ | — | | | $ | 3,402,598,200 | |
See accompanying Notes to Financial Statements.
65
| | Portfolio of Investments
Touchstone Small Cap Fund – September 30, 2016 |
| | | | | | Market | |
| | | Shares | | | Value | |
| | | | | | | | | |
| Common Stocks — 98.8% | | | | | | | | |
| | | | | | | | | |
| Industrials — 26.0% | | | | | | | | |
| Armstrong World Industries, Inc.* | | | 444,570 | | | $ | 18,369,632 | |
| GATX Corp.† | | | 515,520 | | | | 22,966,418 | |
| Kaman Corp. | | | 472,858 | | | | 20,767,923 | |
| Landstar System, Inc. | | | 283,240 | | | | 19,282,979 | |
| Matson, Inc. | | | 449,575 | | | | 17,929,051 | |
| Orbital ATK, Inc. | | | 465,802 | | | | 35,508,086 | |
| USG Corp.* | | | 852,700 | | | | 22,042,295 | |
| | | | | | | | 156,866,384 | |
| | | | | | | | | |
| Consumer Discretionary — 24.8% | | | | | | | | |
| Cabela’s, Inc.* | | | 311,926 | | | | 17,134,095 | |
| Deckers Outdoor Corp.* | | | 259,690 | | | | 15,464,540 | |
| Penske Automotive Group, Inc.† | | | 595,000 | | | | 28,667,100 | |
| Service Corp. International | | | 1,031,420 | | | | 27,373,887 | |
| Sturm Ruger & Co., Inc.† | | | 194,862 | | | | 11,255,229 | |
| Tempur Sealy International, Inc.*† | | | 518,180 | | | | 29,401,533 | |
| Vista Outdoor, Inc.* | | | 510,890 | | | | 20,364,075 | |
| | | | | | | | 149,660,459 | |
| | | | | | | | | |
| Materials — 11.6% | | | | | | | | |
| NewMarket Corp. | | | 96,593 | | | | 41,469,307 | |
| Olin Corp. | | | 1,018,340 | | | | 20,896,337 | |
| Tredegar Corp. | | | 401,260 | | | | 7,459,423 | |
| | | | | | | | 69,825,067 | |
| | | | | | | | | |
| Real Estate — 10.2% | | | | | | | | |
| Alexander & Baldwin, Inc. | | | 742,458 | | | | 28,525,236 | |
| First Industrial Realty Trust, Inc. REIT | | | 908,351 | | | | 25,633,665 | |
| Tejon Ranch Co.* | | | 309,851 | | | | 7,535,576 | |
| | | | | | | | 61,694,477 | |
| | | | | | | | | |
| Consumer Staples — 8.3% | | | | | | | | |
| Energizer Holdings, Inc. | | | 526,980 | | | | 26,327,921 | |
| PriceSmart, Inc. | | | 280,605 | | | | 23,503,475 | |
| | | | | | | | 49,831,396 | |
| | | | | | | | | |
| Financials — 7.4% | | | | | | | | |
| Eaton Vance Corp. | | | 340,939 | | | | 13,313,668 | |
| MBIA, Inc.* | | | 1,350,954 | | | | 10,523,932 | |
| White Mountains Insurance Group Ltd. | | | 25,089 | | | | 20,823,870 | |
| | | | | | | | 44,661,470 | |
| | | | | | | | | |
| Energy — 4.5% | | | | | | | | |
| Superior Energy Services, Inc. | | | 983,990 | | | | 17,613,421 | |
| World Fuel Services Corp. | | | 202,294 | | | | 9,358,120 | |
| | | | | | | | 26,971,541 | |
| | | | | | | | | |
| Information Technology — 3.9% | | | | | | | | |
| DST Systems, Inc. | | | 201,610 | | | | 23,773,851 | |
| | | | | | | | | |
| Health Care — 2.1% | | | | | | | | |
| Tenet Healthcare Corp.* | | | 569,837 | | | | 12,912,506 | |
| Total Common Stocks | | | | | | $ | 596,197,151 | |
| | | | | | Market | |
| | | Shares | | | Value | |
| | | | | | | | | |
| Investment Funds — 11.2% | | | | | | | | |
| Dreyfus Government Cash Management, Institutional Shares, 0.30%¥W | | | 3,398 | | | $ | 3,398 | |
| Invesco Government & Agency Portfolio, Institutional Class, 0.31%**¥W | | | 67,474,423 | | | | 67,474,423 | |
| Total Investment Funds | | | | | | $ | 67,477,821 | |
| | | | | | | | | |
Total Investment Securities — 110.0%
(Cost $528,142,370) | | | | | | $ | 663,674,972 | |
| | | | | | | | | |
| Liabilities in Excess of Other Assets — (10.0%) | | | | (60,155,525 | ) |
| | | | | | | | | |
| Net Assets — 100.0% | | | | | | $ | 603,519,447 | |
| * | Non-income producing security. |
| | |
| ** | Represents collateral for securities loaned. |
| | |
| † | All or a portion of the security is on loan. The total market value of the securities on loan as of September 30, 2016 was $67,507,093. |
| | |
| ∞ | Open-End Fund. |
| | |
| Ω | Represents the 7-day SEC yield as of September 30, 2016. |
Portfolio Abbreviation:
REIT - Real Estate Investment Trust
Other Information:
The inputs or methodology used for valuing securities may not be an indication of the risk associated with investing in those securities. For more information on valuation inputs, and their aggregation into the levels used in the table below, please refer to the security valuation section in the accompanying Notes to Financial Statements.
| Valuation inputs at Reporting Date: |
| Description | | Level 1 | | | Level 2 | | | Level 3 | | | Total | |
| | | | | | | | | | | | | | | | | |
| Common Stocks | | $ | 596,197,151 | | | $ | — | | | $ | — | | | $ | 596,197,151 | |
| Investment Funds | | | 67,477,821 | | | | — | | | | — | | | | 67,477,821 | |
| Total | | $ | 663,674,972 | | | $ | — | | | $ | — | | | $ | 663,674,972 | |
See accompanying Notes to Financial Statements.
66
Portfolio of Investments
Touchstone Small Cap Value Fund – September 30, 2016 | |
| | | Shares | | Market
Value |
| | | | | |
| Common Stocks — 98.0% | | | | | | | | |
| | | | | | | | | |
| Financials — 26.2% | | | | | | | | |
| BankUnited, Inc. | | | 58,194 | | | $ | 1,757,459 | |
| Blackstone Mortgage Trust, Inc. - Class A REIT | | | 122,880 | | | | 3,618,816 | |
| Boston Private Financial Holdings, Inc. | | | 84,034 | | | | 1,078,156 | |
| Eagle Bancorp, Inc.* | | | 33,506 | | | | 1,652,851 | |
| Employers Holdings, Inc. | | | 33,532 | | | | 1,000,260 | |
| Endurance Specialty Holdings Ltd. (Bermuda) | | | 15,640 | | | | 1,023,638 | |
| Federated Investors, Inc. - Class B | | | 28,788 | | | | 852,988 | |
| First Horizon National Corp. | | | 143,147 | | | | 2,180,129 | |
| Hancock Holding Co. | | | 80,463 | | | | 2,609,415 | |
| Hanover Insurance Group, Inc. (The) | | | 31,555 | | | | 2,379,878 | |
| Hercules Capital, Inc. | | | 176,551 | | | | 2,394,032 | |
| Horace Mann Educators Corp. | | | 85,232 | | | | 3,123,753 | |
| IBERIABANK Corp. | | | 36,365 | | | | 2,440,819 | |
| Infinity Property & Casualty Corp. | | | 23,770 | | | | 1,964,115 | |
| MB Financial, Inc. | | | 56,231 | | | | 2,139,027 | |
| PacWest Bancorp | | | 47,844 | | | | 2,052,986 | |
| ServisFirst Bancshares, Inc. | | | 42,823 | | | | 2,222,942 | |
| SLM Corp.* | | | 310,099 | | | | 2,316,440 | |
| Sterling Bancorp | | | 213,128 | | | | 3,729,740 | |
| TCF Financial Corp. | | | 133,298 | | | | 1,934,154 | |
| Univest Corp. of Pennsylvania | | | 83,935 | | | | 1,960,722 | |
| Validus Holdings Ltd. (Bermuda) | | | 45,057 | | | | 2,244,740 | |
| | | | | | | | 46,677,060 | |
| | | | | | | | | |
| Industrials — 21.0% | | | | | | | | |
| Actuant Corp. - Class A | | | 58,410 | | | | 1,357,446 | |
| Altra Industrial Motion Corp. | | | 35,053 | | | | 1,015,485 | |
| Clean Harbors, Inc.* | | | 37,421 | | | | 1,795,460 | |
| EMCOR Group, Inc. | | | 40,715 | | | | 2,427,428 | |
| EnPro Industries, Inc. | | | 36,393 | | | | 2,067,850 | |
| Generac Holdings, Inc.* | | | 50,571 | | | | 1,835,727 | |
| Hexcel Corp. | | | 42,396 | | | | 1,878,143 | |
| Huron Consulting Group, Inc.* | | | 42,600 | | | | 2,545,776 | |
| ITT, Inc. | | | 42,999 | | | | 1,541,084 | |
| Korn/Ferry International | | | 83,795 | | | | 1,759,695 | |
| Matthews International Corp. - Class A | | | 26,842 | | | | 1,630,920 | |
| Multi-Color Corp. | | | 14,641 | | | | 966,306 | |
| Regal Beloit Corp. | | | 31,525 | | | | 1,875,422 | |
| Standex International Corp. | | | 22,516 | | | | 2,091,061 | |
| Team, Inc.* | | | 59,425 | | | | 1,943,792 | |
| Teledyne Technologies, Inc.* | | | 10,607 | | | | 1,144,814 | |
| Tetra Tech, Inc. | | | 64,174 | | | | 2,276,252 | |
| TriMas Corp.* | | | 92,156 | | | | 1,715,023 | |
| TriNet Group, Inc.* | | | 110,625 | | | | 2,392,819 | |
| Triumph Group, Inc. | | | 44,695 | | | | 1,246,097 | |
| Watts Water Technologies, Inc. - Class A | | | 29,137 | | | | 1,889,243 | |
| | | | | | | | 37,395,843 | |
| | | | | | | | | |
| | | | | | | | | |
| Information Technology — 13.4% | | | | | | | | |
| Blackhawk Network Holdings, Inc.* | | | 68,195 | | | | 2,057,443 | |
| BroadSoft, Inc.* | | | 29,897 | | | | 1,391,705 | |
| CACI International, Inc. - Class A* | | | 17,861 | | | | 1,802,175 | |
| Coherent, Inc.* | | | 15,803 | | | | 1,746,864 | |
| CSRA, Inc. | | | 84,924 | | | | 2,284,456 | |
| | | Shares | | Market
Value |
| | | | | |
| Information Technology — (Continued) | | | | | | | | |
| Diebold, Inc. | | | 89,040 | | | $ | 2,207,302 | |
| Ixia* | | | 220,975 | | | | 2,762,188 | |
| MACOM Technology Solutions Holdings, Inc.* | | | 52,275 | | | | 2,213,324 | |
| MKS Instruments, Inc. | | | 28,956 | | | | 1,439,982 | |
| PTC, Inc.* | | | 64,052 | | | | 2,838,144 | |
| Semtech Corp.* | | | 74,862 | | | | 2,075,923 | |
| Virtusa Corp.* | | | 41,849 | | | | 1,032,833 | |
| | | | | | | | 23,852,339 | |
| | | | | | | | | |
| Consumer Discretionary — 9.5% | | | | | | | | |
| American Eagle Outfitters, Inc. | | | 86,102 | | | | 1,537,782 | |
| Arctic Cat, Inc.† | | | 32,362 | | | | 501,287 | |
| Buffalo Wild Wings, Inc.* | | | 8,602 | | | | 1,210,645 | |
| Callaway Golf Co. | | | 121,124 | | | | 1,406,250 | |
| Dorman Products, Inc.* | | | 18,507 | | | | 1,182,597 | |
| DSW, Inc. - Class A | | | 75,928 | | | | 1,555,005 | |
| Ethan Allen Interiors, Inc. | | | 21,615 | | | | 675,901 | |
| Express, Inc.* | | | 41,379 | | | | 487,858 | |
| Horizon Global Corp.* | | | 89,465 | | | | 1,783,037 | |
| Murphy USA, Inc.* | | | 38,975 | | | | 2,781,256 | |
| Oxford Industries, Inc. | | | 21,450 | | | | 1,452,165 | |
| Steven Madden Ltd.* | | | 37,286 | | | | 1,288,604 | |
| Tailored Brands, Inc. | | | 68,180 | | | | 1,070,426 | |
| | | | | | | | 16,932,813 | |
| | | | | | | | | |
| Health Care — 5.2% | | | | | | | | |
| Amsurg Corp.* | | | 42,411 | | | | 2,843,658 | |
| Charles River Laboratories International, Inc.* | | | 26,868 | | | | 2,239,179 | |
| HealthSouth Corp. | | | 68,758 | | | | 2,789,512 | |
| PerkinElmer, Inc. | | | 25,680 | | | | 1,440,905 | |
| | | | | | | | 9,313,254 | |
| | | | | | | | | |
| Materials — 5.1% | | | | | | | | |
| Allegheny Technologies, Inc. | | | 96,373 | | | | 1,741,460 | |
| Berry Plastics Group, Inc.* | | | 36,286 | | | | 1,591,141 | |
| Ingevity Corp.* | | | 21,234 | | | | 978,887 | |
| Innophos Holdings, Inc. | | | 32,789 | | | | 1,279,755 | |
| Olin Corp. | | | 89,933 | | | | 1,845,425 | |
| Silgan Holdings, Inc. | | | 33,061 | | | | 1,672,556 | |
| | | | | | | | 9,109,224 | |
| | | | | | | | | |
| Utilities — 4.6% | | | | | | | | |
| Great Plains Energy, Inc. | | | 93,562 | | | | 2,553,307 | |
| IDACORP, Inc. | | | 20,659 | | | | 1,617,187 | |
| NorthWestern Corp. | | | 16,515 | | | | 950,108 | |
| Portland General Electric Co. | | | 71,075 | | | | 3,027,084 | |
| | | | | | | | 8,147,686 | |
| | | | | | | | | |
| Consumer Staples — 4.5% | | | | | | | | |
| Darling Ingredients, Inc.* | | | 140,588 | | | | 1,899,344 | |
| Hain Celestial Group, Inc. (The)* | | | 58,052 | | | | 2,065,490 | |
| Snyder’s-Lance, Inc. | | | 36,810 | | | | 1,236,080 | |
| TreeHouse Foods, Inc.* | | | 33,173 | | | | 2,892,354 | |
| | | | | | | | 8,093,268 | |
67
| | Touchstone Small Cap Value Fund (Continued) |
| | | Shares | | Market
Value |
| | | | | |
| Common Stocks — 98.0% (Continued) | | | | | | | | |
| | | | | | | | | |
| Real Estate — 4.4% | | | | | | | | |
| Corporate Office Properties Trust REIT | | | 91,062 | | | $ | 2,581,608 | |
| Education Realty Trust, Inc. REIT | | | 51,927 | | | | 2,240,131 | |
| Equity One, Inc. REIT | | | 59,285 | | | | 1,814,714 | |
| Lexington Realty Trust REIT | | | 124,164 | | | | 1,278,889 | |
| | | | | | | | 7,915,342 | |
| | | | | | | | | |
| Energy — 3.4% | | | | | | | | |
| Callon Petroleum Co.* | | | 103,963 | | | | 1,632,219 | |
| Carrizo Oil & Gas, Inc.* | | | 46,461 | | | | 1,887,246 | |
| Synergy Resources Corp.* | | | 217,566 | | | | 1,507,732 | |
| World Fuel Services Corp. | | | 23,139 | | | | 1,070,410 | |
| | | | | | | | 6,097,607 | |
| | | | | | | | | |
| Telecommunication Services — 0.7% | | | | | | | | |
| Cogent Communications Holdings, Inc. | | | 32,222 | | | | 1,186,092 | |
| Total Common Stocks | | | | | | $ | 174,720,528 | |
| | | | | | | | | |
| Exchange Traded Fund — 0.1% | | | | | | | | |
| iShares Russell 2000 Value ETF | | | 1,707 | | | | 178,808 | |
| | | | | | | | | |
| Investment Funds — 0.7% | | | | | | | | |
| Dreyfus Government Cash Management, Institutional Shares, 0.30%¥W | | | 1,080,846 | | | | 1,080,846 | |
| Invesco Government & Agency Portfolio, Institutional Class, 0.31%**¥W | | | 98,825 | | | | 98,825 | |
| Total Investment Funds | | | | | | $ | 1,179,671 | |
| | | | | | | | | |
Total Investment Securities —98.8%
(Cost $174,135,976) | | | | | | $ | 176,079,007 | |
| | | | | | | | | |
| Other Assets in Excess of Liabilities — 1.2% | | | | | | | 2,198,132 | |
| | | | | | | | | |
| Net Assets — 100.0% | | | | | | $ | 178,277,139 | |
| * | Non-income producing security. |
| | |
| ** | Represents collateral for securities loaned. |
| | |
| † | All or a portion of the security is on loan. The total market value of the securities on loan as of September 30, 2016 was $103,783. |
| | |
| ¥ | Open-End Fund. |
| | |
| W | Represents the 7-day SEC yield as of September 30, 2016. |
Portfolio Abbreviation:
ETF - Exchange Traded Fund
REIT - Real Estate Investment Trust
Other Information:
The inputs or methodology used for valuing securities may not be an indication of the risk associated with investing in those securities. For more information on valuation inputs, and their aggregation into the levels used in the table below, please refer to the security valuation section in the accompanying Notes to Financial Statements.
| Valuation inputs at Reporting Date: |
| Description | | | Level 1 | | | | Level 2 | | | | Level 3 | | | | Total | |
| | | | | | | | | | | | | | | | | |
| Common Stocks | | $ | 174,720,528 | | | $ | — | | | $ | — | | | $ | 174,720,528 | |
| Exchange Traded Fund | | | 178,808 | | | | — | | | | — | | | | 178,808 | |
| Investment Funds | | | 1,179,671 | | | | — | | | | — | | | | 1,179,671 | |
| Total | | $ | 176,079,007 | | | $ | — | | | $ | — | | | $ | 176,079,007 | |
See accompanying Notes to Financial Statements.
68
Portfolio of Investments
Touchstone Total Return Bond Fund – September 30, 2016 | |
Principal
Amount | | | | Market
Value |
| | | | | | | | | |
| | | | | Corporate Bonds — 32.7% | | | | |
| | | | | | | | | |
| | | | | Industrials — 10.3% | | | | |
| $ | 1,406,247 | | | American Airlines 2011-1 Class B Pass Through Trust, 144a, 7.000%, 1/31/18 | | $ | 1,469,528 | |
| | 54,047 | | | Burlington Northern and Santa Fe Railway Co. 1998-C Pass Through Trust, 6.230%, 7/2/18 | | | 56,058 | |
| | 78,282 | | | Burlington Northern and Santa Fe Railway Co. 2004-1 Pass Through Trust, 4.575%, 1/15/21 | | | 82,788 | |
| | 337,614 | | | Burlington Northern and Santa Fe Railway Co. 2005-3 Pass Through Trust, 4.830%, 1/15/23 | | | 358,728 | |
| | 1,044,179 | | | Burlington Northern and Santa Fe Railway Co. 2005-4 Pass Through Trust, 4.967%, 4/1/23 | | | 1,130,525 | |
| | 1,417,922 | | | Continental Airlines 2000-2 Class A-1 Pass Through Trust, 7.707%, 4/2/21 | | | 1,545,535 | |
| | 1,545,952 | | | CSX Transportation, Inc., 6.251%, 1/15/23 | | | 1,819,748 | |
| | 1,536,047 | | | Delta Air Lines 2010-2 Class A Pass Through Trust, 4.950%, 5/23/19 | | | 1,616,690 | |
| | 879,137 | | | Federal Express Corp. 1998 Pass Through Trust, 6.845%, 1/15/19 | | | 927,489 | |
| | 555,900 | | | Federal Express Corp. 1999 Pass Through Trust, 7.650%, 1/15/22 | | | 649,569 | |
| | 1,500,000 | | | GATX Corp., 3.250%, 3/30/25 | | | 1,509,042 | |
| | 524,000 | | | General Electric Co. MTN, 3.450%, 5/15/24 | | | 568,546 | |
| | 600,000 | | | Kansas City Southern, 3.000%, 5/15/23 | | | 611,279 | |
| | 1,225,000 | | | Kansas City Southern, 3.125%, 6/1/26 | | | 1,243,840 | |
| | 1,941,000 | | | Norfolk Southern Corp., 2.903%, 2/15/23 | | | 2,010,166 | |
| | 1,402,000 | | | Republic Services, Inc., 5.250%, 11/15/21 | | | 1,616,791 | |
| | 1,282,261 | | | Southwest Airlines Co. 2007-1 Pass Through Trust, 6.150%, 8/1/22 | | | 1,445,749 | |
| | 48,493 | | | Union Pacific Railroad Co. 2001 Pass Through Trust, 6.630%, 1/27/22 | | | 54,586 | |
| | 1,024,876 | | | Union Pacific Railroad Co. 2003 Pass Through Trust, 4.698%, 1/2/24 | | | 1,098,768 | |
| | 660,500 | | | Union Pacific Railroad Co. 2006 Pass Through Trust, 5.866%, 7/2/30 | | | 769,783 | |
| | 1,372,000 | | | United Rentals North America, Inc., 5.750%, 11/15/24 | | | 1,423,450 | |
| | 1,300,000 | | | Waste Management, Inc., 2.400%, 5/15/23 | | | 1,312,977 | |
| | | | | | | | 23,321,635 | |
| | | | | | | | | |
| | | | | Financials — 7.9% | | | | |
| | 2,008,000 | | | American Express Co., 2.650%, 12/2/22 | | | 2,054,965 | |
| | 1,351,000 | | | Delphi Financial Group, Inc., 7.875%, 1/31/20 | | | 1,550,321 | |
| | 2,000,000 | | | Fishers Lane Associates LLC, 144a, 3.666%, 8/5/30 | | | 2,101,492 | |
| Principal Amount | | | | Market
Value |
| | | | | | | | | |
| | | | | Financials — (Continued) | | | | |
| $ | 2,050,000 | | | Ford Motor Credit Co. LLC, 4.375%, 8/6/23 | | $ | 2,203,811 | |
| | 1,386,000 | | | GE Capital International Funding Co. (Ireland), 3.373%, 11/15/25 | | | 1,499,676 | |
| | 1,501,000 | | | National Rural Utilities Cooperative Finance Corp., 3.400%, 11/15/23 | | | 1,610,681 | |
| | 1,500,000 | | | Provident Cos., Inc., 7.000%, 7/15/18 | | | 1,632,811 | |
| | 1,398,000 | | | Torchmark Corp., 3.800%, 9/15/22 | | | 1,484,869 | |
| | 2,000,000 | | | USB Capital IX, 3.500%, 10/29/49(A)(B) | | | 1,712,500 | |
| | 2,000,000 | | | Wachovia Capital Trust III, | | | | |
| | | | | 5.570%, 3/29/49(A)(B) | | | 1,994,800 | |
| | | | | | | | 17,845,926 | |
| | | | | | | | | |
| | | | | Utilities — 5.1% | | | | |
| | 1,348,328 | | | Bruce Mansfield Unit 1, 2007 Pass Through Trust, 6.850%, 6/1/34 | | | 687,647 | |
| | 550,000 | | | California Water Service Co., 5.500%, 12/1/40 | | | 689,555 | |
| | 1,311,000 | | | Commonwealth Edison Co., 5.900%, 3/15/36 | | | 1,721,575 | |
| | 1,780,000 | | | Dominion Resources, Inc., 3.138%, 9/30/66(A) | | | 1,406,200 | |
| | 275,000 | | | Duke Energy Progress LLC, 6.300%, 4/1/38 | | | 382,653 | |
| | 1,700,000 | | | Entergy Louisiana LLC, 4.440%, 1/15/26 | | | 1,917,138 | |
| | 733,137 | | | Kiowa Power Partners LLC, 144a, 5.737%, 3/30/21 | | | 774,434 | |
| | 2,000,000 | | | NextEra Energy Capital Holdings, Inc., 6.350%, 10/1/66(A) | | | 1,653,760 | |
| | 1,983,000 | | | South Carolina Electric & Gas Co., 4.600%, 6/15/43 | | | 2,245,466 | |
| | | | | | | | 11,478,428 | |
| | | | | | | | | |
| | | | | Energy — 4.4% | | | | |
| | 1,000,000 | | | Apache Corp., 3.250%, 4/15/22 | | | 1,026,142 | |
| | 1,253,000 | | | Chesapeake Energy Corp., 6.625%, 8/15/20 | | | 1,179,386 | |
| | 1,530,000 | | | Newfield Exploration Co., 5.750%, 1/30/22 | | | 1,579,725 | |
| | 1,551,000 | | | Petrobras Global Finance BV (Cayman Islands), 3.500%, 2/6/17 | | | 1,555,033 | |
| | 1,500,000 | | | Petroleos Mexicanos (Mexico), 4.875%, 1/24/22 | | | 1,530,000 | |
| | 400,000 | | | Spectra Energy Partners LP, 3.500%, 3/15/25 | | | 404,648 | |
| | 1,650,000 | | | Tennessee Valley Authority, 4.650%, 6/15/35 | | | 2,094,974 | |
| | 500,000 | | | Texas Eastern Transmission LP, 7.000%, 7/15/32 | | | 624,288 | |
| | | | | | | | 9,994,196 | |
| | | | | | | | | |
| | | | | Consumer Discretionary — 1.9% | | | | |
| | 500,000 | | | American Airlines 2016-3 Class AA Pass Through Trust, 3.000%, 10/15/28 | | | 501,740 | |
69
| | Touchstone Total Return Bond Fund (Continued) |
Principal
Amount | | | | Market
Value |
| | | | | | | | | |
| | | | | Corporate Bonds — 32.7% (Continued) | | | | |
| | | | | | | | | |
| | | | | Consumer Discretionary — (Continued) | | | | |
| $ | 694,180 | | | Continental Airlines 2012-2 Class A Pass Through Trust, 4.000%, 10/29/24 | | $ | 742,772 | |
| | 990,000 | | | PulteGroup, Inc., 7.875%, 6/15/32 | | | 1,143,450 | |
| | 1,300,000 | | | Royal Caribbean Cruises Ltd. (Liberia), 5.250%, 11/15/22 | | | 1,413,750 | |
| | 466,000 | | | Service Corp. International, 5.375%, 5/15/24 | | | 493,960 | |
| | | | | | | | 4,295,672 | |
| | | | | | | | | |
| | | | | Consumer Staples — 1.7% | | | | |
| | 1,914,804 | | | CVS Pass-Through Trust, 6.036%, 12/10/28 | | | 2,221,274 | |
| | 1,500,000 | | | Kroger Co. (The), 3.850%, 8/1/23 | | | 1,626,006 | |
| | | | | | | | 3,847,280 | |
| | | | | | | | | |
| | | | | Telecommunication Services — 0.8% | | | | |
| | 1,500,000 | | | Verizon Communications, Inc., 6.000%, 4/1/41 | | | 1,889,589 | |
| | | | | | | | | |
| | | | | Health Care — 0.6% | | | | |
| | 1,400,000 | | | HCA, Inc., 4.250%, 10/15/19 | | | 1,459,500 | |
| | | | | Total Corporate Bonds | | $ | 74,132,226 | |
| | | | | | | | | |
| | | | | U.S. Government Agency Obligations — 23.9% | |
| | 31,270 | | | Astro Offshore Corp., 6.000%, 12/20/19 | | | 32,791 | |
| | 1,156,000 | | | Canal Barge Co., Inc., 4.500%, 11/12/34 | | | 1,290,497 | |
| | 472,173 | | | EJM Airport LLC, 6.271%, 5/15/20 | | | 511,248 | |
| | 1,800,000 | | | Hashemite Kingdom of Jordan Government AID Bond, 3.000%, 6/30/25 | | | 1,947,055 | |
| | 534,000 | | | Matson Navigation Co., Inc., 5.337%, 9/4/28 | | | 609,295 | |
| | 1,421,250 | | | Petroleos Mexicanos (Mexico), 2.290%, 2/15/24 | | | 1,449,638 | |
| | 1,800,000 | | | Private Export Funding Corp., 2.450%, 7/15/24 | | | 1,873,667 | |
| | 6,448 | | | Small Business Administration Participation Certificates, 6.150%, 2/1/18 | | | 6,656 | |
| | 235,182 | | | Small Business Administration Participation Certificates, Ser 2001-20A, Class 1, 6.290%, 1/1/21 | | | 248,753 | |
| | 50,219 | | | Small Business Administration Participation Certificates, Ser 2001-20K, Class 1, 5.340%, 11/1/21 | | | 53,419 | |
| | 145,820 | | | Small Business Administration Participation Certificates, Ser 2002-20H, Class 1, 5.310%, 8/1/22 | | | 156,494 | |
| | 131,230 | | | Small Business Administration Participation Certificates, Ser 2003-20B, Class 1, 4.840%, 2/1/23 | | | 139,390 | |
| | 46,603 | | | Small Business Administration Participation Certificates, Ser 2003-20D, Class 1, 4.760%, 4/1/23 | | | 49,463 | |
Principal
Amount | | | | Market
Value |
| | | | | | | | | |
| | | | | U.S. Government Agency Obligations — 23.9% (Continued) | |
| | | | | | | | | |
| $ | 37,641 | | | Small Business Administration Participation Certificates, Ser 2004-20D, Class 1, 4.770%, 4/1/24 | | $ | 40,127 | |
| | 329,455 | | | Small Business Administration Participation Certificates, Ser 2004-20K, Class 1, 4.880%, 11/1/24 | | | 352,455 | |
| | 179,826 | | | Small Business Administration Participation Certificates, Ser 2005-20B, Class 1, 4.625%, 2/1/25 | | | 192,811 | |
| | 138,893 | | | Small Business Administration Participation Certificates, Ser 2005-20H, Class 1, 5.110%, 8/1/25 | | | 150,645 | |
| | 952,317 | | | Small Business Administration Participation Certificates, Ser 2006-20B, Class 1, 5.350%, 2/1/26 | | | 1,042,995 | |
| | 273,723 | | | Small Business Administration Participation Certificates, Ser 2006-20H, Class 1, 5.700%, 8/1/26 | | | 306,129 | |
| | 768,789 | | | Small Business Administration Participation Certificates, Ser 2006-20K, Class 1, 5.360%, 11/1/26 | | | 844,550 | |
| | 851,563 | | | Small Business Administration Participation Certificates, Ser 2006-20L, Class 1, 5.120%, 12/1/26 | | | 926,989 | |
| | 821,086 | | | Small Business Administration Participation Certificates, Ser 2007-20A, Class 1, 5.320%, 1/1/27 | | | 902,685 | |
| | 907,025 | | | Small Business Administration Participation Certificates, Ser 2007-20E, Class 1, 5.310%, 5/1/27 | | | 999,712 | |
| | 369,963 | | | Small Business Administration Participation Certificates, Ser 2007-20F, Class 1, 5.710%, 6/1/27 | | | 414,879 | |
| | 960,868 | | | Small Business Administration Participation Certificates, Ser 2007-20L, Class 1, 5.290%, 12/1/27 | | | 1,054,893 | |
| | 585,952 | | | Small Business Administration Participation Certificates, Ser 2008-20A, Class 1, 5.170%, 1/1/28 | | | 650,270 | |
| | 625,891 | | | Small Business Administration Participation Certificates, Ser 2008-20K, Class 1, 6.770%, 11/1/28 | | | 719,313 | |
| | 1,287,466 | | | Small Business Administration Participation Certificates, Ser 2009-20B, Class 1, 4.760%, 2/1/29 | | | 1,417,913 | |
| | 1,509,754 | | | Small Business Administration Participation Certificates, Ser 2009-20C, Class 1, 4.660%, 3/1/29 | | | 1,655,079 | |
| | 218,060 | | | Small Business Administration Participation Certificates, Ser 2009-20D, Class 1, 4.310%, 4/1/29 | | | 236,517 | |
| | 1,413,207 | | | Small Business Administration Participation Certificates, Ser 2009-20E, Class 1, 4.430%, 5/1/29 | | | 1,543,441 | |
70
| Touchstone Total Return Bond Fund (Continued) | |
Principal
Amount | | | | Market
Value |
| | | | | |
| | | | | U.S. Government Agency Obligations — 23.9% (Continued) | | | | |
| $ | 780,977 | | | Small Business Administration Participation Certificates, Ser 2009-20F, Class 1, 4.950%, 6/1/29 | | $ | 865,254 | |
| | 1,068,337 | | | Small Business Administration Participation Certificates, Ser 2009-20J, Class 1, 3.920%, 10/1/29 | | | 1,150,009 | |
| | 1,211,689 | | | Small Business Administration Participation Certificates, Ser 2010-20F, Class 1, 3.880%, 6/1/30 | | | 1,312,757 | |
| | 1,656,638 | | | Small Business Administration Participation Certificates, Ser 2010-20I, Class 1, 3.210%, 9/1/30 | | | 1,753,374 | |
| | 1,015,148 | | | Small Business Administration Participation Certificates, Ser 2012-10C, Class 1, 1.240%, 5/1/22 | | | 1,006,637 | |
| | 4,344,797 | | | Small Business Administration Participation Certificates, Ser 2013-20C, Class 1, 2.220%, 3/1/33 | | | 4,407,463 | |
| | 2,115,148 | | | Small Business Administration Participation Certificates, Ser 2013-20E, Class 1, 2.070%, 5/1/33 | | | 2,131,045 | |
| | 2,659,183 | | | Small Business Administration Participation Certificates, Ser 2013-20G, Class 1, 3.150%, 7/1/33 | | | 2,818,595 | |
| | 2,686,047 | | | Small Business Administration Participation Certificates, Ser 2014-20H, Class 1, 2.880%, 8/1/34 | | | 2,785,023 | |
| | 2,191,594 | | | Small Business Administration Participation Certificates, Ser 2014-20K, Class 1, 2.800%, 11/1/34 | | | 2,266,318 | |
| | 3,993,494 | | | Small Business Administration Participation Certificates, Ser 2015-20E, Class 1, 2.770%, 5/1/35 | | | 4,103,225 | |
| | 3,196,654 | | | Small Business Administration Participation Certificates, Ser 2015-20I, Class 1, 2.820%, 9/1/35 | | | 3,314,029 | |
| | 91,435 | | | Sterling Equipment, 6.125%, 9/28/19 | | | 99,178 | |
| | 1,456,437 | | | Tagua Leasing LLC, 1.581%, 11/16/24 | | | 1,443,804 | |
| | 1,000,000 | | | Totem Ocean Trailer Express, Inc., 6.365%, 4/15/28 | | | 1,193,641 | |
| | 1,435,000 | | | Vessel Management Services, Inc., 5.125%, 4/16/35 | | | 1,681,817 | |
| | | | | Total U.S. Government Agency Obligations | | $ | 54,151,938 | |
| | | | | | | | | |
| | | | | U.S. Government Mortgage-Backed Obligations — 17.4% | |
| | 243,891 | | | FHLMC, Pool #A89148, 4.000%, 10/1/39 | | | 262,692 | |
| | 1,775,314 | | | FHLMC, Pool #W30008, 7.645%, 5/1/25 | | | 2,157,411 | |
| | 213,465 | | | FNMA, Pool #465711, 4.680%, 8/1/28 | | | 248,716 | |
| | 1,556,998 | | | FNMA, Pool #469616, 3.500%, 11/1/21 | | | 1,684,163 | |
| | 111,196 | | | FNMA, Pool #874210, 5.260%, 1/1/25 | | | 125,588 | |
| | 189,384 | | | FNMA, Pool #888829, 5.832%, 6/1/37 | | | 225,727 | |
| | 280,704 | | | FNMA, Pool #958736, 4.940%, 5/1/19 | | | 302,823 | |
Principal
Amount | | | | Market
Value |
| | | |
| | | | | U.S. Government Mortgage-Backed Obligations — 17.4% (Continued) | |
| $ | 163,229 | | | FNMA, Pool #AB1152, 4.000%, 6/1/25 | | $ | 173,178 | |
| | 342,196 | | | FNMA, Pool #AD0101, 4.890%, 7/1/19 | | | 370,812 | |
| | 337,858 | | | FNMA, Pool #AD0166, 4.839%, 8/1/19 | | | 366,368 | |
| | 959,950 | | | FNMA, Pool #AD0342, 4.656%, 10/1/19 | | | 1,037,497 | |
| | 938,254 | | | FNMA, Pool #AD0786, 4.501%, 1/1/20 | | | 1,016,375 | |
| | 449,146 | | | FNMA, Pool #AD0910, 4.603%, 4/1/20 | | | 487,238 | |
| | 166,062 | | | FNMA, Pool #AD1608, 4.000%, 2/1/25 | | | 176,122 | |
| | 384,398 | | | FNMA, Pool #AE0209, 4.380%, 6/1/20 | | | 417,069 | |
| | 1,052,890 | | | FNMA, Pool #AE0446, 4.014%, 9/1/20 | | | 1,136,047 | |
| | 542,237 | | | FNMA, Pool #AE2771, 3.500%, 8/1/26 | | | 574,619 | |
| | 318,088 | | | FNMA, Pool #AE8886, 3.500%, 12/1/25 | | | 335,315 | |
| | 216,489 | | | FNMA, Pool #AH1519, 3.500%, 12/1/25 | | | 228,200 | |
| | 2,432,720 | | | FNMA, Pool #AH8854, 4.500%, 4/1/41 | | | 2,675,663 | |
| | 391,864 | | | FNMA, Pool #AI1856, 4.500%, 5/1/41 | | | 433,935 | |
| | 1,798,622 | | | FNMA, Pool #AM0157, 2.680%, 2/1/22 | | | 1,879,241 | |
| | 1,880,019 | | | FNMA, Pool #AM0566, 1.940%, 9/1/19 | | | 1,893,055 | |
| | 2,273,237 | | | FNMA, Pool #AP7488, 3.500%, 9/1/42 | | | 2,407,110 | |
| | 1,194,469 | | | FNMA, Pool #AT0924, 2.000%, 3/1/28 | | | 1,201,229 | |
| | 3,401,492 | | | FNMA, Pool #AU1628, 3.000%, 7/1/43 | | | 3,543,297 | |
| | 2,598,574 | | | FNMA, Pool #AX7699, 3.500%, 2/1/45 | | | 2,741,258 | |
| | 2,833,669 | | | FNMA, Pool #BC0153, 4.000%, 1/1/46 | | | 3,046,333 | |
| | 3,002,055 | | | FNMA, Pool #BC0300, 3.500%, 3/1/46 | | | 3,166,893 | |
| | 1,064,604 | | | GNMA, Pool #5276, 3.000%, 1/20/27 | | | 1,120,524 | |
| | 1,497,831 | | | GNMA, Pool #710077, 4.700%, 5/20/61 | | | 1,558,931 | |
| | 333,356 | | | GNMA, Pool #751408, 4.826%, 6/20/61 | | | 364,677 | |
| | 613,098 | | | GNMA, Pool #751409, 4.626%, 7/20/61 | | | 640,829 | |
| | 347,479 | | | GNMA, Pool #752631, 4.500%, 10/20/40 | | | 379,689 | |
| | 609,661 | | | GNMA, Pool #756686, 4.697%, 9/20/61 | | | 640,189 | |
| | 414,553 | | | GNMA, Pool #757327, 4.295%, 7/20/61 | | | 430,981 | |
| | | | | Total U.S. Government Mortgage-Backed Obligations | | $ | 39,449,794 | |
| | | | | | | | | |
| | | | | Municipal Bonds — 7.1% | | | | |
| | | | | | | | | |
| | | | | California — 2.3% | | | | |
| | 1,225,000 | | | CA State City of San Francisco Public Utilities Commission Water Revenue, Build America Bonds, 6.950%, 11/1/50 | | | 1,892,576 | |
| | 1,510,000 | | | CA State East Bay Municipal Utility District Water System Revenue, Build America Bonds Sub, 5.874%, 6/1/40 | | | 2,061,527 | |
| | 1,310,315 | | | CA State HFA Residential Mortgage Rev, Ser A, 2.900%, 2/1/42 | | | 1,320,404 | |
| | | | | | | | 5,274,507 | |
| | | | | | | | | |
| | | | | Florida — 0.5% | | | | |
| | 1,105,830 | | | FL State HFC Rev, Homeownership Mortgage Special Project, 2.800%, 7/1/41 | | | 1,119,376 | |
71
| | Touchstone Total Return Bond Fund (Continued) |
Principal
Amount | | | | Market
Value |
| | | | | | | | | |
| | | | | Municipal Bonds — 7.1% (Continued) | | | | |
| | | | | | | | | |
| | | | | Missouri — 0.4% | | | | |
| $ | 980,000 | | | MO State Housing Development Commission, Special Homeownership Loan Program, Ser C, 2.650%, 11/1/40 | | $ | 981,137 | |
| | | | | | | | | |
| | | | | Ohio — 1.0% | | | | |
| | 2,245,000 | | | Ohio Housing Finance Agency, Ser 1, 2.650%, 11/1/41 | | | 2,250,388 | |
| | | | | | | | | |
| | | | | Texas — 1.6% | | | | |
| | 1,770,000 | | | TX State Dallas Area Rapid Transit, Build America Bonds, 5.999%, 12/1/44 | | | 2,586,855 | |
| | 915,000 | | | TX State Texas Dept of Housing & Community Affairs, Ser A, 2.800%, 3/1/36 | | | 925,138 | |
| | | | | | | | 3,511,993 | |
| | | | | | | | | |
| | | | | Virginia — 0.4% | | | | |
| | 989,707 | | | VA State Housing Development Authority, Pass Thru Ser B, 2.750%, 4/25/42 | | | 1,006,423 | |
| | | | | | | | | |
| | | | | Washington — 0.9% | | | | |
| | 1,515,000 | | | WA State of Washington, Build America Bonds Ser D, UTGO, 5.481%, 8/1/39 | | | 2,047,704 | |
| | | | | Total Municipal Bonds | | $ | 16,191,528 | |
| | | | | | | | | |
| | | | | Agency Collateralized Mortgage Obligations — 6.9% | |
| | 1,020,000 | | | FREMF Mortgage Trust, Ser 2011-K702, Class B, 144a, 4.931%, 4/25/44(A) | | | 1,059,444 | |
| | 1,000,000 | | | FREMF Mortgage Trust, Ser 2012-K19, Class B, 144a, 4.173%, 5/25/45(A) | | | 1,077,725 | |
| | 925,000 | | | FREMF Mortgage Trust, Ser 2012-K706, Class B, 144a, 4.167%, 11/25/44(A) | | | 961,589 | |
| | 1,035,000 | | | FREMF Mortgage Trust, Ser 2012-K710, Class B, 144a, 3.952%, 6/25/47(A) | | | 1,071,433 | |
| | 1,798,918 | | | FRESB Mortgage Trust, Ser 2016-SB17, Class A5H, 2.160%, 6/25/21(A) | | | 1,815,288 | |
| | 1,029,702 | | | GNMA, Ser 2011-147, Class A, 2.174%, 7/16/38 | | | 1,032,384 | |
| | 2,748,616 | | | GNMA, Ser 2012-53, Class AC, 2.381%, 12/16/43 | | | 2,776,823 | |
| | 1,446,920 | | | GNMA, Ser 2013-40, Class AC, 1.584%, 1/16/46 | | | 1,425,143 | |
| | 2,540,000 | | | GNMA, Ser 2015-32, Class HG, 3.000%, 9/16/49(A) | | | 2,541,759 | |
| | 2,009,000 | | | GNMA, Ser 2015-73, Class B, 2.700%, 10/16/55(A) | | | 2,029,278 | |
| | | | | Total Agency Collateralized Mortgage Obligations | | $ | 15,790,866 | |
Principal
Amount | | | | Market
Value |
| | | | | | | | | |
| | | | | Commercial Mortgage-Backed Securities — 3.8% | |
| $ | 2,435,000 | | | Citigroup Commercial Mortgage Trust, Ser 2007-C6, Class A4, 5.901%, 12/10/49(A) | | $ | 2,479,161 | |
| | 2,057,451 | | | Citigroup Commercial Mortgage Trust, Ser 2008-C7, Class A4, 6.333%, 12/10/49(A) | | | 2,121,682 | |
| | 505,000 | | | Citigroup/Deutsche Bank Commercial Mortgage Trust, Ser 2006-CD3, Class AJ, 5.688%, 10/15/48 | | | 290,806 | |
| | 1,620,617 | | | Citigroup/Deutsche Bank Commercial Mortgage Trust, Ser 2007-CD4, Class A4, 5.322%, 12/11/49 | | | 1,627,536 | |
| | 2,122,764 | | | GS Mortgage Securities Corp. II, Ser 2007-GG10, Class A4, 5.988%, 8/10/45(A) | | | 2,154,791 | |
| | | | | Total Commercial Mortgage-Backed Securities | | $ | 8,673,976 | |
| | | | | | | | | |
| | | | | U.S. Treasury Obligations — 3.2% | | | | |
| | 3,146,000 | | | U.S. Treasury Strip, Principal, 0.000%, 8/15/35# | | | 2,065,145 | |
| | 3,695,000 | | | U.S. Treasury Strip, Principal, 0.000%, 5/15/40# | | | 2,134,701 | |
| | 5,650,000 | | | U.S. Treasury Strip, Principal, 0.000%, 5/15/43# | | | 2,982,279 | |
| | | | | Total U.S. Treasury Obligations | | $ | 7,182,125 | |
| | | | | | | | | |
| | | | | Asset-Backed Securities — 2.1% | | | | |
| | 1,571,126 | | | 321 Henderson Receivables I LLC, Ser 2012-1A, Class A, 144a, 4.210%, 2/16/65 | | | 1,695,433 | |
| | 1,079,112 | | | 321 Henderson Receivables I LLC, Ser 2012-2A, Class A, 144a, 3.840%, 10/15/59 | | | 1,126,511 | |
| | 419,859 | | | FPL Recovery Funding LLC, Ser 2007-A, Class A4, 5.256%, 8/1/21 | | | 445,216 | |
| | 1,325,000 | | | JCP&L Transition Funding LLC, Ser 2006-A, Class A4, 5.610%, 6/5/23 | | | 1,493,258 | |
| | | | | Total Asset-Backed Securities | | $ | 4,760,418 | |
72
| Touchstone Total Return Bond Fund (Continued) | |
| Shares | | | | Market
Value |
| | | | | | | | | |
| | | | | Investment Fund — 6.5% | | | | |
| | 14,727,741 | | | Dreyfus Government Cash Management, Institutional Shares, 0.30%∞Ω | | $ | 14,727,741 | |
| | | | | | | | | |
| | | | | Total Investment Securities — 103.6%
(Cost $230,101,176) | | $ | 235,060,612 | |
| | | | | | | | | |
| | | | | Liabilities in Excess of Other Assets — (3.6%) | | | (8,116,739 | ) |
| | | | | | | | | |
| | | | | Net Assets — 100.0% | | $ | 226,943,873 | |
| # | Strip Security - Separate trading of Registered Interest and Principal. Holders of a principal strip security are entitled to the portion of the payment representing principal only. |
| | |
| (A) | Variable rate security - Rate reflected is the rate in effect as of September 30, 2016. |
| | |
| (B) | Perpetual Bond - A Bond with no definite maturity date. |
| | |
| ∞ | Open-End Fund. |
| | |
| Ω | Represents the 7-day SEC yield as of September 30, 2016. |
Portfolio Abbreviations:
FHLMC - Federal Home Loan Mortgage Corporation
FNMA - Federal National Mortgage Association
FREMF - Finnish Real Estate Management Federation
FRESB - Freddie Mac Multifamily Securitization Small Balance Loan
GNMA - Government National Mortgage Association
HFA - Housing Finance Authority/Agency
HFC - Housing Finance Corporation
LLC - Limited Liability Company
LP - Limited Partnership
MTN - Medium Term Note
UTGO - Unlimited Tax General Obligation
144a - This is a restricted security that was sold in a transaction qualifying for the exemption under Rule 144A of the Securities Act of 1933. This security may be sold in transactions exempt from registration, normally to qualified institutional buyers. At September 30, 2016, these securities were valued at $11,337,589 or 5.0% of net assets. These securities were deemed liquid pursuant to procedures approved by the Board of Trustees.
Other Information:
The inputs or methodology used for valuing securities may not be an indication of the risk associated with investing in those securities. For more information on valuation inputs, and their aggregation into the levels used in the table below, please refer to the security valuation section in the accompanying Notes to Financial Statements.
| Valuation inputs at Reporting Date: | |
| Description | | Level 1 | | Level 2 | | Level 3 | | | Total | |
| | | | | | | | | | | | | | | | | |
| Corporate Bonds | | $ | — | | | $ | 74,132,226 | | | $ | — | | | $ | 74,132,226 | |
| U.S. Government Agency Obligations | | | — | | | | 54,151,938 | | | | — | | | | 54,151,938 | |
| U.S. Government Mortgage-Backed Obligations | | | — | | | | 39,449,794 | | | | — | | | | 39,449,794 | |
| Municipal Bonds | | | — | | | | 16,191,528 | | | | — | | | | 16,191,528 | |
| Agency Collateralized Mortgage Obligations | | | — | | | | 15,790,866 | | | | — | | | | 15,790,866 | |
| Commercial Mortgage-Backed Securities | | | — | | | | 8,673,976 | | | | — | | | | 8,673,976 | |
| U.S. Treasury Obligations | | | — | | | | 7,182,125 | | | | — | | | | 7,182,125 | |
| Asset-Backed Securities | | | — | | | | 4,760,418 | | | | — | | | | 4,760,418 | |
| Investment Fund | | | 14,727,741 | | | | — | | | | — | | | | 14,727,741 | |
| Total | | $ | 14,727,741 | | | $ | 220,332,871 | | | $ | — | | | $ | 235,060,612 | |
See accompanying Notes to Financial Statements.
73
| | Portfolio of Investments
Touchstone Ultra Short Duration Fixed Income Fund – September 30, 2016 |
Principal
Amount | | | | | Market
Value | |
| | | | | | | | | |
| | | | | Corporate Bonds — 37.7% | | | | |
| | | | | | | | | |
| | | | | Financials — 19.3% | | | | |
| $ | 5,389,000 | | | Air Lease Corp., 5.625%, 4/1/17 | | $ | 5,480,893 | |
| | 2,500,000 | | | American Express Credit Corp. MTN, 2.375%, 3/24/17 | | | 2,515,025 | |
| | 4,080,000 | | | AvalonBay Communities, Inc. MTN, 5.700%, 3/15/17 | | | 4,156,141 | |
| | 3,000,000 | | | Bank of America Corp., 3.875%, 3/22/17 | | | 3,034,656 | |
| | 2,000,000 | | | Bank of America Corp., 5.420%, 3/15/17 | | | 2,034,510 | |
| | 2,704,000 | | | Bank of America NA, 6.100%, 6/15/17 | | | 2,791,258 | |
| | 926,000 | | | Bear Stearns Cos. LLC (The), 5.550%, 1/22/17 | | | 938,132 | |
| | 800,000 | | | Brandywine Operating Partnership LP, 5.700%, 5/1/17 | | | 817,494 | |
| | 400,000 | | | Camden Property Trust, 5.700%, 5/15/17 | | | 410,173 | |
| | 5,000,000 | | | Canadian Imperial Bank of Commerce/New York NY, 1.186%, 5/10/17(A) | | | 5,000,260 | |
| | 3,460,000 | | | Capital One Bank USA NA, 1.150%, 11/21/16 | | | 3,461,010 | |
| | 1,500,000 | | | Capital One Bank USA NA, 1.200%, 2/13/17 | | | 1,498,953 | |
| | 2,700,000 | | | Capital One Bank USA NA, 1.300%, 6/5/17 | | | 2,699,617 | |
| | 1,600,000 | | | Citigroup, Inc., 1.300%, 11/15/16 | | | 1,600,309 | |
| | 1,800,000 | | | Citigroup, Inc., 1.800%, 2/5/18 | | | 1,804,538 | |
| | 4,800,000 | | | Credit Suisse/New York (Switzerland) MTN, 1.315%, 5/26/17(A) | | | 4,801,229 | |
| | 1,250,000 | | | DDR Corp., 7.500%, 4/1/17 | | | 1,286,652 | |
| | 1,600,000 | | | Equity Commonwealth, 6.250%, 6/15/17 | | | 1,613,555 | |
| | 2,712,000 | | | Fifth Third Bancorp, 5.450%, 1/15/17 | | | 2,742,510 | |
| | 500,000 | | | Fifth Third Bank/Cincinnati OH, 1.150%, 11/18/16 | | | 500,006 | |
| | 6,400,000 | | | Goldman Sachs Group, Inc. (The) MTN, 1.254%, 3/29/17(A) | | | 6,386,451 | |
| | 860,000 | | | HCP, Inc., 5.625%, 5/1/17 | | | 880,188 | |
| | 1,340,000 | | | Highwoods Realty LP, 5.850%, 3/15/17 | | | 1,364,081 | |
| | 1,790,000 | | | Highwoods Realty LP, 7.500%, 4/15/18 | | | 1,935,407 | |
| | 3,200,000 | | | HSBC Bank USA NA/New York NY, 6.000%, 8/9/17 | | | 3,321,235 | |
| | 6,425,000 | | | Huntington National Bank (The), 1.300%, 11/20/16 | | | 6,427,133 | |
| | 1,300,000 | | | JPMorgan Chase & Co., 6.125%, 6/27/17 | | | 1,343,784 | |
| | 1,000,000 | | | Lloyds Bank PLC, 1.750%, 5/14/18 | | | 1,002,955 | |
| | 1,100,000 | | | Lloyds Bank PLC, 2.000%, 8/17/18 | | | 1,104,812 | |
| | 2,800,000 | | | Mizuho Bank Ltd., 144a, 1.550%, 10/17/17 | | | 2,799,381 | |
| | 1,450,000 | | | Morgan Stanley MTN, 6.250%, 8/28/17 | | | 1,510,261 | |
| | 9,935,000 | | | Mountain Agency, Inc. (The), 1.040%, 12/1/23(A) | | | 9,935,000 | |
| | 5,400,000 | | | PNC Bank NA, 1.150%, 11/1/16 | | | 5,400,000 | |
| | 2,365,000 | | | PNC Financial Services Group, Inc. (The), 5.625%, 2/1/17 | | | 2,399,030 | |
Principal
Amount | | | | | Market
Value | |
| | | | | | | | | |
| | | | | Financials — (Continued) | | | | |
| $ | 500,000 | | | Post Apartment Homes LP, 4.750%, 10/15/17 | | $ | 515,870 | |
| | 1,990,000 | | | Progress Industrial Properties, Inc., 2.100%, 1/1/22(A) | | | 1,990,000 | |
| | 865,000 | | | Prologis LP, 4.000%, 1/15/18 | | | 886,971 | |
| | 2,800,000 | | | Royal Bank of Canada/New York NY, 1.193%, 7/28/17(A) | | | 2,800,862 | |
| | 2,210,000 | | | Simon Property Group LP, 144a, 1.500%, 2/1/18 | | | 2,216,841 | |
| | 9,150,000 | | | Toronto-Dominion Bank/NY, 1.107%, 2/10/17(A) | | | 9,156,249 | |
| | 3,765,000 | | | Ventas Realty LP, 1.250%, 4/17/17 | | | 3,763,392 | |
| | 800,000 | | | Western Union Co. (The), 5.930%, 10/1/16 | | | 800,000 | |
| | 2,600,000 | | | XLIT Ltd., 2.300%, 12/15/18 | | | 2,630,901 | |
| | | | | | | | 119,757,725 | |
| | | | | | | | | |
| | | | | Consumer Discretionary — 3.3% | | | | |
| | 6,250,000 | | | Blue Hen Hotel LLC, 1.400%, 9/1/27(A) | | | 6,250,000 | |
| | 470,000 | | | ERAC USA Finance LLC, 144a, 6.200%, 11/1/16 | | | 471,773 | |
| | 1,000,000 | | | Ford Motor Credit Co. LLC, 4.250%, 2/3/17 | | | 1,009,593 | |
| | 3,300,000 | | | Hasbro, Inc., 6.300%, 9/15/17 | | | 3,450,718 | |
| | 325,000 | | | Hyundai Capital America, 144a, 4.000%, 6/8/17 | | | 330,599 | |
| | 1,800,000 | | | Marriott International, Inc. MD, 6.375%, 6/15/17 | | | 1,860,037 | |
| | 3,100,000 | | | Volkswagen International Finance N.V., 144a, 2.375%, 3/22/17 | | | 3,112,363 | |
| | 3,700,000 | | | Volkswagen International Finance NV, 144a, 1.125%, 11/18/16 | | | 3,699,911 | |
| | | | | | | | 20,184,994 | |
| | | | | | | | | |
| | | | | Industrials — 2.8% | | | | |
| | 2,325,000 | | | Crane Co., 2.750%, 12/15/18 | | | 2,370,235 | |
| | 1,000,000 | | | L-3 Communications Corp., 1.500%, 5/28/17 | | | 1,000,754 | |
| | 298,000 | | | L-3 Communications Corp., 3.950%, 11/15/16 | | | 298,972 | |
| | 1,550,000 | | | Norfolk Southern Corp., 7.700%, 5/15/17 | | | 1,612,245 | |
| | 958,000 | | | SBA Tower Trust, 144a, 2.898%, 10/15/19 | | | 971,463 | |
| | 3,555,000 | | | SBA Tower Trust, 144a, 2.933%, 12/15/17 | | | 3,574,742 | |
| | 7,200,000 | | | Temple-Inland, Inc., 6.625%, 1/15/18 | | | 7,642,375 | |
| | | | | | | | 17,470,786 | |
| | | | | | | | | |
| | | | | Utilities — 2.5% | | | | |
| | 350,000 | | | CenterPoint Energy, Inc., 5.950%, 2/1/17 | | | 355,200 | |
| | 939,000 | | | Exelon Corp., 1.550%, 6/9/17 | | | 939,707 | |
| | 5,900,000 | | | Kentucky Power Co., 144a, 6.000%, 9/15/17 | | | 6,146,402 | |
| | 715,000 | | | New York State Electric & Gas Corp., 144a, 6.150%, 12/15/17 | | | 742,948 | |
74
| Touchstone Ultra Short Duration Fixed Income Fund (Continued) | |
Principal
Amount | | | | | Market
Value | |
| | | | | | | | | |
| | | | | Corporate Bonds — 37.7% (Continued) | | | | |
| | | | | | | | | |
| | | | | Utilities — (Continued) | | | | |
| $ | 1,400,000 | | | NiSource Finance Corp., 5.250%, 9/15/17 | | $ | 1,447,453 | |
| | 1,178,000 | | | Oklahoma Gas & Electric Co., 6.500%, 7/15/17 | | | 1,219,596 | |
| | 700,000 | | | Oncor Electric Delivery Co. LLC, 5.000%, 9/30/17 | | | 725,602 | |
| | 550,000 | | | PECO Energy Co., 1.200%, 10/15/16 | | | 550,020 | |
| | 800,000 | | | PPL UK Distribution Holdings Ltd. / Western Power Distribution Ltd., 144a, 7.250%, 12/15/17 | | | 827,653 | |
| | 900,000 | | | South Carolina Electric & Gas Co., 5.250%, 11/1/18 | | | 969,752 | |
| | 451,000 | | | Southern Electric Generating Co., 144a, 2.200%, 12/1/18 | | | 460,369 | |
| | 1,255,000 | | | West Penn Power Co., 144a, 5.950%, 12/15/17 | | | 1,313,056 | |
| | | | | | | | 15,697,758 | |
| | | | | | | | | |
| | | | | Energy — 2.4% | | | | |
| | 1,800,000 | | | BP Capital Markets PLC, 1.846%, 5/5/17 | | | 1,807,821 | |
| | 3,992,000 | | | Cameron International Corp., 1.150%, 12/15/16 | | | 3,993,250 | |
| | 775,000 | | | Cameron International Corp., 1.400%, 6/15/17 | | | 774,998 | |
| | 800,000 | | | Questar Pipeline Co., 5.830%, 2/1/18 | | | 842,818 | |
| | 1,500,000 | | | Ras Laffan Liquefied Natural Gas Co., 6.750%, 9/30/19 | | | 1,708,350 | |
| | 384,480 | | | Ras Laffan Liquefied Natural Gas Co. Ltd. II (Qatar), 144a, 5.298%, 9/30/20 | | | 410,459 | |
| | 400,000 | | | Shell International Finance BV, 5.200%, 3/22/17 | | | 408,148 | |
| | 4,800,000 | | | Valero Energy Corp., 6.125%, 6/15/17 | | | 4,969,973 | |
| | | | | | | | 14,915,817 | |
| | | | | | | | | |
| | | | | Health Care — 1.8% | | | | |
| | 4,800,000 | | | Amgen, Inc., 1.191%,
5/22/17(A) | | | 4,803,341 | |
| | 2,800,000 | | | Bayer US Finance LLC, 144a, 0.907%,
10/7/16(A) | | | 2,800,050 | |
| | 1,955,000 | | | Catholic Health Initiatives, 1.600%, 11/1/17 | | | 1,958,808 | |
| | 1,850,000 | | | Mylan, Inc., 1.350%, 11/29/16 | | | 1,850,936 | |
| | | | | | | | 11,413,135 | |
| | | | | | | | | |
| | | | | Consumer Staples — 1.8% | | | | |
| | 4,370,000 | | | Bunge Ltd. Finance Corp., 3.200%, 6/15/17 | | | 4,426,452 | |
| | 700,000 | | | Kroger Co. (The), 2.200%, 1/15/17 | | | 702,100 | |
| | 500,000 | | | Reynolds American, Inc., 2.300%, 8/21/17 | | | 504,267 | |
| | 1,000,000 | | | RJ Reynolds Tobacco Co./NC, 2.300%, 8/21/17 | | | 1,008,534 | |
| | 4,292,000 | | | SABMiller Holdings, Inc., 144a, 2.450%, 1/15/17 | | | 4,304,867 | |
| | | | | | | | 10,946,220 | |
Principal
Amount | | | | | Market
Value | |
| | | | | | | | | |
| | | | | Telecommunication Services — 1.7% | | | | |
| $ | 4,000,000 | | | BellSouth Corp.,
144a, 4.400%, 4/26/17 | | $ | 4,073,200 | |
| | 2,710,000 | | | Cox Communications, Inc., 144a, 5.875%, 12/1/16 | | | 2,728,954 | |
| | 3,900,000 | | | Scripps Networks Interactive, Inc., 2.700%, 12/15/16 | | | 3,909,200 | |
| | | | | | | | 10,711,354 | |
| | | | | | | | | |
| | | | | Information Technology — 1.7% | | | | |
| | 3,200,000 | | | Diamond 1 Finance Corp. / Diamond 2 Finance Corp., 144a, 3.480%, 6/1/19 | | | 3,291,104 | |
| | 2,040,000 | | | Fidelity National Information Services, Inc., 1.450%, 6/5/17 | | | 2,040,677 | |
| | 4,850,000 | | | Hewlett Packard Enterprise Co., 144a, 2.450%, 10/5/17 | | | 4,888,848 | |
| | | | | | | | 10,220,629 | |
| | | | | | | | | |
| | | | | Real Estate — 0.3% | | | | |
| | 1,620,000 | | | Weingarten Realty Investors REIT MTN, 5.542%, 12/15/16 | | | 1,631,717 | |
| | | | | | | | | |
| | | | | Materials — 0.1% | | | | |
| | 300,000 | | | Domtar Corp., 10.750%, 6/1/17 | | | 317,255 | |
| | | | | Total Corporate Bonds | | $ | 233,267,390 | |
| | | | | | | | | |
| | | | | Asset-Backed Securities — 35.2% | | | | |
| | 2,243,008 | | | American Credit Acceptance Receivables Trust, Ser 2015-3, Class A, 144a, 1.950%, 9/12/19 | | | 2,249,394 | |
| | 2,376,210 | | | American Homes 4 Rent, Ser 2014-SFR1, Class A, 144a, 1.531%, 6/17/31(A) | | | 2,368,758 | |
| | 3,709,632 | | | AmeriCredit Automobile Receivables, Ser 2013-2, Class C, 1.790%, 3/8/19 | | | 3,716,264 | |
| | 3,780,000 | | | AmeriCredit Automobile Receivables Trust, Ser 2013-4, Class C, 2.720%, 9/9/19 | | | 3,813,964 | |
| | 4,635,000 | | | AmeriCredit Automobile Receivables Trust, Ser 2014-1, Class D, 2.540%, 6/8/20 | | | 4,695,299 | |
| | 5,700,000 | | | Ascentium Equipment Receivables Trust, Ser 2016-1A, Class A2, 144a, 1.750%, 11/13/18 | | | 5,733,319 | |
| | 883,112 | | | Bayview Financial Acquisition Trust, Ser 2004-C, Class M1, 1.174%, 5/28/44(A) | | | 883,090 | |
| | 298,854 | | | Bayview Financial Acquisition Trust, Ser 2004-D, Class M1, 1.154%, 8/28/44(A) | | | 298,863 | |
| | 516,911 | | | Bear Stearns Asset Backed Securities I Trust, Ser 2004-BO1, Class M2, 1.275%,
10/25/34(A) | | | 516,659 | |
| | 3,875,844 | | | BlueVirgo Trust, Ser 2015-1A, Class NOTE, 144a, 3.000%, 12/15/22 | | | 3,916,889 | |
| | 100,310 | | | California Republic Auto Receivables Trust, Ser 2014-3, Class A3, 1.090%, 11/15/18 | | | 100,330 | |
75
| | Touchstone Ultra Short Duration Fixed Income Fund (Continued) |
Principal
Amount | | | | | Market
Value | |
| | | | | | | | | |
| | | | | Asset-Backed Securities — 35.2% (Continued) | | | | |
| $ | 5,000,000 | | | Capital Auto Receivables Asset Trust, Ser 2013-4, Class A4, 1.470%, 7/20/18 | | $ | 5,006,893 | |
| | 2,254,887 | | | Carfinance Capital Auto Trust, Ser 2013-1A, Class B, 144a, 2.750%, 11/15/18 | | | 2,264,290 | |
| | 1,120,138 | | | CarFinance Capital Auto Trust, Ser 2015-1A, Class A, 144a, 1.750%, 6/15/21 | | | 1,122,314 | |
| | 1,305,308 | | | Carnow Auto Receivables Trust, Ser 2015-1A, Class A, 144a, 1.690%, 1/15/20 | | | 1,306,460 | |
| | 661,094 | | | Carrington Mortgage Loan Trust, Ser 2005-OPT2, Class M2, 1.200%, 5/25/35(A) | | | 660,005 | |
| | 2,447,918 | | | Cazenovia Creek Funding I LLC, Ser 2015-1A, Class A, 144a, 2.000%, 12/10/23 | | | 2,430,704 | |
| | 762,143 | | | CCG Receivables Trust, Ser 2014-1, Class A2, 144a, 1.060%, 11/15/21 | | | 761,402 | |
| | 163,092 | | | CFC LLC, Ser 2014-1A, Class A, 144a, 1.460%, 12/17/18 | | | 163,093 | |
| | 286,976 | | | Cifc Funding 2007-II Ltd., Ser 2007-2A, Class A1J, 144a, 1.020%, 4/15/21(A) | | | 286,833 | |
| | 2,468,049 | | | CNH Equipment Trust, Ser 2014-C, Class A3, 1.050%, 11/15/19 | | | 2,466,742 | |
| | 31,147 | | | College & University Facility Loan Trust, Ser 2 Class D, 4.000%, 6/1/18 | | | 31,147 | |
| | 1,099,589 | | | Countrywide Asset-Backed Certificates, Ser 2004-12, Class MV3, 1.515%, 3/25/35(A) | | | 1,095,579 | |
| | 756,967 | | | Credit-Based Asset Servicing and Securitization LLC, Ser 2006-SC1, Class A, 144a, 0.795%, 5/25/36(A) | | | 750,361 | |
| | 496,937 | | | Dell Equipment Finance Trust, Ser 2014-1, Class C, 144a, 1.800%, 6/22/20 | | | 497,168 | |
| | 1,567,644 | | | Dell Equipment Finance Trust, Ser 2015-1, Class A2, 144a, 1.010%, 7/24/17 | | | 1,567,449 | |
| | 2,725,000 | | | Dell Equipment Finance Trust, Ser 2015-1, Class D, 144a, 2.840%, 9/22/20 | | | 2,721,311 | |
| | 2,211,611 | | | Dell Equipment Finance Trust, Ser 2016-1, Class A1, 144a, 0.850%, 7/24/17 | | | 2,211,621 | |
| | 3,000,000 | | | Dell Equipment Finance Trust, Ser 2016-1, Class A2, 144a, 1.430%, 9/24/18 | | | 3,006,004 | |
| | 616,749 | | | DT Auto Owner Trust, Ser 2015-2A, Class A, 144a, 1.240%, 9/17/18 | | | 616,680 | |
| | 1,166,441 | | | Elara HGV Timeshare Issuer LLC, Ser 2014-A, Class A, 144a, 2.530%, 2/25/27 | | | 1,174,872 | |
Principal
Amount | | | | | Market
Value | |
| | | | | | | | | |
| | | | | Asset-Backed Securities — 35.2% (Continued) | | | | |
| $ | 1,415,409 | | | Exeter Automobile Receivables Trust, Ser 2015-1A, Class A, 144a, 1.600%, 6/17/19 | | $ | 1,415,521 | |
| | 168,895 | | | First Investors Auto Owner Trust, Ser 2013-1A, Class B, 144a, 1.810%, 10/15/18 | | | 168,927 | |
| | 4,450,000 | | | First Investors Auto Owner Trust, Ser 2014-1A, Class B, 144a, 2.260%, 1/15/20 | | | 4,469,251 | |
| | 2,600,000 | | | First Investors Auto Owner Trust, Ser 2016-2A, Class A1, 144a, 1.530%, 11/16/20 | | | 2,601,092 | |
| | 1,010,672 | | | Flagship Credit Auto Trust, Ser 2013-1, Class B, 144a, 2.760%, 9/17/18 | | | 1,011,524 | |
| | 1,291,203 | | | Flagship Credit Auto Trust, Ser 2013-2, Class A, 144a, 1.940%, 1/15/19 | | | 1,292,581 | |
| | 4,075,222 | | | Flagship Credit Auto Trust, Ser 2016-3, Class A1, 144a, 1.610%, 12/15/19 | | | 4,080,041 | |
| | 672,698 | | | FNA 2014-1 Trust, Ser 2014-1A, Class A, 144a, 1.296%, 12/10/22 | | | 665,971 | |
| | 2,606,492 | | | FNA 2015-1 Trust, Ser 2015-1, Class A, 144a, 3.240%, 12/10/23 | | | 2,599,535 | |
| | 1,186,349 | | | GE Equipment Small Ticket LLC Series, Ser 2014-1A, Class A3, 144a, 0.950%, 9/25/17 | | | 1,185,551 | |
| | 4,537,842 | | | GLS Auto Receivables Trust, Ser 2016-1A, Class A, 144a, 2.730%, 10/15/20 | | | 4,568,327 | |
| | 1,265,761 | | | GreatAmerica Leasing Receivables Funding LLC Series, Ser 2015-1, Class A2, 144a, 1.120%, 6/20/17 | | | 1,265,861 | |
| | 456,965 | | | GreatAmerica Leasing Receivables Funding LLC Series, Ser 2016-1, Class A1, 144a, 0.780%, 2/21/17 | | | 456,777 | |
| | 6,455,000 | | | GreatAmerica Leasing Receivables Funding LLC Series, Ser 2016-1, Class A2, 144a, 1.570%, 5/21/18 | | | 6,464,896 | |
| | 3,230,738 | | | Jasper CLO Ltd., Ser 2005-1A, Class C, 144a, 1.659%, 8/1/17(A) | | | 3,229,391 | |
| | 2,800,000 | | | Leaf Receivables Funding 11 LLC, Ser 2016-1, Class A2, 144a, 1.720%, 7/15/18 | | | 2,803,223 | |
| | 2,759,559 | | | LEAF Receivables Funding 9 LLC, Ser 2013-1, Class A4, 144a, 1.980%, 9/15/21 | | | 2,763,008 | |
| | 2,355,000 | | | MAPS CLO Fund II Ltd., Ser 2007-2A, Class B, 144a, 1.596%, 7/20/22(A) | | | 2,274,826 | |
| | 576,001 | | | MMAF Equipment Finance LLC, Ser 2012-AA, Class A4, 144a, 1.350%, 10/10/18 | | | 576,618 | |
| | 2,758,081 | | | Morgan Stanley ABS Capital I, Inc. Trust, Ser 2006-NC1, Class A4, 0.825%, 12/25/35(A) | | | 2,712,936 | |
76
| Touchstone Ultra Short Duration Fixed Income Fund (Continued) | |
Principal
Amount | | | | | Market
Value | |
| | | | | | | | | |
| | | | | Asset-Backed Securities — 35.2% (Continued) | | | | |
| $ | 6,655,000 | | | Navitas Equipment Receivables LLC, Ser 2016-1, Class A1, 144a, 1.100%, 9/15/17 | | $ | 6,655,063 | |
| | 6,600,000 | | | Navitas Equipment Receivables LLC, Ser 2016-1, Class A2, 144a, 2.200%, 6/15/21 | | | 6,602,919 | |
| | 50,000 | | | New Mexico Educational Assistance Foundation, Ser 2010, Class A2, 1.492%, 12/1/28(A) | | | 50,003 | |
| | 5,142,783 | | | OneMain Direct Auto Receivables Trust, Ser 2016-1A, Class A, 144a, 2.040%, 1/15/21 | | | 5,163,523 | |
| | 2,710,229 | | | Orange Lake Timeshare Trust, Ser 2012-AA, Class A, 144a, 3.450%, 3/10/27 | | | 2,744,811 | |
| | 1,210,052 | | | Orange Lake Timeshare Trust, Ser 2014-AA, Class A, 144a, 2.290%, 7/9/29 | | | 1,203,974 | |
| | 554,717 | | | Park Place Securities, Inc. Asset Backed Pass Through Certificates, Ser 2005-WHQ3, Class M2, 1.200%, 6/25/35(A) | | | 553,829 | |
| | 827,589 | | | Prestige Auto Receivables Trust, Ser 2014-1A, Class A3, 144a, 1.520%, 4/15/20 | | | 828,097 | |
| | 168,127 | | | RAMP Trust, Ser 2003-RZ3, Class A6, 3.900%, 3/25/33(B) | | | 170,745 | |
| | 690,003 | | | Rockwall CDO Ltd., Ser 2006-1A, Class A1LB, 144a, 1.257%, 8/1/21(A) | | | 689,769 | |
| | 746,308 | | | Santander Drive Auto Receivables Trust, Ser 2012-5, Class C, 2.700%, 8/15/18 | | | 747,631 | |
| | 370,721 | | | Santander Drive Auto Receivables Trust, Ser 2012-AA, Class C, 144a, 1.780%, 11/15/18 | | | 371,163 | |
| | 4,790,000 | | | Santander Drive Auto Receivables Trust, Ser 2012-AA, Class D, 144a, 2.460%, 12/17/18 | | | 4,825,867 | |
| | 2,847,452 | | | Santander Drive Auto Receivables Trust, Ser 2013-1, Class C, 1.760%, 1/15/19 | | | 2,852,093 | |
| | 8,000,000 | | | Santander Drive Auto Receivables Trust, Ser 2013-1, Class D, 2.270%, 1/15/19 | | | 8,060,993 | |
| | 3,829,850 | | | Santander Drive Auto Receivables Trust, Ser 2013-2, Class C, 1.950%, 3/15/19 | | | 3,839,928 | |
| | 3,727,000 | | | Santander Drive Auto Receivables Trust, Ser 2014-4, Class C, 2.600%, 11/16/20 | | | 3,768,051 | |
| | 6,340,000 | | | Santander Drive Auto Receivables Trust, Ser 2015-1, Class B, 1.970%, 11/15/19 | | | 6,360,985 | |
Principal
Amount | | | | | Market
Value | |
| | | | | | | | | |
| | | | | Asset-Backed Securities — 35.2% (Continued) | | | | |
| $ | 2,362,839 | | | Schiller Park CLO Ltd., Ser 2007-1A, Class A2, 144a, 0.955%, 4/25/21(A) | | $ | 2,355,994 | |
| | 1,131,254 | | | Sierra Timeshare Receivables Funding LLC, Ser 2011-3A, Class A, 144a, 3.370%, 7/20/28 | | | 1,133,404 | |
| | 649,454 | | | Sierra Timeshare Receivables Funding LLC, Ser 2012-1A, Class A, 144a, 2.840%, 11/20/28 | | | 650,830 | |
| | 3,076,294 | | | Sierra Timeshare Receivables Funding LLC, Ser 2012-3A, Class A, 144a, 1.870%, 8/20/29 | | | 3,055,978 | |
| | 1,425,243 | | | Sierra Timeshare Receivables Funding LLC, Ser 2013-1A, Class A, 144a, 1.590%, 11/20/29 | | | 1,419,434 | |
| | 1,105,935 | | | Sierra Timeshare Receivables Funding LLC, Ser 2014-1A, Class A, 144a, 2.070%, 3/20/30 | | | 1,100,275 | |
| | 829,321 | | | Sierra Timeshare Receivables Funding LLC, Ser 2014-2A, Class A, 144a, 2.050%, 6/20/31 | | | 829,811 | |
| | 2,257,819 | | | Sierra Timeshare Receivables Funding LLC, Ser 2014-3A, Class A, 144a, 2.300%, 10/20/31 | | | 2,262,351 | |
| | 2,565,970 | | | Sierra Timeshare Receivables Funding LLC, Ser 2015-2A, Class A, 144a, 2.430%, 6/20/32 | | | 2,571,455 | |
| | 3,986,656 | | | SpringCastle America Funding LLC, Ser 2014-AA, Class A, 144a, 2.700%, 5/25/23 | | | 3,999,593 | |
| | 2,748,645 | | | Tidewater Auto Receivables Trust, Ser 2016-AA, Class A2, 144a, 2.300%, 9/15/19 | | | 2,750,709 | |
| | 237,372 | | | United Auto Credit Securitization Trust, Ser 2016-1, Class A, 144a, 2.000%, 10/15/17 | | | 237,532 | |
| | 4,750,000 | | | United Auto Credit Securitization Trust, Ser 2016-2, Class A, 144a, 1.670%, 9/10/18 | | | 4,751,368 | |
| | 3,828,494 | | | Welk Resorts LLC, Ser 2013-AA, Class A, 144a, 3.100%, 3/15/29 | | | 3,866,917 | |
| | 1,629,052 | | | Westgate Resorts LLC, Ser 2013-1A, Class A, 144a, 2.250%, 8/20/25 | | | 1,628,034 | |
| | 2,664,470 | | | Westgate Resorts LLC, Ser 2015-1A, Class A, 144a, 2.750%, 5/20/27 | | | 2,648,691 | |
| | 2,674,703 | | | Westgate Resorts LLC, Ser 2016-1A, Class A, 144a, 3.500%, 12/20/28 | | | 2,676,836 | |
| | 6,075,000 | | | Westlake Automobile Receivables Trust, Ser 2014-2A, Class C, 144a, 2.240%, 4/15/20 | | | 6,095,331 | |
| | 531,293 | | | Westlake Automobile Receivables Trust, Ser 2015-1A, Class A2, 144a, 1.170%, 3/15/18 | | | 531,229 | |
| | 2,409,272 | | | Westlake Automobile Receivables Trust, Ser 2015-2A, Class A2A, 144a, 1.280%, 7/16/18 | | | 2,409,484 | |
77
| | Touchstone Ultra Short Duration Fixed Income Fund (Continued) |
Principal
Amount | | | | | Market
Value | |
| | | | | | | | | |
| | | | | Asset-Backed Securities — 35.2% (Continued) |
| $ | 834,191 | | | Westlake Automobile Receivables Trust, Ser 2016-1A, Class A2A, 144a, 1.820%, 1/15/19 | | $ | 836,536 | |
| | 4,301,171 | | | Westlake Automobile Receivables Trust, Ser 2016-1A, Class A2B, 144a, 1.574%, 1/15/19(A) | | | 4,313,739 | |
| | 5,365,000 | | | Westlake Automobile Receivables Trust, Ser 2016-2A, Class A2, 144a, 1.570%, 6/17/19 | | | 5,369,590 | |
| | | | | Total Asset-Backed Securities | | $ | 218,024,179 | |
| | | | | | | | | |
| | | | | Commercial Mortgage-Backed Securities — 9.4% | |
| | 9,305,469 | | | BAMLL Re-REMIC Trust, Ser 2014-FRR7, Class A, 144a, 2.774%, 10/26/44(A) | | | 9,303,204 | |
| | 5,182,000 | | | CD Mortgage Trust, Ser 2006-CD3, Class AM, 5.648%, 10/15/48 | | | 5,186,421 | |
| | 5,645,000 | | | CDGJ Commercial Mortgage Trust, Ser 2014-BXCH, Class B, 144a, 2.374%, 12/15/27(A) | | | 5,626,445 | |
| | 4,991,000 | | | COMM Mortgage Trust, Ser 2012-9W57, Class A, 144a, 2.365%, 2/10/29 | | | 5,001,428 | |
| | 3,537,904 | | | COMM Mortgage Trust, Ser 2014-SAVA, Class A, 144a, 1.675%, 6/15/34(A) | | | 3,541,088 | |
| | 391,335 | | | DBRR Trust, Ser 2013-EZ3, Class A, 144a, 1.636%, 12/18/49(A) | | | 391,201 | |
| | 1,172,698 | | | DBUBS Mortgage Trust, Ser 2011-LC2A, Class A1FL, 144a, 1.869%, 7/12/44(A) | | | 1,170,198 | |
| | 7,649,709 | | | EQTY Mortgage Trust, Ser 2014-INNS, Class A, 144a, 1.367%, 5/8/31(A) | | | 7,628,115 | |
| | 40,561 | | | FDIC Guaranteed Notes, Ser 2010-C1, Class A, 144a, 2.980%, 12/6/20 | | | 41,025 | |
| | 4,965,000 | | | Hyatt Hotel Portfolio Trust, Ser 2015-HYT, Class A, 144a, 1.781%, 11/15/29(A) | | | 4,968,895 | |
| | 6,050,000 | | | JP Morgan Chase Commercial Mortgage Securities Trust, Ser 2014-INN, Class D, 144a, 2.874%, 6/15/29(A) | | | 5,922,034 | |
| | 2,800,000 | | | PFP 2015-2 Ltd., Ser 2015-2, Class A, 144a, 1.980%, 7/14/34(A) | | | 2,788,330 | |
| | 16,121,596 | | | UBS-Citigroup Commercial Mortgage Trust, Ser 2011-C1, Class XA, 144a, 2.290%, 1/10/45(A)(C) | | | 1,467,085 | |
| | 5,000,000 | | | Wells Fargo Commercial Mortgage Trust, Ser 2014-TISH, Class B, 144a, 1.874%, 2/15/27(A) | | | 5,009,180 | |
| | | | | Total Commercial Mortgage-Backed Securities | | $ | 58,044,649 | |
| | | | | | | | | |
| | | | | U.S. Government Mortgage-Backed Obligations — 6.7% | |
| | 162,820 | | | FHLMC, Pool #1B1580, 3.086%, 3/1/34(A) | | | 171,744 | |
Principal
Amount | | | | | Market
Value | |
| | | | | | | | | |
| | | | | U.S. Government Mortgage-Backed Obligations — 6.7% (Continued) | |
| $ | 154,889 | | | FHLMC, Pool #1B2629, 2.625%, 11/1/34(A) | | $ | 164,574 | |
| | 468,261 | | | FHLMC, Pool #1B7189, 3.555%, 3/1/36(A) | | | 499,700 | |
| | 141,582 | | | FHLMC, Pool #1G1471, 2.552%, 1/1/37(A) | | | 150,646 | |
| | 817,727 | | | FHLMC, Pool #1H1354, 2.671%, 11/1/36(A) | | | 865,445 | |
| | 94,154 | | | FHLMC, Pool #1H2524, 2.781%, 8/1/35(A) | | | 99,543 | |
| | 489,273 | | | FHLMC, Pool #1J1813, 3.175%, 8/1/37(A) | | | 519,184 | |
| | 353,996 | | | FHLMC, Pool #1K1238, 2.778%, 7/1/36(A) | | | 374,852 | |
| | 203,306 | | | FHLMC, Pool #1L0087, 2.755%, 6/1/35(A) | | | 214,884 | |
| | 446,506 | | | FHLMC, Pool #1L0147, 2.801%, 7/1/35(A) | | | 475,914 | |
| | 279,848 | | | FHLMC, Pool #1L1288, 2.822%, 5/1/36(A) | | | 295,558 | |
| | 249,027 | | | FHLMC, Pool #1Q0080, 2.773%, 1/1/36(A) | | | 262,842 | |
| | 535,569 | | | FHLMC, Pool #1Q0119, 3.080%, 9/1/36(A) | | | 569,890 | |
| | 1,302,593 | | | FHLMC, Pool #1Q0187, 2.759%, 12/1/36(A) | | | 1,376,884 | |
| | 700,821 | | | FHLMC, Pool #1Q0339, 2.896%, 4/1/37(A) | | | 743,172 | |
| | 197,345 | | | FHLMC, Pool #1Q0669, 2.767%, 11/1/37(A) | | | 208,023 | |
| | 697,408 | | | FHLMC, Pool #1Q1303, 2.686%, 11/1/36(A) | | | 737,944 | |
| | 840,784 | | | FHLMC, Pool #781515, 2.824%, 4/1/34(A) | | | 887,665 | |
| | 349,656 | | | FHLMC, Pool #782760, 2.698%, 11/1/36(A) | | | 370,723 | |
| | 305,061 | | | FHLMC, Pool #847795, 2.686%, 4/1/35(A) | | | 321,709 | |
| | 187,803 | | | FHLMC, Pool #848088, 2.728%, 4/1/35(A) | | | 198,735 | |
| | 579,275 | | | FHLMC, Pool #848539, 2.846%, 4/1/37(A) | | | 618,554 | |
| | 1,567,611 | | | FHLMC, Pool #848583, 2.784%, 1/1/36(A) | | | 1,657,106 | |
| | 21,454 | | | FHLMC, Pool #A92646, 5.500%, 6/1/40 | | | 24,663 | |
| | 20,222 | | | FHLMC, Pool #C03505, 5.500%, 6/1/40 | | | 22,712 | |
| | 71,401 | | | FHLMC, Pool #C66916, 7.000%, 5/1/32 | | | 82,330 | |
| | 16,136 | | | FHLMC, Pool #D94598, 6.500%, 4/1/21 | | | 18,127 | |
| | 65,765 | | | FHLMC, Pool #G01840, 5.000%, 7/1/35 | | | 73,628 | |
| | 772,503 | | | FHLMC, Pool #G11769, 5.000%, 10/1/20 | | | 809,433 | |
| | 489,624 | | | FHLMC, Pool #G11773, 5.000%, 10/1/20 | | | 513,062 | |
| | 5,452 | | | FHLMC, Pool #G30085, 7.500%, 10/1/17 | | | 5,534 | |
78
| Touchstone Ultra Short Duration Fixed Income Fund (Continued) | |
Principal
Amount | | | | | Market
Value | |
| | | | | | | | | |
| | | | | U.S. Government Mortgage-Backed Obligations — 6.7% (Continued) | |
| $ | 277,168 | | | FHLMC, Pool #J10895, 4.000%, 10/1/19 | | $ | 285,723 | |
| | 207,099 | | | FNMA, Pool #254868, 5.000%, 9/1/33 | | | 231,067 | |
| | 98,826 | | | FNMA, Pool #256272, 5.500%, 6/1/26 | | | 111,247 | |
| | 164,342 | | | FNMA, Pool #256852, 6.000%, 8/1/27 | | | 188,130 | |
| | 36,303 | | | FNMA, Pool #323832, 7.500%, 7/1/29 | | | 43,522 | |
| | 2,697 | | | FNMA, Pool #334593, 7.000%, 5/1/24 | | | 2,957 | |
| | 174,050 | | | FNMA, Pool #555380, 2.733%, 4/1/33(A) | | | 182,191 | |
| | 60,933 | | | FNMA, Pool #665773, 7.500%, 6/1/31 | | | 62,871 | |
| | 119,346 | | | FNMA, Pool #679742, 2.972%, 1/1/40(A) | | | 123,386 | |
| | 82,592 | | | FNMA, Pool #681842, 2.678%, 2/1/33(A) | | | 86,866 | |
| | 200,535 | | | FNMA, Pool #681898, 2.698%, 4/1/33(A) | | | 209,428 | |
| | 221,604 | | | FNMA, Pool #725245, 2.556%, 2/1/34(A) | | | 233,477 | |
| | 227,863 | | | FNMA, Pool #725424, 5.500%, 4/1/34 | | | 259,106 | |
| | 1,389,523 | | | FNMA, Pool #725490, 2.730%, 4/1/34(A) | | | 1,483,441 | |
| | 121,750 | | | FNMA, Pool #735439, 6.000%, 9/1/19 | | | 125,144 | |
| | 40,812 | | | FNMA, Pool #735484, 5.000%, 5/1/35 | | | 45,555 | |
| | 168,929 | | | FNMA, Pool #735539, 2.783%, 4/1/35(A) | | | 178,076 | |
| | 97,240 | | | FNMA, Pool #743207, 2.442%, 10/1/33(A) | | | 101,627 | |
| | 71,195 | | | FNMA, Pool #745467, 2.834%, 4/1/36(A) | | | 75,260 | |
| | 72,875 | | | FNMA, Pool #745790, 2.666%, 8/1/36(A) | | | 76,674 | |
| | 493,430 | | | FNMA, Pool #761411, 4.500%, 5/1/19 | | | 506,199 | |
| | 123,106 | | | FNMA, Pool #784365, 2.425%, 5/1/34(A) | | | 128,841 | |
| | 254,225 | | | FNMA, Pool #791978, 2.392%, 9/1/34(A) | | | 264,675 | |
| | 91,856 | | | FNMA, Pool #804001, 2.575%, 10/1/34(A) | | | 96,623 | |
| | 61,374 | | | FNMA, Pool #809897, 2.812%, 3/1/35(A) | | | 65,164 | |
| | 266,524 | | | FNMA, Pool #813170, 2.539%, 1/1/35(A) | | | 280,316 | |
| | 1,343,392 | | | FNMA, Pool #815323, 2.452%, 1/1/35(A) | | | 1,399,887 | |
| | 258,400 | | | FNMA, Pool #820364, 2.197%, 4/1/35(A) | | | 266,537 | |
| | 708,611 | | | FNMA, Pool #827787, 2.427%, 5/1/35(A) | | | 742,238 | |
| | 101,441 | | | FNMA, Pool #828480, 2.980%, 6/1/35(A) | | | 108,741 | |
| | 157,990 | | | FNMA, Pool #839239, 2.882%, 9/1/35(A) | | | 165,870 | |
| | 125,082 | | | FNMA, Pool #888179, 2.741%, 2/1/37(A) | | | 132,164 | |
Principal
Amount | | | | | Market
Value | |
| | | | | | | | | |
| | | | | U.S. Government Mortgage-Backed Obligations — 6.7% (Continued) | |
| $ | 86,289 | | | FNMA, Pool #888548, 2.647%, 5/1/35(A) | | $ | 91,225 | |
| | 137,538 | | | FNMA, Pool #889060, 6.000%, 1/1/38 | | | 159,482 | |
| | 133,966 | | | FNMA, Pool #889061, 6.000%, 1/1/38 | | | 156,936 | |
| | 8,391 | | | FNMA, Pool #889382, 5.500%, 4/1/38 | | | 9,621 | |
| | 499,256 | | | FNMA, Pool #922674, 2.928%, 4/1/36(A) | | | 525,649 | |
| | 277,721 | | | FNMA, Pool #931676, 5.500%, 1/1/19 | | | 287,112 | |
| | 214,384 | | | FNMA, Pool #950385, 1.876%, 8/1/37(A) | | | 220,085 | |
| | 72,871 | | | FNMA, Pool #960376, 5.500%, 12/1/37 | | | 82,029 | |
| | 26,518 | | | FNMA, Pool #995284, 5.500%, 3/1/20 | | | 26,888 | |
| | 630,833 | | | FNMA, Pool #AA1150, 4.000%, 4/1/23 | | | 651,232 | |
| | 13,034 | | | FNMA, Pool #AD0941, 5.500%, 4/1/40 | | | 15,143 | |
| | 103,655 | | | FNMA, Pool #AE0363, 5.000%, 7/1/37 | | | 116,435 | |
| | 361,066 | | | FNMA, Pool #AE0727, 4.000%, 10/1/20 | | | 372,634 | |
| | 150,099 | | | FNMA, Pool #AE5441, 5.000%, 10/1/40 | | | 166,981 | |
| | 234,188 | | | FNMA, Pool #AI6588, 4.000%, 7/1/26 | | | 248,630 | |
| | 235,828 | | | FNMA, Pool #AI8506, 4.000%, 8/1/26 | | | 250,465 | |
| | 231,757 | | | FNMA, Pool #AL0211, 5.000%, 4/1/41 | | | 258,711 | |
| | 39,333 | | | FNMA, Pool #AL0302, 5.000%, 4/1/24 | | | 42,194 | |
| | 1,469,602 | | | FNMA, Pool #AL0478, 2.718%, 4/1/36(A) | | | 1,556,619 | |
| | 379,876 | | | FNMA, Pool #AL0543, 5.000%, 7/1/41 | | | 423,793 | |
| | 225,024 | | | FNMA, Pool #AL1105, 4.500%, 12/1/40 | | | 249,676 | |
| | 103,022 | | | FNMA, Pool #AL2591, 5.500%, 5/1/38 | | | 110,774 | |
| | 953,239 | | | FNMA, Pool #AL5275, 2.357%, 9/1/37(A) | | | 980,398 | |
| | 4,723,069 | | | FNMA, Pool #AL7396, 2.424%, 2/1/37(A) | | | 4,941,511 | |
| | 14,059 | | | GNMA, Pool #344233, 8.000%, 2/15/23 | | | 15,282 | |
| | 63,252 | | | GNMA, Pool #345123, 8.000%, 12/15/23 | | | 69,664 | |
| | 6,878 | | | GNMA, Pool #569337, 6.500%, 4/15/22 | | | 7,416 | |
| | 17,293 | | | GNMA, Pool #780322, 8.000%, 11/15/22 | | | 19,390 | |
| | 578 | | | GNMA, Pool #780327, 8.000%, 11/15/17 | | | 584 | |
| | 646,429 | | | GNMA, Pool #80826, 2.000%, 2/20/34(A) | | | 671,508 | |
| | 308,956 | | | GNMA, Pool #80889, 2.125%, 4/20/34(A) | | | 320,891 | |
| | 514,659 | | | GNMA, Pool #81016, 1.875%, 8/20/34(A) | | | 535,888 | |
| | 2,035 | | | GNMA, Pool #814, 8.000%, 8/20/17 | | | 2,049 | |
| | 1,106,776 | | | GNMA, Pool #82760, 2.000%, 3/20/41(A) | | | 1,146,807 | |
| | 1,976 | | | GNMA, Pool #8426, 3.000%, 11/20/18(A) | | | 1,990 | |
| | 1,179,214 | | | GNMA, Pool #MA2392, 2.000%, 11/20/44(A) | | | 1,208,104 | |
| | 4,115,984 | | | GNMA, Pool #MA2466, 2.000%, 12/20/44(A) | | | 4,218,130 | |
| | | | | Total U.S. Government Mortgage-Backed Obligations | | $ | 41,759,709 | |
79
| | Touchstone Ultra Short Duration Fixed Income Fund (Continued) |
Principal
Amount | | | | | Market
Value | |
| | | | | | | | | |
| | | | | Municipal Bonds — 3.8% | | | | |
| | | | | | | | | |
| | | | | California — 0.8% | | | | |
| $ | 2,340,000 | | | CA St Enterprise Dev Authority, Txbl Variable J Harris Indl Wt, (LOC: City National Bank), 144a, 1.060%, 9/1/41 | | $ | 2,340,000 | |
| | 730,000 | | | CA St Infrastructure & Economic Dev Bank, Txbl Studio Moulding, Ser B, (LOC: Comerica Bank), 1.990%, 12/1/28 | | | 730,000 | |
| | 255,000 | | | CA St Infrastructure & Economic Dev Bank, Txbl Tobinworld Pj, Ser B, (LOC: Comerica Bank), 1.990%, 11/1/36 | | | 255,000 | |
| | 1,885,000 | | | CA St Infrastructure & Economic Dev Bank, Variable Canyon Plastics Inc P, (LOC: Bank Of West (The), 1.190%, 12/1/39 | | | 1,885,000 | |
| | | | | | | | 5,210,000 | |
| | | | | | | | | |
| | | | | Connecticut — 0.1% | | | | |
| | 425,000 | | | State of Connecticut, Ser A, UTGO, 1.760%, 5/15/18(A) | | | 427,159 | |
| | | | | | | | | |
| | | | | Florida — 0.8% | | | | |
| | 5,000,000 | | | State Brd of Admin Fin Corp., Txbl Ser A, 2.163%, 7/1/19 | | | 5,093,650 | |
| | | | | | | | | |
| | | | | Massachusetts — 0.7% | | | | |
| | 4,450,000 | | | MA St Edu Fin Auth, Ser B 1, 2.277%, 1/1/31(A) | | | 4,450,044 | |
| | | | | | | | | |
| | | | | Minnesota — 0.3% | | | | |
| | 1,000,000 | | | Saint Paul MN Hsg & Redev Auth, Txbl Ref Healthpartners Oblig, 1.400%, 7/1/17 | | | 1,001,950 | |
| | 1,095,000 | | | Saint Paul MN Hsg & Redev Auth, Txbl Ref Healthpartners Oblig, 1.838%, 7/1/18 | | | 1,102,107 | |
| | | | | | | | 2,104,057 | |
| | | | | | | | | |
| | | | | New York — 0.6% | | | | |
| | 3,600,000 | | | Brookhaven NY IDA, Variable Intercounty Asso, (LOC: Capital One NA), 0.980%, 1/1/25 | | | 3,600,000 | |
| | | | | | | | | |
| | | | | Ohio — 0.3% | | | | |
| | 1,540,000 | | | Akron OH COP, Muni Baseball Stadium, 1.750%, 12/1/16 | | | 1,541,263 | |
| | | | | | | | | |
| | | | | South Carolina — 0.2% | | | | |
| | 230,000 | | | Spartanburg SC Wtrwks Rev, Txbl Ref Sys Ser B, 1.219%, 12/1/16 | | | 229,975 | |
Principal
Amount | | | | | Market
Value | |
| | | | | | | | | |
| | | | | Municipal Bonds — 3.8% (Continued) | |
| | | | | | | | | |
| $ | 535,000 | | | Spartanburg SC Wtrwks Rev, Txbl Ref Sys Ser B, 1.519%, 12/1/17 | | $ | 537,445 | |
| | 280,000 | | | Spartanburg SC Wtrwks Rev, Txbl Ref Sys Ser B, 1.785%, 12/1/18 | | | 283,108 | |
| | | | | | | | 1,050,528 | |
| | | | | Total Municipal Bonds | | $ | 23,476,701 | |
| | | | | | | | | |
| | | | | Non-Agency Collateralized Mortgage Obligations — 3.5% | |
| | 3,154,195 | | | Bear Stearns ARM Trust, Ser 2003-1, Class 5A1, 2.730%, 4/25/33(A)†† | | | 3,142,911 | |
| | 373,051 | | | Bear Stearns ARM Trust, Ser 2004-1, Class 13A3, 3.274%, 4/25/34(A)†† | | | 361,229 | |
| | 266,840 | | | Bear Stearns Asset Backed Securities Trust, Ser 2003-AC7, Class A2, 5.750%, 1/25/34(B)†† | | | 273,966 | |
| | 105,516 | | | Community Program Loan Trust, Ser 1987-A, Class A5, 4.500%, 4/1/29 | | | 104,870 | |
| | 1,268,190 | | | CSMC Trust, Ser 2012-CIM1, Class A1, 144a, 3.380%, 2/25/42(A) | | | 1,273,600 | |
| | 93,238 | | | FDIC Structured Sale Guaranteed Notes, Ser 2010-S3, Class A, 144a, 2.740%, 12/3/20 | | | 94,680 | |
| | 218,206 | | | JP Morgan Mortgage Trust, Ser 2006-A4, Class 2A2, 2.812%, 6/25/36(A) | | | 196,474 | |
| | 24,031 | | | Merrill Lynch Mortgage Investors Trust, Ser 2003-A1, Class 2A, 3.184%, 12/25/32(A) | | | 23,722 | |
| | 251,536 | | | Merrill Lynch Mortgage Investors Trust, Ser 2004-1, Class 1A, 2.640%, 12/25/34(A) | | | 247,509 | |
| | 2,750,371 | | | Mill City Mortgage Trust, Ser 2015-1, Class A1, 144a, 2.230%, 6/25/56(A) | | | 2,754,198 | |
| | 1,469,990 | | | People’s Choice Home Loan Securities Trust Series, Ser 2005-1, Class M3, 1.394%, 1/25/35(A) | | | 1,471,052 | |
| | 1,167,909 | | | RFMSI Trust, Ser 2007-SA1, Class 1A1, 3.208%, 2/25/37(A) | | | 978,634 | |
| | 3,860,704 | | | Springleaf Mortgage Loan Trust, Ser 2013-1A, Class M5, 144a, 2.378%, 6/25/58(A) | | | 3,854,438 | |
| | 5,856,393 | | | Springleaf Mortgage Loan Trust, Ser 2013-3A, Class A, 144a, 1.870%, 9/25/57(A) | | | 5,856,448 | |
| | 238,975 | | | Wells Fargo Mortgage Backed Securities Trust, Ser 2003-G, Class A1, 2.894%, 6/25/33(A) | | | 239,517 | |
| | 556,340 | | | Wells Fargo Mortgage Backed Securities Trust, Ser 2003-M, Class A1, 2.810%, 12/25/33(A) | | | 557,156 | |
| | | | | Total Non-Agency Collateralized Mortgage Obligations | | $ | 21,430,404 | |
| | | | | | | | | |
| | | | | U.S. Government Agency Obligations — 1.3% | |
| | 583,000 | | | Government Trust Certificate, 0.000%, 10/1/16# | | | 583,000 | |
80
| Touchstone Ultra Short Duration Fixed Income Fund (Continued) | |
Principal
Amount | | | | | Market
Value | |
| | | | | | | | | |
| | | | | U.S. Government Agency Obligations — 1.3% (Continued) | |
| $ | 2,100,000 | | | Overseas Private Investment Corp., 0.800%, 10/15/33(A) | | $ | 2,100,000 | |
| | 5,000,000 | | | Overseas Private Investment Corp., 0.830%, 7/20/22(A) | | | 5,000,000 | |
| | 31,190 | | | Small Business Administration Participation Certificates, Ser 2002-20A, Class 1, 6.140%, 1/1/22 | | | 33,510 | |
| | 46,412 | | | Small Business Administration Participation Certificates, Ser 2003-20E, Class 1, 4.640%, 5/1/23 | | | 49,184 | |
| | 209,300 | | | Small Business Administration Pools, 507682, 0.900%, 1/25/26(A) | | | 208,658 | |
| | 169,531 | | | Small Business Administration Pools, 508374, 1.000%, 4/25/28(A) | | | 169,405 | |
| | | | | Total U.S. Government Agency Obligations | | $ | 8,143,757 | |
| | | | | | | | | |
| | | | | Agency Collateralized Mortgage Obligations — 0.8% | |
| | 125,522,266 | | | FHLMC Multifamily Structured Pass Through Certificates, Ser K504 Class X1, 0.329%, 9/25/20(A)(C) | | | 796,527 | |
| | 46,718 | | | FHLMC REMIC, Ser 2510 Class TA, 4.000%, 6/15/32 | | | 47,978 | |
| | 494,605 | | | FHLMC REMIC, Ser 2770 Class FH, 0.924%, 3/15/34(A) | | | 494,723 | |
| | 132,336 | | | FHLMC REMIC, Ser 3414 Class MB, 4.250%, 12/15/19 | | | 135,331 | |
| | 237,727 | | | FHLMC REMIC, Ser 4459 Class NG, 6.500%, 10/15/24 | | | 239,859 | |
| | 282,037 | | | FNMA REMIC, Ser 2003-119, Class PU, 4.000%, 11/25/33 | | | 288,868 | |
| | 97,099 | | | FNMA REMIC, Ser 2003-33, Class AM, 4.250%, 5/25/33 | | | 104,918 | |
| | 90,438 | | | FNMA REMIC, Ser 2003-42, Class CA, 4.000%, 5/25/33 | | | 95,466 | |
| | 401,820 | | | FNMA REMIC, Ser 2003-81, Class FE, 1.025%, 9/25/33(A) | | | 403,098 | |
| | 76,934 | | | FNMA REMIC, Ser 2008-35, Class IO, 4.500%, 4/25/23(C) | | | 1,212 | |
| | 141,397 | | | FNMA REMIC, Ser 2010-13, Class WD, 4.250%, 3/25/25 | | | 145,926 | |
| | 34,863 | | | FNMA REMIC, Ser 2010-54, Class NA, 4.500%, 10/25/39 | | | 35,186 | |
| | 116,681 | | | FNMA REMIC, Ser 2011-52, Class AH, 2.750%, 10/25/18 | | | 117,897 | |
| | 399,711 | | | FNMA REMIC, Ser 2012-102, Class NA, 1.500%, 9/25/27 | | | 396,499 | |
| | 142,031 | | | FNMA REMIC Trust, Ser 2001-W4, Class AF5, 6.114%, 2/25/32(B) | | | 174,127 | |
| | 159,268 | | | GNMA, Ser 2002-72, Class AB, 4.500%, 10/20/32 | | | 172,103 | |
| | 18,257,181 | | | GNMA, Ser 2011-142, Class IO, 0.810%, 9/16/46(A)(C) | | | 584,177 | |
Principal
Amount | | | | | Market
Value | |
| | | | | | | | | |
| | | | | Agency Collateralized Mortgage Obligations — 0.8% (Continued) | |
| $ | 180,883 | | | GNMA, Ser 2011-161, Class A, 1.738%, 1/16/34 | | $ | 180,869 | |
| | 132,277 | | | GNMA, Ser 2011-57, Class BA, 3.000%, 5/20/40 | | | 136,252 | |
| | 101,071 | | | GNMA, Ser 2011-78, Class AB, 2.450%, 2/16/39 | | | 101,116 | |
| | 6,879,017 | | | GNMA, Ser 2011-78, Class IX, 0.477%, 8/16/46(A)(C) | | | 190,280 | |
| | 236,177 | | | GNMA, Ser 2012-27, Class A, 1.614%, 7/16/39 | | | 233,672 | |
| | 997,756 | | | GNMA, Ser 2013-121, Class KX, 0.620%, 10/16/44(A)(C) | | | 169,231 | |
| | | | | Total Agency Collateralized Mortgage Obligations | | $ | 5,245,315 | |
| | | | | | | | | |
| | | | | Commercial Paper — 0.4% | | | | |
| | 2,600,000 | | | MDU Resourses Group, Inc., 0.600%,
10/3/16(D) | | | 2,599,870 | |
| | | | | | | | | |
| Shares | | | | | | | |
| | | | | | | | | |
| | | | | Investment Fund — 0.0% | | | | |
| | 16,628 | | | Dreyfus Government Cash Management, Institutional Shares, 0.30%¥W | | | 16,628 | |
| | | | | | | | | |
| | | | | Total Investment Securities —98.8%
(Cost $613,474,342) | | $ | 612,008,602 | |
| | | | | | | | | |
| | | | | Other Assets in Excess of Liabilities — 1.2% | | | 7,376,050 | |
| | | | | | | | | |
| | | | | Net Assets — 100.0% | | $ | 619,384,652 | |
| (A) | Variable rate security - Rate reflected is the rate in effect as of September 30, 2016. |
| | |
| (B) | Step Bond - A bond that pays an initial interest rate for the first period and then a higher interest rate for the following periods until maturity. The interest rate shown reflects the rate in effect as of September 30, 2016. |
| | |
| (C) | Interest only security. This type of security represents the right to receive the monthly interest payments on an underlying pool of mortgages. Payments of principal on the pool reduce the value of the “interest only” holding. |
| | |
| (D) | Rate reflects yield at the time of purchase. |
| | |
| # | Zero coupon bond - Rate shown reflects effective yield to maturity at time of purchase. |
81
| | Touchstone Ultra Short Duration Fixed Income Fund (Continued) |
| †† | The issuers and/or sponsors of certain mortgage-backed securities may no longer exist; however, the securities held by the Fund are separate legal entities organized as trusts and publicly traded. The Fund receives principal and interest payments directly from these trusts. |
| | |
| ∞ | Open-End Fund. |
| | |
| Ω | Represents the 7-day SEC yield as of September 30, 2016. |
Portfolio Abbreviations:
ARM - Adjustable Rate Mortgage
CDO - Collateralized Debt Obligations
COP - Certificate of Participation
CLO - Collateralized Loan Obligations
FDIC - Federal Deposit Insurance Corporation
FHLMC - Federal Home Loan Mortgage Corporation
FNMA - Federal National Mortgage Association
GNMA - Government National Mortgage Association
IDA - Industrial Development Agency
LLC - Limited Liability Company
LOC - Letter of Credit
LP - Limited Partnership
MTN - Medium Term Note
PLC - Public Limited Company
REIT - Real Estate Investment Trust
REMIC - Real Estate Mortgage Investment Conduit
UTGO - Unlimited Tax General Obligation
144a - This is a restricted security that was sold in a transaction qualifying for the exemption under Rule 144A of the Securities Act of 1933. This security may be sold in transactions exempt from registration, normally to qualified institutional buyers. At September 30, 2016, these securities were valued at $283,818,722 or 45.8% of net assets. These securities were deemed liquid pursuant to procedures approved by the Board of Trustees.
Other Information:
The inputs or methodology used for valuing securities may not be an indication of the risk associated with investing in those securities. For more information on valuation inputs, and their aggregation into the levels used in the table below, please refer to the security valuation section in the accompanying Notes to Financial Statements.
| Valuation inputs at Reporting Date: |
| Description | | Level 1 | | | Level 2 | | | Level 3 | | | Total | |
| | | | | | | | | | | | | | | | | |
| Corporate Bonds | | $ | — | | | $ | 233,267,390 | | | $ | — | | | $ | 233,267,390 | |
| Asset-Backed Securities | | | — | | | | 218,024,179 | | | | — | | | | 218,024,179 | |
| Commercial Mortgage-Backed Securities | | | — | | | | 58,044,649 | | | | — | | | | 58,044,649 | |
| U.S. Government Mortgage-Backed Obligations | | | — | | | | 41,759,709 | | | | — | | | | 41,759,709 | |
| Municipal Bonds | | | — | | | | 23,476,701 | | | | — | | | | 23,476,701 | |
| Non-Agency Collateralized Mortgage Obligations | | | — | | | | 21,430,404 | | | | — | | | | 21,430,404 | |
| U.S. Government Agency Obligations | | | — | | | | 8,143,757 | | | | — | | | | 8,143,757 | |
| Agency Collateralized Mortgage Obligations | | | — | | | | 5,245,315 | | | | — | | | | 5,245,315 | |
| Commercial Paper | | | — | | | | 2,599,870 | | | | — | | | | 2,599,870 | |
| Investment Fund | | | 16,628 | | | | — | | | | — | | | | 16,628 | |
| Total | | $ | 16,628 | | | $ | 611,991,974 | | | $ | — | | | $ | 612,008,602 | |
See accompanying Notes to Financial Statements.
82
This page intentionally left blank.
| | Statements of Assets and Liabilities September 30, 2016 |
| | | | Touchstone
Arbitrage
Fund | | Touchstone
Emerging
Markets Small
Cap
Fund | | Touchstone
Merger
Arbitrage
Fund | | Touchstone
Mid
Cap
Fund |
| | Assets | | | | | | | | | | | | | | | | |
| | Investments, at cost | | $ | 162,239,265 | | | $ | 8,179,091 | | | $ | 226,901,663 | | | $ | 657,791,204 | |
| | Investments, at market value(A) | | $ | 162,324,094 | | | $ | 8,960,685 | | | $ | 227,202,457 | | | $ | 725,823,290 | |
| | Cash | | | 3,089,966 | | | | — | | | | 2,598,222 | | | | 1,248 | |
| | Foreign Currency(B) | | | — | | | | 81,256 | | | | — | | | | — | |
| | Cash collateral for securities sold short and written options | | | 36,608,741 | | | | — | | | | 14,426,614 | | | | — | |
| | Unrealized appreciation on forward foreign currency contracts | | | 80,668 | | | | — | | | | 84,152 | | | | — | |
| | Dividends and interest receivable | | | 224,972 | | | | 10,884 | | | | 636,240 | | | | 386,698 | |
| | Receivable for capital shares sold | | | 2,331,790 | | | | 5,023 | | | | 125,532 | | | | 2,594,700 | |
| | Receivable for investments sold | | | 5,690,959 | | | | 11,454 | | | | 6,117,003 | | | | — | |
| | Receivable for securities sold short | | | 2,078,292 | | | | — | | | | 1,776,271 | | | | — | |
| | Receivable for securities lending income | | | 6,488 | | | | 368 | | | | — | | | | 8,114 | |
| | Tax reclaim receivable | | | 2,896 | | | | — | | | | 6,764 | | | | — | |
| | Other assets | | | 22,489 | | | | 18,221 | | | | 19,250 | | | | 30,929 | |
| | Total Assets | | | 212,461,355 | | | | 9,087,891 | | | | 252,992,505 | | | | 728,844,979 | |
| | Liabilities | | | | | | | | | | | | | | | | |
| | Bank overdrafts | | | — | | | | 21,195 | | | | — | | | | — | |
| | Foreign Currency(B) | | | 165 | | | | — | | | | 160 | | | | — | |
| | Written options, at market value(C) | | | 64,783 | | | | — | | | | 73,923 | | | | — | |
| | Securities sold short(D) | | | 47,363,225 | | | | — | | | | 48,024,193 | | | | — | |
| | Dividend and interest payable on securities sold short | | | 47,599 | | | | — | | | | 82,191 | | | | — | |
| | Unrealized depreciation on forward foreign currency contracts | | | 11,839 | | | | — | | | | 15,140 | | | | — | |
| | Payable for return of collateral for securities on loan | | | 164,688 | | | | 118,751 | | | | — | | | | 41,064,072 | |
| | Deferred foreign capital gains tax(E) | | | — | | | | 18,178 | | | | — | | | | — | |
| | Payable for capital shares redeemed | | | 115,063 | | | | 21,358 | | | | 211,633 | | | | 1,009,431 | |
| | Payable for investments purchased | | | 10,965,311 | | | | 59,512 | | | | 11,540,784 | | | | — | |
| | Payable to Investment Advisor | | | 127,592 | | | | 30,151 | | | | 167,266 | | | | 414,841 | |
| | Payable to other affiliates | | | 23,906 | | | | 234 | | | | 39,151 | | | | 120,430 | |
| | Payable to Trustees | | | 3,910 | | | | 3,910 | | | | 3,910 | | | | 3,910 | |
| | Payable for professional services | | | 19,516 | | | | 17,789 | | | | 20,764 | | | | 27,862 | |
| | Payable to Transfer Agent | | | 20,725 | | | | 4,238 | | | | 27,289 | | | | 140,206 | |
| | Payable for reports to shareholders | | | 15,185 | | | | 11,189 | | | | 14,175 | | | | 44,792 | |
| | Other accrued expenses and liabilities | | | 9,268 | | | | 29,741 | | | | 10,088 | | | | 4,412 | |
| | Total Liabilities | | | 58,952,775 | | | | 336,246 | | | | 60,230,667 | | | | 42,829,956 | |
| | Net Assets | | $ | 153,508,580 | | | $ | 8,751,645 | | | $ | 192,761,838 | | | $ | 686,015,023 | |
| | Net assets consist of: | | | | | | | | | | | | | | | | |
| | Par value | | $ | 147,916 | | | $ | 9,427 | | | $ | 173,823 | | | $ | 263,950 | |
| | Paid-in capital | | | 149,727,541 | | | | 107,383,181 | | | | 188,322,861 | | | | 720,199,700 | |
| | Accumulated net investment income (loss) | | | (131,773 | ) | | | (120,063 | ) | | | (123,559 | ) | | | 3,651,860 | |
| | Accumulated net realized gains (losses) on investments, foreign currency transactions, written options and securities sold short | | | 4,630,791 | | | | (99,284,790 | ) | | | 5,202,630 | | | | (106,132,573 | ) |
| | Net unrealized appreciation (depreciation) on investments,foreign currency transactions, written options and securities sold short | | | (865,895 | ) | | | 763,890 | | | | (813,917 | ) | | | 68,032,086 | |
| | Net Assets | | $ | 153,508,580 | | | $ | 8,751,645 | | | $ | 192,761,838 | | | $ | 686,015,023 | |
| | (A) Includes market value of securities on loan of: | | $ | 158,488 | | | $ | 110,216 | | | $ | — | | | $ | 41,122,934 | |
| | (B) Cost of foreign currency: | | $ | (166 | ) | | $ | 80,762 | | | $ | (161 | ) | | $ | — | |
| | (C) Premiums received from written options: | | $ | 93,336 | | | $ | — | | | $ | 120,236 | | | $ | — | |
| | (D) Proceeds received for securities sold short: | | $ | 46,315,118 | | | $ | — | | | $ | 46,794,156 | | | $ | — | |
| | (E) See Note 2 in Notes to Financial Statements. | | | | | | | | | | | | | | | | |
| | See accompanying Notes to Financial Statements. | | | | | | | | | | | | | | | | |
84
| Statements of Assets and Liabilities (Continued) | |
Touchstone
Mid Cap
Value
Fund | | Touchstone
Premium
Yield Equity
Fund | | Touchstone
Sands Capital
Select Growth
Fund | | Touchstone
Small
Cap
Fund |
| | | | | | | | | | | |
| $ | 469,795,903 | | | $ | 138,837,574 | | | $ | 1,991,125,559 | | | $ | 528,142,370 | |
| $ | 525,497,687 | | | $ | 152,445,596 | | | $ | 3,402,598,200 | | | $ | 663,674,972 | |
| | 27,895 | | | | 500 | | | | — | | | | — | |
| | — | | | | — | | | | — | | | | — | |
| | — | | | | — | | | | — | | | | — | |
| | — | | | | — | | | | — | | | | — | |
| | 951,380 | | | | 256,656 | | | | 440,741 | | | | 502,870 | |
| | 1,194,128 | | | | 501,905 | | | | 2,331,496 | | | | 539,820 | |
| | — | | | | — | | | | 1,281,125 | | | | 18,461,013 | |
| | — | | | | — | | | | — | | | | — | |
| | 6,032 | | | | — | | | | 39,734 | | | | 12,140 | |
| | 172 | | | | 30,053 | | | | — | | | | 906 | |
| | 22,415 | | | | 14,616 | | | | 47,863 | | | | 21,181 | |
| | 527,699,709 | | | | 153,249,326 | | | | 3,406,739,159 | | | | 683,212,902 | |
| | | | | | | | | | | | | | | |
| | — | | | | — | | | | 1,271,186 | | | | 235,596 | |
| | — | | | | — | | | | — | | | | — | |
| | — | | | | — | | | | — | | | | — | |
| | — | | | | — | | | | — | | | | — | |
| | — | | | | — | | | | — | | | | — | |
| | — | | | | — | | | | — | | | | — | |
| | 6,925,787 | | | | — | | | | 101,299,820 | | | | 67,474,423 | |
| | — | | | | — | | | | — | | | | — | |
| | 14,438,800 | | | | 419,627 | | | | 37,174,659 | | | | 721,444 | |
| | 943,203 | | | | — | | | | 24,731,355 | | | | 10,590,686 | |
| | 313,910 | | | | 79,115 | | | | 1,667,640 | | | | 429,114 | |
| | 29,274 | | | | 40,597 | | | | 1,552,251 | | | | 94,470 | |
| | 3,910 | | | | 3,910 | | | | 3,910 | | | | 3,910 | |
| | 20,918 | | | | 15,342 | | | | 85,215 | | | | 25,809 | |
| | 71,757 | | | | 32,938 | | | | 741,845 | | | | 86,040 | |
| | 24,494 | | | | 14,191 | | | | 151,136 | | | | 27,876 | |
| | 5,629 | | | | 2,448 | | | | 22,537 | | | | 4,087 | |
| | 22,777,682 | | | | 608,168 | | | | 168,701,554 | | | | 79,693,455 | |
| $ | 504,922,027 | | | $ | 152,641,158 | | | $ | 3,238,037,605 | | | $ | 603,519,447 | |
| | | | | | | | | | | | | | | |
| $ | 287,023 | | | $ | 174,428 | | | $ | 1,963,761 | | | $ | 367,883 | |
| | 436,629,440 | | | | 142,020,123 | | | | 1,524,945,283 | | | | 529,086,456 | |
| | 52,237 | | | | 208,614 | | | | (17,640,732 | ) | | | 1,744,841 | |
| | | | | | | | | | | | | | | |
| | 12,251,543 | | | | (3,370,029 | ) | | | 317,296,652 | | | | (63,212,335 | ) |
| | | | | | | | | | | | | | | |
| | 55,701,784 | | | | 13,608,022 | | | | 1,411,472,641 | | | | 135,532,602 | |
| $ | 504,922,027 | | | $ | 152,641,158 | | | $ | 3,238,037,605 | | | $ | 603,519,447 | |
| $ | 6,851,937 | | | $ | — | | | $ | 100,594,535 | | | $ | 67,507,093 | |
| $ | — | | | $ | — | | | $ | — | | | $ | — | |
| $ | — | | | $ | — | | | $ | — | | | $ | — | |
| $ | — | | | $ | — | | | $ | — | | | $ | — | |
85
| | Statements of Assets and Liabilities (Continued) |
| | | | | Touchstone
Arbitrage
Fund | | Touchstone
Emerging
Markets
Small Cap
Fund | | Touchstone
Merger
Arbitrage
Fund | | Touchstone
Mid
Cap
Fund |
| | Pricing of Class A Shares | | | | | | | | | | | | | |
| | Net assets applicable to Class A shares | | | $ | 10,002,769 | | | $ | 2,376,388 | | | $ | 15,711,456 | | | $ | 53,044,323 | |
| | Shares of beneficial interest outstanding (unlimited number of shares authorized, $0.01 par value) | | | | 969,880 | | | | 255,679 | | | | 1,427,889 | | | | 2,047,177 | |
| | Net asset value price per share* | | | $ | 10.31 | | | $ | 9.29 | | | $ | 11.00 | | | $ | 25.91 | |
| | Maximum sales charge - Class A shares | | | | 5.75 | % | | | 5.75 | % | | | 5.75 | % | | | 5.75 | % |
| | Maximum offering price per share (100%/(100%-maximum sales charge) of net asset value adjusted to the nearest cent) - Class A shares | | | $ | 10.94 | | | $ | 9.86 | | | $ | 11.67 | | | $ | 27.49 | |
| | | | | | | | | | | | | | | | | | | |
| | Pricing of Class C Shares | | | | | | | | | | | | | | | | | |
| | Net assets applicable to Class C shares | | | $ | 7,929,905 | | | $ | 912,006 | | | $ | 14,299,978 | | | $ | 59,431,090 | |
| | Shares of beneficial interest outstanding (unlimited number of shares authorized, $0.01 par value) | | | | 784,287 | | | | 100,177 | | | | 1,349,628 | | | | 2,400,678 | |
| | Net asset value and offering price per share** | | | $ | 10.11 | | | $ | 9.10 | | | $ | 10.60 | | | $ | 24.76 | |
| | | | | | | | | | | | | | | | | | | |
| | Pricing of Class Y Shares | | | | | | | | | | | | | | | | | |
| | Net assets applicable to Class Y shares | | | $ | 121,793,531 | | | $ | 4,796,166 | | | $ | 85,840,883 | | | $ | 476,830,746 | |
| | Shares of beneficial interest outstanding (unlimited number of shares authorized, $0.01 par value) | | | | 11,715,707 | | | | 514,589 | | | | 7,715,927 | | | | 18,240,885 | |
| | Net asset value, offering price and redemption price per share | | | $ | 10.40 | | | $ | 9.32 | | | $ | 11.13 | | | $ | 26.14 | |
| | | | | | | | | | | | | | | | | | | |
| | Pricing of Class Z Shares | | | | | | | | | | | | | | | | | |
| | Net assets applicable to Class Z shares | | | $ | — | | | $ | — | | | $ | — | | | $ | 18,933,762 | |
| | Shares of beneficial interest outstanding (unlimited number of shares authorized, $0.01 par value) | | | | — | | | | — | | | | — | | | | 735,261 | |
| | Net asset value, offering price and redemption price per share | | | $ | — | | | $ | — | | | $ | — | | | $ | 25.75 | |
| | | | | | | | | | | | | | | | | | | |
| | Pricing of Institutional Class Shares | | | | | | | | | | | | | | | | | |
| | Net assets applicable to Institutional Class Shares | | | $ | 13,782,375 | | | $ | 667,085 | | | $ | 76,909,521 | | | $ | 77,775,102 | |
| | Shares of beneficial interest outstanding (unlimited number of shares authorized, $0.01 par value) | | | | 1,321,696 | | | | 72,210 | | | | 6,888,806 | | | | 2,971,026 | |
| | Net asset value, offering price and redemption price per share | | | $ | 10.43 | | | $ | 9.24 | | | $ | 11.16 | | | $ | 26.18 | |
* There is no sales load on subscriptions of $1 million or more. Redemptions that were part of a $1 million or more subscription may be subject to a contingent deferred sales load if redeemed within a one-year period from the date of purchase.
** Redemption price per share varies by length of time shares are held due to the terms of the contingent deferred sales charge.
See accompanying Notes to Financial Statements.
86
| Statements of Assets and Liabilities (Continued) | |
Touchstone
Mid Cap
Value
Fund | | Touchstone
Premium
Yield Equity
Fund | | Touchstone
Sands Capital
Select
Growth Fund | | Touchstone
Small
Cap
Fund |
| | | | | | | | | | | |
| $ | 21,866,670 | | | $ | 26,907,020 | | | $ | 138,315,453 | | | $ | 37,942,126 | |
| | | | | | | | | | | | | | | |
| | 1,249,997 | | | | 3,069,579 | | | | 8,569,123 | | | | 2,336,485 | |
| $ | 17.49 | | | $ | 8.77 | | | $ | 16.14 | | | $ | 16.24 | |
| | 5.75 | % | | | 5.75 | % | | | 5.75 | % | | | 5.75 | % |
| | | | | | | | | | | | | | | |
| $ | 18.56 | | | $ | 9.31 | | | $ | 17.12 | | | $ | 17.23 | |
| | | | | | | | | | | | | | | |
| $ | 4,087,838 | | | $ | 25,780,759 | | | $ | 111,951,253 | | | $ | 14,956,816 | |
| | | | | | | | | | | | | | | |
| | 237,267 | | | | 2,944,865 | | | | 7,290,636 | | | | 956,793 | |
| $ | 17.23 | | | $ | 8.75 | | | $ | 15.36 | | | $ | 15.63 | |
| | | | | | | | | | | | | | | |
| $ | 292,978,290 | | | $ | 99,953,379 | | | $ | 2,209,840,941 | | | $ | 295,198,006 | |
| | | | | | | | | | | | | | | |
| | 16,671,831 | | | | 11,428,397 | | | | 132,346,226 | | | | 17,952,303 | |
| $ | 17.57 | | | $ | 8.75 | | | $ | 16.70 | | | $ | 16.44 | |
| | | | | | | | | | | | | | | |
| $ | — | | | $ | — | | | $ | 777,929,958 | | | $ | — | |
| | | | | | | | | | | | | | | |
| | — | | | | — | | | | 48,170,122 | | | | — | |
| $ | — | | | $ | — | | | $ | 16.15 | | | $ | — | |
| | | | | | | | | | | | | | | |
| $ | 185,989,229 | | | $ | — | | | $ | — | | | $ | 255,422,499 | |
| | | | | | | | | | | | | | | |
| | 10,543,155 | | | | — | | | | — | | | | 15,542,684 | |
| $ | 17.64 | | | $ | — | | | $ | — | | | $ | 16.43 | |
87
| | Statements of Assets and Liabilities (Continued) |
| | | Touchstone | | | | | | Touchstone | |
| | | Small | | | Touchstone | | | Ultra Short | |
| | | Cap Value | | | Total Return | | | Duration Fixed | |
| | | Fund | | | Bond Fund | | | Income Fund | |
| Assets | | | | | | | | | |
| Investments, at cost | | $ | 174,135,976 | | | $ | 230,101,176 | | | $ | 613,474,342 | |
| Investments, at market value (A) | | $ | 176,079,007 | | | $ | 235,060,612 | | | $ | 612,008,602 | |
| Cash | | | 2,021 | | | | — | | | | 7,267,535 | |
| Dividends and interest receivable | | | 246,956 | | | | 1,731,385 | | | | 2,282,939 | |
| Receivable for capital shares sold | | | 171,692 | | | | 688,961 | | | | 6,641,817 | |
| Receivable for investments sold | | | 2,595,011 | | | | — | | | | 3,544,258 | |
| Receivable from securities lending income | | | 801 | | | | — | | | | — | |
| Other assets | | | 52,177 | | | | 23,482 | | | | 56,521 | |
| Total Assets | | | 179,147,665 | | | | 237,504,440 | | | | 631,801,672 | |
| | | | | | | | | | | | | |
| Liabilities | | | | | | | | | | | | |
| Bank overdrafts | | | — | | | | 12,211 | | | | — | |
| Distributions payable | | | — | | | | — | | | | 84,251 | |
| Payable for return of collateral for securities on loan | | | 98,825 | | | | — | | | | — | |
| Payable for capital shares redeemed | | | 198,297 | | | | 9,900,671 | | | | 2,341,862 | |
| Payable for investments purchased | | | 349,626 | | | | 500,000 | | | | 9,399,376 | |
| Payable to Investment Advisor | | | 128,235 | | | | 54,259 | | | | 112,398 | |
| Payable to other affiliates | | | 234 | | | | 21,217 | | | | 305,107 | |
| Payable to Trustees | | | 3,910 | | | | 3,910 | | | | 3,910 | |
| Payable for professional services | | | 14,971 | | | | 18,331 | | | | 26,473 | |
| Payable to Transfer Agent | | | 56,731 | | | | 25,191 | | | | 86,621 | |
| Payable for reports to shareholders | | | 13,849 | | | | 11,580 | | | | 25,006 | |
| Other accrued expenses and liabilities | | | 5,848 | | | | 13,197 | | | | 32,016 | |
| Total Liabilities | | | 870,526 | | | | 10,560,567 | | | | 12,417,020 | |
| Net Assets | | $ | 178,277,139 | | | $ | 226,943,873 | | | $ | 619,384,652 | |
| | | | | | | | | | | | | |
| Net assets consist of: | | | | | | | | | | | | |
| Par value | | $ | 80,309 | | | $ | 218,459 | | | $ | 664,818 | |
| Paid-in capital | | | 187,720,258 | | | | 223,876,701 | | | | 645,004,381 | |
| Accumulated net investment income | | | 39,218 | | | | 138,900 | | | | 314,261 | |
| Accumulated net realized losses on investments | | | (11,505,677 | ) | | | (2,249,623 | ) | | | (25,133,068 | ) |
| Net unrealized appreciation (depreciation) on investments | | | 1,943,031 | | | | 4,959,436 | | | | (1,465,740 | ) |
| Net Assets | | $ | 178,277,139 | | | $ | 226,943,873 | | | $ | 619,384,652 | |
| (A) Includes market value of securities on loan of: | | $ | 103,783 | | | $ | — | | | $ | — | |
See accompanying Notes to Financial Statements.
88
| Statements of Assets and Liabilities (Continued) | |
| | | Touchstone | | | | | | Touchstone | |
| | | Small | | | Touchstone | | | Ultra Short | |
| | | Cap Value | | | Total Return | | | Duration Fixed | |
| | | Fund | | | Bond Fund | | | Income Fund | |
| Pricing of Class A Shares | | | | | | | | | |
| Net assets applicable to Class A shares | | $ | 150,081,339 | | | $ | 8,639,360 | | | $ | 16,945,768 | |
| Shares of beneficial interest outstanding (unlimited number of shares authorized, $0.01 par value) | | | 6,761,312 | | | | 832,575 | | | | 1,818,879 | |
| Net asset value price per share* | | $ | 22.20 | | | $ | 10.38 | | | $ | 9.32 | |
| Maximum sales charge - Class A shares | | | 5.75 | % | | | 4.75 | % | | | 2.00 | % |
| Maximum offering price per share (100%/(100%-maximum sales charge) of net asset value adjusted to the nearest cent) - Class A shares | | $ | 23.55 | | | $ | 10.90 | | | $ | 9.51 | |
| | | | | | | | | | | | | |
| Pricing of Class C Shares | | | | | | | | | | | | |
| Net assets applicable to Class C shares | | $ | 1,376,370 | | | $ | 2,812,948 | | | $ | 7,960,773 | |
| Shares of beneficial interest outstanding (unlimited number of shares authorized, $0.01 par value) | | | 62,697 | | | | 271,493 | | | | 854,472 | |
| Net asset value and offering price per share** | | $ | 21.95 | | | $ | 10.36 | | | $ | 9.32 | |
| | | | | | | | | | | | | |
| Pricing of Class Y Shares | | | | | | | | | | | | |
| Net assets applicable to Class Y shares | | $ | 3,079,699 | | | $ | 49,483,652 | | | $ | 206,313,263 | |
| Shares of beneficial interest outstanding (unlimited number of shares authorized, $0.01 par value) | | | 138,506 | | | | 4,762,506 | | | | 22,144,692 | |
| Net asset value, offering price and redemption price per share | | $ | 22.24 | | | $ | 10.39 | | | $ | 9.32 | |
| | | | | | | | | | | | | |
| Pricing of Class Z Shares | | | | | | | | | | | | |
| Net assets applicable to Class Z shares | | $ | — | | | $ | — | | | $ | 245,252,289 | |
| Shares of beneficial interest outstanding (unlimited number of shares authorized, $0.01 par value) | | | — | | | | — | | | | 26,324,223 | |
| Net asset value, offering price and redemption price per share | | $ | — | | | $ | — | | | $ | 9.32 | |
| | | | | | | | | | | | | |
| Pricing of Institutional Class Shares | | | | | | | | | | | | |
| Net assets applicable to Institutional Class Shares | | $ | 23,739,731 | | | $ | 166,007,913 | | | $ | 142,912,559 | |
| Shares of beneficial interest outstanding (unlimited number of shares authorized, $0.01 par value) | | | 1,068,389 | | | | 15,979,371 | | | | 15,339,559 | |
| Net asset value, offering price and redemption price per share | | $ | 22.22 | | | $ | 10.39 | | | $ | 9.32 | |
* There is no sales load on subscriptions of $1 million or more. Redemptions that were part of a $1 million or more subscription may be subject to a contingent deferred sales load if redeemed within a one-year period from the date of purchase.
** Redemption price per share varies by length of time shares are held due to the terms of the contingent deferred sales charge.
See accompanying Notes to Financial Statements.
89
| | Statements of Operations
For the Year Ended September 30, 2016 |
| | | | | | Touchstone | | | | | | | |
| | | | | | Emerging | | | Touchstone | | | Touchstone | |
| | | Touchstone | | | Markets Small | | | Merger | | | Mid | |
| | | Arbitrage | | | Cap | | | Arbitrage | | | Cap | |
| | | Fund | | | Fund | | | Fund | | | Fund | |
| Investment Income | | | | | | | | | | | | | | | | |
| Dividends (A) | | $ | 1,938,600 | | | $ | 492,337 | | | $ | 2,544,802 | | | $ | 11,777,116 | |
| Interest | | | 249,005 | | | | — | | | | 1,011,566 | | | | — | |
| Income from securities loaned | | | 19,976 | | | | 6,110 | | | | — | | | | 55,375 | |
| Total Investment Income | | | 2,207,581 | | | | 498,447 | | | | 3,556,368 | | | | 11,832,491 | |
| Expenses | | | | | | | | | | | | | | | | |
| Investment advisory fees | | | 1,327,181 | | | | 405,474 | | | | 2,103,187 | | | | 5,567,483 | |
| Administration fees | | | 183,277 | | | | 56,131 | | | | 290,440 | | | | 1,028,047 | |
| Compliance fees and expenses | | | 2,849 | | | | 2,849 | | | | 2,849 | | | | 2,849 | |
| Custody fees | | | 29,756 | | | | 187,625 | | | | 39,812 | | | | 17,908 | |
| Professional fees | | | 32,040 | | | | 80,616 | | | | 33,710 | | | | 51,240 | |
| Transfer Agent fees, Class A | | | 13,201 | | | | 9,337 | | | | 19,146 | | | | 58,643 | |
| Transfer Agent fees, Class C | | | 5,824 | | | | 3,328 | | | | 15,000 | | | | 77,599 | |
| Transfer Agent fees, Class Y | | | 82,683 | | | | 16,705 | | | | 77,365 | | | | 505,259 | |
| Transfer Agent fees, Class Z | | | — | | | | — | | | | — | | | | 29,848 | |
| Transfer Agent fees, Institutional Class | | | 228 | | | | 4,290 | | | | 3,693 | | | | 12,009 | |
| Registration Fees, Class A | | | 16,209 | | | | 15,402 | | | | 15,208 | | | | 16,414 | |
| Registration Fees, Class C | | | 7,518 | | | | 10,277 | | | | 10,248 | | | | 17,452 | |
| Registration Fees, Class Y | | | 18,589 | | | | 15,582 | | | | 16,048 | | | | 42,196 | |
| Registration Fees, Class Z | | | — | | | | — | | | | — | | | | 16,917 | |
| Registration Fees, Institutional Class | | | 3,195 | | | | 13,088 | | | | 10,094 | | | | 8,448 | |
| Dividend expense on securities sold short | | | 1,170,758 | | | | — | | | | 1,271,415 | | | | — | |
| Interest expense on securities sold short | | | 248,849 | | | | — | | | | 402,797 | | | | — | |
| Reports to Shareholders, Class A | | | 6,363 | | | | 6,333 | | | | 5,888 | | | | 11,305 | |
| Reports to Shareholders, Class C | | | 6,184 | | | | 6,081 | | | | 6,627 | | | | 13,667 | |
| Reports to Shareholders, Class Y | | | 13,905 | | | | 5,962 | | | | 7,321 | | | | 68,691 | |
| Reports to Shareholders, Class Z | | | — | | | | — | | | | — | | | | 8,671 | |
| Reports to Shareholders, Institutional Class | | | 5,582 | | | | 5,831 | | | | 5,518 | | | | 6,080 | |
| Shareholder servicing fees, Class Z | | | — | | | | — | | | | — | | | | 53,918 | |
| Distribution expenses, Class A | | | 23,329 | | | | 6,384 | | | | 47,945 | | | | 143,874 | |
| Distribution and shareholder servicing expenses, Class C | | | 85,969 | | | | 11,149 | | | | 166,933 | | | | 612,840 | |
| Trustee fees | | | 16,289 | | | | 16,289 | | | | 16,289 | | | | 16,289 | |
| Other expenses | | | 17,374 | | | | 40,128 | | | | 23,757 | | | | 46,507 | |
| Total Expenses | | | 3,317,152 | | | | 918,861 | | | | 4,591,290 | | | | 8,434,154 | |
| Fees waived and/or reimbursed by the Advisor and/or Affiliates(B) | | | (35,383 | ) | | | (371,480 | ) | | | (8,474 | ) | | | (657,760 | ) |
| Net Expenses | | | 3,281,769 | | | | 547,381 | | | | 4,582,816 | | | | 7,776,394 | |
| Net Investment Income (Loss) | | | (1,074,188 | ) | | | (48,934 | ) | | | (1,026,448 | ) | | | 4,056,097 | |
| Realized and Unrealized Gains (Losses) on Investments | | | | | | | | | | | | | | | | |
| Net realized gains (losses) on investments | | | 5,978,550 | | | | (50,451,125 | ) | | | 7,596,517 | | | | 17,791,453 | |
| Net realized gains on foreign currency transactions | | | 447,353 | | | | 27,799 | | | | 443,744 | | | | — | |
| Net realized gains on written options | | | 397,435 | | | | — | | | | 612,699 | | | | — | |
| Net realized gains (losses) on securities sold short | | | 293,161 | | | | — | | | | (741,626 | ) | | | — | |
| Net change in unrealized appreciation (depreciation) on investments(C) | | | 2,267,134 | | | | 60,484,561 | | | | 2,974,617 | | | | 55,983,037 | |
| Net change in unrealized appreciation (depreciation) on foreign currency transactions | | | 68,830 | | | | 40,839 | | | | 69,013 | | | | — | |
| Net change in unrealized appreciation (depreciation) on written options | | | 350,312 | | | | — | | | | 611,306 | | | | — | |
| Net change in unrealized appreciation (depreciation) on securities sold short | | | (1,771,364 | ) | | | — | | | | (1,351,616 | ) | | | — | |
| Net Realized and Unrealized Gains on Investments | | | 8,031,411 | | | | 10,102,074 | | | | 10,214,654 | | | | 73,774,490 | |
| Change in Net Assets Resulting from Operations | | $ | 6,957,223 | | | $ | 10,053,140 | | | $ | 9,188,206 | | | $ | 77,830,587 | |
| (A) Net of foreign tax withholding of: | | $ | 2,581 | | | $ | 42,694 | | | $ | 2,945 | | | $ | — | |
| (B) See Note 4 in Notes to Financial Statements. | | | | | | | | | | | | | | | | |
| (C) Includes change in deferred foreign capital gains tax of: | | $ | — | | | $ | 18,178 | | | $ | — | | | $ | — | |
See accompanying Notes to Financial Statements.
90
| Statements of Operations (Continued) | |
| Touchstone | | | Touchstone | | | Touchstone | | | | |
| Mid Cap | | | Premium | | | Sands Capital | | | Touchstone | |
| Value | | | Yield Equity | | | Select Growth | | | Small Cap | |
| Fund | | | Fund | | | Fund | | | Fund | |
| | | | | | | | | | | |
| $ | 6,935,177 | | | $ | 5,640,050 | | | $ | 9,293,302 | | | $ | 8,874,619 | |
| | — | | | | — | | | | — | | | | — | |
| | 32,120 | | | | — | | | | 1,020,366 | | | | 130,431 | |
| | 6,967,297 | | | | 5,640,050 | | | | 10,313,668 | | | | 9,005,050 | |
| | | | | | | | | | | | | | | |
| | 3,084,251 | | | | 1,023,138 | | | | 22,940,604 | | | | 5,543,019 | |
| | 551,588 | | | | 217,084 | | | | 5,843,408 | | | | 945,574 | |
| | 2,849 | | | | 2,849 | | | | 2,849 | | | | 2,849 | |
| | 18,385 | | | | 11,051 | | | | 93,379 | | | | 23,317 | |
| | 34,279 | | | | 27,127 | | | | 165,629 | | | | 45,449 | |
| | 14,825 | | | | 36,407 | | | | 166,971 | | | | 70,238 | |
| | 3,001 | | | | 24,111 | | | | 119,276 | | | | 18,447 | |
| | 254,411 | | | | 98,969 | | | | 2,279,631 | | | | 307,588 | |
| | — | | | | — | | | | 1,503,954 | | | | — | |
| | 43,272 | | | | — | | | | — | | | | 55,100 | |
| | 15,291 | | | | 16,408 | | | | 18,342 | | | | 15,702 | |
| | 9,420 | | | | 13,944 | | | | 16,368 | | | | 13,043 | |
| | 22,022 | | | | 19,415 | | | | 111,617 | | | | 39,017 | |
| | — | | | | — | | | | 44,086 | | | | — | |
| | 16,282 | | | | — | | | | — | | | | 19,315 | |
| | — | | | | — | | | | — | | | | — | |
| | — | | | | — | | | | — | | | | — | |
| | 6,795 | | | | 8,182 | | | | 18,180 | | | | 8,417 | |
| | 6,121 | | | | 8,041 | | | | 17,063 | | | | 7,473 | |
| | 36,891 | | | | 17,515 | | | | 195,254 | | | | 50,195 | |
| | — | | | | — | | | | 99,989 | | | | — | |
| | 9,340 | | | | — | | | | — | | | | 7,139 | |
| | — | | | | — | | | | 2,290,399 | | | | — | |
| | 26,125 | | | | 71,610 | | | | 454,827 | | | | 125,074 | |
| | 24,180 | | | | 277,012 | | | | 1,394,841 | | | | 181,733 | |
| | 16,289 | | | | 16,289 | | | | 16,289 | | | | 16,289 | |
| | 36,877 | | | | 20,133 | | | | 199,580 | | | | 42,176 | |
| | 4,232,494 | | | | 1,909,285 | | | | 37,992,536 | | | | 7,537,154 | |
| | (476,709 | ) | | | (138,887 | ) | | | (831,974 | ) | | | (92,604 | ) |
| | 3,755,785 | | | | 1,770,398 | | | | 37,160,562 | | | | 7,444,550 | |
| | 3,211,512 | | | | 3,869,652 | | | | (26,846,894 | ) | | | 1,560,500 | |
| | | | | | | | | | | | | | | |
| | 14,992,172 | | | | (1,237,607 | ) | | | 461,133,830 | | | | (60,975,970 | ) |
| | — | | | | — | | | | — | | | | — | |
| | — | | | | — | | | | — | | | | — | |
| | — | | | | — | | | | — | | | | — | |
| | | | | | | | | | | | | | | |
| | 48,991,829 | | | | 20,365,252 | | | | (201,305,875 | ) | | | 89,708,679 | |
| | | | | | | | | | | | | | | |
| | — | | | | — | | | | — | | | | — | |
| | | | | | | | | | | | | | | |
| | — | | | | — | | | | — | | | | — | |
| | | | | | | | | | | | | | | |
| | — | | | | — | | | | — | | | | — | |
| | 63,984,001 | | | | 19,127,645 | | | | 259,827,955 | | | | 28,732,709 | |
| $ | 67,195,513 | | | $ | 22,997,297 | | | $ | 232,981,061 | | | $ | 30,293,209 | |
| $ | — | | | $ | 66,456 | | | $ | 54,986 | | | $ | 55 | |
| | | | | | | | | | | | | | | |
| $ | — | | | $ | — | | | $ | — | | | $ | — | |
91
| | Statements of Operations (Continued) |
| | | | | | | | | Touchstone | |
| | | Touchstone | | | Touchstone | | | Ultra Short | |
| | | Small Cap | | | Total Return | | | Duration | |
| | | Value | | | Bond | | | Fixed Income | |
| | | Fund | | | Fund | | | Fund | |
| Investment Income | | | | | | | | | | | | |
| Dividends (A) | | $ | 1,826,567 | | | $ | 24,100 | | | $ | 1,209 | |
| Interest | | | — | | | | 6,349,509 | | | | 10,277,781 | |
| Income from securities loaned | | | 27,069 | | | | 378 | | | | — | |
| Total Investment Income | | | 1,853,636 | | | | 6,373,987 | | | | 10,278,990 | |
| Expenses | | | | | | | | | | | | |
| Investment advisory fees | | | 685,757 | | | | 713,723 | | | | 1,444,677 | |
| Administration fees | | | 110,483 | | | | 295,685 | | | | 837,913 | |
| Compliance fees and expenses | | | 2,849 | | | | 2,849 | | | | 2,849 | |
| Custody fees | | | 14,176 | | | | 9,303 | | | | 40,161 | |
| Professional fees | | | 24,766 | | | | 31,081 | | | | 44,519 | |
| Transfer Agent fees, Class A | | | 103,919 | | | | 10,077 | | | | 9,131 | |
| Transfer Agent fees, Class C | | | 3,261 | | | | 2,189 | | | | 6,289 | |
| Transfer Agent fees, Class Y | | | 7,221 | | | | 47,171 | | | | 176,344 | |
| Transfer Agent fees, Class Z | | | — | | | | — | | | | 196,147 | |
| Transfer Agent fees, Institutional Class | | | 176 | | | | 64,779 | | | | 5,351 | |
| Registration Fees, Class A | | | 15,845 | | | | 11,172 | | | | 15,464 | |
| Registration Fees, Class C | | | 7,849 | | | | 8,466 | | | | 18,945 | |
| Registration Fees, Class Y | | | 7,896 | | | | 21,428 | | | | 20,147 | |
| Registration Fees, Class Z | | | — | | | | — | | | | 32,138 | |
| Registration Fees, Institutional Class | | | 5,015 | | | | 16,687 | | | | 15,496 | |
| Reports to Shareholders, Class A | | | 12,097 | | | | 5,519 | | | | 5,970 | |
| Reports to Shareholders, Class C | | | 6,471 | | | | 5,648 | | | | 5,833 | |
| Reports to Shareholders, Class Y | | | 6,367 | | | | 6,021 | | | | 13,146 | |
| Reports to Shareholders, Class Z | | | — | | | | — | | | | 20,349 | |
| Reports to Shareholders, Institutional Class | | | 11,693 | | | | 6,485 | | | | 5,616 | |
| Shareholder servicing fees, Class Z | | | — | | | | — | | | | 589,721 | |
| Distribution expenses, Class A | | | 119,477 | | | | 14,804 | | | | 26,422 | |
| Distribution and shareholder servicing expenses, Class C | | | 14,158 | | | | 25,100 | | | | 64,649 | |
| Trustee fees | | | 16,289 | | | | 16,289 | | | | 16,289 | |
| Other expenses | | | 18,436 | | | | 40,516 | | | | 109,514 | |
| Total Expenses | | | 1,194,201 | | | | 1,354,992 | | | | 3,723,080 | |
| Fees waived and/or reimbursed by the Advisor and/or Affiliates(B) | | | (234,463 | ) | | | (235,052 | ) | | | (552,999 | ) |
| Net Expenses | | | 959,738 | | | | 1,119,940 | | | | 3,170,081 | |
| Net Investment Income | | | 893,898 | | | | 5,254,047 | | | | 7,108,909 | |
| Realized and Unrealized Gains (Losses) on Investments | | | | | | | | | | | | |
| Net realized gains (losses) on investments | | | (6,960,047 | ) | | | (45,495 | ) | | | 10,953 | |
| Net change in unrealized appreciation (depreciation) on investments | | | 14,496,319 | | | | 4,436,944 | | | | 1,127,268 | |
| Net Realized and Unrealized Gains on Investments | | | 7,536,272 | | | | 4,391,449 | | | | 1,138,221 | |
| Change in Net Assets Resulting from Operations | | $ | 8,430,170 | | | $ | 9,645,496 | | | $ | 8,247,130 | |
| (A) Net of foreign tax withholding of: | | $ | 976 | | | $ | — | | | $ | — | |
| (B) See Note 4 in Notes to Financial Statements. | | | | | | | | | | | | |
See accompanying Notes to Financial Statements.
92
This page intentionally left blank.
| | Statements of Changes in Net Assets |
| | | Touchstone | | | Touchstone | |
| | | Arbitrage | | | Emerging Markets | |
| | | Fund | | | Small Cap Fund | |
| | | For the | | | For the | | | For the | | | For the | |
| | | Year Ended | | | Year Ended | | | Year Ended | | | Year Ended | |
| | | September 30, | | | September 30, | | | September 30, | | | September 30, | |
| | | 2016 | | | 2015 | | | 2016 | | | 2015 | |
| From Operations | | | | | | | | | | | | | | | | |
| Net investment income (loss) | | $ | (1,074,188 | ) | | $ | (938,277 | ) | | $ | (48,934 | ) | | $ | 3,303,542 | |
| Net realized gains (losses) on investments, foreign currency transactions, written options and securities sold short | | | 7,116,499 | | | | 1,964,712 | | | | (50,423,326 | ) | | | (8,542,947 | ) |
| Net change in unrealized appreciation (depreciation) on investments, foreign currency transactions, written options and securities sold short | | | 914,912 | | | | 284,658 | | | | 60,525,400 | | | | (67,458,307 | ) |
| Change in Net Assets from Operations | | | 6,957,223 | | | | 1,311,093 | | | | 10,053,140 | | | | (72,697,712 | ) |
| Distributions to Shareholders from: | | | | | | | | | | | | | | | | |
| Net investment income, Class A | | | (17,509 | ) | | | — | | | | (188,269 | ) | | | (24,587 | ) |
| Net investment income, Class C | | | (6,332 | ) | | | — | | | | (82,074 | ) | | | — | |
| Net investment income, Class Y | | | (287,174 | ) | | | — | | | | (620,411 | ) | | | (871,078 | ) |
| Net investment income, Class Z | | | — | | | | — | | | | — | | | | — | |
| Net investment income, Institutional Class | | | (31,972 | ) | | | — | | | | (1,728,009 | ) | | | (2,505,846 | ) |
| Net realized gains, Class A | | | (154,157 | ) | | | (33,828 | ) | | | — | | | | — | |
| Net realized gains, Class C | | | (131,554 | ) | | | (16,826 | ) | | | — | | | | — | |
| Net realized gains, Class Y | | | (1,293,949 | ) | | | (167,228 | ) | | | — | | | | — | |
| Net realized gains, Institutional Class | | | (133,669 | ) | | | (70,593 | ) | | | — | | | | — | |
| Total Distributions | | | (2,056,316 | ) | | | (288,475 | ) | | | (2,618,763 | ) | | | (3,401,511 | ) |
| | | | | | | | | | | | | | | | | |
| Net Increase (Decrease) from Share Transactions(A) | | | 23,078,874 | | | | (72,683,275 | ) | | | (258,177,711 | ) | | | (12,246,077 | ) |
| | | | | | | | | | | | | | | | | |
| Total Increase (Decrease) in Net Assets | | | 27,979,781 | | | | (71,660,657 | ) | | | (250,743,334 | ) | | | (88,345,300 | ) |
| | | | | | | | | | | | | | | | | |
| Net Assets | | | | | | | | | | | | | | | | |
| Beginning of period | | | 125,528,799 | | | | 197,189,456 | | | | 259,494,979 | | | | 347,840,279 | |
| End of period | | $ | 153,508,580 | | | $ | 125,528,799 | | | $ | 8,751,645 | | | $ | 259,494,979 | |
| Accumulated Net Investment Income (Loss) | | $ | (131,773 | ) | | $ | 3,548 | | | $ | (120,063 | ) | | $ | 2,568,970 | |
(A) For details on share transactions by class, see Statements of Changes in Net Assets - Capital Stock Activity in pages 100-102.
See accompanying Notes to Financial Statements.
94
| Statements of Changes in Net Assets (Continued) | |
| Touchstone | | | Touchstone | | | Touchstone | |
| Merger Arbitrage | | | Mid Cap | | | Mid Cap | |
| Fund | | | Fund | | | Value Fund | |
| For the | | | For the | | | For the | | | For the | | | For the | | | For the | |
| Year Ended | | | Year Ended | | | Year Ended | | | Year Ended | | | Year Ended | | | Year Ended | |
| September 30, | | | September 30, | | | September 30, | | | September 30, | | | September 30, | | | September 30, | |
| 2016 | | | 2015 | | | 2016 | | | 2015 | | | 2016 | | | 2015 | |
| | | | | | | | | | | | | | | | | | | | | | | |
| $ | (1,026,448 | ) | | $ | (2,534,206 | ) | | $ | 4,056,097 | | | $ | 460,582 | | | $ | 3,211,512 | | | $ | 3,025,444 | |
| | | | | | | | | | | | | | | | | | | | | | | |
| | 7,911,334 | | | | 1,857,492 | | | | 17,791,453 | | | | 12,577,383 | | | | 14,992,172 | | | | 21,967,422 | |
| | | | | | | | | | | | | | | | | | | | | | | |
| | 2,303,320 | | | | 4,479,870 | | | | 55,983,037 | | | | (49,885,177 | ) | | | 48,991,829 | | | | (27,750,574 | ) |
| | 9,188,206 | | | | 3,803,156 | | | | 77,830,587 | | | | (36,847,212 | ) | | | 67,195,513 | | | | (2,757,708 | ) |
| | | | | | | | | | | | | | | | | | | | | | | |
| | — | | | | — | | | | — | | | | — | | | | (69,498 | ) | | | (48,181 | ) |
| | — | | | | — | | | | — | | | | — | | | | — | | | | — | |
| | — | | | | — | | | | (302,705 | ) | | | (609,061 | ) | | | (1,918,693 | ) | | | (1,725,242 | ) |
| | — | | | | — | | | | (1,361 | ) | | | — | | | | — | | | | — | |
| | — | | | | — | | | | (61,198 | ) | | | (258,983 | ) | | | (1,444,479 | ) | | | (1,326,235 | ) |
| | — | | | | (270,079 | ) | | | — | | | | — | | | | (466,658 | ) | | | (376,327 | ) |
| | — | | | | (136,421 | ) | | | — | | | | — | | | | (117,202 | ) | | | (76,516 | ) |
| | — | | | | (654,494 | ) | | | — | | | | — | | | | (12,371,938 | ) | | | (7,781,541 | ) |
| | — | | | | (505,070 | ) | | | — | | | | — | | | | (6,757,290 | ) | | | (5,200,105 | ) |
| | — | | | | (1,566,064 | ) | | | (365,264 | ) | | | (868,044 | ) | | | (23,145,758 | ) | | | (16,534,147 | ) |
| | | | | | | | | | | | | | | | | | | | | | | |
| | (28,687,623 | ) | | | (220,660,915 | ) | | | (91,734,050 | ) | | | 292,015,815 | | | | 118,340,157 | | | | (1,870,672 | ) |
| | | | | | | | | | | | | | | | | | | | | | | |
| | (19,499,417 | ) | | | (218,423,823 | ) | | | (14,268,727 | ) | | | 254,300,559 | | | | 162,389,912 | | | | (21,162,527 | ) |
| | | | | | | | | | | | | | | | | | | | | | | |
| | 212,261,255 | | | | 430,685,078 | | | | 700,283,750 | | | | 445,983,191 | | | | 342,532,115 | | | | 363,694,642 | |
| $ | 192,761,838 | | | $ | 212,261,255 | | | $ | 686,015,023 | | | $ | 700,283,750 | | | $ | 504,922,027 | | | $ | 342,532,115 | |
| $ | (123,559 | ) | | $ | (837,461 | ) | | $ | 3,651,860 | | | $ | (38,973 | ) | | $ | 52,237 | | | $ | 80,839 | |
95
| | Statements of Changes in Net Assets (Continued) |
| | | | | | | | | Touchstone | |
| | | Touchstone | | | Sands Capital | |
| | | Premium Yield | | | Select Growth | |
| | | Equity Fund | | | Fund | |
| | | For the | | | For the | | | For the | | | For the | |
| | | Year Ended | | | Year Ended | | | Year Ended | | | Year Ended | |
| | | September 30, | | | September 30, | | | September 30, | | | September 30, | |
| | | 2016 | | | 2015 | | | 2016 | | | 2015 | |
| From Operations | | | | | | | | | | | | | | | | |
| Net investment income (loss) | | $ | 3,869,652 | | | $ | 5,109,522 | | | $ | (26,846,894 | ) | | $ | (30,444,851 | ) |
| Net realized gain (losses) on investments | | | (1,237,607 | ) | | | 10,215,915 | | | | 461,133,830 | | | | 448,220,268 | |
| Net change in unrealized appreciation (depreciation) on investments | | | 20,365,252 | | | | (36,402,981 | ) | | | (201,305,875 | ) | | | (606,231,963 | ) |
| Change in Net Assets from Operations | | | 22,997,297 | | | | (21,077,544 | ) | | | 232,981,061 | | | | (188,456,546 | ) |
| Distributions to Shareholders from: | | | | | | | | | | | | | | | | |
| Net investment income, Class A | | | (732,361 | ) | | | (1,240,585 | ) | | | — | | | | — | |
| Net investment income, Class C | | | (504,463 | ) | | | (681,106 | ) | | | — | | | | — | |
| Net investment income, Class Y | | | (2,622,164 | ) | | | (3,439,427 | ) | | | — | | | | — | |
| Net investment income, Institutional Class | | | — | | | | — | | | | — | | | | — | |
| Net realized gains, Class A | | | (2,086,246 | ) | | | (2,197,270 | ) | | | (19,790,200 | ) | | | (14,093,187 | ) |
| Net realized gains, Class C | | | (2,029,563 | ) | | | (1,531,929 | ) | | | (15,311,943 | ) | | | (10,111,362 | ) |
| Net realized gains, Class Y | | | (6,140,759 | ) | | | (5,137,668 | ) | | | (278,000,457 | ) | | | (183,460,195 | ) |
| Net realized gains, Class Z | | | — | | | | — | | | | (112,244,362 | ) | | | (90,266,864 | ) |
| Net realized gains, Institutional Class | | | — | | | | — | | | | — | | | | — | |
| Total Distributions | | | (14,115,556 | ) | | | (14,227,985 | ) | | | (425,346,962 | ) | | | (297,931,608 | ) |
| | | | | | | | | | | | | | | | | |
| Net Increase (Decrease) from Share Transactions(A) | | | (24,439,466 | ) | | | 17,989,598 | | | | (1,455,227,653 | ) | | | (897,050,296 | ) |
| | | | | | | | | | | | | | | | | |
| Total Increase (Decrease) in Net Assets | | | (15,557,725 | ) | | | (17,315,931 | ) | | | (1,647,593,554 | ) | | | (1,383,438,450 | ) |
| | | | | | | | | | | | | | | | | |
| Net Assets | | | | | | | | | | | | | | | | |
| Beginning of period | | | 168,198,883 | | | | 185,514,814 | | | | 4,885,631,159 | | | | 6,269,069,609 | |
| End of period | | $ | 152,641,158 | | | $ | 168,198,883 | | | $ | 3,238,037,605 | | | $ | 4,885,631,159 | |
| Accumulated Net Investment Income (Loss) | | $ | 208,614 | | | $ | 163,737 | | | $ | (17,640,732 | ) | | $ | (21,615,887 | ) |
(A) For details on share transactions by class, see Statements of Changes in Net Assets - Capital Stock Activity on pages 102-104.
See accompanying Notes to Financial Statements.
96
| Statements of Changes in Net Assets (Continued) | |
| Touchstone | | | Touchstone | | | Touchstone | |
| Small Cap | | | Small Cap | | | Total Return | |
| Fund | | | Value Fund | | | Bond Fund | |
| For the | | | For the | | | For the | | | For the | | | For the | | | For the | |
| Year Ended | | | Year Ended | | | Year Ended | | | Year Ended | | | Year Ended | | | Year Ended | |
| September 30, | | | September 30, | | | September 30, | | | September 30, | | | September 30, | | | September 30, | |
| 2016 | | | 2015 | | | 2016 | | | 2015 | | | 2016 | | | 2015 | |
| | | | | | | | | | | | | | | | | | | | | | | |
| $ | 1,560,500 | | | $ | 7,960,852 | | | $ | 893,898 | | | $ | 1,208,039 | | | $ | 5,254,047 | | | $ | 4,225,533 | |
| | (60,975,970 | ) | | | 83,192,630 | | | | (6,960,047 | ) | | | 3,657,420 | | | | (45,495 | ) | | | 656,088 | |
| | | | | | | | | | | | | | | | | | | | | | | |
| | 89,708,679 | | | | (141,878,468 | ) | | | 14,496,319 | | | | (9,186,442 | ) | | | 4,436,944 | | | | (786,185 | ) |
| | 30,293,209 | | | | (50,724,986 | ) | | | 8,430,170 | | | | (4,320,983 | ) | | | 9,645,496 | | | | 4,095,436 | |
| | | | | | | | | | | | | | | | | | | | | | | |
| | (459,982 | ) | | | (4,964 | ) | | | (438,953 | ) | | | (456,935 | ) | | | (155,483 | ) | | | (152,519 | ) |
| | (26,741 | ) | | | — | | | | (8,814 | ) | | | (14,424 | ) | | | (47,330 | ) | | | (38,190 | ) |
| | (3,110,979 | ) | | | (146,568 | ) | | | (59,822 | ) | | | (139,413 | ) | | | (1,269,095 | ) | | | (808,571 | ) |
| | (2,961,769 | ) | | | (212,904 | ) | | | (378,488 | ) | | | (583,324 | ) | | | (4,538,220 | ) | | | (4,108,293 | ) |
| | (6,403,253 | ) | | | (4,610,591 | ) | | | (865,953 | ) | | | (1,209,646 | ) | | | — | | | | — | |
| | (2,276,849 | ) | | | (2,081,129 | ) | | | (49,306 | ) | | | (80,833 | ) | | | — | | | | — | |
| | (33,435,598 | ) | | | (23,363,113 | ) | | | (150,398 | ) | | | (346,677 | ) | | | — | | | | — | |
| | — | | | | — | | | | — | | | | — | | | | — | | | | — | |
| | (29,370,263 | ) | | | (29,583,949 | ) | | | (792,852 | ) | | | (1,174,928 | ) | | | — | | | | — | |
| | (78,045,434 | ) | | | (60,003,218 | ) | | | (2,744,586 | ) | | | (4,006,180 | ) | | | (6,010,128 | ) | | | (5,107,573 | ) |
| | | | | | | | | | | | | | | | | | | | | | | |
| | (68,552,191 | ) | | | 40,547,715 | | | | 116,149,710 | | | | (8,100,551 | ) | | | 40,563,136 | | | | 41,178,974 | |
| | | | | | | | | | | | | | | | | | | | | | | |
| | (116,304,416 | ) | | | (70,180,489 | ) | | | 121,835,294 | | | | (16,427,714 | ) | | | 44,198,504 | | | | 40,166,837 | |
| | | | | | | | | | | | | | | | | | | | | | | |
| | 719,823,863 | | | | 790,004,352 | | | | 56,441,845 | | | | 72,869,559 | | | | 182,745,369 | | | | 142,578,532 | |
| $ | 603,519,447 | | | $ | 719,823,863 | | | $ | 178,277,139 | | | $ | 56,441,845 | | | $ | 226,943,873 | | | $ | 182,745,369 | |
| $ | 1,744,841 | | | $ | 6,559,385 | | | $ | 39,218 | | | $ | 39,687 | | | $ | 138,900 | | | $ | 32,933 | |
97
| | Statements of Changes in Net Assets (Continued) |
| | | Touchstone | |
| | | Ultra Short | |
| | | Duration Fixed | |
| | | Income Fund | |
| | | For the | | | For the | |
| | | Year Ended | | | Year Ended | |
| | | September 30, | | | September 30, | |
| | | 2016 | | | 2015 | |
| From Operations | | | | | | | | |
| Net investment income | | $ | 7,108,909 | | | $ | 3,959,419 | |
| Net realized gains (losses) on investments | | | 10,953 | | | | (68,741 | ) |
| Net change in unrealized appreciation (depreciation) on investments | | | 1,127,268 | | | | (1,301,049 | ) |
| Change in Net Assets from Operations | | | 8,247,130 | | | | 2,589,629 | |
| Distributions to Shareholders from: | | | | | | | | |
| Net investment income, Class A | | | (138,872 | ) | | | (120,421 | ) |
| Net investment income, Class C | | | (73,201 | ) | | | (73,655 | ) |
| Net investment income, Class Y | | | (3,408,667 | ) | | | (3,184,693 | ) |
| Net investment income, Class Z | | | (3,136,351 | ) | | | (4,319,849 | ) |
| Net investment income, Institutional Class | | | (1,706,659 | ) | | | (801,753 | ) |
| Total Distributions | | | (8,463,750 | ) | | | (8,500,371 | ) |
| | | | | | | | | |
| Net Increase (Decrease) from Share Transactions(A) | | | 46,236,958 | | | | (140,181,440 | ) |
| | | | | | | | | |
| Total Increase (Decrease) in Net Assets | | | 46,020,338 | | | | (146,092,182 | ) |
| | | | | | | | | |
| Net Assets | | | | | | | | |
| Beginning of period | | | 573,364,314 | | | | 719,456,496 | |
| End of period | | $ | 619,384,652 | | | $ | 573,364,314 | |
| Accumulated Net Investment Income | | $ | 314,261 | | | $ | 462,446 | |
(A) For details on share transactions by class, see Statements of Changes in Net Assets - Capital Stock Activity on page 105.
See accompanying Notes to Financial Statements.
98
This page intentionally left blank.
| | Statements of Changes in Net Assets - Capital Stock Activity |
| | | Touchstone Arbitrage Fund | | | Touchstone Emerging
Markets Small Cap Fund | |
| | | For the Year
Ended
September 30, 2016 | | | For the Year
Ended
September 30, 2015 | | | For the Year
Ended
September 30, 2016 | | | For the Year
Ended
September 30, 2015 | |
| | | Shares | | | Dollars | | | Shares | | | Dollars | | | Shares | | | Dollars | | | Shares | | | Dollars | |
| Class A | | | | | | | | | | | | | | | | | | | | | | | | | | | | | | | | |
| Proceeds from Shares issued | | | 636,422 | | | $ | 6,496,133 | | | | 697,405 | | | $ | 6,923,936 | | | | 61,377 | | | $ | 526,287 | | | | 186,600 | | | $ | 2,072,169 | |
| Reinvestment of distributions | | | 17,213 | | | | 171,655 | | | | 3,414 | | | | 33,622 | | | | 21,437 | | | | 180,076 | | | | 2,103 | | | | 23,322 | |
| Cost of Shares redeemed | | | (1,765,938 | ) | | | (17,730,722 | ) | | | (920,226 | ) | | | (9,124,998 | ) | | | (157,406 | ) | | | (1,384,545 | ) | | | (313,089 | ) | | | (3,477,526 | ) |
| Change from Class A Share Transactions | | | (1,112,303 | ) | | | (11,062,934 | ) | | | (219,407 | ) | | | (2,167,440 | ) | | | (74,592 | ) | | | (678,182 | ) | | | (124,386 | ) | | | (1,382,035 | ) |
| Class C | | | | | | | | | | | | | | | | | | | | | | | | | | | | | | | | |
| Proceeds from Shares issued | | | 227,699 | | | | 2,258,773 | | | | 237,911 | | | | 2,335,338 | | | | 11,480 | | | | 105,215 | | | | 24,930 | | | | 277,830 | |
| Reinvestment of distributions | | | 13,631 | | | | 133,742 | | | | 1,654 | | | | 16,175 | | | | 9,925 | | | | 82,074 | | | | — | | | | — | |
| Cost of Shares redeemed | | | (344,365 | ) | | | (3,436,570 | ) | | | (484,282 | ) | | | (4,756,438 | ) | | | (96,415 | ) | | | (840,648 | ) | | | (101,198 | ) | | | (1,098,754 | ) |
| Change from Class C Share Transactions | | | (103,035 | ) | | | (1,044,055 | ) | | | (244,717 | ) | | | (2,404,925 | ) | | | (75,010 | ) | | | (653,359 | ) | | | (76,268 | ) | | | (820,924 | ) |
| Class Y | | | | | | | | | | | | | | | | | | | | | | | | | | | | | | | | |
| Proceeds from Shares issued | | | 5,014,120 | | | | 51,434,095 | | | | 4,068,067 | | | | 40,496,482 | | | | 642,770 | | | | 5,876,947 | | | | 1,430,819 | | | | 15,269,883 | |
| Reinvestment of distributions | | | 155,458 | | | | 1,559,811 | | | | 16,744 | | | | 165,594 | | | | 73,578 | | | | 618,052 | | | | 79,179 | | | | 870,970 | |
| Cost of Shares redeemed | | | (2,203,090 | ) | | | (22,478,967 | ) | | | (7,205,496 | ) | | | (71,751,279 | ) | | | (7,901,441 | ) | | | (72,245,185 | ) | | | (2,896,992 | ) | | | (31,709,119 | ) |
| Change from Class Y Share Transactions | | | 2,966,488 | | | | 30,514,939 | | | | (3,120,685 | ) | | | (31,089,203 | ) | | | (7,185,093 | ) | | | (65,750,186 | ) | | | (1,386,994 | ) | | | (15,568,266 | ) |
| Class Z | | | | | | | | | | | | | | | | | | | | | | | | | | | | | | | | |
| Proceeds from Shares issued | | | — | | | | — | | | | — | | | | — | | | | — | | | | — | | | | — | | | | — | |
| Reinvestment of distributions | | | — | | | | — | | | | — | | | | — | | | | — | | | | — | | | | — | | | | — | |
| Cost of Shares redeemed | | | — | | | | — | | | | — | | | | — | | | | — | | | | — | | | | — | | | | — | |
| Change from Class Z Share Transactions | | | — | | | | — | | | | — | | | | — | | | | — | | | | — | | | | — | | | | — | |
| Institutional Class | | | | | | | | | | | | | | | | | | | | | | | | | | | | | | | | |
| Proceeds from Shares issued | | | 1,249,780 | | | | 12,808,253 | | | | 220,191 | | | | 2,220,455 | | | | 453,173 | | | | 3,882,643 | | | | 4,709,785 | | | | 52,209,046 | |
| Reinvestment of distributions | | | 16,462 | | | | 165,641 | | | | 7,123 | | | | 70,593 | | | | 197,701 | | | | 1,644,874 | | | | 227,026 | | | | 2,497,286 | |
| Cost of Shares redeemed | | | (816,893 | ) | | | (8,302,970 | ) | | | (3,968,913 | ) | | | (39,312,755 | ) | | | (20,875,902 | ) | | | (196,623,501 | ) | | | (4,751,637 | ) | | | (49,181,184 | ) |
| Change from Institutional Class Share Transactions | | | 449,349 | | | | 4,670,924 | | | | (3,741,599 | ) | | | (37,021,707 | ) | | | (20,225,028 | ) | | | (191,095,984 | ) | | | 185,174 | | | | 5,525,148 | |
| | | | | | | | | | | | | | | | | | | | | | | | | | | | | | | | | |
| Change from Share Transactions | | | 2,200,499 | | | $ | 23,078,874 | | | | (7,326,408 | ) | | $ | (72,683,275 | ) | | | (27,559,723 | ) | | $ | (258,177,711 | ) | | | (1,402,474 | ) | | $ | (12,246,077 | ) |
See accompanying Notes to Financial Statements.
100
| Statements of Changes in Net Assets - Capital Stock Activity (Continued) | |
| Touchstone Merger Arbitrage Fund | | | Touchstone Mid Cap Fund | |
For the Year
Ended
September 30, 2016 | | | For the Year
Ended
September 30, 2015 | | | For the Year
Ended
September 30, 2016 | | | For the Year
Ended
September 30, 2015 | |
| Shares | | | Dollars | | | Shares | | | Dollars | | | Shares | | | Dollars | | | Shares | | | Dollars | |
| | | | | | | | | | | | | | | | | | | | | | | | | | | | | | | |
| | 395,192 | | | $ | 4,243,218 | | | | 317,995 | | | $ | 3,355,747 | | | | 690,963 | | | $ | 16,958,049 | | | | 1,699,189 | | | $ | 43,125,179 | |
| | — | | | | — | | | | 24,939 | | | | 261,605 | | | | — | | | | — | | | | — | | | | — | |
| | (1,041,709 | ) | | | (11,242,430 | ) | | | (7,506,278 | ) | | | (78,939,832 | ) | | | (1,344,791 | ) | | | (32,261,785 | ) | | | (497,769 | ) | | | (12,575,317 | ) |
| | | | | | | | | | | | | | | | | | | | | | | | | | | | | | | |
| | (646,517 | ) | | | (6,999,212 | ) | | | (7,163,344 | ) | | | (75,322,480 | ) | | | (653,828 | ) | | | (15,303,736 | ) | | | 1,201,420 | | | | 30,549,862 | |
| | | | | | | | | | | | | | | | | | | | | | | | | | | | | | | |
| | 25,575 | | | | 269,111 | | | | 21,898 | | | | 225,663 | | | | 493,383 | | | | 11,515,804 | | | | 1,235,605 | | | | 30,223,772 | |
| | — | | | | — | | | | 13,289 | | | | 136,208 | | | | — | | | | — | | | | — | | | | — | |
| | (521,358 | ) | | | (5,450,169 | ) | | | (1,671,980 | ) | | | (17,160,505 | ) | | | (813,813 | ) | | | (18,986,298 | ) | | | (318,653 | ) | | | (7,658,547 | ) |
| | | | | | | | | | | | | | | | | | | | | | | | | | | | | | | |
| | (495,783 | ) | | | (5,181,058 | ) | | | (1,636,793 | ) | | | (16,798,634 | ) | | | (320,430 | ) | | | (7,470,494 | ) | | | 916,952 | | | | 22,565,225 | |
| | | | | | | | | | | | | | | | | | | | | | | | | | | | | | | |
| | 1,400,121 | | | | 15,261,513 | | | | 1,632,792 | | | | 17,296,230 | | | | 7,186,523 | | | | 176,426,122 | | | | 13,034,302 | | | | 335,664,826 | |
| | — | | | | — | | | | 59,302 | | | | 626,234 | | | | 9,378 | | | | 226,837 | | | | 14,093 | | | | 358,948 | |
| | (2,032,901 | ) | | | (22,066,584 | ) | | | (10,245,967 | ) | | | (108,541,694 | ) | | | (9,559,803 | ) | | | (239,131,360 | ) | | | (3,623,295 | ) | | | (91,336,205 | ) |
| | | | | | | | | | | | | | | | | | | | | | | | | | | | | | | |
| | (632,780 | ) | | | (6,805,071 | ) | | | (8,553,873 | ) | | | (90,619,230 | ) | | | (2,363,902 | ) | | | (62,478,401 | ) | | | 9,425,100 | | | | 244,687,569 | |
| | | | | | | | | | | | | | | | | | | | | | | | | | | | | | | |
| | — | | | | — | | | | — | | | | — | | | | 653,874 | | | | 15,736,708 | | | | 794,664 | | | | 19,940,900 | |
| | — | | | | — | | | | — | | | | — | | | | 57 | | | | 1,361 | | | | — | | | | — | |
| | — | | | | — | | | | — | | | | — | | | | (728,737 | ) | | | (17,272,179 | ) | | | (477,159 | ) | | | (11,756,957 | ) |
| | | | | | | | | | | | | | | | | | | | | | | | | | | | | | | |
| | — | | | | — | | | | — | | | | — | | | | (74,806 | ) | | | (1,534,110 | ) | | | 317,505 | | | | 8,183,943 | |
| | | | | | | | | | | | | | | | | | | | | | | | | | | | | | | |
| | 718,753 | | | | 7,858,014 | | | | 1,842,775 | | | | 19,481,278 | | | | 1,263,355 | | | | 32,341,689 | | | | 443,808 | | | | 11,248,537 | |
| | — | | | | — | | | | 43,999 | | | | 465,514 | | | | 1,800 | | | | 43,567 | | | | 7,316 | | | | 186,413 | |
| | (1,610,541 | ) | | | (17,560,296 | ) | | | (5,434,586 | ) | | | (57,867,363 | ) | | | (1,556,379 | ) | | | (37,332,565 | ) | | | (1,004,121 | ) | | | (25,405,734 | ) |
| | | | | | | | | | | | | | | | | | | | | | | | | | | | | | |
| | (891,788 | ) | | | (9,702,282 | ) | | | (3,547,812 | ) | | | (37,920,571 | ) | | | (291,224 | ) | | | (4,947,309 | ) | | | (552,997 | ) | | | (13,970,784 | ) |
| | | | | | | | | | | | | | | | | | | | | | | | | | | | | | |
| | (2,666,868 | ) | | $ | (28,687,623 | ) | | | (20,901,822 | ) | | $ | (220,660,915 | ) | | | (3,704,190 | ) | | $ | (91,734,050 | ) | | | 11,307,980 | | | $ | 292,015,815 | |
101
| | Statements of Changes in Net Assets - Capital Stock Activity (Continued) |
| | | Touchstone Mid Cap Value Fund | | | Touchstone Premium Yield Equity Fund | |
| | | For the Year
Ended
September 30, 2016 | | | For the Year
Ended
September 30, 2015 | | | For the Year
Ended
September 30, 2016 | | | For the Year
Ended
September 30, 2015 | |
| | | Shares | | | Dollars | | | Shares | | | Dollars | | | Shares | | | Dollars | | | Shares | | | Dollars | |
| Class A | | | | | | | | | | | | | | | | | | | | | | | | | | | | | | | | |
| Proceeds from Shares issued | | | 895,554 | | | $ | 15,389,896 | | | | 154,790 | | | $ | 2,609,534 | | | | 893,980 | | | $ | 7,265,127 | | | | 1,698,528 | | | $ | 16,405,724 | |
| Reinvestment of distributions | | | 33,498 | | | | 513,921 | | | | 24,707 | | | | 405,472 | | | | 321,003 | | | | 2,457,627 | | | | 334,440 | | | | 3,162,900 | |
| Cost of Shares redeemed | | | (167,163 | ) | | | (2,768,421 | ) | | | (536,569 | ) | | | (9,007,319 | ) | | | (2,501,557 | ) | | | (20,481,758 | ) | | | (2,197,894 | ) | | | (20,728,402 | ) |
| Change from Class A Share Transactions | | | 761,889 | | | | 13,135,396 | | | | (357,072 | ) | | | (5,992,313 | ) | | | (1,286,574 | ) | | | (10,759,004 | ) | | | (164,926 | ) | | | (1,159,778 | ) |
| Class C | | | | | | | | | | | | | | | | | | | | | | | | | | | | | | | | |
| Proceeds from Shares issued | | | 159,177 | | | | 2,622,368 | | | | 33,065 | | | | 553,321 | | | | 240,470 | | | | 1,977,576 | | | | 1,092,280 | | | | 10,483,333 | |
| Reinvestment of distributions | | | 7,245 | | | | 108,314 | | | | 4,467 | | | | 72,235 | | | | 297,727 | | | | 2,267,553 | | | | 202,879 | | | | 1,912,977 | |
| Cost of Shares redeemed | | | (42,291 | ) | | | (668,664 | ) | | | (46,335 | ) | | | (771,881 | ) | | | (1,395,315 | ) | | | (11,204,814 | ) | | | (620,690 | ) | | | (5,816,648 | ) |
| Change from Class C Share Transactions | | | 124,131 | | | | 2,062,018 | | | | (8,803 | ) | | | (146,325 | ) | | | (857,118 | ) | | | (6,959,685 | ) | | | 674,469 | | | | 6,579,662 | |
| Class Y | | | | | | | | | | | | | | | | | | | | | | | | | | | | | | | | |
| Proceeds from Shares issued | | | 5,770,403 | | | | 98,377,196 | | | | 3,429,721 | | | | 58,072,725 | | | | 5,449,973 | | | | 44,567,862 | | | | 5,230,685 | | | | 49,314,434 | |
| Reinvestment of distributions | | | 912,703 | | | | 14,062,747 | | | | 565,498 | | | | 9,334,998 | | | | 1,055,348 | | | | 8,111,513 | | | | 809,706 | | | | 7,630,116 | |
| Cost of Shares redeemed | | | (3,240,894 | ) | | | (52,471,504 | ) | | | (3,569,354 | ) | | | (60,449,696 | ) | | | (7,288,142 | ) | | | (59,400,152 | ) | | | (4,787,404 | ) | | | (44,374,836 | ) |
| Change from Class Y Share Transactions | | | 3,442,212 | | | | 59,968,439 | | | | 425,865 | | | | 6,958,027 | | | | (782,821 | ) | | | (6,720,777 | ) | | | 1,252,987 | | | | 12,569,714 | |
| Class Z | | | | | | | | | | | | | | | | | | | | | | | | | | | | | | | | |
| Proceeds from Shares issued | | | — | | | | — | | | | — | | | | — | | | | — | | | | — | | | | — | | | | — | |
| Reinvestment of distributions | | | — | | | | — | | | | — | | | | — | | | | — | | | | — | | | | — | | | | — | |
| Cost of Shares redeemed | | | — | | | | — | | | | — | | | | — | | | | — | | | | — | | | | — | | | | — | |
| Change from Class Z Share Transactions | | | — | | | | — | | | | — | | | | — | | | | — | | | | — | | | | — | | | | — | |
| Institutional Class | | | | | | | | | | | | | | | | | | | | | | | | | | | | | | | | |
| Proceeds from Shares issued | | | 6,959,601 | | | | 115,342,356 | | | | 2,461,723 | | | | 41,633,362 | | | | — | | | | — | | | | — | | | | — | |
| Reinvestment of distributions | | | 300,454 | | | | 4,672,213 | | | | 269,644 | | | | 4,472,681 | | | | — | | | | — | | | | — | | | | — | |
| Cost of Shares redeemed | | | (4,592,736 | ) | | | (76,840,265 | ) | | | (2,879,594 | ) | | | (48,796,104 | ) | | | — | | | | — | | | | — | | | | — | |
| Change from Institutional Class Share Transactions | | | 2,667,319 | | | | 43,174,304 | | | | (148,227 | ) | | | (2,690,061 | ) | | | — | | | | — | | | | — | | | | — | |
| | | | | | | | | | | | | | | | | | | | | | | | | | | | | | | | | |
| Change from Share Transactions | | | 6,995,551 | | | $ | 118,340,157 | | | | (88,237 | ) | | $ | (1,870,672 | ) | | | (2,926,513 | ) | | $ | (24,439,466 | ) | | | 1,762,530 | | | $ | 17,989,598 | |
See accompanying Notes to Financial Statements.
102
| Statements of Changes in Net Assets - Capital Stock Activity (Continued) | |
| Touchstone Sands Capital Select Growth Fund | | | Touchstone Small Cap Fund | |
For the Year
Ended
September 30, 2016 | | | For the Year
Ended
September 30, 2015 | | | For the Year
Ended
September 30, 2016 | | | For the Year
Ended
September 30, 2015 | |
| Shares | | | Dollars | | | Shares | | | Dollars | | | Shares | | | Dollars | | | Shares | | | Dollars | |
| | | | | | | | | | | | | | | | | | | | | | | |
| | 1,781,144 | | | $ | 27,608,651 | | | | 3,641,024 | | | $ | 65,559,498 | | | | 403,980 | | | $ | 6,570,669 | | | | 1,922,057 | | | $ | 37,461,873 | |
| | 1,013,500 | | | | 16,469,382 | | | | 632,172 | | | | 11,233,693 | | | | 407,403 | | | | 6,419,574 | | | | 225,866 | | | | 4,210,298 | |
| | (8,227,919 | ) | | | (127,495,191 | ) | | | (6,220,356 | ) | | | (111,540,350 | ) | | | (1,995,355 | ) | | | (32,579,500 | ) | | | (1,559,188 | ) | | | (31,246,980 | ) |
| | | | | | | | | | | | | | | | | | | | | | | | | | | | | | | |
| | (5,433,275 | ) | | | (83,417,158 | ) | | | (1,947,160 | ) | | | (34,747,159 | ) | | | (1,183,972 | ) | | | (19,589,257 | ) | | | 588,735 | | | | 10,425,191 | |
| | | | | | | | | | | | | | | | | | | | | | | | | | | | | | | |
| | 331,830 | | | | 5,104,448 | | | | 517,357 | | | | 8,977,978 | | | | 22,915 | | | | 359,013 | | | | 48,757 | | | | 913,444 | |
| | 719,512 | | | | 11,188,418 | | | | 427,832 | | | | 7,358,711 | | | | 137,154 | | | | 2,078,131 | | | | 100,136 | | | | 1,817,469 | |
| | (4,053,250 | ) | | | (59,099,723 | ) | | | (2,219,652 | ) | | | (38,545,926 | ) | | | (460,139 | ) | | | (7,288,098 | ) | | | (242,220 | ) | | | (4,700,467 | ) |
| | | | | | | | | | | | | | | | | | | | | | | | | | | | | | | |
| | (3,001,908 | ) | | | (42,806,857 | ) | | | (1,274,463 | ) | | | (22,209,237 | ) | | | (300,070 | ) | | | (4,850,954 | ) | | | (93,327 | ) | | | (1,969,554 | ) |
| | | | | | | | | | | | | | | | | | | | | | | | | | | | | | | |
| | 27,425,606 | | | | 434,736,619 | | | | 59,278,345 | | | | 1,111,054,923 | | | | 6,097,043 | | | | 95,431,681 | | | | 6,507,540 | | | | 132,883,759 | |
| | 11,303,725 | | | | 189,677,066 | | | | 6,959,585 | | | | 127,012,426 | | | | 2,083,885 | | | | 33,271,220 | | | | 874,337 | | | | 16,458,603 | |
| | (94,962,088 | ) | | | (1,498,045,256 | ) | | | (64,334,704 | ) | | | (1,186,531,629 | ) | | | (8,854,273 | ) | | | (145,834,007 | ) | | | (3,686,636 | ) | | | (73,725,190 | ) |
| | | | | | | | | | | | | | | | | | | | | | | | | | | | | | | |
| | (56,232,757 | ) | | | (873,631,571 | ) | | | 1,903,226 | | | | 51,535,720 | | | | (673,345 | ) | | | (17,131,106 | ) | | | 3,695,241 | | | | 75,617,172 | |
| | | | | | | | | | | | | | | | | | | | | | | | | | | | | | | |
| | 5,906,679 | | | | 92,270,499 | | | | 13,122,014 | | | | 236,143,567 | | | | — | | | | — | | | | — | | | | — | |
| | 6,855,766 | | | | 111,406,290 | | | | 5,044,388 | | | | 89,638,768 | | | | — | | | | — | | | | — | | | | — | |
| | (43,009,825 | ) | | | (659,048,856 | ) | | | (66,561,196 | ) | | | (1,217,411,955 | ) | | | — | | | | — | | | | — | | | | — | |
| | | | | | | | | | | | | | | | | | | | | | | | | | | | | | | |
| | (30,247,380 | ) | | | (455,372,067 | ) | | | (48,394,794 | ) | | | (891,629,620 | ) | | | — | | | | — | | | | — | | | | — | |
| | | | | | | | | | | | | | | | | | | | | | | | | | | | | | | |
| | — | | | | — | | | | — | | | | — | | | | 6,414,250 | | | | 104,506,111 | | | | 5,353,309 | | | | 107,676,224 | |
| | — | | | | — | | | | — | | | | — | | | | 1,130,473 | | | | 18,036,138 | | | | 978,565 | | | | 18,399,911 | |
| | — | | | | — | | | | — | | | | — | | | | (8,849,233 | ) | | | (149,523,123 | ) | | | (8,489,308 | ) | | | (169,601,229 | ) |
| | | | | | | | | | | | | | | | | | | | | | | | | | | | | | | |
| | — | | | | — | | | | — | | | | — | | | | (1,304,510 | ) | | | (26,980,874 | ) | | | (2,157,434 | ) | | | (43,525,094 | ) |
| | | | | | | | | | | | | | | | | | | | | | | | | | | | | | | |
| | (94,915,320 | ) | | $ | (1,455,227,653 | ) | | | (49,713,191 | ) | | $ | (897,050,296 | ) | | | (3,461,897 | ) | | $ | (68,552,191 | ) | | | 2,033,215 | | | $ | 40,547,715 | |
103
| | Statements of Changes in Net Assets - Capital Stock Activity (Continued) |
| | | Touchstone Small Cap Value Fund | | | Touchstone Total Return Bond Fund | |
| | | For the Year
Ended
September 30, 2016 | | | For the Year
Ended
September 30, 2015 | | | For the Year
Ended
September 30, 2016 | | | For the Year
Ended
September 30, 2015 | |
| | | Shares | | | Dollars | | | Shares | | | Dollars | | | Shares | | | Dollars | | | Shares | | | Dollars | |
| Class A | | | | | | | | | | | | | | | | | | | | | | | | | | | | | | | | |
| Proceeds from Shares issued | | | 5,882,525 | | | $ | 130,027,094 | | | | 39,094 | | | $ | 943,019 | | | | 404,980 | | | $ | 4,176,299 | | | | 464,998 | | | $ | 4,794,879 | |
| Reinvestment of distributions | | | 62,383 | | | | 1,249,310 | | | | 68,652 | | | | 1,602,761 | | | | 10,799 | | | | 110,510 | | | | 12,299 | | | | 126,552 | |
| Cost of Shares redeemed | | | (405,894 | ) | | | (8,670,985 | ) | | | (253,395 | ) | | | (6,025,281 | ) | | | (147,362 | ) | | | (1,505,459 | ) | | | (416,177 | ) | | | (4,311,114 | ) |
| Change from Class A Share Transactions | | | 5,539,014 | | | | 122,605,419 | | | | (145,649 | ) | | | (3,479,501 | ) | | | 268,417 | | | | 2,781,350 | | | | 61,120 | | | | 610,317 | |
| Class C | | | | | | | | | | | | | | | | | | | | | | | | | | | | | | | | |
| Proceeds from Shares issued | | | 8,467 | | | | 169,445 | | | | 8,200 | | | | 194,538 | | | | 139,295 | | | | 1,417,759 | | | | 120,723 | | | | 1,244,614 | |
| Reinvestment of distributions | | | 1,924 | | | | 37,527 | | | | 2,405 | | | | 55,586 | | | | 3,370 | | | | 34,456 | | | | 2,936 | | | | 30,186 | |
| Cost of Shares redeemed | | | (17,559 | ) | | | (366,361 | ) | | | (35,009 | ) | | | (814,026 | ) | | | (103,849 | ) | | | (1,057,076 | ) | | | (50,965 | ) | | | (526,214 | ) |
| Change from Class C Share Transactions | | | (7,168 | ) | | | (159,389 | ) | | | (24,404 | ) | | | (563,902 | ) | | | 38,816 | | | | 395,139 | | | | 72,694 | | | | 748,586 | |
| Class Y | | | | | | | | | | | | | | | | | | | | | | | | | | | | | | | | |
| Proceeds from Shares issued | | | 20,965 | | | | 429,261 | | | | 32,469 | | | | 756,310 | | | | 1,932,957 | | | | 19,881,344 | | | | 4,023,444 | | | | 41,258,943 | |
| Reinvestment of distributions | | | 8,366 | | | | 165,828 | | | | 17,660 | | | | 413,841 | | | | 79,717 | | | | 817,213 | | | | 53,383 | | | | 549,588 | |
| Cost of Shares redeemed | | | (109,569 | ) | | | (2,278,011 | ) | | | (222,703 | ) | | | (5,207,182 | ) | | | (1,145,680 | ) | | | (11,760,046 | ) | | | (2,075,281 | ) | | | (21,366,189 | ) |
| Change from Class Y Share Transactions | | | (80,238 | ) | | | (1,682,922 | ) | | | (172,574 | ) | | | (4,037,031 | ) | | | 866,994 | | | | 8,938,511 | | | | 2,001,546 | | | | 20,442,342 | |
| Class Z | | | | | | | | | | | | | | | | | | | | | | | | | | | | | | | | |
| Proceeds from Shares issued | | | — | | | | — | | | | — | | | | — | | | | — | | | | — | | | | — | | | | — | |
| Reinvestment of distributions | | | — | | | | — | | | | — | | | | — | | | | — | | | | — | | | | — | | | | — | |
| Cost of Shares redeemed | | | — | | | | — | | | | — | | | | — | | | | — | | | | — | | | | — | | | | — | |
| Change from Class Z Share Transactions | | | — | | | | — | | | | — | | | | — | | | | — | | | | — | | | | — | | | | — | |
| Institutional Class | | | | | | | | | | | | | | | | | | | | | | | | | | | | | | | | |
| Proceeds from Shares issued | | | 153,488 | | | | 3,135,912 | | | | 181,436 | | | | 4,287,336 | | | | 6,930,518 | | | | 71,129,405 | | | | 5,199,931 | | | | 53,765,978 | |
| Reinvestment of distributions | | | 58,793 | | | | 1,171,340 | | | | 75,308 | | | | 1,758,252 | | | | 418,347 | | | | 4,287,777 | | | | 392,536 | | | | 4,041,700 | |
| Cost of Shares redeemed | | | (429,978 | ) | | | (8,920,650 | ) | | | (254,262 | ) | | | (6,065,705 | ) | | | (4,589,373 | ) | | | (46,969,046 | ) | | | (3,744,321 | ) | | | (38,429,949 | ) |
| Change from Institutional Class Share Transactions | | | (217,697 | ) | | | (4,613,398 | ) | | | 2,482 | | | | (20,117 | ) | | | 2,759,492 | | | | 28,448,136 | | | | 1,848,146 | | | | 19,377,729 | |
| | | | | | | | | | | | | | | | | | | | | | | | | | | | | | | | | |
| Change from Share Transactions | | | 5,233,911 | | | $ | 116,149,710 | | | | (340,145 | ) | | $ | (8,100,551 | ) | | | 3,933,719 | | | $ | 40,563,136 | | | | 3,983,506 | | | $ | 41,178,974 | |
See accompanying Notes to Financial Statements.
104
| Statements of Changes in Net Assets - Capital Stock Activity (Continued) | |
| Touchstone Ultra Short Duration Fixed Income Fund | | | |
For the Year
Ended
September 30, 2016 | | | For the Year
Ended
September 30, 2015 | | | |
| Shares | | | Dollars | | | Shares | | | Dollars | | | |
| | | | | | | | | | | | | |
| | 1,455,659 | | | $ | 13,554,444 | | | | 527,290 | | | $ | 4,935,752 | | | |
| | 13,073 | | | | 121,660 | | | | 10,396 | | | | 97,320 | | | |
| | (795,071 | ) | | | (7,399,901 | ) | | | (518,482 | ) | | | (4,862,453 | ) | | |
| | | | | | | | | | | | | | | | | |
| | 673,661 | | | | 6,276,203 | | | | 19,204 | | | | 170,619 | | | |
| | | | | | | | | | | | | | | | | |
| | 445,090 | | | | 4,142,012 | | | | 243,405 | | | | 2,278,894 | | | |
| | 5,126 | | | | 47,688 | | | | 5,658 | | | | 52,983 | | | |
| | (484,982 | ) | | | (4,514,193 | ) | | | (557,428 | ) | | | (5,221,331 | ) | | |
| | | | | | | | | | | | | | | | | |
| | (34,766 | ) | | | (324,493 | ) | | | (308,365 | ) | | | (2,889,454 | ) | | |
| | | | | | | | | | | | | | | | | |
| | 16,170,047 | | | | 150,487,329 | | | | 9,248,000 | | | | 86,579,336 | | | |
| | 238,789 | | | | 2,222,199 | | | | 192,324 | | | | 1,800,488 | | | |
| | (15,767,661 | ) | | | (146,728,963 | ) | | | (13,958,645 | ) | | | (130,807,171 | ) | | |
| | | | | | | | | | | | | | | | | |
| | 641,175 | | | | 5,980,565 | | | | (4,518,321 | ) | | | (42,427,347 | ) | | |
| | | | | | | | | | | | | | | | | |
| | 14,233,209 | | | | 132,476,170 | | | | 14,410,836 | | | | 134,971,031 | | | |
| | 333,217 | | | | 3,101,505 | | | | 456,110 | | | | 4,270,605 | | | |
| | (20,909,389 | ) | | | (194,733,929 | ) | | | (24,898,995 | ) | | | (233,301,872 | ) | | |
| | | | | | | | | | | | | | | | | |
| | (6,342,963 | ) | | | (59,156,254 | ) | | | (10,032,049 | ) | | | (94,060,236 | ) | | |
| | | | | | | | | | | | | | | | | |
| | 20,434,716 | | | | 190,239,052 | | | | 3,274,706 | | | | 30,697,794 | | | |
| | 159,277 | | | | 1,481,955 | | | | 64,983 | | | | 608,313 | | | |
| | (10,553,125 | ) | | | (98,260,070 | ) | | | (3,445,073 | ) | | | (32,281,129 | ) | | |
| | | | | | | | | | | | | | | | | |
| | 10,040,868 | | | | 93,460,937 | | | | (105,384 | ) | | | (975,022 | ) | | |
| | | | | | | | | | | | | | | | | |
| | 4,977,975 | | | $ | 46,236,958 | | | | (14,944,915 | ) | | $ | (140,181,440 | ) | | |
105
Touchstone Arbitrage Fund—Class A
Selected Data for a Share Outstanding Throughout Each Period
| | | Year Ended September 30, | |
| | | | 2016 | | | | 2015 | | | | 2014(A) | |
| Net asset value at beginning of period | | $ | 9.93 | | | $ | 9.87 | | | $ | 10.00 | |
| Income (loss) from investments operations: | | | | | | | | | | | | |
| Net investment loss(B) | | | (0.11 | ) | | | (0.08 | ) | | | (0.10 | ) |
| Net realized and unrealized gains (losses) on investments | | | 0.66 | | | | 0.16 | | | | (0.03 | ) |
| Total from investment operations | | | 0.55 | | | | 0.08 | | | | (0.13 | ) |
| Distributions from: | | | | | | | | | | | | |
| Net investment income | | | (0.02 | ) | | | — | | | | — | |
| Realized capital gains | | | (0.15 | ) | | | (0.02 | ) | | | — | |
| Total distributions | | | (0.17 | ) | | | (0.02 | ) | | | — | |
| Net asset value at end of period | | $ | 10.31 | | | $ | 9.93 | | | $ | 9.87 | |
| Total return(C) | | | 5.61% | | | | 0.77% | | | | (1.30% | ) |
| Ratios and supplemental data: | | | | | | | | | | | | |
| Net assets at end of period (000’s) | | $ | 10,003 | | | $ | 20,672 | | | $ | 22,725 | |
| Ratio to average net assets: | | | | | | | | | | | | |
| Net expenses (including dividend and interest expense on securities sold short)(D) | | | 2.80% | | | | 2.42% | | | | 2.51% | |
| Gross expenses (including dividend and interest expense on securities sold short)(E) | | | 3.03% | | | | 2.44% | | | | 2.51% | |
| Net investment loss | | | (1.06% | ) | | | (0.83% | ) | | | (1.01% | ) |
| Portfolio turnover rate | | | 451% | | | | 276% | | | | 293% | |
Touchstone Arbitrage Fund—Class C
Selected Data for a Share Outstanding Throughout Each Period
| | | Year Ended September 30, | |
| | | | 2016 | | | | 2015 | | | | 2014(A) | |
| Net asset value at beginning of period | | $ | 9.80 | | | $ | 9.82 | | | $ | 10.00 | |
| Income (loss) from investments operations: | | | | | | | | | | | | |
| Net investments loss(B) | | | (0.18 | ) | | | (0.15 | ) | | | (0.17 | ) |
| Net realized and unrealized gains (losses) on investments | | | 0.65 | | | | 0.15 | | | | (0.01 | ) |
| Total from investment operations | | | 0.47 | | | | — | | | | (0.18 | ) |
| Distributions from: | | | | | | | | | | | | |
| Net investment income | | | (0.01 | ) | | | — | | | | — | |
| Realized capital gains | | | (0.15 | ) | | | (0.02 | ) | | | — | |
| Total distributions | | | (0.16 | ) | | | (0.02 | ) | | | — | |
| Net asset value at end of period | | $ | 10.11 | | | $ | 9.80 | | | $ | 9.82 | |
| Total return(C) | | | 4.81% | | | | (0.05% | ) | | | (1.80% | ) |
| Ratios and supplemental data: | | | | | | | | | | | | |
| Net assets at end of period (000’s) | | $ | 7,930 | | | $ | 8,694 | | | $ | 11,113 | |
| Ratio to average net assets: | | | | | | | | | | | | |
| Net expenses (including dividend and interest expense on securities sold short)(D) | | | 3.55% | | | | 3.14% | | | | 3.27% | |
| Gross expenses (including dividend and interest expense on securities sold short)(E) | | | 3.62% | | | | 3.14% | | | | 3.29% | |
| Net investment loss | | | (1.81% | ) | | | (1.55% | ) | | | (1.77% | ) |
| Portfolio turnover rate | | | 451% | | | | 276% | | | | 293% | |
| (A) | Represents the period from commencement of operations (October 1, 2013) through September 30, 2014. |
| (B) | The net investment loss per share is based on average shares outstanding for the period. |
| (C) | Total returns shown exclude the effect of applicable sales loads. If these charges were included, the returns would be lower. |
| (D) | The ratio of net expenses to average net assets excluding dividend and interest expense on securities sold short for Class A is 1.68%, 1.68% and 1.67% and for Class C is 2.43%, 2.40% and 2.43% for the years ended September 30, 2016, 2015 and 2014, respectively. |
| (E) | The ratio of gross expenses to average net assets excluding dividend and interest expense on securities sold short for Class A is 1.91%, 1.70% and 1.67% and for Class C is 2.50%, 2.40% and 2.45% for the years ended September 30, 2016, 2015 and 2014, respectively. |
See accompanying Notes to Financial Statements.
106
| Financial Highlights (Continued) | |
Touchstone Arbitrage Fund—Class Y
Selected Data for a Share Outstanding Throughout Each Period
| | | Year Ended September 30, |
| | | | 2016 | | | | 2015 | | | | 2014(A) | |
| Net asset value at beginning of period | | $ | 9.99 | | | $ | 9.91 | | | $ | 10.00 | |
| Income (loss) from investment operations: | | | | | | | | | | | | |
| Net investment loss(B) | | | (0.08 | ) | | | (0.05 | ) | | | (0.07 | ) |
| Net realized and unrealized gains (losses) on investments | | | 0.67 | | | | 0.15 | | | | (0.02 | ) |
| Total from investment operations | | | 0.59 | | | | 0.10 | | | | (0.09 | ) |
| Distributions from: | | | | | | | | | | | | |
| Net investment income | | | (0.03 | ) | | | — | | | | — | |
| Realized capital gains | | | (0.15 | ) | | | (0.02 | ) | | | — | |
| Total distributions | | | (0.18 | ) | | | (0.02 | ) | | | — | |
| Net asset value at end of period | | $ | 10.40 | | | $ | 9.99 | | | $ | 9.91 | |
| Total return | | | 6.00% | | | | 0.97% | | | | (0.90% | ) |
| Ratios and supplemental data: | | | | | | | | | | | | |
| Net assets at end of period (000’s) | | $ | 121,794 | | | $ | 87,427 | | | $ | 117,589 | |
| Ratio to average net assets: | | | | | | | | | | | | |
| Net expenses (including dividend and interest expense on securities sold short)(C) | | | 2.51% | | | | 2.10% | | | | 2.19% | |
| Gross expenses (including dividend and interest expense on securities sold short(D) | | | 2.51% | | | | 2.10% | | | | 2.19% | |
| Net investment loss | | | (0.77% | ) | | | (0.51% | ) | | | (0.69% | ) |
| Portfolio turnover rate | | | 451% | | | | 276% | | | | 293% | |
Touchstone Arbitrage Fund—Institutional Class
Selected Data for a Share Outstanding Throughout Each Period
| | | Year Ended September 30, | |
| | | | 2016 | | | | 2015 | | | | 2014(A) | |
| Net asset value at beginning of period | | $ | 10.01 | | | $ | 9.92 | | | $ | 10.00 | |
| Income (loss) from investment operations: | | | | | | | | | | | | |
| Net investment loss(B) | | | (0.07 | ) | | | (0.04 | ) | | | (0.06 | ) |
| Net realized and unrealized gains (losses) on investments | | | 0.68 | | | | 0.15 | | | | (0.02 | ) |
| Total from investment operations | | | 0.61 | | | | 0.11 | | | | (0.08 | ) |
| Distributions from: | | | | | | | | | | | | |
| Net investment income | | | (0.04 | ) | | | — | | | | — | |
| Realized capital gains | | | (0.15 | ) | | | (0.02 | ) | | | — | |
| Total distributions | | | (0.19 | ) | | | (0.02 | ) | | | — | |
| Net asset value at end of period | | $ | 10.43 | | | $ | 10.01 | | | $ | 9.92 | |
| Total return | | | 6.12% | | | | 1.06% | | | | (0.80% | ) |
| Ratios and supplemental data: | | | | | | | | | | | | |
| Net assets at end of period (000’s) | | $ | 13,782 | | | $ | 8,735 | | | $ | 47,763 | |
| Ratio to average net assets: | | | | | | | | | | | | |
| Net expenses (including dividend and interest expense on securities sold short)(C) | | | 2.40% | | | | 2.02% | | | | 2.12% | |
| Gross expenses (including dividend and interest expense on securities sold short)(D) | | | 2.48% | | | | 2.03% | | | | 2.12% | |
| Net investment loss | | | (0.66% | ) | | | (0.43% | ) | | | (0.62% | ) |
| Portfolio turnover rate | | | 451% | | | | 276% | | | | 293% | |
| (A) | Represents the period from commencement of operations (October 1, 2013) through September 30, 2014. |
| (B) | The net investment loss per share is based on average shares outstanding for the period. |
| (C) | The ratio of net expenses to average net assets excluding dividend and interest expense on securities sold short for Class Y is 1.39%, 1.36% and 1.35% and for Institutional Class is 1.28%, 1.28% and 1.28% for the years ended September 30, 2016, 2015 and 2014, respectively. |
| (D) | The ratio of gross expenses to average net assets excluding dividend and interest expense on securities sold short for Class Y is 1.39%, 1.36% and 1.35% and for Institutional Class is 1.36%, 1.29% and 1.28% for the years ended September 30, 2016, 2015 and 2014, respectively. |
See accompanying Notes to Financial Statements.
107
| | Financial Highlights (Continued) |
Touchstone Emerging Markets Small Cap Fund—Class A
Selected Data for a Share Outstanding Throughout Each Period
| | | Year Ended September 30, | |
| | | 2016 | | | 2015 | | | 2014 | | | 2013 | | | 2012 | |
| Net asset value at beginning of period | | $ | 9.15 | | | $ | 11.67 | | | $ | 11.52 | | | $ | 12.24 | | | $ | 10.69 | |
| Income (loss) from investment operations: | | | | | | | | | | | | | | | | | | | | |
| Net investment income (loss) | | | (0.03 | )(A) | | | 0.07 | (A) | | | 0.09 | (A) | | | 0.09 | (A) | | | 0.11 | |
| Net realized and unrealized gains (losses) on investments | | | 0.87 | | | | (2.53 | ) | | | 0.09 | | | | (0.80 | ) | | | 1.68 | |
| Total from investment operations | | | 0.84 | | | | (2.46 | ) | | | 0.18 | | | | (0.71 | ) | | | 1.79 | |
| Distributions from: | | | | | | | | | | | | | | | | | | | | |
| Net investment income | | | (0.70 | ) | | | (0.06 | ) | | | (0.03 | ) | | | (0.01 | ) | | | (0.15 | ) |
| Realized capital gains | | | — | | | | — | | | | — | | | | — | | | | (0.09 | ) |
| Total distributions | | | (0.70 | ) | | | (0.06 | ) | | | (0.03 | ) | | | (0.01 | ) | | | (0.24 | ) |
| Net asset value at end of period | | $ | 9.29 | | | $ | 9.15 | | | $ | 11.67 | | | $ | 11.52 | | | $ | 12.24 | |
| Total return(B) | | | 10.01% | | | | (21.18% | ) | | | 1.61% | | | | (5.69% | ) | | | 16.71% | |
| Ratios and supplemental data: | | | | | | | | | | | | | | | | | | | | |
| Net assets at end of period (000’s) | | $ | 2,376 | | | $ | 3,022 | | | $ | 5,307 | | | $ | 9,843 | | | $ | 34,369 | |
| Ratio to average net assets: | | | | | | | | | | | | | | | | | | | | |
| Net expenses | | | 1.69% | | | | 1.69% | | | | 1.69% | | | | 1.69% | | | | 1.72% | |
| Gross expenses | | | 3.51% | | | | 2.41% | | | | 2.20% | | | | 1.93% | | | | 1.99% | |
| Net investment income (loss) | | | (0.40% | ) | | | 0.66% | | | | 0.75% | | | | 0.71% | | | | 0.94% | |
| Portfolio turnover rate | | | 68% | | | | 28% | | | | 38% | | | | 25% | | | | 33% | (C) |
Touchstone Emerging Markets Small Cap Fund—Class C
Selected Data for a Share Outstanding Throughout Each Period
| | | Year Ended September 30, | |
| | | 2016 | | | 2015 | | | 2014 | | | 2013 | | | 2012 | |
| Net asset value at beginning of period | | $ | 8.94 | | | $ | 11.43 | | | $ | 11.33 | | | $ | 12.13 | | | $ | 10.54 | |
| Income gain (loss) from investment operations: | | | | | | | | | | | | | | | | | | | | |
| Net investment income (loss) | | | (0.10 | )(A) | | | (0.01 | )(A) | | | (— | )(A)(D) | | | (— | )(A)(D) | | | 0.04 | |
| Net realized and unrealized gains (losses) on investments | | | 0.86 | | | | (2.48 | ) | | | 0.10 | | | | (0.80 | ) | | | 1.64 | |
| Total from investment operations | | | 0.76 | | | | (2.49 | ) | | | 0.10 | | | | (0.80 | ) | | | 1.68 | |
| Distributions from: | | | | | | | | | | | | | | | | | | | | |
| Net investment income | | | (0.60 | ) | | | — | | | | — | | | | — | | | | — | (D) |
| Realized capital gains | | | — | | | | — | | | | — | | | | — | | | | (0.09 | ) |
| Total distributions | | | (0.60 | ) | | | — | | | | — | | | | — | | | | (0.09 | ) |
| Net asset value at end of period | | $ | 9.10 | | | $ | 8.94 | | | $ | 11.43 | | | $ | 11.33 | | | $ | 12.13 | |
| Total return(B) | | | 9.18% | | | | (21.79% | ) | | | 0.88% | | | | (6.44% | ) | | | 15.84% | |
| Ratios and supplemental data: | | | | | | | | | | | | | | | | | | | | |
| Net assets at end of period (000’s) | | $ | 912 | | | $ | 1,566 | | | $ | 2,874 | | | $ | 3,719 | | | $ | 4,903 | |
| Ratio to average net assets: | | | | | | | | | | | | | | | | | | | | |
| Net expenses | | | 2.44% | | | | 2.44% | | | | 2.44% | | | | 2.44% | | | | 2.47% | |
| Gross expenses | | | 4.80% | | | | 3.19% | | | | 3.03% | | | | 2.84% | | | | 2.85% | |
| Net investment income (loss) | | | (1.15% | ) | | | (0.09% | ) | | | (0.00% | )(D) | | | (0.04% | ) | | | 0.19% | |
| Portfolio turnover rate | | | 68% | | | | 28% | | | | 38% | | | | 25% | | | | 33% | (C) |
| (A) | The net investment income (loss) per share is based on average shares outstanding for the period. |
| (B) | Total returns shown exclude the effect of applicable sales loads. If these charges were included, the returns would be lower. |
| (C) | Portfolio turnover excludes the purchases and sales of the Touchstone Emerging Markets Equity Fund II acquired on September 17, 2012. If these transactions were included, portfolio turnover would have been higher. |
| (D) | Less than $0.005 per share or 0.005%. |
See accompanying Notes to Financial Statements.
108
| Financial Highlights (Continued) | |
Touchstone Emerging Markets Small Cap Fund—Class Y
Selected Data for a Share Outstanding Throughout Each Period
| | | Year Ended September 30, |
| | | 2016 | | | 2015 | | | 2014 | | | 2013 | | | 2012 | |
| Net asset value at beginning of period | | $ | 9.10 | | | $ | 11.63 | | | $ | 11.54 | | | $ | 12.27 | | | $ | 10.74 | |
| Income (loss) from investment operations: | | | | | | | | | | | | | | | | | | | | |
| Net investment income (loss) | | | (0.01 | )(A) | | | 0.10 | (A) | | | 0.12 | (A) | | | 0.13 | (A) | | | 0.14 | |
| Net realized and unrealized gains (losses) on investments | | | 0.88 | | | | (2.52 | ) | | | 0.10 | | | | (0.81 | ) | | | 1.70 | |
| Total from investment operations | | | 0.87 | | | | (2.42 | ) | | | 0.22 | | | | (0.68 | ) | | | 1.84 | |
| Distributions from: | | | | | | | | | | | | | | | | | | | | |
| Net investment income | | | (0.65 | ) | | | (0.11 | ) | | | (0.13 | ) | | | (0.05 | ) | | | (0.22 | ) |
| Realized capital gains | | | — | | | | — | | | | — | | | | — | | | | (0.09 | ) |
| Total distributions | | | (0.65 | ) | | | (0.11 | ) | | | (0.13 | ) | | | (0.05 | ) | | | (0.31 | ) |
| Net asset value at end of period | | $ | 9.32 | | | $ | 9.10 | | | $ | 11.63 | | | $ | 11.54 | | | $ | 12.27 | |
| Total return | | | 10.37% | | | | (20.98% | ) | | | 1.99% | | | | (5.45% | ) | | | 17.12% | |
| Ratios and supplemental data: | | | | | | | | | | | | | | | | | | | | |
| Net assets at end of period (000’s) | | $ | 4,796 | | | $ | 70,066 | | | $ | 105,641 | | | $ | 138,451 | | | $ | 219,717 | |
| Ratio to average net assets: | | | | | | | | | | | | | | | | | | | | |
| Net expenses | | | 1.44% | | | | 1.40% | | | | 1.38% | | | | 1.37% | | | | 1.41% | |
| Gross expenses | | | 2.27% | | | | 1.40% | | | | 1.38% | | | | 1.35% | | | | 1.44% | |
| Net investment income (loss) | | | (0.15% | ) | | | 0.95% | | | | 1.06% | | | | 1.04% | | | | 1.25% | |
| Portfolio turnover rate | | | 68% | | | | 28% | | | | 38% | | | | 25% | | | | 33% | (B) |
Touchstone Emerging Markets Small Cap Fund—Institutional Class
Selected Data for a Share Outstanding Throughout Each Period
| | | Year Ended September 30, |
| | | 2016 | | | 2015 | | | 2014 | | | 2013 | | | 2012 | |
| Net asset value at beginning of period | | $ | 9.11 | | | $ | 11.64 | | | $ | 11.55 | | | $ | 12.28 | | | $ | 10.76 | |
| Income (loss) from investment operations: | | | | | | | | | | | | | | | | | | | | |
| Net investment income (loss) | | | (— | )(A)(C) | | | 0.12 | (A) | | | 0.13 | (A) | | | 0.14 | (A) | | | 0.18 | |
| Net realized and unrealized gains (losses) on investments | | | 0.88 | | | | (2.53 | ) | | | 0.11 | | | | (0.81 | ) | | | 1.67 | |
| Total from investment operations | | | 0.88 | | | | (2.41 | ) | | | 0.24 | | | | (0.67 | ) | | | 1.85 | |
| Distributions from: | | | | | | | | | | | | | | | | | | | | |
| Net investment income | | | (0.75 | ) | | | (0.12 | ) | | | (0.15 | ) | | | (0.06 | ) | | | (0.24 | ) |
| Realized capital gains | | | — | | | | — | | | | — | | | | — | | | | (0.09 | ) |
| Total distributions | | | (0.75 | ) | | | (0.12 | ) | | | (0.15 | ) | | | (0.06 | ) | | | (0.33 | ) |
| Net asset value at end of period | | $ | 9.24 | | | $ | 9.11 | | | $ | 11.64 | | | $ | 11.55 | | | $ | 12.28 | |
| Total return | | | 10.52% | | | | (20.87% | ) | | | 2.13% | | | | (5.43% | ) | | | 17.28% | |
| Ratios and supplemental data: | | | | | | | | | | | | | | | | | | | | |
| Net assets at end of period (000’s) | | $ | 667 | | | $ | 184,841 | | | $ | 234,019 | | | $ | 218,523 | | | $ | 271,186 | |
| Ratio to average net assets: | | | | | | | | | | | | | | | | | | | | |
| Net expenses | | | 1.29% | | | | 1.29% | | | | 1.29% | | | | 1.29% | | | | 1.32% | |
| Gross expenses | | | 2.16% | | | | 1.33% | | | | 1.31% | | | | 1.29% | | | | 1.37% | |
| Net investment income (loss) | | | (0.00% | )(C) | | | 1.06% | | | | 1.15% | | | | 1.11% | | | | 1.34% | |
| Portfolio turnover rate | | | 68% | | | | 28% | | | | 38% | | | | 25% | | | | 33% | (B) |
| (A) | The net investment income (loss) per share is based on average shares outstanding for the period. |
| (B) | Portfolio turnover excludes the purchases and sales of the Touchstone Emerging Markets Equity Fund II acquired on September 17, 2012. If these transactions were included, portfolio turnover would have been higher. |
| (C) | Less than $0.005 per share or 0.005%. |
See accompanying Notes to Financial Statements.
109
| | Financial Highlights (Continued) |
Touchstone Merger Arbitrage Fund—Class A
Selected Data for a Share Outstanding Throughout Each Period
| | | Year Ended September 30, |
| | | 2016 | | | 2015 | | | 2014 | | | 2013 | | | 2012 | |
| Net asset value at beginning of period | | $ | 10.54 | | | $ | 10.49 | | | $ | 11.05 | | | $ | 10.65 | | | $ | 10.02 | |
| Income (loss) from investment operations: | | | | | | | | | | | | | | | | | | | | |
| Net investment income (loss)(A) | | | (0.08 | ) | | | (0.11 | ) | | | (0.13 | ) | | | 0.07 | | | | (0.09 | ) |
| Net realized and unrealized gains (losses) on investments | | | 0.54 | | | | 0.21 | | | | (0.05 | ) | | | 0.44 | | | | 0.73 | |
| Total from investment operations | | | 0.46 | | | | 0.10 | | | | (0.18 | ) | | | 0.51 | | | | 0.64 | |
| Distributions from: | | | | | | | | | | | | | | | | | | | | |
| Net investment income | | | — | | | | — | | | | (0.05 | ) | | | — | | | | (— | )(B) |
| Realized capital gains | | | — | | | | (0.05 | ) | | | (0.33 | ) | | | (0.11 | ) | | | (0.01 | ) |
| Total distributions | | | — | | | | (0.05 | ) | | | (0.38 | ) | | | (0.11 | ) | | | (0.01 | ) |
| Net asset value at end of period | | $ | 11.00 | | | $ | 10.54 | | | $ | 10.49 | | | $ | 11.05 | | | $ | 10.65 | |
| Total return(C) | | | 4.37% | | | | 0.92% | | | | (1.75% | ) | | | 4.84% | | | | 6.35% | |
| Ratios and supplemental data: | | | | | | | | | | | | | | | | | | | | |
| Net assets at end of period (000’s) | | $ | 15,711 | | | $ | 21,858 | | | $ | 96,916 | | | $ | 275,858 | | | $ | 150,148 | |
| Ratio to average net assets: | | | | | | | | | | | | | | | | | | | | |
| Net expenses (including dividend and interest expense on securities sold short)(D) | | | 2.52% | | | | 2.47% | | | | 2.52% | | | | 2.27% | | | | 1.96% | |
| Gross expenses (including dividend and interest expense on securities sold short)(E) | | | 2.55% | | | | 2.47% | | | | 2.52% | | | | 2.27% | | | | 1.97% | |
| Net investment income (loss) | | | (0.74% | ) | | | (0.99% | ) | | | (1.25% | ) | | | 0.65% | | | | (0.90% | ) |
| Portfolio turnover rate | | | 400% | | | | 227% | | | | 271% | | | | 288% | | | | 307% | |
| (A) | The net investment income (loss) per share is based on average shares outstanding for the period. |
| (B) | Less than $0.005 per share. |
| (C) | Total returns shown exclude the effect of applicable sales loads. If these charges were included, the returns would be lower. |
| (D) | The ratio of net expenses to average net assets excluding dividend and interest expense on securities sold short is 1.68%, 1.60%, 1.57%, 1.64% and 1.65% for the years ended September 30, 2016, 2015, 2014, 2013 and 2012, respectively. |
| (E) | The ratio of gross expenses to average net assets excluding dividend and interest expense on securities sold short is 1.71%, 1.60%, 1.57%, 1.64% and 1.66% for the years ended September 30, 2016, 2015, 2014, 2013 and 2012, respectively. |
See accompanying Notes to Financial Statements.
110
| Financial Highlights (Continued) | |
Touchstone Merger Arbitrage Fund—Class C
Selected Data for a Share Outstanding Throughout Each Period
| | | Year Ended September 30, |
| | | 2016 | | | 2015 | | | 2014 | | | 2013 | | | 2012 | |
| Net asset value at beginning of period | | $ | 10.22 | | | $ | 10.26 | | | $ | 10.85 | | | $ | 10.54 | | | $ | 10.01 | |
| Income (loss) from investment operations: | | | | | | | | | | | | | | | | | | | | |
| Net investment loss(A) | | | (0.16 | ) | | | (0.18 | ) | | | (0.22 | ) | | | (0.01 | ) | | | (0.17 | ) |
| Net realized and unrealized gains (losses) on investments | | | 0.54 | | | | 0.19 | | | | (0.04 | ) | | | 0.43 | | | | 0.71 | |
| Total from investment operations | | | 0.38 | | | | 0.01 | | | | (0.26 | ) | | | 0.42 | | | | 0.54 | |
| Distributions from: | | | | | | | | | | | | | | | | | | | | |
| Net investment income | | | — | | | | �� | | | | — | | | | — | | | | (— | )(B) |
| Realized capital gains | | | — | | | | (0.05 | ) | | | (0.33 | ) | | | (0.11 | ) | | | (0.01 | ) |
| Total distributions | | | — | | | | (0.05 | ) | | | (0.33 | ) | | | (0.11 | ) | | | (0.01 | ) |
| Net asset value at end of period | | $ | 10.60 | | | $ | 10.22 | | | $ | 10.26 | | | $ | 10.85 | | | $ | 10.54 | |
| Total return(C) | | | 3.62% | | | | 0.06% | | | | (2.51% | ) | | | 3.93% | | | | 5.56% | |
| Ratios and supplemental data: | | | | | | | | | | | | | | | | | | | | |
| Net assets at end of period (000’s) | | $ | 14,300 | | | $ | 18,868 | | | $ | 35,737 | | | $ | 50,001 | | | $ | 25,739 | |
| Ratio to average net assets: | | | | | | | | | | | | | | | | | | | | |
| Net expenses (including dividend and interest expense on securities sold short)(D) | | | 3.27% | | | | 3.26% | | | | 3.32% | | | | 3.05% | | | | 2.74% | |
| Gross expenses (including dividend and interest expense on securities sold short)(E) | | | 3.28% | | | | 3.26% | | | | 3.32% | | | | 3.05% | | | | 2.75% | |
| Net investment loss | | | (1.49% | ) | | | (1.79% | ) | | | (2.05% | ) | | | (0.13% | ) | | | (1.68% | ) |
| Portfolio turnover rate | | | 400% | | | | 227% | | | | 271% | | | | 288% | | | | 307% | |
| (A) | The net investment loss per share is based on average shares outstanding for the period. |
| (B) | Less than $0.005 per share. |
| (C) | Total returns shown exclude the effect of applicable sales loads. If these charges were included, the returns would be lower. |
| (D) | The ratio of net expenses to average net assets excluding dividend and interest expense on securities sold short is 2.43%, 2.39%, 2.37%, 2.42%, and 2.43% for the years ended September 30, 2016, 2015, 2014, 2013 and 2012, respectively. |
| (E) | The ratio of gross expenses to average net assets excluding dividend and interest expense on securities sold short is 2.44%, 2.39%, 2.37%, 2.42% and 2.44% for the years ended September 30, 2016, 2015, 2014, 2013 and 2012, respectively. |
See accompanying Notes to Financial Statements.
111
| | Financial Highlights (Continued) |
Touchstone Merger Arbitrage Fund—Class Y
Selected Data for a Share Outstanding Throughout Each Period
| | | Year Ended September 30, | |
| | | 2016 | | | 2015 | | | 2014 | | | 2013 | | | 2012 | |
| Net asset value at beginning of period | | $ | 10.62 | | | $ | 10.55 | | | $ | 11.10 | | | $ | 10.68 | | | $ | 10.02 | |
| Income (loss) from investment operations: | | | | | | | | | | | | | | | | | | | | |
| Net investment income (loss)(A) | | | (0.05 | ) | | | (0.08 | ) | | | (0.10 | ) | | | 0.10 | | | | (0.07 | ) |
| Net realized and unrealized gains (losses) on investments | | | 0.56 | | | | 0.20 | | | | (0.05 | ) | | | 0.43 | | | | 0.74 | |
| Total from investment operations | | | 0.51 | | | | 0.12 | | | | (0.15 | ) | | | 0.53 | | | | 0.67 | |
| Distributions from: | | | | | | | | | | | | | | | | | | | | |
| Net investment income | | | — | | | | — | | | | (0.07 | ) | | | — | | | | (— | )(B) |
| Realized capital gains | | | — | | | | (0.05 | ) | | | (0.33 | ) | | | (0.11 | ) | | | (0.01 | ) |
| Total distributions | | | — | | | | (0.05 | ) | | | (0.40 | ) | | | (0.11 | ) | | | (0.01 | ) |
| Net asset value at end of period | | $ | 11.13 | | | $ | 10.62 | | | $ | 10.55 | | | $ | 11.10 | | | $ | 10.68 | |
| Total return | | | 4.71% | | | | 1.10% | | | | (1.41% | ) | | | 5.01% | | | | 6.75% | |
| Ratios and supplemental data: | | | | | | | | | | | | | | | | | | | | |
| Net assets at end of period (000’s) | | $ | 85,841 | | | $ | 88,677 | | | $ | 178,305 | | | $ | 192,095 | | | $ | 90,741 | |
| Ratio to average net assets: | | | | | | | | | | | | | | | | | | | | |
| Net expenses (including dividend and interest expense on securities sold short)(C) | | | 2.21% | | | | 2.20% | | | | 2.24% | | | | 2.02% | | | | 1.68% | |
| Gross expenses (including dividend and interest expense on securities sold short)(D) | | | 2.21% | | | | 2.20% | | | | 2.24% | | | | 2.01% | | | | 1.70% | |
| Net investment income (loss) | | | (0.43% | ) | | | (0.73% | ) | | | (0.97% | ) | | | 0.90% | | | | (0.62% | ) |
| Portfolio turnover rate | | | 400% | | | | 227% | | | | 271% | | | | 288% | | | | 307% | |
| (A) | The net investment income (loss) per share is based on average shares outstanding for the period. |
| (B) | Less than $0.005 per share. |
| (C) | The ratio of net expenses to average net assets excluding dividend and interest expense on securities sold short is 1.37%, 1.33%, 1.29%, 1.39% and 1.37% for the years ended September 30, 2016, 2015, 2014, 2013 and 2012, respectively. |
| (D) | The ratio of gross expenses to average net assets excluding dividend and interest expense on securities sold short is 1.37%, 1.33%, 1.29%, 1.38% and 1.39% for the years ended September 30, 2016, 2015, 2014, 2013 and 2012, respectively. |
See accompanying Notes to Financial Statements.
112
| Financial Highlights (Continued) | |
Touchstone Merger Arbitrage Fund—Institutional Class
Selected Data for a Share Outstanding Throughout Each Period
| | | Year Ended September 30, | |
| | | 2016 | | | 2015 | | | 2014 | | | 2013 | | | 2012 | |
| Net asset value at beginning of period | | $ | 10.65 | | | $ | 10.57 | | | $ | 11.13 | | | $ | 10.69 | | | $ | 10.03 | |
| Income (loss) from investment operations: | | | | | | | | | | | | | | | | | | | | |
| Net investment income (loss)(A) | | | (0.04 | ) | | | (0.07 | ) | | | (0.10 | ) | | | 0.11 | | | | (0.06 | ) |
| Net realized and unrealized gains (losses) on investments | | | 0.55 | | | | 0.20 | | | | (0.05 | ) | | | 0.44 | | | | 0.73 | |
| Total from investment operations | | | 0.51 | | | | 0.13 | | | | (0.15 | ) | | | 0.55 | | | | 0.67 | |
| Distributions from: | | | | | | | | | | | | | | | | | | | | |
| Net investment income | | | — | | | | — | | | | (0.08 | ) | | | — | | | | (— | )(B) |
| Realized capital gains | | | — | | | | (0.05 | ) | | | (0.33 | ) | | | (0.11 | ) | | | (0.01 | ) |
| Total distributions | | | — | | | | (0.05 | ) | | | (0.41 | ) | | | (0.11 | ) | | | (0.01 | ) |
| Net asset value at end of period | | $ | 11.16 | | | $ | 10.65 | | | $ | 10.57 | | | $ | 11.13 | | | $ | 10.69 | |
| Total return | | | 4.79% | | | | 1.19% | | | | (1.44% | ) | | | 5.20% | | | | 6.75% | |
| Ratios and supplemental data: | | | | | | | | | | | | | | | | | | | | |
| Net assets at end of period (000’s) | | $ | 76,910 | | | $ | 82,858 | | | $ | 119,727 | | | $ | 170,930 | | | $ | 79,164 | |
| Ratio to average net assets: | | | | | | | | | | | | | | | | | | | | |
| Net expenses (including dividend and interest expense on securities sold short)(C) | | | 2.12% | | | | 2.13% | | | | 2.21% | | | | 1.91% | | | | 1.59% | |
| Gross expenses (including dividend and interest expense on securities sold short)(D) | | | 2.12% | | | | 2.13% | | | | 2.20% | | | | 1.92% | | | | 1.62% | |
| Net investment income (loss) | | | (0.34% | ) | | | (0.66% | ) | | | (0.94% | ) | | | 1.01% | | | | (0.53% | ) |
| Portfolio turnover rate | | | 400% | | | | 227% | | | | 271% | | | | 288% | | | | 307% | |
| (A) | The net investment income (loss) per share is based on average shares outstanding for the period. |
| (B) | Less than $0.005 per share. |
| (C) | The ratio of net expenses to average net assets excluding dividend and interest expense on securities sold short is 1.28%, 1.26%, 1.26%, 1.28% and 1.28% for the years ended September 30, 2016, 2015, 2014, 2013 and 2012, respectively. |
| (D) | The ratio of gross expenses to average net assets excluding dividend and interest expense on securities sold short is 1.28%, 1.26%, 1.25%, 1.29% and 1.31% for the years ended September 30, 2016, 2015, 2014, 2013 and 2012, respectively. |
See accompanying Notes to Financial Statements.
113
| | Financial Highlights (Continued) |
Touchstone Mid Cap Fund—Class A
Selected Data for a Share Outstanding Throughout Each Period
| | | Year Ended September 30, | |
| | | 2016 | | | 2015 | | | 2014 | | | 2013 | | | 2012 | |
| Net asset value at beginning of period | | $ | 23.22 | | | $ | 23.68 | | | $ | 20.87 | | | $ | 16.55 | | | $ | 13.16 | |
| Income (loss) from investment operations: | | | | | | | | | | | | | | | | | | | | |
| Net investment income (loss) | | | 0.12 | | | | (0.02 | )(A) | | | — | (B) | | | 0.12 | (A) | | | 0.10 | (A) |
| Net realized and unrealized gains (losses) on investments | | | 2.57 | | | | (0.44 | ) | | | 2.83 | | | | 4.51 | | | | 3.31 | |
| Total from investment operations | | | 2.69 | | | | (0.46 | ) | | | 2.83 | | | | 4.63 | | | | 3.41 | |
| Distributions from: | | | | | | | | | | | | | | | | | | | | |
| Net investment income | | | — | | | | — | | | | (0.02 | ) | | | (0.31 | ) | | | (0.02 | ) |
| Net asset value at end of period | | $ | 25.91 | | | $ | 23.22 | | | $ | 23.68 | | | $ | 20.87 | | | $ | 16.55 | |
| Total return(C) | | | 11.58% | | | | (1.94% | ) | | | 13.57% | | | | 28.43% | | | | 25.95% | |
| Ratios and supplemental data: | | | | | | | | | | | | | | | | | | | | |
| Net assets at end of period (000’s) | | $ | 53,044 | | | $ | 62,717 | | | $ | 35,513 | | | $ | 43,611 | | | $ | 905 | |
| Ratio to average net assets: | | | | | | | | | | | | | | | | | | | | |
| Net expenses | | | 1.24% | | | | 1.24% | | | | 1.23% | | | | 1.21% | | | | 1.21% | |
| Gross expenses | | | 1.35% | | | | 1.35% | | | | 1.40% | | | | 1.50% | | | | 3.50% | |
| Net investment income (loss) | | | 0.43% | | | | (0.07% | ) | | | 0.01% | | | | 0.61% | | | | 0.66% | |
| Portfolio turnover rate | | | 19% | | | | 17% | | | | 26% | | | | 20% | | | | 152% | |
Touchstone Mid Cap Fund—Class C
Selected Data for a Share Outstanding Throughout Each Period
| | | Year Ended September 30, |
| | | 2016 | | | 2015 | | | 2014 | | | 2013 | | | 2012 | |
| Net asset value at beginning of period | | $ | 22.35 | | | $ | 22.97 | | | $ | 20.37 | | | $ | 16.21 | | | $ | 12.96 | |
| Income (loss) from investment operations: | | | | | | | | | | | | | | | | | | | | |
| Net investment loss | | | (0.12 | ) | | | (0.20 | )(A) | | | (0.15 | ) | | | (0.03 | )(A) | | | (0.01 | )(A) |
| Net realized and unrealized gains (losses) on investments | | | 2.53 | | | | (0.42 | ) | | | 2.75 | | | | 4.42 | | | | 3.26 | |
| Total from investment operations | | | 2.41 | | | | (0.62 | ) | | | 2.60 | | | | 4.39 | | | | 3.25 | |
| Distributions from: | | | | | | | | | | | | | | | | | | | | |
| Net investment income | | | — | | | | — | | | | — | | | | (0.23 | ) | | | — | |
| Net asset value at end of period | | $ | 24.76 | | | $ | 22.35 | | | $ | 22.97 | | | $ | 20.37 | | | $ | 16.21 | |
| Total return(C) | | | 10.78% | | | | (2.70% | ) | | | 12.76% | | | | 27.43% | | | | 25.08% | |
| Ratios and supplemental data: | | | | | | | | | | | | | | | | | | | | |
| Net assets at end of period (000’s) | | $ | 59,431 | | | $ | 60,815 | | | $ | 41,433 | | | $ | 25,018 | | | $ | 962 | |
| Ratio to average net assets: | | | | | | | | | | | | | | | | | | | | |
| Net expenses | | | 1.99% | | | | 1.99% | | | | 1.98% | | | | 1.96% | | | | 1.96% | |
| Gross expenses | | | 2.13% | | | | 2.12% | | | | 2.16% | | | | 2.37% | | | | 4.62% | |
| Net investment loss | | | (0.32% | ) | | | (0.82% | ) | | | (0.75% | ) | | | (0.14% | ) | | | (0.09% | ) |
| Portfolio turnover rate | | | 19% | | | | 17% | | | | 26% | | | | 20% | | | | 152% | |
| (A) | The net investment income (loss) per share is based on average shares outstanding for the period. |
| (B) | Less than $0.005 per share. |
| (C) | Total return shown exclude the effect of applicable sales loads. If these charges were included, the returns would be lower. |
See accompanying Notes to Financial Statements.
114
| Financial Highlights (Continued) | |
Touchstone Mid Cap Fund—Class Y
Selected Data for a Share Outstanding Throughout Each Period
| | | Year Ended September 30, | |
| | | 2016 | | | 2015 | | | 2014 | | | 2013 | | | 2012 | |
| Net asset value at beginning of period | | $ | 23.38 | | | $ | 23.83 | | | $ | 20.98 | | | $ | 16.60 | | | $ | 13.17 | |
| Income (loss) from investment operations: | | | | | | | | | | | | | | | | | | | | |
| Net investment income | | | 0.18 | | | | 0.05 | (A) | | | 0.06 | | | | 0.17 | (A) | | | 0.15 | (A) |
| Net realized and unrealized gains (losses) on investments | | | 2.59 | | | | (0.45 | ) | | | 2.84 | | | | 4.53 | | | | 3.31 | |
| Total from investment operations | | | 2.77 | | | | (0.40 | ) | | | 2.90 | | | | 4.70 | | | | 3.46 | |
| Distributions from: | | | | | | | | | | | | | | | | | | | | |
| Net investment income | | | (0.01 | ) | | | (0.05 | ) | | | (0.05 | ) | | | (0.32 | ) | | | (0.03 | ) |
| Net asset value at end of period | | $ | 26.14 | | | $ | 23.38 | | | $ | 23.83 | | | $ | 20.98 | | | $ | 16.60 | |
| Total return | | | 11.87% | | | | (1.69% | ) | | | 13.83% | | | | 28.78% | | | | 26.29% | |
| Ratios and supplemental data: | | | | | | | | | | | | | | | | | | | | |
| Net assets at end of period (000’s) | | $ | 476,831 | | | $ | 481,735 | | | $ | 266,446 | | | $ | 181,276 | | | $ | 47,419 | |
| Ratio to average net assets: | | | | | | | | | | | | | | | | | | | | |
| Net expenses | | | 0.99% | | | | 0.99% | | | | 0.98% | | | | 0.95% | | | | 0.92% | |
| Gross expenses | | | 1.07% | | | | 1.11% | | | | 1.06% | | | | 1.09% | | | | 1.08% | |
| Net investment income | | | 0.68% | | | | 0.18% | | | | 0.26% | | | | 0.87% | | | | 0.95% | |
| Portfolio turnover rate | | | 19% | | | | 17% | | | | 26% | | | | 20% | | | | 152% | |
Touchstone Mid Cap Fund—Class Z
Selected Data for a Share Outstanding Throughout Each Period
| | | Year Ended September 30, | |
| | | 2016 | | | 2015 | | | 2014 | | | 2013 | | | 2012 | |
| Net asset value at beginning of period | | $ | 23.08 | | | $ | 23.54 | | | $ | 20.73 | | | $ | 16.45 | | | $ | 13.08 | |
| Income (loss) from investment operations: | | | | | | | | | | | | | | | | | | | | |
| Net investment income (loss) | | | 0.12 | | | | (0.02 | )(A) | | | 0.01 | | | | 0.12 | (A) | | | 0.10 | (A) |
| Net realized and unrealized gains (losses) on investments | | | 2.55 | | | | (0.44 | ) | | | 2.81 | | | | 4.48 | | | | 3.28 | |
| Total from investment operations | | | 2.67 | | | | (0.46 | ) | | | 2.82 | | | | 4.60 | | | | 3.38 | |
| Distributions from: | | | | | | | | | | | | | | | | | | | | |
| Net investment income | | | (— | )(B) | | | — | | | | (0.01 | ) | | | (0.32 | ) | | | (0.01 | ) |
| Net asset value at end of period | | $ | 25.75 | | | $ | 23.08 | | | $ | 23.54 | | | $ | 20.73 | | | $ | 16.45 | |
| Total return | | | 11.58% | | | | (1.95% | ) | | | 13.58% | | | | 28.45% | | | | 25.89% | |
| Ratios and supplemental data: | | | | | | | | | | | | | | | | | | | | |
| Net assets at end of period (000’s) | | $ | 18,934 | | | $ | 18,693 | | | $ | 11,593 | | | $ | 12,858 | | | $ | 267 | |
| Ratio to average net assets: | | | | | | | | | | | | | | | | | | | | |
| Net expenses | | | 1.24% | | | | 1.24% | | | | 1.23% | | | | 1.21% | | | | 1.21% | |
| Gross expenses | | | 1.46% | | | | 1.44% | | | | 1.55% | | | | 1.55% | | | | 3.67% | |
| Net investment income (loss) | | | 0.43% | | | | (0.07% | ) | | | 0.01% | | | | 0.61% | | | | 0.66% | |
| Portfolio turnover rate | | | 19% | | | | 17% | | | | 26% | | | | 20% | | | | 152% | |
| (A) | The net investment income (loss) per share is based on average shares outstanding for the period. |
| (B) | Less than $0.005 per share. |
See accompanying Notes to Financial Statements.
115
| | Financial Highlights (Continued) |
Touchstone Mid Cap Fund—Institutional Class
Selected Data for a Share Outstanding Throughout The Period
| | | | | | | | | | | | | | | Period | |
| | | | | | | | | | | | | | | Ended | |
| | | | | | Year Ended September 30, | | | | | | September 30, | |
| | | 2016 | | | 2015 | | | 2014 | | | 2013 | | | 2012(A) | |
| Net asset value at beginning of period | | $ | 23.40 | | | $ | 23.85 | | | $ | 20.99 | | | $ | 16.61 | | | $ | 15.36 | |
| Income (loss) from investment operations: | | | | | | | | | | | | | | | | | | | | |
| Net investment income | | | 0.19 | | | | 0.06 | (B) | | | 0.08 | | | | 0.19 | (B) | | | 0.10 | (B) |
| Net realized and unrealized gains (losses) on investments | | | 2.61 | | | | (0.44 | ) | | | 2.84 | | | | 4.52 | | | | 1.15 | |
| Total from investment operations | | | 2.80 | | | | (0.38 | ) | | | 2.92 | | | | 4.71 | | | | 1.25 | |
| Distributions from: | | | | | | | | | | | | | | | | | | | | |
| Net investment income | | | (0.02 | ) | | | (0.07 | ) | | | (0.06 | ) | | | (0.33 | ) | | | — | |
| Net asset value at end of period | | $ | 26.18 | | | $ | 23.40 | | | $ | 23.85 | | | $ | 20.99 | | | $ | 16.61 | |
| Total return | | | 11.92% | | | | (1.62% | ) | | | 13.91% | | | | 28.85% | | | | 8.14% | (C) |
| Ratios and supplemental data: | | | | | | | | | | | | | | | | | | | | |
| Net assets at end of period (000’s) | | $ | 77,775 | | | $ | 76,324 | | | $ | 90,998 | | | $ | 74,170 | | | $ | 12,231 | |
| Ratio to average net assets: | | | | | | | | | | | | | | | | | | | | |
| Net expenses | | | 0.92% | | | | 0.92% | | | | 0.91% | | | | 0.89% | | | | 0.89% | (D) |
| Gross expenses | | | 0.99% | | | | 1.00% | | | | 1.01% | | | | 1.07% | | | | 1.38% | (D) |
| Net investment income | | | 0.75% | | | | 0.25% | | | | 0.33% | | | | 0.93% | | | | 0.98% | (D) |
| Portfolio turnover rate | | | 19% | | | | 17% | | | | 26% | | | | 20% | | | | 152% | |
| (A) | Represents the period from commencement of operations (January 27, 2012) through September 30, 2012. |
| (B) | The net investment income per share is based on average shares outstanding for the period. |
| (C) | Not annualized. |
| (D) | Annualized. |
See accompanying Notes to Financial Statements.
116
| Financial Highlights (Continued) | |
Touchstone Mid Cap Value Fund—Class A
Selected Data for a Share Outstanding Throughout Each Period
| | | Year Ended September 30, | |
| | | 2016 | | | 2015 | | | 2014 | | | 2013 | | | 2012 | |
| Net asset value at beginning of period | | $ | 15.70 | | | $ | 16.60 | | | $ | 16.09 | | | $ | 12.98 | | | $ | 10.86 | |
| Income (loss) from investment operations: | | | | | | | | | | | | | | | | | | | | |
| Net investment income | | | 0.09 | (A) | | | 0.12 | | | | 0.05 | | | | 0.10 | | | | 0.09 | |
| Net realized and unrealized gains (losses) on investments | | | 2.76 | | | | (0.28 | ) | | | 1.85 | | | | 3.26 | | | | 2.78 | |
| Total from investment operations | | | 2.85 | | | | (0.16 | ) | | | 1.90 | | | | 3.36 | | | | 2.87 | |
| Distributions from: | | | | | | | | | | | | | | | | | | | | |
| Net investment income | | | (0.10 | ) | | | (0.10 | ) | | | (0.05 | ) | | | (0.10 | ) | | | (0.09 | ) |
| Realized capital gains | | | (0.96 | ) | | | (0.64 | ) | | | (1.34 | ) | | | (0.15 | ) | | | (0.66 | ) |
| Total distributions | | | (1.06 | ) | | | (0.74 | ) | | | (1.39 | ) | | | (0.25 | ) | | | (0.75 | ) |
| Net asset value at end of period | | $ | 17.49 | | | $ | 15.70 | | | $ | 16.60 | | | $ | 16.09 | | | $ | 12.98 | |
| Total return(B) | | | 19.20% | | | | (1.14% | ) | | | 12.49% | | | | 26.26% | | | | 27.55% | |
| Ratios and supplemental data: | | | | | | | | | | | | | | | | | | | | |
| Net assets at end of period (000’s) | | $ | 21,867 | | | $ | 7,663 | | | $ | 14,029 | | | $ | 5,307 | | | $ | 3,409 | |
| Ratio to average net assets: | | | | | | | | | | | | | | | | | | | | |
| Net expenses | | | 1.27% | | | | 1.29% | | | | 1.29% | | | | 1.29% | | | | 1.29% | |
| Gross expenses | | | 1.59% | | | | 1.66% | | | | 1.58% | | | | 1.75% | | | | 1.97% | |
| Net investment income | | | 0.56% | | | | 0.55% | | | | 0.41% | | | | 0.73% | | | | 0.77% | |
| Portfolio turnover rate | | | 45% | | | | 54% | | | | 85% | (C) | | | 68% | | | | 42% | |
Touchstone Mid Cap Value Fund—Class C
Selected Data for a Share Outstanding Throughout Each Period
| | | Year Ended September 30, | |
| | | 2016 | | | 2015 | | | 2014 | | | 2013 | | | 2012 | |
| Net asset value at beginning of period | | $ | 15.49 | | | $ | 16.42 | | | $ | 16.00 | | | $ | 12.92 | | | $ | 10.82 | |
| Income (loss) from investment operations: | | | | | | | | | | | | | | | | | | | | |
| Net investment income (loss) | | | (0.03 | )(A) | | | (0.04 | ) | | | (0.04 | ) | | | (— | )(D) | | | — | (D) |
| Net realized and unrealized gains (losses) on investments | | | 2.73 | | | | (0.25 | ) | | | 1.80 | | | | 3.24 | | | | 2.77 | |
| Total from investment operations | | | 2.70 | | | | (0.29 | ) | | | 1.76 | | | | 3.24 | | | | 2.77 | |
| Distributions from: | | | | | | | | | | | | | | | | | | | | |
| Net investment income | | | — | | | | — | | | | — | | | | (0.01 | ) | | | (0.01 | ) |
| Realized capital gains | | | (0.96 | ) | | | (0.64 | ) | | | (1.34 | ) | | | (0.15 | ) | | | (0.66 | ) |
| Total distributions | | | (0.96 | ) | | | (0.64 | ) | | | (1.34 | ) | | | (0.16 | ) | | | (0.67 | ) |
| Net asset value at end of period | | $ | 17.23 | | | $ | 15.49 | | | $ | 16.42 | | | $ | 16.00 | | | $ | 12.92 | |
| Total return(B) | | | 18.32% | | | | (1.91% | ) | | | 11.62% | | | | 25.32% | | | | 26.64% | |
| Ratios and supplemental data: | | | | | | | | | | | | | | | | | | | | |
| Net assets at end of period (000’s) | | $ | 4,088 | | | $ | 1,752 | | | $ | 2,002 | | | $ | 719 | | | $ | 292 | |
| Ratio to average net assets: | | | | | | | | | | | | | | | | | | | | |
| Net expenses | | | 2.02% | | | | 2.04% | | | | 2.04% | | | | 2.04% | | | | 2.04% | |
| Gross expenses | | | 2.75% | | | | 2.83% | | | | 3.05% | | | | 4.17% | | | | 7.90% | |
| Net investment income (loss) | | | (0.19% | ) | | | (0.20% | ) | | | (0.34% | ) | | | (0.02% | ) | | | 0.02% | |
| Portfolio turnover rate | | | 45% | | | | 54% | | | | 85% | (C) | | | 68% | | | | 42% | |
| (A) | The net investment income (loss) per share is based on average shares outstanding for the period. |
| (B) | Total returns shown exclude the effect of applicable sales loads. If these charges were included, the returns would be lower. |
| (C) | Portfolio turnover excludes the purchases and sales of the Touchstone Mid Cap Value Opportunities Fund acquired on March 21, 2014. If these transactions were included, portfolio turnover would have been higher. |
| (D) | Less than $0.005 per share. |
See accompanying Notes to Financial Statements.
117
| | Financial Highlights (Continued) |
Touchstone Mid Cap Value Fund—Class Y
Selected Data for a Share Outstanding Throughout Each Period
| | | Year Ended September 30, | |
| | | 2016 | | | 2015 | | | 2014 | | | 2013 | | | 2012 | |
| Net asset value at beginning of period | | $ | 15.76 | | | $ | 16.67 | | | $ | 16.15 | | | $ | 13.03 | | | $ | 10.89 | |
| Income (loss) from investment operations: | | | | | | | | | | | | | | | | | | | | |
| Net investment income | | | 0.13 | (A) | | | 0.14 | | | | 0.07 | | | | 0.15 | | | | 0.11 | |
| Net realized and unrealized gains (losses) on investments | | | 2.78 | | | | (0.27 | ) | | | 1.88 | | | | 3.26 | | | | 2.81 | |
| Total from investment operations | | | 2.91 | | | | (0.13 | ) | | | 1.95 | | | | 3.41 | | | | 2.92 | |
| Distributions from: | | | | | | | | | | | | | | | | | | | | |
| Net investment income | | | (0.14 | ) | | | (0.14 | ) | | | (0.09 | ) | | | (0.14 | ) | | | (0.12 | ) |
| Realized capital gains | | | (0.96 | ) | | | (0.64 | ) | | | (1.34 | ) | | | (0.15 | ) | | | (0.66 | ) |
| Total distributions | | | (1.10 | ) | | | (0.78 | ) | | | (1.43 | ) | | | (0.29 | ) | | | (0.78 | ) |
| Net asset value at end of period | | $ | 17.57 | | | $ | 15.76 | | | $ | 16.67 | | | $ | 16.15 | | | $ | 13.03 | |
| Total return | | | 19.51% | | | | (0.91% | ) | | | 12.77% | | | | 26.53% | | | | 27.97% | |
| Ratios and supplemental data: | | | | | | | | | | | | | | | | | | | | |
| Net assets at end of period (000’s) | | $ | 292,978 | | | $ | 208,525 | | | $ | 213,404 | | | $ | 15,782 | | | $ | 13,785 | |
| Ratio to average net assets: | | | | | | | | | | | | | | | | | | | | |
| Net expenses | | | 1.03% | | | | 1.04% | | | | 1.04% | | | | 1.04% | | | | 1.04% | |
| Gross expenses | | | 1.13% | | | | 1.13% | | | | 1.14% | | | | 1.37% | | | | 1.46% | |
| Net investment income | | | 0.81% | | | | 0.81% | | | | 0.66% | | | | 0.98% | | | | 1.02% | |
| Portfolio turnover rate | | | 45% | | | | 54% | | | | 85% | (B) | | | 68% | | | | 42% | |
Touchstone Mid Cap Value Fund—Institutional Class
Selected Data for a Share Outstanding Throughout Each Period
| | | Year Ended September 30, | |
| | | 2016 | | | 2015 | | | 2014 | | | 2013 | | | 2012 | |
| Net asset value at beginning of period | | $ | 15.82 | | | $ | 16.73 | | | $ | 16.20 | | | $ | 13.07 | | | $ | 10.92 | |
| Income (loss) from investment operations: | | | | | | | | | | | | | | | | | | | | |
| Net investment income | | | 0.16 | (A) | | | 0.17 | | | | 0.13 | | | | 0.16 | | | | 0.13 | |
| Net realized and unrealized gains (losses) on investments | | | 2.78 | | | | (0.27 | ) | | | 1.85 | | | | 3.28 | | | | 2.82 | |
| Total from investment operations | | | 2.94 | | | | (0.10 | ) | | | 1.98 | | | | 3.44 | | | | 2.95 | |
| Distributions from: | | | | | | | | | | | | | | | | | | | | |
| Net investment income | | | (0.16 | ) | | | (0.17 | ) | | | (0.11 | ) | | | (0.16 | ) | | | (0.14 | ) |
| Realized capital gains | | | (0.96 | ) | | | (0.64 | ) | | | (1.34 | ) | | | (0.15 | ) | | | (0.66 | ) |
| Total distributions | | | (1.12 | ) | | | (0.81 | ) | | | (1.45 | ) | | | (0.31 | ) | | | (0.80 | ) |
| Net asset value at end of period | | $ | 17.64 | | | $ | 15.82 | | | $ | 16.73 | | | $ | 16.20 | | | $ | 13.07 | |
| Total return | | | 19.71% | | | | (0.76% | ) | | | 12.90% | | | | 26.71% | | | | 28.17% | |
| Ratios and supplemental data: | | | | | | | | | | | | | | | | | | | | |
| Net assets at end of period (000’s) | | $ | 185,989 | | | $ | 124,592 | | | $ | 134,259 | | | $ | 144,965 | | | $ | 75,240 | |
| Ratio to average net assets: | | | | | | | | | | | | | | | | | | | | |
| Net expenses | | | 0.89% | | | | 0.89% | | | | 0.89% | | | | 0.89% | | | | 0.89% | |
| Gross expenses | | | 1.03% | | | | 1.03% | | | | 1.04% | | | | 1.09% | | | | 1.12% | |
| Net investment income | | | 0.94% | | | | 0.96% | | | | 0.81% | | | | 1.13% | | | | 1.17% | |
| Portfolio turnover rate | | | 45% | | | | 54% | | | | 85% | (B) | | | 68% | | | | 42% | |
| (A) | The net investment income per share is based on average shares outstanding for the period. |
| (B) | Portfolio turnover excludes the purchases and sales of the Touchstone Mid Cap Value Opportunities Fund acquired on March 21, 2014. If these transactions were included, portfolio turnover would have been higher. |
See accompanying Notes to Financial Statements.
118
| Financial Highlights (Continued) | |
Touchstone Premium Yield Equity Fund—Class A
Selected Data for a Share Outstanding Throughout Each Period
| | | Year Ended September 30, | |
| | | 2016 | | | 2015 | | | 2014 | | | 2013 | | | 2012 | |
| Net asset value at beginning of period | | $ | 8.27 | | | $ | 9.98 | | | $ | 8.92 | | | $ | 8.11 | | | $ | 6.76 | |
| Income (loss) from investment operations: | | | | | | | | | | | | | | | | | | | | |
| Net investment income | | | 0.22 | | | | 0.24 | | | | 0.40 | (A) | | | 0.24 | | | | 0.24 | |
| Net realized and unrealized gains (losses) on investments | | | 1.04 | | | | (1.25 | ) | | | 1.07 | | | | 0.80 | | | | 1.36 | |
| Total from investment operations | | | 1.26 | | | | (1.01 | ) | | | 1.47 | | | | 1.04 | | | | 1.60 | |
| Distributions from: | | | | | | | | | | | | | | | | | | | | |
| Net investment income | | | (0.21 | ) | | | (0.25 | ) | | | (0.41 | ) | | | (0.23 | ) | | | (0.24 | ) |
| Realized capital gains | | | (0.55 | ) | | | (0.45 | ) | | | — | | | | — | | | | — | |
| Return of capital | | | — | | | | — | | | | — | | | | — | | | | (0.01 | ) |
| Total distributions | | | (0.76 | ) | | | (0.70 | ) | | | (0.41 | ) | | | (0.23 | ) | | | (0.25 | ) |
| Net asset value at end of period | | $ | 8.77 | | | $ | 8.27 | | | $ | 9.98 | | | $ | 8.92 | | | $ | 8.11 | |
| Total return(B) | | | 16.80% | | | | (10.79% | ) | | | 16.79% | | | | 12.97% | | | | 23.98% | |
| Ratios and supplemental data: | | | | | | | | | | | | | | | | | | | | |
| Net assets at end of period (000’s) | | $ | 26,907 | | | $ | 36,023 | | | $ | 45,124 | | | $ | 86,171 | | | $ | 68,780 | |
| Ratio to average net assets: | | | | | | | | | | | | | | | | | | | | |
| Net expenses | | | 1.20% | | | | 1.20% | | | | 1.20% | | | | 1.20% | | | | 1.20% | |
| Gross expenses | | | 1.34% | | | | 1.25% | | | | 1.29% | | | | 1.29% | | | | 1.30% | |
| Net investment income | | | 2.57% | | | | 2.57% | | | | 4.24% | (A) | | | 2.74% | | | | 3.26% | |
| Portfolio turnover rate | | | 38% | | | | 31% | | | | 26% | | | | 56% | | | | 16% | |
Touchstone Premium Yield Equity Fund—Class C
Selected Data for a Share Outstanding Throughout Each Period
| | | Year Ended September 30, | |
| | | 2016 | | | 2015 | | | 2014 | | | 2013 | | | 2012 | |
| Net asset value at beginning of period | | $ | 8.26 | | | $ | 9.97 | | | $ | 8.90 | | | $ | 8.10 | | | $ | 6.76 | |
| Income (loss) from investment operations: | | | | | | | | | | | | | | | | | | | | |
| Net investment income | | | 0.15 | | | | 0.17 | | | | 0.33 | (A) | | | 0.16 | | | | 0.18 | |
| Net realized and unrealized gains (losses) on investments | | | 1.04 | | | | (1.24 | ) | | | 1.07 | | | | 0.80 | | | | 1.35 | |
| Total from investment operations | | | 1.19 | | | | (1.07 | ) | | | 1.40 | | | | 0.96 | | | | 1.53 | |
| Distributions from: | | | | | | | | | | | | | | | | | | | | |
| Net investment income | | | (0.15 | ) | | | (0.19 | ) | | | (0.33 | ) | | | (0.16 | ) | | | (0.18 | ) |
| Realized capital gains | | | (0.55 | ) | | | (0.45 | ) | | | — | | | | — | | | | — | |
| Return of capital | | | — | | | | — | | | | — | | | | — | | | | (0.01 | ) |
| Total distributions | | | (0.70 | ) | | | (0.64 | ) | | | (0.33 | ) | | | (0.16 | ) | | | (0.19 | ) |
| Net asset value at end of period | | $ | 8.75 | | | $ | 8.26 | | | $ | 9.97 | | | $ | 8.90 | | | $ | 8.10 | |
| Total return(B) | | | 15.81% | | | | (11.45% | ) | | | 15.99% | | | | 12.03% | | | | 22.93% | |
| Ratios and supplemental data: | | | | | | | | | | | | | | | | | | | | |
| Net assets at end of period (000’s) | | $ | 25,781 | | | $ | 31,405 | | | $ | 31,190 | | | $ | 24,009 | | | $ | 15,680 | |
| Ratio to average net assets: | | | | | | | | | | | | | | | | | | | | |
| Net expenses | | | 1.95% | | | | 1.95% | | | | 1.95% | | | | 1.95% | | | | 1.95% | |
| Gross expenses | | | 2.05% | | | | 2.00% | | | | 2.02% | | | | 2.08% | | | | 2.14% | |
| Net investment income | | | 1.82% | | | | 1.82% | | | | 3.49% | (A) | | | 1.99% | | | | 2.51% | |
| Portfolio turnover rate | | | 38% | | | | 31% | | | | 26% | | | | 56% | | | | 16% | |
| (A) | Reflects the impact of a corporate action event that resulted in a one-time increase to net investment income. If the corporate action event had not occurred, the Class A and Class C net investment income per share and ratio of net investment income to average net assets would have been lower by $0.16 and 1.70%, respectively. |
| (B) | Total returns shown exclude the effect of applicable sales loads. If these charges were included, the returns would be lower. |
See accompanying Notes to Financial Statements.
119
| | Financial Highlights (Continued) |
Touchstone Premium Yield Equity Fund—Class Y
Selected Data for a Share Outstanding Throughout Each Period
| | | Year Ended September 30, | |
| | | 2016 | | | 2015 | | | 2014 | | | 2013 | | | 2012 | |
| Net asset value at beginning of period | | $ | 8.25 | | | $ | 9.97 | | | $ | 8.90 | | | $ | 8.10 | | | $ | 6.75 | |
| Income (loss) from investment operations: | | | | | | | | | | | | | | | | | | | | |
| Net investment income | | | 0.23 | | | | 0.26 | | | | 0.43 | (A) | | | 0.25 | | | | 0.27 | |
| Net realized and unrealized gains (losses) on investments | | | 1.05 | | | | (1.25 | ) | | | 1.07 | | | | 0.80 | | | | 1.35 | |
| Total from investment operations | | | 1.28 | | | | (0.99 | ) | | | 1.50 | | | | 1.05 | | | | 1.62 | |
| Distributions from: | | | | | | | | | | | | | | | | | | | | |
| Net investment income | | | (0.23 | ) | | | (0.28 | ) | | | (0.43 | ) | | | (0.25 | ) | | | (0.26 | ) |
| Realized capital gains | | | (0.55 | ) | | | (0.45 | ) | | | — | | | | — | | | | — | |
| Return of capital | | | — | | | | — | | | | — | | | | — | | | | (0.01 | ) |
| Total distributions | | | (0.78 | ) | | | (0.73 | ) | | | (0.43 | ) | | | (0.25 | ) | | | (0.27 | ) |
| Net asset value at end of period | | $ | 8.75 | | | $ | 8.25 | | | $ | 9.97 | | | $ | 8.90 | | | $ | 8.10 | |
| Total return | | | 17.13% | | | | (10.58% | ) | | | 17.13% | | | | 13.14% | | | | 24.31% | |
| Ratios and supplemental data: | | | | | | | | | | | | | | | | | | | | |
| Net assets at end of period (000’s) | | $ | 99,953 | | | $ | 100,772 | | | $ | 109,201 | | | $ | 66,644 | | | $ | 33,185 | |
| Ratio to average net assets: | | | | | | | | | | | | | | | | | | | | |
| Net expenses | | | 0.95% | | | | 0.95% | | | | 0.95% | | | | 0.95% | | | | 0.95% | |
| Gross expenses | | | 1.03% | | | | 0.97% | | | | 0.96% | | | | 1.04% | | | | 1.18% | |
| Net investment income | | | 2.82% | | | | 2.82% | | | | 4.49% | (A) | | | 2.99% | | | | 3.51% | |
| Portfolio turnover rate | | | 38% | | | | 31% | | | | 26% | | | | 56% | | | | 16% | |
| (A) | Reflects the impact of a corporate action event that resulted in a one-time increase to net investment income. If the corporate action event had not occurred, the Class Y net investment income per share and ratio of net investment income to average net assets would have been lower by $0.16 and 1.70%, respectively. |
See accompanying Notes to Financial Statements.
120
| Financial Highlights (Continued) | |
Touchstone Sands Capital Select Growth Fund—Class A
Selected Data for a Share Outstanding Throughout Each Period
| | | Year Ended September 30, | |
| | | 2016 | | | 2015 | | | 2014 | | | 2013 | | | 2012 | |
| Net asset value at beginning of period | | $ | 16.48 | | | $ | 18.15 | | | $ | 16.08 | | | $ | 12.65 | | | $ | 9.39 | |
| Income (loss) from investment operations: | | | | | | | | | | | | | | | | | | | | |
| Net investment loss | | | (0.28 | ) | | | (0.15 | ) | | | (0.29 | ) | | | (0.05 | ) | | | (0.09 | )(A) |
| Net realized and unrealized gains (losses) on investments | | | 1.47 | | | | (0.64 | ) | | | 2.49 | | | | 3.48 | | | | 3.35 | |
| Total from investment operations | | | 1.19 | | | | (0.79 | ) | | | 2.20 | | | | 3.43 | | | | 3.26 | |
| Distributions from: | | | | | | | | | | | | | | | | | | | | |
| Realized capital gains | | | (1.53 | ) | | | (0.88 | ) | | | (0.13 | ) | | | — | | | | — | |
| Net asset value at end of period | | $ | 16.14 | | | $ | 16.48 | | | $ | 18.15 | | | $ | 16.08 | | | $ | 12.65 | |
| Total return(B) | | | 7.17% | | | | (4.70% | ) | | | 13.73% | | | | 27.11% | | | | 34.72% | |
| Ratios and supplemental data: | | | | | | | | | | | | | | | | | | | | |
| Net assets at end of period (000’s) | | $ | 138,315 | | | $ | 230,783 | | | $ | 289,506 | | | $ | 416,396 | | | $ | 186,384 | |
| Ratio to average net assets: | | | | | | | | | | | | | | | | | | | | |
| Net expenses | | | 1.07% | | | | 1.10% | | | | 1.31% | | | | 1.28% | | | | 1.37% | |
| Gross expenses | | | 1.09% | | | | 1.10% | | | | 1.33% | | | | 1.37% | | | | 1.47% | |
| Net investment loss | | | (0.81% | ) | | | (0.65% | ) | | | (0.91% | ) | | | (0.62% | ) | | | (0.74% | ) |
| Portfolio turnover rate | | | 46% | | | | 29% | | | | 30% | | | | 37% | | | | 19% | |
Touchstone Sands Capital Select Growth Fund—Class C
Selected Data for a Share Outstanding Throughout Each Period
| | | Year Ended September 30, | |
| | | 2016 | | | 2015 | | | 2014 | | | 2013 | | | 2012 | |
| Net asset value at beginning of period | | $ | 15.86 | | | $ | 17.62 | | | $ | 15.74 | | | $ | 12.47 | | | $ | 9.33 | |
| Income (loss) from investment operations: | | | | | | | | | | | | | | | | | | | | |
| Net investment loss | | | (0.52 | ) | | | (0.30 | ) | | | (0.32 | ) | | | (0.13 | ) | | | (0.17 | )(A) |
| Net realized and unrealized gains (losses) on investments | | | 1.55 | | | | (0.58 | ) | | | 2.33 | | | | 3.40 | | | | 3.31 | |
| Total from investment operations | | | 1.03 | | | | (0.88 | ) | | | 2.01 | | | | 3.27 | | | | 3.14 | |
| Distributions from: | | | | | | | | | | | | | | | | | | | | |
| Realized capital gains | | | (1.53 | ) | | | (0.88 | ) | | | (0.13 | ) | | | — | | | | — | |
| Net asset value at end of period | | $ | 15.36 | | | $ | 15.86 | | | $ | 17.62 | | | $ | 15.74 | | | $ | 12.47 | |
| Total return(B) | | | 6.32% | | | | (5.38% | ) | | | 12.89% | | | | 26.14% | | | | 33.66% | |
| Ratios and supplemental data: | | | | | | | | | | | | | | | | | | | | |
| Net assets at end of period (000’s) | | $ | 111,951 | | | $ | 163,237 | | | $ | 203,865 | | | $ | 198,584 | | | $ | 88,931 | |
| Ratio to average net assets: | | | | | | | | | | | | | | | | | | | | |
| Net expenses | | | 1.82% | | | | 1.85% | | | | 2.06% | | | | 2.03% | | | | 2.12% | |
| Gross expenses | | | 1.84% | | | | 1.85% | | | | 2.09% | | | | 2.14% | | | | 2.22% | |
| Net investment loss | | | (1.56% | ) | | | (1.40% | ) | | | (1.65% | ) | | | (1.37% | ) | | | (1.49% | ) |
| Portfolio turnover rate | | | 46% | | | | 29% | | | | 30% | | | | 37% | | | | 19% | |
| (A) | The net investment loss per share is based on average shares outstanding for the period. |
| (B) | Total returns shown exclude the effect of applicable sales loads. If these charges were included, the returns would be lower. |
See accompanying Notes to Financial Statements.
121
| | Financial Highlights (Continued) |
Touchstone Sands Capital Select Growth Fund—Class Y
Selected Data for a Share Outstanding Throughout Each Period
| | | | | | Year Ended September 30, | | | | | | | |
| | | 2016 | | | 2015 | | | 2014 | | | 2013 | | | 2012 | |
| Net asset value at beginning of period | | $ | 16.96 | | | $ | 18.61 | | | $ | 16.44 | | | $ | 12.90 | | | $ | 9.56 | |
| Income (loss) from investment operations: | | | | | | | | | | | | | | | | | | | | |
| Net investment loss | | | (0.11 | ) | | | (0.08 | ) | | | (0.10 | ) | | | (0.02 | ) | | | (0.06 | )(A) |
| Net realized and unrealized gains (losses) on investments | | | 1.38 | | | | (0.69 | ) | | | 2.40 | | | | 3.56 | | | | 3.40 | |
| Total from investment operations | | | 1.27 | | | | (0.77 | ) | | | 2.30 | | | | 3.54 | | | | 3.34 | |
| Distributions from: | | | | | | | | | | | | | | | | | | | | |
| Realized capital gains | | | (1.53 | ) | | | (0.88 | ) | | | (0.13 | ) | | | — | | | | — | |
| Net asset value at end of period | | $ | 16.70 | | | $ | 16.96 | | | $ | 18.61 | | | $ | 16.44 | | | $ | 12.90 | |
| Total return | | | 7.46% | | | | (4.46% | ) | | | 14.04% | | | | 27.44% | | | | 34.94% | |
| Ratios and supplemental data: | | | | | | | | | | | | | | | | | | | | |
| Net assets at end of period (000’s) | | $ | 2,209,841 | | | $ | 3,198,758 | | | $ | 3,473,661 | | | $ | 2,684,731 | | | $ | 1,215,124 | |
| Ratio to average net assets: | | | | | | | | | | | | | | | | | | | | |
| Net expenses | | | 0.82% | | | | 0.83% | | | | 1.06% | | | | 1.03% | | | | 1.11% | |
| Gross expenses | | | 0.82% | | | | 0.83% | | | | 1.03% | | | | 1.06% | | | | 1.18% | |
| Net investment loss | | | (0.56% | ) | | | (0.39% | ) | | | (0.66% | ) | | | (0.37% | ) | | | (0.49% | ) |
| Portfolio turnover rate | | | 46% | | | | 29% | | | | 30% | | | | 37% | | | | 19% | |
Touchstone Sands Capital Select Growth Fund—Class Z
Selected Data for a Share Outstanding Throughout Each Period
| | | Year Ended September 30, | |
| | | 2016 | | | 2015 | | | 2014 | | | 2013 | | | 2012 | |
| Net asset value at beginning of period | | $ | 16.49 | | | $ | 18.15 | | | $ | 16.08 | | | $ | 12.65 | | | $ | 9.39 | |
| Income (loss) from investment operations: | | | | | | | | | | | | | | | | | | | | |
| Net investment loss | | | (0.29 | ) | | | (0.19 | ) | | | (0.17 | ) | | | (0.10 | ) | | | (0.08 | )(A) |
| Net realized and unrealized gains (losses) on investments | | | 1.48 | | | | (0.59 | ) | | | 2.37 | | | | 3.53 | | | | 3.34 | |
| Total from investment operations | | | 1.19 | | | | (0.78 | ) | | | 2.20 | | | | 3.43 | | | | 3.26 | |
| Distributions from: | | | | | | | | | | | | | | | | | | | | |
| Realized capital gains | | | (1.53 | ) | | | (0.88 | ) | | | (0.13 | ) | | | — | | | | — | |
| Net asset value at end of period | | $ | 16.15 | | | $ | 16.49 | | | $ | 18.15 | | | $ | 16.08 | | | $ | 12.65 | |
| Total return | | | 7.24% | | | | (4.70% | ) | | | 13.73% | | | | 27.11% | | | | 34.72% | |
| Ratios and supplemental data: | | | | | | | | | | | | | | | | | | | | |
| Net assets at end of period (000’s) | | $ | 777,930 | | | $ | 1,292,853 | | | $ | 2,302,038 | | | $ | 2,140,884 | | | $ | 1,836,957 | |
| Ratio to average net assets: | | | | | | | | | | | | | | | | | | | | |
| Net expenses | | | 1.04% | | | | 1.08% | | | | 1.31% | | | | 1.28% | | | | 1.32% | |
| Gross expenses | | | 1.11% | | | | 1.13% | | | | 1.35% | | | | 1.37% | | | | 1.39% | |
| Net investment loss | | | (0.79% | ) | | | (0.64% | ) | | | (0.90% | ) | | | (0.62% | ) | | | (0.70% | ) |
| Portfolio turnover rate | | | 46% | | | | 29% | | | | 30% | | | | 37% | | | | 19% | |
| (A) | The net investment loss per share is based on average shares outstanding for the period. |
See accompanying Notes to Financial Statements.
122
| Financial Highlights (Continued) | |
Touchstone Small Cap Fund—Class A
Selected Data for a Share Outstanding Throughout Each Period
| | | | | | Year Ended September 30, | | | | | | | |
| | | 2016 | | | 2015 | | | 2014 | | | 2013 | | | 2012 | |
| Net asset value at beginning of period | | $ | 17.73 | | | $ | 20.55 | | | $ | 19.44 | | | $ | 16.02 | | | $ | 11.94 | |
| Income (loss) from investment operations: | | | | | | | | | | | | | | | | | | | | |
| Net investment income (loss) | | | — | (A) | | | 0.15 | (B) | | | (0.09 | )(C) | | | 0.44 | | | | 0.05 | |
| Net realized and unrealized gains (losses) on investments | | | 0.59 | | | | (1.38 | ) | | | 1.80 | | | | 3.28 | | | | 4.20 | |
| Total from investment operations | | | 0.59 | | | | (1.23 | ) | | | 1.71 | | | | 3.72 | | | | 4.25 | |
| Distributions from: | | | | | | | | | | | | | | | | | | | | |
| Net investment income | | | (0.13 | ) | | | (— | )(A) | | | (0.31 | ) | | | (0.18 | ) | | | (— | )(A) |
| Realized capital gains | | | (1.95 | ) | | | (1.59 | ) | | | (0.29 | ) | | | (0.12 | ) | | | (0.17 | ) |
| Total distributions | | | (2.08 | ) | | | (1.59 | ) | | | (0.60 | ) | | | (0.30 | ) | | | (0.17 | ) |
| Net asset value at end of period | | $ | 16.24 | | | $ | 17.73 | | | $ | 20.55 | | | $ | 19.44 | | | $ | 16.02 | |
| Total return(D) | | | 3.74% | | | | (6.36% | ) | | | 8.80% | | | | 23.60% | | | | 35.86% | |
| Ratios and supplemental data: | | | | | | | | | | | | | | | | | | | | |
| Net assets at end of period (000’s) | | $ | 37,942 | | | $ | 62,423 | | | $ | 60,246 | | | $ | 122,394 | | | $ | 84,539 | |
| Ratio to average net assets: | | | | | | | | | | | | | | | | | | | | |
| Net expenses | | | 1.38% | | | | 1.38% | | | | 1.36% | | | | 1.34% | | | | 1.34% | |
| Gross expenses | | | 1.45% | | | | 1.42% | | | | 1.43% | | | | 1.53% | | | | 1.58% | |
| Net investment income (loss) | | | 0.00% | (A) | | | 0.75% | (B) | | | (0.45% | ) | | | 2.47% | | | | 0.37% | |
| Portfolio turnover rate | | | 17% | | | | 42% | | | | 17% | | | | 15% | | | | 11% | |
Touchstone Small Cap Fund—Class C
Selected Data for a Share Outstanding Throughout Each Period
| | | Year Ended September 30, | |
| | | 2016 | | | 2015 | | | 2014 | | | 2013 | | | 2012 | |
| Net asset value at beginning of period | | $ | 17.16 | | | $ | 20.07 | | | $ | 19.01 | | | $ | 15.69 | | | $ | 11.79 | |
| Income (loss) from investment operations: | | | | | | | | | | | | | | | | | | | | |
| Net investment income (loss) | | | (0.16 | ) | | | — | (A)(B) | | | (0.24 | )(C) | | | 0.30 | | | | (0.01 | ) |
| Net realized and unrealized gains (losses) on investments | | | 0.60 | | | | (1.32 | ) | | | 1.75 | | | | 3.22 | | | | 4.08 | |
| Total from investment operations | | | 0.44 | | | | (1.32 | ) | | | 1.51 | | | | 3.52 | | | | 4.07 | |
| Distributions from: | | | | | | | | | | | | | | | | | | | | |
| Net investment income | | | (0.02 | ) | | | — | | | | (0.16 | ) | | | (0.08 | ) | | | (— | )(A) |
| Realized capital gains | | | (1.95 | ) | | | (1.59 | ) | | | (0.29 | ) | | | (0.12 | ) | | | (0.17 | ) |
| Total distributions | | | (1.97 | ) | | | (1.59 | ) | | | (0.45 | ) | | | (0.20 | ) | | | (0.17 | ) |
| Net asset value at end of period | | $ | 15.63 | | | $ | 17.16 | | | $ | 20.07 | | | $ | 19.01 | | | $ | 15.69 | |
| Total return(D) | | | 2.92% | | | | (7.01% | ) | | | 7.96% | | | | 22.69% | | | | 34.78% | |
| Ratios and supplemental data: | | | | | | | | | | | | | | | | | | | | |
| Net assets at end of period (000’s) | | $ | 14,957 | | | $ | 21,562 | | | $ | 27,104 | | | $ | 28,685 | | | $ | 24,278 | |
| Ratio to average net assets: | | | | | | | | | | | | | | | | | | | | |
| Net expenses | | | 2.13% | | | | 2.13% | | | | 2.12% | | | | 2.09% | | | | 2.09% | |
| Gross expenses | | | 2.23% | | | | 2.17% | | | | 2.17% | | | | 2.24% | | | | 2.30% | |
| Net investment income (loss) | | | (0.75% | ) | | | 0.00% | (A)(B) | | | (1.20% | ) | | | 1.72% | | | | (0.38% | ) |
| Portfolio turnover rate | | | 17% | | | | 42% | | | | 17% | | | | 15% | | | | 11% | |
| (A) | Less than $0.005 per share or 0.005%. |
| (B) | Reflects the impact of a corporate action event that resulted in a one-time increase to net investment income. If the corporate action event had not occurred, the Class A and Class C net investment income per share and ratio of net investment income to average net assets would have been lower by $0.13 and 0.65%, respectively. |
| (C) | The net investment loss per share is based on average shares outstanding for the period. |
| (D) | Total returns shown exclude the effect of applicable sales loads. If these charges were included, the returns would be lower. |
See accompanying Notes to Financial Statements.
123
| | Financial Highlights (Continued) |
Touchstone Small Cap Fund—Class Y
Selected Data for a Share Outstanding Throughout Each Period
| | | | | | Year Ended September 30, | | | | | | | |
| | | 2016 | | | 2015 | | | 2014 | | | 2013 | | | 2012 | |
| Net asset value at beginning of period | | $ | 17.93 | | | $ | 20.72 | | | $ | 19.59 | | | $ | 16.13 | | | $ | 12.00 | |
| Income (loss) from investment operations: | | | | | | | | | | | | | | | | | | | | |
| Net investment income (loss) | | | 0.05 | | | | 0.18 | (A) | | | (0.03 | )(B) | | | 0.46 | | | | 0.07 | |
| Net realized and unrealized gains (losses) on investments | | | 0.58 | | | | (1.37 | ) | | | 1.81 | | | | 3.34 | | | | 4.24 | |
| Total from investment operations | | | 0.63 | | | | (1.19 | ) | | | 1.78 | | | | 3.80 | | | | 4.31 | |
| Distributions from: | | | | | | | | | | | | | | | | | | | | |
| Net investment income | | | (0.17 | ) | | | (0.01 | ) | | | (0.36 | ) | | | (0.22 | ) | | | (0.01 | ) |
| Realized capital gains | | | (1.95 | ) | | | (1.59 | ) | | | (0.29 | ) | | | (0.12 | ) | | | (0.17 | ) |
| Total distributions | | | (2.12 | ) | | | (1.60 | ) | | | (0.65 | ) | | | (0.34 | ) | | | (0.18 | ) |
| Net asset value at end of period | | $ | 16.44 | | | $ | 17.93 | | | $ | 20.72 | | | $ | 19.59 | | | $ | 16.13 | |
| Total return | | | 3.97% | | | | (6.11% | ) | | | 9.12% | | | | 24.01% | | | | 36.23% | |
| Ratios and supplemental data: | | | | | | | | | | | | | | | | | | | | |
| Net assets at end of period (000’s) | | $ | 295,198 | | | $ | 333,971 | | | $ | 309,367 | | | $ | 258,024 | | | $ | 168,987 | |
| Ratio to average net assets: | | | | | | | | | | | | | | | | | | | | |
| Net expenses | | | 1.13% | | | | 1.11% | | | | 1.06% | | | | 1.03% | | | | 1.04% | |
| Gross expenses | | | 1.14% | | | | 1.11% | | | | 1.08% | | | | 1.14% | | | | 1.17% | |
| Net investment income (loss) | | | 0.25% | | | | 1.02% | (A) | | | (0.15% | ) | | | 2.78% | | | | 0.66% | |
| Portfolio turnover rate | | | 17% | | | | 42% | | | | 17% | | | | 15% | | | | 11% | |
Touchstone Small Cap Fund—Institutional Class
Selected Data for a Share Outstanding Throughout Each Period
| | | Year Ended September 30, | |
| | | 2016 | | | 2015 | | | 2014 | | | 2013 | | | 2012 | |
| Net asset value at beginning of period | | $ | 17.92 | | | $ | 20.69 | | | $ | 19.57 | | | $ | 16.11 | | | $ | 11.99 | |
| Income (loss) from investment operations: | | | | | | | | | | | | | | | | | | | | |
| Net investment income (loss) | | | 0.07 | | | | 0.24 | (A) | | | (0.02 | )(B) | | | 0.49 | | | | 0.06 | |
| Net realized and unrealized gains (losses) on investments | | | 0.57 | | | | (1.41 | ) | | | 1.81 | | | | 3.32 | | | | 4.26 | |
| Total from investment operations | | | 0.64 | | | | (1.17 | ) | | | 1.79 | | | | 3.81 | | | | 4.32 | |
| Distributions from: | | | | | | | | | | | | | | | | | | | | |
| Net investment income | | | (0.18 | ) | | | (0.01 | ) | | | (0.38 | ) | | | (0.23 | ) | | | (0.03 | ) |
| Realized capital gains | | | (1.95 | ) | | | (1.59 | ) | | | (0.29 | ) | | | (0.12 | ) | | | (0.17 | ) |
| Total distributions | | | (2.13 | ) | | | (1.60 | ) | | | (0.67 | ) | | | (0.35 | ) | | | (0.20 | ) |
| Net asset value at end of period | | $ | 16.43 | | | $ | 17.92 | | | $ | 20.69 | | | $ | 19.57 | | | $ | 16.11 | |
| Total return | | | 4.05% | | | | (6.01% | ) | | | 9.17% | | | | 24.13% | | | | 36.32% | |
| Ratios and supplemental data: | | | | | | | | | | | | | | | | | | | | |
| Net assets at end of period (000’s) | | $ | 255,422 | | | $ | 301,868 | | | $ | 393,287 | | | $ | 395,770 | | | $ | 247,876 | |
| Ratio to average net assets: | | | | | | | | | | | | | | | | | | | | |
| Net expenses | | | 1.04% | | | | 1.04% | | | | 1.01% | | | | 0.94% | | | | 0.94% | |
| Gross expenses | | | 1.04% | | | | 1.04% | | | | 1.04% | | | | 1.07% | | | | 1.09% | |
| Net investment income (loss) | | | 0.34% | | | | 1.10% | (A) | | | (0.10% | ) | | | 2.87% | | | | 0.77% | |
| Portfolio turnover rate | | | 17% | | | | 42% | | | | 17% | | | | 15% | | | | 11% | |
| (A) | Reflects the impact of a corporate action event that resulted in a one-time increase to net investment income. If the corporate action event had not occurred, the Class Y and Institutional Class net investment income per share and ratio of net investment income to average net assets would have been lower by $0.13 and 0.65%, respectively. |
| (B) | The net investment loss per share is based on average shares outstanding for the period. |
See accompanying Notes to Financial Statements.
124
| Financial Highlights (Continued) | |
Touchstone Small Cap Value Fund—Class A
Selected Data for a Share Outstanding Throughout Each Period
| | | Year Ended September 30, | |
| | | 2016 | | | 2015 | | | 2014 | | | 2013 | | | 2012 | |
| Net asset value at beginning of period | | $ | 20.17 | | | $ | 23.23 | | | $ | 22.79 | | | $ | 18.33 | | | $ | 13.85 | |
| Income (loss) from investment operations: | | | | | | | | | | | | | | | | | | | | |
| Net investment income | | | 0.23 | | | | 0.36 | | | | 0.36 | | | | 0.41 | | | | 0.21 | (A) |
| Net realized and unrealized gains (losses) on investments | | | 2.80 | | | | (2.15 | ) | | | 0.39 | | | | 4.45 | | | | 4.60 | |
| Total from investment operations | | | 3.03 | | | | (1.79 | ) | | | 0.75 | | | | 4.86 | | | | 4.81 | |
| Distributions from: | | | | | | | | | | | | | | | | | | | | |
| Net investment income | | | (0.27 | ) | | | (0.35 | ) | | | (0.31 | ) | | | (0.40 | ) | | | (0.33 | ) |
| Realized capital gains | | | (0.73 | ) | | | (0.92 | ) | | | — | | | | — | | | | — | |
| Total distributions | | | (1.00 | ) | | | (1.27 | ) | | | (0.31 | ) | | | (0.40 | ) | | | (0.33 | ) |
| Net asset value at end of period | | $ | 22.20 | | | $ | 20.17 | | | $ | 23.23 | | | $ | 22.79 | | | $ | 18.33 | |
| Total return(B) | | | 15.63% | | | | (8.32% | ) | | | 3.19% | | | | 26.82% | | | | 34.87% | |
| Ratios and supplemental data: | | | | | | | | | | | | | | | | | | | | |
| Net assets at end of period (000’s) | | $ | 150,081 | | | $ | 24,659 | | | $ | 31,773 | | | $ | 34,826 | | | $ | 32,115 | |
| Ratio to average net assets: | | | | | | | | | | | | | | | | | | | | |
| Net expenses | | | 1.38% | | | | 1.38% | | | | 1.43% | | | | 1.43% | | | | 1.43% | |
| Gross expenses | | | 1.67% | | | | 1.60% | | | | 1.67% | | | | 1.78% | | | | 1.77% | |
| Net investment income | | | 1.05% | | | | 1.51% | | | | 1.44% | | | | 1.98% | | | | 1.26% | |
| Portfolio turnover rate | | | 155% | | | | 112% | | | | 100% | (C)(D) | | | 98% | | | | 109% | |
Touchstone Small Cap Value Fund—Class C
Selected Data for a Share Outstanding Throughout Each Period
| | | Year Ended September 30, | |
| | | 2016 | | | 2015 | | | 2014 | | | 2013 | | | 2012 | |
| Net asset value at beginning of period | | $ | 19.98 | | | $ | 23.00 | | | $ | 22.61 | | | $ | 18.23 | | | $ | 13.82 | |
| Income (loss) from investment operations: | | | | | | | | | | | | | | | | | | | | |
| Net investment income | | | 0.06 | | | | 0.17 | | | | 0.16 | | | | 0.29 | | | | 0.09 | (A) |
| Net realized and unrealized gains (losses) on investments | | | 2.77 | | | | (2.10 | ) | | | 0.40 | | | | 4.39 | | | | 4.58 | |
| Total from investment operations | | | 2.83 | | | | (1.93 | ) | | | 0.56 | | | | 4.68 | | | | 4.67 | |
| Distributions from: | | | | | | | | | | | | | | | | | | | | |
| Net investment income | | | (0.13 | ) | | | (0.17 | ) | | | (0.17 | ) | | | (0.30 | ) | | | (0.26 | ) |
| Realized capital gains | | | (0.73 | ) | | | (0.92 | ) | | | — | | | | — | | | | — | |
| Total distributions | | | (0.86 | ) | | | (1.09 | ) | | | (0.17 | ) | | | (0.30 | ) | | | (0.26 | ) |
| Net asset value at end of period | | $ | 21.95 | | | $ | 19.98 | | | $ | 23.00 | | | $ | 22.61 | | | $ | 18.23 | |
| Total return(B) | | | 14.72% | | | | (9.01% | ) | | | 2.46% | | | | 25.90% | | | | 33.95% | |
| Ratios and supplemental data: | | | | | | | | | | | | | | | | | | | | |
| Net assets at end of period (000’s) | | $ | 1,376 | | | $ | 1,396 | | | $ | 2,169 | | | $ | 841 | | | $ | 104 | |
| Ratio to average net assets: | | | | | | | | | | | | | | | | | | | | |
| Net expenses | | | 2.13% | | | | 2.13% | | | | 2.18% | | | | 2.18% | | | | 2.18% | |
| Gross expenses | | | 3.39% | | | | 3.13% | | | | 3.25% | | | | 5.19% | | | | 28.35% | |
| Net investment income | | | 0.30% | | | | 0.76% | | | | 0.69% | | | | 1.23% | | | | 0.51% | |
| Portfolio turnover rate | | | 155% | | | | 112% | | | | 100% | (C)(D) | | | 98% | | | | 109% | |
| (A) | The net investment income per share is based on average shares outstanding for the period. |
| (B) | Total returns shown exclude the effect of applicable sales loads. If these charges were included, the returns would be lower. |
| (C) | Portfolio turnover rate excludes securities received from a subscription-in-kind. |
| (D) | Portfolio turnover excludes the purchases and sales of the Touchstone Small Company Value Fund acquired on March 21, 2014. If these transactions were included, portfolio turnover would have been higher. |
See accompanying Notes to Financial Statements.
125
| | Financial Highlights (Continued) |
Touchstone Small Cap Value Fund—Class Y
Selected Data for a Share Outstanding Throughout Each Period
| | | Year Ended September 30, |
| | | 2016 | | | 2015 | | | 2014 | | | 2013 | | | 2012 | |
| Net asset value at beginning of period | | $ | 20.20 | | | $ | 23.25 | | | $ | 22.82 | | | $ | 18.36 | | | $ | 13.89 | |
| Income (loss) from investment operations: | | | | | | | | | | | | | | | | | | | | |
| Net investment income | | | 0.24 | | | | 0.42 | | | | 0.35 | | | | 0.48 | | | | 0.26 | (A) |
| Net realized and unrealized gains (losses) on investments | | | 2.84 | | | | (2.14 | ) | | | 0.46 | | | | 4.44 | | | | 4.59 | |
| Total from investment operations | | | 3.08 | | | | (1.72 | ) | | | 0.81 | | | | 4.92 | | | | 4.85 | |
| Distributions from: | | | | | | | | | | | | | | | | | | | | |
| Net investment income | | | (0.31 | ) | | | (0.41 | ) | | | (0.38 | ) | | | (0.46 | ) | | | (0.38 | ) |
| Realized capital gains | | | (0.73 | ) | | | (0.92 | ) | | | — | | | | — | | | | — | |
| Total distributions | | | (1.04 | ) | | | (1.33 | ) | | | (0.38 | ) | | | (0.46 | ) | | | (0.38 | ) |
| Net asset value at end of period | | $ | 22.24 | | | $ | 20.20 | | | $ | 23.25 | | | $ | 22.82 | | | $ | 18.36 | |
| Total return | | | 15.86% | | | | (8.08% | ) | | | 3.47% | | | | 27.11% | | | | 35.19% | |
| Ratios and supplemental data: | | | | | | | | | | | | | | | | | | | | |
| Net assets at end of period (000’s) | | $ | 3,080 | | | $ | 4,419 | | | $ | 9,097 | | | $ | 769 | | | $ | 222 | |
| Ratio to average net assets: | | | | | | | | | | | | | | | | | | | | |
| Net expenses | | | 1.13% | | | | 1.13% | | | | 1.18% | | | | 1.18% | | | | 1.18% | |
| Gross expenses | | | 1.70% | | | | 1.44% | | | | 1.65% | | | | 3.45% | | | | 22.47% | |
| Net investment income | | | 1.30% | | | | 1.76% | | | | 1.70% | | | | 2.23% | | | | 1.51% | |
| Portfolio turnover rate | | | 155% | | | | 112% | | | | 100% | (B)(C) | | | 98% | | | | 109% | |
Touchstone Small Cap Value Fund—Institutional Class
Selected Data for a Share Outstanding Throughout Each Period
| | | Year Ended September 30, |
| | | 2016 | | | 2015 | | | 2014 | | | 2013 | | | 2012 | |
| Net asset value at beginning of period | | $ | 20.19 | | | $ | 23.24 | | | $ | 22.81 | | | $ | 18.35 | | | $ | 13.86 | |
| Income (loss) from investment operations: | | | | | | | | | | | | | | | | | | | | |
| Net investment income | | | 0.30 | | | | 0.45 | | | | 0.40 | | | | 0.48 | | | | 0.29 | (A) |
| Net realized and unrealized gains (losses) on investments | | | 2.80 | | | | (2.13 | ) | | | 0.44 | | | | 4.47 | | | | 4.60 | |
| Total from investment operations | | | 3.10 | | | | (1.68 | ) | | | 0.84 | | | | 4.95 | | | | 4.89 | |
| Distributions from: | | | | | | | | | | | | | | | | | | | | |
| Net investment income | | | (0.34 | ) | | | (0.45 | ) | | | (0.41 | ) | | | (0.49 | ) | | | (0.40 | ) |
| Realized capital gains | | | (0.73 | ) | | | (0.92 | ) | | | — | | | | — | | | | — | |
| Total distributions | | | (1.07 | ) | | | (1.37 | ) | | | (0.41 | ) | | | (0.49 | ) | | | (0.40 | ) |
| Net asset value at end of period | | $ | 22.22 | | | $ | 20.19 | | | $ | 23.24 | | | $ | 22.81 | | | $ | 18.35 | |
| Total return | | | 16.05% | | | | (7.93% | ) | | | 3.59% | | | | 27.30% | | | | 35.56% | |
| Ratios and supplemental data: | | | | | | | | | | | | | | | | | | | | |
| Net assets at end of period (000’s) | | $ | 23,740 | | | $ | 25,968 | | | $ | 29,831 | | | $ | 2,665 | | | $ | 1,160 | |
| Ratio to average net assets: | | | | | | | | | | | | | | | | | | | | |
| Net expenses | | | 0.98% | | | | 0.98% | | | | 1.03% | | | | 1.03% | | | | 1.03% | |
| Gross expenses | | | 1.22% | | | | 1.19% | | | | 1.30% | | | | 1.83% | | | | 1.87% | |
| Net investment income | | | 1.45% | | | | 1.91% | | | | 1.84% | | | | 2.38% | | | | 1.66% | |
| Portfolio turnover rate | | | 155% | | | | 112% | | | | 100% | (B)(C) | | | 98% | | | | 109% | |
| (A) | The net investment income per share is based on average shares outstanding for the period. |
| (B) | Portfolio turnover rate excludes securities received from a subscription-in-kind. |
| (C) | Portfolio turnover excludes the purchases and sales of the Touchstone Small Company Value Fund acquired on March 21, 2014. If these transactions were included, portfolio turnover would have been higher. |
See accompanying Notes to Financial Statements.
126
| Financial Highlights (Continued) | |
Touchstone Total Return Bond Fund—Class A
Selected Data for a Share Outstanding Throughout Each Period
| | | Year Ended September 30, |
| | | 2016 | | | 2015 | | | 2014 | | | 2013 | | | 2012 | |
| Net asset value at beginning of period | | $ | 10.19 | | | $ | 10.23 | | | $ | 10.07 | | | $ | 10.50 | | | $ | 10.13 | |
| Income (loss) from investment operations: | | | | | | | | | | | | | | | | | | | | |
| Net investment income | | | 0.24 | | | | 0.22 | | | | 0.23 | | | | 0.21 | | | | 0.23 | |
| Net realized and unrealized gains (losses) on investments | | | 0.22 | | | | 0.01 | | | | 0.22 | | | | (0.36 | ) | | | 0.41 | |
| Total from investment operations | | | 0.46 | | | | 0.23 | | | | 0.45 | | | | (0.15 | ) | | | 0.64 | |
| Distributions from: | | | | | | | | | | | | | | | | | | | | |
| Net investment income | | | (0.27 | ) | | | (0.27 | ) | | | (0.29 | ) | | | (0.27 | ) | | | (0.27 | ) |
| Realized capital gains | | | — | | | | — | | | | — | | | | (0.01 | ) | | | — | |
| Total distributions | | | (0.27 | ) | | | (0.27 | ) | | | (0.29 | ) | | | (0.28 | ) | | | (0.27 | ) |
| Net asset value at end of period | | $ | 10.38 | | | $ | 10.19 | | | $ | 10.23 | | | $ | 10.07 | | | $ | 10.50 | |
| Total return(A) | | | 4.57% | | | | 2.24% | | | | 4.53% | | | | (1.48% | ) | | | 6.42% | |
| Ratios and supplemental data: | | | | | | | | | | | | | | | | | | | | |
| Net assets at end of period (000’s) | | $ | 8,639 | | | $ | 5,749 | | | $ | 5,144 | | | $ | 12,167 | | | $ | 10,210 | |
| Ratio to average net assets: | | | | | | | | | | | | | | | | | | | | |
| Net expenses | | | 0.87% | | | | 0.90% | | | | 0.90% | | | | 0.90% | | | | 0.90% | |
| Gross expenses | | | 1.25% | | | | 1.26% | | | | 1.25% | | | | 1.10% | | | | 1.22% | |
| Net investment income | | | 2.26% | | | | 2.10% | | | | 2.32% | | | | 2.07% | | | | 2.26% | |
| Portfolio turnover rate | | | 12% | | | | 19% | | | | 5% | | | | 35% | | | | 79% | (B) |
Touchstone Total Return Bond Fund—Class C
Selected Data for a Share Outstanding Throughout Each Period
| | | Year Ended September 30, |
| | | 2016 | | | 2015 | | | 2014 | | | 2013 | | | 2012 | |
| Net asset value at beginning of period | | $ | 10.18 | | | $ | 10.21 | | | $ | 10.05 | | | $ | 10.49 | | | $ | 10.12 | |
| Income (loss) from investment operations: | | | | | | | | | | | | | | | | | | | | |
| Net investment income | | | 0.15 | | | | 0.14 | | | | 0.15 | | | | 0.11 | | | | 0.14 | |
| Net realized and unrealized gains (losses) on investments | | | 0.22 | | | | 0.02 | | �� | | 0.22 | | | | (0.35 | ) | | | 0.42 | |
| Total from investment operations | | | 0.37 | | | | 0.16 | | | | 0.37 | | | | (0.24 | ) | | | 0.56 | |
| Distributions from: | | | | | | | | | | | | | | | | | | | | |
| Net investment income | | | (0.19 | ) | | | (0.19 | ) | | | (0.21 | ) | | | (0.19 | ) | | | (0.19 | ) |
| Realized capital gains | | | — | | | | — | | | | — | | | | (0.01 | ) | | | — | |
| Total distributions | | | (0.19 | ) | | | (0.19 | ) | | | (0.21 | ) | | | (0.20 | ) | | | (0.19 | ) |
| Net asset value at end of period | | $ | 10.36 | | | $ | 10.18 | | | $ | 10.21 | | | $ | 10.05 | | | $ | 10.49 | |
| Total return(A) | | | 3.70% | | | | 1.60% | | | | 3.75% | | | | (2.33% | ) | | | 5.63% | |
| Ratios and supplemental data: | | | | | | | | | | | | | | | | | | | | |
| Net assets at end of period (000’s) | | $ | 2,813 | | | $ | 2,368 | | | $ | 1,634 | | | $ | 2,455 | | | $ | 3,257 | |
| Ratio to average net assets: | | | | | | | | | | | | | | | | | | | | |
| Net expenses | | | 1.62% | | | | 1.65% | | | | 1.65% | | | | 1.65% | | | | 1.65% | |
| Gross expenses | | | 2.19% | | | | 2.27% | | | | 2.47% | | | | 2.10% | | | | 2.03% | |
| Net investment income | | | 1.51% | | | | 1.35% | | | | 1.57% | | | | 1.32% | | | | 1.51% | |
| Portfolio turnover rate | | | 12% | | | | 19% | | | | 5% | | | | 35% | | | | 79% | (B) |
| (A) | Total returns shown exclude the effect of applicable sales loads. If these charges were included, the returns would be lower. |
| (B) | Portfolio turnover excludes the purchases and sales of the Old Mutual Barrow Hanley Core Bond Fund acquired on April 16, 2012. If these transactions were included, portfolio turnover would have been higher. |
See accompanying Notes to Financial Statements.
127
| | Financial Highlights (Continued) |
Touchstone Total Return Bond Fund—Class Y
Selected Data for a Share Outstanding Throughout Each Period
| | | Year Ended September 30, |
| | | 2016 | | | 2015 | | | 2014 | | | 2013 | | | 2012 | |
| Net asset value at beginning of period | | $ | 10.20 | | | $ | 10.24 | | | $ | 10.08 | | | $ | 10.52 | | | $ | 10.15 | |
| Income (loss) from investment operations: | | | | | | | | | | | | | | | | | | | | |
| Net investment income | | | 0.26 | | | | 0.25 | | | | 0.26 | | | | 0.23 | | | | 0.25 | |
| Net realized and unrealized gains (losses) on investments | | | 0.23 | | | | 0.01 | | | | 0.22 | | | | (0.36 | ) | | | 0.42 | |
| Total from investment operations | | | 0.49 | | | | 0.26 | | | | 0.48 | | | | (0.13 | ) | | | 0.67 | |
| Distributions from: | | | | | | | | | | | | | | | | | | | | |
| Net investment income | | | (0.30 | ) | | | (0.30 | ) | | | (0.32 | ) | | | (0.30 | ) | | | (0.30 | ) |
| Realized capital gains | | | — | | | | — | | | | — | | | | (0.01 | ) | | | — | |
| Total distributions | | | (0.30 | ) | | | (0.30 | ) | | | (0.32 | ) | | | (0.31 | ) | | | (0.30 | ) |
| Net asset value at end of period | | $ | 10.39 | | | $ | 10.20 | | | $ | 10.24 | | | $ | 10.08 | | | $ | 10.52 | |
| Total return | | | 4.82% | | | | 2.51% | | | | 4.84% | | | | (1.32% | ) | | | 6.72% | |
| Ratios and supplemental data: | | | | | | | | | | | | | | | | | | | | |
| Net assets at end of period (000’s) | | $ | 49,484 | | | $ | 39,751 | | | $ | 19,397 | | | $ | 19,635 | | | $ | 29,716 | |
| Ratio to average net assets: | | | | | | | | | | | | | | | | | | | | |
| Net expenses | | | 0.62% | | | | 0.65% | | | | 0.61% | | | | 0.62% | | | | 0.58% | |
| Gross expenses | | | 0.71% | | | | 0.70% | | | | 0.68% | | | | 0.71% | | | | 0.70% | |
| Net investment income | | | 2.51% | | | | 2.35% | | | | 2.61% | | | | 2.34% | | | | 2.59% | |
| Portfolio turnover rate | | | 12% | | | | 19% | | | | 5% | | | | 35% | | | | 79% | (A) |
Touchstone Total Return Bond Fund — Institutional Class
Selected Data for a Share Outstanding Throughout Each Period
| | | Year Ended September 30, |
| | | 2016 | | | 2015 | | | 2014 | | | 2013 | | | 2012 | |
| Net asset value at beginning of period | | $ | 10.20 | | | $ | 10.24 | | | $ | 10.08 | | | $ | 10.51 | | | $ | 10.14 | |
| Income (loss) from investment operations: | | | | | | | | | | | | | | | | | | | | |
| Net investment income | | | 0.28 | | | | 0.26 | | | | 0.27 | | | | 0.25 | | | | 0.22 | |
| Net realized and unrealized gains (losses) on investments | | | 0.22 | | | | 0.01 | | | | 0.22 | | | | (0.36 | ) | | | 0.46 | |
| Total from investment operations | | | 0.50 | | | | 0.27 | | | | 0.49 | | | | (0.11 | ) | | | 0.68 | |
| Distributions from: | | | | | | | | | | | | | | | | | | | | |
| Net investment income | | | (0.31 | ) | | | (0.31 | ) | | | (0.33 | ) | | | (0.31 | ) | | | (0.31 | ) |
| Realized capital gains | | | — | | | | — | | | | — | | | | (0.01 | ) | | | — | |
| Total distributions | | | (0.31 | ) | | | (0.31 | ) | | | (0.33 | ) | | | (0.32 | ) | | | (0.31 | ) |
| Net asset value at end of period | | $ | 10.39 | | | $ | 10.20 | | | $ | 10.24 | | | $ | 10.08 | | | $ | 10.51 | |
| Total return | | | 4.94% | | | | 2.65% | | | | 4.96% | | | | (1.09% | ) | | | 6.81% | |
| Ratios and supplemental data: | | | | | | | | | | | | | | | | | | | | |
| Net assets at end of period (000’s) | | $ | 166,008 | | | $ | 134,877 | | | $ | 116,404 | | | $ | 133,051 | | | $ | 148,341 | |
| Ratio to average net assets: | | | | | | | | | | | | | | | | | | | | |
| Net expenses | | | 0.50% | | | | 0.50% | | | | 0.50% | | | | 0.50% | | | | 0.50% | |
| Gross expenses | | | 0.60% | | | | 0.61% | | | | 0.60% | | | | 0.60% | | | | 0.67% | |
| Net investment income | | | 2.63% | | | | 2.50% | | | | 2.72% | | | | 2.47% | | | | 2.66% | |
| Portfolio turnover rate | | | 12% | | | | 19% | | | | 5% | | | | 35% | | | | 79% | (A) |
| (A) | Portfolio turnover excludes the purchases and sales of the Old Mutual Barrow Hanley Core Bond Fund acquired on April 16, 2012. If these transactions were included, portfolio turnover would have been higher. |
See accompanying Notes to Financial Statements.
128
| Financial Highlights (Continued) | |
Touchstone Ultra Short Duration Fixed Income Fund—Class A
Selected Data for a Share Outstanding Throughout Each Period
| | | | | | | | | | | | | | | Period |
| | | | | | | | | | | | | | | Ended |
| | | Year Ended September 30, | | September 30, |
| | | 2016 | | | 2015 | | | 2014 | | | 2013 | | | 2012(A) |
| Net asset value at beginning of period | | $ | 9.32 | | | $ | 9.41 | | | $ | 9.45 | | | $ | 9.56 | | | $ | 9.57 | |
| Income (loss) from investment operations: | | | | | | | | | | | | | | | | | | | | |
| Net investment income | | | 0.10 | | | | 0.06 | | | | 0.06 | | | | 0.09 | | | | 0.09 | |
| Net realized and unrealized gains (losses) on investments | | | 0.02 | | | | (0.03 | ) | | | 0.03 | | | | (0.04 | ) | | | (0.01 | ) |
| Total from investment operations | | | 0.12 | | | | 0.03 | | | | 0.09 | | | | 0.05 | | | | 0.08 | |
| Distributions from: | | | | | | | | | | | | | | | | | | | | |
| Net investment income | | | (0.12 | ) | | | (0.12 | ) | | | (0.13 | ) | | | (0.16 | ) | | | (0.09 | ) |
| Net asset value at end of period | | $ | 9.32 | | | $ | 9.32 | | | $ | 9.41 | | | $ | 9.45 | | | $ | 9.56 | |
| Total return(B) | | | 1.35% | | | | 0.31% | | | | 0.92% | | | | 0.48% | | | | 0.85% | (C) |
| Ratios and supplemental data: | | | | | | | | | | | | | | | | | | | | |
| Net assets at end of period (000’s) | | $ | 16,946 | | | $ | 10,675 | | | $ | 10,596 | | | $ | 32,088 | | | $ | 34,228 | |
| Ratio to average net assets: | | | | | | | | | | | | | | | | | | | | |
| Net expenses | | | 0.69% | | | | 0.69% | | | | 0.69% | | | | 0.69% | | | | 0.69% | (D) |
| Gross expenses | | | 0.97% | | | | 0.99% | | | | 0.93% | | | | 0.83% | | | | 1.19% | (D) |
| Net investment income | | | 1.09% | | | | 0.54% | | | | 0.79% | | | | 0.85% | | | | 1.40% | (D) |
| Portfolio turnover rate | | | 169% | | | | 132% | | | | 142% | | | | 107% | (E) | | | 169% | (F) |
Touchstone Ultra Short Duration Fixed Income Fund—Class C
Selected Data for a Share Outstanding Throughout Each Period
| | | | | | | | | | | | | | | Period |
| | | | | | | | | | | | | | | Ended |
| | | Year Ended September 30, | | September 30, |
| | | 2016 | | | 2015 | | | 2014 | | | 2013 | | | 2012(A) |
| Net asset value at beginning of period | | $ | 9.32 | | | $ | 9.41 | | | $ | 9.45 | | | $ | 9.56 | | | $ | 9.57 | |
| Income (loss) from investment operations: | | | | | | | | | | | | | | | | | | | | |
| Net investment income | | | 0.06 | | | | — | (G) | | | 0.02 | | | | 0.04 | | | | 0.05 | |
| Net realized and unrealized gains (losses) on investments | | | 0.02 | | | | (0.02 | ) | | | 0.02 | | | | (0.04 | ) | | | 0.01 | |
| Total from investment operations | | | 0.08 | | | | (0.02 | ) | | | 0.04 | | | | — | | | | 0.06 | |
| Distributions from: | | | | | | | | | | | | | | | | | | | | |
| Net investment income | | | (0.08 | ) | | | (0.07 | ) | | | (0.08 | ) | | | (0.11 | ) | | | (0.07 | ) |
| Net asset value at end of period | | $ | 9.32 | | | $ | 9.32 | | | $ | 9.41 | | | $ | 9.45 | | | $ | 9.56 | |
| Total return(B) | | | 0.84% | | | | (0.19% | ) | | | 0.42% | | | | (0.02% | ) | | | 0.62% | (C) |
| Ratios and supplemental data: | | | | | | | | | | | | | | | | | | | | |
| Net assets at end of period (000’s) | | $ | 7,961 | | | $ | 8,291 | | | $ | 11,272 | | | $ | 13,568 | | | $ | 11,517 | |
| Ratio to average net assets: | | | | | | | | | | | | | | | | | | | | |
| Net expenses | | | 1.19% | | | | 1.19% | | | | 1.19% | | | | 1.19% | | | | 1.19% | (D) |
| Gross expenses | | | 1.54% | | | | 1.48% | | | | 1.44% | | | | 1.39% | | | | 1.68% | (D) |
| Net investment income | | | 0.59% | | | | 0.04% | | | | 0.29% | | | | 0.35% | | | | 0.90% | (D) |
| Portfolio turnover rate | | | 169% | | | | 132% | | | | 142% | | | | 107% | (E) | | | 169% | (F) |
| (A) | Represents the period from commencement of operations (April 16, 2012) through September 30, 2012. |
| (B) | Total returns shown exclude the effect of applicable sales loads. If these charges were included, the returns would be lower. |
| (C) | Not annualized. |
| (D) | Annualized. |
| (E) | Portfolio turnover excludes the purchases and sales of the Touchstone Short Duration Fixed Income Fund acquired on May 17, 2013. If these transactions were included, portfolio turnover would have been higher. |
| (F) | Portfolio turnover excludes the purchases and sales of the Old Mutual Dwight Short Term Fixed Income Fund and Fifth Third Short Term Bond Fund acquired on April 16, 2012 and September 10, 2012, respectively. If these transactions were included, portfolio turnover would have been higher. |
| (G) | Less than $0.005 per share. |
See accompanying Notes to Financial Statements.
129
| | Financial Highlights (Continued) |
Touchstone Ultra Short Duration Fixed Income Fund—Class Y
Selected Data for a Share Outstanding Throughout Each Period
| | | | | | | | | | | | | | | Period |
| | | | | | | | | | | | | | | Ended |
| | | Year Ended September 30, | | September 30, |
| | | 2016 | | | 2015 | | | 2014 | | | 2013 | | | 2012(A) |
| Net asset value at beginning of period | | $ | 9.32 | | | $ | 9.41 | | | $ | 9.45 | | | $ | 9.56 | | | $ | 9.57 | |
| Income (loss) from investment operations: | | | | | | | | | | | | | | | | | | | | |
| Net investment income | | | 0.13 | | | | 0.07 | | | | 0.10 | | | | 0.12 | | | | 0.08 | |
| Net realized and unrealized gains (losses) on investments | | | 0.02 | | | | (0.02 | ) | | | 0.01 | | | | (0.05 | ) | | | 0.01 | |
| Total from investment operations | | | 0.15 | | | | 0.05 | | | | 0.11 | | | | 0.07 | | | | 0.09 | |
| Distributions from: | | | | | | | | | | | | | | | | | | | | |
| Net investment income | | | (0.15 | ) | | | (0.14 | ) | | | (0.15 | ) | | | (0.18 | ) | | | (0.10 | ) |
| Net asset value at end of period | | $ | 9.32 | | | $ | 9.32 | | | $ | 9.41 | | | $ | 9.45 | | | $ | 9.56 | |
| Total return | | | 1.60% | | | | 0.56% | | | | 1.17% | | | | 0.74% | | | | 0.97% | (B) |
| Ratios and supplemental data: | | | | | | | | | | | | | | | | | | | | |
| Net assets at end of period (000’s) | | $ | 206,313 | | | $ | 200,456 | | | $ | 244,885 | | | $ | 249,250 | | | $ | 190,515 | |
| Ratio to average net assets: | | | | | | | | | | | | | | | | | | | | |
| Net expenses | | | 0.44% | | | | 0.44% | | | | 0.44% | | | | 0.44% | | | | 0.44% | (C) |
| Gross expenses | | | 0.53% | | | | 0.52% | | | | 0.49% | | | | 0.51% | | | | 0.55% | (C) |
| Net investment income | | | 1.34% | | | | 0.79% | | | | 1.04% | | | | 1.10% | | | | 1.65% | (C) |
| Portfolio turnover rate | | | 169% | | | | 132% | | | | 142% | | | | 107% | (D) | | | 169% | (E) |
Touchstone Ultra Short Duration Fixed Income Fund—Class Z
Selected Data for a Share Outstanding Throughout Each Period
| | | Year Ended September 30, |
| | | 2016 | | | 2015 | | | 2014 | | | 2013 | | | 2012 | |
| Net asset value at beginning of period | | $ | 9.32 | | | $ | 9.41 | | | $ | 9.45 | | | $ | 9.56 | | | $ | 9.58 | |
| Income (loss) from investment operations: | | | | | | | | | | | | | | | | | | | | |
| Net investment income | | | 0.10 | | | | 0.05 | | | | 0.08 | | | | 0.09 | | | | 0.14 | |
| Net realized and unrealized gains (losses) on investment | | | 0.02 | | | | (0.02 | ) | | | 0.01 | | | | (0.04 | ) | | | 0.06 | |
| Total from investment operations | | | 0.12 | | | | 0.03 | | | | 0.09 | | | | 0.05 | | | | 0.20 | |
| Distributions from: | | | | | | | | | | | | | | | | | | | | |
| Net investment income | | | (0.12 | ) | | | (0.12 | ) | | | (0.13 | ) | | | (0.16 | ) | | | (0.22 | ) |
| Net asset value at end of period | | $ | 9.32 | | | $ | 9.32 | | | $ | 9.41 | | | $ | 9.45 | | | $ | 9.56 | |
| Total return | | | 1.35% | | | | 0.31% | | | | 0.91% | | | | 0.52% | | | | 2.10% | |
| Ratios and supplemental data: | | | | | | | | | | | | | | | | | | | | |
| Net assets at end of period (000’s) | | $ | 245,252 | | | $ | 304,553 | | | $ | 401,851 | | | $ | 381,554 | | | $ | 338,669 | |
| Ratio to average net assets: | | | | | | | | | | | | | | | | | | | | |
| Net expenses | | | 0.69% | | | | 0.69% | | | | 0.69% | | | | 0.65% | | | | 0.64% | |
| Gross expenses | | | 0.79% | | | | 0.76% | | | | 0.76% | | | | 0.73% | | | | 0.73% | |
| Net Investment Income | | | 1.09% | | | | 0.54% | | | | 0.79% | | | | 0.89% | | | | 1.45% | |
| Portfolio turnover rate | | | 169% | | | | 132% | | | | 142% | | | | 107% | (D) | | | 169% | (E) |
| (A) | Represents the period from commencement of operations (April 16, 2012) through September 30, 2012. |
| (B) | Not annualized. |
| (C) | Annualized. |
| (D) | Portfolio turnover excludes the purchases and sales of the Touchstone Short Duration Fixed Income Fund acquired on May 17, 2013. If these transactions were included, portfolio turnover would have been higher. |
| (E) | Portfolio turnover excludes the purchases and sales of the Old Mutual Dwight Short Term Fixed Income Fund and Fifth Third Short Term Bond Fund acquired on April 16, 2012 and September 10, 2012, respectively. If these transactions were included, portfolio turnover would have been higher. |
See accompanying Notes to Financial Statements.
130
| Financial Highlights (Continued) | |
Touchstone Ultra Short Duration Fixed Income Fund—Institutional Class
Selected Data for a Share Outstanding Throughout Each Period
| | | | | | | | | | | | | | | Period |
| | | | | | | | | | | | | | | Ended |
| | | Year Ended September 30, | | September 30, |
| | | 2016 | | | 2015 | | | 2014 | | | 2013 | | | 2012(A) |
| Net asset value at beginning of period | | $ | 9.32 | | | $ | 9.41 | | | $ | 9.45 | | | $ | 9.56 | | | $ | 9.57 | |
| Income (loss) from investment operations: | | | | | | | | | | | | | | | | | | | | |
| Net investment income | | | 0.13 | | | | 0.08 | | | | 0.10 | | | | 0.14 | | | | 0.09 | |
| Net realized and unrealized gains (losses) on investments | | | 0.02 | | | | (0.02 | ) | | | 0.01 | | | | (0.07 | ) | | | — | (B) |
| Total from investment operations | | | 0.15 | | | | 0.06 | | | | 0.11 | | | | 0.07 | | | | 0.09 | |
| Distributions from: | | | | | | | | | | | | | | | | | | | | |
| Net investment income | | | (0.15 | ) | | | (0.15 | ) | | | (0.15 | ) | | | (0.18 | ) | | | (0.10 | ) |
| Net asset value at end of period | | $ | 9.32 | | | $ | 9.32 | | | $ | 9.41 | | | $ | 9.45 | | | $ | 9.56 | |
| Total return | | | 1.54% | | | | 0.61% | | | | 1.22% | | | | 0.78% | | | | 0.99% | (C) |
| Ratios and supplemental data: | | | | | | | | | | | | | | | | | | | | |
| Net assets at end of period (000’s) | | $ | 142,913 | | | $ | 49,389 | | | $ | 50,853 | | | $ | 59,662 | | | $ | 6,697 | |
| Ratio to average net assets: | | | | | | | | | | | | | | | | | | | | |
| Net expenses | | | 0.39% | | | | 0.39% | | | | 0.39% | | | | 0.39% | | | | 0.39% | (D) |
| Gross expenses | | | 0.46% | | | | 0.48% | | | | 0.48% | | | | 0.52% | | | | 1.23% | (D) |
| Net investment income | | | 1.39% | | | | 0.84% | | | | 1.09% | | | | 1.15% | | | | 1.70% | (D) |
| Portfolio turnover rate | | | 169% | | | | 132% | | | | 142% | | | | 107% | (E) | | | 169% | (F) |
| (A) | Represents the period from commencement of operations (April 16, 2012) through September 30, 2012. |
| (B) | Less than $0.005 per share. |
| (C) | Not annualized. |
| (D) | Annualized. |
| (E) | Portfolio turnover excludes the purchases and sales of the Touchstone Short Duration Fixed Income Fund acquired on May 17, 2013. If these transactions were included, portfolio turnover would have been higher. |
| (F) | Portfolio turnover excludes the purchases and sales of the Old Mutual Dwight Short Term Fixed Income Fund and Fifth Third Short Term Bond Fund acquired on April 16, 2012 and September 10, 2012, respectively. If these transactions were included, portfolio turnover would have been higher. |
See accompanying Notes to Financial Statements.
131
| | Notes to Financial Statements
September 30, 2016 |
1. Organization
The Touchstone Funds Group Trust (the “Trust”) is registered under the Investment Company Act of 1940, as amended (the “1940 Act”), as an open-end management investment company. The Trust was established as a Delaware statutory trust pursuant to an Agreement and Declaration of Trust dated October 25, 1993. The Trust consists of eleven funds (individually, a “Fund,” and collectively, the “Funds”):
Touchstone Arbitrage Fund (“Arbitrage Fund”)
Touchstone Emerging Markets Small Cap Fund (“Emerging Markets Small Cap Fund”) (formerly known as Touchstone Emerging Markets Equity Fund)
Touchstone Merger Arbitrage Fund (“Merger Arbitrage Fund”)
Touchstone Mid Cap Fund (“Mid Cap Fund”)
Touchstone Mid Cap Value Fund (“Mid Cap Value Fund”)
Touchstone Premium Yield Equity Fund (“Premium Yield Equity Fund”)
Touchstone Sands Capital Select Growth Fund (“Sands Capital Select Growth Fund”)
Touchstone Small Cap Fund (“Small Cap Fund”)
Touchstone Small Cap Value Fund (“Small Cap Value Fund”)
Touchstone Total Return Bond Fund (“Total Return Bond Fund”)
Touchstone Ultra Short Duration Fixed Income Fund (“Ultra Short Duration Fixed Income Fund”)
Each Fund is diversified, with the exception of the Arbitrage Fund, the Merger Arbitrage Fund, the Sands Capital Select Growth Fund and the Small Cap Fund, which are non-diversified.
The Agreement and Declaration of Trust permits the Trust to issue an unlimited number of shares of beneficial interest of each Fund. The table below indicates the classes of shares that each Fund is registered to offer:
| | Class A | Class C | Class Y | Class Z | Institutional
Class |
| Arbitrage Fund | X | X | X | | X |
| Emerging Markets Small Cap Fund | X | X | X | | X |
| Merger Arbitrage Fund | X | X | X | | X |
| Mid Cap Fund | X | X | X | X | X |
| Mid Cap Value Fund | X | X | X | | X |
| Premium Yield Equity Fund | X | X | X | | |
| Sands Capital Select Growth Fund | X | X | X | X | |
| Small Cap Fund | X | X | X | | X |
| Small Cap Value Fund | X | X | X | | X |
| Total Return Bond Fund | X | X | X | | X |
| Ultra Short Duration Fixed Income Fund | X | X | X | X | X |
The assets of each Fund are segregated, and a shareholder’s interest is limited to the Fund in which shares are held. The Funds’ prospectus provides a description of each Fund’s investment goals, policies, and strategies along with information on the classes of shares currently being offered.
132
| Notes to Financial Statements (Continued) | |
2. Significant Accounting Policies
The following is a summary of the Funds’ significant accounting policies:
Each Fund is an investment company that follows the accounting and reporting guidance of Accounting Standards Codification Topic 946 applicable to investment companies.
Security valuation and fair value measurements — U.S. generally accepted accounting principles (“U.S. GAAP”) define fair value as the price the Funds would receive to sell an asset or pay to transfer a liability in an orderly transaction between market participants at the measurement date. All investments in securities are recorded at their estimated fair value. The Funds define the term “market value”, as used throughout this report, as the estimated fair value. The Funds use various methods to measure fair value of their portfolio securities on a recurring basis. U.S. GAAP fair value measurement standards require disclosure of a hierarchy that prioritizes inputs to valuation methods.
These inputs are summarized in the three broad levels listed below:
| • | Level 1 – | quoted prices in active markets for identical securities |
| | | |
| • | Level 2 – | other significant observable inputs (including quoted prices for similar securities, interest rates, prepayment speeds, credit risk, etc.) |
| | | |
| • | Level 3 – | significant unobservable inputs (including a Fund’s own assumptions in determining the fair value of investments) |
The inputs or methodology used for valuing securities are not necessarily an indication of the risk associated with investing in those securities.
The aggregate value by input level, as of September 30, 2016, for each Fund’s investments, as well as a reconciliation of assets for which significant unobservable inputs (Level 3) were used in determining value, if applicable, is included in the Fund’s Portfolio of Investments, which also includes a breakdown of the Fund’s investments by geographic, portfolio or sector allocation. The Funds did not hold any Level 3 categorized securities during the year ended September 30, 2016.
Changes in valuation techniques may result in transfers into or out of an investment’s assigned level within the hierarchy. All transfers in and out of the levels are recognized at the value at the end of the period. During the year ended September 30, 2016, there were no transfers between Levels 1, 2 and 3 for all Funds.
The Funds’ portfolio securities are valued as of the close of the regular session of trading on the New York Stock Exchange (“NYSE”) (currently 4:00 p.m., Eastern Time). Portfolio securities traded on stock exchanges are valued at the last reported sale price, official close price, or last bid price if no sales are reported. Portfolio securities quoted by NASDAQ are valued at the NASDAQ Official Closing Price (“NOCP”) or from the primary exchange on which the security trades. To the extent these securities are actively traded, they are categorized in Level 1 of the fair value hierarchy. Options are valued at the last quoted sales price. If there is no such reported sale on the valuation date, long option positions are valued at the most recent bid price, and short option positions are valued at the most recent ask price and are categorized in Level 1. Shares of mutual funds in which the Funds invest are valued at their respective net asset values (“NAV”) as reported by the underlying funds (“Underlying Funds”) and are categorized in Level 1.
Debt securities held by the Funds are valued at their evaluated bid by an independent pricing service or at their last broker-quoted bid prices as obtained from one or more of the major market makers for such securities. Independent pricing services use information provided by market makers or estimates of market values through accepted market modeling conventions. Observable inputs to the models may include prepayment speeds, pricing spread, yield, trade information, dealer quotes, market color, cash flow models, the securities’ terms
133
| | Notes to Financial Statements (Continued) |
and conditions, among others, and are generally categorized in Level 2. Debt securities with remaining maturities of 60 days or less may be valued at amortized cost, provided such amount approximates market value and are categorized in Level 2. While this method provides consistency in valuation (and may only be used if it approximates market value), it may result in periods during which value, as determined by amortized cost, is higher or lower than the price that would be received if the Fund sold the investment.
Foreign currency exchange contracts are valued at the mean between the bid and ask prices and are determined as of the close of regular trading on the NYSE. Interpolated values are derived when the settlement date of the contract is an interim date for which quotations are not available and categorized in Level 2.
Securities mainly traded on a non-U.S. exchange or denominated in foreign currencies are generally valued according to the preceding closing values on that exchange, translated to U.S. dollars using currency exchange rates as of the close of regular trading on the NYSE, and are generally categorized in Level 1. However, if an event that may change the value of a security occurs after the time that the closing value on the non-U.S. exchange was determined, but before the close of regular trading on the NYSE, the security may be priced based on fair value and generally categorized in Level 2. This may cause the value of the security, if held on the books of a Fund to be different from the closing value on the non-U.S. exchange and may affect the calculation of that Fund’s NAV.
The Funds may use fair value pricing under the following circumstances, among others:
| • | If the value of a security has been materially affected by events occurring before the Funds’ pricing time but after the close of the primary markets on which the security is traded. |
| • | If the exchange on which a portfolio security is principally traded closes early or if trading in a particular portfolio security was halted during the day and did not resume prior to the Funds’ NAV calculation. |
| • | If a security is so thinly traded that reliable market quotations are unavailable due to infrequent trading. |
| • | If the validity of market quotations is not reliable. |
Securities held by the Funds that do not have readily available market quotations, significant observable inputs, or securities for which the available market quotations are not reliable, are priced at their estimated fair value using procedures approved by the Funds’ Board of Trustees and are generally categorized in Level 3.
Investment companies — The Funds may invest in securities of other investment companies, including exchange-traded funds (“ETFs”), open-end funds and closed-end funds. Open-end funds are investment companies that issue new shares continuously and redeem shares daily. Closed-end funds are investment companies that typically issue a fixed number of shares that trade on a securities exchange or over-the-counter. An ETF is an investment company that typically seeks to track the performance of an index by holding in its portfolio shares of all the companies, or a representative sample of the companies, that are components of a particular index. ETF shares are traded on a securities exchange based on their market value. The risks of investment in other investment companies typically reflect the risks of the types of securities in which the other investment companies invest. Investments in ETFs and closed-end funds are subject to the additional risk that their shares may trade at a premium or discount to their NAV. When a Fund invests in another investment company, shareholders of the Fund indirectly bear their proportionate share of the other investment company’s fees and expenses, including operating, registration, trustee, licensing, and marketing, as well as their share of the Fund’s fees and expenses.
Securities sold short — The Funds may engage in selling securities short, which obligates a Fund to replace a security borrowed by purchasing the same security at the current market value. A Fund would incur a loss if the price of the security increases between the date of the short sale and the date on which the Fund replaces the borrowed security. A Fund would realize a gain if the price of the security declines between those dates. As of September 30, 2016, the Arbitrage Fund and Merger Arbitrage Fund held securities sold short with a
134
| Notes to Financial Statements (Continued) | |
fair value of $47,363,225 and $48,024,193, respectively, and had securities with a fair value of $52,640,647 and $64,917,149, respectively, held as collateral and cash collateral of $36,608,741 and $14,426,614, respectively, for both securities sold short and written options.
Options — The Funds may write or purchase financial option contracts primarily to hedge against changes in the value of equity securities (or securities that the Funds intend to purchase), against fluctuations in fair value caused by changes in prevailing market interest rates or foreign currency exchange rates and against changes in overall equity market volatility. In addition, the Funds may utilize options in an attempt to generate gains from option premiums or to reduce overall portfolio risk. The Funds’ option strategy primarily focuses on the use of writing and/or purchasing call or put options on equity indexes. When the Funds write or purchase an option, an amount equal to the premium received or paid by the Funds is recorded as a liability or an asset and is subsequently adjusted to the current market value of the option written or purchased. Premiums received or paid from writing or purchasing options which expire unexercised are treated by the Funds on the expiration date as realized gains or losses. The difference between the premium and the amount paid or received on effecting a closing purchase or sale transaction, including brokerage commissions, is also treated as a realized gain or loss. If an option is exercised, the premium paid or received is added to the cost of the purchase or proceeds from the sale in determining whether the Funds have realized a gain or loss on investment transactions. The Funds, as writers of an option, may have no control over whether the underlying securities may be sold (call) or purchased (put) and as a result bear the market risk of an unfavorable change in the price of the security underlying the written option. The Funds, as purchasers of an option, bear the risk that the counterparties to the option may not have the ability to meet the terms of the option contracts. There is minimal counterparty credit risk involved in entering into option contracts since they are exchange-traded instruments and the exchange’s clearinghouse, as counterparty to all exchange-traded options, guarantees the options against default. As of September 30, 2016, the Arbitrage Fund and Merger Arbitrage Fund held written options with a fair value of $64,783 and $73,923 respectively, and had securities with a fair value of $52,640,647 and $64,917,149, respectively, held as collateral and cash collateral of $36,608,741 and $14,426,614, respectively, for both securities sold short and written options. The Arbitrage Fund and Merger Arbitrage Fund also held purchased options with a fair value of $45,445 and $57,858, as of September 30, 2016.
Warrants — The Funds can invest in warrants and stock purchase rights of companies of any market capitalization. A warrant gives the company the right to buy stock, typically from the issuer. The warrant specifies the amount of underlying stock, the purchase (or “exercise”) price, and the date the warrant expires. Certain warrants may permit, without legal obligation, net settlement for stock or cash. The Funds have no obligation to exercise the warrant and buy the stock.
Foreign currency translation — The books and records of the Funds are maintained in U.S. dollars and translated into U.S. dollars on the following basis:
(1) market value of investment securities, assets and liabilities at the current rate of exchange on the valuation date; and
(2) purchases and sales of investment securities, income, and expenses at the relevant rates of exchange prevailing on the respective dates of such transactions.
The Funds do not isolate that portion of gains and losses on investments in equity securities that is due to changes in the foreign exchange rates from that which is due to changes in market prices of equity securities.
Forward foreign currency contracts — A forward foreign currency contract is an agreement between two parties to buy and sell a specific currency at a price that is set on the date of the contract. The forward contract calls for delivery of the currency on a future date that is specified in the contract. Risks related to the use of forwards include the possible failure of counterparties to meet the terms of the forward agreement, the failure of the
135
| | Notes to Financial Statements (Continued) |
counterparties to timely post collateral, the risk that currency movements will not occur thereby reducing the Fund’s total return, and the potential for losses in excess of the Fund’s initial investment.
The market value of a forward foreign currency contract fluctuates with changes in foreign currency exchange rates. Forward foreign currency contracts are marked to market daily and the change in value is recorded by a Fund as an unrealized gain or loss. Realized gains or losses, equal to the difference between the value of the contract at the time it was opened and the value at the time it was closed, are recorded upon delivery or receipt of the currency.
During the year ended September 30, 2016, the Arbitrage Fund and the Merger Arbitrage Fund used forward foreign currency contracts to enhance potential gains, hedge against anticipated currency exchange rates, maintain diversity and liquidity of the portfolio and/or adjust exposure to foreign currencies.
Real Estate Investment Trusts – The Funds may invest in real estate investment trusts (“REITs”) that involve risks not associated with investing in stocks. Risks include declines in the value of real estate, general and economic conditions, changes in the value of the underlying property and defaults by borrowers. The value of assets in the real estate industry may go through cycles of relative underperformance and outperformance in comparison to equity securities markets in general. Dividend income is recorded using management’s estimate of the income included in distributions received from REIT investments. The actual amounts of income, return of capital and capital gains are only determined by each REIT after its fiscal year-end and may differ from the estimated amount. Estimates of income are adjusted in the Funds to the actual amounts when the amounts are determined.
Master Limited Partnership – The Funds may invest in Master Limited Partnership (“MLP”) common units that represent limited partnership interests in the MLP. Common units are generally listed and traded on U.S. securities exchanges or over-the-counter (“OTC”) with their value fluctuating predominantly based on the success of the MLP. Unlike owners of common stock of a corporation, owners of MLP common units have limited voting rights and have no ability to annually elect directors. MLPs generally distribute all available cash flow (cash flow from operations less maintenance capital expenditures) in the form of quarterly distributions. Common unit holders have first priority to receive quarterly cash distributions up to the minimum quarterly distribution and have arrearage rights. Distributions received from MLPs generally are comprised of income and return of capital. Investment income and return of capital are recorded based on estimates made at the time distributions are received. The actual amounts of income and return of capital are only determined by each MLP after its fiscal year-end and may differ from the estimated amount. Estimates of income are adjusted in the Funds to the actual amounts when the amounts are determined. In the event of liquidation, common unit holders have preference over subordinated units, but not debt holders or preferred unit holders, to the remaining assets of the MLP.
Pay-In-Kind (“PIK”) Bonds – PIK bonds are securities that, at the issuer’s option, pay interest in either cash or additional securities for a specified period. PIK bonds, like zero coupon bonds, are designed to give an issuer flexibility in managing cash flow. PIK bonds are expected to reflect the market value of the underlying debt plus an amount representing accrued interest since the last payment. PIK bonds are usually less volatile than zero coupon bonds, but more volatile than cash pay securities.
Derivative instruments and hedging activities — The Arbitrage Fund and the Merger Arbitrage Fund may enter into an International Swaps and Derivatives Associations, Inc. Master Agreement (“ISDA Master Agreement” or “MNA”) or similar agreement with certain counterparties. An ISDA Master Agreement is a bilateral agreement between a Fund and a counterparty that governs OTC derivatives and foreign exchange contracts, and typically contains, among other things, collateral posting terms and master netting provisions in the event of a default or termination. Under an ISDA Master Agreement, a party may, under certain circumstances, offset with the counterparty certain derivative financial instrument’s payables or receivables with collateral held or posted and
136
| Notes to Financial Statements (Continued) | |
create one single net payment. The provisions of the ISDA Master Agreement typically permit a single net payment in the event of default (close-out netting). These default events include bankruptcy or insolvency of the counterparty. Note, however, that bankruptcy or insolvency laws of a particular jurisdiction may impose restrictions on or prohibitions against the right of offset.
When entering into a derivative transaction, a Fund may be required to post and maintain collateral or margin (including both initial and maintenance margin). Collateral and margin requirements differ by type of derivative. Margin requirements are established by the broker or clearing house for exchange traded and centrally cleared derivatives (financial futures contracts, options, and centrally cleared swaps). Brokers can ask for margining in excess of the clearing house’s minimum in certain circumstances. Collateral terms are contract specific for OTC derivatives (foreign currency exchange contracts, options, and swaps). For derivatives traded under an ISDA Master Agreement, the collateral requirements are typically calculated by netting the marked-to-market amount for each transaction under such agreement and comparing that amount to the value of any collateral currently pledged by the Fund and the counterparty. For financial reporting purposes, cash collateral that has been pledged to cover obligations of the Fund and cash collateral received from the counterparty, if any, is reported separately on the Statements of Assets and Liabilities as cash pledged as collateral and cash received as collateral, respectively. Non-cash collateral pledged by the Fund, if any, is noted in the Portfolio of Investments. To the extent amounts due to the Fund from its counterparties are not fully collateralized, contractually or otherwise, the Fund bears the risk of loss from counterparty non-performance.
Certain ISDA Master Agreements allow counterparties to OTC derivatives transactions to terminate derivative contracts prior to maturity in the event a Fund’s net assets decline by a stated percentage or the Fund fails to meet the terms of its ISDA Master Agreement, which would cause the Fund (counterparty) to accelerate payment of any net liability owed to the counterparty (Fund).
For financial reporting purposes, a Fund does not offset derivative assets and derivative liabilities that are subject to netting arrangements in the Statements of Assets and Liabilities.
As of September 30, 2016, the Arbitrage and Merger Arbitrage Funds’ assets and liabilities that were subject to a MNA on a gross basis were as follows:
| | | Assets | | | Liabilities | |
| Arbitrage Fund | | | | | | | | |
| Written Options | | $ | — | | | $ | (64,783 | ) |
| Merger Arbitrage Fund | | | | | | | | |
| Written Options | | | — | | | | (73,923 | ) |
| Forward Foreign Currency Contracts | | | 84,152 | | | | (15,140 | ) |
The following table presents the Merger Arbitrage Fund’s assets net of amounts available for offset under a MNA and net of the related collateral pledged to the Fund as of September 30, 2016 :
| Fund | | Counterparty | | Derivative
Type | | Gross
Amount of
Recognized
Assets | | Gross
Amount
Available
for Offset in
Statement
of Assets
and
Liabilities | | Non-
Cash
Collateral
Received | | Cash
Collateral
Received | | Net
Amount(A) | |
| Merger Arbitrage Fund | | Brown
Brothers
Harriman | | Forward
Foreign
Currency
Contracts | | $84,152 | | $(15,140) | | $ — | | $ — | | $69,012 | |
| (A) | Net amount represents the net amount receivable from the counterparty in the event of default. |
137
| | Notes to Financial Statements (Continued) |
The following table presents the Arbitrage and Merger Arbitrage Funds’ liabilities net of amounts available for offset under MNA and of the related collateral pledged by the Fund as of September 30, 2016:
| Fund | | Counterparty | | Derivative Type | | Gross
Amount of
Recognized
Liabilities | | Gross
Amount
Available
for Offset in
Statement
of Assets
and
Liabilities | | Non-
Cash
Collateral
Pledged | | Cash
Collateral
Pledged | | Net
Amount(A) | |
| Arbitrage Fund | | Pershing LLC | | Written
Options | | $64,783 | | $ — | | $(14,778) | | $(50,005) | | $ — | |
| Merger Arbitrage Fund | | Pershing LLC | | Written
Options | | 73,923 | | — | | (51,750) | | (22,173) | | — | |
| | | Brown Brothers Harriman | | Forward
Foreign
Currency
Contracts | | 15,140 | | (15,140) | | — | | — | | — | |
| (A) | Net amount represents the net amount payable due to the counterparty in the event of default. |
The following table sets forth the fair value of the Arbitrage and Merger Arbitrage Funds’ derivative financial instruments by primary risk exposure as of September 30, 2016:
Fair Value of Derivative Investments
As of September 30, 2016 |
| Fund | | Derivatives not accounted for as hedging
instruments under ASC 815 | | Asset
Derivatives | | | Liability
Derivatives | |
| Arbitrage Fund | | Purchased Options-Equity Contracts* | | $ | 45,445 | | | $ | — | |
| | | Written Options-Equity Contracts** | | | — | | | | (64,783 | ) |
| | | Forward Foreign Currency Contracts*** | | | 80,668 | | | | (11,839 | ) |
| Merger Arbitrage Fund | | Purchased Options-Equity contracts* | | | 57,858 | | | | — | |
| | | Written Options-Equity Contracts** | | | — | | | | (73,923 | ) |
| | | Forward Foreign Currency Contracts*** | | | 84,152 | | | | (15,140 | ) |
* Statements of Assets and Liabilities Location: Investments, at market value.
** Statements of Assets and Liabilities Location: Written options, at market value.
*** Statements of Assets and Liabilities Location: Unrealized appreciation on forward foreign currency contracts and Unrealized depreciation on forward foreign currency contracts, respectively.
The following table sets forth the effect of the Funds’ derivative financial instruments by primary risk exposure on the Statements of Operations for the year ended September 30, 2016:
The Effect of Derivative Investments on the Statement of Operations
For the Year Ended September 30, 2016 |
| Fund | | Derivatives not accounted for as hedging
instruments under ASC 815 | | Realized Gain
(Loss)
on Derivatives | | Change in
Unrealized
Appreciation
(Depreciation)
on Derivatives |
| Arbitrage Fund | | Purchased Options-Equity Contracts* | | $ | (209,597 | ) | | $ | 198,893 | |
| | | Written Options-Equity Contracts** | | | 397,435 | | | | 350,312 | |
| | | Forward Foreign Currency Contracts*** | | | 647,555 | | | | 68,829 | |
| Merger Arbitrage Fund | | Purchased Options-Equity Contracts* | | | (348,638 | ) | | | 361,638 | |
| | | Written Options-Equity Contracts** | | | 612,699 | | | | 611,306 | |
| | | Forward Foreign Currency Contracts*** | | | 676,830 | | | | 69,012 | |
* Statements of Operations Location: Net realized gains (losses) on investments and net change in unrealized appreciation (depreciation) on investments, respectively.
138
| Notes to Financial Statements (Continued) | |
** Statements of Operations Location: Net realized gains on written options and net change in unrealized appreciation (depreciation) on written options, respectively.
*** Statements of Operations Location: Net realized gains on foreign currency transactions and net change in unrealized appreciation (depreciation) on foreign currency transactions, respectively.
For the year ended September 30, 2016, the average quarterly balances of outstanding derivative financial instruments was as follows:
| | | Arbitrage
Fund | | | Merger
Arbitrage
Fund | |
| Equity contracts: | | | | | | | | |
| Purchased Options - Cost | | $ | 151,526 | | | $ | 255,127 | |
| Written Options - Premiums received | | $ | 100,783 | | | $ | 165,463 | |
| Forward foreign currency contracts: | | | | | | | | |
| Average number of contracts | | | 2 | | | | 2 | |
| Average U.S. dollar amount sold | | $ | 4,778,072 | | | $ | 5,358,723 | |
Portfolio securities loaned — The Funds may lend their portfolio securities. Lending portfolio securities exposes the Funds to the risk that the borrower may fail to return the loaned securities or may not be able to provide additional collateral or that the Funds may experience delays in recovery of the loaned securities or loss of rights in the collateral if the borrower fails financially. To minimize these risks, the borrower must agree to maintain cash collateral with the Funds’ custodian. The loaned securities are secured by collateral valued at least equal, at all times, to the market value of the loaned securities plus accrued interest, if any. When the collateral falls below specified amounts, the lending agent will use its best effort to obtain additional collateral on the next business day to meet required amounts under the security lending agreement. The cash collateral is reinvested by the Funds’ custodian into an approved investment vehicle. The approved investment vehicle is subject to market risk.
As of September 30, 2016, the following Funds loaned securities and received collateral as follows:
| Fund | | Security Type | | Market
Value of
Securities
Loaned* | | Market
Value of
Collateral
Received** | | Net Amount |
| Arbitrage Fund | | Corporate Bonds | | $ | 158,488 | | | $ | 164,688 | | | $ | 6,200 | |
| Emerging Markets Small Cap Fund | | Common Stocks | | | 110,216 | | | | 118,751 | | | | 8,535 | |
| Mid Cap Fund | | Common Stocks | | | 41,122,934 | | | | 41,064,072 | | | | (58,862 | ) |
| Mid Cap Value Fund | | Common Stocks | | | 6,851,937 | | | | 6,925,787 | | | | 73,850 | |
| Sands Capital Select Growth Fund | | Common Stocks | | | 100,594,535 | | | | 101,299,820 | | | | 705,285 | |
| Small Cap Fund | | Common Stocks | | | 67,507,093 | | | | 67,474,423 | | | | (32,670 | ) |
| Small Cap Value Fund | | Common Stocks | | | 103,783 | | | | 98,825 | | | | (4,958 | ) |
* The remaining contractual maturity is overnight for all securities.
** Gross amount of recognized liabilities for securities lending is included in the Statements of Assets and Liabilities.
All cash collateral is received, held, and administered by the Funds’ custodian for the benefit of the lending Fund in its custody account or other account established for the purpose of holding collateral.
Funds participating in securities lending receive compensation in the form of fees. Securities lending income is derived from lending long securities from the Funds to creditworthy approved borrowers at rates that are determined based on daily trading volumes, float, short-term interest rates and market liquidity. When a Fund lends securities, it retains the interest or dividends on the investment of any cash received as collateral, and the Fund continues to receive interest or dividends on the loaned securities.
139
| | Notes to Financial Statements (Continued) |
Unrealized gain or loss on the market value of the loaned securities that may occur during the term of the loan is recognized by the Fund. The Fund has the right under the lending agreement to recover any loaned securities from the borrower on demand.
When-issued or delayed delivery transactions — Each Fund may purchase or sell securities on a when-issued or delayed delivery basis. These transactions involve a commitment by the Fund to purchase or sell securities for a predetermined price or yield, with payment and delivery taking place beyond the customary settlement period. When delayed delivery purchases are outstanding, the Fund will set aside liquid assets in an amount sufficient to meet the purchase price. When purchasing a security on a delayed delivery basis, the Fund assumes the rights and risks of ownership of the security, including the risk of price and yield fluctuations, and takes such fluctuations into account when determining NAV. The Fund may dispose of or renegotiate a delayed delivery transaction after it is entered into, and may sell when-issued securities before they are delivered, which may result in a capital gain or loss. When the Fund has sold a security on a delayed delivery basis, the Fund does not participate in future gains and losses with respect to the security.
Share valuation — The NAV per share of each class of shares of each Fund is calculated daily by dividing the total value of a Fund’s assets attributable to that class, less liabilities attributable to that class, by the number of outstanding shares of that class.
The maximum offering price per share of Class A shares of the Funds (except the Total Return Bond Fund and Ultra Short Duration Fixed Income Fund) is equal to the NAV per share plus a sales load equal to 6.10% of the NAV (or 5.75% of the offering price). The maximum offering price per share of Class A shares of the Total Return Bond Fund is equal to the NAV per share plus a sales load equal to 4.99% of the NAV (or 4.75% of the offering price). The maximum offering price per share of Class A shares of the Ultra Short Duration Fixed Income Fund is equal to the NAV per share plus sales load equal to 2.04% of the NAV (or 2.00% of the offering price). There is no sales load on purchases of $1 million or more of Class A shares. The maximum offering price per share of Classes C, Y, Z, and Institutional Class shares of the Funds is equal to the NAV per share.
The redemption price per share of each class of shares of the Funds is generally equal to the NAV per share. However, Class A redemptions that were part of a no-load $1 million subscription may be subject to a contingent deferred sales charge (“CDSC”) of up to 1.00% if redeemed within a one-year period from the date of purchase. Additionally, purchases of Class C shares of the Funds are subject to a CDSC of 1.00%. The CDSC will be assessed on an amount equal to the lesser of (1) the NAV at the time of purchase of the shares being redeemed or (2) the NAV of such shares being redeemed, if redeemed within a one-year period from the date of purchase.
Investment income — Dividend income from securities is recognized on the ex-dividend date, net of foreign withholding taxes, if any, which are reduced by any amounts reclaimable by the Funds, where applicable. Interest income from securities is recorded on the basis of interest accrued, premium amortized and discount accreted. Realized gains and losses resulting from principal paydowns on mortgage-backed and asset-backed securities are included in interest income. Market discounts, original issue discount (“OID”) and market premiums on debt securities are accreted/amortized to interest income over the life of the security with a corresponding adjustment in the cost basis of that security. In addition, it is the Funds’ policy to accrue for foreign capital gains taxes, if applicable, on certain foreign securities held by the Funds. An estimated foreign capital gains tax is recorded daily on net unrealized gains on these securities and is payable upon the sale of such securities when a gain is realized.
Distributions to shareholders — Each Fund intends to distribute to its shareholders substantially all of its income and capital gains. The Arbitrage Fund, Emerging Markets Small Cap Fund, Merger Arbitrage Fund, Mid Cap Fund, and Small Cap Fund distribute their income, if any, annually, as a dividend to shareholders. The Mid Cap Value Fund, Sands Capital Select Growth Fund, and Small Cap Value Fund declare and distribute
140
| Notes to Financial Statements (Continued) | |
their income, if any, quarterly, as a dividend to shareholders. The Premium Yield Equity Fund and Total Return Bond Fund declare and distribute their income, if any, monthly, as a dividend to shareholders. The Ultra Short Duration Fixed Income Fund declares its income, if any, daily, and distributes such income monthly, as a dividend to shareholders. Each Fund makes distributions of capital gains, if any, at least annually, net of applicable capital loss carryforwards. Income distributions and capital gain distributions are determined in accordance with income tax regulations. Recognition of the Funds’ net investment income from investments in Underlying Funds is affected by the timing of dividend declarations by the Underlying Funds.
Allocations — Investment income earned, realized capital gains and losses, and unrealized appreciation and depreciation for a Fund are allocated daily to each class of shares based upon its proportionate share of total net assets of the Fund. Class-specific expenses are charged directly to the class incurring the expense. Common expenses, which are not attributable to a specific class, are allocated daily to each class of shares based upon their proportionate share of total net assets of the Fund. Expenses not directly billed to a Fund are allocated proportionally among all the Funds in the Trust, and, if applicable, Touchstone Institutional Funds Trust, Touchstone Investment Trust, Touchstone Strategic Trust, Touchstone Tax-Free Trust, and Touchstone Variable Series Trust (collectively with the Trust, “Touchstone Fund Complex”), daily in relation to net assets of each Fund or another reasonable measure.
Security transactions — Security transactions are reflected for financial reporting purposes as of the trade date. Realized gains and losses on sales of portfolio securities are calculated using the identified cost basis.
Estimates — The preparation of financial statements in conformity with U.S. GAAP requires management to make estimates and assumptions that affect the reported amounts of assets and liabilities and disclosure of contingent assets and liabilities at the date of the financial statements and the reported amounts of income and expenses during the reporting period. Actual results could differ from those estimates.
3. Investment Transactions
Investment transactions (excluding short-term investments and U.S. Government securities) were as follows for the year ended September 30, 2016:
| | | Arbitrage
Fund | | | Emerging
Markets Small
Cap Fund | | | Merger
Arbitrage
Fund | | | Mid Cap
Fund | |
| Purchases of investment securities | | $ | 544,142,068 | | | $ | 30,284,805 | | | $ | 637,136,113 | | | $ | 135,109,326 | |
| Proceeds from sales and maturities | | $ | 528,287,044 | | | $ | 288,485,275 | | | $ | 656,093,321 | | | $ | 230,919,569 | |
| | | | | | | | | | | | | | | | | |
| | | Mid Cap
Value
Fund | | | Premium Yield
Equity
Fund | | | Sands Capital
Select Growth
Fund | | | Small Cap
Fund | |
| Purchases of investment securities | | $ | 274,433,362 | | | $ | 55,778,434 | | | $ | 1,846,501,973 | | | $ | 106,994,519 | |
| Proceeds from sales and maturities | | $ | 170,165,585 | | | $ | 96,706,489 | | | $ | 3,769,491,260 | | | $ | 251,631,950 | |
| | | | | | | | | | | | | | | | | |
| | | Small Cap
Value
Fund | | | Total Return
Bond
Fund | | | Ultra Short
Duration Fixed
Income Fund | | | | | |
| Purchases of investment securities | | $ | 235,605,019 | | | $ | 55,042,567 | | | $ | 735,849,353 | | | | | |
| Proceeds from sales and maturities | | $ | 123,608,731 | | | $ | 16,138,579 | | | $ | 694,114,368 | | | | | |
For the year ended September 30, 2016, purchases and proceeds from sales and maturities in U.S. Government Securities were $13,602,878 and $6,463,561, respectively, for the Total Return Bond Fund and $93,490,437 and $95,951,420, respectively, for the Ultra Short Duration Fixed Income Fund.
141
| | Notes to Financial Statements (Continued) |
4. Transactions with Affiliates and Other Related Parties
Certain officers of the Trust are also officers of Touchstone Advisors, Inc. (the “Advisor”),Touchstone Securities, Inc. (the “Underwriter”), or BNY Mellon Investment Servicing (U.S.) Inc. (“BNY Mellon”), the Sub-Administrator and Transfer Agent to the Funds. Such officers receive no compensation from the Trust. The Advisor and the Underwriter are each wholly-owned, indirect subsidiaries of Western & Southern Financial Group, Inc. (“Western & Southern”).
On behalf of the Funds, the Advisor pays each Independent Trustee a quarterly retainer plus additional retainers to the Lead Independent Trustee and the chairs of each standing committee. Interested Trustees do not receive compensation from the Funds. Each Independent Trustee also receives compensation for each board meeting and committee meeting attended. Each standing committee chair receives additional compensation for each committee meeting that he or she oversees. The Advisor is reimbursed by the Funds for the Independent Trustees’ compensation and out-of-pocket expenses relating to their services. The Funds accrued Trustee-related expenses of $179,179 for the year ended September 30, 2016.
MANAGEMENT & EXPENSE LIMITATION AGREEMENTS
The Advisor provides general investment supervisory services for the Funds, under terms of an advisory agreement (the “Advisory Agreement”). Under the Advisory Agreement, each Fund pays the Advisor a fee, which is computed and accrued daily and paid monthly, at an annual rate based on average daily net assets of each Fund as shown in the table below.
| Arbitrage Fund | | 1.05% on the first $500 million |
| | | 1.00% on the next $500 million |
| | | 0.95% on such assets over $1 billion |
| Emerging Markets Small Cap Fund | | 1.05% on the first $200 million |
| | | 1.00% on the next $200 million |
| | | 0.90% on such assets over $400 million |
| Merger Arbitrage Fund | | 1.05% |
| Mid Cap Fund | | 0.80% on the first $500 million |
| | | 0.75% on the next $500 million |
| | | 0.70% on such assets over $1 billion |
| Mid Cap Value Fund | | 0.85% on the first $100 million |
| | | 0.80% on the next $300 million |
| | | 0.75% on such assets over $400 million |
| Premium Yield Equity Fund | | 0.70% on the first $100 million |
| | | 0.65% on such assets over $100 million |
| Sands Capital Select Growth Fund | | 0.85% on the first $1 billion |
| | | 0.80% on the next $500 million |
| | | 0.75% on the next $500 million |
| | | 0.70% on such assets over $2 billion |
| Small Cap Fund | | 0.85% |
| Small Cap Value Fund | | 0.90% |
| Total Return Bond Fund | | 0.35% |
| Ultra Short Duration Fixed Income Fund | | 0.25% |
In addition to the base advisory fee shown above for the Sands Capital Select Growth Fund, a performance fee adjustment will be added to or subtracted from the base advisory fee depending on the performance of the Fund in relation to the investment performance of the Fund’s benchmark index, for the preceding twelve month period, as follows:
142
| Notes to Financial Statements (Continued) | |
| | | Benchmark
Index | | Benchmark
Threshold | | Annual
Adjustment
Rate | | Highest / Lowest
Possible Advisory
Fee |
| Sands Capital Select Growth Fund | | Russell1000®
Growth Index | | +/-2.50% | | +/-0.15% | | 1.00% / 0.55% |
For the year ended September 30, 2016, the Advisor’s base fee was decreased by $7,518,953 as a result of the performance fee adjustment.
The Advisor has entered into investment sub-advisory agreements with the following parties (each, a “Sub-Advisor”):
| Copper Rock Capital Partners LLC | | The London Company |
| Emerging Markets Small Cap Fund* | | Mid Cap Fund |
| | | Small Cap Fund |
| EARNEST Partners LLC | | |
| Total Return Bond Fund | | Longfellow Investment Management Co. |
| | | Arbitrage Fund |
| Fort Washington Investment Advisors, Inc.** | | Merger Arbitrage Fund |
| Ultra Short Duration Fixed Income Fund | | |
| | | Miller/Howard Investments, Inc. |
| | | Premium Yield Equity Fund |
| LMCG Investments, LLC | | |
| Mid Cap Value Fund | | Sands Capital Management, LLC |
| Small Cap Value Fund*** | | Sands Capital Select Growth Fund |
*Effective April 19, 2016, Copper Rock Capital Partners LLC became the sub-advisor of the Emerging Markets Small Cap Fund; for the period February 20, 2016 through April 18, 2016, Russell Implementation Services, Inc. was the interim sub-advisor; prior to February 20, 2016, AGF Investments America, Inc. was the sub-advisor.
**Affiliate of the Advisor and wholly-owned indirect subsidiary of Western & Southern.
***Effective July 1, 2016, LMCG Investments, Inc. became the sub-advisor for the Small Cap Value Fund; for the period May 20, 2016 through June 30, 2016, Russell Implementation Services, Inc was the interim sub-advisor of the Small Cap Value Fund; prior to May 20, 2016, DePrince, Race & Zollo, Inc was the sub-advisor.
The Advisor, not the Funds, pays sub-advisory fees to each Sub-Advisor.
The Advisor entered into an expense limitation agreement (the “Expense Limitation Agreement”) to contractually limit the annual operating expenses of the Funds, excluding: dividend and interest expenses relating to short sales; interest; taxes; brokerage commissions and other transaction costs; portfolio transactions and investment related expenses; other expenditures which are capitalized in accordance with U.S. GAAP; the cost of “Acquired Fund Fees and Expenses”, if any; and other extraordinary expenses not incurred in the ordinary course of business. The maximum annual operating expense limit in any year with respect to the Funds is based on a percentage of the average daily net assets of the Funds. The Advisor has agreed to separately waive class-level expenses, advisory fees and administration fees, and to reimburse expenses in order to maintain the following expense limitations for the Funds:
143
| | Notes to Financial Statements (Continued) |
| | | Class A | | Class C | | Class Y | | Class Z | | Institutional
Class |
| Arbitrage Fund | | | 1.68 | % | | | 2.43 | % | | | 1.43 | % | | | — | | | | 1.28 | % |
| Emerging Markets Small Cap Fund | | | 1.69 | % | | | 2.44 | % | | | 1.44 | % | | | — | | | | 1.29 | % |
| Merger Arbitrage Fund | | | 1.68 | % | | | 2.43 | % | | | 1.43 | % | | | — | | | | 1.28 | % |
| Mid Cap Fund | | | 1.24 | % | | | 1.99 | % | | | 0.99 | % | | | 1.24 | % | | | 0.92 | % |
| Mid Cap Value Fund* | | | 1.27 | % | | | 2.02 | % | | | 1.02 | % | | | — | | | | 0.89 | % |
| Premium Yield Equity Fund | | | 1.20 | % | | | 1.95 | % | | | 0.95 | % | | | — | | | | — | |
| Sands Capital Select Growth Fund | | | 0.25 | % | | | 0.25 | % | | | 0.25 | % | | | 0.25 | % | | | — | |
| Small Cap Fund | | | 1.38 | % | | | 2.13 | % | | | 1.13 | % | | | — | | | | 1.05 | % |
| Small Cap Value Fund | | | 1.38 | % | | | 2.13 | % | | | 1.13 | % | | | — | | | | 0.98 | % |
| Total Return Bond Fund** | | | 0.85 | % | | | 1.60 | % | | | 0.60 | % | | | — | | | | 0.50 | % |
| Ultra Short Duration Fixed Income Fund | | | 0.69 | % | | | 1.19 | % | | | 0.44 | % | | | 0.69 | % | | | 0.39 | % |
*Prior to January 29, 2016, the expense limitation for Classes A, C and Y shares were 1.29%, 2.04% and 1.04%, respectively.
**Prior to January 29, 2016, the expense limitation for Classes A, C and Y shares were 0.90%, 1.65% and 0.65%, respectively.
The Expense Limitation Agreement for Sands Capital Select Growth Fund limits other operating expenses to 0.25% for all classes of the Fund. Other operating expenses include all operating expenses of the fund except for investment advisory fees, administration fees, performance fees, distribution fees (12b-1), shareholder service fees and any expenses excluded in the Expense Limitation Agreement.
These expense limitations will remain in effect for all Funds through at least January 29, 2017, except for Emerging Markets Small Cap Fund which will remain in effect through April 18, 2017, but can be terminated by a vote of the Board of Trustees of the Trust if it deems the termination to be beneficial to the Funds’ shareholders.
During the year ended September 30, 2016, the Advisor or its affiliates waived investment advisory fees and administration fees or reimbursed expenses, including distribution fees of the Funds, as follows:
| | | Investment
Advisory
Fees
Waived | | | Administration
Fees
Waived | | | Other
Operating
Expenses
Reimbursed/
Waived | | | Total | |
| Arbitrage Fund | | $ | — | | | $ | — | | | $ | 35,383 | | | $ | 35,383 | |
| Emerging Markets Small Cap Fund | | | 233,392 | | | | 56,131 | | | | 81,957 | | | | 371,480 | |
| Merger Arbitrage Fund | | | — | | | | — | | | | 8,474 | | | | 8,474 | |
| Mid Cap Fund | | | — | | | | 211,004 | | | | 446,756 | | | | 657,760 | |
| Mid Cap Value Fund | | | — | | | | 361,662 | | | | 115,047 | | | | 476,709 | |
| Premium Yield Equity Fund | | | — | | | | — | | | | 138,887 | | | | 138,887 | |
| Sands Capital Select Growth Fund | | | — | | | | — | | | | 831,974 | | | | 831,974 | |
| Small Cap Fund | | | — | | | | — | | | | 92,604 | | | | 92,604 | |
| Small Cap Value Fund | | | 14,920 | | | | 110,483 | | | | 109,060 | | | | 234,463 | |
| Total Return Bond Fund | | | — | | | | 89,984 | | | | 145,068 | | | | 235,052 | |
| Ultra Short Duration Fixed Income Fund | | | — | | | | 239,253 | | | | 313,746 | | | | 552,999 | |
Under the terms of the Expense Limitation Agreement, the Advisor is entitled to recover, subject to approval by the Funds’ Board, such amounts waived or reimbursed for a period of up to three years from the year in which the Advisor reduced its compensation or assumed expenses for the Funds. No recoupment will occur unless a Fund’s operating expenses are below the expense limitation amount in effect at the time of the waiver or reimbursement.
144
| Notes to Financial Statements (Continued) | |
As of September 30, 2016, the Advisor may seek recoupment of previously waived fees and reimbursed expenses as follows:
| Fund | | Expiration
September 30, 2017 | | Expiration
September 30, 2018 | | Expiration
September 30, 2019 | | Total |
| Arbitrage Fund | | $ | 1,355 | | | $ | 2,350 | | | $ | 8,272 | | | $ | 11,977 | |
| Emerging Markets Small Cap Fund | | | 67,176 | | | | 117,715 | | | | 353,948 | | | | 538,839 | |
| Mid Cap Fund | | | 380,034 | | | | 632,713 | | | | 545,460 | | | | 1,558,207 | |
| Mid Cap Value Fund | | | 328,349 | | | | 411,352 | | | | 438,591 | | | | 1,178,292 | |
| Premium Yield Equity Fund | | | 10,470 | | | | 28,340 | | | | 71,385 | | | | 110,195 | |
| Sands Capital Select Growth Fund | | | 1,033,092 | | | | 946,969 | | | | 831,974 | | | | 2,812,035 | |
| Small Cap Fund | | | 243,573 | | | | — | | | | 38,604 | | | | 282,177 | |
| Small Cap Value Fund | | | 148,793 | | | | 144,541 | | | | 159,191 | | | | 452,525 | |
| Total Return Bond Fund | | | 143,600 | | | | 170,094 | | | | 206,835 | | | | 520,529 | |
| Ultra Short Duration Fixed Income Fund | | | 456,994 | | | | 465,366 | | | | 500,874 | | | | 1,423,234 | |
The Advisor did not recoup any amounts it previously waived or reimbursed during the year ended September 30, 2016.
ADMINISTRATION AGREEMENT
The Advisor entered into an Administration Agreement with the Trust, whereby the Advisor is responsible for supplying executive and regulatory compliance services; supervising the preparation of tax returns; coordinating the preparation of reports to shareholders and reports to, and filings with the Securities and Exchange Commission (the “SEC”) and state securities authorities, as well as materials for meetings of the Board; calculating the daily NAV per share; and maintaining the financial books and records of each Fund.
For its services, the Advisor’s annual administrative fee is:
0.145% on the first $20 billion of the aggregate average daily net assets;
0.11% on the next $10 billion of aggregate average daily net assets;
0.09% on the next $10 billion of aggregate average daily net assets; and
0.07% on the aggregate average daily net assets over $40 billion.
The fee is computed and allocated among the Touchstone Fund Complex (excluding Touchstone Institutional Funds Trust) on the basis of relative daily net assets.
The Advisor has engaged BNY Mellon as the Sub-Administrator to the Trust. BNY Mellon provides administrative and accounting services to the Trust and is compensated directly by the Advisor, not the Trust.
TRANSFER AGENT AGREEMENT
Under the terms of the Transfer Agent Agreement between the Trust and BNY Mellon, BNY Mellon maintains the records of each shareholder’s account, answers shareholders’ inquiries concerning their accounts, processes purchases and redemptions of each Fund’s shares, acts as dividend and distribution disbursing agent, and performs other shareholder service functions. For these services, BNY Mellon receives a monthly fee from each Fund. In addition, each Fund pays out-of-pocket expenses incurred by BNY Mellon, including, but not limited to, postage and supplies.
The Funds may reimburse the Advisor for fees paid to intermediaries such as banks, broker-dealers, financial advisors or other financial institutions for sub-transfer agency, sub-administration and other services provided to investors whose shares of record are held in omnibus, other group accounts, retirement plans or accounts traded through registered securities clearing agents. These fees may vary based on, for example, the nature of
145
| | Notes to Financial Statements (Continued) |
services provided, but generally range up to 0.15% of the assets of the class serviced or maintained by the intermediary or up to $22 per sub-account maintained by the intermediary.
PLANS OF DISTRIBUTION AND SHAREHOLDER SERVICING FEE ARRANGEMENTS
The Trust has adopted distribution plans pursuant to Rule 12b-1 under the 1940 Act for each class of shares it offers that is subject to 12b-1 distribution fees. The plans allow each Fund to pay distribution and other fees for the sale and distribution of its shares and for services provided to shareholders. The fees charged to the Funds are limited to the actual expenses incurred. Under the Class A plan, each Fund offering Class A shares pays an annual fee of up to 0.25% of average daily net assets that are attributable to Class A shares. Under the Class C plan, each Fund (except the Ultra Short Duration Fixed Income Fund) pays an annual fee of up to 1.00% of average daily net assets that are attributable to Class C shares (of which up to 0.75% is a distribution fee and up to 0.25% is a shareholder servicing fee). The Ultra Short Duration Fixed Income Fund has limited the amount of the 12b-1 fees for Class C shares to 0.75% of average daily net assets through January 29, 2017. Under the Class Z plan, each Fund offering Class Z shares pays an annual shareholder servicing fee of up to 0.25% of average daily net assets that are attributed to Class Z shares.
UNDERWRITING AGREEMENT
The Underwriter is the Funds’ principal underwriter and, as such, acts as exclusive agent for distribution of the Funds’ shares. Under the terms of the Underwriting Agreement between the Trust and the Underwriter, the Underwriter earned underwriting and broker commissions on the sale of Class A shares of the Funds. W&S Brokerage Services, Inc., an affiliate of the Underwriter and the Advisor, also earned broker commissions on the sale of Class A shares of the Funds. Listed below are the total underwriting and broker commissions earned by the Underwriter and its affiliate during the year ended September 30, 2016:
| Fund | | Amount | |
| Arbitrage Fund | | $ | 4,183 | |
| Emerging Markets Small Cap Fund | | | 1,834 | |
| Merger Arbitrage Fund | | | 124 | |
| Mid Cap Fund | | | 18,210 | |
| Mid Cap Value Fund | | | 6,284 | |
| Premium Yield Equity Fund | | | 5,448 | |
| Sands Capital Select Growth Fund | | | 6,021 | |
| Small Cap Fund | | | 2,045 | |
| Small Cap Value Fund | | | 1,661 | |
| Total Return Bond Fund | | | 2,545 | |
| Ultra Short Duration Fixed Income Fund | | | 1,139 | |
In addition, the Underwriter collected CDSC on the redemption of Class C shares of the Funds listed below during the year ended September 30, 2016:
| Fund | | Amount | |
| Emerging Markets Small Cap Fund | | $ | 2 | |
| Mid Cap Fund | | | 1,992 | |
| Mid Cap Value Fund | | | 390 | |
| Premium Yield Equity Fund | | | 133 | |
| Sands Capital Select Growth Fund | | | 721 | |
| Small Cap Fund | | | 130 | |
| Total Return Bond Fund | | | 39 | |
| Ultra Short Duration Fixed Income Fund | | | 306 | |
146
| Notes to Financial Statements (Continued) | |
INTERFUND TRANSACTIONS
The Funds may engage in purchase and sale transactions with funds that have a common investment advisor (or affiliated investment advisors), common Trustees and/or common Officers. During the year ended September 30, 2016 the Funds did not engage in any Rule 17a-7 transactions under the 1940 Act.
5. Federal Tax Information
Federal income tax — It is each Fund’s policy to continue to comply with the special provisions of the Internal Revenue Code applicable to regulated investment companies. As provided therein, in any fiscal year in which a Fund so qualifies and distributes at least 90% of its investment company taxable income, the Fund (but not the shareholders) will be relieved of federal income tax on the income distributed. It is each Fund’s policy to distribute all of its taxable income and accordingly, no provision for income taxes has been made.
In order to avoid imposition of the excise tax applicable to regulated investment companies, it is also each Fund’s intention to declare and pay as dividends in each calendar year at least 98% of its investment company taxable income (earned during the calendar year) and 98.2% of its net realized capital gains (earned during the twelve months ending October 31) plus undistributed amounts from prior years.
The tax character of distributions paid for the years ended September 30, 2016 and 2015 are as follows:
| | | Arbitrage | | | Emerging Markets | |
| | | Fund | | | Small Cap Fund | |
| | | Year Ended | | | Year Ended | | | Year Ended | | | Year Ended | |
| | | September 30, | | | September 30, | | | September 30, | | | September 30, | |
| | | 2016 | | | 2015 | | | 2016 | | | 2015 | |
| From ordinary income | | $ | 1,713,725 | | | $ | — | | | $ | 2,618,763 | | | $ | 3,401,511 | |
| From long-term capital gains | | | 342,591 | | | | 288,475 | | | | — | | | | — | |
| Total distributions | | $ | 2,056,316 | | | $ | 288,475 | | | $ | 2,618,763 | | | $ | 3,401,511 | |
| | | Merger Arbitrage | | | Mid Cap | | | Mid Cap | |
| | | Fund | | | Fund | | | Value Fund | |
| | | Year Ended | | | Year Ended | | | Year Ended | | | Year Ended | | | Year Ended | | | Year Ended | |
| | | September 30, | | | September 30, | | | September 30, | | | September 30, | | | September 30, | | | September 30, | |
| | | 2016 | | | 2015 | | | 2016 | | | 2015 | | | 2016 | | | 2015 | |
| From ordinary income | | $ | — | | | $ | — | | | $ | 365,264 | | | $ | 868,044 | | | $ | 7,115,657 | | | $ | 11,660,373 | |
| From long-term capital gains | | | — | | | | 1,566,064 | | | | — | | | | — | | | | 16,030,101 | | | | 4,873,774 | |
| Total distributions | | $ | — | | | $ | 1,566,064 | | | $ | 365,264 | | | $ | 868,044 | | | $ | 23,145,758 | | | $ | 16,534,147 | |
| | | Premium Yield | | | Sands Capital | | | Small Cap | |
| | | Equity Fund | | | Select Growth Fund | | | Fund | |
| | | Year Ended | | | Year Ended | | | Year Ended | | | Year Ended | | | Year Ended | | | Year Ended | |
| | | September 30, | | | September 30, | | | September 30, | | | September 30, | | | September 30, | | | September 30, | |
| | | 2016 | | | 2015 | | | 2016 | | | 2015 | | | 2016 | | | 2015 | |
| From ordinary income | | $ | 3,858,988 | | | $ | 5,326,219 | | | $ | — | | | $ | — | | | $ | 13,028,179 | | | $ | 4,878,943 | |
| From long-term capital gains | | | 10,256,568 | | | | 8,901,766 | | | | 425,346,962 | | | | 297,931,608 | | | | 65,017,255 | | | | 55,124,275 | |
| Total distributions | | $ | 14,115,556 | | | $ | 14,227,985 | | | $ | 425,346,962 | | | $ | 297,931,608 | | | $ | 78,045,434 | | | $ | 60,003,218 | |
| | | Small Cap | | | Total Return | | | Ultra Short Duration | |
| | | Value Fund | | | Bond Fund | | | Fixed Income Fund | |
| | | Year Ended | | | Year Ended | | | Year Ended | | | Year Ended | | | Year Ended | | | Year Ended | |
| | | September 30, | | | September 30, | | | September 30, | | | September 30, | | | September 30, | | | September 30, | |
| | | 2016 | | | 2015 | | | 2016 | | | 2015 | | | 2016 | | | 2015 | |
| From ordinary income | | $ | 911,469 | | | $ | 1,186,997 | | | $ | 6,010,128 | | | $ | 5,107,573 | | | $ | 8,481,610 | | | $ | 8,549,313 | |
| From long-term capital gains | | | 1,833,117 | | | | 2,819,183 | | | | — | | | | — | | | | — | | | | — | |
| Total distributions | | $ | 2,744,586 | | | $ | 4,006,180 | | | $ | 6,010,128 | | | $ | 5,107,573 | | | $ | 8,481,610 | | | $ | 8,549,313 | |
147
| | Notes to Financial Statements (Continued) |
The following information is computed on a tax basis for each item as of September 30, 2016:
| | | | | | Emerging | | | | |
| | | Arbitrage | | | Markets Small Cap | | | Merger | |
| | | Fund | | | Fund | | | Arbitrage Fund | |
| Tax cost of portfolio investments | | $ | 162,328,926 | | | $ | 8,272,903 | | | $ | 227,009,421 | |
| Gross unrealized appreciation | | | 2,204,801 | | | | 995,230 | | | | 2,491,670 | |
| Gross unrealized depreciation | | | (2,209,633 | ) | | | (307,448 | ) | | | (2,298,634 | ) |
| Net unrealized appreciation (depreciation) on investments | | | (4,832 | ) | | | 687,782 | | | | 193,036 | |
| Net unrealized appreciation (depreciation) on written options | | | 28,553 | | | | — | | | | 46,313 | |
| Net unrealized appreciation (depreciation) on securities sold short | | | (1,091,308 | ) | | | — | | | | (1,230,037 | ) |
| Net unrealized appreciation (depreciation) on foreign currency transactions | | | 1 | | | | 474 | | | | 1 | |
| Net unrealized appreciation (depreciation) on deferred foreign capital gains tax | | | — | | | | (18,178 | ) | | | — | |
| Capital loss carryforwards | | | — | | | | (99,241,130 | ) | | | — | |
| Qualified late-year losses | | | — | | | | (66,198 | ) | | | — | |
| Other temporary differences | | | (13,490 | ) | | | (3,713 | ) | | | (12,633 | ) |
| Undistributed ordinary income | | | 4,714,199 | | | | — | | | | 5,268,474 | |
| Accumulated earnings (deficit) | | $ | 3,633,123 | | | $ | (98,640,963 | ) | | $ | 4,265,154 | |
| | | | | | | | | Premium | | | Sands Capital | |
| | | | | | Mid Cap Value | | | Yield Equity | | | Select Growth | |
| | | Mid Cap Fund | | | Fund | | | Fund | | | Fund | |
| Tax cost of portfolio investments | | $ | 657,835,509 | | | $ | 472,776,051 | | | $ | 138,757,428 | | | $ | 2,022,299,967 | |
| Gross unrealized appreciation | | | 94,073,069 | | | | 70,893,056 | | | | 18,841,775 | | | | 1,431,620,681 | |
| Gross unrealized depreciation | | | (26,085,288 | ) | | | (18,171,420 | ) | | | (5,153,607 | ) | | | (51,322,448 | ) |
| Net unrealized appreciation (depreciation) on investments | | | 67,987,781 | | | | 52,721,636 | | | | 13,688,168 | | | | 1,380,298,233 | |
| Capital loss carryforwards | | | (106,032,326 | ) | | | — | | | | — | | | | — | |
| Qualified late-year losses | | | (55,942 | ) | | | — | | | | (3,305,816 | ) | | | (17,640,732 | ) |
| Undistributed ordinary income | | | 3,651,860 | | | | 3,483,049 | | | | 64,255 | | | | — | |
| Undistributed capital gains | | | — | | | | 11,800,879 | | | | — | | | | 348,471,060 | |
| Accumulated earnings (deficit) | | $ | (34,448,627 | ) | | $ | 68,005,564 | | | $ | 10,446,607 | | | $ | 1,711,128,561 | |
| | | | | | | | | | | | Ultra Short | |
| | | | | | | | | Total | | | Duration | |
| | | Small Cap | | | Small Cap Value | | | Return Bond | | | Fixed Income | |
| | | Fund | | | Fund | | | Fund | | | Fund | |
| Tax cost of portfolio investments | | $ | 531,357,222 | | | $ | 174,277,033 | | | $ | 230,101,183 | | | $ | 613,474,105 | |
| Gross unrealized appreciation | | | 147,178,237 | | | | 8,266,433 | | | | 7,286,062 | | | | 1,862,911 | |
| Gross unrealized depreciation | | | (14,860,487 | ) | | | (6,464,459 | ) | | | (2,326,633 | ) | | | (3,328,414 | ) |
| Net unrealized appreciation (depreciation) on investments | | | 132,317,750 | | | | 1,801,974 | | | | 4,959,429 | | | | (1,465,503 | ) |
| Capital loss carryforwards | | | (59,997,483 | ) | | | (11,364,620 | ) | | | (2,249,616 | ) | | | (25,133,305 | ) |
| Undistributed ordinary income | | | 1,744,841 | | | | 39,218 | | | | 138,900 | | | | 398,512 | |
| Other temporary differences | | | — | | | | — | | | | — | | | | (84,251 | ) |
| Accumulated earnings (deficit) | | $ | 74,065,108 | | | $ | (9,523,428 | ) | | $ | 2,848,713 | | | $ | (26,284,547 | ) |
148
| Notes to Financial Statements (Continued) | |
The difference between the tax cost of portfolio investments and the financial statement cost is primarily due to wash sale loss deferrals, investments in passive foreign investment company (“PFIC”) adjustments, regulated investment companies adjustments, amortization adjustments on bonds, and real estate investment trusts adjustments.
As of September 30, 2016, the Funds had the following capital loss carryforwards for federal income tax purposes:
| | | | | | | | | | | | No | | | No | | | | |
| | | Short Term Expiring In | | | Expiration | | | Expiration | | | | |
| | | 2017 | | | 2018 | | | 2019 | | | Short Term* | | | Long Term* | | | Total | |
| Emerging Markets Small Cap Fund** | | $ | — | | | $ | — | | | $ | — | | | $ | 18,417,148 | | | $ | 80,823,982 | | | $ | 99,241,130 | |
| Mid Cap Fund | | | 35,231,534 | | | | 70,800,792 | | | | — | | | | — | | | | — | | | | 106,032,326 | |
| Small Cap Fund | | | — | | | | — | | | | — | | | | 13,307,122 | | | | 46,690,361 | | | | 59,997,483 | |
| Small Cap Value Fund | | | — | | | | 4,388,796 | | | | — | | | | 2,307,850 | | | | 4,667,974 | | | | 11,364,620 | |
| Total Return Bond Fund | | | — | | | | — | | | | — | | | | 397,485 | | | | 1,852,131 | | | | 2,249,616 | |
| Ultra Short Duration Fixed Income Fund | | | 3,231,117 | | | | 3,336,624 | | | | 933,830 | | | | 7,668,913 | | | | 9,962,821 | | | | 25,133,305 | |
* The Regulated Investment Company Modernization Act of 2010 (the “Act”) was enacted on December 22, 2010. The Act made changes to several tax rules impacting the Funds. The provisions of the Act first became effective for the Funds’ fiscal year ended September 30, 2012 and are applicable to all subsequent fiscal years. Although the Act provides several benefits, including the unlimited carryover of future capital losses, there may be a greater likelihood that all or a portion of each Fund’s pre-enactment capital loss carryovers may expire without being utilized due to the fact that post-enactment capital losses must be utilized before pre-enactment capital loss carryovers may be utilized. Under the Act, new capital losses may now be carried forward indefinitely, and retain the character of the original loss as compared with pre-enactment law, where capital losses could be carried forward for up to eight years, and carried forward as short-term capital losses, irrespective of the character of the original loss.
** May be subject to limitation.
The capital loss carryforwards may be utilized in future years to offset net realized capital gains, if any, prior to distributing such gains to shareholders.
The following Funds had capital losses expiring in the current year as follows:
| Fund | Amount | |
| Ultra Short Duration Fixed Income Fund | $ 1,769,310 | |
During the year ended September 30, 2016, the following Funds utilized capital loss carryforwards:
| Fund | Amount | |
| Mid Cap Fund | $17,815,675 | |
Under current laws, certain capital losses realized after October 31 and ordinary losses realized after December 31 may be deferred (and certain ordinary losses after October and/or December 31 may be deferred) and treated as occurring on the first day of the following fiscal year. For the year ended September 30, 2016, the Funds elected to defer the following losses:
| | | Realized | | | | | | | |
| | | Capital | | | Ordinary | | | | |
| Fund | | Losses | | | Losses | | | Total | |
| Emerging Markets Small Cap Fund | | $ | — | | | $ | 66,198 | | | $ | 66,198 | |
| Mid Cap Fund | | | 55,942 | | | | — | | | | 55,942 | |
| Premium Yield Equity Fund | | | 3,305,816 | | | | — | | | | 3,305,816 | |
| Sands Capital Select Growth Fund | | | — | | | | 17,640,732 | | | | 17,640,732 | |
The Funds have analyzed their tax positions taken on federal income tax returns for all open tax years (tax years ended September 30, 2013 through 2016) and have concluded that no provision for income tax is required in their financial statements.
149
| | Notes to Financial Statements (Continued) |
Certain reclassifications, the result of permanent differences between financial statement and income tax reporting requirements, have been made to the components of capital. These reclassifications have no impact on the net assets or NAV per share of the Funds. The following reclassifications, which are primarily attributed to the tax treatment of net investment losses, current year overdistributions, deemed distributions on shareholder redemptions, foreign currency gains/losses, gains/losses and dividend expenses on short sales, paydown gains/losses on mortgage-backed securities, gains/losses on passive foreign investment companies, gains/losses on real estate investment trusts, reclassification of distributions, foreign capital gains tax, adjustments on preferred stock sold and expiration of prior year capital loss carryovers have been made to the following Funds for the year ended September 30, 2016:
| | | | | | Accumulated | | | Accumulated | |
| | | Paid-In | | | Net Investment | | | Net Realized | |
| Fund | | Capital | | | Income(Loss) | | | Gains(Losses) | |
| Arbitrage Fund | | $ | — | | | $ | 1,281,854 | | | $ | (1,281,854 | ) |
| Emerging Markets Small Cap Fund | | | (280,361 | ) | | | (21,336 | ) | | | 301,697 | |
| Merger Arbitrage Fund | | | 59,246 | | | | 1,740,350 | | | | (1,799,596 | ) |
| Mid Cap Value Fund | | | 77,386 | | | | 192,556 | | | | (269,942 | ) |
| Premium Yield Equity Fund | | | (36,642 | ) | | | 34,213 | | | | 2,429 | |
| Sands Capital Select Growth Fund | | | 36,487,213 | | | | 30,822,049 | | | | (67,309,262 | ) |
| Small Cap Fund | | | 1 | | | | 184,427 | | | | (184,428 | ) |
| Small Cap Value Fund | | | — | | | | (8,290 | ) | | | 8,290 | |
| Total Return Bond Fund | | | — | | | | 862,048 | | | | (862,048 | ) |
| Ultra Short Duration Fixed Income Fund | | | (1,769,310 | ) | | | 1,206,656 | | | | 562,654 | |
6. Commitments and Contingencies
The Funds indemnify theTrust’s officers andTrustees for certain liabilities that might arise from their performance of their duties to the Funds. Additionally, in the normal course of business, the Funds enter into contracts that contain a variety of representations and warranties and which provide general indemnifications. The Funds’ maximum exposure under these arrangements is unknown, as this would involve future claims that may be made against the Funds.
7. Principal Risks
Risks Associated with Foreign Investments — Some of the Funds may invest in the securities of foreign issuers. Investing in securities issued by companies whose principal business activities are outside the U.S. may involve significant risks not present in domestic investments. For example, there is generally less publicly available information about foreign companies, particularly those not subject to the disclosure and reporting requirements of the U.S. securities laws. Foreign issuers are generally not bound by uniform accounting, auditing, and financial reporting requirements and standards of practice comparable to those applicable to domestic issuers. Investments in foreign securities also involve the risk of possible adverse changes in investment or exchange control regulations, expropriation or confiscatory taxation, limitations on the removal of funds or other assets of a Fund, political or financial instability or diplomatic and other developments which could affect such investments. Foreign stock markets, while growing in volume and sophistication, are generally not as developed as those in the U.S., and securities of some foreign issuers (particularly those located in developing countries) may be less liquid and more volatile than securities of comparable U.S. companies. In general, there is less overall governmental supervision and regulation of foreign securities markets, broker-dealers, and issuers than in the U.S.
Risks Associated with Concentration — Certain Funds may invest a high percentage of their assets in specific sectors of the market in order to achieve a potentially greater investment return. As a result, these Funds may
150
| Notes to Financial Statements (Continued) | |
be more susceptible to economic, political, and regulatory developments in a particular sector of the market, positive or negative, and may experience increased volatility on the Funds’ NAVs and magnified effect on the total return.
Risks Associated with Credit — An issuer may be unable to make timely payments of either principal or interest. This may cause the issuer’s securities to decline in value. Credit risk is particularly relevant to those Funds that invest a significant amount of their assets in junk bonds or lower-rated securities
Risks Associated with Interest Rate Changes — As interest rates rise, the value of fixed-income securities a Fund owns will likely decrease. The price of debt securities is generally linked to the prevailing market interest rates. In general, when interest rates rise, the price of debt securities falls, and when interest rates fall, the price of debt securities rises. The price volatility of a debt security also depends on its maturity. Longer-term securities are generally more volatile, so the longer the average maturity or duration of these securities, the greater their price risk. Duration is a measure of the expected life, taking into account any prepayment or call features of the security, that is used to determine the price sensitivity of the security for a given change in interest rates. Specifically, duration is the change in the value of a fixed-income security that will result from a 1% change in interest rates, and generally is stated in years. For example, as a general rule a 1% rise in interest rates means a 1% fall in value for every year of duration. Maturity, on the other hand, is the date on which a fixed-income security becomes due for payment of principal. The negative impact on fixed income securities if interest rates increase as a result could negatively impact a Fund’s NAV.
Please see the Funds’ prospectus for complete discussion of these and other risks.
8. Litigation
In January 2012, the Old Mutual Mid-Cap Fund (which reorganized into the TS&W Mid-Cap Value Fund in March 2009, and was subsequently renamed the Touchstone Mid Cap Value Opportunities Fund in April 2012 and the Touchstone Mid Cap Value Fund in March 2014) was served with a summons and complaint in an action brought by Edward S. Weisfelner, asTrustee of the LB CreditorTrust, in the case captioned Weisfelner v. Fund 1(U.S. Bankr. S.D.N.Y. Adv. Pro. No. 10-4609) (the “Action”). The Action alleges that, under state law, all payments made to shareholders in the December 2007 leveraged buyout of Lyondell Chemical Company were made, by means of intentional and constructive fraudulent transfer and seeks to recover all those payments. The amount sought to be disgorged is $3,784,800, which is what the Fund received in payments in connection with the leveraged buyout. The Fund (along with thousands of other defendants) filed a joinder to the motion to dismiss and the court heard oral argument on the motion to dismiss in January 2015. In November 2015, the court dismissed the intentional fraudulent transfer claims and in July 2016, the court dismissed the remaining constructive fraudulent transfer claims. The plaintiff appealed the part of the motion to dismiss that was granted in November 2015, and on July 27, 2016, the District Court reversed the Bankruptcy Court’s dismissal order. As a result, part of the claims against the defendants (including the Fund) have been reinstated. The path the litigation will follow is uncertain at this time, including whether the parties will appeal the District Court’s and Bankruptcy Court’s rulings on the motion to dismiss. At this nascent stage of the litigation, it is not possible to assess the likely outcome. The Fund is currently assessing the case and has not yet determined the potential effect, if any, on its net asset value.
9. Subsequent Events
Subsequent events occurring after the date of this report have been evaluated for potential impact to this report through the date financial statements were issued. There were no subsequent events that necessitated recognition or disclosure in the Funds’ financial statement.
151
| | Report of Independent Registered Public Accounting Firm |
To the Board of Trustees and Shareholders of Touchstone Funds Group Trust
We have audited the accompanying statements of assets and liabilities, including the portfolios of investments, of Touchstone Funds Group Trust (comprising, respectively, the Touchstone Arbitrage, Touchstone Emerging Markets Small Cap (formerly,Touchstone Emerging Markets Equity),Touchstone Merger Arbitrage,Touchstone Mid Cap, Touchstone Mid Cap Value, Touchstone Premium Yield Equity, Touchstone Sands Capital Select Growth,Touchstone Small Cap (formerly,Touchstone Small Cap Core),Touchstone Small Cap Value,Touchstone Total Return Bond, and Touchstone Ultra Short Duration Fixed Income Funds) (the “Funds”) as of September 30, 2016, and the related statements of operations for the year then ended, the statements of changes in net assets for each of the two years in the period then ended and the financial highlights for each of the years or periods indicated therein. These financial statements and financial highlights are the responsibility of the Funds’ management. Our responsibility is to express an opinion on these financial statements and financial highlights based on our audits.
We conducted our audits in accordance with the standards of the Public Company Accounting Oversight Board (United States). Those standards require that we plan and perform the audits to obtain reasonable assurance about whether the financial statements and financial highlights are free of material misstatement. We were not engaged to perform an audit of the Funds’ internal control over financial reporting. Our audits included consideration of internal control over financial reporting as a basis for designing audit procedures that are appropriate in the circumstances, but not for the purpose of expressing an opinion on the effectiveness of the Funds’ internal control over financial reporting. Accordingly, we express no such opinion. An audit also includes examining, on a test basis, evidence supporting the amounts and disclosures in the financial statements and financial highlights, assessing the accounting principles used and significant estimates made by management, and evaluating the overall financial statement presentation. Our procedures included confirmation of securities owned as of September 30, 2016, by correspondence with the custodian, transfer agent, and brokers or by other appropriate auditing procedures where replies from brokers were not received. We believe that our audits provide a reasonable basis for our opinion.
In our opinion, the financial statements and financial highlights referred to above present fairly, in all material respects, the financial position of each of the respective funds constituting Touchstone Funds Group Trust at September 30, 2016, the results of their operations for the year then ended, the changes in their net assets for each of the two years in the period then ended and the financial highlights for each of the years or periods indicated therein, in conformity with U.S generally accepted accounting principles.

Cincinnati, Ohio
November 18, 2016
152
Qualified Dividend Income
Under the Jobs and Growth Tax Relief Reconciliation Act of 2003 (the “Act”), the following percentages of ordinary dividends paid during the fiscal year ended September 30, 2016 are designated as “qualified dividend income,” as defined in the Act, and are subject to reduced tax rates in 2016. The Funds intend to pass through the maximum allowable percentage for Form 1099 Div.
| Arbitrage Fund | 21.71% |
| Emerging Markets Small Cap Fund | 98.26% |
| Mid Cap Fund | 100.00% |
| Mid Cap Value Fund | 73.87% |
| Premium Yield Equity Fund | 100.00% |
| Small Cap Fund | 81.18% |
| Small Cap Value Fund | 100.00% |
Dividend Received Deduction
For corporate shareholders, the following ordinary distributions paid during the current fiscal year ended September 30, 2016 qualify for the corporate dividends received deduction. The Funds intend to pass through the maximum allowable percentage.
| Arbitrage Fund | 19.50% |
| Emerging Markets Small Cap Fund | 0.01% |
| Mid Cap Fund | 100.00% |
| Mid Cap Value Fund | 73.67% |
| Premium Yield Equity Fund | 97.34% |
| Small Cap Fund | 44.87% |
| Small Cap Value Fund | 100.00% |
For the fiscal year ended September 30, 2016, the Arbitrage Fund, Mid Cap Value Fund, Premium Yield Equity Fund, Sands Capital Select Growth Fund, Small Cap Fund and Small Cap Value Fund designated $342,591, $16,030,101, $10,256,568, $492,656,224, $65,017,255 and $1,833,117, respectively, as long-term capital gains.
Proxy Voting Guidelines and Proxy Voting Records
The Sub-Advisors are responsible for exercising the voting rights associated with the securities purchased and held by the Funds. A description of the policies and procedures that the Sub-Advisors use in fulfilling this responsibility is available as an appendix to the most recent Statement of Additional Information, which can be obtained without charge by calling toll free 1.800.543.0407 or by visiting the Touchstone website at TouchstoneInvestments.com or on the Securities and Exchange Commission’s (the “Commission”) website sec.gov. Information regarding how those proxies were voted during the most recent twelve-month period ended June 30 is also available without charge by calling toll free 1.800.543.0407 or on the Commission’s website at sec.gov.
Quarterly Portfolio Disclosure
The Trust files a complete listing of portfolio holdings for each Fund as of the end of the first and third quarters of each fiscal year on Form N-Q. The complete listing (i) is available on the Commission’s website; (ii) may be reviewed and copied at the Commission’s Public Reference Room in Washington, DC; or (iii) will be made available to shareholders upon request by calling 1.800.543.0407. Information on the operation of the Public Reference Room may be obtained by calling 1.800.SEC.0330.
153
| | Other Items (Unaudited) (Continued) |
Schedule of Shareholder Expenses
As a shareholder of the Funds, you incur two types of costs: (1) transaction costs, including reinvested dividends or other distributions; and (2) ongoing costs, including investment advisory fees; distribution (12b-1) fees; and other Fund expenses. This example is intended to help you understand your ongoing costs (in dollars) of investing in the Funds and to compare these costs with the ongoing costs of investing in other mutual funds. The example is based on an investment of $1,000 invested at the beginning of the period and held for the entire period (April 1, 2016 through September 30, 2016).
Actual Expenses
The first line for each share class of a Fund in the table below provides information about actual account values and actual expenses. You may use the information in this line, together with the amount you invested, to estimate the expenses that you paid over the period. Simply divide your account value by $1,000 (for example, an $8,600 account value divided by $1,000 = 8.6), then multiply the result by the number in the first line under the heading entitled “Expenses Paid During the Six Months Ended September 30, 2016” to estimate the expenses you paid on your account during this period.
Hypothetical Example for Comparison Purposes
The second line for each share class of a Fund in the table below provides information about hypothetical account values and hypothetical expenses based on the Funds’ actual expense ratio and an assumed rate of return of 5% per year before expenses, which is not the Funds’ actual return. The hypothetical account values and expenses may not be used to estimate the actual ending account balance or expenses you paid for the period. You may use this information to compare the ongoing costs of investing in the Funds and other funds. To do so, compare this 5% hypothetical example with the 5% hypothetical examples that appear in the shareholder reports of the other funds.
Please note that the expenses shown in the table below are meant to highlight your ongoing costs only and do not reflect any transactional costs, such as sales charges (loads), redemption fees, or exchange fees. Therefore, the second line for each share class of a Fund in the table below is useful in comparing ongoing costs only, and will not help you determine the relative total costs of owning different funds. In addition, if these transactional costs were included, your costs would have been higher.
| | | | | | | | | | | Expenses |
| | | | | Net Expense | | Beginning | | Ending | | Paid During |
| | | | | Ratio | | Account | | Account | | the Six Months |
| | | | | Annualized | | Value | | Value | | Ended |
| | | | | September 30, | | April 1, | | September 30, | | September 30, |
| | | | | 2016 | | 2016 | | 2016 | | 2016* |
| Touchstone Arbitrage Fund | | | | | | | | | | | | |
| Class A | | Actual | | | 3.14 | % | | $ | 1,000.00 | | | $ | 1,011.80 | | | $ | 15.79 | ** |
| Class A | | Hypothetical | | | 3.14 | % | | $ | 1,000.00 | | | $ | 1,009.30 | | | $ | 15.77 | ** |
| | | | | | | | | | | | | | | | | | | |
| |
| Class C | | Actual | | | 3.89 | % | | $ | 1,000.00 | | | $ | 1,008.00 | | | $ | 19.53 | ** |
| Class C | | Hypothetical | | | 3.89 | % | | $ | 1,000.00 | | | $ | 1,005.55 | | | $ | 19.50 | ** |
| | | | | | | | | | | | | | | | | | | |
| Class Y | | Actual | | | 2.85 | % | | $ | 1,000.00 | | | $ | 1,013.70 | | | $ | 14.35 | ** |
| Class Y | | Hypothetical | | | 2.85 | % | | $ | 1,000.00 | | | $ | 1,010.75 | | | $ | 14.33 | ** |
| | | | | | | | | | | | | | | | | | | |
| Institutional Class | | Actual | | | 2.74 | % | | $ | 1,000.00 | | | $ | 1,013.60 | | | $ | 13.79 | ** |
| Institutional Class | | Hypothetical | | | 2.74 | % | | $ | 1,000.00 | | | $ | 1,011.30 | | | $ | 13.78 | ** |
154
| Other Items (Unaudited) (Continued) | |
| | | | | | | | | | | Expenses |
| | | | | Net Expense | | Beginning | | Ending | | Paid During |
| | | | | Ratio | | Account | | Account | | the Six Months |
| | | | | Annualized | | Value | | Value | | Ended |
| | | | | September 30, | | April 1, | | September 30, | | September 30, |
| | | | | 2016 | | 2016 | | 2016 | | 2016* |
| Touchstone Emerging Markets Small Cap Fund | | | | | | | | | | | | |
| Class A | | Actual | | | 1.69 | % | | $ | 1,000.00 | | | $ | 1,094.20 | | | $ | 8.85 | |
| Class A | | Hypothetical | | | 1.69 | % | | $ | 1,000.00 | | | $ | 1,016.55 | | | $ | 8.52 | |
| | | | | | | | | | | | | | | | | | | |
| Class C | | Actual | | | 2.44 | % | | $ | 1,000.00 | | | $ | 1,089.80 | | | $ | 12.75 | |
| Class C | | Hypothetical | | | 2.44 | % | | $ | 1,000.00 | | | $ | 1,012.80 | | | $ | 12.28 | |
| | | | | | | | | | | | | | | | | | | |
| Class Y | | Actual | | | 1.44 | % | | $ | 1,000.00 | | | $ | 1,096.50 | | | $ | 7.55 | |
| Class Y | | Hypothetical | | | 1.44 | % | | $ | 1,000.00 | | | $ | 1,017.80 | | | $ | 7.26 | |
| | | | | | | | | | | | | | | | | | | |
| Institutional Class | | Actual | | | 1.29 | % | | $ | 1,000.00 | | | $ | 1,097.40 | | | $ | 6.76 | |
| Institutional Class | | Hypothetical | | | 1.29 | % | | $ | 1,000.00 | | | $ | 1,018.55 | | | $ | 6.51 | |
| | | | | | | | | | | | | | | | | | | |
| Touchstone Merger Arbitrage Fund | | | | | | | | | | | | |
| Class A | | Actual | | | 2.80 | % | | $ | 1,000.00 | | | $ | 1,012.90 | | | $ | 14.09 | *** |
| Class A | | Hypothetical | | | 2.80 | % | | $ | 1,000.00 | | | $ | 1,011.00 | | | $ | 14.08 | *** |
| | | | | | | | | | | | | | | | | | | |
| Class C | | Actual | | | 3.55 | % | | $ | 1,000.00 | | | $ | 1,008.60 | | | $ | 17.83 | *** |
| Class C | | Hypothetical | | | 3.55 | % | | $ | 1,000.00 | | | $ | 1,007.25 | | | $ | 17.81 | *** |
| | | | | | | | | | | | | | | | | | | |
| Class Y | | Actual | | | 2.48 | % | | $ | 1,000.00 | | | $ | 1,013.70 | | | $ | 12.48 | *** |
| Class Y | | Hypothetical | | | 2.48 | % | | $ | 1,000.00 | | | $ | 1,012.60 | | | $ | 12.48 | *** |
| | | | | | | | | | | | | | | | | | | |
| Institutional Class | | Actual | | | 2.40 | % | | $ | 1,000.00 | | | $ | 1,014.50 | | | $ | 12.09 | *** |
| Institutional Class | | Hypothetical | | | 2.40 | % | | $ | 1,000.00 | | | $ | 1,013.00 | | | $ | 12.08 | *** |
| | | | | | | | | | | | | | | | | | | |
| Touchstone Mid Cap Fund | | | | | | | | | | | | |
| Class A | | Actual | | | 1.24 | % | | $ | 1,000.00 | | | $ | 1,058.80 | | | $ | 6.38 | |
| Class A | | Hypothetical | | | 1.24 | % | | $ | 1,000.00 | | | $ | 1,018.80 | | | $ | 6.26 | |
| | | | | | | | | | | | | | | | | | | |
| Class C | | Actual | | | 1.99 | % | | $ | 1,000.00 | | | $ | 1,055.00 | | | $ | 10.22 | |
| Class C | | Hypothetical | | | 1.99 | % | | $ | 1,000.00 | | | $ | 1,015.05 | | | $ | 10.02 | |
| | | | | | | | | | | | | | | | | | | |
| Class Y | | Actual | | | 0.99 | % | | $ | 1,000.00 | | | $ | 1,060.50 | | | $ | 5.10 | |
| Class Y | | Hypothetical | | | 0.99 | % | | $ | 1,000.00 | | | $ | 1,020.05 | | | $ | 5.00 | |
| | | | | | | | | | | | | | | | | | | |
| Class Z | | Actual | | | 1.24 | % | | $ | 1,000.00 | | | $ | 1,058.80 | | | $ | 6.38 | |
| Class Z | | Hypothetical | | | 1.24 | % | | $ | 1,000.00 | | | $ | 1,018.80 | | | $ | 6.26 | |
| | | | | | | | | | | | | | | | | | | |
| Institutional Class | | Actual | | | 0.92 | % | | $ | 1,000.00 | | | $ | 1,060.40 | | | $ | 4.74 | |
| Institutional Class | | Hypothetical | | | 0.92 | % | | $ | 1,000.00 | | | $ | 1,020.40 | | | $ | 4.65 | |
| | | | | | | | | | | | | | | | | | | |
| Touchstone Mid Cap Value Fund | | | | | | | | | | | | |
| Class A | | Actual | | | 1.27 | % | | $ | 1,000.00 | | | $ | 1,092.40 | | | $ | 6.64 | |
| Class A | | Hypothetical | | | 1.27 | % | | $ | 1,000.00 | | | $ | 1,018.65 | | | $ | 6.41 | |
| | | | | | | | | | | | | | | | | | | |
| Class C | | Actual | | | 2.02 | % | | $ | 1,000.00 | | | $ | 1,087.80 | | | $ | 10.54 | |
| Class C | | Hypothetical | | | 2.02 | % | | $ | 1,000.00 | | | $ | 1,014.90 | | | $ | 10.18 | |
| | | | | | | | | | | | | | | | | | | |
| Class Y | | Actual | | | 1.02 | % | | $ | 1,000.00 | | | $ | 1,093.60 | | | $ | 5.34 | |
| Class Y | | Hypothetical | | | 1.02 | % | | $ | 1,000.00 | | | $ | 1,019.90 | | | $ | 5.15 | |
| | | | | | | | | | | | | | | | | | | |
| Institutional Class | | Actual | | | 0.89 | % | | $ | 1,000.00 | | | $ | 1,094.60 | | | $ | 4.66 | |
| Institutional Class | | Hypothetical | | | 0.89 | % | | $ | 1,000.00 | | | $ | 1,020.55 | | | $ | 4.50 | |
155
| | Other Items (Unaudited) (Continued) |
| | | | | | | | | | | Expenses |
| | | | | Net Expense | | Beginning | | Ending | | Paid During |
| | | | | Ratio | | Account | | Account | | the Six Months |
| | | | | Annualized | | Value | | Value | | Ended |
| | | | | September 30, | | April 1, | | September 30, | | September 30, |
| | | | | 2016 | | 2016 | | 2016 | | 2016* |
| Touchstone Premium Yield Equity Fund | | | | | | | | | | | | |
| Class A | | Actual | | | 1.20 | % | | $ | 1,000.00 | | | $ | 1,109.10 | | | $ | 6.33 | |
| Class A | | Hypothetical | | | 1.20 | % | | $ | 1,000.00 | | | $ | 1,019.00 | | | $ | 6.06 | |
| | | | | | | | | | | | | | | | | | | |
| Class C | | Actual | | | 1.95 | % | | $ | 1,000.00 | | | $ | 1,103.80 | | | $ | 10.26 | |
| Class C | | Hypothetical | | | 1.95 | % | | $ | 1,000.00 | | | $ | 1,015.25 | | | $ | 9.82 | |
| | | | | | | | | | | | | | | | | | | |
| Class Y | | Actual | | | 0.95 | % | | $ | 1,000.00 | | | $ | 1,109.30 | | | $ | 5.01 | |
| Class Y | | Hypothetical | | | 0.95 | % | | $ | 1,000.00 | | | $ | 1,020.25 | | | $ | 4.80 | |
| | | | | | | | | | | | | | | | | | | |
| Touchstone Sands Capital Select Growth Fund | | | | | | | | | | | | |
| Class A | | Actual | | | 1.07 | % | | $ | 1,000.00 | | | $ | 1,097.20 | | | $ | 5.61 | |
| Class A | | Hypothetical | | | 1.07 | % | | $ | 1,000.00 | | | $ | 1,019.65 | | | $ | 5.40 | |
| | | | | | | | | | | | | | | | | | | |
| Class C | | Actual | | | 1.82 | % | | $ | 1,000.00 | | | $ | 1,092.50 | | | $ | 9.52 | |
| Class C | | Hypothetical | | | 1.82 | % | | $ | 1,000.00 | | | $ | 1,015.90 | | | $ | 9.17 | |
| | | | | | | | | | | | | | | | | | | |
| Class Y | | Actual | | | 0.82 | % | | $ | 1,000.00 | | | $ | 1,098.70 | | | $ | 4.30 | |
| Class Y | | Hypothetical | | | 0.82 | % | | $ | 1,000.00 | | | $ | 1,020.90 | | | $ | 4.14 | |
| | | | | | | | | | | | | | | | | | | |
| Class Z | | Actual | | | 1.02 | % | | $ | 1,000.00 | | | $ | 1,097.20 | | | $ | 5.35 | |
| Class Z | | Hypothetical | | | 1.02 | % | | $ | 1,000.00 | | | $ | 1,019.90 | | | $ | 5.15 | |
| | | | | | | | | | | | | | | | | | | |
| Touchstone Small Cap Fund | | | | | | | | | | | | |
| Class A | | Actual | | | 1.38 | % | | $ | 1,000.00 | | | $ | 1,005.60 | | | $ | 6.92 | |
| Class A | | Hypothetical | | | 1.38 | % | | $ | 1,000.00 | | | $ | 1,018.10 | | | $ | 6.96 | |
| | | | | | | | | | | | | | | | | | | |
| Class C | | Actual | | | 2.13 | % | | $ | 1,000.00 | | | $ | 1,001.90 | | | $ | 10.66 | |
| Class C | | Hypothetical | | | 2.13 | % | | $ | 1,000.00 | | | $ | 1,014.35 | | | $ | 10.73 | |
| | | | | | | | | | | | | | | | | | | |
| Class Y | | Actual | | | 1.13 | % | | $ | 1,000.00 | | | $ | 1,006.70 | | | $ | 5.67 | |
| Class Y | | Hypothetical | | | 1.13 | % | | $ | 1,000.00 | | | $ | 1,019.35 | | | $ | 5.70 | |
| | | | | | | | | | | | | | | | | | | |
| Institutional Class | | Actual | | | 1.04 | % | | $ | 1,000.00 | | | $ | 1,007.40 | | | $ | 5.22 | |
| Institutional Class | | Hypothetical | | | 1.04 | % | | $ | 1,000.00 | | | $ | 1,019.80 | | | $ | 5.25 | |
| | | | | | | | | | | | | | | | | | | |
| Touchstone Small Cap Value Fund | | | | | | | | | | | | |
| Class A | | Actual | | | 1.38 | % | | $ | 1,000.00 | | | $ | 1,085.80 | | | $ | 7.20 | |
| Class A | | Hypothetical | | | 1.38 | % | | $ | 1,000.00 | | | $ | 1,018.10 | | | $ | 6.96 | |
| | | | | | | | | | | | | | | | | | | |
| Class C | | Actual | | | 2.13 | % | | $ | 1,000.00 | | | $ | 1,081.50 | | | $ | 11.08 | |
| Class C | | Hypothetical | | | 2.13 | % | | $ | 1,000.00 | | | $ | 1,014.35 | | | $ | 10.73 | |
| | | | | | | | | | | | | | | | | | | |
| Class Y | | Actual | | | 1.13 | % | | $ | 1,000.00 | | | $ | 1,086.70 | | | $ | 5.89 | |
| Class Y | | Hypothetical | | | 1.13 | % | | $ | 1,000.00 | | | $ | 1,019.35 | | | $ | 5.70 | |
| | | | | | | | | | | | | | | | | | | |
| Institutional Class | | Actual | | | 0.98 | % | | $ | 1,000.00 | | | $ | 1,087.70 | | | $ | 5.11 | |
| Institutional Class | | Hypothetical | | | 0.98 | % | | $ | 1,000.00 | | | $ | 1,020.10 | | | $ | 4.95 | |
156
| Other Items (Unaudited) (Continued) | |
| | | | | | | | | | | Expenses |
| | | | | Net Expense | | Beginning | | Ending | | Paid During |
| | | | | Ratio | | Account | | Account | | the Six Months |
| | | | | Annualized | | Value | | Value | | Ended |
| | | | | September 30, | | April 1, | | September 30, | | September 30, |
| | | | | 2016 | | 2016 | | 2016 | | 2016* |
| Touchstone Total Return Bond Fund | | | | | | | | | | | | |
| Class A | | Actual | | | 0.85 | % | | $ | 1,000.00 | | | $ | 1,028.90 | | | $ | 4.31 | |
| Class A | | Hypothetical | | | 0.85 | % | | $ | 1,000.00 | | | $ | 1,020.75 | | | $ | 4.29 | |
| | | | | | | | | | | | | | | | | | | |
| Class C | | Actual | | | 1.60 | % | | $ | 1,000.00 | | | $ | 1,024.10 | | | $ | 8.10 | |
| Class C | | Hypothetical | | | 1.60 | % | | $ | 1,000.00 | | | $ | 1,017.00 | | | $ | 8.07 | |
| | | | | | | | | | | | | | | | | | | |
| Class Y | | Actual | | | 0.60 | % | | $ | 1,000.00 | | | $ | 1,029.10 | | | $ | 3.04 | |
| Class Y | | Hypothetical | | | 0.60 | % | | $ | 1,000.00 | | | $ | 1,022.00 | | | $ | 3.03 | |
| | | | | | | | | | | | | | | | | | | |
| Institutional Class | | Actual | | | 0.50 | % | | $ | 1,000.00 | | | $ | 1,030.70 | | | $ | 2.54 | |
| Institutional Class | | Hypothetical | | | 0.50 | % | | $ | 1,000.00 | | | $ | 1,022.50 | | | $ | 2.53 | |
| | | | | | | | | | | | | | | | | | | |
| Touchstone Ultra Short Duration Fixed Income Fund | | | | | | | | | | | | |
| Class A | | Actual | | | 0.69 | % | | $ | 1,000.00 | | | $ | 1,008.50 | | | $ | 3.46 | |
| Class A | | Hypothetical | | | 0.69 | % | | $ | 1,000.00 | | | $ | 1,021.55 | | | $ | 3.49 | |
| | | | | | | | | | | | | | | | | | | |
| Class C | | Actual | | | 1.19 | % | | $ | 1,000.00 | | | $ | 1,006.00 | | | $ | 5.97 | |
| Class C | | Hypothetical | | | 1.19 | % | | $ | 1,000.00 | | | $ | 1,019.05 | | | $ | 6.01 | |
| | | | | | | | | | | | | | | | | | | |
| Class Y | | Actual | | | 0.44 | % | | $ | 1,000.00 | | | $ | 1,009.80 | | | $ | 2.21 | |
| Class Y | | Hypothetical | | | 0.44 | % | | $ | 1,000.00 | | | $ | 1,022.80 | | | $ | 2.23 | |
| | | | | | | | | | | | | | | | | | | |
| Class Z | | Actual | | | 0.69 | % | | $ | 1,000.00 | | | $ | 1,008.50 | | | $ | 3.46 | |
| Class Z | | Hypothetical | | | 0.69 | % | | $ | 1,000.00 | | | $ | 1,021.55 | | | $ | 3.49 | |
| | | | | | | | | | | | | | | | | | | |
| Institutional Class | | Actual | | | 0.39 | % | | $ | 1,000.00 | | | $ | 1,009.00 | | | $ | 1.96 | |
| Institutional Class | | Hypothetical | | | 0.39 | % | | $ | 1,000.00 | | | $ | 1,023.05 | | | $ | 1.97 | |
| * | Expenses are equal to the Fund’s annualized expense ratio, multiplied by the average account value over the period, multiplied by 183/366 (to reflect one-half year period). |
| | |
| ** | Excluding interest and dividend expenses on securities sold short, your actual cost of investment in Class A, Class C, Class Y and Institutional Class would be $8.45, $12.20, $7.00 and $6.44, respectively, and your hypothetical cost of investment in Class A, Class C, Class Y and Institutional Class would be $8.47, $12.23, $7.01, and $6.46, respectively. |
| | |
| *** | Excluding interest and dividend expenses on securities sold short, your actual cost of investment in Class A, Class C, Class Y and Institutional Class would be $8.45, $12.20, $6.85 and $6.45, respectively, and your hypothetical cost of investment in Class A, Class C, Class Y and Institutional Class would be $8.47, $12.23, $6.86, and $6.46, respectively. |
Basis for Board’s Approval of Sub-Advisory Agreements and Interim Sub-Advisory
Touchstone Emerging Markets Small Cap Fund
At an in-person meeting held on February 11, 2016 (the “Meeting”), Touchstone Advisors, Inc. (the “Advisor”) proposed the replacement of the current sub-adviser of the Touchstone Emerging Markets Equity Fund, currently known as Touchstone Emerging Markets Small Cap Fund (the “Fund”), AGF Investments America Inc. (“AGF”), to the Board of Trustees (the “Board”) of Touchstone Funds Group Trust (the “Trust”). As discussed below, the Board approved replacing AGF with Copper Rock Capital Partners LLC (“Copper Rock”). In connection with this sub-advisor change, the Board also approved changes to the Fund’s investment policy and name.
The Advisor and Copper Rock provided the Board with various written materials in advance of the Meeting to assist with the Board’s consideration of Copper Rock as sub-advisor. The Advisor provided written and oral information stating the basis for its recommendation to engage Copper Rock and to transition the Fund to
157
| | Other Items (Unaudited) (Continued) |
Copper Rock’s emerging markets small cap strategy. The information also included details regarding Copper Rock’s: (a) investment philosophy and investment process; (b) investment management services proposed to be provided to the Fund; (c) investment management personnel; (d) operating history, infrastructure and financial condition; (e) proposed sub-advisory fees that would be paid to Copper Rock by the Advisor; and (f) reputation, expertise and resources as an investment advisor. The Board then discussed the written materials that the Board received before the Meeting and all other information that the Board received at the Meeting.
The Board, including the Independent Trustees of the Trust, voting separately, unanimously determined that the proposal to approve the Sub-Advisory Agreement for the Fund would be in the best interests of the Fund. In approving the Sub-Advisory Agreement, the Board considered various factors, among them: (1) the nature, extent and quality of services to be provided to the Fund, including the personnel who would be providing such services; (2) Copper Rock’s proposed compensation; (3) the performance of the Fund and that of a composite of the accounts managed by Copper Rock that use the same emerging markets small cap strategy that Copper Rock proposes to use in managing the Fund; and (4) the terms of the Sub-Advisory Agreement. The Board’s consideration of these factors is summarized below. The Independent Trustees were advised by independent legal counsel throughout the process.
Nature, Extent and Quality of Services Provided; Investment Personnel. The Board considered information provided by the Advisor and Copper Rock regarding the services to be provided by Copper Rock. The Board considered Copper Rock’s level of knowledge and investment style. The Board reviewed the experience and credentials of the investment personnel who would be responsible for managing the investment of portfolio securities with respect to the Fund. The Board also took into consideration that the Advisor was satisfied with Copper Rock’s in-house risk and compliance teams. The Board also took into account Copper Rock’s management of the Touchstone International Small Cap Fund.
Copper Rock’s Compensation. The Board took into consideration the financial condition of Copper Rock and any direct and indirect benefits to be derived by Copper Rock’s relationship with the Fund. In considering the anticipated level of profitability to Copper Rock, the Board noted the proposed contractual undertaking of the Advisor to maintain the current levels of expense limitations for the Fund, that the sub-advisory fees under the Sub-Advisory Agreement would be paid by the Advisor out of the advisory fees that it receives from the Fund, and that the sub-advisory fees were negotiated at arm’s length between the Advisor and Copper Rock. As a consequence, the anticipated level of profitability to Copper Rock from its relationship with the Fund was not a substantial factor in the Board’s deliberations. For similar reasons, the Board did not consider potential economies of scale in Copper Rock’s management of the Fund to be a substantial factor in its consideration, although the Board noted that the proposed sub-advisory fee schedule contains breakpoints that would reduce the sub-advisory fee rate if Fund assets exceed specified levels.
Sub-Advisory Fees and Fund Performance. The Board considered that the Fund would pay an advisory fee to the Advisor and that the Advisor would pay a sub-advisory fee to Copper Rock out of the advisory fee. The Board also considered certain comparative fee information concerning the sub-advisory fee that was paid to AGF for managing the Fund.The Board also compared Copper Rock’s proposed sub-advisory fee to the sub-advisory fee paid to AGF, noting that the proposed sub-advisory fee schedule with Copper Rock was identical to the current sub-advisory fee schedule with AGF. The Board considered the amount of the advisory fee to be retained by the Advisor and the amount to be paid to Copper Rock, with respect to the various services to be provided by the Advisor and Copper Rock. The Board also noted that the Advisor negotiated the sub-advisory fee with Copper Rock at arm’s length. The Board also noted that identical expense caps were expected to remain in place for the Fund following the proposed sub-advisor change.
The Board also considered the performance of Copper Rock’s strategies and the Fund’s performance record under AGF’s management. The Board also reviewed Copper Rock’s investment performance, highlighting the
158
| Other Items (Unaudited) (Continued) | |
firm’s strong performance in its emerging markets small-cap strategy relative to the MSCI Emerging Markets Small Cap Index. Based upon their review, the Trustees concluded that the Fund’s proposed sub-advisory fee was reasonable in light of the services to be provided by Copper Rock to the Fund.
Conclusion. The Board reached the following conclusions regarding the Sub-Advisory Agreement: (a) Copper Rock is qualified to manage the Fund’s assets in accordance with the Fund’s investment goal and policies; (b) Copper Rock maintains an appropriate and effective compliance program; (c) the Fund’s proposed sub-advisory fee is reasonable in relation to the services to be provided by Copper Rock; and (d) Copper Rock’s proposed investment strategies are appropriate for pursuing the Fund’s investment goal. In considering the approval of the Sub-Advisory Agreement, the Board, including the Independent Trustees, did not identify any single factor as controlling, and each Trustee attributed different weights to the various factors. Based on its conclusions, the Board determined that approval of the Sub-Advisory Agreement was in the best interests of the Fund and its shareholders.
In connection with the approval of Copper Rock as the sub-advisor to the Fund at the Meeting, the Advisor also proposed to the Board the appointment of Russell Implementation Services, Inc. (“Russell”), as the interim sub-advisor to the Fund. The Board approved the appointment of Russell as the interim sub-advisor, effective on or around February 20, 2016, until on or about April 18, 2016.
The Advisor and Russell provided the Board with various written materials in advance of the Meeting to assist with the Board’s consideration of Russell as the Fund’s interim sub-advisor. The Advisor provided written and oral information stating the basis for its recommendation to engage Russell as an interim sub-advisor. The information also included details regarding Russell’s: (a) investment philosophy and investment process; (b) investment management services proposed to be provided to the Fund; (c) investment management personnel; (d) operating history, infrastructure and financial condition; (e) proposed interim sub-advisory fee that would be paid to Russell by the Advisor; and (f) reputation, expertise and resources as an interim investment advisor. The Board then discussed the written materials that the Board received before the Meeting and all other information that the Board received at the Meeting.
The Board, including the Independent Trustees of the Trust, voting separately, unanimously determined that the proposal to approve the Interim Sub-Advisory Agreement for the Fund would be in the best interests of the shareholders and the Fund. In approving the Interim Sub-Advisory Agreement, the Board considered various factors, among them: (1) the nature, extent, and quality of services to be provided by Russell to the Fund, including the personnel who would be providing such services; (2) Russell’s proposed compensation; (3) Russell’s past performance; and (4) the terms of the Interim Sub-Advisory Agreement. The Board’s analysis of these factors is set forth below. The Independent Trustees were advised by independent legal counsel throughout the process.
Nature, Extent and Quality of Services Provided; Investment Personnel. The Board considered information provided by the Advisor regarding the services to be provided by Russell. The Board considered Russell’s level of knowledge and investment style. The Board reviewed the experience and credentials of the investment personnel who would be responsible for managing the investment of portfolio securities with respect to the Fund. The Board also took into consideration that the Advisor was satisfied with Russell’s in-house risk and compliance teams.
Russell’s Compensation. The Board took into consideration the financial condition of Russell and any direct and indirect benefits to be derived by Russell’s relationship with the Fund. In considering the anticipated level of profitability to Russell, the Board noted the proposed contractual undertaking of the Advisor to maintain expense limitations for the Fund and also noted that the interim sub-advisory fee under the Interim Sub-Advisory Agreement would be paid by the Advisor out of the advisory fee that it receives from the Fund, and that the interim sub-advisory fee was negotiated at arm’s length between the Advisor and Russell. As a consequence, the anticipated level of profitability to Russell from its relationship with the Fund was not a substantial factor
159
| | Other Items (Unaudited) (Continued) |
in the Board’s deliberations. For similar reasons, the Board did not consider potential economies of scale in Russell’s management of the Fund to be a substantial factor in its consideration.
Interim Sub-Advisory Fee and Fund Performance. The Board considered that the Fund would pay an advisory fee to the Advisor and that the Advisor would pay an interim sub-advisory fee to Russell out of that advisory fee. The Board also considered certain comparative fee information concerning the sub-advisory fee that was paid to AGF for managing the Fund. The Board also compared Russell’s proposed interim sub-advisory fee to the sub-advisory fees paid to AGF, noting that the proposed interim sub-advisory fee schedule to Russell was substantially lower than AGF’s sub-advisory fee schedule. The Board considered the amount of the advisory fee to be retained by the Advisor and the amount to be paid to Russell, with respect to the various services to be provided by the Advisor and Russell. The Board also noted that the Advisor negotiated the interim sub-advisory fee with Russell at arm’s length.
The Board also considered Russell’s investment performance and the Fund’s performance record under AGF’s management. TheTrustees also noted that Russell has extensive experience providing transition services, including interim management, to the Touchstone Funds complex during sub-advisor transitions and that the Advisor was satisfied with Russell’s management of those funds. Based upon their review, the Trustees concluded that the Fund’s proposed interim sub-advisory fee was reasonable in light of the services to be received by the Fund from Russell.
Conclusion. The Board reached the following conclusions regarding the Interim Sub-Advisory Agreement: (a) Russell is qualified to manage the Fund’s assets in accordance with the Fund’s investment goal and policies; (b) Russell maintains an appropriate compliance program; (c) the Fund’s proposed interim sub-advisory fee is reasonable in relation to the fees of similar funds and the services to be provided by Russell; and (d) Russell’s proposed investment strategies are appropriate for pursuing the investment goal of the Fund. In considering the approval of the Interim Sub-Advisory Agreement, the Board, including the Independent Trustees, did not identify any single factor as controlling, and each Trustee attributed different weights to the various factors. Based on its conclusions, the Board determined that approval of the Interim Sub-Advisory Agreement was in the best interests of the Fund and its shareholders.
Touchstone Small Cap Value Fund
At an in-person meeting held on May 19, 2016 (the “Meeting”), the Advisor proposed the replacement of the current sub-adviser of the Touchstone Small Cap Value Fund (the “Fund”), DePrince Race and Zollo, Inc. (“DRZ”), to the Board of the Trust. As discussed below, the Board approved replacing DRZ with LMCG Investments, LLC (“LMCG”).
The Advisor and LMCG provided the Board with various written materials in advance of the Meeting to assist with the Board’s consideration of LMCG as sub-advisor. The Advisor provided written and oral information stating the basis for its recommendation to engage LMCG and to transition the Fund to LMCG’s small cap value strategy. The information also included details regarding LMCG’s: (a) investment philosophy and investment process; (b) investment management services proposed to be provided to the Fund; (c) investment management personnel; (d) operating history, infrastructure and financial condition; (e) proposed sub-advisory fees that would be paid to LMCG by the Advisor; and (f) reputation, expertise and resources as an investment advisor. The Board then discussed the written materials that the Board received before the Meeting and all other information that the Board received at the Meeting.
The Board, including the Independent Trustees of the Trust, voting separately, unanimously determined that the proposal to approve the Sub-Advisory Agreement for the Fund would be in the best interests of the Fund. In approving the Sub-Advisory Agreement, the Board considered various factors, among them: (1) the nature, extent and quality of services to be provided to the Fund, including the personnel who would be providing
160
| Other Items (Unaudited) (Continued) | |
such services; (2) LMCG’s proposed compensation; (3) the performance of the Fund and that of a composite of the accounts managed by LMCG that use the same small cap value strategy that LMCG proposes to use in managing the Fund; and (4) the terms of the Sub-Advisory Agreement. The Board’s consideration of these factors is summarized below. The Independent Trustees were advised by independent legal counsel throughout the process.
Nature, Extent and Quality of Services Provided; Investment Personnel. The Board considered information provided by the Advisor and LMCG regarding the services to be provided by LMCG. The Board considered LMCG’s level of knowledge and investment style. The Board reviewed the experience and credentials of the investment personnel who would be responsible for managing the investment of portfolio securities with respect to the Fund. The Board also took into consideration that the Advisor was satisfied with LMCG’s in-house risk and compliance teams. The Board also took into account LMCG’s well-established record as investment sub-advisor to the Touchstone Mid Cap Value Fund.
LMCG’s Compensation. The Board took into consideration the financial condition of LMCG and any direct and indirect benefits to be derived by LMCG’s relationship with the Fund. In considering the anticipated level of profitability to LMCG, the Board noted the proposed contractual undertaking of the Advisor to maintain the current levels of expense limitations for the Fund, that the sub-advisory fees under the Sub-Advisory Agreement would be paid by the Advisor out of the advisory fee that it receives from the Fund, and that the sub-advisory fee was negotiated at arm’s length between the Advisor and LMCG. As a consequence, the anticipated level of profitability to LMCG from its relationship with the Fund was not a substantial factor in the Board’s deliberations. For similar reasons, the Board did not consider potential economies of scale in LMCG’s management of the Fund to be a substantial factor in its consideration.
Sub-Advisory Fees and Fund Performance. The Board considered that the Fund would pay an advisory fee to the Advisor and that the Advisor would pay a sub-advisory fee to LMCG out of the advisory fee. The Board also considered certain comparative fee information concerning the sub-advisory fee paid to DRZ for managing the Fund. The Board also compared LMCG’s proposed sub-advisory fee to the sub-advisory fee that was paid to DRZ, noting that the proposed sub-advisory fee schedule to be paid by the Advisor to LMCG was slightly lower than the sub-advisory fee paid to DRZ. The Board considered the amount of the advisory fee to be retained by the Advisor and the amount to be paid to LMCG, with respect to the various services to be provided by the Advisor and LMCG. The Board also noted that the Advisor negotiated the sub-advisory fee with LMCG at arm’s length. The Board also noted that identical expense caps were expected to remain in place for the Fund following the proposed sub-advisor change.
The Board also considered the performance of LMCG’s strategies and the Fund’s performance record under DRZ’s management. The Board also reviewed LMCG’s investment performance, highlighting the firm’s strong performance in its small cap value strategy relative to the Russell 2000® Value Index. Based upon their review, the Trustees concluded that the Fund’s proposed sub-advisory fee was reasonable in light of the services to be provided by LMCG to the Fund.
Conclusion. The Board reached the following conclusions regarding the Sub-Advisory Agreement: (a) LMCG is qualified to manage the Fund’s assets in accordance with the Fund’s investment goal and policies; (b) LMCG maintains an appropriate and effective compliance program; (c) the Fund’s proposed sub-advisory fee is reasonable in relation to the services to be provided by LMCG; and (d) LMCG’s proposed investment strategies are appropriate for pursuing the Fund’s investment goal. In considering the approval of the Sub-Advisory Agreement, the Board, including the Independent Trustees, did not identify any single factor as controlling, and each Trustee attributed different weights to the various factors. Based on its conclusions, the Board determined that approval of the Sub-Advisory Agreement was in the best interests of the Fund and its shareholders.
161
| | Other Items (Unaudited) (Continued) |
In connection with the approval of LMCG as the sub-advisor to the Fund at the Meeting, the Advisor also proposed to the Board the appointment of Russell Implementation Services, Inc. (“Russell”), as the interim sub-advisor to the Fund. The Board approved the appointment of Russell as the interim sub-advisor, effective on or around May 21, 2016, until on or about June 30, 2016.
The Advisor and Russell provided the Board with various written materials in advance of the Meeting to assist with the Board’s consideration of Russell as the Fund’s interim sub-advisor. The Advisor provided written and oral information stating the basis for its recommendation to engage Russell as an interim sub-advisor. The information also included details regarding Russell’s: (a) investment philosophy and investment process; (b) investment management services proposed to be provided to the Fund; (c) investment management personnel; (d) operating history, infrastructure and financial condition; (e) proposed interim sub-advisory fee that would be paid to Russell by the Advisor; and (f) reputation, expertise and resources as an interim investment advisor. The Board then discussed the written materials that the Board received before the Meeting and all other information that the Board received at the Meeting.
The Board, including the Independent Trustees of the Trust, voting separately, unanimously determined that the proposal to approve the Interim Sub-Advisory Agreement for the Fund would be in the best interests of the shareholders and the Fund. In approving the Interim Sub-Advisory Agreement, the Board considered various factors, among them: (1) the nature, extent, and quality of services to be provided by Russell to the Fund, including the personnel who would be providing such services; (2) Russell’s proposed compensation; (3) Russell’s past performance; and (4) the terms of the Interim Sub-Advisory Agreement. The Board’s analysis of these factors is set forth below. The Independent Trustees were advised by independent legal counsel throughout the process.
Nature, Extent and Quality of Services Provided; Investment Personnel. The Board considered information provided by the Advisor regarding the services to be provided by Russell. The Board considered Russell’s level of knowledge and investment style. The Board reviewed the experience and credentials of the investment personnel who would be responsible for managing the investment of portfolio securities with respect to the Fund. The Board also took into consideration that the Advisor was satisfied with Russell’s in-house risk and compliance teams.
Russell’s Compensation. The Board took into consideration the financial condition of Russell and any direct and indirect benefits to be derived by Russell’s relationship with the Fund. In considering the anticipated level of profitability to Russell, the Board noted the proposed contractual undertaking of the Advisor to maintain expense limitations for the Fund and also noted that the interim sub-advisory fee under the Interim Sub-Advisory Agreement would be paid by the Advisor out of the advisory fee that it receives from the Fund, and that the interim sub-advisory fee was negotiated at arm’s length between the Advisor and Russell. As a consequence, the anticipated level of profitability to Russell from its relationship with the Fund was not a substantial factor in the Board’s deliberations. For similar reasons, the Board did not consider potential economies of scale in Russell’s management of the Fund to be a substantial factor in its consideration.
Interim Sub-Advisory Fee and Fund Performance. The Board considered that the Fund would pay an advisory fee to the Advisor and that the Advisor would pay an interim sub-advisory fee to Russell out of that advisory fee. The Board also considered certain comparative fee information concerning the sub-advisory fee that was paid to DRZ for managing the Fund. The Board also compared Russell’s proposed interim sub-advisory fee to the sub-advisory fees paid to DRZ, noting that the proposed interim sub-advisory fee schedule to Russell was substantially lower than DRZ’s sub-advisory fee schedule. The Board considered the amount of the advisory fee to be retained by the Advisor and the amount to be paid to Russell, with respect to the various services to be provided by the Advisor and Russell. The Board also noted that the Advisor negotiated the interim sub-advisory fee with Russell at arm’s length.
162
| Other Items (Unaudited) (Continued) | |
The Board also considered Russell’s investment performance and the Fund’s performance record under DRZ’s management. TheTrustees also noted that Russell has extensive experience providing transition services, including interim management, to the Touchstone Funds complex during sub-advisor transitions and that the Advisor was satisfied with Russell’s management of those funds. Based upon their review, the Trustees concluded that the Fund’s proposed interim sub-advisory fee was reasonable in light of the services to be received by the Fund from Russell.
Conclusion. The Board reached the following conclusions regarding the Interim Sub-Advisory Agreement: (a) Russell is qualified to manage the Fund’s assets in accordance with the Fund’s investment goal and policies; (b) Russell maintains an appropriate compliance program; (c) the Fund’s proposed interim sub-advisory fee is reasonable in relation to the fees of similar funds and the services to be provided by Russell; and (d) Russell’s proposed investment strategies are appropriate for pursuing the investment goal of the Fund. In considering the approval of the Interim Sub-Advisory Agreement, the Board, including the Independent Trustees, did not identify any single factor as controlling, and each Trustee attributed different weights to the various factors. Based on its conclusions, the Board determined that approval of the Interim Sub-Advisory Agreement was in the best interests of the Fund and its shareholders.
163
| | Management of the Trust (Unaudited) |
Listed below is required information regarding the Trustees and principal officers of the Trust. The Trust’s Statement of Additional Information includes additional information about the Trustees and is available, without charge, upon request by calling 1.800.543.0407 or by visiting the Touchstone website at TouchstoneInvestments.com.
Interested Trustee1 :
| | | | | | | | | Number | | |
| | | | | | | | | of Funds | | |
| | | | | | | | | Overseen | | |
| | | | | Term of | | | | in the | | |
| Name | | Position(s) | | Office And | | | | Touchstone | | Other |
| Address | | Held with | | Length of | | Principal Occupation(s) | | Fund | | Directorships |
| Age | | Trust | | Time Served | | During Past 5 Years | | Complex2 | | Held During the Past 5 Years3 |
| Jill T. McGruder Touchstone Advisors, Inc. 303 Broadway Suite 1100 Cincinnati, OH 45202 Year of Birth: 1955 | | Trustee and President | | Until retirement at age 75 or until she resigns or is removed Trustee since 1999 | | President and CEO of IFS Financial Services, Inc. (a holding company). | | 41 | | Director of LaRosa’s, Inc. (a restaurant chain) from 1999 to 2011; IFS Financial Services, Inc. (a holding company) from 1999 to the present; Integrity and National Integrity Life Insurance Co. from 2005 to the present; Touchstone Securities (the Trust’s distributor) from 1999 to the present; Touchstone Advisors (the Trust’s investment advisor and administrator) from 1999 to the present; W&S Brokerage Services (a brokerage company) from 1999 to the present; W&S Financial Group Distributors (a distribution company) from 1999 to the present; Every Child Succeeds (a social services agency) from 2007 to the present; Taft Museum of Art from 2007 to the present; and YWCA of Greater Cincinnati from 2012 to the present. |
| Independent Trustees: | | | | | | | | | | |
| Phillip R. Cox c/o Touchstone Advisors, Inc. 303 Broadway Suite 1100 Cincinnati, OH 45202 Year of Birth: 1947 | | Trustee | | Until retirement at age 75 or until he resigns or is removed Trustee since 1999 | | President and Chief Executive Officer of Cox Financial Corp. (a financial services company) from 1971 to the present. | | 41 | | Director of Cincinnati Bell (a communications company) from 1994 to the present; Bethesda Inc. (a hospital) from 2005 to the present; Timken Co. (a manufacturing company) from 2004 to 2014; TimkenSteel from 2014 to the present; Diebold, Inc. (a technology solutions company) from 2004 to the present; and Ohio Business Alliance for Higher Education and the Economy from 2005 to the present. |
| William C. Gale c/o Touchstone Advisors, Inc. 303 Broadway Suite 1100 Cincinnati, OH 45202 Year of Birth: 1952 | | Trustee | | Until retirement at age 75 or until he resigns or is removed Trustee since 2013 | | Retired; formerly Senior Vice President and Chief Financial Officer (from 2003 to January 2015) of Cintas Corporation (a business services company). | | 41 | | None. |
164
| Management of the Trust (Unaudited) (Continued) | |
Independent Trustees (Continued):
| | | | | | | | | Number | | |
| | | | | | | | | of Funds | | |
| | | | | | | | | Overseen | | |
| | | | | Term of | | | | in the | | |
| Name | | Position(s) | | Office And | | | | Touchstone | | Other |
| Address | | Held with | | Length of | | Principal Occupation(s) | | Fund | | Directorships |
| Age | | Trust | | Time Served | | During Past 5 Years | | Complex2 | | Held During the Past 5 Years3 |
| Susan J. Hickenlooper c/o Touchstone Advisors, Inc. 303 Broadway Suite 1100 Cincinnati, OH 45202 Year of Birth: 1946 | | Trustee | | Until retirement at age 75 or until she resigns or is removed Trustee since 2009 | | Retired; formerly Financial Analyst for Impact 100 (charitable organization) from November 2012 to 2013. | | 41 | | Trustee of Diocese of Southern Ohio from 2014 to the present; and Trustee of Episcopal Retirement Homes Foundation from 1998 to 2011 (a charitable organization). |
| Kevin A. Robie c/o Touchstone Advisors, Inc. 303 Broadway Suite 1100 Cincinnati, OH 45202 Year of Birth: 1956 | | Trustee | | Until retirement at age 75 or until he resigns or is removed Trustee since 2013 | | Vice President of Portfolio Management at Soin International LLC (a private multinational holding company) from 2004 to the present. | | 41 | | Director of Buckeye EcoCare, Inc. (a lawn care company) from 2013 to the present; Trustee of Dayton Region New Market Fund, LLC (a private fund) from 2010 to the present; Trustee of the Entrepreneurs Center, Inc. (a small business incubator) from 2006 to the present; and Director of Interventional Imaging, Inc. (a medical device company) from 2004 to 2011. |
| Edward J. VonderBrink c/o Touchstone Advisors, Inc. 303 Broadway Suite 1100 Cincinnati, OH 45202 Year of Birth: 1944 | | Trustee | | Until retirement at age 75 or until he resigns or is removed Trustee since 2013 | | Consultant, VonderBrink Consulting LLC from 2000 to the present. | | 41 | | Director of Streamline Health Solutions, Inc. (healthcare IT) from 2006 to 2015; Mercy Health from 2013 to the present; Mercy Health Foundation (healthcare nonprofit) from 2008 to the present; Al Neyer Inc. (a construction company) from 2013 to the present; and BASCO Shower Door from 2011 to the present. |
| 1 | Ms. McGruder, as a director of the Advisor and the Distributor, and an officer of affiliates of the Advisor and the Distributor, is an “interested person” of the Trust within the meaning of Section 2(a) (19) of the 1940 Act. |
| | |
| 2 | As of September 30, 2016, the Touchstone Fund Complex consisted of 11 series of the Trust, 1 series of Touchstone Institutional Funds Trust, 2 series of Touchstone Investment Trust, 20 series of Touchstone Strategic Trust, 1 series of Touchstone Tax-Free Trust, and 6 variable annuity series of Touchstone Variable Series Trust. |
| | |
| 3 | Each Trustee is also a Trustee of Touchstone Institutional Funds Trust, Touchstone Investment Trust, Touchstone Strategic Trust, Touchstone Tax-Free Trust, and Touchstone Variable Series Trust. |
165
| | Management of the Trust (Unaudited) (Continued) |
The following is a list of the Principal Officers of theTrusts, the length of time served, and principal occupations for the past five years.
Principal Officers:
| | | | | Term of | | |
| Name | | Position(s) | | Office And | | |
| Address | | Held with | | Length of | | Principal Occupation(s) |
| Age | | Trust1 | | Time Served | | During the Past 5 Years |
| Jill T. McGruder Touchstone Advisors, Inc. 303 Broadway Suite 1100 Cincinnati, OH 45202 Year of Birth: 1955 | | President and Trustee | | Until resignation, removal or disqualification President since 2006 | | See biography above. |
| Steven M. Graziano Touchstone Advisors, Inc. 303 Broadway Suite 1100 Cincinnati, OH 45202 Year of Birth: 1954 | | Vice President | | Until resignation, removal or disqualification Vice President since 2009 | | President of Touchstone Advisors, Inc. |
| Timothy D. Paulin Touchstone Advisors, Inc. 303 Broadway Suite 1100 Cincinnati, OH 45202 Year of Birth: 1963 | | Vice President | | Until resignation, removal or disqualification Vice President since 2010 | | Senior Vice President of Investment Research and Product Management of Touchstone Advisors, Inc. |
| Timothy S. Stearns Touchstone Advisors, Inc. 303 Broadway Suite 1100 Cincinnati, OH 45202 Year of Birth: 1963 | | Chief Compliance Officer | | Until resignation, removal or disqualification Chief Compliance Officer since 2013 | | Chief Compliance Officer of Touchstone Advisors, Inc.; Chief Compliance Officer of Envestnet Asset Management, Inc. (2009 to 2013). |
| Terrie A. Wiedenheft Touchstone Advisors, Inc. 303 Broadway Suite 1100 Cincinnati, OH 45202 Year of Birth: 1962 | | Controller and Treasurer | | Until resignation, removal or disqualification Controller and Treasurer since 2006 | | Senior Vice President, Chief Financial Officer and Chief Operations Officer, of IFS Financial Services, Inc. (a holding company). |
| Ellen Blanchard BNY Mellon Investment Servicing (US) Inc. 201 Washington St, 34th Fl. Boston, MA 02108 Year of Birth: 1973 | | Secretary | | Until resignation, removal or disqualification Secretary since 2015 | | Director and Senior Counsel of BNY Mellon Investment Servicing (US) Inc. |
| 1 | Each officer also holds the same office with Touchstone Institutional Funds Trust, Touchstone Investment Trust, Touchstone Strategic Trust, Touchstone Tax-Free Trust and Touchstone Variable Series Trust. |
166
PRIVACY PROTECTION POLICY
We Respect Your Privacy
Thank you for your decision to invest with us. Touchstone and its affiliates have always placed a high value on the trust and confidence our clients place in us. We believe that confidence must be earned and validated through time. In today’s world, when technology allows the sharing of information at light speeds, trust must be reinforced by our sincere pledge to take the steps necessary to ensure that the information you share with us is treated with respect and confidentiality.
Our Pledge to Our Clients
| • | We collect only the information we need to service your account and administer our business. |
| | |
| • | We are committed to keeping your information confidential and we place strict limits and controls on the use and sharing of your information. |
| | |
| • | We make every effort to ensure the accuracy of your information. |
We Collect the Following Nonpublic Personal Information About You:
| • | Information we receive from you on or in applications or other forms, correspondence, or conversations, including, but not limited to, your name, address, phone number, social security number, assets, income and date of birth; and |
| | |
| • | Information about your transactions with us, our affiliates, or others, including, but not limited to, your account number and balance, payment history, parties to transactions, cost basis information, and other financial information. |
Categories of Information We Disclose and Parties to Whom We Disclose
We do not disclose any nonpublic personal information about our current or former clients to nonaffiliated third parties, except as required or permitted by law.
We Place Strict Limits and Controls on the Use and Sharing of Your Information
| • | We restrict access to nonpublic personal information about you to authorized employees who need the information to administer your business. |
| | |
| • | We maintain physical, electronic and procedural safeguards that comply with federal standards to protect this information. |
| | |
| • | We do not disclose any nonpublic personal information about our current or former clients to anyone, except as required or permitted by law or as described in this document. |
| | |
| • | We will not sell your personal information to anyone. |
We May Provide Information to Service Your Account
Sometimes it is necessary to provide information about you to various companies such as transfer agents, custodians, broker-dealers and marketing service firms to facilitate the servicing of your account. These organizations have a legitimate business need to see some of your personal information in order for us to provide service to you. We may disclose to these various companies the information that we collect as described above. We require that these companies, including our own subsidiaries and affiliates, strictly maintain the confidentiality of this information and abide by all applicable laws. Companies within our corporate family that may receive this information are financial service providers and insurance companies. We do not permit these associated companies to sell the information for their own purposes, and we never sell our customer information.
This policy is applicable to the following affiliated companies: Touchstone Funds Group Trust, Touchstone Investment Trust, Touchstone Strategic Trust, Touchstone Tax-Free Trust, Touchstone Variable Series Trust, Touchstone Institutional Funds Trust, Touchstone Securities, Inc.,* and W&S Brokerage Services, Inc.
* Touchstone Securities, Inc. serves as the underwriter to the Touchstone Funds.
A Member of Western & Southern Financial Group®
The Privacy Protection Policy is not part of the Annual Report.
167

Touchstone Investments
Distributor
Touchstone Securities, Inc.*
303 Broadway
Cincinnati, Ohio 45202-4203 800.638.8194
www.touchstoneinvestments.com
Investment Advisor
Touchstone Advisors, Inc.*
303 Broadway
Cincinnati, Ohio 45202-4203
Transfer Agent
BNY Mellon Investment Servicing (US) Inc.
4400 Computer Drive
Westborough, MA 01581
Shareholder Service
800.543.0407
* A Member of Western & Southern Financial Group
TSF-56-TFGT-AR-1610
| | | | | |
| | �� | | September 30, 2016 | |
| | | | | |
| | | | | |
| | Annual Report | | |
| | | | | |
| | | | | |
| | | |
| | | |
| | Touchstone Investment Trust Touchstone Active Bond Fund Touchstone High Yield Fund | |
| | | |

This report identifies the Funds’ investments on September 30, 2016. These holdings are subject to change. Not all investments in each Fund performed the same, nor is there any guarantee that these investments will perform as well in the future. Market forecasts provided in this report may not occur.
| Letter from the President | |
Dear Fellow Shareholder:
We are pleased to provide you with the Touchstone Investment Trust Annual Report. Inside you will find key financial information, as well as manager commentaries, for the 12 months ended September 30, 2016.
The fiscal year was eventful and featured the U.S. Federal Reserve Board’s (Fed’s) first interest rate hike in a decade, volatility in energy and commodity prices and the United Kingdom’s (U.K.’s) historic decision to leave the European Union (an action dubbed “Brexit”). The U.S. economy maintained its moderate but steady growth. Strong gains in the labor market buoyed consumer confidence and spending, but overall GDP growth was restrained by continued weakness in business investment. Outside of the U.S., the economic landscape was less positive. Growth in Europe and Japan remained anemic despite monetary policy intervention from central banks. Investor concern over a slowdown in China’s economy led to further declines in commodity prices, weakness for emerging markets and increased volatility in capital markets during late 2015 and early 2016.
The Fed’s dovish statements and an apparent bottoming in commodity prices proved to be an inflection point for risk assets. From mid-February to the end of the fiscal year,markets enjoyed a broad rally, powering through the U.K.’s Brexit vote in late June and uncertainty surrounding the U.S. presidential election. After widening in the first half of the period, credit spreads tightened significantly in the post-February rally, boosting returns for corporate and other credit-exposed bonds.
Bond markets enjoyed solid gains during the fiscal year. Though the Fed raised interest rates in December 2015, thereafter it maintained a dovish stance surrounding the pace of future rate hikes. With weak growth and continued quantitative easing in Europe and Japan, interest rates fell to historic lows and left trillions of dollars of bonds with negative yields. The decline in rates provided a tailwind to fixed income securities. Corporate bonds underperformed Treasuries early in the period, but as risk assets gained momentum in February, they rallied to positive returns on an absolute basis and relative to Treasuries. Desperately seeking income in a world of ultra-low interest rates, investors flocked to the additional yield of non-investment-grade bonds in particular, generating strong gains for High Yield bonds.
For so many investors, an appropriate investment horizon is measured in years or decades, rather than weeks or months. Our belief is that achieving such distant goals requires a similarly long-term approach to investing. Unfortunately, this long-term mentality can easily be sidetracked by the powerful emotions that accompany short-term market movements. Working with a financial advisor can help investors commit to a disciplined approach across market cycles in an effort to reach their ultimate investing goals.
We appreciate the opportunity to be part of your investment plan both today and in the years ahead.
Sincerely,

Jill T. McGruder
President
Touchstone Investment Trust
| | Management’s Discussion of Fund Performance (Unaudited) |
Touchstone Active Bond Fund
Sub-Advised by Fort Washington Investment Advisors, Inc.
Investment Philosophy
The Touchstone Active Bond Fund seeks to provide as high a level of current income as is consistent with the preservation of capital. Capital appreciation is a secondary goal. In deciding what securities to buy and sell for the Fund, the overall investment opportunities and risks in different sectors of the debt securities market are analyzed by focusing on maximizing total return and reducing volatility of the Fund’s portfolio. A disciplined sector allocation process is followed to build a broadly diversified portfolio of bonds.
Fund Performance
The Touchstone Active Bond Fund (Class A Shares) outperformed its benchmark, the Bloomberg Barclays U.S. Aggregate Bond Index, for the 12-month period ended September 30, 2016. The Fund’s total return was 6.90 percent (excluding the maximum sales charge), while the total return of the benchmark was 5.19 percent.
Market Environment
A few standalone events drove higher volatility during the 12-months ended September 30, 2016, but risk markets overall performed well. Significant events included the U.S. Federal Reserve Board’s (Fed) decision to raise interest rates in December 2015, a steep decline in oil prices, the possibility of a hard landing for the Chinese economy and Britain’s vote to leave the European Union (EU) in June 2016 (Brexit). Along with the strong political rhetoric that has marked elections both in the U.S. and abroad, these events shaped the market environment during the past year.
Financial conditions also began to tighten during the period as a result of widening corporate credit spreads and a stronger U.S. dollar. Corporate profits struggled against the headwinds of an appreciating U.S. dollar and the sharp decline in oil prices, which led to weak sales for industrial equipment related to energy and other commodity production. However, recent data has suggested that consumer savings from lower energy prices have finally begun to flow through to other parts of the economy in the form of increased consumer spending and confidence.
Though the period was marked by volatility, bond market returns were positive across all underlying sectors within the benchmark. Credit spreads widened for the first half of the period, but tightened sharply into the end of the fiscal year, allowing both investment-grade and High Yield bonds to outperform Treasuries for the overall period. Though they produced positive returns, securitized assets (Mortgage-Backed Securities, Asset-Backed Securities and Commercial Mortgage-Backed Securities) underperformed U.S. Treasuries.
At the beginning of the period, yields on the U.S. 10-year Treasury were slightly above two percent and rose ahead of the Fed interest rate hike in December 2015. The increase in yields was short lived, as 10-year rates fell sharply in January 2016 amid concerns surrounding the Chinese economy, then again after the Brexit vote in June 2016. While steady underlying market fundamentals and resilient consumer spending have provided a slow recovery in yields during the last three months, interest rates remain below their level at the start of the fiscal year.
Given their extraordinarily low levels, we believe interest rates are at risk of rising in both the near- and medium-term. However, we expect the path will remain muted and shallow given concerns over the broader global economic recovery.
| Management’s Discussion of Fund Performance (Unaudited) (Continued) | |
Portfolio Review
The Fund outperformed during the 12-month period as a result of an overweight to non-U.S. Treasury sectors and positive security selection. The Fund’s allocation to High Yield bonds was the most significant contributor to performance. The Fund maintained its overweight to that sector, as we believed High Yield bonds continued to offer adequate compensation for their credit and liquidity risk. The Fund’s positions in other non-Treasury sectors also benefited performance as risk premiums across the bond market contracted during the period. This positioning was further aided by strong security selection efforts across multiple sectors. In terms of interest rate risk and yield curve positioning, the Fund predominantly maintained a neutral duration relative to the benchmark for the period. However, short-term tactical shifts, such as opportunistic investments in Treasury Inflation Protected Securities (TIPS), had a positive impact on the performance of the Fund.
When compared to our management of interest rate risk, the Fund’s exposure to credit risk was more dynamic during the year. As credit spreads widened during the first half of the 12-month period, we added to the Fund’s credit risk to reflect the increasingly attractive valuations being offered. This more aggressive positioning was underpinned by our positive macro outlook on U.S. economic growth and the accommodative financial conditions. As spreads peaked in mid-February and began to tighten, we gradually reduced the Fund’s risk exposures, taking profits opportunistically.
Outlook
Over the near term, we believe interest rate exposure is a risk due to historically low levels and the strength of realized inflation. Offsetting this risk is the uncertainty surrounding global economic growth and the currently accommodative policies of central banks around the world. In the medium term, however, various central banks appear willing to let economies achieve inflation targets, risking a potential overshoot in realized inflation. With increases in fiscal spending seeming likely, these factors could lead to confidence that inflation will rise and drive an upward movement in global government bond yields in coming years. With the interest rate environment finely balanced at present, we will continue to actively manage the Fund’s interest rate exposure and make tactical trades to capture short-term opportunities as they arise.
Going forward, our biggest concerns are outside of the U.S., specifically with issues stemming from Brexit and the impact it will likely have on Europe as a whole. A significant risk is that Brexit could have a destabilizing effect on the political climate in Europe and ultimately lead to additional eurozone countries withdrawing from the EU. Such events would have a profound impact on the global economy and create a real potential for negative effects from abroad to spill over into the U.S. economy. In such a scenario, the impact on risk premiums would likely be detrimental to the Fund’s overweight to risk assets. We will closely monitor the global macroeconomic environment for any factors that may have a broader impact on the economic outlook and adjust the Fund’s allocation to risk assets accordingly. In our view, however, the current risk of a eurozone break-up is minimal, and the credit environment in the U.S. remains stable.
The attractiveness to credit exposure is now more a function of coupon than the expectation that spreads will tighten further. Financial conditions have remained relatively easy, with spreads stable near year-to-date tight levels. The economy has continued to expand and economic growth near trend levels of approximately 2% seems achievable. With recession risk low, we continue to be comfortable with the Fund having an overweight to credit risk, specifically among High Yield and Investment Grade Corporate Credit securities.
| | Management’s Discussion of Fund Performance (Unaudited) (Continued) |
Comparison of the Change in Value of a $10,000 Investment in the
Touchstone Active Bond Fund - Class A*and the
Bloomberg Barclays U.S. Aggregate Bond Index
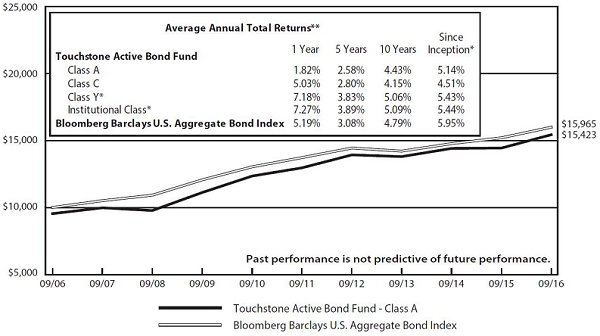
| * | The chart above represents performance of Class A shares only, which will vary from the performance of Class C shares, Class Y shares and Institutional Class shares based on the differences in sales loads and fees paid by shareholders in the different classes. The inception date of Class A shares, Class C shares, Class Y shares and Institutional Class shares was October 3, 1994, October 3, 1994, April 12, 2012, and April 12, 2012, respectively. Class Y shares and Institutional Class shares performance was calculated using the historical performance of Class A shares for the periods prior to April 12, 2012. The returns have been restated for sales loads and fees applicable to Class Y and Institutional Class shares. The returns of the index listed above are based on the inception date of the Fund. |
| | |
| ** | The average annual total returns shown above are adjusted for maximum sales loads and fees, if applicable. The maximum offering price per share of Class A shares is equal to the net asset value (“NAV”) per share plus a sales load equal to 4.99% of the NAV (or 4.75% of the offering price). Class C shares are subject to a contingent deferred sales charge (“CDSC”) of 1.00%. The CDSC will be assessed on an amount equal to the lesser of (1) the NAV at the time of purchase of the shares being redeemed or (2) the NAV of such shares being redeemed, if redeemed within a one-year period from date of purchase. Class Y shares and Institutional Class shares are not subject to sales charges. |
The performance of the above Fund does not reflect the deduction of taxes that a shareholder would pay on Fund distributions or the redemption of Fund shares.
Note to Chart
Bloomberg Barclays U.S. Aggregate Bond Index is an unmanaged index comprised of U.S. investment grade, fixed rate bond market securities, including government, government agency, corporate and mortgage-backed securities between one and ten years.
| Management’s Discussion of Fund Performance (Unaudited) | |
Touchstone High Yield Fund
Sub-Advised by Fort Washington Investment Advisors, Inc.
Investment Philosophy
The Touchstone High Yield Fund seeks a high level of income. Capital appreciation is a secondary consideration. The Fund primarily invests in non-investment-grade securities. The Fund emphasizes the higher-quality segment of the High Yield market. It utilizes a research process designed to maximize risk-adjusted returns by avoiding lower-rated securities.
Fund Performance
The Touchstone High Yield Fund (Class A Shares) underperformed its benchmark, BofA Merrill Lynch High Yield Cash Pay Index, for the 12-month period ended September 30, 2016. The Fund’s total return was 8.78 percent (calculated excluding the maximum sales charge) while the benchmark’s total return was 12.79 percent.
Market Environment
The fiscal year ended September 30, 2016, was characterized by two distinctly different market environments. The first five months exhibited significant volatility as a result of weakness in the commodity markets. At one point in February 2016, oil traded below $30 a barrel, as supply remained high amid continued production and concerns over weak global growth led to lower forecasted demand. Equities and High Yield traded down in concert, eventually reaching levels where High Yield valuations priced in a significant risk of recession and constrained access to refinancing capital.
Just when markets seemed trapped in a vicious cycle, sentiment suddenly turned positive. One catalyst was the Federal Reserve’s indication that it was not in a rush to raise interest rates, an acknowledgment of market concerns about overseas developments. Oil and other commodities began to rally, along with risk assets tied to those markets. While the United Kingdom’s vote to leave the European Union (Brexit) resulted in a brief bout of volatility in June, High Yield bonds continued to post strong returns, making this period one of the best outside of a post-recession recovery. Reflecting the recovery in commodity prices, commodity-related sectors led the rally. Relative to higher-rated bonds, CCCs and CCs were strong performers, another indication of the tailwind of energy prices for the lower-credit-quality commodity sectors.
Portfolio Review
The Fund struggled to keep pace in the market environment, particularly during the low-credit-quality rally after mid-February as the Fund’s higher-quality bias was a significant headwind. The lack of exposure to recent fallen angels (i.e., formerly investment-grade issuers that had been downgraded to non-investment-grade status), which performed well since March, also detracted from returns. Other factors inhibiting performance were underweight allocations to the Independent Energy and Metals & Mining sectors and security selection within the Energy sector.
The selection impact within Energy was materially negative due to Exploration & Production holdings California Resources Corp. and Whiting Petroleum Corp. and Oil Field Services holding Hornbeck Offshore Services Inc., each of which underperformed its respective industry. An overweight position in satellite services company Intelsat SA also negatively impacted returns, after that company provided poor guidance due to anticipated pricing declines.
Favorable security selection within the Food, Beverage and Tobacco and Chemicals sectors partially offset these negative contributors. Food manufacturerTreeHouse Foods Inc. continued to benefit from the successful integration
| | Management’s Discussion of Fund Performance (Unaudited) (Continued) |
of recent acquisitions. Within Chemicals, the rebound in titanium dioxide manufacturer Chemours Co. contributed to relative returns.
The Fund’s most significant positioning shift was the gradual but continuing upgrade in quality. The Fund’s exposure to BBB-rated securities increased due to upgrades, while its overweight to BB-rated securities also expanded through an offsetting decrease in B-rated securities. This shift to quality was consistent with our late cycle management of the Fund’s strategy.
With the continued recovery in commodity markets and continued global demand for yield, we gradually reduced the Fund’s exposure to “lower-quality” securities and used proceeds to increase exposure to less economically sensitive sectors and to “higher-rated” securities. While we believed that High Yield spreads were attractive at the then-current levels, overall leverage for the market was near all-time highs, which caused us to be cautious in the Fund’s positioning.
The Fund remained overweight in sectors with more stable business models, such as Cable & Media, Midstream and Healthcare. With the impressive compression of spreads over the last couple of quarters, we believed that these sectors offered attractive spread compensation for their expected default losses. The Fund’s underweight to Energy was due to the “higher-quality” bias of its holdings, intended to position the Fund well in the existing oil price environment and avoid dependence on continued increases in crude oil prices for the underlying balance sheets to be viable. An underweight to Metals & Mining continued to stem from the weak level of global economic growth and the high operational leverage that these business models and balance sheets contain. We began to reduce the underweight by adding some higher-quality securities from companies that had stabilized their balance sheets and had expressed their desire to work toward regaining investment grade ratings. Though these purchases reduced the underweight position, the Fund still remained meaningfully underexposed to the sector due to the large number of formerly investment-grade credits that had been downgraded into the High Yield index.
Outlook
As we survey the High Yield market, balance sheets are showing recessionary levels of leverage and declining levels of cash interest coverage — both troubling signs for a non-recessionary environment. This mixture of high leverage and low absolute yields has the potential to exacerbate losses realized from any defaults. Such risks are the primary impetus for our continued upgrading of the Fund’s credit quality. We continue to closely monitor the outlook for economic growth as we believe that aggregate growth holds the key for whether or not High Yield spreads can continue to tighten meaningfully from current levels.
Given our concerns regarding lower-quality and stressed issuers, we believe High Yield returns will still be positive, though slightly less than coupon. The greatest opportunity for the Fund revolves around an environment of some combination of tightening financial conditions, slowing growth and increased volatility in the equity markets. While we do not anticipate a recession, given that late cycle dynamics are at play, we believe a more defensive posture is warranted. This positioning is exhibited by both quality and sector allocation with a modest underweight to cyclicals and an overweight to less cyclical sectors. In addition, discernment across issues would also provide opportunity as we believe the Fund’s positions are supported by solid, fundamental research and relative value.
| Management’s Discussion of Fund Performance (Unaudited) (Continued) | |
Comparison of the Change in Value of a $10,000 Investment in the
Touchstone High Yield Fund - Class A*and the BofA Merrill Lynch High Yield Cash Pay Index
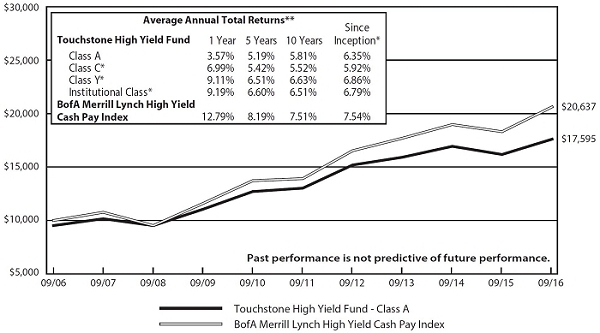
| * | The chart above represents performance of Class A shares only, which will vary from the performance of Class C shares, Class Y shares and Institutional Class shares based on the differences in sales loads and fees paid by shareholders in the different classes. The inception date of Class A shares, Class C shares, Class Y shares and Institutional Class shares was May 1, 2000, May 23, 2000, February 1, 2007, and January 27, 2012, respectively. Class C shares, Class Y shares and Institutional Class shares performance was calculated using the historical performance of Class A shares for the periods prior to May 23, 2000, February 1, 2007 and January 27, 2012, respectively. The returns have been restated for sales loads and fees applicable to Class Y and Institutional Class shares. The returns of the index listed above are based on the inception date of the Fund. |
| | |
| ** | The average annual total returns shown above are adjusted for maximum sales loads and fees, if applicable. The maximum offering price per share of Class A shares is equal to the net asset value (“NAV”) per share plus a sales load equal to 4.99% of the NAV (or 4.75% of the offering price). Class C shares are subject to a contingent deferred sales charge (“CDSC”) of 1.00%. The CDSC will be assessed on an amount equal to the lesser of (1) the NAV at the time of purchase of the shares being redeemed or (2) the NAV of such shares being redeemed, if redeemed within a one-year period from date of purchase. Class Y shares and Institutional Class shares are not subject to sales charges. |
The performance of the above Fund does not reflect the deduction of taxes that a shareholder would pay on Fund distributions or the redemption of Fund shares.
Note to Chart
BofA Merrill Lynch High Yield Cash Pay Index is an unmanaged index used as a general measure of market performance consisting of fixed-rate, coupon-bearing bonds with an outstanding par which is greater than or equal to $50 million, a maturity range greater than or equal to one year and must be less than BBB/Baa3 rated but not in default.
| | Tabular Presentation of Portfolios of Investments (Unaudited)
September 30, 2016 |
The tables below provide each Fund’s credit quality allocation. We hope it will be useful to shareholders as it summarizes key information about each Fund’s investments.
| | Touchstone Active Bond Fund | |
| | Credit Quality* (% of Investment Securities) | |
| | AAA/Aaa | | | 45.1 | % |
| | AA/Aa | | | 2.5 | |
| | A/A | | | 7.2 | |
| | BBB/Baa | | | 28.2 | |
| | BB/Ba | | | 7.1 | |
| | B/B | | | 2.9 | |
| | CCC | | | 1.4 | |
| | Not Rated | | | 3.1 | |
| | Cash Equivalents | | | 2.5 | |
| | Total | | | 100.0 | % |
| | Touchstone High Yield Fund | |
| | Credit Quality* (% of Investment Securities) | |
| | BBB/Baa | | | 10.7 | % |
| | BB/Ba | | | 60.0 | |
| | B/B | | | 24.0 | |
| | CCC | | | 2.1 | |
| | Cash equivalents | | | 3.2 | |
| | Total | | | 100.0 | % |
| * | Credit quality ratings are from Standard & Poor’s (“S&P”) and Moody’s Investors Service (“Moody’s”). If agency ratings differ, the higher rating will be used. Where no rating has been assigned, it may be for reasons unrelated to the creditworthiness of the issuer. |
Portfolio of Investments
Touchstone Active Bond Fund – September 30, 2016 | |
Principal
Amount | | | | | Market
Value | |
| | | | | | | | | |
| | | | | Corporate Bonds — 44.1% | | | | |
| | | | | | | | | |
| | | | | Financials — 10.1% | | | | |
| $ | 504,000 | | | AerCap Ireland Capital Ltd. / AerCap
Global Aviation Trust (Ireland),
4.500%, 5/15/21 | | $ | 527,310 | |
| | 230,000 | | | Allstate Corp. (The), 6.500%, 5/15/57(A) | | | 267,375 | |
| | 290,000 | | | Ally Financial, Inc., 8.000%, 11/1/31 | | | 358,150 | |
| | 682,000 | | | Bank of America Corp.,
6.100%, 12/29/49(A)(B) | | | 710,985 | |
| | 550,000 | | | Bank of America Corp. MTN,
4.000%, 1/22/25 | | | 570,012 | |
| | 354,000 | | | Bank of Nova Scotia (The) (Canada),
4.500%, 12/16/25 | | | 377,177 | |
| | 370,000 | | | Barclays PLC (United Kingdom),
3.250%, 1/12/21 | | | 376,056 | |
| | 384,000 | | | Branch Banking & Trust Co.,
3.625%, 9/16/25 | | | 411,869 | |
| | 575,000 | | | Capital One NA, 1.650%, 2/5/18 | | | 575,674 | |
| | 335,000 | | | Chubb INA Holdings, Inc.,
4.350%, 11/3/45 | | | 387,218 | |
| | 102,000 | | | CIT Group, Inc., 5.000%, 8/15/22 | | | 108,375 | |
| | 660,000 | | | Citigroup, Inc., 2.255%, 9/1/23(A) | | | 663,159 | |
| | 250,000 | | | Citigroup, Inc., 3.300%, 4/27/25 | | | 257,155 | |
| | 58,000 | | | Citigroup, Inc., 6.125%, 12/29/49(A)(B) | | | 60,320 | |
| | 49,000 | | | Credit Acceptance Corp.,
7.375%, 3/15/23 | | | 50,715 | |
| | 250,000 | | | Credit Suisse Group Funding
Guernsey Ltd. (Guernsey),
2.750%, 3/26/20 | | | 250,910 | |
| | 380,000 | | | Fifth Third Bancorp, 2.875%, 7/27/20 | | | 393,965 | |
| | 34,000 | | | FirstCash, Inc., 6.750%, 4/1/21 | | | 35,530 | |
| | 232,000 | | | GE Capital International Funding Co.
Unlimited Co. (Ireland),
4.418%, 11/15/35 | | | 260,389 | |
| | 495,000 | | | General Motors Financial Co., Inc.,
3.200%, 7/13/20 | | | 506,854 | |
| | 33,000 | | | General Motors Financial Co., Inc.,
4.200%, 3/1/21 | | | 34,728 | |
| | 155,000 | | | Goldman Sachs Group, Inc. (The),
5.250%, 7/27/21 | | | 174,989 | |
| | 55,000 | | | Goldman Sachs Group, Inc. (The),
5.375%, 12/29/49(A)(B) | | | 55,274 | |
| | 430,000 | | | HSBC Holdings PLC, 2.357%, 1/5/22(A) | | | 431,926 | |
| | 420,000 | | | Huntington National Bank (The),
2.200%, 11/6/18 | | | 425,245 | |
| | 145,000 | | | JPMorgan Chase & Co.,
3.250%, 9/23/22 | | | 152,088 | |
| | 630,000 | | | JPMorgan Chase & Co.,
5.150%, 12/29/49(A)(B) | | | 633,150 | |
| | 30,000 | | | JPMorgan Chase & Co.,
5.300%, 12/29/49(A)(B) | | | 30,412 | |
| | 265,000 | | | JPMorgan Chase & Co.,
6.000%, 1/15/18 | | | 279,976 | |
| | 60,000 | | | MetLife, Inc., 5.250%, 12/29/49(A)(B) | | | 60,300 | |
| | 175,000 | | | Morgan Stanley, 3.950%, 4/23/27 | | | 181,764 | |
| | 360,000 | | | Navient Corp. MTN, 6.125%, 3/25/24 | | | 335,250 | |
| | 250,000 | | | PNC Bank NA, 2.700%, 11/1/22 | | | 254,116 | |
Principal
Amount | | | | | Market
Value | |
| | | | | | | | | |
| | | | | Financials — (Continued) | | | | |
| $ | 360,000 | | | Prudential Financial, Inc.,
5.625%, 6/15/43(A) | | $ | 388,368 | |
| | 28,000 | | | Quicken Loans, Inc., 144a,
5.750%, 5/1/25 | | | 27,790 | |
| | 285,000 | | | Teachers Insurance & Annuity
Association of America, 144a,
6.850%, 12/16/39 | | | 387,461 | |
| | 580,000 | | | Wells Fargo & Co.,
5.900%, 12/29/49(A)(B) | | | 601,025 | |
| | | | | | | | 11,603,060 | |
| | | | | | | | | |
| | | | | Consumer Discretionary — 5.9% | | | | |
| | 28,000 | | | 1011778 BC ULC / New Red Finance,
Inc. (Canada), 144a, 4.625%, 1/15/22 | | | 29,120 | |
| | 35,000 | | | AMC Networks, Inc., 4.750%, 12/15/22 | | | 35,438 | |
| | 6,000 | | | American Builders & Contractors
Supply Co., Inc., 144a,
5.750%, 12/15/23 | | | 6,240 | |
| | 120,000 | | | Anheuser-Busch InBev Finance, Inc.,
2.650%, 2/1/21 | | | 123,828 | |
| | 306,000 | | | Anheuser-Busch InBev Finance, Inc.,
4.900%, 2/1/46 | | | 364,073 | |
| | 490,000 | | | AutoNation, Inc., 5.500%, 2/1/20 | | | 539,663 | |
| | 43,000 | | | Belo Corp., 7.250%, 9/15/27 | | | 45,580 | |
| | 31,000 | | | Brinker International, Inc., 144a,
5.000%, 10/1/24 | | | 31,430 | |
| | 23,000 | | | Brookfield Residential Properties, Inc. /
Brookfield Residential US Corp.
(Canada), 144a, 6.125%, 7/1/22 | | | 23,230 | |
| | 14,000 | | | Cable One, Inc., 144a, 5.750%, 6/15/22 | | | 14,630 | |
| | 70,000 | | | Cablevision Systems Corp.,
5.875%, 9/15/22 | | | 63,700 | |
| | 425,000 | | | CBS Corp., 4.900%, 8/15/44 | | | 451,643 | |
| | 374,000 | | | CCO Holdings LLC / CCO Holdings
Capital Corp., 144a, 5.750%, 2/15/26 | | | 396,440 | |
| | 251,000 | | | Cequel Communications Holdings I
LLC / Cequel Capital Corp., 144a,
6.375%, 9/15/20 | | | 258,530 | |
| | 18,000 | | | Churchill Downs, Inc., 144a,
5.375%, 12/15/21 | | | 18,720 | |
| | 50,000 | | | Cimpress N.V. (Netherlands), 144a,
7.000%, 4/1/22 | | | 52,125 | |
| | 436,000 | | | Delphi Automotive PLC (Jersey),
3.150%, 11/19/20 | | | 451,448 | |
| | 387,000 | | | Dollar General Corp., 3.250%, 4/15/23 | | | 399,546 | |
| | 6,000 | | | Dollar Tree, Inc., 5.250%, 3/1/20 | | | 6,225 | |
| | 15,000 | | | Dollar Tree, Inc., 5.750%, 3/1/23 | | | 16,144 | |
| | 40,000 | | | DR Horton, Inc., 4.375%, 9/15/22 | | | 43,000 | |
| | 12,000 | | | DR Horton, Inc., 4.750%, 2/15/23 | | | 13,020 | |
| | 156,000 | | | Ford Motor Co., 4.750%, 1/15/43 | | | 161,616 | |
| | 475,000 | | | Forest Laboratories LLC, 144a,
5.000%, 12/15/21 | | | 531,607 | |
| | 58,000 | | | GLP Capital LP / GLP Financing II, Inc.,
5.375%, 4/15/26 | | | 62,350 | |
| | Touchstone Active Bond Fund (Continued) |
Principal
Amount | | | | | Market
Value | |
| | | | | | | | | |
| | | | | Corporate Bonds — 44.1% (Continued) | | | | |
| | | | | | | | | |
| | | | | Consumer Discretionary — (Continued) | | | | |
| $ | 38,000 | | | Hanesbrands, Inc., 144a,
4.625%, 5/15/24 | | $ | 38,998 | |
| | 220,000 | | | Home Depot, Inc. (The),
5.950%, 4/1/41 | | | 302,537 | |
| | 375,000 | | | Imperial Brands Finance PLC (United
Kingdom), 144a, 3.500%, 2/11/23 | | | 392,827 | |
| | 21,000 | | | International Game Technology PLC
(United Kingdom), 144a,
5.625%, 2/15/20 | | | 22,286 | |
| | 12,000 | | | International Game Technology PLC
(United Kingdom), 144a,
6.250%, 2/15/22 | | | 12,720 | |
| | 10,000 | | | Lennar Corp., 4.750%, 11/15/22 | | | 10,325 | |
| | 42,000 | | | Lennar Corp., 4.750%, 5/30/25 | | | 42,630 | |
| | 12,000 | | | Lennar Corp., 4.875%, 12/15/23 | | | 12,300 | |
| | 29,000 | | | M/I Homes, Inc., 6.750%, 1/15/21 | | | 30,378 | |
| | 37,000 | | | MDC Partners, Inc. (Canada), 144a,
6.500%, 5/1/24 | | | 34,225 | |
| | 180,000 | | | Mylan NV (Netherlands), 144a,
3.000%, 12/15/18 | | | 183,968 | |
| | 35,000 | | | NCL Corp. Ltd. (Bermuda), 144a,
4.625%, 11/15/20 | | | 35,000 | |
| | 318,000 | | | Newell Brands, Inc., 2.875%, 12/1/19 | | | 326,476 | |
| | 188,000 | | | Newell Brands, Inc., 4.200%, 4/1/26 | | | 204,752 | |
| | 21,000 | | | Newell Brands, Inc., 144a,
5.000%, 11/15/23 | | | 22,358 | |
| | 38,000 | | | Nexstar Broadcasting, Inc., 144a,
6.125%, 2/15/22 | | | 39,235 | |
| | 19,000 | | | PulteGroup, Inc., 5.500%, 3/1/26 | | | 19,950 | |
| | 31,000 | | | Quad/Graphics, Inc., 7.000%, 5/1/22 | | | 29,760 | |
| | 20,000 | | | Sabre GLBL, Inc., 144a,
5.250%, 11/15/23 | | | 20,350 | |
| | 35,000 | | | Sabre GLBL, Inc., 144a,
5.375%, 4/15/23 | | | 35,962 | |
| | 400,000 | | | Scripps Networks Interactive, Inc.,
2.750%, 11/15/19 | | | 410,676 | |
| | 10,000 | | | Sirius XM Radio, Inc., 144a,
5.375%, 4/15/25 | | | 10,325 | |
| | 103,000 | | | Sirius XM Radio, Inc., 144a,
5.375%, 7/15/26 | | | 105,832 | |
| | 38,000 | | | Taylor Morrison Communities, Inc. /
Monarch Communities, Inc., 144a,
5.250%, 4/15/21 | | | 39,235 | |
| | 26,000 | | | Tenneco, Inc., 5.000%, 7/15/26 | | | 26,325 | |
| | 90,000 | | | Time Warner Cable, Inc.,
4.500%, 9/15/42 | | | 85,883 | |
| | 42,000 | | | Toll Brothers Finance Corp., 4.875%, 11/15/25 | | | 43,050 | |
| | 31,000 | | | TRI Pointe Group, Inc., 4.875%, 7/1/21 | | | 31,775 | |
| | 10,000 | | | Vista Outdoor, Inc., 144a,
5.875%, 10/1/23 | | | 10,450 | |
| | 65,000 | | | ZF North America Capital, Inc., 144a,
4.500%, 4/29/22 | | | 68,925 | |
| | 28,000 | | | ZF North America Capital, Inc., 144a,
4.750%, 4/29/25 | | | 29,400 | |
| | | | | | | | 6,818,259 | |
Principal
Amount | | | | | Market
Value | |
| | | | | | | | | |
| | | | | Telecommunication Services — 5.2% | | | | |
| $ | 59,000 | | | Altice Financing SA (Luxemburg),
144a, 6.625%, 2/15/23 | | $ | 60,549 | |
| | 23,000 | | | AMC Networks, Inc., 5.000%, 4/1/24 | | | 23,144 | |
| | 225,000 | | | AT&T, Inc., 3.900%, 3/11/24 | | | 240,863 | |
| | 90,000 | | | AT&T, Inc., 4.350%, 6/15/45 | | | 88,655 | |
| | 360,000 | | | AT&T, Inc., 4.500%, 5/15/35 | | | 378,248 | |
| | 325,000 | | | CenturyLink, Inc., 5.150%, 6/15/17 | | | 331,500 | |
| | 8,000 | | | CenturyLink, Inc., 5.800%, 3/15/22 | | | 8,200 | |
| | 2,000 | | | CenturyLink, Inc., 6.450%, 6/15/21 | | | 2,142 | |
| | 264,000 | | | Charter Communications Operating
LLC / Charter Communications
Operating Capital,
144a, 6.484%, 10/23/45 | | | 319,261 | |
| | 450,000 | | | Cisco Systems, Inc., 1.850%, 9/20/21 | | | 452,701 | |
| | 372,000 | | | Comcast Corp., 1.625%, 1/15/22 | | | 368,892 | |
| | 15,000 | | | CommScope, Inc., 144a,
5.000%, 6/15/21 | | | 15,525 | |
| | 31,000 | | | CSC Holdings LLC, 8.625%, 2/15/19 | | | 34,604 | |
| | 34,000 | | | CSC Holdings LLC, 144a,
5.500%, 4/15/27 | | | 34,765 | |
| | 60,000 | | | CSC Holdings LLC, 144a,
10.125%, 1/15/23 | | | 69,150 | |
| | 16,000 | | | Discovery Communications LLC,
3.250%, 4/1/23 | | | 16,200 | |
| | 14,000 | | | Discovery Communications LLC,
3.300%, 5/15/22 | | | 14,370 | |
| | 500,000 | | | Discovery Communications LLC,
3.450%, 3/15/25 | | | 494,260 | |
| | 31,000 | | | Discovery Communications LLC,
4.900%, 3/11/26 | | | 33,681 | |
| | 504,000 | | | DISH DBS Corp., 6.750%, 6/1/21 | | | 544,320 | |
| | 245,000 | | | Frontier Communications Corp.,
6.875%, 1/15/25 | | | 216,825 | |
| | 10,000 | | | Frontier Communications Corp.,
10.500%, 9/15/22 | | | 10,600 | |
| | 45,000 | | | Gray Television, Inc., 144a,
5.125%, 10/15/24 | | | 44,156 | |
| | 188,000 | | | Intelsat Jackson Holdings SA
(Luxembourg), 7.250%, 10/15/20 | | | 145,700 | |
| | 5,000 | | | LIN Television Corp., 5.875%, 11/15/22 | | | 5,238 | |
| | 6,000 | | | Match Group, Inc., 6.375%, 6/1/24 | | | 6,525 | |
| | 14,000 | | | Match Group, Inc., 6.750%, 12/15/22 | | | 14,892 | |
| | 31,000 | | | Nexstar Escrow Corp., 144a,
5.625%, 8/1/24 | | | 31,078 | |
| | 375,000 | | | Qwest Corp., 6.750%, 12/1/21 | | | 417,656 | |
| | 181,000 | | | Sprint Communications, Inc.,
6.000%, 11/15/22 | | | 167,878 | |
| | 7,000 | | | Telecom Italia Capital SA
(Luxembourg), 7.175%, 6/18/19 | | | 7,853 | |
| | 504,000 | | | T-Mobile USA, Inc., 6.731%, 4/28/22 | | | 529,200 | |
| | 95,000 | | | Univision Communications, Inc., 144a,
6.750%, 9/15/22 | | | 100,819 | |
| | 425,000 | | | Verizon Communications, Inc.,
4.672%, 3/15/55 | | | 447,070 | |
| | 275,000 | | | Verizon Communications, Inc.,
6.250%, 4/1/37 | | | 348,179 | |
| Touchstone Active Bond Fund (Continued) | |
Principal
Amount | | | | | Market
Value | |
| | | | | | | | | |
| | | | | Corporate Bonds — 44.1% (Continued) | | | | |
| | | | | | | | | |
| | | | | Telecommunication Services — (Continued) | | | | |
| $ | 6,000 | | | ViaSat, Inc., 6.875%, 6/15/20 | | $ | 6,218 | |
| | | | | | | | 6,030,917 | |
| | | | | | | | | |
| | | | | Energy — 4.3% | | | | |
| | 32,000 | | | Antero Resources Corp.,
5.375%, 11/1/21 | | | 32,360 | |
| | 292,000 | | | Boardwalk Pipelines LP, 3.375%, 2/1/23 | | | 277,062 | |
| | 200,000 | | | Buckeye Partners LP, 4.150%, 7/1/23 | | | 203,730 | |
| | 475,000 | | | Cenovus Energy, Inc. (Canada),
6.750%, 11/15/39 | | | 513,354 | |
| | 59,000 | | | Continental Resources, Inc.,
5.000%, 9/15/22 | | | 58,852 | |
| | 13,000 | | | DCP Midstream LLC, 144a,
4.750%, 9/30/21 | | | 13,130 | |
| | 26,000 | | | DCP Midstream LLC, 144a,
5.350%, 3/15/20 | | | 26,650 | |
| | 218,000 | | | Enterprise Products Operating LLC,
7.000%, 6/1/67(A) | | | 184,594 | |
| | 12,000 | | | Genesis Energy LP / Genesis Energy
Finance Corp., 6.000%, 5/15/23 | | | 11,910 | |
| | 108,000 | | | Genesis Energy LP / Genesis Energy
Finance Corp., 6.750%, 8/1/22 | | | 111,281 | |
| | 260,000 | | | Hess Corp., 5.600%, 2/15/41 | | | 259,158 | |
| | 19,000 | | | Hilcorp Energy I LP / Hilcorp Finance
Co., 144a, 5.000%, 12/1/24 | | | 18,192 | |
| | 9,000 | | | Holly Energy Partners LP / Holly
Energy Finance Corp., 144a,
6.000%, 8/1/24 | | | 9,315 | |
| | 377,000 | | | Kinder Morgan Energy Partners LP,
3.500%, 9/1/23 | | | 377,587 | |
| | 440,000 | | | Marathon Oil Corp., 2.800%, 11/1/22 | | | 407,512 | |
| | 44,000 | | | MEG Energy Corp. (Canada), 144a,
6.500%, 3/15/21 | | | 35,915 | |
| | 282,000 | | | Midcontinent Express Pipeline LLC,
144a, 6.700%, 9/15/19 | | | 295,395 | |
| | 29,000 | | | MPLX LP, 4.875%, 6/1/25 | | | 30,069 | |
| | 53,000 | | | Nabors Industries, Inc.,
4.625%, 9/15/21 | | | 49,945 | |
| | 236,000 | | | Nabors Industries, Inc.,
5.000%, 9/15/20 | | | 232,560 | |
| | 27,000 | | | PDC Energy, Inc., 144a,
6.125%, 9/15/24 | | | 27,945 | |
| | 285,000 | | | Petroleos Mexicanos (Mexico),
4.500%, 1/23/26† | | | 276,393 | |
| | 45,000 | | | Precision Drilling Corp. (Canada),
5.250%, 11/15/24 | | | 36,675 | |
| | 45,000 | | | Range Resources Corp., 144a,
5.000%, 8/15/22 | | | 44,775 | |
| | 16,000 | | | Range Resources Corp., 144a,
5.750%, 6/1/21 | | | 16,200 | |
| | 48,000 | | | Rose Rock Midstream LP / Rose Rock
Finance Corp., 5.625%, 11/15/23 | | | 43,680 | |
| | 401,000 | | | Sabine Pass Liquefaction LLC, 144a,
5.000%, 3/15/27 | | | 411,025 | |
Principal
Amount | | | | | Market
Value | |
| | | | | | | | | |
| | | | | Energy — (Continued) | | | | |
| $ | 56,000 | | | SESI LLC, 6.375%, 5/1/19 | | $ | 55,580 | |
| | 400,000 | | | Shell International Finance BV
(Netherlands), 1.875%, 5/10/21 | | | 400,424 | |
| | 14,000 | | | SM Energy Co., 6.750%, 9/15/26 | | | 14,140 | |
| | 71,000 | | | Southwestern Energy Co.,
5.800%, 1/23/20 | | | 70,822 | |
| | 36,000 | | | Summit Midstream Holdings LLC /
Summit Midstream Finance Corp.,
7.500%, 7/1/21 | | | 37,260 | |
| | 106,000 | | | Tullow Oil PLC (United Kingdom),
144a, 6.000%, 11/1/20 | | | 95,665 | |
| | 85,000 | | | Unit Corp., 6.625%, 5/15/21 | | | 71,719 | |
| | 31,000 | | | Weatherford International Ltd
(Bermuda), 6.500%, 8/1/36 | | | 22,010 | |
| | 217,000 | | | Williams Partners LP, 3.350%, 8/15/22 | | | 214,806 | |
| | | | | | | | 4,987,690 | |
| | | | | | | | | |
| | | | | Information Technology — 4.3% | | | | |
| | 429,000 | | | Activision Blizzard, Inc., 144a,
6.125%, 9/15/23 | | | 471,364 | |
| | 313,000 | | | Apple, Inc., 4.650%, 2/23/46 | | | 361,179 | |
| | 17,000 | | | CDW LLC / CDW Finance Corp.,
5.000%, 9/1/23 | | | 17,552 | |
| | 4,000 | | | CDW LLC / CDW Finance Corp.,
6.000%, 8/15/22 | | | 4,260 | |
| | 395,000 | | | Diamond 1 Finance Corp. / Diamond
2 Finance Corp., 144a,
4.420%, 6/15/21 | | | 412,822 | |
| | 32,000 | | | Diamond 1 Finance Corp. / Diamond
2 Finance Corp., 144a,
5.450%, 6/15/23 | | | 34,287 | |
| | 20,000 | | | Diamond 1 Finance Corp. / Diamond
2 Finance Corp., 144a,
5.875%, 6/15/21 | | | 21,249 | |
| | 66,000 | | | Diamond 1 Finance Corp. / Diamond
2 Finance Corp., 144a,
7.125%, 6/15/24 | | | 72,590 | |
| | 54,000 | | | Diebold, Inc., 144a, 8.500%, 4/15/24 | | | 55,958 | |
| | 432,000 | | | Electronic Arts, Inc., 3.700%, 3/1/21 | | | 459,011 | |
| | 470,000 | | | Fidelity National Information Services,
Inc., 3.625%, 10/15/20 | | | 498,515 | |
| | 67,000 | | | First Data Corp., 144a, 5.000%, 1/15/24 | | | 68,005 | |
| | 30,000 | | | First Data Corp., 144a, 5.375%, 8/15/23 | | | 30,900 | |
| | 440,000 | | | Hewlett Packard Enterprise Co., 144a,
2.450%, 10/5/17 | | | 443,524 | |
| | 360,000 | | | Lam Research Corp., 3.450%, 6/15/23 | | | 368,232 | |
| | 27,000 | | | Micron Technology, Inc., 144a,
7.500%, 9/15/23 | | | 29,990 | |
| | 190,000 | | | Microsoft Corp., 3.500%, 2/12/35 | | | 194,516 | |
| | 314,000 | | | Microsoft Corp., 3.700%, 8/8/46 | | | 317,826 | |
| | 88,000 | | | NCR Corp., 5.875%, 12/15/21 | | | 92,620 | |
| | 45,000 | | | NXP BV / NXP Funding LLC
(Netherlands), 144a,
4.125%, 6/15/20 | | | 47,756 | |
| | 338,000 | | | Oracle Corp., 2.650%, 7/15/26 | | | 338,062 | |
| | Touchstone Active Bond Fund (Continued) |
Principal
Amount | | | | | Market
Value | |
| | | | | | | |
| | | | | Corporate Bonds — 44.1% (Continued) | | | | |
| | | | | | | | | |
| | | | | Information Technology — (Continued) | | | | |
| $ | 425,000 | | | QUALCOMM, Inc., 3.450%, 5/20/25 | | $ | 452,616 | |
| | 28,000 | | | Western Digital Corp., 144a,
7.375%, 4/1/23 | | | 30,800 | |
| | 57,000 | | | Western Digital Corp., 144a,
10.500%, 4/1/24 | | | 66,120 | |
| | | | | | | | 4,889,754 | |
| | | | | | | | | |
| | | | | Industrials — 3.6% | | | | |
| | 122,000 | | | AECOM Global II LLC / URS Fox US LP,
3.850%, 4/1/17 | | | 122,559 | |
| | 250,000 | | | Air Lease Corp., 5.625%, 4/1/17 | | | 254,263 | |
| | 9,000 | | | Allegion PLC (Ireland),
5.875%, 9/15/23 | | | 9,698 | |
| | 37,000 | | | Anixter, Inc., 5.500%, 3/1/23 | | | 38,758 | |
| | 190,000 | | | Burlington Northern Santa Fe LLC,
5.750%, 5/1/40 | | | 246,830 | |
| | 3,000 | | | Clean Harbors, Inc., 5.125%, 6/1/21 | | | 3,075 | |
| | 19,000 | | | Eagle Materials, Inc., 4.500%, 8/1/26 | | | 19,255 | |
| | 400,000 | | | FedEx Corp., 5.100%, 1/15/44 | | | 475,249 | |
| | 476,000 | | | Fortive Corp., 144a, 2.350%, 6/15/21 | | | 481,857 | |
| | 5,000 | | | Huntington Ingalls Industries, Inc., 144a,
5.000%, 11/15/25 | | | 5,288 | |
| | 80,000 | | | Hutchison Whampoa International
09/19 Ltd. (Cayman Islands), 144a,
5.750%, 9/11/19 | | | 89,290 | |
| | 455,000 | | | Joy Global, Inc., 5.125%, 10/15/21 | | | 499,362 | |
| | 57,000 | | | KLX, Inc., 144a, 5.875%, 12/1/22 | | | 58,995 | |
| | 330,000 | | | LafargeHolcim Finance US LLC, 144a,
3.500%, 9/22/26 | | | 337,966 | |
| | 29,000 | | | Louisiana-Pacific Corp., 144a,
4.875%, 9/15/24 | | | 29,000 | |
| | 322,000 | | | Masco Corp., 4.375%, 4/1/26 | | | 338,905 | |
| | 10,000 | | | Masco Corp., 5.950%, 3/15/22 | | | 11,400 | |
| | 20,000 | | | Orbital ATK, Inc., 5.250%, 10/1/21 | | | 20,800 | |
| | 29,000 | | | Orbital ATK, Inc., 5.500%, 10/1/23 | | | 30,378 | |
| | 430,000 | | | Roper Technologies, Inc.,
3.000%, 12/15/20 | | | 446,991 | |
| | 334,000 | | | SBA Tower Trust, 144a,
2.898%, 10/15/19 | | | 338,694 | |
| | 147,000 | | | United Rentals North America, Inc.,
7.625%, 4/15/22 | | | 156,555 | |
| | 158,000 | | | XPO CNW, Inc., 6.700%, 5/1/34 | | | 124,030 | |
| | | | | | | | 4,139,198 | |
| | | | | | | | | |
| | | | | Health Care — 3.4% | | | | |
| | 342,000 | | | AbbVie, Inc., 4.450%, 5/14/46 | | | 357,181 | |
| | 77,000 | | | Acadia Healthcare Co., Inc.,
6.500%, 3/1/24 | | | 80,658 | |
| | 195,000 | | | Actavis Funding SCS (Luxembourg),
3.800%, 3/15/25 | | | 206,379 | |
| | 380,000 | | | Catholic Health Initiatives,
4.200%, 8/1/23 | | | 411,590 | |
| | 61,000 | | | Centene Corp., 5.625%, 2/15/21 | | | 64,660 | |
Principal
Amount | | | | | Market
Value | |
| | | | | | | |
| | | | | Health Care — (Continued) | | | | |
| $ | 88,000 | | | CHS / Community Health Systems, Inc.,
7.125%, 7/15/20 | | $ | 81,796 | |
| | 336,000 | | | Express Scripts Holding Co.,
3.300%, 2/25/21 | | | 353,121 | |
| | 171,000 | | | HCA, Inc., 6.500%, 2/15/20 | | | 189,382 | |
| | 77,000 | | | Kindred Healthcare, Inc.,
8.750%, 1/15/23 | | | 77,000 | |
| | 64,000 | | | LifePoint Health, Inc., 144a,
5.375%, 5/1/24 | | | 64,000 | |
| | 7,000 | | | Mallinckrodt International Finance SA,
4.750%, 4/15/23 | | | 6,300 | |
| | 53,000 | | | Mallinckrodt International Finance SA
/ Mallinckrodt CB LLC
(Luxembourg), 144a,
5.500%, 4/15/25 | | | 50,350 | |
| | 300,000 | | | Ochsner Clinic Foundation,
5.897%, 5/15/45 | | | 392,185 | |
| | 11,000 | | | Quintiles Transnational Corp., 144a,
4.875%, 5/15/23 | | | 11,302 | |
| | 80,000 | | | Select Medical Corp., 6.375%, 6/1/21 | | | 78,700 | |
| | 426,000 | | | Shire Acquisitions Investments Ireland DAC (Ireland),
2.400%, 9/23/21 | | | 426,536 | |
| | 8,000 | | | Teleflex, Inc., 4.875%, 6/1/26 | | | 8,280 | |
| | 170,000 | | | Tenet Healthcare Corp.,
4.500%, 4/1/21 | | | 171,062 | |
| | 6,000 | | | Tenet Healthcare Corp.,
4.750%, 6/1/20 | | | 6,090 | |
| | 12,000 | | | Tenet Healthcare Corp.,
6.000%, 10/1/20 | | | 12,690 | |
| | 172,000 | | | Teva Pharmaceutical Finance
Netherlands III BV (Netherlands),
2.200%, 7/21/21 | | | 171,351 | |
| | 378,000 | | | Teva Pharmaceutical Finance
Netherlands III BV (Netherlands),
3.150%, 10/1/26 | | | 379,749 | |
| | 57,000 | | | Universal Hospital Services, Inc.,
7.625%, 8/15/20 | | | 54,293 | |
| | 323,000 | | | Valeant Pharmaceuticals International, 144a,
6.750%, 8/15/21 | | | 303,620 | |
| | | | | | | | 3,958,275 | |
| | | | | | | | | |
| | | | | Utilities — 2.3% | | | | |
| | 12,000 | | | AES Corp., 8.000%, 6/1/20 | | | 14,130 | |
| | 874,000 | | | Alabama Power Capital Trust V,
3.746%, 10/1/42(A) | | | 837,658 | |
| | 4,000 | | | Calpine Corp., 144a, 7.875%, 1/15/23 | | | 4,225 | |
| | 420,000 | | | Dominion Resources, Inc.,
2.000%, 8/15/21 | | | 418,998 | |
| | 191,000 | | | Dynegy, Inc., 5.875%, 6/1/23 | | | 173,332 | |
| | 188,000 | | | Dynegy, Inc., 7.375%, 11/1/22 | | | 185,650 | |
| | 384,000 | | | Fortis, Inc. (Canada), 144a,
3.055%, 10/4/26 | | | 382,370 | |
| | 115,000 | | | NextEra Energy Capital Holdings, Inc.,
6.000%, 3/1/19 | | | 126,426 | |
| | 17,000 | | | NGL Energy Partners LP / NGL Energy Finance Corp.,
6.875%, 10/15/21 | | | 16,107 | |
| Touchstone Active Bond Fund (Continued) | |
Principal
Amount | | | | | Market
Value | |
| | | | | | | |
| | | | | Corporate Bonds — 44.1% (Continued) | | | | |
| | | | | | | | | |
| | | | | Utilities — (Continued) | | | | |
| $ | 142,000 | | | NRG Energy, Inc., 144a,
6.625%, 1/15/27 | | $ | 139,160 | |
| | 272,000 | | | PacifiCorp, 5.750%, 4/1/37 | | | 356,175 | |
| | | | | | | | 2,654,231 | |
| | | | | | | | | |
| | | | | Real Estate — 1.8% | | | | |
| | 84,000 | | | Care Capital Properties REIT, 144a,
5.125%, 8/15/26 | | | 83,986 | |
| | 7,000 | | | Corrections Corp. of America,
4.125%, 4/1/20† | | | 6,580 | |
| | 6,000 | | | Corrections Corp. of America,
4.625%, 5/1/23 | | | 5,265 | |
| | 15,000 | | | Corrections Corp. of America,
5.000%, 10/15/22 | | | 13,575 | |
| | 250,000 | | | Crown Castle International Corp. REIT,
4.450%, 2/15/26 | | | 274,568 | |
| | 39,000 | | | ESH Hospitality, Inc. REIT, 144a,
5.250%, 5/1/25 | | | 38,951 | |
| | 40,000 | | | GEO Group, Inc. (The) REIT,
5.125%, 4/1/23 | | | 34,000 | |
| | 400,000 | | | Omega Healthcare Investors, Inc. REIT,
4.950%, 4/1/24 | | | 420,480 | |
| | 330,000 | | | Simon Property Group LP, REIT,
2.750%, 2/1/23 | | | 338,240 | |
| | 47,000 | | | VEREIT Operating Partnership LP REIT,
4.600%, 2/6/24 | | | 48,645 | |
| | 375,000 | | | Vornado Realty LP REIT,
5.000%, 1/15/22 | | | 412,228 | |
| | 316,000 | | | Welltower, Inc. REIT, 6.125%, 4/15/20 | | | 357,955 | |
| | | | | | | | 2,034,473 | |
| | | | | | | | | |
| | | | | Consumer Staples — 1.7% | | | | |
| | 22,000 | | | B&G Foods, Inc., 4.625%, 6/1/21 | | | 22,660 | |
| | 22,000 | | | Constellation Brands, Inc.,
4.750%, 12/1/25 | | | 23,760 | |
| | 150,000 | | | Cott Beverages, Inc., 5.375%, 7/1/22 | | | 154,500 | |
| | 31,000 | | | Darling Ingredients, Inc.,
5.375%, 1/15/22 | | | 32,356 | |
| | 55,000 | | | IHS Markit Ltd., 144a, 5.000%, 11/1/22 | | | 58,196 | |
| | 120,000 | | | JBS USA LLC / JBS USA Finance, Inc., 144a,
5.750%, 6/15/25 | | | 117,900 | |
| | 52,000 | | | JBS USA LLC / JBS USA Finance, Inc., 144a,
5.875%, 7/15/24 | | | 51,740 | |
| | 40,000 | | | KFC Holding Co./Pizza Hut Holdings
LLC/Taco Bell of America LLC, 144a,
5.000%, 6/1/24 | | | 41,800 | |
| | 6,000 | | | KFC Holding Co./Pizza Hut Holdings
LLC/Taco Bell of America LLC, 144a,
5.250%, 6/1/26 | | | 6,345 | |
| | 515,000 | | | Kraft Heinz Foods Co., 6.875%, 1/26/39 | | | 714,841 | |
| | 500,000 | | | Kroger Co. (The), 5.000%, 4/15/42 | | | 582,174 | |
| | 73,000 | | | Post Holdings, Inc., 144a,
5.000%, 8/15/26 | | | 72,635 | |
| | 7,000 | | | TreeHouse Foods, Inc.,
4.875%, 3/15/22 | | | 7,245 | |
Principal
Amount | | | | | Market
Value | |
| | | | | | | |
| | | | | Consumer Staples — (Continued) | | | | |
| $ | 14,000 | | | TreeHouse Foods, Inc., 144a,
6.000%, 2/15/24 | | $ | 15,068 | |
| | 11,000 | | | US Foods, Inc., 144a, 5.875%, 6/15/24 | | | 11,412 | |
| | 25,000 | | | WhiteWave Foods Co. (The),
5.375%, 10/1/22 | | | 28,406 | |
| | | | | | | | 1,941,038 | |
| | | | | | | | | |
| | | | | Materials — 1.5% | | | | |
| | 31,000 | | | Alcoa, Inc., 5.125%, 10/1/24 | | | 32,976 | |
| | 301,000 | | | ArcelorMittal (Luxembourg),
6.500%, 3/1/21 | | | 334,862 | |
| | 122,000 | | | Cascades, Inc. (Canada), 144a,
5.750%, 7/15/23 | | | 123,525 | |
| | 48,000 | | | CVR Partners LP / CVR Nitrogen
Finance Corp., 144a,
9.250%, 6/15/23 | | | 46,440 | |
| | 119,000 | | | Domtar Corp., 10.750%, 6/1/17 | | | 125,845 | |
| | 6,000 | | | FMG Resources August 2006 Pty Ltd. (Australia), 144a,
9.750%, 3/1/22 | | | 6,960 | |
| | 355,000 | | | International Paper Co.,
5.150%, 5/15/46 | | | 393,706 | |
| | 47,000 | | | Lundin Mining Corp. (Canada), 144a,
7.500%, 11/1/20 | | | 49,938 | |
| | 27,000 | | | NOVA Chemicals Corp. (Canada), 144a,
5.250%, 8/1/23 | | | 27,608 | |
| | 226,000 | | | Southern Copper Corp.,
5.875%, 4/23/45 | | | 224,831 | |
| | 6,000 | | | Valvoline, Inc., 144a, 5.500%, 7/15/24 | | | 6,285 | |
| | 328,000 | | | Westlake Chemical Corp., 144a,
3.600%, 8/15/26 | | | 328,930 | |
| | | | | | | | 1,701,906 | |
| | | | | Total Corporate Bonds | | $ | 50,758,801 | |
| | | | | | | | | |
| | | | | U.S. Treasury Obligations — 30.1% | | | | |
| | 410,000 | | | U.S. Treasury Bond, 2.500%, 2/15/46 | | | 423,774 | |
| | 135,000 | | | U.S. Treasury Bond, 3.000%, 5/15/45 | | | 153,921 | |
| | 750,000 | | | U.S. Treasury Bond, 3.000%, 11/15/45 | | | 855,762 | |
| | 7,245,000 | | | U.S. Treasury Inflation Indexed Bonds,
0.125%, 7/15/26 | | | 7,353,492 | |
| | 2,095,000 | | | U.S. Treasury Inflation Indexed Bonds,
1.000%, 2/15/46 | | | 2,352,191 | |
| | 9,925,000 | | | U.S. Treasury Note, 0.625%, 6/30/18 | | | 9,903,284 | |
| | 5,785,000 | | | U.S. Treasury Note, 0.750%, 1/31/18 | | | 5,787,036 | |
| | 1,690,000 | | | U.S. Treasury Note, 1.125%, 2/28/21 | | | 1,691,056 | |
| | 1,500,000 | | | U.S. Treasury Note, 1.125%, 7/31/21 | | | 1,497,833 | |
| | 1,500,000 | | | U.S. Treasury Note, 1.375%, 4/30/21 | | | 1,515,704 | |
| | 645,000 | | | U.S. Treasury Note, 1.500%, 8/15/26 | | | 638,726 | |
| | 1,500,000 | | | U.S. Treasury Note, 1.625%, 2/15/26 | | | 1,502,578 | |
| | 1,000,000 | | | U.S. Treasury Note, 2.250%, 11/15/25 | | | 1,055,625 | |
| | | | | Total U.S. Treasury Obligations | | $ | 34,730,982 | |
| | | | | | | | | |
| | | | | U.S. Government Mortgage-Backed Obligations — 12.7% | | | | |
| | 66,872 | | | FHLMC, Pool #1B3366,
2.736%, 3/1/37(A) | | | 70,621 | |
| | Touchstone Active Bond Fund (Continued) |
Principal
Amount | | | | | Market
Value | |
| | | | | | | |
| | | | | U.S. Government Mortgage-Backed Obligations — 12.7% (Continued) | | | | |
| $ | 189,509 | | | FHLMC, Pool #1H1348,
2.498%, 10/1/36(A) | | $ | 200,591 | |
| | 781,068 | | | FHLMC, Pool #1Q0339,
2.896%, 4/1/37(A) | | | 828,268 | |
| | 27,651 | | | FHLMC, Pool #A12886, 5.000%, 8/1/33 | | | 31,058 | |
| | 62,793 | | | FHLMC, Pool #A13842, 6.000%, 9/1/33 | | | 71,642 | |
| | 15,745 | | | FHLMC, Pool #A21415, 5.000%, 5/1/34 | | | 17,434 | |
| | 36,559 | | | FHLMC, Pool #A35682, 5.000%, 7/1/35 | | | 40,564 | |
| | 19,462 | | | FHLMC, Pool #A36523, 5.000%, 8/1/35 | | | 21,551 | |
| | 87,600 | | | FHLMC, Pool #A46590, 5.000%, 8/1/35 | | | 97,003 | |
| | 32,169 | | | FHLMC, Pool #A56988, 5.500%, 2/1/37 | | | 36,255 | |
| | 209,673 | | | FHLMC, Pool #A96485, 4.500%, 1/1/41 | | | 230,018 | |
| | 898,584 | | | FHLMC, Pool #A97897, 4.500%, 4/1/41 | | | 1,009,324 | |
| | 27,158 | | | FHLMC, Pool #C62740, 7.000%, 1/1/32 | | | 30,774 | |
| | 27,448 | | | FHLMC, Pool #C72254, 6.500%, 7/1/32 | | | 32,292 | |
| | 117,593 | | | FHLMC, Pool #C90986, 7.000%, 6/1/26 | | | 133,374 | |
| | 33,733 | | | FHLMC, Pool #G02184, 5.000%, 4/1/36 | | | 37,708 | |
| | 522,086 | | | FHLMC, Pool #G05733,
5.000%, 11/1/39 | | | 586,666 | |
| | 318,418 | | | FHLMC, Pool #J13584,
3.500%, 11/1/25 | | | 340,065 | |
| | 117,951 | | | FNMA, Pool #255628, 5.500%, 2/1/25 | | | 132,776 | |
| | 7,699 | | | FNMA, Pool #432269, 6.500%, 8/1/28 | | | 8,868 | |
| | 5,538 | | | FNMA, Pool #535290, 8.000%, 5/1/30 | | | 6,717 | |
| | 10,956 | | | FNMA, Pool #540040, 7.500%, 6/1/28 | | | 10,991 | |
| | 22,015 | | | FNMA, Pool #561741, 7.500%, 1/1/31 | | | 25,702 | |
| | 2,468 | | | FNMA, Pool #626811, 6.500%, 6/1/17 | | | 2,480 | |
| | 62,185 | | | FNMA, Pool #640291, 7.000%, 8/1/32 | | | 69,228 | |
| | 33,629 | | | FNMA, Pool #653301, 6.500%, 7/1/32 | | | 38,737 | |
| | 103,211 | | | FNMA, Pool #653502, 6.500%, 7/1/32 | | | 118,885 | |
| | 55,672 | | | FNMA, Pool #670402, 6.500%, 6/1/32 | | | 64,127 | |
| | 9,236 | | | FNMA, Pool #704460, 6.000%, 5/1/18 | | | 9,297 | |
| | 6,731 | | | FNMA, Pool #725906,
2.358%, 8/1/34(A) | | | 7,111 | |
| | 327,897 | | | FNMA, Pool #745257, 6.000%, 1/1/36 | | | 380,831 | |
| | 2,628 | | | FNMA, Pool #745974,
2.815%, 10/1/36(A) | | | 2,783 | |
| | 129,731 | | | FNMA, Pool #810049, 5.500%, 3/1/35 | | | 146,986 | |
| | 204,521 | | | FNMA, Pool #819297, 6.000%, 9/1/35 | | | 234,125 | |
| | 68,769 | | | FNMA, Pool #889060, 6.000%, 1/1/38 | | | 79,741 | |
| | 150,996 | | | FNMA, Pool #889061, 6.000%, 1/1/38 | | | 176,885 | |
| | 84,871 | | | FNMA, Pool #893003, 7.000%, 9/1/36 | | | 92,660 | |
| | 23,065 | | | FNMA, Pool #895657, 6.500%, 8/1/36 | | | 25,949 | |
| | 236,750 | | | FNMA, Pool #905049, 5.500%, 11/1/36 | | | 266,505 | |
| | 276,850 | | | FNMA, Pool #908944, 5.500%, 1/1/37 | | | 313,624 | |
| | 724,343 | | | FNMA, Pool #928553, 5.500%, 8/1/37 | | | 836,263 | |
| | 25,333 | | | FNMA, Pool #995220, 6.000%, 11/1/23 | | | 27,539 | |
| | 376,987 | | | FNMA, Pool #AA3467, 4.500%, 4/1/39 | | | 417,391 | |
| | 587,948 | | | FNMA, Pool #AA4584, 4.500%, 4/1/39 | | | 650,949 | |
| | 130,983 | | | FNMA, Pool #AB1800, 4.000%, 11/1/40 | | | 142,636 | |
| | 484,905 | | | FNMA, Pool #AB2452, 4.000%, 3/1/26 | | | 510,793 | |
| | 154,954 | | | FNMA, Pool #AD3775, 4.500%, 3/1/25 | | | 167,736 | |
| | 222,226 | | | FNMA, Pool #AD6193, 5.000%, 6/1/40 | | | 248,409 | |
| | 479,883 | | | FNMA, Pool #AE0996, 4.000%, 2/1/41 | | | 522,684 | |
| | 284,515 | | | FNMA, Pool #AE1568, 4.000%, 9/1/40 | | | 306,407 | |
| | 835,916 | | | FNMA, Pool #AE2497, 4.500%, 9/1/40 | | | 932,276 | |
Principal
Amount | | | | | Market
Value | |
| | | | | | | |
| | | | | U.S. Government Mortgage-Backed Obligations — 12.7% (Continued) | | | | |
| $ | 150,099 | | | FNMA, Pool #AE5441, 5.000%, 10/1/40 | | $ | 166,981 | |
| | 410,986 | | | FNMA, Pool #AH1135, 5.000%, 1/1/41 | | | 457,957 | |
| | 692,378 | | | FNMA, Pool #AH3483, 3.500%, 2/1/26 | | | 738,517 | |
| | 303,352 | | | FNMA, Pool #AH3671, 4.000%, 2/1/26 | | | 319,536 | |
| | 703,128 | | | FNMA, Pool #AH6622, 4.000%, 3/1/41 | | | 775,459 | |
| | 36,405 | | | FNMA, Pool #AI0805, 4.500%, 7/1/41 | | | 39,960 | |
| | 924,029 | | | FNMA, Pool #AL0150, 4.000%, 2/1/41 | | | 1,005,895 | |
| | 231,757 | | | FNMA, Pool #AL0211, 5.000%, 4/1/41 | | | 258,711 | |
| | 46,903 | | | GNMA, Pool #5305, 4.000%, 2/20/42 | | | 50,430 | |
| | 12,065 | | | GNMA, Pool #748495, 4.000%, 8/15/40 | | | 12,963 | |
| | 21,350 | | | GNMA, Pool #8503, 1.875%, 9/20/24(A) | | | 22,020 | |
| | | | | Total U.S. Government Mortgage-Backed Obligations | | $ | 14,641,728 | |
| | | | | | | | | |
| | | | | Asset-Backed Securities — 4.2% | | | | |
| | 369,631 | | | American Homes 4 Rent Trust, Ser
2015-SFR2, Class A, 144a,
3.732%, 10/17/45 | | | 401,087 | |
| | 475,000 | | | Ascentium Equipment Receivables
Trust, Ser 2016-1A, Class B, 144a,
2.850%, 7/10/20 | | | 482,444 | |
| | 450,000 | | | Dell Equipment Finance Trust, Ser
2015-1, Class C, 144a
2.420%, 3/23/20 | | | 454,084 | |
| | 178,749 | | | Domino’s Pizza Master Issuer LLC, Ser
2012-1A, Class A2, 144a,
5.216%, 1/25/42 | | | 183,822 | |
| | 300,000 | | | Leaf Receivables Funding LLC, Ser
2016-1, Class B, 144a,
2.780%, 8/15/22 | | | 302,869 | |
| | 1,647,140 | | | Mid-State Capital Corp. Trust, Ser
2005-1, Class M2, 7.079%, 1/15/40 | | | 1,806,350 | |
| | 395,000 | | | Santander Drive Auto Receivables
Trust, Ser 2015-1, Class B,
1.970%, 11/15/19 | | | 396,307 | |
| | 313,950 | | | Sonic Capital LLC, Ser 2016-1A, Class
A2, 144a, 4.472%, 5/20/46 | | | 321,903 | |
| | 500,000 | | | SpringCastle America Funding LLC,
Ser 2016-AA, Class A, 144a,
3.050%, 4/25/29 | | | 503,845 | |
| | | | | Total Asset-Backed Securities | | $ | 4,852,711 | |
| | | | | | | | | |
| | | | | Non-Agency Collateralized Mortgage Obligations — 3.9% | | | | |
| | 5,022 | | | Adjustable Rate Mortgage Trust, Ser
2004-4, Class 3A1,
3.024%, 3/25/35(A) | | | 4,840 | |
| | 341,542 | | | Alternative Loan Trust, Ser 2004-30CB,
Class 3A1, 5.000%, 2/25/20 | | | 344,884 | |
| | 36,488 | | | Alternative Loan Trust, Ser 2005-J3,
Class 3A1, 6.500%, 9/25/34 | | | 36,312 | |
| | 3,620 | | | CIT Group Home Equity Loan Trust,
Ser 2002-1, Class AF5,
7.210%, 2/25/33(C) | | | 3,616 | |
| | 66,653 | | | CSFB Mortgage-Backed Trust, Ser
2004-7, Class 6A1, 5.250%, 10/25/19 | | | 67,229 | |
| Touchstone Active Bond Fund (Continued) | |
Principal
Amount | | | | | Market
Value | |
| | | | | | | |
| | | | | Non-Agency Collateralized Mortgage Obligations — 3.9% (Continued) | | | | |
| $ | 393,063 | | | CWHEQ Home Equity Loan Trust, Ser
2007-S1, Class A5,
6.018%, 11/25/36(A) | | $ | 372,015 | |
| | 470,308 | | | First Franklin Mortgage Loan Trust, Ser
2005-FFA, Class M3,
6.017%, 3/25/25(C) | | | 470,858 | |
| | 122,657 | | | JP Morgan Mortgage Trust, Ser
2005-A1, Class 2A1,
2.760%, 2/25/35(A) | | | 123,673 | |
| | 335,084 | | | JP Morgan Mortgage Trust, Ser
2005-A2, Class 7CB1,
2.993%, 4/25/35(A) | | | 336,147 | |
| | 69,272 | | | JP Morgan Mortgage Trust, Ser
2006-A4, Class 2A2,
2.824%, 6/25/36(A) | | | 62,373 | |
| | 69,737 | | | MASTR Alternative Loans Trust, Ser
2004-7, Class 10A1, 6.000%, 6/25/34 | | | 70,238 | |
| | 43,574 | | | MASTR Asset Securitization Trust, Ser
2003-4, Class 4A2, 5.500%, 5/25/33 | | | 43,769 | |
| | 136,400 | | | RAMP Trust, Ser 2003-RZ5, Class A7,
5.470%, 9/25/33(C) | | | 140,062 | |
| | 2,622 | | | RASC Trust, Ser 2001-KS3, Class AI6,
5.960%, 9/25/31(A) | | | 2,713 | |
| | 227,785 | | | Residential Asset Securitization Trust,
Ser 2006-A1, Class 1A3,
6.000%, 4/25/36 | | | 187,566 | |
| | 603,317 | | | Sequoia Mortgage Trust, Ser 2013-10,
Class B2, 144a, 3.572%, 8/25/43(A) | | | 619,219 | |
| | 5,383 | | | Structured Asset Securities Corp.
Mortgage Pass-Through
Certificates, Ser 2004-21XS, Class 2A6B,
5.150%, 12/25/34(C) | | | 5,475 | |
| | 164,776 | | | Structured Asset Securities Corp. Trust,
Ser 2005-17, Class 5A1,
5.500%, 10/25/35 | | | 133,713 | |
| | 700,000 | | | Towd Point Mortgage Trust, Ser
2015-3, Class A2, 144a,
4.000%, 3/25/54(A) | | | 744,634 | |
| | 417,381 | | | Towd Point Mortgage Trust, Ser
2016-2, Class A1, 144a,
3.000%, 8/25/55(A) | | | 426,071 | |
| | 136,035 | | | Washington Mutual Alternative
Mortgage Pass-Through
Certificates, Ser 2005-9, Class 2A4,
5.500%, 11/25/35 | | | 124,596 | |
| | 155,431 | | | Wells Fargo Mortgage Backed
Securities Trust, Ser 2003-G, Class A1,
2.898%, 6/25/33(A) | | | 155,784 | |
| | | | | Total Non-Agency Collateralized Mortgage Obligations | | $ | 4,475,787 | |
| | | | | | | | | |
| | | | | Commercial Mortgage-Backed Securities — 1.4% |
| | 396,448 | | | COMM Mortgage Trust, Ser
2014-SAVA, Class A, 144a,
1.675%, 6/15/34(A) | | | 396,805 | |
Principal
Amount | | | | | Market
Value | |
| | | | | | | |
| | | | | Commercial Mortgage-Backed Securities — 1.4% (Continued) | | | | |
| $ | 550,000 | | | Eleven Madison Trust Mortgage Trust,
Ser 2015-11MD, Class C, 144a,
3.673%, 9/10/35(A) | | $ | 568,844 | |
| | 595,000 | | | JP Morgan Chase Commercial
Mortgage Securities Trust, Ser
2015-CSMO, Class A, 144a,
1.685%, 1/15/32(A) | | | 594,503 | |
| | | | | Total Commercial Mortgage-Backed Securities | | $ | 1,560,152 | |
| | | | | | | | | |
| | | | | Agency Collateralized Mortgage Obligations — 0.6% | | | | |
| | 217,555 | | | FHLMC Structured Pass Through
Securities, Ser T-20, Class A5,
8.134%, 12/25/29(C) | | | 257,100 | |
| | 149,390 | | | FNMA REMIC, Ser 2015-51, Class KC,
3.000%, 6/25/45 | | | 154,331 | |
| | 61,000 | | | FNMA REMIC Trust, Ser 2001-W2, Class
AF6, 6.589%, 10/25/31(C) | | | 66,209 | |
| | 158,999 | | | FNMA Trust, Ser 2004-W15, Class 2AF,
0.703%, 8/25/44(A) | | | 158,147 | |
| | 11,974 | | | GNMA, Ser 2003-11, Class GJ,
4.000%, 10/17/29 | | | 12,730 | |
| | | | | Total Agency Collateralized Mortgage Obligations | | $ | 648,517 | |
| | | | | | | | | |
| Shares | | | | | | |
| | | | | | | |
| | | | | Investment Funds — 2.6% | | | | |
| | 2,756,880 | | | Dreyfus Government Cash
Management, Institutional Shares,
0.30%¥W | | | 2,756,880 | |
| | 287,724 | | | Invesco Government & Agency
Portfolio, Institutional Class,
0.31%**¥W | | | 287,724 | |
| | | | | Total Investment Funds | | $ | 3,044,604 | |
| | | | | | | | | |
| | | | | Total Investment Securities —99.6%
(Cost $111,048,503) | | $ | 114,713,282 | |
| | | | | | | | | |
| | | | | Other Assets in | | | | |
| | | | | Excess of Liabilities — 0.4% | | | 509,353 | |
| | | | | Net Assets — 100.0% | | $ | 115,222,635 | |
| (A) | Variable rate security - Rate reflected is the rate in effect as of September 30, 2016. |
| (B) | Perpetual Bond - A Bond with no definite maturity date. |
| (C) | Step Bond - A bond that pays an initial interest rate for the first period and then a higher interest rate for the following periods until maturity. The interest rate shown reflects the rate in effect as of September 30, 2016. |
| ** | Represents collateral for securities loaned. |
| | Touchstone Active Bond Fund (Continued) |
| † | All or a portion of the security is on loan. The total market value of the securities on loan as of September 30, 2016 was $276,519. |
| W | Represents the 7-day SEC yield as of September 30, 2016. |
Portfolio Abbreviations:
FHLMC - Federal Home Loan Mortgage Corporation
FNMA - Federal National Mortgage Association
GNMA - Government National Mortgage Association
LLC - Limited Liability Company
LP - Limited Partnership
MTN - Medium Term Note
PLC - Public Limited Company
REIT - Real Estate Investment Trust
REMIC - Real Estate Mortgage Investment Conduit
144a - This is a restricted security that was sold in a transaction qualifying for the exemption under Rule 144A of the Securities Act of 1933. This security may be sold in transactions exempt from registration, normally to qualified institutional buyers. At September 30, 2016, these securities were valued at $15,718,260 or 13.6% of net assets. These securities were deemed liquid pursuant to procedures approved by the Board of Trustees.
Other Information:
The inputs or methodology used for valuing securities may not be an indication of the risk associated with investing in those securities. For more information on valuation inputs, and their aggregation into the levels used in the table below, please refer to the security valuation section in the accompanying Notes to Financial Statements.
| | Valuation inputs at Reporting Date: | | | |
| Description | | Level 1 | | | Level 2 | | | Level 3 | | | Total | |
| | | | | | | | | | | | | |
| Corporate Bonds | | $ | — | | | $ | 50,758,801 | | | $ | — | | | $ | 50,758,801 | |
| U.S. Treasury Obligations | | | — | | | | 34,730,982 | | | | — | | | | 34,730,982 | |
| U.S. Government Mortgage-Backed Obligations | | | — | | | | 14,641,728 | | | | — | | | | 14,641,728 | |
| Asset-Backed Securities | | | — | | | | 4,852,711 | | | | — | | | | 4,852,711 | |
| Non-Agency Collateralized Mortgage Obligations | | | — | | | | 4,475,787 | | | | — | | | | 4,475,787 | |
| Commercial Mortgage-Backed Securities | | | — | | | | 1,560,152 | | | | — | | | | 1,560,152 | |
| Agency Collateralized Mortgage Obligations | | | — | | | | 648,517 | | | | — | | | | 648,517 | |
| Investment Funds | | | 3,044,604 | | | | — | | | | — | | | | 3,044,604 | |
| Total | | $ | 3,044,604 | | | $ | 111,668,678 | | | $ | — | | | $ | 114,713,282 | |
See accompanying Notes to Financial Statements.
Portfolio of Investments
Touchstone High Yield Fund – September 30, 2016 | |
Principal
Amount | | | | | Market
Value | |
| | | | | | | |
| | | | | Corporate Bonds — 95.4% | | | | |
| | | | | | | | | |
| | | | | Consumer Discretionary — 20.9% | | | | |
| $ | 596,000 | | | 1011778 BC ULC / New Red Finance,
Inc. (Canada), 144a, 4.625%, 1/15/22 | | $ | 619,840 | |
| | 460,000 | | | Albea Beauty Holdings SA
(Luxembourg), 144a,
8.375%, 11/1/19 | | | 480,700 | |
| | 325,000 | | | Allegion US Holding Co., Inc.,
5.750%, 10/1/21 | | | 339,219 | |
| | 532,000 | | | AMC Networks, Inc., 4.750%, 12/15/22 | | | 538,650 | |
| | 417,000 | | | AMC Networks, Inc., 5.000%, 4/1/24 | | | 419,606 | |
| | 121,000 | | | American Builders & Contractors
Supply Co., Inc., 144a,
5.625%, 4/15/21 | | | 125,235 | |
| | 188,000 | | | American Builders & Contractors
Supply Co., Inc., 144a,
5.750%, 12/15/23 | | | 195,520 | |
| | 403,000 | | | Belo Corp., 7.250%, 9/15/27 | | | 427,180 | |
| | 558,000 | | | Brinker International, Inc., 144a,
5.000%, 10/1/24 | | | 565,735 | |
| | 231,000 | | | Brookfield Residential Properties, Inc.
(Canada), 144a, 6.375%, 5/15/25 | | | 230,711 | |
| | 311,000 | | | Brookfield Residential Properties, Inc. /
Brookfield Residential US Corp. (Canada),
144a, 6.125%, 7/1/22 | | | 314,110 | |
| | 114,000 | | | Brookfield Residential Properties, Inc.,
(Canada), 144a, 6.500%, 12/15/20 | | | 117,990 | |
| | 302,000 | | | Cable One, Inc., 144a, 5.750%, 6/15/22 | | | 315,590 | |
| | 905,000 | | | Cablevision Systems Corp.,
5.875%, 9/15/22 | | | 823,550 | |
| | 500,000 | | | Cablevision Systems Corp.,
8.000%, 4/15/20 | | | 523,750 | |
| | 620,000 | | | CalAtlantic Group, Inc.,
5.375%, 10/1/22 | | | 646,350 | |
| | 400,000 | | | Cardtronics, Inc., 5.125%, 8/1/22 | | | 409,000 | |
| | 563,000 | | | CCO Holdings LLC / CCO Holdings
Capital Corp., 5.750%, 9/1/23 | | | 596,076 | |
| | 441,000 | | | CCO Holdings LLC / CCO Holdings
Capital Corp., 5.750%, 1/15/24 | | | 468,562 | |
| | 479,000 | | | CCO Holdings LLC / CCO Holdings
Capital Corp., 144a, 5.125%, 5/1/23 | | | 499,956 | |
| | 1,047,000 | | | CCO Holdings LLC / CCO Holdings
Capital Corp., 144a, 5.375%, 5/1/25 | | | 1,098,041 | |
| | 1,359,000 | | | CCO Holdings LLC / CCO Holdings
Capital Corp., 144a, 5.750%, 2/15/26 | | | 1,440,540 | |
| | 565,000 | | | CCO Holdings LLC / CCO Holdings
Capital Corp., 144a, 5.875%, 4/1/24 | | | 602,798 | |
| | 1,514,000 | | | Cequel Communications Holdings I
LLC / Cequel Capital Corp., 144a,
6.375%, 9/15/20 | | | 1,559,420 | |
| | 389,000 | | | Churchill Downs, Inc., 144a,
5.375%, 12/15/21 | | | 404,560 | |
| | 835,000 | | | Cimpress NV (Netherlands), 144a,
7.000%, 4/1/22 | | | 870,488 | |
| | 623,000 | | | Cogeco Communications, Inc.
(Canada), 144a, 4.875%, 5/1/20 | | | 643,248 | |
| | 89,000 | | | DISH DBS Corp., 6.750%, 6/1/21 | | | 96,120 | |
| | 1,093,000 | | | DISH DBS Corp., 7.875%, 9/1/19 | | | 1,224,160 | |
Principal
Amount | | | | | Market
Value | |
| | | | | | | |
| | | | | Consumer Discretionary — (Continued) | | | | |
| $ | 336,000 | | | Dollar Tree, Inc., 5.750%, 3/1/23 | | $ | 361,620 | |
| | 595,000 | | | DR Horton, Inc., 4.375%, 9/15/22 | | | 639,625 | |
| | 169,000 | | | DR Horton, Inc., 4.750%, 2/15/23 | | | 183,365 | |
| | 161,000 | | | DR Horton, Inc., 5.750%, 8/15/23 | | | 184,345 | |
| | 200,000 | | | General Motors Financial Co., Inc.,
4.250%, 5/15/23 | | | 207,725 | |
| | 164,000 | | | GLP Capital LP / GLP Financing II, Inc.,
4.375%, 4/15/21 | | | 172,610 | |
| | 1,076,000 | | | GLP Capital LP / GLP Financing II, Inc.,
5.375%, 4/15/26 | | | 1,156,700 | |
| | 798,000 | | | Goodyear Tire & Rubber Co. (The),
8.750%, 8/15/20 | | | 953,610 | |
| | 671,000 | | | Hanesbrands, Inc., 144a,
4.625%, 5/15/24 | | | 688,614 | |
| | 789,000 | | | Hilton Domestic Operating Co., Inc., 144a,
4.250%, 9/1/24 | | | 804,780 | |
| | 459,000 | | | International Game Technology PLC
(United Kingdom), 144a,
5.625%, 2/15/20 | | | 487,114 | |
| | 442,000 | | | International Game Technology PLC
(United Kingdom), 144a,
6.250%, 2/15/22 | | | 468,520 | |
| | 638,000 | | | KFC Holding Co./Pizza Hut Holdings
LLC/Taco Bell of America LLC, 144a,
5.000%, 6/1/24 | | | 666,710 | |
| | 112,000 | | | KFC Holding Co./Pizza Hut Holdings
LLC/Taco Bell of America LLC, 144a,
5.250%, 6/1/26 | | | 118,440 | |
| | 1,286,000 | | | L Brands, Inc., 5.625%, 2/15/22 | | | 1,437,105 | |
| | 138,000 | | | Lennar Corp., 4.750%, 11/15/22 | | | 142,485 | |
| | 332,000 | | | Lennar Corp., 4.750%, 5/30/25 | | | 336,980 | |
| | 248,000 | | | Lennar Corp., 4.875%, 12/15/23 | | | 254,200 | |
| | 601,000 | | | M/I Homes, Inc., 6.750%, 1/15/21 | | | 629,548 | |
| | 665,000 | | | MDC Partners, Inc. (Canada), 144a,
6.500%, 5/1/24 | | | 615,125 | |
| | 510,000 | | | Men’s Wearhouse, Inc. (The),
7.000%, 7/1/22 | | | 474,300 | |
| | 531,000 | | | Meritage Homes Corp.,
7.150%, 4/15/20 | | | 590,738 | |
| | 1,923,000 | | | MGM Resorts International,
5.250%, 3/31/20 | | | 2,047,995 | |
| | 115,000 | | | National CineMedia LLC, 144a,
5.750%, 8/15/26 | | | 119,312 | |
| | 747,000 | | | NCL Corp. Ltd. (Bermuda), 144a,
4.625%, 11/15/20 | | | 747,000 | |
| | 322,000 | | | Netflix, Inc., 5.500%, 2/15/22 | | | 346,552 | |
| | 400,000 | | | Netflix, Inc., 5.750%, 3/1/24 | | | 430,000 | |
| | 333,000 | | | Netflix, Inc., 5.875%, 2/15/25 | | | 359,640 | |
| | 839,000 | | | Newell Brands, Inc., 144a,
5.000%, 11/15/23 | | | 893,254 | |
| | 1,076,000 | | | Penske Automotive Group, Inc.,
5.375%, 12/1/24 | | | 1,081,380 | |
| | 586,000 | | | Quad/Graphics, Inc., 7.000%, 5/1/22 | | | 562,560 | |
| | 700,000 | | | Quebecor Media, Inc. (Canada),
5.750%, 1/15/23 | | | 728,000 | |
| | 200,000 | | | QVC, Inc., 5.125%, 7/2/22 | | | 211,990 | |
| | Touchstone High Yield Fund (Continued) |
Principal
Amount | | | | | Market
Value | |
| | | | | | | |
| | | | | Corporate Bonds — 95.4% (Continued) | | | | |
| | | | | | | | | |
| | | | | Consumer Discretionary — (Continued) | | | | |
| $ | 797,000 | | | Reynolds Group Issuer, Inc. / Reynolds
Group Issuer LLC / Reynolds Group
Issuer, 6.875%, 2/15/21 | | $ | 826,888 | |
| | 731,000 | | | Royal Caribbean Cruises Ltd. (Liberia),
5.250%, 11/15/22 | | | 794,962 | |
| | 571,000 | | | Sabre GLBL, Inc., 144a,
5.250%, 11/15/23 | | | 580,992 | |
| | 768,000 | | | Sabre GLBL, Inc., 144a,
5.375%, 4/15/23 | | | 789,120 | |
| | 528,000 | | | Service Corp. International,
5.375%, 5/15/24 | | | 559,680 | |
| | 485,000 | | | Service Corp. International,
8.000%, 11/15/21 | | | 569,875 | |
| | 534,000 | | | SFR Group SA (France), 144a,
7.375%, 5/1/26 | | | 545,849 | |
| | 668,000 | | | Sirius XM Radio, Inc., 144a,
5.375%, 4/15/25 | | | 689,710 | |
| | 520,000 | | | Sirius XM Radio, Inc., 144a,
5.375%, 7/15/26 | | | 534,300 | |
| | 176,000 | | | Sirius XM Radio, Inc., 144a,
6.000%, 7/15/24 | | | 187,660 | |
| | 172,000 | | | Taylor Morrison Communities, Inc. /
Monarch Communities, Inc., 144a,
5.250%, 4/15/21 | | | 177,590 | |
| | 188,000 | | | TEGNA, Inc., 144a, 4.875%, 9/15/21 | | | 195,520 | |
| | 149,000 | | | Toll Brothers Finance Corp.,
4.875%, 11/15/25 | | | 152,725 | |
| | 773,000 | | | Toll Brothers Finance Corp.,
5.875%, 2/15/22 | | | 850,300 | |
| | 276,000 | | | United Rentals North America, Inc.,
4.625%, 7/15/23 | | | 282,900 | |
| | 295,200 | | | Virgin Media Secured Finance PLC
(United Kingdom), 144a,
5.375%, 4/15/21 | | | 307,746 | |
| | 514,000 | | | Vista Outdoor, Inc., 144a,
5.875%, 10/1/23 | | | 537,130 | |
| | 295,000 | | | ZF North America Capital, Inc., 144a,
4.500%, 4/29/22 | | | 312,812 | |
| | 659,000 | | | ZF North America Capital, Inc., 144a,
4.750%, 4/29/25 | | | 691,950 | |
| | | | | | | | 45,286,356 | |
| | | | | | | | | |
| | | | | Telecommunication Services — 13.8% | | | | |
| | 1,324,000 | | | Altice Financing SA (Luxembourg), 144a,
6.625%, 2/15/23 | | | 1,358,755 | |
| | 1,363,000 | | | Altice Financing SA (Luxembourg), 144a,
7.500%, 5/15/26 | | | 1,419,224 | |
| | 551,000 | | | Altice US Finance I Corp., 144a,
5.500%, 5/15/26 | | | 566,152 | |
| | 334,000 | | | CenturyLink, Inc., 5.625%, 4/1/20 | | | 353,205 | |
| | 1,107,000 | | | CenturyLink, Inc., 5.800%, 3/15/22 | | | 1,134,675 | |
| | 436,000 | | | CenturyLink, Inc., 6.450%, 6/15/21 | | | 467,065 | |
| | 893,000 | | | CommScope, Inc., 144a,
5.000%, 6/15/21 | | | 924,255 | |
| | 556,000 | | | CSC Holdings LLC, 144a,
5.500%, 4/15/27 | | | 568,510 | |
Principal
Amount | | | | | Market
Value | |
| | | | | | | |
| | | | | Telecommunication Services — (Continued) | | | | |
| $ | 247,000 | | | CSC Holdings LLC, 144a,
6.625%, 10/15/25 | | $ | 267,995 | |
| | 1,485,000 | | | CSC Holdings LLC, 144a,
10.125%, 1/15/23 | | | 1,711,462 | |
| | 298,000 | | | Discovery Communications LLC,
3.250%, 4/1/23 | | | 301,723 | |
| | 267,000 | | | Discovery Communications LLC,
3.300%, 5/15/22 | | | 274,050 | |
| | 566,000 | | | Discovery Communications LLC,
4.900%, 3/11/26 | | | 614,948 | |
| | 873,000 | | | DISH DBS Corp., 5.125%, 5/1/20 | | | 905,738 | |
| | 100,000 | | | Frontier Communications Corp.,
7.125%, 1/15/23 | | | 93,250 | |
| | 585,000 | | | Frontier Communications Corp.,
8.500%, 4/15/20 | | | 632,531 | |
| | 2,914,000 | | | Frontier Communications Corp.,
10.500%, 9/15/22 | | | 3,088,840 | |
| | 811,000 | | | Gray Television, Inc., 144a,
5.125%, 10/15/24 | | | 795,794 | |
| | 750,000 | | | Intelsat Jackson Holdings SA
(Luxembourg), 5.500%, 8/1/23 | | | 519,375 | |
| | 573,000 | | | Intelsat Jackson Holdings SA
(Luxembourg), 7.250%, 4/1/19 | | | 460,907 | |
| | 1,453,000 | | | Intelsat Jackson Holdings SA
(Luxembourg), 7.250%, 10/15/20 | | | 1,126,075 | |
| | 550,000 | | | Intelsat Jackson Holdings SA
(Luxembourg), 7.500%, 4/1/21 | | | 415,250 | |
| | 84,000 | | | LIN Television Corp., 5.875%, 11/15/22 | | | 87,990 | |
| | 107,000 | | | Match Group, Inc., 6.375%, 6/1/24 | | | 116,362 | |
| | 572,000 | | | Match Group, Inc., 6.750%, 12/15/22 | | | 608,465 | |
| | 12,000 | | | Nexstar Broadcasting, Inc.,
6.875%, 11/15/20 | | | 12,465 | |
| | 700,000 | | | Nexstar Broadcasting, Inc., 144a,
6.125%, 2/15/22 | | | 722,750 | |
| | 527,000 | | | Nexstar Escrow Corp., 144a,
5.625%, 8/1/24 | | | 528,318 | |
| | 250,000 | | | Sable International Finance Ltd.
(Cayman Islands), 144a,
6.875%, 8/1/22 | | | 259,375 | |
| | 20,000 | | | Sinclair Television Group, Inc., 144a,
5.625%, 8/1/24 | | | 20,450 | |
| | 386,000 | | | SoftBank Corp. (Japan), 144a,
4.500%, 4/15/20 | | | 400,475 | |
| | 505,000 | | | Sprint Capital Corp., 6.875%, 11/15/28 | | | 474,069 | |
| | 75,000 | | | Sprint Capital Corp., 6.900%, 5/1/19 | | | 77,344 | |
| | 727,000 | | | Sprint Communications, Inc.,
6.000%, 11/15/22 | | | 674,292 | |
| | 1,000,000 | | | Sprint Communications, Inc., 144a,
9.000%, 11/15/18 | | | 1,103,750 | |
| | 223,000 | | | Sprint Corp., 7.625%, 2/15/25 | | | 220,770 | |
| | 151,000 | | | Telecom Italia Capital SA (Luxembourg),
7.175%, 6/18/19 | | | 169,396 | |
| | 303,000 | | | T-Mobile USA, Inc., 6.000%, 3/1/23 | | | 323,698 | |
| | 629,000 | | | T-Mobile USA, Inc., 6.000%, 4/15/24 | | | 673,030 | |
| | 388,000 | | | T-Mobile USA, Inc., 6.125%, 1/15/22 | | | 412,250 | |
| | 939,000 | | | T-Mobile USA, Inc., 6.250%, 4/1/21 | | | 985,363 | |
| | 750,000 | | | T-Mobile USA, Inc., 6.625%, 4/1/23 | | | 805,312 | |
| Touchstone High Yield Fund (Continued) | |
Principal
Amount | | | | | Market
Value | |
| | | | | | | |
| | | | | Corporate Bonds — 95.4% (Continued) | | | | |
| | | | | | | | | |
| | | | | Telecommunication Services — (Continued) | | | | |
| $ | 89,000 | | | T-Mobile USA, Inc., 6.731%, 4/28/22 | | $ | 93,450 | |
| | 1,357,000 | | | Univision Communications, Inc., 144a,
6.750%, 9/15/22 | | | 1,440,116 | |
| | 693,000 | | | UPCB Finance IV Ltd. (Cayman Islands),
144a, 5.375%, 1/15/25 | | | 696,222 | |
| | 479,200 | | | UPCB Finance VI Ltd. (Cayman Islands),
144a, 6.875%, 1/15/22 | | | 501,962 | |
| | 391,000 | | | Videotron Ltd. (Canada),
5.000%, 7/15/22 | | | 408,106 | |
| | | | | | | | 29,815,559 | |
| | | | | | | | | |
| | | | | Energy — 13.3% | | | | |
| | 252,000 | | | Antero Resources Corp.,
5.125%, 12/1/22 | | | 253,890 | |
| | 574,000 | | | Antero Resources Corp.,
5.375%, 11/1/21 | | | 580,458 | |
| | 937,000 | | | Cheniere Corpus Christi Holdings LLC, 144a,
7.000%, 6/30/24 | | | 1,011,960 | |
| | 685,000 | | | Continental Resources, Inc.,
4.500%, 4/15/23 | | | 657,600 | |
| | 1,489,000 | | | Continental Resources, Inc.,
5.000%, 9/15/22 | | | 1,485,278 | |
| | 204,000 | | | DCP Midstream LLC, 144a,
4.750%, 9/30/21 | | | 206,040 | |
| | 473,000 | | | DCP Midstream LLC, 144a,
5.350%, 3/15/20 | | | 484,825 | |
| | 945,000 | | | Freeport-McMoran Oil & Gas LLC /
FCX Oil & Gas, Inc., 6.750%, 2/1/22 | | | 970,988 | |
| | 507,000 | | | FTS International, Inc., 144a,
7.837%, 6/15/20(A) | | | 430,646 | |
| | 1,439,000 | | | Genesis Energy LP / Genesis Energy
Finance Corp., 5.750%, 2/15/21 | | | 1,439,000 | |
| | 251,000 | | | Genesis Energy LP / Genesis Energy
Finance Corp., 6.000%, 5/15/23 | | | 249,118 | |
| | 843,000 | | | Genesis Energy LP / Genesis Energy
Finance Corp., 6.750%, 8/1/22 | | | 868,610 | |
| | 1,088,000 | | | Gibson Energy, Inc. (Canada), 144a,
6.750%, 7/15/21 | | | 1,112,480 | |
| | 574,000 | | | Hilcorp Energy I LP / Hilcorp Finance
Co., 144a, 5.000%, 12/1/24 | | | 549,605 | |
| | 158,000 | | | Holly Energy Partners LP / Holly
Energy Finance Corp., 144a,
6.000%, 8/1/24 | | | 163,530 | |
| | 647,000 | | | MEG Energy Corp. (Canada), 144a,
6.375%, 1/30/23 | | | 511,939 | |
| | 255,000 | | | MEG Energy Corp. (Canada), 144a,
6.500%, 3/15/21 | | | 208,144 | |
| | 227,000 | | | Midcontinent Express Pipeline LLC, 144a,
6.700%, 9/15/19 | | | 237,782 | |
| | 403,000 | | | MPLX LP, 4.875%, 12/1/24 | | | 416,833 | |
| | 923,000 | | | Nabors Industries, Inc.,
4.625%, 9/15/21 | | | 869,804 | |
| | 367,000 | | | Nabors Industries, Inc.,
5.000%, 9/15/20 | | | 361,651 | |
| | 609,000 | | | Newfield Exploration Co.,
5.625%, 7/1/24 | | | 624,225 | |
Principal
Amount | | | | | Market
Value | |
| | | | | | | |
| | | | | Energy — (Continued) | | | | |
| $ | 581,000 | | | NuStar Logistics LP, 4.800%, 9/1/20 | | $ | 582,452 | |
| | 454,000 | | | ONEOK, Inc., 4.250%, 2/1/22 | | | 444,920 | |
| | 490,000 | | | PDC Energy, Inc., 144a,
6.125%, 9/15/24 | | | 507,150 | |
| | 868,000 | | | Precision Drilling Corp. (Canada),
5.250%, 11/15/24 | | | 707,420 | |
| | 284,000 | | | Precision Drilling Corp. (Canada),
6.500%, 12/15/21 | | | 257,020 | |
| | 743,000 | | | QEP Resources, Inc., 6.800%, 3/1/20 | | | 763,432 | |
| | 1,394,000 | | | Range Resources Corp., 144a,
5.000%, 8/15/22 | | | 1,387,030 | |
| | 563,000 | | | Range Resources Corp., 144a,
5.750%, 6/1/21 | | | 570,038 | |
| | 384,000 | | | Rose Rock Midstream LP / Rose Rock
Finance Corp., 5.625%, 7/15/22 | | | 353,280 | |
| | 676,000 | | | Rose Rock Midstream LP / Rose Rock
Finance Corp., 5.625%, 11/15/23 | | | 615,160 | |
| | 1,217,000 | | | Sabine Pass Liquefaction LLC, 144a,
5.000%, 3/15/27 | | | 1,247,425 | |
| | 749,000 | | | SemGroup Corp., 7.500%, 6/15/21 | | | 749,000 | |
| | 942,000 | | | SESI LLC, 6.375%, 5/1/19 | | | 934,935 | |
| | 244,000 | | | SM Energy Co., 6.750%, 9/15/26 | | | 246,440 | |
| | 269,000 | | | Southwestern Energy Co.,
4.100%, 3/15/22 | | | 244,118 | |
| | 1,005,000 | | | Southwestern Energy Co.,
5.800%, 1/23/20 | | | 1,002,488 | |
| | 622,000 | | | Summit Midstream Holdings LLC /
Summit Midstream Finance Corp.,
7.500%, 7/1/21 | | | 643,770 | |
| | 338,000 | | | Targa Resources Partners LP / Targa
Resources Partners Finance Corp.,
6.375%, 8/1/22 | | | 349,830 | |
| | 472,000 | | | Tesoro Logistics LP / Tesoro Logistics
Finance Corp., 5.875%, 10/1/20 | | | 486,160 | |
| | 281,000 | | | Tesoro Logistics LP / Tesoro Logistics
Finance Corp., 6.250%, 10/15/22 | | | 299,968 | |
| | 711,000 | | | Tullow Oil PLC (United Kingdom),
144a, 6.000%, 11/1/20 | | | 641,678 | |
| | 433,000 | | | Tullow Oil PLC (United Kingdom),
144a, 6.250%, 4/15/22 | | | 387,535 | |
| | 1,421,000 | | | Unit Corp., 6.625%, 5/15/21 | | | 1,198,969 | |
| | 556,000 | | | Weatherford International Ltd
(Bermuda), 6.500%, 8/1/36 | | | 394,760 | |
| | | | | | | | 28,709,384 | |
| | | | | | | | | |
| | | | | Financials — 10.0% | | | | |
| | 240,000 | | | AerCap Ireland Capital Ltd. / AerCap
Global Aviation Trust (Ireland),
3.950%, 2/1/22 | | | 246,000 | |
| | 613,000 | | | AerCap Ireland Capital Ltd. / AerCap
Global Aviation Trust (Ireland),
4.500%, 5/15/21 | | | 641,351 | |
| | 6,000 | | | AerCap Ireland Capital Ltd. / AerCap
Global Aviation Trust (Ireland),
5.000%, 10/1/21 | | | 6,405 | |
| | 625,000 | | | Aircastle Ltd. (Bermuda),
5.500%, 2/15/22 | | | 673,438 | |
| | Touchstone High Yield Fund (Continued) |
| Principal | | | | | Market | |
| Amount | | | | | Value | |
| | | | | | | | | |
| | | | | Corporate Bonds — 95.4% (Continued) | | | | |
| | | | | | | | | |
| | | | | Financials — (Continued) | | | | |
| $ | 458,000 | | | Ally Financial, Inc., 8.000%, 3/15/20 | | $ | 523,265 | |
| | 1,661,000 | | | Ally Financial, Inc., 8.000%, 11/1/31 | | | 2,051,335 | |
| | 1,128,000 | | | Bank of America Corp.,
6.100%, 12/29/49(A)(B) | | | 1,175,940 | |
| | 1,084,000 | | | Blue Racer Midstream LLC / Blue Racer
Finance Corp., 144a,
6.125%, 11/15/22 | | | 1,059,610 | |
| | 1,899,000 | | | CIT Group, Inc., 5.000%, 8/15/22 | | | 2,017,688 | |
| | 1,658,000 | | | Citigroup, Inc., 6.125%, 12/29/49(A)(B) | | | 1,724,320 | |
| | 263,000 | | | Credit Acceptance Corp.,
6.125%, 2/15/21 | | | 264,315 | |
| | 776,000 | | | Credit Acceptance Corp.,
7.375%, 3/15/23 | | | 803,160 | |
| | 1,333,000 | | | FirstCash, Inc., 6.750%, 4/1/21 | | | 1,392,985 | |
| | 809,000 | | | Goldman Sachs Group, Inc. (The),
5.375%, 12/29/49(A)(B) | | | 813,023 | |
| | 534,000 | | | International Lease Finance Corp.,
5.875%, 8/15/22 | | | 592,072 | |
| | 770,000 | | | International Lease Finance Corp.,
6.250%, 5/15/19 | | | 834,487 | |
| | 1,167,000 | | | JPMorgan Chase & Co.,
5.300%, 12/29/49(A)(B) | | | 1,183,046 | |
| | 1,026,000 | | | MetLife, Inc., 5.250%, 12/29/49(A)(B) | | | 1,031,130 | |
| | 597,000 | | | Navient Corp., 5.000%, 10/26/20 | | | 588,791 | |
| | 227,000 | | | Navient Corp., 5.875%, 10/25/24 | | | 206,570 | |
| | 1,089,000 | | | Navient Corp. MTN, 5.500%, 1/15/19 | | | 1,105,335 | |
| | 860,000 | | | Navient Corp. MTN, 6.125%, 3/25/24 | | | 800,875 | |
| | 551,000 | | | Navient Corp. MTN, 8.450%, 6/15/18 | | | 592,325 | |
| | 1,235,000 | | | Quicken Loans, Inc., 144a,
5.750%, 5/1/25 | | | 1,225,738 | |
| | | | | | | | 21,553,204 | |
| | | | | | | | | |
| | | | | Health Care — 8.1% | | | | |
| | 352,000 | | | Acadia Healthcare Co., Inc.,
5.625%, 2/15/23 | | | 357,280 | |
| | 350,000 | | | Acadia Healthcare Co., Inc.,
6.500%, 3/1/24 | | | 366,625 | |
| | 1,003,000 | | | CHS / Community Health Systems, Inc.,
7.125%, 7/15/20 | | | 932,288 | |
| | 200,000 | | | CHS/Community Health Systems, Inc.,
8.000%, 11/15/19† | | | 196,000 | |
| | 251,000 | | | Grifols Worldwide Operations Ltd.
(Ireland), 5.250%, 4/1/22 | | | 259,785 | |
| | 1,012,000 | | | HCA, Inc., 5.375%, 2/1/25 | | | 1,044,890 | |
| | 487,000 | | | HCA, Inc., 5.875%, 3/15/22 | | | 536,918 | |
| | 554,000 | | | HCA, Inc., 5.875%, 5/1/23 | | | 590,010 | |
| | 1,730,000 | | | HCA, Inc., 5.875%, 2/15/26 | | | 1,844,612 | |
| | 975,000 | | | Kindred Healthcare, Inc.,
8.750%, 1/15/23 | | | 975,000 | |
| | 911,000 | | | LifePoint Health, Inc., 5.500%, 12/1/21 | | | 949,718 | |
| | 98,000 | | | LifePoint Health, Inc., 144a,
5.375%, 5/1/24 | | | 98,000 | |
| | 1,145,000 | | | Mallinckrodt International Finance SA
/ Mallinckrodt CB LLC
(Luxembourg), 144a,
5.500%, 4/15/25 | | | 1,087,750 | |
| Principal | | | | | Market | |
| Amount | | | | | Value | |
| | | | | | | | | |
| | | | | Health Care — (Continued) | | | | |
| $ | 238,000 | | | Quintiles Transnational Corp., 144a,
4.875%, 5/15/23 | | $ | 244,545 | |
| | 390,000 | | | Select Medical Corp., 6.375%, 6/1/21 | | | 383,662 | |
| | 134,000 | | | Teleflex, Inc., 4.875%, 6/1/26 | | | 138,690 | |
| | 223,000 | | | Tenet Healthcare Corp.,
4.500%, 4/1/21 | | | 224,394 | |
| | 750,000 | | | Tenet Healthcare Corp.,
4.750%, 6/1/20 | | | 761,250 | |
| | 2,036,000 | | | Tenet Healthcare Corp.,
6.000%, 10/1/20 | | | 2,153,070 | |
| | 1,363,000 | | | Universal Hospital Services, Inc.,
7.625%, 8/15/20 | | | 1,298,258 | |
| | 19,000 | | | Valeant Pharmaceuticals International,
144a, 6.375%, 10/15/20 | | | 17,812 | |
| | 101,000 | | | Valeant Pharmaceuticals International,
144a, 6.750%, 8/15/21 | | | 94,940 | |
| | 829,000 | | | Valeant Pharmaceuticals International, Inc. (Canada),
144a, 5.500%, 3/1/23 | | | 708,795 | |
| | 398,000 | | | Valeant Pharmaceuticals International, Inc. (Canada),
144a, 5.875%, 5/15/23 | | | 343,275 | |
| | 931,000 | | | Valeant Pharmaceuticals International, Inc. (Canada),
144a, 6.125%, 4/15/25 | | | 801,824 | |
| | 1,016,000 | | | Valeant Pharmaceuticals International, Inc. (Canada),
144a, 6.750%, 8/15/18 | | | 1,021,080 | |
| | | | | | | | 17,430,471 | |
| | | | | | | | | |
| | | | | Industrials — 7.1% | | | | |
| | 1,080,000 | | | AECOM Global II LLC / URS Fox US LP,
5.000%, 4/1/22 | | | 1,055,700 | |
| | 139,000 | | | Allegion PLC (Ireland),
5.875%, 9/15/23 | | | 149,772 | |
| | 1,247,545 | | | American Airlines 2013-2 Class B Pass
Through Trust, 144a,
5.600%, 7/15/20 | | | 1,305,244 | |
| | 751,000 | | | Amsted Industries, Inc., 144a,
5.000%, 3/15/22 | | | 754,755 | |
| | 267,000 | | | Amsted Industries, Inc., 144a,
5.375%, 9/15/24 | | | 265,665 | |
| | 512,000 | | | Anixter, Inc., 5.125%, 10/1/21 | | | 533,760 | |
| | 333,000 | | | Anixter, Inc., 144a, 5.500%, 3/1/23 | | | 348,818 | |
| | 465,000 | | | Bombardier, Inc. (Canada), 144a,
7.500%, 3/15/25 | | | 428,381 | |
| | 60,000 | | | Clean Harbors, Inc., 5.125%, 6/1/21 | | | 61,500 | |
| | 384,000 | | | DigitalGlobe, Inc., 144a,
5.250%, 2/1/21 | | | 381,120 | |
| | 402,000 | | | Eagle Materials, Inc., 4.500%, 8/1/26 | | | 407,393 | |
| | 505,000 | | | Graphic Packaging International, Inc.,
4.125%, 8/15/24 | | | 508,788 | |
| | 99,000 | | | Huntington Ingalls Industries, Inc.,
144a, 5.000%, 11/15/25 | | | 104,692 | |
| | 952,000 | | | JB Poindexter & Co., Inc., 144a,
9.000%, 4/1/22 | | | 1,007,930 | |
| | 903,000 | | | Joy Global, Inc., 5.125%, 10/15/21 | | | 991,042 | |
| | 480,000 | | | KLX, Inc., 144a, 5.875%, 12/1/22 | | | 496,800 | |
| | 525,000 | | | Louisiana-Pacific Corp., 144a,
4.875%, 9/15/24 | | | 525,000 | |
| | 214,000 | | | Masco Corp., 4.375%, 4/1/26 | | | 225,235 | |
| Touchstone High Yield Fund (Continued) | |
| Principal | | | | | Market | |
| Amount | | | | | Value | |
| | | | | | | | | |
| | | | | Corporate Bonds — 95.4% (Continued) | | | | |
| | | | | | | | | |
| | | | | Industrials — (Continued) | | | | |
| $ | 172,000 | | | Masco Corp., 5.950%, 3/15/22 | | $ | 196,080 | |
| | 731,000 | | | Multi-Color Corp., 144a,
6.125%, 12/1/22 | | | 767,550 | |
| | 689,000 | | | Nielsen Co. Luxembourg SARL (The)
(Luxembourg), 144a,
5.500%, 10/1/21 | | | 719,144 | |
| | 1,074,000 | | | Orbital ATK, Inc., 5.250%, 10/1/21 | | | 1,116,960 | |
| | 441,000 | | | Standard Industries, Inc., 144a,
5.125%, 2/15/21 | | | 463,050 | |
| | 365,000 | | | Standard Industries, Inc., 144a,
5.375%, 11/15/24 | | | 375,950 | |
| | 433,000 | | | Tenneco, Inc., 5.000%, 7/15/26 | | | 438,412 | |
| | 531,000 | | | TRI Pointe Group, Inc., 4.875%, 7/1/21 | | | 544,275 | |
| | 330,947 | | | United Airlines 2014-2 Class B Pass
Through Trust, 4.625%, 9/3/22 | | | 335,911 | |
| | 761,000 | | | United Rentals North America, Inc.,
7.625%, 4/15/22 | | | 810,465 | |
| | | | | | | | 15,319,392 | |
| | | | | | | | | |
| | | | | Information Technology — 5.7% | | | | |
| | 385,000 | | | CDW LLC / CDW Finance Corp.,
5.000%, 9/1/23 | | | 397,512 | |
| | 97,000 | | | CDW LLC / CDW Finance Corp.,
6.000%, 8/15/22 | | | 103,305 | |
| | 554,000 | | | Diamond 1 Finance Corp. / Diamond
2 Finance Corp., 144a,
5.450%, 6/15/23 | | | 593,587 | |
| | 148,000 | | | Diamond 1 Finance Corp. / Diamond
2 Finance Corp., 144a,
5.875%, 6/15/21 | | | 157,246 | |
| | 881,000 | | | Diamond 1 Finance Corp. / Diamond
2 Finance Corp., 144a,
7.125%, 6/15/24 | | | 968,966 | |
| | 1,016,000 | | | Diebold, Inc., 144a, 8.500%, 4/15/24 | | | 1,052,830 | |
| | 1,047,000 | | | First Data Corp., 144a, 5.000%, 1/15/24 | | | 1,062,705 | |
| | 578,000 | | | First Data Corp., 144a, 5.375%, 8/15/23 | | | 595,340 | |
| | 220,000 | | | Hughes Satellite Systems Corp.,
6.500%, 6/15/19 | | | 240,625 | |
| | 446,000 | | | Micron Technology, Inc., 144a,
7.500%, 9/15/23 | | | 495,390 | |
| | 646,000 | | | NCR Corp., 4.625%, 2/15/21 | | | 652,460 | |
| | 756,000 | | | NCR Corp., 5.875%, 12/15/21 | | | 795,690 | |
| | 806,000 | | | NXP BV / NXP Funding LLC
(Netherlands), 144a,
4.125%, 6/15/20 | | | 855,368 | |
| | 312,000 | | | NXP BV / NXP Funding LLC
(Netherlands), 144a, 4.125%, 6/1/21 | | | 334,230 | |
| | 690,000 | | | NXP BV / NXP Funding LLC
(Netherlands), 144a, 4.625%, 6/1/23 | | | 754,688 | |
| | 325,000 | | | Quintiles IMS, Inc., 144a,
5.000%, 10/15/26 | | | 338,000 | |
| | 1,180,000 | | | ViaSat, Inc., 6.875%, 6/15/20 | | | 1,222,775 | |
| | 276,000 | | | Western Digital Corp., 144a,
7.375%, 4/1/23 | | | 303,600 | |
| Principal | | | | | Market | |
| Amount | | | | | Value | |
| | | | | | | | | |
| | | | | Information Technology — (Continued) | | | | |
| $ | 1,130,000 | | | Western Digital Corp., 144a,
10.500%, 4/1/24 | | $ | 1,310,800 | |
| | | | | | | | 12,235,117 | |
| | | | | | | | | |
| | | | | Materials — 4.7% | | | | |
| | 495,000 | | | Alcoa Nederland Holding BV
(Netherlands), 144a,
6.750%, 9/30/24 | | | 514,181 | |
| | 494,000 | | | Alcoa Nederland Holding BV
(Netherlands), 144a,
7.000%, 9/30/26 | | | 510,672 | |
| | 504,000 | | | Alcoa, Inc., 5.125%, 10/1/24 | | | 536,130 | |
| | 120,000 | | | Alcoa, Inc., 5.870%, 2/23/22 | | | 129,000 | |
| | 731,000 | | | Anglo American Capital PLC (United
Kingdom), 144a, 4.125%, 9/27/22 | | | 723,690 | |
| | 585,000 | | | ArcelorMittal (Luxembourg),
6.250%, 8/5/20 | | | 636,188 | |
| | 89,000 | | | ArcelorMittal (Luxembourg),
6.500%, 3/1/21 | | | 99,012 | |
| | 460,000 | | | ArcelorMittal (Luxembourg),
7.250%, 2/25/22† | | | 522,100 | |
| | 30,000 | | | Cascades, Inc. (Canada), 144a,
5.500%, 7/15/22 | | | 30,488 | |
| | 689,000 | | | Cascades, Inc. (Canada), 144a,
5.750%, 7/15/23 | | | 697,612 | |
| | 943,000 | | | Chemtura Corp., 5.750%, 7/15/21 | | | 990,150 | |
| | 1,041,000 | | | CVR Partners LP / CVR Nitrogen
Finance Corp., 144a,
9.250%, 6/15/23 | | | 1,007,168 | |
| | 134,000 | | | FMG Resources August 2006 Pty Ltd.
(Australia), 144a, 9.750%, 3/1/22 | | | 155,440 | |
| | 111,000 | | | Kaiser Aluminum Corp.,
5.875%, 5/15/24 | | | 115,995 | |
| | 782,000 | | | Lundin Mining Corp. (Canada), 144a,
7.500%, 11/1/20 | | | 830,875 | |
| | 365,000 | | | Lundin Mining Corp. (Canada), 144a,
7.875%, 11/1/22 | | | 388,725 | |
| | 686,000 | | | NOVA Chemicals Corp. (Canada), 144a,
5.250%, 8/1/23 | | | 701,435 | |
| | 840,000 | | | PolyOne Corp., 5.250%, 3/15/23 | | | 869,501 | |
| | 417,000 | | | Steel Dynamics, Inc., 5.125%, 10/1/21 | | | 433,159 | |
| | 249,000 | | | Steel Dynamics, Inc., 5.250%, 4/15/23 | | | 258,338 | |
| | 108,000 | | | Valvoline, Inc., 144a, 5.500%, 7/15/24 | | | 113,130 | |
| | | | | | | | 10,262,989 | |
| | | | | | | | | |
| | | | | Consumer Staples — 4.6% | | | | |
| | 1,378,000 | | | Albertsons Cos. LLC / Safeway, Inc. /
New Albertson’s Inc. / Albertson’s
LLC, 144a, 5.750%, 3/15/25 | | | 1,374,555 | |
| | 517,000 | | | B&G Foods, Inc., 4.625%, 6/1/21 | | | 532,510 | |
| | 201,000 | | | Barry Callebaut Services NV (Belgium),
144a, 5.500%, 6/15/23 | | | 219,020 | |
| | 641,000 | | | Constellation Brands, Inc.,
4.750%, 12/1/25 | | | 692,280 | |
| | 1,172,000 | | | Cott Beverages, Inc., 5.375%, 7/1/22 | | | 1,207,160 | |
| | 400,000 | | | Darling Ingredients, Inc.,
5.375%, 1/15/22 | | | 417,500 | |
| | Touchstone High Yield Fund (Continued) |
| Principal | | | | | Market | |
| Amount | | | | | Value | |
| | | | | | | | | |
| | | | | Corporate Bonds — 95.4% (Continued) | | | | |
| | | | | | | | | |
| | | | | Consumer Staples — (Continued) | | | | |
| $ | 705,000 | | | Harland Clarke Holdings Corp., 144a,
9.750%, 8/1/18 | | $ | 724,387 | |
| | 498,000 | | | IHS Markit Ltd. (Bermuda), 144a,
5.000%, 11/1/22 | | | 526,934 | |
| | 650,000 | | | Ingles Markets, Inc., 5.750%, 6/15/23 | | | 674,375 | |
| | 243,000 | | | JBS USA LLC / JBS USA Finance, Inc.,
144a, 5.750%, 6/15/25 | | | 238,748 | |
| | 684,000 | | | JBS USA LLC / JBS USA Finance, Inc.,
144a, 5.875%, 7/15/24 | | | 680,580 | |
| | 1,296,000 | | | Post Holdings, Inc., 144a,
5.000%, 8/15/26 | | | 1,289,520 | |
| | 268,000 | | | Post Holdings, Inc., 144a,
7.750%, 3/15/24 | | | 300,160 | |
| | 284,000 | | | TreeHouse Foods, Inc., 144a,
6.000%, 2/15/24 | | | 305,655 | |
| | 367,000 | | | US Foods, Inc., 144a, 5.875%, 6/15/24 | | | 380,762 | |
| | 436,000 | | | WhiteWave Foods Co. (The),
5.375%, 10/1/22 | | | 495,405 | |
| | | | | | | | 10,059,551 | |
| | | | | | | | | |
| | | | | Utilities — 3.7% | | | | |
| | 452,000 | | | AES Corp., 5.500%, 3/15/24 | | | 470,360 | |
| | 480,000 | | | AES Corp., 7.375%, 7/1/21 | | | 550,800 | |
| | 755,000 | | | Calpine Corp., 144a, 7.875%, 1/15/23 | | | 797,469 | |
| | 699,000 | | | DPL, Inc., 7.250%, 10/15/21 | | | 712,980 | |
| | 356,000 | | | Dynegy, Inc., 6.750%, 11/1/19 | | | 364,900 | |
| | 61,000 | | | Dynegy, Inc., 7.375%, 11/1/22 | | | 60,238 | |
| | 356,000 | | | Dynegy, Inc., 7.625%, 11/1/24 | | | 349,592 | |
| | 500,000 | | | GenOn Energy, Inc., 7.875%, 6/15/17 | | | 413,750 | |
| | 541,000 | | | GenOn Energy, Inc., 9.500%, 10/15/18 | | | 427,390 | |
| | 1,698,000 | | | InterGen NV (Netherlands), 144a,
7.000%, 6/30/23 | | | 1,434,810 | |
| | 650,000 | | | NGL Energy Partners LP / NGL Energy Finance Corp., 6.875%, 10/15/21 | | | 615,875 | |
| | 138,000 | | | NRG Energy, Inc., 6.250%, 7/15/22 | | | 140,070 | |
| | 528,000 | | | NRG Energy, Inc., 7.875%, 5/15/21 | | | 551,760 | |
| | 1,105,000 | | | NRG Energy, Inc., 144a,
6.625%, 1/15/27 | | | 1,082,900 | |
| | 68,000 | | | Sabine Pass LNG LP, 6.500%, 11/1/20 | | | 70,380 | |
| | | | | | | | 8,043,274 | |
| | | | | | | | | |
| | | | | Real Estate — 3.5% | | | | |
| | 1,798,000 | | | Care Capital Properties LP REIT, 144a,
5.125%, 8/15/26 | | | 1,797,702 | |
| | 135,000 | | | Corrections Corp. of America REIT,
4.125%, 4/1/20† | | | 126,900 | |
| | 123,000 | | | Corrections Corp. of America REIT,
4.625%, 5/1/23 | | | 107,932 | |
| | 562,000 | | | Corrections Corp. of America REIT,
5.000%, 10/15/22 | | | 508,610 | |
| | 362,000 | | | Crown Castle International Corp., REIT,
5.250%, 1/15/23 | | | 409,907 | |
| | 1,318,000 | | | CTR Partnership LP / CareTrust Capital
Corp., REIT, 5.875%, 6/1/21 | | | 1,364,130 | |
| | 868,000 | | | Equinix, Inc., REIT, 5.375%, 4/1/23 | | | 910,315 | |
| Principal | | | | | Market | |
| Amount | | | | | Value | |
| | | | | | | | | |
| | | | | Real Estate — (Continued) | | | | |
| $ | 653,000 | | | ESH Hospitality, Inc., REIT, 144a,
5.250%, 5/1/25 | | $ | 652,184 | |
| | 110,000 | | | GEO Group, Inc. (The) REIT,
5.125%, 4/1/23 | | | 93,500 | |
| | 72,000 | | | GEO Group, Inc. (The) REIT,
5.875%, 10/15/24 | | | 61,920 | |
| | 523,000 | | | MGM Growth Properties Operating
Partnership LP / MGP Finance
Co-Issuer, Inc. REIT, 144a,
5.625%, 5/1/24 | | | 567,298 | |
| | 1,018,000 | | | VEREIT Operating Partnership LP, REIT,
4.600%, 2/6/24 | | | 1,053,630 | |
| | | | | | | | 7,654,028 | |
| | | | | Total Corporate Bonds | | $ | 206,369,325 | |
| | | | | | | | | |
| | | | | Bank Loan — 0.4% | | | | |
| | | | | | | | | |
| | | | | Health Care — 0.4% | | | | |
| | 1,000,000 | | | Envision Healthcare Corp., Tranche B-2
Term Loan, 4.500%, 10/28/22 | | | 1,003,930 | |
| | | | | Total Bank Loan | | $ | 1,003,930 | |
| | | | | | | | | |
| | Shares | | | | | | | |
| | | | | | | | | |
| | | | | Investment Funds — 8.8% | | | | |
| | 18,170,494 | | | Dreyfus Government Cash
Management, Institutional Shares,
0.30%¥W | | | 18,170,494 | |
| | 799,061 | | | Invesco Government & Agency
Portfolio, Institutional Class,
0.31%**¥W | | | 799,061 | |
| | | | | Total Investment Funds | | $ | 18,969,555 | |
| | | | | | | | | |
| | | | | Total Investment Securities —104.6%
(Cost $222,160,019) | | | 226,342,810 | |
| | | | | | | | | |
| | | | | Liabilities in Excess of Other Assets — (4.6%) | | | (9,969,701 | ) |
| | | | | Net Assets — 100.0% | | $ | 216,373,109 | |
| (A) | Variable rate security - Rate reflected is the rate in effect as of September 30, 2016. |
| | |
| (B) | Perpetual Bond - A Bond with no definite maturity date. |
| | |
| ** | Represents collateral for securities loaned. |
| | |
| † | All or a portion of the security is on loan. The total market value of the securities on loan as of September 30, 2016 was $775,516. |
| | |
| ¥ | Open-End Fund. |
| | |
| W | Represents the 7-day SEC yield as of September 30, 2016. |
| Touchstone High Yield Fund (Continued) | |
Portfolio Abbreviations:
LLC - Limited Limited Company
LP - Limited Partnership
MTN - Medium Term Note
PLC - Public Limited Company
REIT - Real Estate Investment Trust
144a - This is a restricted security that was sold in a transaction qualifying for the exemption under Rule 144A of the Securities Act of 1933. This security may be sold in transactions exempt from registration, normally to qualified institutional buyers. At September 30, 2016, these securities were valued at $85,703,420 or 39.6% of net assets. These securities were deemed liquid pursuant to procedures approved by the Board of Trustees.
Other Information:
The inputs or methodology used for valuing securities may not be an indication of the risk associated with investing in those securities. For more information on valuation inputs, and their aggregation into the levels used in the table below, please refer to the security valuation section in the accompanying Notes to Financial Statements.
| Valuation inputs at Reporting Date: |
| Description | | Level 1 | | | Level 2 | | | Level 3 | | | Total | |
| Corporate Bonds | | $ | — | | | $ | 206,369,325 | | | $ | — | | | $ | 206,369,325 | |
| Bank Loan | | | — | | | | 1,003,930 | | | | — | | | | 1,003,930 | |
| Investment Funds | | | 18,969,555 | | | | — | | | | — | | | | 18,969,555 | |
| Total | | $ | 18,969,555 | | | $ | 207,373,255 | | | $ | — | | | $ | 226,342,810 | |
See accompanying Notes to Financial Statements.
| | Statements of Assets and Liabilities
September 30, 2016 |
| | | Touchstone | | Touchstone |
| | | Active Bond | | High Yield |
| | | Fund | | Fund |
| Assets | | | | | | | | |
| Investments, at cost | | $ | 111,048,503 | | | $ | 222,160,019 | |
| Investments, at market value (A) | | $ | 114,713,282 | | | $ | 226,342,810 | |
| Cash | | | 1,349 | | | | 1,044 | |
| Dividends and interest receivable | | | 726,494 | | | | 3,316,715 | |
| Receivable for capital shares sold | | | 89,814 | | | | 241,130 | |
| Receivable for investments sold | | | 8,820,957 | | | | — | |
| Receivable for securities lending income | | | 13 | | | | 491 | |
| Other assets | | | 29,148 | | | | 24,428 | |
| Total Assets | | | 124,381,057 | | | | 229,926,618 | |
| | | | | | | | | |
| Liabilities | | | | | | | | |
| Payable for return of collateral for securities on loan | | | 287,724 | | | | 799,061 | |
| Payable for capital shares redeemed | | | 46,994 | | | | 147,198 | |
| Payable for investments purchased | | | 8,681,999 | | | | 12,379,678 | |
| Payable to Investment Advisor | | | 30,724 | | | | 86,107 | |
| Payable to other affiliates | | | 12,207 | | | | 39,679 | |
| Payable to Trustees | | | 3,910 | | | | 3,910 | |
| Other accrued expenses and liabilities | | | 94,864 | | | | 97,876 | |
| Total Liabilities | | | 9,158,422 | | | | 13,553,509 | |
| | | | | | | | | |
| Net Assets | | $ | 115,222,635 | | | $ | 216,373,109 | |
| | | | | | | | | |
| Net assets consist of: | | | | | | | | |
| Paid-in capital | | $ | 120,044,555 | | | $ | 233,566,711 | |
| Accumulated net investment income | | | 100,282 | | | | 272,401 | |
| Accumulated net realized losses on investments, futures contracts and swap agreements | | | (8,586,981 | ) | | | (21,648,794 | ) |
| Net unrealized appreciation on investments and swap agreements | | | 3,664,779 | | | | 4,182,791 | |
| Net Assets | | $ | 115,222,635 | | | $ | 216,373,109 | |
| (A) Includes market value of securities on loan of: | | $ | 276,519 | | | $ | 775,516 | |
See accompanying Notes to Financial Statements.
| Statements of Assets and Liabilities (Continued) | |
| | | Touchstone | | Touchstone |
| | | Active Bond | | High Yield |
| | | Fund | | Fund |
| Pricing of Class A Shares | | | | | | | | |
| Net assets applicable to Class A shares | | $ | 25,323,847 | | | $ | 20,995,106 | |
Shares of beneficial interest outstanding
(unlimited number of shares authorized, no par value) | | | 2,390,659 | | | | 2,558,004 | |
| Net asset value and redemption price per share* | | $ | 10.59 | | | $ | 8.21 | |
| Maximum sales charge - Class A Shares | | | 4.75 | % | | | 4.75 | % |
Maximum offering price per share
(100%/(100%-maximum sales charge) of net asset value
adjusted to the nearest cent) - Class A Shares | | $ | 11.12 | | | $ | 8.62 | |
| | | | | | | | | |
| Pricing of Class C Shares | | | | | | | | |
| Net assets applicable to Class C shares | | $ | 6,513,289 | | | $ | 16,372,442 | |
Shares of beneficial interest outstanding
(unlimited number of shares authorized, no par value) | | | 663,580 | | | | 1,998,665 | |
| Net asset value and offering price per share** | | $ | 9.82 | | | $ | 8.19 | |
| | | | | | | | | |
| Pricing of Class Y Shares | | | | | | | | |
| Net assets applicable to Class Y shares | | $ | 76,544,176 | | | $ | 85,738,645 | |
Shares of beneficial interest outstanding
(unlimited number of shares authorized, no par value) | | | 7,229,363 | | | | 10,159,545 | |
| Net asset value, offering price and redemption price per share | | $ | 10.59 | | | $ | 8.44 | |
| | | | | | | | | |
| Pricing of Institutional Class Shares | | | | | | | | |
| Net assets applicable to Institutional Class Shares | | $ | 6,841,323 | | | $ | 93,266,916 | |
Shares of beneficial interest outstanding
(unlimited number of shares authorized, no par value) | | | 646,459 | | | | 11,059,725 | |
| Net asset value, offering price and redemption price per share | | $ | 10.58 | | | $ | 8.43 | |
* There is no sales load on subscriptions of $1 million or more. Redemptions that were part of a $1 million or more subscription may be subject to a contingent deferred sales load if redeemed within a one-year period from the date of purchase.
** Redemption price per share varies by length of time shares are held due to the terms of the contingent deferred sales charge.
See accompanying Notes to Financial Statements.
| | Statements of Operations
For the Year Ended September 30, 2016 |
| | | Touchstone | | | Touchstone | |
| | | Active Bond | | | High Yield | |
| | | Fund | | | Fund | |
| Investment Income | | | | | | | | |
| Dividends | | $ | 37,332 | | | $ | 8,578 | |
| Interest | | | 3,528,416 | | | | 12,899,513 | |
| Income from securities loaned | | | 1,639 | | | | 24,644 | |
| Total Investment Income | | | 3,567,387 | | | | 12,932,735 | |
| Expenses | | | | | | | | |
| Investment advisory fees | | | 417,361 | | | | 1,085,856 | |
| Administration fees | | | 151,294 | | | | 300,398 | |
| Compliance fees and expenses | | | 2,849 | | | | 2,849 | |
| Custody fees | | | 43,374 | | | | 16,423 | |
| Professional fees | | | 31,785 | | | | 37,030 | |
| Transfer Agent fees, Class A | | | 36,883 | | | | 35,125 | |
| Transfer Agent fees, Class C | | | 8,078 | | | | 18,354 | |
| Transfer Agent fees, Class Y | | | 91,051 | | | | 131,008 | |
| Transfer Agent fees, Institutional Class | | | 154 | | | | 5,720 | |
| Pricing Expense | | | 57,684 | | | | 44,432 | |
| Registration fees, Class A | | | 16,929 | | | | 15,960 | |
| Registration fees, Class C | | | 12,857 | | | | 13,988 | |
| Registration fees, Class Y | | | 17,127 | | | | 20,918 | |
| Registration fees, Institutional Class | | | 13,358 | | | | 9,800 | |
| Reports to Shareholders, Class A | | | 5,049 | | | | 5,488 | |
| Reports to Shareholders, Class C | | | 3,680 | | | | 4,904 | |
| Reports to Shareholders, Class Y | | | 4,257 | | | | 6,392 | |
| Reports to Shareholders, Institutional Class | | | 3,218 | | | | 3,796 | |
| Distribution expenses, Class A | | | 67,781 | | | | 58,349 | |
| Distribution and shareholder servicing expenses, Class C | | | 67,456 | | | | 188,500 | |
| Trustee fees | | | 16,289 | | | | 16,289 | |
| Other expenses | | | 33,444 | | | | 33,986 | |
| Total Expenses | | | 1,101,958 | | | | 2,055,565 | |
| Fees waived and/or reimbursed by the Advisor and/or Affiliates(A) | | | (292,704 | ) | | | (209,551 | ) |
| Net Expenses | | | 809,254 | | | | 1,846,014 | |
| | | | | | | | | |
| Net Investment Income | | | 2,758,133 | | | | 11,086,721 | |
| Realized and Unrealized Gains (Losses) on Investments | | | | | | | | |
| Net realized losses on investments | | | (168,379 | ) | | | (20,953,503 | ) |
| Net realized gains on futures contracts | | | 229,662 | | | | — | |
| Net realized gains on swap agreements | | | 103,362 | | | | — | |
| Net change in unrealized appreciation (depreciation) on investments | | | 4,355,600 | | | | 25,923,699 | |
| Net change in unrealized appreciation (depreciation) on swap agreements | | | 148,981 | | | | — | |
| Net Realized and Unrealized Gains (Losses) on Investments | | | 4,669,226 | | | | 4,970,196 | |
| | | | | | | | | |
| Change in Net Assets Resulting from Operations | | $ | 7,427,359 | | | $ | 16,056,917 | |
(A) See Note 4 in Notes to Financial Statements.
See accompanying Notes to Financial Statements.
| Statements of Changes in Net Assets | |
| | | Touchstone | | | Touchstone | |
| | | Active Bond Fund | | | High Yield Fund | |
| | | For the | | | For the | | | For the | | | For the | |
| | | Year | | | Year | | | Year | | | Year | |
| | | Ended | | | Ended | | | Ended | | | Ended | |
| | | September 30, | | | September 30, | | | September 30, | | | September 30, | |
| | | 2016 | | | 2015 | | | 2016 | | | 2015 | |
| From Operations | | | | | | | | | | | | | | | | |
| Net investment income | | $ | 2,758,133 | | | $ | 2,756,854 | | | $ | 11,086,721 | | | $ | 13,443,008 | |
| Net realized gains (losses) on investments, futures contracts and swap agreements | | | 164,645 | | | | 929,632 | | | | (20,953,503 | ) | | | (615,062 | ) |
| Net change in unrealized appreciation (depreciation) on investments and swap agreements | | | 4,504,581 | | | | (3,242,562 | ) | | | 25,923,699 | | | | (24,114,989 | ) |
| Change in Net Assets from Operations | | | 7,427,359 | | | | 443,924 | | | | 16,056,917 | | | | (11,287,043 | ) |
| Distributions to Shareholders from: | | | | | | | | | | | | | | | | |
| Net investment income, Class A | | | (793,010 | ) | | | (783,672 | ) | | | (1,196,537 | ) | | | (1,755,044 | ) |
| Net investment income, Class C | | | (163,270 | ) | | | (168,157 | ) | | | (827,572 | ) | | | (1,274,997 | ) |
| Net investment income, Class Y | | | (2,017,062 | ) | | | (1,743,683 | ) | | | (4,925,536 | ) | | | (7,346,440 | ) |
| Net investment income, Institutional Class | | | (182,651 | ) | | | (235,382 | ) | | | (3,934,366 | ) | | | (3,121,237 | ) |
| Net realized gains, Class A | | | — | | | | — | | | | — | | | | (600,485 | ) |
| Net realized gains, Class C | | | — | | | | — | | | | — | | | | (497,039 | ) |
| Net realized gains, Class Y | | | — | | | | — | | | | — | | | | (2,409,429 | ) |
| Net realized gains, Institutional Class | | | — | | | | — | | | | — | | | | (879,275 | ) |
| Total Distributions | | | (3,155,993 | ) | | | (2,930,894 | ) | | | (10,884,011 | ) | | | (17,883,946 | ) |
| | | | | | | | | | | | | | | | | |
| Net Increase (Decrease) from Share Transactions(A) | | | 10,687,819 | | | | (2,050,799 | ) | | | (18,893,488 | ) | | | (34,869,626 | ) |
| Total Increase (Decrease) in Net Assets | | | 14,959,185 | | | | (4,537,769 | ) | | | (13,720,582 | ) | | | (64,040,615 | ) |
| | | | | | | | | | | | | | | | | |
| Net Assets | | | | | | | | | | | | | | | | |
| Beginning of period | | | 100,263,450 | | | | 104,801,219 | | | | 230,093,691 | | | | 294,134,306 | |
| End of period | | $ | 115,222,635 | | | $ | 100,263,450 | | | $ | 216,373,109 | | | $ | 230,093,691 | |
| | | | | | | | | | | | | | | | | |
| Accumulated Net Investment Income | | $ | 100,282 | | | $ | 247,264 | | | $ | 272,401 | | | $ | 7,473 | |
(A) For details of share transactions by class, see Statements of Changes in Net Assets - Capital Stock Activity on pages 30-31.
See accompanying Notes to Financial Statements.
| | Statements of Changes in Net Assets - Capital Stock Activity |
| | | Touchstone Active Bond Fund | |
| | | For the Year | | | For the Year | |
| | | Ended | | | Ended | |
| | | September 30, 2016 | | | September 30, 2015 | |
| | | Shares | | | Dollars | | | Shares | | | Dollars | |
| Class A | | | | | | | | | | | | | | | | |
| Proceeds from Shares issued | | | 422,516 | | | $ | 4,377,566 | | | | 521,863 | | | $ | 5,472,178 | |
| Reinvestment of distributions | | | 64,512 | | | | 663,170 | | | | 60,776 | | | | 634,044 | |
| Cost of Shares redeemed | | | (952,555 | ) | | | (9,803,201 | ) | | | (493,611 | ) | | | (5,165,635 | ) |
| Change from Class A Share Transactions | | | (465,527 | ) | | | (4,762,465 | ) | | | 89,028 | | | | 940,587 | |
| Class C | | | | | | | | | | | | | | | | |
| Proceeds from Shares issued | | | 52,531 | | | | 498,074 | | | | 31,849 | | | | 309,516 | |
| Reinvestment of distributions | | | 11,675 | | | | 111,191 | | | | 11,574 | | | | 112,348 | |
| Cost of Shares redeemed | | | (133,602 | ) | | | (1,280,684 | ) | | | (207,164 | ) | | | (2,015,474 | ) |
| Change from Class C Share Transactions | | | (69,396 | ) | | | (671,419 | ) | | | (163,741 | ) | | | (1,593,610 | ) |
| Class Y | | | | | | | | | | | | | | | | |
| Proceeds from Shares issued | | | 3,546,908 | | | | 36,345,102 | | | | 1,398,596 | | | | 14,597,461 | |
| Reinvestment of distributions | | | 116,399 | | | | 1,198,270 | | | | 114,921 | | | | 1,198,720 | |
| Cost of Shares redeemed | | | (2,062,857 | ) | | | (21,159,535 | ) | | | (1,605,404 | ) | | | (16,755,511 | ) |
| Change from Class Y Share Transactions | | | 1,600,450 | | | | 16,383,837 | | | | (91,887 | ) | | | (959,330 | ) |
| Institutional Class | | | | | | | | | | | | | | | | |
| Proceeds from Shares issued | | | 469,433 | | | | 4,740,317 | | | | 248,941 | | | | 2,595,870 | |
| Reinvestment of distributions | | | 1,481 | | | | 15,119 | | | | 13,804 | | | | 143,962 | |
| Cost of Shares redeemed | | | (490,474 | ) | | | (5,017,570 | ) | | | (304,688 | ) | | | (3,178,278 | ) |
| Change from Institutional Class Share Transactions | | | (19,560 | ) | | | (262,134 | ) | | | (41,943 | ) | | | (438,446 | ) |
| | | | | | | | | | | | | | | | | |
| Change from Share Transactions | | | 1,045,967 | | | $ | 10,687,819 | | | | (208,543 | ) | | $ | (2,050,799 | ) |
See accompanying Notes to Financial Statements.
| Statements of Changes in Net Assets - Capital Stock Activity (Continued) | |
| Touchstone High Yield Fund | |
| For the Year | | | For the Year | |
| Ended | | | Ended | |
| September 30, 2016 | | | September 30, 2015 | |
| Shares | | | Dollars | | | Shares | | | Dollars | |
| | | | | | | | | | | | | | | |
| | 1,840,076 | | | $ | 14,313,901 | | | | 1,240,634 | | | $ | 10,932,148 | |
| | 126,429 | | | | 995,257 | | | | 210,474 | | | | 1,803,113 | |
| | (2,779,467 | ) | | | (21,828,720 | ) | | | (2,531,530 | ) | | | (22,055,444 | ) |
| | (812,962 | ) | | | (6,519,562 | ) | | | (1,080,422 | ) | | | (9,320,183 | ) |
| | | | | | | | | | | | | | | |
| | 276,329 | | | | 2,167,022 | | | | 300,148 | | | | 2,605,236 | |
| | 86,491 | | | | 677,823 | | | | 170,244 | | | | 1,453,456 | |
| | (1,484,518 | ) | | | (11,552,083 | ) | | | (965,899 | ) | | | (8,244,327 | ) |
| | (1,121,698 | ) | | | (8,707,238 | ) | | | (495,507 | ) | | | (4,185,635 | ) |
| | | | | | | | | | | | | | | |
| | 3,605,884 | | | | 29,012,898 | | | | 5,508,924 | | | | 49,526,271 | |
| | 296,981 | | | | 2,401,348 | | | | 539,658 | | | | 4,732,512 | |
| | (8,383,588 | ) | | | (67,033,983 | ) | | | (9,586,993 | ) | | | (85,130,542 | ) |
| | (4,480,723 | ) | | | (35,619,737 | ) | | | (3,538,411 | ) | | | (30,871,759 | ) |
| | | | | | | | | | | | | | | |
| | 5,429,812 | | | | 44,956,988 | | | | 2,174,554 | | | | 19,196,691 | |
| | 437,280 | | | | 3,530,745 | | | | 415,119 | | | | 3,639,862 | |
| | (2,044,785 | ) | | | (16,534,684 | ) | | | (1,511,700 | ) | | | (13,328,602 | ) |
| | 3,822,307 | | | | 31,953,049 | | | | 1,077,973 | | | | 9,507,951 | |
| | | | | | | | | | | | | | | |
| | (2,593,076 | ) | | $ | (18,893,488 | ) | | | (4,036,367 | ) | | $ | (34,869,626 | ) |
Touchstone Active Bond Fund—Class A
Selected Data for a Share Outstanding Throughout Each Period
| | | Year Ended September 30, |
| | | 2016 | | 2015 | | 2014 | | 2013 | | 2012 |
| Net asset value at beginning of period | | $ | 10.20 | | | $ | 10.45 | | | $ | 10.33 | | | $ | 10.89 | | | $ | 10.46 | |
| Income (loss) from investment operations: | | | | | | | | | | | | | | | | | | | | |
| Net investment income | | | 0.26 | | | | 0.26 | | | | 0.32 | | | | 0.30 | | | | 0.30 | |
Net realized and unrealized gains (losses)
on investments | | | 0.43 | | | | (0.23 | ) | | | 0.13 | | | | (0.38 | ) | | | 0.46 | |
| Total from investment operations | | | 0.69 | | | | 0.03 | | | | 0.45 | | | | (0.08 | ) | | | 0.76 | |
| Distributions from: | | | | | | | | | | | | | | | | | | | | |
| Net investment income | | | (0.30 | ) | | | (0.28 | ) | | | (0.33 | ) | | | (0.36 | ) | | | (0.33 | ) |
| Realized capital gains | | | — | | | | — | | | | — | | | | (0.12 | ) | | | — | |
| Total distributions | | | (0.30 | ) | | | (0.28 | ) | | | (0.33 | ) | | | (0.48 | ) | | | (0.33 | ) |
| Net asset value at end of period | | $ | 10.59 | | | $ | 10.20 | | | $ | 10.45 | | | $ | 10.33 | | | $ | 10.89 | |
| Total return(A) | | | 6.90% | | | | 0.24% | | | | 4.41% | | | | (0.85% | ) | | | 7.47% | |
| Ratios and supplemental data: | | | | | | | | | | | | | | | | | | | | |
| Net assets at end of period (000’s) | | $ | 25,324 | | | $ | 29,135 | | | $ | 28,920 | | | $ | 34,635 | | | $ | 79,208 | |
| Ratio to average net assets: | | | | | | | | | | | | | | | | | | | | |
| Net expenses | | | 0.90% | | | | 0.90% | | | | 0.86% | | | | 0.83% | | | | 0.87% | |
| Gross expenses | | | 1.19% | | | | 1.19% | | | | 1.28% | | | | 1.18% | | | | 1.23% | |
| Net investment income | | | 2.52% | | | | 2.50% | | | | 2.99% | | | | 2.94% | | | | 2.72% | |
| Portfolio turnover rate | | | 590% | | | | 349% | | | | 281% | | | | 353% | | | | 525% | (B) |
Touchstone Active Bond Fund—Class C
Selected Data for a Share Outstanding Throughout Each Period
| | | Year Ended September 30, |
| | | 2016 | | 2015 | | 2014 | | 2013 | | 2012 |
| Net asset value at beginning of period | | $ | 9.48 | | | $ | 9.73 | | | $ | 9.64 | | | $ | 10.20 | | | $ | 9.82 | |
| Income (loss) from investment operations: | | | | | | | | | | | | | | | | | | | | |
| Net investment income | | | 0.16 | | | | 0.17 | | | | 0.21 | | | | 0.20 | | | | 0.22 | |
Net realized and unrealized gains (losses)
on investments | | | 0.41 | | | | (0.21 | ) | | | 0.14 | | | | (0.35 | ) | | | 0.42 | |
| Total from investment operations | | | 0.57 | | | | (0.04 | ) | | | 0.35 | | | | (0.15 | ) | | | 0.64 | |
| Distributions from: | | | | | | | | | | | | | | | | | | | | |
| Net investment income | | | (0.23 | ) | | | (0.21 | ) | | | (0.26 | ) | | | (0.29 | ) | | | (0.26 | ) |
| Realized capital gains | | | — | | | | — | | | | — | | | | (0.12 | ) | | | — | |
| Total distributions | | | (0.23 | ) | | | (0.21 | ) | | | (0.26 | ) | | | (0.41 | ) | | | (0.26 | ) |
| Net asset value at end of period | | $ | 9.82 | | | $ | 9.48 | | | $ | 9.73 | | | $ | 9.64 | | | $ | 10.20 | |
| Total return(A) | | | 6.03% | | | | (0.47% | ) | | | 3.65% | | | | (1.55% | ) | | | 6.59% | |
| Ratios and supplemental data: | | | | | | | | | | | | | | | | | | | | |
| Net assets at end of period (000’s) | | $ | 6,513 | | | $ | 6,946 | | | $ | 8,725 | | | $ | 11,337 | | | $ | 19,386 | |
| Ratio to average net assets: | | | | | | | | | | | | | | | | | | | | |
| Net expenses | | | 1.65% | | | | 1.65% | | | | 1.61% | | | | 1.58% | | | | 1.62% | |
| Gross expenses | | | 2.09% | | | | 2.06% | | | | 2.15% | | | | 1.98% | | | | 2.10% | |
| Net investment income | | | 1.77% | | | | 1.75% | | | | 2.24% | | | | 2.19% | | | | 1.98% | |
| Portfolio turnover rate | | | 590% | | | | 349% | | | | 281% | | | | 353% | | | | 525% | (B) |
| (A) | Total returns shown exclude the effect of applicable sales loads. If these charges were included, the returns would be lower. |
| (B) | Portfolio turnover excludes the purchases and sales of the Funds acquired on April 16, 2012 and September 10, 2012. If these transactions were included, portfolio turnover would have been higher. |
See accompanying Notes to Financial Statements.
| Financial Highlights (Continued) | |
Touchstone Active Bond Fund— Class Y
Selected Data for a Share Outstanding Throughout Each Period
| | | | | | | | | | | | | | | Period |
| | | | | | | | | | | | | | | Ended |
| | | Year Ended September 30, | | September 30, |
| | | 2016 | | 2015 | | 2014 | | 2013 | | 2012(A) |
| Net asset value at beginning of period | | $ | 10.20 | | | $ | 10.45 | | | $ | 10.32 | | | $ | 10.89 | | | $ | 10.69 | |
| Income (loss) from investment operations: | | | | | | | | | | | | | | | | | | | | |
| Net investment income | | | 0.29 | | | | 0.29 | | | | 0.34 | | | | 0.33 | | | | 0.18 | |
Net realized and unrealized gains (losses) on
investments | | | 0.43 | | | | (0.24 | ) | | | 0.15 | | | | (0.39 | ) | | | 0.19 | |
| Total from investment operations | | | 0.72 | | | | 0.05 | | | | 0.49 | | | | (0.06 | ) | | | 0.37 | |
| Distributions from: | | | | | | | | | | | | | | | | | | | | |
| Net investment income | | | (0.33 | ) | | | (0.30 | ) | | | (0.36 | ) | | | (0.39 | ) | | | (0.17 | ) |
| Realized capital gains | | | — | | | | — | | | | — | | | | (0.12 | ) | | | — | |
| Total distributions | | | (0.33 | ) | | | (0.30 | ) | | | (0.36 | ) | | | (0.51 | ) | | | (0.17 | ) |
| Net asset value at end of period | | $ | 10.59 | | | $ | 10.20 | | | $ | 10.45 | | | $ | 10.32 | | | $ | 10.89 | |
| Total return | | | 7.18% | | | | 0.49% | | | | 4.78% | | | | (0.60% | ) | | | (3.46% | )(B) |
| Ratios and supplemental data: | | | | | | | | | | | | | | | | | | | | |
| Net assets at end of period (000’s) | | $ | 76,544 | | | $ | 57,394 | | | $ | 59,764 | | | $ | 58,944 | | | $ | 78,575 | |
| Ratio to average net assets: | | | | | | | | | | | | | | | | | | | | |
| Net expenses | | | 0.65% | | | | 0.65% | | | | 0.61% | | | | 0.58% | | | | 0.58% | (C) |
| Gross expenses | | | 0.90% | | | | 0.91% | | | | 0.95% | | | | 0.88% | | | | 0.97% | (C) |
| Net investment income | | | 2.77% | | | | 2.75% | | | | 3.24% | | | | 3.19% | | | | 2.97% | (C) |
| Portfolio turnover rate | | | 590% | | | | 349% | | | | 281% | | | | 353% | | | | 525% | (D) |
Touchstone Active Bond Fund—Institutional Class
Selected Data for a Share Outstanding Throughout Each Period
| | | | | | | | | | | | | | | Period |
| | | | | | | | | | | | | | | Ended |
| | | Year Ended September 30, | | September 30, |
| | | 2016 | | | 2015 | | | 2014 | | | 2013 | | | 2012(A) |
| Net asset value at beginning of period | | $ | 10.19 | | | $ | 10.44 | | | $ | 10.32 | | | $ | 10.89 | | | $ | 10.69 | |
| Income (loss) from investment operations: | | | | | | | | | | | | | | | | | | | | |
| Net investment income | | | 0.33 | | | | 0.30 | | | | 0.35 | | | | 0.34 | | | | 0.18 | |
Net realized and unrealized gains (losses) on
investments | | | 0.40 | | | | (0.24 | ) | | | 0.14 | | | | (0.39 | ) | | | 0.19 | |
| Total from investment operations | | | 0.73 | | | | 0.06 | | | | 0.49 | | | | (0.05 | ) | | | 0.37 | |
| Distributions from: | | | | | | | | | | | | | | | | | | | | |
| Net investment income | | | (0.34 | ) | | | (0.31 | ) | | | (0.37 | ) | | | (0.40 | ) | | | (0.17 | ) |
| Realized capital gains | | | — | | | | — | | | | — | | | | (0.12 | ) | | | — | |
| Total distributions | | | (0.34 | ) | | | (0.31 | ) | | | (0.37 | ) | | | (0.52 | ) | | | (0.17 | ) |
| Net asset value at end of period | | $ | 10.58 | | | $ | 10.19 | | | $ | 10.44 | | | $ | 10.32 | | | $ | 10.89 | |
| Total return | | | 7.27% | | | | 0.57% | | | | 4.76% | | | | (0.52% | ) | | | 3.50% | (B) |
| Ratios and supplemental data: | | | | | | | | | | | | | | | | | | | | |
| Net assets at end of period (000’s) | | $ | 6,841 | | | $ | 6,788 | | | $ | 7,393 | | | $ | 7,606 | | | $ | 12,311 | |
| Ratio to average net assets: | | | | | | | | | | | | | | | | | | | | |
| Net expenses | | | 0.57% | | | | 0.57% | | | | 0.53% | | | | 0.50% | | | | 0.50% | (C) |
| Gross expenses | | | 1.00% | | | | 0.95% | | | | 1.09% | | | | 0.95% | | | | 1.11% | (C) |
| Net investment income | | | 2.85% | | | | 2.83% | | | | 3.32% | | | | 3.27% | | | | 3.05% | (C) |
| Portfolio turnover rate | | | 590% | | | | 349% | | | | 281% | | | | 353% | | | | 525% | (D) |
| (A) | Represents the period from commencement of operations (April 16, 2012) through September 30, 2012. |
| (B) | Not annualized. |
| (C) | Annualized. |
| (D) | Portfolio turnover excludes the purchases and sales of the Funds acquired on April 16, 2012 and September 10, 2012. If these transactions were included, portfolio turnover would have been higher. |
See accompanying Notes to Financial Statements.
| | Financial Highlights (Continued) |
Touchstone High Yield Fund—Class A
Selected Data for a Share Outstanding Throughout Each Period
| | | Year Ended September 30, |
| | | 2016 | | 2015 | | 2014 | | 2013 | | 2012 |
| Net asset value at beginning of period | | $ | 7.95 | | | $ | 8.91 | | | $ | 8.80 | | | $ | 8.90 | | | $ | 8.13 | |
| Income (loss) from investment operations: | | | | | | | | | | | | | | | | | | | | |
| Net investment income | | | 0.41 | | | | 0.43 | | | | 0.45 | | | | 0.51 | | | | 0.57 | |
Net realized and unrealized gains (losses) on
investments | | | 0.26 | | | | (0.81 | ) | | | 0.12 | | | | (0.10 | ) | | | 0.76 | |
| Total from investment operations | | | 0.67 | | | | (0.38 | ) | | | 0.57 | | | | 0.41 | | | | 1.33 | |
| Distributions from: | | | | | | | | | | | | | | | | | | | | |
| Net investment income | | | (0.41 | ) | | | (0.44 | ) | | | (0.46 | ) | | | (0.51 | ) | | | (0.56 | ) |
| Realized capital gains | | | — | | | | (0.14 | ) | | | — | | | | — | | | | — | |
| Total distributions | | | (0.41 | ) | | | (0.58 | ) | | | (0.46 | ) | | | (0.51 | ) | | | (0.56 | ) |
| Net asset value at end of period | | $ | 8.21 | | | $ | 7.95 | | | $ | 8.91 | | | $ | 8.80 | | | $ | 8.90 | |
| Total return(A) | | | 8.78% | | | | (4.54% | ) | | | 6.54% | | | | 4.68% | | | | 16.80% | |
| Ratios and supplemental data: | | | | | | | | | | | | | | | | | | | | |
| Net assets at end of period (000’s) | | $ | 20,995 | | | $ | 26,797 | | | $ | 39,671 | | | $ | 54,845 | | | $ | 96,667 | |
| Ratio to average net assets: | | | | | | | | | | | | | | | | | | | | |
| Net expenses | | | 1.05% | | | | 1.05% | | | | 1.03% | | | | 0.99% | | | | 0.99% | |
| Gross expenses | | | 1.23% | | | | 1.15% | | | | 1.14% | | | | 1.13% | | | | 1.10% | |
| Net investment income | | | 5.19% | | | | 4.92% | | | | 4.95% | | | | 5.60% | | | | 6.48% | |
| Portfolio turnover rate | | | 56% | | | | 35% | | | | 40% | | | | 47% | | | | 48% | (B) |
Touchstone High Yield Fund—Class C
Selected Data for a Share Outstanding Throughout Each Period
| | | Year Ended September 30, |
| | | 2016 | | 2015 | | 2014 | | 2013 | | 2012 |
| Net asset value at beginning of period | | $ | 7.93 | | | $ | 8.90 | | | $ | 8.79 | | | $ | 8.89 | | | $ | 8.12 | |
| Income (loss) from investment operations: | | | | | | | | | | | | | | | | | | | | |
| Net investment income | | | 0.35 | | | | 0.36 | | | | 0.38 | | | | 0.44 | | | | 0.49 | |
Net realized and unrealized gains (losses) on
investments | | | 0.26 | | | | (0.82 | ) | | | 0.12 | | | | (0.09 | ) | | | 0.78 | |
| Total from investment operations | | | 0.61 | | | | (0.46 | ) | | | 0.50 | | | | 0.35 | | | | 1.27 | |
| Distributions from: | | | | | | | | | | | | | | | | | | | | |
| Net investment income | | | (0.35 | ) | | | (0.37 | ) | | | (0.39 | ) | | | (0.45 | ) | | | (0.50 | ) |
| Realized capital gains | | | — | | | | (0.14 | ) | | | — | | | | — | | | | — | |
| Total distributions | | | (0.35 | ) | | | (0.51 | ) | | | (0.39 | ) | | | (0.45 | ) | | | (0.50 | ) |
| Net asset value at end of period | | $ | 8.19 | | | $ | 7.93 | | | $ | 8.90 | | | $ | 8.79 | | | $ | 8.89 | |
| Total return(A) | | | 7.99% | | | | (5.28% | ) | | | 5.64% | | | | 3.92% | | | | 15.93% | |
| Ratios and supplemental data: | | | | | | | | | | | | | | | | | | | | |
| Net assets at end of period (000’s) | | $ | 16,372 | | | $ | 24,755 | | | $ | 32,163 | | | $ | 34,661 | | | $ | 42,626 | |
| Ratio to average net assets: | | | | | | | | | | | | | | | | | | | | |
| Net expenses | | | 1.80% | | | | 1.80% | | | | 1.78% | | | | 1.74% | | | | 1.80% | |
| Gross expenses | | | 1.94% | | | | 1.87% | | | | 1.86% | | | | 1.87% | | | | 1.92% | |
| Net investment income | | | 4.44% | | | | 4.17% | | | | 4.21% | | | | 4.86% | | | | 5.67% | |
| Portfolio turnover rate | | | 56% | | | | 35% | | | | 40% | | | | 47% | | | | 48% | (B) |
| (A) | Total returns shown exclude the effect of applicable sales loads. If these charges were included, the returns would be lower. |
| (B) | Portfolio turnover excludes the purchases and sales of the Fund acquired on September 10, 2012. If these transactions were included, portfolio turnover would have been higher. |
See accompanying Notes to Financial Statements.
| Financial Highlights (Continued) | |
Touchstone High Yield Fund—Class Y
Selected Data for a Share Outstanding Throughout Each Period
| | | Year Ended September 30, |
| | | 2016 | | 2015 | | 2014 | | 2013 | | 2012 |
| Net asset value at beginning of period | | $ | 8.16 | | | $ | 9.14 | | | $ | 9.01 | | | $ | 9.10 | | | $ | 8.30 | |
| Income (loss) from investment operations | | | | | | | | | | | | | | | | | | | | |
| Net investment income | | | 0.46 | | | | 0.47 | | | | 0.50 | | | | 0.56 | | | | 0.59 | |
Net realized and unrealized gains (losses) on
investments | | | 0.25 | | | | (0.85 | ) | | | 0.12 | | | | (0.11 | ) | | | 0.79 | |
| Total from investment operations | | | 0.71 | | | | (0.38 | ) | | | 0.62 | | | | 0.45 | | | | 1.38 | |
| Distributions from: | | | | | | | | | | | | | | | | | | | | |
| Net investment income | | | (0.43 | ) | | | (0.46 | ) | | | (0.49 | ) | | | (0.54 | ) | | | (0.58 | ) |
| Realized capital gains | | | — | | | | (0.14 | ) | | | — | | | | — | | | | — | |
| Total distributions | | | (0.43 | ) | | | (0.60 | ) | | | (0.49 | ) | | | (0.54 | ) | | | (0.58 | ) |
| Net asset value at end of period | | $ | 8.44 | | | $ | 8.16 | | | $ | 9.14 | | | $ | 9.01 | | | $ | 9.10 | |
| Total return | | | 9.11% | | | | (4.42% | ) | | | 6.91% | | | | 5.00% | | | | 17.10% | |
| Ratios and supplemental data: | | | | | | | | | | | | | | | | | | | | |
| Net assets at end of period (000’s) | | $ | 85,739 | | | $ | 119,505 | | | $ | 166,071 | | | $ | 187,463 | | | $ | 222,866 | |
| Ratio to average net assets: | | | | | | | | | | | | | | | | | | | | |
| Net expenses | | | 0.80% | | | | 0.80% | | | | 0.74% | | | | 0.69% | | | | 0.75% | |
| Gross expenses | | | 0.91% | | | | 0.87% | | | | 0.78% | | | | 0.83% | | | | 0.86% | |
| Net investment income | | | 5.44% | | | | 5.17% | | | | 5.24% | | | | 5.90% | | | | 6.72% | |
| Portfolio turnover rate | | | 56% | | | | 35% | | | | 40% | | | | 47% | | | | 48% | (A) |
Touchstone High Yield Fund—Institutional Class
Selected Data for a Share Outstanding Throughout Each Period
| | | | | | | | | | | | | | | Period Ended |
| | | | | | | | | | | | | | | September |
| | | Year Ended September 30, | | 30, |
| | | | 2016 | | | | 2015 | | | | 2014 | | | | 2013 | | | 2012(B) |
| Net asset value at beginning of period | | $ | 8.16 | | | $ | 9.13 | | | $ | 9.00 | | | $ | 9.10 | | | $ | 8.88 | |
| Income (loss) from investment operations: | | | | | | | | | | | | | | | | | | | | |
| Net Investment income | | | 0.44 | | | | 0.46 | | | | 0.49 | | | | 0.54 | | | | 0.43 | |
Net realized and unrealized gains (losses) on
investments | | | 0.27 | | | | (0.82 | ) | | | 0.13 | | | | (0.09 | ) | | | 0.23 | |
| Total from investment operations | | | 0.71 | | | | (0.36 | ) | | | 0.62 | | | | 0.45 | | | | 0.66 | |
| Distributions from: | | | | | | | | | | | | | | | | | | | | |
| Net Investment income | | | (0.44 | ) | | | (0.47 | ) | | | (0.49 | ) | | | (0.55 | ) | | | (0.44 | ) |
| Realized capital gains | | | — | | | | (0.14 | ) | | | — | | | | — | | | | — | |
| Total distributions | | | (0.44 | ) | | | (0.61 | ) | | | (0.49 | ) | | | (0.55 | ) | | | (0.44 | ) |
| Net asset value at end of period | | $ | 8.43 | | | $ | 8.16 | | | $ | 9.13 | | | $ | 9.00 | | | $ | 9.10 | |
| Total return | | | 9.19% | | | | (4.23% | ) | | | 6.99% | | | | 5.00% | | | | 7.66% | (C) |
| Ratios and supplemental data: | | | | | | | | | | | | | | | | | | | | |
| Net assets at end of period (000’s) | | $ | 93,267 | | | $ | 59,037 | | | $ | 56,228 | | | $ | 53,844 | | | $ | 15,735 | |
| Ratio to average net assets: | | | | | | | | | | | | | | | | | | | | |
| Net expenses | | | 0.72% | | | | 0.72% | | | | 0.68% | | | | 0.59% | | | | 0.65% | (D) |
| Gross expenses | | | 0.77% | | | | 0.75% | | | | 0.75% | | | | 0.75% | | | | 0.95% | (D) |
| Net investment income | | | 5.52% | | | | 5.25% | | | | 5.31% | | | | 6.00% | | | | 6.82% | (D) |
| Portfolio turnover rate | | | 56% | | | | 35% | | | | 40% | | | | 47% | | | | 48% | (A) |
| (A) | Portfolio turnover excludes the purchases and sales of the Fund acquired on September 10, 2012. If these transactions were included, portfolio turnover would have been higher. |
| (B) | Represents the period from commencement of operations (January 27, 2012) through September 30, 2012. |
| (C) | Not annualized. |
| (D) | Annualized. |
See accompanying Notes to Financial Statements.
| | Notes to Financial Statements
September 30, 2016 |
1. Organization
The Touchstone Investment Trust (the “Trust”) is registered under the Investment Company Act of 1940, as amended (the “1940 Act”), as an open-end management investment company. The Trust was established as a Massachusetts business trust pursuant to an Agreement and Declaration of Trust dated December 7, 1980. The Trust consists of the following two funds (individually, a “Fund,” and collectively, the “Funds”):
Touchstone Active Bond Fund (“Active Bond Fund”)
Touchstone High Yield Fund (“High Yield Fund”)
Each Fund is diversified.
The Agreement and Declaration of Trust permits the Trust to issue an unlimited number of shares of beneficial interest of each Fund. The Active Bond Fund and High Yield Fund are registered to offer Class A shares, Class C shares, Class Y shares and Institutional Class shares. The assets of each Fund are segregated, and a shareholder’s interest is limited to the Fund in which shares are held. The Funds’ prospectus provides a description of each Fund’s investment goals, policies, and strategies along with information on the classes of shares currently being offered.
2. Significant Accounting Policies
The following is a summary of the Funds’ significant accounting policies:
Each Fund is an investment company that follows the accounting and reporting guidance of Accounting Standards Codification Topic 946 applicable to investment companies.
Security valuation and fair value measurements — U.S. generally accepted accounting principles (“U.S. GAAP”) define fair value as the price the Funds would receive to sell an asset or pay to transfer a liability in an orderly transaction between market participants at the measurement date. All investments in securities are recorded at their estimated fair value. The Funds define the term “market value”, as used throughout this report, as the estimated fair value. The Funds use various methods to measure fair value of their portfolio securities on a recurring basis. U.S. GAAP fair value measurement standards require disclosure of a hierarchy that prioritizes inputs to valuation methods.
These inputs are summarized in the three broad levels listed below:
| • | Level 1 – | quoted prices in active markets for identical securities |
| | | |
| • | Level 2 – | other significant observable inputs (including quoted prices for similar securities, interest rates, prepayment speeds, credit risk, etc.) |
| | | |
| • | Level 3 – | significant unobservable inputs (including a Fund’s own assumptions in determining the fair value of investments) |
The inputs or methodology used for valuing securities are not necessarily an indication of the risk associated with investing in those securities.
The aggregate value by input level, as of September 30, 2016, for each Fund’s investments, as well as a reconciliation of assets for which significant unobservable inputs (Level 3) were used in determining value, if applicable, is included in the Fund’s Portfolio of Investments, which also includes a breakdown of the Fund’s investments by portfolio allocation. The Funds did not hold any Level 3 categorized securities during the year ended September 30, 2016.
| Notes to Financial Statements (Continued) | |
Changes in valuation techniques may result in transfers into or out of an investment’s assigned level within the hierarchy. All transfers in and out of the levels are recognized at the value at the end of the period. During the year ended September 30, 2016, there were no transfers between Levels 1, 2 and 3 for all Funds.
The Funds’ portfolio securities are valued as of the close of the regular session of trading on the New York Stock Exchange (“NYSE”) (currently 4:00 p.m., Eastern time). Portfolio securities traded on stock exchanges are valued at the last reported sale price, official close price, or last bid price if no sales are reported. Portfolio securities quoted by NASDAQ are valued at the NASDAQ Official Closing Price (“NOCP”) or from the primary exchange on which the security trades. To the extent these securities are actively traded, they are categorized in Level 1 of the fair value hierarchy. Shares of mutual funds in which the Funds invest are valued at their respective net asset values (“NAV”) as reported by the underlying funds and are categorized in Level 1.
Debt securities held by the Funds are valued at their evaluated bid by an independent pricing service or at their last broker-quoted bid prices as obtained from one or more of the major market makers for such securities. Independent pricing services use information provided by market makers or estimates of market values through accepted market modeling conventions. Observable inputs to the models may include prepayment speeds, pricing spread, yield, trade information, dealer quotes, market color, cash flow models, the securities’ terms and conditions, among others, and are generally categorized in Level 2. The High Yield Fund’s investment in bank loans are normally valued at the bid quotation obtained from dealers in loans by an independent pricing service in accordance with the Fund’s valuation policies and procedures approved by the Fund’s Board of Trustees (the “Board”) and are generally categorized in Level 2. Debt securities with remaining maturities of 60 days or less may be valued at amortized cost, provided such amount approximates market value and are categorized in Level 2. While this method provides consistency in valuation (and may only be used if it approximates market value), it may result in periods during which value, as determined by amortized cost, is higher or lower than the price that would be received if the Fund sold the investment.
Securities mainly traded on a non-U.S. exchange or denominated in foreign currencies are generally valued according to the preceding closing values on that exchange, translated to U.S. dollars using currency exchange rates as of the close of regular trading on the NYSE, and are generally categorized in Level 1. However, if an event that may change the value of a security occurs after the time that the closing value on the non-U.S. exchange was determined, but before the close of regular trading on the NYSE, the security may be priced based on fair value and generally categorized in Level 2. This may cause the value of the security, if held on the books of a Fund to be different from the closing value on the non-U.S. exchange and may affect the calculation of that Fund’s NAV.
The Funds may use fair value pricing under the following circumstances, among others:
| • | If the value of a security has been materially affected by events occurring before the Funds’ pricing time but after the close of the primary markets on which the security is traded. |
| | |
| • | If the exchange on which a portfolio security is principally traded closes early or if trading in a particular portfolio security was halted during the day and did not resume prior to the Funds’ NAV calculation. |
| | |
| • | If a security is so thinly traded that reliable market quotations are unavailable due to infrequent trading. |
| | |
| • | If the validity of market quotations is not reliable. |
Securities held by the Funds that do not have readily available market quotations, significant observable inputs, or securities for which the available market quotations are not reliable, are priced at their estimated fair value using procedures approved by the Funds’ Board and are generally categorized in Level 3.
Bank Loans — The High Yield Fund may invest in bank loans, which usually take the form of loan participations and assignments. Loan participations and assignments are agreements to make money available to U.S. or foreign
| | Notes to Financial Statements (Continued) |
corporations, partnerships or other business entities (the “Borrower”) in a specified amount, at a specified rate and within a specified time. A loan is typically originated, negotiated and structured by a U.S. or foreign bank, insurance company or other financial institution (the “Agent”) for a group of loan investors (“Loan Investors”). The Agent typically administers and enforces the loan on behalf of the other Loan Investors in the syndicate and may hold any collateral on behalf of the Loan Investors. Such loan participations and assignments are typically senior, secured and collateralized in nature. The Fund records an investment when the Borrower withdraws money and records interest as earned. These loans pay interest at rates which are periodically reset by reference to a base lending rate plus a spread. These base lending rates are generally the prime rate offered by a designated U.S. bank or London InterBank Offered Rate (“LIBOR”).
The loans in which the Fund invests may be subject to some restrictions on resale. For example, the Fund may be contractually obligated to receive approval from the Agent and/or Borrower prior to the sale of these investments. The Fund generally has no right to enforce compliance with the terms of the loan agreement with the Borrower. As a result, the Fund assumes the credit risk of the Borrower, the selling participant and any other persons interpositioned between the Fund and the Borrower (“Intermediate Participants”). In the event that the Borrower, selling participant or Intermediate Participants become insolvent or enter into bankruptcy, the Fund may incur certain costs and delays in realizing payment or may suffer a loss of principal and/or interest.
Unfunded commitments represent the remaining obligation of the Fund to the Borrower. At any point in time, up to the maturity date of the issue, the Borrower may demand the unfunded portion. Until demanded by the Borrower, unfunded commitments are not recognized as an asset on the Statement of Assets and Liabilities. Unrealized appreciation/depreciation on unfunded commitments presented on the Statement of Assets and Liabilities represents mark to market of the unfunded portion of the Fund’s bank loans. As of September 30, 2016, the Fund did not hold any unfunded loan commitments.
Investment companies — The Funds may invest in securities of other investment companies, including exchange-traded funds (“ETFs”), open-end funds and closed-end funds. Open-end funds are investment companies that issue new shares continuously and redeem shares daily. Closed-end funds are investment companies that typically issue a fixed number of shares that trade on a securities exchange or over-the-counter (“OTC”). An ETF is an investment company that typically seeks to track the performance of an index by holding in its portfolio shares of all the companies, or a representative sample of the companies, that are components of a particular index. ETF shares are traded on a securities exchange based on their market value. The risks of investment in other investment companies typically reflect the risks of the types of securities in which the other investment companies invest. Investments in ETFs and closed-end funds are subject to the additional risk that their shares may trade at a premium or discount to their NAV. When a Fund invests in another investment company, shareholders of the Fund indirectly bear their proportionate share of the other investment company’s fees and expenses, including operating, registration, trustee, licensing, and marketing, as well as their share of the Fund’s fees and expenses.
Futures Contracts — The Active Bond Fund may buy and sell futures contracts and related options to manage its exposure to changing interest rates and securities prices. Some strategies reduce the Fund’s exposure to price fluctuations, while others tend to increase its market exposure. Futures and options on futures can be volatile instruments and involve certain risks that could negatively impact the Fund’s return. In order to avoid leveraging and related risks, when the Fund purchases futures contracts, it will collateralize its position by depositing an amount of cash or liquid securities, equal to the market value of the futures positions held, less margin deposits, in a segregated account with its custodian or otherwise “cover” its position in a manner consistent with the 1940 Act, or the rules of the Securities and Exchange Commission (the “SEC”) or interpretations thereunder. Collateral equal to the current market value of the futures position will be marked to market on a daily basis.
| Notes to Financial Statements (Continued) | |
When the contract is closed, the Fund records a realized gain or loss equal to the difference between the proceeds from (or cost of) the closing transactions and the Fund’s basis in the contract. Risks of entering into futures contracts include the possibility that a change in the value of the contract may not correlate with the changes in the value of the underlying instruments. Second, it is possible that a lack of liquidity for futures contracts could exist in the secondary market resulting in an inability to close a futures position prior to its maturity date. Third, the purchase of a futures contract involves the risk that the Fund could lose more than the original margin deposit required to initiate the futures transaction. Finally, the risk exists that losses could exceed amounts disclosed on the Statements of Assets and Liabilities. There is minimal counterparty credit risk involved in entering into futures contracts since they are exchange-traded instruments and the exchange’s clearinghouse, as counterparty to all exchange-traded futures, guarantees the futures against default.
As of September 30, 2016, the Fund did not hold any futures contracts.
Swap Contracts — The Active Bond Fund may enter into swap transactions to help enhance the value of its portfolio or manage its exposure to different types of investments. Swaps are financial instruments that typically involve the exchange of cash flows between two parties on specified dates (settlement dates), where the cash flows are based on agreed-upon prices, rates, indexes, etc. The nominal amount on which the cash flows are calculated is called the notional amount. Swaps are individually negotiated and structured to include exposure to a variety of different types of investments or market factors, such as interest rates, foreign currency rates, mortgage securities, corporate borrowing rates, security prices, indexes or inflation rates.
Swap agreements may increase or decrease the overall volatility of the investments of the Fund and its share price. The performance of swap agreements may be affected by a change in the specific interest rate, currency, or other factors that determine the amounts of payments due to and from the Fund. If a swap agreement calls for payments by the Fund, the Fund must be prepared to make such payments when due. In addition, if the counterparty’s creditworthiness declines, the value of a swap agreement would be likely to decline, potentially resulting in losses.
Generally, bilateral swap agreements, (OTC) swaps have a fixed maturity date that will be agreed upon by the parties. The agreement can be terminated before the maturity date only under limited circumstances, such as default by one of the parties or insolvency, among others, and can be transferred by a party only with the prior written consent of the other party. The Fund may be able to eliminate its exposure under a swap agreement either by assignment or by other disposition, or by entering into an offsetting swap agreement with the same party or a similarly creditworthy party. If the counterparty is unable to meet its obligations under the contract, declares bankruptcy, defaults or becomes insolvent, the Fund may not be able to recover the money it expected to receive under the contract.
Cleared swaps are transacted through futures commission merchants that are members of central clearinghouses with the clearinghouses serving as a central counterparty. Pursuant to rules promulgated under the Dodd-Frank Act, central clearing of swap agreements is currently required for certain market participants trading certain instruments, and central clearing for additional instruments is expected to be implemented by regulators until the majority of the swaps market is ultimately subject to central clearing.
Swaps are marked-to-market daily based upon values received from third party vendors or quotations from market makers. For OTC swaps, any upfront premiums paid or received are recorded as assets or liabilities, respectively, and are shown as premium paid on swap agreements or premium received on swap agreements in the Statements of Assets and Liabilities. For swaps that are centrally cleared, initial margins, determined by each relevant clearing agency, are posted and are segregated at a broker account registered with the Commodity Futures Trading Commission (“CFTC”), or the applicable regulator. The change in value of swaps, including accruals of periodic amounts of interest to be paid or received on swaps, is recorded as unrealized appreciation or depreciation. Daily changes in the value of centrally cleared swaps are recorded in the Statements of Assets
| | Notes to Financial Statements (Continued) |
and Liabilities as receivable or payable for variation margin on swap agreements and settled daily. Upfront premiums and liquidation payments received or paid are recorded as realized gains or losses at the termination or maturity of the swap. Net periodic payments received or paid by the Fund are recorded as realized gain or loss.
A swap agreement can be a form of leverage, which can magnify the Fund’s gains or losses. In order to reduce the risk associated with leveraging, the Fund may cover its current obligations under swap agreements according to guidelines established by the SEC. If the Fund enters into a swap agreement on a net basis, it will segregate assets with a daily value at least equal to the excess, if any, of the Fund’s accrued obligations under the swap agreement over the accrued amount the Fund is entitled to receive under the agreement. If the Fund enters into a swap agreement on other than a net basis, it will segregate assets with a value equal to the full amount of the Fund’s accrued obligations under the agreement.
As of September 30, 2016, the Fund did not hold any swap contracts.
Foreign currency translation — The books and records of the Funds are maintained in U.S. dollars and translated into U.S. dollars on the following basis:
| (1) | market value of investment securities, assets and liabilities at the current rate of exchange on the valuation date; and |
| | |
| (2) | purchases and sales of investment securities, income, and expenses at the relevant rates of exchange prevailing on the respective dates of such transactions. |
The Funds do not isolate that portion of gains and losses on investments in equity securities that is due to changes in the foreign exchange rates from that which is due to changes in market prices of equity securities.
Real Estate Investment Trusts — The Funds may invest in real estate investment trusts (“REITs”) that involve risks not associated with investing in stocks. Risks include declines in the value of real estate, general and economic conditions, changes in the value of the underlying property and defaults by borrowers. The value of assets in the real estate industry may go through cycles of relative underperformance and outperformance in comparison to equity securities markets in general. Dividend income is recorded using management’s estimate of the income included in distributions received from REIT investments. The actual amounts of income, return of capital and capital gains are only determined by each REIT after its fiscal year-end and may differ from the estimated amount. Estimates of income are adjusted in the Funds to the actual amounts when the amounts are determined.
Derivative instruments and hedging activities — The Active Bond Fund may enter into an International Swaps and Derivatives Association, Inc. Master Agreement (“ISDA Master Agreement” or “MNA”) or similar agreement with certain counterparties. An ISDA Master Agreement is a bilateral agreement between the Fund and a counterparty that governs OTC derivatives and foreign exchange contracts, and typically contains, among other things, collateral posting terms and master netting provisions in the event of a default or termination. Under an ISDA Master Agreement, a party may, under certain circumstances, offset with the counterparty certain derivative financial instrument’s payables or receivables with collateral held or posted and create one single net payment. The provisions of the ISDA Master Agreement typically permit a single net payment in the event of default (close-out netting).These default events include bankruptcy or insolvency of the counterparty. Note, however, that bankruptcy or insolvency laws of a particular jurisdiction may impose restrictions on or prohibitions against the right of offset.
When entering into a derivative transaction, the Fund may be required to post and maintain collateral or margin (including both initial and maintenance margin). Collateral and margin requirements differ by type of derivative. Margin requirements are established by the broker or clearing house for exchange traded and centrally cleared
| Notes to Financial Statements (Continued) | |
derivatives (financial futures contracts, options, and centrally cleared swaps). Brokers can ask for margining in excess of the clearing house’s minimum in certain circumstances. Collateral terms are contract specific for OTC derivatives (foreign currency exchange contracts, options, and swaps). For derivatives traded under an ISDA Master Agreement, the collateral requirements are typically calculated by netting the marked-to-market amount for each transaction under such agreement and comparing that amount to the value of any collateral currently pledged by the Fund and the counterparty. For financial reporting purposes, cash collateral that has been pledged to cover obligations of the Fund and cash collateral received from the counterparty, if any, is reported separately on the Statement of Assets and Liabilities as cash pledged as collateral and cash received as collateral, respectively. Non-cash collateral pledged by the Fund, if any, is noted in the Portfolio of Investments. To the extent amounts due to the Fund from its counterparties are not fully collateralized, contractually or otherwise, the Fund bears the risk of loss from counterparty non-performance.
Certain ISDA Master Agreements allow counterparties to OTC derivatives transactions to terminate derivative contracts prior to maturity in the event the Fund’s net assets decline by a stated percentage or the Fund fails to meet the terms of its ISDA Master Agreement, which would cause the Fund (counterparty) to accelerate payment of any net liability owed to the counterparty (Fund).
For financial reporting purposes, the Active Bond Fund does not offset derivative assets and derivative liabilities that are subject to netting arrangements in the Statement of Assets and Liabilities.
The following table sets forth the effects of the Active Bond Fund’s derivative financial instruments by primary risk exposure on the Statement of Operations for the year ended September 30, 2016:
The Effect of Derivative Investments on the Statement of Operations
for the Year Ended September 30, 2016 |
| Fund | | Derivatives not accounted for as hedging
instruments under ASC 815 | | Realized Gain
(Loss)
on Derivatives | | Change in
Unrealized
Appreciation
(Depreciation)
on Derivatives |
| Active Bond Fund | | Futures - Interest Rate Contracts* | | $ | 229,662 | | | $ | — | |
| | | Swap Agreements - Credit Contracts** | | | 103,362 | | | | 148,981 | |
| * | Statement of Operations Location: Net realized gains on futures contracts. |
| | |
| ** | Statement of Operations Location: Net realized gains on swap agreements and net change in unrealized appreciation (depreciation) on swap agreements. |
For the year ended September 30, 2016, the average quarterly notional value of derivative financial instruments was as follows:
| | | Active | |
| | | Bond | |
| | | Fund | |
| Futures | | $ | — | * |
| Credit Default Swaps | | $ | 2,040,000 | |
| * | The Fund held no futures contracts at each quarter end. |
Portfolio securities loaned — The Funds may lend their portfolio securities. Lending portfolio securities exposes the Funds to the risk that the borrower may fail to return the loaned securities or may not be able to provide additional collateral or that the Funds may experience delays in recovery of the loaned securities or loss of rights in the collateral if the borrower fails financially. To minimize these risks, the borrower must agree to maintain cash collateral with the Funds’ custodian. The loaned securities are secured by collateral valued at least equal, at all times, to the market value of the loaned securities plus accrued interest, if any. When the collateral falls
| | Notes to Financial Statements (Continued) |
below specified amounts, the lending agent will use its best effort to obtain additional collateral on the next business day to meet required amounts under the security lending agreement. The cash collateral is reinvested by the Funds’ custodian into an approved investment vehicle. The approved investment vehicle is subject to market risk.
As of September 30, 2016, the following Funds loaned securities and received collateral as follows:
| Fund | | Security Type | | Market
Value of
Securities
Loaned* | | | Market
Value of
Collateral
Received** | | | Net Amount | |
| Active Bond Fund | | Corporate Bonds | | $ | 276,519 | | | $ | 287,724 | | | $ | 11,205 | |
| High Yield Fund | | Corporate Bonds | | | 775,516 | | | | 799,061 | | | | 23,545 | |
| * | The remaining contractual maturity is overnight for all securities. |
| ** | Gross amount of recognized liabilities for securities lending included in the Statements of Assets and Liabilities. |
All cash collateral is received, held, and administered by the Funds’ custodian for the benefit of the lending Fund in its custody account or other account established for the purpose of holding collateral.
Funds participating in securities lending receive compensation in the form of fees. Securities lending income is derived from lending long securities from the Funds to creditworthy approved borrowers at rates that are determined based on daily trading volumes, float, short-term interest rates and market liquidity. When a Fund lends securities, it retains the interest or dividends on the investment of any cash received as collateral, and the Fund continues to receive interest or dividends on the loaned securities.
Unrealized gain or loss on the market value of the loaned securities that may occur during the term of the loan is recognized by the Fund. The Fund has the right under the lending agreement to recover any loaned securities from the borrower on demand.
Share valuation — The NAV per share of each class of shares of each Fund is calculated daily by dividing the total value of a Fund’s assets attributable to that class, less liabilities attributable to that class, by the number of outstanding shares of that class.
The maximum offering price per share of Class A shares of the Funds is equal to the NAV per share plus a sales load equal to 4.99% of the NAV (or 4.75% of the offering price). There is no sales load on purchases of $1 million or more of Class A shares of the Funds. The maximum offering price per share of Classes C, Y and Institutional Class shares of the Funds is equal to the NAV per share.
The redemption price per share of each class of shares of the Funds is generally equal to the NAV per share. However, Class A redemptions that were part of a no-load $1 million subscription may be subject to a contingent deferred sales charge (“CDSC”) of up to 1.00% if redeemed within a one-year period from the date of purchase. Additionally, purchases of Class C shares of the Funds are subject to a CDSC of 1.00%. The CDSC will be assessed on an amount equal to the lesser of (1) the NAV at the time of purchase of the shares being redeemed or (2) the NAV of such shares being redeemed, if redeemed within a one-year period from the date of purchase.
Investment income — Interest income from securities is recorded on the basis of interest accrued, premium amortized and discount accreted. Realized gains and losses resulting from principal paydowns on mortgage-backed and asset-backed securities are included in interest income. Market discounts, original issue discount (“OID”) and market premiums on debt securities are accreted/amortized to interest income over the life of the security with a corresponding adjustment in the cost basis of that security. In addition, it is the Funds’ policy to accrue for foreign capital gains taxes, if applicable, on certain foreign securities held by the Funds. An estimated foreign capital gains tax is recorded daily on net unrealized gains on these securities and is payable upon the sale of such securities when a gain is realized.
| Notes to Financial Statements (Continued) | |
Distributions to shareholders — Each Fund intends to distribute to its shareholders substantially all of its income and capital gains. The Funds declare and distribute net investment income, if any, monthly, as a dividend to shareholders. Each Fund makes distributions of capital gains, if any, at least annually, net of applicable capital loss carryforwards. Income distributions and capital gain distributions are determined in accordance with income tax regulations. Recognition of the Funds’ net investment income from investments in underlying funds is affected by the timing of dividends declarations by the underlying funds.
Allocations — Investment income earned, realized capital gains and losses, and unrealized appreciation and depreciation for a Fund are allocated daily to each class of shares based upon its proportionate share of total net assets of the Fund. Class-specific expenses are charged directly to the class incurring the expense. Common expenses, which are not attributable to a specific class, are allocated daily to each class of shares based upon their proportionate share of total net assets of the Fund. Expenses not directly billed to a Fund are allocated proportionally among all the Funds in the Trust, and, if applicable, Touchstone Funds Group Trust, Touchstone Institutional Funds Trust, Touchstone Strategic Trust, Touchstone Tax-Free Trust, and Touchstone Variable Series Trust (collectively with the Trust, “Touchstone Fund Complex”), daily in relation to net assets of each Fund or another reasonable measure.
Security transactions — Security transactions are reflected for financial reporting purposes as of the trade date. Realized gains and losses on sales of portfolio securities are calculated using the identified cost basis.
Estimates — The preparation of financial statements in conformity with U.S. GAAP requires management to make estimates and assumptions that affect the reported amounts of assets and liabilities and disclosure of contingent assets and liabilities at the date of the financial statements and the reported amounts of income and expenses during the reporting period. Actual results could differ from those estimates.
3. Investment Transactions
Investment transactions (excluding short-term investments and U.S. Government securities) were as follows for the year ended September 30, 2016:
| | | Active Bond | | | High Yield | |
| | | Fund | | | Fund | |
| Purchases of investment securities | | $ | 34,248,098 | | | $ | 113,538,736 | |
| Proceeds from sales and maturities | | $ | 25,814,439 | | | $ | 136,298,260 | |
For the year ended September 30, 2016, purchases and proceeds from sales and maturities in U.S. Government securities were $564,559,684 and $559,681,204, respectively, for the Active Bond Fund. There were no purchases or proceeds from sales and maturities of U.S. Government securities by the High Yield Fund for the year ended September 30, 2016.
4. Transactions with Affiliates and Other Related Parties
Certain officers of the Trust are also officers of Touchstone Advisors, Inc. (the “Advisor”),Touchstone Securities, Inc. (the “Underwriter” and “Distributor”), or BNY Mellon Investment Servicing (U.S.) Inc. (“BNY Mellon”), the Sub-Administrator and Transfer Agent to the Funds. Such officers receive no compensation from the Trust. The Advisor and the Underwriter are each wholly-owned, indirect subsidiaries of Western & Southern Financial Group, Inc. (“Western & Southern”).
On behalf of the Funds, the Advisor pays each Independent Trustee a quarterly retainer plus additional retainers to the Lead Independent Trustee and the chairs of each standing committee. Interested Trustees do not receive compensation from the Funds. Each Independent Trustee also receives compensation for each board meeting and committee meeting attended. Each standing committee chair receives additional compensation for each
| | Notes to Financial Statements (Continued) |
committee meeting that he or she oversees. The Advisor is reimbursed by the Funds for the Independent Trustees’ compensation and out-of-pocket expenses relating to their services. The Funds accrued Trustee-related expenses of $32,578 for the year ended September 30, 2016.
MANAGEMENT & EXPENSE LIMITATION AGREEMENTS
The Advisor provides general investment supervisory services for the Funds, under the terms of an advisory agreement (the “Advisory Agreement”). Under the Advisory Agreement, each Fund pays the Advisor a fee, which is computed and accrued daily and paid monthly, at an annual rate based on average daily net assets of each fund as shown in the table below.
| Active Bond Fund | 0.40% on the first $300 million |
| | 0.35% on such assets in excess of $300 million |
| High Yield Fund | 0.60% on the first $50 million |
| | 0.50% on the next $250 million |
| | 0.45% on such assets in excess of $300 million |
The Advisor has entered into investment sub-advisory agreements with Fort Washington Investment Advisors, Inc. (the “Sub-Advisor”), an affiliate of the Advisor. The Sub-Advisor is a wholly-owned, indirect subsidiary of Western & Southern. The Advisor, not the Funds, pays sub-advisory fees to the Sub-Advisor.
The Advisor entered into an expense limitation agreement (the “Expense Limitation Agreement”) to contractually limit the annual operating expenses of the Funds, excluding: dividend and interest expenses relating to short sales; interest; taxes; brokerage commissions and other transaction costs; portfolio transactions and investment related expenses; other expenditures which are capitalized in accordance with U.S. GAAP; the cost of “Acquired Fund Fees and Expenses”, if any; and other extraordinary expenses not incurred in the ordinary course of business. The maximum annual operating expense limit in any year with respect to the Funds is based on a percentage of the average daily net assets of the Funds. The Advisor has agreed to separately waive class-level expenses, advisory fees and administration fees, and to reimburse expenses in order to maintain the following expense limitations for the Funds:
| Fund | Class A | Class C | Class Y | Institutional
Class |
| Active Bond Fund | 0.90% | 1.65% | 0.65% | 0.57% |
| High Yield Fund | 1.05% | 1.80% | 0.80% | 0.72% |
These expense limitations will remain in effect for all Funds through at least January 29, 2017, but can be terminated by a vote of the Board if it deems the termination to be beneficial to the Funds’ shareholders.
During the year ended September 30, 2016, the Advisor or its affiliates waived investment advisory fees and administration fees or reimbursed expenses, including distribution fees of the Funds as follows:
| Fund | | Investment
Advisory
Fees Waived | | | Administration
Fees
Waived | | | Other
Operating
Expenses
Reimbursed/
Waived | | | Total | |
| Active Bond Fund | | $ | 7,585 | | | $ | 151,294 | | | $ | 133,825 | | | $ | 292,704 | |
| High Yield Fund | | | — | | | | 46,532 | | | | 163,019 | | | | 209,551 | |
Under the terms of the Expense Limitation Agreement, the Advisor is entitled to recover, subject to approval by the Funds’ Board, such amounts waived or reimbursed for a period of up to three years from the year in which the Advisor reduced its compensation or assumed expenses for the Funds. No recoupment will occur unless a Fund’s operating expenses are below the expense limitation amount in effect at the time of the waiver or reimbursement.
| Notes to Financial Statements (Continued) | |
As of September 30, 2016, the Advisor may seek recoupment of previously waived fees and reimbursed expenses as follows:
| Fund | | Expiration
September 30,
2017 | | | Expiration
September 30,
2018 | | | Expiration
September 30,
2019 | | | Total | |
| Active Bond Fund | | $ | 351,146 | | | $ | 248,771 | | | $ | 236,361 | | | $ | 836,278 | |
| High Yield Fund | | | 159,641 | | | | 125,918 | | | | 149,452 | | | | 435,011 | |
The Advisor did not recoup any amounts it previously waived or reimbursed during the year ended September 30, 2016.
ADMINISTRATION AGREEMENT
The Advisor entered into an Administration Agreement with the Trust, whereby the Advisor is responsible for: supplying executive and regulatory compliance services; supervising the preparation of tax returns; coordinating the preparation of reports to shareholders and reports to, and filings with the SEC and state securities authorities, as well as materials for meetings of the Board; calculating the daily NAV per share; and maintaining the financial books and records of each Fund.
For its services, the Advisor’s annual administrative fee is:
0.145% on the first $20 billion of the aggregate average daily net assets;
0.11% on the next $10 billion of aggregate average daily net assets;
0.09% on the next $10 billion of aggregate average daily net assets; and
0.07% on the aggregate average daily net assets over $40 billion.
The fee is computed and allocated among the Touchstone Fund Complex (excluding Touchstone Institutional Funds Trust) on the basis of relative daily net assets.
The Advisor has engaged BNY Mellon as the Sub-Administrator to the Trust. BNY Mellon provides administrative and accounting services to the Trust and is compensated directly by the Advisor, not the Trust.
TRANSFER AGENT AGREEMENT
Under the terms of the Transfer Agent Agreement between the Trust and BNY Mellon, BNY Mellon maintains the records of each shareholder’s account, answers shareholders’ inquiries concerning their accounts, processes purchases and redemptions of each Fund’s shares, acts as dividend and distribution disbursing agent, and performs other shareholder service functions. For these services, BNY Mellon receives a monthly fee from each Fund. In addition, each Fund pays out-of-pocket expenses incurred by BNY Mellon, including, but not limited to, postage and supplies.
The Funds may reimburse the Advisor for fees paid to intermediaries such as banks, broker-dealers, financial advisors or other financial institutions for sub-transfer agency, sub-administration and other services provided to investors whose shares of record are held in omnibus, other group accounts, retirement plans or accounts traded through registered securities clearing agents. These fees may vary based on, for example, the nature of services provided, but generally range up to 0.15% of the assets of the class serviced or maintained by the intermediary or up to $22 per sub-account maintained by the intermediary.
PLANS OF DISTRIBUTION AND SHAREHOLDER SERVICING FEE ARANGEMENTS
The Trust has adopted distribution plans pursuant to Rule 12b-1 under the 1940 Act for each class of shares it offers that are subject to 12b-1 distribution fees. The plans allow each Fund to pay distribution and other
| | Notes to Financial Statements (Continued) |
fees for the sale and distribution of its shares and for services provided to shareholders. The fees charged to the Funds are limited to the actual expenses incurred. Under the Class A plan, each Fund offering Class A shares pays an annual fee of up to 0.35% of average daily net assets that are attributable to Class A shares. The Funds currently limit the 12b-1 fees for Class A shares to 0.25% of average daily net assets attributable to such shares. Under the Class C plan, each Fund offering Class C shares pays an annual fee of up to 1.00% of average daily net assets that are attributable to Class C shares (of which up to 0.75% is a distribution fee and up to 0.25% is a shareholder servicing fee).
UNDERWRITING AGREEMENT
The Underwriter is the Funds’ principal underwriter and, as such, acts as exclusive agent for distribution of the Funds’ shares. Under the terms of the Underwriting Agreement between the Trust and Underwriter, the Underwriter earned underwriting and broker commissions on the sale of Class A shares of the Funds. W&S Brokerage Services, Inc., an affiliate of the Underwriter and the Advisor, also earned broker commissions on the sale of Class A shares of the funds. Listed below are the total underwriting and broker commissions earned by the Underwriter and its affiliates during the year ended September 30, 2016:
| Fund | | Amount | |
| Active Bond Fund | | $ | 9,336 | |
| High Yield Fund | | | 7,972 | |
In addition, the Underwriter collected CDSC on the redemption of Class A and C shares of the Funds listed below during the year ended September 30, 2016:
| Fund | | Class A | | | Class C | |
| Active Bond Fund | | $ | 504 | | | $ | 1,030 | |
| High Yield Fund | | | — | | | | 84 | |
INTERFUND TRANSACTIONS
The Funds may engage in purchase and sale transactions with funds that have a common investment advisor (or affiliated investment advisors), common Trustees and/or common Officers. During the year ended September 30, 2016, the Funds did not engage in any Rule 17a-7 transactions under the 1940 Act.
5. Federal Tax Information
Federal income tax — It is each Fund’s policy to continue to comply with the special provisions of the Internal Revenue Code applicable to regulated investment companies. As provided therein, in any fiscal year in which a Fund so qualifies and distributes at least 90% of its investment company taxable income, the Fund (but not the shareholders) will be relieved of federal income tax on the income distributed. It is each Fund’s policy to distribute all of its taxable income and accordingly, no provision for income taxes has been made.
In order to avoid imposition of the excise tax applicable to regulated investment companies, it is also each Fund’s intention to declare and pay as dividends in each calendar year at least 98% of its investment company taxable income (earned during the calendar year) and 98.2% of its net realized capital gains (earned during the twelve months ending October 31) plus undistributed amounts from prior years.
The tax character of distributions paid for the years ended September 30, 2016 and 2015 are as follows:
| | | Active Bond Fund | | | High Yield Fund | |
| | | 2016 | | | 2015 | | | 2016 | | | 2015 | |
| From ordinary income | | $ | 3,155,993 | | | $ | 2,930,894 | | | $ | 10,884,011 | | | $ | 13,497,632 | |
| From long-term capital gains | | | — | | | | — | | | | — | | | | 4,386,314 | |
| Total distributions | | $ | 3,155,993 | | | $ | 2,930,894 | | | $ | 10,884,011 | | | $ | 17,883,946 | |
| Notes to Financial Statements (Continued) | |
The following information is computed on a tax basis for each item as of September 30, 2016:
| | | Active Bond
Fund | | High Yield
Fund | |
| Tax cost of portfolio investments | | $ | 111,148,368 | | | $ | 222,160,075 | |
| Gross unrealized appreciation | | | 4,159,340 | | | | 7,100,353 | |
| Gross unrealized depreciation | | | (594,426 | ) | | | (2,917,618 | ) |
| Net unrealized appreciation (depreciation) on investments | | | 3,564,914 | | | | 4,182,735 | |
| Post-October and Qualified Late-Year Losses | | | (12,746 | ) | | | — | |
| Capital loss carryforwards | | | (8,427,960 | ) | | | (21,648,738 | ) |
| Undistributed ordinary income | | | 100,282 | | | | 272,401 | |
| Other temporary differences | | | (46,410 | ) | | | — | |
| Accumulated earnings (deficit) | | $ | (4,821,920 | ) | | $ | (17,193,602 | ) |
The difference between the tax cost of portfolio investments and the financial statement cost is primarily due to certain timing differences in the recognition of capital losses under income tax regulations and U.S. GAAP.
As of September 30, 2016, the Funds had the following capital loss carryforwards for federal income tax purposes:
| | | | | | No
Expiration | | No
Expiration | | | |
| | | Short Term Expiring In | | Short | | Long | | | |
| Fund | | 2017 | | Term* | | Term* | | Total |
| Active Bond Fund | | $ | 8,427,960 | | | $ | — | | | $ | — | | | $ | 8,427,960 | |
| High Yield Fund | | | — | | | | 1,705,494 | | | | 19,943,244 | | | | 21,648,738 | |
* The Regulated Investment Company Modernization Act of 2010 (the “Act”) was enacted on December 22, 2010. The Act made changes to several tax rules impacting the Funds. The provisions of the Act first became effective for the Funds’ fiscal year ended September 30, 2012 and are applicable to all subsequent fiscal years. Although the Act provides several benefits, including the unlimited carryover of future capital losses, there may be a greater likelihood that all or a portion of each Fund’s pre-enactment capital loss carryovers may expire without being utilized due to the fact that post-enactment capital losses must be utilized before pre-enactment capital loss carryovers may be utilized. Under the Act, new capital losses may now be carried forward indefinitely, and retain the character of the original loss as compared with pre-enactment law, where capital losses could be carried forward for up to eight years, and carried forward as short-term capital losses, irrespective of the character of the original loss.
The capital loss carryforwards may be utilized in future years to offset net realized capital gains, if any, prior to distributing such gains to shareholders.
For the year ended September 30, 2016, the Active Bond Fund utilized $48,252 of the capital loss carryforwards and had $37,067,095 of capital loss carryforwards expiring in the current year.
The Funds have analyzed their tax positions taken on federal income tax returns for all open tax years (tax years ended September 30, 2013 through 2016) and have concluded that no provision for income tax is required in their financial statements.
Certain reclassifications, the result of permanent differences between financial statements and income tax reporting requirements, have been made to the components of capital. These reclassifications have no impact on the net assets or NAV per share of the Funds. The following reclassifications, which are primarily attributed to the paydown gains/losses on mortgage backed securities, swap premium paid, expiration of prior year capital loss carryforwards, gains/losses on real estate investment trusts,TIPs (Treasury Inflation Protected Securities) income adjustments, have been made to the following Funds for the year ended September 30, 2016:
| | | Paid-In
Capital | | Accumulated
Net Investment
Income(Loss) | | Accumulated
Net Realized
Gains(Losses) |
| Active Bond Fund | | $ | (37,066,989 | ) | | $ | 250,878 | | | $ | 36,816,111 | |
| | Notes to Financial Statements (Continued) |
| | | Paid-In
Capital | | Accumulated
Net Investment
Income(Loss) | | Accumulated
Net Realized
Gains(Losses) |
| High Yield Fund | | | — | | | | 62,218 | | | | (62,218 | ) |
6. Commitments and Contingencies
The Funds indemnify the Trust’s officers and Trustees for certain liabilities that might arise from their performance of their duties to the Funds. Additionally, in the normal course of business, the Funds enter into contracts that contain a variety of representations and warranties and which provide general indemnifications. The Funds’ maximum exposure under these arrangements is unknown, as this would involve future claims that may be made against the Funds.
7. Principal Risks
Risks Associated with Concentration — The Funds may invest a high percentage of their assets in specific sectors of the market in order to achieve a potentially greater investment return. As a result, the Funds may be more susceptible to economic, political, and regulatory developments in a particular sector of the market, positive or negative, and may experience increased volatility on the Funds’ NAVs and magnified effect on the total return.
Risks Associated with Credit — An issuer may be unable to make timely payments of either principal or interest. This may cause the issuer’s securities to decline in value. Credit risk is particularly relevant to those Funds that invest a significant amount of their assets in junk bonds or lower-rated securities
Risks Associated with Interest Rate Changes — As interest rates rise, the value of fixed-income securities a Fund owns will likely decrease. The price of debt securities is generally linked to the prevailing market interest rates. In general, when interest rates rise, the price of debt securities falls, and when interest rates fall, the price of debt securities rises. The price volatility of a debt security also depends on its maturity. Longer-term securities are generally more volatile, so the longer the average maturity or duration of these securities, the greater their price risk. Duration is a measure of the expected life, taking into account any prepayment or call features of the security, that is used to determine the price sensitivity of the security for a given change in interest rates. Specifically, duration is the change in the value of a fixed-income security that will result from a 1% change in interest rates, and generally is stated in years. For example, as a general rule a 1% rise in interest rates means a 1% fall in value for every year of duration. Maturity, on the other hand, is the date on which a fixed-income security becomes due for payment of principal. The negative impact on fixed income securities if interest rates increase as a result could negatively impact a Fund’s NAV.
Risks Associated with Liquidity — Liquidity risk exists when particular investments are difficult to purchase or sell. This can reduce a Fund’s returns because a Fund may be unable to transact at advantageous times or prices, or at all.
Please see the Funds’ prospectus for complete discussion of these and other risks.
8. Subsequent Events
Subsequent events occurring after the date of this report have been evaluated for potential impact to this report through the date the financial statements were issued. There were no subsequent events that necessitated recognition or disclosure on the Funds’ financial statements.
| Report of Independent Registered Public Accounting Firm | |
To the Board of Trustees and Shareholders of Touchstone Investment Trust
We have audited the accompanying statements of assets and liabilities, including the portfolios of investments, of Touchstone Investment Trust (comprising, respectively, the Touchstone Active Bond and Touchstone High Yield Fund) (the “Funds”) as of September 30, 2016, and the related statements of operations for the year then ended, the statements of changes in net assets for each of the two years in the period then ended and the financial highlights for each of the years or periods indicated therein. These financial statements and financial highlights are the responsibility of the Funds’ management. Our responsibility is to express an opinion on these financial statements and financial highlights based on our audits.
We conducted our audits in accordance with the standards of the Public Company Accounting Oversight Board (United States). Those standards require that we plan and perform the audits to obtain reasonable assurance about whether the financial statements and financial highlights are free of material misstatement. We were not engaged to perform an audit of the Funds’ internal control over financial reporting. Our audits included consideration of internal control over financial reporting as a basis for designing audit procedures that are appropriate in the circumstances, but not for the purpose of expressing an opinion on the effectiveness of the Funds’ internal control over financial reporting. Accordingly, we express no such opinion. An audit also includes examining, on a test basis, evidence supporting the amounts and disclosures in the financial statements and financial highlights, assessing the accounting principles used and significant estimates made by management, and evaluating the overall financial statement presentation. Our procedures included confirmation of securities owned as of September 30, 2016, by correspondence with the custodian, brokers and others or by other appropriate auditing procedures where replies from brokers, or others were not received. We believe that our audits provide a reasonable basis for our opinion.
In our opinion, the financial statements and financial highlights referred to above present fairly, in all material respects, the financial position of each of the respective funds constituting Touchstone Investment Trust at September 30, 2016, the results of their operations for the year then ended, the changes in their net assets for each of the two years in the period then ended and the financial highlights for each of the years or periods indicated therein, in conformity with U.S. generally accepted accounting principles.

Cincinnati, Ohio
November 18, 2016
Qualified Dividend Income
Under the Jobs and Growth Tax Relief Reconciliation Act of 2003 (the “Act”), the following percentages of ordinary dividends paid during the fiscal year ended September 30, 2016 are designated as “qualified dividend income,” as defined in the Act, and are subject to reduced tax rates in 2016. The Fund intends to pass through the maximum allowable percentage for Form 1099Div.
Dividends Received Deduction
For corporate shareholders, the following ordinary distributions paid during the current fiscal year ended September 30, 2016 qualify for the corporate dividends received deduction. The Fund intends to pass through the maximum allowable percentage.
Proxy Voting Guidelines and Proxy Voting Records
The Sub-Advisor is responsible for exercising the voting rights associated with the securities purchased and held by the Funds. A description of the policies and procedures that the Sub-Advisor uses in fulfilling this responsibility is available as an appendix to the most recent Statement of Additional Information, which can be obtained without charge by calling toll free 1.800.543.0407 or by visiting the Touchstone website at TouchstoneInvestments.com or on the Securities and Exchange Commission’s (the “Commission”) website sec.gov. Information regarding how those proxies were voted during the most recent twelve-month period ended June 30 is also available without charge by calling toll free 1.800.543.0407 or on the Commission’s website at sec.gov.
Quarterly Portfolio Disclosure
The Trust files a complete listing of portfolio holdings for each Fund as of the end of the first and third quarters of each fiscal year on Form N-Q. The complete listing (i) is available on the Commission’s website; (ii) may be reviewed and copied at the Commission’s Public Reference Room in Washington, DC; or (iii) will be made available to shareholders upon request by calling 1.800.543.0407. Information on the operation of the Public Reference Room may be obtained by calling 1.800.SEC.0330.
Schedule of Shareholder Expenses
As a shareholder of the Funds, you incur two types of costs: (1) transaction costs, including reinvested dividends or other distributions; and (2) ongoing costs, including investment advisory fees, distribution (12b-1) fees, and other Fund expenses. This example is intended to help you understand your ongoing costs (in dollars) of investing in the Funds and to compare these costs with the ongoing costs of investing in other mutual funds. The example is based on an investment of $1,000 invested at the beginning of the period and held for the entire period April 1, 2016 through September 30, 2016.
Actual Expenses
The first line of the table below for each share class of a Fund provides information about actual account values and actual expenses. You may use the information in this line, together with the amount you invested, to estimate the expenses that you paid over the period. Simply divide your account value by $1,000 (for example, an $8,600 account value divided by $1,000 = 8.6), then multiply the result by the number in the first line under the heading entitled “Expenses Paid During the six months ended September 30, 2016” to estimate the expenses you paid on your account during this period.
| Other Items (Unaudited) (Continued) | |
Hypothetical Example for Comparison Purposes
The second line of the table below for each share class of a Fund provides information about hypothetical account values and hypothetical expenses based on the Funds’ actual expense ratio and an assumed rate of return of 5% per year before expenses, which is not the Funds’ actual return. The hypothetical account values and expenses may not be used to estimate the actual ending account balance or expenses you paid for the period. You may use this information to compare the ongoing costs of investing in the Funds and other funds. To do so, compare this 5% hypothetical example with the 5% hypothetical examples that appear in the shareholder reports of the other funds.
Please note that the expenses shown in the table below are meant to highlight your ongoing costs only and do not reflect any transactional costs, such as sales charges (loads), redemption fees, or exchange fees. Therefore, the second line of the table below for each share class of a Fund is useful in comparing ongoing costs only, and will not help you determine the relative total costs of owning different funds. In addition, if these transactional costs were included, your costs would have been higher.
| | | | | Net Expense
Ratio
Annualized
September 30,
2016 | | Beginning
Account
Value
April 1,
2016 | | Ending
Account
Value
September 30,
2016 | | Expenses
Paid During
the Six Months
Ended
September 30,
2016* |
| Touchstone Active Bond | | | | | | | | | | | | | | |
| Fund | | | | | | | | | | | | | | |
| Class A | | Actual | | | 0.90 | % | | $ | 1,000.00 | | | $ | 1,039.90 | | | $ | 4.59 | |
| Class A | | Hypothetical | | | 0.90 | % | | $ | 1,000.00 | | | $ | 1,020.50 | | | $ | 4.55 | |
| | | | | | | | | | | | | | | | | | | |
| Class C | | Actual | | | 1.65 | % | | $ | 1,000.00 | | | $ | 1,036.10 | | | $ | 8.40 | |
| Class C | | Hypothetical | | | 1.65 | % | | $ | 1,000.00 | | | $ | 1,016.75 | | | $ | 8.32 | |
| | | | | | | | | | | | | | | | | | | |
| Class Y | | Actual | | | 0.65 | % | | $ | 1,000.00 | | | $ | 1,042.20 | | | $ | 3.32 | |
| Class Y | | Hypothetical | | | 0.65 | % | | $ | 1,000.00 | | | $ | 1,021.75 | | | $ | 3.29 | |
| | | | | | | | | | | | | | | | | | | |
| Institutional Class | | Actual | | | 0.57 | % | | $ | 1,000.00 | | | $ | 1,041.70 | | | $ | 2.91 | |
| Institutional Class | | Hypothetical | | | 0.57 | % | | $ | 1,000.00 | | | $ | 1,022.15 | | | $ | 2.88 | |
| | | | | | | | | | | | | | | | | | | |
| Touchstone High Yield | | | | | | | | | | | | | | | | | | |
| Fund | | | | | | | | | | | | | | | | | | |
| Class A | | Actual | | | 1.05 | % | | $ | 1,000.00 | | | $ | 1,086.40 | | | $ | 5.48 | |
| Class A | | Hypothetical | | | 1.05 | % | | $ | 1,000.00 | | | $ | 1,019.75 | | | $ | 5.30 | |
| | | | | | | | | | | | | | | | | | | |
| Class C | | Actual | | | 1.80 | % | | $ | 1,000.00 | | | $ | 1,082.60 | | | $ | 9.37 | |
| Class C | | Hypothetical | | | 1.80 | % | | $ | 1,000.00 | | | $ | 1,016.00 | | | $ | 9.07 | |
| | | | | | | | | | | | | | | | | | | |
| Class Y | | Actual | | | 0.80 | % | | $ | 1,000.00 | | | $ | 1,088.30 | | | $ | 4.18 | |
| Class Y | | Hypothetical | | | 0.80 | % | | $ | 1,000.00 | | | $ | 1,021.00 | | | $ | 4.04 | |
| | | | | | | | | | | | | | | | | | | |
| Institutional Class | | Actual | | | 0.72 | % | | $ | 1,000.00 | | | $ | 1,088.70 | | | $ | 3.76 | |
| Institutional Class | | Hypothetical | | | 0.72 | % | | $ | 1,000.00 | | | $ | 1,021.40 | | | $ | 3.64 | |
* Expenses are equal to the Fund’s annualized expense ratio, multiplied by the average account value over the period, multiplied by 183/366 (to reflect one-half year period).
| | Management of the Trust (Unaudited) |
Listed below is required information regarding the Trustees and principal officers of the Trust. The Trust’s Statement of Additional Information includes additional information about the Trustees and is available, without charge, upon request by calling 1.800.543.0407 or by visiting the Touchstone website at TouchstoneInvestments.com.
| Interested Trustee1 : |
Name
Address
Age | | Position(s)
Held with
Trust | | Term of
Office And
Length of
Time Served | | Principal Occupation(s)
During Past 5 Years | | Number
of Funds
Overseen
in the
Touchstone
Fund
Complex2 | | Other
Directorships
Held During the Past 5 Years3 |
Jill T. McGruder
Touchstone Advisors, Inc.
303 Broadway
Suite 1100
Cincinnati, OH 45202
Year of Birth: 1955 | | Trustee and President | | Until retirement at age 75 or until she resigns or is removed Trustee since 1999 | | President and CEO of IFS Financial Services, Inc. (a holding company). | | 41 | | Director of LaRosa’s, Inc. (a restaurant chain) from 1999 to 2011; IFS Financial Services, Inc. (a holding company) from 1999 to the present; Integrity and National Integrity Life Insurance Co. from 2005 to the present; Touchstone Securities (the Trust’s distributor) from 1999 to the present; Touchstone Advisors (the Trust’s investment advisor and administrator) from 1999 to the present; W&S Brokerage Services (a brokerage company) from 1999 to the present; W&S Financial Group Distributors (a distribution company) from 1999 to the present; Every Child Succeeds (a social services agency) from 2007 to the present; Taft Museum of Art from 2007 to the present; and YWCA of Greater Cincinnati from 2012 to the present. |
| Independent Trustees: |
Phillip R. Cox
c/o Touchstone Advisors, Inc.
303 Broadway
Suite 1100
Cincinnati, OH 45202
Year of Birth: 1947 | | Trustee | | Until retirement at age 75 or until he resigns or is removed Trustee since 1999 | | President and Chief Executive Officer of Cox Financial Corp. (a financial services company) from 1971 to the present. | | 41 | | Director of Cincinnati Bell (a communications company) from 1994 to the present; Bethesda Inc. (a hospital) from 2005 to the present; Timken Co. (a manufacturing company) from 2004 to 2014; TimkenSteel from 2014 to the present; Diebold, Inc. (a technology solutions company) from 2004 to the present; and Ohio Business Alliance for Higher Education and the Economy from 2005 to the present. |
William C. Gale
c/o Touchstone Advisors, Inc.
303 Broadway Suite 1100
Cincinnati, OH 45202
Year of Birth: 1952 | | Trustee | | Until retirement at age 75 or until he resigns or is removed Trustee since 2013 | | Retired; formerly Senior Vice President and Chief Financial Officer (from 2003 to January 2015) of Cintas Corporation (a business services company). | | 41 | | None. |
| Management of the Trust (Unaudited) (Continued) | |
| Independent Trustees (Continued): |
Name
Address
Age | | Position(s)
Held with
Trust | | Term of
Office And
Length of
Time Served | | Principal Occupation(s)
During Past 5 Years | | Number
of Funds
Overseen
in the
Touchstone
Fund
Complex2 | | Other
Directorships
Held During the Past 5 Years3 |
Susan J. Hickenlooper
c/o Touchstone Advisors, Inc.
303 Broadway
Suite 1100
Cincinnati, OH 45202
Year of Birth: 1946 | | Trustee | | Until retirement at age 75 or until she resigns or is removed Trustee since 2009 | | Retired; formerly Financial Analyst for Impact 100 (charitable organization) from November 2012 to 2013. | | 41 | | Trustee of Diocese of Southern Ohio from 2014 to the present; and Trustee of Episcopal Retirement Homes Foundation from 1998 to 2011 (a charitable organization). |
Kevin A. Robie
c/o Touchstone Advisors, Inc.
303 Broadway Suite 1100
Cincinnati, OH 45202
Year of Birth: 1956 | | Trustee | | Until retirement at age 75 or until he resigns or is removed Trustee since 2013 | | Vice President of Portfolio Management at Soin International LLC (a private multinational holding company) from 2004 to the present. | | 41 | | Director of Buckeye EcoCare, Inc. (a lawn care company) from 2013 to the present; Trustee of Dayton Region New Market Fund, LLC (a private fund) from 2010 to the present; Trustee of the Entrepreneurs Center, Inc. (a small business incubator) from 2006 to the present; and Director of Interventional Imaging, Inc. (a medical device company) from 2004 to 2011. |
Edward J. VonderBrink
c/o Touchstone Advisors, Inc.
303 Broadway
Suite 1100
Cincinnati, OH 45202
Year of Birth: 1944 | | Trustee | | Until retirement at age 75 or until he resigns or is removed Trustee since 2013 | | Consultant, VonderBrink Consulting LLC from 2000 to the present. | | 41 | | Director of Streamline Health Solutions, Inc. (healthcare IT) from 2006 to 2015; Mercy Health from 2013 to the present; Mercy Health Foundation (healthcare nonprofit) from 2008 to the present; Al Neyer Inc. (a construction company) from 2013 to the present; and BASCO Shower Door from 2011 to the present. |
| 1 | Ms. McGruder, as a director of the Advisor and the Trust’s Distributor, and an officer of affiliates of the Advisor and the Trust’s Distributor, is an “interested person” of the Trust within the meaning of Section 2(a)(19) of the 1940 Act. |
| 2 | As of September 30, 2016, the Touchstone Fund Complex consists of 2 series of the Trust, 11 series of Touchstone Funds Group Trust, 1 series of Touchstone Institutional Funds Trust, 20 series of Touchstone Strategic Trust, 1 series of Touchstone Tax-Free Trust, and 6 variable annuity series of Touchstone Variable Series Trust. |
| 3 | Each Trustee is also a Trustee of Touchstone Funds Group Trust, Touchstone Institutional Funds Trust, Touchstone Strategic Trust, Touchstone Tax-Free Trust, and Touchstone Variable Series Trust. |
| | Management of the Trust (Unaudited) (Continued) |
The following is a list of the Principal Officers of the Trusts, the length of time served, and principal occupations for the past five years.
| Principal Officers: |
Name
Address
Age | | Position(s)
Held with
Trust1 | | Term of
Office And
Length of
Time Served | | Principal Occupation(s)
During the Past 5 Years |
Jill T. McGruder
Touchstone Advisors, Inc.
303 Broadway
Suite 1100
Cincinnati, OH 45202
Year of Birth: 1955 | | President and Trustee | | Until resignation, removal or disqualification President since 2006 | | See biography above. |
Steven M. Graziano
Touchstone Advisors, Inc.
303 Broadway
Suite 1100
Cincinnati, OH 45202
Year of Birth: 1954 | | Vice President | | Until resignation, removal or disqualification Vice President since 2009 | | President of Touchstone Advisors, Inc. |
Timothy D. Paulin
Touchstone Advisors, Inc.
303 Broadway
Suite 1100
Cincinnati, OH 45202
Year of Birth: 1963 | | Vice President | | Until resignation, removal or disqualification Vice President since 2010 | | Senior Vice President of Investment Research and Product Management of Touchstone Advisors, Inc. |
Timothy S. Stearns
Touchstone Advisors, Inc.
303 Broadway
Suite 1100
Cincinnati, OH 45202
Year of Birth: 1963 | | Chief Compliance Officer | | Until resignation, removal or disqualification Chief Compliance Officer since 2013 | | Chief Compliance Officer of Touchstone Advisors, Inc.; Chief Compliance Officer of Envestnet Asset Management, Inc. (2009 to 2013). |
Terrie A. Wiedenheft
Touchstone Advisors, Inc.
303 Broadway
Suite 1100
Cincinnati, OH 45202
Year of Birth: 1962 | | Controller and Treasurer | | Until resignation, removal or disqualification Controller and Treasurer since 2006 | | Senior Vice President, Chief Financial Officer and Chief Operations Officer, of IFS Financial Services, Inc. (a holding company). |
Ellen Blanchard
BNY Mellon
201 Washington St, 34th Fl.
Boston, MA 02108
Year of Birth: 1973 | | Secretary | | Until resignation, removal or disqualification Secretary since 2015 | | Director and Senior Counsel of BNY Mellon Investment Servicing (US) Inc. |
| 1 | Each officer also holds the same office with Touchstone Funds Group Trust, Touchstone Institutional Funds Trust, Touchstone Investment Trust, Touchstone Tax-Free Trust, and Touchstone Variable Series Trust. |
PRIVACY PROTECTION POLICY
We Respect Your Privacy
Thank you for your decision to invest with us. Touchstone and its affiliates have always placed a high value on the trust and confidence our clients place in us. We believe that confidence must be earned and validated through time. In today’s world, when technology allows the sharing of information at light speeds, trust must be reinforced by our sincere pledge to take the steps necessary to ensure that the information you share with us is treated with respect and confidentiality.
Our Pledge to Our Clients
| • | We collect only the information we need to service your account and administer our business. |
| | |
| • | We are committed to keeping your information confidential and we place strict limits and controls on the use and sharing of your information. |
| | |
| • | We make every effort to ensure the accuracy of your information. |
We Collect the Following Nonpublic Personal Information About You:
| • | Information we receive from you on or in applications or other forms, correspondence, or conversations, including, but not limited to, your name, address, phone number, social security number, assets, income and date of birth; and |
| | |
| • | Information about your transactions with us, our affiliates, or others, including, but not limited to, your account number and balance, payment history, parties to transactions, cost basis information, and other financial information. |
Categories of Information We Disclose and Parties to Whom We Disclose
We do not disclose any nonpublic personal information about our current or former clients to nonaffiliated third parties, except as required or permitted by law.
We Place Strict Limits and Controls on the Use and Sharing of Your Information
| • | We restrict access to nonpublic personal information about you to authorized employees who need the information to administer your business. |
| | |
| • | We maintain physical, electronic and procedural safeguards that comply with federal standards to protect this information. |
| | |
| • | We do not disclose any nonpublic personal information about our current or former clients to anyone, except as required or permitted by law or as described in this document. |
| | |
| • | We will not sell your personal information to anyone. |
We May Provide Information to Service Your Account
Sometimes it is necessary to provide information about you to various companies such as transfer agents, custodians, broker-dealers and marketing service firms to facilitate the servicing of your account. These organizations have a legitimate business need to see some of your personal information in order for us to provide service to you. We may disclose to these various companies the information that we collect as described above. We require that these companies, including our own subsidiaries and affiliates, strictly maintain the confidentiality of this information and abide by all applicable laws. Companies within our corporate family that may receive this information are financial service providers and insurance companies. We do not permit these associated companies to sell the information for their own purposes, and we never sell our customer information.
This policy is applicable to the following affiliated companies: Touchstone Funds Group Trust, Touchstone Investment Trust, Touchstone Strategic Trust, Touchstone Tax-Free Trust, Touchstone Variable Series Trust, Touchstone Institutional Funds Trust, Touchstone Securities, Inc.,* and W&S Brokerage Services, Inc.
* Touchstone Securities, Inc. serves as the underwriter to the Touchstone Funds.
A Member of Western & Southern Financial Group®
The Privacy Protection Policy is not part of the Annual Report.


Touchstone Investments
Distributor
Touchstone Securities, Inc.*
303 Broadway
Cincinnati, Ohio 45202-4203 800.638.8194
www.touchstoneinvestments.com
Investment Advisor
Touchstone Advisors, Inc.*
303 Broadway
Cincinnati, Ohio 45202-4203
Transfer Agent
BNY Mellon Investment Servicing (US) Inc.
4400 Computer Drive
Westborough, MA 01581
Shareholder Service
800.543.0407
* A Member of Western & Southern Financial Group
TSF-55-TINT-AR-1610
PART C
OTHER INFORMATION
Item 15. Indemnification
Article VII of the Agreement and Declaration of Trust empowers the Trustees of the Trust, to the full extent permitted by law, to purchase with Trust assets insurance for indemnification from liability and to pay for all expenses reasonably incurred or paid or expected to be paid by a Trustee or officer in connection with any claim, action, suit or proceeding in which he or she becomes involved by virtue of his or her capacity or former capacity with the Trust.
Article VI of the By-Laws of the Trust provides that the Trust shall indemnify any person who was or is a party or is threatened to be made a party to any proceeding by reason of the fact that such person is or was an agent of the Trust, against expenses, judgments, fines, settlements and other amounts actually and reasonably incurred in connection with such proceeding if that person acted in good faith and reasonably believed his or her conduct to be in the best interests of the Trust. Indemnification will not be provided in certain circumstances, however, including instances of willful misfeasance, bad faith, gross negligence, and reckless disregard of the duties involved in the conduct of the particular office involved.
Insofar as indemnification for liabilities arising under the Securities Act of 1933 may be permitted to the Trustees, officers and controlling persons of the Registrant pursuant to the foregoing provisions or otherwise, the Registrant has been advised that in the opinion of the Securities and Exchange Commission such indemnification is against public policy as expressed in the Securities Act of 1933 and is, therefore, unenforceable. In the event that a claim for indemnification against such liabilities (other than the payment by the Registrant of expenses incurred or paid by a Trustee, officer or controlling person of the Registrant in the successful defense of any action, suit or proceeding) is asserted by such Trustee, officer or controlling person in connection with the securities being registered, the Registrant will, unless in the opinion of its counsel the matter has been settled by controlling precedent, submit to a court of appropriate jurisdiction the question whether such indemnification by it is against public policy as expressed in the Securities Act of 1933 and will be governed by the final adjudication of such issue.
Item 16. Exhibits
| (1)(a) | Registrant’s Certificate of Trust dated October 22, 1993 is herein incorporated by reference to Exhibit (1)(a) of Registrant’s Registration Statement on Form N-14 (File No. 333-193307), filed with the Securities and Exchange Commission (“SEC”) on January 10, 2014. |
| | |
| (1)(b) | Registrant’s Agreement and Declaration of Trust dated October 25, 1993 is herein incorporated by reference to Exhibit (a)(1) of Post-Effective Amendment No. 8 to Registrant’s Registration Statement on Form N-1A (File No. 033-70958), filed with the SEC on November 24, 1998. |
| | |
| (1)(c) | Certificate of Amendment of Agreement and Declaration of Trust of Corona Investment Trust dated December 11, 1993 is herein incorporated by reference to Exhibit (a)(2) of Post-Effective Amendment No. 8 to Registrant’s Registration Statement on Form N-1A (File No. 033-70958), filed with the SEC on November 24, 1998. |
| | |
| (1)(d) | Certificate of Amendment and Restatement of Certificate of Trust dated January 27, 1994 is herein incorporated by reference to Exhibit (1)(a) of Registrant’s Registration Statement on Form N-14 (File No. 333-193307), filed with the SEC on January 10, 2014. |
| | |
| (1)(e) | Certificate of Amendment of Agreement and Declaration of Trust and Certificate of Trust of the Solon Funds dated June 13, 1994 is herein incorporated by reference to Exhibit (a)(3) of Post-Effective Amendment No. 8 to Registrant’s Registration Statement on Form N-1A (File No. 033-70958), filed with the SEC on November 24, 1998. |
| (1)(f) | Certificate of Amendment of Agreement and Declaration of Trust dated November 10, 1997 is herein incorporated by reference to Exhibit (1)(d) of Post-Effective Amendment No. 5 to Registrant’s Registration Statement on Form N-1A (File No. 033-70958), filed with the SEC on December 17, 1997. |
| | |
| (1)(g) | Amended and Restated Agreement and Declaration of Trust dated October 8, 1998 is herein incorporated by reference to Exhibit (a)(5) of Post-Effective Amendment No. 8 to Registrant’s Registration Statement on Form N-1A (File No. 033-70958), filed with the SEC on November 24, 1998. |
| | |
| (1)(h) | Certificate of Amendment of Amended and Restated Agreement and Declaration of Trust dated November 23, 1998 is herein incorporated by reference to Exhibit (a)(6) of Post-Effective Amendment No. 10 to Registrant’s Registration Statement on Form N-1A (File No. 033-70958), filed with the SEC on January 27, 1999. |
| | |
| (1)(i) | Certificate of Amendment of Certificate of Trust dated March 24, 2004 is herein incorporated by reference to Exhibit (a)(7) of Post-Effective Amendment No. 18 to Registrant’s Registration Statement on Form N-1A (File No. 033-70958), filed with the SEC on May 3, 2004. |
| | |
| (1)(j) | Certificate of Amendment of Certificate of Trust dated November 17, 2006 is herein incorporated by reference to Exhibit (a)(8) of Post-Effective Amendment No. 29 to Registrant’s Registration Statement on Form N-1A (File Nos. 033-70958 and 811-08104), filed with the SEC on February 1, 2007. |
| | |
| (1)(k) | Certificate of Correction of a Statutory Trust dated April 17, 2009 is herein incorporated by reference to Exhibit (1)(a) of Registrant’s Registration Statement on Form N-14 (File No. 333-193307), filed with the SEC on January 10, 2014. |
| | |
| (2) | Amended and Restated By-Laws of the Trust as revised November 19, 2015 is herein incorporated by reference to Exhibit (b) of Post-Effective Amendment No. 77 to Registrant's Registration Statement on Form N-1A (File Nos. 033-70958 and 811-08104), filed with the SEC on January 28, 2016. |
| | |
| (3) | Not applicable |
| | |
| |
| (4) | Form of Agreement and Plan of Reorganization is filed herewith as Exhibit A to Part A of this Registration Statement. |
| |
| | |
| (5) | Instruments Defining Rights of Security Holders are herein incorporated by reference to Exhibit (c) of Post-Effective Amendment No. 34 to Registrant’s Registration Statement on Form N-1A (File Nos. 033-70958 and 811-03651), filed with the SEC on September 19, 2007. |
| | |
| (6)(a)(i) | Investment Advisory Agreement between the Registrant and Touchstone Advisors, Inc. dated February 17, 2006 is herein incorporated by reference to Exhibit (d)(1) of Post-Effective Amendment No. 62 to Registrant’s Registration Statement on Form N-1A (File Nos. 033-70958 and 811-08104), filed with the SEC on August 9, 2011. |
| | |
| (6)(a)(ii) | Schedule C-1 of the Investment Advisory Agreement between the Registrant and Touchstone Advisors, Inc. dated January 27, 2017 is herein incorporated by reference to Exhibit (d)(1)(b) of Post-Effective Amendment No. 83 to Registrant’s Registration Statement on Form N-1A (File Nos. 033-70958 and 811-08104), filed with the SEC on January 27, 2017. |
| (6)(b) | Sub-Advisory Agreement between Touchstone Advisors, Inc. and Sands Capital Management, LLC with respect to the Touchstone Sands Capital Select Growth Fund dated August 18, 2011 is herein incorporated by reference to Exhibit (d)(2)(b) of Post-Effective Amendment No. 65 to Registrant’s Registration Statement on Form N-1A (File Nos. 033-70958 and 811-08104), filed with the SEC on January 30, 2012. |
| | |
| (6)(c) | Sub-Advisory Agreement between Touchstone Advisors, Inc. and Miller/Howard Investments, Inc. with respect to the Touchstone Premium Yield Equity Fund dated May 20, 2008 is herein incorporated by reference to Exhibit (d)(6) of Post-Effective Amendment No. 40 to Registrant’s Registration Statement on Form N-1A (File Nos. 033-70958 and 811-08104), filed with the SEC on September 15, 2008. |
| | |
| (6)(d) | Sub-Advisory Agreement between Touchstone Advisors, Inc. and Fort Washington Investment Advisors, Inc. with respect to the Touchstone Ultra Short Duration Fixed Income Fund dated February 20, 2009 is herein incorporated by reference to Exhibit (d)(9) of Post-Effective Amendment No. 43 to Registrant’s Registration Statement on Form N-1A (File Nos. 033-70958 and 811-08104), filed with the SEC on May 4, 2009. |
| | |
| (6)(e) | Sub-Advisory Agreement between Touchstone Advisors, Inc. and Copper Rock Capital Partners LLC with respect to the Touchstone Emerging Markets Small Cap Fund dated April 19, 2016 is herein incorporated by reference to Exhibit (d)(15) of Post-Effective Amendment No. 80 to Registrant’s Registration Statement on Form N-1A (File Nos. 033-70958 and 811-08104), filed with the SEC on April 19, 2016. |
| | |
| (6)(f) | Sub-Advisory Agreement between Touchstone Advisors, Inc. and Lee Munder Investments, LLC with respect to the Touchstone Mid Cap Value Fund dated October 1, 2009 is herein incorporated by reference to Exhibit (d)(13) of Post-Effective Amendment No. 47 to Registrant’s Registration Statement on Form N-1A (File Nos. 033-70958 and 811-08104), filed with the SEC on September 30, 2009. |
| | |
| (6)(g) | Amendment to Sub-Advisory Agreement between Touchstone Advisors, Inc. and Lee Munder Investments, LLC with respect to the Touchstone Mid Cap Value Fund dated December 1, 2014 is herein incorporated by reference to Exhibit (d)(7) of Post-Effective Amendment No. 75 to Registrant’s Registration Statement on Form N-1A (File Nos. 033-70958 and 811-08104), filed with the SEC on January 27, 2015. |
| | |
| (6)(h) | Sub-Advisory Agreement between Touchstone Advisors, Inc. and The London Company of Virginia with respect to the Touchstone Small Cap Core Fund dated October 1, 2009 is herein incorporated by reference to Exhibit (d)(16) of Post-Effective Amendment No. 47 to Registrant’s Registration Statement on Form N-1A (File Nos. 033-70958 and 811-08104), filed with the SEC on September 30, 2009. |
| | |
| (6)(i) | Sub-Advisory Agreement between Touchstone Advisors, Inc. and The London Company of Virginia with respect to the Touchstone Mid Cap Fund dated December 8, 2011 is herein incorporated by reference to Exhibit (d)(13) of Post-Effective Amendment No. 65 to Registrant’s Registration Statement on Form N-1A (File Nos. 033-70958 and 811-08104), filed with the SEC on January 30, 2012. |
| | |
| (6)(j) | Sub-Advisory Agreement between Touchstone Advisors, Inc. and EARNEST Partners, LLC with respect to the Touchstone Total Return Bond Fund dated May 19, 2011 is herein incorporated by reference to Exhibit (d)(20) of Post-Effective Amendment No. 62 to Registrant’s Registration Statement on Form N-1A (File Nos. 033-70958 and 811-08104), filed with the SEC on August 9, 2011. |
| (6)(k) | Sub-Advisory Agreement between Touchstone Advisors, Inc. and Longfellow Investment Management Co. LLC with respect to the Touchstone Merger Arbitrage Fund dated August 9, 2011 is herein incorporated by reference to Exhibit (d)(21) of Post-Effective Amendment No. 62 to Registrant’s Registration Statement on Form N-1A (File Nos. 033-70958 and 811-08104), filed with the SEC on August 9, 2011. |
| | |
| (6)(l) | Sub-Advisory Agreement between Touchstone Advisors, Inc. and Longfellow Investment Management Co. LLC with respect to the Touchstone Merger Arbitrage Fund dated August 9, 2011 is herein incorporated by reference to Exhibit (d)(21) of Post-Effective Amendment No. 62 to Registrant’s Registration Statement on Form N-1A (File Nos. 033-70958 and 811-08104), filed with the SEC on August 9, 2011. |
| | |
| (6)(m) | Sub-Advisory Agreement between Touchstone Advisors, Inc. and Longfellow Investment Management Co. LLC with respect to the Touchstone Arbitrage Fund dated September 30, 2013, incorporated by reference to Exhibit (d)(15) of Post-Effective Amendment No. 70 to Registrant’s Registration Statement on Form N-1A (File Nos. 033-70958 and 811-08104), filed with the SEC on September 30, 2013. |
| | |
| (6)(n) | Sub-Advisory Agreement between Touchstone Advisors, Inc. and Copper Rock Capital Partners LLC with respect to the Touchstone Emerging Markets Small Cap Fund dated April 19, 2016 is herein incorporated by reference to Exhibit (d)(15) of Post-Effective Amendment No. 80 to Registrant’s Registration Statement on Form N-1A (File Nos. 033-70958 and 811-08104), filed with the SEC on April 19, 2016. |
| | |
| (6)(o) | Form of Sub-Advisory Agreement between Touchstone Advisors, Inc. and Fort Washington Investment Advisors with respect to the Touchstone Active Bond Fund is herein incorporated by reference to Exhibit (d)(15) of Post-Effective Amendment No. 83 to Registrant’s Registration Statement on Form N-1A (File Nos. 033-70958 and 811-08104), filed with the SEC on January 27, 2017. |
| | |
| (6)(p) | Form of Sub-Advisory Agreement between Touchstone Advisors, Inc. and Fort Washington Investment Advisors with respect to the Touchstone High Yield Fund is herein incorporated by reference to Exhibit (d)(16) of Post-Effective Amendment No. 83 to Registrant’s Registration Statement on Form N-1A (File Nos. 033-70958 and 811-08104), filed with the SEC on January 27, 2017. |
| | |
| (7)(a) | Distribution Agreement between the Registrant and Touchstone Securities, Inc. is herein incorporated by reference to Exhibit (e)(1) of Post-Effective Amendment No. 28 to Registrant’s Registration Statement on Form N-1A (File Nos. 033-70958 and 811-08104), filed with the SEC on September 21, 2006. |
| | |
| (7)(b) | Form of Underwriter’s Dealer Agreement is herein incorporated by reference to Exhibit (e)(2) of Post-Effective Amendment No. 29 to Registrant’s Registration Statement on Form N-1A (File Nos. 033-70958 and 811-08104), filed with the SEC on February 1, 2007. |
| | |
| (8) | Touchstone Trustee Deferred Compensation Plan is herein incorporated by reference to Exhibit (f) of Post-Effective Amendment No. 51 to Registrant’s Registration Statement on Form N-1A (File Nos. 033-70958 and 811-08104), filed with the SEC on January 28, 2010. |
| | |
| (9)(a) | Custodian Agreement between the Registrant and Brown Brothers Harriman & Co. dated February 25, 2008 is herein incorporated by reference to Exhibit (g) of Post-Effective Amendment No. 41 to Registrant’s Registration Statement on Form N-1A (File Nos. 033-70958 and 811-08104), filed with the SEC on January 28, 2009.) |
| (9)(b) | Amended Schedule of Global Services & Charges to the Custodian Agreement dated February 1, 2013 between the Trust and Brown Brothers Harriman & Co. Fund is herein incorporated by reference to Exhibit (g)(2) of Post-Effective Amendment No. 83 to Registrant’s Registration Statement on Form N-1A (File Nos. 033-70958 and 811-08104), filed with the SEC on January 27, 2017. |
| | |
| 10(a)(i) | Distribution and Shareholder Services Plan for Class A shares is herein incorporated by reference to exhibit (m)(1) of Post-Effective Amendment No. 67 to Registrant’s Registration Statement on Form N-1A (File Nos. 033-70958 and 811-08104), filed with the SEC on January 28, 2013. |
| | |
| 10(a)(ii) | Exhibit A to the Distribution and Shareholder Services Plan for Class A is herein incorporated by reference to Exhibit (m)(1)(b) of Post-Effective Amendment No. 83 to Registrant’s Registration Statement on Form N-1A (File Nos. 033-70958 and 811-08104), filed with the SEC on January 27, 2017. |
| | |
| 10(b)(i) | Distribution and Shareholder Services Plan for Class C shares is herein incorporated by reference to exhibit (m)(2) of Post-Effective Amendment No. 67 to Registrant’s Registration Statement on Form N-1A (File Nos. 033-70958 and 811-08104), filed with the SEC on January 28, 2013. |
| | |
| 10(b)(ii) | Exhibit A to the Distribution and Shareholder Services Plan for Class C shares is herein incorporated by reference to Exhibit (m)(2)(b) of Post-Effective Amendment No. 83 to Registrant’s Registration Statement on Form N-1A (File Nos. 033-70958 and 811-08104), filed with the SEC on January 27, 2017. |
| | |
| (10)(c) | Shareholder Services Plan for Class Z shares is herein incorporated by reference to Exhibit (m)(3) of Post-Effective Amendment No. 41 to Registrant’s Registration Statement on Form N-1A (File Nos. 033-70958 and 811-08104), filed with the SEC on January 28, 2009. |
| | |
| (10)(d) | Amended and Restated Rule 18f-3 Multiple Class Plan is to be filed by amendment. |
| | |
| (10)(e) | Amended Schedule A to the Amended and Restated Rule 18f-3 Multiple Class Plan shares is to be filed by amendment. |
| | |
| (11) | Opinion and Consent of Counsel is to be filed by amendment. |
| | |
| (12) | Form of Opinion and Consent of Vedder Price P.C. supporting the tax matters discussed in the Joint Proxy Statement/Prospectus is filed herewith. |
| | |
| (13)(a) | Amended Administration Agreement between the Registrant and Touchstone Advisors, Inc. is herein incorporated by reference to Exhibit (h)(1) of Post-Effective Amendment No. 67 to Registrant’s Registration Statement on Form N-1A (File Nos. 033-70958 and 811-08104), filed with the SEC on January 28, 2013. |
| | |
| (13)(b) | Amended and Restated Sub-Administration and Accounting Services Agreement between Touchstone Advisors, Inc. and BNY Mellon Investment Servicing (US) Inc. is herein incorporated by reference to Exhibit (h)(2) of Post-Effective Amendment No. 75 to Registrant’s Registration Statement on Form N-1A (File Nos. 033-70958 and 811-08104), filed with the SEC on January 27, 2015. |
| (13)(c) | Amended and Restated Transfer Agency and Shareholder Services Agreement with BNY Mellon Investment Servicing (US) Inc. dated January 1, 2015 is herein incorporated by reference to Exhibit (h)(3) of Post-Effective Amendment No. 75 to Registrant’s Registration Statement on Form N-1A (File Nos. 033-70958 and 811-08104), filed with the SEC on January 27, 2015. |
| | |
| (13)(d)(i) | State Filing Services Agreement between Registrant and BNY Mellon dated December 5, 2011 is herein incorporated by reference to Exhibit (h)(4) of Post-Effective Amendment No. 65 to Registrant’s Registration Statement on Form N-1A (File Nos. 033-70958 and 811-08104), filed with the SEC on January 30, 2012. |
| | |
| (13)(d)(ii) | Amended Schedule A dated September 30, 2013 to the State Filing Services Agreement between Registrant and BNY Mellon dated December 5, 2011 Mellon is herein incorporated by reference to Exhibit (h)(4)(b) of Post-Effective Amendment No. 72 to Registrant’s Registration Statement on Form N-1A (File Nos. 033-70958 and 811-08104), filed with the SEC on January 27, 2014. |
| | |
| (13)(e) | Fidelity Bond Allocation Agreement dated April 1, 2011 is herein incorporated by reference to Exhibit (13)(h) of Post-Effective Amendment No. 2 to Registrant’s Registration Statement on Form N-14 (File Nos. 333-177599 and 811-08104), filed with the SEC on April 25, 2012. |
| | |
| (13)(f)(i) | Expense Limitation Agreement between Touchstone Advisors, Inc. and the Registrant effective as of January 25, 2013 is herein incorporated by reference to Exhibit (13)(a)(1) of Registrant’s Registration Statement on Form N-14 (File No. 333-193307), filed with the SEC on January 10, 2014. |
| | |
| (13)(f)(ii) | Amendment to the Expense Limitation Agreement between Touchstone Advisors, Inc. and the Registrant dated August 31, 2015 is herein incorporated by reference to Exhibit (h)(6)(b) of Post-Effective Amendment No. 77 to Registrant's Registration Statement on Form N-1A (File Nos. 033-70958 and 811-08104), filed with the SEC on January 28, 2016. |
| | |
| (13)(f)(iii) | Schedule A to the Expense Limitation Agreement between Touchstone Advisors, Inc. and the Registrant effective as of January 30, 2017 is herein incorporated by reference to Exhibit (h)(6)(c) of Post-Effective Amendment No. 83 to Registrant’s Registration Statement on Form N-1A (File Nos. 033-70958 and 811-08104), filed with the SEC on January 27, 2017. |
| | |
| (13)(g)(i) | Expense Limitation Agreement between Touchstone Advisors, Inc. and the Registrant effective as of January 25, 2013 with respect to the Sands Capital Select Growth Fund is herein incorporated by reference to Exhibit (13)(g)(1) of Registrant’s Registration Statement on Form N-14 (File No. 333-193307), filed with the SEC on January 10, 2014. |
| | |
| (13)(g)(ii) | Amendment to the Expense Limitation Agreement between Touchstone Advisors, Inc. and the Registrant with respect to the Sands Capital Select Growth Fund dated August 31, 2015 is herein incorporated by reference to Exhibit (h)(7)(b) of Post-Effective Amendment No. 77 to Registrant's Registration Statement on Form N-1A (File Nos. 033-70958 and 811-08104), filed with the SEC on January 28, 2016. |
| | |
| (13)(g)(iii) | Schedule A to the Expense Limitation Agreement between Touchstone Advisors, Inc. and the Registrant with respect to the Sands Capital Select Growth Fund, effective as of January 30, 2017 is herein incorporated by reference to Exhibit (h)(7)(c) of Post-Effective Amendment No. 83 to Registrant’s Registration Statement on Form N-1A (File Nos. 033-70958 and 811-08104), filed with the SEC on January 27, 2017. |
| (13)(h) | Form of Securities Lending Agency Agreement between the Registrant and Brown Brothers Harriman & Co. dated February 1, 2013, Mellon is herein incorporated by reference to Exhibit (h)(8) of Post-Effective Amendment No. 72 to Registrant’s Registration Statement on Form N-1A (File Nos. 033-70958 and 811-08104), filed with the SEC on January 27, 2014. |
| | |
| (14)(a) | Consent of Ernst & Young LLP is filed herewith. |
| | |
| (14)(b) | Consent of PricewaterhouseCoopers LLP is filed herewith. |
| | |
| (15) | Not applicable. |
| | |
| (16) | Power of Attorney is filed herewith. |
| | |
| (17) | Forms of Proxy Card are filed herewith and appear following Part A of this Registration Statement. |
Item 17. Undertakings
(1) The undersigned Registrant agrees that prior to any public reoffering of the securities registered through the use of a prospectus which is a part of this Registration Statement by any person or party who is deemed to be an underwriter within the meaning of Rule 145(c) of the Securities Act, the reoffering prospectus will contain the information called for by the applicable registration form for reofferings by persons who may be deemed underwriters, in addition to the information called for by the other items of the applicable form.
(2) The undersigned Registrant agrees that every prospectus that is filed under paragraph (1) above will be filed as a part of an amendment to the Registration Statement and will not be used until the amendment is effective, and that, in determining any liability under the Securities Act, each post-effective amendment shall be deemed to be a new Registration Statement for the securities offered therein, and the offering of the securities at that time shall be deemed to be the initial bona fide offering of them.
(3) Insofar as indemnification for liability arising under the 1933 Act may be permitted to trustees, officers and controlling persons of the Registrant pursuant to the foregoing provisions, or otherwise, the Registrant has been advised that in the opinion of the Securities and Exchange Commission such indemnification is against public policy as expressed in the 1933 Act and is, therefore, unenforceable. In the event that a claim for indemnification against such liabilities (other than the payment by the Registrant of expenses incurred or paid by a trustee, officer or controlling person of the Registrant in the successful defense of any action, suit or proceeding) is asserted by such trustee, officer or controlling person in connection with the securities being registered, the Registrant will, unless in the opinion of its counsel the matter has been settled by controlling precedent, submit to a court of appropriate jurisdiction the question whether such indemnification by it is against public policy as expressed in the 1933 Act and will be governed by the final adjudication of such issue.
(4) The undersigned Registrant agrees that it shall file a final executed version of the legal opinion as to tax matters as an exhibit to the subsequent post-effective amendment to its Registration Statement on Form N-14 filed with the SEC upon the closing of the reorganizations contemplated by this Registration Statement on Form N-14.
SIGNATURES
As required by the Securities Act of 1933, this Registration Statement has been signed on behalf of the Registrant, in the City of Cincinnati, the State of Ohio, on the 30th day of May, 2017.
| | TOUCHSTONE FUNDS GROUP TRUST |
| | |
| | By: | /s/ Jill T. McGruder |
| | | Jill T. McGruder
President |
As required by the Securities Act of 1933, this Registration Statement has been signed by the following persons in the capacities and on the dates indicated:
| * | | Trustee | | May 30, 2017 |
| Phillip R. Cox | | | | |
| | | | | |
| * | | Trustee | | May 30, 2017 |
| William C. Gale | | | | |
| | | | | |
| * | | Trustee | | May 30, 2017 |
| Susan J. Hickenlooper | | | | |
| | | | | |
| * | | Trustee | | May 30, 2017 |
| Kevin A. Robie | | | | |
| | | | | |
| * | | Trustee | | May 30, 2017 |
| Edward J. VonderBrink | | | | |
| | | | | |
| /s/ Jill T. McGruder | | Trustee and President | | May 30, 2017 |
| Jill T. McGruder | | | | |
| | | | | |
/s/ Terrie A. Wiedenheft | | Controller, Treasurer and Principal
Financial Officer | | May 30, 2017 |
| Terrie A. Wiedenheft | | | | |
| *By: | /s/ Terrie A. Wiedenheft | | May 30, 2017 |
| | Terrie A. Wiedenheft | | |
| | (Attorney-in-Fact Pursuant to Power of Attorney filed herewith as Exhibit (16)) | | |
EXHIBIT INDEX
| Exhibit No. | | Name of Exhibit |
| | | |
| (12) | | Form of Opinion and Consent of Vedder Price P.C. supporting the tax matters discussed in the Joint Proxy Statement/Prospectus. |
| | | |
| (14)(a) | | Consent of Ernst & Young LLP. |
| | | |
| (14)(b) | | Consent of PricewaterhouseCoopers LLP. |
| | | |
| (16) | | Powers of Attorney. |