UNITED STATES
SECURITIES AND EXCHANGE COMMISSION
Washington, D.C. 20549
FormN-CSR
CERTIFIED SHAREHOLDER REPORT OF REGISTERED
MANAGEMENT INVESTMENT COMPANIES
Investment Company Act File Number: 811-08134
Eaton Vance Municipals Trust II
(Exact Name of Registrant as Specified in Charter)
Two International Place, Boston, Massachusetts 02110
(Address of Principal Executive Offices)
Maureen A. Gemma
Two International Place, Boston, Massachusetts 02110
(Name and Address of Agent for Services)
(617)482-8260
(Registrant’s Telephone Number)
January 31
Date of Fiscal Year End
January 31, 2019
Date of Reporting Period
Item 1. Reports to Stockholders

Eaton Vance
High Yield Municipal Income Fund
Annual Report
January 31, 2019
Important Note. Beginning on January 1, 2021, as permitted by regulations adopted by the Securities and Exchange Commission, paper copies of the Fund’s annual and semi-annual shareholder reports will no longer be sent by mail unless you specifically request paper copies of the reports. Instead, the reports will be made available on the Fund’s website (eatonvance.com/funddocuments), and you will be notified by mail each time a report is posted and provided with a website address to access the report.
If you already elected to receive shareholder reports electronically, you will not be affected by this change and you need not take any action. If you are a direct investor, you may elect to receive shareholder reports and other communications from the Fund electronically by signing up for e-Delivery at eatonvance.com/edelivery. If you own your shares through a financial intermediary (such as a broker-dealer or bank), you must contact your financial intermediary to sign up.
You may elect to receive all future Fund shareholder reports in paper free of charge. If you are a direct investor, you can inform the Fund that you wish to continue receiving paper copies of your shareholder reports by calling 1-800-262-1122. If you own these shares through a financial intermediary, you must contact your financial intermediary or follow instructions included with this disclosure, if applicable, to elect to continue to receive paper copies of your shareholder reports. Your election to receive reports in paper will apply to all Eaton Vance funds held directly or to all funds held through your financial intermediary, as applicable.

Commodity Futures Trading Commission Registration. Effective December 31, 2012, the Commodity Futures Trading Commission (“CFTC”) adopted certain regulatory changes that subject registered investment companies and advisers to regulation by the CFTC if a fund invests more than a prescribed level of its assets in certain CFTC-regulated instruments (including futures, certain options and swap agreements) or markets itself as providing investment exposure to such instruments. The Fund has claimed an exclusion from the definition of the term “commodity pool operator” under the Commodity Exchange Act. Accordingly, neither the Fund nor the adviser with respect to the operation of the Fund is subject to CFTC regulation. Because of its management of other strategies, the Fund’s adviser is registered with the CFTC as a commodity pool operator and a commodity trading advisor.
Fund shares are not insured by the FDIC and are not deposits or other obligations of, or guaranteed by, any depository institution. Shares are subject to investment risks, including possible loss of principal invested.
This report must be preceded or accompanied by a current summary prospectus or prospectus. Before investing, investors should consider carefully the investment objective, risks, and charges and expenses of a mutual fund. This and other important information is contained in the summary prospectus and prospectus, which can be obtained from a financial advisor. Prospective investors should read the prospectus carefully before investing. For further information, please call 1-800-262-1122.
Annual ReportJanuary 31, 2019
Eaton Vance
High Yield Municipal Income Fund
Table of Contents
| | | | |
Management’s Discussion of Fund Performance | | | 2 | |
| |
Performance | | | 3 | |
| |
Fund Profile | | | 4 | |
| |
Endnotes and Additional Disclosures | | | 5 | |
| |
Fund Expenses | | | 6 | |
| |
Financial Statements | | | 7 | |
| |
Report of Independent Registered Public Accounting Firm | | | 31 | |
| |
Federal Tax Information | | | 32 | |
| |
Special Meeting of Shareholders | | | 33 | |
| |
Management and Organization | | | 34 | |
| |
Important Notices | | | 37 | |
Eaton Vance
High Yield Municipal Income Fund
January 31, 2019
Management’s Discussion of Fund Performance1
Economic and Market Conditions
The12-month period ended January 31, 2019, was positive for the municipal bond market, with the Bloomberg Barclays Municipal Bond Index,2 a broad measure of the asset class, returning 3.26%.
Bond performance, however, varied considerably across the AAA7 municipal yield curve.9 During the period, rates rose and bond prices fell in the 0–2 year and 19–30 year areas of the curve. But rates declined in the 3–18 year segment of the curve, with the largest declines — and the strongest bond price performance — occurring in the 10–12 year part of the curve. As a result, the front end of the municipal yield curve — 1–9 years — generally flattened while the back end — 10–30 years — steepened. In addition, lower-rated bonds generally outperformed higher-rated issues during the period. Municipal bonds outperformed comparable U.S. Treasurys in the 1–10 year area of the yield curve, while Treasurys outperformed municipals across the remainder of the curve.
As the period opened in February 2018, signs of increasing inflation, higher wage growth and fears that recent tax legislation might overheat the economy were pushing interest rates up and bond prices down. Upward pressure on short-term rates continued in March and June 2018 as the U.S. Federal Reserve Board (the Fed) delivered its first two rate hikes of the year. At the long end of the curve, however, fluctuating perceptions of geopolitical risk were a primary driver of rates from April through the end of August 2018. Investors toggled between concern that the U.S. was initiating a global trade war and optimism about economic growth and a potential detente between the U.S. and North Korea.
In September 2018, the Fed hiked the federal funds rate again, which pushed up both U.S. Treasury and municipal rates across the curve. In October 2018, a strong U.S. employment report and easing concerns about Italy’s national budget crisis continued the upward pressure on longer-term rates. But as 2018 came to a close, investors became increasingly concerned about a trade war with China, a potential government shutdown and dovish comments by the Fed that led the futures market to project the possibility of no further rate hikes in 2019. The result was a “flight to quality” by bond investors that pushed longer-term bond prices up and rates down in December 2018.
The first month of 2019, in contrast, was relatively quiet for bonds. As investors waited to see the outcome of the longest-ever U.S. government shutdown, municipal interest rates were virtually unchanged in January.
Fund Performance
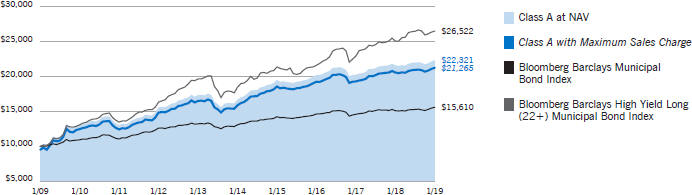
For the12-month period ended January 31, 2019, Eaton Vance High Yield Municipal Income Fund (the Fund) returned 3.29% for Class A shares at net asset value (NAV), performing approximately in line with the 3.26% return of the Fund’s primary benchmark, the Bloomberg Barclays Municipal Bond Index (the Index), but underperforming the 5.77% return of the Fund’s secondary benchmark, the Bloomberg Barclays High Yield Long (22+) Municipal Bond Index.
The Fund primarily invests in high yield municipal obligations — defined as securities rated BBB or below — whereas the Index, reflecting the broad municipal market, had a significantly smaller weight inBBB-rated and below investment-grade issues throughout the fiscal year. In general, high yield municipal bonds experienced strong investor demand during the period and high yield municipal funds saw strong inflows. For most of the period, these factors helped drive up prices and put downward pressure on yields, leading high yield municipal bonds to generally outperform investment-grade municipal bonds during the period.
The Fund seeks to enhancetax-exempt income by entering into residual interest bond transactions6and investing the proceeds in additional municipal securities, creating leverage within the Fund. Leverage has the effect of magnifying the Fund’s exposure to its underlying investments in both up and down markets. During this period, however, the net effect of leverage was not a meaningful contributor to, or detractor from performance versus the unleveraged Index.
Contributors to Fund performance versus the Index during the period included an overweight position, relative to the Index, in the health care sector, one of the best-performing sectors within the Index during the period, security selection and an overweight position in Illinois bonds and the favorable resolution of a distressed bond owned by the Fund. By period end, the bond was sold out of the Fund.
In contrast, detractors from Fund performance relative to the Index included security selection inzero-coupon bonds, the best-performing coupon structure in the Index during the period, security selection in Texas bonds and the Fund’s hedging strategy, which uses Treasury futures to various degrees.
As a risk-management tactic within the Fund’s overall strategy, interest-rate hedging is intended to moderate performance in both up and down markets. During a period when the Fund delivered positive performance, the Fund’s hedging strategy mitigated some of that positive performance and, thus, detracted from Fund performance relative to the unhedged Index.
See Endnotes and Additional Disclosures in this report.
Past performance is no guarantee of future results. Returns are historical and are calculated by determining the percentage change in net asset value (NAV) or offering price (as applicable) with all distributions reinvested. Investment return and principal value will fluctuate so that shares, when redeemed, may be worth more or less than their original cost. Performance less than or equal to one year is cumulative. Performance is for the stated time period only; due to market volatility, the Fund’s current performance may be lower or higher than quoted. Returns are before taxes unless otherwise noted. For performance as of the most recent month-end, please refer to eatonvance.com.
Eaton Vance
High Yield Municipal Income Fund
January 31, 2019
Performance2,3
PortfolioManagerCynthia J. Clemson
| | | | | | | | | | | | | | | | | | | | |
| % Average Annual Total Returns | | Class Inception Date | | | Performance Inception Date | | | One Year | | | Five Years | | | Ten Years | |
Class A at NAV | | | 08/07/1995 | | | | 08/07/1995 | | | | 3.29 | % | | | 5.99 | % | | | 8.36 | % |
Class A with 4.75% Maximum Sales Charge | | | — | | | | — | | | | –1.58 | | | | 4.97 | | | | 7.83 | |
Class B at NAV | | | 08/07/1995 | | | | 08/07/1995 | | | | 2.52 | | | | 5.21 | | | | 7.54 | |
Class B with 5% Maximum Sales Charge | | | — | | | | — | | | | –2.46 | | | | 4.88 | | | | 7.54 | |
Class C at NAV | | | 06/18/1997 | | | | 08/07/1995 | | | | 2.60 | | | | 5.22 | | | | 7.54 | |
Class C with 1% Maximum Sales Charge | | | — | | | | — | | | | 1.61 | | | | 5.22 | | | | 7.54 | |
Class I at NAV | | | 05/09/2007 | | | | 08/07/1995 | | | | 3.67 | | | | 6.28 | | | | 8.63 | |
Bloomberg Barclays Municipal Bond Index | | | — | | | | — | | | | 3.26 | % | | | 3.57 | % | | | 4.55 | % |
Bloomberg Barclays High Yield Long (22+) Municipal Bond Index | | | — | | | | — | | | | 5.77 | | | | 7.51 | | | | 10.24 | |
| | | | | |
| | | | | | | | | | | | | | | | | | | | |
| % Total Annual Operating Expense Ratios4 | | | | | Class A | | | Class B | | | Class C | | | Class I | |
| | | | | | | 0.92 | % | | | 1.67 | % | | | 1.67 | % | | | 0.67 | % |
| | | | | |
| | | | | | | | | | | | | | | | | | | | |
| % Distribution Rates/Yields5 | | | | | Class A | | | Class B | | | Class C | | | Class I | |
Distribution Rate | | | | | | | 3.97 | % | | | 3.19 | % | | | 3.20 | % | | | 4.22 | % |
Taxable-Equivalent Distribution Rate | | | | | | | 6.71 | | | | 5.39 | | | | 5.41 | | | | 7.13 | |
SEC 30-day Yield | | | | | | | 2.68 | | | | 2.10 | | | | 2.09 | | | | 3.07 | |
Taxable-Equivalent SEC 30-day Yield | | | | | | | 4.53 | | | | 3.55 | | | | 3.54 | | | | 5.19 | |
| | | | | |
| | | | | | | | | | | | | | | | | | | | |
| % Total Leverage6 | | | | | | | | | | | | | | | |
Residual Interest Bond (RIB) Financing | | | | | | | | | | | | | | | | | | | 7.15 | % |
Growth of $10,000
This graph shows the change in value of a hypothetical investment of $10,000 in Class A of the Fund for the period indicated. For comparison, the same investment is shown in the indicated index.
| | | | | | | | | | | | | | | | |
| Growth of Investment | | Amount Invested | | | Period Beginning | | | At NAV | | | With Maximum Sales Charge | |
Class B | | $ | 10,000 | | | | 01/31/2009 | | | $ | 20,697 | | | | N.A. | |
Class C | | $ | 10,000 | | | | 01/31/2009 | | | $ | 20,697 | | | | N.A. | |
Class I | | $ | 250,000 | | | | 01/31/2009 | | | $ | 572,350 | | | | N.A. | |
See Endnotes and Additional Disclosures in this report.
Past performance is no guarantee of future results. Returns are historical and are calculated by determining the percentage change in net asset value (NAV) or offering price (as applicable) with all distributions reinvested. Investment return and principal value will fluctuate so that shares, when redeemed, may be worth more or less than their original cost. Performance less than or equal to one year is cumulative. Performance is for the stated time period only; due to market volatility, the Fund’s current performance may be lower or higher than quoted. Returns are before taxes unless otherwise noted. For performance as of the most recentmonth-end, please refer to eatonvance.com.
Eaton Vance
High Yield Municipal Income Fund
January 31, 2019
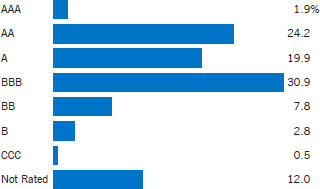
Fund Profile
Credit Quality (% of total investments)7,8
See Endnotes and Additional Disclosures in this report.
Eaton Vance
High Yield Municipal Income Fund
January 31, 2019
Endnotes and Additional Disclosures
| 1 | The views expressed in this report are those of the portfolio manager(s) and are current only through the date stated at the top of this page. These views are subject to change at any time based upon market or other conditions, and Eaton Vance and the Fund(s) disclaim any responsibility to update such views. These views may not be relied upon as investment advice and, because investment decisions are based on many factors, may not be relied upon as an indication of trading intent on behalf of any Eaton Vance fund. This commentary may contain statements that are not historical facts, referred to as “forward looking statements.” The Fund’s actual future results may differ significantly from those stated in any forward looking statement, depending on factors such as changes in securities or financial markets or general economic conditions, the volume of sales and purchases of Fund shares, the continuation of investment advisory, administrative and service contracts, and other risks discussed from time to time in the Fund’s filings with the Securities and Exchange Commission. |
| 2 | Bloomberg Barclays Municipal Bond Index is an unmanaged index of municipal bonds traded in the U.S. Bloomberg Barclays High Yield Long (22+) Municipal Bond Index is an unmanaged index of high-yield municipal bonds traded in the U.S. with maturities of 22 years or more. Unless otherwise stated, index returns do not reflect the effect of any applicable sales charges, commissions, expenses, taxes or leverage, as applicable. It is not possible to invest directly in an index. |
| 3 | Total Returns at NAV do not include applicable sales charges. If sales charges were deducted, the returns would be lower. Total Returns shown with maximum sales charge reflect the stated maximum sales charge. Unless otherwise stated, performance does not reflect the deduction of taxes on Fund distributions or redemptions of Fund shares. |
| 4 | Source: Fund prospectus. The expense ratios for the current reporting period can be found in the Financial Highlights section of this report. |
| 5 | The Distribution Rate is based on the Fund’s last regular distribution per share in the period (annualized) divided by the Fund’s NAV at the end of the period. The Fund’s distributions may be comprised of amounts characterized for federal income tax purposes astax-exempt income, qualified andnon-qualified ordinary dividends, capital gains and nondividend distributions, also known as return of capital. The Fund will determine the federal income tax character of distributions paid to a shareholder after the end of the calendar year. This is reported on the IRS form1099-DIV and provided to the shareholder shortly after eachyear-end. The Fund’s distributions are determined by the investment adviser based on its current assessment of the Fund’s long-term return potential. As portfolio and market conditions change, the rate of distributions paid by the Fund could change. Taxable-equivalent performance is based on the highest combined federal and state income tax rates, where applicable. Lower tax rates would result in lowertax-equivalent performance. Actual tax rates will vary depending on your income, exemptions and deductions. Rates do not include local taxes. The SEC Yield is a standardized measure based on the estimated yield to maturity of a fund’s investments over a30-day period and is based on the maximum offer price at the date specified. The SEC Yield is not based on the distributions made by the Fund, which may differ. |
| 6 | Fund employs RIB financing. The leverage created by RIB investments provides an opportunity for increased income but, at the same time, creates special risks (including the likelihood of greater volatility of NAV). The cost of leverage rises and falls with changes in short-term interest rates. See “Floating Rate Notes Issued in Conjunction with Securities Held” in the notes to the financial statements for more information about RIB financing. RIB leverage represents the amount of Floating Rate Notes outstanding at period end as a percentage of Fund net assets plus Floating Rate Notes. |
| 7 | Ratings are based on Moody’s Investors Service, Inc. (“Moody’s”), S&P Global Ratings (“S&P”) or Fitch Ratings (“Fitch”), as applicable. If securities are rated differently by the ratings agencies, the highest rating is applied. Ratings, which are subject to change, apply to the creditworthiness of the issuers of the underlying securities and not to the Fund or its shares. Credit ratings measure the quality of a bond based on the issuer’s creditworthiness, with ratings ranging from AAA, being the highest, to D, being the lowest based on S&P’s measures. Ratings of BBB or higher by S&P or Fitch (Baa or higher by Moody’s) are considered to be investment-grade quality. Credit ratings are based largely on the ratings agency’s analysis at the time of rating. The rating assigned to any particular security is not necessarily a reflection of the issuer’s current financial condition and does not necessarily reflect its assessment of the volatility of a security’s market value or of the liquidity of an investment in the security. Holdings designated as “Not Rated” (if any) are not rated by the national ratings agencies stated above. |
| 8 | The chart includes the municipal bonds held by a trust that issues residual interest bonds, consistent with the Portfolio of Investments. |
| 9 | Yield curve is a graphical representation of the yields offered by bonds of various maturities. The yield curve flattens when long-term rates fall and/or short-term rates increase, and the yield curve steepens when long-term rates increase and/or short-term rates fall. |
| | Fund profile subject to change due to active management. |
Eaton Vance
High Yield Municipal Income Fund
January 31, 2019
Fund Expenses
Example: As a Fund shareholder, you incur two types of costs: (1) transaction costs, including sales charges (loads) on purchases and redemption fees (if applicable); and (2) ongoing costs, including management fees; distribution and/or service fees; and other Fund expenses. This Example is intended to help you understand your ongoing costs (in dollars) of Fund investing and to compare these costs with the ongoing costs of investing in other mutual funds. The Example is based on an investment of $1,000 invested at the beginning of the period and held for the entire period (August 1, 2018 – January 31, 2019).
Actual Expenses: The first section of the table below provides information about actual account values and actual expenses. You may use the information in this section, together with the amount you invested, to estimate the expenses that you paid over the period. Simply divide your account value by $1,000 (for example, an $8,600 account value divided by $1,000 = 8.6), then multiply the result by the number in the first section under the heading entitled “Expenses Paid During Period” to estimate the expenses you paid on your account during this period.
Hypothetical Example for Comparison Purposes: The second section of the table below provides information about hypothetical account values and hypothetical expenses based on the actual Fund expense ratio and an assumed rate of return of 5% per year (before expenses), which is not the actual Fund return. The hypothetical account values and expenses may not be used to estimate the actual ending account balance or expenses you paid for the period. You may use this information to compare the ongoing costs of investing in your Fund and other funds. To do so, compare this 5% hypothetical example with the 5% hypothetical examples that appear in the shareholder reports of the other funds.
Please note that the expenses shown in the table are meant to highlight your ongoing costs only and do not reflect any transactional costs, such as sales charges (loads) or redemption fees (if applicable). Therefore, the second section of the table is useful in comparing ongoing costs only, and will not help you determine the relative total costs of owning different funds. In addition, if these transactional costs were included, your costs would be higher.
| | | | | | | | | | | | | | | | |
| | | Beginning
Account Value
(8/1/18) | | | Ending
Account Value
(1/31/19) | | | Expenses Paid
During Period*
(8/1/18 – 1/31/19) | | | Annualized
Expense
Ratio | |
| | | | |
Actual | | | | | | | | | | | | | | | | |
Class A | | $ | 1,000.00 | | | $ | 1,014.70 | | | $ | 5.03 | | | | 0.99 | % |
Class B | | $ | 1,000.00 | | | $ | 1,010.80 | | | $ | 8.77 | | | | 1.73 | % |
Class C | | $ | 1,000.00 | | | $ | 1,010.50 | | | $ | 8.77 | | | | 1.73 | % |
Class I | | $ | 1,000.00 | | | $ | 1,015.90 | | | $ | 3.76 | | | | 0.74 | % |
| | | | | |
Hypothetical | | | | | | | | | | | | | | | | |
(5% return per year before expenses) | | | | | | | | | | | | | | | | |
Class A | | $ | 1,000.00 | | | $ | 1,020.20 | | | $ | 5.04 | | | | 0.99 | % |
Class B | | $ | 1,000.00 | | | $ | 1,016.50 | | | $ | 8.79 | | | | 1.73 | % |
Class C | | $ | 1,000.00 | | | $ | 1,016.50 | | | $ | 8.79 | | | | 1.73 | % |
Class I | | $ | 1,000.00 | | | $ | 1,021.50 | | | $ | 3.77 | | | | 0.74 | % |
| * | Expenses are equal to the Fund’s annualized expense ratio for the indicated Class, multiplied by the average account value over the period, multiplied by 184/365 (to reflect the one-half year period). The Example assumes that the $1,000 was invested at the net asset value per share determined at the close of business on July 31, 2018. |
Eaton Vance
High Yield Municipal Income Fund
January 31, 2019
Portfolio of Investments
| | | | | | | | |
| Tax-Exempt Municipal Securities — 101.4% | |
| Security | | Principal
Amount
(000’s omitted) | | | Value | |
|
| Cogeneration — 1.1% | |
| | |
New York City Industrial Development Agency, NY, (Brooklyn Navy Yard Cogeneration Partners, L.P.), (AMT), 5.65%, 10/1/28 | | $ | 3,750 | | | $ | 3,755,737 | |
| | |
New York City Industrial Development Agency, NY, (Brooklyn Navy Yard Cogeneration Partners, L.P.), (AMT), 5.75%, 10/1/36 | | | 8,045 | | | | 8,057,631 | |
| | |
Northampton County Industrial Development Authority, PA, (Northampton Generating), 5.00%, 12/31/23(1) | | | 567 | | | | 170,156 | |
| | |
| | | | | | | $ | 11,983,524 | |
|
| Education — 4.0% | |
| | |
California Educational Facilities Authority, (Art Center College of Design), 5.00%, 12/1/44 | | $ | 3,000 | | | $ | 3,355,380 | |
| | |
California Municipal Finance Authority, (California Lutheran University), 5.00%, 10/1/34 | | | 1,225 | | | | 1,405,810 | |
| | |
California Municipal Finance Authority, (California Lutheran University), 5.00%, 10/1/36 | | | 1,250 | | | | 1,421,150 | |
| | |
California Municipal Finance Authority, (California Lutheran University), 5.00%, 10/1/38 | | | 1,500 | | | | 1,689,525 | |
| | |
Capital Trust Agency, FL, (Florida Charter Educational Foundation, Inc.), 5.375%, 6/15/38(2) | | | 545 | | | | 538,825 | |
| | |
Capital Trust Agency, FL, (Florida Charter Educational Foundation, Inc.), 5.375%, 6/15/48(2) | | | 1,020 | | | | 991,328 | |
| | |
Dutchess County Local Development Corp., NY, (Culinary Institute of America), 5.00%, 7/1/33 | | | 200 | | | | 222,178 | |
| | |
Dutchess County Local Development Corp., NY, (Culinary Institute of America), 5.00%, 7/1/34 | | | 240 | | | | 266,114 | |
| | |
Dutchess County Local Development Corp., NY, (Culinary Institute of America), 5.00%, 7/1/41 | | | 400 | | | | 433,144 | |
| | |
Florida Higher Educational Facilities Financing Authority, (Jacksonville University), 5.00%, 6/1/48(2) | | | 750 | | | | 775,943 | |
| | |
Forest Grove, OR, (Pacific University), 5.00%, 5/1/40 | | | 1,070 | | | | 1,118,054 | |
| | |
Massachusetts Development Finance Agency, (Wentworth Institute of Technology), 5.00%, 10/1/46 | | | 4,000 | | | | 4,313,400 | |
| | |
New York Dormitory Authority, (Cornell University), 5.00%, 7/1/34(3) | | | 10,000 | | | | 10,131,400 | |
| | |
Oregon Facilities Authority, (Lewis & Clark College), 5.625%, 10/1/36 | | | 1,325 | | | | 1,444,740 | |
| | |
Oregon Facilities Authority, (University of Portland), 5.00%, 4/1/35 | | | 1,000 | | | | 1,128,330 | |
| | |
Romeoville, IL, (Lewis University), 5.00%, 10/1/27 | | | 1,000 | | | | 1,099,850 | |
| | |
Romeoville, IL, (Lewis University), 5.00%, 10/1/29 | | | 1,000 | | | | 1,088,180 | |
| | |
Romeoville, IL, (Lewis University), 5.00%, 10/1/30 | | | 1,000 | | | | 1,081,830 | |
| | |
Romeoville, IL, (Lewis University), 5.00%, 10/1/35 | | | 2,000 | | | | 2,122,680 | |
| | |
University of California, 5.00%, 5/15/38(3) | | | 10,000 | | | | 11,064,200 | |
| | |
| | | | | | | $ | 45,692,061 | |
| | | | | | | | |
| Security | | Principal
Amount
(000’s omitted) | | | Value | |
|
| Electric Utilities — 3.0% | |
| | |
Apache County Industrial Development Authority, AZ, (Tucson Electric Power Co.), 4.50%, 3/1/30 | | $ | 3,845 | | | $ | 4,026,984 | |
| | |
Arkansas River Power Authority, CO, 5.00%, 10/1/31 | | | 1,500 | | | | 1,662,225 | |
| | |
Arkansas River Power Authority, CO, 5.00%, 10/1/32 | | | 1,500 | | | | 1,657,080 | |
| | |
Arkansas River Power Authority, CO, 5.00%, 10/1/38 | | | 2,825 | | | | 3,044,644 | |
| | |
Burke County Development Authority, GA, (Oglethorpe Power Corp.), 4.125%, 11/1/45 | | | 13,750 | | | | 13,411,750 | |
| | |
Hawaii Department of Budget and Finance, (Hawaiian Electric Co.), 6.50%, 7/1/39 | | | 730 | | | | 743,089 | |
| | |
Hawaii Department of Budget and Finance, (Hawaiian Electric Co.), (AMT), 4.00%, 3/1/37 | | | 7,500 | | | | 7,577,250 | |
| | |
Pima County Industrial Development Authority, AZ, (Tucson Electric Power Co.), 4.00%, 9/1/29 | | | 1,520 | | | | 1,579,645 | |
| | |
Pima County Industrial Development Authority, AZ, (Tucson Electric Power Co.), 5.25%, 10/1/40 | | | 210 | | | | 219,107 | |
| | |
Vernon, CA, Electric System Revenue, 5.125%, 8/1/21 | | | 320 | | | | 324,720 | |
| | |
| | | | | | | $ | 34,246,494 | |
|
| Escrowed / Prerefunded — 3.1% | |
| | |
Brooklyn Arena Local Development Corp., NY, (Barclays Center), Prerefunded to 1/15/20, 6.00%, 7/15/30 | | $ | 1,150 | | | $ | 1,198,035 | |
| | |
Brooklyn Arena Local Development Corp., NY, (Barclays Center), Prerefunded to 1/15/20, 6.25%, 7/15/40 | | | 1,290 | | | | 1,346,902 | |
| | |
Brooklyn Arena Local Development Corp., NY, (Barclays Center), Prerefunded to 1/15/20, 6.375%, 7/15/43 | | | 700 | | | | 731,696 | |
| | |
Dawson Ridge Metropolitan District No. 1, CO, Escrowed to Maturity, 0.00%, 10/1/22 | | | 3,500 | | | | 3,263,680 | |
| | |
Hawaii Department of Budget and Finance, (Hawaii Pacific Health Obligated Group), Prerefunded to 7/1/20, 5.50%, 7/1/40 | | | 6,555 | | | | 6,895,401 | |
| | |
Johnson City Health and Educational Facilities Board, TN, (Mountain States Health Alliance), Prerefunded to 7/1/20, 6.00%, 7/1/38 | | | 3,335 | | | | 3,531,265 | |
| | |
Massachusetts Development Finance Agency, (Tufts Medical Center), Prerefunded to 1/1/21, 6.75%, 1/1/36 | | | 1,205 | | | | 1,316,137 | |
| | |
Onondaga Civic Development Corp., NY, (St. Joseph’s Hospital Health Center), Prerefunded to 7/1/19, 5.125%, 7/1/31 | | | 2,500 | | | | 2,535,575 | |
| | |
Pennsylvania Turnpike Commission, Prerefunded to 12/1/20, 5.35%, 12/1/30 | | | 150 | | | | 159,793 | |
| | |
Pennsylvania Turnpike Commission, Prerefunded to 12/1/20, 5.35%, 12/1/30 | | | 195 | | | | 207,732 | |
| | |
Pennsylvania Turnpike Commission, Prerefunded to 12/1/20, 5.45%, 12/1/35 | | | 1,125 | | | | 1,200,465 | |
| | |
Southwestern Illinois Development Authority, (Memorial Group, Inc.), Prerefunded to 11/1/23, 7.25%, 11/1/33 | | | 1,455 | | | | 1,806,310 | |
| | |
Vernon, CA, Electric System Revenue, Prerefunded to 8/1/19, 5.125%, 8/1/21 | | | 150 | | | | 152,631 | |
| | | | |
| | 7 | | See Notes to Financial Statements. |
Eaton Vance
High Yield Municipal Income Fund
January 31, 2019
Portfolio of Investments — continued
| | | | | | | | |
| Security | | Principal
Amount
(000’s omitted) | | | Value | |
|
| Escrowed / Prerefunded (continued) | |
| | |
Washington, Prerefunded to 2/1/21, 5.25%, 2/1/36(3) | | $ | 10,000 | | | $ | 10,702,500 | |
| | |
| | | | | | | $ | 35,048,122 | |
|
| General Obligations — 6.6% | |
| | |
California, 5.00%, 9/1/32 | | $ | 11,705 | | | $ | 13,107,610 | |
| | |
Centennial Independent School District No. 12, Circle Pines, MN, 0.00%, 2/1/31 | | | 1,225 | | | | 813,780 | |
| | |
Centennial Independent School District No. 12, Circle Pines, MN, 0.00%, 2/1/33 | | | 1,500 | | | | 901,965 | |
| | |
Chicago Board of Education, IL, 5.00%, 12/1/21 | | | 790 | | | | 821,355 | |
| | |
Chicago Board of Education, IL, 5.00%, 12/1/26 | | | 1,595 | | | | 1,691,274 | |
| | |
Chicago Board of Education, IL, 5.00%, 12/1/46 | | | 9,935 | | | | 10,018,752 | |
| | |
Chicago Board of Education, IL, 5.00%, 12/1/46 | | | 1,875 | | | | 1,883,644 | |
| | |
Detroit, MI, 5.00%, 4/1/30 | | | 1,400 | | | | 1,506,400 | |
| | |
Detroit, MI, 5.00%, 4/1/31 | | | 865 | | | | 923,215 | |
| | |
Illinois, 5.00%, 11/1/30 | | | 7,200 | | | | 7,655,184 | |
| | |
Illinois, 5.00%, 5/1/33 | | | 9,480 | | | | 9,981,113 | |
| | |
Illinois, 5.00%, 5/1/35 | | | 3,500 | | | | 3,597,125 | |
| | |
Illinois, 5.00%, 5/1/39 | | | 8,165 | | | | 8,451,591 | |
| | |
Illinois, 5.25%, 7/1/30 | | | 2,800 | | | | 2,933,140 | |
| | |
San Luis Coastal Unified School District, CA, (Election of 2014), 5.00%, 8/1/37 | | | 2,000 | | | | 2,294,040 | |
| | |
Will and Cook Counties Community High School District No. 210, IL, 3.375%, 1/1/33 | | | 350 | | | | 285,180 | |
| | |
Will and Cook Counties Community High School District No. 210, IL, 5.00%, 1/1/28 | | | 3,500 | | | | 3,590,930 | |
| | |
Will County Community Unit School District No. 365-U, IL, (Valley View), 5.75%, 11/1/32 | | | 3,855 | | | | 4,260,430 | |
| | |
| | | | | | | $ | 74,716,728 | |
|
| Health Care - Miscellaneous — 0.0%(4) | |
| | |
Illinois Development Finance Authority, (Community Rehabilitation Providers), 5.60%, 7/1/19 | | $ | 300 | | | $ | 299,352 | |
| | |
| | | | | | | $ | 299,352 | |
|
| Hospital — 9.3% | |
| | |
Arkansas Development Finance Authority, (Washington Regional Medical Center), 5.00%, 2/1/33 | | $ | 2,200 | | | $ | 2,419,384 | |
| | |
California Municipal Finance Authority, (NorthBay Healthcare Group), 5.00%, 11/1/35 | | | 250 | | | | 267,460 | |
| | |
California Municipal Finance Authority, (NorthBay Healthcare Group), 5.00%, 11/1/40 | | | 550 | | | | 581,114 | |
| | |
California Municipal Finance Authority, (NorthBay Healthcare Group), 5.00%, 11/1/44 | | | 500 | | | | 526,180 | |
| | |
California Public Finance Authority, (Henry Mayo Newhall Hospital), 5.00%, 10/15/37 | | | 1,000 | | | | 1,081,460 | |
| | | | | | | | |
| Security | | Principal
Amount
(000’s omitted) | | | Value | |
|
| Hospital (continued) | |
| | |
California Statewide Communities Development Authority, (Methodist Hospital of Southern California), 5.00%, 1/1/48 | | $ | 2,400 | | | $ | 2,589,480 | |
| | |
Camden County Improvement Authority, NJ, (Cooper Health System), 5.00%, 2/15/29 | | | 1,000 | | | | 1,100,090 | |
| | |
Camden County Improvement Authority, NJ, (Cooper Health System), 5.00%, 2/15/32 | | | 2,000 | | | | 2,163,140 | |
| | |
Charlotte-Mecklenburg Hospital Authority, NC, (Carolinas HealthCare System), (SPA: JPMorgan Chase Bank, N.A.),
1.65%, 1/15/38(5) | | | 800 | | | | 800,000 | |
| | |
Crawford County Hospital Authority, PA, (Meadville Medical Center), 6.00%, 6/1/46 | | | 3,175 | | | | 3,395,599 | |
| | |
Cuyahoga County, OH, (The MetroHealth System), 5.00%, 2/15/31 | | | 1,500 | | | | 1,645,305 | |
| | |
Cuyahoga County, OH, (The MetroHealth System), 5.00%, 2/15/32 | | | 1,500 | | | | 1,637,655 | |
| | |
Decatur Hospital Authority, TX, (Wise Regional Health System), 5.00%, 9/1/34 | | | 1,625 | | | | 1,741,496 | |
| | |
Decatur Hospital Authority, TX, (Wise Regional Health System), 5.25%, 9/1/29 | | | 1,675 | | | | 1,850,808 | |
| | |
Decatur Hospital Authority, TX, (Wise Regional Health System), 5.25%, 9/1/44 | | | 8,880 | | | | 9,424,966 | |
| | |
Illinois Finance Authority, (Presence Health Network), 3.75%, 2/15/34 | | | 2,965 | | | | 2,987,504 | |
| | |
Indiana County Hospital Authority, PA, (Indiana Regional Medical Center), 5.50%, 6/1/29 | | | 710 | | | | 757,684 | |
| | |
Indiana County Hospital Authority, PA, (Indiana Regional Medical Center), 6.00%, 6/1/39 | | | 3,805 | | | | 4,090,185 | |
| | |
Jefferson County Civic Facility Development Corp., NY, (Samaritan Medical Center), 5.00%, 11/1/37 | | | 2,860 | | | | 3,139,851 | |
| | |
Martin County Health Facilities Authority, FL, (Martin Memorial Medical Center), 4.25%, 11/15/41 | | | 3,940 | | | | 3,973,963 | |
| | |
Massachusetts Development Finance Agency, (Tufts Medical Center), 6.75%, 1/1/36 | | | 800 | | | | 870,152 | |
| | |
Muskingum County, OH, (Genesis HealthCare System Obligated Group), 5.00%, 2/15/33 | | | 2,775 | | | | 2,879,423 | |
| | |
New Jersey Health Care Facilities Financing Authority, (Robert Wood Johnson University Hospital), 5.00%, 7/1/39 | | | 2,175 | | | | 2,395,197 | |
| | |
New York Dormitory Authority, (Orange Regional Medical Center), 5.00%, 12/1/32(2) | | | 1,000 | | | | 1,115,120 | |
| | |
New York Dormitory Authority, (Orange Regional Medical Center), 5.00%, 12/1/33(2) | | | 1,000 | | | | 1,112,050 | |
| | |
New York Dormitory Authority, (Orange Regional Medical Center), 5.00%, 12/1/34(2) | | | 3,900 | | | | 4,319,133 | |
| | |
New York Dormitory Authority, (Orange Regional Medical Center), 5.00%, 12/1/35(2) | | | 1,000 | | | | 1,103,670 | |
| | |
New York Dormitory Authority, (Orange Regional Medical Center), 5.00%, 12/1/40(2) | | | 2,300 | | | | 2,469,809 | |
| | | | |
| | 8 | | See Notes to Financial Statements. |
Eaton Vance
High Yield Municipal Income Fund
January 31, 2019
Portfolio of Investments — continued
| | | | | | | | |
| Security | | Principal
Amount
(000’s omitted) | | | Value | |
|
| Hospital (continued) | |
| | |
Oklahoma Development Finance Authority, (OU Medicine), 5.00%, 8/15/38 | | $ | 1,025 | | | $ | 1,103,863 | |
| | |
Oklahoma Development Finance Authority, (OU Medicine), 5.25%, 8/15/43 | | | 8,045 | | | | 8,815,228 | |
| | |
Palm Beach County Health Facilities Authority, FL, (BRRH Corp. Obligated Group), 5.00%, 12/1/31 | | | 6,250 | | | | 6,829,375 | |
| | |
South Lake County Hospital District, FL, (South Lake Hospital), 6.25%, 4/1/39 | | | 3,065 | | | | 3,081,827 | |
| | |
Southeastern Ohio Port Authority, (Memorial Health System Obligated Group), 5.00%, 12/1/35 | | | 3,100 | | | | 3,252,923 | |
| | |
Southeastern Ohio Port Authority, (Memorial Health System Obligated Group), 5.75%, 12/1/32 | | | 4,050 | | | | 4,332,933 | |
| | |
Tarrant County Cultural Education Facilities Finance Corp., TX, (Cook Children’s Medical Center), 5.25%, 12/1/39(3) | | | 7,000 | | | | 7,765,380 | |
| | |
Ward County, ND, (Trinity Obligated Group), 5.00%, 6/1/38 | | | 2,500 | | | | 2,686,800 | |
| | |
West Virginia Hospital Finance Authority, (West Virginia United Health System Obligated Group), 5.375%, 6/1/38 | | | 2,580 | | | | 2,819,037 | |
| | |
Yavapai County Industrial Development Authority, AZ, (Yavapai Regional Medical Center), 5.25%, 8/1/33 | | | 2,500 | | | | 2,740,225 | |
| | |
| | | | | | | $ | 105,865,469 | |
|
| Housing — 1.8% | |
| | |
Centerline Equity Issuer Trust, TN, 6.00%, 5/15/19(2) | | $ | 4,000 | | | $ | 4,039,280 | |
| | |
East Hempfield Township Industrial Development Authority, PA, (Student Services, Inc.), 5.00%, 7/1/34 | | | 750 | | | | 789,855 | |
| | |
East Hempfield Township Industrial Development Authority, PA, (Student Services, Inc.), 5.00%, 7/1/39 | | | 1,250 | | | | 1,298,500 | |
| | |
New Hope Cultural Education Facilities Finance Corp., TX, (CHF-Collegiate Housing Corpus Christi II, LLC - Texas A&M University), 5.00%, 4/1/36 | | | 490 | | | | 487,731 | |
| | |
New Hope Cultural Education Facilities Finance Corp., TX, (CHF-Collegiate Housing Galveston I, LLC - Texas A&M University), 5.00%, 4/1/34 | | | 3,885 | | | | 3,946,500 | |
| | |
New Hope Cultural Education Facilities Finance Corp., TX, (CHF-Collegiate Housing Galveston I, LLC - Texas A&M University), 5.00%, 4/1/39 | | | 3,500 | | | | 3,510,815 | |
| | |
New Hope Cultural Education Facilities Finance Corp., TX, (CHF-Collegiate Housing Island Campus, LLC - Texas A&M University-Corpus Christi), 5.00%, 4/1/37 | | | 1,500 | | | | 1,487,535 | |
| | |
New Hope Cultural Education Facilities Finance Corp., TX, (CHF-Collegiate Housing Stephenville III, LLC - Tarleton State University), 5.00%, 4/1/30 | | | 800 | | | | 860,872 | |
| | |
New Hope Cultural Education Facilities Finance Corp., TX, (CHF-Collegiate Housing Stephenville III, LLC - Tarleton State University), 5.00%, 4/1/35 | | | 1,000 | | | | 1,056,290 | |
| | |
Texas Student Housing Corp., (University of North Texas), 9.375%, 7/1/06(6) | | | 860 | | | | 761,100 | |
| | | | | | | | |
| Security | | Principal
Amount
(000’s omitted) | | | Value | |
|
| Housing (continued) | |
| | |
Texas Student Housing Corp., (University of North Texas), 11.00%, 7/1/31(6) | | $ | 2,000 | | | $ | 1,770,000 | |
| | |
| | | | | | | $ | 20,008,478 | |
|
| Industrial Development Revenue — 9.8% | |
| | |
Clayton County Development Authority, GA, (Delta Air Lines, Inc.), 8.75%, 6/1/29 | | $ | 1,180 | | | $ | 1,278,046 | |
| | |
Denver City and County, CO, (United Airlines), (AMT), 5.00%, 10/1/32 | | | 1,890 | | | | 1,991,682 | |
| | |
Essex County Improvement Authority, NJ, (Covanta), (AMT), 5.25%, 7/1/45(2) | | | 7,175 | | | | 7,203,628 | |
| | |
Florida Development Finance Corp., (Waste Pro USA, Inc.), (AMT), 5.00% to 8/1/22 (Put Date), 8/1/29(2) | | | 1,250 | | | | 1,282,563 | |
| | |
Louisiana Public Facilities Authority, (Cleco Power LLC), 4.25%, 12/1/38 | | | 8,750 | | | | 8,919,662 | |
| | |
Maine Finance Authority, (Casella Waste Systems, Inc.), (AMT), 5.125% to 8/1/25 (Put Date), 8/1/35(2) | | | 1,880 | | | | 1,947,642 | |
| | |
Maricopa County Pollution Control Corp., AZ, (El Paso Electric Co.), 4.50%, 8/1/42 | | | 6,500 | | | | 6,662,435 | |
| | |
Maryland Economic Development Corp., (AFCO Cargo), (AMT), 3.50%, 7/1/24(2) | | | 1,810 | | | | 1,832,788 | |
| | |
Matagorda County Navigation District No. 1, TX, (AEP Texas Central Co.), Series 2008-1, 4.00%, 6/1/30 | | | 1,000 | | | | 1,028,810 | |
| | |
Matagorda County Navigation District No. 1, TX, (AEP Texas Central Co.), Series 2008-2, 4.00%, 6/1/30 | | | 6,155 | | | | 6,332,326 | |
| | |
Mississippi Business Finance Corp., (Waste Pro USA, Inc.), (AMT), 5.00% to 8/1/22 (Put Date), 2/1/36(2) | | | 1,500 | | | | 1,539,075 | |
| | |
National Finance Authority, NH, (Covanta), 4.625%, 11/1/42(2) | | | 6,335 | | | | 6,108,904 | |
| | |
National Finance Authority, NH, (Covanta), (AMT), 4.875%, 11/1/42(2) | | | 6,965 | | | | 6,863,311 | |
| | |
New Hampshire Business Finance Authority, (Casella Waste Systems, Inc.), (AMT), 4.00% to 10/1/19 (Put Date), 4/1/29(2) | | | 1,285 | | | | 1,293,108 | |
| | |
New Jersey Economic Development Authority, (Continental Airlines), (AMT), 5.25%, 9/15/29 | | | 8,285 | | | | 8,993,450 | |
| | |
New Jersey Economic Development Authority, (Continental Airlines), (AMT), 5.50%, 6/1/33 | | | 4,375 | | | | 4,803,969 | |
| | |
New Jersey Economic Development Authority, (Continental Airlines), Series 2000A, (AMT), 5.625%, 11/15/30 | | | 760 | | | | 857,280 | |
| | |
New Jersey Economic Development Authority, (Continental Airlines), Series 2000B, (AMT), 5.625%, 11/15/30 | | | 1,285 | | | | 1,450,135 | |
| | |
New Jersey Economic Development Authority, (New Jersey-American Water Co., Inc.), (AMT), 5.70%, 10/1/39 | | | 6,245 | | | | 6,375,708 | |
| | |
New York State Environmental Facilities Corp., (Casella Waste Systems, Inc.), (AMT), 3.125% to 6/1/26 (Put Date), 12/1/44(2) | | | 5,500 | | | | 5,029,090 | |
| | | | |
| | 9 | | See Notes to Financial Statements. |
Eaton Vance
High Yield Municipal Income Fund
January 31, 2019
Portfolio of Investments — continued
| | | | | | | | |
| Security | | Principal
Amount
(000’s omitted) | | | Value | |
|
| Industrial Development Revenue (continued) | |
| | |
Ohio Air Quality Development Authority, (Pratt Paper, LLC), (AMT), 4.25%, 1/15/38(2) | | $ | 1,000 | | | $ | 998,690 | |
| | |
Phenix City Industrial Development Board, AL, (MeadWestvaco Coated Board), (AMT), 4.125%, 5/15/35 | | | 13,570 | | | | 13,497,672 | |
| | |
Public Finance Authority, WI, (Celanese Corp.), (AMT), 4.30%, 11/1/30 | | | 5,000 | | | | 5,080,650 | |
| | |
Rockdale County Development Authority, GA, (Pratt Paper, LLC), (AMT),
4.00%, 1/1/38(2) | | | 1,340 | | | | 1,295,030 | |
| | |
Selma Industrial Development Board, AL, (International Paper Co.), 5.80%, 5/1/34 | | | 4,230 | | | | 4,402,076 | |
| | |
Vermont Economic Development Authority, (Casella Waste Systems, Inc.), (AMT), 4.625% to 4/3/28 (Put Date), 4/1/36(2) | | | 475 | | | | 476,207 | |
| | |
Virginia Small Business Financing Authority, (Covanta), (AMT), 5.00% to 7/1/38 (Put Date), 1/1/48(2) | | | 1,440 | | | | 1,468,440 | |
| | |
Washington Economic Development Finance Authority, (Columbia Pulp I, LLC), (AMT), 7.50%, 1/1/32(2) | | | 2,260 | | | | 2,534,206 | |
| | |
| | | | | | | $ | 111,546,583 | |
|
| Insured – General Obligations — 2.3% | |
| | |
Atlantic City, NJ, (AGM), 4.00%, 3/1/42 | | $ | 480 | | | $ | 491,462 | |
| | |
Atlantic City, NJ, (BAM), 5.00%, 3/1/42 | | | 1,250 | | | | 1,367,988 | |
| | |
Chicago Board of Education, IL, (AGM), 5.00%, 12/1/26 | | | 500 | | | | 568,890 | |
| | |
Irvington Township, NJ, (AGM), 5.00%, 7/15/32 | | | 1,000 | | | | 1,123,310 | |
| | |
McHenry County Community Unit School District No. 12, IL, (Johnsburg), (AGM), 5.00%, 1/1/31 | | | 3,175 | | | | 3,461,226 | |
| | |
McHenry County Community Unit School District No. 12, IL, (Johnsburg), (AGM), 5.00%, 1/1/32 | | | 1,215 | | | | 1,321,057 | |
| | |
McHenry County Community Unit School District No. 12, IL, (Johnsburg), (AGM), 5.00%, 1/1/33 | | | 1,405 | | | | 1,524,973 | |
| | |
McHenry County Community Unit School District No. 12, IL, (Johnsburg), (AGM), 5.00%, 7/1/34 | | | 2,810 | | | | 3,045,956 | |
| | |
North Las Vegas, NV, (AGM), 4.00%, 6/1/36 | | | 5,055 | | | | 5,238,092 | |
| | |
Oyster Bay, NY, (AGM), 4.00%, 8/1/31 | | | 2,415 | | | | 2,507,495 | |
| | |
Proviso Township High School District No. 209, IL, (AGM), 4.00%, 12/1/38 | | | 5,000 | | | | 5,052,500 | |
| | |
| | | | | | | $ | 25,702,949 | |
|
| Insured – Other Revenue — 2.1% | |
| | |
Harris County-Houston Sports Authority, TX, (AGM), (NPFG), 0.00%, 11/15/34 | | $ | 12,700 | | | $ | 6,536,690 | |
| | |
Harris County-Houston Sports Authority, TX, (NPFG), 0.00%, 11/15/26 | | | 10,510 | | | | 8,097,429 | |
| | |
Harris County-Houston Sports Authority, TX, (NPFG), 0.00%, 11/15/28 | | | 10,000 | | | | 7,108,600 | |
| | | | | | | | |
| Security | | Principal
Amount
(000’s omitted) | | | Value | |
|
| Insured – Other Revenue (continued) | |
| | |
New York City Industrial Development Agency, NY, (Yankee Stadium), (AGC), 0.00%, 3/1/34 | | $ | 3,500 | | | $ | 2,050,020 | |
| | |
| | | | | | | $ | 23,792,739 | |
|
| Insured – Special Tax Revenue — 2.3% | |
| | |
Illinois Sports Facilities Authority, (AMBAC), 0.00%, 6/15/25 | | $ | 400 | | | $ | 317,356 | |
| | |
Illinois Sports Facilities Authority, (AMBAC), 0.00%, 6/15/26 | | | 1,970 | | | | 1,497,397 | |
| | |
Miami-Dade County, FL, Professional Sports Franchise Facilities, (AGC), 7.00%, (0.00% until 10/1/19), 10/1/39 | | | 14,500 | | | | 18,817,955 | |
| | |
Tolomato Community Development District, FL, (AGM), 3.75%, 5/1/39 | | | 2,575 | | | | 2,542,478 | |
| | |
Tolomato Community Development District, FL, (AGM), 3.75%, 5/1/40 | | | 3,030 | | | | 2,977,520 | |
| | |
| | | | | | | $ | 26,152,706 | |
|
| Insured – Transportation — 4.5% | |
| | |
Chicago, IL, (O’Hare International Airport), (AGM), 5.25%, 1/1/32 | | $ | 1,500 | | | $ | 1,651,470 | |
| | |
Chicago, IL, (O’Hare International Airport), (AGM), 5.25%, 1/1/33 | | | 650 | | | | 714,370 | |
| | |
Chicago, IL, (O’Hare International Airport), (AGM), 5.50%, 1/1/43 | | | 1,355 | | | | 1,492,153 | |
| | |
E-470 Public Highway Authority, CO, (NPFG), 0.00%, 9/1/33 | | | 15,000 | | | | 6,845,850 | |
| | |
E-470 Public Highway Authority, CO, (NPFG), 0.00%, 9/1/34 | | | 20,000 | | | | 8,622,000 | |
| | |
E-470 Public Highway Authority, CO, (NPFG), 0.00%, 9/1/37 | | | 6,665 | | | | 2,878,480 | |
| | |
Foothill/Eastern Transportation Corridor Agency, CA, (AGM), 5.625%, (0.00% until 1/15/24), 1/15/32 | | | 1,955 | | | | 1,912,850 | |
| | |
New Jersey Economic Development Authority, (The Goethals Bridge Replacement), (AGM), (AMT), 5.125%, 7/1/42 | | | 1,805 | | | | 1,934,491 | |
| | |
New York Transportation Development Corp., (LaGuardia Airport Terminal B Redevelopment), (AGM), (AMT), 4.00%, 7/1/37 | | | 3,000 | | | | 3,043,680 | |
| | |
North Texas Tollway Authority, (AGC), 6.20%, 1/1/42 | | | 10,000 | | | | 12,044,700 | |
| | |
Ohio, (Portsmouth Gateway Group, LLC), (AGM), (AMT), 5.00%, 12/31/27 | | | 1,150 | | | | 1,307,504 | |
| | |
Ohio, (Portsmouth Gateway Group, LLC), (AGM), (AMT), 5.00%, 12/31/28 | | | 1,600 | | | | 1,812,080 | |
| | |
Texas Turnpike Authority, (AMBAC), 0.00%, 8/15/30 | | | 9,440 | | | | 6,546,262 | |
| | |
| | | | | | | $ | 50,805,890 | |
|
| Insured – Water and Sewer — 0.7% | |
| | |
Jefferson County, AL, Sewer Revenue, (AGM), 0.00%, 10/1/27 | | $ | 2,155 | | | $ | 1,554,876 | |
| | |
Jefferson County, AL, Sewer Revenue, (AGM), 0.00%, 10/1/28 | | | 3,965 | | | | 2,675,384 | |
| | | | |
| | 10 | | See Notes to Financial Statements. |
Eaton Vance
High Yield Municipal Income Fund
January 31, 2019
Portfolio of Investments — continued
| | | | | | | | |
| Security | | Principal
Amount
(000’s omitted) | | | Value | |
|
| Insured – Water and Sewer (continued) | |
| | |
Jefferson County, AL, Sewer Revenue, (AGM), 0.00%, 10/1/29 | | $ | 3,035 | | | $ | 1,910,502 | |
| | |
Jefferson County, AL, Sewer Revenue, (AGM), 0.00%, 10/1/30 | | | 2,580 | | | | 1,511,467 | |
| | |
| | | | | | | $ | 7,652,229 | |
|
| Lease Revenue / Certificates of Participation — 2.2% | |
| | |
Charleston Educational Excellence Financing Corp., SC, (Charleston County School District), 5.00%, 12/1/29(3) | | $ | 10,875 | | | $ | 12,293,317 | |
| | |
Hudson Yards Infrastructure Corp., NY, 5.75%, 2/15/47 | | | 945 | | | | 1,015,365 | |
| | |
Hudson Yards Infrastructure Corp., NY, Prerefunded to 2/15/21, 5.75%, 2/15/47 | | | 1,535 | | | | 1,661,438 | |
| | |
New Jersey Economic Development Authority, (School Facilities Construction), 5.00%, 6/15/43 | | | 10,000 | | | | 10,524,500 | |
| | |
| | | | | | | $ | 25,494,620 | |
|
| Nursing Home — 0.1% | |
| | |
Mississippi Business Finance Corp., (Magnolia Healthcare), 7.99%, 7/1/25 | | $ | 640 | | | $ | 649,210 | |
| | |
| | | | | | | $ | 649,210 | |
|
| Other Revenue — 4.0% | |
| | |
Austin Convention Enterprises, Inc., TX, (Convention Center Hotel), 5.00%, 1/1/31 | | $ | 500 | | | $ | 565,040 | |
| | |
Austin Convention Enterprises, Inc., TX, (Convention Center Hotel), 5.00%, 1/1/32 | | | 500 | | | | 562,060 | |
| | |
Austin Convention Enterprises, Inc., TX, (Convention Center Hotel), 5.00%, 1/1/33 | | | 600 | | | | 671,802 | |
| | |
Austin Convention Enterprises, Inc., TX, (Convention Center Hotel), 5.00%, 1/1/34 | | | 500 | | | | 557,620 | |
| | |
Brooklyn Arena Local Development Corp., NY, (Barclays Center), 0.00%, 7/15/32 | | | 250 | | | | 150,895 | |
| | |
Brooklyn Arena Local Development Corp., NY, (Barclays Center), 0.00%, 7/15/33 | | | 3,300 | | | | 1,886,049 | |
| | |
Brooklyn Arena Local Development Corp., NY, (Barclays Center), 0.00%, 7/15/46 | | | 8,950 | | | | 2,520,857 | |
| | |
Build NYC Resource Corp., NY, (YMCA of Greater New York), 4.00%, 8/1/31 | | | 650 | | | | 679,484 | |
| | |
Build NYC Resource Corp., NY, (YMCA of Greater New York), 4.00%, 8/1/36 | | | 875 | | | | 898,669 | |
| | |
Central Falls Detention Facility Corp., RI, 7.25%, 7/15/35(6) | | | 6,250 | | | | 1,125,000 | |
| | |
Cleveland-Cuyahoga County Port Authority, OH, (Playhouse Square Foundation), 5.25%, 12/1/38 | | | 430 | | | | 469,999 | |
| | |
Cleveland-Cuyahoga County Port Authority, OH, (Playhouse Square Foundation), 5.50%, 12/1/43 | | | 285 | | | | 313,594 | |
| | |
Cleveland-Cuyahoga County Port Authority, OH, (Playhouse Square Foundation), 5.50%, 12/1/53 | | | 490 | | | | 537,922 | |
| | | | | | | | |
| Security | | Principal
Amount
(000’s omitted) | | | Value | |
|
| Other Revenue (continued) | |
| | |
Kalispel Tribe of Indians, WA, 5.25%, 1/1/38(2) | | $ | 1,260 | | | $ | 1,344,874 | |
| | |
Morongo Band of Mission Indians, CA, 5.00%, 10/1/42(2) | | | 2,040 | | | | 2,093,326 | |
| | |
New York City Transitional Finance Authority, NY, (Building Aid), 5.00%, 7/15/37(3) | | | 10,000 | | | | 11,156,800 | |
| | |
Non-Profit Preferred Funding Trust I, Various States, Series D, 5.17%, 9/15/37(2) | | | 6,446 | | | | 5,770,455 | |
| | |
Salt Verde Financial Corp., AZ, Senior Gas Revenue, 5.00%, 12/1/37 | | | 5,105 | | | | 5,945,742 | |
| | |
Texas Municipal Gas Acquisition and Supply Corp. III, Gas Supply Revenue, 5.00%, 12/15/30 | | | 1,860 | | | | 1,994,701 | |
| | |
White Earth Band of Chippewa Indians, MN, 6.375%, 12/1/26(2) | | | 5,785 | | | | 5,785,983 | |
| | |
Will and Kankakee Counties Community Unit School District No. 255-U, IL, 4.00%, 6/1/30 | | | 700 | | | | 727,335 | |
| | |
| | | | | | | $ | 45,758,207 | |
|
| Senior Living / Life Care — 11.9% | |
| | |
Albemarle County Economic Development Authority, VA, (Westminster-Canterbury of the Blue Ridge), 5.00%, 1/1/42 | | $ | 1,350 | | | $ | 1,377,769 | |
| | |
Atlantic Beach, FL, (Fleet Landing), 5.00%, 11/15/37 | | | 7,945 | | | | 8,311,741 | |
| | |
Atlantic Beach, FL, (Fleet Landing), 5.00%, 11/15/38 | | | 1,000 | | | | 1,065,220 | |
| | |
Centerville, OH, (Graceworks Lutheran Services), 5.25%, 11/1/37 | | | 3,250 | | | | 3,395,632 | |
| | |
Centerville, OH, (Graceworks Lutheran Services), 5.25%, 11/1/47 | | | 3,190 | | | | 3,291,251 | |
| | |
Clackamas County Hospital Facility Authority, OR, (Mary’s Woods at Marylhurst), 5.00%, 5/15/38 | | | 225 | | | | 236,021 | |
| | |
Clackamas County Hospital Facility Authority, OR, (Mary’s Woods at Marylhurst), 5.00%, 5/15/43 | | | 310 | | | | 323,426 | |
| | |
Clackamas County Hospital Facility Authority, OR, (Mary’s Woods at Marylhurst), 5.00%, 5/15/48 | | | 425 | | | | 441,911 | |
| | |
Colorado Health Facilities Authority, (Covenant Retirement Communities, Inc.), 5.00%, 12/1/33 | | | 5,000 | | | | 5,322,400 | |
| | |
Colorado Health Facilities Authority, (Frasier Meadows Retirement Community), 5.25%, 5/15/37 | | | 750 | | | | 805,635 | |
| | |
Connecticut Health and Educational Facilities Authority, (Church Home of Hartford, Inc.), 5.00%, 9/1/46(2) | | | 1,000 | | | | 1,013,810 | |
| | |
Delaware Economic Development Authority, (ACTS Retirement-Life Communities, Inc. Obligated Group), 5.00%, 11/15/48 | | | 1,250 | | | | 1,349,237 | |
| | |
District of Columbia, (Ingleside at Rock Creek), 3.875%, 7/1/24 | | | 840 | | | | 839,992 | |
| | |
District of Columbia, (Ingleside at Rock Creek), 5.00%, 7/1/32 | | | 600 | | | | 622,488 | |
| | |
Franklin County Industrial Development Authority, PA, (Menno-Haven, Inc.), 5.00%, 12/1/38 | | | 1,000 | | | | 1,021,750 | |
| | | | |
| | 11 | | See Notes to Financial Statements. |
Eaton Vance
High Yield Municipal Income Fund
January 31, 2019
Portfolio of Investments — continued
| | | | | | | | |
| Security | | Principal
Amount
(000’s omitted) | | | Value | |
|
| Senior Living / Life Care (continued) | |
| | |
Hanover County Economic Development Authority, VA, (Covenant Woods), 5.00%, 7/1/38 | | $ | 125 | | | $ | 128,800 | |
| | |
Harris County Cultural Education Facilities Finance Corp., TX, (Brazos Presbyterian Homes, Inc.), 5.75%, 1/1/28 | | | 415 | | | | 448,188 | |
| | |
Harris County Cultural Education Facilities Finance Corp., TX, (Brazos Presbyterian Homes, Inc.), 6.375%, 1/1/33 | | | 655 | | | | 719,439 | |
| | |
Hawaii Department of Budget and Finance, (Kahala Senior Living Community, Inc.), 5.125%, 11/15/32 | | | 525 | | | | 574,004 | |
| | |
Hawaii Department of Budget and Finance, (Kahala Senior Living Community, Inc.), 5.25%, 11/15/37 | | | 480 | | | | 522,787 | |
| | |
Howard County, MD, (Vantage House), 5.00%, 4/1/36 | | | 1,725 | | | | 1,751,444 | |
| | |
Illinois Finance Authority, (Plymouth Place, Inc.), 5.00%, 5/15/37 | | | 1,000 | | | | 1,017,170 | |
| | |
Indiana Finance Authority, (Marquette), 5.00%, 3/1/39 | | | 1,000 | | | | 1,026,590 | |
| | |
Iowa Finance Authority, (Lifespace Communities, Inc.), 4.125%, 5/15/38 | | | 1,500 | | | | 1,435,380 | |
| | |
Iowa Finance Authority, (Lifespace Communities, Inc.), 5.00%, 5/15/43 | | | 3,250 | | | | 3,364,497 | |
| | |
Lancaster County Hospital Authority, PA, (Brethren Village), 5.25%, 7/1/41 | | | 1,000 | | | | 1,043,440 | |
| | |
Maryland Health and Higher Educational Facilities Authority, (Edenwald), 5.25%, 1/1/37 | | | 2,500 | | | | 2,698,475 | |
| | |
Massachusetts Development Finance Agency, (Linden Ponds, Inc.), 5.00%, 11/15/33(2) | | | 1,550 | | | | 1,614,402 | |
| | |
Massachusetts Development Finance Agency, (Linden Ponds, Inc.), 5.00%, 11/15/38(2) | | | 1,010 | | | | 1,031,877 | |
| | |
Massachusetts Development Finance Agency, (NewBridge on the Charles, Inc.), 5.00%, 10/1/37(2) | | | 1,000 | | | | 1,051,580 | |
| | |
Massachusetts Development Finance Agency, (NewBridge on the Charles, Inc.), 5.00%, 10/1/47(2) | | | 1,280 | | | | 1,323,546 | |
| | |
Massachusetts Development Finance Agency, (NewBridge on the Charles, Inc.), 5.00%, 10/1/57(2) | | | 2,410 | | | | 2,479,794 | |
| | |
Massachusetts Development Finance Agency, (VOA Concord Assisted Living, Inc.), 5.125%, 11/1/27(2) | | | 1,045 | | | | 1,045,219 | |
| | |
Massachusetts Development Finance Agency, (VOA Concord Assisted Living, Inc.), 5.20%, 11/1/41(2) | | | 2,560 | | | | 2,522,854 | |
| | |
Mesquite Health Facilities Development Corp., TX, (Christian Care Centers), 5.00%, 2/15/36 | | | 500 | | | | 503,080 | |
| | |
Mesquite Health Facilities Development Corp., TX, (Christian Care Centers), 5.125%, 2/15/30 | | | 750 | | | | 771,563 | |
| | |
Mesquite Health Facilities Development Corp., TX, (Christian Care Centers), 5.125%, 2/15/42 | | | 1,500 | | | | 1,504,920 | |
| | |
Missouri Health and Educational Facilities Authority, (Bethesda Health Group, Inc.), 5.00%, 8/1/40 | | | 1,300 | | | | 1,355,055 | |
| | |
Montgomery County Industrial Development Authority, PA, (Whitemarsh Continuing Care Retirement Community), 5.25%, 1/1/48 | | | 9,045 | | | | 9,050,337 | |
| | | | | | | | |
| Security | | Principal
Amount
(000’s omitted) | | | Value | |
|
| Senior Living / Life Care (continued) | |
| | |
Multnomah County Hospital Facilities Authority, OR, (Mirabella at South Waterfront), 5.125%, 10/1/34 | | $ | 2,500 | | | $ | 2,634,550 | |
| | |
Multnomah County Hospital Facilities Authority, OR, (Mirabella at South Waterfront), 5.40%, 10/1/44 | | | 1,770 | | | | 1,866,766 | |
| | |
New Hampshire Health and Education Facilities Authority, (Kendal at Hanover), 5.00%, 10/1/40 | | | 565 | | | | 592,798 | |
| | |
New Hampshire Health and Education Facilities Authority, (Kendal at Hanover), 5.00%, 10/1/46 | | | 1,000 | | | | 1,045,870 | |
| | |
New Hope Cultural Education Facilities Finance Corp., TX, (Longhorn Village), 5.00%, 1/1/37 | | | 6,320 | | | | 6,402,097 | |
| | |
New Jersey Economic Development Authority, (United Methodist Homes of New Jersey), 5.00%, 7/1/29 | | | 1,285 | | | | 1,347,528 | |
| | |
North Carolina Medical Care Commission, (Deerfield Episcopal Retirement Community, Inc.), 5.00%, 11/1/37 | | | 1,675 | | | | 1,851,193 | |
| | |
Palm Beach County Health Facilities Authority, FL, (Sinai Residences of Boca Raton), 7.25%, 6/1/34 | | | 75 | | | | 83,878 | |
| | |
Palm Beach County Health Facilities Authority, FL, (Sinai Residences of Boca Raton), 7.25%, 6/1/39 | | | 1,190 | | | | 1,330,456 | |
| | |
Palm Beach County Health Facilities Authority, FL, (Sinai Residences of Boca Raton), 7.50%, 6/1/49 | | | 6,855 | | | | 7,707,831 | |
| | |
Public Finance Authority, WI, (Church Home of Hartford, Inc.), 5.00%, 9/1/30(2) | | | 770 | | | | 797,597 | |
| | |
Saint Louis County Industrial Development Authority, MO, (Friendship Village of St. Louis), 5.00%, 9/1/38 | | | 1,250 | | | | 1,259,413 | |
| | |
Savannah Economic Development Authority, GA, (Marshes Skidaway Island Project), 7.00%, 1/1/34 | | | 3,000 | | | | 3,307,440 | |
| | |
South Carolina Jobs-Economic Development Authority, (South Carolina Episcopal Home at Still Hopes), 5.00%, 4/1/30 | | | 1,945 | | | | 2,039,099 | |
| | |
Tarrant County Cultural Education Facilities Finance Corp., TX, (MRC Stevenson Oaks), 10.00%, 3/15/23(2) | | | 1,325 | | | | 1,315,977 | |
| | |
Tarrant County Cultural Education Facilities Finance Corp., TX, (Trinity Terrace), 5.00%, 10/1/34 | | | 2,130 | | | | 2,243,401 | |
| | |
Tarrant County Cultural Education Facilities Finance Corp., TX, (Trinity Terrace), 5.00%, 10/1/44 | | | 5,370 | | | | 5,611,596 | |
| | |
Tempe Industrial Development Authority, AZ, (Friendship Village of Tempe), 6.00%, 12/1/32 | | | 450 | | | | 473,418 | |
| | |
Tempe Industrial Development Authority, AZ, (Friendship Village of Tempe), 6.25%, 12/1/42 | | | 1,380 | | | | 1,453,775 | |
| | |
Tempe Industrial Development Authority, AZ, (Mirabella at ASU), 6.125%, 10/1/52(2) | | | 2,850 | | | | 3,062,524 | |
| | |
Tompkins County Development Corp., NY, (Kendal at Ithaca, Inc.), 4.25%, 7/1/32 | | | 1,270 | | | | 1,281,595 | |
| | |
Tompkins County Development Corp., NY, (Kendal at Ithaca, Inc.), 4.50%, 7/1/42 | | | 1,270 | | | | 1,282,344 | |
| | |
Warren County, OH, (Otterbein Homes Obligated Group), 5.00%, 7/1/39 | | | 1,975 | | | | 2,102,723 | |
| | |
Warren County, OH, (Otterbein Homes Obligated Group), 5.50%, 7/1/39 | | | 500 | | | | 545,415 | |
| | | | |
| | 12 | | See Notes to Financial Statements. |
Eaton Vance
High Yield Municipal Income Fund
January 31, 2019
Portfolio of Investments — continued
| | | | | | | | |
| Security | | Principal
Amount
(000’s omitted) | | | Value | |
|
| Senior Living / Life Care (continued) | |
| | |
Washington Housing Finance Commission, (Bayview Manor Homes), 5.00%, 7/1/36(2) | | $ | 1,500 | | | $ | 1,538,190 | |
| | |
Washington Housing Finance Commission, (Bayview Manor Homes), 5.00%, 7/1/46(2) | | | 1,250 | | | | 1,269,275 | |
| | |
Washington Housing Finance Commission, (Horizon House), 5.00%, 1/1/43(2) | | | 4,000 | | | | 4,169,160 | |
| | |
Washington Housing Finance Commission, (Horizon House), 5.00%, 1/1/48(2) | | | 4,815 | | | | 5,000,666 | |
| | |
Westchester County Local Development Corp., NY, (Kendal on Hudson), 5.00%, 1/1/34 | | | 2,380 | | | | 2,492,431 | |
| | |
| | | | | | | $ | 134,511,730 | |
|
| Special Tax Revenue — 6.0% | |
| | |
Aliso Viejo Community Facilities District No. 2005-01, CA, (Glenwood at Aliso Viejo), 5.00%, 9/1/38 | | $ | 7,000 | | | $ | 7,803,250 | |
| | |
Bridgeville, DE, (Heritage Shores Special Development District), 5.45%, 7/1/35 | | | 4,841 | | | | 4,750,715 | |
| | |
Irvine Community Facilities District No. 2013-3, CA, (Great Park), 5.00%, 9/1/39 | | | 2,000 | | | | 2,128,800 | |
| | |
Jurupa Public Financing Authority, CA, 5.00%, 9/1/33 | | | 600 | | | | 676,266 | |
| | |
Lakewood Ranch Stewardship District, FL, (Villages of Lakewood Ranch South), 5.00%, 5/1/36 | | | 4,685 | | | | 4,695,775 | |
| | |
Metropolitan Development and Housing Agency, TN, (Fifth + Broadway Development Project), 5.125%, 6/1/36(2) | | | 900 | | | | 935,442 | |
| | |
Michigan Finance Authority, Detroit Financial Recovery Income Tax Revenue, 4.50%, 10/1/29 | | | 4,460 | | | | 4,762,522 | |
| | |
New River Community Development District, FL, (Capital Improvements), 5.00%, 5/1/13(6) | | | 1,005 | | | | 10 | |
| | |
New River Community Development District, FL, (Capital Improvements), Series 2010A-1, 5.75%, 5/1/38 | | | 485 | | | | 485,121 | |
| | |
New River Community Development District, FL, (Capital Improvements), Series 2010A-2, 5.75%, 5/1/38 | | | 1,265 | | | | 1,223,457 | |
| | |
New York City Transitional Finance Authority, NY, Future Tax Revenue, (SPA: JPMorgan Chase Bank, N.A.), 1.63%, 8/1/42(5) | | | 4,000 | | | | 4,000,000 | |
| | |
New York Dormitory Authority, Personal Income Tax Revenue, 5.00%, 2/15/37(3) | | | 10,000 | | | | 11,218,800 | |
| | |
New York State Urban Development Corp., Personal Income Tax Revenue, 4.00%, 3/15/47 | | | 10,000 | | | | 10,322,300 | |
| | |
Reno, NV, Sales Tax Revenue, 4.00%, 6/1/43 | | | 1,250 | | | | 1,267,212 | |
| | |
River Hall Community Development District, FL, (Capital Improvements), 5.45%, 5/1/36 | | | 2,595 | | | | 2,586,151 | |
| | |
South Orange County Public Financing Authority, CA, (Ladera Ranch), 5.00%, 8/15/31 | | | 1,500 | | | | 1,614,555 | |
| | |
South Orange County Public Financing Authority, CA, (Ladera Ranch), 5.00%, 8/15/33 | | | 1,000 | | | | 1,073,290 | |
| | |
South Orange County Public Financing Authority, CA, (Ladera Ranch), 5.00%, 8/15/34 | | | 450 | | | | 482,522 | |
| | | | | | | | |
| Security | | Principal
Amount
(000’s omitted) | | | Value | |
|
| Special Tax Revenue (continued) | |
| | |
South Village Community Development District, FL, 3.50%, 5/1/32 | | $ | 805 | | | $ | 815,264 | |
| | |
South Village Community Development District, FL, 3.625%, 5/1/35 | | | 500 | | | | 504,265 | |
| | |
South Village Community Development District, FL, 3.75%, 5/1/38 | | | 1,020 | | | | 1,025,753 | |
| | |
South Village Community Development District, FL, 4.875%, 5/1/35 | | | 500 | | | | 499,685 | |
| | |
South Village Community Development District, FL, 5.00%, 5/1/38 | | | 100 | | | | 100,113 | |
| | |
Southern Hills Plantation I Community Development District, FL, Series A1, 5.80%, 5/1/35 | | | 1,183 | | | | 1,142,591 | |
| | |
Southern Hills Plantation I Community Development District, FL, Series A2, 5.80%, 5/1/35 | | | 860 | | | | 759,174 | |
| | |
Sterling Hill Community Development District, FL, 5.50%, 5/1/37(6) | | | 3,650 | | | | 365,000 | |
| | |
Winter Garden Village at Fowler Groves Community Development District, FL, 4.125%, 5/1/37 | | | 3,415 | | | | 3,264,808 | |
| | |
| | | | | | | $ | 68,502,841 | |
|
| Student Loan — 1.1% | |
| | |
Massachusetts Educational Financing Authority, (AMT), 3.625%, 7/1/32 | | $ | 4,340 | | | $ | 4,400,543 | |
| | |
New Jersey Higher Education Student Assistance Authority, (AMT), 4.00%, 12/1/30 | | | 4,650 | | | | 4,818,562 | |
| | |
New Jersey Higher Education Student Assistance Authority, (AMT), 4.75%, 12/1/43 | | | 2,765 | | | | 2,885,582 | |
| | |
| | | | | | | $ | 12,104,687 | |
|
| Transportation — 23.3% | |
| | |
Austin, TX, Airport System Revenue, (AMT), 5.00%, 11/15/41 | | $ | 2,000 | | | $ | 2,196,980 | |
| | |
California Municipal Finance Authority, (LINXS Automated People Mover), (AMT), 5.00%, 12/31/36 | | | 1,740 | | | | 1,943,145 | |
| | |
California Municipal Finance Authority, (LINXS Automated People Mover), (AMT), 5.00%, 12/31/37 | | | 760 | | | | 844,231 | |
| | |
Central Texas Regional Mobility Authority, 5.00%, 1/1/35 | | | 1,100 | | | | 1,216,556 | |
| | |
Central Texas Regional Mobility Authority, Prerefunded to 1/1/21, 5.75%, 1/1/31 | | | 565 | | | | 606,121 | |
| | |
Central Texas Regional Mobility Authority, Series 2016, 5.00%, 1/1/40 | | | 2,375 | | | | 2,602,549 | |
| | |
Chesapeake Bay Bridge and Tunnel Commission, VA, 5.00%, 7/1/46 | | | 4,000 | | | | 4,358,480 | |
| | |
Chicago, IL, (O’Hare International Airport), 5.00%, 1/1/35 | | | 2,500 | | | | 2,778,500 | |
| | |
Chicago, IL, (O’Hare International Airport), 5.00%, 1/1/38 | | | 5,000 | | | | 5,501,650 | |
| | |
Chicago, IL, (O’Hare International Airport), (AMT), 4.375%, 1/1/40 | | | 2,500 | | | | 2,539,600 | |
| | | | |
| | 13 | | See Notes to Financial Statements. |
Eaton Vance
High Yield Municipal Income Fund
January 31, 2019
Portfolio of Investments — continued
| | | | | | | | |
| Security | | Principal
Amount
(000’s omitted) | | | Value | |
|
| Transportation (continued) | |
| | |
Chicago, IL, (O’Hare International Airport), (AMT), 5.00%, 1/1/25 | | $ | 2,555 | | | $ | 2,798,364 | |
| | |
Chicago, IL, (O’Hare International Airport), (AMT), 5.00%, 1/1/26 | | | 2,170 | | | | 2,371,593 | |
| | |
Chicago, IL, (O’Hare International Airport), (AMT), 5.00%, 7/1/33 | | | 500 | | | | 563,080 | |
| | |
Chicago, IL, (O’Hare International Airport), (AMT), 5.00%, 7/1/38 | | | 1,500 | | | | 1,653,690 | |
| | |
Colorado High Performance Transportation Enterprise,(C-470 Express Lanes), 5.00%, 12/31/47 | | | 1,900 | | | | 2,025,894 | |
| | |
Colorado High Performance Transportation Enterprise, (U.S. 36 and I-25 Managed Lanes), (AMT), 5.75%, 1/1/44 | | | 2,500 | | | | 2,700,875 | |
| | |
Dallas and Fort Worth, TX, (Dallas/Fort Worth International Airport), (AMT), 5.25%, 11/1/29 | | | 7,000 | | | | 7,835,450 | |
| | |
Eagle County Air Terminal Corp., CO, (AMT), 5.00%, 5/1/37 | | | 1,000 | | | | 1,093,050 | |
| | |
Eagle County Air Terminal Corp., CO, (AMT), 5.00%, 5/1/41 | | | 4,940 | | | | 5,337,670 | |
| | |
Grand Parkway Transportation Corp., TX, 5.125%, 10/1/43 | | | 3,025 | | | | 3,276,377 | |
| | |
Illinois Toll Highway Authority, 5.00%, 1/1/40(3) | | | 15,000 | | | | 16,559,700 | |
| | |
Kentucky Public Transportation Infrastructure Authority, (Downtown Crossing Project), 0.00%, 7/1/28 | | | 2,690 | | | | 1,657,820 | |
| | |
Kentucky Public Transportation Infrastructure Authority, (Downtown Crossing Project), 0.00%, 7/1/29 | | | 1,135 | | | | 717,638 | |
| | |
Kentucky Public Transportation Infrastructure Authority, (Downtown Crossing Project), 0.00%, 7/1/30 | | | 500 | | | | 295,650 | |
| | |
Kentucky Public Transportation Infrastructure Authority, (Downtown Crossing Project), 0.00%, 7/1/31 | | | 1,150 | | | | 632,500 | |
| | |
Maryland Economic Development Corp., (Transportation Facilities), 5.00%, 6/1/35 | | | 450 | | | | 506,754 | |
| | |
Memphis-Shelby County Airport Authority, TN, (AMT), 5.00%, 7/1/43 | | | 7,500 | | | | 8,287,350 | |
| | |
Metropolitan Transportation Authority, NY, Green Bonds, 0.00%, 11/15/32 | | | 595 | | | | 368,359 | |
| | |
Metropolitan Transportation Authority, NY, Green Bonds, 0.00%, 11/15/33 | | | 4,925 | | | | 2,889,694 | |
| | |
Mid-Bay Bridge Authority, FL, 5.00%, 10/1/30 | | | 2,050 | | | | 2,286,549 | |
| | |
Mid-Bay Bridge Authority, FL, 5.00%, 10/1/35 | | | 5,000 | | | | 5,470,150 | |
| | |
New Jersey Economic Development Authority, (The Goethals Bridge Replacement), (AMT), 5.125%, 1/1/34 | | | 5,000 | | | | 5,386,750 | |
| | |
New Jersey Transportation Trust Fund Authority, 5.00%, 6/15/38 | | | 13,000 | | | | 13,886,340 | |
| | |
New Jersey Turnpike Authority, 4.00%, 1/1/48(7) | | | 6,760 | | | | 6,887,291 | |
| | |
New Jersey Turnpike Authority,
5.00%, 1/1/48(3)(7) | | | 5,000 | | | | 5,667,550 | |
| | |
New Orleans Aviation Board, LA, (North Terminal Project), (AMT), 5.00%, 1/1/35 | | | 2,000 | | | | 2,192,340 | |
| | |
New Orleans Aviation Board, LA, (North Terminal Project), (AMT), 5.00%, 1/1/43 | | | 1,500 | | | | 1,639,050 | |
| | |
New York Transportation Development Corp., (LaGuardia Airport Terminal B Redevelopment), (AMT), 5.00%, 7/1/41 | | | 7,500 | | | | 7,928,475 | |
| | | | | | | | |
| Security | | Principal
Amount
(000’s omitted) | | | Value | |
|
| Transportation (continued) | |
| | |
New York Transportation Development Corp., (LaGuardia Airport Terminal B Redevelopment), (AMT), 5.00%, 7/1/46 | | $ | 6,345 | | | $ | 6,688,455 | |
| | |
Niagara Frontier Transportation Authority, NY, (Buffalo Niagara International Airport), (AMT), 5.00%, 4/1/28 | | | 470 | | | | 523,387 | |
| | |
North East Texas Regional Mobility Authority, 5.00%, 1/1/41 | | | 5,250 | | | | 5,596,605 | |
| | |
North Texas Tollway Authority, Prerefunded to 9/1/21, 5.50%, 9/1/41(3) | | | 10,000 | | | | 10,937,400 | |
| | |
Pennsylvania Economic Development Financing Authority, (Amtrak), (AMT), 5.00%, 11/1/41 | | | 5,495 | | | | 5,868,935 | |
| | |
Pennsylvania Turnpike Commission, Prerefunded to 12/1/20, 5.35%, 12/1/30 | | | 215 | | | | 228,437 | |
| | |
Port Authority of New York and New Jersey, (AMT), 4.00%, 9/1/33(3) | | | 12,080 | | | | 12,563,321 | |
| | |
Port Authority of New York and New Jersey, (AMT), 4.50%, 4/1/37(3) | | | 10,000 | | | | 10,329,400 | |
| | |
Port Authority of New York and New Jersey, (AMT), 5.00%, 10/15/35 | | | 4,070 | | | | 4,619,491 | |
| | |
Port Authority of New York and New Jersey, (AMT), 5.00%, 10/15/44 | | | 5,320 | | | | 5,826,464 | |
| | |
Public Finance Authority, WI, (Denver International Airport Great Hall), (AMT), 5.00%, 9/30/37 | | | 2,625 | | | | 2,879,730 | |
| | |
San Francisco City and County Airport Commission, CA, (San Francisco International Airport), (AMT), 5.00%, 5/1/44(7) | | | 11,000 | | | | 12,428,570 | |
| | |
San Joaquin Hills Transportation Corridor Agency, CA, 5.00%, 1/15/44 | | | 10,000 | | | | 10,759,700 | |
| | |
San Jose, CA, Airport Revenue, (AMT), 5.00%, 3/1/24 | | | 2,135 | | | | 2,265,406 | |
| | |
South Jersey Transportation Authority, 5.00%, 11/1/32 | | | 2,250 | | | | 2,432,565 | |
| | |
Texas Private Activity Bond Surface Transportation Corp., (LBJ Express Managed Lanes Project), 7.00%, 6/30/34 | | | 3,685 | | | | 3,912,106 | |
| | |
Texas Private Activity Bond Surface Transportation Corp., (LBJ IH-635 Managed Lanes Project), 7.00%, 6/30/40 | | | 4,460 | | | | 4,729,607 | |
| | |
Texas Private Activity Bond Surface Transportation Corp., (North Tarrant Express Managed Lanes Project), 6.875%, 12/31/39 | | | 3,415 | | | | 3,545,419 | |
| | |
Texas Transportation Commission, (Central Texas Turnpike System), 5.00%, 8/15/37 | | | 5,000 | | | | 5,359,100 | |
| | |
Texas Transportation Commission, (Central Texas Turnpike System), 5.00%, 8/15/42 | | | 11,430 | | | | 12,133,516 | |
| | |
Virginia Small Business Financing Authority, (Transform 66 P3 Project), (AMT), 5.00%, 12/31/52 | | | 2,500 | | | | 2,675,050 | |
| | |
| | | | | | | $ | 263,806,479 | |
|
| Water and Sewer — 2.2% | |
| | |
Detroit, MI, Sewage Disposal System, 5.00%, 7/1/32 | | $ | 3,185 | | | $ | 3,429,481 | |
| | |
Detroit, MI, Sewage Disposal System, 5.25%, 7/1/39 | | | 3,355 | | | | 3,616,958 | |
| | |
Detroit, MI, Water Supply System, 5.25%, 7/1/41 | | | 13,100 | | | | 13,955,561 | |
| | | | |
| | 14 | | See Notes to Financial Statements. |
Eaton Vance
High Yield Municipal Income Fund
January 31, 2019
Portfolio of Investments — continued
| | | | | | | | |
| Security | | Principal
Amount
(000’s omitted) | | | Value | |
|
| Water and Sewer (continued) | |
| | |
Michigan Finance Authority, (Detroit Water and Sewerage Department), 5.00%, 7/1/33 | | $ | 1,905 | | | $ | 2,093,862 | |
| | |
Michigan Finance Authority, (Detroit Water and Sewerage Department), 5.00%, 7/1/44 | | | 1,905 | | | | 2,032,216 | |
| | |
| | | | | | | $ | 25,128,078 | |
| |
Total Tax-Exempt Municipal Securities — 101.4%
(identified cost $1,114,343,944) | | | $ | 1,149,469,176 | |
|
| Taxable Municipal Securities — 5.3% | |
| Security | | Principal
Amount
(000’s omitted) | | | Value | |
| | |
| Cogeneration — 0.0%(4) | | | | | | |
| | |
Northampton County Industrial Development Authority, PA, (Northampton Generating), 5.00%, 12/31/23(1) | | $ | 120 | | | $ | 35,988 | |
| | |
| | | | | | | $ | 35,988 | |
| | |
| General Obligations — 2.0% | | | | | | |
| | |
Atlantic City, NJ, 7.50%, 3/1/40 | | $ | 5,440 | | | $ | 7,199,731 | |
| | |
Chicago Board of Education, IL,
5.182%, 12/1/21(8) | | | 325 | | | | 324,740 | |
| | |
Chicago, IL, 7.75%, 1/1/42 | | | 12,430 | | | | 14,979,393 | |
| | |
| | | | | | | $ | 22,503,864 | |
| | |
| Hospital — 1.2% | | | | | | |
| | |
California Statewide Communities Development Authority, (Loma Linda University Medical Center), 6.00%, 12/1/24 | | $ | 12,750 | | | $ | 13,478,663 | |
| | |
| | | | | | | $ | 13,478,663 | |
| | |
| Insured – General Obligations — 0.7% | | | | | | |
| | |
Detroit, MI, (AMBAC), 4.96%, 4/1/20 | | $ | 580 | | | $ | 579,878 | |
| | |
Detroit, MI, (AMBAC), 5.15%, 4/1/25 | | | 7,679 | | | | 7,592,201 | |
| | |
| | | | | | | $ | 8,172,079 | |
| | |
| Senior Living / Life Care — 0.4% | | | | | | |
| | |
St. Johns County Industrial Development Authority, FL, (Westminster St. Augustine), 5.50% to 8/1/24 (Put Date), 8/1/44 | | $ | 4,440 | | | $ | 4,322,073 | |
| | |
Tarrant County Cultural Education Facilities Finance Corp., TX, (MRC Stevenson Oaks), 12.50%, 3/15/23(2) | | | 235 | | | | 234,925 | |
| | |
| | | | | | | $ | 4,556,998 | |
| | | | | | | | |
| Security | | Principal
Amount
(000’s omitted) | | | Value | |
| | |
| Special Tax Revenue — 0.3% | | | | | | |
| | |
Ohio County Commission, WV, (Fort Henry Economic Opportunity Development District - The Highlands), 4.80%, 3/1/36 | | $ | 1,150 | | | $ | 1,140,168 | |
| | |
Ohio County Commission, WV, (Fort Henry Economic Opportunity Development District - The Highlands), 5.25%, 3/1/31 | | | 2,570 | | | | 2,653,499 | |
| | |
| | | | | | | $ | 3,793,667 | |
| | |
| Transportation — 0.7% | | | | | | |
| | |
New Jersey Transportation Trust Fund Authority, 5.754%, 12/15/28(8) | | $ | 7,375 | | | $ | 8,118,400 | |
| | |
| | | | | | | $ | 8,118,400 | |
| | |
Total Taxable Municipal Securities — 5.3%
(identified cost $55,452,088) | | | | | | $ | 60,659,659 | |
|
| Corporate Bonds & Notes — 1.5% | |
| Security | | Principal
Amount
(000’s omitted) | | | Value | |
| | |
| Hospital — 0.8% | | | | | | |
| | |
Boston Medical Center Corp., 4.581%, 7/1/47 | | $ | 4,165 | | | $ | 4,036,273 | |
| | |
Harnett Health System, Inc., 6.50% to 4/1/20 (Put Date), 4/1/32 | | | 4,425 | | | | 4,518,429 | |
| | |
| | | | | | | $ | 8,554,702 | |
| | |
| Other — 0.7% | | | | | | |
| | |
Morongo Band of Mission Indians, 7.00%, 10/1/39(2) | | $ | 7,980 | | | $ | 8,240,308 | |
| | |
| | | | | | | $ | 8,240,308 | |
| | |
Total Corporate Bonds & Notes — 1.5%
(identified cost $16,570,000) | | | | | | $ | 16,795,010 | |
| | |
Total Investments — 108.2%
(identified cost $1,186,366,032) | | | | | | $ | 1,226,923,845 | |
| | |
Other Assets, Less Liabilities — (8.2)% | | | | | | $ | (92,860,531 | ) |
| | |
Net Assets — 100.0% | | | | | | $ | 1,134,063,314 | |
The percentage shown for each investment category in the Portfolio of Investments is based on net assets.
| | | | |
| | 15 | | See Notes to Financial Statements. |
Eaton Vance
High Yield Municipal Income Fund
January 31, 2019
Portfolio of Investments — continued
At January 31, 2019, the concentration of the Fund’s investments in the various states, determined as a percentage of net assets, is as follows:
| | | | |
| |
| Texas | | | 15.0% | |
| |
| New York | | | 13.8% | |
| |
| Illinois | | | 12.2% | |
| |
| Others, representing less than 10% individually | | | 67.2% | |
The Fund invests primarily in debt securities issued by municipalities. The ability of the issuers of the debt securities to meet their obligations may be affected by economic developments in a specific industry or municipality. In order to reduce the risk associated with such economic developments, at January 31, 2019, 11.6% of total investments are backed by bond insurance of various financial institutions and financial guaranty assurance agencies. The aggregate percentage insured by an individual financial institution or financial guaranty assurance agency ranged from 0.1% to 4.7% of total investments.
| (1) | Represents a payment-in-kind security which may pay interest in additional principal at the issuer’s discretion. |
| (2) | Security exempt from registration pursuant to Rule 144A under the Securities Act of 1933, as amended. These securities may be sold in certain transactions in reliance on an exemption from registration (normally to qualified institutional buyers). At January 31, 2019, the aggregate value of these securities is $109,979,624 or 9.7% of the Fund’s net assets. |
| (3) | Security represents the municipal bond held by a trust that issues residual interest bonds (see Note 1H). |
| (4) | Amount is less than 0.05%. |
| (5) | Variable rate demand obligation that may be tendered at par on any day for payment the same or next business day. The stated interest rate, which generally resets daily, is determined by the remarketing agent and represents the rate in effect at January 31, 2019. |
| (6) | Defaulted security. Issuer has defaulted on the payment of interest and/or principal or has filed for bankruptcy. |
| (7) | When-issued security. |
| (8) | Build America Bond. Represents taxable municipal obligation issued pursuant to the American Recovery and Reinvestment Act of 2009 or other legislation providing for the issuance of taxable municipal debt on which the issuer receives federal support. |
| | | | | | | | | | | | | | | | | | | | |
| Futures Contracts | |
| | | | | |
| Description | | Number of
Contracts | | | Position | | | Expiration
Date | | | Notional
Amount | | | Value/Unrealized
Depreciation | |
| | | | | |
Interest Rate Futures | | | | | | | | | | | | | | | | | | | | |
| | | | | |
| U.S. 10-Year Treasury Note | | | 175 | | | | Short | | | | 3/20/19 | | | $ | (21,432,031 | ) | | $ | (603,222 | ) |
| | | | | |
| U.S. Long Treasury Bond | | | 112 | | | | Short | | | | 3/20/19 | | | | (16,429,000 | ) | | | (844,872 | ) |
| | | | | |
| | | | | | | | | | | | | | | | | | | $ | (1,448,094 | ) |
Abbreviations:
| | | | |
| | |
| AGC | | – | | Assured Guaranty Corp. |
| | |
| AGM | | – | | Assured Guaranty Municipal Corp. |
| | |
| AMBAC | | – | | AMBAC Financial Group, Inc. |
| | |
| AMT | | – | | Interest earned from these securities may be considered a tax preference item for purposes of the Federal Alternative Minimum Tax. |
| | |
| BAM | | – | | Build America Mutual Assurance Co. |
| | |
| NPFG | | – | | National Public Finance Guarantee Corp. |
| | |
| SPA | | – | | Standby Bond Purchase Agreement |
| | | | |
| | 16 | | See Notes to Financial Statements. |
Eaton Vance
High Yield Municipal Income Fund
January 31, 2019
Statement of Assets and Liabilities
| | | | |
| Assets | | January 31, 2019 | |
| |
Unaffiliated investments, at value (identified cost, $1,186,366,032) | | $ | 1,226,923,845 | |
| |
Cash | | | 3,045,164 | |
| |
Deposits for derivatives collateral — financial futures contracts | | | 477,842 | |
| |
Interest receivable | | | 12,382,997 | |
| |
Receivable for investments sold | | | 155,210 | |
| |
Receivable for Fund shares sold | | | 4,396,432 | |
| |
Due from broker for floating rate notes issued | | | 4,000,000 | |
| |
Total assets | | $ | 1,251,381,490 | |
| |
| Liabilities | | | | |
| |
Payable for floating rate notes issued | | $ | 87,421,288 | |
| |
Payable for when-issued securities | | | 24,636,944 | |
| |
Payable for variation margin on open financial futures contracts | | | 194,018 | |
| |
Payable for Fund shares redeemed | | | 2,965,452 | |
| |
Distributions payable | | | 598,226 | |
| |
Payable to affiliates: | | | | |
| |
Investment adviser fee | | | 589,468 | |
| |
Distribution and service fees | | | 195,152 | |
| |
Interest expense and fees payable | | | 471,835 | |
| |
Accrued expenses | | | 245,793 | |
| |
Total liabilities | | $ | 117,318,176 | |
| |
Net Assets | | $ | 1,134,063,314 | |
| |
| Sources of Net Assets | | | | |
| |
Paid-in capital | | $ | 1,132,165,596 | |
| |
Distributable earnings | | | 1,897,718 | |
| |
Net Assets | | $ | 1,134,063,314 | |
| |
| Class A Shares | | | | |
| |
Net Assets | | $ | 350,923,415 | |
| |
Shares Outstanding | | | 39,731,628 | |
| |
Net Asset Value and Redemption Price Per Share | | | | |
| |
(net assets ÷ shares of beneficial interest outstanding) | | $ | 8.83 | |
| |
Maximum Offering Price Per Share | | | | |
| |
(100 ÷ 95.25 of net asset value per share) | | $ | 9.27 | |
|
| Class B Shares | |
| |
Net Assets | | $ | 261,031 | |
| |
Shares Outstanding | | | 29,652 | |
| |
Net Asset Value and Offering Price Per Share* | | | | |
| |
(net assets ÷ shares of beneficial interest outstanding) | | $ | 8.80 | |
|
| Class C Shares | |
| |
Net Assets | | $ | 126,049,032 | |
| |
Shares Outstanding | | | 15,423,217 | |
| |
Net Asset Value and Offering Price Per Share* | | | | |
| |
(net assets ÷ shares of beneficial interest outstanding) | | $ | 8.17 | |
|
| Class I Shares | |
| |
Net Assets | | $ | 656,829,836 | |
| |
Shares Outstanding | | | 74,306,414 | |
| |
Net Asset Value, Offering Price and Redemption Price Per Share | | | | |
| |
(net assets ÷ shares of beneficial interest outstanding) | | $ | 8.84 | |
On sales of $50,000 or more, the offering price of Class A shares is reduced.
| * | Redemption price per share is equal to the net asset value less any applicable contingent deferred sales charge. |
| | | | |
| | 17 | | See Notes to Financial Statements. |
Eaton Vance
High Yield Municipal Income Fund
January 31, 2019
Statement of Operations
| | | | |
| Investment Income | | Year Ended
January 31, 2019 | |
| |
Interest | | $ | 54,740,603 | |
| |
Total investment income | | $ | 54,740,603 | |
| |
| Expenses | | | | |
| |
Investment adviser fee | | $ | 5,055,238 | |
| |
Distribution and service fees | | | | |
| |
Class A | | | 774,818 | |
| |
Class B | | | 6,040 | |
| |
Class C | | | 1,614,636 | |
| |
Trustees’ fees and expenses | | | 56,038 | |
| |
Custodian fee | | | 258,885 | |
| |
Transfer and dividend disbursing agent fees | | | 394,523 | |
| |
Legal and accounting services | | | 115,818 | |
| |
Printing and postage | | | 66,912 | |
| |
Registration fees | | | 107,769 | |
| |
Interest expense and fees | | | 1,863,913 | �� |
| |
Miscellaneous | | | 127,823 | |
| |
Total expenses | | $ | 10,442,413 | |
| |
Net investment income | | $ | 44,298,190 | |
| |
| Realized and Unrealized Gain (Loss) | | | | |
| |
Net realized gain (loss) — | | | | |
| |
Investment transactions | | $ | 1,209,461 | |
| |
Financial futures contracts | | | 1,964,593 | |
| |
Net realized gain | | $ | 3,174,054 | |
| |
Change in unrealized appreciation (depreciation) — | | | | |
| |
Investments | | $ | (8,058,337 | ) |
| |
Financial futures contracts | | | (2,561,708 | ) |
| |
Net change in unrealized appreciation (depreciation) | | $ | (10,620,045 | ) |
| |
Net realized and unrealized loss | | $ | (7,445,991 | ) |
| |
Net increase in net assets from operations | | $ | 36,852,199 | |
| | | | |
| | 18 | | See Notes to Financial Statements. |
Eaton Vance
High Yield Municipal Income Fund
January 31, 2019
Statements of Changes in Net Assets
| | | | | | | | |
| | | Year Ended January 31, | |
| Increase (Decrease) in Net Assets | | 2019 | | | 2018 | |
| | |
From operations — | | | | | | | | |
| | |
Net investment income | | $ | 44,298,190 | | | $ | 44,185,391 | |
| | |
Net realized gain | | | 3,174,054 | | | | 1,288,060 | |
| | |
Net change in unrealized appreciation (depreciation) | | | (10,620,045 | ) | | | 26,472,455 | |
| | |
Net increase in net assets from operations | | $ | 36,852,199 | | | $ | 71,945,906 | |
| | |
Distributions to shareholders(1) — | | | | | | | | |
| | |
Class A | | $ | (11,834,973 | ) | | $ | (13,120,204 | ) |
| | |
Class B | | | (18,478 | ) | | | (54,454 | ) |
| | |
Class C | | | (4,943,722 | ) | | | (5,587,965 | ) |
| | |
Class I | | | (26,714,886 | ) | | | (25,365,278 | ) |
| | |
Total distributions to shareholders | | $ | (43,512,059 | ) | | $ | (44,127,901 | ) |
| | |
Transactions in shares of beneficial interest — | | | | | | | | |
| | |
Proceeds from sale of shares | | | | | | | | |
| | |
Class A | | $ | 72,888,150 | | | $ | 69,348,266 | |
| | |
Class B | | | 203 | | | | 9,922 | |
| | |
Class C | | | 14,794,035 | | | | 16,481,193 | |
| | |
Class I | | | 291,027,900 | | | | 310,466,266 | |
| | |
Net asset value of shares issued to shareholders in payment of distributions declared | | | | | | | | |
| | |
Class A | | | 10,033,376 | | | | 11,396,337 | |
| | |
Class B | | | 14,780 | | | | 44,910 | |
| | |
Class C | | | 4,089,234 | | | | 4,503,189 | |
| | |
Class I | | | 22,596,935 | | | | 21,224,854 | |
| | |
Cost of shares redeemed | | | | | | | | |
| | |
Class A | | | (106,414,568 | ) | | | (119,798,317 | ) |
| | |
Class B | | | (82,717 | ) | | | (357,064 | ) |
| | |
Class C | | | (35,093,214 | ) | | | (43,607,197 | ) |
| | |
Class I | | | (335,020,911 | ) | | | (206,907,648 | ) |
| | |
Net asset value of shares converted | | | | | | | | |
| | |
Class A | | | 31,285,333 | | | | 1,054,094 | |
| | |
Class B | | | (729,156 | ) | | | (1,054,094 | ) |
| | |
Class C | | | (30,556,177 | ) | | | — | |
| | |
Net increase (decrease) in net assets from Fund share transactions | | $ | (61,166,797 | ) | | $ | 62,804,711 | |
| | |
Net increase (decrease) in net assets | | $ | (67,826,657 | ) | | $ | 90,622,716 | |
|
| Net Assets | |
| | |
At beginning of year | | $ | 1,201,889,971 | | | $ | 1,111,267,255 | |
| | |
At end of year | | $ | 1,134,063,314 | | | $ | 1,201,889,971 | (2) |
| (1) | For the year ended January 31, 2018, the source of distributions was from net investment income. The current year presentation of distributions conforms with the Disclosure Update and Simplification Rule issued by the Securities and Exchange Commission, effective November 5, 2018. |
| (2) | Includes accumulated undistributed net investment income of $2,335,507 at January 31, 2018. The requirement to disclose the corresponding amount as of January 31, 2019 was eliminated. |
| | | | |
| | 19 | | See Notes to Financial Statements. |
Eaton Vance
High Yield Municipal Income Fund
January 31, 2019
Financial Highlights
| | | | | | | | | | | | | | | | | | | | |
| | | Class A | |
| |
| | | Year Ended January 31, | |
| | | 2019 | | | 2018 | | | 2017 | | | 2016 | | | 2015 | |
| | | | | |
Net asset value — Beginning of year | | $ | 8.880 | | | $ | 8.650 | | | $ | 8.970 | | | $ | 9.020 | | | $ | 8.070 | |
|
| Income (Loss) From Operations | |
| | | | | |
Net investment income(1) | | $ | 0.345 | | | $ | 0.337 | | | $ | 0.345 | | | $ | 0.367 | | | $ | 0.378 | |
| | | | | |
Net realized and unrealized gain (loss) | | | (0.059 | ) | | | 0.229 | | | | (0.315 | ) | | | (0.053 | ) | | | 0.960 | |
| | | | | |
Total income from operations | | $ | 0.286 | | | $ | 0.566 | | | $ | 0.030 | | | $ | 0.314 | | | $ | 1.338 | |
|
| Less Distributions | |
| | | | | |
From net investment income | | $ | (0.336 | ) | | $ | (0.336 | ) | | $ | (0.350 | ) | | $ | (0.364 | ) | | $ | (0.388 | ) |
| | | | | |
Total distributions | | $ | (0.336 | ) | | $ | (0.336 | ) | | $ | (0.350 | ) | | $ | (0.364 | ) | | $ | (0.388 | ) |
| | | | | |
Net asset value — End of year | | $ | 8.830 | | | $ | 8.880 | | | $ | 8.650 | | | $ | 8.970 | | | $ | 9.020 | |
| | | | | |
Total Return(2) | | | 3.29 | % | | | 6.63 | % | | | 0.25 | % | | | 3.64 | % | | | 16.92 | % |
|
| Ratios/Supplemental Data | |
| | | | | |
Net assets, end of year (000’s omitted) | | $ | 350,923 | | | $ | 344,822 | | | $ | 374,661 | | | $ | 431,777 | | | $ | 452,135 | |
| | | | | |
Ratios (as a percentage of average daily net assets): | | | | | | | | | | | | | | | | | | | | |
| | | | | |
Expenses excluding interest and fees(3) | | | 0.79 | % | | | 0.78 | % | | | 0.79 | % | | | 0.81 | % | | | 0.83 | % |
| | | | | |
Interest and fee expense(4) | | | 0.17 | % | | | 0.14 | % | | | 0.10 | % | | | 0.05 | % | | | 0.06 | % |
| | | | | |
Total expenses(3) | | | 0.96 | % | | | 0.92 | % | | | 0.89 | % | | | 0.86 | % | | | 0.89 | % |
| | | | | |
Net investment income | | | 3.92 | % | | | 3.81 | % | | | 3.83 | % | | | 4.18 | % | | | 4.41 | % |
| | | | | |
Portfolio Turnover | | | 32 | % | | | 21 | % | | | 35 | % | | | 27 | % | | | 16 | % |
| (1) | Computed using average shares outstanding. |
| (2) | Returns are historical and are calculated by determining the percentage change in net asset value with all distributions reinvested and do not reflect the effect of sales charges. |
| (3) | Excludes the effect of custody fee credits, if any, of less than 0.005%. Effective September 1, 2015, custody fee credits, which were earned on cash deposit balances, were discontinued by the custodian. |
| (4) | Interest and fee expense relates to the liability for floating rate notes issued in conjunction with residual interest bond transactions (see Note 1H). |
| | | | |
| | 20 | | See Notes to Financial Statements. |
Eaton Vance
High Yield Municipal Income Fund
January 31, 2019
Financial Highlights — continued
| | | | | | | | | | | | | | | | | | | | |
| | | Class B | |
| |
| | | Year Ended January 31, | |
| | | 2019 | | | 2018 | | | 2017 | | | 2016 | | | 2015 | |
| | | | | |
Net asset value — Beginning of year | | $ | 8.850 | | | $ | 8.620 | | | $ | 8.940 | | | $ | 8.990 | | | $ | 8.040 | |
|
| Income (Loss) From Operations | |
| | | | | |
Net investment income(1) | | $ | 0.272 | | | $ | 0.272 | | | $ | 0.277 | | | $ | 0.301 | | | $ | 0.318 | |
| | | | | |
Net realized and unrealized gain (loss) | | | (0.054 | ) | | | 0.227 | | | | (0.316 | ) | | | (0.054 | ) | | | 0.955 | |
| | | | | |
Total income (loss) from operations | | $ | 0.218 | | | $ | 0.499 | | | $ | (0.039 | ) | | $ | 0.247 | | | $ | 1.273 | |
|
| Less Distributions | |
| | | | | |
From net investment income | | $ | (0.268 | ) | | $ | (0.269 | ) | | $ | (0.281 | ) | | $ | (0.297 | ) | | $ | (0.323 | ) |
| | | | | |
Total distributions | | $ | (0.268 | ) | | $ | (0.269 | ) | | $ | (0.281 | ) | | $ | (0.297 | ) | | $ | (0.323 | ) |
| | | | | |
Net asset value — End of year | | $ | 8.800 | | | $ | 8.850 | | | $ | 8.620 | | | $ | 8.940 | | | $ | 8.990 | |
| | | | | |
Total Return(2) | | | 2.52 | % | | | 5.85 | % | | | (0.51 | )% | | | 2.87 | % | | | 16.11 | % |
|
| Ratios/Supplemental Data | |
| | | | | |
Net assets, end of year (000’s omitted) | | $ | 261 | | | $ | 1,067 | | | $ | 2,365 | | | $ | 3,298 | | | $ | 5,436 | |
| | | | | |
Ratios (as a percentage of average daily net assets): | | | | | | | | | | | | | | | | | | | | |
| | | | | |
Expenses excluding interest and fees(3) | | | 1.54 | % | | | 1.53 | % | | | 1.54 | % | | | 1.56 | % | | | 1.58 | % |
| | | | | |
Interest and fee expense(4) | | | 0.17 | % | | | 0.14 | % | | | 0.10 | % | | | 0.05 | % | | | 0.06 | % |
| | | | | |
Total expenses(3) | | | 1.71 | % | | | 1.67 | % | | | 1.64 | % | | | 1.61 | % | | | 1.64 | % |
| | | | | |
Net investment income | | | 3.10 | % | | | 3.09 | % | | | 3.09 | % | | | 3.43 | % | | | 3.74 | % |
| | | | | |
Portfolio Turnover | | | 32 | % | | | 21 | % | | | 35 | % | | | 27 | % | | | 16 | % |
| (1) | Computed using average shares outstanding. |
| (2) | Returns are historical and are calculated by determining the percentage change in net asset value with all distributions reinvested and do not reflect the effect of sales charges. |
| (3) | Excludes the effect of custody fee credits, if any, of less than 0.005%. Effective September 1, 2015, custody fee credits, which were earned on cash deposit balances, were discontinued by the custodian. |
| (4) | Interest and fee expense relates to the liability for floating rate notes issued in conjunction with residual interest bond transactions (see Note 1H). |
| | | | |
| | 21 | | See Notes to Financial Statements. |
Eaton Vance
High Yield Municipal Income Fund
January 31, 2019
Financial Highlights — continued
| | | | | | | | | | | | | | | | | | | | |
| | | Class C | |
| |
| | | Year Ended January 31, | |
| | | 2019 | | | 2018 | | | 2017 | | | 2016 | | | 2015 | |
| | | | | |
Net asset value — Beginning of year | | $ | 8.210 | | | $ | 8.010 | | | $ | 8.300 | | | $ | 8.340 | | | $ | 7.460 | |
|
| Income (Loss) From Operations | |
| | | | | |
Net investment income(1) | | $ | 0.252 | | | $ | 0.251 | | | $ | 0.256 | | | $ | 0.279 | | | $ | 0.290 | |
| | | | | |
Net realized and unrealized gain (loss) | | | (0.042 | ) | | | 0.199 | | | | (0.285 | ) | | | (0.043 | ) | | | 0.889 | |
| | | | | |
Total income (loss) from operations | | $ | 0.210 | | | $ | 0.450 | | | $ | (0.029 | ) | | $ | 0.236 | | | $ | 1.179 | |
|
| Less Distributions | |
| | | | | |
From net investment income | | $ | (0.250 | ) | | $ | (0.250 | ) | | $ | (0.261 | ) | | $ | (0.276 | ) | | $ | (0.299 | ) |
| | | | | |
Total distributions | | $ | (0.250 | ) | | $ | (0.250 | ) | | $ | (0.261 | ) | | $ | (0.276 | ) | | $ | (0.299 | ) |
| | | | | |
Net asset value — End of year | | $ | 8.170 | | | $ | 8.210 | | | $ | 8.010 | | | $ | 8.300 | | | $ | 8.340 | |
| | | | | |
Total Return(2) | | | 2.60 | % | | | 5.67 | % | | | (0.42 | )% | | | 2.95 | % | | | 16.08 | % |
|
| Ratios/Supplemental Data | |
| | | | | |
Net assets, end of year (000’s omitted) | | $ | 126,049 | | | $ | 173,844 | | | $ | 191,619 | | | $ | 205,556 | | | $ | 197,655 | |
| | | | | |
Ratios (as a percentage of average daily net assets): | | | | | | | | | | | | | | | | | | | | |
| | | | | |
Expenses excluding interest and fees(3) | | | 1.54 | % | | | 1.53 | % | | | 1.54 | % | | | 1.56 | % | | | 1.58 | % |
| | | | | |
Interest and fee expense(4) | | | 0.17 | % | | | 0.14 | % | | | 0.10 | % | | | 0.05 | % | | | 0.06 | % |
| | | | | |
Total expenses(3) | | | 1.71 | % | | | 1.67 | % | | | 1.64 | % | | | 1.61 | % | | | 1.64 | % |
| | | | | |
Net investment income | | | 3.10 | % | | | 3.06 | % | | | 3.07 | % | | | 3.43 | % | | | 3.65 | % |
| | | | | |
Portfolio Turnover | | | 32 | % | | | 21 | % | | | 35 | % | | | 27 | % | | | 16 | % |
| (1) | Computed using average shares outstanding. |
| (2) | Returns are historical and are calculated by determining the percentage change in net asset value with all distributions reinvested and do not reflect the effect of sales charges. |
| (3) | Excludes the effect of custody fee credits, if any, of less than 0.005%. Effective September 1, 2015, custody fee credits, which were earned on cash deposit balances, were discontinued by the custodian. |
| (4) | Interest and fee expense relates to the liability for floating rate notes issued in conjunction with residual interest bond transactions (see Note 1H). |
| | | | |
| | 22 | | See Notes to Financial Statements. |
Eaton Vance
High Yield Municipal Income Fund
January 31, 2019
Financial Highlights — continued
| | | | | | | | | | | | | | | | | | | | |
| | | Class I | |
| |
| | | Year Ended January 31, | |
| | | 2019 | | | 2018 | | | 2017 | | | 2016 | | | 2015 | |
| | | | | |
Net asset value — Beginning of year | | $ | 8.880 | | | $ | 8.660 | | | $ | 8.980 | | | $ | 9.020 | | | $ | 8.070 | |
|
| Income (Loss) From Operations | |
| | | | | |
Net investment income(1) | | $ | 0.364 | | | $ | 0.359 | | | $ | 0.367 | | | $ | 0.388 | | | $ | 0.397 | |
| | | | | |
Net realized and unrealized gain (loss) | | | (0.046 | ) | | | 0.220 | | | | (0.314 | ) | | | (0.041 | ) | | | 0.963 | |
| | | | | |
Total income from operations | | $ | 0.318 | | | $ | 0.579 | | | $ | 0.053 | | | $ | 0.347 | | | $ | 1.360 | |
|
| Less Distributions | |
| | | | | |
From net investment income | | $ | (0.358 | ) | | $ | (0.359 | ) | | $ | (0.373 | ) | | $ | (0.387 | ) | | $ | (0.410 | ) |
| | | | | |
Total distributions | | $ | (0.358 | ) | | $ | (0.359 | ) | | $ | (0.373 | ) | | $ | (0.387 | ) | | $ | (0.410 | ) |
| | | | | |
Net asset value — End of year | | $ | 8.840 | | | $ | 8.880 | | | $ | 8.660 | | | $ | 8.980 | | | $ | 9.020 | |
| | | | | |
Total Return(2) | | | 3.67 | % | | | 6.77 | % | | | 0.51 | % | | | 4.02 | % | | | 17.21 | % |
|
| Ratios/Supplemental Data | |
| | | | | |
Net assets, end of year (000’s omitted) | | $ | 656,830 | | | $ | 682,157 | | | $ | 542,623 | | | $ | 466,822 | | | $ | 409,570 | |
| | | | | |
Ratios (as a percentage of average daily net assets): | | | | | | | | | | | | | | | | | | | | |
| | | | | |
Expenses excluding interest and fees(3) | | | 0.54 | % | | | 0.53 | % | | | 0.54 | % | | | 0.56 | % | | | 0.58 | % |
| | | | | |
Interest and fee expense(4) | | | 0.17 | % | | | 0.14 | % | | | 0.10 | % | | | 0.05 | % | | | 0.06 | % |
| | | | | |
Total expenses(3) | | | 0.71 | % | | | 0.67 | % | | | 0.64 | % | | | 0.61 | % | | | 0.64 | % |
| | | | | |
Net investment income | | | 4.13 | % | | | 4.04 | % | | | 4.06 | % | | | 4.42 | % | | | 4.60 | % |
| | | | | |
Portfolio Turnover | | | 32 | % | | | 21 | % | | | 35 | % | | | 27 | % | | | 16 | % |
| (1) | Computed using average shares outstanding. |
| (2) | Returns are historical and are calculated by determining the percentage change in net asset value with all distributions reinvested. |
| (3) | Excludes the effect of custody fee credits, if any, of less than 0.005%. Effective September 1, 2015, custody fee credits, which were earned on cash deposit balances, were discontinued by the custodian. |
| (4) | Interest and fee expense relates to the liability for floating rate notes issued in conjunction with residual interest bond transactions (see Note 1H). |
| | | | |
| | 23 | | See Notes to Financial Statements. |
Eaton Vance
High Yield Municipal Income Fund
January 31, 2019
Notes to Financial Statements
1 Significant Accounting Policies
Eaton Vance High Yield Municipal Income Fund (the Fund) is a diversified series of Eaton Vance Municipals Trust II (the Trust). The Trust is a Massachusetts business trust registered under the Investment Company Act of 1940, as amended (the 1940 Act), as an open-end management investment company. The Fund seeks to provide high current income exempt from regular federal income tax. The Fund primarily invests in high yield municipal obligations with maturities of ten years or more. The Fund offers four classes of shares. Class A shares are generally sold subject to a sales charge imposed at time of purchase. Class B and Class C shares are sold at net asset value and are generally subject to a contingent deferred sales charge (see Note 5). Class I shares are sold at net asset value and are not subject to a sales charge. Class B shares automatically convert to Class A shares eight years after their purchase as described in the Fund’s prospectus. Beginning January 1, 2012, Class B shares are only available for purchase upon exchange from another Eaton Vance fund or through reinvestment of distributions. Effective January 25, 2019, Class C shares generally automatically convert to Class A shares ten years after their purchase as described in the Fund’s prospectus. Each class represents a pro-rata interest in the Fund, but votes separately on class-specific matters and (as noted below) is subject to different expenses. Realized and unrealized gains and losses are allocated daily to each class of shares based on the relative net assets of each class to the total net assets of the Fund. Net investment income, other thanclass-specific expenses, is allocated daily to each class of shares based upon the ratio of the value of each class’s paid shares to the total value of all paid shares. Each class of shares differs in its distribution plan and certain other class-specific expenses.
The following is a summary of significant accounting policies of the Fund. The policies are in conformity with accounting principles generally accepted in the United States of America (U.S. GAAP). The Fund is an investment company and follows accounting and reporting guidance in the Financial Accounting Standards Board (FASB) Accounting Standards Codification Topic 946.
A Investment Valuation — The following methodologies are used to determine the market value or fair value of investments.
Debt Obligations. Debt obligations are generally valued on the basis of valuations provided by third party pricing services, as derived from such services’ pricing models. Inputs to the models may include, but are not limited to, reported trades, executable bid and ask prices, broker/dealer quotations, prices or yields of securities with similar characteristics, interest rates, anticipated prepayments, benchmark curves or information pertaining to the issuer, as well as industry and economic events. The pricing services may use a matrix approach, which considers information regarding securities with similar characteristics to determine the valuation for a security. Short-term debt obligations purchased with a remaining maturity of sixty days or less for which a valuation from a third party pricing service is not readily available may be valued at amortized cost, which approximates fair value.
Derivatives. Financial futures contracts are valued at the closing settlement price established by the board of trade or exchange on which they are traded.
Fair Valuation. Investments for which valuations or market quotations are not readily available or are deemed unreliable are valued at fair value using methods determined in good faith by or at the direction of the Trustees of the Fund in a manner that fairly reflects the security’s value, or the amount that the Fund might reasonably expect to receive for the security upon its current sale in the ordinary course. Each such determination is based on a consideration of relevant factors, which are likely to vary from one pricing context to another. These factors may include, but are not limited to, the type of security, the existence of any contractual restrictions on the security’s disposition, the price and extent of public trading in similar securities of the issuer or of comparable companies or entities, quotations or relevant information obtained from broker/dealers or other market participants, information obtained from the issuer, analysts, and/or the appropriate stock exchange (for exchange-traded securities), an analysis of the company’s or entity’s financial condition, and an evaluation of the forces that influence the issuer and the market(s) in which the security is purchased and sold.
B Investment Transactions and Related Income — Investment transactions for financial statement purposes are accounted for on a trade date basis. Realized gains and losses on investments sold are determined on the basis of identified cost. Interest income is recorded on the basis of interest accrued, adjusted for amortization of premium or accretion of discount.
C Federal Taxes — The Fund’s policy is to comply with the provisions of the Internal Revenue Code applicable to regulated investment companies and to distribute to shareholders each year substantially all of its taxable, if any, and tax-exempt net investment income, and all or substantially all of its net realized capital gains. Accordingly, no provision for federal income or excise tax is necessary. The Fund intends to satisfy conditions which will enable it to designate distributions from the interest income generated by its investments in non-taxable municipal securities, which are exempt from regular federal income tax when received by the Fund, as exempt-interest dividends. The portion of such interest, if any, earned on private activity bonds issued after August 7, 1986, may be considered a tax preference item to shareholders.
As of January 31, 2019, the Fund had no uncertain tax positions that would require financial statement recognition, de-recognition, or disclosure. The Fund files a U.S. federal income tax return annually after its fiscal year-end, which is subject to examination by the Internal Revenue Service for a period of three years from the date of filing.
D Expenses — The majority of expenses of the Trust are directly identifiable to an individual fund. Expenses which are not readily identifiable to a specific fund are allocated taking into consideration, among other things, the nature and type of expense and the relative size of the funds.
E Legal Fees — Legal fees and other related expenses incurred as part of negotiations of the terms and requirement of capital infusions, or that are expected to result in the restructuring of, or a plan of reorganization for, an investment are recorded as realized losses. Ongoing expenditures to protect or enhance an investment are treated as operating expenses.
Eaton Vance
High Yield Municipal Income Fund
January 31, 2019
Notes to Financial Statements — continued
F Use of Estimates — The preparation of the financial statements in conformity with U.S. GAAP requires management to make estimates and assumptions that affect the reported amounts of assets and liabilities at the date of the financial statements and the reported amounts of income and expense during the reporting period. Actual results could differ from those estimates.
G Indemnifications — Under the Trust’s organizational documents, its officers and Trustees may be indemnified against certain liabilities and expenses arising out of the performance of their duties to the Fund. Under Massachusetts law, if certain conditions prevail, shareholders of a Massachusetts business trust (such as the Trust) could be deemed to have personal liability for the obligations of the Trust. However, the Trust’s Declaration of Trust contains an express disclaimer of liability on the part of Fund shareholders and the By-laws provide that the Trust shall assume the defense on behalf of any Fund shareholders. Moreover, the By-laws also provide for indemnification out of Fund property of any shareholder held personally liable solely by reason of being or having been a shareholder for all loss or expense arising from such liability. Additionally, in the normal course of business, the Fund enters into agreements with service providers that may contain indemnification clauses. The Fund’s maximum exposure under these arrangements is unknown as this would involve future claims that may be made against the Fund that have not yet occurred.
H Floating Rate Notes Issued in Conjunction with Securities Held — The Fund may invest in residual interest bonds, also referred to as inverse floating rate securities, whereby the Fund may sell a variable or fixed rate bond for cash to a Special-Purpose Vehicle (the SPV), (which is generally organized as a trust), while at the same time, buying a residual interest in the assets and cash flows of the SPV. The bond is deposited into the SPV with the same CUSIP number as the bond sold to the SPV by the Fund, and which may have been, but is not required to be, the bond purchased from the Fund (the Bond). The SPV also issues floating rate notes (Floating Rate Notes) which are sold to third-parties. The residual interest bond held by the Fund gives the Fund the right (1) to cause the holders of the Floating Rate Notes to generally tender their notes at par, and (2) to have the Bond held by the SPV transferred to the Fund, thereby terminating the SPV. Should the Fund exercise such right, it would generally pay the SPV the par amount due on the Floating Rate Notes and exchange the residual interest bond for the underlying Bond. Pursuant to generally accepted accounting principles for transfers and servicing of financial assets and extinguishment of liabilities, the Fund accounts for the transaction described above as a secured borrowing by including the Bond in its Portfolio of Investments and the Floating Rate Notes as a liability under the caption “Payable for floating rate notes issued” in its Statement of Assets and Liabilities. The Floating Rate Notes have interest rates that generally reset weekly and their holders have the option to tender their notes to the SPV for redemption at par at each reset date. Accordingly, the fair value of the payable for floating rate notes issued approximates its carrying value. If measured at fair value, the payable for floating rate notes would have been considered as Level 2 in the fair value hierarchy (see Note 10) at January 31, 2019. Interest expense related to the Fund’s liability with respect to Floating Rate Notes is recorded as incurred. The SPV may be terminated by the Fund, as noted above, or by the occurrence of certain termination events as defined in the trust agreement, such as a downgrade in the credit quality of the underlying Bond, bankruptcy of or payment failure by the issuer of the underlying Bond, the inability to remarket Floating Rate Notes that have been tendered due to insufficient buyers in the market, or the failure by the SPV to obtain renewal of the liquidity agreement under which liquidity support is provided for the Floating Rate Notes up to one year. At January 31, 2019, the amount of the Fund’s Floating Rate Notes outstanding and the related collateral were $87,421,288 and $130,389,768, respectively. The range of interest rates on the Floating Rate Notes outstanding at January 31, 2019 was 1.32% to 1.37%. For the year ended January 31, 2019, the Fund’s average settled Floating Rate Notes outstanding and the average interest rate including fees were $89,229,247 and 2.09%, respectively.
In certain circumstances, the Fund may enter into shortfall and forbearance agreements with brokers by which the Fund agrees to reimburse the broker for the difference between the liquidation value of the Bond held by the SPV and the liquidation value of the Floating Rate Notes, as well as any shortfalls in interest cash flows. The Fund had no shortfalls as of January 31, 2019.
The Fund may also purchase residual interest bonds in a secondary market transaction without first owning the underlying bond. Such transactions are not required to be treated as secured borrowings. Shortfall agreements, if any, related to residual interest bonds purchased in a secondary market transaction are disclosed in the Portfolio of Investments.
The Fund’s investment policies and restrictions expressly permit investments in residual interest bonds. Such bonds typically offer the potential for yields exceeding the yields available on fixed rate bonds with comparable credit quality and maturity. These securities tend to underperform the market for fixed rate bonds in a rising long-term interest rate environment, but tend to outperform the market for fixed rate bonds when long-term interest rates decline. The value and income of residual interest bonds are generally more volatile than that of a fixed rate bond. The Fund’s investment policies do not allow the Fund to borrow money except as permitted by the 1940 Act. Management believes that the Fund’s restrictions on borrowing money and issuing senior securities (other than as specifically permitted) do not apply to Floating Rate Notes issued by the SPV and included as a liability in the Fund’s Statement of Assets and Liabilities. As secured indebtedness issued by an SPV, Floating Rate Notes are distinct from the borrowings and senior securities to which the Fund’s restrictions apply. Residual interest bonds held by the Fund are securities exempt from registration under Rule 144A of the Securities Act of 1933.
I Financial Futures Contracts — Upon entering into a financial futures contract, the Fund is required to deposit with the broker, either in cash or securities, an amount equal to a certain percentage of the contract amount (initial margin). Subsequent payments, known as variation margin, are made or received by the Fund each business day, depending on the daily fluctuations in the value of the underlying security, and are recorded as unrealized gains or losses by the Fund. Gains (losses) are realized upon the expiration or closing of the financial futures contracts. Should market conditions change unexpectedly, the Fund may not achieve the anticipated benefits of the financial futures contracts and may realize a loss. Futures contracts have minimal counterparty risk as they are exchange traded and the clearinghouse for the exchange is substituted as the counterparty, guaranteeing counterparty performance.
Eaton Vance
High Yield Municipal Income Fund
January 31, 2019
Notes to Financial Statements — continued
J When-Issued Securities and Delayed Delivery Transactions — The Fund may purchase or sell securities on a delayed delivery or when-issued basis. Payment and delivery may take place after the customary settlement period for that security. At the time the transaction is negotiated, the price of the security that will be delivered is fixed. The Fund maintains cash and/or security positions for these commitments such that sufficient liquid assets will be available to make payments upon settlement. Securities purchased on a delayed delivery or when-issued basis are marked-to-market daily and begin earning interest on settlement date. Losses may arise due to changes in the market value of the underlying securities or if the counterparty does not perform under the contract.
2 Distributions to Shareholders and Income Tax Information
The net investment income of the Fund is determined daily and substantially all of the net investment income so determined is declared as a dividend to shareholders of record at the time of declaration. Distributions are declared separately for each class of shares. Distributions are paid monthly. Distributions of realized capital gains are made at least annually. Shareholders may reinvest income and capital gain distributions in additional shares of the same class of the Fund at the net asset value as of the reinvestment date or, at the election of the shareholder, receive distributions in cash. Distributions to shareholders are determined in accordance with income tax regulations, which may differ from U.S. GAAP. As required by U.S. GAAP, only distributions in excess of tax basis earnings and profits are reported in the financial statements as a return of capital. Permanent differences between book and tax accounting relating to distributions are reclassified to paid-in capital. For tax purposes, distributions from short-term capital gains are considered to be from ordinary income.
The tax character of distributions declared for the years ended January 31, 2019 and January 31, 2018 was as follows:
| | | | | | | | |
| | | Year Ended January 31, | |
| | | 2019 | | | 2018 | |
| | |
Tax-exempt income | | $ | 39,832,090 | | | $ | 40,437,408 | |
| | |
Ordinary income | | $ | 3,679,969 | | | $ | 3,690,493 | |
During the year ended January 31, 2019, distributable earnings was increased by $9,567,013 and paid-in capital was decreased by $9,567,013 due to expired capital loss carryforwards. These reclassifications had no effect on the net assets or net asset value per share of the Fund.
As of January 31, 2019, the components of distributable earnings (accumulated loss) on a tax basis were as follows:
| | | | |
| | |
Undistributed tax-exempt income | | $ | 8,659,634 | |
| |
Deferred capital losses | | $ | (46,563,954 | ) |
| |
Net unrealized appreciation | | $ | 40,400,264 | |
| |
Distributions payable | | $ | (598,226 | ) |
At January 31, 2019, the Fund, for federal income tax purposes, had deferred capital losses of $46,563,954 which would reduce its taxable income arising from future net realized gains on investment transactions, if any, to the extent permitted by the Internal Revenue Code, and thus would reduce the amount of distributions to shareholders, which would otherwise be necessary to relieve the Fund of any liability for federal income or excise tax. The deferred capital losses are treated as arising on the first day of the Fund’s next taxable year and retain the same short-term or long-term character as when originally deferred. Of the deferred capital losses at January 31, 2019, $12,110,129 are short-term and $34,453,825 are long-term.
The cost and unrealized appreciation (depreciation) of investments, including open derivative contracts, of the Fund at January 31, 2019, as determined on a federal income tax basis, were as follows:
| | | | |
| |
Aggregate cost | | $ | 1,099,102,293 | |
| |
Gross unrealized appreciation | | $ | 55,876,148 | |
| |
Gross unrealized depreciation | | | (15,475,884 | ) |
| |
Net unrealized appreciation | | $ | 40,400,264 | |
Eaton Vance
High Yield Municipal Income Fund
January 31, 2019
Notes to Financial Statements — continued
3 Investment Adviser Fee and Other Transactions with Affiliates
The investment adviser fee is earned by Boston Management and Research (BMR), a subsidiary of Eaton Vance Management (EVM), as compensation for management and investment advisory services rendered to the Fund. Pursuant to the investment advisory agreement and subsequent fee reduction agreements between the Fund and BMR, the fee is based upon a percentage of average daily net assets plus a percentage of gross income (i.e., income other than gains from the sale of securities) as presented in the following table and is payable monthly.
| | | | | | | | |
| Daily Net Assets | | Annual Asset Rate | | | Daily Income Rate | |
| | |
Up to $500 million | | | 0.3150 | % | | | 3.1500 | % |
| | |
$500 million but less than $750 million | | | 0.2925 | | | | 2.9250 | |
| | |
$750 million but less than $1 billion | | | 0.2700 | | | | 2.9250 | |
| | |
$1 billion but less than $1.5 billion | | | 0.2700 | | | | 2.7000 | |
On average daily net assets of $1.5 billion or more, the rates are further reduced. The fee reductions cannot be terminated without the consent of a majority of the Trustees and a majority of shareholders. For the year ended January 31, 2019, the investment adviser fee amounted to $5,055,238 or 0.45% of the Fund’s average daily net assets. EVM serves as the administrator of the Fund, but receives no compensation. EVM provides sub-transfer agency and related services to the Fund pursuant to a Sub-Transfer Agency Support Services Agreement. For the year ended January 31, 2019, EVM earned $19,959 from the Fund pursuant to such agreement, which is included in transfer and dividend disbursing agent fees on the Statement of Operations. The Fund was informed that Eaton Vance Distributors, Inc. (EVD), an affiliate of EVM and the Fund’s principal underwriter, received $32,667 as its portion of the sales charge on sales of Class A shares for the year ended January 31, 2019. EVD also received distribution and service fees from Class A, Class B and Class C shares (see Note 4) and contingent deferred sales charges (see Note 5).
Trustees and officers of the Fund who are members of EVM’s or BMR’s organizations receive remuneration for their services to the Fund out of the investment adviser fee. Trustees of the Fund who are not affiliated with the investment adviser may elect to defer receipt of all or a percentage of their annual fees in accordance with the terms of the Trustees Deferred Compensation Plan. For the year ended January 31, 2019, no significant amounts have been deferred. Certain officers and Trustees of the Fund are officers of the above organizations.
4 Distribution Plans
The Fund has in effect a distribution plan for Class A shares (Class A Plan) pursuant to Rule 12b-1 under the 1940 Act. Pursuant to the Class A Plan, the Fund pays EVD a distribution and service fee of 0.25% per annum of its average daily net assets attributable to Class A shares for distribution services and facilities provided to the Fund by EVD, as well as for personal services and/or the maintenance of shareholder accounts. Distribution and service fees paid or accrued to EVD for the year ended January 31, 2019 amounted to $774,818 for Class A shares.
The Fund also has in effect distribution plans for Class B shares (Class B Plan) and Class C shares (Class C Plan) pursuant to Rule 12b-1 under the 1940 Act. Pursuant to the Class B and Class C Plans, the Fund pays EVD amounts equal to 0.75% per annum of its average daily net assets attributable to Class B and Class C shares for providing ongoing distribution services and facilities to the Fund. For the year ended January 31, 2019, the Fund paid or accrued to EVD $4,530 and $1,210,977 for Class B and Class C shares, respectively.
Pursuant to the Class B and Class C Plans, the Fund also makes payments of service fees to EVD, financial intermediaries and other persons in amounts equal to 0.25% per annum of its average daily net assets attributable to that class. Service fees paid or accrued are for personal services and/or the maintenance of shareholder accounts. They are separate and distinct from the sales commissions and distribution fees payable to EVD. Service fees paid or accrued for the year ended January 31, 2019 amounted to $1,510 and $403,659 for Class B and Class C shares, respectively.
Distribution and service fees are subject to the limitations contained in the Financial Industry Regulatory Authority Rule 2341(d) and for Class B, are further limited to a 5% maximum sales charge as determined in accordance with such rule.
5 Contingent Deferred Sales Charges
A contingent deferred sales charge (CDSC) generally is imposed on redemptions of Class B shares made within six years of purchase and on redemptions of Class C shares made within one year of purchase. Class A shares may be subject to a 1% CDSC if redeemed within eighteen months of purchase (depending on the circumstances of purchase). Generally, the CDSC is based upon the lower of the net asset value at date of redemption or date of purchase. No charge is levied on shares acquired by reinvestment of dividends or capital gain distributions. The CDSC for Class B shares is imposed at declining rates that begin at 5% in the case of redemptions in the first and second year after purchase, declining one percentage point each subsequent year. Class C shares are subject to a 1% CDSC if redeemed within one year of purchase. For the year ended January 31, 2019, the Fund was informed that EVD received approximately $7,000 and $3,000 of CDSCs paid by Class A and Class C shareholders, respectively, and no CDSCs paid by Class B shareholders.
Eaton Vance
High Yield Municipal Income Fund
January 31, 2019
Notes to Financial Statements — continued
6 Purchases and Sales of Investments
Purchases and sales of investments, other than short-term obligations, aggregated $386,210,636 and $461,934,665, respectively, for the year ended January 31, 2019.
7 Shares of Beneficial Interest
The Fund’s Declaration of Trust permits the Trustees to issue an unlimited number of full and fractional shares of beneficial interest (without par value). Such shares may be issued in a number of different series (such as the Fund) and classes. Transactions in Fund shares were as follows:
| | | | | | | | |
| | | Year Ended January 31, | |
| Class A | | 2019 | | | 2018 | |
| | |
Sales | | | 8,272,949 | | | | 7,799,186 | |
| | |
Issued to shareholders electing to receive payments of distributions in Fund shares | | | 1,138,872 | | | | 1,286,789 | |
| | |
Redemptions | | | (12,086,607 | ) | | | (13,658,655 | ) |
| | |
Converted from Class B shares | | | 82,938 | | | | 118,562 | |
| | |
Converted from Class C shares | | | 3,476,243 | | | | — | |
| | |
Net increase (decrease) | | | 884,395 | | | | (4,454,118 | ) |
| |
| | | Year Ended January 31, | |
| Class B | | 2019 | | | 2018 | |
| | |
Sales | | | 23 | | | | 1,110 | |
| | |
Issued to shareholders electing to receive payments of distributions in Fund shares | | | 1,682 | | | | 5,097 | |
| | |
Redemptions | | | (9,400 | ) | | | (40,889 | ) |
| | |
Converted to Class A shares | | | (83,222 | ) | | | (118,969 | ) |
| | |
Net decrease | | | (90,917 | ) | | | (153,651 | ) |
| |
| | | Year Ended January 31, | |
| Class C | | 2019 | | | 2018 | |
| | |
Sales | | | 1,818,684 | | | | 2,007,988 | |
| | |
Issued to shareholders electing to receive payments of distributions in Fund shares | | | 501,610 | | | | 549,469 | |
| | |
Redemptions | | | (4,307,595 | ) | | | (5,323,504 | ) |
| | |
Converted to Class A shares | | | (3,753,548 | ) | | | — | |
| | |
Net decrease | | | (5,740,849 | ) | | | (2,766,047 | ) |
| |
| | | Year Ended January 31, | |
| Class I | | 2019 | | | 2018 | |
| | |
Sales | | | 33,033,051 | | | | 35,197,411 | |
| | |
Issued to shareholders electing to receive payments of distributions in Fund shares | | | 2,562,373 | | | | 2,392,122 | |
| | |
Redemptions | | | (38,077,931 | ) | | | (23,455,201 | ) |
| | |
Net increase (decrease) | | | (2,482,507 | ) | | | 14,134,332 | |
Eaton Vance
High Yield Municipal Income Fund
January 31, 2019
Notes to Financial Statements — continued
8 Line of Credit
The Fund participates with other portfolios and funds managed by EVM and its affiliates in a $625 million unsecured line of credit agreement with a group of banks, which is in effect through October 29, 2019. Borrowings are made by the Fund solely to facilitate the handling of unusual and/or unanticipated short-term cash requirements. Interest is charged to the Fund based on its borrowings at an amount above either the Eurodollar rate or Federal Funds rate. In addition, a fee computed at an annual rate of 0.15% on the daily unused portion of the line of credit is allocated among the participating portfolios and funds at the end of each quarter. Because the line of credit is not available exclusively to the Fund, it may be unable to borrow some or all of its requested amounts at any particular time. The Fund did not have any significant borrowings or allocated fees during the year ended January 31, 2019.
9 Financial Instruments
The Fund may trade in financial instruments with off-balance sheet risk in the normal course of its investing activities. These financial instruments may include financial futures contracts and may involve, to a varying degree, elements of risk in excess of the amounts recognized for financial statement purposes. The notional or contractual amounts of these instruments represent the investment the Fund has in particular classes of financial instruments and do not necessarily represent the amounts potentially subject to risk. The measurement of the risks associated with these instruments is meaningful only when all related and offsetting transactions are considered. A summary of obligations under these financial instruments at January 31, 2019 is included in the Portfolio of Investments. At January 31, 2019, the Fund had sufficient cash and/or securities to cover commitments under these contracts.
The Fund is subject to interest rate risk in the normal course of pursuing its investment objective. Because the Fund holds fixed-rate bonds, the value of these bonds may decrease if interest rates rise. The Fund enters into U.S. Treasury futures contracts to hedge against changes in interest rates.
The fair value of open derivative instruments (not considered to be hedging instruments for accounting disclosure purposes) and whose primary underlying risk exposure is interest rate risk at January 31, 2019 was as follows:
| | | | | | | | |
| | | Fair Value | |
| Derivative | | Asset Derivative | | | Liability Derivative(1) | |
| | |
Futures Contracts | | $ | — | | | $ | (1,448,094 | ) |
| (1) | Amount represents cumulative unrealized depreciation on futures contracts. Only the current day’s variation margin on open futures contracts is reported within the Statement of Assets and Liabilities as Receivable or Payable for variation margin on open financial futures contracts, as applicable. |
The effect of derivative instruments (not considered to be hedging instruments for accounting disclosure purposes) on the Statement of Operations and whose primary underlying risk exposure is interest rate risk for the year ended January 31, 2019 was as follows:
| | | | | | | | |
| Derivative | | Realized Gain (Loss)
on Derivatives Recognized
in Income(1) | | | Change in Unrealized
Appreciation (Depreciation) on
Derivatives Recognized in Income(2) | |
| | |
Futures Contracts | | $ | 1,964,593 | | | $ | (2,561,708 | ) |
| (1) | Statement of Operations location: Net realized gain (loss) – Financial futures contracts. |
| (2) | Statement of Operations location: Change in unrealized appreciation (depreciation) – Financial futures contracts. |
The average notional cost of futures contracts (short) outstanding during the year ended January 31, 2019, which is indicative of the volume of this derivative type, was approximately $37,030,000.
10 Fair Value Measurements
Under generally accepted accounting principles for fair value measurements, a three-tier hierarchy to prioritize the assumptions, referred to as inputs, is used in valuation techniques to measure fair value. The three-tier hierarchy of inputs is summarized in the three broad levels listed below.
| • | | Level 1 – quoted prices in active markets for identical investments |
| • | | Level 2 – other significant observable inputs (including quoted prices for similar investments, interest rates, prepayment speeds, credit risk, etc.) |
| • | | Level 3 – significant unobservable inputs (including a fund’s own assumptions in determining the fair value of investments) |
Eaton Vance
High Yield Municipal Income Fund
January 31, 2019
Notes to Financial Statements — continued
In cases where the inputs used to measure fair value fall in different levels of the fair value hierarchy, the level disclosed is determined based on the lowest level input that is significant to the fair value measurement in its entirety. The inputs or methodology used for valuing securities are not necessarily an indication of the risk associated with investing in those securities.
At January 31, 2019, the hierarchy of inputs used in valuing the Fund’s investments and open derivative instruments, which are carried at value, were as follows:
| | | | | | | | | | | | | | | | |
| Asset Description | | Level 1 | | | Level 2 | | | Level 3 | | | Total | |
| | | | |
Tax-Exempt Municipal Securities | | $ | — | | | $ | 1,149,469,176 | | | $ | — | | | $ | 1,149,469,176 | |
| | | | |
Taxable Municipal Securities | | | — | | | | 60,659,659 | | | | — | | | | 60,659,659 | |
| | | | |
Corporate Bonds & Notes | | | — | | | | 16,795,010 | | | | — | | | | 16,795,010 | |
| | | | |
Total Investments | | $ | — | | | $ | 1,226,923,845 | | | $ | — | | | $ | 1,226,923,845 | |
| | | | |
Liability Description | | | | | | | | | | | | | | | | |
| | | | |
Futures Contracts | | $ | (1,448,094 | ) | | $ | — | | | $ | — | | | $ | (1,448,094 | ) |
| | | | |
Total | | $ | (1,448,094 | ) | | $ | — | | | $ | — | | | $ | (1,448,094 | ) |
Eaton Vance
High Yield Municipal Income Fund
January 31, 2019
Report of Independent Registered Public Accounting Firm
To the Trustees of Eaton Vance Municipals Trust II and Shareholders of Eaton Vance High Yield Municipal Income Fund:
Opinion on the Financial Statements and Financial Highlights
We have audited the accompanying statement of assets and liabilities of Eaton Vance High Yield Municipal Income Fund (the “Fund”) (one of the funds constituting Eaton Vance Municipals Trust II), including the portfolio of investments, as of January 31, 2019, the related statement of operations for the year then ended, the statements of changes in net assets for each of the two years in the period then ended, the financial highlights for each of the five years in the period then ended, and the related notes. In our opinion, the financial statements and financial highlights present fairly, in all material respects, the financial position of the Fund as of January 31, 2019, and the results of its operations for the year then ended, the changes in its net assets for each of the two years in the period then ended, and the financial highlights for each of the five years in the period then ended, in conformity with accounting principles generally accepted in the United States of America.
Basis for Opinion
These financial statements and financial highlights are the responsibility of the Fund’s management. Our responsibility is to express an opinion on the Fund’s financial statements and financial highlights based on our audits. We are a public accounting firm registered with the Public Company Accounting Oversight Board (United States) (PCAOB) and are required to be independent with respect to the Fund in accordance with the U.S. federal securities laws and the applicable rules and regulations of the Securities and Exchange Commission and the PCAOB.
We conducted our audits in accordance with the standards of the PCAOB. Those standards require that we plan and perform the audit to obtain reasonable assurance about whether the financial statements and financial highlights are free of material misstatement, whether due to error or fraud. The Fund is not required to have, nor were we engaged to perform, an audit of its internal control over financial reporting. As part of our audits we are required to obtain an understanding of internal control over financial reporting but not for the purpose of expressing an opinion on the effectiveness of the Fund’s internal control over financial reporting. Accordingly, we express no such opinion.
Our audits included performing procedures to assess the risks of material misstatement of the financial statements and financial highlights, whether due to error or fraud, and performing procedures that respond to those risks. Such procedures included examining, on a test basis, evidence regarding the amounts and disclosures in the financial statements and financial highlights. Our audits also included evaluating the accounting principles used and significant estimates made by management, as well as evaluating the overall presentation of the financial statements and financial highlights. Our procedures included confirmation of securities owned as of January 31, 2019, by correspondence with the custodian and brokers; when replies were not received from brokers, we performed other auditing procedures. We believe that our audits provide a reasonable basis for our opinion.
/s/ Deloitte & Touche LLP
Boston, Massachusetts
March 21, 2019
We have served as the auditor of one or more Eaton Vance investment companies since 1959.
Eaton Vance
High Yield Municipal Income Fund
January 31, 2019
Federal Tax Information (Unaudited)
The Form 1099-DIV you receive in February 2020 will show the tax status of all distributions paid to your account in calendar year 2019. Shareholders are advised to consult their own tax adviser with respect to the tax consequences of their investment in the Fund. As required by the Internal Revenue Code and/or regulations, shareholders must be notified regarding exempt-interest dividends.
Exempt-Interest Dividends. For the fiscal year ended January 31, 2019, the Fund designates 91.54% of distributions from net investment income as an exempt-interest dividend.
Eaton Vance
High Yield Municipal Income Fund
January 31, 2019
Special Meeting of Shareholders (Unaudited)
The Fund held a Special Meeting of Shareholders on September 20, 2018 to elect the five Trustees listed below. The other Trustees named herein continue to serve as Trustees. The results of the vote with respect to the Fund were as follows:
| | | | | | | | |
| | | Number of Shares | |
| Nominee for Trustee | | For | | | Withheld | |
| | |
Mark R. Fetting | | | 119,428,530 | | | | 997,147 | |
| | |
Keith Quinton | | | 119,407,847 | | | | 1,017,830 | |
| | |
Marcus L. Smith | | | 119,375,409 | | | | 1,050,268 | |
| | |
Susan J. Sutherland | | | 119,774,590 | | | | 651,086 | |
| | |
Scott E. Wennerholm | | | 119,368,746 | | | | 1,056,931 | |
| Results | are rounded to the nearest whole number. |
Eaton Vance
High Yield Municipal Income Fund
January 31, 2019
Management and Organization
Fund Management. The Trustees of Eaton Vance Municipals Trust II (the Trust) are responsible for the overall management and supervision of the Trust’s affairs. The Trustees and officers of the Trust are listed below. Except as indicated, each individual has held the office shown or other offices in the same company for the last five years. Trustees and officers of the Trust hold indefinite terms of office. The “noninterested Trustees” consist of those Trustees who are not “interested persons” of the Trust, as that term is defined under the 1940 Act. The business address of each Trustee and officer is Two International Place, Boston, Massachusetts 02110. As used below, “EVC” refers to Eaton Vance Corp., “EV” refers to Eaton Vance, Inc., “EVM” refers to Eaton Vance Management, “BMR” refers to Boston Management and Research and “EVD” refers to Eaton Vance Distributors, Inc. EVC and EV are the corporate parent and trustee, respectively, of EVM and BMR. EVD is the Fund’s principal underwriter and a wholly-owned subsidiary of EVC. Each officer affiliated with Eaton Vance may hold a position with other Eaton Vance affiliates that is comparable to his or her position with EVM listed below. Each Trustee oversees 175 portfolios in the Eaton Vance Complex (including all master and feeder funds in a master feeder structure). Each officer serves as an officer of certain other Eaton Vance funds. Each Trustee and officer serves until his or her successor is elected.
| | | | | | |
| Name and Year of Birth | | Position(s) with the Trust | | Trustee Since(1) | | Principal Occupation(s) and Directorships
During Past Five Years and Other Relevant Experience |
|
| Interested Trustee |
| | | |
Thomas E. Faust Jr. 1958 | | Trustee | | 2007 | | Chairman, Chief Executive Officer and President of EVC, Director and President of EV, Chief Executive Officer and President of EVM and BMR, and Director of EVD. Trustee and/or officer of 175 registered investment companies. Mr. Faust is an interested person because of his positions with EVM, BMR, EVD, EVC and EV, which are affiliates of the Trust. Directorships in the Last Five Years.(2) Director of EVC and Hexavest Inc. (investment management firm). |
|
| Noninterested Trustees |
| | | |
Mark R. Fetting 1954 | | Trustee | | 2016 | | Private investor. Formerly held various positions at Legg Mason, Inc. (investment management firm) (2000-2012), including President, Chief Executive Officer, Director and Chairman (2008-2012), Senior Executive Vice President(2004-2008) and Executive Vice President (2001-2004). Formerly, President of Legg Mason family of funds (2001-2008). Formerly, Division President and Senior Officer of Prudential Financial Group, Inc. and related companies (investment management firm) (1991-2000). Directorships in the Last Five Years. None. |
| | | |
Cynthia E. Frost 1961 | | Trustee | | 2014 | | Private investor. Formerly, Chief Investment Officer of Brown University (university endowment) (2000-2012). Formerly, Portfolio Strategist for Duke Management Company (university endowment manager) (1995-2000). Formerly, Managing Director, Cambridge Associates (investment consulting company) (1989-1995). Formerly, Consultant, Bain and Company (management consulting firm)(1987-1989). Formerly, Senior Equity Analyst, BA Investment Management Company (1983-1985). Directorships in the Last Five Years. None. |
| | | |
George J. Gorman 1952 | | Trustee | | 2014 | | Principal at George J. Gorman LLC (consulting firm). Formerly, Senior Partner at Ernst & Young LLP (a registered public accounting firm) (1974-2009). Directorships in the Last Five Years. Formerly, Trustee of the BofA Funds Series Trust (11 funds) (2011-2014) and of the Ashmore Funds (9 funds) (2010-2014). |
| | | |
Valerie A. Mosley 1960 | | Trustee | | 2014 | | Chairwoman and Chief Executive Officer of Valmo Ventures (a consulting and investment firm). Former Partner and Senior Vice President, Portfolio Manager and Investment Strategist at Wellington Management Company, LLP (investment management firm) (1992-2012). Former Chief Investment Officer, PG Corbin Asset Management (1990-1992). Formerly worked in institutional corporate bond sales at Kidder Peabody (1986-1990). Directorships in the Last Five Years.(2) Director of Envestnet, Inc. (provider of intelligent systems for wealth management and financial wellness) (since 2018). |
Eaton Vance
High Yield Municipal Income Fund
January 31, 2019
Management and Organization — continued
| | | | | | |
| Name and Year of Birth | | Position(s) with the Trust | | Trustee Since(1) | | Principal Occupation(s) and Directorships During Past Five Years and Other Relevant Experience |
|
| Noninterested Trustees (continued) |
| | | |
William H. Park 1947 | | Chairperson of the Board and Trustee | | 2016 (Chairperson) 2003 (Trustee) | | Private investor. Formerly, Consultant (management and transactional)(2012-2014). Formerly, Chief Financial Officer, Aveon Group L.P. (investment management firm) (2010-2011). Formerly, Vice Chairman, Commercial Industrial Finance Corp. (specialty finance company) (2006-2010). Formerly, President and Chief Executive Officer, Prizm Capital Management, LLC (investment management firm) (2002-2005). Formerly, Executive Vice President and Chief Financial Officer, United Asset Management Corporation (investment management firm) (1982-2001). Formerly, Senior Manager, Price Waterhouse (now PricewaterhouseCoopers) (a registered public accounting firm) (1972-1981). Directorships in the Last Five Years.(2) None. |
| | | |
Helen Frame Peters 1948 | | Trustee | | 2008 | | Professor of Finance, Carroll School of Management, Boston College. Formerly, Dean, Carroll School of Management, Boston College (2000-2002). Formerly, Chief Investment Officer, Fixed Income, Scudder Kemper Investments (investment management firm) (1998-1999). Formerly, Chief Investment Officer, Equity and Fixed Income, Colonial Management Associates (investment management firm) (1991-1998). Directorships in the Last Five Years.(2) None. |
| | | |
Keith Quinton(3) 1958 | | Trustee | | 2018 | | Independent Investment Committee Member at New Hampshire Retirement System (since 2017). Advisory Committee member at Northfield Information Services, Inc. (risk management analytics provider) (since 2016). Formerly, Portfolio Manager and Senior Quantitative Analyst at Fidelity Investments (investment management firm) (2001-2014). Directorships in the Last Five Years. Director of New Hampshire Municipal Bond Bank (since 2016). |
| | | |
Marcus L. Smith(3) 1966 | | Trustee | | 2018 | | Member of Posse Boston Advisory Board (foundation) (since 2015); Trustee at University of Mount Union (since 2008). Formerly, Portfolio Manager at MFS Investment Management (investment management firm) (1994-2017). Directorships in the Last Five Years. Director of MSCI Inc. (global provider of investment decision support tools) (since 2017). Director of DCT Industrial Trust Inc. (logistics real estate company) (since 2017). |
| | | |
Susan J. Sutherland 1957 | | Trustee | | 2015 | | Private investor. Formerly, Associate, Counsel and Partner at Skadden, Arps, Slate, Meagher & Flom LLP (law firm) (1982-2013). Directorships in the Last Five Years. Formerly, Director of Montpelier Re Holdings Ltd. (global provider of customized insurance and reinsurance products)(2013-2015). |
| | | |
Scott E. Wennerholm 1959 | | Trustee | | 2016 | | Formerly, Trustee at Wheelock College (postsecondary institution) (2012-2018). Formerly, Consultant at GF Parish Group (executive recruiting firm) (2016-2017). Formerly, Chief Operating Officer and Executive Vice President at BNY Mellon Asset Management (investment management firm) (2005-2011). Formerly, Chief Operating Officer and Chief Financial Officer at Natixis Global Asset Management (investment management firm) (1997-2004). Formerly, Vice President at Fidelity Investments Institutional Services (investment management firm) (1994-1997). Directorships in the Last Five Years. None. |
| | | | | | |
| Name and Year of Birth | | Position(s) with the Trust | | Officer Since(4) | | Principal Occupation(s)
During Past Five Years |
|
| Principal Officers who are not Trustees |
| | | |
Payson F. Swaffield 1956 | | President | | 2003 | | Vice President and Chief Income Investment Officer of EVM and BMR. Also Vice President of Calvert Research and Management (“CRM”). |
| | | |
Maureen A. Gemma 1960 | | Vice President, Secretary and Chief Legal Officer | | 2005 | | Vice President of EVM and BMR. Also Vice President and officer of CRM. |
Eaton Vance
High Yield Municipal Income Fund
January 31, 2019
Management and Organization — continued
| | | | | | |
| Name and Year of Birth | | Position(s) with the Trust | | Officer Since(4) | | Principal Occupation(s) During Past Five Years |
|
| Principal Officers who are not Trustees (continued) |
| | | |
James F. Kirchner 1967 | | Treasurer | | 2007 | | Vice President of EVM and BMR. Also Vice President and officer of CRM. |
| | | |
Richard F. Froio 1968 | | Chief Compliance Officer | | 2017 | | Vice President of EVM and BMR since 2017. Formerly Deputy Chief Compliance Officer (Adviser/Funds) and Chief Compliance Officer (Distribution) at PIMCO (2012-2017) and Managing Director at BlackRock/Barclays Global Investors (2009-2012). |
| (1) | Year first appointed to serve as Trustee for a fund in the Eaton Vance family of funds. Each Trustee has served continuously since appointment unless indicated otherwise. |
| (2) | During their respective tenures, the Trustees (except for Mmes. Frost and Sutherland and Messrs. Fetting, Gorman, Quinton, Smith and Wennerholm) also served as Board members of one or more of the following funds (which operated in the years noted): eUnitsTM 2 Year U.S. Market Participation Trust: Upside to Cap / Buffered Downside (launched in 2012 and terminated in 2014); and eUnitsTM 2 Year U.S. Market Participation Trust II: Upside to Cap / Buffered Downside (launched in 2012 and terminated in 2014). However, Ms. Mosley did not serve as a Board member of eUnitsTM 2 Year U.S. Market Participation Trust: Upside to Cap / Buffered Downside (launched in 2012 and terminated in 2014). |
| (3) | Messrs. Quinton and Smith began serving as Trustees effective October 1, 2018. |
| (4) | Year first elected to serve as officer of a fund in the Eaton Vance family of funds when the officer has served continuously. Otherwise, year of most recent election as an officer of a fund in the Eaton Vance family of funds. Titles may have changed since initial election. |
The SAI for the Fund includes additional information about the Trustees and officers of the Fund and can be obtained without charge on Eaton Vance’s website at www.eatonvance.com or by calling 1-800-262-1122.
Eaton Vance Funds
IMPORTANT NOTICES
Privacy. The Eaton Vance organization is committed to ensuring your financial privacy. Each of the financial institutions identified below has in effect the following policy (“Privacy Policy”) with respect to nonpublic personal information about its customers:
| • | | Only such information received from you, through application forms or otherwise, and information about your Eaton Vance fund transactions will be collected. This may include information such as name, address, social security number, tax status, account balances and transactions. |
| • | | None of such information about you (or former customers) will be disclosed to anyone, except as permitted by law (which includes disclosure to employees necessary to service your account). In the normal course of servicing a customer’s account, Eaton Vance may share information with unaffiliated third parties that perform various required services such as transfer agents, custodians and broker-dealers. |
| • | | Policies and procedures (including physical, electronic and procedural safeguards) are in place that are designed to protect the confidentiality of such information. |
| • | | We reserve the right to change our Privacy Policy at any time upon proper notification to you. Customers may want to review our Privacy Policy periodically for changes by accessing the link on our homepage: www.eatonvance.com. |
Our pledge of privacy applies to the following entities within the Eaton Vance organization: the Eaton Vance Family of Funds, Eaton Vance Management, Eaton Vance Investment Counsel, Eaton Vance Distributors, Inc., Eaton Vance Trust Company, Eaton Vance Management (International) Limited, Eaton Vance Advisers International Ltd., Eaton Vance Management’s Real Estate Investment Group and Boston Management and Research. In addition, our Privacy Policy applies only to those Eaton Vance customers who are individuals and who have a direct relationship with us. If a customer’s account (i.e., fund shares) is held in the name of a third-party financial advisor/broker-dealer, it is likely that only such advisor’s privacy policies apply to the customer. This notice supersedes all previously issued privacy disclosures. For more information about Eaton Vance’s Privacy Policy, please call 1-800-262-1122.
Delivery of Shareholder Documents. The Securities and Exchange Commission (SEC) permits funds to deliver only one copy of shareholder documents, including prospectuses, proxy statements and shareholder reports, to fund investors with multiple accounts at the same residential or post office box address. This practice is often called “householding” and it helps eliminate duplicate mailings to shareholders.Eaton Vance, or your financial advisor, may household the mailing of your documents indefinitely unless you instruct Eaton Vance, or your financial advisor, otherwise.If you would prefer that your Eaton Vance documents not be householded, please contact Eaton Vance at 1-800-262-1122, or contact your financial advisor. Your instructions that householding not apply to delivery of your Eaton Vance documents will typically be effective within 30 days of receipt by Eaton Vance or your financial advisor.
Portfolio Holdings. Each Eaton Vance Fund and its underlying Portfolio(s) (if applicable) will file a schedule of portfolio holdings on Form N-Q with the SEC for the first and third quarters of each fiscal year. The Form N-Q will be available on the Eaton Vance website at www.eatonvance.com, by calling Eaton Vance at 1-800-262-1122 or in the EDGAR database on the SEC’s website at www.sec.gov. Form N-Q may also be reviewed and copied at the SEC’s public reference room in Washington, D.C. (call 1-800-732-0330 for information on the operation of the public reference room).
Proxy Voting. From time to time, funds are required to vote proxies related to the securities held by the funds. The Eaton Vance Funds or their underlying Portfolios (if applicable) vote proxies according to a set of policies and procedures approved by the Funds’ and Portfolios’ Boards. You may obtain a description of these policies and procedures and information on how the Funds or Portfolios voted proxies relating to portfolio securities during the most recent 12-month period ended June 30, without charge, upon request, by calling 1-800-262-1122 and by accessing the SEC’s website at www.sec.gov.
This Page Intentionally Left Blank
This Page Intentionally Left Blank
This Page Intentionally Left Blank
Investment Adviser
Boston Management and Research
Two International Place
Boston, MA 02110
Administrator
Eaton Vance Management
Two International Place
Boston, MA 02110
Principal Underwriter*
Eaton Vance Distributors, Inc.
Two International Place
Boston, MA 02110
(617) 482-8260
Custodian
State Street Bank and Trust Company
State Street Financial Center, One Lincoln Street
Boston, MA 02111
Transfer Agent
BNY Mellon Investment Servicing (US) Inc.
Attn: Eaton Vance Funds
P.O. Box 9653
Providence, RI 02940-9653
(800) 262-1122
Independent Registered Public Accounting Firm
Deloitte & Touche LLP
200 Berkeley Street
Boston, MA 02116-5022
Fund Offices
Two International Place
Boston, MA 02110
| * | FINRA BrokerCheck. Investors may check the background of their Investment Professional by contacting the Financial Industry Regulatory Authority (FINRA). FINRA BrokerCheck is a free tool to help investors check the professional background of current and former FINRA-registered securities firms and brokers. FINRA BrokerCheck is available by calling 1-800-289-9999 and at www.FINRA.org. The FINRA BrokerCheck brochure describing this program is available to investors at www.FINRA.org. |

416 1.31.19

Eaton Vance
TABS Municipal Bond Funds
Annual Report
January 31, 2019
Important Note. Beginning on January 1, 2021, as permitted by regulations adopted by the Securities and Exchange Commission, paper copies of each Fund’s annual and semi-annual shareholder reports will no longer be sent by mail unless you specifically request paper copies of the reports. Instead, the reports will be made available on the Funds’ website (eatonvance.com/funddocuments), and you will be notified by mail each time a report is posted and provided with a website address to access the report.
If you already elected to receive shareholder reports electronically, you will not be affected by this change and you need not take any action. If you are a direct investor, you may elect to receive shareholder reports and other communications from the Funds electronically by signing up for e-Delivery at eatonvance.com/edelivery. If you own your shares through a financial intermediary (such as a broker-dealer or bank), you must contact your financial intermediary to sign up.
You may elect to receive all future Fund shareholder reports in paper free of charge. If you are a direct investor, you can inform the Funds that you wish to continue receiving paper copies of your shareholder reports by calling 1-800-262-1122. If you own these shares through a financial intermediary, you must contact your financial intermediary or follow instructions included with this disclosure, if applicable, to elect to continue to receive paper copies of your shareholder reports. Your election to receive reports in paper will apply to all Eaton Vance funds held directly or to all funds held through your financial intermediary, as applicable.

Commodity Futures Trading Commission Registration. Effective December 31, 2012, the Commodity Futures Trading Commission (“CFTC”) adopted certain regulatory changes that subject registered investment companies and advisers to regulation by the CFTC if a fund invests more than a prescribed level of its assets in certain CFTC-regulated instruments (including futures, certain options and swap agreements) or markets itself as providing investment exposure to such instruments. Each Fund has claimed an exclusion from the definition of the term “commodity pool operator” under the Commodity Exchange Act. Accordingly, neither the Funds nor the adviser with respect to the operation of the Funds is subject to CFTC regulation. Because of its management of other strategies, each Fund’s adviser is registered with the CFTC as a commodity pool operator and a commodity trading advisor.
Fund shares are not insured by the FDIC and are not deposits or other obligations of, or guaranteed by, any depository institution. Shares are subject to investment risks, including possible loss of principal invested.
This report must be preceded or accompanied by a current summary prospectus or prospectus. Before investing, investors should consider carefully the investment objective, risks, and charges and expenses of a mutual fund. This and other important information is contained in the summary prospectus and prospectus, which can be obtained from a financial advisor. Prospective investors should read the prospectus carefully before investing. For further information, please call 1-800-262-1122.
Annual Report January 31, 2019
Eaton Vance
TABS Municipal Bond Funds
Table of Contents
| | | | |
Management’s Discussion of Fund Performance | | | 2 | |
| |
Performance and Fund Profile | | | | |
| |
| | | | |
TABS Short-Term Municipal Bond Fund | | | 4 | |
TABS Intermediate-Term Municipal Bond Fund | | | 6 | |
| |
| | | | |
| |
Endnotes and Additional Disclosures | | | 8 | |
| |
Fund Expenses | | | 9 | |
| |
Financial Statements | | | 11 | |
| |
Report of Independent Registered Public Accounting Firm | | | 36 | |
| |
Federal Tax Information | | | 37 | |
| |
Special Meeting of Shareholders | | | 38 | |
| |
Management and Organization | | | 39 | |
| |
Important Notices | | | 42 | |
Eaton Vance
TABS Municipal Bond Funds
January 31, 2019
Management’s Discussion of Fund Performance1
Economic and Market Conditions
The12-month period ended January 31, 2019, was positive for the municipal bond market, with the Bloomberg Barclays Municipal Bond Index,2 a broad measure of the asset class, returning 3.26%.
Bond performance, however, varied considerably across the AAA6 municipal yield curve.8 During the period, rates rose and bond prices fell in the 0–2 year and 19–30 year areas of the curve. But rates declined in the 3–18 year segment of the curve, with the largest declines — and the strongest bond price performance — occurring in the 10–12 year part of the curve. As a result, the front end of the municipal yield curve — 1–9 years — generally flattened while the back end — 10–30 years — steepened. In addition, lower-rated bonds generally outperformed higher-rated issues during the period. Municipal bonds outperformed comparable U.S. Treasurys in the 1–10 year area of the yield curve, while Treasurys outperformed municipals across the remainder of the curve.
As the period opened in February 2018, signs of increasing inflation, higher wage growth and fears that recent tax legislation might overheat the economy were pushing interest rates up and bond prices down. Upward pressure on short-term rates continued in March and June 2018 as the U.S. Federal Reserve Board (the Fed) delivered its first two rate hikes of the year. At the long end of the curve, however, fluctuating perceptions of geopolitical risk were a primary driver of rates from April through the end of August 2018. Investors toggled between concern that the U.S. was initiating a global trade war and optimism about economic growth and a potential detente between the U.S. and North Korea.
In September 2018, the Fed hiked the federal funds rate again, which pushed up both U.S. Treasury and municipal rates across the curve. In October 2018, a strong U.S. employment report and easing concerns about Italy’s national budget crisis continued the upward pressure on longer-term rates. But as 2018 came to a close, investors became increasingly concerned about a trade war with China, a potential government shutdown and dovish comments by the Fed that led the futures market to project the possibility of no further rate hikes in 2019. The result was a “flight to quality” by bond investors that pushed longer-term bond prices up and rates down in December 2018.
The first month of 2019, in contrast, was relatively quiet for bonds. As investors waited to see the outcome of the longest-ever U.S. government shutdown, municipal interest rates were virtually unchanged in January.
Fund Performance
For the12-month period ended January 31, 2019, Eaton Vance TABS Short-Term Municipal Bond Fund returned 2.00% for Class A shares at net asset value (NAV), underperforming its primary benchmark, the Bloomberg Barclays 5 Year Municipal Bond Index, which returned 2.85%.
For the12-month period ended January 31, 2019, Eaton Vance TABS Intermediate-Term Municipal Bond Fund returned 2.38% for Class A shares at NAV, underperforming its primary benchmark, the Bloomberg Barclays Municipal Managed Money Intermediate 1–17 Year Bond Index, which returned 3.58%. The Indexes are unmanaged and returns do not reflect any applicable sales charges, commissions, or expenses.
The TABS Short-Term and Intermediate-Term Funds seekafter-tax total return. The Funds generally invest in investment-grade municipal securities of limited or intermediate duration.7 Management pursuesafter-tax total return through relative value trading to take advantage of inefficiencies within the municipal market. With respect to 20% of each Fund’s net assets, management may also strive to add value by crossing over fromtax-free municipals to U.S. government bonds and/or taxable municipal bonds, and vice versa, according to which sector is perceived to be more attractively valued on anafter-tax basis.
Fund-Specific Results
For Eaton Vance TABS Short-Term Municipal Bond Fund, credit quality and duration were the main detractors from Fund performance versus its benchmark during the period. The Fund’s higher average credit quality, compared with its benchmark, hurt relative performance during the period, when lower-rated bonds generally outperformed higher-rated issues. The Fund was underweight versus the benchmark in lower-quality, better-performingA- andBBB-rated bonds and overweight in higher-qualityAAA-rated issues.
Duration, or interest rate sensitivity, detracted from Fund performance versus its benchmark. For the period as a whole, rates fell and prices rose for short-term municipal bonds. The Fund had a shorter duration than its benchmark during the period, and thus benefited less than its benchmark from rising bond prices.
See Endnotes and Additional Disclosures in this report.
Past performance is no guarantee of future results. Returns are historical and are calculated by determining the percentage change in net asset value (NAV) or offering price (as applicable) with all distributions reinvested. Investment return and principal value will fluctuate so that shares, when redeemed, may be worth more or less than their original cost. Performance less than or equal to one year is cumulative. Performance is for the stated time period only; due to market volatility, the Fund’s current performance may be lower or higher than quoted. Returns are before taxes unless otherwise noted. For performance as of the most recentmonth-end, please refer to eatonvance.com.
Eaton Vance
TABS Municipal Bond Funds
January 31, 2019
Management’s Discussion of Fund Performance1 — continued
Fund-Specific Results — continued
In contrast, security selection, relative value trading, and yield curve positioning contributed to Fund performance versus its benchmark during the period. Active selection of individual bonds — based on fundamental credit research — was the largest single contributor to Fund performance relative to its benchmark.
Relative value trading — a strategy that seeks to take advantage of price and rate differences among similar securities — contributed to Fund performance versus its benchmark as well. Management employed relative value trading to take advantage of its own research results, as well as the relatively inefficient nature of the municipal bond market, in order to buy and sell bonds to pursue additional return during the period.
With regard to yield curve positioning, the Bloomberg Barclays 5 Year Municipal Bond Index held only bonds with maturities of 4–6 years, whereas the Fund also held bonds in the shorter-maturity 0–3 year area of the yield curve, and the longer-maturity 7–10 year area of the curve. During the period, rates rose and prices fell in the 0–3 year area of the curve, causing the Fund’s holdings in that area to underperform the benchmark’s holdings in the 4–6 year area of the curve and, thus, detract from relative performance versus the benchmark. To a greater extent, however, the Fund’sout-of-Index holdings in the 7–10 year area of the curve outperformed the benchmark’s shorter-maturity holdings and contributed to results versus the benchmark. For the period as a whole, the net effect of the Fund’s yield curve positioning was modestly positive for Fund performance versus the benchmark.
The Fund’s crossover trading strategy was employed only minimally during the period and did not have a material impact on Fund performance versus its benchmark.
For Eaton Vance TABS Intermediate-Term Municipal Bond Fund, duration, credit quality and yield curve positioning detracted from Fund performance versus its benchmark during the period. The Fund had a shorter duration than its benchmark, and benefited less than its benchmark when rates fell and bond prices rose during the period.
With regard to credit quality, the Fund’s marginally higher credit-quality positioning hurt relative performance for the period as lower-rated issues outperformed. Yield curve positioning detracted from relative performance as the Fund was overweight versus its benchmark in the 0–2 year area of the yield curve, which was the one of the worst-performing areas of the curve during the period.
In contrast, relative value trading and security selection contributed to Fund performance versus its benchmark. The Fund’s crossover strategy was not employed during the period.
See Endnotes and Additional Disclosures in this report.
Past performance is no guarantee of future results. Returns are historical and are calculated by determining the percentage change in net asset value (NAV) or offering price (as applicable) with all distributions reinvested. Investment return and principal value will fluctuate so that shares, when redeemed, may be worth more or less than their original cost. Performance less than one year is cumulative. Performance is for the stated time period only; due to market volatility, the Fund’s current performance may be lower or higher than quoted. Returns are before taxes unless otherwise noted. For performance as of the most recentmonth-end, please refer to eatonvance.com.
Eaton Vance
TABS Short-Term Municipal Bond Fund
January 31, 2019
Performance2,3
Portfolio Managers James H. Evans, CFA, Brian C. Barney, CFA and Devin J. Cooch, CFA
| | | | | | | | | | | | | | | | | | | | |
| % Average Annual Total Returns | | Class Inception Date | | | Performance
Inception Date | | | One Year | | | Five Years | | | Ten Years | |
Class A at NAV | | | 03/27/2009 | | | | 12/31/1998 | | | | 2.00 | % | | | 1.13 | % | | | 1.87 | % |
Class A with 2.25% Maximum Sales Charge | | | — | | | | — | | | | –0.32 | | | | 0.68 | | | | 1.64 | |
Class C at NAV | | | 03/27/2009 | | | | 12/31/1998 | | | | 1.24 | | | | 0.36 | | | | 1.12 | |
Class C with 1% Maximum Sales Charge | | | — | | | | — | | | | 0.24 | | | | 0.36 | | | | 1.12 | |
Class I at NAV | | | 03/27/2009 | | | | 12/31/1998 | | | | 2.25 | | | | 1.37 | | | | 2.12 | |
Bloomberg Barclays 5 Year Municipal Bond Index | | | — | | | | — | | | | 2.85 | % | | | 1.97 | % | | | 2.91 | % |
Bloomberg Barclays Municipal Managed Money 1–7 Year Bond Index | | | — | | | | — | | | | 2.68 | | | | 1.58 | | | | 2.33 | |
| | | | | |
| | | | | | | | | | | | | | | | | | | | |
| %After-Tax Returns with Maximum Sales Charge | | Class Inception Date | | | Performance Inception Date | | | One Year | | | Five Years | | | Ten Years | |
Class A After Taxes on Distributions | | | 03/27/2009 | | | | 12/31/1998 | | | | –0.36 | % | | | 0.57 | % | | | — | |
Class A After Taxes on Distributions and Sale of Fund Shares | | | — | | | | — | | | | 0.37 | | | | 0.75 | | | | — | |
Class C After Taxes on Distributions | | | 03/27/2009 | | | | 12/31/1998 | | | | 0.23 | | | | 0.27 | | | | — | |
Class C After Taxes on Distributions and Sale of Fund Shares | | | — | | | | — | | | | 0.43 | | | | 0.36 | | | | — | |
Class I After Taxes on Distributions | | | 03/27/2009 | | | | 12/31/1998 | | | | 2.21 | | | | 1.25 | | | | — | |
Class I After Taxes on Distributions and Sale of Fund Shares | | | — | | | | — | | | | 2.01 | | | | 1.34 | | | | — | |
| | | | | |
| | | | | | | | | | | | | | | | | | | | |
| % Total Annual Operating Expense Ratios4 | | | | | | | | Class A | | | Class C | | | Class I | |
| | | | | | | | | | | 0.90 | % | | | 1.65 | % | | | 0.65 | % |
| | | | | |
| | | | | | | | | | | | | | | | | | | | |
| % Distribution Rates/Yields5 | | | | | | | | Class A | | | Class C | | | Class I | |
Distribution Rate | | | | | | | | | | | 1.43 | % | | | 0.68 | % | | | 1.68 | % |
SEC30-day Yield | | | | | | | | | | | 1.00 | | | | 0.29 | | | | 1.27 | |
Growth of $10,0003
This graph shows the change in value of a hypothetical investment of $10,000 in Class A of the Fund for the period indicated. For comparison, the same investment is shown in the indicated index.
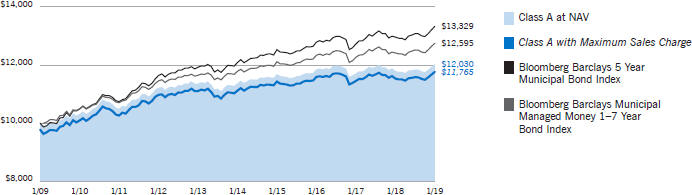
| | | | | | | | | | | | | | | | |
| Growth of Investment3 | | Amount Invested | | | Period Beginning | | | At NAV | | | With Maximum Sales Charge | |
Class C | | $ | 10,000 | | | | 01/31/2009 | | | $ | 11,177 | | | | N.A. | |
Class I | | $ | 250,000 | | | | 01/31/2009 | | | $ | 308,244 | | | | N.A. | |
See Endnotes and Additional Disclosures in this report.
Past performance is no guarantee of future results. Returns are historical and are calculated by determining the percentage change in net asset value (NAV) or offering price (as applicable) with all distributions reinvested. Investment return and principal value will fluctuate so that shares, when redeemed, may be worth more or less than their original cost. Performance less than or equal to one year is cumulative. Performance is for the stated time period only; due to market volatility, the Fund’s current performance may be lower or higher than quoted. Returns are before taxes unless otherwise noted. For performance as of the most recentmonth-end, please refer to eatonvance.com.
Eaton Vance
TABS Short-Term Municipal Bond Fund
January 31, 2019
Fund Profile
Credit Quality (% of total investments)6
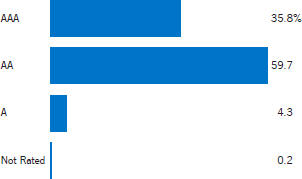
See Endnotes and Additional Disclosures in this report.
Eaton Vance
TABS Intermediate-Term Municipal Bond Fund
January 31, 2019
Performance2,3
Portfolio ManagersJames H. Evans, CFA, Brian C. Barney, CFA and Christopher J. Harshman, CFA
| | | | | | | | | | | | | | | | | | | | |
% Average Annual Total Returns | | Class Inception Date | | | Performance Inception Date | | | One Year | | | Five Years | | | Since Inception | |
Class A at NAV | | | 02/01/2010 | | | | 02/01/2010 | | | | 2.38 | % | | | 2.79 | % | | | 4.06 | % |
Class A with 2.25% Maximum Sales Charge | | | — | | | | — | | | | 0.07 | | | | 2.32 | | | | 3.79 | |
Class C at NAV | | | 02/01/2010 | | | | 02/01/2010 | | | | 1.61 | | | | 2.03 | | | | 3.29 | |
Class C with 1% Maximum Sales Charge | | | — | | | | — | | | | 0.61 | | | | 2.03 | | | | 3.29 | |
Class I at NAV | | | 02/01/2010 | | | | 02/01/2010 | | | | 2.63 | | | | 3.05 | | | | 4.32 | |
Bloomberg Barclays Municipal Managed Money Intermediate 1–17 Year Bond Index | | | — | | | | — | | | | 3.58 | % | | | 3.03 | % | | | 3.56 | % |
Bloomberg Barclays 7 Year Municipal Bond Index | | | — | | | | — | | | | 3.70 | | | | 2.86 | | | | 3.64 | |
| | | | | |
| | | | | | | | | | | | | | | | | | | | |
| %After-Tax Returns with Maximum Sales Charge | | Class Inception Date | | | Performance Inception Date | | | One Year | | | Five Years | | | Since
Inception | |
Class A After Taxes on Distributions | | | 02/01/2010 | | | | 02/01/2010 | | | | 0.06 | % | | | 2.31 | % | | | 3.69 | % |
Class A After Taxes on Distributions and Sale of Fund Shares | | | — | | | | — | | | | 0.81 | | | | 2.20 | | | | 3.35 | |
Class C After Taxes on Distributions | | | 02/01/2010 | | | | 02/01/2010 | | | | 0.61 | | | | 2.02 | | | | 3.19 | |
Class C After Taxes on Distributions and Sale of Fund Shares | | | — | | | | — | | | | 0.84 | | | | 1.82 | | | | 2.79 | |
Class I After Taxes on Distributions | | | 02/01/2010 | | | | 02/01/2010 | | | | 2.62 | | | | 3.04 | | | | 4.22 | |
Class I After Taxes on Distributions and Sale of Fund Shares | | | — | | | | — | | | | 2.45 | | | | 2.85 | | | | 3.85 | |
| | | | | |
| | | | | | | | | | | | | | | | | | | | |
| % Total Annual Operating Expense Ratios4 | | | | | | | | Class A | | | Class C | | | Class I | |
Gross | | | | | | | | | | | 0.97 | % | | | 1.72 | % | | | 0.72 | % |
Net | | | | | | | | | | | 0.90 | | | | 1.65 | | | | 0.65 | |
| | | | | |
| | | | | | | | | | | | | | | | | | | | |
| % Distribution Rates/Yields5 | | | | | | | | Class A | | �� | Class C | | | Class I | |
Distribution Rate | | | | | | | | | | | 1.87 | % | | | 1.12 | % | | | 2.12 | % |
SEC30-day Yield – Subsidized | | | | | | | | | | | 1.36 | | | | 0.65 | | | | 1.64 | |
SEC30-day Yield – Unsubsidized | | | | | | | | | | | 1.21 | | | | 0.50 | | | | 1.48 | |
Growth of $10,000
This graph shows the change in value of a hypothetical investment of $10,000 in Class A of the Fund for the period indicated. For comparison, the same investment is shown in the indicated index.
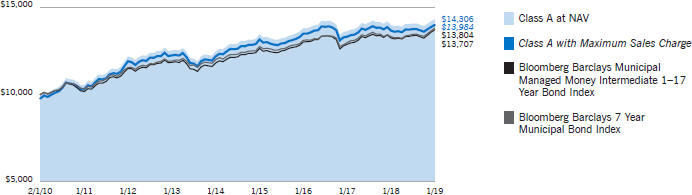
| | | | | | | | | | | | | | | | |
| Growth of Investment | | Amount Invested | | | Period Beginning | | | At NAV | | | With Maximum Sales Charge | |
Class C | | $ | 10,000 | | | | 02/01/2010 | | | $ | 13,386 | | | | N.A. | |
Class I | | $ | 250,000 | | | | 02/01/2010 | | | $ | 366,041 | | | | N.A. | |
See Endnotes and Additional Disclosures in this report.
Past performance is no guarantee of future results. Returns are historical and are calculated by determining the percentage change in net asset value (NAV) or offering price (as applicable) with all distributions reinvested. Investment return and principal value will fluctuate so that shares, when redeemed, may be worth more or less than their original cost. Performance less than or equal to one year is cumulative. Performance is for the stated time period only; due to market volatility, the Fund’s current performance may be lower or higher than quoted. Returns are before taxes unless otherwise noted. For performance as of the most recentmonth-end, please refer to eatonvance.com.
Eaton Vance
TABS Intermediate-Term Municipal Bond Fund
January 31, 2019
Fund Profile
Credit Quality (% of total investments)6
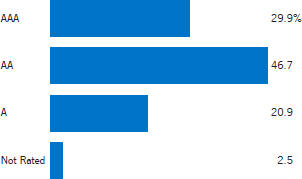
See Endnotes and Additional Disclosures in this report.
Eaton Vance
TABS Municipal Bond Funds
January 31, 2019
Endnotes and Additional Disclosures
| 1 | The views expressed in this report are those of the portfolio manager(s) and are current only through the date stated at the top of this page. These views are subject to change at any time based upon market or other conditions, and Eaton Vance and the Fund(s) disclaim any responsibility to update such views. These views may not be relied upon as investment advice and, because investment decisions are based on many factors, may not be relied upon as an indication of trading intent on behalf of any Eaton Vance fund. This commentary may contain statements that are not historical facts, referred to as “forward looking statements.” The Fund’s actual future results may differ significantly from those stated in any forward looking statement, depending on factors such as changes in securities or financial markets or general economic conditions, the volume of sales and purchases of Fund shares, the continuation of investment advisory, administrative and service contracts, and other risks discussed from time to time in the Fund’s filings with the Securities and Exchange Commission. |
| 2 | Bloomberg Barclays Municipal Bond Index is an unmanaged index of municipal bonds traded in the U.S. Bloomberg Barclays 5 Year Municipal Bond Index is an unmanaged index of municipal bonds traded in the U.S. with maturities ranging from4-6 years. Bloomberg Barclays Municipal Managed Money 1–7 Year Bond Index is an unmanaged,tax-exempt bond market index that measures the 1–7 year maturity component of the Bloomberg Barclays Municipal Managed Money Bond Index. Bloomberg Barclays Municipal Managed Money Intermediate 1–17 Year Bond Index is an unmanaged,tax-exempt bond market index that measures the 1–17 year maturity component of the Bloomberg Barclays Municipal Managed Money Bond Index. Bloomberg Barclays 7 Year Municipal Bond Index is an unmanaged index of municipal bonds traded in the U.S. with maturities ranging from6-8 years. Unless otherwise stated, index returns do not reflect the effect of any applicable sales charges, commissions, expenses, taxes or leverage, as applicable. It is not possible to invest directly in an index. |
| 3 | Total Returns at NAV do not include applicable sales charges. If sales charges were deducted, the returns would be lower. Total Returns shown with maximum sales charge reflect the stated maximum sales charge. Unless otherwise stated, performance does not reflect the deduction of taxes on Fund distributions or redemptions of Fund shares. Performance since inception for an index, if presented, is the performance since the Fund’s or oldest share class’ inception, as applicable.After-tax returns are calculated using certain assumptions, including using the highest individual federal income tax rates in effect at the time of the distributions and do not reflect the impact of state/local taxes. Actualafter-tax returns depend on a shareholder’s tax situation and the actual characterization of distributions and may differ from those shown.After-tax returns are not relevant to shareholders who hold shares intax-deferred accounts or shares held by nontaxable entities. Return After Taxes on Distributions may be the same as Return Before Taxes for the same period because no taxable distributions were made during that period. Return After Taxes on Distributions and Sale of Fund Shares may be greater than or equal to Return After Taxes on Distributions for the same period because of losses realized on the sale of Fund shares. |
| | For the TABS Short-Term Municipal Bond Fund, performance prior to the inception date of each share class is that of a private investment partnership (the Predecessor Account). Performance shown prior to the inception of the share class is adjusted for any applicable sales charge, but not adjusted for expense differences between the Predecessor Account and each share class. If adjusted for such differences, the performance would be different. |
| | The Predecessor Account was not a mutual fund registered under the Investment Company Act of 1940, as amended (the 1940 Act) or a regulated investment company under the Internal Revenue Code of 1986, as amended (the Code), and therefore the Predecessor Account was not subject to investment limitations, diversification requirements and other restrictions imposed by the 1940 Act and/or the Code. If such requirements were applicable to the Predecessor Account, the performance shown may have been adversely affected. Performance presented in the Financial Highlights included in the financial statements is not linked. |
| | After-Tax Returns are not shown for the Ten Year period because the Predecessor Account, unlike a registered investment company, was not required to make annual income distributions to its investors. |
| 4 | Source: Fund prospectus. Net expense ratios reflect a contractual expense reimbursement for TABS Intermediate-Term Municipal Bond Fund that continues through 5/31/19. Without the reimbursement, performance would have been lower. The expense ratios for the current reporting period can be found in the Financial Highlights section of this report. |
| 5 | The Distribution Rate is based on the Fund’s last regular distribution per share in the period (annualized) divided by the Fund’s NAV at the end of the period. The Fund’s distributions may be comprised of amounts characterized for federal income tax purposes astax-exempt income, qualified andnon-qualified ordinary dividends, capital gains and nondividend distributions, also known as return of capital. The Fund will determine the federal income tax character of distributions paid to a shareholder after the end of the calendar year. This is reported on the IRS form1099-DIV and provided to the shareholder shortly after eachyear-end. The Fund’s distributions are determined by the investment adviser based on its current assessment of the Fund’s long-term return potential. As portfolio and market conditions change, the rate of distributions paid by the Fund could change. Taxable-equivalent performance is based on the highest combined federal and state income tax rates, where applicable. Lower tax rates would result in lowertax-equivalent performance. Actual tax rates will vary depending on your income, exemptions and deductions. Rates do not include local taxes. The SEC Yield is a standardized measure based on the estimated yield to maturity of a fund’s investments over a30-day period and is based on the maximum offer price at the date specified. The SEC Yield is not based on the distributions made by the Fund, which may differ. Subsidized yield reflects the effect of fee waivers and expense reimbursements. |
| 6 | Ratings are based on Moody’s Investors Service, Inc. (“Moody’s”), S&P Global Ratings (“S&P”) or Fitch Ratings (“Fitch”), as applicable. If securities are rated differently by the ratings agencies, the highest rating is applied. Ratings, which are subject to change, apply to the creditworthiness of the issuers of the underlying securities and not to the Fund or its shares. Credit ratings measure the quality of a bond based on the issuer’s creditworthiness, with ratings ranging from AAA, being the highest, to D, being the lowest based on S&P’s measures. Ratings of BBB or higher by S&P or Fitch (Baa or higher by Moody’s) are considered to be investment-grade quality. Credit ratings are based largely on the ratings agency’s analysis at the time of rating. The rating assigned to any particular security is not necessarily a reflection of the issuer’s current financial condition and does not necessarily reflect its assessment of the volatility of a security’s market value or of the liquidity of an investment in the security. Holdings designated as “Not Rated” (if any) are not rated by the national ratings agencies stated above. |
| 7 | Duration is a measure of the expected change in price of a bond — in percentage terms — given a one percent change in interest rates, all else being constant. Securities with lower durations tend to be less sensitive to interest rate changes. |
| 8 | Yield curve is a graphical representation of the yields offered by bonds of various maturities. The yield curve flattens when long-term rates fall and/or short-term rates increase, and the yield curve steepens when long-term rates increase and/or short-term rates fall. |
| | Fund profiles subject to change due to active management. |
Eaton Vance
TABS Municipal Bond Funds
January 31, 2019
Fund Expenses
Example: As a Fund shareholder, you incur two types of costs: (1) transaction costs, including sales charges (loads) on purchases and redemption fees (if applicable); and (2) ongoing costs, including management fees; distribution and/or service fees; and other Fund expenses. This Example is intended to help you understand your ongoing costs (in dollars) of Fund investing and to compare these costs with the ongoing costs of investing in other mutual funds. The Example is based on an investment of $1,000 invested at the beginning of the period and held for the entire period (August 1, 2018 – January 31, 2019).
Actual Expenses: The first section of each table below provides information about actual account values and actual expenses. You may use the information in this section, together with the amount you invested, to estimate the expenses that you paid over the period. Simply divide your account value by $1,000 (for example, an $8,600 account value divided by $1,000 = 8.6), then multiply the result by the number in the first section under the heading entitled “Expenses Paid During Period” to estimate the expenses you paid on your account during this period.
Hypothetical Example for Comparison Purposes: The second section of each table below provides information about hypothetical account values and hypothetical expenses based on the actual Fund expense ratio and an assumed rate of return of 5% per year (before expenses), which is not the actual Fund return. The hypothetical account values and expenses may not be used to estimate the actual ending account balance or expenses you paid for the period. You may use this information to compare the ongoing costs of investing in your Fund and other funds. To do so, compare this 5% hypothetical example with the 5% hypothetical examples that appear in the shareholder reports of the other funds.
Please note that the expenses shown in each table are meant to highlight your ongoing costs only and do not reflect any transactional costs, such as sales charges (loads) or redemption fees (if applicable). Therefore, the second section of each table is useful in comparing ongoing costs only, and will not help you determine the relative total costs of owning different funds. In addition, if these transactional costs were included, your costs would be higher.
Eaton Vance TABS Short-Term Municipal Bond Fund
| | | | | | | | | | | | | | | | |
| | | Beginning Account Value
(8/1/18) | | | Ending Account Value
(1/31/19) | | | Expenses Paid During Period*
(8/1/18 – 1/31/19) | | | Annualized Expense
Ratio | |
| | | | |
Actual | | | | | | | | | | | | | | | | |
Class A | | $ | 1,000.00 | | | $ | 1,015.60 | | | $ | 4.62 | | | | 0.91 | % |
Class C | | $ | 1,000.00 | | | $ | 1,011.80 | | | $ | 8.47 | | | | 1.67 | % |
Class I | | $ | 1,000.00 | | | $ | 1,016.90 | | | $ | 3.41 | | | | 0.67 | % |
| | | | | |
Hypothetical | | | | | | | | | | | | | | | | |
(5% return per year before expenses) | | | | | | | | | | | | | | | | |
Class A | | $ | 1,000.00 | | | $ | 1,020.60 | | | $ | 4.63 | | | | 0.91 | % |
Class C | | $ | 1,000.00 | | | $ | 1,016.80 | | | $ | 8.49 | | | | 1.67 | % |
Class I | | $ | 1,000.00 | | | $ | 1,021.80 | | | $ | 3.41 | | | | 0.67 | % |
| * | Expenses are equal to the Fund’s annualized expense ratio for the indicated Class, multiplied by the average account value over the period, multiplied by 184/365 (to reflect the one-half year period). The Example assumes that the $1,000 was invested at the net asset value per share determined at the close of business on July 31, 2018. |
Eaton Vance
TABS Municipal Bond Funds
January 31, 2019
Fund Expenses — continued
Eaton Vance TABS Intermediate-Term Municipal Bond Fund
| | | | | | | | | | | | | | | | |
| | | Beginning Account Value
(8/1/18) | | | Ending Account Value
(1/31/19) | | | Expenses Paid During Period*
(8/1/18 – 1/31/19) | | | Annualized Expense
Ratio | |
| | | | |
Actual | | | | | | | | | | | | | | | | |
Class A | | $ | 1,000.00 | | | $ | 1,017.30 | | | $ | 4.58 | ** | | | 0.90 | % |
Class C | | $ | 1,000.00 | | | $ | 1,013.50 | | | $ | 8.37 | ** | | | 1.65 | % |
Class I | | $ | 1,000.00 | | | $ | 1,018.60 | | | $ | 3.31 | ** | | | 0.65 | % |
| | | | | |
Hypothetical | | | | | | | | | | | | | | | | |
(5% return per year before expenses) | | | | | | | | | | | | | | | | |
Class A | | $ | 1,000.00 | | | $ | 1,020.70 | | | $ | 4.58 | ** | | | 0.90 | % |
Class C | | $ | 1,000.00 | | | $ | 1,016.90 | | | $ | 8.39 | ** | | | 1.65 | % |
Class I | | $ | 1,000.00 | | | $ | 1,021.90 | | | $ | 3.31 | ** | | | 0.65 | % |
| * | Expenses are equal to the Fund’s annualized expense ratio for the indicated Class, multiplied by the average account value over the period, multiplied by 184/365 (to reflect the one-half year period). The Example assumes that the $1,000 was invested at the net asset value per share determined at the close of business on July 31, 2018. |
| ** | Absent an allocation of certain expenses to an affiliate, expenses would be higher. |
Eaton Vance
TABS Short-Term Municipal Bond Fund
January 31, 2019
Portfolio of Investments
| | | | | | | | |
| Tax-Exempt Municipal Securities — 95.7% | |
| Security | | Principal Amount (000’s omitted) | | | Value | |
|
| Education — 3.8% | |
| | |
Connecticut Health and Educational Facilities Authority,(Yale-New Haven Health), 2.00% to 2/8/22 (Put Date), 7/1/49 | | $ | 5,000 | | | $ | 5,027,700 | |
| | |
Noblesville Multi-School Building Corp., IN, 5.00%, 7/15/22 | | | 3,075 | | | | 3,357,469 | |
| | |
Southwest Higher Education Authority, Inc., TX, (Southern Methodist University), 5.00%, 10/1/23 | | | 400 | | | | 455,212 | |
| | |
University of Texas, Prerefunded to 2/15/20, 5.00%, 8/15/23 | | | 2,975 | | | | 3,077,043 | |
| |
| | | | $ | 11,917,424 | |
|
| Electric Utilities — 1.4% | |
| | |
Denton, TX, Utility System Revenue, 5.00%, 12/1/26 | | $ | 1,000 | | | $ | 1,203,430 | |
| | |
Seattle, WA, Municipal Light and Power Revenue, 1.92%, (SIFMA + 0.49%), 11/1/23 (Put Date), 11/1/46(1) | | | 1,000 | | | | 1,000,970 | |
| | |
Southern California Public Power Authority, 5.00%, 7/1/26 | | | 1,000 | | | | 1,077,290 | |
| | |
Southern California Public Power Authority, 5.00%, 7/1/27 | | | 1,000 | | | | 1,074,830 | |
| |
| | | | $ | 4,356,520 | |
|
| Escrowed / Prerefunded — 8.9% | |
| | |
Fairfax County, VA, Prerefunded to 4/1/20, 4.00%, 4/1/23 | | $ | 500 | | | $ | 512,895 | |
| | |
Illinois Development Finance Authority, (Regency Park), Escrowed to Maturity, 0.00%, 7/15/23 | | | 10,000 | | | | 9,112,800 | |
| | |
Illinois Development Finance Authority, (Regency Park), Escrowed to Maturity, 0.00%, 7/15/25 | | | 5,750 | | | | 4,968,115 | |
| | |
Leander Independent School District, TX, (PSF Guaranteed), Prerefunded to 8/15/24, 0.00%, 8/15/43 | | | 1,935 | | | | 627,791 | |
| | |
Leander Independent School District, TX, (PSF Guaranteed), Prerefunded to 8/15/24, 0.00%, 8/15/49 | | | 33,580 | | | | 7,553,150 | |
| | |
Minnesota, Escrowed to Maturity, 4.00%, 8/1/19 | | | 55 | | | | 55,636 | |
| | |
St. Mary Hospital Authority, PA, (Catholic Health East), Prerefunded to 5/15/20, 5.00%, 11/15/22 | | | 5,000 | | | | 5,208,000 | |
| |
| | | | $ | 28,038,387 | |
|
| General Obligations — 39.2% | |
| | |
Barbers Hill Independent School District, TX, Prerefunded to 2/15/19, 4.00%, 2/15/23 | | $ | 2,000 | | | $ | 2,001,520 | |
| | |
Beaverton School District No. 48J, Washington and Multnomah Counties, OR, 5.00%, 6/15/26 | | | 2,000 | | | | 2,411,940 | |
| | |
Birmingham, AL, 5.00%, 12/1/28 | | | 1,475 | | | | 1,792,287 | |
| | |
Boulder Valley School District No. Re-2, CO, 6.00%, 12/1/22(2) | | | 1,150 | | | | 1,324,627 | |
| | |
Brown County, WI, 4.00%, 11/1/21 | | | 620 | | | | 645,116 | |
| | |
California, 2.452%, (70% of 1 mo. USD LIBOR + 0.70%), 12/1/20 (Put Date), 12/1/28(1) | | | 7,500 | | | | 7,534,950 | |
| | |
Chaffey Joint Union High School District, CA, (Election of 2012), 0.00%, 8/1/22 | | | 155 | | | | 145,046 | |
| | | | | | | | |
| Security | | Principal Amount (000’s omitted) | | | Value | |
|
| General Obligations (continued) | |
| | |
Clark County, NV, 5.00%, 12/1/27 | | $ | 2,500 | | | $ | 3,056,375 | |
| | |
Cleveland Heights-University Heights City School District, OH, 0.00%, 12/1/23 | | | 250 | | | | 222,710 | |
| | |
College Station, TX, 5.00%, 2/15/24 | | | 1,000 | | | | 1,062,900 | |
| | |
Columbia County, WI, 4.00%, 8/1/29 | | | 1,100 | | | | 1,206,568 | |
| | |
Denton Independent School District, TX, (PSF Guaranteed), 0.00%, 8/15/24 | | | 3,000 | | | | 2,691,750 | |
| | |
El Dorado Union High School District, CA, 0.00%, 8/1/21 | | | 45 | | | | 42,993 | |
| | |
Fairfax County, VA, 4.00%, 4/1/23 | | | 500 | | | | 513,945 | |
| | |
Florida Board of Education, 5.00%, 6/1/22 | | | 2,150 | | | | 2,245,997 | |
| | |
Fort Worth Independent School District, TX, (PSF Guaranteed), 5.00%, 2/15/24 | | | 2,200 | | | | 2,530,264 | |
| | |
Frisco, TX, 4.00%, 2/15/19 | | | 155 | | | | 155,118 | |
| | |
Glasscock County Independent School District, TX, (PSF Guaranteed), 5.00%, 2/15/23 | | | 300 | | | | 305,670 | |
| | |
Guilford County, NC, Series 2010D, 5.00%, 8/1/19 | | | 10,190 | | | | 10,360,479 | |
| | |
Hawaii, 5.00%, 10/1/29 | | | 2,500 | | | | 3,031,475 | |
| | |
Houston Independent School District, TX, 2.20% to 6/1/20 (Put Date), 6/1/39 | | | 2,000 | | | | 2,007,520 | |
| | |
Hutto Independent School District, TX, (PSF Guaranteed), 0.00%, 8/1/22 | | | 525 | | | | 489,253 | |
| | |
Johnston County, NC, 5.00%, 2/1/24 | | | 2,500 | | | | 2,886,750 | |
| | |
Lake County Community College District No. 532, IL, 4.00%, 6/1/21 | | | 4,230 | | | | 4,438,920 | |
| | |
Leander Independent School District, TX, 0.00%, 8/15/20 | | | 3,000 | | | | 2,913,960 | |
| | |
Leander Independent School District, TX, (PSF Guaranteed), 0.00%, 8/15/22 | | | 700 | | | | 653,877 | |
| | |
Manhattan Beach Unified School District, CA, (Election of 2016), 3.00%, 9/1/26 | | | 230 | | | | 249,631 | |
| | |
Manhattan Beach Unified School District, CA, (Election of 2016), 3.00%, 9/1/27 | | | 270 | | | | 293,396 | |
| | |
Maryland, 4.00%, 6/1/27 | | | 5,000 | | | | 5,478,800 | |
| | |
Maryland, 5.00%, 3/1/19 | | | 5,465 | | | | 5,478,881 | |
| | |
Massachusetts, 5.00%, 12/1/24 | | | 5,000 | | | | 5,868,850 | |
| | |
Miami-Dade County, FL, 5.00%, 7/1/26 | | | 1,000 | | | | 1,203,310 | |
| | |
Minnesota, 4.00%, 8/1/19 | | | 2,945 | | | | 2,980,193 | |
| | |
Montgomery County, MD, 5.00%, 11/1/26 | | | 5,000 | | | | 5,833,300 | |
| | |
Montgomery County, MD, 5.00%, 12/1/27 | | | 5,000 | | | | 5,826,750 | |
| | |
Mountain View-Los Altos Union High School District, CA, 0.00%, 8/1/23 | | | 945 | | | | 866,886 | |
| | |
Mountain View-Los Altos Union High School District, CA, 0.00%, 8/1/24 | | | 900 | | | | 804,636 | |
| | |
New York, 5.00%, 8/1/24 | | | 5,000 | | | | 5,827,350 | |
| | |
New York, 5.00%, 8/1/26 | | | 1,000 | | | | 1,205,440 | |
| | |
North Carolina, 5.00%, 6/1/25 | | | 1,000 | | | | 1,189,810 | |
| | |
Ohio, 5.00%, 6/15/27 | | | 2,500 | | | | 2,806,300 | |
| | |
Peralta Community College District, CA, 5.00%, 8/1/23 | | | 140 | | | | 160,355 | |
| | | | |
| | 11 | | See Notes to Financial Statements. |
Eaton Vance
TABS Short-Term Municipal Bond Fund
January 31, 2019
Portfolio of Investments — continued
| | | | | | | | |
| Security | | Principal Amount (000’s omitted) | | | Value | |
|
| General Obligations (continued) | |
| | |
Plano Independent School District, TX, (PSF Guaranteed), 5.00%, 2/15/25 | | $ | 5,000 | | | $ | 5,879,200 | |
| | |
Poudre School District No. R-1, CO, 5.00%, 12/15/27 | | | 500 | | | | 613,980 | |
| | |
Rose Tree Media School District, PA, 5.00%, 4/1/27 | | | 1,000 | | | | 1,181,580 | |
| | |
Schaumburg, IL, 4.00%, 12/1/25 | | | 1,150 | | | | 1,233,386 | |
| | |
Sugar Land, TX, 5.00%, 2/15/23 | | | 1,105 | | | | 1,239,589 | |
| | |
Tennessee, 3.00%, 10/1/26 | | | 275 | | | | 279,188 | |
| | |
Vistancia Community Facilities District, AZ, 5.00%, 7/15/21 | | | 610 | | | | 636,681 | |
| | |
Vistancia Community Facilities District, AZ, 5.00%, 7/15/22 | | | 740 | | | | 771,176 | |
| | |
Vistancia Community Facilities District, AZ, 5.00%, 7/15/25 | | | 1,350 | | | | 1,404,513 | |
| | |
West Chester Area School District, PA, 4.00%, 5/15/28 | | | 1,365 | | | | 1,486,116 | |
| | |
West Valley-Mission Community College District, CA, 5.00%, 8/1/25 | | | 300 | | | | 363,273 | |
| | |
Williamson County, TN, 4.00%, 4/1/28 | | | 1,000 | | | | 1,116,490 | |
| | |
Williamson County, TN, 5.00%, 4/1/25 | | | 3,475 | | | | 4,115,929 | |
| |
| | | | $ | 123,066,999 | |
|
| Hospital — 13.5% | |
| | |
Grand Traverse County Hospital Finance Authority, MI, (Munson Healthcare), 5.00%, 7/1/20 | | $ | 445 | | | $ | 464,010 | |
| | |
Indiana Finance Authority, (Community Foundation of Northwest Indiana Obligated Group), 5.00%, 9/1/25 | | | 650 | | | | 759,967 | |
| | |
Indiana Finance Authority, (Indiana University Health), 5.00%, 3/1/19 | | | 5,000 | | | | 5,012,350 | |
| | |
Indiana Finance Authority, (Indiana University Health), 5.00%, 3/1/20 | | | 6,395 | | | | 6,615,308 | |
| | |
Massachusetts Development Finance Agency, (Partners HealthCare System), 1.93%, (SIFMA + 0.50%), 1/26/23 (Put Date), 7/1/38(1) | | | 2,500 | | | | 2,493,775 | |
| | |
Missouri Health and Educational Facilities Authority, (Mercy Health), 5.00%, 6/1/26 | | | 2,500 | | | | 2,980,425 | |
| | |
Missouri Health and Educational Facilities Authority, (Mercy Health), 5.00%, 6/1/27 | | | 3,500 | | | | 4,215,085 | |
| | |
New York Dormitory Authority, (Mount Sinai Hospital), 5.00%, 7/1/22 | | | 1,950 | | | | 2,036,638 | |
| | |
Utah County, UT, (IHC Health Services, Inc.), 5.00% to 8/1/24 (Put Date), 5/15/57 | | | 4,000 | | | | 4,484,480 | |
| | |
Wisconsin Health and Educational Facilities Authority, (Advocate Aurora Health Credit Group), 5.00% to 1/31/24 (Put Date), 8/15/54 | | | 5,000 | | | | 5,688,800 | |
| | |
Wisconsin Health and Educational Facilities Authority, (Advocate Aurora Health Credit Group), 2.08%, (SIFMA + 0.65%), 7/31/24 (Put Date), 8/15/54(1) | | | 2,200 | | | | 2,202,420 | |
| | |
Yavapai County Industrial Development Authority, AZ, (Northern Arizona Healthcare System), 5.00%, 10/1/19 | | | 3,630 | | | | 3,709,461 | |
| | |
Yuma Industrial Development Authority, AZ, (Yuma Regional Medical Center), 5.00%, 8/1/19 | | | 400 | | | | 406,216 | |
| | | | | | | | |
| Security | | Principal Amount (000’s omitted) | | | Value | |
|
| Hospital (continued) | |
| | |
Yuma Industrial Development Authority, AZ, (Yuma Regional Medical Center), 5.00%, 8/1/20 | | $ | 1,130 | | | $ | 1,182,477 | |
| |
| | | | $ | 42,251,412 | |
|
| Housing — 2.1% | |
| | |
Minnesota Housing Finance Agency, 2.35%, 7/1/21 | | $ | 150 | | | $ | 151,263 | |
| | |
New York Housing Finance Agency, (Affordable Housing Corp.), 2.65%, 5/1/23 | | | 2,500 | | | | 2,533,100 | |
| | |
New York Housing Finance Agency, Green Bonds, 2.75%, 11/1/22 | | | 4,000 | | | | 4,023,640 | |
| |
| | | | $ | 6,708,003 | |
|
| Insured-General Obligations — 0.2% | |
| | |
Washington, (NPFG), 0.00%, 6/1/21 | | $ | 620 | | | $ | 593,470 | |
| |
| | | | $ | 593,470 | |
|
| Lease Revenue / Certificates of Participation — 4.9% | |
| | |
Colorado, (Building Excellent Schools Today), 5.00%, 3/15/27 | | $ | 3,275 | | | $ | 3,958,361 | |
| | |
Colorado, (Rural Colorado), 5.00%, 12/15/25 | | | 6,000 | | | | 7,119,360 | |
| | |
Malibu, CA, 5.00%, 11/1/38 | | | 275 | | | | 281,221 | |
| | |
Malibu, CA, 5.00%, 11/1/43 | | | 225 | | | | 229,988 | |
| | |
Malibu, CA, 5.00%, 11/1/48 | | | 375 | | | | 383,175 | |
| | |
Montgomery County, MD, (Metrorail Garage Projects), 5.00%, 6/1/19 | | | 2,420 | | | | 2,446,330 | |
| | |
Montgomery County, MD, (Metrorail Garage Projects), 5.00%, 6/1/20 | | | 610 | | | | 636,578 | |
| | |
Volusia County School Board, FL, 5.00%, 8/1/21 | | | 325 | | | | 350,145 | |
| |
| | | | $ | 15,405,158 | |
|
| Other Revenue — 5.3% | |
| | |
California Infrastructure and Economic Development Bank, (The J. Paul Getty Trust), 2.328%, (70% of 3 mo. USD LIBOR + 0.37%), 4/1/20 (Put Date), 4/1/38(1) | | $ | 6,500 | | | $ | 6,511,505 | |
| | |
Johnson County Public Building Commission, KS, (Courthouse and Medical Examiner’s Facility), 5.00%, 9/1/25 | | | 3,325 | | | | 3,943,417 | |
| | |
Ohio, 5.00%, 9/1/28 | | | 5,150 | | | | 6,318,947 | |
| |
| | | | $ | 16,773,869 | |
|
| Special Tax Revenue — 3.8% | |
| | |
Central Puget Sound Regional Transit Authority, WA, Sales Tax and Motor Vehicle Tax Revenue, Green Bonds, 1.88%, (SIFMA + 0.45%), 11/1/23 (Put Date), 11/1/45(1) | | $ | 1,000 | | | $ | 997,000 | |
| | |
Denver City and County, CO, Dedicated Tax Revenue, 0.00%, 8/1/29 | | | 200 | | | | 140,560 | |
| | | | |
| | 12 | | See Notes to Financial Statements. |
Eaton Vance
TABS Short-Term Municipal Bond Fund
January 31, 2019
Portfolio of Investments — continued
| | | | | | | | |
| Security | | Principal Amount (000’s omitted) | | | Value | |
|
| Special Tax Revenue (continued) | |
| | |
Denver City and County, CO, Dedicated Tax Revenue, 0.00%, 8/1/30 | | $ | 400 | | | $ | 268,812 | |
| | |
New York Dormitory Authority, Sales Tax Revenue, 5.00%, 3/15/28 | | | 5,770 | | | | 6,770,864 | |
| | |
Reno, NV, Sales Tax Revenue, 5.00%, 6/1/25 | | | 750 | | | | 867,113 | |
| | |
Sales Tax Asset Receivable Corp., 5.00%, 10/15/27 | | | 1,500 | | | | 1,736,745 | |
| | |
Westminster, CO, Sales & Use Tax, 5.00%, 12/1/19 | | | 1,135 | | | | 1,166,099 | |
| |
| | | | $ | 11,947,193 | |
|
| Transportation — 8.1% | |
| | |
Arizona Transportation Board, Highway Revenue, 5.00%, 7/1/25 | | $ | 2,500 | | | $ | 2,760,675 | |
| | |
Bay Area Toll Authority, CA, (San Francisco Bay Area), 2.51%, (70% of 3 mo. USD LIBOR + 0.55%), 4/1/21 (Put Date), 4/1/45(1) | | | 10,000 | | | | 10,017,300 | |
| | |
Illinois Toll Highway Authority, 5.00%, 1/1/27 | | | 3,000 | | | | 3,587,370 | |
| | |
Illinois Toll Highway Authority, 5.00%, 1/1/28 | | | 3,000 | | | | 3,614,190 | |
| | |
North Texas Tollway Authority, 2.10%, (SIFMA + 0.67%), 1/1/20 (Put Date), 1/1/38(1) | | | 2,500 | | | | 2,498,500 | |
| | |
Pennsylvania Turnpike Commission, 2.13%, (SIFMA + 0.70%), 12/1/23(1) | | | 3,000 | | | | 2,994,570 | |
| |
| | | | $ | 25,472,605 | |
|
| Water and Sewer — 4.5% | |
| | |
Charleston, SC, Waterworks and Sewer System Revenue, 2.126%, (70% of 1 mo. USD LIBOR + 0.37%), 1/1/22 (Put Date), 1/1/35(1) | | $ | 5,000 | | | $ | 4,999,900 | |
| | |
Indianapolis, IN, Water System Revenue, 5.00%, 10/1/27 | | | 1,500 | | | | 1,833,390 | |
| | |
Kansas City, MO, Sanitary Sewer System Revenue, 5.00%, 1/1/25 | | | 500 | | | | 586,535 | |
| | |
Ohio Water Development Authority, Water Pollution Control, (Water Quality), 5.00%, 12/1/19 | | | 1,020 | | | | 1,048,203 | |
| | |
Oklahoma City Water Utilities Trust, OK, 4.00%, 7/1/25 | | | 1,000 | | | | 1,090,160 | |
| | |
Riverside, CA, Water System Revenue, 2.06%, (SIFMA + 0.63%), 1/15/20 (Put Date), 10/1/35(1) | | | 1,870 | | | | 1,871,122 | |
| | |
San Francisco City and County Public Utilities Commission, CA, Wastewater Revenue, Green Bonds, 2.125% to 10/1/23 (Put Date), 10/1/48 | | | 2,500 | | | | 2,518,375 | |
| | |
Seattle, WA, Solid Waste Revenue, 5.00%, 8/1/19 | | | 175 | | | | 177,858 | |
| |
| | | | $ | 14,125,543 | |
| |
Total Tax-Exempt Municipal Securities — 95.7%
(identified cost $295,726,528) | | | $ | 300,656,583 | |
| | | | | | | | |
| Taxable Municipal Securities — 0.8% | |
| Security | | Principal Amount (000’s omitted) | | | Value | |
|
| Bond Bank — 0.2% | |
| | |
New York Environmental Facilities Corp., NY, 2.42%, 1/15/23 | | $ | 530 | | | $ | 522,951 | |
| |
| | | | $ | 522,951 | |
|
| Special Tax Revenue — 0.6% | |
| | |
New York Urban Development Corp., Personal Income Tax Revenue, 3.20%, 3/15/22 | | $ | 955 | | | $ | 962,611 | |
| | |
Successor Agency to San Diego Redevelopment Agency, CA, 3.25%, 9/1/22 | | | 600 | | | | 610,356 | |
| | |
Successor Agency to San Diego Redevelopment Agency, CA, 3.375%, 9/1/23 | | | 450 | | | | 460,674 | |
| |
| | | | $ | 2,033,641 | |
| |
Total Taxable Municipal Securities — 0.8%
(identified cost $2,557,027) | | | $ | 2,556,592 | |
| |
Total Investments — 96.5%
(identified cost $298,283,555) | | | $ | 303,213,175 | |
| |
Other Assets, Less Liabilities — 3.5% | | | $ | 10,951,946 | |
| |
Net Assets — 100.0% | | | $ | 314,165,121 | |
The percentage shown for each investment category in the Portfolio of Investments is based on net assets.
At January 31, 2019, the concentration of the Fund’s investments in the various states, determined as a percentage of net assets, is as follows:
| | | | |
| |
| Texas | | | 11.9% | |
| |
| California | | | 11.3% | |
| |
| Others, representing less than 10% individually | | | 73.3% | |
The Fund invests primarily in debt securities issued by municipalities. The ability of the issuers of the debt securities to meet their obligations may be affected by economic developments in a specific industry or municipality. In order to reduce the risk associated with such economic developments, at January 31, 2019, 0.2% of total investments are backed by bond insurance of a financial guaranty assurance agency.
| (1) | Floating rate security. The stated interest rate represents the rate in effect at January 31, 2019. |
| (2) | When-issued security. |
Abbreviations:
| | | | |
| LIBOR | | – | | London Interbank Offered Rate |
| | |
| NPFG | | – | | National Public Finance Guarantee Corp. |
| | |
| PSF | | – | | Permanent School Fund |
| | |
| SIFMA | | – | | Securities Industry and Financial Markets Association Municipal Swap Index |
| | |
| USD | | – | | United States Dollar |
| | | | |
| | 13 | | See Notes to Financial Statements. |
Eaton Vance
TABS Intermediate-Term Municipal Bond Fund
January 31, 2019
Portfolio of Investments
| | | | | | | | |
| Tax-Exempt Municipal Securities — 98.9% | |
| Security | | Principal Amount (000’s omitted) | | | Value | |
|
| Bond Bank — 1.9% | |
| | |
Alaska Municipal Bond Bank Authority, 5.00%, 3/1/30 | | $ | 1,145 | | | $ | 1,304,006 | |
| | |
Ohio Water Development Authority, Water Pollution Control Loan Fund, 1.65%, (SIFMA + 0.22%), 12/1/20(1) | | | 5,000 | | | | 4,982,850 | |
| | |
Texas Water Development Board, 4.00%, 10/15/34 | | | 2,445 | | | | 2,628,008 | |
| |
| | | | $ | 8,914,864 | |
|
| Education — 1.5% | |
| | |
District of Columbia, (Georgetown University), 5.00%, 4/1/31 | | $ | 2,455 | | | $ | 2,856,122 | |
| | |
Nevada System of Higher Education, 5.00%, 7/1/23 | | | 500 | | | | 565,695 | |
| | |
New Jersey Educational Facilities Authority, (Princeton University), 4.00%, 7/1/27 | | | 590 | | | | 651,472 | |
| | |
South Dakota Health and Educational Facilities Authority, (Vocation Education Program), 5.00%, 8/1/27 | | | 1,200 | | | | 1,399,068 | |
| | |
Virginia Commonwealth University, 4.00%, 11/1/32 | | | 1,285 | | | | 1,384,922 | |
| |
| | | | $ | 6,857,279 | |
|
| Electric Utilities — 4.2% | |
| | |
Municipal Electric Authority of Georgia, (Combined Cycle Project), 5.00%, 11/1/20 | | $ | 1,000 | | | $ | 1,051,240 | |
| | |
Nebraska Public Power District, 5.00%, 1/1/21 | | | 1,405 | | | | 1,491,127 | |
| | |
North Carolina Municipal Power Agency Number 1, (Catawba), 5.00%, 1/1/23 | | | 1,485 | | | | 1,659,324 | |
| | |
Omaha Public Power District, NE, Prerefunded to 2/1/22, 5.00%, 2/1/29 | | | 810 | | | | 886,901 | |
| | |
Pend Oreille County Public Utility District No. 1, WA, Green Bonds, 5.00%, 1/1/22 | | | 1,000 | | | | 1,075,810 | |
| | |
Pend Oreille County Public Utility District No. 1, WA, Green Bonds, 5.00%, 1/1/24 | | | 1,000 | | | | 1,117,230 | |
| | |
Pend Oreille County Public Utility District No. 1, WA, Green Bonds, 5.00%, 1/1/27 | | | 1,000 | | | | 1,156,610 | |
| | |
Springfield Electric System Revenue, IL, 5.00%, 3/1/27 | | | 3,000 | | | | 3,411,180 | |
| | |
Springfield Electric System Revenue, IL, 5.00%, 3/1/28 | | | 3,475 | | | | 3,936,619 | |
| | |
Springfield Electric System Revenue, IL, 5.00%, 3/1/29 | | | 3,325 | | | | 3,752,761 | |
| |
| | | | $ | 19,538,802 | |
|
| Escrowed / Prerefunded — 3.5% | |
| | |
Florida Department of Transportation, Prerefunded to 7/1/19, 5.00%, 7/1/25 | | $ | 900 | | | $ | 921,438 | |
| | |
Honolulu City and County, HI, Wastewater System Revenue, Prerefunded to 7/1/19, 5.00%, 7/1/22 | | | 560 | | | | 567,779 | |
| | |
Leander Independent School District, TX, (PSF Guaranteed), Prerefunded to 8/15/24, 0.00%, 8/15/43 | | | 5,000 | | | | 1,622,200 | |
| | | | | | | | |
| Security | | Principal Amount (000’s omitted) | | | Value | |
|
| Escrowed / Prerefunded (continued) | |
| | |
Massachusetts Development Finance Agency, (Partners HealthCare System), Prerefunded to 7/1/21, 5.00%, 7/1/26 | | $ | 545 | | | $ | 585,782 | |
| | |
Massachusetts Health and Educational Facilities Authority, (Partners HealthCare System), Prerefunded to 7/1/19, 5.25%, 7/1/29 | | | 1,000 | | | | 1,014,690 | |
| | |
Metropolitan Transportation Authority, NY, Prerefunded to 5/15/23, 5.00%, 11/15/32 | | | 1,000 | | | | 1,138,770 | |
| | |
Nixa Public Schools, MO, (Refunding & Improvement - Direct Deposit Program), Prerefunded to 3/1/20, 5.00%, 3/1/31 | | | 505 | | | | 522,726 | |
| | |
North Carolina Medical Care Commission, (Duke University Health System), Prerefunded to 6/1/19, 5.00%, 6/1/34 | | | 1,685 | | | | 1,703,501 | |
| | |
North Carolina, Grant Anticipation Revenue, Prerefunded to 3/1/19, 5.25%, 3/1/20 | | | 1,350 | | | | 1,353,780 | |
| | |
North Olmsted City School District, OH, Prerefunded to 12/1/23, 5.00%, 12/1/32 | | | 1,000 | | | | 1,149,220 | |
| | |
Tatum Independent School District, TX, (PSF Guaranteed), Prerefunded to 2/15/19, 5.00%, 2/15/30 | | | 515 | | | | 515,556 | |
| | |
Wisconsin Department of Transportation, Prerefunded to 7/1/19, 5.00%, 7/1/23 | | | 2,000 | | | | 2,027,780 | |
| | |
Wisconsin Health and Educational Facilities Authority, (Ministry Health Care), Prerefunded to 8/15/22, 5.00%, 8/15/32 | | | 2,885 | | | | 3,201,513 | |
| |
| | | | $ | 16,324,735 | |
|
| General Obligations — 40.1% | |
| | |
Adams 12 Five Star Schools, CO, 5.00%, 12/15/28 | | $ | 5,000 | | | $ | 6,017,800 | |
| | |
Adams 12 Five Star Schools, CO, 5.00%, 12/15/30 | | | 5,000 | | | | 5,918,550 | |
| | |
Anchorage, AK, 5.00%, 9/1/28 | | | 1,835 | | | | 2,152,804 | |
| | |
Arlington County, VA, 5.00%, 8/15/29 | | | 1,600 | | | | 1,981,728 | |
| | |
Beaverton School District No. 48J, Washington and Multnomah Counties, OR, 5.00%, 6/15/35 | | | 5,000 | | | | 5,823,100 | |
| | |
California, 2.452%, (70% of 1 mo. USD LIBOR + 0.70%), 12/1/20 (Put Date), 12/1/28(1) | | | 6,500 | | | | 6,530,290 | |
| | |
California, 5.00%, 8/1/28 | | | 2,000 | | | | 2,477,340 | |
| | |
Cleveland Municipal School District, OH, 5.00%, 12/1/23 | | | 1,695 | | | | 1,903,892 | |
| | |
Cleveland Municipal School District, OH, 5.00%, 12/1/32 | | | 5,000 | | | | 5,524,350 | |
| | |
Columbus City School District, OH, 5.00%, 12/1/27 | | | 1,000 | | | | 1,157,000 | |
| | |
Dallas County, TX, 5.00%, 8/15/29 | | | 5,200 | | | | 6,161,740 | |
| | |
Dallas, TX, 5.00%, 2/15/29 | | | 5,000 | | | | 5,625,150 | |
| | |
Decatur, IL, 5.00%, 3/1/23 | | | 1,030 | | | | 1,132,516 | |
| | |
Douglas County School District No. RE-1, CO, 4.00%, 12/15/35(2) | | | 3,750 | | | | 4,021,425 | |
| | |
Douglas County, NE, 3.75%, 12/15/27 | | | 1,000 | | | | 1,038,270 | |
| | |
Edgewood City School District, OH, 5.25%, 12/1/33 | | | 4,500 | | | | 5,080,995 | |
| | |
Fairfax County, VA, 5.00%, 10/1/31(2) | | | 5,000 | | | | 6,163,350 | |
| | | | |
| | 14 | | See Notes to Financial Statements. |
Eaton Vance
TABS Intermediate-Term Municipal Bond Fund
January 31, 2019
Portfolio of Investments — continued
| | | | | | | | |
| Security | | Principal Amount (000’s omitted) | | | Value | |
|
| General Obligations (continued) | |
| | |
Florida Board of Education, 5.00%, 6/1/25 | | $ | 9,500 | | | $ | 10,191,220 | |
| | |
Florida Board of Education, 5.00%, 6/1/28 | | | 5,000 | | | | 5,890,150 | |
| | |
Georgia, 5.00%, 2/1/30 | | | 5,045 | | | | 6,066,865 | |
| | |
Gladstone School District No. 115, Clackamas County, OR, 0.00%, 6/15/26 | | | 1,000 | | | | 833,410 | |
| | |
Glendale Unified School District, CA, 0.00%, 9/1/30 | | | 5,280 | | | | 3,623,769 | |
| | |
Grand Prairie Independent School District, TX, (PSF Guaranteed), 4.00%, 2/15/22 | | | 2,180 | | | | 2,298,112 | |
| | |
Greensboro, NC, 5.00%, 2/1/28 | | | 1,790 | | | | 2,154,981 | |
| | |
Hempfield School District, PA, 5.00%, 10/15/27 | | | 1,000 | | | | 1,036,620 | |
| | |
Hennepin County, MN, (SPA: TD Bank, N.A.), 1.38%, 12/1/38(3) | | | 5,000 | | | | 5,000,000 | |
| | |
Homewood, AL, 5.00%, 9/1/32 | | | 1,190 | | | | 1,376,342 | |
| | |
Houston Community College System, TX, 5.25%, 2/15/25 | | | 1,000 | | | | 1,066,600 | |
| | |
King County, WA, 5.00%, 1/1/26 | | | 5,000 | | | | 5,523,050 | |
| | |
King County, WA, 5.00%, 12/1/26 | | | 2,350 | | | | 2,688,964 | |
| | |
Lakeland, FL, 5.00%, 10/1/31 | | | 1,860 | | | | 2,132,974 | |
| | |
Lakota Local School District, OH, (School Facilities Construction & Improvement), 5.00%, 12/1/28 | | | 1,120 | | | | 1,251,432 | |
| | |
Leander Independent School District, TX, 0.00%, 8/15/20 | | | 1,955 | | | | 1,898,931 | |
| | |
Leander Independent School District, TX, 0.00%, 8/15/23 | | | 1,000 | | | | 906,850 | |
| | |
Long Beach Unified School District, CA, (Election of 2008), 0.00%, 8/1/31 | | | 1,675 | | | | 1,084,914 | |
| | |
Long Beach Unified School District, CA, (Election of 2008), 0.00%, 8/1/32 | | | 1,500 | | | | 923,940 | |
| | |
Macomb County, MI, 4.00%, 5/1/24 | | | 1,000 | | | | 1,102,700 | |
| | |
Montgomery County, MD, 5.00%, 11/1/24 | | | 10,400 | | | | 12,201,176 | |
| | |
Montgomery County, MD, 5.00%, 12/1/27 | | | 5,000 | | | | 5,826,750 | |
| | |
Mountain View-Los Altos Union High School District, CA, 0.00%, 8/1/25 | | | 2,115 | | | | 1,837,300 | |
| | |
Neshaminy School District, PA, 4.00%, 11/1/26 | | | 660 | | | | 715,988 | |
| | |
New Hampshire, 4.00%, 12/1/32 | | | 2,385 | | | | 2,616,369 | |
| | |
New York, 5.00%, 2/15/20 | | | 1,210 | | | | 1,253,391 | |
| | |
New York, 5.00%, 2/15/26 | | | 5,685 | | | | 6,893,858 | |
| | |
North Charleston Sewer District, SC, 4.00%, 1/1/23 | | | 310 | | | | 322,794 | |
| | |
Ohio, 5.00%, 8/1/26 | | | 1,000 | | | | 1,205,440 | |
| | |
Oxnard Union High School District, CA, (Election of 2018), 5.00%, 8/1/35 | | | 1,650 | | | | 1,910,683 | |
| | |
Pennsylvania, 4.00%, 6/1/30 | | | 2,500 | | | | 2,614,300 | |
| | |
Rowland Unified School District, CA, (Election of 2012), 0.00%, 8/1/33 | | | 2,735 | | | | 1,554,355 | |
| | |
San Francisco Bay Area Rapid Transit District, CA, 4.00%, 8/1/33 | | | 1,350 | | | | 1,451,358 | |
| | |
San Juan Unified School District, CA, (Election of 2012), 4.00%, 8/1/31 | | | 3,250 | | | | 3,583,515 | |
| | |
South Texas Community College District, 5.00%, 8/15/23 | | | 1,560 | | | | 1,771,879 | |
| | | | | | | | |
| Security | | Principal Amount (000’s omitted) | | | Value | |
|
| General Obligations (continued) | |
| | |
Tennessee, 5.00%, 9/1/29 | | $ | 1,800 | | | $ | 2,085,570 | |
| | |
Texas, (SPA: State Street Bank and Trust Co.), 1.46%, 12/1/42(3) | | | 9,700 | | | | 9,700,000 | |
| | |
Wylie Independent School District, TX, (PSF Guaranteed), 6.50%, 8/15/26 | | | 1,100 | | | | 1,358,588 | |
| | |
Zeeland Public Schools, MI, 5.00%, 5/1/24 | | | 1,000 | | | | 1,132,570 | |
| |
| | | | $ | 185,798,008 | |
|
| Hospital — 10.6% | |
| | |
Allen County, OH, (Catholic Health Partners), 5.00%, 5/1/21 | | $ | 765 | | | $ | 815,039 | |
| | |
California Health Facilities Financing Authority, (El Camino Hospital), 5.00%, 2/1/33 | | | 1,000 | | | | 1,148,070 | |
| | |
Carroll City-County Hospital Authority, GA, (Tanner Medical Center, Inc.), 5.00%, 7/1/34 | | | 2,660 | | | | 2,997,714 | |
| | |
Colorado Health Facilities Authority, (Vail Valley Medical Center), 5.00%, 1/15/35 | | | 3,150 | | | | 3,536,095 | |
| | |
Greeneville Health and Educational Facilities Board, TN, (Ballad Health), 5.00%, 7/1/31 | | | 2,500 | | | | 2,709,250 | |
| | |
Greeneville Health and Educational Facilities Board, TN, (Ballad Health), 5.00%, 7/1/34 | | | 6,020 | | | | 6,459,520 | |
| | |
Kansas Development Finance Authority, (Adventist Health System), 5.00%, 11/15/28 | | | 5,090 | | | | 5,528,402 | |
| | |
Massachusetts Development Finance Agency, (Partners HealthCare System), 5.00%, 7/1/24 | | | 800 | | | | 908,376 | |
| | |
Massachusetts Development Finance Agency, (Partners HealthCare System), 5.00%, 7/1/26 | | | 905 | | | | 969,391 | |
| | |
Michigan Finance Authority, (Trinity Health Credit Group), 5.00%, 12/1/35 | | | 1,000 | | | | 1,070,290 | |
| | |
Michigan Finance Authority, (Trinity Health Credit Group), 5.00%, 12/1/39 | | | 12,205 | | | | 12,994,053 | |
| | |
Monongalia County Building Commission, WV, (Monongalia Health System Obligated Group), 5.00%, 7/1/24 | | | 215 | | | | 238,923 | |
| | |
Monongalia County Building Commission, WV, (Monongalia Health System Obligated Group), 5.00%, 7/1/27 | | | 2,005 | | | | 2,206,462 | |
| | |
North Carolina Medical Care Commission, (Rex Healthcare, Inc.), 5.00%, 7/1/33 | | | 2,055 | | | | 2,304,395 | |
| | |
Royal Oak Hospital Finance Authority, MI, (William Beaumont Hospital), 5.00%, 9/1/23 | | | 1,000 | | | | 1,129,120 | |
| | |
Royal Oak Hospital Finance Authority, MI, (William Beaumont Hospital), 5.00%, 9/1/24 | | | 520 | | | | 593,034 | |
| | |
St. Paul Housing and Redevelopment Authority, MN, (HealthPartners Obligated Group), 5.00%, 7/1/30 | | | 600 | | | | 678,810 | |
| | |
Tarrant County Cultural Education Facilities Finance Corp., TX, (Methodist Hospitals of Dallas), 5.00%, 10/1/20 | | | 1,500 | | | | 1,580,820 | |
| | |
Yuma Industrial Development Authority, AZ, (Yuma Regional Medical Center), 5.00%, 8/1/22 | | | 1,000 | | | | 1,095,730 | |
| |
| | | | $ | 48,963,494 | |
| | | | |
| | 15 | | See Notes to Financial Statements. |
Eaton Vance
TABS Intermediate-Term Municipal Bond Fund
January 31, 2019
Portfolio of Investments — continued
| | | | | | | | |
| Security | | Principal Amount (000’s omitted) | | | Value | |
|
| Housing — 1.2% | |
| | |
New York Housing Finance Agency, Green Bonds, 2.75%, 11/1/22 | | $ | 5,000 | | | $ | 5,029,550 | |
| | |
Virginia Housing Development Authority, 2.45%, 7/1/19 | | | 500 | | | | 501,450 | |
| |
| | | | $ | 5,531,000 | |
|
| Insured – Escrowed / Prerefunded — 0.2% | |
| | |
Cook County Community High School District No. 219, Niles Township, IL, (FGIC), Escrowed to Maturity, 5.50%, 12/1/19 | | $ | 1,055 | | | $ | 1,087,948 | |
| |
| | | | $ | 1,087,948 | |
|
| Insured – General Obligations — 1.7% | |
| | |
Grossmont Union High School District, CA, (Election of 2008), (AGM), 0.00%, 8/1/33 | | $ | 3,535 | | | $ | 1,986,316 | |
| | |
Rockland County, NY, (Public Improvement), (AGM), 4.00%, 5/1/23 | | | 2,010 | | | | 2,178,619 | |
| | |
San Mateo County Community College District, CA, (Election of 2005), (NPFG), 0.00%, 9/1/29 | | | 5,000 | | | | 3,777,100 | |
| |
| | | | $ | 7,942,035 | |
|
| Insured – Special Tax Revenue — 0.3% | |
| | |
Successor Agency to the Rancho Cucamonga Redevelopment Agency, CA, (AGM), 5.00%, 9/1/23 | | $ | 1,350 | | | $ | 1,543,361 | |
| |
| | | | $ | 1,543,361 | |
|
| Insured – Water and Sewer — 0.5% | |
| | |
Massachusetts Water Resources Authority, (AGM), 5.50%, 8/1/20 | | $ | 1,870 | | | $ | 1,975,655 | |
| | |
Massachusetts Water Resources Authority, (AGM), Escrowed to Maturity, 5.50%, 8/1/20 | | | 50 | | | | 52,787 | |
| | |
Massachusetts Water Resources Authority, (AGM), Escrowed to Maturity, 5.50%, 8/1/20 | | | 80 | | | | 84,459 | |
| |
| | | | $ | 2,112,901 | |
|
| Lease Revenue / Certificates of Participation — 3.7% | |
| | |
Cincinnati City School District, OH, 5.00%, 12/15/29 | | $ | 1,505 | | | $ | 1,716,046 | |
| | |
Michigan Strategic Fund, Limited Obligation Revenue, (Facility for Rare Isotope Beams), 5.00%, 3/1/22 | | | 750 | | | | 820,290 | |
| | |
Oklahoma County Finance Authority, OK, (Deer Creek Public Schools), 5.00%, 12/1/26 | | | 1,410 | | | | 1,639,125 | |
| | |
Orange County School Board, FL, 5.00%, 8/1/26 | | | 4,300 | | | | 5,133,942 | |
| | |
South Dakota Building Authority, 5.00%, 6/1/26 | | | 1,000 | | | | 1,148,070 | |
| | |
South Dakota Building Authority, 5.00%, 6/1/32 | | | 1,500 | | | | 1,696,215 | |
| | |
Texas, 4.00%, 8/29/19 | | | 5,000 | | | | 5,066,650 | |
| |
| | | | $ | 17,220,338 | |
| | | | | | | | |
| Security | | Principal Amount (000’s omitted) | | | Value | |
|
| Other Revenue — 6.7% | |
| | |
California Infrastructure and Economic Development Bank, (The J. Paul Getty Trust), 1.96%, (70% of 1 mo. USD LIBOR + 0.20%), 4/1/21 (Put Date), 10/1/47(1) | | $ | 2,500 | | | $ | 2,499,400 | |
| | |
Fort Myers, FL, Capital Improvement Revenue, 5.00%, 12/1/30 | | | 1,055 | | | | 1,222,376 | |
| | |
Fort Myers, FL, Capital Improvement Revenue, 5.00%, 12/1/31 | | | 965 | | | | 1,112,211 | |
| | |
Fort Myers, FL, Capital Improvement Revenue, 5.00%, 12/1/35 | | | 500 | | | | 569,220 | |
| | |
Fort Myers, FL, Capital Improvement Revenue, 5.00%, 12/1/36 | | | 450 | | | | 511,398 | |
| | |
Kentucky Public Energy Authority, Gas Supply Revenue, 4.00% to 6/1/25 (Put Date), 12/1/49 | | | 5,000 | | | | 5,274,900 | |
| | |
Louisiana Local Government Environmental Facilities and Community Development Authority, (Jefferson Parish), 5.00%, 12/1/33 | | | 2,425 | | | | 2,830,460 | |
| | |
Main Street Natural Gas, Inc., GA, Gas Supply Revenue, (Liq: Royal Bank of Canada), 4.00% to 9/1/23 (Put Date), 4/1/48 | | | 11,000 | | | | 11,630,850 | |
| | |
Orange County, FL, Tourist Development Tax Revenue, 4.00%, 10/1/32 | | | 5,000 | | | | 5,308,000 | |
| |
| | | | $ | 30,958,815 | |
|
| Senior Living / Life Care — 0.8% | |
| | |
Illinois Finance Authority, (Presbyterian Homes Obligated Group), 3.11%, (70% of 1 mo. USD LIBOR + 1.35%), 5/1/21 (Put Date), 5/1/36(1) | | $ | 2,500 | | | $ | 2,508,925 | |
| | |
North Carolina Medical Care Commission, (Deerfield Episcopal Retirement Community, Inc.), 5.00%, 11/1/31 | | | 1,000 | | | | 1,130,570 | |
| |
| | | | $ | 3,639,495 | |
|
| Special Tax Revenue — 3.2% | |
| | |
Contra Costa Transportation Authority, CA, Sales Tax Revenue, 2.01%, (70% of 1 mo. USD LIBOR + 0.25%), 9/1/21 (Put Date), 3/1/34(1) | | $ | 2,025 | | | $ | 2,025,567 | |
| | |
Massachusetts School Building Authority, Dedicated Sales Tax Revenue, 5.00%, 5/15/33 | | | 2,000 | | | | 2,224,920 | |
| | |
New York City Transitional Finance Authority, NY, Future Tax Revenue, 5.00%, 11/1/31 | | | 3,220 | | | | 3,550,565 | |
| | |
New York Dormitory Authority, Sales Tax Revenue, 5.00%, 3/15/31 | | | 6,000 | | | | 7,172,400 | |
| |
| | | | $ | 14,973,452 | |
|
| Transportation — 12.3% | |
| | |
Chicago, IL, (O’Hare International Airport), 5.00%, 1/1/25 | | $ | 5,000 | | | $ | 5,801,650 | |
| | |
Chicago, IL, (O’Hare International Airport), 5.00%, 1/1/33 | | | 1,000 | | | | 1,106,950 | |
| | |
Chicago, IL, (O’Hare International Airport), 5.00%, 1/1/34 | | | 1,000 | | | | 1,102,970 | |
| | | | |
| | 16 | | See Notes to Financial Statements. |
Eaton Vance
TABS Intermediate-Term Municipal Bond Fund
January 31, 2019
Portfolio of Investments — continued
| | | | | | | | |
| Security | | Principal Amount (000’s omitted) | | | Value | |
|
| Transportation (continued) | |
| | |
Chicago, IL, (O’Hare International Airport), 5.25%, 1/1/33 | | $ | 3,750 | | | $ | 4,314,375 | |
| | |
Chicago, IL, (O’Hare International Airport), 5.25%, 1/1/34 | | | 3,950 | | | | 4,529,544 | |
| | |
Chicago, IL, (O’Hare International Airport), 5.25%, 1/1/37 | | | 1,500 | | | | 1,703,205 | |
| | |
Dallas and Fort Worth, TX, (Dallas/Fort Worth International Airport), 5.00%, 11/1/19 | | | 2,500 | | | | 2,560,475 | |
| | |
Dallas and Fort Worth, TX, (Dallas/Fort Worth International Airport), 5.25%, 11/1/32 | | | 4,000 | | | | 4,496,440 | |
| | |
Delaware River and Bay Authority, 5.00%, 1/1/21 | | | 1,000 | | | | 1,060,910 | |
| | |
Florida Department of Transportation, 5.00%, 7/1/28 | | | 2,455 | | | | 2,939,200 | |
| | |
Idaho Housing and Finance Association, Federal Highway Trust Fund, 5.00%, 7/15/25 | | | 1,000 | | | | 1,170,430 | |
| | |
Illinois Toll Highway Authority, 5.00%, 1/1/32 | | | 1,000 | | | | 1,133,930 | |
| | |
Illinois Toll Highway Authority, 5.00%, 1/1/33 | | | 1,775 | | | | 2,002,058 | |
| | |
Louisiana Transportation Authority, 5.00%, 8/15/30 | | | 1,885 | | | | 2,118,325 | |
| | |
Louisiana Transportation Authority, 5.00%, 8/15/31 | | | 1,230 | | | | 1,380,552 | |
| | |
Louisiana Transportation Authority, 5.00%, 8/15/32 | | | 1,090 | | | | 1,221,912 | |
| | |
Metropolitan Transportation Authority, NY, 5.00%, 11/15/27 | | | 3,500 | | | | 4,080,090 | |
| | |
Missouri Highways and Transportation Commission, 5.00%, 5/1/25 | | | 5,000 | | | | 5,791,350 | |
| | |
Salt Lake City, UT, (Salt Lake City International Airport), 5.00%, 7/1/35 | | | 2,115 | | | | 2,461,331 | |
| | |
Salt Lake City, UT, (Salt Lake City International Airport), 5.00%, 7/1/36 | | | 2,265 | | | | 2,621,806 | |
| | |
Wayne County Airport Authority, MI, (Detroit Metropolitan Wayne County Airport), 5.00%, 12/1/34 | | | 3,000 | | | | 3,496,050 | |
| |
| | | | $ | 57,093,553 | |
|
| Water and Sewer — 6.5% | |
| | |
East Bay Municipal Utility District, CA, Water System Revenue, 5.00%, 6/1/30 | | $ | 3,870 | | | $ | 4,548,914 | |
| | |
Hamilton County, OH, Sewer System, 5.00%, 12/1/24 | | | 1,000 | | | | 1,144,740 | |
| | |
Hamilton County, OH, Sewer System, 5.00%, 12/1/28 | | | 2,210 | | | | 2,512,350 | |
| | |
Kansas City, MO, Sanitary Sewer System Revenue, 5.00%, 1/1/30 | | | 600 | | | | 723,366 | |
| | |
Lakeland, FL, Water and Wastewater Revenue, 5.00%, 10/1/26 | | | 470 | | | | 509,626 | |
| | |
New York City Municipal Water Finance Authority, NY, (Water and Sewer System), 5.00%, 6/15/29 | | | 3,750 | | | | 3,855,600 | |
| | |
New York City Municipal Water Finance Authority, NY, (Water and Sewer System), Series BB, 5.00%, 6/15/30 | | | 1,000 | | | | 1,042,760 | |
| | |
New York City Municipal Water Finance Authority, NY, (Water and Sewer System), Series DD, 5.00%, 6/15/35 | | | 5,500 | | | | 6,227,375 | |
| | |
New York City Municipal Water Finance Authority, NY, (Water and Sewer System), Series EE, 5.00%, 6/15/35 | | | 1,155 | | | | 1,279,694 | |
| | |
Northeast Ohio Regional Sewer District, Prerefunded to 5/15/23, 5.00%, 11/15/38 | | | 1,000 | | | | 1,129,920 | |
| | | | | | | | |
| Security | | Principal Amount (000’s omitted) | | | Value | |
|
| Water and Sewer (continued) | |
| | |
Oklahoma City Water Utilities Trust, OK, 5.00%, 7/1/26 | | $ | 3,530 | | | $ | 4,000,196 | |
| | |
Tallahassee, FL, Consolidated Utility Systems Revenue, 5.00%, 10/1/28 | | | 1,100 | | | | 1,249,204 | |
| | |
Westmoreland County Municipal Authority, PA, Water and Sewer Revenue, Prerefunded to 8/15/23, 5.00%, 8/15/31 | | | 1,735 | | | | 1,976,321 | |
| |
| | | | $ | 30,200,066 | |
| |
Total Tax-Exempt Municipal Securities — 98.9%
(identified cost $444,108,865) | | | $ | 458,700,146 | |
|
| Taxable Municipal Securities — 0.2% | |
| Security | | Principal
Amount
(000’s omitted) | | | Value | |
|
| Special Tax Revenue — 0.2% | |
| | |
Successor Agency to San Diego Redevelopment Agency, CA, 3.625%, 9/1/25 | | $ | 500 | | | $ | 518,665 | |
| | |
Successor Agency to San Diego Redevelopment Agency, CA, 3.75%, 9/1/26 | | | 625 | | | | 648,963 | |
| |
Total Taxable Municipal Securities — 0.2%
(identified cost $1,121,512) | | | $ | 1,167,628 | |
| |
Total Investments — 99.1%
(identified cost $445,230,377) | | | $ | 459,867,774 | |
| |
Other Assets, Less Liabilities — 0.9% | | | $ | 3,949,558 | |
| |
Net Assets — 100.0% | | | $ | 463,817,332 | |
The percentage shown for each investment category in the Portfolio of Investments is based on net assets.
At January 31, 2019, the concentration of the Fund’s investments in the various states, determined as a percentage of net assets, is as follows:
| | | | |
| |
| Texas | | | 10.6% | |
| |
| Others, representing less than 10% individually | | | 88.5% | |
The Fund invests primarily in debt securities issued by municipalities. The ability of the issuers of the debt securities to meet their obligations may be affected by economic developments in a specific industry or municipality. In order to reduce the risk associated with such economic developments, at January 31, 2019, 2.8% of total investments are backed by bond insurance of various financial institutions and financial guaranty assurance agencies. The aggregate percentage insured by an individual financial institution or financial guaranty assurance agency ranged from 0.2% to 1.7% of total investments.
| (1) | Floating rate security. The stated interest rate represents the rate in effect at January 31, 2019. |
| | | | |
| | 17 | | See Notes to Financial Statements. |
Eaton Vance
TABS Intermediate-Term Municipal Bond Fund
January 31, 2019
Portfolio of Investments — continued
| (2) | When-issued security. |
| (3) | Variable rate demand obligation that may be tendered at par on any day for payment the lesser of 5 business days or 7 calendar days. The stated interest rate, which generally resets weekly, is determined by the remarketing agent and represents the rate in effect at January 31, 2019. |
Abbreviations:
| | | | |
| | |
| AGM | | – | | Assured Guaranty Municipal Corp. |
| | |
| FGIC | | – | | Financial Guaranty Insurance Company |
| | |
| LIQ | | – | | Liquidity Provider |
| | |
| LIBOR | | – | | London Interbank Offered Rate |
| | |
| NPFG | | – | | National Public Finance Guarantee Corp. |
| | |
| PSF | | – | | Permanent School Fund |
| | |
| SIFMA | | – | | Securities Industry and Financial Markets Association Municipal Swap Index |
| | |
| SPA | | – | | Standby Bond Purchase Agreement |
| | |
| USD | | – | | United States Dollar |
| | | | |
| | 18 | | See Notes to Financial Statements. |
Eaton Vance
TABS Municipal Bond Funds
January 31, 2019
Statements of Assets and Liabilities
| | | | | | | | |
| | | January 31, 2019 | |
| Assets | | Short-Term Municipal Bond Fund | | | Intermediate-Term
Municipal Bond
Fund | |
| | |
Investments — | | | | | | | | |
| | |
Identified cost | | $ | 298,283,555 | | | $ | 445,230,377 | |
| | |
Unrealized appreciation | | | 4,929,620 | | | | 14,637,397 | |
| | |
Investments, at value | | $ | 303,213,175 | | | $ | 459,867,774 | |
| | |
Cash | | $ | 15,113,313 | | | $ | 11,931,931 | |
| | |
Interest receivable | | | 2,744,758 | | | | 4,199,302 | |
| | |
Receivable for Fund shares sold | | | 873,167 | | | | 1,396,289 | |
| | |
Receivable from affiliate | | | — | | | | 59,985 | |
| | |
Total assets | | $ | 321,944,413 | | | $ | 477,455,281 | |
| | |
| Liabilities | | | | | | | | |
| | |
Payable for investments purchased | | $ | 5,000,000 | | | $ | 1,205,857 | |
| | |
Payable for when-issued securities | | | 1,319,234 | | | | 10,104,900 | |
| | |
Payable for Fund shares redeemed | | | 1,053,935 | | | | 1,446,255 | |
| | |
Distributions payable | | | 111,068 | | | | 493,904 | |
| | |
Payable to affiliates: | | | | | | | | |
| | |
Investment adviser and administration fee | | | 146,180 | | | | 240,483 | |
| | |
Distribution and service fees | | | 55,635 | | | | 30,728 | |
| | |
Accrued expenses | | | 93,240 | | | | 115,822 | |
| | |
Total liabilities | | $ | 7,779,292 | | | $ | 13,637,949 | |
| | |
Net Assets | | $ | 314,165,121 | | | $ | 463,817,332 | |
| | |
| Sources of Net Assets | | | | | | | | |
| | |
Paid-in capital | | $ | 311,242,439 | | | $ | 453,081,335 | |
| | |
Distributable earnings | | | 2,922,682 | | | | 10,735,997 | |
| | |
Net Assets | | $ | 314,165,121 | | | $ | 463,817,332 | |
| | |
| Class A Shares | | | | | | | | |
| | |
Net Assets | | $ | 113,654,139 | | | $ | 42,714,877 | |
| | |
Shares Outstanding | | | 10,985,957 | | | | 3,498,307 | |
| | |
Net Asset Value and Redemption Price Per Share | | | | | | | | |
| | |
(net assets ÷ shares of beneficial interest outstanding) | | $ | 10.35 | | | $ | 12.21 | |
| | |
Maximum Offering Price Per Share | | | | | | | | |
| | |
(100 ÷ 97.75 of net asset value per share) | | $ | 10.59 | | | $ | 12.49 | |
| | |
| Class C Shares | | | | | | | | |
| | |
Net Assets | | $ | 35,831,726 | | | $ | 24,455,665 | |
| | |
Shares Outstanding | | | 3,471,564 | | | | 2,003,492 | |
| | |
Net Asset Value and Offering Price Per Share* | | | | | | | | |
| | |
(net assets ÷ shares of beneficial interest outstanding) | | $ | 10.32 | | | $ | 12.21 | |
| | |
| Class I Shares | | | | | | | | |
| | |
Net Assets | | $ | 164,679,256 | | | $ | 396,646,790 | |
| | |
Shares Outstanding | | | 15,913,851 | | | | 32,454,821 | |
| | |
Net Asset Value, Offering Price and Redemption Price Per Share | | | | | | | | |
| | |
(net assets ÷ shares of beneficial interest outstanding) | | $ | 10.35 | | | $ | 12.22 | |
On sales of $100,000 or more ($50,000 or more for certain financial intermediaries, as disclosed in an appendix to the Funds’ prospectus), the offering price of Class A shares is reduced.
| * | Redemption price per share is equal to the net asset value less any applicable contingent deferred sales charge. |
| | | | |
| | 19 | | See Notes to Financial Statements. |
Eaton Vance
TABS Municipal Bond Funds
January 31, 2019
Statements of Operations
| | | | | | | | |
| | | Year Ended January 31, 2019 | |
| Investment Income | | Short-Term
Municipal Bond
Fund | | | Intermediate-Term
Municipal Bond
Fund | |
| | |
Interest | | $ | 8,288,651 | | | $ | 13,573,529 | |
| | |
Total investment income | | $ | 8,288,651 | | | $ | 13,573,529 | |
|
| Expenses | |
| | |
Investment adviser and administration fee | | $ | 1,891,223 | | | $ | 2,862,557 | |
| | |
Distribution and service fees | | | | | | | | |
| | |
Class A | | | 325,457 | | | | 110,750 | |
| | |
Class C | | | 438,011 | | | | 269,993 | |
| | |
Trustees’ fees and expenses | | | 16,859 | | | | 24,273 | |
| | |
Custodian fee | | | 94,680 | | | | 126,057 | |
| | |
Transfer and dividend disbursing agent fees | | | 108,532 | | | | 246,940 | |
| | |
Legal and accounting services | | | 54,184 | | | | 51,609 | |
| | |
Printing and postage | | | 24,889 | | | | 44,360 | |
| | |
Registration fees | | | 50,569 | | | | 82,847 | |
| | |
Miscellaneous | | | 25,724 | | | | 30,242 | |
| | |
Total expenses | | $ | 3,030,128 | | | $ | 3,849,628 | |
| | |
Deduct — | | | | | | | | |
| | |
Allocation of expenses to affiliate | | $ | — | | | $ | 367,776 | |
| | |
Total expense reductions | | $ | — | | | $ | 367,776 | |
| | |
Net expenses | | $ | 3,030,128 | | | $ | 3,481,852 | |
| | |
Net investment income | | $ | 5,258,523 | | | $ | 10,091,677 | |
| | |
| Realized and Unrealized Gain (Loss) | | | | | | | | |
| | |
Net realized gain (loss) — | | | | | | | | |
| | |
Investment transactions | | $ | (1,650,988 | ) | | $ | (492,750 | ) |
| | |
Net realized loss | | $ | (1,650,988 | ) | | $ | (492,750 | ) |
| | |
Change in unrealized appreciation (depreciation) — | | | | | | | | |
| | |
Investments | | $ | 2,630,490 | | | $ | 1,921,475 | |
| | |
Net change in unrealized appreciation (depreciation) | | $ | 2,630,490 | | | $ | 1,921,475 | |
| | |
Net realized and unrealized gain | | $ | 979,502 | | | $ | 1,428,725 | |
| | |
Net increase in net assets from operations | | $ | 6,238,025 | | | $ | 11,520,402 | |
| | | | |
| | 20 | | See Notes to Financial Statements. |
Eaton Vance
TABS Municipal Bond Funds
January 31, 2019
Statements of Changes in Net Assets
| | | | | | | | |
| | | Year Ended January 31, 2019 | |
| Increase (Decrease) in Net Assets | | Short-Term
Municipal Bond
Fund | | | Intermediate-Term
Municipal Bond
Fund | |
| | |
From operations — | | | | | | | | |
| | |
Net investment income | | $ | 5,258,523 | | | $ | 10,091,677 | |
| | |
Net realized loss | | | (1,650,988 | ) | | | (492,750 | ) |
| | |
Net change in unrealized appreciation (depreciation) | | | 2,630,490 | | | | 1,921,475 | |
| | |
Net increase in net assets from operations | | $ | 6,238,025 | | | $ | 11,520,402 | |
| | |
Distributions to shareholders(1) | | | | | | | | |
| | |
Class A | | $ | (1,945,492 | ) | | $ | (861,103 | ) |
| | |
Class C | | | (326,194 | ) | | | (322,058 | ) |
| | |
Class I | | | (2,962,149 | ) | | | (8,895,783 | ) |
| | |
Total distributions to shareholders | | $ | (5,233,835 | ) | | $ | (10,078,944 | ) |
| | |
Transactions in shares of beneficial interest — | | | | | | | | |
| | |
Proceeds from sale of shares | | | | | | | | |
| | |
Class A | | $ | 10,209,302 | | | $ | 4,302,642 | |
| | |
Class C | | | 1,888,722 | | | | 1,985,352 | |
| | |
Class I | | | 70,230,004 | | | | 141,045,676 | |
| | |
Net asset value of shares issued to shareholders in payment of distributions declared | | | | | | | | |
| | |
Class A | | | 1,675,245 | | | | 528,823 | |
| | |
Class C | | | 279,114 | | | | 144,386 | |
| | |
Class I | | | 2,060,815 | | | | 3,477,172 | |
| | |
Cost of shares redeemed | | | | | | | | |
| | |
Class A | | | (49,297,736 | ) | | | (11,801,998 | ) |
| | |
Class C | | | (17,405,888 | ) | | | (5,875,657 | ) |
| | |
Class I | | | (87,365,549 | ) | | | (162,581,776 | ) |
| | |
Net asset value of shares converted | | | | | | | | |
| | |
Class A | | | 1,103,425 | | | | 1,087,728 | |
| | |
Class C | | | (1,103,425 | ) | | | (1,087,728 | ) |
| | |
Net decrease in net assets from Fund share transactions | | $ | (67,725,971 | ) | | $ | (28,775,380 | ) |
| | |
Net decrease in net assets | | $ | (66,721,781 | ) | | $ | (27,333,922 | ) |
|
| Net Assets | |
| | |
At beginning of year | | $ | 380,886,902 | | | $ | 491,151,254 | |
| | |
At end of year | | $ | 314,165,121 | | | $ | 463,817,332 | |
| (1) | The current period presentation of distributions conforms with the Disclosure Update and Simplification Rule issued by the Securities and Exchange Commission, effective November 5, 2018. |
| | | | |
| | 21 | | See Notes to Financial Statements. |
Eaton Vance
TABS Municipal Bond Funds
January 31, 2019
Statements of Changes in Net Assets — continued
| | | | | | | | |
| | | Year Ended January 31, 2018 | |
| Increase (Decrease) in Net Assets | | Short-Term
Municipal Bond
Fund | | | Intermediate-Term
Municipal Bond
Fund | |
| | |
From operations — | | | | | | | | |
| | |
Net investment income | | $ | 6,055,207 | | | $ | 9,885,561 | |
| | |
Net realized gain | | | 3,134,086 | | | | 1,152,175 | |
| | |
Net change in unrealized appreciation (depreciation) | | | (5,344,574 | ) | | | 2,803,279 | |
| | |
Net increase in net assets from operations | | $ | 3,844,719 | | | $ | 13,841,015 | |
| | |
Distributions to shareholders | | | | | | | | |
| | |
From net investment income | | | | | | | | |
| | |
Class A | | $ | (2,406,880 | ) | | $ | (971,189 | ) |
| | |
Class C | | | (393,374 | ) | | | (343,304 | ) |
| | |
Class I | | | (3,241,194 | ) | | | (8,541,231 | ) |
| | |
Total distributions to shareholders | | $ | (6,041,448 | ) | | $ | (9,855,724 | ) |
| | |
Transactions in shares of beneficial interest — | | | | | | | | |
| | |
Proceeds from sale of shares | | | | | | | | |
| | |
Class A | | $ | 21,676,979 | | | $ | 9,674,400 | |
| | |
Class C | | | 2,380,499 | | | | 4,198,322 | |
| | |
Class I | | | 64,582,264 | | | | 144,938,675 | |
| | |
Net asset value of shares issued to shareholders in payment of distributions declared | | | | | | | | |
| | |
Class A | | | 2,090,543 | | | | 621,483 | |
| | |
Class C | | | 336,998 | | | | 164,127 | |
| | |
Class I | | | 2,431,631 | | | | 3,342,186 | |
| | |
Cost of shares redeemed | | | | | | | | |
| | |
Class A | | | (73,141,699 | ) | | | (19,519,307 | ) |
| | |
Class C | | | (20,020,992 | ) | | | (10,376,045 | ) |
| | |
Class I | | | (91,037,112 | ) | | | (173,002,474 | ) |
| | |
Net decrease in net assets from Fund share transactions | | $ | (90,700,889 | ) | | $ | (39,958,633 | ) |
| | |
Net decrease in net assets | | $ | (92,897,618 | ) | | $ | (35,973,342 | ) |
|
| Net Assets | |
| | |
At beginning of year | | $ | 473,784,520 | | | $ | 527,124,596 | |
| | |
At end of year(1) | | $ | 380,886,902 | | | $ | 491,151,254 | |
| (1) | Includes accumulated distributions in excess of net investment income of $(67,306) and $(14,459), respectively, at January 31, 2018. The requirement to disclose the corresponding amounts as of January 31, 2019 was eliminated. |
| | | | |
| | 22 | | See Notes to Financial Statements. |
Eaton Vance
TABS Municipal Bond Funds
January 31, 2019
Financial Highlights
| | | | | | | | | | | | | | | | | | | | |
| | | Short-Term Municipal Bond Fund — Class A | |
| |
| | | Year Ended January 31, | |
| | | 2019 | | | 2018 | | | 2017 | | | 2016 | | | 2015 | |
| | | | | |
Net asset value — Beginning of year | | $ | 10.300 | | | $ | 10.370 | | | $ | 10.690 | | | $ | 10.740 | | | $ | 10.580 | |
| | | | | |
| Income (Loss) From Operations | | | | | | | | | | | | | | | | | | | | |
| | | | | |
Net investment income | | $ | 0.154 | (1) | | $ | 0.149 | | | $ | 0.130 | | | $ | 0.134 | | | $ | 0.122 | |
| | | | | |
Net realized and unrealized gain (loss) | | | 0.049 | | | | (0.074 | ) | | | (0.254 | ) | | | 0.011 | (2) | | | 0.173 | |
| | | | | |
Total income (loss) from operations | | $ | 0.203 | | | $ | 0.075 | | | $ | (0.124 | ) | | $ | 0.145 | | | $ | 0.295 | |
| | | | | |
| Less Distributions | | | | | | | | | | | | | | | | | | | | |
| | | | | |
From net investment income | | $ | (0.153 | ) | | $ | (0.145 | ) | | $ | (0.128 | ) | | $ | (0.133 | ) | | $ | (0.119 | ) |
| | | | | |
From net realized gain | | | — | | | | — | | | | (0.068 | ) | | | (0.062 | ) | | | (0.016 | ) |
| | | | | |
Total distributions | | $ | (0.153 | ) | | $ | (0.145 | ) | | $ | (0.196 | ) | | $ | (0.195 | ) | | $ | (0.135 | ) |
| | | | | |
Net asset value — End of year | | $ | 10.350 | | | $ | 10.300 | | | $ | 10.370 | | | $ | 10.690 | | | $ | 10.740 | |
| | | | | |
Total Return(3) | | | 2.00 | % | | | 0.71 | % | | | (1.18 | )% | | | 1.38 | % | | | 2.80 | % |
| | | | | |
| Ratios/Supplemental Data | | | | | | | | | | | | | | | | | | | | |
| | | | | |
Net assets, end of year (000’s omitted) | | $ | 113,654 | | | $ | 149,651 | | | $ | 199,916 | | | $ | 227,242 | | | $ | 243,950 | |
| | | | | |
Ratios (as a percentage of average daily net assets): | | | | | | | | | | | | | | | | | | | | |
| | | | | |
Expenses | | | 0.91 | % | | | 0.90 | % | | | 0.90 | % | | | 0.89 | %(4) | | | 0.90 | %(4) |
| | | | | |
Net investment income | | | 1.50 | % | | | 1.39 | % | | | 1.21 | % | | | 1.26 | % | | | 1.12 | % |
| | | | | |
Portfolio Turnover | | | 67 | % | | | 54 | % | | | 63 | % | | | 47 | % | | | 33 | % |
| (1) | Computed using average shares outstanding. |
| (2) | The per share amount is not in accord with the net realized and unrealized gain (loss) on investments for the period because of the timing of sales of Fund shares and the amount of the per share realized and unrealized gains and losses at such time. |
| (3) | Returns are historical and are calculated by determining the percentage change in net asset value with all distributions reinvested and do not reflect the effect of sales charges. |
| (4) | Excludes the effect of custody fee credits, if any, of less than 0.005%. Effective September 1, 2015, custody fee credits, which were earned on cash deposit balances, were discontinued by the custodian. |
| | | | |
| | 23 | | See Notes to Financial Statements. |
Eaton Vance
TABS Municipal Bond Funds
January 31, 2019
Financial Highlights — continued
| | | | | | | | | | | | | | | | | | | | |
| | | Short-Term Municipal Bond Fund — Class C | |
| |
| | | Year Ended January 31, | |
| | | 2019 | | | 2018 | | | 2017 | | | 2016 | | | 2015 | |
| | | | | |
Net asset value — Beginning of year | | $ | 10.270 | | | $ | 10.340 | | | $ | 10.660 | | | $ | 10.720 | | | $ | 10.560 | |
| | | | | |
| Income (Loss) From Operations | | | | | | | | | | | | | | | | | | | | |
| | | | | |
Net investment income(1) | | $ | 0.077 | | | $ | 0.067 | | | $ | 0.049 | | | $ | 0.054 | | | $ | 0.040 | |
| | | | | |
Net realized and unrealized gain (loss) | | | 0.049 | | | | (0.071 | ) | | | (0.253 | ) | | | 0.001 | (2) | | | 0.175 | |
| | | | | |
Total income (loss) from operations | | $ | 0.126 | | | $ | (0.004 | ) | | $ | (0.204 | ) | | $ | 0.055 | | | $ | 0.215 | |
| | | | | |
| Less Distributions | | | | | | | | | | | | | | | | | | | | |
| | | | | |
From net investment income | | $ | (0.076 | ) | | $ | (0.066 | ) | | $ | (0.048 | ) | | $ | (0.053 | ) | | $ | (0.039 | ) |
| | | | | |
From net realized gain | | | — | | | | — | | | | (0.068 | ) | | | (0.062 | ) | | | (0.016 | ) |
| | | | | |
Total distributions | | $ | (0.076 | ) | | $ | (0.066 | ) | | $ | (0.116 | ) | | $ | (0.115 | ) | | $ | (0.055 | ) |
| | | | | |
Net asset value — End of year | | $ | 10.320 | | | $ | 10.270 | | | $ | 10.340 | | | $ | 10.660 | | | $ | 10.720 | |
| | | | | |
Total Return(3) | | | 1.24 | % | | | (0.04 | )% | | | (1.92 | )% | | | 0.53 | % | | | 2.04 | % |
| | | | | |
| Ratios/Supplemental Data | | | | | | | | | | | | | | | | | | | | |
| | | | | |
Net assets, end of year (000’s omitted) | | $ | 35,832 | | | $ | 52,079 | | | $ | 69,622 | | | $ | 85,043 | | | $ | 106,273 | |
| | | | | |
Ratios (as a percentage of average daily net assets): | | | | | | | | | | | | | | | | | | | | |
| | | | | |
Expenses | | | 1.66 | % | | | 1.65 | % | | | 1.65 | % | | | 1.65 | %(4) | | | 1.65 | %(4) |
| | | | | |
Net investment income | | | 0.75 | % | | | 0.64 | % | | | 0.46 | % | | | 0.51 | % | | | 0.37 | % |
| | | | | |
Portfolio Turnover | | | 67 | % | | | 54 | % | | | 63 | % | | | 47 | % | | | 33 | % |
| (1) | Computed using average shares outstanding. |
| (2) | The per share amount is not in accord with the net realized and unrealized gain (loss) on investments for the period because of the timing of sales of Fund shares and the amount of the per share realized and unrealized gains and losses at such time. |
| (3) | Returns are historical and are calculated by determining the percentage change in net asset value with all distributions reinvested and do not reflect the effect of sales charges. |
| (4) | Excludes the effect of custody fee credits, if any, of less than 0.005%. Effective September 1, 2015, custody fee credits, which were earned on cash deposit balances, were discontinued by the custodian. |
| | | | |
| | 24 | | See Notes to Financial Statements. |
Eaton Vance
TABS Municipal Bond Funds
January 31, 2019
Financial Highlights — continued
| | | | | | | | | | | | | | | | | | | | |
| | | Short-Term Municipal Bond Fund — Class I | |
| |
| | | Year Ended January 31, | |
| | | 2019 | | | 2018 | | | 2017 | | | 2016 | | | 2015 | |
| | | | | |
Net asset value — Beginning of year | | $ | 10.300 | | | $ | 10.370 | | | $ | 10.690 | | | $ | 10.750 | | | $ | 10.590 | |
| | | | | |
| Income (Loss) From Operations | | | | | | | | | | | | | | | | | | | | |
| | | | | |
Net investment income | | $ | 0.181 | | | $ | 0.172 | | | $ | 0.156 | | | $ | 0.161 | | | $ | 0.145 | |
| | | | | |
Net realized and unrealized gain (loss) | | | 0.048 | | | | (0.071 | ) | | | (0.253 | ) | | | 0.001 | (1) | | | 0.177 | |
| | | | | |
Total income (loss) from operations | | $ | 0.229 | | | $ | 0.101 | | | $ | (0.097 | ) | | $ | 0.162 | | | $ | 0.322 | |
| | | | | |
| Less Distributions | | | | | | | | | | | | | | | | | | | | |
| | | | | |
From net investment income | | $ | (0.179 | ) | | $ | (0.171 | ) | | $ | (0.155 | ) | | $ | (0.160 | ) | | $ | (0.146 | ) |
| | | | | |
From net realized gain | | | — | | | | — | | | | (0.068 | ) | | | (0.062 | ) | | | (0.016 | ) |
| | | | | |
Total distributions | | $ | (0.179 | ) | | $ | (0.171 | ) | | $ | (0.223 | ) | | $ | (0.222 | ) | | $ | (0.162 | ) |
| | | | | |
Net asset value — End of year | | $ | 10.350 | | | $ | 10.300 | | | $ | 10.370 | | | $ | 10.690 | | | $ | 10.750 | |
| | | | | |
Total Return(2) | | | 2.25 | % | | | 0.96 | % | | | (0.93 | )% | | | 1.54 | % | | | 3.06 | % |
| | | | | |
| Ratios/Supplemental Data | | | | | | | | | | | | | | | | | | | | |
| | | | | |
Net assets, end of year (000’s omitted) | | $ | 164,679 | | | $ | 179,156 | | | $ | 204,247 | | | $ | 217,956 | | | $ | 242,029 | |
| | | | | |
Ratios (as a percentage of average daily net assets): | | | | | | | | | | | | | | | | | | | | |
| | | | | |
Expenses | | | 0.66 | % | | | 0.65 | % | | | 0.65 | % | | | 0.64 | %(3) | | | 0.65 | %(3) |
| | | | | |
Net investment income | | | 1.75 | % | | | 1.64 | % | | | 1.46 | % | | | 1.51 | % | | | 1.37 | % |
| | | | | |
Portfolio Turnover | | | 67 | % | | | 54 | % | | | 63 | % | | | 47 | % | | | 33 | % |
| (1) | The per share amount is not in accord with the net realized and unrealized gain (loss) on investments for the period because of the timing of sales of Fund shares and the amount of the per share realized and unrealized gains and losses at such time. |
| (2) | Returns are historical and are calculated by determining the percentage change in net asset value with all distributions reinvested. |
| (3) | Excludes the effect of custody fee credits, if any, of less than 0.005%. Effective September 1, 2015, custody fee credits, which were earned on cash deposit balances, were discontinued by the custodian. |
| | | | |
| | 25 | | See Notes to Financial Statements. |
Eaton Vance
TABS Municipal Bond Funds
January 31, 2019
Financial Highlights — continued
| | | | | | | | | | | | | | | | | | | | |
| | | Intermediate-Term Municipal Bond Fund — Class A | |
| |
| | | Year Ended January 31, | |
| | | 2019 | | | 2018 | | | 2017 | | | 2016 | | | 2015 | |
| | | | | |
Net asset value — Beginning of year | | $ | 12.160 | | | $ | 12.070 | | | $ | 12.430 | | | $ | 12.320 | | | $ | 11.600 | |
| | | | | |
| Income (Loss) From Operations | | | | | | | | | | | | | | | | | | | | |
| | | | | |
Net investment income | | $ | 0.235 | | | $ | 0.227 | | | $ | 0.197 | | | $ | 0.199 | | | $ | 0.191 | |
| | | | | |
Net realized and unrealized gain (loss) | | | 0.050 | | | | 0.090 | | | | (0.353 | ) | | | 0.110 | | | | 0.720 | |
| | | | | |
Total income (loss) from operations | | $ | 0.285 | | | $ | 0.317 | | | $ | (0.156 | ) | | $ | 0.309 | | | $ | 0.911 | |
| | | | | |
| Less Distributions | | | | | | | | | | | | | | | | | | | | |
| | | | | |
From net investment income | | $ | (0.235 | ) | | $ | (0.227 | ) | | $ | (0.196 | ) | | $ | (0.199 | ) | | $ | (0.191 | ) |
| | | | | |
From net realized gain | | | — | | | | — | | | | (0.008 | ) | | | — | | | | — | |
| | | | | |
Total distributions | | $ | (0.235 | ) | | $ | (0.227 | ) | | $ | (0.204 | ) | | $ | (0.199 | ) | | $ | (0.191 | ) |
| | | | | |
Net asset value — End of year | | $ | 12.210 | | | $ | 12.160 | | | $ | 12.070 | | | $ | 12.430 | | | $ | 12.320 | |
| | | | | |
Total Return(1)(2) | | | 2.38 | % | | | 2.62 | % | | | (1.29 | )% | | | 2.57 | % | | | 7.91 | % |
| | | | | |
| Ratios/Supplemental Data | | | | | | | | | | | | | | | | | | | | |
| | | | | |
Net assets, end of year (000’s omitted) | | $ | 42,715 | | | $ | 48,494 | | | $ | 57,262 | | | $ | 61,227 | | | $ | 58,616 | |
| | | | | |
Ratios (as a percentage of average daily net assets): | | | | | | | | | | | | | | | | | | | | |
| | | | | |
Expenses(2) | | | 0.90 | % | | | 0.90 | % | | | 0.90 | % | | | 0.90 | %(3) | | | 0.92 | %(3) |
| | | | | |
Net investment income | | | 1.95 | % | | | 1.85 | % | | | 1.57 | % | | | 1.65 | % | | | 1.60 | % |
| | | | | |
Portfolio Turnover | | | 86 | % | | | 62 | % | | | 68 | % | | | 62 | % | | | 77 | % |
| (1) | Returns are historical and are calculated by determining the percentage change in net asset value with all distributions reinvested and do not reflect the effect of sales charges. |
| (2) | The investment adviser and administrator reimbursed certain operating expenses (equal to 0.08%, 0.07%, 0.07%, 0.09% and 0.08% of average daily net assets for the years ended January 31, 2019, 2018, 2017, 2016 and 2015, respectively). Absent this reimbursement, total return would be lower. |
| (3) | Excludes the effect of custody fee credits, if any, of less than 0.005%. Effective September 1, 2015, custody fee credits, which were earned on cash deposit balances, were discontinued by the custodian. |
| | | | |
| | 26 | | See Notes to Financial Statements. |
Eaton Vance
TABS Municipal Bond Funds
January 31, 2019
Financial Highlights — continued
| | | | | | | | | | | | | | | | | | | | |
| | | Intermediate-Term Municipal Bond Fund — Class C | |
| |
| | | Year Ended January 31, | |
| | | 2019 | | | 2018 | | | 2017 | | | 2016 | | | 2015 | |
| | | | | |
Net asset value — Beginning of year | | $ | 12.160 | | | $ | 12.060 | | | $ | 12.430 | | | $ | 12.310 | | | $ | 11.600 | |
| | | | | |
| Income (Loss) From Operations | | | | | | | | | | | | | | | | | | | | |
| | | | | |
Net investment income | | $ | 0.143 | | | $ | 0.134 | | | $ | 0.101 | | | $ | 0.109 | | | $ | 0.102 | |
| | | | | |
Net realized and unrealized gain (loss) | | | 0.051 | | | | 0.101 | | | | (0.361 | ) | | | 0.120 | | | | 0.709 | |
| | | | | |
Total income (loss) from operations | | $ | 0.194 | | | $ | 0.235 | | | $ | (0.260 | ) | | $ | 0.229 | | | $ | 0.811 | |
| | | | | |
| Less Distributions | | | | | | | | | | | | | | | | | | | | |
| | | | | |
From net investment income | | $ | (0.144 | ) | | $ | (0.135 | ) | | $ | (0.102 | ) | | $ | (0.109 | ) | | $ | (0.101 | ) |
| | | | | |
From net realized gain | | | — | | | | — | | | | (0.008 | ) | | | — | | | | — | |
| | | | | |
Total distributions | | $ | (0.144 | ) | | $ | (0.135 | ) | | $ | (0.110 | ) | | $ | (0.109 | ) | | $ | (0.101 | ) |
| | | | | |
Net asset value — End of year | | $ | 12.210 | | | $ | 12.160 | | | $ | 12.060 | | | $ | 12.430 | | | $ | 12.310 | |
| | | | | |
Total Return(1)(2) | | | 1.61 | % | | | 1.94 | % | | | (2.11 | )% | | | 1.88 | % | | | 7.02 | % |
| | | | | |
| Ratios/Supplemental Data | | | | | | | | | | | | | | | | | | | | |
| | | | | |
Net assets, end of year (000’s omitted) | | $ | 24,456 | | | $ | 29,221 | | | $ | 34,920 | | | $ | 38,737 | | | $ | 37,435 | |
| | | | | |
Ratios (as a percentage of average daily net assets): | | | | | | | | | | | | | | | | | | | | |
| | | | | |
Expenses(2) | | | 1.65 | % | | | 1.65 | % | | | 1.65 | % | | | 1.65 | %(3) | | | 1.67 | %(3) |
| | | | | |
Net investment income | | | 1.20 | % | | | 1.10 | % | | | 0.82 | % | | | 0.90 | % | | | 0.85 | % |
| | | | | |
Portfolio Turnover | | | 86 | % | | | 62 | % | | | 68 | % | | | 62 | % | | | 77 | % |
| (1) | Returns are historical and are calculated by determining the percentage change in net asset value with all distributions reinvested and do not reflect the effect of sales charges. |
| (2) | The investment adviser and administrator reimbursed certain operating expenses (equal to 0.08%, 0.07%, 0.07%, 0.09% and 0.08% of average daily net assets for the years ended January 31, 2019, 2018, 2017, 2016 and 2015, respectively). Absent this reimbursement, total return would be lower. |
| (3) | Excludes the effect of custody fee credits, if any, of less than 0.005%. Effective September 1, 2015, custody fee credits, which were earned on cash deposit balances, were discontinued by the custodian. |
| | | | |
| | 27 | | See Notes to Financial Statements. |
Eaton Vance
TABS Municipal Bond Funds
January 31, 2019
Financial Highlights — continued
| | | | | | | | | | | | | | | | | | | | |
| | | Intermediate-Term Municipal Bond Fund — Class I | |
| |
| | | Year Ended January 31, | |
| | | 2019 | | | 2018 | | | 2017 | | | 2016 | | | 2015 | |
| | | | | |
Net asset value — Beginning of year | | $ | 12.180 | | | $ | 12.080 | | | $ | 12.440 | | | $ | 12.330 | | | $ | 11.610 | |
| | | | | |
| Income (Loss) From Operations | | | | | | | | | | | | | | | | | | | | |
| | | | | |
Net investment income | | $ | 0.265 | | | $ | 0.258 | | | $ | 0.227 | | | $ | 0.230 | | | $ | 0.221 | |
| | | | | |
Net realized and unrealized gain (loss) | | | 0.040 | | | | 0.100 | | | | (0.352 | ) | | | 0.110 | | | | 0.720 | |
| | | | | |
Total income (loss) from operations | | $ | 0.305 | | | $ | 0.358 | | | $ | (0.125 | ) | | $ | 0.340 | | | $ | 0.941 | |
| | | | | |
| Less Distributions | | | | | | | | | | | | | | | | | | | | |
| | | | | |
From net investment income | | $ | (0.265 | ) | | $ | (0.258 | ) | | $ | (0.227 | ) | | $ | (0.230 | ) | | $ | (0.221 | ) |
| | | | | |
From net realized gain | | | — | | | | — | | | | (0.008 | ) | | | — | | | | — | |
| | | | | |
Total distributions | | $ | (0.265 | ) | | $ | (0.258 | ) | | $ | (0.235 | ) | | $ | (0.230 | ) | | $ | (0.221 | ) |
| | | | | |
Net asset value — End of year | | $ | 12.220 | | | $ | 12.180 | | | $ | 12.080 | | | $ | 12.440 | | | $ | 12.330 | |
| | | | | |
Total Return(1)(2) | | | 2.63 | % | | | 2.87 | % | | | (1.04 | )% | | | 2.82 | % | | | 8.17 | % |
| | | | | |
| Ratios/Supplemental Data | | | | | | | | | | | | | | | | | | | | |
| | | | | |
Net assets, end of year (000’s omitted) | | $ | 396,647 | | | $ | 413,436 | | | $ | 434,942 | | | $ | 347,631 | | | $ | 273,125 | |
| | | | | |
Ratios (as a percentage of average daily net assets): | | | | | | | | | | | | | | | | | | | | |
| | | | | |
Expenses(2) | | | 0.65 | % | | | 0.65 | % | | | 0.65 | % | | | 0.65 | %(3) | | | 0.67 | %(3) |
| | | | | |
Net investment income | | | 2.19 | % | | | 2.10 | % | | | 1.82 | % | | | 1.90 | % | | | 1.84 | % |
| | | | | |
Portfolio Turnover | | | 86 | % | | | 62 | % | | | 68 | % | | | 62 | % | | | 77 | % |
| (1) | Returns are historical and are calculated by determining the percentage change in net asset value with all distributions reinvested. |
| (2) | The investment adviser and administrator reimbursed certain operating expenses (equal to 0.08%, 0.07%, 0.07%, 0.09% and 0.08% of average daily net assets for the years ended January 31, 2019, 2018, 2017, 2016 and 2015, respectively). Absent this reimbursement, total return would be lower. |
| (3) | Excludes the effect of custody fee credits, if any, of less than 0.005%. Effective September 1, 2015, custody fee credits, which were earned on cash deposit balances, were discontinued by the custodian. |
| | | | |
| | 28 | | See Notes to Financial Statements. |
Eaton Vance
TABS Municipal Bond Funds
January 31, 2019
Notes to Financial Statements
1 Significant Accounting Policies
Eaton Vance Municipals Trust II (the Trust) is a Massachusetts business trust registered under the Investment Company Act of 1940, as amended (the 1940 Act), as an open-end management investment company. The Trust presently consists of six funds, two of which, each diversified, are included in these financial statements. They include Eaton Vance TABS Short-Term Municipal Bond Fund (Short-Term Municipal Bond Fund) and Eaton Vance TABS Intermediate-Term Municipal Bond Fund (Intermediate-Term Municipal Bond Fund), (each individually referred to as the Fund, and collectively, the Funds). The Funds’ investment objective is to seek after-tax total return. The Funds offer three classes of shares. Class A shares are generally sold subject to a sales charge imposed at time of purchase. Class C shares are sold at net asset value and are generally subject to a contingent deferred sales charge (see Note 5). Effective January 25, 2019, Class C shares generally automatically convert to Class A shares ten years after their purchase as described in the Funds’ prospectus. Class I shares are sold at net asset value and are not subject to a sales charge. Each class represents a pro-rata interest in the Fund, but votes separately on class-specific matters and (as noted below) is subject to different expenses. Realized and unrealized gains and losses are allocated daily to each class of shares based on the relative net assets of each class to the total net assets of the Fund. Net investment income, other than class-specific expenses, is allocated daily to each class of shares based upon the ratio of the value of each class’s paid shares to the total value of all paid shares. Each class of shares differs in its distribution plan and certain other class-specific expenses.
The following is a summary of significant accounting policies of the Funds. The policies are in conformity with accounting principles generally accepted in the United States of America (U.S. GAAP). Each Fund is an investment company and follows accounting and reporting guidance in the Financial Accounting Standards Board (FASB) Accounting Standards Codification Topic 946.
A Investment Valuation — The following methodologies are used to determine the market value or fair value of investments.
Debt Obligations. Debt obligations are generally valued on the basis of valuations provided by third party pricing services, as derived from such services’ pricing models. Inputs to the models may include, but are not limited to, reported trades, executable bid and ask prices, broker/dealer quotations, prices or yields of securities with similar characteristics, interest rates, anticipated prepayments, benchmark curves or information pertaining to the issuer, as well as industry and economic events. The pricing services may use a matrix approach, which considers information regarding securities with similar characteristics to determine the valuation for a security. Short-term debt obligations purchased with a remaining maturity of sixty days or less for which a valuation from a third party pricing service is not readily available may be valued at amortized cost, which approximates fair value.
Fair Valuation. Investments for which valuations or market quotations are not readily available or are deemed unreliable are valued at fair value using methods determined in good faith by or at the direction of the Trustees of a Fund in a manner that fairly reflects the security’s value, or the amount that a Fund might reasonably expect to receive for the security upon its current sale in the ordinary course. Each such determination is based on a consideration of relevant factors, which are likely to vary from one pricing context to another. These factors may include, but are not limited to, the type of security, the existence of any contractual restrictions on the security’s disposition, the price and extent of public trading in similar securities of the issuer or of comparable entities, quotations or relevant information obtained from broker/dealers or other market participants, information obtained from the issuer, analysts, and/or the appropriate stock exchange (for exchange-traded securities), an analysis of the entity’s financial condition, and an evaluation of the forces that influence the issuer and the market(s) in which the security is purchased and sold.
B Investment Transactions and Related Income — Investment transactions for financial statement purposes are accounted for on a trade date basis. Realized gains and losses on investments sold are determined on the basis of identified cost. Interest income is recorded on the basis of interest accrued, adjusted for amortization of premium or accretion of discount.
C Federal Taxes — Each Fund’s policy is to comply with the provisions of the Internal Revenue Code applicable to regulated investment companies and to distribute to shareholders each year substantially all of its taxable, if any, and tax-exempt net investment income, and all or substantially all of its net realized capital gains. Accordingly, no provision for federal income or excise tax is necessary. Each Fund intends to satisfy conditions which will enable it to designate distributions from the interest income generated by its investments in non-taxable municipal securities, which are exempt from regular federal income tax when received by each Fund, as exempt-interest dividends. The portion of such interest, if any, earned on private activity bonds issued after August 7, 1986, may be considered a tax preference item to shareholders.
As of January 31, 2019, the Funds had no uncertain tax positions that would require financial statement recognition, de-recognition, or disclosure. Each Fund files a U.S. federal income tax return annually after its fiscal year-end, which is subject to examination by the Internal Revenue Service for a period of three years from the date of filing.
D Expenses — The majority of expenses of the Trust are directly identifiable to an individual fund. Expenses which are not readily identifiable to a specific fund are allocated taking into consideration, among other things, the nature and type of expense and the relative size of the funds.
E Legal Fees — Legal fees and other related expenses incurred as part of negotiations of the terms and requirement of capital infusions, or that are expected to result in the restructuring of, or a plan of reorganization for, an investment are recorded as realized losses. Ongoing expenditures to protect or enhance an investment are treated as operating expenses.
F Use of Estimates — The preparation of the financial statements in conformity with U.S. GAAP requires management to make estimates and assumptions that affect the reported amounts of assets and liabilities at the date of the financial statements and the reported amounts of income and expense during the reporting period. Actual results could differ from those estimates.
Eaton Vance
TABS Municipal Bond Funds
January 31, 2019
Notes to Financial Statements — continued
G Indemnifications — Under the Trust’s organizational documents, its officers and Trustees may be indemnified against certain liabilities and expenses arising out of the performance of their duties to the Funds. Under Massachusetts law, if certain conditions prevail, shareholders of a Massachusetts business trust (such as the Trust) could be deemed to have personal liability for the obligations of the Trust. However, the Trust’s Declaration of Trust contains an express disclaimer of liability on the part of Fund shareholders and the By-laws provide that the Trust shall assume the defense on behalf of any Fund shareholders. Moreover, the By-laws also provide for indemnification out of Fund property of any shareholder held personally liable solely by reason of being or having been a shareholder for all loss or expense arising from such liability. Additionally, in the normal course of business, each Fund enters into agreements with service providers that may contain indemnification clauses. Each Fund’s maximum exposure under these arrangements is unknown as this would involve future claims that may be made against each Fund that have not yet occurred.
H When-Issued Securities and Delayed Delivery Transactions — The Funds may purchase or sell securities on a delayed delivery or when-issued basis. Payment and delivery may take place after the customary settlement period for that security. At the time the transaction is negotiated, the price of the security that will be delivered is fixed. The Funds maintain cash and/or security positions for these commitments such that sufficient liquid assets will be available to make payments upon settlement. Securities purchased on a delayed delivery or when-issued basis are marked-to-market daily and begin earning interest on settlement date. Losses may arise due to changes in the market value of the underlying securities or if the counterparty does not perform under the contract.
2 Distributions to Shareholders and Income Tax Information
The net investment income of each Fund is determined daily and substantially all of the net investment income so determined is declared as a dividend to shareholders of record at the time of declaration. Distributions are declared separately for each class of shares. Distributions are paid monthly. Distributions of realized capital gains are made at least annually. Shareholders may reinvest income and capital gain distributions in additional shares of the same class of a Fund at the net asset value as of the reinvestment date or, at the election of the shareholder, receive distributions in cash. Distributions to shareholders are determined in accordance with income tax regulations, which may differ from U.S. GAAP. As required by U.S. GAAP, only distributions in excess of tax basis earnings and profits are reported in the financial statements as a return of capital. Permanent differences between book and tax accounting relating to distributions are reclassified to paid-in capital. For tax purposes, distributions from short-term capital gains are considered to be from ordinary income.
The tax character of distributions declared for the years ended January 31, 2019 and January 31, 2018 was as follows:
| | | | | | | | |
| | | Year Ended January 31, 2019 | |
| | | Short-Term
Municipal Bond Fund | | | Intermediate-Term
Municipal Bond
Fund | |
| | |
Tax-exempt income | | $ | 5,002,054 | | | $ | 10,018,552 | |
| | |
Ordinary income | | $ | 231,781 | | | $ | 60,392 | |
| | |
| | | | | | | | |
| | | Year Ended January 31, 2018 | |
| | | Short-Term
Municipal Bond Fund | | | Intermediate-Term
Municipal Bond
Fund | |
| | |
Tax-exempt income | | $ | 5,515,200 | | | $ | 9,506,428 | |
| | |
Ordinary income | | $ | 526,248 | | | $ | 349,296 | |
As of January 31, 2019, the components of distributable earnings (accumulated loss) on a tax basis were as follows:
| | | | | | | | |
| | | Short-Term
Municipal Bond Fund | | | Intermediate-Term
Municipal Bond
Fund | |
| | |
Undistributed tax-exempt income | | $ | 43,762 | | | $ | 479,445 | |
| | |
Deferred capital losses | | $ | (1,968,273 | ) | | $ | (3,907,056 | ) |
| | |
Net unrealized appreciation | | $ | 4,958,261 | | | $ | 14,657,512 | |
| | |
Distributions payable | | $ | (111,068 | ) | | $ | (493,904 | ) |
Eaton Vance
TABS Municipal Bond Funds
January 31, 2019
Notes to Financial Statements — continued
At January 31, 2019, the Funds, for federal income tax purposes, had deferred capital losses which would reduce the respective Fund’s taxable income arising from future net realized gains on investment transactions, if any, to the extent permitted by the Internal Revenue Code, and thus would reduce the amount of distributions to shareholders, which would otherwise be necessary to relieve the Funds of any liability for federal income or excise tax. The deferred capital losses are treated as arising on the first day of the Funds’ next taxable year and retain the same short-term or long-term character as when originally deferred. The amounts of the deferred capital losses are as follows:
| | | | | | | | |
| | | Short-Term
Municipal Bond Fund | | | Intermediate-Term
Municipal Bond
Fund | |
| | |
Deferred capital losses: | | | | | | | | |
| | |
Short-term | | $ | 1,571,781 | | | $ | 3,907,056 | |
| | |
Long-term | | $ | 396,492 | | | $ | — | |
The cost and unrealized appreciation (depreciation) of investments of each Fund at January 31, 2019, as determined on a federal income tax basis, were as follows:
| | | | | | | | |
| | | Short-Term
Municipal Bond Fund | | | Intermediate-Term
Municipal Bond
Fund | |
| | |
Aggregate cost | | $ | 298,254,914 | | | $ | 445,210,262 | |
| | |
Gross unrealized appreciation | | $ | 5,009,338 | | | $ | 14,691,404 | |
| | |
Gross unrealized depreciation | | | (51,077 | ) | | | (33,892 | ) |
| | |
Net unrealized appreciation | | $ | 4,958,261 | | | $ | 14,657,512 | |
3 Investment Adviser and Administration Fee and Other Transactions with Affiliates
The investment adviser and administration fee is earned by Eaton Vance Management (EVM) as compensation for investment advisory and administrative services rendered to each Fund. The fee is based upon a percentage of average daily net assets as presented in the following table and is payable monthly.
| | | | | | | | |
| | | Annual Asset Rate | |
| Daily Net Assets | | Short-Term
Municipal Bond Fund | | | Intermediate-Term
Municipal Bond
Fund | |
| | |
Up to $500 million | | | 0.55 | % | | | 0.60 | % |
| | |
$500 million up to $1 billion | | | 0.54 | % | | | 0.60 | % |
On average daily net assets of $1 billion or more, the rates are reduced. For the year ended January 31, 2019, investment adviser and administration fees incurred by the Funds and the effective annual rates, as a percentage of average daily net assets, were as follows:
| | | | | | | | |
| | | Short-Term
Municipal Bond Fund | | | Intermediate-Term
Municipal Bond
Fund | |
| | |
Investment Adviser and Administration Fee | | $ | 1,891,223 | | | $ | 2,862,557 | |
| | |
Effective Annual Rate | | | 0.55 | % | | | 0.60 | % |
Eaton Vance
TABS Municipal Bond Funds
January 31, 2019
Notes to Financial Statements — continued
For Intermediate-Term Municipal Bond Fund, EVM has agreed to reimburse the Fund’s expenses to the extent that total annual operating expenses (relating to ordinary operating expenses only) exceed 0.90%, 1.65% and 0.65% of the Fund’s average daily net assets for Class A, Class C and Class I, respectively. This agreement may be changed or terminated after May 31, 2019. Pursuant to this agreement, EVM was allocated $367,776 of Intermediate-Term Municipal Bond Fund’s operating expenses for the year ended January 31, 2019.
EVM provides sub-transfer agency and related services to the Funds pursuant to a Sub-Transfer Agency Support Services Agreement. Eaton Vance Distributors, Inc. (EVD), an affiliate of EVM and the Funds’ principal underwriter, received a portion of the sales charge on sales of Class A shares of the Funds. EVD also received distribution and service fees from Class A and Class C shares (see Note 4) and contingent deferred sales charges (see Note 5). Sub-transfer agent fees earned by EVM, which are included in transfer and dividend disbursing agent fees on the Statements of Operations, and Class A sales charges that the Funds were informed were received by EVD for the year ended January 31, 2019 were as follows:
| | | | | | | | |
| | | Short-Term
Municipal Bond Fund | | | Intermediate-Term
Municipal Bond
Fund | |
| | |
EVM’s Sub-Transfer Agent Fees | | $ | 5,833 | | | $ | 3,354 | |
| | |
EVD’s Class A Sales Charges | | $ | 811 | | | $ | 1,447 | |
Trustees and officers of the Funds who are members of EVM’s organization receive remuneration for their services to the Funds out of the investment adviser and administration fee. Trustees of the Funds who are not affiliated with EVM may elect to defer receipt of all or a percentage of their annual fees in accordance with the terms of the Trustees Deferred Compensation Plan. For the year ended January 31, 2019, no significant amounts have been deferred. Certain officers and Trustees of the Funds are officers of EVM.
4 Distribution Plans
Each Fund has in effect a distribution plan for Class A shares (Class A Plan) pursuant to Rule 12b-1 under the 1940 Act. Pursuant to the Class A Plan, each Fund pays EVD a distribution and service fee of 0.25% per annum of its average daily net assets attributable to Class A shares for distribution services and facilities provided to each Fund by EVD, as well as for personal services and/or the maintenance of shareholder accounts. Distribution and service fees paid or accrued to EVD for the year ended January 31, 2019 for Class A shares amounted to the following:
| | | | | | | | |
| | | Short-Term
Municipal Bond Fund | | | Intermediate-Term
Municipal Bond
Fund | |
| | |
Class A Distribution and Service Fees | | $ | 325,457 | | | $ | 110,750 | |
Each Fund also has in effect a distribution plan for Class C shares (Class C Plan) pursuant to Rule 12b-1 under the 1940 Act. Pursuant to the Class C Plan, each Fund pays EVD amounts equal to 0.75% per annum of its average daily net assets attributable to Class C shares for providing ongoing distribution services and facilities to the Funds. For the year ended January 31, 2019, the Funds paid or accrued to EVD the following distribution fees:
| | | | | | | | |
| | | Short-Term
Municipal Bond Fund | | | Intermediate-Term
Municipal Bond
Fund | |
| | |
Class C Distribution Fees | | $ | 328,508 | | | $ | 202,495 | |
Eaton Vance
TABS Municipal Bond Funds
January 31, 2019
Notes to Financial Statements — continued
Pursuant to the Class C Plan, the Funds also make payments of service fees to EVD, financial intermediaries and other persons in amounts equal to 0.25% per annum of the average daily net assets attributable to Class C shares. Service fees paid or accrued are for personal services and/or the maintenance of shareholder accounts. They are separate and distinct from the sales commissions and distribution fees payable to EVD. Service fees paid or accrued for the year ended January 31, 2019 amounted to the following:
| | | | | | | | |
| | | Short-Term
Municipal Bond Fund | | | Intermediate-Term
Municipal Bond
Fund | |
| | |
Class C Service Fees | | $ | 109,503 | | | $ | 67,498 | |
Distribution and service fees are subject to the limitations contained in the Financial Industry Regulatory Authority Rule 2341(d).
5 Contingent Deferred Sales Charges
A contingent deferred sales charge (CDSC) of 1% generally is imposed on redemptions of Class C shares made within one year of purchase. Class A shares of Intermediate-Term Municipal Bond Fund may be subject to a 1% CDSC if redeemed within eighteen months of purchase (depending on the circumstances of purchase). Generally, the CDSC is based upon the lower of the net asset value at date of redemption or date of purchase. No charge is levied on shares acquired by reinvestment of dividends or capital gain distributions. For the year ended January 31, 2019, the Funds were informed that EVD received approximately the following amounts of CDSCs paid by Class C shareholders and no CDSCs paid by Class A shareholders:
| | | | | | | | |
| | | Short-Term
Municipal Bond Fund | | | Intermediate-Term
Municipal Bond
Fund | |
| | |
Class C | | $ | 1,600 | | | $ | 2,000 | |
6 Purchases and Sales of Investments
Purchases and sales of investments, other than short-term obligations, for the year ended January 31, 2019 were as follows:
| | | | | | | | |
| | | Short-Term
Municipal Bond Fund | | | Intermediate-Term
Municipal Bond
Fund | |
| | |
Purchases | | $ | 226,175,297 | | | $ | 402,590,995 | |
| | |
Sales | | $ | 297,042,688 | | | $ | 415,391,099 | |
7 Shares of Beneficial Interest
Each Fund’s Declaration of Trust permits the Trustees to issue an unlimited number of full and fractional shares of beneficial interest (without par value). Such shares may be issued in a number of different series (such as the Funds) and classes. Transactions in Fund shares were as follows:
| | | | | | | | | | | | |
Short-Term Municipal Bond Fund | | | | | | | | | |
| | | Year Ended January 31, 2019 | |
| | | Class A | | | Class C | | | Class I | |
| | | |
Sales | | | 996,823 | | | | 184,904 | | | | 6,856,949 | |
| | | |
Issued to shareholders electing to receive payments of distributions in Fund shares | | | 163,559 | | | | 27,318 | | | | 201,173 | |
| | | |
Redemptions | | | (4,814,522 | ) | | | (1,702,951 | ) | | | (8,538,609 | ) |
| | | |
Converted from Class C shares | | | 106,835 | | | | — | | | | — | |
| | | |
Converted to Class A shares | | | — | | | | (107,123 | ) | | | — | |
| | | |
Net decrease | | | (3,547,305 | ) | | | (1,597,852 | ) | | | (1,480,487 | ) |
Eaton Vance
TABS Municipal Bond Funds
January 31, 2019
Notes to Financial Statements — continued
| | | | | | | | | | | | |
| | | Year Ended January 31, 2018 | |
| | | Class A | | | Class C | | | Class I | |
| | | |
Sales | | | 2,072,785 | | | | 228,419 | | | | 6,190,310 | |
| | | |
Issued to shareholders electing to receive payments of distributions in Fund shares | | | 200,298 | | | | 32,369 | | | | 232,921 | |
| | | |
Redemptions | | | (7,020,764 | ) | | | (1,921,389 | ) | | | (8,722,242 | ) |
| | | |
Net decrease | | | (4,747,681 | ) | | | (1,660,601 | ) | | | (2,299,011 | ) |
| | | |
Intermediate-Term Municipal Bond Fund | | | | | | | | | |
| | | Year Ended January 31, 2019 | |
| | | Class A | | | Class C | | | Class I | |
| | | |
Sales | | | 355,900 | | | | 164,304 | | | | 11,656,386 | |
| | | |
Issued to shareholders electing to receive payments of distributions in Fund shares | | | 43,777 | | | | 11,957 | | | | 287,558 | |
| | | |
Redemptions | | | (977,358 | ) | | | (486,470 | ) | | | (13,446,326 | ) |
| | | |
Converted from Class C shares | | | 89,315 | | | | — | | | | — | |
| | | |
Converted to Class A shares | | | — | | | | (89,376 | ) | | | — | |
| | | |
Net decrease | | | (488,366 | ) | | | (399,585 | ) | | | (1,502,382 | ) |
| |
| | | Year Ended January 31, 2018 | |
| | | Class A | | | Class C | | | Class I | |
| | | |
Sales | | | 785,707 | | | | 340,700 | | | | 11,786,693 | |
| | | |
Issued to shareholders electing to receive payments of distributions in Fund shares | | | 50,528 | | | | 13,353 | | | | 271,605 | |
| | | |
Redemptions | | | (1,595,426 | ) | | | (846,024 | ) | | | (14,114,765 | ) |
| | | |
Net decrease | | | (759,191 | ) | | | (491,971 | ) | | | (2,056,467 | ) |
8 Line of Credit
The Funds participate with other portfolios and funds managed by EVM and its affiliates in a $625 million unsecured line of credit agreement with a group of banks, which is in effect through October 29, 2019. Borrowings are made by the Funds solely to facilitate the handling of unusual and/or unanticipated short-term cash requirements. Interest is charged to each Fund based on its borrowings at an amount above either the Eurodollar rate or Federal Funds rate. In addition, a fee computed at an annual rate of 0.15% on the daily unused portion of the line of credit is allocated among the participating portfolios and funds at the end of each quarter. Because the line of credit is not available exclusively to the Funds, a Fund may be unable to borrow some or all of its requested amounts at any particular time. The Funds did not have any significant borrowings or allocated fees during the year ended January 31, 2019.
9 Fair Value Measurements
Under generally accepted accounting principles for fair value measurements, a three-tier hierarchy to prioritize the assumptions, referred to as inputs, is used in valuation techniques to measure fair value. The three-tier hierarchy of inputs is summarized in the three broad levels listed below.
| • | | Level 1 – quoted prices in active markets for identical investments |
| • | | Level 2 – other significant observable inputs (including quoted prices for similar investments, interest rates, prepayment speeds, credit risk, etc.) |
| • | | Level 3 – significant unobservable inputs (including a fund’s own assumptions in determining the fair value of investments) |
In cases where the inputs used to measure fair value fall in different levels of the fair value hierarchy, the level disclosed is determined based on the lowest level input that is significant to the fair value measurement in its entirety. The inputs or methodology used for valuing securities are not necessarily an indication of the risk associated with investing in those securities.
Eaton Vance
TABS Municipal Bond Funds
January 31, 2019
Notes to Financial Statements — continued
At January 31, 2019, the hierarchy of inputs used in valuing the Funds’ investments, which are carried at value, were as follows:
| | | | | | | | | | | | | | | | |
Short-Term Municipal Bond Fund | | | | | | | | | | | | |
| Asset Description | | Level 1 | | | Level 2 | | | Level 3 | | | Total | |
| | | | |
Tax-Exempt Municipal Securities | | $ | — | | | $ | 300,656,583 | | | $ | — | | | $ | 300,656,583 | |
| | | | |
Taxable Municipal Securities | | | — | | | | 2,556,592 | | | | — | | | | 2,556,592 | |
| | | | |
Total Investments | | $ | — | | | $ | 303,213,175 | | | $ | — | | | $ | 303,213,175 | |
| | | | |
Intermediate-Term Municipal Bond Fund | | | | | | | | | | | | |
| Asset Description | | Level 1 | | | Level 2 | | | Level 3 | | | Total | |
| | | | |
Tax-Exempt Municipal Securities | | $ | — | | | $ | 458,700,146 | | | $ | — | | | $ | 458,700,146 | |
| | | | |
Taxable Municipal Securities | | | — | | | | 1,167,628 | | | | — | | | | 1,167,628 | |
| | | | |
Total Investments | | $ | — | | | $ | 459,867,774 | | | $ | — | | | $ | 459,867,774 | |
Eaton Vance
TABS Municipal Bond Funds
January 31, 2019
Report of Independent Registered Public Accounting Firm
To the Trustees of Eaton Vance Municipals Trust II and Shareholders of Eaton Vance TABS Short-Term Municipal Bond Fund and Eaton Vance TABS Intermediate-Term Municipal Bond Fund:
Opinion on the Financial Statements and Financial Highlights
We have audited the accompanying statements of assets and liabilities of Eaton Vance TABS Short-Term Municipal Bond Fund and Eaton Vance TABS Intermediate-Term Municipal Bond Fund (collectively, the “Funds”) (certain of the funds constituting Eaton Vance Municipals Trust II), including the portfolios of investments, as of January 31, 2019, the related statements of operations for the year then ended, the statements of changes in net assets for each of the two years in the period then ended, the financial highlights for each of the five years in the period then ended, and the related notes. In our opinion, the financial statements and financial highlights present fairly, in all material respects, the financial position of the Funds as of January 31, 2019, and the results of their operations for the year then ended, the changes in their net assets for each of the two years in the period then ended, and the financial highlights for each of the five years in the period then ended, in conformity with accounting principles generally accepted in the United States of America.
Basis for Opinion
These financial statements and financial highlights are the responsibility of the Funds’ management. Our responsibility is to express an opinion on the Funds’ financial statements and financial highlights based on our audits. We are a public accounting firm registered with the Public Company Accounting Oversight Board (United States) (PCAOB) and are required to be independent with respect to the Funds in accordance with the U.S. federal securities laws and the applicable rules and regulations of the Securities and Exchange Commission and the PCAOB.
We conducted our audits in accordance with the standards of the PCAOB. Those standards require that we plan and perform the audits to obtain reasonable assurance about whether the financial statements and financial highlights are free of material misstatement, whether due to error or fraud. The Funds are not required to have, nor were we engaged to perform, an audit of their internal control over financial reporting. As part of our audits we are required to obtain an understanding of internal control over financial reporting but not for the purpose of expressing an opinion on the effectiveness of the Funds’ internal control over financial reporting. Accordingly, we express no such opinion.
Our audits included performing procedures to assess the risks of material misstatement of the financial statements and financial highlights, whether due to error or fraud, and performing procedures that respond to those risks. Such procedures included examining, on a test basis, evidence regarding the amounts and disclosures in the financial statements and financial highlights. Our audits also included evaluating the accounting principles used and significant estimates made by management, as well as evaluating the overall presentation of the financial statements and financial highlights. Our procedures included confirmation of securities owned as of January 31, 2019, by correspondence with the custodian and brokers; when replies were not received from brokers, we performed other auditing procedures. We believe that our audits provide a reasonable basis for our opinion.
/s/ Deloitte & Touche LLP
Boston, Massachusetts
March 21, 2019
We have served as the auditor of one or more Eaton Vance investment companies since 1959.
Eaton Vance
TABS Municipal Bond Funds
January 31, 2019
Federal Tax Information (Unaudited)
The Form 1099-DIV you receive in February 2020 will show the tax status of all distributions paid to your account in calendar year 2019. Shareholders are advised to consult their own tax adviser with respect to the tax consequences of their investment in the Funds. As required by the Internal Revenue Code and/or regulations, shareholders must be notified regarding exempt-interest dividends.
Exempt-Interest Dividends. For the fiscal year ended January 31, 2019, the Funds designate the following percentages of distributions from net investment income as exempt-interest dividends:
| | | | |
| |
TABS Short-Term Municipal Bond Fund | | | 95.57 | % |
| |
TABS Intermediate-Term Municipal Bond Fund | | | 99.40 | % |
Eaton Vance
TABS Municipal Bond Funds
January 31, 2019
Special Meeting of Shareholders (Unaudited)
Each Fund held a Special Meeting of Shareholders on September 20, 2018 to elect the five Trustees listed below. The other Trustees named herein continue to serve as Trustees. The results of the vote with respect to each Fund were as follows:
Eaton Vance TABS Short-Term Municipal Bond Fund
| | | | | | | | |
| | | Number of Shares | |
| Nominee for Trustee | | For | | | Withheld | |
| | |
Mark R. Fetting | | | 30,123,686 | | | | 585,642 | |
| | |
Keith Quinton | | | 30,124,215 | | | | 585,113 | |
| | |
Marcus L. Smith | | | 30,120,253 | | | | 589,074 | |
| | |
Susan J. Sutherland | | | 30,437,515 | | | | 271,812 | |
| | |
Scott E. Wennerholm | | | 30,123,686 | | | | 585,642 | |
| | |
Eaton Vance TABS Intermediate-Term Municipal Bond Fund | | | | | | |
| | | Number of Shares | |
| Nominee for Trustee | | For | | | Withheld | |
| | |
Mark R. Fetting | | | 38,512,188 | | | | 74,325 | |
| | |
Keith Quinton | | | 38,512,188 | | | | 74,325 | |
| | |
Marcus L. Smith | | | 38,512,188 | | | | 74,325 | |
| | |
Susan J. Sutherland | | | 38,513,972 | | | | 72,541 | |
| | |
Scott E. Wennerholm | | | 38,512,188 | | | | 74,325 | |
Results are rounded to the nearest whole number.
Eaton Vance
TABS Municipal Bond Funds
January 31, 2019
Management and Organization
Fund Management. The Trustees of Eaton Vance Municipals Trust II (the Trust) are responsible for the overall management and supervision of the Trust’s affairs. The Trustees and officers of the Trust are listed below. Except as indicated, each individual has held the office shown or other offices in the same company for the last five years. Trustees and officers of the Trust hold indefinite terms of office. The “noninterested Trustees” consist of those Trustees who are not “interested persons” of the Trust, as that term is defined under the 1940 Act. The business address of each Trustee and officer is Two International Place, Boston, Massachusetts 02110. As used below, “EVC” refers to Eaton Vance Corp., “EV” refers to Eaton Vance, Inc., “EVM” refers to Eaton Vance Management, “BMR” refers to Boston Management and Research and “EVD” refers to Eaton Vance Distributors, Inc. EVC and EV are the corporate parent and trustee, respectively, of EVM and BMR. EVD is the Funds’ principal underwriter and a wholly-owned subsidiary of EVC. Each officer affiliated with Eaton Vance may hold a position with other Eaton Vance affiliates that is comparable to his or her position with EVM listed below. Each Trustee oversees 175 portfolios in the Eaton Vance Complex (including all master and feeder funds in a master feeder structure). Each officer serves as an officer of certain other Eaton Vance funds. Each Trustee and officer serves until his or her successor is elected.
| | | | | | |
| Name and Year of Birth | | Position(s) with the Trust | | Trustee Since(1) | | Principal Occupation(s) and Directorships During Past Five Years and Other Relevant Experience |
| | |
| Interested Trustee | | | | |
| | | |
Thomas E. Faust Jr. 1958 | | Trustee | | 2007 | | Chairman, Chief Executive Officer and President of EVC, Director and President of EV, Chief Executive Officer and President of EVM and BMR, and Director of EVD. Trustee and/or officer of 175 registered investment companies. Mr. Faust is an interested person because of his positions with EVM, BMR, EVD, EVC and EV, which are affiliates of the Trust. Directorships in the Last Five Years.(2) Director of EVC and Hexavest Inc. (investment management firm). |
|
| Noninterested Trustees |
| | | |
Mark R. Fetting 1954 | | Trustee | | 2011 | | Private investor. Formerly held various positions at Legg Mason, Inc. (investment management firm) (2000-2012), including President, Chief Executive Officer, Director and Chairman (2008-2012), Senior Executive Vice President(2004-2008) and Executive Vice President (2001-2004). Formerly, President of Legg Mason family of funds (2001-2008). Formerly, Division President and Senior Officer of Prudential Financial Group, Inc. and related companies (investment management firm) (1991-2000). Directorships in the Last Five Years. None. |
| | | |
Cynthia E. Frost 1961 | | Trustee | | 2014 | | Private investor. Formerly, Chief Investment Officer of Brown University (university endowment) (2000-2012). Formerly, Portfolio Strategist for Duke Management Company (university endowment manager) (1995-2000). Formerly, Managing Director, Cambridge Associates (investment consulting company) (1989-1995). Formerly, Consultant, Bain and Company (management consulting firm)(1987-1989). Formerly, Senior Equity Analyst, BA Investment Management Company (1983-1985). Directorships in the Last Five Years. None. |
| | | |
George J. Gorman 1952 | | Trustee | | 2014 | | Principal at George J. Gorman LLC (consulting firm). Formerly, Senior Partner at Ernst & Young LLP (a registered public accounting firm) (1974-2009). Directorships in the Last Five Years. Formerly, Trustee of the BofA Funds Series Trust (11 funds) (2011-2014) and of the Ashmore Funds (9 funds) (2010-2014). |
| | | |
Valerie A. Mosley 1960 | | Trustee | | 2014 | | Chairwoman and Chief Executive Officer of Valmo Ventures (a consulting and investment firm). Former Partner and Senior Vice President, Portfolio Manager and Investment Strategist at Wellington Management Company, LLP (investment management firm) (1992-2012). Former Chief Investment Officer, PG Corbin Asset Management (1990-1992). Formerly worked in institutional corporate bond sales at Kidder Peabody (1986-1990). Directorships in the Last Five Years.(2) Director of Envestnet, Inc. (provider of intelligent systems for wealth management and financial wellness) (since 2018). |
Eaton Vance
TABS Municipal Bond Funds
January 31, 2019
Management and Organization — continued
| | | | | | |
| Name and Year of Birth | | Position(s) with the Trust | | Trustee Since(1) | | Principal Occupation(s) and Directorships During Past Five Years and Other Relevant Experience |
| | |
| Noninterested Trustee (continued) | | | | |
| | | |
William H. Park 1947 | | Chairperson of the Board and Trustee | | 2016 (Chairperson) 2003 (Trustee) | | Private investor. Formerly, Consultant (management and transactional)(2012-2014). Formerly, Chief Financial Officer, Aveon Group L.P. (investment management firm) (2010-2011). Formerly, Vice Chairman, Commercial Industrial Finance Corp. (specialty finance company) (2006-2010). Formerly, President and Chief Executive Officer, Prizm Capital Management, LLC (investment management firm) (2002-2005). Formerly, Executive Vice President and Chief Financial Officer, United Asset Management Corporation (investment management firm) (1982-2001). Formerly, Senior Manager, Price Waterhouse (now PricewaterhouseCoopers) (a registered public accounting firm) (1972-1981). Directorships in the Last Five Years.(2)None. |
| | | |
Helen Frame Peters 1948 | | Trustee | | 2008 | | Professor of Finance, Carroll School of Management, Boston College. Formerly, Dean, Carroll School of Management, Boston College (2000-2002). Formerly, Chief Investment Officer, Fixed Income, Scudder Kemper Investments (investment management firm) (1998-1999). Formerly, Chief Investment Officer, Equity and Fixed Income, Colonial Management Associates (investment management firm) (1991-1998). Directorships in the Last Five Years.(2) None. |
| | | |
Keith Quinton(3) 1958 | | Trustee | | 2018 | | Independent Investment Committee Member at New Hampshire Retirement System (since 2017). Advisory Committee member at Northfield Information Services, Inc. (risk management analytics provider) (since 2016). Formerly, Portfolio Manager and Senior Quantitative Analyst at Fidelity Investments (investment management firm) (2001-2014). Directorships in the Last Five Years. Director of New Hampshire Municipal Bond Bank (since 2016). |
| | | |
Marcus L. Smith(3) 1966 | | Trustee | | 2018 | | Member of Posse Boston Advisory Board (foundation) (since 2015); Trustee at University of Mount Union (since 2008). Formerly, Portfolio Manager at MFS Investment Management (investment management firm) (1994-2017). Directorships in the Last Five Years. Director of MSCI Inc. (global provider of investment decision support tools) (since 2017). Director of DCT Industrial Trust Inc. (logistics real estate company) (since 2017). |
| | | |
Susan J. Sutherland 1957 | | Trustee | | 2015 | | Private investor. Formerly, Associate, Counsel and Partner at Skadden, Arps, Slate, Meagher & Flom LLP (law firm) (1982-2013). Directorships in the Last Five Years. Formerly, Director of Montpelier Re Holdings Ltd. (global provider of customized insurance and reinsurance products)(2013-2015). |
| | | |
Scott E. Wennerholm 1959 | | Trustee | | 2016 | | Formerly, Trustee at Wheelock College (postsecondary institution) (2012-2018). Formerly, Consultant at GF Parish Group (executive recruiting firm) (2016-2017). Formerly, Chief Operating Officer and Executive Vice President at BNY Mellon Asset Management (investment management firm) (2005-2011). Formerly, Chief Operating Officer and Chief Financial Officer at Natixis Global Asset Management (investment management firm) (1997-2004). Formerly, Vice President at Fidelity Investments Institutional Services (investment management firm) (1994-1997). Directorships in the Last Five Years. None. |
Eaton Vance
TABS Municipal Bond Funds
January 31, 2019
Management and Organization — continued
| | | | | | |
| Name and Year of Birth | | Position(s) with the Trust | | Officer
Since(4) | | Principal Occupation(s) During Past Five Years |
|
| Principal Officers who are not Trustees |
| | | |
Payson F. Swaffield 1956 | | President | | 2003 | | Vice President and Chief Income Investment Officer of EVM and BMR. Also Vice President of Calvert Research and Management (“CRM”). |
| | | |
Maureen A. Gemma 1960 | | Vice President, Secretary and Chief Legal Officer | | 2005 | | Vice President of EVM and BMR. Also Vice President and officer of CRM. |
| | | |
James F. Kirchner 1967 | | Treasurer | | 2007 | | Vice President of EVM and BMR. Also Vice President and officer of CRM. |
| | | |
Richard F. Froio 1968 | | Chief Compliance Officer | | 2017 | | Vice President of EVM and BMR since 2017. Formerly Deputy Chief Compliance Officer (Adviser/Funds) and Chief Compliance Officer (Distribution) at PIMCO (2012-2017) and Managing Director at BlackRock/Barclays Global Investors (2009-2012). |
| (1) | Year first appointed to serve as Trustee for a fund in the Eaton Vance family of funds. Each Trustee has served continuously since appointment unless indicated otherwise. |
| (2) | During their respective tenures, the Trustees (except for Mmes. Frost and Sutherland and Messrs. Fetting, Gorman, Quinton, Smith and Wennerholm) also served as Board members of one or more of the following funds (which operated in the years noted): eUnitsTM 2 Year U.S. Market Participation Trust: Upside to Cap / Buffered Downside (launched in 2012 and terminated in 2014); and eUnitsTM 2 Year U.S. Market Participation Trust II: Upside to Cap / Buffered Downside (launched in 2012 and terminated in 2014). However, Ms. Mosley did not serve as a Board member of eUnitsTM 2 Year U.S. Market Participation Trust: Upside to Cap / Buffered Downside (launched in 2012 and terminated in 2014). |
| (3) | Messrs. Quinton and Smith began serving as Trustees effective October 1, 2018. |
| (4) | Year first elected to serve as officer of a fund in the Eaton Vance family of funds when the officer has served continuously. Otherwise, year of most recent election as an officer of a fund in the Eaton Vance family of funds. Titles may have changed since initial election. |
The SAI for the Funds includes additional information about the Trustees and officers of the Funds and can be obtained without charge on Eaton Vance’s website at www.eatonvance.com or by calling 1-800-262-1122.
Eaton Vance Funds
IMPORTANT NOTICES
Privacy. The Eaton Vance organization is committed to ensuring your financial privacy. Each of the financial institutions identified below has in effect the following policy (“Privacy Policy”) with respect to nonpublic personal information about its customers:
| • | | Only such information received from you, through application forms or otherwise, and information about your Eaton Vance fund transactions will be collected. This may include information such as name, address, social security number, tax status, account balances and transactions. |
| • | | None of such information about you (or former customers) will be disclosed to anyone, except as permitted by law (which includes disclosure to employees necessary to service your account). In the normal course of servicing a customer’s account, Eaton Vance may share information with unaffiliated third parties that perform various required services such as transfer agents, custodians and broker-dealers. |
| • | | Policies and procedures (including physical, electronic and procedural safeguards) are in place that are designed to protect the confidentiality of such information. |
| • | | We reserve the right to change our Privacy Policy at any time upon proper notification to you. Customers may want to review our Privacy Policy periodically for changes by accessing the link on our homepage: www.eatonvance.com. |
Our pledge of privacy applies to the following entities within the Eaton Vance organization: the Eaton Vance Family of Funds, Eaton Vance Management, Eaton Vance Investment Counsel, Eaton Vance Distributors, Inc., Eaton Vance Trust Company, Eaton Vance Management (International) Limited, Eaton Vance Advisers International Ltd., Eaton Vance Management’s Real Estate Investment Group and Boston Management and Research. In addition, our Privacy Policy applies only to those Eaton Vance customers who are individuals and who have a direct relationship with us. If a customer’s account (i.e., fund shares) is held in the name of a third-party financial advisor/broker-dealer, it is likely that only such advisor’s privacy policies apply to the customer. This notice supersedes all previously issued privacy disclosures. For more information about Eaton Vance’s Privacy Policy, please call 1-800-262-1122.
Delivery of Shareholder Documents. The Securities and Exchange Commission (SEC) permits funds to deliver only one copy of shareholder documents, including prospectuses, proxy statements and shareholder reports, to fund investors with multiple accounts at the same residential or post office box address. This practice is often called “householding” and it helps eliminate duplicate mailings to shareholders.Eaton Vance, or your financial advisor, may household the mailing of your documents indefinitely unless you instruct Eaton Vance, or your financial advisor, otherwise.If you would prefer that your Eaton Vance documents not be householded, please contact Eaton Vance at 1-800-262-1122, or contact your financial advisor. Your instructions that householding not apply to delivery of your Eaton Vance documents will typically be effective within 30 days of receipt by Eaton Vance or your financial advisor.
Portfolio Holdings. Each Eaton Vance Fund and its underlying Portfolio(s) (if applicable) will file a schedule of portfolio holdings on Form N-Q with the SEC for the first and third quarters of each fiscal year. The Form N-Q will be available on the Eaton Vance website at www.eatonvance.com, by calling Eaton Vance at 1-800-262-1122 or in the EDGAR database on the SEC’s website at www.sec.gov. Form N-Q may also be reviewed and copied at the SEC’s public reference room in Washington, D.C. (call 1-800-732-0330 for information on the operation of the public reference room).
Proxy Voting. From time to time, funds are required to vote proxies related to the securities held by the funds. The Eaton Vance Funds or their underlying Portfolios (if applicable) vote proxies according to a set of policies and procedures approved by the Funds’ and Portfolios’ Boards. You may obtain a description of these policies and procedures and information on how the Funds or Portfolios voted proxies relating to portfolio securities during the most recent 12-month period ended June 30, without charge, upon request, by calling 1-800-262-1122 and by accessing the SEC’s website at www.sec.gov.
This Page Intentionally Left Blank
This Page Intentionally Left Blank
Investment Adviser and Administrator
Eaton Vance Management
Two International Place
Boston, MA 02110
Principal Underwriter*
Eaton Vance Distributors, Inc.
Two International Place
Boston, MA 02110
(617) 482-8260
Custodian
State Street Bank and Trust Company
State Street Financial Center, One Lincoln Street
Boston, MA 02111
Transfer Agent
BNY Mellon Investment Servicing (US) Inc.
Attn: Eaton Vance Funds
P.O. Box 9653
Providence, RI 02940-9653
(800) 262-1122
Independent Registered Public Accounting Firm
Deloitte & Touche LLP
200 Berkeley Street
Boston, MA 02116-5022
Fund Offices
Two International Place
Boston, MA 02110
| * | FINRA BrokerCheck. Investors may check the background of their Investment Professional by contacting the Financial Industry Regulatory Authority (FINRA). FINRA BrokerCheck is a free tool to help investors check the professional background of current and former FINRA-registered securities firms and brokers. FINRA BrokerCheck is available by calling 1-800-289-9999 and at www.FINRA.org. The FINRA BrokerCheck brochure describing this program is available to investors at www.FINRA.org. |

6096 1.31.19

Eaton Vance
TABS Laddered Municipal Bond Funds
Annual Report
January 31, 2019
Important Note. Beginning on January 1, 2021, as permitted by regulations adopted by the Securities and Exchange Commission, paper copies of each Fund’s annual and semi-annual shareholder reports will no longer be sent by mail unless you specifically request paper copies of the reports. Instead, the reports will be made available on the Funds’ website (eatonvance.com/funddocuments), and you will be notified by mail each time a report is posted and provided with a website address to access the report.
If you already elected to receive shareholder reports electronically, you will not be affected by this change and you need not take any action. If you are a direct investor, you may elect to receive shareholder reports and other communications from the Funds electronically by signing up for e-Delivery at eatonvance.com/edelivery. If you own your shares through a financial intermediary (such as a broker-dealer or bank), you must contact your financial intermediary to sign up.
You may elect to receive all future Fund shareholder reports in paper free of charge. If you are a direct investor, you can inform the Funds that you wish to continue receiving paper copies of your shareholder reports by calling 1-800-262-1122. If you own these shares through a financial intermediary, you must contact your financial intermediary or follow instructions included with this disclosure, if applicable, to elect to continue to receive paper copies of your shareholder reports. Your election to receive reports in paper will apply to all Eaton Vance funds held directly or to all funds held through your financial intermediary, as applicable.

Commodity Futures Trading Commission Registration. Effective December 31, 2012, the Commodity Futures Trading Commission (“CFTC”) adopted certain regulatory changes that subject registered investment companies and advisers to regulation by the CFTC if a fund invests more than a prescribed level of its assets in certain CFTC-regulated instruments (including futures, certain options and swap agreements) or markets itself as providing investment exposure to such instruments. Each Fund has claimed an exclusion from the definition of the term “commodity pool operator” under the Commodity Exchange Act. Accordingly, neither the Funds nor the adviser with respect to the operation of the Funds is subject to CFTC regulation. Because of its management of other strategies, each Fund’s adviser is registered with the CFTC as a commodity pool operator and a commodity trading advisor.
Fund shares are not insured by the FDIC and are not deposits or other obligations of, or guaranteed by, any depository institution. Shares are subject to investment risks, including possible loss of principal invested.
This report must be preceded or accompanied by a current summary prospectus or prospectus. Before investing, investors should consider carefully the investment objective, risks, and charges and expenses of a mutual fund. This and other important information is contained in the summary prospectus and prospectus, which can be obtained from a financial advisor. Prospective investors should read the prospectus carefully before investing. For further information, please call 1-800-262-1122.
Annual Report January 31, 2019
Eaton Vance
TABS Laddered Municipal Bond Funds
Table of Contents
| | | | |
Management’s Discussion of Fund Performance | | | 2 | |
| |
Performance and Fund Profile | | | | |
| |
| | | | |
TABS1-to-10 Year Laddered Municipal Bond Fund | | | 4 | |
TABS10-to-20 Year Laddered Municipal Bond Fund | | | 6 | |
| |
| | | | |
| |
Endnotes and Additional Disclosures | | | 8 | |
| |
Fund Expenses | | | 9 | |
| |
Financial Statements | | | 11 | |
| |
Report of Independent Registered Public Accounting Firm | | | 35 | |
| |
Federal Tax Information | | | 36 | |
| |
Special Meeting of Shareholders | | | 37 | |
| |
Management and Organization | | | 38 | |
| |
Important Notices | | | 41 | |
Eaton Vance
TABS Laddered Municipal Bond Funds
January 31, 2019
Management’s Discussion of Fund Performance1
Economic and Market Conditions
The12-month period ended January 31, 2019, was positive for the municipal bond market, with the Bloomberg Barclays Municipal Bond Index,2 a broad measure of the asset class, returning 3.26%.
Bond performance, however, varied considerably across the AAA6 municipal yield curve.8 During the period, rates rose and bond prices fell in the 0–2 year and 19–30 year areas of the curve. But rates declined in the 3–18 year segment of the curve, with the largest declines — and the strongest bond price performance — occurring in the 10–12 year part of the curve. As a result, the front end of the municipal yield curve — 1–9 years — generally flattened while the back end — 10–30 years — steepened. In addition, lower-rated bonds generally outperformed higher-rated issues during the period. Municipal bonds outperformed comparable U.S. Treasurys in the 1–10 year area of the yield curve, while Treasurys outperformed municipals across the remainder of the curve.
As the period opened in February 2018, signs of increasing inflation, higher wage growth and fears that recent tax legislation might overheat the economy were pushing interest rates up and bond prices down. Upward pressure onshort-term rates continued in March and June 2018 as the U.S. Federal Reserve Board (the Fed) delivered its first two rate hikes of the year. At the long end of the curve, however, fluctuating perceptions of geopolitical risk were a primary driver of rates from April through the end of August 2018. Investors toggled between concern that the U.S. was initiating a global trade war and optimism about economic growth and a potential detente between the U.S. and North Korea.
In September 2018, the Fed hiked the federal funds rate again, which pushed up both U.S. Treasury and municipal rates across the curve. In October 2018, a strong U.S. employment report and easing concerns about Italy’s national budget crisis continued the upward pressure on longer-term rates. But as 2018 came to a close, investors became increasingly concerned about a trade war with China, a potential government shutdown and dovish comments by the Fed that led the futures market to project the possibility of no further rate hikes in 2019. The result was a “flight to quality” by bond investors that pushed longer-term bond prices up and rates down in December 2018.
The first month of 2019, in contrast, was relatively quiet for bonds. As investors waited to see the outcome of the longest-ever U.S. government shutdown, municipal interest rates were virtually unchanged in January.
Fund Performance
For the12-month period ended January 31, 2019, Eaton Vance TABS1-to-10 Year Laddered Municipal Bond Fund returned 2.26% for Class A shares at net asset value (NAV), underperforming its benchmark, the Bloomberg BarclaysShort-Intermediate 1–10 Year Municipal Bond Index, which returned 2.94%.
For the12-month period ended January 31, 2019, Eaton Vance TABS10-to-20 Year Laddered Municipal Bond Fund returned 3.30% for Class A shares at NAV, underperforming its benchmark, the Bloomberg Barclays 15 Year Municipal Bond Index, which returned 4.07%. The Indexes are unmanaged and returns do not reflect any applicable sales charges, commissions, or expenses.
Each of the TABS Laddered Municipal Bond Funds provides rules-based, approximately equal-weighted exposure across its respective portion of the yield curve, with the objective of seeking current income exempt from regular federal income tax. Management seeks to add incremental return through active security selection andin-depth credit analysis.
During the period, yield curve positioning detracted from relative performance for both TABS Laddered Municipal Bond Funds versus their respective benchmarks. Security selection was the largest contributor to the relative performance of both Funds. Duration7 positioning also helped the relative performance of both Funds during the period.
Fund-specific Results
For Eaton Vance TABS1-to-10 Year Laddered Municipal Bond Fund, yield curve positioning detracted from Fund performance versus its benchmark during the period. Due to its equal-weighted, laddered strategy, the Fund had approximately 10% of its holdings in bonds with 0–1 year remaining to maturity, an area of the yield curve not represented in its benchmark. As rates rose and bond prices declined in that part of the curve during the period, the Fund’s holdings in that area modestly hurt Fund performance relative to its benchmark.
See Endnotes and Additional Disclosures in this report.
Past performance is no guarantee of future results. Returns are historical and are calculated by determining the percentage change in net asset value (NAV) or offering price (as applicable) with all distributions reinvested. Investment return and principal value will fluctuate so that shares, when redeemed, may be worth more or less than their original cost. Performance less than or equal to one year is cumulative. Performance is for the stated time period only; due to market volatility, the Fund’s current performance may be lower or higher than quoted. Returns are before taxes unless otherwise noted. For performance as of the most recentmonth-end, please refer to eatonvance.com.
Eaton Vance
TABS Laddered Municipal Bond Funds
January 31, 2019
Management’s Discussion of Fund Performance1 —continued
Fund-specific Results —continued
In contrast, security selection, duration, and credit quality contributed to Fund performance versus its benchmark. With regard to security selection, active selection of individual bonds based on fundamental credit research was the largest single contributor to Fund performance relative to its benchmark.
The Fund had an overall longer duration than its benchmark and a greater sensitivity to interest rate changes during the period. This also helped relative performance by causing the Fund to benefit more than its benchmark as rates fell and bond prices rose for bonds with 3–10 years remaining to maturity, which accounted for a majority of the Fund’s holdings. The Fund’s lower average credit quality, compared with its benchmark, contributed to relative performance as well because lower-rated bonds generally outperformed higher-rated issues during the period. The Fund was overweight versus its benchmark in lower-quality, better-performing A- and BBB- rated bonds and underweight in lower-performing, higher-quality AAA- andAA- rated bonds.
For Eaton Vance TABS10-to-20 Year Laddered Municipal Bond Fund, yield curve positioning detracted from Fund performance versus its benchmark. The Fund was approximately equally weighted throughout the 10–20 year part of the curve, whereas its benchmark held only bonds with maturities between 12–17 years. As the 10–20 year area of the curve steepened during the period, the worst performance occurred toward the 20–year part of the curve, which saw the largest rate increases and bond price declines. Thus, the Fund’s exposure to bonds with 18–20 years remaining to maturity, which were not represented in its benchmark, detracted from Fund performance versus its benchmark.
In contrast, security selection and duration contributed to Fund performance versus its benchmark. Active selection of individual bonds based on fundamental credit research was the largest single contributor to relative results. The Fund also had a longer duration than its benchmark during the period. This helped the Fund benefit more than its benchmark as interest rates fell and bond prices rose for bonds with 10–17 years remaining to maturity, which accounted for a majority of the Fund’s holdings. However, interest rates rose and bond prices fell for bonds with 18–20 year maturities.
See Endnotes and Additional Disclosures in this report.
Past performance is no guarantee of future results. Returns are historical and are calculated by determining the percentage change in net asset value (NAV) or offering price (as applicable) with all distributions reinvested. Investment return and principal value will fluctuate so that shares, when redeemed, may be worth more or less than their original cost. Performance less than or equal to one year is cumulative. Performance is for the stated time period only; due to market volatility, the Fund’s current performance may be lower or higher than quoted. Returns are before taxes unless otherwise noted. For performance as of the most recent month-end, please refer to eatonvance.com.
Eaton Vance
TABS1-to-10 Year Laddered Municipal Bond Fund
January 31, 2019
Performance2,3
Portfolio ManagersJames H. Evans, CFA, Brian C. Barney, CFA and Christopher J. Harshman, CFA
| | | | | | | | | | | | | | | | | | | | |
| % Average Annual Total Returns | | Class Inception Date | | | Performance Inception Date | | | One Year | | | Five Years | | | Since Inception | |
Class A at NAV | | | 05/04/2015 | | | | 05/04/2015 | | | | 2.26 | % | | | — | | | | 1.89 | % |
Class A with 4.75% Maximum Sales Charge | | | — | | | | — | | | | –2.62 | | | | — | | | | 0.57 | |
Class C at NAV | | | 05/04/2015 | | | | 05/04/2015 | | | | 1.50 | | | | — | | | | 1.13 | |
Class C with 1% Maximum Sales Charge | | | — | | | | — | | | | 0.50 | | | | — | | | | 1.13 | |
Class I at NAV | | | 05/04/2015 | | | | 05/04/2015 | | | | 2.51 | | | | — | | | | 2.18 | |
Bloomberg BarclaysShort-Intermediate 1–10 Year Municipal Bond Index | | | — | | | | — | | | | 2.94 | % | | | 2.08 | % | | | 1.88 | % |
| | | | | |
| | | | | | | | | | | | | | | | | | | | |
| % Total Annual Operating Expense Ratios4 | | | | | | | | Class A | | | Class C | | | Class I | |
Gross | | | | | | | | | | | 0.89 | % | | | 1.64 | % | | | 0.64 | % |
Net | | | | | | | | | | | 0.65 | | | | 1.40 | | | | 0.40 | |
| | | | | |
| | | | | | | | | | | | | | | | | | | | |
| % Distribution Rates/Yields5 | | | | | | | | Class A | | | Class C | | | Class I | |
Distribution Rate | | | | | | | | | | | 1.76 | % | | | 1.01 | % | | | 2.01 | % |
SEC30-day Yield – Subsidized | | | | | | | | | | | 1.59 | | | | 0.93 | | | | 1.92 | |
SEC30-day Yield – Unsubsidized | | | | | | | | | | | 1.38 | | | | 0.70 | | | | 1.69 | |
Growth of $10,000
This graph shows the change in value of a hypothetical investment of $10,000 in Class A of the Fund for the period indicated. For comparison, the same investment is shown in the indicated index.
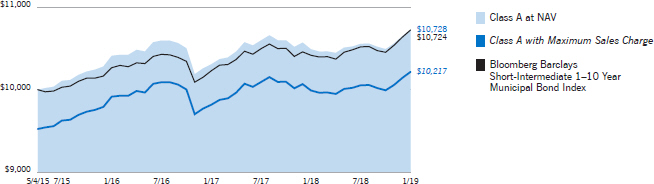
| | | | | | | | | | | | | | | | |
| Growth of Investment | | Amount Invested | | | Period Beginning | | | At NAV | | | With Maximum Sales Charge | |
Class C | | $ | 10,000 | | | | 05/04/2015 | | | $ | 10,432 | | | | N.A. | |
Class I | | $ | 250,000 | | | | 05/04/2015 | | | $ | 271,013 | | | | N.A. | |
See Endnotes and Additional Disclosures in this report.
Past performance is no guarantee of future results. Returns are historical and are calculated by determining the percentage change in net asset value (NAV) or offering price (as applicable) with all distributions reinvested. Investment return and principal value will fluctuate so that shares, when redeemed, may be worth more or less than their original cost. Performance less than or equal to one year is cumulative. Performance is for the stated time period only; due to market volatility, the Fund’s current performance may be lower or higher than quoted. Returns are before taxes unless otherwise noted. For performance as of the most recent month-end, please refer to eatonvance.com.
Eaton Vance
TABS1-to-10 Year Laddered Municipal Bond Fund
January 31, 2019
Fund Profile
Credit Quality (% of total investments)6
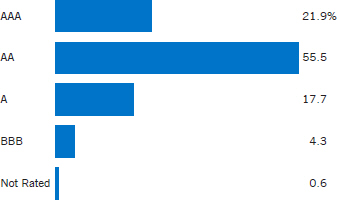
See Endnotes and Additional Disclosures in this report.
Eaton Vance
TABS10-to-20 Year Laddered Municipal Bond Fund
January 31, 2019
Performance2,3
Portfolio ManagersJames H. Evans, CFA, Brian C. Barney, CFA and Christopher J. Harshman, CFA
| | | | | | | | | | | | | | | | | | | | |
| % Average Annual Total Returns | | Class Inception Date | | | Performance Inception Date | | | One Year | | | Five Years | | | Since Inception | |
Class A at NAV | | | 05/04/2015 | | | | 05/04/2015 | | | | 3.30 | % | | | — | | | | 4.15 | % |
Class A with 4.75% Maximum Sales Charge | | | — | | | | — | | | | –1.65 | | | | — | | | | 2.80 | |
Class C at NAV | | | 05/04/2015 | | | | 05/04/2015 | | | | 2.53 | | | | — | | | | 3.39 | |
Class C with 1% Maximum Sales Charge | | | — | | | | — | | | | 1.53 | | | | — | | | | 3.39 | |
Class I at NAV | | | 05/04/2015 | | | | 05/04/2015 | | | | 3.56 | | | | — | | | | 4.41 | |
Bloomberg Barclays 15 Year Municipal Bond Index | | | — | | | | — | | | | 4.07 | % | | | 4.47 | % | | | 3.58 | % |
| | | | | |
| | | | | | | | | | | | | | | | | | | | |
| % Total Annual Operating Expense Ratios4 | | | Class A | | | Class C | | | Class I | |
Gross | | | | | | | | | | | 2.07 | % | | | 2.82 | % | | | 1.82 | % |
Net | | | | | | | | | | | 0.65 | | | | 1.40 | | | | 0.40 | |
| | | | | |
| | | | | | | | | | | | | | | | | | | | |
| % Distribution Rates/Yields5 | | | | | | | | Class A | | | Class C | | | Class I | |
Distribution Rate | | | | | | | | | | | 2.65 | % | | | 1.90 | % | | | 2.90 | % |
SEC30-day Yield – Subsidized | | | | | | | | | | | 2.28 | | | | 1.66 | | | | 2.65 | |
SEC30-day Yield – Unsubsidized | | | | | | | | | | | 1.05 | | | | 0.36 | | | | 1.34 | |
Growth of $10,000
This graph shows the change in value of a hypothetical investment of $10,000 in Class A of the Fund for the period indicated. For comparison, the same investment is shown in the indicated index.
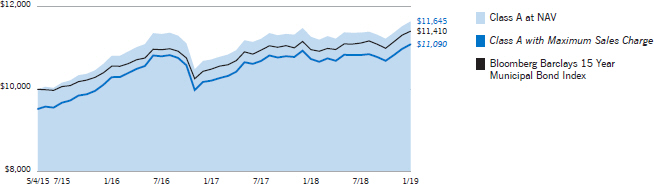
| | | | | | | | | | | | | | | | |
| Growth of Investment | | Amount Invested | | | Period Beginning | | | At NAV | | | With Maximum Sales Charge | |
Class C | | $ | 10,000 | | | | 05/04/2015 | | | $ | 11,331 | | | | N.A. | |
Class I | | $ | 250,000 | | | | 05/04/2015 | | | $ | 293,935 | | | | N.A. | |
See Endnotes and Additional Disclosures in this report.
Past performance is no guarantee of future results. Returns are historical and are calculated by determining the percentage change in net asset value (NAV) or offering price (as applicable) with all distributions reinvested. Investment return and principal value will fluctuate so that shares, when redeemed, may be worth more or less than their original cost. Performance less than or equal to one year is cumulative. Performance is for the stated time period only; due to market volatility, the Fund’s current performance may be lower or higher than quoted. Returns are before taxes unless otherwise noted. For performance as of the most recentmonth-end, please refer to eatonvance.com.
Eaton Vance
TABS10-to-20 Year Laddered Municipal Bond Fund
January 31, 2019
Fund Profile
Credit Quality (% of total investments)6
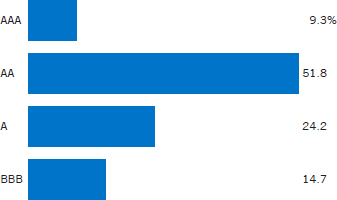
See Endnotes and Additional Disclosures in this report.
Eaton Vance
TABS Laddered Municipal Bond Funds
January 31, 2019
Endnotes and Additional Disclosures
| 1 | The views expressed in this report are those of the portfolio manager(s) and are current only through the date stated at the top of this page. These views are subject to change at any time based upon market or other conditions, and Eaton Vance and the Fund(s) disclaim any responsibility to update such views. These views may not be relied upon as investment advice and, because investment decisions are based on many factors, may not be relied upon as an indication of trading intent on behalf of any Eaton Vance fund. This commentary may contain statements that are not historical facts, referred to as “forward looking statements.” The Fund’s actual future results may differ significantly from those stated in any forward looking statement, depending on factors such as changes in securities or financial markets or general economic conditions, the volume of sales and purchases of Fund shares, the continuation of investment advisory, administrative and service contracts, and other risks discussed from time to time in the Fund’s filings with the Securities and Exchange Commission. |
| 2 | Bloomberg Barclays Municipal Bond Index is an unmanaged index of municipal bonds traded in the U.S. Bloomberg BarclaysShort-Intermediate 1–10 Year Municipal Bond Index is an unmanaged index of municipal bonds traded in the U.S. with maturities ranging from 1–10 years. Bloomberg Barclays 15 Year Municipal Bond Index is an unmanaged index of municipal bonds traded in the U.S. with maturities ranging from 12–17 years. Unless otherwise stated, index returns do not reflect the effect of any applicable sales charges, commissions, expenses, taxes or leverage, as applicable. It is not possible to invest directly in an index. |
| 3 | Total Returns at NAV do not include applicable sales charges. If sales charges were deducted, the returns would be lower. Total Returns shown with maximum sales charges reflect the stated maximum sales charge. Unless otherwise stated, performance does not reflect the deduction of taxes on Fund distributions or redemptions of Fund shares. Performance since inception for an index, if presented, is the performance since the Fund’s or oldest share class’ inception, as applicable. |
| 4 | Source: Fund prospectus. Net expense ratios reflect a contractual expense reimbursement that continues through 5/31/19. Without the reimbursement, performance would have been lower. The expense ratios for the current reporting period can be found in the Financial Highlights section of this report. |
| 5 | The Distribution Rate is based on the Fund’s last regular distribution per share in the period (annualized) divided by the Fund’s NAV at the end of the period. The Fund’s distributions may be comprised of amounts characterized for federal income tax purposes astax-exempt income, qualified andnon-qualified ordinary dividends, capital gains and nondividend distributions, also known as return of capital. The Fund will determine the federal income tax character of distributions paid to a shareholder after the end of the calendar year. This is reported on the IRS form1099-DIV and provided to the shareholder shortly after each year-end. The Fund’s distributions are determined by the investment adviser based on its current assessment of the Fund’s long-term return potential. As portfolio and market conditions change, the rate of distributions paid by the Fund could change. The SEC Yield is a standardized measure based on the estimated yield to maturity of a fund’s investments over a30-day period and is based on the maximum offer price at the date specified. The SEC Yield is not based on the distributions made by the Fund, which may differ. Subsidized yield reflects the effect of fee waivers and expense reimbursements. |
| 6 | Ratings are based on Moody’s Investors Service, Inc. (“Moody’s”), S&P Global Ratings (“S&P”) or Fitch Ratings (“Fitch”), as applicable. If securities are rated differently by the ratings agencies, the highest rating is applied. Ratings, which are subject to change, apply to the creditworthiness of the issuers of the underlying securities and not to the Fund or its shares. Credit ratings measure the quality of a bond based on the issuer’s creditworthiness, with ratings ranging from AAA, being the highest, to D, being the lowest based on S&P’s measures. Ratings of BBB or higher by S&P or Fitch (Baa or higher by Moody’s) are considered to be investment-grade quality. Credit ratings are based largely on the ratings agency’s analysis at the time of rating. The rating assigned to any particular security is not necessarily a reflection of the issuer’s current financial condition and does not necessarily reflect its assessment of the volatility of a security’s market value or of the liquidity of an investment in the security. Holdings designated as “Not Rated” (if any) are not rated by the national ratings agencies stated above. |
| 7 | Duration is a measure of the expected change in price of a bond — in percentage terms — given a one percent change in interest rates, all else being constant. Securities with lower durations tend to be less sensitive to interest rate changes. |
| 8 | Yield curve is a graphical representation of the yields offered by bonds of various maturities. The yield curve flattens when long-term rates fall and/orshort-term rates increase, and the yield curve steepens when long-term rates increase and/orshort-term rates fall. |
| | Fund profiles subject to change due to active management. |
Eaton Vance
TABS Laddered Municipal Bond Funds
January 31, 2019
Fund Expenses
Example: As a Fund shareholder, you incur two types of costs: (1) transaction costs, including sales charges (loads) on purchases and redemption fees (if applicable); and (2) ongoing costs, including management fees; distribution and/or service fees; and other Fund expenses. This Example is intended to help you understand your ongoing costs (in dollars) of Fund investing and to compare these costs with the ongoing costs of investing in other mutual funds. The Example is based on an investment of $1,000 invested at the beginning of the period and held for the entire period (August 1, 2018 – January 31, 2019).
Actual Expenses: The first section of each table below provides information about actual account values and actual expenses. You may use the information in this section, together with the amount you invested, to estimate the expenses that you paid over the period. Simply divide your account value by $1,000 (for example, an $8,600 account value divided by $1,000 = 8.6), then multiply the result by the number in the first section under the heading entitled “Expenses Paid During Period” to estimate the expenses you paid on your account during this period.
Hypothetical Example for Comparison Purposes: The second section of each table below provides information about hypothetical account values and hypothetical expenses based on the actual Fund expense ratio and an assumed rate of return of 5% per year (before expenses), which is not the actual Fund return. The hypothetical account values and expenses may not be used to estimate the actual ending account balance or expenses you paid for the period. You may use this information to compare the ongoing costs of investing in your Fund and other funds. To do so, compare this 5% hypothetical example with the 5% hypothetical examples that appear in the shareholder reports of the other funds.
Please note that the expenses shown in each table are meant to highlight your ongoing costs only and do not reflect any transactional costs, such as sales charges (loads) or redemption fees (if applicable). Therefore, the second section of each table is useful in comparing ongoing costs only, and will not help you determine the relative total costs of owning different funds. In addition, if these transactional costs were included, your costs would be higher.
Eaton Vance TABS 1-to-10 Year Laddered Municipal Bond Fund
| | | | | | | | | | | | | | | | |
| | | Beginning
Account Value
(8/1/18) | | | Ending
Account Value
(1/31/19) | | | Expenses Paid
During Period*
(8/1/18 – 1/31/19) | | | Annualized
Expense
Ratio | |
| | | | |
Actual | | | | | | | | | | | | | | | | |
Class A | | $ | 1,000.00 | | | $ | 1,016.20 | | | $ | 3.30 | ** | | | 0.65 | % |
Class C | | $ | 1,000.00 | | | $ | 1,012.40 | | | $ | 7.10 | ** | | | 1.40 | % |
Class I | | $ | 1,000.00 | | | $ | 1,017.40 | | | $ | 2.03 | ** | | | 0.40 | % |
| | | | | |
Hypothetical | | | | | | | | | | | | | | | | |
(5% return per year before expenses) | | | | | | | | | | | | | | | | |
Class A | | $ | 1,000.00 | | | $ | 1,021.90 | | | $ | 3.31 | ** | | | 0.65 | % |
Class C | | $ | 1,000.00 | | | $ | 1,018.10 | | | $ | 7.12 | ** | | | 1.40 | % |
Class I | | $ | 1,000.00 | | | $ | 1,023.20 | | | $ | 2.04 | ** | | | 0.40 | % |
| * | Expenses are equal to the Fund’s annualized expense ratio for the indicated Class, multiplied by the average account value over the period, multiplied by 184/365 (to reflect the one-half year period). The Example assumes that the $1,000 was invested at the net asset value per share determined at the close of business on July 31, 2018. |
| ** | Absent an allocation of certain expenses to an affiliate, expenses would be higher. |
Eaton Vance
TABS Laddered Municipal Bond Funds
January 31, 2019
Fund Expenses — continued
Eaton Vance TABS 10-to-20 Year Laddered Municipal Bond Fund
| | | | | | | | | | | | | | | | |
| | | Beginning
Account Value
(8/1/18) | | | Ending
Account Value
(1/31/19) | | | Expenses Paid
During Period*
(8/1/18 – 1/31/19) | | | Annualized
Expense
Ratio | |
| | | | |
Actual | | | | | | | | | | | | | | | | |
Class A | | $ | 1,000.00 | | | $ | 1,023.90 | | | $ | 3.32 | ** | | | 0.65 | % |
Class C | | $ | 1,000.00 | | | $ | 1,020.00 | | | $ | 7.13 | ** | | | 1.40 | % |
Class I | | $ | 1,000.00 | | | $ | 1,024.20 | | | $ | 2.04 | ** | | | 0.40 | % |
| | | | | |
Hypothetical | | | | | | | | | | | | | | | | |
(5% return per year before expenses) | | | | | | | | | | | | | | | | |
Class A | | $ | 1,000.00 | | | $ | 1,021.90 | | | $ | 3.31 | ** | | | 0.65 | % |
Class C | | $ | 1,000.00 | | | $ | 1,018.10 | | | $ | 7.12 | ** | | | 1.40 | % |
Class I | | $ | 1,000.00 | | | $ | 1,023.20 | | | $ | 2.04 | ** | | | 0.40 | % |
| * | Expenses are equal to the Fund’s annualized expense ratio for the indicated Class, multiplied by the average account value over the period, multiplied by 184/365 (to reflect the one-half year period). The Example assumes that the $1,000 was invested at the net asset value per share determined at the close of business on July 31, 2018. |
| ** | Absent an allocation of certain expenses to an affiliate, expenses would be higher. |
Eaton Vance
TABS 1-to-10 Year Laddered Municipal Bond Fund
January 31, 2019
Portfolio of Investments
| | | | | | | | |
| Tax-Exempt Investments — 95.1% | |
| Security | | Principal
Amount
(000’s omitted) | | | Value | |
|
| Bond Bank — 0.1% | |
| | |
North Dakota Public Finance Authority, 5.00%, 10/1/19 | | $ | 35 | | | $ | 35,757 | |
| | |
Oklahoma Water Resources Board, 5.00%, 4/1/19 | | | 25 | | | | 25,133 | |
| | |
| | | | | | | $ | 60,890 | |
|
| Education — 9.6% | |
| | |
California Municipal Finance Authority, (California Lutheran University), 5.00%, 10/1/20 | | $ | 325 | | | $ | 341,744 | |
| | |
California Municipal Finance Authority, (California Lutheran University), 5.00%, 10/1/21 | | | 150 | | | | 161,914 | |
| | |
California Municipal Finance Authority, (California Lutheran University), 5.00%, 10/1/23 | | | 125 | | | | 141,063 | |
| | |
Kershaw County Public Schools Foundation, SC, 5.00%, 12/1/19 | | | 100 | | | | 102,740 | |
| | |
Massachusetts Health and Educational Facilities Authority, (Tufts University), (SPA: Wells Fargo Bank, N.A.), 1.50%, 8/15/34(1) | | | 1,400 | | | | 1,400,000 | |
| | |
Michigan State University, (SPA: Royal Bank of Canada), 1.48%, 8/15/30(2) | | | 1,000 | | | | 1,000,000 | |
| | |
New York Dormitory Authority, (Icahn School of Medicine at Mount Sinai), 5.00%, 7/1/23 | | | 60 | | | | 67,558 | |
| | |
North Carolina Educational Facilities Finance Agency, (Duke University), 1.20%, 6/1/27(2) | | | 1,000 | | | | 1,000,000 | |
| | |
Southcentral Pennsylvania General Authority, (York College of Pennsylvania), 5.00%, 11/1/24 | | | 250 | | | | 285,815 | |
| | |
UCF Stadium Corp., FL, 5.00%, 3/1/21 | | | 150 | | | | 159,353 | |
| | |
UCF Stadium Corp., FL, 5.00%, 3/1/23 | | | 250 | | | | 279,517 | |
| | |
West Clark 2000 School Building Corp., IN, 5.00%, 7/15/21 | | | 100 | | | | 107,527 | |
| | |
West Clark 2000 School Building Corp., IN, 5.00%, 1/15/23 | | | 100 | | | | 111,734 | |
| | |
| | | | | | | $ | 5,158,965 | |
|
| Electric Utilities — 6.9% | |
| | |
Pend Oreille County Public Utility District No. 1, WA, Green Bonds, 5.00%, 1/1/22 | | $ | 225 | | | $ | 242,057 | |
| | |
Pend Oreille County Public Utility District No. 1, WA, Green Bonds, 5.00%, 1/1/23 | | | 780 | | | | 855,520 | |
| | |
Pend Oreille County Public Utility District No. 1, WA, Green Bonds, 5.00%, 1/1/25 | | | 275 | | | | 310,871 | |
| | |
Pend Oreille County Public Utility District No. 1, WA, Green Bonds, 5.00%, 1/1/28 | | | 1,000 | | | | 1,154,460 | |
| | |
Redding Joint Powers Financing Authority, CA, Electric System Revenue, 4.00%, 6/1/23 | | | 175 | | | | 192,117 | |
| | |
San Antonio, TX, Electric and Gas Systems, 3.00% to 12/1/19 (Put Date), 12/1/45 | | | 225 | | | | 227,124 | |
| | |
San Antonio, TX, Electric and Gas Systems, 3.00% to 12/1/20 (Put Date), 12/1/45 | | | 250 | | | | 254,997 | |
| | | | | | | | |
| Security | | Principal
Amount
(000’s omitted) | | | Value | |
|
| Electric Utilities (continued) | |
| | |
Springfield, IL, Electric System Revenue, 5.00%, 3/1/21 | | $ | 200 | | | $ | 212,174 | |
| | |
Springfield, IL, Electric System Revenue, 5.00%, 3/1/25 | | | 250 | | | | 287,825 | |
| | |
| | | | | | | $ | 3,737,145 | |
|
| Escrowed / Prerefunded — 0.7% | |
| | |
Lake County Community Consolidated School District No. 50, IL, Escrowed to Maturity, 5.00%, 1/1/21 | | $ | 165 | | | $ | 175,019 | |
| | |
Revere Local School District, OH, Prerefunded to 6/1/22, 5.00%, 12/1/27 | | | 200 | | | | 221,380 | |
| | |
| | | | | | | $ | 396,399 | |
|
| General Obligations — 30.1% | |
| | |
Aldine Independent School District, TX, (PSF Guaranteed), 5.00%, 2/15/21 | | $ | 1,060 | | | $ | 1,129,525 | |
| | |
Arlington County, VA, 5.00%, 8/15/29 | | | 1,000 | | | | 1,238,580 | |
| | |
Boulder Valley School District No. Re-2, CO, 4.00%, 12/1/23 | | | 125 | | | | 138,166 | |
| | |
Burlington, VT, 5.00%, 11/1/27 | | | 225 | | | | 264,361 | |
| | |
Campton Township, IL, 5.00%, 12/15/19 | | | 75 | | | | 77,079 | |
| | |
Campton Township, IL, 5.00%, 12/15/22 | | | 200 | | | | 221,490 | |
| | |
Campton Township, IL, 5.00%, 12/15/23 | | | 105 | | | | 118,799 | |
| | |
Cypress-Fairbanks Independent School District, TX, (PSF Guaranteed), 5.00%, 2/15/20 | | | 1,000 | | | | 1,033,980 | |
| | |
Decatur City Board of Education, AL, 5.00%, 2/1/24 | | | 50 | | | | 56,939 | |
| | |
Decatur City Board of Education, AL, 5.00%, 2/1/25 | | | 50 | | | | 58,093 | |
| | |
Douglas County, NE, 3.75%, 12/15/27 | | | 555 | | | | 576,240 | |
| | |
Fort Worth, TX, 5.00%, 3/1/20 | | | 825 | | | | 853,957 | |
| | |
Grand Blanc Community Schools, MI, 4.00%, 5/1/27 | | | 455 | | | | 481,649 | |
| | |
Joshua Independent School District, TX, (PSF Guaranteed), 4.00%, 8/15/24 | | | 55 | | | | 60,945 | |
| | |
Katy Independent School District, TX, (PSF Guaranteed), 5.00%, 2/15/20 | | | 1,000 | | | | 1,033,980 | |
| | |
La Joya Independent School District, TX, (PSF Guaranteed), 5.00%, 2/15/26 | | | 1,000 | | | | 1,101,400 | |
| | |
Lake County Community Consolidated School District No. 50, IL, 5.00%, 1/1/21 | | | 85 | | | | 89,980 | |
| | |
Lakeland, FL, 5.00%, 10/1/19 | | | 50 | | | | 51,081 | |
| | |
Lakeland, FL, 5.00%, 10/1/21 | | | 50 | | | | 54,202 | |
| | |
Lakeland, FL, 5.00%, 10/1/22 | | | 100 | | | | 111,241 | |
| | |
Lakeland, FL, 5.00%, 10/1/24 | | | 50 | | | | 58,190 | |
| | |
Little Rock School District, AR, 3.00%, 2/1/23 | | | 100 | | | | 101,776 | |
| | |
Little Rock School District, AR, 3.00%, 2/1/24 | | | 250 | | | | 254,012 | |
| | |
Macomb County, MI, 4.00%, 5/1/23 | | | 50 | | | | 54,280 | |
| | |
McLean County Public Building Commission, IL, 5.00%, 12/1/22 | | | 250 | | | | 278,650 | |
| | |
New York, NY, 2.08%, (SIFMA + 0.65%),
2/15/19(3) | | | 100 | | | | 100,012 | |
| | | | |
| | 11 | | See Notes to Financial Statements. |
Eaton Vance
TABS 1-to-10 Year Laddered Municipal Bond Fund
January 31, 2019
Portfolio of Investments — continued
| | | | | | | | |
| Security | | Principal
Amount
(000’s omitted) | | | Value | |
|
| General Obligations (continued) | |
| | |
New York, NY, 2.13%, (SIFMA + 0.70%), 2/15/20(3) | | $ | 100 | | | $ | 100,365 | |
| | |
New York, NY, (LOC: TD Bank N.A.), 1.47%, 9/1/27(2) | | | 500 | | | | 500,000 | |
| | |
Northside Independent School District, TX, (PSF Guaranteed), 4.00%, 6/1/29 | | | 1,000 | | | | 1,058,040 | |
| | |
Ohio, 5.00%, 8/1/26 | | | 1,000 | | | | 1,205,440 | |
| | |
Pendergast Elementary School District No. 92, AZ, 3.00%, 7/1/21 | | | 50 | | | | 51,408 | |
| | |
Schaumburg, IL, 4.00%, 12/1/19 | | | 40 | | | | 40,736 | |
| | |
Scotts Bluff County School District 0016, NE, (Gering Public Schools), 5.00%, 12/1/25 | | | 120 | | | | 131,634 | |
| | |
Scotts Bluff County School District 0016, NE, (Gering Public Schools), 5.00%, 12/1/26 | | | 115 | | | | 125,955 | |
| | |
Scotts Bluff County School District 0016, NE, (Gering Public Schools), 5.00%, 12/1/27 | | | 170 | | | | 186,079 | |
| | |
Texas, (Texas Water Development Board), 5.00%, 8/1/25 | | | 950 | | | | 1,024,233 | |
| | |
Texas, (Texas Water Development Board), 5.00%, 8/1/26 | | | 925 | | | | 996,336 | |
| | |
Texas, (Texas Water Development Board), 5.00%, 8/1/27 | | | 1,000 | | | | 1,076,360 | |
| | |
Vistancia Community Facilities District, AZ, 5.00%, 7/15/19 | | | 30 | | | | 30,432 | |
| | |
Vistancia Community Facilities District, AZ, 5.00%, 7/15/20 | | | 30 | | | | 31,374 | |
| | |
Vistancia Community Facilities District, AZ, 5.00%, 7/15/21 | | | 65 | | | | 67,843 | |
| | |
| | | | | | | $ | 16,224,842 | |
|
| Hospital — 5.8% | |
| | |
Colorado Health Facilities Authority, (Vail Valley Medical Center), 4.00%, 1/15/22 | | $ | 30 | | | $ | 31,717 | |
| | |
Colorado Health Facilities Authority, (Vail Valley Medical Center), 4.00%, 1/15/25 | | | 25 | | | | 27,554 | |
| | |
Colorado Health Facilities Authority, (Vail Valley Medical Center), 5.00%, 1/15/23 | | | 25 | | | | 27,783 | |
| | |
Greeneville Health and Educational Facilities Board, TN, (Ballad Health), 5.00%, 7/1/28 | | | 1,000 | | | | 1,181,740 | |
| | |
Massachusetts Development Finance Agency, (Berkshire Retirement Community, Inc.), 4.00%, 7/1/19 | | | 25 | | | | 25,222 | |
| | |
Massachusetts Development Finance Agency, (Berkshire Retirement Community, Inc.), 4.00%, 7/1/20 | | | 200 | | | | 205,920 | |
| | |
Michigan Finance Authority, (Trinity Health Credit Group), 5.00%, 12/1/27 | | | 500 | | | | 545,310 | |
| | |
Northampton County General Purpose Authority, PA, (St. Luke’s University Health Network), 5.00%, 8/15/24 | | | 85 | | | | 97,186 | |
| | |
Northampton County General Purpose Authority, PA, (St. Luke’s University Health Network), 5.00%, 8/15/25 | | | 30 | | | | 34,846 | |
| | |
Northampton County General Purpose Authority, PA, (St. Luke’s University Health Network), 5.00%, 8/15/26 | | | 85 | | | | 99,695 | |
| | |
Oregon Facilities Authority, (Legacy Health), 4.125%, 5/1/19 | | | 30 | | | | 30,169 | |
| | |
Royal Oak Hospital Finance Authority, MI, (William Beaumont Hospital), 5.00%, 9/1/23 | | | 35 | | | | 39,519 | |
| | | | | | | | |
| Security | | Principal
Amount
(000’s omitted) | | | Value | |
|
| Hospital (continued) | |
| | |
San Diego County, CA, (Sanford Burnham Prebys Medical Discovery Institute), 5.00%, 11/1/25 | | $ | 35 | | | $ | 41,236 | |
| | |
Southcentral Pennsylvania General Authority, (Hanover Hospital, Inc.), 4.00%, 12/1/19 | | | 100 | | | | 101,808 | |
| | |
Southcentral Pennsylvania General Authority, (Hanover Hospital, Inc.), 5.00%, 12/1/20 | | | 235 | | | | 247,826 | |
| | |
Southcentral Pennsylvania General Authority, (Hanover Hospital, Inc.), 5.00%, 12/1/21 | | | 150 | | | | 162,081 | |
| | |
Southcentral Pennsylvania General Authority, (Hanover Hospital, Inc.), 5.00%, 12/1/22 | | | 200 | | | | 221,282 | |
| | |
| | | | | | | $ | 3,120,894 | |
|
| Housing — 0.9% | |
| | |
New York City Housing Development Corp., NY, 1.70%, 11/1/20 | | $ | 200 | | | $ | 199,520 | |
| | |
New York City Housing Development Corp., NY, 1.75%, 5/1/21 | | | 135 | | | | 134,675 | |
| | |
New York City Housing Development Corp., NY, 1.80%, 11/1/21 | | | 165 | | | | 164,691 | |
| | |
| | | | | | | $ | 498,886 | |
|
| Insured – General Obligations — 3.7% | |
| | |
Albertville, AL, (BAM), 4.00%, 6/1/28 | | $ | 250 | | | $ | 264,540 | |
| | |
Cave Creek Unified School District No. 93, Maricopa County, AZ, (BAM), 5.25%, 7/1/23 | | | 50 | | | | 56,982 | |
| | |
Montgomery County Municipal Utility District No. 9, TX, (BAM), 3.00%, 4/1/25 | | | 250 | | | | 259,215 | |
| | |
Montgomery County Municipal Utility District No. 9, TX, (BAM), 3.00%, 4/1/26 | | | 250 | | | | 258,002 | |
| | |
Montgomery County Municipal Utility District No. 9, TX, (BAM), 3.00%, 4/1/27 | | | 525 | | | | 538,225 | |
| | |
New Britain, CT, (BAM), 5.00%, 3/1/24 | | | 55 | | | | 62,668 | |
| | |
New Britain, CT, (BAM), 5.00%, 3/1/25 | | | 50 | | | | 57,704 | |
| | |
New Britain, CT, (BAM), Escrowed to Maturity, 5.00%, 3/1/23 | | | 105 | | | | 118,232 | |
| | |
New Britain, CT, (BAM), Escrowed to Maturity, 5.00%, 3/1/24 | | | 95 | | | | 109,530 | |
| | |
New Britain, CT, (BAM), Escrowed to Maturity, 5.00%, 3/1/25 | | | 5 | | | | 5,873 | |
| | |
Peoria Unified School District No. 11, Maricopa County, AZ, (AGM), 5.00%, 7/1/24 | | | 85 | | | | 98,150 | |
| | |
Sienna Plantation Levee Improvement District of Fort Bend County, TX, (AGM), 3.00%, 9/1/19 | | | 50 | | | | 50,356 | |
| | |
Sienna Plantation Levee Improvement District of Fort Bend County, TX, (AGM), 3.00%, 9/1/20 | | | 50 | | | | 50,912 | |
| | |
Sienna Plantation Levee Improvement District of Fort Bend County, TX, (AGM), 3.00%, 9/1/21 | | | 50 | | | | 51,426 | |
| | |
| | | | | | | $ | 1,981,815 | |
| | | | |
| | 12 | | See Notes to Financial Statements. |
Eaton Vance
TABS 1-to-10 Year Laddered Municipal Bond Fund
January 31, 2019
Portfolio of Investments — continued
| | | | | | | | |
| Security | | Principal
Amount
(000’s omitted) | | | Value | |
|
| Insured – Lease Revenue / Certificates of Participation — 0.9% | |
| | |
Highlands County School Board, FL, (BAM), 5.00%, 3/1/20 | | $ | 250 | | | $ | 258,285 | |
| | |
Highlands County School Board, FL, (BAM), 5.00%, 3/1/26 | | | 180 | | | | 208,400 | |
| | |
| | | | | | | $ | 466,685 | |
|
| Insured – Special Tax Revenue — 0.1% | |
| | |
Successor Agency to Riverside County Redevelopment Agency, CA, (AGM), 5.00%, 10/1/24 | | $ | 50 | | | $ | 58,335 | |
| | |
| | | | | | | $ | 58,335 | |
|
| Insured – Transportation — 5.5% | |
| | |
New Orleans Aviation Board, LA, (AGM), 5.00%, 1/1/28 | | $ | 1,000 | | | $ | 1,189,730 | |
| | |
New Orleans Aviation Board, LA, (AGM), 5.00%, 1/1/29 | | | 1,510 | | | | 1,780,698 | |
| | |
| | | | | | | $ | 2,970,428 | |
|
| Insured – Water and Sewer — 0.1% | |
| | |
Beaumont, TX, Waterworks and Sewer System Revenue, (BAM), 3.00%, 9/1/22 | | $ | 25 | | | $ | 25,981 | �� |
| | |
| | | | | | | $ | 25,981 | |
|
| Lease Revenue / Certificates of Participation — 2.9% | |
| | |
Georgia Municipal Association, Inc., Certificates of Participation, (Atlanta Public Safety), 5.00%, 12/1/23 | | $ | 225 | | | $ | 256,228 | |
| | |
Miami-Dade County School Board, FL, 5.00%, 2/1/24 | | | 300 | | | | 341,025 | |
| | |
Miami-Dade County School Board, FL, 5.00%, 2/1/25 | | | 200 | | | | 230,790 | |
| | |
New Jersey Economic Development Authority, (School Facilities Construction), 5.00%, 9/1/23 | | | 100 | | | | 104,940 | |
| | |
Palm Beach County School Board, FL, 5.00%, 8/1/21 | | | 125 | | | | 134,862 | |
| | |
South Dakota Building Authority, 5.00%, 6/1/25 | | | 85 | | | | 99,912 | |
| | |
St. Charles County Public Water Supply District No. 2, MO, 3.00%, 12/1/24 | | | 100 | | | | 103,484 | |
| | |
St. Charles County Public Water Supply District No. 2, MO, 3.00%, 12/1/25 | | | 250 | | | | 258,037 | |
| | |
Thompson School District No. R2-J, Larimer, Weld and Boulder Counties, CO, 5.00%, 12/1/19 | | | 25 | | | | 25,670 | |
| | |
| | | | | | | $ | 1,554,948 | |
|
| Other Revenue — 9.9% | |
| | |
Citizens Property Insurance Corp., FL, 5.00%, 6/1/22 | | $ | 100 | | | $ | 108,485 | |
| | |
Fort Myers, FL, Capital Improvement Revenue, 5.00%, 12/1/27 | | | 330 | | | | 388,021 | |
| | |
Fort Myers, FL, Capital Improvement Revenue, 5.00%, 12/1/28 | | | 545 | | | | 637,813 | |
| | |
Fort Myers, FL, Capital Improvement Revenue, 5.00%, 12/1/29 | | | 600 | | | | 698,880 | |
| | | | | | | | |
| Security | | Principal
Amount
(000’s omitted) | | | Value | |
|
| Other Revenue (continued) | |
| | |
Fulton County Development Authority, GA, (Robert W. Woodruff Arts Center, Inc.), 5.00%, 3/15/24 | | $ | 150 | | | $ | 169,661 | |
| | |
Main Street Natural Gas, Inc., GA, Gas Supply Revenue, (Liq: Royal Bank of Canada), 4.00% to 9/1/23 (Put Date), 4/1/48 | | | 2,500 | | | | 2,643,375 | |
| | |
Tennessee Energy Acquisition Corp., Gas Project Revenue, 5.00%, 11/1/22 | | | 400 | | | | 434,896 | |
| | |
West Virginia School Building Authority, Lottery Revenue, 5.00%, 7/1/24 | | | 100 | | | | 115,637 | |
| | |
West Virginia School Building Authority, Lottery Revenue, 5.00%, 7/1/25 | | | 100 | | | | 117,761 | |
| | |
| | | | | | | $ | 5,314,529 | |
|
| Senior Living / Life Care — 3.0% | |
| | |
Alexandria Industrial Development Authority, VA, (Goodwin House, Inc.), 5.00%, 10/1/22 | | $ | 50 | | | $ | 54,306 | |
| | |
Buffalo and Erie County Industrial Land Development Corp., NY, (Orchard Park CCRC, Inc.), 5.00%, 11/15/24 | | | 60 | | | | 65,490 | |
| | |
Buffalo and Erie County Industrial Land Development Corp., NY, (Orchard Park CCRC, Inc.), 5.00%, 11/15/25 | | | 60 | | | | 65,957 | |
| | |
Buffalo and Erie County Industrial Land Development Corp., NY, (Orchard Park CCRC, Inc.), 5.00%, 11/15/29 | | | 830 | | | | 892,076 | |
| | |
California Statewide Communities Development Authority, (American Baptist Homes of the West), 5.00%, 10/1/21 | | | 50 | | | | 53,088 | |
| | |
California Statewide Communities Development Authority, (American Baptist Homes of the West), 5.00%, 10/1/23 | | | 100 | | | | 109,542 | |
| | |
North Carolina Medical Care Commission, (United Methodist Retirement Homes), 5.00%, 10/1/22 | | | 150 | | | | 161,610 | |
| | |
Orange County, FL, Health Facilities Authority, (Presbyterian Retirement Communities), 4.00%, 8/1/24 | | | 50 | | | | 53,297 | |
| | |
Wisconsin Health and Educational Facilities Authority, (Saint John’s Communities, Inc.), 4.00%, 9/15/19 | | | 100 | | | | 100,796 | |
| | |
Wisconsin Health and Educational Facilities Authority, (Saint John’s Communities, Inc.), 4.00%, 9/15/23 | | | 25 | | | | 25,634 | |
| | |
Wisconsin Health and Educational Facilities Authority, (Saint John’s Communities, Inc.), 4.00%, 9/15/24 | | | 50 | | | | 51,045 | |
| | |
| | | | | | | $ | 1,632,841 | |
|
| Special Tax Revenue — 6.5% | |
| | |
Contra Costa Transportation Authority, CA, Sales Tax Revenue, 2.014%, (70% of 1 mo. USD LIBOR + 0.25%), 3/1/34(3) | | $ | 500 | | | $ | 500,140 | |
| | |
New York Urban Development Corp., Personal Income Tax Revenue, 5.00%, 3/15/26 | | | 100 | | | | 112,125 | |
| | |
Port St. Lucie, FL, Public Service Tax Revenue, 5.00%, 9/1/27 | | | 250 | | | | 286,817 | |
| | |
Thornton Development Authority, CO, 2.00%, 12/1/19 | | | 200 | | | | 200,356 | |
| | | | |
| | 13 | | See Notes to Financial Statements. |
Eaton Vance
TABS 1-to-10 Year Laddered Municipal Bond Fund
January 31, 2019
Portfolio of Investments — continued
| | | | | | | | |
| Security | | Principal
Amount
(000’s omitted) | | | Value | |
|
| Special Tax Revenue (continued) | |
| | |
Thornton Development Authority, CO, 4.00%, 12/1/20 | | $ | 100 | | | $ | 103,949 | |
| | |
Troup County Public Facilities Authority, GA, 3.00%, 5/1/21 | | | 1,000 | | | | 1,026,230 | |
| | |
Troup County Public Facilities Authority, GA, 4.00%, 5/1/22 | | | 1,000 | | | | 1,068,630 | |
| | |
West Palm Beach Community Redevelopment Agency, FL, 5.00%, 3/1/20 | | | 100 | | | | 103,347 | |
| | |
West Palm Beach Community Redevelopment Agency, FL, 5.00%, 3/1/22 | | | 50 | | | | 54,249 | |
| | |
West Palm Beach Community Redevelopment Agency, FL, 5.00%, 3/1/23 | | | 60 | | | | 66,538 | |
| | |
| | | | | | | $ | 3,522,381 | |
|
| Transportation — 3.4% | |
| | |
Chicago, IL, (O’Hare International Airport), 5.00%, 1/1/21 | | $ | 50 | | | $ | 53,007 | |
| | |
Chicago, IL, (O’Hare International Airport), 5.00%, 1/1/25 | | | 25 | | | | 29,008 | |
| | |
Idaho Housing and Finance Association, Federal Highway Trust Fund, 5.00%, 7/15/21 | | | 50 | | | | 53,726 | |
| | |
Idaho Housing and Finance Association, Federal Highway Trust Fund, 5.00%, 7/15/25 | | | 250 | | | | 292,608 | |
| | |
Metropolitan Transportation Authority, NY, Green Bonds, 5.00%, 11/15/29 | | | 1,000 | | | | 1,174,200 | |
| | |
North Carolina, (Federal-Aid Highway Projects), 5.00%, 3/1/20 | | | 100 | | | | 103,499 | |
| | |
North Carolina, (Federal-Aid Highway Projects), 5.00%, 3/1/22 | | | 100 | | | | 109,530 | |
| | |
| | | | | | | $ | 1,815,578 | |
|
| Water and Sewer — 5.0% | |
| | |
Arizona Water Infrastructure Finance Authority, 5.00%, 10/1/25 | | $ | 55 | | | $ | 64,330 | |
| | |
Brushy Creek Regional Utility Authority, Inc., TX, 5.00%, 8/1/24 | | | 500 | | | | 576,520 | |
| | |
Brushy Creek Regional Utility Authority, Inc., TX, 5.00%, 8/1/25 | | | 160 | | | | 187,810 | |
| | |
Brushy Creek Regional Utility Authority, Inc., TX, 5.00%, 8/1/27 | | | 500 | | | | 591,285 | |
| | |
Buffalo Municipal Water Finance Authority, NY, 5.00%, 7/1/21 | | | 50 | | | | 53,803 | |
| | |
DeKalb County, GA, Water and Sewerage Revenue, 5.00%, 10/1/24 | | | 335 | | | | 391,632 | |
| | |
Glendale, AZ, Water and Sewer Revenue, 5.00%, 7/1/28 | | | 500 | | | | 580,325 | |
| | |
Travis County Water Control and Improvement District No. 17, TX, 4.00%, 11/1/26 | | | 220 | | | | 239,598 | |
| | |
| | | | | | | $ | 2,685,303 | |
| |
Total Tax-Exempt Investments — 95.1%
(identified cost $50,540,800) | | | $ | 51,226,845 | |
| | | | | | | | |
| Short-Term Investments — 15.2% | |
| Description | | Units | | | Value | |
| | |
Eaton Vance Cash Reserves Fund, LLC, 2.61%(4) | | | 8,198,232 | | | $ | 8,198,232 | |
| |
Total Short-Term Investments
(identified cost $8,197,970) | | | $ | 8,198,232 | |
| |
Total Investments — 110.3%
(identified cost $58,738,770) | | | $ | 59,425,077 | |
| |
Other Assets, Less Liabilities — (10.3)% | | | $ | (5,560,117 | ) |
| |
Net Assets — 100.0% | | | $ | 53,864,960 | |
The percentage shown for each investment category in the Portfolio of Investments is based on net assets.
At January 31, 2019, the concentration of the Fund’s investments in the various states, determined as a percentage of net assets, is as follows:
| | | | |
| |
| Texas | | | 23.5% | |
| |
| Georgia | | | 10.3% | |
| |
| Others, representing less than 10% individually | | | 61.3% | |
The Fund invests primarily in debt securities issued by municipalities. The ability of the issuers of the debt securities to meet their obligations may be affected by economic developments in a specific industry or municipality. In order to reduce the risk associated with such economic developments, at January 31, 2019, 9.3% of total investments are backed by bond insurance of various financial institutions and financial guaranty assurance agencies. The aggregate percentage insured by an individual financial institution or financial guaranty assurance agency ranged from 3.7% to 5.5% of total investments.
| (1) | Variable rate demand obligation that may be tendered at par on any day for payment the same or next business day. The stated interest rate, which generally resets daily, is determined by the remarketing agent and represents the rate in effect at January 31, 2019. |
| (2) | Variable rate demand obligation that may be tendered at par on any day for payment the lesser of 5 business days or 7 calendar days. The stated interest rate, which generally resets weekly, is determined by the remarketing agent and represents the rate in effect at January 31, 2019. |
| (3) | Floating rate security. The stated interest rate represents the rate in effect at January 31, 2019. |
| (4) | Affiliated investment company, available to Eaton Vance portfolios and funds, which invests in high quality, U.S. dollar denominated money market instruments. The rate shown is the annualized seven-day yield as of January 31, 2019. |
| | | | |
| | 14 | | See Notes to Financial Statements. |
Eaton Vance
TABS 1-to-10 Year Laddered Municipal Bond Fund
January 31, 2019
Portfolio of Investments — continued
Abbreviations:
| | | | |
| | |
| AGM | | – | | Assured Guaranty Municipal Corp. |
| | |
| BAM | | – | | Build America Mutual Assurance Co. |
| | |
| LIBOR | | – | | London Interbank Offered Rate |
| | |
| Liq | | – | | Liquidity Provider |
| | |
| LOC | | – | | Letter of Credit |
| | |
| PSF | | – | | Permanent School Fund |
| | |
| SIFMA | | – | | Securities Industry and Financial Markets Association Municipal Swap Index |
| | |
| SPA | | – | | Standby Bond Purchase Agreement |
Currency Abbreviations:
| | | | |
| | |
| USD | | – | | United States Dollar |
| | | | |
| | 15 | | See Notes to Financial Statements. |
Eaton Vance
TABS 10-to-20 Year Laddered Municipal Bond Fund
January 31, 2019
Portfolio of Investments
| | | | | | | | |
| Tax-Exempt Investments — 94.8% | |
| Security | | Principal
Amount
(000’s omitted) | | | Value | |
|
| Education — 6.0% | |
| | |
Colorado Educational and Cultural Facilities Authority, (University of Denver), 4.00%, 3/1/35 | | $ | 100 | | | $ | 105,578 | |
| | |
Colorado School of Mines, 4.00%, 12/1/34 | | | 300 | | | | 318,303 | |
| | |
Madison County Capital Resource Corp., NY, (Colgate University), 5.00%, 7/1/31 | | | 100 | | | | 114,964 | |
| | |
| | | | | | | $ | 538,845 | |
|
| Electric Utilities — 0.6% | |
| | |
Missouri Joint Municipal Electric Utility Commission, (Prairie State Energy Campus), 4.00%, 12/1/35 | | $ | 50 | | | $ | 52,860 | |
| | |
| | | | | | | $ | 52,860 | |
|
| General Obligations — 20.2% | |
| | |
California, 4.00%, 9/1/32 | | $ | 225 | | | $ | 243,310 | |
| | |
Cascade School District No. 228, Chelan County, WA, 4.00%, 12/1/26 | | | 100 | | | | 110,634 | |
| | |
Colonial School District, PA, 5.00%, 2/15/35 | | | 75 | | | | 86,624 | |
| | |
Colonial School District, PA, 5.00%, 2/15/36 | | | 100 | | | | 115,237 | |
| | |
Lakeland, FL, 5.00%, 10/1/29 | | | 100 | | | | 115,418 | |
| | |
Lakeland, FL, 5.00%, 10/1/31 | | | 100 | | | | 114,676 | |
| | |
Lewis and Thurston Counties Centralia School District No. 401, WA, 5.00%, 12/1/37 | | | 145 | | | | 165,629 | |
| | |
Los Angeles Community College District, CA, (Election of 2008), 4.00%, 8/1/33 | | | 125 | | | | 133,938 | |
| | |
Monterey Peninsula Community College District, CA, 4.00%, 8/1/33 | | | 100 | | | | 106,785 | |
| | |
Rowland Unified School District, CA, (Election of 2012), 0.00%, 8/1/34 | | | 400 | | | | 215,508 | |
| | |
Williamson County, TX, 4.00%, 2/15/29 | | | 150 | | | | 163,486 | |
| | |
Williamson County, TX, 4.00%, 2/15/30 | | | 100 | | | | 108,290 | |
| | |
Williamson County, TX, 5.00%, 2/15/28 | | | 125 | | | | 146,281 | |
| | |
| | | | | | | $ | 1,825,816 | |
|
| Hospital — 8.5% | |
| | |
Lexington County Health Services District, Inc., SC, 4.00%, 11/1/33 | | $ | 150 | | | $ | 155,715 | |
| | |
Massachusetts Development Finance Agency, (Berkshire Retirement Community, Inc.), 5.00%, 7/1/25 | | | 50 | | | | 57,259 | |
| | |
Massachusetts Development Finance Agency, (Berkshire Retirement Community, Inc.), 5.00%, 7/1/31 | | | 50 | | | | 55,390 | |
| | |
Michigan Finance Authority, (Trinity Health Credit Group), 5.00%, 12/1/39 | | | 100 | | | | 106,465 | |
| | |
New Hampshire Health and Education Facilities Authority, (Concord Hospital), 5.00%, 10/1/32 | | | 150 | | | | 171,124 | |
| | | | | | | | |
| Security | | Principal
Amount
(000’s omitted) | | | Value | |
|
| Hospital (continued) | |
| | |
North Carolina Medical Care Commission, (Rex Healthcare, Inc.), 5.00%, 7/1/32 | | $ | 100 | | | $ | 112,696 | |
| | |
North Carolina Medical Care Commission, (Rex Healthcare, Inc.), 5.00%, 7/1/33 | | | 100 | | | | 112,136 | |
| | |
| | | | | | | $ | 770,785 | |
|
| Housing — 1.6% | |
| | |
Vermont Housing Finance Agency, (FHLMC), (FNMA), (GNMA), 3.85%, 11/1/33 | | $ | 140 | | | $ | 144,411 | |
| | |
| | | | | | | $ | 144,411 | |
|
| Insured – Education — 2.6% | |
| | |
Patterson Joint Unified School District, CA, (Election 2018), (BAM), 5.00%, 8/1/29 | | $ | 200 | | | $ | 235,814 | |
| | |
| | | | | | | $ | 235,814 | |
|
| Insured – General Obligations — 4.2% | |
| | |
Grossmont Union High School District, CA, (Election of 2008), (AGM), 0.00%, 8/1/33 | | $ | 100 | | | $ | 56,190 | |
| | |
Grossmont Union High School District, CA, (Election of 2008), (AGM), 0.00%, 8/1/35 | | | 100 | | | | 50,698 | |
| | |
Sienna Plantation Levee Improvement District of Fort Bend County, TX, (AGM), 4.00%, 9/1/31 | | | 150 | | | | 155,780 | |
| | |
Zeeland Public Schools, MI, (AGM), 5.00%, 5/1/28 | | | 100 | | | | 115,047 | |
| | |
| | | | | | | $ | 377,715 | |
|
| Insured – Transportation — 4.4% | |
| | |
New Orleans Aviation Board, LA, (AGM), 5.00%, 1/1/32 | | $ | 100 | | | $ | 115,193 | |
| | |
New Orleans Aviation Board, LA, (AGM), 5.00%, 1/1/33 | | | 100 | | | | 114,605 | |
| | |
New Orleans Aviation Board, LA, (AGM), 5.00%, 1/1/34 | | | 150 | | | | 171,154 | |
| | |
| | | | | | | $ | 400,952 | |
|
| Lease Revenue / Certificates of Participation — 4.4% | |
| | |
New Jersey Economic Development Authority, (School Facilities Construction), 5.00%, 6/15/33 | | $ | 150 | | | $ | 159,477 | |
| | |
Riverside County Public Financing Authority, CA, 5.00%, 11/1/27 | | | 150 | | | | 177,207 | |
| | |
Riverside County Public Financing Authority, CA, 5.00%, 11/1/28 | | | 50 | | | | 58,760 | |
| | |
| | | | | | | $ | 395,444 | |
|
| Other Revenue — 9.7% | |
| | |
Fort Myers, FL, Capital Improvement Revenue, 5.00%, 12/1/30 | | $ | 100 | | | $ | 115,865 | |
| | |
Fort Myers, FL, Capital Improvement Revenue, 5.00%, 12/1/36 | | | 250 | | | | 284,110 | |
| | | | |
| | 16 | | See Notes to Financial Statements. |
Eaton Vance
TABS 10-to-20 Year Laddered Municipal Bond Fund
January 31, 2019
Portfolio of Investments — continued
| | | | | | | | |
| Security | | Principal
Amount
(000’s omitted) | | | Value | |
|
| Other Revenue (continued) | |
| | |
Las Vegas Convention and Visitors Authority, NV, 5.00%, 7/1/30 | | $ | 125 | | | $ | 140,015 | |
| | |
Las Vegas Convention and Visitors Authority, NV, 5.00%, 7/1/31 | | | 150 | | | | 167,010 | |
| | |
Wisconsin, Environmental Improvement Fund Revenue, 5.00%, 6/1/34 | | | 50 | | | | 58,094 | |
| | |
Wisconsin, Environmental Improvement Fund Revenue, 5.00%, 6/1/35 | | | 100 | | | | 115,997 | |
| | |
| | | | | | | $ | 881,091 | |
|
| Senior Living / Life Care — 15.1% | |
| | |
Alexandria Industrial Development Authority, VA, (Goodwin House, Inc.), 5.00%, 10/1/30 | | $ | 250 | | | $ | 275,207 | |
| | |
Maryland Health and Higher Educational Facilities Authority, (Broadmead), 5.00%, 7/1/31 | | | 150 | | | | 164,588 | |
| | |
Maryland Health and Higher Educational Facilities Authority, (Broadmead), 5.00%, 7/1/32 | | | 220 | | | | 240,863 | |
| | |
Missouri Health and Educational Facilities Authority, (Lutheran Senior Services), 5.00%, 2/1/28 | | | 150 | | | | 165,609 | |
| | |
Missouri Health and Educational Facilities Authority, (Lutheran Senior Services), 5.00%, 2/1/31 | | | 100 | | | | 107,816 | |
| | |
Orange County Health Facilities Authority, FL, (Presbyterian Retirement Communities), 5.00%, 8/1/35 | | | 150 | | | | 161,430 | |
| | |
Palm Beach County Health Facilities Authority, FL, (Lifespace Communities, Inc.), 5.00%, 5/15/32 | | | 100 | | | | 106,920 | |
| | |
Palm Beach County Health Facilities Authority, FL, (Lifespace Communities, Inc.), 5.00%, 5/15/34 | | | 40 | | | | 42,444 | |
| | |
Westchester County Local Development Corp., NY, (Kendal on Hudson), 5.00%, 1/1/34 | | | 100 | | | | 104,724 | |
| | |
| | | | | | | $ | 1,369,601 | |
|
| Special Tax Revenue — 3.4% | |
| | |
Atlanta Development Authority, GA, (New Downtown Atlanta Stadium), 5.00%, 7/1/34 | | $ | 225 | | | $ | 254,554 | |
| | |
Baltimore, MD, Special Tax Obligation, 5.00%, 6/15/29 | | | 50 | | | | 55,547 | |
| | |
| | | | | | | $ | 310,101 | |
|
| Transportation — 12.7% | |
| | |
Chicago, IL, (O’Hare International Airport), 5.00%, 1/1/37 | | $ | 250 | | | $ | 278,995 | |
| | |
New Orleans Aviation Board, LA, 5.00%, 1/1/36 | | | 125 | | | | 140,980 | |
| | |
New Orleans Aviation Board, LA, 5.00%, 1/1/37 | | | 50 | | | | 56,132 | |
| | |
Oklahoma Turnpike Authority, 4.00%, 1/1/38 | | | 250 | | | | 262,265 | |
| | |
Salt Lake City, UT, (Salt Lake City International Airport), 5.00%, 7/1/35 | | | 150 | | | | 174,562 | |
| | |
Salt Lake City, UT, (Salt Lake City International Airport), 5.00%, 7/1/36 | | | 200 | | | | 231,506 | |
| | |
| | | | | | | $ | 1,144,440 | |
| | | | | | | | |
| Security | | Principal
Amount
(000’s omitted) | | | Value | |
|
| Water and Sewer — 1.4% | |
| | |
Buffalo Municipal Water Finance Authority, NY, 5.00%, 7/1/30 | | $ | 50 | | | $ | 57,422 | |
| | |
Tucson, AZ, Water System Revenue, 5.00%, 7/1/32 | | | 60 | | | | 69,678 | |
| | |
| | | | | | | $ | 127,100 | |
| |
Total Tax-Exempt Investments — 94.8%
(identified cost $8,296,512) | | | $ | 8,574,975 | |
|
| Short-Term Investments — 4.9% | |
| Description | | Units | | | Value | |
| | |
Eaton Vance Cash Reserves Fund, LLC, 2.61%(1) | | | 440,443 | | | $ | 440,443 | |
| |
Total Short-Term Investments
(identified cost $440,423) | | | $ | 440,443 | |
| |
Total Investments — 99.7%
(identified cost $8,736,935) | | | $ | 9,015,418 | |
| |
Other Assets, Less Liabilities — 0.3% | | | $ | 27,917 | |
| |
Net Assets — 100.0% | | | $ | 9,043,335 | |
The percentage shown for each investment category in the Portfolio of Investments is based on net assets.
At January 31, 2019, the concentration of the Fund’s investments in the various states, determined as a percentage of net assets, is as follows:
| | | | |
| |
| California | | | 14.1% | |
| |
| Florida | | | 10.4% | |
| |
| Others, representing less than 10% individually | | | 70.3% | |
The Fund invests primarily in debt securities issued by municipalities. The ability of the issuers of the debt securities to meet their obligations may be affected by economic developments in a specific industry or municipality. In order to reduce the risk associated with such economic developments, at January 31, 2019, 11.3% of total investments are backed by bond insurance of various financial institutions and financial guaranty assurance agencies. The aggregate percentage insured by an individual financial institution or financial guaranty assurance agency ranged from 2.6% to 8.6% of total investments.
| (1) | Affiliated investment company, available to Eaton Vance portfolios and funds, which invests in high quality, U.S. dollar denominated money market instruments. The rate shown is the annualized seven-day yield as of January 31, 2019. |
Abbreviations:
| | | | |
| | |
| AGM | | – | | Assured Guaranty Municipal Corp. |
| | |
| BAM | | – | | Build America Mutual Assurance Co. |
| | |
| FHLMC | | – | | Federal Home Loan Mortgage Corp. |
| | |
| FNMA | | – | | Federal National Mortgage Association |
| | |
| GNMA | | – | | Government National Mortgage Association |
| | | | |
| | 17 | | See Notes to Financial Statements. |
Eaton Vance
TABS Laddered Municipal Bond Funds
January 31, 2019
Statements of Assets and Liabilities
| | | | | | | | |
| | | January 31, 2019 | |
| Assets | | 1-to-10 Year
Laddered Fund | | | 10-to-20 Year
Laddered Fund | |
| | |
Unaffiliated investments, at value (identified cost, $50,540,800 and $8,296,512, respectively) | | $ | 51,226,845 | | | $ | 8,574,975 | |
| | |
Affiliated investment, at value (identified cost, $8,197,970 and $440,423, respectively) | | | 8,198,232 | | | | 440,443 | |
| | |
Cash | | | 1,400,967 | | | | — | |
| | |
Interest receivable | | | 560,562 | | | | 84,930 | |
| | |
Dividends receivable from affiliated investment | | | 9,171 | | | | 513 | |
| | |
Receivable for investments sold | | | 277,524 | | | | — | |
| | |
Receivable for Fund shares sold | | | 266,670 | | | | — | |
| | |
Receivable from affiliate | | | — | | | | 9,818 | |
| | |
Total assets | | $ | 61,939,971 | | | $ | 9,110,679 | |
| | |
| Liabilities | | | | | | | | |
| | |
Payable for investments purchased | | $ | 7,870,940 | | | $ | — | |
| | |
Payable for Fund shares redeemed | | | 102,091 | | | | 879 | |
| | |
Distributions payable | | | 1,105 | | | | — | |
| | |
Payable to affiliates: | | | | | | | | |
| | |
Investment adviser and administration fee | | | 13,646 | | | | 2,387 | |
| | |
Distribution and service fees | | | 7,037 | | | | 341 | |
| | |
Other | | | 1,310 | | | | — | |
| | |
Accrued expenses | | | 78,882 | | | | 63,737 | |
| | |
Total liabilities | | $ | 8,075,011 | | | $ | 67,344 | |
| | |
Net Assets | | $ | 53,864,960 | | | $ | 9,043,335 | |
| | |
| Sources of Net Assets | | | | | | | | |
| | |
Paid-in capital | | $ | 53,857,534 | | | $ | 8,838,269 | |
| | |
Distributable earnings | | | 7,426 | | | | 205,066 | |
| | |
Net Assets | | $ | 53,864,960 | | | $ | 9,043,335 | |
| | |
| Class A Shares | | | | | | | | |
| | |
Net Assets | | $ | 17,978,255 | | | $ | 297,169 | |
| | |
Shares Outstanding | | | 1,754,870 | | | | 28,153 | |
| | |
Net Asset Value and Redemption Price Per Share | | | | | | | | |
| | |
(net assets ÷ shares of beneficial interest outstanding) | | $ | 10.24 | | | $ | 10.56 | |
| | |
Maximum Offering Price Per Share | | | | | | | | |
| | |
(100 ÷ 95.25 of net asset value per share) | | $ | 10.75 | | | $ | 11.09 | |
| | |
| Class C Shares | | | | | | | | |
| | |
Net Assets | | $ | 3,950,648 | | | $ | 330,903 | |
| | |
Shares Outstanding | | | 385,696 | | | | 31,318 | |
| | |
Net Asset Value and Offering Price Per Share* | | | | | | | | |
| | |
(net assets ÷ shares of beneficial interest outstanding) | | $ | 10.24 | | | $ | 10.57 | |
| | |
| Class I Shares | | | | | | | | |
| | |
Net Assets | | $ | 31,936,057 | | | $ | 8,415,263 | |
| | |
Shares Outstanding | | | 3,114,375 | | | | 796,938 | |
| | |
Net Asset Value, Offering Price and Redemption Price Per Share | | | | | | | | |
| | |
(net assets ÷ shares of beneficial interest outstanding) | | $ | 10.25 | | | $ | 10.56 | |
On sales of $50,000 or more, the offering price of Class A shares is reduced.
| * | Redemption price per share is equal to the net asset value less any applicable contingent deferred sales charge. |
| | | | |
| | 18 | | See Notes to Financial Statements. |
Eaton Vance
TABS Laddered Municipal Bond Funds
January 31, 2019
Statements of Operations
| | | | | | | | |
| | | Year Ended January 31, 2019 | |
| Investment Income | | 1-to-10 Year
Laddered Fund | | | 10-to-20 Year
Laddered Fund | |
| | |
Interest | | $ | 1,227,168 | | | $ | 277,399 | |
| | |
Dividends from affiliated investment | | | 94,397 | | | | 9,703 | |
| | |
Total investment income | | $ | 1,321,565 | | | $ | 287,102 | |
|
| Expenses | |
| | |
Investment adviser and administration fee | | $ | 193,026 | | | $ | 28,271 | |
| | |
Distribution and service fees | | | | | | | | |
| | |
Class A | | | 39,755 | | | | 815 | |
| | |
Class C | | | 36,581 | | | | 3,559 | |
| | |
Trustees’ fees and expenses | | | 3,128 | | | | 933 | |
| | |
Custodian fee | | | 38,752 | | | | 24,547 | |
| | |
Transfer and dividend disbursing agent fees | | | 10,822 | | | | 2,637 | |
| | |
Legal and accounting services | | | 42,404 | | | | 35,545 | |
| | |
Printing and postage | | | 12,248 | | | | 6,238 | |
| | |
Registration fees | | | 47,424 | | | | 35,630 | |
| | |
Miscellaneous | | | 13,564 | | | | 11,641 | |
| | |
Total expenses | | $ | 437,704 | | | $ | 149,816 | |
| | |
Deduct — | | | | | | | | |
| | |
Allocation of expenses to affiliate | | $ | 119,877 | | | $ | 110,102 | |
| | |
Total expense reductions | | $ | 119,877 | | | $ | 110,102 | |
| | |
Net expenses | | $ | 317,827 | | | $ | 39,714 | |
| | |
Net investment income | | $ | 1,003,738 | | | $ | 247,388 | |
| | |
| Realized and Unrealized Gain (Loss) | | | | | | | | |
| | |
Net realized gain (loss) — | | | | | | | | |
| | |
Investment transactions | | $ | (634,673 | ) | | $ | (76,285 | ) |
| | |
Investment transactions — affiliated investment | | | 671 | | | | (81 | ) |
| | |
Net realized loss | | $ | (634,002 | ) | | $ | (76,366 | ) |
| | |
Change in unrealized appreciation (depreciation) — | | | | | | | | |
| | |
Investments | | $ | 959,562 | | | $ | 129,154 | |
| | |
Investments — affiliated investment | | | 56 | | | | (25 | ) |
| | |
Net change in unrealized appreciation (depreciation) | | $ | 959,618 | | | $ | 129,129 | |
| | |
Net realized and unrealized gain | | $ | 325,616 | | | $ | 52,763 | |
| | |
Net increase in net assets from operations | | $ | 1,329,354 | | | $ | 300,151 | |
| | | | |
| | 19 | | See Notes to Financial Statements. |
Eaton Vance
TABS Laddered Municipal Bond Funds
January 31, 2019
Statements of Changes in Net Assets
| | | | | | | | |
| | | Year Ended January 31, 2019 | |
| Increase (Decrease) in Net Assets | | 1-to-10 Year
Laddered Fund | | | 10-to-20 Year
Laddered Fund | |
| | |
From operations — | | | | | | | | |
| | |
Net investment income | | $ | 1,003,738 | | | $ | 247,388 | |
| | |
Net realized loss | | | (634,002 | ) | | | (76,366 | ) |
| | |
Net change in unrealized appreciation (depreciation) | | | 959,618 | | | | 129,129 | |
| | |
Net increase in net assets from operations | | $ | 1,329,354 | | | $ | 300,151 | |
| | |
Distributions to shareholders(1)— | | | | | | | | |
| | |
Class A | | $ | (247,716 | ) | | $ | (9,792 | ) |
| | |
Class C | | | (29,315 | ) | | | (7,954 | ) |
| | |
Class I | | | (726,703 | ) | | | (262,121 | ) |
| | |
Total distributions to shareholders | | $ | (1,003,734 | ) | | $ | (279,867 | ) |
| | |
Transactions in shares of beneficial interest — | | | | | | | | |
| | |
Proceeds from sale of shares | | | | | | | | |
| | |
Class A | | $ | 5,789,653 | | | $ | 94,543 | |
| | |
Class C | | | 1,080,335 | | | | — | |
| | |
Class I | | | 20,759,823 | | | | 399,396 | |
| | |
Net asset value of shares issued to shareholders in payment of distributions declared | | | | | | | | |
| | |
Class A | | | 236,539 | | | | 9,792 | |
| | |
Class C | | | 29,285 | | | | 7,954 | |
| | |
Class I | | | 724,053 | | | | 262,007 | |
| | |
Cost of shares redeemed | | | | | | | | |
| | |
Class A | | | (5,052,474 | ) | | | (142,366 | ) |
| | |
Class C | | | (828,665 | ) | | | (57,544 | ) |
| | |
Class I | | | (31,820,357 | ) | | | (624,783 | ) |
| | |
Net decrease in net assets from Fund share transactions | | $ | (9,081,808 | ) | | $ | (51,001 | ) |
| | |
Net decrease in net assets | | $ | (8,756,188 | ) | | $ | (30,717 | ) |
|
| Net Assets | |
| | |
At beginning of year | | $ | 62,621,148 | | | $ | 9,074,052 | |
| | |
At end of year | | $ | 53,864,960 | | | $ | 9,043,335 | |
| (1) | The current year presentation of distributions conforms with the Disclosure Update and Simplification Rule issued by the Securities and Exchange Commision, effective November 5, 2018. |
| | | | |
| | 20 | | See Notes to Financial Statements. |
Eaton Vance
TABS Laddered Municipal Bond Funds
January 31, 2019
Statements of Changes in Net Assets — continued
| | | | | | | | |
| | | Year Ended January 31, 2018 | |
| Increase (Decrease) in Net Assets | | 1-to-10 Year
Laddered Fund | | | 10-to-20 Year
Laddered Fund | |
| | |
From operations — | | | | | | | | |
| | |
Net investment income | | $ | 765,150 | | | $ | 219,905 | |
| | |
Net realized gain (loss) | | | (56,090 | ) | | | 34,290 | |
| | |
Net change in unrealized appreciation (depreciation) | | | 44,755 | | | | 149,265 | |
| | |
Net increase in net assets from operations | | $ | 753,815 | | | $ | 403,460 | |
| | |
Distributions to shareholders — | | | | | | | | |
| | |
From net investment income | | | | | | | | |
| | |
Class A | | $ | (112,233 | ) | | $ | (10,003 | ) |
| | |
Class C | | | (17,652 | ) | | | (6,500 | ) |
| | |
Class I | | | (635,003 | ) | | | (203,421 | ) |
| | |
Total distributions to shareholders | | $ | (764,888 | ) | | $ | (219,924 | ) |
| | |
Transactions in shares of beneficial interest — | | | | | | | | |
| | |
Proceeds from sale of shares | | | | | | | | |
| | |
Class A | | $ | 13,204,984 | | | $ | 98,309 | |
| | |
Class C | | | 1,812,341 | | | | 181,074 | |
| | |
Class I | | | 15,601,136 | | | | 1,946,982 | |
| | |
Net asset value of shares issued to shareholders in payment of distributions declared | | | | | | | | |
| | |
Class A | | | 104,229 | | | | 10,003 | |
| | |
Class C | | | 17,652 | | | | 6,500 | |
| | |
Class I | | | 634,090 | | | | 203,421 | |
| | |
Cost of shares redeemed | | | | | | | | |
| | |
Class A | | | (1,301,887 | ) | | | (358,312 | ) |
| | |
Class C | | | (863,649 | ) | | | (202,440 | ) |
| | |
Class I | | | (13,343,325 | ) | | | (419,810 | ) |
| | |
Net increase in net assets from Fund share transactions | | $ | 15,865,571 | | | $ | 1,465,727 | |
| | |
Net increase in net assets | | $ | 15,854,498 | | | $ | 1,649,263 | |
|
| Net Assets | |
| | |
At beginning of year | | $ | 46,766,650 | | | $ | 7,424,789 | |
| | |
At end of year(1) | | $ | 62,621,148 | | | $ | 9,074,052 | |
| (1) | Includes accumulated undistributed (distributions in excess of) net investment income of $(678) and $2,349, respectively, at January 31, 2018. The requirement to disclose the corresponding amount as of January 31, 2019 was eliminated. |
| | | | |
| | 21 | | See Notes to Financial Statements. |
Eaton Vance
TABS Laddered Municipal Bond Funds
January 31, 2019
Financial Highlights
| | | | | | | | | | | | | | | | |
| | | 1-to-10 Year Laddered Fund — Class A | |
| | |
| | | Year Ended January 31, | | | Period Ended January 31, 2016(1) | |
| | | 2019 | | | 2018 | | | 2017 | |
| | | | |
Net asset value — Beginning of period | | $ | 10.170 | | | $ | 10.120 | | | $ | 10.340 | | | $ | 10.000 | |
| | | | |
| Income (Loss) From Operations | | | | | | | | | | | | | | | | |
| | | | |
Net investment income | | $ | 0.157 | | | $ | 0.129 | | | $ | 0.120 | | | $ | 0.070 | |
| | | | |
Net realized and unrealized gain (loss) | | | 0.070 | | | | 0.050 | | | | (0.220 | ) | | | 0.340 | |
| | | | |
Total income (loss) from operations | | $ | 0.227 | | | $ | 0.179 | | | $ | (0.100 | ) | | $ | 0.410 | |
| | | | |
| Less Distributions | | | | | | | | | | | | | | | | |
| | | | |
From net investment income | | $ | (0.157 | ) | | $ | (0.129 | ) | | $ | (0.120 | ) | | $ | (0.070 | ) |
| | | | |
Total distributions | | $ | (0.157 | ) | | $ | (0.129 | ) | | $ | (0.120 | ) | | $ | (0.070 | ) |
| | | | |
Net asset value — End of period | | $ | 10.240 | | | $ | 10.170 | | | $ | 10.120 | | | $ | 10.340 | |
| | | | |
Total Return(2)(3) | | | 2.26 | % | | | 1.76 | % | | | (0.99 | )% | | | 4.12 | %(4) |
| | | | |
| Ratios/Supplemental Data | | | | | | | | | | | | | | | | |
| | | | |
Net assets, end of period (000’s omitted) | | $ | 17,978 | | | $ | 16,877 | | | $ | 5,031 | | | $ | 1,838 | |
| | | | |
Ratios (as a percentage of average daily net assets): | | | | | | | | | | | | | | | | |
| | | | |
Expenses(3) | | | 0.65 | % | | | 0.65 | % | | | 0.65 | % | | | 0.65 | %(5) |
| | | | |
Net investment income | | | 1.56 | % | | | 1.25 | % | | | 1.14 | % | | | 0.89 | %(5) |
| | | | |
Portfolio Turnover | | | 91 | % | | | 19 | % | | | 4 | % | | | 0 | % |
| (1) | For the period from the start of business, May 4, 2015, to January 31, 2016. |
| (2) | Returns are historical and are calculated by determining the percentage change in net asset value with all distributions reinvested and do not reflect the effect of sales charges. |
| (3) | The investment adviser and administrator reimbursed certain operating expenses (equal to 0.20%, 0.24%, 0.31% and 1.45% of average daily net assets for the years ended January 31, 2019, 2018 and 2017 and the period ended January 31, 2016, respectively). Absent this reimbursement, total return would be lower. |
| | | | |
| | 22 | | See Notes to Financial Statements. |
Eaton Vance
TABS Laddered Municipal Bond Funds
January 31, 2019
Financial Highlights — continued
| | | | | | | | | | | | | | | | |
| | | 1-to-10 Year Laddered Fund — Class C | |
| | |
| | | Year Ended January 31, | | | Period Ended January 31, 2016(1) | |
| | | 2019 | | | 2018 | | | 2017 | |
| | | | |
Net asset value — Beginning of period | | $ | 10.170 | | | $ | 10.120 | | | $ | 10.340 | | | $ | 10.000 | |
| | | | |
| Income (Loss) From Operations | | | | | | | | | | | | | | | | |
| | | | |
Net investment income | | $ | 0.081 | | | $ | 0.052 | | | $ | 0.041 | | | $ | 0.015 | |
| | | | |
Net realized and unrealized gain (loss) | | | 0.070 | | | | 0.050 | | | | (0.220 | ) | | | 0.340 | |
| | | | |
Total income (loss) from operations | | $ | 0.151 | | | $ | 0.102 | | | $ | (0.179 | ) | | $ | 0.355 | |
| | | | |
| Less Distributions | | | | | | | | | | | | | | | | |
| | | | |
From net investment income | | $ | (0.081 | ) | | $ | (0.052 | ) | | $ | (0.041 | ) | | $ | (0.015 | ) |
| | | | |
Total distributions | | $ | (0.081 | ) | | $ | (0.052 | ) | | $ | (0.041 | ) | | $ | (0.015 | ) |
| | | | |
Net asset value — End of period | | $ | 10.240 | | | $ | 10.170 | | | $ | 10.120 | | | $ | 10.340 | |
| | | | |
Total Return(2)(3) | | | 1.50 | % | | | 1.00 | % | | | (1.73 | )% | | | 3.55 | %(4) |
| | | | |
| Ratios/Supplemental Data | | | | | | | | | | | | | | | | |
| | | | |
Net assets, end of period (000’s omitted) | | $ | 3,951 | | | $ | 3,638 | | | $ | 2,665 | | | $ | 27 | |
| | | | |
Ratios (as a percentage of average daily net assets): | | | | | | | | | | | | | | | | |
| | | | |
Expenses(3) | | | 1.40 | % | | | 1.40 | % | | | 1.40 | % | | | 1.40 | %(5) |
| | | | |
Net investment income | | | 0.80 | % | | | 0.50 | % | | | 0.34 | % | | | 0.19 | %(5) |
| | | | |
Portfolio Turnover | | | 91 | % | | | 19 | % | | | 4 | % | | | 0 | % |
| (1) | For the period from the start of business, May 4, 2015, to January 31, 2016. |
| (2) | Returns are historical and are calculated by determining the percentage change in net asset value with all distributions reinvested and do not reflect the effect of sales charges. |
| (3) | The investment adviser and administrator reimbursed certain operating expenses (equal to 0.20%, 0.24%, 0.31% and 1.45% of average daily net assets for the years ended January 31, 2019, 2018 and 2017 and the period ended January 31, 2016, respectively). Absent this reimbursement, total return would be lower. |
| | | | |
| | 23 | | See Notes to Financial Statements. |
Eaton Vance
TABS Laddered Municipal Bond Funds
January 31, 2019
Financial Highlights — continued
| | | | | | | | | | | | | | | | |
| | | 1-to-10 Year Laddered Fund — Class I | |
| | |
| | | Year Ended January 31, | | | Period Ended January 31, 2016(1) | |
| | | 2019 | | | 2018 | | | 2017 | |
| | | | |
Net asset value — Beginning of period | | $ | 10.180 | | | $ | 10.130 | | | $ | 10.350 | | | $ | 10.000 | |
| | | | |
| Income (Loss) From Operations | | | | | | | | | | | | | | | | |
| | | | |
Net investment income | | $ | 0.182 | | | $ | 0.156 | | | $ | 0.146 | | | $ | 0.090 | |
| | | | |
Net realized and unrealized gain (loss) | | | 0.070 | | | | 0.050 | | | | (0.220 | ) | | | 0.350 | |
| | | | |
Total income (loss) from operations | | $ | 0.252 | | | $ | 0.206 | | | $ | (0.074 | ) | | $ | 0.440 | |
| | | | |
| Less Distributions | | | | | | | | | | | | | | | | |
| | | | |
From net investment income | | $ | (0.182 | ) | | $ | (0.156 | ) | | $ | (0.146 | ) | | $ | (0.090 | ) |
| | | | |
Total distributions | | $ | (0.182 | ) | | $ | (0.156 | ) | | $ | (0.146 | ) | | $ | (0.090 | ) |
| | | | |
Net asset value — End of period | | $ | 10.250 | | | $ | 10.180 | | | $ | 10.130 | | | $ | 10.350 | |
| | | | |
Total Return(2)(3) | | | 2.51 | % | | | 2.03 | % | | | (0.74 | )% | | | 4.42 | %(4) |
| | | | |
| Ratios/Supplemental Data | | | | | | | | | | | | | | | | |
| | | | |
Net assets, end of period (000’s omitted) | | $ | 31,936 | | | $ | 42,106 | | | $ | 39,070 | | | $ | 27,456 | |
| | | | |
Ratios (as a percentage of average daily net assets): | | | | | | | | | | | | | | | | |
| | | | |
Expenses(3) | | | 0.40 | % | | | 0.40 | % | | | 0.40 | % | | | 0.40 | %(5) |
| | | | |
Net investment income | | | 1.79 | % | | | 1.51 | % | | | 1.40 | % | | | 1.14 | %(5) |
| | | | |
Portfolio Turnover | | | 91 | % | | | 19 | % | | | 4 | % | | | 0 | % |
| (1) | For the period from the start of business, May 4, 2015, to January 31, 2016. |
| (2) | Returns are historical and are calculated by determining the percentage change in net asset value with all distributions reinvested. |
| (3) | The investment adviser and administrator reimbursed certain operating expenses (equal to 0.20%, 0.24%, 0.31% and 1.45% of average daily net assets for the years ended January 31, 2019, 2018 and 2017 and the period ended January 31, 2016, respectively). Absent this reimbursement, total return would be lower. |
| | | | |
| | 24 | | See Notes to Financial Statements. |
Eaton Vance
TABS Laddered Municipal Bond Funds
January 31, 2019
Financial Highlights — continued
| | | | | | | | | | | | | | | | |
| | | 10-to-20 Year Laddered Fund — Class A | |
| | |
| | | Year Ended January 31, | | | Period Ended January 31, 2016(1) | |
| | | 2019 | | | 2018 | | | 2017 | |
| | | | |
Net asset value — Beginning of period | | $ | 10.530 | | | $ | 10.260 | | | $ | 10.610 | | | $ | 10.000 | |
| | | | |
| Income (Loss) From Operations | | | | | | | | | | | | | | | | |
| | | | |
Net investment income | | $ | 0.272 | | | $ | 0.255 | | | $ | 0.255 | | | $ | 0.192 | |
| | | | |
Net realized and unrealized gain (loss) | | | 0.068 | | | | 0.270 | | | | (0.336 | ) | | | 0.610 | |
| | | | |
Total income (loss) from operations | | $ | 0.340 | | | $ | 0.525 | | | $ | (0.081 | ) | | $ | 0.802 | |
| | | | |
| Less Distributions | | | | | | | | | | | | | | | | |
| | | | |
From net investment income | | $ | (0.271 | ) | | $ | (0.255 | ) | | $ | (0.254 | ) | | $ | (0.192 | ) |
| | | | |
From net realized gain | | | (0.039 | ) | | | — | | | | (0.015 | ) | | | — | |
| | | | |
Total distributions | | $ | (0.310 | ) | | $ | (0.255 | ) | | $ | (0.269 | ) | | $ | (0.192 | ) |
| | | | |
Net asset value — End of period | | $ | 10.560 | | | $ | 10.530 | | | $ | 10.260 | | | $ | 10.610 | |
| | | | |
Total Return(2)(3) | | | 3.30 | % | | | 5.14 | % | | | (0.82 | )% | | | 8.11 | %(4) |
| | | | |
| Ratios/Supplemental Data | | | | | | | | | | | | | | | | |
| | | | |
Net assets, end of period (000’s omitted) | | $ | 297 | | | $ | 336 | | | $ | 574 | | | $ | 345 | |
| | | | |
Ratios (as a percentage of average daily net assets): | | | | | | | | | | | | | | | | |
| | | | |
Expenses(3) | | | 0.65 | % | | | 0.65 | % | | | 0.65 | % | | | 0.65 | %(5) |
| | | | |
Net investment income | | | 2.59 | % | | | 2.44 | % | | | 2.35 | % | | | 2.28 | %(5) |
| | | | |
Portfolio Turnover | | | 44 | % | | | 53 | % | | | 16 | % | | | 0 | % |
| (1) | For the period from the start of business, May 4, 2015, to January 31, 2016. |
| (2) | Returns are historical and are calculated by determining the percentage change in net asset value with all distributions reinvested and do not reflect the effect of sales charges. |
| (3) | The investment adviser and administrator reimbursed certain operating expenses (equal to 1.25%, 1.42%, 1.50% and 3.35% of average daily net assets for the years ended January 31, 2019, 2018 and 2017 and the period ended January 31, 2016, respectively). Absent this reimbursement, total return would be lower. |
| | | | |
| | 25 | | See Notes to Financial Statements. |
Eaton Vance
TABS Laddered Municipal Bond Funds
January 31, 2019
Financial Highlights — continued
| | | | | | | | | | | | | | | | |
| | | 10-to-20 Year Laddered Fund — Class C | |
| | |
| | | Year Ended January 31, | | | Period Ended
January 31, 2016(1) | |
| | | 2019 | | | 2018 | | | 2017 | |
| | | | |
Net asset value — Beginning of period | | $ | 10.540 | | | $ | 10.270 | | | $ | 10.620 | | | $ | 10.000 | |
| | | | |
| Income (Loss) From Operations | | | | | | | | | | | | | | | | |
| | | | |
Net investment income | | $ | 0.194 | | | $ | 0.176 | | | $ | 0.174 | | | $ | 0.134 | |
| | | | |
Net realized and unrealized gain (loss) | | | 0.068 | | | | 0.270 | | | | (0.335 | ) | | | 0.619 | |
| | | | |
Total income (loss) from operations | | $ | 0.262 | | | $ | 0.446 | | | $ | (0.161 | ) | | $ | 0.753 | |
| | | | |
| Less Distributions | | | | | | | | | | | | | | | | |
| | | | |
From net investment income | | $ | (0.193 | ) | | $ | (0.176 | ) | | $ | (0.174 | ) | | $ | (0.133 | ) |
| | | | |
From net realized gain | | | (0.039 | ) | | | — | | | | (0.015 | ) | | | — | |
| | | | |
Total distributions | | $ | (0.232 | ) | | $ | (0.176 | ) | | $ | (0.189 | ) | | $ | (0.133 | ) |
| | | | |
Net asset value — End of period | | $ | 10.570 | | | $ | 10.540 | | | $ | 10.270 | | | $ | 10.620 | |
| | | | |
Total Return(2)(3) | | | 2.53 | % | | | 4.35 | % | | | (1.56 | )% | | | 7.58 | %(4) |
| | | | |
| Ratios/Supplemental Data | | | | | | | | | | | | | | | | |
| | | | |
Net assets, end of period (000’s omitted) | | $ | 331 | | | $ | 380 | | | $ | 385 | | | $ | 192 | |
| | | | |
Ratios (as a percentage of average daily net assets): | | | | | | | | | | | | | | | | |
| | | | |
Expenses(3) | | | 1.40 | % | | | 1.40 | % | | | 1.40 | % | | | 1.40 | %(5) |
| | | | |
Net investment income | | | 1.85 | % | | | 1.66 | % | | | 1.59 | % | | | 1.59 | %(5) |
| | | | |
Portfolio Turnover | | | 44 | % | | | 53 | % | | | 16 | % | | | 0 | % |
| (1) | For the period from the start of business, May 4, 2015, to January 31, 2016. |
| (2) | Returns are historical and are calculated by determining the percentage change in net asset value with all distributions reinvested and do not reflect the effect of sales charges. |
| (3) | The investment adviser and administrator reimbursed certain operating expenses (equal to 1.25%, 1.42%, 1.50% and 3.35% of average daily net assets for the years ended January 31, 2019, 2018 and 2017 and the period ended January 31, 2016, respectively). Absent this reimbursement, total return would be lower. |
| | | | |
| | 26 | | See Notes to Financial Statements. |
Eaton Vance
TABS Laddered Municipal Bond Funds
January 31, 2019
Financial Highlights — continued
| | | | | | | | | | | | | | | | |
| | | 10-to-20 Year Laddered Fund — Class I | |
| | |
| | | Year Ended January 31, | | | Period Ended
January 31, 2016(1) | |
| | | 2019 | | | 2018 | | | 2017 | |
| | | | |
Net asset value — Beginning of period | | $ | 10.530 | | | $ | 10.270 | | | $ | 10.610 | | | $ | 10.000 | |
| | | | |
| Income (Loss) From Operations | | | | | | | | | | | | | | | | |
| | | | |
Net investment income | | $ | 0.298 | | | $ | 0.281 | | | $ | 0.281 | | | $ | 0.217 | |
| | | | |
Net realized and unrealized gain (loss) | | | 0.069 | | | | 0.261 | | | | (0.325 | ) | | | 0.607 | |
| | | | |
Total income (loss) from operations | | $ | 0.367 | | | $ | 0.542 | | | $ | (0.044 | ) | | $ | 0.824 | |
| | | | |
| Less Distributions | | | | | | | | | | | | | | | | |
| | | | |
From net investment income | | $ | (0.298 | ) | | $ | (0.282 | ) | | $ | (0.281 | ) | | $ | (0.214 | ) |
| | | | |
From net realized gain | | | (0.039 | ) | | | — | | | | (0.015 | ) | | | — | |
| | | | |
Total distributions | | $ | (0.337 | ) | | $ | (0.282 | ) | | $ | (0.296 | ) | | $ | (0.214 | ) |
| | | | |
Net asset value — End of period | | $ | 10.560 | | | $ | 10.530 | | | $ | 10.270 | | | $ | 10.610 | |
| | | | |
Total Return(2)(3) | | | 3.56 | % | | | 5.30 | % | | | (0.47 | )% | | | 8.33 | %(4) |
| | | | |
| Ratios/Supplemental Data | | | | | | | | | | | | | | | | |
| | | | |
Net assets, end of period (000’s omitted) | | $ | 8,415 | | | $ | 8,358 | | | $ | 6,465 | | | $ | 5,540 | |
| | | | |
Ratios (as a percentage of average daily net assets): | | | | | | | | | | | | | | | | |
| | | | |
Expenses(3) | | | 0.40 | % | | | 0.40 | % | | | 0.40 | % | | | 0.40 | %(5) |
| | | | |
Net investment income | | | 2.85 | % | | | 2.65 | % | | | 2.61 | % | | | 2.81 | %(5) |
| | | | |
Portfolio Turnover | | | 44 | % | | | 53 | % | | | 16 | % | | | 0 | % |
| (1) | For the period from the start of business, May 4, 2015, to January 31, 2016. |
| (2) | Returns are historical and are calculated by determining the percentage change in net asset value with all distributions reinvested. |
| (3) | The investment adviser and administrator reimbursed certain operating expenses (equal to 1.25%, 1.42%, 1.50% and 3.35% of average daily net assets for the years ended January 31, 2019, 2018 and 2017 and the period ended January 31, 2016, respectively). Absent this reimbursement, total return would be lower. |
| | | | |
| | 27 | | See Notes to Financial Statements. |
Eaton Vance
TABS Laddered Municipal Bond Funds
January 31, 2019
Notes to Financial Statements
1 Significant Accounting Policies
Eaton Vance Municipals Trust II (the Trust) is a Massachusetts business trust registered under the Investment Company Act of 1940, as amended (the 1940 Act), as an open-end management investment company. The Trust presently consists of six funds, two of which, each diversified, are included in these financial statements. They include Eaton Vance TABS 1-to-10 Year Laddered Municipal Bond Fund (1-to-10 Year Laddered Fund) and Eaton Vance TABS 10-to-20 Year Laddered Municipal Bond Fund (10-to-20 Year Laddered Fund), (each individually referred to as the Fund, and collectively, the Funds). The Funds’ investment objective is to provide current income exempt from regular federal income tax. The Funds offer three classes of shares. Class A shares are generally sold subject to a sales charge imposed at time of purchase. Class C shares are sold at net asset value and are generally subject to a contingent deferred sales charge (see Note 5). Class I shares are sold at net asset value and are not subject to a sales charge. Effective January 25, 2019, Class C shares generally automatically convert to Class A shares ten years after their purchase as described in the Funds’ prospectus. Each class represents a pro-rata interest in the Fund, but votes separately on class-specific matters and (as noted below) is subject to different expenses. Realized and unrealized gains and losses are allocated daily to each class of shares based on the relative net assets of each class to the total net assets of the Fund. Net investment income, other than class-specific expenses, is allocated daily to each class of shares based upon the ratio of the value of each class’s paid shares to the total value of all paid shares. Each class of shares differs in its distribution plan and certain other class-specific expenses.
The following is a summary of significant accounting policies of the Funds. The policies are in conformity with accounting principles generally accepted in the United States of America (U.S. GAAP). Each Fund is an investment company and follows accounting and reporting guidance in the Financial Accounting Standards Board (FASB) Accounting Standards Codification Topic 946.
A Investment Valuation — The following methodologies are used to determine the market value or fair value of investments.
Debt Obligations. Debt obligations are generally valued on the basis of valuations provided by third party pricing services, as derived from such services’ pricing models. Inputs to the models may include, but are not limited to, reported trades, executable bid and ask prices, broker/dealer quotations, prices or yields of securities with similar characteristics, interest rates, anticipated prepayments, benchmark curves or information pertaining to the issuer, as well as industry and economic events. The pricing services may use a matrix approach, which considers information regarding securities with similar characteristics to determine the valuation for a security. Short-term debt obligations purchased with a remaining maturity of sixty days or less for which a valuation from a third party pricing service is not readily available may be valued at amortized cost, which approximates fair value.
Affiliated Fund.The Funds may invest in Eaton Vance Cash Reserves Fund, LLC (Cash Reserves Fund), an affiliated investment company managed by Eaton Vance Management (EVM). While Cash Reserves Fund is not a registered money market mutual fund, it conducts all of its investment activities in accordance with the requirements of Rule 2a-7 under the 1940 Act. Investments in Cash Reserves Fund are valued at the closing net asset value per unit on the valuation day. Cash Reserves Fund generally values its investment securities based on available market quotations provided by a third party pricing service.
Fair Valuation. Investments for which valuations or market quotations are not readily available or are deemed unreliable are valued at fair value using methods determined in good faith by or at the direction of the Trustees of a Fund in a manner that fairly reflects the security’s value, or the amount that a Fund might reasonably expect to receive for the security upon its current sale in the ordinary course. Each such determination is based on a consideration of relevant factors, which are likely to vary from one pricing context to another. These factors may include, but are not limited to, the type of security, the existence of any contractual restrictions on the security’s disposition, the price and extent of public trading in similar securities of the issuer or of comparable entities, quotations or relevant information obtained from broker/dealers or other market participants, information obtained from the issuer, analysts, and/or the appropriate stock exchange (for exchange-traded securities), an analysis of the entity’s financial condition, and an evaluation of the forces that influence the issuer and the market(s) in which the security is purchased and sold.
B Investment Transactions and Related Income — Investment transactions for financial statement purposes are accounted for on a trade date basis. Realized gains and losses on investments sold are determined on the basis of identified cost. Interest income is recorded on the basis of interest accrued, adjusted for amortization of premium or accretion of discount. Dividend income is recorded on the ex-dividend date for dividends received in cash and/or securities.
C Federal Taxes — Each Fund’s policy is to comply with the provisions of the Internal Revenue Code applicable to regulated investment companies and to distribute to shareholders each year substantially all of its taxable, if any, and tax-exempt net investment income, and all or substantially all of its net realized capital gains. Accordingly, no provision for federal income or excise tax is necessary. Each Fund intends to satisfy conditions which will enable it to designate distributions from the interest income generated by its investments in municipal obligations, which are exempt from regular federal income tax when received by each Fund, as exempt-interest dividends. The portion of such interest, if any, earned on private activity bonds issued after August 7, 1986, may be considered a tax preference item to shareholders.
As of January 31, 2019, the Funds had no uncertain tax positions that would require financial statement recognition, de-recognition, or disclosure. Each Fund files a U.S. federal income tax return annually after its fiscal year-end, which is subject to examination by the Internal Revenue Service for a period of three years from the date of filing.
D Expenses — The majority of expenses of the Trust are directly identifiable to an individual fund. Expenses which are not readily identifiable to a specific fund are allocated taking into consideration, among other things, the nature and type of expense and the relative size of the funds.
Eaton Vance
TABS Laddered Municipal Bond Funds
January 31, 2019
Notes to Financial Statements — continued
E Legal Fees — Legal fees and other related expenses incurred as part of negotiations of the terms and requirement of capital infusions, or that are expected to result in the restructuring of, or a plan of reorganization for, an investment are recorded as realized losses. Ongoing expenditures to protect or enhance an investment are treated as operating expenses.
F Use of Estimates — The preparation of the financial statements in conformity with U.S. GAAP requires management to make estimates and assumptions that affect the reported amounts of assets and liabilities at the date of the financial statements and the reported amounts of income and expense during the reporting period. Actual results could differ from those estimates.
G Indemnifications — Under the Trust’s organizational documents, its officers and Trustees may be indemnified against certain liabilities and expenses arising out of the performance of their duties to the Funds. Under Massachusetts law, if certain conditions prevail, shareholders of a Massachusetts business trust (such as the Trust) could be deemed to have personal liability for the obligations of the Trust. However, the Trust’s Declaration of Trust contains an express disclaimer of liability on the part of Fund shareholders and the By-laws provide that the Trust shall assume the defense on behalf of any Fund shareholders. Moreover, the By-laws also provide for indemnification out of Fund property of any shareholder held personally liable solely by reason of being or having been a shareholder for all loss or expense arising from such liability. Additionally, in the normal course of business, each Fund enters into agreements with service providers that may contain indemnification clauses. Each Fund’s maximum exposure under these arrangements is unknown as this would involve future claims that may be made against each Fund that have not yet occurred.
2 Distributions to Shareholders and Income Tax Information
The net investment income of each Fund is determined daily and substantially all of the net investment income so determined is declared as a dividend to shareholders of record at the time of declaration. Distributions are declared separately for each class of shares. Distributions are paid monthly. Distributions of realized capital gains are made at least annually. Shareholders may reinvest income and capital gain distributions in additional shares of the same class of a Fund at the net asset value as of the reinvestment date or, at the election of the shareholder, receive distributions in cash. Distributions to shareholders are determined in accordance with income tax regulations, which may differ from U.S. GAAP. As required by U.S. GAAP, only distributions in excess of tax basis earnings and profits are reported in the financial statements as a return of capital. Permanent differences between book and tax accounting relating to distributions are reclassified to paid-in capital. For tax purposes, distributions from short-term capital gains are considered to be from ordinary income.
The tax character of distributions declared for the years ended January 31, 2019 and January 31, 2018 was as follows:
| | | | | | | | |
| | | Year Ended January 31, 2019 | |
| | | 1-to-10 Year
Laddered Fund | | | 10-to-20 Year
Laddered Fund | |
| | |
Tax-exempt income | | $ | 918,541 | | | $ | 237,693 | |
| | |
Ordinary income | | $ | 85,193 | | | $ | 9,703 | |
| | |
Long-term capital gains | | $ | — | | | $ | 32,471 | |
| |
| | | Year Ended January 31, 2018 | |
| | | 1-to-10 Year
Laddered Fund | | | 10-to-20 Year
Laddered Fund | |
| | |
Tax-exempt income | | $ | 699,505 | | | $ | 212,339 | |
| | |
Ordinary income | | $ | 65,383 | | | $ | 7,585 | |
During the year ended January 31, 2019, the following amounts were reclassified for 1-to-10 Year Laddered Fund due to differences between book and tax accounting, primarily for tax treatment of distributions in excess of net tax-exempt income. These reclassifications had no effect on the net assets or net asset value per share of the Fund.
| | | | |
| | | 1-to-10 Year
Laddered Fund | |
| |
Paid-in capital | | $ | (12,921 | ) |
| |
Distributable earnings | | $ | 12,921 | |
Eaton Vance
TABS Laddered Municipal Bond Funds
January 31, 2019
Notes to Financial Statements — continued
As of January 31, 2019, the components of distributable earnings (accumulated loss) on a tax basis were as follows:
| | | | | | | | |
| | | 1-to-10 Year
Laddered Fund | | | 10-to-20 Year
Laddered Fund | |
| | |
Undistributed tax-exempt income | | $ | — | | | $ | 1,218 | |
| | |
Deferred capital losses | | $ | (702,719 | ) | | $ | (76,285 | ) |
| | |
Net unrealized appreciation | | $ | 711,250 | | | $ | 280,133 | |
| | |
Distributions payable | | $ | (1,105 | ) | | $ | — | |
At January 31, 2019, each Fund, for federal income tax purposes, had deferred capital losses which would reduce the respective Fund’s taxable income arising from future net realized gains on investment transactions, if any, to the extent permitted by the Internal Revenue Code, and thus would reduce the amount of distributions to shareholders, which would otherwise be necessary to relieve each Fund of any liability for federal income or excise tax. The deferred capital losses are treated as arising on the first day of each Fund’s next taxable year and retain the same short-term or long-term character as when originally deferred. The amounts of the deferred capital losses are as follows:
| | | | | | | | |
| | | 1-to-10 Year
Laddered Fund | | | 10-to-20 Year
Laddered Fund | |
| | |
Deferred Capital Losses | | | | | | | | |
| | |
Short-term | | $ | 489,630 | | | $ | 69,766 | |
| | |
Long-term | | $ | 213,089 | | | $ | 6,519 | |
The cost and unrealized appreciation (depreciation) of investments of each Fund at January 31, 2019, as determined on a federal income tax basis, were as follows:
| | | | | | | | |
| | | 1-to-10 Year
Laddered Fund | | | 10-to-20 Year
Laddered Fund | |
| | |
Aggregate cost | | $ | 58,713,827 | | | $ | 8,735,285 | |
| | |
Gross unrealized appreciation | | $ | 749,245 | | | $ | 298,285 | |
| | |
Gross unrealized depreciation | | | (37,995 | ) | | | (18,152 | ) |
| | |
Net unrealized appreciation | | $ | 711,250 | | | $ | 280,133 | |
3 Investment Adviser and Administration Fee and Other Transactions with Affiliates
The investment adviser and administration fee is earned by EVM as compensation for investment advisory and administrative services rendered to each Fund. The fee is based upon a percentage of average daily net assets as presented in the following table and is payable monthly.
| | | | | | | | |
| | | Annual Asset Rate | |
| Daily Net Assets | | 1-to-10 Year
Laddered Fund | | | 10-to-20 Year
Laddered Fund | |
| | |
Up to $1 billion | | | 0.32 | % | | | 0.32 | % |
Eaton Vance
TABS Laddered Municipal Bond Funds
January 31, 2019
Notes to Financial Statements — continued
On average daily net assets of $1 billion or more, the rates are reduced. The Funds invest their cash in Cash Reserves Fund. EVM does not currently receive a fee for advisory services provided to Cash Reserves Fund. For the year ended January 31, 2019, investment adviser and administration fees incurred by the Funds and the effective annual rates, as a percentage of average daily net assets, were as follows:
| | | | | | | | |
| | | 1-to-10 Year
Laddered Fund | | | 10-to-20 Year
Laddered Fund | |
| | |
Investment Adviser and Administration Fee | | $ | 193,026 | | | $ | 28,271 | |
| | |
Effective Annual Rate | | | 0.32 | % | | | 0.32 | % |
EVM has agreed to reimburse each Fund’s expenses to the extent that total annual operating expenses (relating to ordinary operating expenses only) exceed 0.65%, 1.40% and 0.40% of each Fund’s average daily net assets for Class A, Class C and Class I, respectively. These agreements may be changed or terminated after May 31, 2019. Pursuant to these agreements, EVM was allocated $119,877 and $110,102 of operating expenses of the 1-to-10 Year Laddered Fund and the 10-to-20 Year Laddered Fund, respectively, for the year ended January 31, 2019.
EVM provides sub-transfer agency and related services to the Funds pursuant to a Sub-Transfer Agency Support Services Agreement. Eaton Vance Distributors, Inc. (EVD), an affiliate of EVM and the Funds’ principal underwriter, received a portion of the sales charge on sales of Class A shares of the Funds. EVD also received distribution and service fees from Class A and Class C shares (see Note 4) and contingent deferred sales charges (see Note 5). Sub-transfer agent fees earned by EVM, which are included in transfer and dividend disbursing agent fees on the Statements of Operations, and Class A sales charges that the Funds were informed were received by EVD for the year ended January 31, 2019 were as follows:
| | | | | | | | |
| | | 1-to-10 Year
Laddered Fund | | | 10-to-20 Year
Laddered Fund | |
| | |
EVM’s Sub-Transfer Agent Fees | | $ | 1,316 | | | $ | 755 | |
| | |
EVD’s Class A Sales Charges | | $ | 2,587 | | | $ | — | |
Trustees and officers of the Funds who are members of EVM’s organization receive remuneration for their services to the Funds out of the investment adviser and administration fee. Trustees of the Funds who are not affiliated with EVM may elect to defer receipt of all or a percentage of their annual fees in accordance with the terms of the Trustees Deferred Compensation Plan. For the year ended January 31, 2019, no significant amounts have been deferred. Certain officers and Trustees of the Funds are officers of EVM.
4 Distribution Plans
Each Fund has in effect a distribution plan for Class A shares (Class A Plan) pursuant to Rule 12b-1 under the 1940 Act. Pursuant to the Class A Plan, each Fund pays EVD a distribution and service fee of 0.25% per annum of its average daily net assets attributable to Class A shares for distribution services and facilities provided to each Fund by EVD, as well as for personal services and/or the maintenance of shareholder accounts. Distribution and service fees paid or accrued to EVD for the year ended January 31, 2019 for Class A shares amounted to the following:
| | | | | | | | |
| | | 1-to-10 Year
Laddered Fund | | | 10-to-20 Year
Laddered Fund | |
| | |
Class A Distribution and Service Fees | | $ | 39,755 | | | $ | 815 | |
Each Fund also has in effect a distribution plan for Class C shares (Class C Plan) pursuant to Rule 12b-1 under the 1940 Act. Pursuant to the Class C Plan, each Fund pays EVD amounts equal to 0.75% per annum of its average daily net assets attributable to Class C shares for providing ongoing distribution services and facilities to the Funds. For the year ended January 31, 2019, the Funds paid or accrued to EVD the following distribution fees:
| | | | | | | | |
| | | 1-to-10 Year
Laddered Fund | | | 10-to-20 Year
Laddered Fund | |
| | |
Class C Distribution Fees | | $ | 27,436 | | | $ | 2,669 | |
Eaton Vance
TABS Laddered Municipal Bond Funds
January 31, 2019
Notes to Financial Statements — continued
Pursuant to the Class C Plan, the Funds also make payments of service fees to EVD, financial intermediaries and other persons in amounts equal to 0.25% per annum of the average daily net assets attributable to Class C shares. Service fees paid or accrued are for personal services and/or the maintenance of shareholder accounts. They are separate and distinct from the sales commissions and distribution fees payable to EVD. Service fees paid or accrued for the year ended January 31, 2019 amounted to the following:
| | | | | | | | |
| | | 1-to-10 Year
Laddered Fund | | | 10-to-20 Year
Laddered Fund | |
| | |
Class C Service Fees | | $ | 9,145 | | | $ | 890 | |
Distribution and service fees are subject to the limitations contained in the Financial Industry Regulatory Authority Rule 2341(d).
5 Contingent Deferred Sales Charges
A contingent deferred sales charge (CDSC) of 1% generally is imposed on redemptions of Class C shares made within one year of purchase. Class A shares may be subject to a 1% CDSC if redeemed within eighteen months of purchase (depending on the circumstances of purchase). Generally, the CDSC is based upon the lower of the net asset value at date of redemption or date of purchase. No charge is levied on shares acquired by reinvestment of dividends or capital gain distributions. For the year ended January 31, 2019, the Funds were informed that EVD received approximately the following amounts of CDSCs paid by Class A and Class C shareholders:
| | | | | | | | |
| | | 1-to-10 Year
Laddered Fund | | | 10-to-20 Year
Laddered Fund | |
| | |
Class A | | $ | 3,000 | | | $ | — | |
| | |
Class C | | $ | 2,000 | | | $ | — | |
6 Purchases and Sales of Investments
Purchases and sales of investments, other than short-term obligations, for the year ended January 31, 2019 were as follows:
| | | | | | | | |
| | | 1-to-10 Year
Laddered Fund | | | 10-to-20 Year
Laddered Fund | |
| | |
Purchases | | $ | 51,620,290 | | | $ | 3,721,700 | |
| | |
Sales | | $ | 59,354,703 | | | $ | 3,845,480 | |
7 Shares of Beneficial Interest
Each Fund’s Declaration of Trust permits the Trustees to issue an unlimited number of full and fractional shares of beneficial interest (without par value). Such shares may be issued in a number of different series (such as the Funds) and classes. Transactions in Fund shares were as follows:
| | | | | | | | | | | | |
1-to-10 Year Laddered Fund | | | | | | | | | |
| | | Year Ended January 31, 2019 | |
| | | Class A | | | Class C | | | Class I | |
| | | |
Sales | | | 570,425 | | | | 106,559 | | | | 2,044,610 | |
| | | |
Issued to shareholders electing to receive payments of distributions in Fund shares | | | 23,333 | | | | 2,889 | | | | 71,394 | |
| | | |
Redemptions | | | (498,829 | ) | | | (81,650 | ) | | | (3,138,663 | ) |
| | | |
Net increase (decrease) | | | 94,929 | | | | 27,798 | | | | (1,022,659 | ) |
Eaton Vance
TABS Laddered Municipal Bond Funds
January 31, 2019
Notes to Financial Statements — continued
| | | | | | | | | | | | |
| | | Year Ended January 31, 2018 | |
| | | Class A | | | Class C | | | Class I | |
| | | |
Sales | | | 1,279,086 | | | | 176,932 | | | | 1,516,813 | |
| | | |
Issued to shareholders electing to receive payments of distributions in Fund shares | | | 10,162 | | | | 1,718 | | | | 61,687 | |
| | | |
Redemptions | | | (126,453 | ) | | | (84,160 | ) | | | (1,297,360 | ) |
| | | |
Net increase | | | 1,162,795 | | | | 94,490 | | | | 281,140 | |
| | | |
10-to-20 Year Laddered Fund | | | | | | | | | |
| | | Year Ended January 31, 2019 | |
| | | Class A | | | Class C | | | Class I | |
| | | |
Sales | | | 9,017 | | | | — | | | | 38,124 | |
| | | |
Issued to shareholders electing to receive payments of distributions in Fund shares | | | 937 | | | | 759 | | | | 25,077 | |
| | | |
Redemptions | | | (13,714 | ) | | | (5,510 | ) | | | (59,821 | ) |
| | | |
Net increase (decrease) | | | (3,760 | ) | | | (4,751 | ) | | | 3,380 | |
| |
| | | Year Ended January 31, 2018 | |
| | | Class A | | | Class C | | | Class I | |
| | | |
Sales | | | 9,223 | | | | 17,004 | | | | 183,796 | |
| | | |
Issued to shareholders electing to receive payments of distributions in Fund shares | | | 949 | | | | 615 | | | | 19,236 | |
| | | |
Redemptions | | | (34,229 | ) | | | (19,059 | ) | | | (39,210 | ) |
| | | |
Net increase (decrease) | | | (24,057 | ) | | | (1,440 | ) | | | 163,822 | |
At January 31, 2019, EVM owned 65.0% of the value of the outstanding shares of the 10-to-20 Year Laddered Fund.
8 Line of Credit
The Funds participate with other portfolios and funds managed by EVM and its affiliates in a $625 million unsecured line of credit agreement with a group of banks, which is in effect through October 29, 2019. Borrowings are made by the Funds solely to facilitate the handling of unusual and/or unanticipated short-term cash requirements. Interest is charged to each Fund based on its borrowings at an amount above either the Eurodollar rate or Federal Funds rate. In addition, a fee computed at an annual rate of 0.15% on the daily unused portion of the line of credit is allocated among the participating portfolios and funds at the end of each quarter. Because the line of credit is not available exclusively to the Funds, a Fund may be unable to borrow some or all of its requested amounts at any particular time. The Funds did not have any significant borrowings or allocated fees during the year ended January 31, 2019.
9 Fair Value Measurements
Under generally accepted accounting principles for fair value measurements, a three-tier hierarchy to prioritize the assumptions, referred to as inputs, is used in valuation techniques to measure fair value. The three-tier hierarchy of inputs is summarized in the three broad levels listed below.
| • | | Level 1 – quoted prices in active markets for identical investments |
| • | | Level 2 – other significant observable inputs (including quoted prices for similar investments, interest rates, prepayment speeds, credit risk, etc.) |
| • | | Level 3 – significant unobservable inputs (including a fund’s own assumptions in determining the fair value of investments) |
In cases where the inputs used to measure fair value fall in different levels of the fair value hierarchy, the level disclosed is determined based on the lowest level input that is significant to the fair value measurement in its entirety. The inputs or methodology used for valuing securities are not necessarily an indication of the risk associated with investing in those securities.
Eaton Vance
TABS Laddered Municipal Bond Funds
January 31, 2019
Notes to Financial Statements — continued
At January 31, 2019, the hierarchy of inputs used in valuing the Funds’ investments, which are carried at value, were as follows:
| | | | | | | | | | | | | | | | |
1-to-10 Year Laddered Fund | | | | | | | | | | | | |
| Asset Description | | Level 1 | | | Level 2 | | | Level 3 | | | Total | |
| | | | |
Tax-Exempt Investments | | $ | — | | | $ | 51,226,845 | | | $ | — | | | $ | 51,226,845 | |
| | | | |
Short-Term Investments | | | — | | | | 8,198,232 | | | | — | | | | 8,198,232 | |
| | | | |
Total Investments | | $ | — | | | $ | 59,425,077 | | | $ | — | | | $ | 59,425,077 | |
| | | | | | | | | | | | | | | | |
10-to-20 Year Laddered Fund | | | | | | | | | | | | |
| Asset Description | | Level 1 | | | Level 2 | | | Level 3 | | | Total | |
| | | | |
Tax-Exempt Investments | | $ | — | | | $ | 8,574,975 | | | $ | — | | | $ | 8,574,975 | |
| | | | |
Short-Term Investments | | | — | | | | 440,443 | | | | — | | | | 440,443 | |
| | | | |
Total Investments | | $ | — | | | $ | 9,015,418 | | | $ | — | | | $ | 9,015,418 | |
Eaton Vance
TABS Laddered Municipal Bond Funds
January 31, 2019
Report of Independent Registered Public Accounting Firm
To the Trustees of Eaton Vance Municipals Trust II and Shareholders of Eaton Vance TABS 1-to-10 Year Laddered Municipal Bond Fund and Eaton Vance TABS 10-to-20 Year Laddered Municipal Bond Fund:
Opinion on the Financial Statements and Financial Highlights
We have audited the accompanying statements of assets and liabilities of Eaton Vance TABS 1-to-10 Year Laddered Municipal Bond Fund and Eaton Vance TABS 10-to-20 Year Laddered Municipal Bond Fund (collectively, the “Funds”) (certain of the funds constituting Eaton Vance Municipals Trust II), including the portfolios of investments, as of January 31, 2019, the related statements of operations for the year then ended, the statements of changes in net assets for each of the two years in the period then ended, the financial highlights for each of the three years in the period then ended and the period from the start of business, May 4, 2015, to January 31, 2016, and the related notes. In our opinion, the financial statements and financial highlights present fairly, in all material respects, the financial position of the Funds as of January 31, 2019, and the results of their operations for the year then ended, the changes in their net assets for each of the two years in the period then ended, and the financial highlights for each of the three years in the period then ended and the period from the start of business, May 4, 2015, to January 31, 2016, in conformity with accounting principles generally accepted in the United States of America.
Basis for Opinion
These financial statements and financial highlights are the responsibility of the Funds’ management. Our responsibility is to express an opinion on the Funds’ financial statements and financial highlights based on our audits. We are a public accounting firm registered with the Public Company Accounting Oversight Board (United States) (PCAOB) and are required to be independent with respect to the Funds in accordance with the U.S. federal securities laws and the applicable rules and regulations of the Securities and Exchange Commission and the PCAOB.
We conducted our audits in accordance with the standards of the PCAOB. Those standards require that we plan and perform the audits to obtain reasonable assurance about whether the financial statements and financial highlights are free of material misstatement, whether due to error or fraud. The Funds are not required to have, nor were we engaged to perform, an audit of their internal control over financial reporting. As part of our audits we are required to obtain an understanding of internal control over financial reporting but not for the purpose of expressing an opinion on the effectiveness of the Funds’ internal control over financial reporting. Accordingly, we express no such opinion.
Our audits included performing procedures to assess the risks of material misstatement of the financial statements and financial highlights, whether due to error or fraud, and performing procedures that respond to those risks. Such procedures included examining, on a test basis, evidence regarding the amounts and disclosures in the financial statements and financial highlights. Our audits also included evaluating the accounting principles used and significant estimates made by management, as well as evaluating the overall presentation of the financial statements and financial highlights. Our procedures included confirmation of securities owned as of January 31, 2019, by correspondence with the custodian and brokers; when replies were not received from brokers, we performed other auditing procedures. We believe that our audits provide a reasonable basis for our opinion.
/s/ Deloitte & Touche LLP
Boston, Massachusetts
March 21, 2019
We have served as the auditor of one or more Eaton Vance investment companies since 1959.
Eaton Vance
TABS Laddered Municipal Bond Funds
January 31, 2019
Federal Tax Information (Unaudited)
The Form 1099-DIV you receive in February 2020 will show the tax status of all distributions paid to your account in calendar year 2019. Shareholders are advised to consult their own tax adviser with respect to the tax consequences of their investment in a Fund. As required by the Internal Revenue Code and/or regulations, shareholders must be notified regarding exempt interest dividends.
Exempt-Interest Dividends. For the fiscal year ended January 31, 2019, the Funds designate the following percentages of distributions from net investment income as exempt-interest dividends:
| | | | |
| |
TABS 1-to-10 Year Laddered Municipal Bond Fund | | | 91.51 | % |
| |
TABS 10-to-20 Year Laddered Municipal Bond Fund | | | 96.08 | % |
Eaton Vance
TABS Laddered Municipal Bond Funds
January 31, 2019
Special Meeting of Shareholders (Unaudited)
Each Fund held a Special Meeting of Shareholders on September 20, 2018 to elect the five Trustees listed below. The other Trustees named herein continue to serve as Trustees. The results of the vote with respect to each Fund were as follows:
| | | | | | | | | | | | | | | | |
| | | TABS 1-to-10 Year
Laddered Municipal
Bond Fund | | | TABS 10-to-20 Year
Laddered Municipal
Bond Fund | |
| Nominee for Trustee | | For | | | Withheld | | | For | | | Withheld | |
| | | | |
Mark R. Fetting | | | 2,912,147 | | | | 0 | | | | 242,409 | | | | 0 | |
| | | | |
Keith Quinton | | | 2,912,147 | | | | 0 | | | | 242,409 | | | | 0 | |
| | | | |
Marcus L. Smith | | | 2,912,147 | | | | 0 | | | | 242,409 | | | | 0 | |
| | | | |
Susan J. Sutherland | | | 2,912,147 | | | | 0 | | | | 242,409 | | | | 0 | |
| | | | |
Scott E. Wennerholm | | | 2,912,147 | | | | 0 | | | | 242,409 | | | | 0 | |
Results are rounded to the nearest whole number.
Eaton Vance
TABS Laddered Municipal Bond Funds
January 31, 2019
Management and Organization
Fund Management. The Trustees of Eaton Vance Municipals Trust II (the Trust) are responsible for the overall management and supervision of the Trust’s affairs. The Trustees and officers of the Trust are listed below. Except as indicated, each individual has held the office shown or other offices in the same company for the last five years. Trustees and officers of the Trust hold indefinite terms of office. The “noninterested Trustees” consist of those Trustees who are not “interested persons” of the Trust, as that term is defined under the 1940 Act. The business address of each Trustee and officer is Two International Place, Boston, Massachusetts 02110. As used below, “EVC” refers to Eaton Vance Corp., “EV” refers to Eaton Vance, Inc., “EVM” refers to Eaton Vance Management, “BMR” refers to Boston Management and Research and “EVD” refers to Eaton Vance Distributors, Inc. EVC and EV are the corporate parent and trustee, respectively, of EVM and BMR. EVD is the Funds’ principal underwriter and a wholly-owned subsidiary of EVC. Each officer affiliated with Eaton Vance may hold a position with other Eaton Vance affiliates that is comparable to his or her position with EVM listed below. Each Trustee oversees 175 portfolios in the Eaton Vance Complex (including all master and feeder funds in a master feeder structure). Each officer serves as an officer of certain other Eaton Vance funds. Each Trustee and officer serves until his or her successor is elected.
| | | | | | |
| Name and Year of Birth | | Position(s)
with the
Trust | | Trustee
Since(1) | | Principal Occupation(s) and Directorships
During Past Five Years and Other Relevant Experience |
|
| Interested Trustee |
| | | |
Thomas E. Faust Jr. 1958 | | Trustee | | 2007 | | Chairman, Chief Executive Officer and President of EVC, Director and President of EV, Chief Executive Officer and President of EVM and BMR, and Director of EVD. Trustee and/or officer of 175 registered investment companies. Mr. Faust is an interested person because of his positions with EVM, BMR, EVD, EVC and EV, which are affiliates of the Trust. Directorships in the Last Five Years.(2) Director of EVC and Hexavest Inc. (investment management firm). |
|
| Noninterested Trustees |
| | | |
Mark R. Fetting 1954 | | Trustee | | 2016 | | Private investor. Formerly held various positions at Legg Mason, Inc. (investment management firm) (2000-2012), including President, Chief Executive Officer, Director and Chairman (2008-2012), Senior Executive Vice President (2004-2008) and Executive Vice President (2001-2004). Formerly, President of Legg Mason family of funds (2001-2008). Formerly, Division President and Senior Officer of Prudential Financial Group, Inc. and related companies (investment management firm)(1991-2000). Directorships in the Last Five Years. None. |
| | | |
Cynthia E. Frost 1961 | | Trustee | | 2014 | | Private investor. Formerly, Chief Investment Officer of Brown University (university endowment) (2000-2012). Formerly, Portfolio Strategist for Duke Management Company (university endowment manager) (1995-2000). Formerly, Managing Director, Cambridge Associates (investment consulting company) (1989-1995). Formerly, Consultant, Bain and Company (management consulting firm) (1987-1989). Formerly, Senior Equity Analyst, BA Investment Management Company (1983-1985). Directorships in the Last Five Years. None. |
| | | |
George J. Gorman 1952 | | Trustee | | 2014 | | Principal at George J. Gorman LLC (consulting firm). Formerly, Senior Partner at Ernst & Young LLP (a registered public accounting firm) (1974-2009). Directorships in the Last Five Years. Formerly, Trustee of the BofA Funds Series Trust (11 funds) (2011-2014) and of the Ashmore Funds (9 funds) (2010-2014). |
| | | |
Valerie A. Mosley 1960 | | Trustee | | 2014 | | Chairwoman and Chief Executive Officer of Valmo Ventures (a consulting and investment firm). Former Partner and Senior Vice President, Portfolio Manager and Investment Strategist at Wellington Management Company, LLP (investment management firm) (1992-2012). Former Chief Investment Officer, PG Corbin Asset Management (1990-1992). Formerly worked in institutional corporate bond sales at Kidder Peabody (1986-1990). Directorships in the Last Five Years.(2) Director of Envestnet, Inc. (provider of intelligent systems for wealth management and financial wellness) (since 2018). |
Eaton Vance
TABS Laddered Municipal Bond Funds
January 31, 2019
Management and Organization — continued
| | | | | | |
| Name and Year of Birth | | Position(s)
with the
Trust | | Trustee
Since(1) | | Principal Occupation(s) and Directorships
During Past Five Years and Other Relevant Experience |
|
| Noninterested Trustees (continued) |
| | | |
William H. Park 1947 | | Chairperson of the Board and Trustee | | 2016 (Chairperson) 2003 (Trustee) | | Private investor. Formerly, Consultant (management and transactional) (2012-2014). Formerly, Chief Financial Officer, Aveon Group L.P. (investment management firm) (2010-2011). Formerly, Vice Chairman, Commercial Industrial Finance Corp. (specialty finance company) (2006-2010). Formerly, President and Chief Executive Officer, Prizm Capital Management, LLC (investment management firm) (2002-2005). Formerly, Executive Vice President and Chief Financial Officer, United Asset Management Corporation (investment management firm) (1982-2001). Formerly, Senior Manager, Price Waterhouse (now PricewaterhouseCoopers) (a registered public accounting firm) (1972-1981). Directorships in the Last Five Years.(2) None. |
| | | |
Helen Frame Peters 1948 | | Trustee | | 2008 | | Professor of Finance, Carroll School of Management, Boston College. Formerly, Dean, Carroll School of Management, Boston College (2000-2002). Formerly, Chief Investment Officer, Fixed Income, Scudder Kemper Investments (investment management firm) (1998-1999). Formerly, Chief Investment Officer, Equity and Fixed Income, Colonial Management Associates (investment management firm) (1991-1998). Directorships in the Last Five Years.(2) None. |
| | | |
Keith Quinton(3) 1958 | | Trustee | | 2018 | | Independent Investment Committee Member at New Hampshire Retirement System (since 2017). Advisory Committee member at Northfield Information Services, Inc. (risk management analytics provider) (since 2016). Formerly, Portfolio Manager and Senior Quantitative Analyst at Fidelity Investments (investment management firm)(2001-2014). Directorships in the Last Five Years. Director of New Hampshire Municipal Bond Bank (since 2016). |
| | | |
Marcus L. Smith(3) 1966 | | Trustee | | 2018 | | Member of Posse Boston Advisory Board (foundation) (since 2015); Trustee at University of Mount Union (since 2008). Formerly, Portfolio Manager at MFS Investment Management (investment management firm) (1994-2017). Directorships in the Last Five Years. Director of MSCI Inc. (global provider of investment decision support tools) (since 2017). Director of DCT Industrial Trust Inc. (logistics real estate company) (since 2017). |
| | | |
Susan J. Sutherland 1957 | | Trustee | | 2015 | | Private investor. Formerly, Associate, Counsel and Partner at Skadden, Arps, Slate, Meagher & Flom LLP (law firm) (1982-2013). Directorships in the Last Five Years. Formerly, Director of Montpelier Re Holdings Ltd. (global provider of customized insurance and reinsurance products) (2013-2015). |
| | | |
Scott E. Wennerholm 1959 | | Trustee | | 2016 | | Formerly, Trustee at Wheelock College (postsecondary institution) (2012-2018). Formerly, Consultant at GF Parish Group (executive recruiting firm) (2016-2017). Formerly, Chief Operating Officer and Executive Vice President at BNY Mellon Asset Management (investment management firm) (2005-2011). Formerly, Chief Operating Officer and Chief Financial Officer at Natixis Global Asset Management (investment management firm) (1997-2004). Formerly, Vice President at Fidelity Investments Institutional Services (investment management firm) (1994-1997). Directorships in the Last Five Years. None. |
| | | | | | |
| Name and Year of Birth | | Position(s)
with the
Trust | | Officer
Since(4) | | Principal Occupation(s)
During Past Five Years |
|
| Principal Officers who are not Trustees |
| | | |
Payson F. Swaffield 1956 | | President | | 2003 | | Vice President and Chief Income Investment Officer of EVM and BMR. Also Vice President of Calvert Research and Management (“CRM”). |
| | | |
Maureen A. Gemma 1960 | | Vice President, Secretary and Chief Legal Officer | | 2005 | | Vice President of EVM and BMR. Also Vice President and officer of CRM. |
| | | |
James F. Kirchner 1967 | | Treasurer | | 2007 | | Vice President of EVM and BMR. Also Vice President and officer of CRM. |
Eaton Vance
TABS Laddered Municipal Bond Funds
January 31, 2019
Management and Organization — continued
| | | | | | |
| Name and Year of Birth | | Position(s)
with the
Trust | | Officer
Since(4) | | Principal Occupation(s)
During Past Five Years |
|
| Principal Officers who are not Trustees (continued) |
| | | |
Richard F. Froio 1968 | | Chief Compliance Officer | | 2017 | | Vice President of EVM and BMR since 2017. Formerly, Deputy Chief Compliance Officer (Adviser/Funds) and Chief Compliance Officer (Distribution) at PIMCO(2012-2017) and Managing Director at BlackRock/Barclays Global Investors(2009-2012). |
| (1) | Year first appointed to serve as Trustee for a fund in the Eaton Vance family of funds. Each Trustee has served continuously since appointment unless indicated otherwise. |
| (2) | During their respective tenures, the Trustees (except for Mmes. Frost and Sutherland and Messrs. Fetting, Gorman, Quinton, Smith and Wennerholm) also served as Board members of one or more of the following funds (which operated in the years noted): eUnitsTM 2 Year U.S. Market Participation Trust: Upside to Cap / Buffered Downside (launched in 2012 and terminated in 2014); and eUnitsTM 2 Year U.S. Market Participation Trust II: Upside to Cap / Buffered Downside (launched in 2012 and terminated in 2014). However, Ms. Mosley did not serve as a Board member of eUnitsTM 2 Year U.S. Market Participation Trust: Upside to Cap / Buffered Downside (launched in 2012 and terminated in 2014). |
| (3) | Messrs. Quinton and Smith began serving as Trustees effective October 1, 2018. |
| (4) | Year first elected to serve as officer of a fund in the Eaton Vance family of funds when the officer has served continuously. Otherwise, year of most recent election as an officer of a fund in the Eaton Vance family of funds. Titles may have changed since initial election. |
The SAI for the Funds includes additional information about the Trustees and officers of the Funds and can be obtained without charge on Eaton Vance’s website at www.eatonvance.com or by calling 1-800-262-1122.
Eaton Vance Funds
IMPORTANT NOTICES
Privacy. The Eaton Vance organization is committed to ensuring your financial privacy. Each of the financial institutions identified below has in effect the following policy (“Privacy Policy”) with respect to nonpublic personal information about its customers:
| • | | Only such information received from you, through application forms or otherwise, and information about your Eaton Vance fund transactions will be collected. This may include information such as name, address, social security number, tax status, account balances and transactions. |
| • | | None of such information about you (or former customers) will be disclosed to anyone, except as permitted by law (which includes disclosure to employees necessary to service your account). In the normal course of servicing a customer’s account, Eaton Vance may share information with unaffiliated third parties that perform various required services such as transfer agents, custodians and broker-dealers. |
| • | | Policies and procedures (including physical, electronic and procedural safeguards) are in place that are designed to protect the confidentiality of such information. |
| • | | We reserve the right to change our Privacy Policy at any time upon proper notification to you. Customers may want to review our Privacy Policy periodically for changes by accessing the link on our homepage: www.eatonvance.com. |
Our pledge of privacy applies to the following entities within the Eaton Vance organization: the Eaton Vance Family of Funds, Eaton Vance Management, Eaton Vance Investment Counsel, Eaton Vance Distributors, Inc., Eaton Vance Trust Company, Eaton Vance Management (International) Limited, Eaton Vance Advisers International Ltd., Eaton Vance Management’s Real Estate Investment Group and Boston Management and Research. In addition, our Privacy Policy applies only to those Eaton Vance customers who are individuals and who have a direct relationship with us. If a customer’s account (i.e., fund shares) is held in the name of a third-party financial advisor/broker-dealer, it is likely that only such advisor’s privacy policies apply to the customer. This notice supersedes all previously issued privacy disclosures. For more information about Eaton Vance’s Privacy Policy, please call 1-800-262-1122.
Delivery of Shareholder Documents. The Securities and Exchange Commission (SEC) permits funds to deliver only one copy of shareholder documents, including prospectuses, proxy statements and shareholder reports, to fund investors with multiple accounts at the same residential or post office box address. This practice is often called “householding” and it helps eliminate duplicate mailings to shareholders.Eaton Vance, or your financial advisor, may household the mailing of your documents indefinitely unless you instruct Eaton Vance, or your financial advisor, otherwise.If you would prefer that your Eaton Vance documents not be householded, please contact Eaton Vance at 1-800-262-1122, or contact your financial advisor. Your instructions that householding not apply to delivery of your Eaton Vance documents will typically be effective within 30 days of receipt by Eaton Vance or your financial advisor.
Portfolio Holdings. Each Eaton Vance Fund and its underlying Portfolio(s) (if applicable) will file a schedule of portfolio holdings on Form N-Q with the SEC for the first and third quarters of each fiscal year. The Form N-Q will be available on the Eaton Vance website at www.eatonvance.com, by calling Eaton Vance at 1-800-262-1122 or in the EDGAR database on the SEC’s website at www.sec.gov. Form N-Q may also be reviewed and copied at the SEC’s public reference room in Washington, D.C. (call 1-800-732-0330 for information on the operation of the public reference room).
Proxy Voting. From time to time, funds are required to vote proxies related to the securities held by the funds. The Eaton Vance Funds or their underlying Portfolios (if applicable) vote proxies according to a set of policies and procedures approved by the Funds’ and Portfolios’ Boards. You may obtain a description of these policies and procedures and information on how the Funds or Portfolios voted proxies relating to portfolio securities during the most recent 12-month period ended June 30, without charge, upon request, by calling 1-800-262-1122 and by accessing the SEC’s website at www.sec.gov.
This Page Intentionally Left Blank
This Page Intentionally Left Blank
This Page Intentionally Left Blank
Investment Adviser and Administrator
Eaton Vance Management
Two International Place
Boston, MA 02110
Principal Underwriter*
Eaton Vance Distributors, Inc.
Two International Place
Boston, MA 02110
(617) 482-8260
Custodian
State Street Bank and Trust Company
State Street Financial Center, One Lincoln Street
Boston, MA 02111
Transfer Agent
BNY Mellon Investment Servicing (US) Inc.
Attn: Eaton Vance Funds
P.O. Box 9653
Providence, RI 02940-9653
(800) 262-1122
Independent Registered Public Accounting Firm
Deloitte & Touche LLP
200 Berkeley Street
Boston, MA 02116-5022
Fund Offices
Two International Place
Boston, MA 02110
| * | FINRA BrokerCheck. Investors may check the background of their Investment Professional by contacting the Financial Industry Regulatory Authority (FINRA). FINRA BrokerCheck is a free tool to help investors check the professional background of current and former FINRA-registered securities firms and brokers. FINRA BrokerCheck is available by calling 1-800-289-9999 and at www.FINRA.org. The FINRA BrokerCheck brochure describing this program is available to investors at www.FINRA.org. |

21124 1.31.19

Eaton Vance
TABS 5-to-15 Year Laddered Municipal Bond Fund
Annual Report
January 31, 2019
Important Note. Beginning on January 1, 2021, as permitted by regulations adopted by the Securities and Exchange Commission, paper copies of the Fund’s annual and semi-annual shareholder reports will no longer be sent by mail unless you specifically request paper copies of the reports. Instead, the reports will be made available on the Fund’s website (eatonvance.com/funddocuments), and you will be notified by mail each time a report is posted and provided with a website address to access the report.
If you already elected to receive shareholder reports electronically, you will not be affected by this change and you need not take any action. If you are a direct investor, you may elect to receive shareholder reports and other communications from the Fund electronically by signing up for e-Delivery at eatonvance.com/edelivery. If you own your shares through a financial intermediary (such as a broker-dealer or bank), you must contact your financial intermediary to sign up.
You may elect to receive all future Fund shareholder reports in paper free of charge. If you are a direct investor, you can inform the Fund that you wish to continue receiving paper copies of your shareholder reports by calling 1-800-262-1122. If you own these shares through a financial intermediary, you must contact your financial intermediary or follow instructions included with this disclosure, if applicable, to elect to continue to receive paper copies of your shareholder reports. Your election to receive reports in paper will apply to all Eaton Vance funds held directly or to all funds held through your financial intermediary, as applicable.

Commodity Futures Trading Commission Registration. Effective December 31, 2012, the Commodity Futures Trading Commission (“CFTC”) adopted certain regulatory changes that subject registered investment companies and advisers to regulation by the CFTC if a fund invests more than a prescribed level of its assets in certain CFTC-regulated instruments (including futures, certain options and swap agreements) or markets itself as providing investment exposure to such instruments. The Fund has claimed an exclusion from the definition of the term “commodity pool operator” under the Commodity Exchange Act. Accordingly, neither the Fund nor the adviser with respect to the operation of the Fund is subject to CFTC regulation. Because of its management of other strategies, the Fund’s adviser is registered with the CFTC as a commodity pool operator and a commodity trading advisor.
Fund shares are not insured by the FDIC and are not deposits or other obligations of, or guaranteed by, any depository institution. Shares are subject to investment risks, including possible loss of principal invested.
This report must be preceded or accompanied by a current summary prospectus or prospectus. Before investing, investors should consider carefully the investment objective, risks, and charges and expenses of a mutual fund. This and other important information is contained in the summary prospectus and prospectus, which can be obtained from a financial advisor. Prospective investors should read the prospectus carefully before investing. For further information, please call1-800-262-1122.
Annual ReportJanuary 31, 2019
Eaton Vance
TABS5-to-15 Year Laddered Municipal Bond Fund
Table of Contents
| | | | |
Management’s Discussion of Fund Performance | | | 2 | |
| |
Performance | | | 3 | |
| |
Fund Profile | | | 4 | |
| |
Endnotes and Additional Disclosures | | | 5 | |
| |
Fund Expenses | | | 6 | |
| |
Financial Statements | | | 7 | |
| |
Report of Independent Registered Public Accounting Firm | | | 17 and 37 | |
| |
Federal Tax Information | | | 18 | |
| |
Special Meeting of Shareholders | | | 38 | |
| |
Management and Organization | | | 39 | |
| |
Important Notices | | | 42 | |
Eaton Vance
TABS5-to-15 Year Laddered Municipal Bond Fund
January 31, 2019
Management’s Discussion of Fund Performance1
Economic and Market Conditions
The12-month period ended January 31, 2019, was positive for the municipal bond market, with the Bloomberg Barclays Municipal Bond Index,2 a broad measure of the asset class, returning 3.26%.
Bond performance, however, varied considerably across the AAA7 municipal yield curve.9 During the period, rates rose and bond prices fell in the 0–2 year and 19–30 year areas of the curve. But rates declined in the 3–18 year segment of the curve, with the largest declines — and the strongest bond price performance — occurring in the
10–12 year part of the curve. As a result, the front end of the municipal yield curve — 1–9 years — generally flattened while the back end — 10–30 years — steepened. In addition, lower-rated bonds generally outperformed higher-rated issues during the period. Municipal bonds outperformed comparable U.S. Treasurys in the 1–10 year area of the yield curve, while Treasurys outperformed municipals across the remainder of the curve.
As the period opened in February 2018, signs of increasing inflation, higher wage growth and fears that recent tax legislation might overheat the economy were pushing interest rates up and bond prices down. Upward pressure on short-term rates continued in March and June 2018 as the U.S. Federal Reserve Board (the Fed) delivered its first two rate hikes of the year. At the long end of the curve, however, fluctuating perceptions of geopolitical risk were a primary driver of rates from April through the end of August 2018. Investors toggled between concern that the U.S. was initiating a global trade war and optimism about economic growth and a potential detente between the U.S. and North Korea.
In September 2018, the Fed hiked the federal funds rate again, which pushed up both U.S. Treasury and municipal rates across the curve. In October 2018, a strong U.S. employment report and easing concerns about Italy’s national budget crisis continued the upward pressure on longer-term rates. But as 2018 came to a close, investors became increasingly concerned about a trade war with China, a potential government shutdown and dovish comments by the Fed that led the futures market to project the possibility of no further rate hikes in 2019. The result was a “flight to quality” by bond investors that pushed longer-term bond prices up and rates down in December 2018.
The first month of 2019, in contrast, was relatively quiet for bonds. As investors waited to see the outcome of the longest-ever U.S. government shutdown, municipal interest rates were virtually unchanged in January.
Fund Performance
For the12-month period ended January 31, 2019, Eaton Vance TABS5-to-15 Year Laddered Municipal Bond Fund (the Fund) returned 2.80% for Class A shares at net asset value (NAV), underperforming its primary benchmark, the Bloomberg Barclays 10 Year Municipal Bond Index (the
Index), which returned 4.11%. The Index is unmanaged and returns do not reflect any applicable sales charges, commissions, or expenses.
The Fund provides rules-based, approximately equal-weighted exposure in each year across the5-to-15 year maturity portion of the yield curve, with the objective of seeking current income exempt from regular federal income tax. Management seeks to add incremental return through active security selection andin-depth credit analysis.
During the period, yield curve positioning detracted from Fund performance versus the Index. While the Index was entirely positioned within the 8–12 year area of the yield curve, the Fund was approximately equally weighted across the yield curve from 5–15 years. Although rates fell and bond prices rose throughout the 5–15 year portion of the curve, the greatest rate declines — and thus the strongest price performance — occurred around the 10–year area of the curve. The Index had a greater portion of its holdings than the Fund in the 10–year area and benefited more from falling rates during the period. Similarly, the Fund had holdings in the weaker-performing 5–7 year and 13–15 year areas of the curve — where the Index had no holdings — and that positioning hurt Fund performance versus the Index.
In contrast, active selection of individual bonds based on fundamental credit research contributed to Fund performance versus the Index during the period. Meanwhile, the Fund’s duration8 and credit quality positioning were approximately in line with the Index and did not have a significant effect on relative performance during the period.
See Endnotes and Additional Disclosures in this report.
Past performance is no guarantee of future results. Returns are historical and are calculated by determining the percentage change in net asset value (NAV) or offering price (as applicable) with all distributions reinvested. Investment return and principal value will fluctuate so that shares, when redeemed, may be worth more or less than their original cost. Performance less than or equal to one year is cumulative. Performance is for the stated time period only; due to market volatility, the Fund’s current performance may be lower or higher than quoted. Returns are before taxes unless otherwise noted. For performance as of the most recent month-end, please refer to eatonvance.com.
Eaton Vance
TABS5-to-15 Year Laddered Municipal Bond Fund
January 31, 2019
Performance2,3
Portfolio ManagersJames H. Evans, CFA, Brian C. Barney, CFA and Christopher J. Harshman, CFA
| | | | | | | | | | | | | | | | | | | | |
| % Average Annual Total Returns | | Class Inception Date | | | Performance
Inception Date | | | One Year | | | Five Years | | | Since
Inception | |
Class A at NAV | | | 02/01/2010 | | | | 02/01/2010 | | | | 2.80 | % | | | 4.48 | % | | | 5.77 | % |
Class A with 4.75% Maximum Sales Charge | | | — | | | | — | | | | –2.05 | | | | 3.47 | | | | 5.19 | |
Class C at NAV | | | 02/01/2010 | | | | 02/01/2010 | | | | 2.12 | | | | 3.72 | | | | 4.98 | |
Class C with 1% Maximum Sales Charge | | | — | | | | — | | | | 1.12 | | | | 3.72 | | | | 4.98 | |
Class I at NAV | | | 02/01/2010 | | | | 02/01/2010 | | | | 3.06 | | | | 4.75 | | | | 6.02 | |
Bloomberg Barclays 10 Year Municipal Bond Index | | | — | | | | — | | | | 4.11 | % | | | 3.70 | % | | | 4.34 | % |
Bloomberg Barclays 15 Year Municipal Bond Index | | | — | | | | — | | | | 4.07 | | | | 4.47 | | | | 4.86 | |
| | | | | |
| | | | | | | | | | | | | | | | | | | | |
| % Total Annual Operating Expense Ratios4 | | | | | | Class A | | | Class C | | | Class I | |
Gross | | | | | | | | | | | 0.70 | % | | | 1.45 | % | | | 0.45 | % |
Net | | | | | | | | | | | 0.65 | | | | 1.40 | | | | 0.40 | |
| | | | | |
| | | | | | | | | | | | | | | | | | | | |
| % Distribution Rates/Yields5 | | | | | | Class A | | | Class C | | | Class I | |
Distribution Rate | | | | | | | | 1.88 | % | | | 1.14 | % | | | 2.13 | % |
SEC30-day Yield – Subsidized | | | | | | | | 1.67 | | | | 1.02 | | | | 2.01 | |
SEC30-day Yield – Unsubsidized | | | | | | | | 1.64 | | | | 0.98 | | | | 1.97 | |
Growth of $10,000
This graph shows the change in value of a hypothetical investment of $10,000 in Class A of the Fund for the period indicated. For comparison, the same investment is shown in the indicated index.
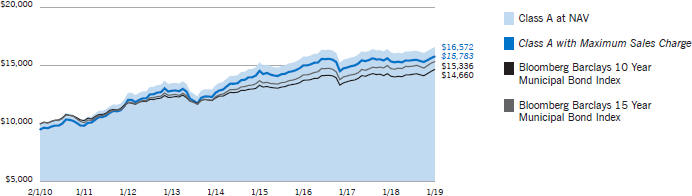
| | | | | | | | | | | | | | | | |
| Growth of Investment | | Amount Invested | | | Period Beginning | | | At NAV | | | With Maximum Sales Charge | |
Class C | | $ | 10,000 | | | | 02/01/2010 | | | $ | 15,498 | | | | N.A. | |
Class I | | $ | 250,000 | | | | 02/01/2010 | | | $ | 423,375 | | | | N.A. | |
See Endnotes and Additional Disclosures in this report.
Past performance is no guarantee of future results. Returns are historical and are calculated by determining the percentage change in net asset value (NAV) or offering price (as applicable) with all distributions reinvested. Investment return and principal value will fluctuate so that shares, when redeemed, may be worth more or less than their original cost. Performance less than or equal to one year is cumulative. Performance is for the stated time period only; due to market volatility, the Fund’s current performance may be lower or higher than quoted. Returns are before taxes unless otherwise noted. For performance as of the most recentmonth-end, please refer to eatonvance.com.
Eaton Vance
TABS5-to-15 Year Laddered Municipal Bond Fund
January 31, 2019
Fund Profile6
Credit Quality (% of total investments)7
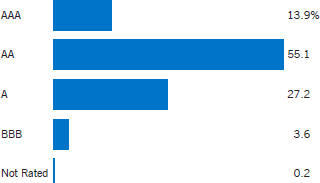
See Endnotes and Additional Disclosures in this report.
Eaton Vance
TABS 5-to-15 Year Laddered Municipal Bond Fund
January 31, 2019
Endnotes and Additional Disclosures
| 1 | The views expressed in this report are those of the portfolio manager(s) and are current only through the date stated at the top of this page. These views are subject to change at any time based upon market or other conditions, and Eaton Vance and the Fund(s) disclaim any responsibility to update such views. These views may not be relied upon as investment advice and, because investment decisions are based on many factors, may not be relied upon as an indication of trading intent on behalf of any Eaton Vance fund. This commentary may contain statements that are not historical facts, referred to as “forward looking statements.” The Fund’s actual future results may differ significantly from those stated in any forward looking statement, depending on factors such as changes in securities or financial markets or general economic conditions, the volume of sales and purchases of Fund shares, the continuation of investment advisory, administrative and service contracts, and other risks discussed from time to time in the Fund’s filings with the Securities and Exchange Commission. |
| 2 | Bloomberg Barclays Municipal Bond Index is an unmanaged index of municipal bonds traded in the U.S. Bloomberg Barclays 10 Year Municipal Bond Index is an unmanaged index of municipal bonds traded in the U.S. with maturities ranging from8-12 years. Bloomberg Barclays 15 Year Municipal Bond Index is an unmanaged index of municipal bonds traded in the U.S. with maturities ranging from12-17 years. Unless otherwise stated, index returns do not reflect the effect of any applicable sales charges, commissions, expenses, taxes or leverage, as applicable. It is not possible to invest directly in an index. |
| 3 | Total Returns at NAV do not include applicable sales charges. If sales charges were deducted, the returns would be lower. Total Returns shown with maximum sales charges reflect the stated maximum sales charge. Unless otherwise stated, performance does not reflect the deduction of taxes on Fund distributions or redemptions of Fund shares. Performance since inception for an index, if presented, is the performance since the Fund’s or oldest share class’ inception, as applicable. |
| | Effective April 15, 2015, the Fund changed its investment objective and investment strategy. Performance prior to April 15, 2015 reflects the Fund’s performance under its former investment objective and policies. |
| 4 | Source: Fund prospectus. Net expense ratios reflect a contractual expense reimbursement that continues through 5/31/19. Without the reimbursement, performance would have been lower. The expense ratios for the current reporting period can be found in the Financial Highlights section of this report. |
| 5 | The Distribution Rate is based on the Fund’s last regular distribution per share in the period (annualized) divided by the Fund’s NAV at the end of the period. The Fund’s distributions may be comprised of amounts characterized for federal income tax purposes astax-exempt income, qualified andnon-qualified ordinary dividends, capital gains and nondividend distributions, also known as return of capital. The Fund will determine the federal income tax character of distributions paid to a shareholder after the end of the calendar year. This is reported on the IRS form1099-DIV and provided to the shareholder shortly after eachyear-end. The Fund’s distributions are determined by the investment adviser based on its current assessment of the Fund’s long-term return potential. As portfolio and market conditions change, the rate of distributions paid by the Fund could change. The SEC Yield is a standardized measure based on the estimated yield to maturity of a fund’s investments over a30-day period and is based on the maximum offer price at the date specified. The SEC Yield is not based on the distributions made by the Fund, which may differ. Subsidized yield reflects the effect of fee waivers and expense reimbursements. |
| 6 | Fund primarily invests in an affiliated investment company (Portfolio) with the same objective(s) and policies as the Fund and may also invest directly. Unless otherwise noted, references to investments are to the aggregate holdings of the Fund and the Portfolio. |
| 7 | Ratings are based on Moody’s Investors Service, Inc. (“Moody’s”), S&P Global Ratings (“S&P”) or Fitch Ratings (“Fitch”), as applicable. If securities are rated differently by the ratings agencies, the highest rating is applied. Ratings, which are subject to change, apply to the creditworthiness of the issuers of the underlying securities and not to the Fund or its shares. Credit ratings measure the quality of a bond based on the issuer’s creditworthiness, with ratings ranging from AAA, being the highest, to D, being the lowest based on S&P’s measures. Ratings of BBB or higher by S&P or Fitch (Baa or higher by Moody’s) are considered to be investment-grade quality. Credit ratings are based largely on the ratings agency’s analysis at the time of rating. The rating assigned to any particular security is not necessarily a reflection of the issuer’s current financial condition and does not necessarily reflect its assessment of the volatility of a security’s market value or of the liquidity of an investment in the security. Holdings designated as “Not Rated” (if any) are not rated by the national ratings agencies stated above. |
| 8 | Duration is a measure of the expected change in price of a bond — in percentage terms — given a one percent change in interest rates, all else being constant. Securities with lower durations tend to be less sensitive to interest rate changes. |
| 9 | Yield curve is a graphical representation of the yields offered by bonds of various maturities. The yield curve flattens when long-term rates fall and/or short-term rates increase, and the yield curve steepens when long-term rates increase and/or short-term rates fall. |
| | Fund profile subject to change due to active management. |
Eaton Vance
TABS 5-to-15 Year Laddered Municipal Bond Fund
January 31, 2019
Fund Expenses
Example: As a Fund shareholder, you incur two types of costs: (1) transaction costs, including sales charges (loads) on purchases and redemption fees (if applicable); and (2) ongoing costs, including management fees; distribution and/or service fees; and other Fund expenses. This Example is intended to help you understand your ongoing costs (in dollars) of Fund investing and to compare these costs with the ongoing costs of investing in other mutual funds. The Example is based on an investment of $1,000 invested at the beginning of the period and held for the entire period (August 1, 2018 – January 31, 2019).
Actual Expenses: The first section of the table below provides information about actual account values and actual expenses. You may use the information in this section, together with the amount you invested, to estimate the expenses that you paid over the period. Simply divide your account value by $1,000 (for example, an $8,600 account value divided by $1,000 = 8.6), then multiply the result by the number in the first section under the heading entitled “Expenses Paid During Period” to estimate the expenses you paid on your account during this period.
Hypothetical Example for Comparison Purposes: The second section of the table below provides information about hypothetical account values and hypothetical expenses based on the actual Fund expense ratio and an assumed rate of return of 5% per year (before expenses), which is not the actual Fund return. The hypothetical account values and expenses may not be used to estimate the actual ending account balance or expenses you paid for the period. You may use this information to compare the ongoing costs of investing in your Fund and other funds. To do so, compare this 5% hypothetical example with the 5% hypothetical examples that appear in the shareholder reports of the other funds.
Please note that the expenses shown in the table are meant to highlight your ongoing costs only and do not reflect any transactional costs, such as sales charges (loads) or redemption fees (if applicable). Therefore, the second section of the table is useful in comparing ongoing costs only, and will not help you determine the relative total costs of owning different funds. In addition, if these transactional costs were included, your costs would be higher.
| | | | | | | | | | | | | | | | |
| | | Beginning
Account Value
(8/1/18) | | | Ending
Account Value
(1/31/19) | | | Expenses Paid
During Period*
(8/1/18 – 1/31/19) | | | Annualized
Expense
Ratio | |
|
Actual | |
Class A | | $ | 1,000.00 | | | $ | 1,020.30 | | | $ | 3.31 | ** | | | 0.65 | % |
Class C | | $ | 1,000.00 | | | $ | 1,017.40 | | | $ | 7.12 | ** | | | 1.40 | % |
Class I | | $ | 1,000.00 | | | $ | 1,021.60 | | | $ | 2.04 | ** | | | 0.40 | % |
| |
Hypothetical | |
(5% return per year before expenses) | |
Class A | | $ | 1,000.00 | | | $ | 1,021.90 | | | $ | 3.31 | ** | | | 0.65 | % |
Class C | | $ | 1,000.00 | | | $ | 1,018.10 | | | $ | 7.12 | ** | | | 1.40 | % |
Class I | | $ | 1,000.00 | | | $ | 1,023.20 | | | $ | 2.04 | ** | | | 0.40 | % |
| * | Expenses are equal to the Fund’s annualized expense ratio for the indicated Class, multiplied by the average account value over the period, multiplied by 184/365 (to reflect theone-half year period). The Example assumes that the $1,000 was invested at the net asset value per share determined at the close of business on July 31, 2018. The Example reflects the expenses of both the Fund and the Portfolio. |
| ** | Absent an allocation of certain expenses to an affiliate, expenses would be higher. |
Eaton Vance
TABS 5-to-15 Year Laddered Municipal Bond Fund
January 31, 2019
Statement of Assets and Liabilities
| | | | |
| Assets | | January 31, 2019 | |
| |
Investment in5-to-15 Year Laddered Municipal Bond Portfolio, at value (identified cost, $594,081,620) | | $ | 605,284,576 | |
| |
Receivable for Fund shares sold | | | 1,264,900 | |
| |
Total assets | | $ | 606,549,476 | |
|
| Liabilities | |
| |
Payable for Fund shares redeemed | | $ | 941,383 | |
| |
Distributions payable | | | 184,105 | |
|
Payable to affiliates: | |
| |
Distribution and service fees | | | 57,405 | |
| |
Other | | | 15,304 | |
| |
Accrued expenses | | | 99,666 | |
| |
Total liabilities | | $ | 1,297,863 | |
| |
Net Assets | | $ | 605,251,613 | |
|
| Sources of Net Assets | |
| |
Paid-in capital | | $ | 609,892,505 | |
| |
Accumulated loss | | | (4,640,892 | ) |
| |
Total | | $ | 605,251,613 | |
|
| Class A Shares | |
| |
Net Assets | | $ | 87,286,620 | |
| |
Shares Outstanding | | | 7,141,607 | |
|
Net Asset Value and Redemption Price Per Share | |
| |
(net assets ÷ shares of beneficial interest outstanding) | | $ | 12.22 | |
|
Maximum Offering Price Per Share | |
| |
(100 ÷ 95.25 of net asset value per share) | | $ | 12.83 | |
|
| Class C Shares | |
| |
Net Assets | | $ | 45,308,786 | |
| |
Shares Outstanding | | | 3,708,564 | |
|
Net Asset Value and Offering Price Per Share* | |
| |
(net assets ÷ shares of beneficial interest outstanding) | | $ | 12.22 | |
|
| Class I Shares | |
| |
Net Assets | | $ | 472,656,207 | |
| |
Shares Outstanding | | | 38,697,667 | |
|
Net Asset Value, Offering Price and Redemption Price Per Share | |
| |
(net assets ÷ shares of beneficial interest outstanding) | | $ | 12.21 | |
On sales of $50,000 or more, the offering price of Class A shares is reduced.
| * | Redemption price per share is equal to the net asset value less any applicable contingent deferred sales charge. |
| | | | |
| | 7 | | See Notes to Financial Statements. |
Eaton Vance
TABS 5-to-15 Year Laddered Municipal Bond Fund
January 31, 2019
Statement of Operations
| | | | |
| Investment Income | | Year Ended January 31, 2019 | |
| |
Interest allocated from Portfolio | | $ | 16,034,485 | |
| |
Expenses allocated from Portfolio | | | (2,236,473 | ) |
| |
Total investment income from Portfolio | | $ | 13,798,012 | |
|
| Expenses | |
|
Distribution and service fees | |
| |
Class A | | $ | 234,044 | |
| |
Class C | | | 507,532 | |
| |
Trustees’ fees and expenses | | | 500 | |
| |
Custodian fee | | | 50,702 | |
| |
Transfer and dividend disbursing agent fees | | | 243,020 | |
| |
Legal and accounting services | | | 32,496 | |
| |
Printing and postage | | | 55,657 | |
| |
Registration fees | | | 88,145 | |
| |
Miscellaneous | | | 15,260 | |
| |
Total expenses | | $ | 1,227,356 | |
|
Deduct — | |
| |
Allocation of expenses to affiliate | | $ | 171,431 | |
| |
Total expense reductions | | $ | 171,431 | |
| |
Net expenses | | $ | 1,055,925 | |
| |
Net investment income | | $ | 12,742,087 | |
|
| Realized and Unrealized Gain (Loss) from Portfolio | |
|
Net realized gain (loss) — | |
| |
Investment transactions | | $ | (8,207,796 | ) |
| |
Net realized loss | | $ | (8,207,796 | ) |
|
Change in unrealized appreciation (depreciation) — | |
| |
Investments | | $ | 13,003,732 | |
| |
Net change in unrealized appreciation (depreciation) | | $ | 13,003,732 | |
| |
Net realized and unrealized gain | | $ | 4,795,936 | |
| |
Net increase in net assets from operations | | $ | 17,538,023 | |
| | | | |
| | 8 | | See Notes to Financial Statements. |
Eaton Vance
TABS 5-to-15 Year Laddered Municipal Bond Fund
January 31, 2019
Statements of Changes in Net Assets
| | | | | | | | |
| | | Year Ended January 31, | |
| Increase (Decrease) in Net Assets | | 2019 | | | 2018 | |
|
From operations — | |
| | |
Net investment income | | $ | 12,742,087 | | | $ | 10,323,557 | |
| | |
Net realized loss | | | (8,207,796 | ) | | | (1,604,889 | ) |
| | |
Net change in unrealized appreciation (depreciation) | | | 13,003,732 | | | | 7,218,825 | |
| | |
Net increase in net assets from operations | | $ | 17,538,023 | | | $ | 15,937,493 | |
|
Distributions to shareholders(1) — | |
| | |
Class A | | $ | (1,744,865 | ) | | $ | (1,893,427 | ) |
| | |
Class C | | | (565,341 | ) | | | (526,058 | ) |
| | |
Class I | | | (10,431,013 | ) | | | (7,932,977 | ) |
| | |
Total distributions to shareholders | | $ | (12,741,219 | ) | | $ | (10,352,462 | ) |
|
Transactions in shares of beneficial interest — | |
|
Proceeds from sale of shares | |
| | |
Class A | | $ | 18,455,738 | | | $ | 51,288,825 | |
| | |
Class C | | | 5,070,229 | | | | 18,200,493 | |
| | |
Class I | | | 186,422,803 | | | | 355,261,229 | |
|
Net asset value of shares issued to shareholders in payment of distributions declared | |
| | |
Class A | | | 1,564,859 | | | | 1,721,320 | |
| | |
Class C | | | 429,822 | | | | 399,198 | |
| | |
Class I | | | 8,485,187 | | | | 6,242,212 | |
|
Cost of shares redeemed | |
| | |
Class A | | | (38,412,479 | ) | | | (94,933,889 | ) |
| | |
Class C | | | (15,432,970 | ) | | | (17,298,833 | ) |
| | |
Class I | | | (236,218,511 | ) | | | (138,679,053 | ) |
|
Net asset value of shares converted | |
| | |
Class A | | | 597,026 | | | | — | |
| | |
Class C | | | (597,026 | ) | | | — | |
| | |
Net increase (decrease) in net assets from Fund share transactions | | $ | (69,635,322 | ) | | $ | 182,201,502 | |
|
Other capital — | |
| | |
Portfolio transaction fee contributed to Portfolio | | $ | (305,548 | ) | | $ | (421,341 | ) |
| | |
Portfolio transaction fee allocated from Portfolio | | | 302,533 | | | | 421,040 | |
| | |
Net decrease in net assets from other capital | | $ | (3,015 | ) | | $ | (301 | ) |
| | |
Net increase (decrease) in net assets | | $ | (64,841,533 | ) | | $ | 187,786,232 | |
| | |
| Net Assets | | | | | | | | |
| | |
At beginning of year | | $ | 670,093,146 | | | $ | 482,306,914 | |
| | |
At end of year | | $ | 605,251,613 | | | $ | 670,093,146 | (2) |
| (1) | For the year ended January 31, 2018, the source of distributions was from net investment income. The current year presentation of distributions conforms with the Disclosure Update and Simplification Rule issued by the Securities and Exchange Commission, effective November 5, 2018. |
| (2) | Includes accumulated undistributed net investment income of $3,675 at January 31, 2018. The requirement to disclose the corresponding amount as of January 31, 2019 was eliminated. |
| | | | |
| | 9 | | See Notes to Financial Statements. |
Eaton Vance
TABS 5-to-15 Year Laddered Municipal Bond Fund
January 31, 2019
Financial Highlights
| | | | | | | | | | | | | | | | | | | | |
| | | Class A | |
| |
| | | Year Ended January 31, | |
| | | 2019 | | | 2018 | | | 2017 | | | 2016 | | | 2015 | |
| | | | | | |
Net asset value — Beginning of year | | $ | 12.110 | | | $ | 11.900 | | | $ | 12.220 | | | $ | 12.080 | | | $ | 10.800 | |
| | | | | |
| Income (Loss) From Operations | | | | | | | | | | | | | | | | | | | | |
| | | | | |
Net investment income | | $ | 0.225 | | | $ | 0.210 | | | $ | 0.175 | | | $ | 0.240 | | | $ | 0.293 | |
| | | | | |
Net realized and unrealized gain (loss) | | | 0.110 | | | | 0.210 | | | | (0.320 | ) | | | 0.140 | | | | 1.280 | |
| | | | | |
Total income (loss) from operations | | $ | 0.335 | | | $ | 0.420 | | | $ | (0.145 | ) | | $ | 0.380 | | | $ | 1.573 | |
| | | | | |
| Less Distributions | | | | | | | | | | | | | | | | | | | | |
| | | | | |
From net investment income | | $ | (0.225 | ) | | $ | (0.210 | ) | | $ | (0.175 | ) | | $ | (0.240 | ) | | $ | (0.293 | ) |
| | | | | |
Total distributions | | $ | (0.225 | ) | | $ | (0.210 | ) | | $ | (0.175 | ) | | $ | (0.240 | ) | | $ | (0.293 | ) |
| | | | | |
Net asset value — End of year | | $ | 12.220 | | | $ | 12.110 | | | $ | 11.900 | | | $ | 12.220 | | | $ | 12.080 | |
| | | | | |
Total Return(1)(2) | | | 2.80 | % | | | 3.53 | % | | | (1.21 | )% | | | 3.23 | % | | | 14.75 | % |
| | | | | |
| Ratios/Supplemental Data | | | | | | | | | | | | | | | | | | | | |
| | | | | |
Net assets, end of year (000’s omitted) | | $ | 87,287 | | | $ | 104,397 | | | $ | 144,984 | | | $ | 51,806 | | | $ | 7,909 | |
| | | | | |
Ratios (as a percentage of average daily net assets):(3) | | | | | | | | | | | | | | | | | | | | |
| | | | | |
Expenses(2) | | | 0.65 | % | | | 0.65 | % | | | 0.65 | % | | | 0.67 | %(4) | | | 0.92 | %(4) |
| | | | | |
Net investment income | | | 1.87 | % | | | 1.72 | % | | | 1.41 | % | | | 1.93 | % | | | 2.59 | % |
| | | | | |
Portfolio Turnover of the Portfolio(5) | | | 78 | % | | | 35 | % | | | 30 | %(6) | | | — | | | | — | |
| | | | | |
Portfolio Turnover of the Fund | | | — | | | | — | | | | 6 | %(6)(7) | | | 41 | % | | | 122 | % |
| (1) | Returns are historical and are calculated by determining the percentage change in net asset value with all distributions reinvested and do not reflect the effect of sales charges. |
| (2) | The investment adviser and administrator of the Fund and the investment adviser of the Portfolio reimbursed certain operating expenses (equal to 0.04%, 0.05%, 0.07%, 0.18% and 0.56% of average daily net assets for the years ended January 31, 2019, 2018, 2017, 2016 and 2015, respectively). Absent this reimbursement, total return would be lower. |
| (3) | Includes the Fund’s share of the Portfolio’s allocated expenses for the period while the Fund was investing in the Portfolio. |
| (4) | Excludes the effect of custody fee credits, if any, of less than 0.005%. Effective September 1, 2015, custody fee credits, which were earned on cash deposit balances, were discontinued by the custodian. |
| (5) | Portfolio turnover represents the rate of portfolio activity for the period while the Fund was investing in the Portfolio. |
| (7) | For the period from February 1, 2016 through March 27, 2016 when the Fund was making investments directly in securities. |
| | | | |
| | 10 | | See Notes to Financial Statements. |
Eaton Vance
TABS 5-to-15 Year Laddered Municipal Bond Fund
January 31, 2019
Financial Highlights — continued
| | | | | | | | | | | | | | | | | | | | |
| | | Class C | |
| |
| | | Year Ended January 31, | |
| | | 2019 | | | 2018 | | | 2017 | | | 2016 | | | 2015 | |
| | | | | | |
Net asset value — Beginning of year | | $ | 12.100 | | | $ | 11.890 | | | $ | 12.210 | | | $ | 12.070 | | | $ | 10.790 | |
| | | | | |
| Income (Loss) From Operations | | | | | | | | | | | | | | | | | | | | |
| | | | | |
Net investment income | | $ | 0.134 | | | $ | 0.118 | | | $ | 0.082 | | | $ | 0.152 | | | $ | 0.208 | |
| | | | | |
Net realized and unrealized gain (loss) | | | 0.120 | | | | 0.210 | | | | (0.320 | ) | | | 0.138 | | | | 1.280 | |
| | | | | |
Total income (loss) from operations | | $ | 0.254 | | | $ | 0.328 | | | $ | (0.238 | ) | | $ | 0.290 | | | $ | 1.488 | |
| | | | | |
| Less Distributions | | | | | | | | | | | | | | | | | | | | |
| | | | | |
From net investment income | | $ | (0.134 | ) | | $ | (0.118 | ) | | $ | (0.082 | ) | | $ | (0.150 | ) | | $ | (0.208 | ) |
| | | | | |
Total distributions | | $ | (0.134 | ) | | $ | (0.118 | ) | | $ | (0.082 | ) | | $ | (0.150 | ) | | $ | (0.208 | ) |
| | | | | |
Net asset value — End of year | | $ | 12.220 | | | $ | 12.100 | | | $ | 11.890 | | | $ | 12.210 | | | $ | 12.070 | |
| | | | | |
Total Return(1)(2) | | | 2.12 | % | | | 2.75 | % | | | (1.96 | )% | | | 2.45 | % | | | 13.92 | % |
| | | | | |
| Ratios/Supplemental Data | | | | | | | | | | | | | | | | | | | | |
| | | | | |
Net assets, end of year (000’s omitted) | | $ | 45,309 | | | $ | 55,476 | | | $ | 53,321 | | | $ | 18,594 | | | $ | 2,390 | |
| | | | | |
Ratios (as a percentage of average daily net assets):(3) | | | | | | | | | | | | | | | | | | | | |
| | | | | |
Expenses(2) | | | 1.40 | % | | | 1.40 | % | | | 1.40 | % | | | 1.42 | %(4) | | | 1.67 | %(4) |
| | | | | |
Net investment income | | | 1.11 | % | | | 0.96 | % | | | 0.66 | % | | | 1.17 | % | | | 1.85 | % |
| | | | | |
Portfolio Turnover of the Portfolio(5) | | | 78 | % | | | 35 | % | | | 30 | %(6) | | | — | | | | — | |
| | | | | |
Portfolio Turnover of the Fund | | | — | | | | — | | | | 6 | %(6)(7) | | | 41 | % | | | 122 | % |
| (1) | Returns are historical and are calculated by determining the percentage change in net asset value with all distributions reinvested and do not reflect the effect of sales charges. |
| (2) | The investment adviser and administrator of the Fund and the investment adviser of the Portfolio reimbursed certain operating expenses (equal to 0.04%, 0.05%, 0.07%, 0.18% and 0.56% of average daily net assets for the years ended January 31, 2019, 2018, 2017, 2016 and 2015, respectively). Absent this reimbursement, total return would be lower. |
| (3) | Includes the Fund’s share of the Portfolio’s allocated expenses for the period while the Fund was investing in the Portfolio. |
| (4) | Excludes the effect of custody fee credits, if any, of less than 0.005%. Effective September 1, 2015, custody fee credits, which were earned on cash deposit balances, were discontinued by the custodian. |
| (5) | Portfolio turnover represents the rate of portfolio activity for the period while the Fund was investing in the Portfolio. |
| (7) | For the period from February 1, 2016 through March 27, 2016 when the Fund was making investments directly in securities. |
| | | | |
| | 11 | | See Notes to Financial Statements. |
Eaton Vance
TABS 5-to-15 Year Laddered Municipal Bond Fund
January 31, 2019
Financial Highlights — continued
| | | | | | | | | | | | | | | | | | | | |
| | | Class I | |
| |
| | | Year Ended January 31, | |
| | | 2019 | | | 2018 | | | 2017 | | | 2016 | | | 2015 | |
| | | | | | |
Net asset value — Beginning of year | | $ | 12.100 | | | $ | 11.890 | | | $ | 12.210 | | | $ | 12.070 | | | $ | 10.790 | |
| | | | | |
| Income (Loss) From Operations | | | | | | | | | | | | | | | | | | | | |
| | | | | |
Net investment income | | $ | 0.255 | | | $ | 0.240 | | | $ | 0.206 | | | $ | 0.270 | | | $ | 0.322 | |
| | | | | |
Net realized and unrealized gain (loss) | | | 0.110 | | | | 0.210 | | | | (0.320 | ) | | | 0.140 | | | | 1.280 | |
| | | | | |
Total income (loss) from operations | | $ | 0.365 | | | $ | 0.450 | | | $ | (0.114 | ) | | $ | 0.410 | | | $ | 1.602 | |
| | | | | |
| Less Distributions | | | | | | | | | | | | | | | | | | | | |
| | | | | |
From net investment income | | $ | (0.255 | ) | | $ | (0.240 | ) | | $ | (0.206 | ) | | $ | (0.270 | ) | | $ | (0.322 | ) |
| | | | | |
Total distributions | | $ | (0.255 | ) | | $ | (0.240 | ) | | $ | (0.206 | ) | | $ | (0.270 | ) | | $ | (0.322 | ) |
| | | | | |
Net asset value — End of year | | $ | 12.210 | | | $ | 12.100 | | | $ | 11.890 | | | $ | 12.210 | | | $ | 12.070 | |
| | | | | |
Total Return(1)(2) | | | 3.06 | % | | | 3.79 | % | | | (0.97 | )% | | | 3.49 | % | | | 15.05 | % |
| | | | | |
| Ratios/Supplemental Data | | | | | | | | | | | | | | | | | | | | |
| | | | | |
Net assets, end of year (000’s omitted) | | $ | 472,656 | | | $ | 510,220 | | | $ | 284,003 | | | $ | 94,748 | | | $ | 15,344 | |
| | | | | |
Ratios (as a percentage of average daily net assets):(3) | | | | | | | | | | | | | | | | | | | | |
| | | | | |
Expenses(2) | | | 0.40 | % | | | 0.40 | % | | | 0.40 | % | | | 0.42 | %(4) | | | 0.67 | %(4) |
| | | | | |
Net investment income | | | 2.11 | % | | | 1.94 | % | | | 1.66 | % | | | 2.21 | % | | | 2.83 | % |
| | | | | |
Portfolio Turnover of the Portfolio(5) | | | 78 | % | | | 35 | % | | | 30 | %(6) | | | — | | | | — | |
| | | | | |
Portfolio Turnover of the Fund | | | — | | | | — | | | | 6 | %(6)(7) | | | 41 | % | | | 122 | % |
| (1) | Returns are historical and are calculated by determining the percentage change in net asset value with all distributions reinvested. |
| (2) | The investment adviser and administrator of the Fund and the investment adviser of the Portfolio reimbursed certain operating expenses (equal to 0.04%, 0.05%, 0.07%, 0.18% and 0.56% of average daily net assets for the years ended January 31, 2019, 2018, 2017, 2016 and 2015, respectively). Absent this reimbursement, total return would be lower. |
| (3) | Includes the Fund’s share of the Portfolio’s allocated expenses for the period while the Fund was investing in the Portfolio. |
| (4) | Excludes the effect of custody fee credits, if any, of less than 0.005%. Effective September 1, 2015, custody fee credits, which were earned on cash deposit balances, were discontinued by the custodian. |
| (5) | Portfolio turnover represents the rate of portfolio activity for the period while the Fund was investing in the Portfolio. |
| (7) | For the period from February 1, 2016 through March 27, 2016 when the Fund was making investments directly in securities. |
| | | | |
| | 12 | | See Notes to Financial Statements. |
Eaton Vance
TABS 5-to-15 Year Laddered Municipal Bond Fund
January 31, 2019
Notes to Financial Statements
1 Significant Accounting Policies
Eaton Vance TABS5-to-15 Year Laddered Municipal Bond Fund (the Fund) is a diversified series of Eaton Vance Municipals Trust II (the Trust). The Trust is a Massachusetts business trust registered under the Investment Company Act of 1940, as amended (the 1940 Act), as anopen-end management investment company. The Fund offers three classes of shares. Class A shares are generally sold subject to a sales charge imposed at time of purchase. Class C shares are sold at net asset value and are generally subject to a contingent deferred sales charge (see Note 5). Class I shares are sold at net asset value and are not subject to a sales charge. Effective January 25, 2019, Class C shares generally automatically convert to Class A shares ten years after their purchase as described in the Fund’s prospectus. Each class represents apro-rata interest in the Fund, but votes separately on class-specific matters and (as noted below) is subject to different expenses. Realized and unrealized gains and losses and net investment income and losses, other than class-specific expenses, are allocated daily to each class of shares based on the relative net assets of each class to the total net assets of the Fund. Each class of shares differs in its distribution plan and certain other class-specific expenses. The Fund invests all of its investable assets in interests in5-to-15 Year Laddered Municipal Bond Portfolio (the Portfolio), a Massachusetts business trust, having the same investment objective and policies as the Fund. The value of the Fund’s investment in the Portfolio reflects the Fund’s proportionate interest in the net assets of the Portfolio (98.8% at January 31, 2019). The performance of the Fund is directly affected by the performance of the Portfolio. The financial statements of the Portfolio, including the portfolio of investments, are included elsewhere in this report and should be read in conjunction with the Fund’s financial statements.
The following is a summary of significant accounting policies of the Fund. The policies are in conformity with accounting principles generally accepted in the United States of America (U.S. GAAP). The Fund is an investment company and follows accounting and reporting guidance in the Financial Accounting Standards Board (FASB) Accounting Standards Codification Topic 946.
A Investment Valuation — Valuation of securities by the Portfolio is discussed in Note 1A of the Portfolio’s Notes to Financial Statements, which are included elsewhere in this report.
B Income — The Fund’s net investment income or loss consists of the Fund’spro-rata share of the net investment income or loss of the Portfolio, less all actual and accrued expenses of the Fund.
C Federal Taxes — The Fund’s policy is to comply with the provisions of the Internal Revenue Code applicable to regulated investment companies and to distribute to shareholders each year substantially all of its taxable, if any, andtax-exempt net investment income, and all or substantially all of its net realized capital gains. Accordingly, no provision for federal income or excise tax is necessary. The Fund intends to satisfy conditions which will enable it to designate distributions from the interest income generated by the Portfolio’s investments in municipal obligations, which are exempt from regular federal income tax when received by the Portfolio, as exempt-interest dividends. The portion of such interest, if any, earned on private activity bonds issued after August 7, 1986, may be considered a tax preference item to shareholders.
As of January 31, 2019, the Fund had no uncertain tax positions that would require financial statement recognition,de-recognition, or disclosure. The Fund files a U.S. federal income tax return annually after its fiscalyear-end, which is subject to examination by the Internal Revenue Service for a period of three years from the date of filing.
D Expenses — The majority of expenses of the Trust are directly identifiable to an individual fund. Expenses which are not readily identifiable to a specific fund are allocated taking into consideration, among other things, the nature and type of expense and the relative size of the funds.
E Use of Estimates — The preparation of the financial statements in conformity with U.S. GAAP requires management to make estimates and assumptions that affect the reported amounts of assets and liabilities at the date of the financial statements and the reported amounts of income and expense during the reporting period. Actual results could differ from those estimates.
F Indemnifications — Under the Trust’s organizational documents, its officers and Trustees may be indemnified against certain liabilities and expenses arising out of the performance of their duties to the Fund. Under Massachusetts law, if certain conditions prevail, shareholders of a Massachusetts business trust (such as the Trust) could be deemed to have personal liability for the obligations of the Trust. However, the Trust’s Declaration of Trust contains an express disclaimer of liability on the part of Fund shareholders and theBy-laws provide that the Trust shall assume the defense on behalf of any Fund shareholders. Moreover, theBy-laws also provide for indemnification out of Fund property of any shareholder held personally liable solely by reason of being or having been a shareholder for all loss or expense arising from such liability. Additionally, in the normal course of business, the Fund enters into agreements with service providers that may contain indemnification clauses. The Fund’s maximum exposure under these arrangements is unknown as this would involve future claims that may be made against the Fund that have not yet occurred.
G Other — Investment transactions are accounted for on a trade date basis.
2 Distributions to Shareholders and Income Tax Information
The Fund declares dividends daily to shareholders of record at the time of declaration. Distributions are generally paid monthly. Distributions of realized capital gains are made at least annually. Distributions are declared separately for each class of shares. Shareholders may reinvest income and capital gain distributions in additional shares of the same class of the Fund at the net asset value as of the reinvestment date or, at the election of the shareholder, receive distributions in cash. Distributions to shareholders are determined in accordance with income tax regulations, which may differ from U.S. GAAP. As
Eaton Vance
TABS 5-to-15 Year Laddered Municipal Bond Fund
January 31, 2019
Notes to Financial Statements — continued
required by U.S. GAAP, only distributions in excess of tax basis earnings and profits are reported in the financial statements as a return of capital. Permanent differences between book and tax accounting relating to distributions are reclassified topaid-in capital. For tax purposes, distributions from short-term capital gains are considered to be from ordinary income.
The tax character of distributions declared for the years ended January 31, 2019 and January 31, 2018 was as follows:
| | | | | | | | |
| | | Year Ended January 31, | |
| | | 2019 | | | 2018 | |
| | |
Tax-exempt income | | $ | 12,741,219 | | | $ | 10,352,462 | |
As of January 31, 2019, the components of distributable earnings (accumulated loss) on a tax basis were as follows:
| | | | |
| | |
Undistributedtax-exempt income | | $ | 187,780 | |
| |
Deferred capital losses | | $ | (15,995,522 | ) |
| |
Net unrealized appreciation | | $ | 11,350,955 | |
| |
Distributions payable | | $ | (184,105 | ) |
At January 31, 2019, the Fund, for federal income tax purposes, had deferred capital losses of $15,995,522 which would reduce its taxable income arising from future net realized gains on investment transactions, if any, to the extent permitted by the Internal Revenue Code, and thus would reduce the amount of distributions to shareholders, which would otherwise be necessary to relieve the Fund of any liability for federal income or excise tax. The deferred capital losses are treated as arising on the first day of the Fund’s next taxable year and retain the same short-term or long-term character as when originally deferred. Of the deferred capital losses at January 31, 2019, $12,738,531 are short-term and $3,256,991 are long-term.
3 Investment Adviser and Administration Fee and Other Transactions with Affiliates
The investment adviser fee is earned by Eaton Vance Management (EVM) as compensation for investment advisory services rendered to the Fund. The fee is computed at an annual rate of 0.32% of the Fund’s average daily net assets that are not invested in other investment companies for which EVM or its affiliates serve as investment adviser and receive an advisory fee (“Direct Assets”) up to $1 billion and is payable monthly. On Direct Assets of $1 billion and over, the annual fee is reduced. For the year ended January 31, 2019, the Fund incurred no investment adviser fee on Direct Assets. To the extent the Fund’s assets are invested in the Portfolio, the Fund is allocated its share of the Portfolio’s investment adviser fee. The Portfolio has engaged Boston Management and Research (BMR), a subsidiary of EVM, to render investment advisory services. See Note 2 of the Portfolio’s Notes to Financial Statements which are included elsewhere in this report. EVM also serves as the administrator of the Fund, but receives no compensation.
EVM has agreed to reimburse the Fund’s expenses to the extent that total annual operating expenses (relating to ordinary operating expenses only) exceed 0.65%, 1.40% and 0.40% of the Fund’s average daily net assets for Class A, Class C and Class I, respectively. This agreement may be changed or terminated after May 31, 2019. Pursuant to this agreement, EVM was allocated $171,431 of the Fund’s operating expenses for the year ended January 31, 2019.
EVM providessub-transfer agency and related services to the Fund pursuant to aSub-Transfer Agency Support Services Agreement. For the year ended January 31, 2019, EVM earned $5,069 from the Fund pursuant to such agreement, which is included in transfer and dividend disbursing agent fees on the Statement of Operations. The Fund was informed that Eaton Vance Distributors, Inc. (EVD), an affiliate of EVM and the Fund’s principal underwriter, received $8,900 as its portion of the sales charge on sales of Class A shares for the year ended January 31, 2019. EVD also received distribution and service fees from Class A and Class C shares (see Note 4) and contingent deferred sales charges (see Note 5).
Trustees and officers of the Fund who are members of EVM’s or BMR’s organizations receive remuneration for their services to the Fund out of the investment adviser fee. Certain officers and Trustees of the Fund and the Portfolio are officers of the above organizations.
4 Distribution Plans
The Fund has in effect a distribution plan for Class A shares (Class A Plan) pursuant to Rule 12b-1 under the 1940 Act. Pursuant to the Class A Plan, the Fund pays EVD a distribution and service fee of 0.25% per annum of its average daily net assets attributable to Class A shares for distribution services and facilities provided to the Fund by EVD, as well as for personal services and/or the maintenance of shareholder accounts. Distribution and service fees paid or accrued to EVD for the year ended January 31, 2019 amounted to $234,044 for Class A shares.
Eaton Vance
TABS 5-to-15 Year Laddered Municipal Bond Fund
January 31, 2019
Notes to Financial Statements — continued
The Fund also has in effect a distribution plan for Class C shares (Class C Plan) pursuant to Rule 12b-1 under the 1940 Act. Pursuant to the Class C Plan, the Fund pays EVD amounts equal to 0.75% per annum of its average daily net assets attributable to Class C shares for providing ongoing distribution services and facilities to the Fund. For the year ended January 31, 2019, the Fund paid or accrued to EVD $380,649 for Class C shares.
Pursuant to the Class C Plan, the Fund also makes payments of service fees to EVD, financial intermediaries and other persons in amounts equal to 0.25% per annum of its average daily net assets attributable to that class. Service fees paid or accrued are for personal services and/or the maintenance of shareholder accounts. They are separate and distinct from the sales commissions and distribution fees payable to EVD. Service fees paid or accrued for the year ended January 31, 2019 amounted to $126,883 for Class C shares.
Distribution and service fees are subject to the limitations contained in the Financial Industry Regulatory Authority Rule 2341(d).
5 Contingent Deferred Sales Charges
A contingent deferred sales charge (CDSC) of 1% generally is imposed on redemptions of Class C shares made within one year of purchase. Class A shares may be subject to a 1% CDSC if redeemed within 18 months of purchase (depending on the circumstances of purchase). Generally, the CDSC is based upon the lower of the net asset value at date of redemption or date of purchase. No charge is levied on shares acquired by reinvestment of dividends or capital gain distributions. For the year ended January 31, 2019, the Fund was informed that EVD received approximately $8,000 and $10,000 of CDSCs paid by Class A and Class C shareholders, respectively.
6 Investment Transactions
For the year ended January 31, 2019, increases and decreases in the Fund’s investment in the Portfolio aggregated $60,666,586 and $143,209,197, respectively. In addition, a Portfolio transaction fee is imposed by the Portfolio on the combined daily inflows or outflows of the Fund and the Portfolio’s other investors as more fully described at Note 1H of the Portfolio’s Notes to Financial Statements included herein. Such fee is allocated to the Fund based on itspro-rata interest in the Portfolio. The amount of the Portfolio transaction fee imposed on the Fund, if any, and the allocation of such fee are presented as Other capital on the Statements of Changes in Net Assets.
7 Shares of Beneficial Interest
The Fund’s Declaration of Trust permits the Trustees to issue an unlimited number of full and fractional shares of beneficial interest (without par value). Such shares may be issued in a number of different series (such as the Fund) and classes. Transactions in Fund shares were as follows:
| | | | | | | | |
| | | Year Ended January 31, | |
| Class A | | 2019 | | | 2018 | |
| | |
Sales | | | 1,535,167 | | | | 4,186,392 | |
| | |
Issued to shareholders electing to receive payments of distributions in Fund shares | | | 129,793 | | | | 141,070 | |
| | |
Redemptions | | | (3,193,486 | ) | | | (7,891,006 | ) |
| | |
Converted from Class C shares | | | 48,977 | | | | — | |
| | |
Net decrease | | | (1,479,549 | ) | | | (3,563,544 | ) |
| |
| | | Year Ended January 31, | |
| Class C | | 2019 | | | 2018 | |
| | |
Sales | | | 421,465 | | | | 1,485,759 | |
| | |
Issued to shareholders electing to receive payments of distributions in Fund shares | | | 35,666 | | | | 32,714 | |
| | |
Redemptions | | | (1,282,992 | ) | | | (1,417,974 | ) |
| | |
Converted to Class A shares | | | (49,033 | ) | | | — | |
| | |
Net increase (decrease) | | | (874,894 | ) | | | 100,499 | |
Eaton Vance
TABS 5-to-15 Year Laddered Municipal Bond Fund
January 31, 2019
Notes to Financial Statements — continued
| | | | | | | | |
| | | Year Ended January 31, | |
| Class I | | 2019 | | | 2018 | |
| | |
Sales | | | 15,477,973 | | | | 29,164,225 | |
| | |
Issued to shareholders electing to receive payments of distributions in Fund shares | | | 704,377 | | | | 510,962 | |
| | |
Redemptions | | | (19,650,265 | ) | | | (11,399,214 | ) |
| | |
Net increase (decrease) | | | (3,467,915 | ) | | | 18,275,973 | |
Eaton Vance
TABS 5-to-15 Year Laddered Municipal Bond Fund
January 31, 2019
Report of Independent Registered Public Accounting Firm
To the Trustees of Eaton Vance Municipals Trust II and Shareholders of Eaton Vance TABS5-to-15 Year Laddered Municipal Bond Fund:
Opinion on the Financial Statements and Financial Highlights
We have audited the accompanying statement of assets and liabilities of Eaton Vance TABS5-to-15 Year Laddered Municipal Bond Fund (the “Fund”) (one of the funds constituting Eaton Vance Municipals Trust II), as of January 31, 2019, the related statement of operations for the year then ended, the statements of changes in net assets for each of the two years in the period then ended, the financial highlights for each of the five years in the period then ended, and the related notes. In our opinion, the financial statements and financial highlights present fairly, in all material respects, the financial position of the Fund as of January 31, 2019, and the results of its operations for the year then ended, the changes in its net assets for each of the two years in the period then ended, and the financial highlights for each of the five years in the period then ended in conformity with accounting principles generally accepted in the United States of America.
Basis for Opinion
These financial statements and financial highlights are the responsibility of the Fund’s management. Our responsibility is to express an opinion on the Fund’s financial statements and financial highlights based on our audits. We are a public accounting firm registered with the Public Company Accounting Oversight Board (United States) (PCAOB) and are required to be independent with respect to the Fund in accordance with the U.S. federal securities laws and the applicable rules and regulations of the Securities and Exchange Commission and the PCAOB.
We conducted our audits in accordance with the standards of the PCAOB. Those standards require that we plan and perform the audit to obtain reasonable assurance about whether the financial statements and financial highlights are free of material misstatement, whether due to error or fraud. The Fund is not required to have, nor were we engaged to perform, an audit of its internal control over financial reporting. As part of our audits we are required to obtain an understanding of internal control over financial reporting but not for the purpose of expressing an opinion on the effectiveness of the Fund’s internal control over financial reporting. Accordingly, we express no such opinion.
Our audits included performing procedures to assess the risks of material misstatement of the financial statements and financial highlights, whether due to error or fraud, and performing procedures that respond to those risks. Such procedures included examining, on a test basis, evidence regarding the amounts and disclosures in the financial statements and financial highlights. Our audits also included evaluating the accounting principles used and significant estimates made by management, as well as evaluating the overall presentation of the financial statements and financial highlights. We believe that our audits provide a reasonable basis for our opinion.
/s/ Deloitte & Touche LLP
Boston, Massachusetts
March 21, 2019
We have served as the auditor of one or more Eaton Vance investment companies since 1959.
Eaton Vance
TABS 5-to-15 Year Laddered Municipal Bond Fund
January 31, 2019
Federal Tax Information (Unaudited)
The Form1099-DIV you receive in February 2020 will show the tax status of all distributions paid to your account in calendar year 2019. Shareholders are advised to consult their own tax adviser with respect to the tax consequences of their investment in the Fund. As required by the Internal Revenue Code and/or regulations, shareholders must be notified regarding exempt-interest dividends.
Exempt-Interest Dividends. For the fiscal year ended January 31, 2019, the Fund designates 100.00% of distributions from net investment income as an exempt-interest dividend.
5-to-15 Year Laddered Municipal Bond Portfolio
January 31, 2019
Portfolio of Investments
| | | | | | | | |
| Tax-Exempt Investments — 97.7% | |
| Security | | Principal
Amount
(000’s omitted) | | | Value | |
| | | | | | | | |
| | |
| Bond Bank — 0.0%(1) | | | | | | |
| | |
New York Environmental Facilities Corp., Revolving Fund Revenue, 5.00%, 6/15/29 | | $ | 50 | | | $ | 50,617 | |
| |
| | | | $ | 50,617 | |
| | |
| Education — 5.2% | | | | | | |
| | |
Alabama Public School and College Authority, 5.00%, 5/1/23 | | $ | 500 | | | $ | 566,050 | |
| | |
Alabama Public School and College Authority, 5.00%, 5/1/24 | | | 500 | | | | 578,355 | |
| | |
Brownsburg 1999 School Building Corp., IN, 5.00%, 2/5/24 | | | 235 | | | | 269,091 | |
| | |
Brownsburg 1999 School Building Corp., IN, 5.00%, 2/5/25 | | | 200 | | | | 233,038 | |
| | |
Brownsburg 1999 School Building Corp., IN, 5.00%, 2/5/26 | | | 565 | | | | 668,463 | |
| | |
California Municipal Finance Authority, (California Lutheran University), 5.00%, 10/1/24 | | | 275 | | | | 314,856 | |
| | |
California Municipal Finance Authority, (California Lutheran University), 5.00%, 10/1/25 | | | 275 | | | | 319,107 | |
| | |
California Municipal Finance Authority, (California Lutheran University), 5.00%, 10/1/26 | | | 300 | | | | 351,231 | |
| | |
California Municipal Finance Authority, (California Lutheran University), 5.00%, 10/1/27 | | | 300 | | | | 354,723 | |
| | |
Colorado School of Mines, 4.00%, 12/1/34 | | | 890 | | | | 944,299 | |
| | |
Connecticut Health and Educational Facilities Authority, (Fairfield University), 5.00%, 7/1/23 | | | 700 | | | | 787,542 | |
| | |
Connecticut Health and Educational Facilities Authority, (Fairfield University), 5.00%, 7/1/24 | | | 1,000 | | | | 1,144,220 | |
| | |
Connecticut Health and Educational Facilities Authority, (Fairfield University), 5.00%, 7/1/25 | | | 875 | | | | 1,016,636 | |
| | |
Connecticut Health and Educational Facilities Authority, (Fairfield University), 5.00%, 7/1/26 | | | 1,000 | | | | 1,173,160 | |
| | |
Florida Higher Educational Facilities Financing Authority, (Nova Southeastern University), 5.00%, 4/1/30 | | | 750 | | | | 844,418 | |
| | |
Louisiana Public Facilities Authority, (Tulane University), 5.00%, 12/15/27 | | | 505 | | | | 595,183 | |
| | |
Massachusetts Health and Educational Facilities Authority, (Tufts University), (SPA: Wells Fargo Bank, N.A.), 1.50%, 8/15/34(2) | | | 5,000 | | | | 5,000,000 | |
| | |
Nevada System of Higher Education, 5.00%, 7/1/24 | | | 1,000 | | | | 1,130,930 | |
| | |
North Carolina Capital Facilities Finance Agency, (Davidson College), 5.00%, 3/1/29 | | | 200 | | | | 217,858 | |
| | |
Red River Education Financing Corp., TX, (Texas Christian University), 5.00%, 3/15/24 | | | 100 | | | | 114,302 | |
| | |
Rhode Island Health and Educational Building Corp., (Rhode Island School of Design), (LOC: TD Bank, N.A.), 1.47%, 8/15/36(3) | | | 5,000 | | | | 5,000,000 | |
| | |
S.M. Educational Building Corp., MS, 5.00%, 9/1/25 | | | 250 | | | | 293,900 | |
| | |
Saginaw Valley State University, MI, 5.00%, 7/1/26 | | | 750 | | | | 883,770 | |
| | |
Saginaw Valley State University, MI, 5.00%, 7/1/27 | | | 750 | | | | 876,540 | |
| | | | | | | | |
| Security | | Principal
Amount
(000’s omitted) | | | Value | |
| | | | | | | | |
| | |
| Education (continued) | | | | | | |
| | |
Saginaw Valley State University, MI, 5.00%, 7/1/28 | | $ | 1,000 | | | $ | 1,161,720 | |
| | |
Tarrant County Cultural Education Facilities Finance Corp., TX, (Hendrick Medical Center), 5.00%, 9/1/23 | | | 250 | | | | 280,768 | |
| | |
University of California, 5.00%, 5/15/32 | | | 3,000 | | | | 3,358,200 | |
| | |
University of North Carolina at Greensboro, 5.00%, 4/1/33 | | | 1,085 | | | | 1,232,169 | |
| | |
Virginia Commonwealth University, 4.00%, 11/1/34 | | | 1,370 | | | | 1,455,159 | |
| | |
Western Michigan University, 5.00%, 11/15/24 | | | 300 | | | | 347,913 | |
| |
| | | | $ | 31,513,601 | |
| | |
| Electric Utilities — 3.7% | | | | | | |
| | |
Brownsville, TX, Utilities System Revenue, 5.00%, 9/1/29 | | $ | 1,000 | | | $ | 1,157,260 | |
| | |
Energy Northwest, WA, Wind Project Revenue, 5.00%, 7/1/25 | | | 365 | | | | 423,612 | |
| | |
Energy Northwest, WA, Wind Project Revenue, 5.00%, 7/1/26 | | | 1,000 | | | | 1,158,070 | |
| | |
Fayetteville Public Works Commission, NC, 5.00%, 3/1/25 | | | 1,000 | | | | 1,177,970 | |
| | |
Garland, TX, Electric Utility System Revenue, 5.00%, 3/1/32 | | | 250 | | | | 284,110 | |
| | |
Lower Colorado River Authority, TX, (LCRA Transmission Services Corp.), 5.00%, 5/15/24 | | | 100 | | | | 114,090 | |
| | |
Marquette Board of Light and Power, MI, 5.00%, 7/1/27 | | | 735 | | | | 855,224 | |
| | |
North Carolina Municipal Power Agency No. 1, (Catawba), 5.00%, 1/1/29 | | | 500 | | | | 588,520 | |
| | |
Orlando Utilities Commission, FL, Utility System Revenue, (SPA: TD Bank, N.A.), 1.42%, 10/1/33(3) | | | 5,000 | | | | 5,000,000 | |
| | |
Pend Oreille County Public Utility District No. 1, WA, Green Bonds, 5.00%, 1/1/25 | | | 500 | | | | 565,220 | |
| | |
Pend Oreille County Public Utility District No. 1, WA, Green Bonds, 5.00%, 1/1/26 | | | 1,075 | | | | 1,229,875 | |
| | |
Public Power Generation Agency, NE, (Whelan Energy Center Unit 2), 5.00%, 1/1/23 | | | 1,325 | | | | 1,469,438 | |
| | |
Public Power Generation Agency, NE, (Whelan Energy Center Unit 2), 5.00%, 1/1/25 | | | 500 | | | | 574,965 | |
| | |
Redding Joint Powers Financing Authority, CA, Electric System Revenue, 4.00%, 6/1/23 | | | 125 | | | | 137,226 | |
| | |
Redding Joint Powers Financing Authority, CA, Electric System Revenue, 5.00%, 6/1/24 | | | 300 | | | | 349,287 | |
| | |
Redding Joint Powers Financing Authority, CA, Electric System Revenue, 5.00%, 6/1/26 | | | 250 | | | | 298,425 | |
| | |
Springfield Electric System Revenue, IL, 5.00%, 3/1/22 | | | 500 | | | | 544,175 | |
| | |
Springfield Electric System Revenue, IL, 5.00%, 3/1/27 | | | 250 | | | | 284,265 | |
| | |
Springfield Electric System Revenue, IL, 5.00%, 3/1/28 | | | 250 | | | | 283,210 | |
| | |
Springfield Electric System Revenue, IL, 5.00%, 3/1/29 | | | 250 | | | | 282,162 | |
| | |
Tallahassee, FL, Energy System Revenue, 5.00%, 10/1/27 | | | 300 | | | | 348,963 | |
| | |
Tallahassee, FL, Energy System Revenue, 5.00%, 10/1/28 | | | 400 | | | | 463,424 | |
| | |
Tallahassee, FL, Energy System Revenue, 5.00%, 10/1/29 | | | 1,120 | | | | 1,293,690 | |
| | |
Tallahassee, FL, Energy System Revenue, 5.00%, 10/1/30 | | | 1,500 | | | | 1,727,430 | |
| | |
Tallahassee, FL, Energy System Revenue, 5.00%, 10/1/31 | | | 1,000 | | | | 1,147,030 | |
| | |
Tallahassee, FL, Energy System Revenue, 5.00%, 10/1/33 | | | 300 | | | | 341,370 | |
| | | | |
| | 19 | | See Notes to Financial Statements. |
5-to-15 Year Laddered Municipal Bond Portfolio
January 31, 2019
Portfolio of Investments — continued
| | | | | | | | |
| Security | | Principal
Amount
(000’s omitted) | | | Value | |
| | | | | | | | |
| | |
| Electric Utilities (continued) | | | | | | |
| | |
Walnut Energy Center Authority, CA, 5.00%, 1/1/33 | | $ | 250 | | | $ | 283,730 | |
| |
| | | | $ | 22,382,741 | |
| | |
| Escrowed / Prerefunded — 0.1% | | | | | | |
| | |
Wisconsin Health and Educational Facilities Authority, (Ministry Health Care), Prerefunded to 8/15/22, 5.00%, 8/15/32 | | $ | 500 | | | $ | 554,855 | |
| |
| | | | $ | 554,855 | |
| | |
| General Obligations — 29.3% | | | | | | |
| | |
Abilene Independent School District, TX, (PSF Guaranteed), 4.00%, 2/15/32(4) | | $ | 800 | | | $ | 867,736 | |
| | |
Addison, TX, 5.00%, 2/15/26 | | | 270 | | | | 302,886 | |
| | |
Anchorage, AK, 5.00%, 9/1/23 | | | 750 | | | | 854,580 | |
| | |
Anchorage, AK, 5.00%, 9/1/24 | | | 250 | | | | 291,385 | |
| | |
Anchorage, AK, 5.00%, 9/1/25 | | | 100 | | | | 118,802 | |
| | |
Anchorage, AK, 5.00%, 9/1/27 | | | 780 | | | | 919,799 | |
| | |
Arlington County, VA, 4.00%, 8/1/27 | | | 2,090 | | | | 2,279,270 | |
| | |
Avon, OH, 4.00%, 12/1/31 | | | 340 | | | | 365,850 | |
| | |
Belding Area Schools, MI, 5.00%, 5/1/28 | | | 250 | | | | 292,600 | |
| | |
Belding Area Schools, MI, 5.00%, 5/1/30 | | | 250 | | | | 289,363 | |
| | |
Birmingham, AL, 5.00%, 12/1/25 | | | 1,050 | | | | 1,243,137 | |
| | |
Birmingham, AL, 5.00%, 12/1/27 | | | 2,460 | | | | 2,987,153 | |
| | |
Bryant School District No. 25, AR, 3.00%, 2/1/26 | | | 300 | | | | 307,452 | |
| | |
Burlington, VT, 5.00%, 11/1/24 | | | 180 | | | | 205,348 | |
| | |
Burlington, VT, 5.00%, 11/1/25 | | | 400 | | | | 462,028 | |
| | |
Burlington, VT, 5.00%, 11/1/26 | | | 150 | | | | 175,557 | |
| | |
California, 4.00%, 9/1/26 | | | 320 | | | | 364,051 | |
| | |
California, 5.00%, 8/1/24 | | | 1,390 | | | | 1,619,225 | |
| | |
California, 5.00%, 10/1/24 | | | 5,000 | | | | 5,845,250 | |
| | |
California, 5.00%, 8/1/26 | | | 2,010 | | | | 2,383,458 | |
| | |
California, 5.00%, 8/1/28 | | | 2,000 | | | | 2,477,340 | |
| | |
California, 5.00%, 8/1/32 | | | 1,590 | | | | 1,850,585 | |
| | |
California, 5.25%, 9/1/23 | | | 400 | | | | 436,152 | |
| | |
California, (LOC: Sumitomo Mitsui Banking Co.), 1.08%, 5/1/40(3) | | | 5,000 | | | | 5,000,000 | |
| | |
Central Dauphin School District, PA, 5.00%, 2/1/29 | | | 500 | | | | 587,555 | |
| | |
Clark County, NV, 4.00%, 11/1/34 | | | 3,500 | | | | 3,671,290 | |
| | |
Collin County, TX, 5.00%, 2/15/25 | | | 1,605 | | | | 1,883,981 | |
| | |
Colonial School District, PA, 5.00%, 2/15/32 | | | 100 | | | | 115,867 | |
| | |
Colonial School District, PA, 5.00%, 2/15/33 | | | 200 | | | | 230,798 | |
| | |
Cook County School District No. 25, (Arlington Heights), IL, 5.00%, 12/15/32 | | | 630 | | | | 726,018 | |
| | |
Dallas, TX, 5.00%, 2/15/26 | | | 4,860 | | | | 5,395,961 | |
| | |
Dallas, TX, 5.00%, 2/15/29 | | | 2,775 | | | | 3,121,958 | |
| | | | | | | | |
| Security | | Principal
Amount
(000’s omitted) | | | Value | |
| | | | | | | | |
| | |
| General Obligations (continued) | | | | | | |
| | |
Dallas, TX, 5.00%, 2/15/31 | | $ | 3,615 | | | $ | 3,969,631 | |
| | |
Delaware, 5.00%, 2/1/29 | | | 1,000 | | | | 1,233,720 | |
| | |
District of Columbia, 5.00%, 6/1/33 | | | 6,690 | | | | 7,550,869 | |
| | |
Douglas County School District No. Re-1, CO, 4.00%, 12/15/34(4) | | | 3,000 | | | | 3,235,620 | |
| | |
Dowagiac Union School District, MI, 4.00%, 5/1/26 | | | 350 | | | | 393,019 | |
| | |
Edgewood City School District, OH, 5.25%, 12/1/33 | | | 500 | | | | 564,555 | |
| | |
Edinburg, TX, 5.00%, 3/1/24 | | | 315 | | | | 359,607 | |
| | |
Edinburg, TX, 5.00%, 3/1/25 | | | 310 | | | | 359,953 | |
| | |
Fairfax County, VA, 5.00%, 10/1/31(4) | | | 5,730 | | | | 7,063,199 | |
| | |
Fayette County School District, GA, 5.25%, 9/1/24 | | | 1,175 | | | | 1,384,925 | |
| | |
Flower Mound, TX, 4.00%, 3/1/32 | | | 100 | | | | 107,412 | |
| | |
Flower Mound, TX, 5.00%, 3/1/27 | | | 510 | | | | 605,039 | |
| | |
Frisco Independent School District, TX, (PSF Guaranteed), 4.00%, 8/15/30 | | | 400 | | | | 432,784 | |
| | |
Georgia, 5.00%, 2/1/32 | | | 1,000 | | | | 1,188,050 | |
| | |
Granville Exempted Village School District, OH, 5.00%, 12/1/26 | | | 500 | | | | 591,735 | |
| | |
Harlandale Independent School District, TX, 5.00%, 8/1/29 | | | 845 | | | | 991,143 | |
| | |
Hennepin County, MN, 5.00%, 12/1/33 | | | 1,000 | | | | 1,175,090 | |
| | |
Hennepin County, MN, (SPA: TD Bank, N.A.), 1.38%, 12/1/38(3) | | | 5,000 | | | | 5,000,000 | |
| | |
Homewood, AL, 5.00%, 9/1/28 | | | 2,000 | | | | 2,366,140 | |
| | |
Homewood, AL, 5.00%, 9/1/29 | | | 2,000 | | | | 2,352,960 | |
| | |
Hudson City School District, OH, 4.00%, 12/1/32 | | | 350 | | | | 374,703 | |
| | |
Jourdanton Independent School District, TX, (PSF Guaranteed), 4.00%, 2/15/26 | | | 500 | | | | 560,750 | |
| | |
Kane, Cook and DuPage Counties School District No. 46, IL, 5.00%, 1/1/29 | | | 1,000 | | | | 1,102,630 | |
| | |
Kane, McHenry, Cook and DeKalb Counties Community Unit School District No. 300, IL, 5.00%, 1/1/28 | | | 2,370 | | | | 2,781,669 | |
| | |
La Joya Independent School District, TX, (PSF Guaranteed), 5.00%, 2/15/26 | | | 585 | | | | 644,319 | |
| | |
Lakeland, FL, 5.00%, 10/1/25 | | | 635 | | | | 742,042 | |
| | |
Lakeland, FL, 5.00%, 10/1/28 | | | 1,500 | | | | 1,736,865 | |
| | |
Lakeland, FL, 5.00%, 10/1/30 | | | 1,000 | | | | 1,150,460 | |
| | |
Leander Independent School District, TX, (PSF Guaranteed), 0.00%, 8/15/31 | | | 850 | | | | 536,903 | |
| | |
Lewisville Independent School District, TX, (PSF Guaranteed), 4.00%, 8/15/27 | | | 1,600 | | | | 1,771,216 | |
| | |
Little Rock School District, AR, 3.00%, 2/1/23 | | | 400 | | | | 407,104 | |
| | |
McLean County Public Building Commission, IL, 5.00%, 12/1/28 | | | 200 | | | | 229,746 | |
| | |
Miami-Dade County School District, FL, 5.00%, 3/15/28 | | | 300 | | | | 346,314 | |
| | |
Miami-Dade County, FL, 5.00%, 7/1/29 | | | 1,000 | | | | 1,167,140 | |
| | |
Miamisburg City School District, OH, 4.00%, 12/1/31 | | | 300 | | | | 321,843 | |
| | |
Milpitas Unified School District, CA, (Election of 2012), 4.00%, 8/1/32 | | | 560 | | | | 593,645 | |
| | | | |
| | 20 | | See Notes to Financial Statements. |
5-to-15 Year Laddered Municipal Bond Portfolio
January 31, 2019
Portfolio of Investments — continued
| | | | | | | | |
| Security | | Principal
Amount
(000’s omitted) | | | Value | |
| | | | | | | | |
| | |
| General Obligations (continued) | | | | | | |
| | |
Mountain View-Los Altos Union High School District, CA, 0.00%, 8/1/27 | | $ | 175 | | | $ | 141,860 | |
| | |
Navasota Independent School District, TX, (PSF Guaranteed), 5.00%, 2/15/28 | | | 195 | | | | 225,553 | |
| | |
Navasota Independent School District, TX, (PSF Guaranteed), 5.00%, 2/15/29 | | | 340 | | | | 391,547 | |
| | |
Navasota Independent School District, TX, (PSF Guaranteed), 5.00%, 2/15/30 | | | 725 | | | | 831,640 | |
| | |
Navasota Independent School District, TX, (PSF Guaranteed), 5.00%, 2/15/31 | | | 885 | | | | 1,010,608 | |
| | |
Navasota Independent School District, TX, (PSF Guaranteed), 5.00%, 2/15/32 | | | 720 | | | | 819,158 | |
| | |
New Hampshire, 4.00%, 12/1/33 | | | 2,535 | | | | 2,766,319 | |
| | |
New York, NY, 5.00%, 8/1/25 | | | 2,000 | | | | 2,376,960 | |
| | |
North Slope Borough, AK, 5.00%, 6/30/24 | | | 2,000 | | | | 2,148,020 | |
| | |
Ohio, 5.00%, 8/1/26 | | | 1,000 | | | | 1,205,440 | |
| | |
Oregon, 2.20%, 6/1/24 | | | 815 | | | | 826,312 | |
| | |
Oregon, 2.25%, 12/1/24 | | | 1,000 | | | | 1,012,680 | |
| | |
Oregon, 2.35%, 6/1/25 | | | 165 | | | | 167,383 | |
| | |
Oregon, 2.40%, 12/1/25 | | | 1,050 | | | | 1,063,671 | |
| | |
Oregon, 2.50%, 6/1/26 | | | 1,070 | | | | 1,084,745 | |
| | |
Oregon, 2.55%, 12/1/26 | | | 430 | | | | 434,984 | |
| | |
Oregon, (SPA: U.S. Bank, N.A.), 1.47%,
12/1/36(3) | | | 5,000 | | | | 5,000,000 | |
| | |
Pasadena, TX, 4.00%, 2/15/28 | | | 500 | | | | 546,415 | |
| | |
Pasadena, TX, 4.00%, 2/15/29 | | | 250 | | | | 271,695 | |
| | |
Pasadena, TX, 4.00%, 2/15/30 | | | 500 | | | | 539,760 | |
| | |
Pasadena, TX, 4.00%, 2/15/31 | | | 650 | | | | 697,723 | |
| | |
Pendleton School District No. 16R, Umatilla County, OR, 0.00%, 6/15/27 | | | 1,060 | | | | 850,512 | |
| | |
Pennsylvania, 4.00%, 6/1/30 | | | 5,000 | | | | 5,228,600 | |
| | |
Pennsylvania, 4.00%, 6/15/31 | | | 235 | | | | 247,152 | |
| | |
Pennsylvania, 5.00%, 7/1/24 | | | 490 | | | | 563,632 | |
| | |
Pittsburg Unified School District, CA, 5.00%, 8/1/28 | | | 920 | | | | 1,129,144 | |
| | |
Prosper Independent School District, TX, (PSF Guaranteed), 5.00%, 2/15/24 | | | 520 | | | | 598,062 | |
| | |
Ravenswood City School District, CA, (Election of 2016), 5.00%, 8/1/23 | | | 445 | | | | 508,662 | |
| | |
Ravenswood City School District, CA, (Election of 2016), 5.00%, 8/1/24 | | | 465 | | | | 543,269 | |
| | |
Ravenswood City School District, CA, (Election of 2016), 5.00%, 8/1/25 | | | 485 | | | | 577,722 | |
| | |
Ravenswood City School District, CA, (Election of 2016), 5.00%, 8/1/26 | | | 505 | | | | 610,702 | |
| | |
Ravenswood City School District, CA, (Election of 2016), 5.00%, 8/1/27 | | | 530 | | | | 636,032 | |
| | |
Ravenswood City School District, CA, (Election of 2016), 5.00%, 8/1/28 | | | 555 | | | | 661,371 | |
| | | | | | | | |
| Security | | Principal
Amount
(000’s omitted) | | | Value | |
| | | | | | | | |
| | |
| General Obligations (continued) | | | | | | |
| | |
Ravenswood City School District, CA, (Election of 2016), 5.00%, 8/1/29 | | $ | 575 | | | $ | 679,978 | |
| | |
Romeo Community Schools, MI, 5.00%, 5/1/30 | | | 700 | | | | 807,821 | |
| | |
Romulus, MI, 4.00%, 11/1/31 | | | 250 | | | | 268,730 | |
| | |
Romulus, MI, 4.00%, 11/1/32 | | | 300 | | | | 320,691 | |
| | |
Romulus, MI, 4.00%, 11/1/33 | | | 250 | | | | 265,945 | |
| | |
SCAGO Educational Facilities Corp. for Cherokee School District, SC, 5.00%, 12/1/23 | | | 500 | | | | 568,020 | |
| | |
SCAGO Educational Facilities Corp. for Pickens School District, SC, 5.00%, 12/1/26 | | | 1,750 | | | | 2,027,007 | |
| | |
School District 27J, Adams and Weld Counties and City and County of Broomfield, CO, 4.00%, 12/1/30 | | | 750 | | | | 814,553 | |
| | |
School District 27J, Adams and Weld Counties and City and County of Broomfield, CO, 4.00%, 12/1/31 | | | 250 | | | | 270,300 | |
| | |
Seguin Independent School District, TX, (PSF Guaranteed), 4.00%, 8/15/29 | | | 300 | | | | 328,467 | |
| | |
Seward County Unified School District No. 480, KS, 5.00%, 9/1/29 | | | 2,000 | | | | 2,315,820 | |
| | |
South Texas College District, 5.00%, 8/15/30 | | | 1,295 | | | | 1,454,699 | |
| | |
Southfield Public Schools, MI, 5.00%, 5/1/25 | | | 1,100 | | | | 1,282,281 | |
| | |
Southfield Public Schools, MI, 5.00%, 5/1/27 | | | 1,000 | | | | 1,194,240 | |
| | |
St. Vrain Valley School District RE-1J, CO, 5.00%, 12/15/28 | | | 1,700 | | | | 2,046,052 | |
| | |
St. Vrain Valley School District RE-1J, CO, 5.00%, 12/15/29 | | | 1,000 | | | | 1,194,780 | |
| | |
Stamford, CT, 4.00%, 8/1/27 | | | 650 | | | | 728,033 | |
| | |
Sun Valley, ID, 5.00%, 9/15/23 | | | 685 | | | | 782,996 | |
| | |
Sun Valley, ID, 5.00%, 9/15/25 | | | 755 | | | | 898,397 | |
| | |
Sun Valley, ID, 5.00%, 9/15/26 | | | 695 | | | | 841,624 | |
| | |
Texas, (SPA: State Street Bank and Trust Co.), 1.46%, 12/1/42(3) | | | 7,445 | | | | 7,445,000 | |
| | |
Torrance Unified School District, CA, (Election of 2014), 5.00%, 8/1/30 | | | 515 | | | | 610,579 | |
| | |
Torrance Unified School District, CA, (Election of 2014), 5.00%, 8/1/31 | | | 450 | | | | 529,448 | |
| | |
Trussville, AL, 5.00%, 10/1/31 | | | 150 | | | | 167,790 | |
| | |
Tuloso-Midway Independent School District, TX, (PSF Guaranteed), 4.00%, 8/15/27 | | | 510 | | | | 564,881 | |
| | |
Tuloso-Midway Independent School District, TX, (PSF Guaranteed), 4.00%, 8/15/28 | | | 530 | | | | 583,928 | |
| | |
Tuloso-Midway Independent School District, TX, (PSF Guaranteed), 4.00%, 8/15/29 | | | 545 | | | | 597,402 | |
| | |
Tuloso-Midway Independent School District, TX, (PSF Guaranteed), 4.00%, 8/15/30 | | | 570 | | | | 621,722 | |
| | |
Virginia Resources Authority, (Pooled Financing Program), 5.00%, 11/1/25 | | | 600 | | | | 720,942 | |
| | |
Washington, 5.00%, 8/1/28 | | | 1,485 | | | | 1,771,872 | |
| | |
Washington, 5.00%, 8/1/29 | | | 1,400 | | | | 1,659,826 | |
| | | | |
| | 21 | | See Notes to Financial Statements. |
5-to-15 Year Laddered Municipal Bond Portfolio
January 31, 2019
Portfolio of Investments — continued
| | | | | | | | |
| Security | | Principal
Amount
(000’s omitted) | | | Value | |
| | | | | | | | |
| | |
| General Obligations (continued) | | | | | | |
| | |
Weatherford Independent School District, TX, (PSF Guaranteed), 0.00%, 2/15/25 | | $ | 265 | | | $ | 232,381 | |
| | |
Will and Kendall Counties Community Consolidated School District No. 202, IL, 4.00%, 1/1/27 | | | 2,825 | | | | 3,120,156 | |
| | |
Will County Community Unit School District No. 365-U, IL, 4.00%, 1/1/30 | | | 750 | | | | 795,225 | |
| | |
Williamson County, TX, 5.00%, 2/15/28 | | | 300 | | | | 344,259 | |
| | |
York County, PA, 5.00%, 6/1/27 | | | 1,225 | | | | 1,417,325 | |
| |
| | | | $ | 179,055,738 | |
| | |
| Hospital — 11.7% | | | | | | |
| | |
Berks County Industrial Development Authority, PA, (Tower Health), 4.00%, 11/1/33 | | $ | 500 | | | $ | 518,285 | |
| | |
Buffalo and Erie County Industrial Land Development Corp., NY, (Catholic Health System, Inc.), 5.00%, 7/1/25 | | | 250 | | | | 287,750 | |
| | |
California Health Facilities Financing Authority, (Adventist Health System/West), 4.00%, 3/1/27 | | | 100 | | | | 105,378 | |
| | |
California Health Facilities Financing Authority, (El Camino Hospital), 5.00%, 2/1/29 | | | 750 | | | | 889,837 | |
| | |
Charlotte-Mecklenburg Hospital Authority, NC, 5.125%, 1/15/37 | | | 40 | | | | 42,344 | |
| | |
Clarke County Hospital Authority, GA, (Piedmont Healthcare, Inc.), 5.00%, 7/1/30 | | | 2,000 | | | | 2,311,300 | |
| | |
Colorado Health Facilities Authority, (NCMC, Inc.), 5.00%, 5/15/25 | | | 150 | | | | 173,934 | |
| | |
Connecticut Health and Educational Facilities Authority, (Yale New Haven Health), 5.00%, 7/1/28 | | | 5,000 | | | | 5,666,450 | |
| | |
Duluth Economic Development Authority, MN, (Essentia Health Obligated Group), 5.00%, 2/15/33 | | | 1,000 | | | | 1,125,570 | |
| | |
Greeneville Health and Educational Facilities Board, TN, (Ballad Health), 5.00%, 7/1/32 | | | 3,965 | | | | 4,281,566 | |
| | |
Greeneville Health and Educational Facilities Board, TN, (Ballad Health), 5.00%, 7/1/33 | | | 4,000 | | | | 4,303,960 | |
| | |
Idaho Health Facilities Authority, (Trinity Health Credit Group), 5.00%, 12/1/30 | | | 750 | | | | 813,937 | |
| | |
Illinois Finance Authority, (Riverside Health System), 5.00%, 11/15/27 | | | 500 | | | | 582,870 | |
| | |
Illinois Finance Authority, (Rush University Medical Center), 5.00%, 11/15/31 | | | 1,000 | | | | 1,116,090 | |
| | |
Illinois Finance Authority, (Rush University Medical Center), 5.00%, 11/15/32 | | | 1,000 | | | | 1,111,250 | |
| | |
Knox County Health, Educational and Housing Facility Board, TN, (University Health System, Inc.), 5.00%, 9/1/30 | | | 1,000 | | | | 1,098,330 | |
| | |
Louisiana Public Facilities Authority, (Ochsner Clinic Foundation), 5.00%, 5/15/23 | | | 150 | | | | 166,805 | |
| | |
Louisiana Public Facilities Authority, (Ochsner Clinic Foundation), 5.00%, 5/15/25 | | | 250 | | | | 287,520 | |
| | | | | | | | |
| Security | | Principal
Amount
(000’s omitted) | | | Value | |
| | | | | | | | |
| | |
| Hospital (continued) | | | | | | |
| | |
Louisiana Public Facilities Authority, (Ochsner Clinic Foundation), 5.00%, 5/15/26 | | $ | 250 | | | $ | 287,363 | |
| | |
Louisiana Public Facilities Authority, (Ochsner Clinic Foundation), 5.00%, 5/15/27 | | | 250 | | | | 285,330 | |
| | |
Louisville/Jefferson County Metro Government, KY, (Norton Healthcare, Inc.), 5.00%, 10/1/30 | | | 2,000 | | | | 2,268,880 | |
| | |
Louisville/Jefferson County Metro Government, KY, (Norton Healthcare, Inc.), 5.00%, 10/1/31 | | | 1,500 | | | | 1,690,725 | |
| | |
Louisville/Jefferson County Metro Government, KY, (Norton Healthcare, Inc.), 5.00%, 10/1/32 | | | 2,000 | | | | 2,241,280 | |
| | |
Maryland Health and Higher Educational Facilities Authority, (MedStar Health, Inc.), 5.00%, 8/15/31 | | | 1,000 | | | | 1,120,700 | |
| | |
Massachusetts Development Finance Agency, (Berkshire Retirement Community, Inc.), 5.00%, 7/1/25 | | | 595 | | | | 681,382 | |
| | |
Massachusetts Development Finance Agency, (South Shore Hospital), 5.00%, 7/1/24 | | | 550 | | | | 624,805 | |
| | |
Massachusetts Development Finance Agency, (South Shore Hospital), 5.00%, 7/1/26 | | | 500 | | | | 583,310 | |
| | |
Massachusetts Development Finance Agency, (South Shore Hospital), 5.00%, 7/1/28 | | | 500 | | | | 573,485 | |
| | |
Michigan Finance Authority, (Sparrow Obligated Group), 5.00%, 11/15/24 | | | 500 | | | | 578,525 | |
| | |
Michigan Finance Authority, (Trinity Health Credit Group), 5.00%, 12/1/27 | | | 1,500 | | | | 1,635,930 | |
| | |
Michigan Finance Authority, (Trinity Health Credit Group), 5.00%, 12/1/35 | | | 500 | | | | 535,145 | |
| | |
Missouri Health and Educational Facilities Authority, (CoxHealth), 5.00%, 11/15/31 | | | 490 | | | | 551,941 | |
| | |
Missouri Health and Educational Facilities Authority, (Saint Luke’s Health System), 5.00%, 11/15/31 | | | 1,000 | | | | 1,129,190 | |
| | |
Monongalia County Building Commission, WV, (Monongalia Health System Obligated Group), 5.00%, 7/1/23 | | | 500 | | | | 549,010 | |
| | |
Monongalia County Building Commission, WV, (Monongalia Health System Obligated Group), 5.00%, 7/1/24 | | | 500 | | | | 555,635 | |
| | |
Monongalia County Building Commission, WV, (Monongalia Health System Obligated Group), 5.00%, 7/1/28 | | | 1,340 | | | | 1,467,327 | |
| | |
Monongalia County Building Commission, WV, (Monongalia Health System Obligated Group), 5.00%, 7/1/29 | | | 775 | | | | 845,843 | |
| | |
New Hampshire Health and Education Facilities Authority, (Dartmouth-Hitchcock Obligated Group), 5.00%, 8/1/23 | | | 200 | | | | 225,102 | |
| | |
New Hampshire Health and Education Facilities Authority, (Dartmouth-Hitchcock Obligated Group), 5.00%, 8/1/24 | | | 100 | | | | 114,688 | |
| | |
New Hampshire Health and Education Facilities Authority, (Dartmouth-Hitchcock Obligated Group), 5.00%, 8/1/25 | | | 400 | | | | 466,092 | |
| | | | |
| | 22 | | See Notes to Financial Statements. |
5-to-15 Year Laddered Municipal Bond Portfolio
January 31, 2019
Portfolio of Investments — continued
| | | | | | | | |
| Security | | Principal
Amount
(000’s omitted) | | | Value | |
| | | | | | | | |
| | |
| Hospital (continued) | | | | | | |
| | |
New Hampshire Health and Education Facilities Authority, (Dartmouth-Hitchcock Obligated Group), 5.00%, 8/1/28 | | $ | 500 | | | $ | 593,900 | |
| | |
New Hampshire Health and Education Facilities Authority, (Dartmouth-Hitchcock Obligated Group), 5.00%, 8/1/29 | | | 500 | | | | 589,515 | |
| | |
New Hanover County, NC, (New Hanover Regional Medical Center), 5.00%, 10/1/26 | | | 400 | | | | 472,040 | |
| | |
New Jersey Health Care Facilities Financing Authority, (Princeton HealthCare System), 5.00%, 7/1/22 | | | 800 | | | | 883,688 | |
| | |
New Jersey Health Care Facilities Financing Authority, (Princeton HealthCare System), 5.00%, 7/1/25 | | | 1,000 | | | | 1,176,290 | |
| | |
New Jersey Health Care Facilities Financing Authority, (Princeton HealthCare System), 5.00%, 7/1/27 | | | 700 | | | | 829,094 | |
| | |
New Jersey Health Care Facilities Financing Authority, (Princeton HealthCare System), 5.00%, 7/1/28 | | | 700 | | | | 823,354 | |
| | |
New Jersey Health Care Facilities Financing Authority, (Princeton HealthCare System), 5.00%, 7/1/30 | | | 520 | | | | 602,451 | |
| | |
New Jersey Health Care Facilities Financing Authority, (Princeton HealthCare System), 5.00%, 7/1/31 | | | 700 | | | | 804,391 | |
| | |
New Mexico Hospital Equipment Loan Council, (Presbyterian Healthcare Services), 5.00%, 8/1/24 | | | 100 | | | | 115,529 | |
| | |
Norman Regional Hospital Authority, OK, 5.00%, 9/1/25 | | | 1,000 | | | | 1,152,000 | |
| | |
Norman Regional Hospital Authority, OK, 5.00%, 9/1/29 | | | 1,000 | | | | 1,146,270 | |
| | |
North Carolina Medical Care Commission, (North Carolina Baptist Hospital), 5.00%, 6/1/34 | | | 2,220 | | | | 2,301,851 | |
| | |
North Carolina Medical Care Commission, (Wake Forest Baptist Obligated Group), 5.00%, 12/1/33 | | | 3,030 | | | | 3,320,819 | |
| | |
Richmond County Hospital Authority, GA, (University Health Services, Inc.), 5.00%, 1/1/28 | | | 1,000 | | | | 1,165,150 | |
| | |
Royal Oak Hospital Finance Authority, MI, (William Beaumont Hospital), 5.00%, 9/1/29 | | | 250 | | | | 279,738 | |
| | |
Southcentral Pennsylvania General Authority, (Hanover Hospital, Inc.), 4.00%, 12/1/30 | | | 150 | | | | 157,112 | |
| | |
Southcentral Pennsylvania General Authority, (Hanover Hospital, Inc.), 5.00%, 12/1/22 | | | 225 | | | | 248,942 | |
| | |
Southcentral Pennsylvania General Authority, (Hanover Hospital, Inc.), 5.00%, 12/1/24 | | | 300 | | | | 345,681 | |
| | |
St. Paul Housing and Redevelopment Authority, MN, (Fairview Health Services), 5.00%, 11/15/25 | | | 500 | | | | 586,350 | |
| | |
St. Paul Housing and Redevelopment Authority, MN, (HealthPartners Obligated Group), 5.00%, 7/1/30 | | | 625 | | | | 707,094 | |
| | |
University of Kansas Hospital Authority, (KU Health System), 5.00%, 9/1/27 | | | 1,655 | | | | 1,919,618 | |
| | |
University of Kansas Hospital Authority, (KU Health System), 5.00%, 9/1/30 | | | 1,625 | | | | 1,850,859 | |
| | |
Vermont Educational and Health Buildings Financing Agency, (University of Vermont Medical Center), 5.00%, 12/1/24 | | | 350 | | | | 405,366 | |
| | |
Vermont Educational and Health Buildings Financing Agency, (University of Vermont Medical Center), 5.00%, 12/1/25 | | | 335 | | | | 394,596 | |
| | | | | | | | |
| Security | | Principal
Amount
(000’s omitted) | | | Value | |
| | | | | | | | |
| | |
| Hospital (continued) | | | | | | |
| | |
Vermont Educational and Health Buildings Financing Agency, (University of Vermont Medical Center), 5.00%, 12/1/26 | | $ | 300 | | | $ | 354,531 | |
| | |
Vermont Educational and Health Buildings Financing Agency, (University of Vermont Medical Center), 5.00%, 12/1/27 | | | 205 | | | | 240,451 | |
| | |
Vermont Educational and Health Buildings Financing Agency, (University of Vermont Medical Center), 5.00%, 12/1/28 | | | 500 | | | | 583,905 | |
| | |
Vermont Educational and Health Buildings Financing Agency, (University of Vermont Medical Center), 5.00%, 12/1/30 | | | 400 | | | | 461,332 | |
| | |
Vermont Educational and Health Buildings Financing Agency, (University of Vermont Medical Center), 5.00%, 12/1/31 | | | 400 | | | | 458,756 | |
| | |
Washington Health Care Facilities Authority, (Overlake Hospital Medical Center), 5.00%, 7/1/27 | | | 1,575 | | | | 1,852,310 | |
| | |
Wisconsin Health and Educational Facilities Authority, (Agnesian HealthCare, Inc.), 5.00%, 7/1/26 | | | 400 | | | | 469,008 | |
| | |
Wisconsin Health and Educational Facilities Authority, (Ascension Health Senior Credit Group), 5.00%, 11/15/33 | | | 650 | | | | 663,429 | |
| |
| | | | $ | 71,850,284 | |
| | |
| Housing — 2.2% | | | | | | |
| | |
Connecticut Housing Finance Authority, 3.60%, 11/15/30 | | $ | 145 | | | $ | 145,497 | |
| | |
Georgia Housing & Finance Authority, 3.65%, 12/1/32 | | | 1,000 | | | | 1,020,480 | |
| | |
New York City Housing Development Corp., NY, 2.30%, 5/1/25 | | | 1,110 | | | | 1,116,527 | |
| | |
New York City Housing Development Corp., NY, 2.35%, 11/1/25 | | | 465 | | | | 466,530 | |
| | |
New York City Housing Development Corp., NY, 2.65%, 11/1/27 | | | 970 | | | | 965,751 | |
| | |
New York City Housing Development Corp., NY, 2.80%, 5/1/29 | | | 795 | | | | 794,070 | |
| | |
New York City Housing Development Corp., NY, 2.85%, 11/1/29 | | | 425 | | | | 424,592 | |
| | |
New York Housing Finance Agency, (FHLMC), (FNMA), (GNMA), 2.20%, 5/1/25 | | | 290 | | | | 292,532 | |
| | |
New York Housing Finance Agency, (FHLMC), (FNMA), (GNMA), 2.25%, 11/1/25 | | | 225 | | | | 226,825 | |
| | |
New York Housing Finance Agency, (FHLMC), (FNMA), (GNMA), 2.35%, 5/1/26 | | | 200 | | | | 201,728 | |
| | |
New York Housing Finance Agency, (FHLMC), (FNMA), (GNMA), 2.40%, 11/1/26 | | | 225 | | | | 227,223 | |
| | |
New York Housing Finance Agency, (FHLMC), (FNMA), (GNMA), 2.50%, 11/1/27 | | | 140 | | | | 140,882 | |
| | |
New York Housing Finance Agency, (FHLMC), (FNMA), (GNMA), 2.60%, 5/1/28 | | | 110 | | | | 110,691 | |
| | |
New York Mortgage Agency, 1.75%, 4/1/24 | | | 150 | | | | 147,928 | |
| | |
New York Mortgage Agency, 1.95%, 10/1/25 | | | 450 | | | | 441,405 | |
| | |
Seattle Housing Authority, WA, 2.625%, 12/1/23 | | | 110 | | | | 112,505 | |
| | |
Seattle Housing Authority, WA, 2.75%, 12/1/24 | | | 480 | | | | 493,080 | |
| | |
Seattle Housing Authority, WA, 2.875%, 12/1/25 | | | 900 | | | | 928,278 | |
| | |
Seattle Housing Authority, WA, 3.00%, 12/1/26 | | | 920 | | | | 951,400 | |
| | |
Tennessee Housing Development Agency, 2.80%, 7/1/26 | | | 250 | | | | 256,897 | |
| | |
Vermont Housing Finance Agency, (FHLMC), (FNMA), (GNMA), 3.85%, 11/1/33 | | | 1,800 | | | | 1,856,718 | |
| | | | |
| | 23 | | See Notes to Financial Statements. |
5-to-15 Year Laddered Municipal Bond Portfolio
January 31, 2019
Portfolio of Investments — continued
| | | | | | | | |
| Security | | Principal
Amount
(000’s omitted) | | | Value | |
| | | | | | | | |
| | |
| Housing (continued) | | | | | | |
| | |
Virginia Housing Development Authority, 1.70%, 5/1/22 | | $ | 245 | | | $ | 244,076 | |
| | |
Virginia Housing Development Authority, 1.85%, 5/1/23 | | | 620 | | | | 619,492 | |
| | |
Virginia Housing Development Authority, 1.95%, 11/1/23 | | | 195 | | | | 195,526 | |
| | |
Virginia Housing Development Authority, 2.40%, 5/1/26 | | | 220 | | | | 224,004 | |
| | |
Virginia Housing Development Authority, 2.55%, 5/1/27 | | | 630 | | | | 637,661 | |
| | |
Washington Housing Finance Commission, 2.05%, 6/1/24 | | | 110 | | | | 110,165 | |
| | |
Washington Housing Finance Commission, 2.25%, 6/1/25 | | | 105 | | | | 105,369 | |
| | |
Washington Housing Finance Commission, 2.30%, 12/1/25 | | | 130 | | | | 130,243 | |
| | |
Washington Housing Finance Commission, 2.40%, 6/1/26 | | | 105 | | | | 105,195 | |
| |
| | | | $ | 13,693,270 | |
|
| Insured – Education — 0.4% | |
| | |
Patterson Joint Unified School District, CA, (Election 2018), (BAM), 5.00%, 8/1/28 | | $ | 1,065 | | | $ | 1,265,295 | |
| | |
Patterson Joint Unified School District, CA, (Election 2018), (BAM), 5.00%, 8/1/29 | | | 1,000 | | | | 1,179,070 | |
| |
| | | | $ | 2,444,365 | |
| | |
| Insured – Electric Utilities — 0.1% | | | | | | |
| | |
Sienna Plantation Municipal Utility District No. 3, TX, (AGM), 5.00%, 3/1/30 | | $ | 500 | | | $ | 552,015 | |
| |
| | | | $ | 552,015 | |
| | |
| Insured – Escrowed / Prerefunded — 0.0%(1) | | | | | | |
| | |
New Britain, CT, (BAM), Escrowed to Maturity, 5.00%, 3/1/25 | | $ | 100 | | | $ | 117,768 | |
| |
| | | | $ | 117,768 | |
| | |
| Insured – General Obligations — 1.1% | | | | | | |
| | |
Albertville, AL, (BAM), 4.00%, 6/1/28 | | $ | 1,130 | | | $ | 1,195,721 | |
| | |
Albertville, AL, (BAM), Series A, 4.00%, 6/1/30 | | | 1,605 | | | | 1,688,877 | |
| | |
Albertville, AL, (BAM), Series C, 4.00%, 6/1/30 | | | 610 | | | | 641,073 | |
| | |
New Britain, CT, (BAM), 5.00%, 3/1/24 | | | 200 | | | | 227,882 | |
| | |
New Britain, CT, (BAM), 5.00%, 3/1/25 | | | 135 | | | | 155,802 | |
| | |
New Britain, CT, (BAM), Escrowed to Maturity, 5.00%, 3/1/23 | | | 385 | | | | 433,518 | |
| | |
New Britain, CT, (BAM), Escrowed to Maturity, 5.00%, 3/1/24 | | | 350 | | | | 403,533 | |
| | |
New Britain, CT, (BAM), Escrowed to Maturity, 5.00%, 3/1/25 | | | 5 | | | | 5,873 | |
| | |
Ogle and Winnebago Counties Community Unit School District No. 223, IL, (BAM), 4.00%, 12/1/25 | | | 470 | | | | 505,255 | |
| | |
Ogle and Winnebago Counties Community Unit School District No. 223, IL, (BAM), 5.00%, 12/1/22 | | | 320 | | | | 352,477 | |
| | |
Ogle and Winnebago Counties Community Unit School District No. 223, IL, (BAM), 5.00%, 12/1/24 | | | 325 | | | | 369,008 | |
| | |
Pocono Mountain School District, PA, (AGM), 4.00%, 9/1/27 | | | 690 | | | | 761,318 | |
| |
| | | | $ | 6,740,337 | |
| | | | | | | | |
| Security | | Principal
Amount
(000’s omitted) | | | Value | |
| | | | | | | | |
|
| Insured – Lease Revenue / Certificates of Participation — 1.6% | |
| | |
Biloxi Public School District, MS, (BAM), 5.00%, 4/1/23 | | $ | 1,000 | | | $ | 1,113,570 | |
| | |
Biloxi Public School District, MS, (BAM), 5.00%, 4/1/25 | | | 1,500 | | | | 1,725,510 | |
| | |
Biloxi Public School District, MS, (BAM), 5.00%, 4/1/26 | | | 100 | | | | 116,360 | |
| | |
Biloxi Public School District, MS, (BAM), 5.00%, 4/1/28 | | | 500 | | | | 574,530 | |
| | |
Biloxi Public School District, MS, (BAM), 5.00%, 4/1/29 | | | 1,235 | | �� | | 1,413,964 | |
| | |
Clermont County Port Authority, OH, (West Clermont Local School District), (BAM), 5.00%, 12/1/26 | | | 250 | | | | 290,235 | |
| | |
Clermont County Port Authority, OH, (West Clermont Local School District), (BAM), 5.00%, 12/1/29 | | | 100 | | | | 115,201 | |
| | |
Highlands County School Board, FL, (BAM), 5.00%, 3/1/23 | | | 500 | | | | 556,340 | |
| | |
Highlands County School Board, FL, (BAM), 5.00%, 3/1/26 | | | 400 | | | | 463,112 | |
| | |
Highlands County School Board, FL, (BAM), 5.00%, 3/1/27 | | | 200 | | | | 230,818 | |
| | |
Pasco County School Board, FL, (BAM), 5.00%, 8/1/23 | | | 255 | | | | 288,762 | |
| | |
Pasco County School Board, FL, (BAM), 5.00%, 8/1/24 | | | 410 | | | | 473,439 | |
| | |
Pasco County School Board, FL, (BAM), 5.00%, 8/1/25 | | | 305 | | | | 358,012 | |
| | |
Pasco County School Board, FL, (BAM), 5.00%, 8/1/26 | | | 355 | | | | 421,690 | |
| | |
Pasco County School Board, FL, (BAM), 5.00%, 8/1/27 | | | 605 | | | | 715,558 | |
| | |
Pasco County School Board, FL, (BAM), 5.00%, 8/1/29 | | | 510 | | | | 594,472 | |
| |
| | | | $ | 9,451,573 | |
| | |
| Insured – Special Tax Revenue — 0.1% | | | | | | |
| | |
Successor Agency to Yuba City Redevelopment Agency, CA, (AGM), 5.00%, 9/1/24 | | $ | 115 | | | $ | 134,162 | |
| | |
Successor Agency to Yuba City Redevelopment Agency, CA, (AGM), 5.00%, 9/1/25 | | | 420 | | | | 499,712 | |
| |
| | | | $ | 633,874 | |
| | |
| Insured – Transportation — 2.0% | | | | | | |
| | |
New Brunswick Parking Authority, NJ, (BAM), 5.00%, 9/1/23 | | $ | 440 | | | $ | 497,710 | |
| | |
New Brunswick Parking Authority, NJ, (BAM), 5.00%, 9/1/24 | | | 350 | | | | 404,306 | |
| | |
New Brunswick Parking Authority, NJ, (BAM), 5.00%, 9/1/25 | | | 500 | | | | 587,800 | |
| | |
New Brunswick Parking Authority, NJ, (BAM), 5.00%, 9/1/26 | | | 320 | | | | 375,635 | |
| | |
New Brunswick Parking Authority, NJ, (BAM), 5.00%, 9/1/27 | | | 375 | | | | 437,944 | |
| | |
New Orleans Aviation Board, LA, (AGM), 5.00%, 1/1/30 | | | 1,000 | | | | 1,168,930 | |
| | |
New Orleans Aviation Board, LA, (AGM), 5.00%, 1/1/31 | | | 1,250 | | | | 1,448,363 | |
| | |
New Orleans Aviation Board, LA, (AGM), 5.00%, 1/1/32 | | | 1,650 | | | | 1,900,684 | |
| | |
New Orleans Aviation Board, LA, (AGM), 5.00%, 1/1/33 | | | 2,450 | | | | 2,807,822 | |
| | |
New Orleans Aviation Board, LA, (AGM), 5.00%, 1/1/34 | | | 2,485 | | | | 2,835,460 | |
| |
| | | | $ | 12,464,654 | |
| | |
| Insured – Water and Sewer — 0.1% | | | | | | |
| | |
Gulf Coast Waste Disposal Authority, TX, (AGM), 5.00%, 10/1/24 | | $ | 150 | | | $ | 172,256 | |
| | |
Gulf Coast Waste Disposal Authority, TX, (AGM), 5.00%, 10/1/30 | | | 250 | | | | 289,937 | |
| |
| | | | $ | 462,193 | |
| | | | |
| | 24 | | See Notes to Financial Statements. |
5-to-15 Year Laddered Municipal Bond Portfolio
January 31, 2019
Portfolio of Investments — continued
| | | | | | | | |
| Security | | Principal
Amount
(000’s omitted) | | | Value | |
| | | | | | | | |
| | |
| Lease Revenue / Certificates of Participation — 7.4% | | | | | | |
| | |
Adams County, CO, Certificates of Participation, 4.00%, 12/1/28 | | $ | 1,000 | | | $ | 1,093,640 | |
| | |
Broward County School Board, FL, 5.00%, 7/1/25 | | | 500 | | | | 588,805 | |
| | |
Broward County School Board, FL, 5.00%, 7/1/27 | | | 500 | | | | 589,545 | |
| | |
Broward County School Board, FL, 5.00%, 7/1/29 | | | 500 | | | | 581,890 | |
| | |
Broward County School Board, FL, Series A, 5.00%, 7/1/23 | | | 500 | | | | 565,015 | |
| | |
Broward County School Board, FL, Series A, 5.00%, 7/1/24 | | | 1,250 | | | | 1,444,075 | |
| | |
California Public Works Board, 5.00%, 11/1/29 | | | 1,000 | | | | 1,187,320 | |
| | |
Canadian County Educational Facilities Authority, OK, (Mustang Public Schools), 5.00%, 9/1/26 | | | 500 | | | | 592,000 | |
| | |
Cleveland County Educational Facilities Authority, OK, (Noble Public Schools), 5.00%, 9/1/25 | | | 300 | | | | 349,080 | |
| | |
Colorado Department of Transportation, 5.00%, 6/15/30 | | | 350 | | | | 405,955 | |
| | |
Colorado Department of Transportation, 5.00%, 6/15/31 | | | 310 | | | | 357,833 | |
| | |
Commonwealth Financing Authority, PA, Tobacco Master Settlement Payment Revenue, 5.00%, 6/1/25 | | | 500 | | | | 574,270 | |
| | |
Commonwealth Financing Authority, PA, Tobacco Master Settlement Payment Revenue, 5.00%, 6/1/29 | | | 3,000 | | | | 3,508,740 | |
| | |
Commonwealth Financing Authority, PA, Tobacco Master Settlement Payment Revenue, 5.00%, 6/1/30 | | | 3,000 | | | | 3,479,490 | |
| | |
Eagle County, CO, Certificates of Participation, 5.00%, 12/1/26 | | | 200 | | | | 235,580 | |
| | |
Fountain Valley Public Financing Authority, CA, 4.00%, 11/1/23 | | | 135 | | | | 150,111 | |
| | |
Fountain Valley Public Financing Authority, CA, 4.00%, 11/1/24 | | | 550 | | | | 620,763 | |
| | |
Fountain Valley Public Financing Authority, CA, 4.00%, 11/1/25 | | | 570 | | | | 652,502 | |
| | |
Fountain Valley Public Financing Authority, CA, 4.00%, 11/1/26 | | | 595 | | | | 671,017 | |
| | |
Fountain Valley Public Financing Authority, CA, 4.00%, 11/1/27 | | | 620 | | | | 691,839 | |
| | |
Fountain Valley Public Financing Authority, CA, 4.00%, 11/1/28 | | | 645 | | | | 712,828 | |
| | |
Georgia Municipal Association, Inc., Certificates of Participation, (Atlanta Public Safety), 5.00%, 12/1/28 | | | 410 | | | | 490,758 | |
| | |
Kentucky Property and Buildings Commission, 5.00%, 4/1/27 | | | 1,710 | | | | 1,994,835 | |
| | |
Kentucky Property and Buildings Commission, 5.00%, 11/1/27 | | | 2,350 | | | | 2,727,010 | |
| | |
Lee County School Board, FL, Certificates of Participation, 5.00%, 8/1/32 | | | 1,495 | | | | 1,717,890 | |
| | |
Medina City School District, OH, 5.00%, 12/1/23 | | | 350 | | | | 396,235 | |
| | |
Medina City School District, OH, 5.00%, 12/1/24 | | | 400 | | | | 460,956 | |
| | |
Oklahoma County Finance Authority, OK, (Deer Creek Public Schools), 5.00%, 12/1/25 | | | 1,405 | | | | 1,649,751 | |
| | |
Oklahoma County Finance Authority, OK, (Deer Creek Public Schools), 5.00%, 12/1/26 | | | 2,000 | | | | 2,325,000 | |
| | |
Oklahoma County Finance Authority, OK, (Midwest City-Del City Public Schools), 5.00%, 10/1/24 | | | 850 | | | | 979,370 | |
| | |
Oklahoma County Finance Authority, OK, (Midwest City-Del City Public Schools), 5.00%, 10/1/25 | | | 1,000 | | | | 1,171,840 | |
| | |
Oklahoma County Finance Authority, OK, (Midwest City-Del City Public Schools), 5.00%, 10/1/26 | | | 1,000 | | | | 1,187,790 | |
| | |
Oklahoma County Finance Authority, OK, (Western Heights Public Schools), 5.00%, 9/1/23 | | | 1,250 | | | | 1,409,062 | |
| | | | | | | | |
| Security | | Principal
Amount
(000’s omitted) | | | Value | |
| | | | | | | | |
| | |
| Lease Revenue / Certificates of Participation (continued) | | | | | | |
| | |
Orange County School Board, FL, 5.00%, 8/1/32 | | $ | 1,935 | | | $ | 2,208,280 | |
| | |
Pennington County, SD, Certificates of Participation, 5.00%, 6/1/27 | | | 1,300 | | | | 1,511,289 | |
| | |
Plymouth Intermediate District No. 287, MN, Certificates of Participation, 5.00%, 2/1/30 | | | 385 | | | | 452,390 | |
| | |
Public Finance Authority, WI, (KU Campus Development Corp.), 5.00%, 3/1/29 | | | 500 | | | | 577,530 | |
| | |
Riverside County Public Financing Authority, CA, 5.00%, 11/1/27 | | | 850 | | | | 1,004,173 | |
| | |
Riverside County Public Financing Authority, CA, 5.00%, 11/1/28 | | | 950 | | | | 1,116,440 | |
| | |
South Dakota Building Authority, 5.00%, 6/1/26 | | | 500 | | | | 595,555 | |
| | |
South Dakota Building Authority, 5.00%, 6/1/27 | | | 635 | | | | 727,646 | |
| | |
South Dakota Building Authority, 5.00%, 6/1/28 | | | 210 | | | | 243,193 | |
| | |
South Dakota Building Authority, Series 2015B, 5.00%, 6/1/30 | | | 200 | | | | 229,834 | |
| | |
St. Charles County Public Water Supply District No. 2, MO, 3.00%, 12/1/24 | | | 500 | | | | 517,420 | |
| | |
Tulsa County Industrial Authority, OK, (Broken Arrow Public Schools), 5.00%, 9/1/23 | | | 500 | | | | 565,730 | |
| |
| | | | $ | 45,312,275 | |
| | |
| Other Revenue — 9.6% | | | | | | |
| | |
Bexar County, TX, Combination Tax and Revenue Certificates of Obligation, 4.00%, 6/15/34 | | $ | 1,005 | | | $ | 1,068,466 | |
| | |
Black Belt Energy Gas District, AL, 4.00% to 12/1/23 (Put Date), 12/1/48 | | | 5,100 | | | | 5,362,497 | |
| | |
California Infrastructure and Economic Development Bank, (The J. Paul Getty Trust), 1.964% (70% of 1 mo. USD LIBOR + 0.20%), to 4/1/21 (Put Date), 10/1/47(5) | | | 2,500 | | | | 2,499,400 | |
| | |
District of Columbia, (National Public Radio, Inc.), 5.00%, 4/1/28 | | | 1,000 | | | | 1,162,490 | |
| | |
District of Columbia, (National Public Radio, Inc.), 5.00%, 4/1/29 | | | 1,000 | | | | 1,157,570 | |
| | |
Fort Myers, FL, Capital Improvement Revenue, 5.00%, 12/1/32 | | | 825 | | | | 947,504 | |
| | |
Fort Myers, FL, Capital Improvement Revenue, 5.00%, 12/1/33 | | | 640 | | | | 733,312 | |
| | |
Fort Myers, FL, Capital Improvement Revenue, 5.00%, 12/1/34 | | | 510 | | | | 581,966 | |
| | |
Fulton County Development Authority, GA, (Robert W. Woodruff Arts Center, Inc.), 5.00%, 3/15/24 | | | 600 | | | | 678,642 | |
| | |
Hyland Hills Park & Recreation District, CO, 5.00%, 12/15/25 | | | 155 | | | | 182,113 | |
| | |
Hyland Hills Park & Recreation District, CO, 5.00%, 12/15/26 | | | 150 | | | | 178,980 | |
| | |
Kentucky Public Energy Authority, Gas Supply Revenue, 4.00%, 7/1/24 | | | 5,000 | | | | 5,332,750 | |
| | |
Kentucky Public Energy Authority, Gas Supply Revenue, 4.00% to 6/1/25 (Put Date), 12/1/49 | | | 5,000 | | | | 5,274,900 | |
| | |
Las Vegas Convention and Visitors Authority, NV, 5.00%, 7/1/30 | | | 400 | | | | 448,048 | |
| | | | |
| | 25 | | See Notes to Financial Statements. |
5-to-15 Year Laddered Municipal Bond Portfolio
January 31, 2019
Portfolio of Investments — continued
| | | | | | | | |
| Security | | Principal
Amount
(000’s omitted) | | | Value | |
| | | | | | | | |
| | |
| Other Revenue (continued) | | | | | | |
| | |
Las Vegas Convention and Visitors Authority, NV, 5.00%, 7/1/31 | | $ | 250 | | | $ | 278,350 | |
| | |
Las Vegas Convention and Visitors Authority, NV, 5.00%, 7/1/32 | | | 365 | | | | 404,905 | |
| | |
Las Vegas Convention and Visitors Authority, NV, 5.00%, 7/1/33 | | | 300 | | | | 331,818 | |
| | |
Las Vegas Convention and Visitors Authority, NV, 5.00%, 7/1/34 | | | 475 | | | | 523,645 | |
| | |
Louisiana Local Government Environmental Facilities and Community Development Authority, 5.00%, 12/1/32 | | | 2,355 | | | | 2,761,426 | |
| | |
Louisiana Local Government Environmental Facilities and Community Development Authority, 5.00%, 12/1/34 | | | 2,425 | | | | 2,814,697 | |
| | |
Louisiana Local Government Environmental Facilities and Community Development Authority, (Jefferson Parish), 5.00%, 4/1/27 | | | 500 | | | | 583,485 | |
| | |
Louisiana Local Government Environmental Facilities and Community Development Authority, (Jefferson Parish), 5.00%, 4/1/29 | | | 275 | | | | 316,778 | |
| | |
Main Street Natural Gas, Inc., GA, Gas Supply Revenue, (Liq: Royal Bank of Canada), 4.00% to 9/1/23 (Put Date), 4/1/48 | | | 7,500 | | | | 7,930,125 | |
| | |
Mississippi Development Bank, Special Obligation Bond, (East Mississippi Correctional Facility), 5.00%, 8/1/25 | | | 1,000 | | | | 1,153,640 | |
| | |
Mississippi Development Bank, Special Obligation Bond, (Jackson Public School District), 5.00%, 4/1/25 | | | 1,270 | | | | 1,470,406 | |
| | |
Rhode Island Health and Educational Building Corp., (Barrington), 5.00%, 5/15/28 | | | 1,060 | | | | 1,284,423 | |
| | |
Spartanburg County School District No. 7, SC, Special Obligation Bonds, 5.00%, 12/1/24 | | | 350 | | | | 405,829 | |
| | |
Tennessee Energy Acquisition Corp., Gas Project Revenue, 4.00% to 11/1/25 (Put Date), 11/1/49 | | | 5,000 | | | | 5,287,300 | |
| | |
Virginia Resources Authority, 5.00%, 11/1/28 | | | 3,135 | | | | 3,570,546 | |
| | |
Wisconsin, Environmental Improvement Fund Revenue, 5.00%, 6/1/31 | | | 2,500 | | | | 2,919,175 | |
| | |
Wisconsin, Environmental Improvement Fund Revenue, 5.00%, 6/1/32 | | | 1,000 | | | | 1,166,390 | |
| |
| | | | $ | 58,811,576 | |
| | |
| Senior Living / Life Care — 3.2% | | | | | | |
| | |
Atlantic Beach, FL, (Fleet Landing), 3.00%, 11/15/23 | | $ | 2,500 | | | $ | 2,505,875 | |
| | |
Atlantic Beach, FL, (Fleet Landing), 5.00%, 11/15/24 | | | 160 | | | | 175,259 | |
| | |
Atlantic Beach, FL, (Fleet Landing), 5.00%, 11/15/28 | | | 1,480 | | | | 1,632,766 | |
| | |
Bexar County Health Facilities Development Corp., TX, (Army Retirement Residence Foundation), 5.00%, 7/15/33 | | | 1,500 | | | | 1,597,575 | |
| | |
Buffalo and Erie County Industrial Land Development Corp., NY, (Orchard Park CCRC, Inc.), 5.00%, 11/15/28 | | | 50 | | | | 54,050 | |
| | |
Buffalo and Erie County Industrial Land Development Corp., NY, (Orchard Park CCRC, Inc.), 5.00%, 11/15/30 | | | 910 | | | | 974,119 | |
| | | | | | | | |
| Security | | Principal
Amount
(000’s omitted) | | | Value | |
| | | | | | | | |
| | |
| Senior Living / Life Care (continued) | | | | | | |
| | |
California Statewide Communities Development Authority, (American Baptist Homes of the West), 5.00%, 10/1/22 | | $ | 250 | | | $ | 269,985 | |
| | |
California Statewide Communities Development Authority, (American Baptist Homes of the West), 5.00%, 10/1/25 | | | 100 | | | | 111,858 | |
| | |
Cumberland County Municipal Authority, PA, (Diakon Lutheran Social Ministries), 2.50%, 1/1/26 | | | 640 | | | | 619,770 | |
| | |
Cumberland County Municipal Authority, PA, (Diakon Lutheran Social Ministries), 5.00%, 1/1/27 | | | 1,035 | | | | 1,155,733 | |
| | |
East Hempfield Township Industrial Development Authority, PA, (Willow Valley Communities), 5.00%, 12/1/21 | | | 250 | | | | 268,817 | |
| | |
East Hempfield Township Industrial Development Authority, PA, (Willow Valley Communities), 5.00%, 12/1/31 | | | 250 | | | | 278,205 | |
| | |
Illinois Finance Authority, (Presbyterian Homes Obligated Group), 5.00%, 5/1/22 | | | 225 | | | | 243,137 | |
| | |
Missouri Health and Educational Facilities Authority, (Lutheran Senior Services), 3.00%, 2/1/27 | | | 1,000 | | | | 978,390 | |
| | |
Missouri Health and Educational Facilities Authority, (Lutheran Senior Services), 5.00%, 2/1/23 | | | 600 | | | | 645,762 | |
| | |
Missouri Health and Educational Facilities Authority, (Lutheran Senior Services), 5.00%, 2/1/28 | | | 250 | | | | 276,015 | |
| | |
Missouri Health and Educational Facilities Authority, (Lutheran Senior Services), 5.00%, 2/1/29 | | | 600 | | | | 655,002 | |
| | |
Missouri Health and Educational Facilities Authority, (Lutheran Senior Services), 5.00%, 2/1/30 | | | 200 | | | | 216,786 | |
| | |
Missouri Health and Educational Facilities Authority, (Lutheran Senior Services), 5.00%, 2/1/31 | | | 250 | | | | 269,540 | |
| | |
New Hope Cultural Education Facilities Finance Corp., TX, (Westminster), 5.00%, 11/1/22 | | | 175 | | | | 187,999 | |
| | |
North Carolina Medical Care Commission, (United Methodist Retirement Homes), 5.00%, 10/1/23 | | | 150 | | | | 163,764 | |
| | |
North Carolina Medical Care Commission, (United Methodist Retirement Homes), 5.00%, 10/1/24 | | | 150 | | | | 165,336 | |
| | |
North Carolina Medical Care Commission, (United Methodist Retirement Homes), 5.00%, 10/1/25 | | | 100 | | | | 110,501 | |
| | |
North Carolina Medical Care Commission, (United Methodist Retirement Homes), 5.00%, 10/1/26 | | | 1,100 | | | | 1,210,440 | |
| | |
North Carolina Medical Care Commission, (United Methodist Retirement Homes), 5.00%, 10/1/27 | | | 50 | | | | 54,768 | |
| | |
North Carolina Medical Care Commission, (United Methodist Retirement Homes), 5.00%, 10/1/29 | | | 125 | | | | 135,784 | |
| | |
North Carolina Medical Care Commission, (United Methodist Retirement Homes), 5.00%, 10/1/32 | | | 225 | | | | 242,082 | |
| | |
North Carolina Medical Care Commission, (United Methodist Retirement Homes), Series 2016A, 5.00%, 10/1/30 | | | 200 | | | | 215,946 | |
| | |
North Carolina Medical Care Commission, (United Methodist Retirement Homes), Series 2016A, 5.00%, 10/1/31 | | | 675 | | | | 724,180 | |
| | |
North Carolina Medical Care Commission, (United Methodist Retirement Homes), Series 2017A, 5.00%, 10/1/30 | | | 250 | | | | 270,775 | |
| | | | |
| | 26 | | See Notes to Financial Statements. |
5-to-15 Year Laddered Municipal Bond Portfolio
January 31, 2019
Portfolio of Investments — continued
| | | | | | | | |
| Security | | Principal
Amount
(000’s omitted) | | | Value | |
| | | | | | | | |
| | |
| Senior Living / Life Care (continued) | | | | | | |
| | |
North Carolina Medical Care Commission, (United Methodist Retirement Homes), Series 2017A, 5.00%, 10/1/31 | | $ | 175 | | | $ | 188,755 | |
| | |
Palm Beach County Health Facilities Authority, FL, (Lifespace Communities, Inc.), 5.00%, 5/15/32 | | | 400 | | | | 427,680 | |
| | |
Palm Beach County Health Facilities Authority, FL, (Lifespace Communities, Inc.), 5.00%, 5/15/33 | | | 500 | | | | 533,090 | |
| | |
Palm Beach County Health Facilities Authority, FL, (Lifespace Communities, Inc.), 5.00%, 5/15/34 | | | 2,000 | | | | 2,122,200 | |
| |
| | | | $ | 19,681,944 | |
| | |
| Special Tax Revenue — 3.4% | | | | | | |
| | |
Atlanta Development Authority, GA, (New Downtown Atlanta Stadium), 5.00%, 7/1/26 | | $ | 100 | | | $ | 116,966 | |
| | |
Cape Coral, FL, Special Obligation Bonds, 5.00%, 10/1/23 | | | 500 | | | | 569,015 | |
| | |
Los Angeles County Metropolitan Transportation Authority, CA, Sales Tax Revenue, 5.00%, 6/1/31 | | | 1,000 | | | | 1,186,210 | |
| | |
Los Angeles County Metropolitan Transportation Authority, CA, Sales Tax Revenue, 5.00%, 6/1/32 | | | 500 | | | | 589,775 | |
| | |
Miami-Dade County, FL, Special Obligation Bonds, 5.00%, 4/1/25 | | | 250 | | | | 294,358 | |
| | |
Miami-Dade County, FL, Special Obligation Bonds, 5.00%, 4/1/26 | | | 1,025 | | | | 1,228,360 | |
| | |
Miami-Dade County, FL, Special Obligation Bonds, 5.00%, 4/1/29 | | | 900 | | | | 1,057,887 | |
| | |
Miami-Dade County, FL, Special Obligation Bonds, 5.00%, 4/1/30 | | | 950 | | | | 1,109,505 | |
| | |
Miami-Dade County, FL, Special Obligation Bonds, 5.00%, 4/1/31 | | | 895 | | | | 1,040,652 | |
| | |
Miami-Dade County, FL, Special Obligation Bonds, 5.00%, 4/1/32 | | | 735 | | | | 849,454 | |
| | |
Miami-Dade County, FL, Special Obligation Bonds, 5.00%, 10/1/32 | | | 1,200 | | | | 1,313,016 | |
| | |
Mississippi Development Bank, Special Obligation Bonds, (Hinds County School District), 4.00%, 3/1/25 | | | 470 | | | | 514,062 | |
| | |
New York Dormitory Authority, Sales Tax Revenue, 5.00%, 3/15/31 | | | 4,000 | | | | 4,781,600 | |
| | |
New York Dormitory Authority, Sales Tax Revenue, 5.00%, 3/15/32 | | | 1,800 | | | | 2,069,154 | |
| | |
New York, Transitional Finance Authority, NY, Future Tax Revenue, 5.00%, 8/1/33 | | | 1,190 | | | | 1,348,960 | |
| | |
Oregon Department of Transportation, Highway User Tax Revenue, 5.00%, 11/15/31 | | | 1,300 | | | | 1,498,809 | |
| | |
Successor Agency to San Mateo Redevelopment Agency, CA, 5.00%, 8/1/26 | | | 100 | | | | 115,869 | |
| | |
Successor Agency to San Mateo Redevelopment Agency, CA, 5.00%, 8/1/29 | | | 140 | | | | 161,125 | |
| | |
Tri-County Metropolitan Transportation District, OR, Payroll Tax Revenue, 5.00%, 9/1/32 | | | 1,000 | | | | 1,174,040 | |
| |
| | | | $ | 21,018,817 | |
| | | | | | | | |
| Security | | Principal
Amount
(000’s omitted) | | | Value | |
| | | | | | | | |
| | |
| Transportation — 11.3% | | | | | | |
| | |
Allegheny County Airport Authority, PA, (Pittsburgh International Airport), 4.00%, 1/1/31 | | $ | 1,000 | | | $ | 1,027,350 | |
| | |
Arizona Transportation Board, Highway Revenue, 5.00%, 7/1/27 | | | 2,755 | | | | 3,302,529 | |
| | |
Bay Area Toll Authority, CA, (San Francisco Bay Area), 2.10% to 4/1/22 (Put Date), 4/1/45 | | | 2,000 | | | | 2,012,380 | |
| | |
Bay Area Toll Authority, CA, (San Francisco Bay Area), 2.95% to 4/1/26 (Put Date), 4/1/47 | | | 1,800 | | | | 1,886,580 | |
| | |
Chicago, IL, (O’Hare International Airport), 5.00%, 1/1/25 | | | 100 | | | | 116,033 | |
| | |
Chicago, IL, (O’Hare International Airport), 5.00%, 1/1/26 | | | 1,000 | | | | 1,175,020 | |
| | |
Chicago, IL, (O’Hare International Airport), 5.00%, 1/1/28 | | | 150 | | | | 170,123 | |
| | |
Chicago, IL, (O’Hare International Airport), 5.00%, 1/1/29 | | | 150 | | | | 169,245 | |
| | |
Chicago, IL, (O’Hare International Airport), 5.00%, 1/1/30 | | | 500 | | | | 561,240 | |
| | |
Chicago, IL, (O’Hare International Airport), 5.00%, 1/1/31 | | | 1,000 | | | | 1,116,700 | |
| | |
Chicago, IL, (O’Hare International Airport), 5.00%, 1/1/33 | | | 500 | | | | 553,475 | |
| | |
Chicago, IL, (O’Hare International Airport), 5.25%, 1/1/28 | | | 2,905 | | | | 3,463,457 | |
| | |
Chicago, IL, (O’Hare International Airport), 5.25%, 1/1/29 | | | 3,060 | | | | 3,624,203 | |
| | |
Chicago, IL, (O’Hare International Airport), 5.25%, 1/1/30 | | | 1,000 | | | | 1,176,580 | |
| | |
Chicago, IL, (O’Hare International Airport), 5.25%, 1/1/31 | | | 1,000 | | | | 1,167,290 | |
| | |
Chicago, IL, (O’Hare International Airport), 5.25%, 1/1/32 | | | 2,565 | | | | 2,978,350 | |
| | |
Chicago, IL, (O’Hare International Airport), Series 2015B, 5.00%, 1/1/24 | | | 200 | | | | 227,614 | |
| | |
Clark County, NV, Highway Revenue, 5.00%, 7/1/33 | | | 3,000 | | | | 3,380,370 | |
| | |
Commonwealth Transportation Board, VA, 5.00%, 9/15/30 | | | 1,240 | | | | 1,467,441 | |
| | |
Dallas and Fort Worth, TX, (Dallas/Fort Worth International Airport), 5.00%, 11/1/30 | | | 2,545 | | | | 2,679,910 | |
| | |
Denver City and County, CO, Airport System Revenue, 5.00%, 11/15/24 | | | 650 | | | | 761,351 | |
| | |
Denver City and County, CO, Airport System Revenue, 5.00%, 11/15/31 | | | 1,650 | | | | 1,920,946 | |
| | |
Denver City and County, CO, Airport System Revenue, 5.00%, 11/15/32 | | | 2,100 | | | | 2,433,627 | |
| | |
Fort Bend County, TX, Toll Road Revenue, 5.00%, 3/1/28 | | | 500 | | | | 572,465 | |
| | |
Fort Bend County, TX, Toll Road Revenue, 5.00%, 3/1/29 | | | 1,000 | | | | 1,141,290 | |
| | |
Fort Bend County, TX, Toll Road Revenue, 5.00%, 3/1/30 | | | 750 | | | | 852,795 | |
| | |
Idaho Housing and Finance Association, Federal Highway Trust Fund, 5.00%, 7/15/25 | | | 650 | | | | 760,779 | |
| | |
Illinois Toll Highway Authority, 5.00%, 1/1/29 | | | 175 | | | | 202,367 | |
| | |
Illinois Toll Highway Authority, 5.00%, 12/1/32 | | | 350 | | | | 396,123 | |
| | |
Kentucky Asset/Liability Commission, 2015 Federal Highway Trust Fund, 5.00%, 9/1/24 | | | 250 | | | | 287,382 | |
| | |
Kentucky Turnpike Authority, 5.00%, 7/1/33 | | | 500 | | | | 554,945 | |
| | |
Metropolitan Transportation Authority, NY, 5.00%, 11/15/27 | | | 1,500 | | | | 1,748,610 | |
| | |
Metropolitan Transportation Authority, NY, Green Bonds, 5.00%, 11/15/29 | | | 2,435 | | | | 2,859,177 | |
| | |
Metropolitan Transportation Authority, NY, 5.00%, 11/15/41 | | | 415 | | | | 447,831 | |
| | |
Miami-Dade County, FL, Seaport Revenue, 5.00%, 10/1/23 | | | 130 | | | | 145,174 | |
| | | | |
| | 27 | | See Notes to Financial Statements. |
5-to-15 Year Laddered Municipal Bond Portfolio
January 31, 2019
Portfolio of Investments — continued
| | | | | | | | |
| Security | | Principal
Amount
(000’s omitted) | | | Value | |
| | | | | | | | |
| | |
| Transportation (continued) | | | | | | |
| | |
New Orleans Aviation Board, LA, 5.00%, 1/1/28 | | $ | 150 | | | $ | 176,637 | |
| | |
New Orleans Aviation Board, LA, 5.00%, 1/1/31 | | | 190 | | | | 219,026 | |
| | |
North Carolina, (Federal-Aid Highway Projects), 5.00%, 3/1/23 | | | 750 | | | | 842,377 | |
| | |
North Carolina, (Federal-Aid Highway Projects), 5.00%, 3/1/29 | | | 550 | | | | 630,470 | |
| | |
North Carolina, (Federal-Aid Highway Projects), 5.00%, 3/1/30 | | | 400 | | | | 455,744 | |
| | |
Pennsylvania Turnpike Commission, 2.13%, (SIFMA + 0.70%), 12/1/23(5) | | | 5,000 | | | | 4,990,950 | |
| | |
Port of Seattle, WA, 5.00%, 3/1/24 | | | 250 | | | | 285,793 | |
| | |
Port of Seattle, WA, 5.00%, 3/1/25 | | | 150 | | | | 173,112 | |
| | |
Port of Seattle, WA, 5.00%, 3/1/27 | | | 250 | | | | 287,100 | |
| | |
Port of Seattle, WA, 5.00%, 3/1/29 | | | 250 | | | | 285,548 | |
| | |
Salt Lake City, UT, (Salt Lake City International Airport), 5.00%, 7/1/28 | | | 1,370 | | | | 1,644,342 | |
| | |
Salt Lake City, UT, (Salt Lake City International Airport), 5.00%, 7/1/31 | | | 300 | | | | 356,436 | |
| | |
Salt Lake City, UT, (Salt Lake City International Airport), 5.00%, 7/1/32 | | | 660 | | | | 778,754 | |
| | |
Salt Lake City, UT, (Salt Lake City International Airport), 5.00%, 7/1/33 | | | 600 | | | | 704,166 | |
| | |
Salt Lake City, UT, (Salt Lake City International Airport), 5.00%, 7/1/34 | | | 650 | | | | 759,343 | |
| | |
Texas Transportation Commission, 5.00%, 4/1/33 | | | 50 | | | | 56,948 | |
| | |
Wayne County Airport Authority, MI, (Detroit Metropolitan Wayne County Airport), 5.00%, 12/1/31 | | | 2,920 | | | | 3,457,309 | |
| | |
Wayne County Airport Authority, MI, (Detroit Metropolitan Wayne County Airport), 5.00%, 12/1/34 | | | 1,005 | | | | 1,171,177 | |
| | |
Wisconsin, Transportation Revenue, 5.00%, 7/1/31 | | | 3,450 | | | | 3,951,319 | |
| | |
Wisconsin, Transportation Revenue, 5.00%, 7/1/32 | | | 700 | | | | 800,177 | |
| |
| | | | $ | 69,367,480 | |
|
| Water and Sewer — 5.2% | |
| | |
Buffalo Municipal Water Finance Authority, NY, 5.00%, 7/1/25 | | $ | 300 | | | $ | 351,096 | |
| | |
Buffalo Municipal Water Finance Authority, NY, 5.00%, 7/1/29 | | | 115 | | | | 132,659 | |
| | |
Buffalo Municipal Water Finance Authority, NY, 5.00%, 7/1/30 | | | 100 | | | | 114,844 | |
| | |
Glendale, AZ, Water and Sewer Revenue, 5.00%, 7/1/28 | | | 1,500 | | | | 1,740,975 | |
| | |
Kentucky Infrastructure Authority, Wastewater and Drinking Water Revolving Fund Revenue, 5.00%, 2/1/28 | | | 500 | | | | 591,865 | |
| | |
King County, WA, Sewer Revenue, 4.00%, 7/1/33 | | | 5,140 | | | | 5,415,761 | |
| | |
Lancaster, OH, Wastewater System Revenue, 4.00%, 12/1/28 | | | 670 | | | | 734,943 | |
| | |
Marin Public Financing Authority, CA, (Sausalito-Marin City Sanitary District), 4.00%, 4/1/31 | | | 130 | | | | 143,880 | |
| | |
Marin Public Financing Authority, CA, (Sausalito-Marin City Sanitary District), 4.00%, 4/1/32 | | | 875 | | | | 961,048 | |
| | |
Memphis, TN, Sanitary Sewerage System Revenue, 4.00%, 10/1/32 | | | 1,895 | | | | 2,022,154 | |
| | |
Mesa, AZ, Utility Systems Revenue, 5.00%, 7/1/27 | | | 600 | | | | 716,520 | |
| | | | | | | | |
| Security | | Principal
Amount
(000’s omitted) | | | Value | |
| | | | | | | | |
|
| Water and Sewer (continued) | |
| | |
Mesa, AZ, Utility Systems Revenue, 5.00%, 7/1/29 | | $ | 500 | | | $ | 591,465 | |
| | |
New York City Municipal Water Finance Authority, NY, (Water and Sewer System), (SPA: Barclays Bank PLC),
1.63%, 6/15/50(2) | | | 5,000 | | | | 5,000,000 | |
| | |
New York City Municipal Water Finance Authority, NY, (Water and Sewer System), (SPA: JPMorgan Chase Bank, N.A.), 1.63%, 6/15/50(2) | | | 5,000 | | | | 5,000,000 | |
| | |
Oklahoma City Water Utilities Trust, OK, 5.00%, 7/1/26 | | | 3,000 | | | | 3,399,600 | |
| | |
Rapid City, SD, Water Revenue, 4.00%, 11/1/29 | | | 600 | | | | 656,274 | |
| | |
Rapid City, SD, Water Revenue, 4.00%, 11/1/30 | | | 670 | | | | 728,230 | |
| | |
Rapid City, SD, Water Revenue, 5.00%, 11/1/26 | | | 1,000 | | | | 1,177,940 | |
| | |
Rapid City, SD, Water Revenue, 5.00%, 11/1/27 | | | 515 | | | | 605,578 | |
| | |
St. Joseph Industrial Development Authority, MO, (Sewerage System Improvements), 5.00%, 4/1/26 | | | 500 | | | | 579,895 | |
| | |
Wyoming, MI, Water Supply System Revenue, 5.00%, 6/1/27 | | | 505 | | | | 589,552 | |
| | |
Wyoming, MI, Water Supply System Revenue, 5.00%, 6/1/28 | | | 550 | | | | 637,643 | |
| |
| | | | $ | 31,891,922 | |
| | |
Total Tax-Exempt Investments — 97.7%
(identified cost $586,609,290) | | | | | | $ | 598,051,899 | |
| | |
Other Assets, Less Liabilities — 2.3% | | | | | | $ | 14,376,498 | |
| |
Net Assets — 100.0% | | | $ | 612,428,397 | |
The percentage shown for each investment category in the Portfolio of Investments is based on net assets.
At January 31, 2019, the concentration of the Portfolio’s investments in the various states, determined as a percentage of net assets, is less than 10% individually.
The Portfolio invests primarily in debt securities issued by municipalities. The ability of the issuers of the debt securities to meet their obligations may be affected by economic developments in a specific industry or municipality. In order to reduce the risk associated with such economic developments, at January 31, 2019, 5.5% of total investments are backed by bond insurance of various financial institutions and financial guaranty assurance agencies. The aggregate percentage insured by an individual financial institution or financial guaranty assurance agency ranged from 2.1% to 3.4% of total investments.
| (1) | Amount is less than 0.05%. |
| (2) | Variable rate demand obligation that may be tendered at par on any day for payment the same or next business day. The stated interest rate, which generally resets daily, is determined by the remarketing agent and represents the rate in effect at January 31, 2019. |
| (3) | Variable rate demand obligation that may be tendered at par on any day for payment the lesser of 5 business days or 7 calendar days. The stated interest rate, which generally resets weekly, is determined by the remarketing agent and represents the rate in effect at January 31, 2019. |
| (4) | When-issued security. |
| | | | |
| | 28 | | See Notes to Financial Statements. |
5-to-15 Year Laddered Municipal Bond Portfolio
January 31, 2019
Portfolio of Investments — continued
| (5) | Floating rate security. The stated interest rate represents the rate in effect at January 31, 2019. |
| | | | |
| Abbreviations: |
| | |
| AGM | | – | | Assured Guaranty Municipal Corp. |
| | |
| BAM | | – | | Build America Mutual Assurance Co. |
| | |
| FHLMC | | – | | Federal Home Loan Mortgage Corp. |
| | |
| FNMA | | – | | Federal National Mortgage Association |
| | |
| GNMA | | – | | Government National Mortgage Association |
| | |
| LIBOR | | – | | London Interbank Offered Rate |
| | |
| Liq | | – | | Liquidity Provider |
| | |
| LOC | | – | | Letter of Credit |
| | |
| PSF | | – | | Permanent School Fund |
| | |
| SIFMA | | – | | Securities Industry and Financial Markets Association Municipal Swap Index |
| | |
| SPA | | – | | Standby Bond Purchase Agreement |
|
| Currency Abbreviations: |
| | |
| USD | | – | | United States Dollar |
| | | | |
| | 29 | | See Notes to Financial Statements. |
5-to-15 Year Laddered Municipal Bond Portfolio
January 31, 2019
Statement of Assets and Liabilities
| | | | |
| Assets | | January 31, 2019 | |
| |
Unaffiliated investments, at value (identified cost, $586,609,290) | | $ | 598,051,899 | |
| |
Cash | | | 26,224,797 | |
| |
Interest receivable | | | 5,686,704 | |
| |
Receivable for investments sold | | | 648,392 | |
| |
Receivable from affiliate | | | 9,840 | |
| |
Total assets | | $ | 630,621,632 | |
| |
| Liabilities | | | | |
| |
Payable for investments purchased | | $ | 6,867,941 | |
| |
Payable for when-issued securities | | | 11,085,037 | |
| |
Payable to affiliate: | | | | |
| |
Investment adviser fee | | | 163,839 | |
| |
Accrued expenses | | | 76,418 | |
| |
Total liabilities | | $ | 18,193,235 | |
| |
Net Assets applicable to investors’ interest in Portfolio | | $ | 612,428,397 | |
| | | | |
| | 30 | | See Notes to Financial Statements. |
5-to-15 Year Laddered Municipal Bond Portfolio
January 31, 2019
Statement of Operations
| | | | |
| Investment Income | | Year Ended January 31, 2019 | |
| |
Interest | | $ | 16,210,797 | |
| |
Total investment income | | $ | 16,210,797 | |
| |
| Expenses | | | | |
| |
Investment adviser fee | | $ | 2,067,248 | |
| |
Trustees’ fees and expenses | | | 31,656 | |
| |
Custodian fee | | | 174,116 | |
| |
Legal and accounting services | | | 58,176 | |
| |
Miscellaneous | | | 18,586 | |
| |
Total expenses | | $ | 2,349,782 | |
| |
Deduct — | | | | |
| |
Allocation of expenses to affiliate | | $ | 88,730 | |
| |
Total expense reductions | | $ | 88,730 | |
| |
Net expenses | | $ | 2,261,052 | |
| |
Net investment income | | $ | 13,949,745 | |
| |
| Realized and Unrealized Gain (Loss) | | | | |
| |
Net realized gain (loss) — | | | | |
| |
Investment transactions | | $ | (8,296,867 | ) |
| |
Net realized loss | | $ | (8,296,867 | ) |
| |
Change in unrealized appreciation (depreciation) — | | | | |
| |
Investments | | $ | 13,159,193 | |
| |
Net change in unrealized appreciation (depreciation) | | $ | 13,159,193 | |
| |
Net realized and unrealized gain | | $ | 4,862,326 | |
| |
Net increase in net assets from operations | | $ | 18,812,071 | |
| | | | |
| | 31 | | See Notes to Financial Statements. |
5-to-15 Year Laddered Municipal Bond Portfolio
January 31, 2019
Statements of Changes in Net Assets
| | | | | | | | |
| | | Year Ended January 31, | |
| Increase (Decrease) in Net Assets | | 2019 | | | 2018 | |
| | |
From operations — | | | | | | | | |
| | |
Net investment income | | $ | 13,949,745 | | | $ | 11,752,466 | |
| | |
Net realized loss | | | (8,296,867 | ) | | | (1,636,424 | ) |
| | |
Net change in unrealized appreciation (depreciation) | | | 13,159,193 | | | | 7,838,450 | |
| | |
Net increase in net assets from operations | | $ | 18,812,071 | | | $ | 17,954,492 | |
| | |
Capital transactions — | | | | | | | | |
| | |
Contributions | | $ | 60,489,911 | | | $ | 211,735,515 | |
| | |
Withdrawals | | | (143,479,290 | ) | | | (55,926,844 | ) |
| | |
Portfolio transaction fee | | | 305,881 | | | | 432,365 | |
| | |
Net increase (decrease) in net assets from capital transactions | | $ | (82,683,498 | ) | | $ | 156,241,036 | |
| | |
Net increase (decrease) in net assets | | $ | (63,871,427 | ) | | $ | 174,195,528 | |
| | |
| Net Assets | | | | | | | | |
| | |
At beginning of year | | $ | 676,299,824 | | | $ | 502,104,296 | |
| | |
At end of year | | $ | 612,428,397 | | | $ | 676,299,824 | |
| | | | |
| | 32 | | See Notes to Financial Statements. |
5-to-15 Year Laddered Municipal Bond Portfolio
January 31, 2019
Financial Highlights
| | | | | | | | | | | | |
| | | Year Ended January 31, | | | Period Ended
January 31, 2017(1) | |
| Ratios/Supplemental Data | | 2019 | | | 2018 | |
| | | |
Ratios (as a percentage of average daily net assets): | | | | | | | | | | | | |
| | | |
Expenses(2) | | | 0.35 | % | | | 0.35 | % | | | 0.35 | %(3) |
| | | |
Net investment income | | | 2.16 | % | | | 2.01 | % | | | 1.71 | %(3) |
| | | |
Portfolio Turnover | | | 78 | % | | | 35 | % | | | 30 | %(4) |
| | | |
Total Return(2) | | | 3.11 | % | | | 3.83 | % | | | (0.80 | )%(4) |
| | | |
Net assets, end of year (000’s omitted) | | $ | 612,428 | | | $ | 676,300 | | | $ | 502,104 | |
| (1) | For the period from the start of business, March 28, 2016, to January 31, 2017. |
| (2) | The investment adviser reimbursed certain operating expenses (equal to 0.01%, 0.01% and 0.02% of average daily net assets for the years ended January 31, 2019 and 2018 and the period ended January 31, 2017, respectively). Absent this reimbursement, total return would be lower. |
| | | | |
| | 33 | | See Notes to Financial Statements. |
5-to-15 Year Laddered Municipal Bond Portfolio
January 31, 2019
Notes to Financial Statements
1 Significant Accounting Policies
5-to-15 Year Laddered Municipal Bond Portfolio (the Portfolio) is a Massachusetts business trust registered under the Investment Company Act of 1940, as amended (the 1940 Act), as a diversified,open-end management investment company. The Portfolio’s investment objective is to seek current income exempt from regular federal income tax. The Declaration of Trust permits the Trustees to issue interests in the Portfolio. At January 31, 2019, Eaton Vance TABS5-to-15 Year Laddered Municipal Bond Fund and Eaton Vance TABS5-to-15 Year Laddered Municipal Bond NextShares held an interest of 98.8% and 1.2%, respectively, in the Portfolio.
The following is a summary of significant accounting policies of the Portfolio. The policies are in conformity with accounting principles generally accepted in the United States of America (U.S. GAAP). The Portfolio is an investment company and follows accounting and reporting guidance in the Financial Accounting Standards Board (FASB) Accounting Standards Codification Topic 946.
A Investment Valuation — The following methodologies are used to determine the market value or fair value of investments.
Debt Obligations. Debt obligations are generally valued on the basis of valuations provided by third party pricing services, as derived from such services’ pricing models. Inputs to the models may include, but are not limited to, reported trades, executable bid and ask prices, broker/dealer quotations, prices or yields of securities with similar characteristics, interest rates, anticipated prepayments, benchmark curves or information pertaining to the issuer, as well as industry and economic events. The pricing services may use a matrix approach, which considers information regarding securities with similar characteristics to determine the valuation for a security. Short-term debt obligations purchased with a remaining maturity of sixty days or less for which a valuation from a third party pricing service is not readily available may be valued at amortized cost, which approximates fair value.
Fair Valuation. Investments for which valuations or market quotations are not readily available or are deemed unreliable are valued at fair value using methods determined in good faith by or at the direction of the Trustees of the Portfolio in a manner that fairly reflects the security’s value, or the amount that the Portfolio might reasonably expect to receive for the security upon its current sale in the ordinary course. Each such determination is based on a consideration of relevant factors, which are likely to vary from one pricing context to another. These factors may include, but are not limited to, the type of security, the existence of any contractual restrictions on the security’s disposition, the price and extent of public trading in similar securities of the issuer or of comparable entities, quotations or relevant information obtained from broker/dealers or other market participants, information obtained from the issuer, analysts, and/or the appropriate stock exchange (for exchange-traded securities), an analysis of the entity’s financial condition, and an evaluation of the forces that influence the issuer and the market(s) in which the security is purchased and sold.
B Investment Transactions — Investment transactions for financial statement purposes are accounted for on a trade date basis. Realized gains and losses on investments sold are determined on the basis of identified cost.
C Income — Interest income is recorded on the basis of interest accrued, adjusted for amortization of premium or accretion of discount.
D Federal Taxes — The Portfolio has elected to be treated as a partnership for federal tax purposes. No provision is made by the Portfolio for federal or state taxes on any taxable income of the Portfolio because each investor in the Portfolio is ultimately responsible for the payment of any taxes on its share of taxable income. Since at least one of the Portfolio’s investors is a regulated investment company that invests all or substantially all of its assets in the Portfolio, the Portfolio normally must satisfy the applicable source of income and diversification requirements (under the Internal Revenue Code) in order for its investors to satisfy them. The Portfolio will allocate, at least annually among its investors, each investor’s distributive share of the Portfolio’s net investment income, net realized capital gains and losses and any other items of income, gain, loss, deduction or credit.
As of January 31, 2019, the Portfolio had no uncertain tax positions that would require financial statement recognition,de-recognition, or disclosure. The Portfolio files a U.S. federal income tax return annually after its fiscalyear-end, which is subject to examination by the Internal Revenue Service for a period of three years from the date of filing.
E Use of Estimates — The preparation of the financial statements in conformity with U.S. GAAP requires management to make estimates and assumptions that affect the reported amounts of assets and liabilities at the date of the financial statements and the reported amounts of income and expense during the reporting period. Actual results could differ from those estimates.
F Indemnifications — Under the Portfolio’s organizational documents, its officers and Trustees may be indemnified against certain liabilities and expenses arising out of the performance of their duties to the Portfolio. Under Massachusetts law, if certain conditions prevail, interestholders in the Portfolio could be deemed to have personal liability for the obligations of the Portfolio. However, the Portfolio’s Declaration of Trust contains an express disclaimer of liability on the part of Portfolio interestholders and theBy-laws provide that the Portfolio shall assume the defense on behalf of any Portfolio interestholder. Moreover, theBy-laws also provide for indemnification out of Portfolio property of any interestholder held personally liable solely by reason of being or having been an interestholder for all loss or expense arising from such liability. Additionally, in the normal course of business, the Portfolio enters into agreements with service providers that may contain indemnification clauses. The Portfolio’s maximum exposure under these arrangements is unknown as this would involve future claims that may be made against the Portfolio that have not yet occurred.
G When-Issued Securities and Delayed Delivery Transactions — The Portfolio may purchase or sell securities on a delayed delivery or when-issued basis. Payment and delivery may take place after the customary settlement period for that security. At the time the transaction is negotiated, the price of the security that will be delivered is fixed. The Portfolio maintains cash and/or security positions for these commitments such that sufficient liquid assets will
5-to-15 Year Laddered Municipal Bond Portfolio
January 31, 2019
Notes to Financial Statements — continued
be available to make payments upon settlement. Securities purchased on a delayed delivery or when-issued basis aremarked-to-market daily and begin earning interest on settlement date. Losses may arise due to changes in the market value of the underlying securities or if the counterparty does not perform under the contract.
H Capital Transactions — To seek to protect the Portfolio (and, indirectly, other investors in the Portfolio) against the costs of accommodating investor inflows and outflows, the Portfolio imposes a fee (“Portfolio transaction fee”) on inflows and outflows by Portfolio investors. The Portfolio transaction fee is sized to cover the estimated cost to the Portfolio of, in connection with issuing interests, converting the cash and/or other instruments it receives to the desired composition and, in connection with redeeming its interests, converting Portfolio holdings to cash and/or other instruments to be distributed. Such fee, which may vary over time, is limited to amounts that have been authorized by the Board of Trustees and determined by Eaton Vance Management (EVM) to be appropriate. The maximum Portfolio transaction fee is 2% of the amount of net contributions or withdrawals. The Portfolio transaction fee is recorded as a component of capital transactions on the Statements of Changes in Net Assets.
2 Investment Adviser Fee and Other Transactions with Affiliates
The investment adviser fee is earned by Boston Management and Research (BMR), a subsidiary of EVM, as compensation for investment advisory services rendered to the Portfolio. The fee is computed at an annual rate of 0.32% of the Portfolio’s average daily net assets up to $1 billion and at reduced rates on average daily net assets of $1 billion or more, and is payable monthly. For the year ended January 31, 2019, the Portfolio’s investment adviser fee amounted to $2,067,248 or 0.32% of the Portfolio’s average daily net assets. Pursuant to a voluntary expense reimbursement, BMR was allocated $88,730 of the Portfolio’s operating expenses for the year ended January 31, 2019.
Trustees and officers of the Portfolio who are members of EVM’s or BMR’s organizations receive remuneration for their services to the Portfolio out of the investment adviser fee. Trustees of the Portfolio who are not affiliated with the investment adviser may elect to defer receipt of all or a percentage of their annual fees in accordance with the terms of the Trustees Deferred Compensation Plan. For the year ended January 31, 2019, no significant amounts have been deferred. Certain officers and Trustees of the Portfolio are officers of the above organizations.
3 Purchases and Sales of Investments
Purchases and sales of investments, other than short-term obligations, aggregated $483,535,235 and $515,898,613, respectively, for the year ended January 31, 2019.
4 Federal Income Tax Basis of Investments
The cost and unrealized appreciation (depreciation) of investments of the Portfolio at January 31, 2019, as determined on a federal income tax basis, were as follows:
| | | | |
| |
Aggregate cost | | $ | 586,606,093 | |
| |
Gross unrealized appreciation | | $ | 11,998,259 | |
| |
Gross unrealized depreciation | | | (552,453 | ) |
| |
Net unrealized appreciation | | $ | 11,445,806 | |
5 Line of Credit
The Portfolio participates with other portfolios and funds managed by EVM and its affiliates in a $625 million unsecured line of credit agreement with a group of banks, which is in effect through October 29, 2019. Borrowings are made by the Portfolio solely to facilitate the handling of unusual and/or unanticipated short-term cash requirements. Interest is charged to the Portfolio based on its borrowings at an amount above either the Eurodollar rate or Federal Funds rate. In addition, a fee computed at an annual rate of 0.15% on the daily unused portion of the line of credit is allocated among the participating portfolios and funds at the end of each quarter. Because the line of credit is not available exclusively to the Portfolio, it may be unable to borrow some or all of its requested amounts at any particular time. The Portfolio did not have any significant borrowings or allocated fees during the year ended January 31, 2019.
5-to-15 Year Laddered Municipal Bond Portfolio
January 31, 2019
Notes to Financial Statements — continued
6 Fair Value Measurements
Under generally accepted accounting principles for fair value measurements, a three-tier hierarchy to prioritize the assumptions, referred to as inputs, is used in valuation techniques to measure fair value. The three-tier hierarchy of inputs is summarized in the three broad levels listed below.
| • | | Level 1 – quoted prices in active markets for identical investments |
| • | | Level 2 – other significant observable inputs (including quoted prices for similar investments, interest rates, prepayment speeds, credit risk, etc.) |
| • | | Level 3 – significant unobservable inputs (including a fund’s own assumptions in determining the fair value of investments) |
In cases where the inputs used to measure fair value fall in different levels of the fair value hierarchy, the level disclosed is determined based on the lowest level input that is significant to the fair value measurement in its entirety. The inputs or methodology used for valuing securities are not necessarily an indication of the risk associated with investing in those securities.
At January 31, 2019, the hierarchy of inputs used in valuing the Portfolio’s investments, which are carried at value, were as follows:
| | | | | | | | | | | | | | | | |
| Asset Description | | Level 1 | | | Level 2 | | | Level 3 | | | Total | |
| | | | |
Tax-Exempt Investments | | $ | — | | | $ | 598,051,899 | | | $ | — | | | $ | 598,051,899 | |
| | | | |
Total Investments | | $ | — | | | $ | 598,051,899 | | | $ | — | | | $ | 598,051,899 | |
5-to-15 Year Laddered Municipal Bond Portfolio
January 31, 2019
Report of Independent Registered Public Accounting Firm
To the Trustees and Investors of5-to-15 Year Laddered Municipal Bond Portfolio:
Opinion on the Financial Statements and Financial Highlights
We have audited the accompanying statement of assets and liabilities of5-to-15 Year Laddered Municipal Bond Portfolio (the “Portfolio”), including the portfolio of investments, as of January 31, 2019, the related statement of operations for the year then ended, the statements of changes in net assets for each of the two years in the period then ended, the financial highlights for each of the two years in the period then ended and the period from the start of business, March 28, 2016, to January 31, 2017, and the related notes. In our opinion, the financial statements and financial highlights present fairly, in all material respects, the financial position of the Portfolio as of January 31, 2019, and the results of its operations for the year then ended, the changes in its net assets for each of the two years in the period then ended, and the financial highlights for each of the two years in the period then ended and the period from the start of business, March 28, 2016, to January 31, 2017, in conformity with accounting principles generally accepted in the United States of America.
Basis for Opinion
These financial statements and financial highlights are the responsibility of the Portfolio’s management. Our responsibility is to express an opinion on the Portfolio’s financial statements and financial highlights based on our audits. We are a public accounting firm registered with the Public Company Accounting Oversight Board (United States) (PCAOB) and are required to be independent with respect to the Portfolio in accordance with the U.S. federal securities laws and the applicable rules and regulations of the Securities and Exchange Commission and the PCAOB.
We conducted our audits in accordance with the standards of the PCAOB. Those standards require that we plan and perform the audit to obtain reasonable assurance about whether the financial statements and financial highlights are free of material misstatement, whether due to error or fraud. The Portfolio is not required to have, nor were we engaged to perform, an audit of its internal control over financial reporting. As part of our audits we are required to obtain an understanding of internal control over financial reporting but not for the purpose of expressing an opinion on the effectiveness of the Portfolio’s internal control over financial reporting. Accordingly, we express no such opinion.
Our audits included performing procedures to assess the risks of material misstatement of the financial statements and financial highlights, whether due to error or fraud, and performing procedures that respond to those risks. Such procedures included examining, on a test basis, evidence regarding the amounts and disclosures in the financial statements and financial highlights. Our audits also included evaluating the accounting principles used and significant estimates made by management, as well as evaluating the overall presentation of the financial statements and financial highlights. Our procedures included confirmation of securities owned as of January 31, 2019, by correspondence with the custodian and brokers; when replies were not received from brokers, we performed other auditing procedures. We believe that our audits provide a reasonable basis for our opinion.
/s/ Deloitte & Touche LLP
Boston, Massachusetts
March 21, 2019
We have served as the auditor of one or more Eaton Vance investment companies since 1959.
Eaton Vance TABS 5-to-15 Year Laddered Municipal Bond Fund
5-to-15 Year Laddered Municipal Bond Portfolio
January 31, 2019
Special Meeting of Shareholders (Unaudited)
Eaton Vance TABS5-to-15 Year Laddered Municipal Bond Fund
The Fund held a Special Meeting of Shareholders on September 20, 2018 to elect the five Trustees listed below. The other Trustees named herein continue to serve as Trustees. The results of the vote with respect to the Fund were as follows:
| | | | | | | | |
| | | Number of Shares | |
| Nominee for Trustee | | For | | | Withheld | |
| | |
Mark R. Fetting | | | 52,195,441 | | | | 610,202 | |
| | |
Keith Quinton | | | 52,181,453 | | | | 624,190 | |
| | |
Marcus L. Smith | | | 52,190,175 | | | | 615,467 | |
| | |
Susan J. Sutherland | | | 52,231,356 | | | | 574,286 | |
| | |
Scott E. Wennerholm | | | 52,018,768 | | | | 786,875 | |
Results are rounded to the nearest whole number.
5-to-15 Year Laddered Municipal Bond Portfolio
The Portfolio held a Special Meeting of Interestholders on September 20, 2018 to elect the five Trustees listed below. The other Trustees named herein continue to serve as Trustees. The results of the vote with respect to the Fund’s interest in the Portfolio were as follows:
| | | | | | | | |
| | | Interest in the Portfolio | |
| Nominee for Trustee | | For | | | Withheld | |
| | |
Mark R. Fetting | | | 99 | % | | | 1 | % |
| | |
Keith Quinton | | | 99 | % | | | 1 | % |
| | |
Marcus L. Smith | | | 99 | % | | | 1 | % |
| | |
Susan J. Sutherland | | | 99 | % | | | 1 | % |
| | |
Scott E. Wennerholm | | | 99 | % | | | 1 | % |
Results are rounded to the nearest whole number.
Eaton Vance
TABS 5-to-15 Year Laddered Municipal Bond Fund
January 31, 2019
Management and Organization
Fund Management. The Trustees of Eaton Vance Municipals Trust II (the Trust) and5-to-15 Year Laddered Municipal Bond Portfolio (the Portfolio) are responsible for the overall management and supervision of the Trust’s and Portfolio’s affairs. The Trustees and officers of the Trust and the Portfolio are listed below. Except as indicated, each individual has held the office shown or other offices in the same company for the last five years. Trustees and officers of the Trust and the Portfolio hold indefinite terms of office. The “noninterested Trustees” consist of those Trustees who are not “interested persons” of the Trust and the Portfolio, as that term is defined under the 1940 Act. The business address of each Trustee and officer is Two International Place, Boston, Massachusetts 02110. As used below, “EVC” refers to Eaton Vance Corp., “EV” refers to Eaton Vance, Inc., “EVM” refers to Eaton Vance Management, “BMR” refers to Boston Management and Research and “EVD” refers to Eaton Vance Distributors, Inc. EVC and EV are the corporate parent and trustee, respectively, of EVM and BMR. EVD is the Fund’s principal underwriter, the Portfolio’s placement agent and a wholly-owned subsidiary of EVC. Each officer affiliated with Eaton Vance may hold a position with other Eaton Vance affiliates that is comparable to his or her position with EVM listed below. Each Trustee oversees 175 portfolios in the Eaton Vance Complex (including all master and feeder funds in a master feeder structure). Each officer serves as an officer of certain other Eaton Vance funds. Each Trustee and officer serves until his or her successor is elected.
| | | | | | |
| Name and Year of Birth | | Position(s) with the Trust and the Portfolio | | Trustee Since(1) | | Principal Occupation(s) and Directorships During Past Five Years and Other Relevant Experience |
| | | |
| Interested Trustee | | | | | | |
| | | |
Thomas E. Faust Jr. 1958 | | Trustee | | 2007 | | Chairman, Chief Executive Officer and President of EVC, Director and President of EV, Chief Executive Officer and President of EVM and BMR, and Director of EVD. Trustee and/or officer of 175 registered investment companies. Mr. Faust is an interested person because of his positions with EVM, BMR, EVD, EVC and EV, which are affiliates of the Trust and the Portfolio. Directorships in the Last Five Years.(2)Director of EVC and Hexavest Inc. (investment management firm). |
|
| Noninterested Trustees |
| | | |
Mark R. Fetting 1954 | | Trustee | | 2016 | | Private investor. Formerly held various positions at Legg Mason, Inc. (investment management firm) (2000-2012), including President, Chief Executive Officer, Director and Chairman (2008-2012), Senior Executive Vice President (2004-2008) and Executive Vice President (2001-2004). Formerly, President of Legg Mason family of funds (2001-2008). Formerly, Division President and Senior Officer of Prudential Financial Group, Inc. and related companies (investment management firm)(1991-2000). Directorships in the Last Five Years. None. |
| | | |
Cynthia E. Frost 1961 | | Trustee | | 2014 | | Private investor. Formerly, Chief Investment Officer of Brown University (university endowment) (2000-2012). Formerly, Portfolio Strategist for Duke Management Company (university endowment manager) (1995-2000). Formerly, Managing Director, Cambridge Associates (investment consulting company) (1989-1995). Formerly, Consultant, Bain and Company (management consulting firm) (1987-1989). Formerly, Senior Equity Analyst, BA Investment Management Company (1983-1985). Directorships in the Last Five Years.None. |
| | | |
George J. Gorman 1952 | | Trustee | | 2014 | | Principal at George J. Gorman LLC (consulting firm). Formerly, Senior Partner at Ernst & Young LLP (a registered public accounting firm) (1974-2009). Directorships in the Last Five Years.Formerly, Trustee of the BofA Funds Series Trust (11 funds) (2011-2014) and of the Ashmore Funds (9 funds) (2010-2014). |
| | | |
Valerie A. Mosley 1960 | | Trustee | | 2014 | | Chairwoman and Chief Executive Officer of Valmo Ventures (a consulting and investment firm). Former Partner and Senior Vice President, Portfolio Manager and Investment Strategist at Wellington Management Company, LLP (investment management firm) (1992-2012). Former Chief Investment Officer, PG Corbin Asset Management (1990-1992). Formerly worked in institutional corporate bond sales at Kidder Peabody (1986-1990). Directorships in the Last Five Years.(2)Director of Envestnet, Inc. (provider of intelligent systems for wealth management and financial wellness) (since 2018). |
Eaton Vance
TABS 5-to-15 Year Laddered Municipal Bond Fund
January 31, 2019
Management and Organization — continued
| | | | | | |
| Name and Year of Birth | | Position(s) with the Trust and the Portfolio | | Trustee Since(1) | | Principal Occupation(s) and Directorships During Past Five Years and Other Relevant Experience |
|
| Noninterested Trustees (continued) |
| | | |
William H. Park 1947 | | Chairperson of the Board and Trustee | | 2016 (Chairperson); 2003 (Trustee) | | Private investor. Formerly, Consultant (management and transactional) (2012-2014). Formerly, Chief Financial Officer, Aveon Group L.P. (investment management firm) (2010-2011). Formerly, Vice Chairman, Commercial Industrial Finance Corp. (specialty finance company) (2006-2010). Formerly, President and Chief Executive Officer, Prizm Capital Management, LLC (investment management firm) (2002-2005). Formerly, Executive Vice President and Chief Financial Officer, United Asset Management Corporation (investment management firm) (1982-2001). Formerly, Senior Manager, Price Waterhouse (now PricewaterhouseCoopers) (a registered public accounting firm) (1972-1981). Directorships in the Last Five Years.(2)None. |
| | | |
Helen Frame Peters 1948 | | Trustee | | 2008 | | Professor of Finance, Carroll School of Management, Boston College. Formerly, Dean, Carroll School of Management, Boston College (2000-2002). Formerly, Chief Investment Officer, Fixed Income, Scudder Kemper Investments (investment management firm) (1998-1999). Formerly, Chief Investment Officer, Equity and Fixed Income, Colonial Management Associates (investment management firm)(1991-1998). Directorships in the Last Five Years.(2)None. |
| | | |
Keith Quinton(3) 1958 | | Trustee | | 2018 | | Independent Investment Committee Member at New Hampshire Retirement System (since 2017). Advisory Committee member at Northfield Information Services, Inc. (risk management analytics provider) (since 2016). Formerly, Portfolio Manager and Senior Quantitative Analyst at Fidelity Investments (investment management firm)(2001-2014). Directorships in the Last Five Years.Director of New Hampshire Municipal Bond Bank (since 2016). |
| | | |
Marcus L. Smith(3) 1966 | | Trustee | | 2018 | | Member of Posse Boston Advisory Board (foundation) (since 2015); Trustee at University of Mount Union (since 2008). Formerly, Portfolio Manager at MFS Investment Management (investment management firm) (1994-2017). Directorships in the Last Five Years.Director of MSCI Inc. (global provider of investment decision support tools) (since 2017). Director of DCT Industrial Trust Inc. (logistics real estate company) (since 2017). |
| | | |
Susan J. Sutherland 1957 | | Trustee | | 2015 | | Private investor. Formerly, Associate, Counsel and Partner at Skadden, Arps, Slate, Meagher & Flom LLP (law firm) (1982-2013). Directorships in the Last Five Years. Formerly, Director of Montpelier Re Holdings Ltd. (global provider of customized insurance and reinsurance products) (2013-2015). |
| | | |
Scott E. Wennerholm 1959 | | Trustee | | 2016 | | Formerly, Trustee at Wheelock College (postsecondary institution) (2012-2018). Formerly, Consultant at GF Parish Group (executive recruiting firm) (2016-2017). Formerly, Chief Operating Officer and Executive Vice President at BNY Mellon Asset Management (investment management firm) (2005-2011). Formerly, Chief Operating Officer and Chief Financial Officer at Natixis Global Asset Management (investment management firm) (1997-2004). Formerly, Vice President at Fidelity Investments Institutional Services (investment management firm) (1994-1997). Directorships in the Last Five Years. None. |
| | | |
| Name and Year of Birth | | Position(s) with the Trust and the Portfolio | | Officer
Since(4) | | Principal Occupation(s) During Past Five Years |
| | |
| Principal Officers who are not Trustees | | | | |
| | | |
Payson F. Swaffield 1956 | | President | | 2003 | | Vice President and Chief Income Investment Officer of EVM and BMR. Also Vice President of Calvert Research and Management (“CRM”). |
| | | |
Maureen A. Gemma 1960 | | Vice President, Secretary and Chief Legal Officer | | 2005 | | Vice President of EVM and BMR. Also Vice President and officer of CRM. |
Eaton Vance
TABS 5-to-15 Year Laddered Municipal Bond Fund
January 31, 2019
Management and Organization — continued
| | | | | | |
| Name and Year of Birth | | Position(s) with the Trust and the Portfolio | | Officer
Since(4) | | Principal Occupation(s) During Past Five Years |
|
| Principal Officers who are not Trustees (continued) |
| | | |
James F. Kirchner 1967 | | Treasurer | | 2007 | | Vice President of EVM and BMR. Also Vice President and officer of CRM. |
| | | |
Richard F. Froio 1968 | | Chief Compliance Officer | | 2017 | | Vice President of EVM and BMR since 2017. Formerly, Deputy Chief Compliance Officer (Adviser/Funds) and Chief Compliance Officer (Distribution) at PIMCO(2012-2017) and Managing Director at BlackRock/Barclays Global Investors(2009-2012). |
| (1) | Year first appointed to serve as Trustee for a fund in the Eaton Vance family of funds. Each Trustee has served continuously since appointment unless indicated otherwise. |
| (2) | During their respective tenures, the Trustees (except for Mmes. Frost and Sutherland and Messrs. Fetting, Gorman, Quinton, Smith and Wennerholm) also served as Board members of one or more of the following funds (which operated in the years noted): eUnitsTM 2 Year U.S. Market Participation Trust: Upside to Cap / Buffered Downside (launched in 2012 and terminated in 2014); and eUnitsTM 2 Year U.S. Market Participation Trust II: Upside to Cap / Buffered Downside (launched in 2012 and terminated in 2014). However, Ms. Mosley did not serve as a Board member of eUnitsTM 2 Year U.S. Market Participation Trust: Upside to Cap / Buffered Downside (launched in 2012 and terminated in 2014). |
| (3) | Messrs. Quinton and Smith began serving as Trustees effective October 1, 2018. |
| (4) | Year first elected to serve as officer of a fund in the Eaton Vance family of funds when the officer has served continuously. Otherwise, year of most recent election as an officer of a fund in the Eaton Vance family of funds. Titles may have changed since initial election. |
The SAI for the Fund includes additional information about the Trustees and officers of the Fund and the Portfolio and can be obtained without charge on Eaton Vance’s website at www.eatonvance.com or by calling1-800-262-1122.
Eaton Vance Funds
IMPORTANT NOTICES
Privacy. The Eaton Vance organization is committed to ensuring your financial privacy. Each of the financial institutions identified below has in effect the following policy (“Privacy Policy”) with respect to nonpublic personal information about its customers:
| • | | Only such information received from you, through application forms or otherwise, and information about your Eaton Vance fund transactions will be collected. This may include information such as name, address, social security number, tax status, account balances and transactions. |
| • | | None of such information about you (or former customers) will be disclosed to anyone, except as permitted by law (which includes disclosure to employees necessary to service your account). In the normal course of servicing a customer’s account, Eaton Vance may share information with unaffiliated third parties that perform various required services such as transfer agents, custodians and broker-dealers. |
| • | | Policies and procedures (including physical, electronic and procedural safeguards) are in place that are designed to protect the confidentiality of such information. |
| • | | We reserve the right to change our Privacy Policy at any time upon proper notification to you. Customers may want to review our Privacy Policy periodically for changes by accessing the link on our homepage: www.eatonvance.com. |
Our pledge of privacy applies to the following entities within the Eaton Vance organization: the Eaton Vance Family of Funds, Eaton Vance Management, Eaton Vance Investment Counsel, Eaton Vance Distributors, Inc., Eaton Vance Trust Company, Eaton Vance Management (International) Limited, Eaton Vance Advisers International Ltd., Eaton Vance Management’s Real Estate Investment Group and Boston Management and Research. In addition, our Privacy Policy applies only to those Eaton Vance customers who are individuals and who have a direct relationship with us. If a customer’s account (i.e., fund shares) is held in the name of a third-party financial advisor/broker-dealer, it is likely that only such advisor’s privacy policies apply to the customer. This notice supersedes all previously issued privacy disclosures. For more information about Eaton Vance’s Privacy Policy, please call1-800-262-1122.
Delivery of Shareholder Documents. The Securities and Exchange Commission (SEC) permits funds to deliver only one copy of shareholder documents, including prospectuses, proxy statements and shareholder reports, to fund investors with multiple accounts at the same residential or post office box address. This practice is often called “householding” and it helps eliminate duplicate mailings to shareholders.Eaton Vance, or your financial advisor, may household the mailing of your documents indefinitely unless you instruct Eaton Vance, or your financial advisor, otherwise.If you would prefer that your Eaton Vance documents not be householded, please contact Eaton Vance at1-800-262-1122, or contact your financial advisor. Your instructions that householding not apply to delivery of your Eaton Vance documents will typically be effective within 30 days of receipt by Eaton Vance or your financial advisor.
Portfolio Holdings. Each Eaton Vance Fund and its underlying Portfolio(s) (if applicable) will file a schedule of portfolio holdings on FormN-Q with the SEC for the first and third quarters of each fiscal year. The FormN-Q will be available on the Eaton Vance website at www.eatonvance.com, by calling Eaton Vance at1-800-262-1122 or in the EDGAR database on the SEC’s website at www.sec.gov. FormN-Q may also be reviewed and copied at the SEC’s public reference room in Washington, D.C. (call1-800-732-0330 for information on the operation of the public reference room).
Proxy Voting. From time to time, funds are required to vote proxies related to the securities held by the funds. The Eaton Vance Funds or their underlying Portfolios (if applicable) vote proxies according to a set of policies and procedures approved by the Funds’ and Portfolios’ Boards. You may obtain a description of these policies and procedures and information on how the Funds or Portfolios voted proxies relating to portfolio securities during the most recent12-month period ended June 30, without charge, upon request, by calling1-800-262-1122 and by accessing the SEC’s website at www.sec.gov.
This Page Intentionally Left Blank
This Page Intentionally Left Blank
Investment Adviser of5-to-15 Year Laddered
Municipal Bond Portfolio
Boston Management and Research
Two International Place
Boston, MA 02110
Investment Adviser and Administrator of Eaton
Vance TABS5-to-15 Year Laddered Municipal Bond Fund
Eaton Vance Management
Two International Place
Boston, MA 02110
Principal Underwriter*
Eaton Vance Distributors, Inc.
Two International Place
Boston, MA 02110
(617)482-8260
Custodian
State Street Bank and Trust Company
State Street Financial Center, One Lincoln Street
Boston, MA 02111
Transfer Agent
BNY Mellon Investment Servicing (US) Inc.
Attn: Eaton Vance Funds
P.O. Box 9653
Providence, RI 02940-9653
(800)262-1122
Independent Registered Public Accounting Firm
Deloitte & Touche LLP
200 Berkeley Street
Boston, MA 02116-5022
Fund Offices
Two International Place
Boston, MA 02110
| * | FINRA BrokerCheck. Investors may check the background of their Investment Professional by contacting the Financial Industry Regulatory Authority (FINRA). FINRA BrokerCheck is a free tool to help investors check the professional background of current and former FINRA-registered securities firms and brokers. FINRA BrokerCheck is available by calling1-800-289-9999 and at www.FINRA.org. The FINRA BrokerCheck brochure describing this program is available to investors at www.FINRA.org. |

22626 1.31.19
Item 2. Code of Ethics
The registrant has adopted a code of ethics applicable to its Principal Executive Officer, Principal Financial Officer and Principal Accounting Officer. The registrant undertakes to provide a copy of such code of ethics to any person upon request, without charge, by calling1-800-262-1122. The registrant has not amended the code of ethics as described in FormN-CSR during the period covered by this report. The registrant has not granted any waiver, including an implicit waiver, from a provision of the code of ethics as described in FormN-CSR during the period covered by this report.
Item 3. Audit Committee Financial Expert
The registrant’s Board has designated George J. Gorman and William H. Park, each an independent trustee, as audit committee financial experts. Mr. Gorman is a certified public accountant who is the Principal at George J. Gorman LLC (a consulting firm). Previously, Mr. Gorman served in various capacities at Ernst & Young LLP (a registered public accounting firm), including as Senior Partner. Mr. Gorman also has experience serving as an independent trustee and audit committee financial expert of other mutual fund complexes. Mr. Park is a certified public accountant who is a private investor. Previously, he served as a consultant, as the Chief
Financial Officer of Aveon Group, L.P. (an investment management firm), as the Vice Chairman of Commercial Industrial Finance Corp. (specialty finance company), as President and Chief Executive Officer of Prizm Capital Management, LLC (investment management firm), as Executive Vice President and Chief Financial Officer of United Asset Management Corporation (an institutional investment management firm) and as a Senior Manager at Price Waterhouse (now PricewaterhouseCoopers) (a registered public accounting firm).
Item 4. Principal Accountant Fees and Services
Eaton Vance High Yield Municipal Income Fund, Eaton Vance TABS Intermediate-Term Municipal Bond Fund, Eaton Vance TABS Short-Term Municipal Bond Fund, Eaton Vance TABS5-to-15 Year Laddered Municipal Bond Fund, Eaton Vance TABS1-to-10 Year Laddered Municipal Bond Fund and Eaton Vance TABS10-to-20 Year Laddered Municipal Bond Fund (the “Fund(s)”) are series of Eaton Vance Municipals Trust II (the “Trust”), a Massachusetts business trust, which, including the Funds, contains a total of 6 series (the “Series”). The Trust is registered under the Investment Company Act of 1940 as anopen-end management investment company. This FormN-CSR relates to the Funds’ annual reports.
(a)-(d)
The following tables present the aggregate fees billed to each Fund for the Fund’s fiscal years ended January 31, 2018 and January 31, 2019 by the registrant’s principal accountant, Deloitte & Touche LLP (“D&T”), for professional services rendered for the audit of the Fund’s annual financial statements and fees billed for other services rendered by D&T during such periods.
Eaton Vance High Yield Municipal Income Fund
| | | | | | | | |
Fiscal Years Ended | | 1/31/18 | | | 1/31/19 | |
Audit Fees | | $ | 80,270 | | | $ | 80,570 | |
Audit-Related Fees(1) | | $ | 0 | | | $ | 0 | |
Tax Fees(2) | | $ | 15,860 | | | $ | 15,860 | |
All Other Fees(3) | | $ | 0 | | | $ | 0 | |
| | | | | | | | |
Total | | $ | 96,130 | | | $ | 96,430 | |
| | | | | | | | |
Eaton Vance TABS Intermediate-Term Municipal Bond Fund
| | | | | | | | |
Fiscal Years Ended | | 1/31/18 | | | 1/31/19 | |
Audit Fees | | $ | 41,020 | | | $ | 40,370 | |
Audit-Related Fees(1) | | $ | 0 | | | $ | 0 | |
Tax Fees(2) | | $ | 10,701 | | | $ | 9,451 | |
All Other Fees(3) | | $ | 0 | | | $ | 0 | |
| | | | | | | | |
Total | | $ | 51,721 | | | $ | 49,821 | |
| | | | | | | | |
Eaton Vance TABS5-to-15 Year Laddered Municipal Bond Fund
| | | | | | | | |
Fiscal Years Ended | | 1/31/18 | | | 1/31/19 | |
Audit Fees | | $ | 15,000 | | | $ | 15,000 | |
Audit-Related Fees(1) | | $ | 0 | | | $ | 0 | |
Tax Fees(2) | | $ | 9,451 | | | $ | 9,451 | |
All Other Fees(3) | | $ | 0 | | | $ | 0 | |
| | | | | | | | |
Total | | $ | 24,451 | | | $ | 24,451 | |
| | | | | | | | |
Eaton Vance TABS Short-Term Municipal Bond Fund
| | | | | | | | |
Fiscal Years Ended | | 1/31/18 | | | 1/31/19 | |
Audit Fees | | $ | 40,040 | | | $ | 40,040 | |
Audit-Related Fees(1) | | $ | 0 | | | $ | 0 | |
Tax Fees(2) | | $ | 10,701 | | | $ | 9,451 | |
All Other Fees(3) | | $ | 0 | | | $ | 0 | |
| | | | | | | | |
Total | | $ | 50,741 | | | $ | 49,491 | |
| | | | | | | | |
Eaton Vance TABS1-to-10 Year Laddered Municipal Bond Fund
| | | | | | | | |
Fiscal Years Ended | | 1/31/18 | | | 1/31/19 | |
Audit Fees | | $ | 29,250 | | | $ | 29,975 | |
Audit-Related Fees(1) | | $ | 0 | | | $ | 0 | |
Tax Fees(2) | | $ | 9,636 | | | $ | 9,636 | |
All Other Fees(3) | | $ | 0 | | | $ | 0 | |
| | | | | | | | |
Total | | $ | 38,886 | | | $ | 39,611 | |
| | | | | | | | |
Eaton Vance TABS10-to-20 Year Laddered Municipal Bond Fund
| | | | | | | | |
Fiscal Years Ended | | 1/31/18 | | | 1/31/19 | |
Audit Fees | | $ | 24,250 | | | $ | 24,250 | |
Audit-Related Fees(1) | | $ | 0 | | | $ | 0 | |
Tax Fees(2) | | $ | 10,886 | | | $ | 10,936 | |
All Other Fees(3) | | $ | 0 | | | $ | 0 | |
| | | | | | | | |
Total | | $ | 35,136 | | | $ | 35,186 | |
| | | | | | | | |
| (1) | Audit-related fees consist of the aggregate fees billed for assurance and related services that are reasonably related to the performance of the audit of financial statements and are not reported under the category of audit fees. |
| (2) | Tax fees consist of the aggregate fees billed for professional services rendered by the principal accountant relating to tax compliance, tax advice, and tax planning and specifically include fees for tax return preparation and other related tax compliance/planning matters. |
| (3) | All other fees consist of the aggregate fees billed for products and services provided by the principal accountant other than audit, audit-related, and tax services. |
The Funds comprised all of the Series of the Trust at January 31, 2019, and have the same fiscal year end (January 31). The following table presents the aggregate audit, audit-related, tax, and other fees billed to all of the Series in the Trust by D&T for the last two fiscal years of each Series.
| | | | | | | | |
Fiscal Years Ended | | 1/31/18 | | | 1/31/19 | |
Audit Fees | | $ | 229,830 | | | $ | 230,205 | |
Audit-Related Fees(1) | | $ | 0 | | | $ | 0 | |
Tax Fees(2) | | $ | 67,235 | | | $ | 64,785 | |
All Other Fees(3) | | $ | 0 | | | $ | 0 | |
| | | | | | | | |
Total | | $ | 297,065 | | | $ | 294,990 | |
| | | | | | | | |
| (1) | Audit-related fees consist of the aggregate fees billed for assurance and related services that are reasonably related to the performance of the audit of financial statements and are not reported under the category of audit fees. |
| (2) | Tax fees consist of the aggregate fees billed for professional services rendered by the principal accountant relating to tax compliance, tax advice, and tax planning and specifically include fees for tax return preparation and other related tax compliance/planning matters. |
| (3) | All other fees consist of the aggregate fees billed for products and services provided by the principal accountant other than audit, audit-related, and tax services. |
(e)(1) The registrant’s audit committee has adopted policies and procedures relating to thepre-approval of services provided by the registrant’s principal accountant (the“Pre-Approval Policies”). ThePre-Approval Policies establish a framework intended to assist the audit committee in the proper discharge of itspre-approval responsibilities. As a general matter, thePre-Approval Policies (i) specify certain types of audit, audit-related, tax, and other services determined to bepre-approved by the audit committee; and (ii) delineate specific procedures governing the mechanics of thepre-approval process, including the approval and monitoring of audit andnon-audit service fees. Unless a service is specificallypre-approved under thePre-Approval Policies, it must be separatelypre-approved by the audit committee.
ThePre-Approval Policies and the types of audit andnon-audit servicespre-approved therein must be reviewed and ratified by the registrant’s audit committee at least annually. The registrant’s audit committee maintains full responsibility for the appointment, compensation, and oversight of the work of the registrant’s principal accountant.
(e)(2) No services described in paragraphs (b)-(d) above were approved by the registrant’s audit committee pursuant to the “de minimis exception” set forth in Rule2-01(c)(7)(i)(C) of RegulationS-X.
(f) Not applicable.
(g)The following table presents (i) the aggregatenon-audit fees (i.e., fees for audit-related, tax, and other services) billed for services rendered to all of the Series in the Trust by D&T for the last two fiscal years of each Series; and (ii) the aggregatenon-audit fees (i.e., fees for audit-related, tax, and other services) billed to the Eaton Vance organization by D&T for the last two fiscal years of each Series.
| | | | | | | | |
Fiscal Years Ended | | 1/31/18 | | | 1/31/19 | |
Registrant(1) | | $ | 67,235 | | | $ | 64,785 | |
Eaton Vance(2) | | $ | 148,018 | | | $ | 126,485 | |
| (1) | Includes all of the Series of the Trust. |
| (2) | The investment adviser to the Series, as well as any of its affiliates that provide ongoing services to the Series, are subsidiaries of Eaton Vance Corp. |
(h) The registrant’s audit committee has considered whether the provision by the registrant’s principal accountant ofnon-audit services to the registrant’s investment adviser and any entity controlling, controlled by, or under common control with the adviser that provides ongoing services to the registrant that were notpre-approved pursuant to Rule2-01(c)(7)(ii) of RegulationS-X is compatible with maintaining the principal accountant’s independence.
Item 5. Audit Committee of Listed Registrant
Not applicable.
Item 6. Schedule of Investments
Please see schedule of investments contained in the Report to Stockholders included under Item 1 of this FormN-CSR.
Item 7. Disclosure of Proxy Voting Policies and Procedures forClosed-End Management Investment Companies
Not applicable.
Item 8. Portfolio Managers ofClosed-End Management Investment Companies
Not applicable.
Item 9. Purchases of Equity Securities byClosed-End Management Investment Company and Affiliated Purchasers
Not applicable.
Item 10. Submission of Matters to a Vote of Security Holders
No material changes.
Item 11. Controls and Procedures
(a) It is the conclusion of the registrant’s principal executive officer and principal financial officer that the effectiveness of the registrant’s current disclosure controls and procedures (such disclosure controls and procedures having been evaluated within 90 days of the date of this filing) provide reasonable assurance that the information required to be disclosed by the registrant has been recorded, processed, summarized and reported within the time period specified in the Commission’s rules and forms and that the information required to be disclosed by the registrant has been accumulated and communicated to the registrant’s principal executive officer and principal financial officer in order to allow timely decisions regarding required disclosure.
(b) There have been no changes in the registrant’s internal controls over financial reporting during the second fiscal quarter of the period covered by this report that has materially affected, or is reasonably likely to materially affect, the registrant’s internal control over financial reporting.
Item 12. Disclosure of Securities Lending Activities forClosed-End Management Investment Companies
Not applicable.
Item 13. Exhibits
| | |
| (a)(1) | | Registrant’s Code of Ethics – Not applicable (please see Item 2). |
| |
| (a)(2)(i) | | Treasurer’s Section 302 certification. |
| |
| (a)(2)(ii) | | President’s Section 302 certification. |
| |
| (b) | | Combined Section 906 certification. |
Signatures
Pursuant to the requirements of the Securities Exchange Act of 1934 and the Investment Company Act of 1940, the registrant has duly caused this report to be signed on its behalf by the undersigned, thereunto duly authorized.
Eaton Vance Municipals Trust II
| | |
| By: | | /s/ Payson F. Swaffield |
| | Payson F. Swaffield |
| | President |
| |
| Date: | | March 22, 2019 |
Pursuant to the requirements of the Securities Exchange Act of 1934 and the Investment Company Act of 1940, this report has been signed below by the following persons on behalf of the registrant and in the capacities and on the dates indicated.
| | |
| By: | | /s/ James F. Kirchner |
| | James F. Kirchner |
| | Treasurer |
| |
| Date: | | March 22, 2019 |
| |
| By: | | /s/ Payson F. Swaffield |
| | Payson F. Swaffield |
| | President |
| |
| Date: | | March 22, 2019 |