UNITED STATES
SECURITIES AND EXCHANGE COMMISSION
Washington, D.C. 20549
Form N-CSR
CERTIFIED SHAREHOLDER REPORT OF REGISTERED
MANAGEMENT INVESTMENT COMPANIES
Investment Company Act File Number: 811-08134
Eaton Vance Municipals Trust II
(Exact Name of Registrant as Specified in Charter)
Two International Place, Boston, Massachusetts 02110
(Address of Principal Executive Offices)
Deidre E. Walsh
Two International Place, Boston, Massachusetts 02110
(Name and Address of Agent for Services)
(617) 482-8260
(Registrant’s Telephone Number)
January 31
Date of Fiscal Year End
January 31, 2022
Date of Reporting Period
Item 1. Reports to Stockholders

Eaton Vance
High Yield Municipal Income Fund
Annual Report
January 31, 2022

Commodity Futures Trading Commission Registration. The Commodity Futures Trading Commission (“CFTC”) has adopted regulations that subject registered investment companies and advisers to regulation by the CFTC if a fund invests more than a prescribed level of its assets in certain CFTC-regulated instruments (including futures, certain options and swap agreements) or markets itself as providing investment exposure to such instruments. The investment adviser has claimed an exclusion from the definition of “commodity pool operator” under the Commodity Exchange Act with respect to its management of the Fund. Accordingly, neither the Fund nor the adviser with respect to the operation of the Fund is subject to CFTC regulation. Because of its management of other strategies, the Fund’s adviser is registered with the CFTC as a commodity pool operator. The adviser is also registered as a commodity trading advisor.
Fund shares are not insured by the FDIC and are not deposits or other obligations of, or guaranteed by, any depository institution. Shares are subject to investment risks, including possible loss of principal invested.
This report must be preceded or accompanied by a current summary prospectus or prospectus. Before investing, investors should consider carefully the investment objective, risks, and charges and expenses of a mutual fund. This and other important information is contained in the summary prospectus and prospectus, which can be obtained from a financial intermediary. Prospective investors should read the prospectus carefully before investing. For further information, please call 1-800-262-1122.
Annual Report January 31, 2022
Eaton Vance
High Yield Municipal Income Fund
Eaton Vance
High Yield Municipal Income Fund
January 31, 2022
Management’s Discussion of Fund Performance1
Economic and Market Conditions
As the 12-month period began on February 1, 2021, municipal bonds were at the tail end of a bond rally that had begun in November 2020. From mid-February through June 2021, the bond market reversed course. Yields on municipal bonds and U.S. Treasurys rose and prices declined in anticipation of rising economic growth, driven by a federal government infusion of stimulus financing and progress on COVID-19 vaccinations. In late spring-early summer, high year-over-year inflation also raised investor concerns, putting further upward pressure on interest rates.
By July, however, the emergence of a more contagious Delta variant of COVID-19 threatened the U.S. economic rebound and diminished inflation concerns. Investors again turned to U.S. Treasurys and municipal bonds as relatively safe-haven assets, leading bond prices to rise and interest rates to fall in July.
From August through October, bond prices declined again due, in part, to anticipation that the U.S. Federal Reserve (the Fed) would begin tapering monthly bond purchases, which had helped hold interest rates down through much of the pandemic.
In the closing months of 2021, the Fed confirmed that tapering would begin in November and accelerate in the months to come. The reduction of monetary stimulus put upward pressure on shorter term interest rates, as did passage of President Biden’s $1 trillion infrastructure bill. As the Fed issued more hawkish monetary statements, U.S. Treasury rates rose in December against the backdrop of inflationary concerns and potential interest rate hikes. Municipal bond rates, however, were nearly unchanged during the month.
But as the new year began, municipal investors appeared to reevaluate the twin threats of inflation and projected rate hikes. The Bloomberg Municipal Bond Index, a broad measure of the municipal bond market, declined 2.74% in January 2022, its worst monthly performance in several years. In the third week of January, municipal bond mutual funds and exchange-traded funds experienced net weekly outflows for only the second time in 87 weeks.
For the period as a whole, the municipal bond yield curve experienced a “bear market flattening” in which interest rates rose across the curve, but more so at the shorter maturity end of the curve. The Bloomberg Municipal Bond Index returned -1.89% during the period. While municipal bonds outperformed U.S. Treasurys at the short end of the yield curve — that is, maturities of 5 years or less — municipals underperformed U.S. Treasurys in the middle and long end of the curve — maturities of about 10 years and 30 years, respectively.
Fund Performance
For the 12-month period ended January 31, 2022, Eaton Vance High Yield Municipal Income Fund (the Fund) returned -0.02% for Class A shares at net asset value (NAV), outperforming its benchmark, the Bloomberg Municipal Bond Index (the Index), which returned -1.89%.
The Fund invests primarily in high yield municipal obligations — defined as securities rated BBB and below. The Index, reflecting the broad municipal market, had a significantly smaller weight in BBB rated and below-investment-grade issues than the Fund during the period.
For the period as a whole, the municipal high yield asset class delivered positive performance while the municipal investment-grade asset class posted negative returns. The bulk of high yield’s outperformance occurred during the first half of the period as high yield spreads — the difference between high yield and investment-grade interest rates — compressed significantly after widening dramatically early in the pandemic.
Despite a “bear market flattening” of the municipal yield curve — in which interest rates rose across the curve, but more so at the shorter-maturity end of the curve — spread compression enabled high yield issues to post positive performance during the period. Demand for high yield bonds was strong during most of the period, buoyed by a global economic recovery; investors’ search for yield in a historically low-yield environment; and Congress’ passage of a $1.9 trillion pandemic relief bill in March 2021, which bolstered the budgets of many municipal bond issuers.
During the period, contributors to Fund performance versus the Index included an overweight position relative to the Index in bonds rated BBB and below; security selections and an overweight position in the health care sector; and the Fund’s hedging strategy, which used U.S. Treasury futures to mitigate interest rate volatility. As a risk-management tactic within the Fund’s overall strategy, interest rate hedging is intended to moderate performance in both up and down markets. During a period when interest rates rose, the Fund’s hedging strategy mitigated some of the negative effect of rising rates and, thus, contributed to Fund performance relative to the unhedged Index.
In contrast, detractors from Fund performance relative to the Index included the Fund’s use of leverage and an overweight position in bonds with coupons of 4% or less.
See Endnotes and Additional Disclosures in this report.
Past performance is no guarantee of future results. Returns are historical and are calculated by determining the percentage change in net asset value (NAV) or offering price (as applicable) with all distributions reinvested. Investment return and principal value will fluctuate so that shares, when redeemed, may be worth more or less than their original cost. Performance for periods less than or equal to one year is cumulative. Performance is for the stated time period only; due to market volatility, current Fund performance may be lower or higher than the quoted return. For performance as of the most recent month-end, please refer to eatonvance.com.
Eaton Vance
High Yield Municipal Income Fund
January 31, 2022
Performance2,3
Portfolio Manager(s) Cynthia J. Clemson and William J. Delahunty, CFA
| | | | | | | | | | | | | | | | | | | | | | | | |
| % Average Annual Total Returns | | | | | Class
Inception Date | | | Performance
Inception Date | | | One Year | | | Five Years | | | Ten Years | |
| | | | | | |
Class A at NAV | | | | | | | 08/07/1995 | | | | 08/07/1995 | | | | –0.02 | % | | | 4.69 | % | | | 5.04 | % |
Class A with 4.75% Maximum Sales Charge | | | | — | | | | — | | | | –4.80 | | | | 3.68 | | | | 4.53 | |
Class C at NAV | | | | | | | 06/18/1997 | | | | 08/07/1995 | | | | –0.78 | | | | 3.90 | | | | 4.42 | |
Class C with 1% Maximum Sales Charge | | | | | | | — | | | | — | | | | –1.75 | | | | 3.90 | | | | 4.42 | |
Class I at NAV | | | | | | | 05/09/2007 | | | | 08/07/1995 | | | | 0.24 | | | | 4.95 | | | | 5.30 | |
Class W at NAV | | | | | | | 10/01/2021 | | | | 08/07/1995 | | | | 0.35 | | | | 4.97 | | | | 5.31 | |
|
| |
| | | | | | |
Bloomberg Municipal Bond Index | | | | | | | — | | | | — | | | | –1.89 | % | | | 3.46 | % | | | 3.20 | % |
| | | | | | |
| % Total Annual Operating Expense Ratios4 | | | | | | | | Class A | | | Class C | | | Class I | | | Class W | |
| | | | | | |
Gross | | | | | | | | | | | 0.82 | % | | | 1.57 | % | | | 0.57 | % | | | 0.57 | % |
Net | | | | | | | | | | | 0.82 | | | | 1.57 | | | | 0.57 | | | | 0.16 | |
| | | | | | |
| % Distribution Rates/Yields5 | | | | | | | | Class A | | | Class C | | | Class I | | | Class W | |
| | | | | | |
Distribution Rate | | | | | | | | | | | 2.94 | % | | | 2.17 | % | | | 3.19 | % | | | 3.61 | % |
Taxable-Equivalent Distribution Rate | | | | | | | | | | | 4.96 | | | | 3.67 | | | | 5.39 | | | | 6.10 | |
SEC 30-day Yield | | | | | | | | | | | 1.34 | | | | 0.65 | | | | 1.66 | | | | 2.08 | |
Taxable-Equivalent SEC 30-day Yield | | | | | | | | | | | 2.27 | | | | 1.10 | | | | 2.81 | | | | 3.52 | |
| | | | | | |
| % Total Leverage6 | | | | | | | | | | | | | | | | | | |
| | | | | | |
Residual Interest Bond (RIB) Financing | | | | | | | | | | | | | | | | | | | | | | | 4.60 | % |
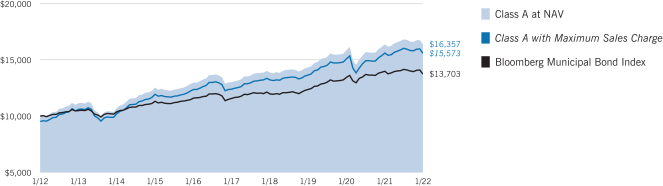
Growth of $10,000
This graph shows the change in value of a hypothetical investment of $10,000 in Class A of the Fund for the period indicated. For comparison, the same investment is shown in the indicated index.
| | | | | | | | | | | | | | | | |
| Growth of Investment3 | | Amount Invested | | | Period Beginning | | | At NAV | | | With Maximum Sales Charge | |
| | | | |
Class C | | | $10,000 | | | | 01/31/2012 | | | | $15,412 | | | | N.A. | |
Class I | | | $250,000 | | | | 01/31/2012 | | | | $419,154 | | | | N.A. | |
Class W | | | $10,000 | | | | 01/31/2012 | | | | $16,785 | | | | N.A. | |
See Endnotes and Additional Disclosures in this report.
Past performance is no guarantee of future results. Returns are historical and are calculated by determining the percentage change in net asset value (NAV) or offering price (as applicable) with all distributions reinvested. Investment return and principal value will fluctuate so that shares, when redeemed, may be worth more or less than their original cost. Performance for periods less than or equal to one year is cumulative. Performance is for the stated time period only; due to market volatility, current Fund performance may be lower or higher than the quoted return. For performance as of the most recent month-end, please refer to eatonvance.com.
Eaton Vance
High Yield Municipal Income Fund
January 31, 2022
Fund Profile
Credit Quality (% of total investments)7,8
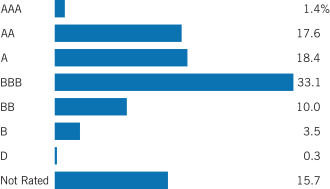
See Endnotes and Additional Disclosures in this report.
Eaton Vance
High Yield Municipal Income Fund
January 31, 2022
Endnotes and Additional Disclosures
| 1 | The views expressed in this report are those of the portfolio manager(s) and are current only through the date stated at the top of this page. These views are subject to change at any time based upon market or other conditions, and Eaton Vance and the Fund(s) disclaim any responsibility to update such views. These views may not be relied upon as investment advice and, because investment decisions are based on many factors, may not be relied upon as an indication of trading intent on behalf of any Eaton Vance fund. This commentary may contain statements that are not historical facts, referred to as “forward-looking statements.” The Fund’s actual future results may differ significantly from those stated in any forward-looking statement, depending on factors such as changes in securities or financial markets or general economic conditions, the volume of sales and purchases of Fund shares, the continuation of investment advisory, administrative and service contracts, and other risks discussed from time to time in the Fund’s filings with the Securities and Exchange Commission. |
| 2 | Bloomberg Municipal Bond Index is an unmanaged index of municipal bonds traded in the U.S. Unless otherwise stated, index returns do not reflect the effect of any applicable sales charges, commissions, expenses, taxes or leverage, as applicable. It is not possible to invest directly in an index. |
| 3 | Total Returns at NAV do not include applicable sales charges. If sales charges were deducted, the returns would be lower. Total Returns shown with maximum sales charge reflect the stated maximum sales charge. Unless otherwise stated, performance does not reflect the deduction of taxes on Fund distributions or redemptions of Fund shares. |
Effective November 5, 2020, Class C shares automatically convert to Class A shares eight years after purchase. The average annual total returns listed for Class C reflect conversion to Class A shares after eight years. Prior to November 5, 2020, Class C shares automatically converted to Class A shares ten years after purchase.
Performance prior to the inception date of a class may be linked to the performance of an older class of the Fund. This linked performance is adjusted for any applicable sales charge, but is not adjusted for class expense differences. If adjusted for such differences, the performance would be different. The performance of Class W is linked to Class I. Performance presented in the Financial Highlights included in the financial statements is not linked.
| 4 | Source: Fund prospectus. Net expense ratio for Class W reflects a contractual expense reimbursement of investment advisory fees that continues through 9/30/24. The expense ratios for the current reporting period can be found in the Financial Highlights section of this report. Performance reflects expenses waived and/or reimbursed, if applicable. Without such waivers and/or reimbursements, performance would have been lower. |
| 5 | The Distribution Rate is based on the Fund’s last regular distribution per share in the period (annualized) divided by the Fund’s NAV at the end of the period. The Fund’s distributions may be comprised of amounts characterized for federal income tax purposes as tax-exempt income, qualified and non-qualified ordinary dividends, capital gains and nondividend distributions, also known as return of capital. The Fund will determine the federal income tax character of distributions |
| | paid to a shareholder after the end of the calendar year. This is reported on the IRS form 1099-DIV and provided to the shareholder shortly after each year-end. The Fund’s distributions are determined by the investment adviser based on its current assessment of the Fund’s long-term return potential. As portfolio and market conditions change, the rate of distributions paid by the Fund could change. Taxable- equivalent performance is based on the highest combined federal and state income tax rates, where applicable. Lower tax rates would result in lower tax-equivalent performance. Actual tax rates will vary depending on your income, exemptions and deductions. Rates do not include local taxes. The SEC Yield is a standardized measure based on the estimated yield to maturity of a fund’s investments over a 30-day period and is based on the maximum offer price at the date specified. The SEC Yield is not based on the distributions made by the Fund, which may differ. |
| 6 | Fund employs RIB financing. The leverage created by RIB investments provides an opportunity for increased income but, at the same time, creates special risks (including the likelihood of greater volatility of NAV). The cost of leverage rises and falls with changes in short-term interest rates. See “Floating Rate Notes Issued in Conjunction with Securities Held” in the notes to the financial statements for more information about RIB financing. RIB leverage represents the amount of Floating Rate Notes outstanding at period end as a percentage of Fund net assets plus Floating Rate Notes. |
| 7 | For purposes of the Fund’s rating restrictions, ratings are based on Moody’s Investors Service, Inc. (“Moody’s”), S&P Global Ratings (“S&P”) or Fitch Ratings (“Fitch”), as applicable. If securities are rated differently by the ratings agencies, the highest rating is applied. Ratings, which are subject to change, apply to the creditworthiness of the issuers of the underlying securities and not to the Fund or its shares. Credit ratings measure the quality of a bond based on the issuer’s creditworthiness, with ratings ranging from AAA, being the highest, to D, being the lowest based on S&P’s measures. Ratings of BBB or higher by S&P or Fitch (Baa or higher by Moody’s) are considered to be investment-grade quality. Credit ratings are based largely on the ratings agency’s analysis at the time of rating. The rating assigned to any particular security is not necessarily a reflection of the issuer’s current financial condition and does not necessarily reflect its assessment of the volatility of a security’s market value or of the liquidity of an investment in the security. Holdings designated as “Not Rated” (if any) are not rated by the national ratings agencies stated above. |
| 8 | The chart includes the municipal bonds held by a trust that issues residual interest bonds, consistent with the Portfolio of Investments. |
Fund profile subject to change due to active management.
Additional Information
Yield curve is a graphical representation of the yields offered by bonds of various maturities. The yield curve flattens when long-term interest rates fall and/or short-term interest rates increase, and the yield curve steepens when long-term interest rates increase and/or short-term interest rates fall.
Eaton Vance
High Yield Municipal Income Fund
January 31, 2022
Fund Expenses
Example: As a Fund shareholder, you incur two types of costs: (1) transaction costs, including sales charges (loads) on purchases and redemption fees (if applicable); and (2) ongoing costs, including management fees; distribution and/or service fees; and other Fund expenses. This Example is intended to help you understand your ongoing costs (in dollars) of Fund investing and to compare these costs with the ongoing costs of investing in other mutual funds. The actual expense Example is based on an investment of $1,000 invested at the beginning of the period and held for the entire period (August 1, 2021 – January 31, 2022) for Class A, Class C and Class I and (October 1, 2021 – January 31, 2022) for Class W. The hypothetical expense Example is based on an investment of $1,000 invested for the one-half year period (August 1, 2021 – January 31, 2022).
Actual Expenses: The first section of the table below provides information about actual account values and actual expenses. You may use the information in this section, together with the amount you invested, to estimate the expenses that you paid over the period. Simply divide your account value by $1,000 (for example, an $8,600 account value divided by $1,000 = 8.6), then multiply the result by the number in the first section under the heading entitled “Expenses Paid During Period” to estimate the expenses you paid on your account during this period.
Hypothetical Example for Comparison Purposes: The second section of the table below provides information about hypothetical account values and hypothetical expenses based on the actual Fund expense ratio and an assumed rate of return of 5% per year (before expenses), which is not the actual Fund return. The hypothetical account values and expenses may not be used to estimate the actual ending account balance or expenses you paid for the period. You may use this information to compare the ongoing costs of investing in your Fund and other funds. To do so, compare this 5% hypothetical example with the 5% hypothetical examples that appear in the shareholder reports of the other funds.
Please note that the expenses shown in the table are meant to highlight your ongoing costs only and do not reflect any transactional costs, such as sales charges (loads) or redemption fees (if applicable). Therefore, the second section of the table is useful in comparing ongoing costs only, and will not help you determine the relative total costs of owning different funds. In addition, if these transactional costs were included, your costs would be higher.
| | | | | | | | | | | | | | | | |
| | | Beginning
Account Value
(8/1/21) | | | Ending
Account Value
(1/31/22) | | | Expenses Paid
During Period
(8/1/21 – 1/31/22) | | | Annualized
Expense
Ratio | |
| | | | |
Actual* | | | | | | | | | | | | | | | | |
Class A | | $ | 1,000.00 | | | $ | 973.20 | | | $ | 3.78 | | | | 0.76 | % |
Class C | | $ | 1,000.00 | | | $ | 969.60 | | | $ | 7.50 | | | | 1.51 | % |
Class I | | $ | 1,000.00 | | | $ | 974.50 | | | $ | 2.54 | | | | 0.51 | % |
Class W | | $ | 1,000.00 | | | $ | 987.00 | | | $ | 0.30 | ** | | | 0.09 | % |
| | | | | |
Hypothetical*** | | | | | | | | | | | | | | | | |
(5% return per year before expenses) | | | | | | | | | | | | | | | | |
Class A | | $ | 1,000.00 | | | $ | 1,021.37 | | | $ | 3.87 | | | | 0.76 | % |
Class C | | $ | 1,000.00 | | | $ | 1,017.59 | | | $ | 7.68 | | | | 1.51 | % |
Class I | | $ | 1,000.00 | | | $ | 1,022.63 | | | $ | 2.60 | | | | 0.51 | % |
Class W | | $ | 1,000.00 | | | $ | 1,024.75 | | | $ | 0.46 | ** | | | 0.09 | % |
| * | Class W had not commenced operations on August 1, 2021. Actual expenses are equal to the Fund’s annualized expense ratio for the indicated Class, multiplied by the average account value over the period, multiplied by 184/365 (to reflect the one-half year period); 123/365 for Class W (to reflect the period from the commencement of operations on October 1, 2021 to January 31, 2022). The Example assumes that the $1,000 was invested at the net asset value per share determined at the close of business on July 31, 2021 (October 1, 2021 for Class W). |
| ** | Absent a reimbursement of investment advisory fees by an affiliate, the expenses would be higher. |
| *** | Hypothetical expenses are equal to the Fund’s annualized expense ratio for the indicated Class, multiplied by the average account value over the period, multiplied by 184/365 (to reflect the one-half year period). The Example assumes that the $1,000 was invested at the net asset value per share determined at the close of business on July 31, 2021 (October 1, 2021 for Class W). |
Eaton Vance
High Yield Municipal Income Fund
January 31, 2022
Portfolio of Investments
| | | | | | | | |
| Corporate Bonds — 2.8% | |
| Security | | Principal
Amount
(000’s omitted) | | | Value | |
|
| Hospital — 2.1% | |
| | |
Boston Medical Center Corp., 4.581%, 7/1/47 | | $ | 4,165 | | | $ | 4,626,429 | |
| | |
Harnett Health System, Inc., 4.25% to 4/1/25 (Put Date), 4/1/32 | | | 5,715 | | | | 5,586,412 | |
| | |
Montefiore Obligated Group, 4.287%, 9/1/50 | | | 8,915 | | | | 8,491,492 | |
| | |
Tower Health, 4.451%, 2/1/50 | | | 15,405 | | | | 13,537,144 | |
| | |
| | | | | | | $ | 32,241,477 | |
|
| Other — 0.6% | |
| | |
Morongo Band of Mission Indians, 7.00%, 10/1/39(1) | | $ | 7,980 | | | $ | 10,284,784 | |
| | |
| | | | | | | $ | 10,284,784 | |
|
| Other Revenue — 0.1% | |
| | |
YMCA of Greater New York, 2.303%, 8/1/26 | | $ | 1,055 | | | $ | 1,031,482 | |
| | |
| | | | | | | $ | 1,031,482 | |
| |
Total Corporate Bonds — 2.8%
(identified cost $41,299,253) | | | $ | 43,557,743 | |
|
| Tax-Exempt Municipal Obligations — 93.6% | |
| Security | | Principal
Amount
(000’s omitted) | | | Value | |
|
| Cogeneration — 0.0%(2) | |
| | |
Northampton County Industrial Development Authority, PA, (Northampton Generating), (AMT), 5.00%, 12/31/23(3) | | $ | 567 | | | $ | 141,797 | |
| | |
| | | | | | | $ | 141,797 | |
|
| Education — 4.8% | |
| | |
Arizona Industrial Development Authority, (Doral Academy of Nevada), 5.00%, 7/15/39(1) | | $ | 1,270 | | | $ | 1,437,805 | |
| | |
Arizona Industrial Development Authority, (Pinecrest Academy of Nevada), 4.00%, 7/15/50(1) | | | 925 | | | | 963,434 | |
| | |
Arizona Industrial Development Authority, (Somerset Academy of Las Vegas), 4.00%, 12/15/51(1) | | | 800 | | | | 834,552 | |
| | |
Build NYC Resource Corp., NY, (New World Preparatory
Charter School): | | | | | | |
| | |
4.00%, 6/15/51 | | | 160 | | | | 168,562 | |
| | |
4.00%, 6/15/56 | | | 125 | | | | 130,970 | |
| | |
Capital Trust Agency, FL, (Florida Charter Educational
Foundation, Inc.): | | | | | | |
| | |
5.375%, 6/15/38(1) | | | 545 | | | | 596,677 | |
| | |
5.375%, 6/15/48(1) | | | 1,020 | | | | 1,099,897 | |
| | | | | | | | |
| Security | | Principal
Amount
(000’s omitted) | | | Value | |
|
| Education (continued) | |
| | |
Capital Trust Agency, FL, (Liza Jackson Preparatory School, Inc.), 5.00%, 8/1/55 | | $ | 325 | | | $ | 368,452 | |
| | |
Colorado Educational and Cultural Facilities Authority,
(Aspen View Academy): | | | | | | |
| | |
4.00%, 5/1/41 | | | 150 | | | | 161,922 | |
| | |
4.00%, 5/1/51 | | | 500 | | | | 533,710 | |
| | |
District of Columbia, (District of Columbia International
School): | | | | | | |
| | |
5.00%, 7/1/39 | | | 710 | | | | 830,693 | |
| | |
5.00%, 7/1/49 | | | 700 | | | | 807,184 | |
| | |
| District of Columbia, (KIPP DC): | | | | | | |
| | |
4.00%, 7/1/39 | | | 280 | | | | 308,140 | |
| | |
4.00%, 7/1/44 | | | 270 | | | | 294,192 | |
| | |
4.00%, 7/1/49 | | | 385 | | | | 416,901 | |
| | |
| District of Columbia, (Rocketship DC Obligated Group): | | | | | | |
| | |
5.00%, 6/1/41(1) | | | 1,190 | | | | 1,348,032 | |
| | |
5.00%, 6/1/49(1) | | | 2,100 | | | | 2,290,239 | |
| | |
5.00%, 6/1/61(1) | | | 1,175 | | | | 1,307,293 | |
| | |
Erie Higher Education Building Authority, PA, (Gannon University), 5.00%, 5/1/47 | | | 475 | | | | 566,195 | |
| | |
Florida Development Finance Corp., (Drs. Kiran & Pallavi Patel 2017 Foundation for Global Understanding, Inc.), 4.00%, 7/1/51(1) | | | 1,000 | | | | 1,046,670 | |
| | |
Florida Development Finance Corp., (River City Science Academy Project), 4.00%, 7/1/55 | | | 750 | | | | 787,140 | |
| | |
Florida Higher Educational Facilities Financing Authority, (Jacksonville University), 5.00%, 6/1/48(1) | | | 750 | | | | 834,037 | |
| | |
Forest Grove, OR, (Pacific University), Prerefunded to 5/1/22, 5.00%, 5/1/40 | | | 1,070 | | | | 1,081,749 | |
| | |
| Indiana Finance Authority, (KIPP Indianapolis, Inc.): | | | | | | |
| | |
5.00%, 7/1/40 | | | 170 | | | | 188,651 | |
| | |
5.00%, 7/1/55 | | | 460 | | | | 503,189 | |
| | |
| Indiana Finance Authority, (Valparaiso University): | | | | | | |
| | |
4.00%, 10/1/34 | | | 500 | | | | 562,045 | |
| | |
4.00%, 10/1/35 | | | 650 | | | | 729,690 | |
| | |
| Kentucky Bond Development Corp., (Centre College): | | | | | | |
| | |
4.00%, 6/1/46 | | | 800 | | | | 900,792 | |
| | |
4.00%, 6/1/51 | | | 1,250 | | | | 1,401,475 | |
| | |
Kentucky Bond Development Corp., (Transylvania
University): | | | | | | |
| | |
4.00%, 3/1/46 | | | 2,805 | | | | 3,083,312 | |
| | |
4.00%, 3/1/49 | | | 705 | | | | 772,934 | |
| | |
| Los Ranchos de Albuquerque, NM, (Albuquerque Academy): | | | | | | |
| | |
4.00%, 9/1/35 | | | 300 | | | | 336,312 | |
| | |
4.00%, 9/1/40 | | | 1,200 | | | | 1,336,344 | |
| | |
Louisiana Public Facilities Authority, (Loyola University), 4.00%, 10/1/51 | | | 1,170 | | | | 1,284,660 | |
| | | | |
| | 7 | | See Notes to Financial Statements. |
Eaton Vance
High Yield Municipal Income Fund
January 31, 2022
Portfolio of Investments — continued
| | | | | | | | |
| Security | | Principal
Amount
(000’s omitted) | | | Value | |
|
| Education (continued) | |
| | |
Maricopa County Industrial Development Authority, AZ, (Arizona Autism Charter Schools), 4.00%, 7/1/61(1) | | $ | 2,600 | | | $ | 2,715,284 | |
| | |
Maricopa County Industrial Development Authority, AZ,
(Legacy Traditional Schools): | | | | | | |
| | |
4.00%, 7/1/51(1) | | | 1,650 | | | | 1,768,998 | |
| | |
4.00%, 7/1/56(1) | | | 1,220 | | | | 1,295,701 | |
| | |
Massachusetts Development Finance Agency, (Wentworth Institute of Technology), 5.00%, 10/1/46 | | | 4,000 | | | | 4,467,600 | |
| | |
Michigan State University, 5.00%, 2/15/44 | | | 1,000 | | | | 1,198,890 | |
| | |
Oregon Facilities Authority, (University of Portland), 5.00%, 4/1/35 | | | 1,000 | | | | 1,108,280 | |
| | |
Public Finance Authority, WI, (Coral Academy of Science Las Vegas), 4.00%, 7/1/51 | | | 2,000 | | | | 2,113,840 | |
| | |
Public Finance Authority, WI, (North Carolina Leadership
Academy): | | | | | | |
| | |
4.00%, 6/15/29(1) | | | 300 | | | | 318,666 | |
| | |
5.00%, 6/15/39(1) | | | 205 | | | | 222,628 | |
| | |
5.00%, 6/15/49(1) | | | 260 | | | | 279,812 | |
| | |
Public Finance Authority, WI, (Roseman University of Health
Sciences): | | | | | | |
| | |
4.00%, 4/1/52(1)(4) | | | 1,000 | | | | 1,033,490 | |
| | |
5.00%, 4/1/40(1) | | | 840 | | | | 955,601 | |
| | |
5.00%, 4/1/50(1) | | | 2,510 | | | | 2,822,620 | |
| | |
5.50%, 4/1/32 | | | 170 | | | | 171,430 | |
| | |
5.75%, 4/1/42 | | | 2,045 | | | | 2,063,037 | |
| | |
| Romeoville, IL, (Lewis University): | | | | | | |
| | |
5.00%, 10/1/27 | | | 1,000 | | | | 1,095,430 | |
| | |
5.00%, 10/1/29 | | | 1,000 | | | | 1,089,390 | |
| | |
5.00%, 10/1/30 | | | 1,000 | | | | 1,087,060 | |
| | |
5.00%, 10/1/35 | | | 2,000 | | | | 2,167,020 | |
| | |
San Antonio Education Facilities Corp., TX, (University of the Incarnate Word), 4.00%, 4/1/54 | | | 2,000 | | | | 2,153,960 | |
| | |
University of California, 5.00%, 5/15/38(5) | | | 10,000 | | | | 10,508,400 | |
| | |
Waco Education Finance Corp., TX, (Baylor University), 5.00%, 3/1/35 | | | 1,260 | | | | 1,554,260 | |
| | |
Wisconsin Health and Educational Facilities Authority,
(Hmong American Peace Academy, Ltd.): | | | | | | |
| | |
4.00%, 3/15/40 | | | 750 | | | | 824,145 | |
| | |
5.00%, 3/15/50 | | | 2,345 | | | | 2,714,478 | |
| | |
| | | | | | | $ | 75,043,870 | |
|
| Electric Utilities — 2.8% | |
| | |
| Arkansas River Power Authority, CO: | | | | | | |
| | |
5.00%, 10/1/31 | | $ | 1,500 | | | $ | 1,748,580 | |
| | |
5.00%, 10/1/32 | | | 1,500 | | | | 1,745,895 | |
| | |
5.00%, 10/1/38 | | | 9,325 | | | | 10,756,294 | |
| | | | | | | | |
| Security | | Principal
Amount
(000’s omitted) | | | Value | |
|
| Electric Utilities (continued) | |
| | |
| Arkansas River Power Authority, CO: (continued) | | | | | | |
| | |
5.00%, 10/1/43 | | $ | 2,250 | | | $ | 2,575,822 | |
| | |
Burke County Development Authority, GA, (Oglethorpe Power Corp.), 4.125%, 11/1/45 | | | 15,890 | | | | 17,555,749 | |
| | |
Hawaii Department of Budget and Finance, (Hawaiian Electric Co.), (AMT), 4.00%, 3/1/37 | | | 7,500 | | | | 8,111,700 | |
| | |
Long Island Power Authority, NY, Electric System Revenue, 5.00%, 9/1/38 | | | 1,420 | | | | 1,773,907 | |
| | |
| | | | | | | $ | 44,267,947 | |
|
| Escrowed / Prerefunded — 3.7% | |
| | |
| Build NYC Resource Corp., NY, (YMCA of Greater New York): | | | | | | |
| | |
Prerefunded to 8/1/25, 4.00%, 8/1/31 | | $ | 650 | | | $ | 709,930 | |
| | |
Prerefunded to 8/1/25, 4.00%, 8/1/36 | | | 875 | | | | 955,675 | |
| | |
Central Texas Regional Mobility Authority, Prerefunded to 7/1/25, 5.00%, 1/1/35 | | | 1,100 | | | | 1,238,743 | |
| | |
Colorado Health Facilities Authority, (Covenant Retirement Communities, Inc.), Prerefunded to 12/1/22, 5.00%, 12/1/33 | | | 5,000 | | | | 5,183,450 | |
| | |
Dawson Ridge Metropolitan District No. 1, CO, Escrowed to Maturity, 0.00%, 10/1/22 | | | 3,500 | | | | 3,485,370 | |
| | |
| Detroit, MI, Sewage Disposal System: | | | | | | |
| | |
Prerefunded to 7/1/22, 5.00%, 7/1/32 | | | 3,185 | | | | 3,245,356 | |
| | |
Prerefunded to 7/1/22, 5.25%, 7/1/39 | | | 3,355 | | | | 3,422,066 | |
| | |
East Hempfield Township Industrial Development Authority,
PA, (Student Services, Inc.): | | | | | | |
| | |
Prerefunded to 7/1/24, 5.00%, 7/1/34 | | | 750 | | | | 818,985 | |
| | |
Prerefunded to 7/1/24, 5.00%, 7/1/39 | | | 1,250 | | | | 1,364,975 | |
| | |
Illinois Finance Authority, (Plymouth Place, Inc.), Prerefunded to 5/15/25, 5.00%, 5/15/37 | | | 1,000 | | | | 1,116,250 | |
| | |
Martin County Health Facilities Authority, FL, (Martin Memorial Medical Center), Prerefunded to 11/15/24, 4.25%, 11/15/41 | | | 3,940 | | | | 4,277,894 | |
| | |
Michigan Finance Authority, (Detroit Water and Sewerage Department), Prerefunded to 7/1/22, 5.00%, 7/1/44 | | | 1,905 | | | | 1,941,100 | |
| | |
New Hope Cultural Education Facilities Finance Corp., TX, (CHF-Collegiate Housing Galveston I, LLC - Texas A&M University), Prerefunded to 4/1/24, 5.00%, 4/1/34 | | | 3,885 | | | | 4,208,271 | |
| | |
New Hope Cultural Education Facilities Finance Corp., TX,
(CHF-Collegiate Housing Stephenville III, LLC - Tarleton
State University): | | | | | | |
| | |
Prerefunded to 4/1/25, 5.00%, 4/1/30 | | | 800 | | | | 895,128 | |
| | |
Prerefunded to 4/1/25, 5.00%, 4/1/35 | | | 1,000 | | | | 1,118,910 | |
| | |
Palm Beach County Health Facilities Authority, FL, (BRRH Corp. Obligated Group), Prerefunded to 12/1/24, 5.00%, 12/1/31 | | | 6,250 | | | | 6,922,875 | |
| | |
San Joaquin Hills Transportation Corridor Agency, CA, Prerefunded to 1/15/25, 5.00%, 1/15/44 | | | 10,000 | | | | 11,141,100 | |
| | | | |
| | 8 | | See Notes to Financial Statements. |
Eaton Vance
High Yield Municipal Income Fund
January 31, 2022
Portfolio of Investments — continued
| | | | | | | | |
| Security | | Principal
Amount
(000’s omitted) | | | Value | |
|
| Escrowed / Prerefunded (continued) | |
| | |
Savannah Economic Development Authority, GA, (Marshes Skidaway Island Project), Prerefunded to 1/1/24, 7.00%, 1/1/34 | | $ | 3,000 | | | $ | 3,328,860 | |
| | |
Southwestern Illinois Development Authority, (Memorial Group, Inc.), Prerefunded to 11/1/23, 7.25%, 11/1/33 | | | 1,455 | | | | 1,611,049 | |
| | |
| | | | | | | $ | 56,985,987 | |
|
| General Obligations — 5.8% | |
| | |
Centennial Independent School District No. 12, Circle
Pines, MN: | | | | | | |
| | |
0.00%, 2/1/31 | | $ | 1,225 | | | $ | 944,463 | |
| | |
0.00%, 2/1/33 | | | 1,500 | | | | 1,057,980 | |
| | |
| Chicago Board of Education, IL: | | | | | | |
| | |
5.00%, 12/1/26 | | | 1,595 | | | | 1,816,418 | |
| | |
5.00%, 12/1/40 | | | 3,000 | | | | 3,484,020 | |
| | |
5.00%, 12/1/42 | | | 1,820 | | | | 1,863,771 | |
| | |
Chicago, IL, 5.00%, 1/1/40 | | | 2,000 | | | | 2,296,240 | |
| | |
| Detroit, MI: | | | | | | |
| | |
5.00%, 4/1/30 | | | 1,400 | | | | 1,607,480 | |
| | |
5.00%, 4/1/31 | | | 865 | | | | 990,226 | |
| | |
5.50%, 4/1/31 | | | 565 | | | | 691,588 | |
| | |
5.50%, 4/1/32 | | | 595 | | | | 726,745 | |
| | |
5.50%, 4/1/35 | | | 350 | | | | 426,423 | |
| | |
5.50%, 4/1/45 | | | 1,930 | | | | 2,316,154 | |
| | |
5.50%, 4/1/50 | | | 2,320 | | | | 2,769,500 | |
| | |
| Illinois: | | | | | | |
| | |
4.00%, 6/1/33 | | | 4,000 | | | | 4,287,000 | |
| | |
4.00%, 11/1/40 | | | 4,000 | | | | 4,323,200 | |
| | |
5.00%, 11/1/30 | | | 7,200 | | | | 8,218,944 | |
| | |
5.00%, 5/1/33 | | | 9,480 | | | | 10,963,715 | |
| | |
5.00%, 5/1/35 | | | 3,500 | | | | 3,755,570 | |
| | |
5.00%, 12/1/42 | | | 8,125 | | | | 9,220,656 | |
| | |
5.25%, 7/1/30 | | | 2,800 | | | | 2,961,308 | |
| | |
5.50%, 5/1/39 | | | 1,085 | | | | 1,321,975 | |
| | |
5.75%, 5/1/45 | | | 1,115 | | | | 1,364,749 | |
| | |
New Jersey, 4.00%, 6/1/31 | | | 3,000 | | | | 3,483,270 | |
| | |
| Puerto Rico: | | | | | | |
| | |
5.75%, 7/1/41(6) | | | 3,555 | | | | 3,492,787 | |
| | |
8.00%, 7/1/35(6) | | | 11,360 | | | | 10,242,275 | |
| | |
Sherwood School District No. 88J, OR, 0.00%, 6/15/37 | | | 3,630 | | | | 2,085,798 | |
| | |
Will and Cook Counties Community High School District
No. 210, IL: | | | | | | |
| | |
0.00%, 1/1/27 | | | 60 | | | | 53,008 | |
| | |
3.375%, 1/1/33 | | | 450 | | | | 455,729 | |
| | |
5.00%, 1/1/28 | | | 3,500 | | | | 3,611,615 | |
| | |
| | | | | | | $ | 90,832,607 | |
| | | | | | | | |
| Security | | Principal
Amount
(000’s omitted) | | | Value | |
|
| Hospital — 11.4% | |
| | |
Arkansas Development Finance Authority, (Washington Regional Medical Center), 5.00%, 2/1/33 | | $ | 2,200 | | | $ | 2,397,670 | |
| | |
Arlington County Industrial Development Authority, VA,
(Virginia Hospital Center): | | | | | | |
| | |
4.00%, 7/1/40 | | | 2,125 | | | | 2,422,734 | |
| | |
4.00%, 7/1/45 | | | 3,000 | | | | 3,388,860 | |
| | |
Berks County Industrial Development Authority, PA,
(Tower Health): | | | | | | |
| | |
5.00%, 11/1/47 | | | 510 | | | | 541,967 | |
| | |
5.00%, 11/1/50 | | | 5,000 | | | | 5,297,500 | |
| | |
California Municipal Finance Authority, (NorthBay
Healthcare Group): | | | | | | |
| | |
5.00%, 11/1/35 | | | 250 | | | | 269,313 | |
| | |
5.00%, 11/1/40 | | | 550 | | | | 591,288 | |
| | |
5.00%, 11/1/44 | | | 500 | | | | 536,135 | |
| | |
California Public Finance Authority, (Henry Mayo Newhall Hospital), 5.00%, 10/15/37 | | | 1,000 | | | | 1,143,650 | |
| | |
California Statewide Communities Development Authority, (Methodist Hospital of Southern California), 5.00%, 1/1/48 | | | 2,400 | | | | 2,766,432 | |
| | |
Camden County Improvement Authority, NJ, (Cooper Health
System): | | | | | | |
| | |
5.00%, 2/15/29 | | | 1,000 | | | | 1,070,690 | |
| | |
5.00%, 2/15/32 | | | 2,000 | | | | 2,136,700 | |
| | |
Chattanooga Health, Educational and Housing Facility Board, TN, (CommonSpirit Health), 4.00%, 8/1/44 | | | 1,655 | | | | 1,809,544 | |
| | |
Colorado Health Facilities Authority, (Boulder
Community Health): | | | | | | |
| | |
4.00%, 10/1/38 | | | 300 | | | | 336,696 | |
| | |
4.00%, 10/1/39 | | | 300 | | | | 336,195 | |
| | |
4.00%, 10/1/40 | | | 300 | | | | 335,619 | |
| | |
Colorado Health Facilities Authority, (Parkview Medical Center, Inc.), (PSF Guaranteed), 4.00%, 9/1/45 | | | 1,000 | | | | 1,126,130 | |
| | |
Connecticut Health and Educational Facilities Authority,
(Stamford Hospital): | | | | | | |
| | |
4.00%, 7/1/42(4) | | | 1,750 | | | | 1,913,537 | |
| | |
5.00%, 7/1/34(4) | | | 3,100 | | | | 3,822,207 | |
| | |
Crawford County Hospital Authority, PA, (Meadville Medical Center), 6.00%, 6/1/46 | | | 3,175 | | | | 3,485,991 | |
| | |
| Cuyahoga County, OH, (The MetroHealth System): | | | | | | |
| | |
5.00%, 2/15/31 | | | 1,500 | | | | 1,731,675 | |
| | |
5.00%, 2/15/32 | | | 1,500 | | | | 1,728,915 | |
| | |
| Decatur Hospital Authority, TX, (Wise Health System): | | | | | | |
| | |
4.00%, 9/1/34 | | | 1,604 | | | | 1,785,942 | |
| | |
4.00%, 9/1/44 | | | 9,039 | | | | 9,865,345 | |
| | |
Douglas County Hospital Authority No. 2, NE, (Children’s Hospital Obligated Group), 4.00%, 11/15/50 | | | 1,300 | | | | 1,458,886 | |
| | | | |
| | 9 | | See Notes to Financial Statements. |
Eaton Vance
High Yield Municipal Income Fund
January 31, 2022
Portfolio of Investments — continued
| | | | | | | | |
| Security | | Principal
Amount
(000’s omitted) | | | Value | |
|
| Hospital (continued) | |
| | |
Doylestown Hospital Authority, PA, (Doylestown Health), 4.00%, 7/1/45 | | $ | 315 | | | $ | 334,568 | |
| | |
Escambia County Health Facilities Authority, FL, (Baptist Health Care Corp. Obligated Group), 4.00%, 8/15/50 | | | 2,595 | | | | 2,799,201 | |
| | |
| Grand Forks, ND, (Altru Health System): | | | | | | |
| | |
4.00%, 12/1/46 | | | 925 | | | | 1,029,978 | |
| | |
4.00%, 12/1/51 | | | 1,375 | | | | 1,524,215 | |
| | |
Hamilton County, OH, (UC Health), 4.00%, 9/15/50 | | | 4,000 | | | | 4,430,520 | |
| | |
Harris County Cultural Education Facilities Finance Corp., TX, (Texas Children’s Hospital), 3.00%, 10/1/51 | | | 8,400 | | | | 8,312,976 | |
| | |
Illinois Finance Authority, (Presence Health Network), 3.75%, 2/15/34 | | | 2,965 | | | | 3,242,346 | |
| | |
Indiana County Hospital Authority, PA, (Indiana Regional
Medical Center): | | | | | | |
| | |
5.50%, 6/1/29 | | | 710 | | | | 735,468 | |
| | |
6.00%, 6/1/39 | | | 3,805 | | | | 3,953,319 | |
| | |
Jefferson County Civic Facility Development Corp., NY, (Samaritan Medical Center), 5.00%, 11/1/37 | | | 4,385 | | | | 4,938,299 | |
| | |
Maryland Health and Higher Educational Facilities Authority, (Frederick Health System), 4.00%, 7/1/40 | | | 300 | | | | 341,787 | |
| | |
Massachusetts Development Finance Agency, (Atrius Health), 5.00%, 6/1/39 | | | 925 | | | | 1,110,111 | |
| | |
Massachusetts Development Finance Agency, (Wellforce), 5.00%, 7/1/44 | | | 4,000 | | | | 4,669,920 | |
| | |
Minneapolis and St. Paul Housing and Redevelopment Authority, MN, (Allina Health System), (LOC: JPMorgan Chase Bank, N.A.), 0.11%, 11/15/35(7) | | | 5,000 | | | | 5,000,000 | |
| | |
Montana Facility Finance Authority, (Bozeman Deaconess
Health Services Obligated Group): | | | | | | |
| | |
3.00%, 6/1/50 | | | 2,875 | | | | 2,961,164 | |
| | |
4.00%, 6/1/45 | | | 1,500 | | | | 1,701,285 | |
| | |
Montgomery County Higher Education and Health Authority, PA, (Holy Redeemer Health System), 5.00%, 10/1/40 | | | 1,120 | | | | 1,246,202 | |
| | |
Muskingum County, OH, (Genesis HealthCare System Obligated Group), 5.00%, 2/15/33 | | | 2,775 | | | | 2,862,468 | |
| | |
New Jersey Health Care Facilities Financing Authority,
(St. Joseph’s Healthcare System Obligated Group): | | | | | | |
| | |
4.00%, 7/1/48 | | | 6,265 | | | | 6,745,087 | |
| | |
5.00%, 7/1/41 | | | 1,750 | | | | 1,979,530 | |
| | |
New York Dormitory Authority, (Orange Regional Medical
Center): | | | | | | |
| | |
5.00%, 12/1/32(1) | | | 1,000 | | | | 1,158,040 | |
| | |
5.00%, 12/1/33(1) | | | 2,000 | | | | 2,315,420 | |
| | |
5.00%, 12/1/34(1) | | | 3,900 | | | | 4,510,662 | |
| | |
5.00%, 12/1/35(1) | | | 1,000 | | | | 1,154,680 | |
| | |
5.00%, 12/1/40(1) | | | 2,300 | | | | 2,551,873 | |
| | | | | | | | |
| Security | | Principal
Amount
(000’s omitted) | | | Value | |
|
| Hospital (continued) | |
| | |
| Oklahoma Development Finance Authority, (OU Medicine): | | | | | | |
| | |
5.00%, 8/15/38 | | $ | 1,025 | | | $ | 1,206,620 | |
| | |
5.25%, 8/15/43 | | | 14,865 | | | | 17,733,648 | |
| | |
Oregon Facilities Authority, (Samaritan Health Services), 5.00%, 10/1/40 | | | 875 | | | | 1,053,570 | |
| | |
Palm Beach County Health Facilities Authority, FL, (Baptist Health South Florida Obligated Group), 3.00%, 8/15/44 | | | 1,170 | | | | 1,195,389 | |
| | |
Pima County Industrial Development Authority, AZ, (Tucson
Medical Center): | | | | | | |
| | |
4.00%, 4/1/37 | | | 900 | | | | 1,040,229 | |
| | |
4.00%, 4/1/38 | | | 1,040 | | | | 1,199,630 | |
| | |
4.00%, 4/1/39 | | | 1,400 | | | | 1,612,366 | |
| | |
4.00%, 4/1/40 | | | 1,350 | | | | 1,548,355 | |
| | |
4.00%, 4/1/41 | | | 1,685 | | | | 1,926,629 | |
| | |
Public Finance Authority, WI, (Appalachian Regional
Healthcare System): | | | | | | |
| | |
4.00%, 7/1/46 | | | 500 | | | | 558,790 | |
| | |
4.00%, 7/1/51 | | | 625 | | | | 692,987 | |
| | |
5.00%, 7/1/37 | | | 275 | | | | 339,014 | |
| | |
5.00%, 7/1/38 | | | 375 | | | | 461,411 | |
| | |
Southeastern Ohio Port Authority, (Memorial Health System
Obligated Group): | | | | | | |
| | |
5.00%, 12/1/35 | | | 3,100 | | | | 3,255,558 | |
| | |
5.75%, 12/1/32 | | | 4,050 | | | | 4,153,963 | |
| | |
Tarrant County Cultural Education Facilities Finance Corp., TX, (Cook Children’s Medical Center), 5.25%, 12/1/39(5) | | | 7,000 | | | | 7,503,020 | |
| | |
Ward County, ND, (Trinity Obligated Group), 5.00%, 6/1/38 | | | 2,500 | | | | 2,881,825 | |
| | |
West Virginia Hospital Finance Authority, (West Virginia United Health System Obligated Group), Prerefunded to 6/1/23, 5.375%, 6/1/38 | | | 2,580 | | | | 2,735,755 | |
| | |
Yavapai County Industrial Development Authority, AZ, (Yavapai Regional Medical Center), 5.25%, 8/1/33 | | | 2,500 | | | | 2,651,425 | |
| | |
| | | | | | | $ | 177,658,924 | |
|
| Housing — 1.3% | |
| | |
California Municipal Finance Authority, (CityView Apartments), Sustainability Bonds, 4.00%, 11/1/36(1) | | $ | 5,175 | | | $ | 5,391,212 | |
| | |
CMFA Special Finance Agency, CA, (Solana at Grand), 4.00%, 8/1/56(1) | | | 4,000 | | | | 3,955,640 | |
| | |
CSCDA Community Improvement Authority, CA, Essential Housing Revenue, 2.80%, 3/1/47(1) | | | 900 | | | | 776,601 | |
| | |
Maryland Economic Development Corp., (Morgan State University), Student Housing Revenue, 4.00%, 7/1/40 | | | 1,000 | | | | 1,098,080 | |
| | |
New Hope Cultural Education Facilities Finance Corp., TX, (CHF-Collegiate Housing Galveston I, LLC - Texas A&M University), Prerefunded to 4/1/24, 5.00%, 4/1/39 | | | 3,500 | | | | 3,791,235 | |
| | | | |
| | 10 | | See Notes to Financial Statements. |
Eaton Vance
High Yield Municipal Income Fund
January 31, 2022
Portfolio of Investments — continued
| | | | | | | | |
| Security | | Principal
Amount
(000’s omitted) | | | Value | |
|
| Housing (continued) | |
| | |
Public Finance Authority, WI, (University of Hawaii Foundation), Green and Social Bonds, 4.00%, 7/1/51(1) | | $ | 2,500 | | | $ | 2,640,550 | |
| | |
| Texas Student Housing Corp., (University of North Texas): | | | | | | |
| | |
9.375%, 7/1/06(6) | | | 860 | | | | 860,000 | |
| | |
11.00%, 7/1/31(6) | | | 2,000 | | | | 2,000,000 | |
| | |
| | | | | | | $ | 20,513,318 | |
|
| Industrial Development Revenue — 10.4% | |
| | |
| Arkansas Development Finance Authority, (Big River Steel): | | | | | | |
| | |
(AMT), 4.50%, 9/1/49(1) | | $ | 3,750 | | | $ | 4,049,138 | |
| | |
Green Bonds, (AMT), 4.75%, 9/1/49(1) | | | 4,000 | | | | 4,409,520 | |
| | |
Denver City and County, CO, (United Airlines), (AMT), 5.00%, 10/1/32 | | | 1,890 | | | | 1,975,145 | |
| | |
| Florida Development Finance Corp., (Waste Pro USA, Inc.): | | | | | | |
| | |
(AMT), 5.00%, 5/1/29(1) | | | 795 | | | | 839,719 | |
| | |
(AMT), 5.00% to 8/1/22 (Put Date), 8/1/29(1) | | | 2,250 | | | | 2,279,745 | |
| | |
George L. Smith II Georgia World Congress Center Authority, 4.00%, 1/1/54 | | | 2,145 | | | | 2,332,430 | |
| | |
| Houston, TX, (United Airlines, Inc. Terminal E Project): | | | | | | |
| | |
(AMT), 4.00%, 7/1/41 | | | 3,600 | | | | 3,749,976 | |
| | |
(AMT), 4.75%, 7/1/24 | | | 4,630 | | | | 4,843,165 | |
| | |
| Houston, TX, (United Airlines, Inc.): | | | | | | |
| | |
(AMT), 4.00%, 7/15/41 | | | 415 | | | | 432,376 | |
| | |
(AMT), 5.00%, 7/15/27 | | | 1,750 | | | | 1,988,683 | |
| | |
Jefferson County Port Authority, OH, (JSW Steel USA Ohio, Inc.), (AMT), 3.50%, 12/1/51(1) | | | 5,250 | | | | 5,070,082 | |
| | |
Louisiana Public Facilities Authority, (Cleco Power LLC), 4.25%, 12/1/38 | | | 4,050 | | | | 4,150,156 | |
| | |
Maine Finance Authority, (Casella Waste Systems, Inc.), (AMT), 5.125% to 8/1/25 (Put Date), 8/1/35(1) | | | 1,880 | | | | 2,105,882 | |
| | |
Maricopa County Pollution Control Corp., AZ, (El Paso Electric Co.), 4.50%, 8/1/42 | | | 6,500 | | | | 6,577,155 | |
| | |
Maryland Economic Development Corp., (AFCO Cargo), (AMT), 3.50%, 7/1/24(1) | | | 1,075 | | | | 1,089,341 | |
| | |
Matagorda County Navigation District No. 1, TX, (AEP Texas Central Co.), Series 2008-1, 4.00%, 6/1/30 | | | 1,000 | | | | 1,036,190 | |
| | |
Mississippi Business Finance Corp., (Waste Pro USA, Inc.), (AMT), 5.00% to 8/1/22 (Put Date), 2/1/36(1) | | | 1,500 | | | | 1,519,830 | |
| | |
| National Finance Authority, NH, (Covanta): | | | | | | |
| | |
4.625%, 11/1/42(1) | | | 6,335 | | | | 6,494,008 | |
| | |
(AMT), 4.875%, 11/1/42(1) | | | 6,965 | | | | 7,163,781 | |
| | |
Green Bonds, (AMT), 3.75% to 7/2/40 (Put Date), 7/1/45(1) | | | 11,690 | | | | 12,029,711 | |
| | |
New Hampshire Business Finance Authority, (Casella Waste Systems, Inc.), (AMT), 2.95%, 4/1/29(1) | | | 480 | | | | 500,813 | |
| | | | | | | | |
| Security | | Principal
Amount
(000’s omitted) | | | Value | |
|
| Industrial Development Revenue (continued) | |
| | |
New Jersey Economic Development Authority, (Continental
Airlines): | | | | | | |
| | |
(AMT), 5.25%, 9/15/29 | | $ | 8,285 | | | $ | 8,519,631 | |
| | |
(AMT), 5.50%, 6/1/33 | | | 4,375 | | | | 4,628,531 | |
| | |
(AMT), 5.625%, 11/15/30 | | | 2,045 | | | | 2,210,093 | |
| | |
New Jersey Economic Development Authority, (New Jersey-American Water Co., Inc.), (AMT), 2.20% to 12/3/29 (Put Date), 10/1/39 | | | 5,100 | | | | 5,167,677 | |
| | |
New York State Environmental Facilities Corp., (Casella Waste Systems, Inc.), (AMT), 3.125% to 6/1/26 (Put Date), 12/1/44(1) | | | 5,500 | | | | 5,802,170 | |
| | |
New York Transportation Development Corp., (Delta Air
Lines, Inc. - LaGuardia Airport Terminals C&D
Redevelopment): | | | | | | |
| | |
(AMT), 4.375%, 10/1/45 | | | 19,130 | | | | 21,303,933 | |
| | |
(AMT), 5.00%, 10/1/40 | | | 7,065 | | | | 8,276,365 | |
| | |
Ohio Air Quality Development Authority, (Pratt Paper, LLC), (AMT), 4.25%, 1/15/38(1) | | | 1,000 | | | | 1,114,960 | |
| | |
Pennsylvania Economic Development Financing Authority, (Covanta), Green Bonds, (AMT), 3.25%, 8/1/39(1) | | | 2,200 | | | | 2,217,358 | |
| | |
Phenix City Industrial Development Board, AL, (MeadWestvaco Coated Board), (AMT), 4.125%, 5/15/35 | | | 13,570 | | | | 13,800,826 | |
| | |
Public Finance Authority, WI, (Celanese Corp.), (AMT), 4.30%, 11/1/30 | | | 5,000 | | | | 5,461,600 | |
| | |
Rockdale County Development Authority, GA, (Pratt Paper, LLC), (AMT), 4.00%, 1/1/38(1) | | | 6,290 | | | | 6,921,830 | |
| | |
Vermont Economic Development Authority, (Casella Waste Systems, Inc.), (AMT), 4.625% to 4/3/28 (Put Date), 4/1/36(1) | | | 475 | | | | 542,863 | |
| | |
Virginia Small Business Financing Authority, (Covanta), (AMT), 5.00% to 7/1/38 (Put Date), 1/1/48(1) | | | 1,440 | | | | 1,485,202 | |
| | |
| | | | | | | $ | 162,089,885 | |
|
| Insured – Education — 0.1% | |
| | |
Atlantic County Improvement Authority, NJ, (Stockton University Atlantic City Campus Phase II), (AGM), 4.00%, 7/1/47 | | $ | 750 | | | $ | 850,875 | |
| | |
| | | | | | | $ | 850,875 | |
|
| Insured – Escrowed / Prerefunded — 0.8% | |
| | |
Irvington Township, NJ, (AGM), Prerefunded to 7/15/24, 5.00%, 7/15/32 | | $ | 1,000 | | | $ | 1,092,170 | |
| | |
North Texas Tollway Authority, (AGC), Prerefunded to 1/1/25, 6.20%, 1/1/42 | | | 10,000 | | | | 11,449,700 | |
| | |
| | | | | | | $ | 12,541,870 | |
| | | | |
| | 11 | | See Notes to Financial Statements. |
Eaton Vance
High Yield Municipal Income Fund
January 31, 2022
Portfolio of Investments — continued
| | | | | | | | |
| Security | | Principal
Amount
(000’s omitted) | | | Value | |
|
| Insured – General Obligations — 1.1% | |
| | |
| Atlantic City, NJ: | | | | | | |
| | |
(AGM), 4.00%, 3/1/42 | | $ | 480 | | | $ | 524,059 | |
| | |
(BAM), 5.00%, 3/1/42 | | | 1,250 | | | | 1,439,012 | |
| | |
Chicago Board of Education, IL, (AGM), 5.00%, 12/1/26 | | | 500 | | | | 578,440 | |
| | |
McHenry County Community Unit School District No. 12, IL,
(Johnsburg): | | | | | | |
| | |
(AGM), 5.00%, 1/1/31 | | | 3,175 | | | | 3,399,917 | |
| | |
(AGM), 5.00%, 1/1/32 | | | 1,215 | | | | 1,300,840 | |
| | |
(AGM), 5.00%, 1/1/33 | | | 1,405 | | | | 1,503,701 | |
| | |
(AGM), 5.00%, 7/1/34 | | | 2,810 | | | | 3,006,869 | |
| | |
Proviso Township High School District No. 209, IL, (AGM), 4.00%, 12/1/38 | | | 5,000 | | | | 5,619,800 | |
| | |
| | | | | | | $ | 17,372,638 | |
|
| Insured – Hospital — 0.2% | |
| | |
Grand Forks, ND, (Altru Health System), (AGM), 3.00%, 12/1/51 | | $ | 3,250 | | | $ | 3,141,840 | |
| | |
| | | | | | | $ | 3,141,840 | |
|
| Insured – Housing — 0.0%(2) | |
| | |
California Municipal Finance Authority, (CHF-Davis II, LLC - Orchard Park Student Housing), Green Bonds, (BAM), 3.00%, 5/15/51 | | $ | 400 | | | $ | 404,096 | |
| | |
| | | | | | | $ | 404,096 | |
|
| Insured – Other Revenue — 2.0% | |
| | |
| Harris County-Houston Sports Authority, TX: | | | | | | |
| | |
(AGM), (NPFG), 0.00%, 11/15/34 | | $ | 12,700 | | | $ | 7,575,423 | |
| | |
(NPFG), 0.00%, 11/15/26 | | | 9,395 | | | | 8,155,706 | |
| | |
(NPFG), 0.00%, 11/15/28 | | | 9,600 | | | | 7,707,744 | |
| | |
(NPFG), Escrowed to Maturity, 0.00%, 11/15/26 | | | 1,115 | | | | 1,031,431 | |
| | |
(NPFG), Escrowed to Maturity, 0.00%, 11/15/28 | | | 400 | | | | 352,828 | |
| | |
New York City Industrial Development Agency, NY, (Queens Baseball Stadium), (AGM), 3.00%, 1/1/40 | | | 1,750 | | | | 1,805,492 | |
| | |
New York City Industrial Development Agency, NY, (Yankee
Stadium): | | | | | | |
| | |
(AGC), 0.00%, 3/1/34 | | | 3,500 | | | | 2,586,430 | |
| | |
(AGM), 3.00%, 3/1/38 | | | 1,555 | | | | 1,617,651 | |
| | |
| | | | | | | $ | 30,832,705 | |
|
| Insured – Special Tax Revenue — 1.9% | |
| | |
| Illinois Sports Facilities Authority: | | | | | | |
| | |
(AMBAC), 0.00%, 6/15/25 | | $ | 750 | | | $ | 708,127 | |
| | |
(AMBAC), 0.00%, 6/15/26 | | | 2,380 | | | | 2,195,479 | |
| | | | | | | | |
| Security | | Principal
Amount
(000’s omitted) | | | Value | |
|
| Insured – Special Tax Revenue (continued) | |
| | |
Miami-Dade County, FL, Professional Sports Franchise Facilities, (AGC), 7.00%, 10/1/39 | | $ | 14,500 | | | $ | 20,156,450 | |
| | |
| Tolomato Community Development District, FL: | | | | | | |
| | |
(AGM), 3.75%, 5/1/39 | | | 2,515 | | | | 2,719,042 | |
| | |
(AGM), 3.75%, 5/1/40 | | | 2,985 | | | | 3,222,994 | |
| | |
| | | | | | | $ | 29,002,092 | |
|
| Insured – Transportation — 1.5% | |
| | |
Allegheny County Airport Authority, PA, (Pittsburgh International Airport), (AGM), (AMT), 4.00%, 1/1/46 | | $ | 2,485 | | | $ | 2,741,676 | |
| | |
| Chicago, IL, (O’Hare International Airport): | | | | | | |
| | |
(AGM), 5.25%, 1/1/32 | | | 1,500 | | | | 1,559,610 | |
| | |
(AGM), 5.25%, 1/1/33 | | | 650 | | | | 675,831 | |
| | |
(AGM), 5.50%, 1/1/43 | | | 1,355 | | | | 1,409,633 | |
| | |
E-470 Public Highway Authority, CO, (NPFG), 0.00%, 9/1/37 | | | 6,665 | | | | 3,467,933 | |
| | |
Foothill/Eastern Transportation Corridor Agency, CA, (AGM), 5.625%, (0.00% until 1/15/24), 1/15/32 | | | 1,955 | | | | 2,254,604 | |
| | |
| Ohio, (Portsmouth Gateway Group, LLC): | | | | | | |
| | |
(AGM), (AMT), 5.00%, 12/31/27 | | | 1,150 | | | | 1,275,373 | |
| | |
(AGM), (AMT), 5.00%, 12/31/28 | | | 1,600 | | | | 1,769,392 | |
| | |
Texas Turnpike Authority, (AMBAC), 0.00%, 8/15/30 | | | 9,440 | | | | 7,917,611 | |
| | |
| | | | | | | $ | 23,071,663 | |
|
| Insured – Water and Sewer — 0.5% | |
| | |
| Jefferson County, AL, Sewer Revenue: | | | | | | |
| | |
(AGM), 0.00%, 10/1/27 | | $ | 2,155 | | | $ | 1,736,865 | |
| | |
(AGM), 0.00%, 10/1/28 | | | 3,965 | | | | 2,992,544 | |
| | |
(AGM), 0.00%, 10/1/29 | | | 3,035 | | | | 2,139,827 | |
| | |
(AGM), 0.00%, 10/1/30 | | | 2,580 | | | | 1,695,163 | |
| | |
| | | | | | | $ | 8,564,399 | |
|
| Lease Revenue / Certificates of Participation — 1.5% | |
| | |
Charleston Educational Excellence Financing Corp., SC, (Charleston County School District), Prerefunded to 12/1/23, 5.00%, 12/1/29(5) | | $ | 10,875 | | | $ | 11,669,093 | |
| | |
New Jersey Economic Development Authority, (School
Facilities Construction): | | | | | | |
| | |
5.00%, 6/15/43 | | | 1,530 | | | | 1,777,003 | |
| | |
5.00%, 6/15/44 | | | 8,290 | | | | 9,721,849 | |
| | |
| | | | | | | $ | 23,167,945 | |
| | | | |
| | 12 | | See Notes to Financial Statements. |
Eaton Vance
High Yield Municipal Income Fund
January 31, 2022
Portfolio of Investments — continued
| | | | | | | | |
| Security | | Principal
Amount
(000’s omitted) | | | Value | |
|
| Nursing Home — 0.0%(2) | |
| | |
Mississippi Business Finance Corp., (Magnolia Healthcare), 7.99%, 7/1/25 | | $ | 405 | | | $ | 410,455 | |
| | |
| | | | | | | $ | 410,455 | |
|
| Other Revenue — 1.9% | |
| | |
Central Falls Detention Facility Corp., RI, 7.25%, 7/15/35(6) | | $ | 6,250 | | | $ | 1,125,000 | |
| | |
Kalispel Tribe of Indians, WA, Series A, 5.25%, 1/1/38(1) | | | 1,260 | | | | 1,462,633 | |
| | |
Metropolitan Pier and Exposition Authority, IL, (McCormick Place), 4.00%, 6/15/52(4) | | | 4,060 | | | | 4,332,994 | |
| | |
Military Installation Development Authority, UT, 4.00%, 6/1/52 | | | 1,500 | | | | 1,368,720 | |
| | |
Morongo Band of Mission Indians, CA, 5.00%, 10/1/42(1) | | | 2,040 | | | | 2,357,975 | |
| | |
New York City Transitional Finance Authority, NY, (Building Aid), 5.00%, 7/15/37(5) | | | 10,000 | | | | 11,035,100 | |
| | |
Salt Verde Financial Corp., AZ, Senior Gas Revenue, 5.00%, 12/1/37 | | | 5,105 | | | | 6,741,255 | |
| | |
Will and Kankakee Counties Community Unit School District No. 255-U, IL, 4.00%, 6/1/30 | | | 700 | | | | 756,686 | |
| | |
| | | | | | | $ | 29,180,363 | |
|
| Senior Living / Life Care — 12.6% | |
| | |
Albemarle County Economic Development Authority, VA, (Westminster-Canterbury of the Blue Ridge), 5.00%, 1/1/42 | | $ | 1,350 | | | $ | 1,401,462 | |
| | |
| Atlantic Beach, FL, (Fleet Landing): | | | | | | |
| | |
5.00%, 11/15/37 | | | 7,945 | | | | 8,319,368 | |
| | |
5.00%, 11/15/38 | | | 1,000 | | | | 1,121,320 | |
| | |
California Public Finance Authority, (Enso Village), Green
Bonds: | | | | | | |
| | |
3.125%, 5/15/29(1) | | | 360 | | | | 362,390 | |
| | |
5.00%, 11/15/51(1) | | | 1,500 | | | | 1,672,815 | |
| | |
| Centerville, OH, (Graceworks Lutheran Services): | | | | | | |
| | |
5.25%, 11/1/37 | | | 3,250 | | | | 3,541,817 | |
| | |
5.25%, 11/1/47 | | | 3,190 | | | | 3,431,706 | |
| | |
Clackamas County Hospital Facility Authority, OR, (Mary’s Woods at Marylhurst), 5.00%, 5/15/48 | | | 425 | | | | 452,459 | |
| | |
Clackamas County Hospital Facility Authority, OR,
(Rose Villa): | | | | | | |
| | |
5.25%, 11/15/50 | | | 250 | | | | 270,408 | |
| | |
5.375%, 11/15/55 | | | 300 | | | | 325,251 | |
| | |
| Colorado Health Facilities Authority, (Aberdeen Ridge): | | | | | | |
| | |
5.00%, 5/15/49 | | | 2,235 | | | | 2,294,965 | |
| | |
5.00%, 5/15/58 | | | 2,525 | | | | 2,566,082 | |
| | |
Colorado Health Facilities Authority, (Christian Living Neighborhoods), 5.00%, 1/1/38 | | | 1,210 | | | | 1,337,207 | |
| | |
Colorado Health Facilities Authority, (Frasier Meadows Retirement Community), 5.25%, 5/15/37 | | | 750 | | | | 853,095 | |
| | | | | | | | |
| Security | | Principal
Amount
(000’s omitted) | | | Value | |
|
| Senior Living / Life Care (continued) | |
| | |
Connecticut Health and Educational Facilities Authority, (Church Home of Hartford, Inc.), 5.00%, 9/1/46(1) | | $ | 1,000 | | | $ | 1,074,330 | |
| | |
District of Columbia, (Ingleside at Rock Creek), 5.00%, 7/1/32 | | | 1,600 | | | | 1,707,696 | |
| | |
Florida Development Finance Corp., (Mayflower Retirement
Community): | | | | | | |
| | |
4.00%, 6/1/36(1) | | | 1,110 | | | | 1,213,308 | |
| | |
4.00%, 6/1/41(1) | | | 655 | | | | 707,937 | |
| | |
4.00%, 6/1/46(1) | | | 1,270 | | | | 1,356,639 | |
| | |
Florida Development Finance Corp., (The Glenridge on Palmer Ranch), 5.00%, 6/1/51 | | | 2,000 | | | | 2,223,160 | |
| | |
Franklin County Industrial Development Authority, PA, (Menno-Haven, Inc.), 5.00%, 12/1/38 | | | 1,000 | | | | 1,091,310 | |
| | |
Fulton County Residential Care Facilities for the Elderly Authority, GA, (Canterbury Court), 4.00%, 4/1/51(1) | | | 10,000 | | | | 10,364,800 | |
| | |
Hanover County Economic Development Authority, VA, (Covenant Woods), 5.00%, 7/1/38 | | | 125 | | | | 135,094 | |
| | |
Harris County Cultural Education Facilities Finance Corp.,
TX, (Brazos Presbyterian Homes, Inc.): | | | | | | |
| | |
5.75%, 1/1/28 | | | 415 | | | | 430,401 | |
| | |
6.375%, 1/1/33 | | | 655 | | | | 680,440 | |
| | |
Hawaii Department of Budget and Finance, (Kahala Senior
Living Community, Inc.): | | | | | | |
| | |
5.125%, 11/15/32 | | | 525 | | | | 538,466 | |
| | |
5.25%, 11/15/37 | | | 480 | | | | 492,317 | |
| | |
Howard County, MD, (Vantage House), 5.00%, 4/1/36 | | | 1,725 | | | | 1,793,241 | |
| | |
Illinois Finance Authority, (Plymouth Place, Inc.), 5.00%, 5/15/41 | | | 400 | | | | 460,204 | |
| | |
Indiana Finance Authority, (Marquette), Prerefunded to 3/1/22, 5.00%, 3/1/39 | | | 1,000 | | | | 1,003,770 | |
| | |
| Iowa Finance Authority, (Lifespace Communities, Inc.): | | | | | | |
| | |
4.125%, 5/15/38 | | | 1,500 | | | | 1,579,605 | |
| | |
5.00%, 5/15/43 | | | 3,250 | | | | 3,530,605 | |
| | |
5.00%, 5/15/55 | | | 2,095 | | | | 2,300,184 | |
| | |
James City County Economic Development Authority, VA, (Williamsburg Landing), 4.00%, 12/1/50 | | | 2,585 | | | | 2,765,485 | |
| | |
Maryland Health and Higher Educational Facilities Authority, (Edenwald), 5.25%, 1/1/37 | | | 2,500 | | | | 2,749,400 | |
| | |
Massachusetts Development Finance Agency, (Linden
Ponds, Inc.): | | | | | | |
| | |
5.00%, 11/15/33(1) | | | 1,550 | | | | 1,704,582 | |
| | |
5.00%, 11/15/38(1) | | | 1,010 | | | | 1,101,536 | |
| | |
Massachusetts Development Finance Agency, (NewBridge
on the Charles, Inc.): | | | | | | |
| | |
5.00%, 10/1/37(1) | | | 1,000 | | | | 1,075,340 | |
| | |
5.00%, 10/1/47(1) | | | 1,280 | | | | 1,374,170 | |
| | |
5.00%, 10/1/57(1) | | | 2,410 | | | | 2,586,460 | |
| | | | |
| | 13 | | See Notes to Financial Statements. |
Eaton Vance
High Yield Municipal Income Fund
January 31, 2022
Portfolio of Investments — continued
| | | | | | | | |
| Security | | Principal
Amount
(000’s omitted) | | | Value | |
|
| Senior Living / Life Care (continued) | |
| | |
Massachusetts Development Finance Agency, (Orchard Cove, Inc.), 5.00%, 10/1/39 | | $ | 370 | | | $ | 408,351 | |
| | |
Mesquite Health Facilities Development Corp., TX, (Christian Care Centers), 5.125%, 2/15/30(6) | | | 25 | | | | 19,500 | |
| | |
Missouri Health and Educational Facilities Authority, (Bethesda Health Group, Inc.), 5.00%, 8/1/40 | | | 1,300 | | | | 1,396,174 | |
| | |
Montgomery County Industrial Development Authority, PA, (Whitemarsh Continuing Care Retirement Community), 5.25%, 1/1/48 | | | 9,045 | | | | 9,695,335 | |
| | |
Multnomah County Hospital Facilities Authority, OR,
(Mirabella at South Waterfront): | | | | | | |
| | |
5.125%, 10/1/34 | | | 2,500 | | | | 2,654,725 | |
| | |
5.40%, 10/1/44 | | | 1,770 | | | | 1,872,306 | |
| | |
Multnomah County Hospital Facilities Authority, OR, (Terwilliger Plaza), 4.00%, 12/1/51 | | | 4,350 | | | | 4,470,973 | |
| | |
| National Finance Authority, NH, (The Vista): | | | | | | |
| | |
5.25%, 7/1/39(1) | | | 585 | | | | 609,512 | |
| | |
5.625%, 7/1/46(1) | | | 555 | | | | 584,371 | |
| | |
5.75%, 7/1/54(1) | | | 1,745 | | | | 1,841,411 | |
| | |
New Hampshire Health and Education Facilities Authority,
(Kendal at Hanover): | | | | | | |
| | |
5.00%, 10/1/40 | | | 815 | | | | 913,680 | |
| | |
5.00%, 10/1/46 | | | 1,000 | | | | 1,113,570 | |
| | |
New Hope Cultural Education Facilities Finance Corp., TX, (Longhorn Village), 5.00%, 1/1/37 | | | 6,320 | | | | 6,734,782 | |
| | |
Norfolk Redevelopment and Housing Authority, VA, (Fort
Norfolk Retirement Community, Inc. - Harbor’s Edge): | | | | | | |
| | |
4.00%, 1/1/25 | | | 1,600 | | | | 1,600,816 | |
| | |
4.375%, 1/1/39 | | | 1,250 | | | | 1,330,638 | |
| | |
5.00%, 1/1/49 | | | 6,000 | | | | 6,426,960 | |
| | |
North Carolina Medical Care Commission, (Deerfield Episcopal Retirement Community, Inc.), 5.00%, 11/1/37 | | | 1,675 | | | | 1,890,907 | |
| | |
North Carolina Medical Care Commission, (Pennybyrn at Maryfield), 5.00%, 10/1/45 | | | 1,000 | | | | 1,096,160 | |
| | |
North Carolina Medical Care Commission, (The Forest at Duke), 4.00%, 9/1/51 | | | 1,600 | | | | 1,768,944 | |
| | |
Palm Beach County Health Facilities Authority, FL, (Lifespace Communities, Inc.), 5.00%, 5/15/53 | | | 2,485 | | | | 2,730,717 | |
| | |
Palm Beach County Health Facilities Authority, FL, (Sinai
Residences of Boca Raton): | | | | | | |
| | |
7.25%, 6/1/34 | | | 75 | | | | 78,137 | |
| | |
7.25%, 6/1/39 | | | 1,190 | | | | 1,239,778 | |
| | |
7.50%, 6/1/49 | | | 6,855 | | | | 7,147,366 | |
| | |
Palm Beach County Health Facilities Authority, FL, (Toby & Leon Cooperman Sinai Residences of Boca Raton Expansion), 5.00%, 6/1/55 | | | 6,800 | | | | 7,259,272 | |
| | | | | | | | |
| Security | | Principal
Amount
(000’s omitted) | | | Value | |
|
| Senior Living / Life Care (continued) | |
| | |
Palm Beach County Health Facilities Authority, FL, (Toby & Leon Cooperman Sinai Residences of Boca Raton), 4.25%, 6/1/56(4) | | $ | 2,460 | | | $ | 2,488,880 | |
| | |
Public Finance Authority, WI, (Church Home of Hartford, Inc.), 5.00%, 9/1/30(1) | | | 770 | | | | 816,215 | |
| | |
South Carolina Jobs-Economic Development Authority, (Kiawah Life Plan Village, Inc.), 8.75%, 7/1/25(1) | | | 1,025 | | | | 1,045,080 | |
| | |
South Carolina Jobs-Economic Development Authority, (South Carolina Episcopal Home at Still Hopes), 5.00%, 4/1/30 | | | 1,945 | | | | 2,106,357 | |
| | |
St. Johns County Industrial Development Authority, FL, (Vicar’s Landing), 4.00%, 12/15/46 | | | 500 | | | | 520,065 | |
| | |
St. Louis County Industrial Development Authority, MO, (Friendship Village of St. Louis Obligated Group), 5.00%, 9/1/38 | | | 1,250 | | | | 1,381,075 | |
| | |
Tarrant County Cultural Education Facilities Finance Corp.,
TX, (MRC Stevenson Oaks): | | | | | | |
| | |
6.625%, 11/15/41 | | | 725 | | | | 835,178 | |
| | |
6.75%, 11/15/51 | | | 3,250 | | | | 3,729,992 | |
| | |
6.875%, 11/15/55 | | | 200 | | | | 230,360 | |
| | |
Tarrant County Cultural Education Facilities Finance Corp.,
TX, (Trinity Terrace): | | | | | | |
| | |
5.00%, 10/1/34 | | | 2,130 | | | | 2,302,402 | |
| | |
5.00%, 10/1/44 | | | 5,410 | | | | 5,804,010 | |
| | |
Tempe Industrial Development Authority, AZ, (Friendship
Village of Tempe): | | | | | | |
| | |
4.00%, 12/1/46 | | | 920 | | | | 968,125 | |
| | |
4.00%, 12/1/56 | | | 785 | | | | 814,061 | |
| | |
Tempe Industrial Development Authority, AZ, (Mirabella at ASU), 6.125%, 10/1/52(1) | | | 3,350 | | | | 3,593,310 | |
| | |
Tompkins County Development Corp., NY, (Kendal at Ithaca,
Inc.): | | | | | | |
| | |
4.25%, 7/1/32 | | | 1,270 | | | | 1,289,063 | |
| | |
4.50%, 7/1/42 | | | 1,270 | | | | 1,290,384 | |
| | |
| Warren County, OH, (Otterbein Homes Obligated Group): | | | | | | |
| | |
5.00%, 7/1/39 | | | 1,975 | | | | 2,111,690 | |
| | |
5.50%, 7/1/39 | | | 500 | | | | 531,645 | |
| | |
Washington Housing Finance Commission, (Bayview Manor
Homes): | | | | | | |
| | |
5.00%, 7/1/36(1) | | | 1,500 | | | | 1,583,490 | |
| | |
5.00%, 7/1/46(1) | | | 1,250 | | | | 1,310,038 | |
| | |
| Washington Housing Finance Commission, (Horizon House): | | | | | | |
| | |
5.00%, 1/1/43(1) | | | 4,000 | | | | 4,468,680 | |
| | |
5.00%, 1/1/48(1) | | | 4,815 | | | | 5,361,840 | |
| | |
Washington Housing Finance Commission, (Transforming
Age): | | | | | | |
| | |
5.00%, 1/1/44(1) | | | 2,780 | | | | 2,982,551 | |
| | |
5.00%, 1/1/49(1) | | | 695 | | | | 742,691 | |
| | | | |
| | 14 | | See Notes to Financial Statements. |
Eaton Vance
High Yield Municipal Income Fund
January 31, 2022
Portfolio of Investments — continued
| | | | | | | | |
| Security | | Principal
Amount
(000’s omitted) | | | Value | |
|
| Senior Living / Life Care (continued) | |
| | |
| Wayzata, MN, (Folkestone Senior Living Community): | | | | | | |
| | |
4.00%, 8/1/38 | | $ | 175 | | | $ | 181,116 | |
| | |
4.00%, 8/1/39 | | | 125 | | | | 129,158 | |
| | |
4.00%, 8/1/44 | | | 815 | | | | 836,598 | |
| | |
West Cornwall Township Municipal Authority, PA, (Lebanon
Valley Brethren Home): | | | | | | |
| | |
4.00%, 11/15/36 | | | 365 | | | | 412,154 | |
| | |
4.00%, 11/15/41 | | | 370 | | | | 414,056 | |
| | |
Westchester County Local Development Corp., NY, (Kendal on Hudson), 5.00%, 1/1/34 | | | 2,630 | | | | 2,706,375 | |
| | |
Wisconsin Health and Educational Facilities Authority,
(Oakwood Lutheran Senior Ministries): | | | | | | |
| | |
4.00%, 1/1/47 | | | 2,600 | | | | 2,703,662 | |
| | |
4.00%, 1/1/57 | | | 2,500 | | | | 2,571,725 | |
| | |
| | | | | | | $ | 197,137,236 | |
|
| Special Tax Revenue — 3.5% | |
| | |
Aliso Viejo Community Facilities District No. 2005-01, CA, (Glenwood at Aliso Viejo), 5.00%, 9/1/38 | | $ | 6,985 | | | $ | 7,415,765 | |
| | |
Cleveland-Cuyahoga County Port Authority, OH, (Flats East Bank), 4.00%, 12/1/55(1) | | | 400 | | | | 408,620 | |
| | |
Conroe Local Government Corp., TX, (Conroe Convention
Center Hotel): | | | | | | |
| | |
3.50%, 10/1/31 | | | 685 | | | | 656,538 | |
| | |
5.00%, 10/1/50 | | | 1,605 | | | | 1,702,728 | |
| | |
Irvine Community Facilities District No. 2013-3, CA, (Great Park), 5.00%, 9/1/39 | | | 2,000 | | | | 2,163,500 | |
| | |
Jurupa Public Financing Authority, CA, 5.00%, 9/1/33 | | | 600 | | | | 655,260 | |
| | |
Lakewood Ranch Stewardship District, FL, (Villages of Lakewood Ranch South), 5.00%, 5/1/36 | | | 4,455 | | | | 4,780,482 | |
| | |
Maryland Economic Development Corp., (Port Covington), 4.00%, 9/1/50 | | | 585 | | | | 635,298 | |
| | |
Metropolitan Development and Housing Agency, TN, (Fifth + Broadway Development Project), 5.125%, 6/1/36(1) | | | 900 | | | | 1,002,348 | |
| | |
Michigan Finance Authority, Detroit Financial Recovery Income Tax Revenue, 4.50%, 10/1/29 | | | 4,460 | | | | 4,659,496 | |
| | |
New River Community Development District, FL, (Capital
Improvements): | | | | | | |
| | |
5.00%, 5/1/13(6) | | | 1,005 | | | | 0 | |
| | |
5.75%, 5/1/38 | | | 1,150 | | | | 1,162,039 | |
| | |
New York Dormitory Authority, Personal Income Tax Revenue, 5.00%, 2/15/37(5) | | | 10,000 | | | | 11,023,000 | |
| | |
Reno, NV, Sales Tax Revenue, 4.00%, 6/1/43 | | | 1,250 | | | | 1,326,875 | |
| | |
South Orange County Public Financing Authority, CA,
(Ladera Ranch): | | | | | | |
| | |
5.00%, 8/15/31 | | | 1,500 | | | | 1,537,455 | |
| | | | | | | | |
| Security | | Principal
Amount
(000’s omitted) | | | Value | |
|
| Special Tax Revenue (continued) | |
| | |
South Orange County Public Financing Authority, CA,
(Ladera Ranch): (continued) | | | | | | |
| | |
5.00%, 8/15/33 | | $ | 1,000 | | | $ | 1,025,180 | |
| | |
5.00%, 8/15/34 | | | 450 | | | | 461,300 | |
| | |
| South Village Community Development District, FL: | | | | | | |
| | |
3.50%, 5/1/32 | | | 790 | | | | 818,503 | |
| | |
3.625%, 5/1/35 | | | 485 | | | | 504,570 | |
| | |
3.75%, 5/1/38 | | | 1,010 | | | | 1,053,248 | |
| | |
4.875%, 5/1/35 | | | 500 | | | | 533,540 | |
| | |
5.00%, 5/1/38 | | | 100 | | | | 107,439 | |
| | |
Southern Hills Plantation I Community Development District,
FL: | | | | | | |
| | |
Series A1, 5.80%, 5/1/35 | | | 1,083 | | | | 1,057,040 | |
| | |
Series A2, 5.80%, 5/1/35 | | | 795 | | | | 628,567 | |
| | |
St. Louis Land Clearance for Redevelopment Authority, MO, (Kiel Opera House Renovation), 3.875%, 10/1/35 | | | 545 | | | | 523,462 | |
| | |
| Tolomato Community Development District, FL: | | | | | | |
| | |
3.00%, 5/1/32(4) | | | 1,540 | | | | 1,525,231 | |
| | |
3.25%, 5/1/40(4) | | | 2,865 | | | | 2,841,536 | |
| | |
Winter Garden Village at Fowler Groves Community Development District, FL, 4.125%, 5/1/37 | | | 3,405 | | | | 3,609,572 | |
| | |
| | | | | | | $ | 53,818,592 | |
|
| Student Loan — 0.3% | |
| | |
| New Jersey Higher Education Student Assistance Authority: | | | | | | |
| | |
(AMT), 4.00%, 12/1/30 | | $ | 2,370 | | | $ | 2,448,874 | |
| | |
(AMT), 4.75%, 12/1/43 | | | 2,765 | | | | 2,815,627 | |
| | |
| | | | | | | $ | 5,264,501 | |
|
| Transportation — 25.1% | |
| | |
Austin, TX, Airport System Revenue, (AMT), 5.00%, 11/15/41 | | $ | 2,000 | | | $ | 2,285,400 | |
| | |
Broward County, FL, Airport System Revenue, (AMT), 5.00%, 10/1/49 | | | 10,000 | | | | 11,820,400 | |
| | |
California Municipal Finance Authority, (LINXS Automated
People Mover): | | | | | | |
| | |
(AMT), 5.00%, 12/31/36 | | | 1,740 | | | | 2,018,661 | |
| | |
(AMT), 5.00%, 12/31/37 | | | 760 | | | | 881,653 | |
| | |
| Central Texas Regional Mobility Authority: | | | | | | |
| | |
4.00%, 1/1/51 | | | 4,400 | | | | 4,882,328 | |
| | |
5.00%, 1/1/46 | | | 6,400 | | | | 7,694,592 | |
| | |
Chesapeake Bay Bridge and Tunnel Commission, VA, 5.00%, 7/1/46 | | | 4,000 | | | | 4,607,000 | |
| | |
| Chicago, IL, (O’Hare International Airport): | | | | | | |
| | |
4.00%, 1/1/35 | | | 7,500 | | | | 8,557,950 | |
| | | | |
| | 15 | | See Notes to Financial Statements. |
Eaton Vance
High Yield Municipal Income Fund
January 31, 2022
Portfolio of Investments — continued
| | | | | | | | |
| Security | | Principal
Amount
(000’s omitted) | | | Value | |
|
| Transportation (continued) | |
| | |
| Chicago, IL, (O’Hare International Airport): (continued) | | | | | | |
| | |
5.00%, 1/1/35 | | $ | 2,500 | | | $ | 2,843,725 | |
| | |
5.00%, 1/1/38 | | | 5,000 | | | | 5,669,700 | |
| | |
(AMT), 4.375%, 1/1/40 | | | 2,500 | | | | 2,690,100 | |
| | |
(AMT), 5.00%, 1/1/25 | | | 2,555 | | | | 2,648,590 | |
| | |
(AMT), 5.00%, 1/1/26 | | | 2,170 | | | | 2,248,272 | |
| | |
(AMT), 5.00%, 7/1/33 | | | 500 | | | | 586,440 | |
| | |
(AMT), 5.00%, 7/1/38 | | | 1,500 | | | | 1,729,965 | |
| | |
Colorado High Performance Transportation Enterprise, (U.S. 36 and I-25 Managed Lanes), (AMT), 5.75%, 1/1/44 | | | 2,500 | | | | 2,609,375 | |
| | |
Dallas and Fort Worth, TX, (Dallas/Fort Worth International
Airport): | | | | | | |
| | |
4.00%, 11/1/35 | | | 3,505 | | | | 4,055,565 | |
| | |
(AMT), 5.25%, 11/1/29 | | | 7,000 | | | | 7,456,050 | |
| | |
| Eagle County Air Terminal Corp., CO: | | | | | | |
| | |
(AMT), 5.00%, 5/1/37 | | | 1,000 | | | | 1,133,230 | |
| | |
(AMT), 5.00%, 5/1/41 | | | 4,940 | | | | 5,567,281 | |
| | |
Florida Development Finance Corp., (Brightline Florida Passenger Rail), Green Bonds, (AMT), 7.375%, 1/1/49(1) | | | 8,840 | | | | 9,605,102 | |
| | |
Grand Parkway Transportation Corp., TX, 5.125%, 10/1/43 | | | 3,025 | | | | 3,211,824 | |
| | |
| Hidalgo County Regional Mobility Authority, TX: | | | | | | |
| | |
4.00%, 12/1/39(4) | | | 340 | | | | 374,156 | |
| | |
4.00%, 12/1/40(4) | | | 400 | | | | 439,104 | |
| | |
4.00%, 12/1/41(4) | | | 400 | | | | 438,028 | |
| | |
| Houston, TX, Airport System Revenue: | | | | | | |
| | |
(AMT), 4.00%, 7/1/46 | | | 10,000 | | | | 10,996,500 | |
| | |
(AMT), 4.00%, 7/1/48 | | | 810 | | | | 888,554 | |
| | |
| Illinois Toll Highway Authority: | | | | | | |
| | |
4.00%, 1/1/44(5) | | | 13,050 | | | | 14,734,363 | |
| | |
5.00%, 1/1/40(5) | | | 15,000 | | | | 16,849,500 | |
| | |
Kansas City Industrial Development Authority, MO, (Kansas City International Airport Terminal Modernization), (AMT), 5.00%, 3/1/46 | | | 6,000 | | | | 6,955,560 | |
| | |
Kentucky Public Transportation Infrastructure Authority,
(Downtown Crossing Project): | | | | | | |
| | |
0.00%, 7/1/29 | | | 1,135 | | | | 921,336 | |
| | |
0.00%, 7/1/30 | | | 500 | | | | 378,035 | |
| | |
0.00%, 7/1/31 | | | 1,150 | | | | 808,140 | |
| | |
Prerefunded to 7/1/23, 0.00%, 7/1/28 | | | 2,690 | | | | 1,951,138 | |
| | |
Maryland Economic Development Corp., (Transportation Facilities), 5.00%, 6/1/35 | | | 450 | | | | 527,103 | |
| | |
Maryland Transportation Authority, 4.00%, 7/1/50 | | | 12,760 | | | | 14,322,079 | |
| | |
Memphis-Shelby County Airport Authority, TN, (AMT), 5.00%, 7/1/43 | | | 7,500 | | | | 8,770,650 | |
| | |
Metropolitan Transportation Authority, NY, Green Bonds, 5.25%, 11/15/55 | | | 11,500 | | | | 13,598,175 | |
| | | | | | | | |
| Security | | Principal
Amount
(000’s omitted) | | | Value | |
|
| Transportation (continued) | |
| | |
| Metropolitan Washington Airports Authority, D.C.: | | | | | | |
| | |
(AMT), 4.00%, 10/1/37 | | $ | 450 | | | $ | 513,846 | |
| | |
(AMT), 4.00%, 10/1/38 | | | 565 | | | | 643,812 | |
| | |
(AMT), 4.00%, 10/1/41 | | | 450 | | | | 507,267 | |
| | |
| Mid-Bay Bridge Authority, FL: | | | | | | |
| | |
5.00%, 10/1/30 | | | 2,050 | | | | 2,277,038 | |
| | |
5.00%, 10/1/35 | | | 5,000 | | | | 5,540,400 | |
| | |
New Jersey Economic Development Authority, (The Goethals Bridge Replacement), (AMT), 5.125%, 1/1/34 | | | 5,000 | | | | 5,349,850 | |
| | |
New Jersey Transportation Trust Fund Authority, 4.00%, 6/15/41(4) | | | 3,000 | | | | 3,297,450 | |
| | |
New Jersey Transportation Trust Fund Authority,
(Transportation Program): | | | | | | |
| | |
3.00%, 6/15/50 | | | 3,575 | | | | 3,372,011 | |
| | |
4.00%, 6/15/45 | | | 3,000 | | | | 3,289,350 | |
| | |
5.00%, 6/15/44 | | | 3,200 | | | | 3,714,656 | |
| | |
5.25%, 6/15/43 | | | 960 | | | | 1,133,626 | |
| | |
| New Jersey Turnpike Authority: | | | | | | |
| | |
4.00%, 1/1/51 | | | 13,735 | | | | 15,496,788 | |
| | |
5.00%, 1/1/48(5) | | | 5,000 | | | | 5,960,600 | |
| | |
| New Orleans Aviation Board, LA, (North Terminal Project): | | | | | | |
| | |
(AMT), 5.00%, 1/1/35 | | | 2,000 | | | | 2,178,240 | |
| | |
(AMT), 5.00%, 1/1/43 | | | 1,500 | | | | 1,713,570 | |
| | |
New York Thruway Authority, 4.00%, 1/1/50 | | | 7,770 | | | | 8,470,621 | |
| | |
New York Transportation Development Corp., (LaGuardia
Airport Terminal B Redevelopment): | | | | | | |
| | |
(AMT), 5.00%, 7/1/41 | | | 1,705 | | | | 1,818,314 | |
| | |
(AMT), 5.00%, 7/1/46 | | | 7,730 | | | | 8,260,664 | |
| | |
(AMT), 5.25%, 1/1/50 | | | 7,520 | | | | 8,020,381 | |
| | |
New York Transportation Development Corp., (Terminal 4
John F. Kennedy International Airport): | | | | | | |
| | |
4.00%, 12/1/39 | | | 1,530 | | | | 1,689,625 | |
| | |
4.00%, 12/1/42 | | | 2,875 | | | | 3,153,501 | |
| | |
(AMT), 4.00%, 12/1/38 | | | 2,050 | | | | 2,243,602 | |
| | |
(AMT), 4.00%, 12/1/39 | | | 300 | | | | 327,840 | |
| | |
(AMT), 4.00%, 12/1/41 | | | 300 | | | | 326,793 | |
| | |
(AMT), 4.00%, 12/1/42 | | | 650 | | | | 703,950 | |
| | |
Niagara Frontier Transportation Authority, NY, (Buffalo Niagara International Airport), (AMT), 5.00%, 4/1/28 | | | 470 | | | | 504,287 | |
| | |
North East Texas Regional Mobility Authority, 5.00%, 1/1/41 | | | 5,250 | | | | 5,855,010 | |
| | |
North Texas Tollway Authority, 4.00%, 1/1/41 | | | 2,295 | | | | 2,623,988 | |
| | |
| Osceola County, FL, (Osceola Parkway): | | | | | | |
| | |
5.00%, 10/1/44 | | | 2,000 | | | | 2,360,260 | |
| | |
5.00%, 10/1/49 | | | 2,500 | | | | 2,931,325 | |
| | |
Pennsylvania Economic Development Financing Authority, (Amtrak), (AMT), 5.00%, 11/1/41 | | | 5,495 | | | | 5,642,101 | |
| | | | |
| | 16 | | See Notes to Financial Statements. |
Eaton Vance
High Yield Municipal Income Fund
January 31, 2022
Portfolio of Investments — continued
| | | | | | | | |
| Security | | Principal
Amount
(000’s omitted) | | | Value | |
|
| Transportation (continued) | |
| | |
| Port Authority of New York and New Jersey: | | | | | | |
| | |
(AMT), 4.00%, 9/1/33(5) | | $ | 12,080 | | | $ | 12,874,622 | |
| | |
(AMT), 4.00%, 9/15/43 | | | 3,640 | | | | 3,972,332 | |
| | |
(AMT), 4.50%, 4/1/37(5) | | | 10,000 | | | | 10,060,900 | |
| | |
(AMT), 5.00%, 10/15/35 | | | 4,050 | | | | 4,681,233 | |
| | |
Port Freeport, TX, (AMT), 4.00%, 6/1/51 | | | 1,500 | | | | 1,624,635 | |
| | |
| South Jersey Port Corp., NJ: | | | | | | |
| | |
(AMT), 5.00%, 1/1/42 | | | 2,500 | | | | 2,818,450 | |
| | |
(AMT), 5.00%, 1/1/48 | | | 5,500 | | | | 6,179,525 | |
| | |
South Jersey Transportation Authority, 5.00%, 11/1/32 | | | 2,250 | | | | 2,445,233 | |
| | |
Texas Private Activity Bond Surface Transportation Corp.,
(North Tarrant Express Managed Lanes Project): | | | | | | |
| | |
4.00%, 12/31/37 | | | 315 | | | | 354,753 | |
| | |
4.00%, 12/31/38 | | | 585 | | | | 657,212 | |
| | |
4.00%, 12/31/39 | | | 305 | | | | 342,180 | |
| | |
5.00%, 12/31/35 | | | 375 | | | | 453,818 | |
| | |
Texas Private Activity Bond Surface Transportation Corp., (North Tarrant Express Segment 3C), (AMT), 5.00%, 6/30/58 | | | 16,865 | | | | 19,589,372 | |
| | |
Texas Transportation Commission, (Central Texas Turnpike System), 5.00%, 8/15/42 | | | 16,430 | | | | 17,934,659 | |
| | |
| Texas Transportation Commission, (State Highway System): | | | | | | |
| | |
0.00%, 8/1/36 | | | 550 | | | | 327,564 | |
| | |
0.00%, 8/1/46 | | | 2,500 | | | | 861,950 | |
| | |
Virginia Small Business Financing Authority, (Elizabeth River
Crossings Opco, LLC): | | | | | | |
| | |
(AMT), 4.00%, 1/1/38(4) | | | 3,750 | | | | 4,069,050 | |
| | |
(AMT), 4.00%, 1/1/40(4) | | | 1,500 | | | | 1,620,750 | |
| | |
Virginia Small Business Financing Authority, (Transform 66 P3 Project), (AMT), 5.00%, 12/31/52 | | | 2,500 | | | | 2,895,300 | |
| | |
| | | | | | | $ | 391,439,928 | |
|
| Water and Sewer — 0.4% | |
| | |
Great Lakes Water Authority, MI, 5.00%, 7/1/49 | | $ | 1,000 | | | $ | 1,211,730 | |
| | |
Miami-Dade County, FL, Water and Sewer System Revenue, 4.00%, 10/1/44 | | | 2,250 | | | | 2,592,472 | |
| | |
Michigan Finance Authority, (Detroit Water and Sewerage Department), 5.00%, 7/1/33 | | | 1,905 | | | | 2,074,012 | |
| | |
| | | | | | | $ | 5,878,214 | |
| |
Total Tax-Exempt Municipal Obligations — 93.6%
(identified cost $1,388,010,080) | | | $ | 1,459,613,747 | |
| | | | | | | | |
| Taxable Municipal Obligations — 5.4% | |
| Security | | Principal
Amount
(000’s omitted) | | | Value | |
|
| Cogeneration — 0.0%(2) | |
| | |
Northampton County Industrial Development Authority, PA, (Northampton Generating), 5.00%, 12/31/23 | | $ | 210 | | | $ | 52,563 | |
| | |
| | | | | | | $ | 52,563 | |
|
| Education — 0.3% | |
| | |
California Municipal Finance Authority, (Albert Einstein
Academies): | | | | | | |
| | |
4.35%, 8/1/38(1) | | $ | 1,100 | | | $ | 1,046,870 | |
| | |
4.50%, 8/1/43(1) | | | 1,500 | | | | 1,398,075 | |
| | |
San Antonio Education Facilities Corp., TX, (University of the Incarnate Word), 3.15%, 4/1/37 | | | 1,750 | | | | 1,726,585 | |
| | |
| | | | | | | $ | 4,171,530 | |
|
| Escrowed / Prerefunded — 1.3% | |
| | |
Chicago, IL, Prerefunded to 1/1/25, 7.75%, 1/1/42 | | $ | 10,316 | | | $ | 12,146,058 | |
| | |
St. Johns County Industrial Development Authority, FL, (Westminster St. Augustine), Prerefunded to 8/1/22, 5.50%, 8/1/44 | | | 7,335 | | | | 7,584,317 | |
| | |
| | | | | | | $ | 19,730,375 | |
|
| General Obligations — 0.9% | |
| | |
Atlantic City, NJ, 7.50%, 3/1/40 | | $ | 5,440 | | | $ | 7,367,338 | |
| | |
Chicago, IL, 7.75%, 1/1/42 | | | 4,356 | | | | 4,914,700 | |
| | |
| Detroit, MI: | | | | | | |
| | |
3.11%, 4/1/28 | | | 830 | | | | 810,354 | |
| | |
3.344%, 4/1/30 | | | 125 | | | | 121,359 | |
| | |
3.644%, 4/1/34 | | | 500 | | | | 487,830 | |
| | |
Portsmouth, VA, 2.40%, 7/15/39 | | | 1,175 | | | | 1,143,745 | |
| | |
| | | | | | | $ | 14,845,326 | |
|
| Hospital — 1.3% | |
| | |
California Statewide Communities Development Authority, (Loma Linda University Medical Center), 6.00%, 12/1/24 | | $ | 12,750 | | | $ | 14,145,870 | |
| | |
Middleburg Heights, OH, (Southwest General Health Center), 4.074%, 8/1/47 | | | 6,000 | | | | 6,200,160 | |
| | |
| | | | | | | $ | 20,346,030 | |
|
| Insured – General Obligations — 0.4% | |
| | |
Addison Fire Protection District No. 1, IL, (BAM), 2.802%, 12/30/39 | | $ | 260 | | | $ | 249,221 | |
| | |
Detroit, MI, (AMBAC), 5.15%, 4/1/25 | | | 6,229 | | | | 6,229,459 | |
| | |
Elmwood Park, IL, (AGM), 2.544%, 12/1/36 | | | 355 | | | | 338,450 | |
| | |
| | | | | | | $ | 6,817,130 | |
| | | | |
| | 17 | | See Notes to Financial Statements. |
Eaton Vance
High Yield Municipal Income Fund
January 31, 2022
Portfolio of Investments — continued
| | | | | | | | |
| Security | | Principal
Amount
(000’s omitted) | | | Value | |
|
| Special Tax Revenue — 0.5% | |
| | |
| American Samoa Economic Development Authority: | | | | | | |
| | |
2.47%, 9/1/24(1) | | $ | 525 | | | $ | 518,999 | |
| | |
3.72%, 9/1/27(1) | | | 1,370 | | | | 1,348,313 | |
| | |
Ohio County Commission, WV, (Fort Henry Economic
Opportunity Development District - The Highlands): | | | | | | |
| | |
4.80%, 3/1/36 | | | 2,800 | | | | 2,824,024 | |
| | |
5.25%, 3/1/31 | | | 2,905 | | | | 2,948,778 | |
| | |
| | | | | | | $ | 7,640,114 | |
|
| Transportation — 0.6% | |
| | |
Central Texas Regional Mobility Authority, 2.674%, 1/1/33 | | $ | 1,000 | | | $ | 984,820 | |
| | |
New Jersey Transportation Trust Fund Authority, 5.754%, 12/15/28(8) | | | 7,375 | | | | 8,521,444 | |
| | |
| | | | | | | $ | 9,506,264 | |
|
| Water and Sewer — 0.1% | |
| | |
Great Lakes Water Authority, MI, 3.473%, 7/1/41 | | $ | 1,000 | | | $ | 1,043,570 | |
| | |
| | | | | | | $ | 1,043,570 | |
| |
Total Taxable Municipal Obligations — 5.4%
(identified cost $77,558,455) | | | $ | 84,152,902 | |
| |
Total Investments — 101.8%
(identified cost $1,506,867,788) | | | $ | 1,587,324,392 | |
| |
Other Assets, Less Liabilities — (1.8)% | | | $ | (28,124,745 | ) |
| |
Net Assets — 100.0% | | | $ | 1,559,199,647 | |
The percentage shown for each investment category in the Portfolio of Investments is based on net assets.
At January 31, 2022, the concentration of the Fund’s investments in the various states, determined as a percentage of net assets, is as follows:
| | | | |
| |
| Texas | | | 14.2% | |
| |
| New York | | | 11.5% | |
| |
| Illinois | | | 11.2% | |
| |
| Others, representing less than 10% individually | | | 64.9% | |
The Fund invests primarily in debt securities issued by municipalities. The ability of the issuers of the debt securities to meet their obligations may be affected by economic developments in a specific industry or municipality. At January 31, 2022, 8.4% of total investments are backed by bond insurance of various financial institutions and financial guaranty assurance agencies. The aggregate percentage insured by an individual financial institution or financial guaranty assurance agency ranged from 0.1% to 3.7% of total investments.
| (1) | Security exempt from registration under Rule 144A of the Securities Act of 1933, as amended. These securities may be sold in certain transactions in reliance on an exemption from registration (normally to qualified institutional buyers). At January 31, 2022, the aggregate value of these securities is $192,229,282 or 12.3% of the Fund’s net assets. |
| (2) | Amount is less than 0.05%. |
| (3) | Represents a payment-in-kind security which may pay interest in additional principal at the issuer’s discretion. |
| (4) | When-issued security. |
| (5) | Security represents the municipal bond held by a trust that issues residual interest bonds (see Note 1H). |
| (6) | Defaulted security. Issuer has defaulted on the payment of interest and/or principal. |
| (7) | Variable rate demand obligation that may be tendered at par on any day for payment the same or next business day. The stated interest rate, which generally resets daily, is determined by the remarketing agent and represents the rate in effect at January 31, 2022. |
| (8) | Build America Bond. Represents taxable municipal obligation issued pursuant to the American Recovery and Reinvestment Act of 2009 or other legislation providing for the issuance of taxable municipal debt on which the issuer receives federal support. |
Futures Contracts
| | | | | | | | | | | | | | | | |
| Description | | Number of
Contracts | | | Position | | Expiration
Date | | Notional
Amount | | | Value/Unrealized
Appreciation
(Depreciation) | |
|
Interest Rate Futures | |
| | | | | |
| U.S. 10-Year Treasury Note | | | (175 | ) | | Short | | 3/22/22 | | $ | (22,394,531 | ) | | $ | 182,874 | |
| | | | | |
| U.S. Long Treasury Bond | | | (112 | ) | | Short | | 3/22/22 | | | (17,430,000 | ) | | | 307,789 | |
| |
| | | | $ | 490,663 | |
| | | | |
| | 18 | | See Notes to Financial Statements. |
Eaton Vance
High Yield Municipal Income Fund
January 31, 2022
Portfolio of Investments — continued
Abbreviations:
| | | | |
| | |
| AGC | | – | | Assured Guaranty Corp. |
| | |
| AGM | | – | | Assured Guaranty Municipal Corp. |
| | |
| AMBAC | | – | | AMBAC Financial Group, Inc. |
| | |
| AMT | | – | | Interest earned from these securities may be considered a tax preference item for purposes of the Federal Alternative Minimum Tax. |
| | |
| BAM | | – | | Build America Mutual Assurance Co. |
| | |
| LOC | | – | | Letter of Credit |
| | |
| NPFG | | – | | National Public Finance Guarantee Corp. |
| | |
| PSF | | – | | Permanent School Fund |
| | | | |
| | 19 | | See Notes to Financial Statements. |
Eaton Vance
High Yield Municipal Income Fund
January 31, 2022
Statement of Assets and Liabilities
| | | | |
| Assets | | January 31, 2022 | |
| |
Unaffiliated investments, at value (identified cost, $1,506,867,788) | | $ | 1,587,324,392 | |
| |
Cash | | | 48,321,302 | |
| |
Deposits for derivatives collateral — financial futures contracts | | | 654,533 | |
| |
Interest receivable | | | 15,242,310 | |
| |
Receivable for investments sold | | | 21,122,505 | |
| |
Receivable for Fund shares sold | | | 4,578,442 | |
| |
Receivable from affiliate | | | 102 | |
| |
Receivable for variation margin on open financial futures contracts | | | 11,269 | |
| |
Total assets | | $ | 1,677,254,855 | |
|
| Liabilities | |
| |
Payable for floating rate notes issued | | $ | 75,425,886 | |
| |
Payable for investments purchased | | | 3,441,079 | |
| |
Payable for when-issued securities | | | 28,871,318 | |
| |
Payable for Fund shares redeemed | | | 8,537,798 | |
| |
Distributions payable | | | 621,878 | |
| |
Payable to affiliates: | | | | |
| |
Investment adviser fee | | | 530,341 | |
| |
Distribution and service fees | | | 161,373 | |
| |
Interest expense and fees payable | | | 105,501 | |
| |
Accrued expenses | | | 360,034 | |
| |
Total liabilities | | $ | 118,055,208 | |
| |
Net Assets | | $ | 1,559,199,647 | |
|
| Sources of Net Assets | |
| |
Paid-in capital | | $ | 1,530,014,426 | |
| |
Distributable earnings | | | 29,185,221 | |
| |
Net Assets | | $ | 1,559,199,647 | |
|
| Class A Shares | |
| |
Net Assets | | $ | 412,905,327 | |
| |
Shares Outstanding | | | 45,460,573 | |
| |
Net Asset Value and Redemption Price Per Share | | | | |
| |
(net assets ÷ shares of beneficial interest outstanding) | | $ | 9.08 | |
| |
Maximum Offering Price Per Share | | | | |
| |
(100 ÷ 95.25 of net asset value per share) | | $ | 9.53 | |
|
| Class C Shares | |
| |
Net Assets | | $ | 82,817,264 | |
| |
Shares Outstanding | | | 9,858,875 | |
| |
Net Asset Value and Offering Price Per Share* | | | | |
| |
(net assets ÷ shares of beneficial interest outstanding) | | $ | 8.40 | |
|
| Class I Shares | |
| |
Net Assets | | $ | 1,063,175,383 | |
| |
Shares Outstanding | | | 116,934,891 | |
| |
Net Asset Value, Offering Price and Redemption Price Per Share | | | | |
| |
(net assets ÷ shares of beneficial interest outstanding) | | $ | 9.09 | |
|
| Class W Shares | |
| |
Net Assets | | $ | 301,673 | |
| |
Shares Outstanding | | | 33,171 | |
| |
Net Asset Value, Offering Price and Redemption Price Per Share | | | | |
| |
(net assets ÷ shares of beneficial interest outstanding) | | $ | 9.09 | |
On sales of $50,000 or more, the offering price of Class A shares is reduced.
| * | Redemption price per share is equal to the net asset value less any applicable contingent deferred sales charge. |
| | | | |
| | 20 | | See Notes to Financial Statements. |
Eaton Vance
High Yield Municipal Income Fund
January 31, 2022
Statement of Operations
| | | | |
| Investment Income | | Year Ended
January 31, 2022 | |
| |
Interest | | $ | 59,373,364 | |
| |
Total investment income | | $ | 59,373,364 | |
|
| Expenses | |
| |
Investment adviser fee | | $ | 6,223,102 | |
| |
Distribution and service fees | | | | |
| |
Class A | | | 1,043,154 | |
| |
Class C | | | 906,605 | |
| |
Trustees’ fees and expenses | | | 77,820 | |
| |
Custodian fee | | | 346,022 | |
| |
Transfer and dividend disbursing agent fees | | | 474,873 | |
| |
Legal and accounting services | | | 148,856 | |
| |
Printing and postage | | | 48,069 | |
| |
Registration fees | | | 111,006 | |
| |
Interest expense and fees | | | 533,138 | |
| |
Miscellaneous | | | 143,075 | |
| |
Total expenses | | $ | 10,055,720 | |
| |
Deduct — | | | | |
| |
Reimbursement of investment adviser fee — Class W | | $ | 192 | |
| |
Total expense reductions | | $ | 192 | |
| |
Net expenses | | $ | 10,055,528 | |
| |
Net investment income | | $ | 49,317,836 | |
|
| Realized and Unrealized Gain (Loss) | |
| |
Net realized gain (loss) — | | | | |
| |
Investment transactions | | $ | (764,679 | ) |
| |
Financial futures contracts | | | 2,186,916 | |
| |
Net realized gain | | $ | 1,422,237 | |
| |
Change in unrealized appreciation (depreciation) — | | | | |
| |
Investments | | $ | (49,186,741 | ) |
| |
Financial futures contracts | | | (426,198 | ) |
| |
Net change in unrealized appreciation (depreciation) | | $ | (49,612,939 | ) |
| |
Net realized and unrealized loss | | $ | (48,190,702 | ) |
| |
Net increase in net assets from operations | | $ | 1,127,134 | |
| | | | |
| | 21 | | See Notes to Financial Statements. |
Eaton Vance
High Yield Municipal Income Fund
January 31, 2022
Statements of Changes in Net Assets
| | | | | | | | |
| | | Year Ended January 31, | |
| Increase (Decrease) in Net Assets | | 2022 | | | 2021 | |
| | |
From operations — | | | | | | | | |
| | |
Net investment income | | $ | 49,317,836 | | | $ | 47,012,555 | |
| | |
Net realized gain (loss) | | | 1,422,237 | | | | (3,382,654 | ) |
| | |
Net change in unrealized appreciation (depreciation) | | | (49,612,939 | ) | | | 4,625,353 | |
| | |
Net increase in net assets from operations | | $ | 1,127,134 | | | $ | 48,255,254 | |
| | |
Distributions to shareholders — | | | | | | | | |
| | |
Class A | | $ | (12,582,413 | ) | | $ | (13,637,583 | ) |
| | |
Class C | | | (2,056,099 | ) | | | (3,120,416 | ) |
| | |
Class I | | | (34,798,742 | ) | | | (31,974,184 | ) |
| | |
Class W(1) | | | (1,745 | ) | | | — | |
| | |
Total distributions to shareholders | | $ | (49,438,999 | ) | | $ | (48,732,183 | ) |
| | |
Transactions in shares of beneficial interest — | | | | | | | | |
| | |
Proceeds from sale of shares | | | | | | | | |
| | |
Class A | | $ | 61,544,294 | | | $ | 99,586,256 | |
| | |
Class C | | | 10,948,395 | | | | 15,591,373 | |
| | |
Class I | | | 371,004,093 | | | | 573,167,384 | |
| | |
Class W(1) | | | 310,000 | | | | — | |
| | |
Net asset value of shares issued to shareholders in payment of distributions declared | | | | | | | | |
| | |
Class A | | | 10,007,784 | | | | 10,952,220 | |
| | |
Class C | | | 1,845,479 | | | | 2,656,219 | |
| | |
Class I | | | 30,339,525 | | | | 28,139,176 | |
| | |
Class W(1) | | | 119 | | | | — | |
| | |
Cost of shares redeemed | | | | | | | | |
| | |
Class A | | | (70,258,658 | ) | | | (133,457,451 | ) |
| | |
Class C | | | (20,212,224 | ) | | | (42,512,625 | ) |
| | |
Class I | | | (299,874,680 | ) | | | (486,792,790 | ) |
| | |
Net asset value of shares converted | | | | | | | | |
| | |
Class A | | | 4,972,497 | | | | 15,497,871 | |
| | |
Class C | | | (4,972,497 | ) | | | (15,497,871 | ) |
| | |
Net increase in net assets from Fund share transactions | | $ | 95,654,127 | | | $ | 67,329,762 | |
| | |
Net increase in net assets | | $ | 47,342,262 | | | $ | 66,852,833 | |
|
| Net Assets | |
| | |
At beginning of year | | $ | 1,511,857,385 | | | $ | 1,445,004,552 | |
| | |
At end of year | | $ | 1,559,199,647 | | | $ | 1,511,857,385 | |
| (1) | For the period from the commencement of operations, October 1, 2021, to January 31, 2022. |
| | | | |
| | 22 | | See Notes to Financial Statements. |
Eaton Vance
High Yield Municipal Income Fund
January 31, 2022
Financial Highlights
| | | | | | | | | | | | | | | | | | | | |
| | | Class A | |
| | | Year Ended January 31, | |
| | | 2022 | | | 2021 | | | 2020 | | | 2019 | | | 2018 | |
| | | | | |
Net asset value — Beginning of year | | $ | 9.360 | | | $ | 9.380 | | | $ | 8.830 | | | $ | 8.880 | | | $ | 8.650 | |
| | | | | |
| Income (Loss) From Operations | | | | | | | | | | | | | | | | | | | | |
| | | | | |
Net investment income(1) | | $ | 0.281 | | | $ | 0.303 | | | $ | 0.327 | | | $ | 0.345 | | | $ | 0.337 | |
| | | | | |
Net realized and unrealized gain (loss) | | | (0.279 | ) | | | (0.008 | )(2) | | | 0.590 | | | | (0.059 | ) | | | 0.229 | |
| | | | | |
Total income from operations | | $ | 0.002 | | | $ | 0.295 | | | $ | 0.917 | | | $ | 0.286 | | | $ | 0.566 | |
| | | | | |
| Less Distributions | | | | | | | | | | | | | | | | | | | | |
| | | | | |
From net investment income | | $ | (0.282 | ) | | $ | (0.315 | ) | | $ | (0.367 | ) | | $ | (0.336 | ) | | $ | (0.336 | ) |
| | | | | |
Total distributions | | $ | (0.282 | ) | | $ | (0.315 | ) | | $ | (0.367 | ) | | $ | (0.336 | ) | | $ | (0.336 | ) |
| | | | | |
Net asset value — End of year | | $ | 9.080 | | | $ | 9.360 | | | $ | 9.380 | | | $ | 8.830 | | | $ | 8.880 | |
| | | | | |
Total Return(3) | | | (0.02 | )% | | | 3.31 | % | | | 10.55 | % | | | 3.29 | % | | | 6.63 | % |
| | | | | |
| Ratios/Supplemental Data | | | | | | | | | | | | | | | | | | | | |
| | | | | |
Net assets, end of year (000’s omitted) | | $ | 412,905 | | | $ | 419,256 | | | $ | 427,334 | | | $ | 350,923 | | | $ | 344,822 | |
| | | | | |
Ratios (as a percentage of average daily net assets): | | | | | | | | | | | | | | | | | | | | |
| | | | | |
Expenses excluding interest and fees | | | 0.73 | % | | | 0.76 | % | | | 0.76 | % | | | 0.79 | % | | | 0.78 | % |
| | | | | |
Interest and fee expense(4) | | | 0.03 | % | | | 0.06 | % | | | 0.13 | % | | | 0.17 | % | | | 0.14 | % |
| | | | | |
Total expenses | | | 0.76 | % | | | 0.82 | % | | | 0.89 | % | | | 0.96 | % | | | 0.92 | % |
| | | | | |
Net investment income | | | 3.01 | % | | | 3.35 | % | | | 3.57 | % | | | 3.92 | % | | | 3.81 | % |
| | | | | |
Portfolio Turnover | | | 22 | % | | | 54 | % | | | 23 | % | | | 32 | % | | | 21 | % |
| (1) | Computed using average shares outstanding. |
| (2) | The per share amount is not in accord with the net realized and unrealized gain (loss) for the period because of the timing of Fund share transactions and the amount of the per share realized and unrealized gains and losses at such time. |
| (3) | Returns are historical and are calculated by determining the percentage change in net asset value with all distributions reinvested and do not reflect the effect of sales charges. |
| (4) | Interest and fee expense relates to the liability for floating rate notes issued in conjunction with residual interest bond transactions (see Note 1H). |
| | | | |
| | 23 | | See Notes to Financial Statements. |
Eaton Vance
High Yield Municipal Income Fund
January 31, 2022
Financial Highlights — continued
| | | | | | | | | | | | | | | | | | | | |
| | | Class C | |
| | | Year Ended January 31, | |
| | | 2022 | | | 2021 | | | 2020 | | | 2019 | | | 2018 | |
| | | | | |
Net asset value — Beginning of year | | $ | 8.660 | | | $ | 8.680 | | | $ | 8.170 | | | $ | 8.210 | | | $ | 8.010 | |
| | | | | |
| Income (Loss) From Operations | | | | | | | | | | | | | | | | | | | | |
| | | | | |
Net investment income(1) | | $ | 0.195 | | | $ | 0.219 | | | $ | 0.239 | | | $ | 0.252 | | | $ | 0.251 | |
| | | | | |
Net realized and unrealized gain (loss) | | | (0.259 | ) | | | (0.011 | )(2) | | | 0.551 | | | | (0.042 | ) | | | 0.199 | |
| | | | | |
Total income (loss) from operations | | $ | (0.064 | ) | | $ | 0.208 | | | $ | 0.790 | | | $ | 0.210 | | | $ | 0.450 | |
| | | | | |
| Less Distributions | | | | | | | | | | | | | | | | | | | | |
| | | | | |
From net investment income | | $ | (0.196 | ) | | $ | (0.228 | ) | | $ | (0.280 | ) | | $ | (0.250 | ) | | $ | (0.250 | ) |
| | | | | |
Total distributions | | $ | (0.196 | ) | | $ | (0.228 | ) | | $ | (0.280 | ) | | $ | (0.250 | ) | | $ | (0.250 | ) |
| | | | | |
Net asset value — End of year | | $ | 8.400 | | | $ | 8.660 | | | $ | 8.680 | | | $ | 8.170 | | | $ | 8.210 | |
| | | | | |
Total Return(3) | | | (0.78 | )% | | | 2.52 | % | | | 9.80 | % | | | 2.60 | % | | | 5.67 | % |
| | | | | |
| Ratios/Supplemental Data | | | | | | | | | | | | | | | | | | | | |
| | | | | |
Net assets, end of year (000’s omitted) | | $ | 82,817 | | | $ | 97,724 | | | $ | 139,608 | | | $ | 126,049 | | | $ | 173,844 | |
| | | | | |
Ratios (as a percentage of average daily net assets): | | | | | | | | | | | | | | | | | | | | |
| | | | | |
Expenses excluding interest and fees | | | 1.48 | % | | | 1.51 | % | | | 1.51 | % | | | 1.54 | % | | | 1.53 | % |
| | | | | |
Interest and fee expense(4) | | | 0.03 | % | | | 0.06 | % | | | 0.13 | % | | | 0.17 | % | | | 0.14 | % |
| | | | | |
Total expenses | | | 1.51 | % | | | 1.57 | % | | | 1.64 | % | | | 1.71 | % | | | 1.67 | % |
| | | | | |
Net investment income | | | 2.26 | % | | | 2.63 | % | | | 2.82 | % | | | 3.10 | % | | | 3.06 | % |
| | | | | |
Portfolio Turnover | | | 22 | % | | | 54 | % | | | 23 | % | | | 32 | % | | | 21 | % |
| (1) | Computed using average shares outstanding. |
| (2) | The per share amount is not in accord with the net realized and unrealized gain (loss) for the period because of the timing of Fund share transactions and the amount of the per share realized and unrealized gains and losses at such time. |
| (3) | Returns are historical and are calculated by determining the percentage change in net asset value with all distributions reinvested and do not reflect the effect of sales charges. |
| (4) | Interest and fee expense relates to the liability for floating rate notes issued in conjunction with residual interest bond transactions (see Note 1H). |
| | | | |
| | 24 | | See Notes to Financial Statements. |
Eaton Vance
High Yield Municipal Income Fund
January 31, 2022
Financial Highlights — continued
| | | | | | | | | | | | | | | | | | | | |
| | | Class I | |
| | | Year Ended January 31, | |
| | | 2022 | | | 2021 | | | 2020 | | | 2019 | | | 2018 | |
| | | | | |
Net asset value — Beginning of year | | $ | 9.370 | | | $ | 9.390 | | | $ | 8.840 | | | $ | 8.880 | | | $ | 8.660 | |
| | | | | |
| Income (Loss) From Operations | | | | | | | | | | | | | | | | | | | | |
| | | | | |
Net investment income(1) | | $ | 0.304 | | | $ | 0.326 | | | $ | 0.349 | | | $ | 0.364 | | | $ | 0.359 | |
| | | | | |
Net realized and unrealized gain (loss) | | | (0.279 | ) | | | (0.009 | )(2) | | | 0.590 | | | | (0.046 | ) | | | 0.220 | |
| | | | | |
Total income from operations | | $ | 0.025 | | | $ | 0.317 | | | $ | 0.939 | | | $ | 0.318 | | | $ | 0.579 | |
| | | | | |
| Less Distributions | | | | | | | | | | | | | | | | | | | | |
| | | | | |
From net investment income | | $ | (0.305 | ) | | $ | (0.337 | ) | | $ | (0.389 | ) | | $ | (0.358 | ) | | $ | (0.359 | ) |
| | | | | |
Total distributions | | $ | (0.305 | ) | | $ | (0.337 | ) | | $ | (0.389 | ) | | $ | (0.358 | ) | | $ | (0.359 | ) |
| | | | | |
Net asset value — End of year | | $ | 9.090 | | | $ | 9.370 | | | $ | 9.390 | | | $ | 8.840 | | | $ | 8.880 | |
| | | | | |
Total Return(3) | | | 0.24 | % | | | 3.57 | % | | | 10.81 | % | | | 3.67 | % | | | 6.77 | % |
| | | | | |
| Ratios/Supplemental Data | | | | | | | | | | | | | | | | | | | | |
| | | | | |
Net assets, end of year (000’s omitted) | | $ | 1,063,175 | | | $ | 994,877 | | | $ | 878,062 | | | $ | 656,830 | | | $ | 682,157 | |
| | | | | |
Ratios (as a percentage of average daily net assets): | | | | | | | | | | | | | | | | | | | | |
| | | | | |
Expenses excluding interest and fees | | | 0.48 | % | | | 0.51 | % | | | 0.51 | % | | | 0.54 | % | | | 0.53 | % |
| | | | | |
Interest and fee expense(4) | | | 0.03 | % | | | 0.06 | % | | | 0.13 | % | | | 0.17 | % | | | 0.14 | % |
| | | | | |
Total expenses | | | 0.51 | % | | | 0.57 | % | | | 0.64 | % | | | 0.71 | % | | | 0.67 | % |
| | | | | |
Net investment income | | | 3.25 | % | | | 3.59 | % | | | 3.81 | % | | | 4.13 | % | | | 4.04 | % |
| | | | | |
Portfolio Turnover | | | 22 | % | | | 54 | % | | | 23 | % | | | 32 | % | | | 21 | % |
| (1) | Computed using average shares outstanding. |
| (2) | The per share amount is not in accord with the net realized and unrealized gain (loss) for the period because of the timing of Fund share transactions and the amount of the per share realized and unrealized gains and losses at such time. |
| (3) | Returns are historical and are calculated by determining the percentage change in net asset value with all distributions reinvested. |
| (4) | Interest and fee expense relates to the liability for floating rate notes issued in conjunction with residual interest bond transactions (see Note 1H). |
| | | | |
| | 25 | | See Notes to Financial Statements. |
Eaton Vance
High Yield Municipal Income Fund
January 31, 2022
Financial Highlights — continued
| | | | |
| | | Class W | |
| | | Period Ended
January 31, 2022(1) | |
| |
Net asset value — Beginning of period | | $ | 9.320 | |
|
| Income (Loss) from Operations | |
| |
Net investment income(2) | | $ | 0.105 | |
| |
Net realized and unrealized loss | | | (0.224 | ) |
| |
Total loss from operations | | $ | (0.119 | ) |
|
| Less Distributions | |
| |
From net investment income | | $ | (0.111 | ) |
| |
Total distributions | | $ | (0.111 | ) |
| |
Net asset value — End of period | | $ | 9.090 | |
| |
Total Return(3)(4) | | | (1.30 | )%(5) |
|
| Ratios/Supplemental Data | |
| |
Net assets, end of period (000’s omitted) | | $ | 302 | |
| |
Ratios (as a percentage of average daily net assets): | | | | |
| |
Expenses excluding interest and fees(4) | | | 0.06 | %(6) |
| |
Interest and fee expense(7) | | | 0.03 | %(6) |
| |
Total expenses | | | 0.09 | %(6) |
| |
Net investment income | | | 3.34 | %(6) |
| |
Portfolio Turnover | | | 22 | %(5)(8) |
| (1) | For the period from the commencement of operations, October 1, 2021, to January 31, 2022. |
| (2) | Computed using average shares outstanding. |
| (3) | Returns are historical and are calculated by determining the percentage change in net asset value with all distributions reinvested. |
| (4) | The investment adviser reimbursed the total amount of the advisory fees paid (equal to 0.37% of average daily net assets for the period ended January 31, 2022). Absent this reimbursement, total return would be lower. |
| (7) | Interest and fee expense relates to the liability for floating rate notes issued in conjunction with residual interest bond transactions (see Note 1H). |
| (8) | For the year ended January 31, 2022. |
| | | | |
| | 26 | | See Notes to Financial Statements. |
Eaton Vance
High Yield Municipal Income Fund
January 31, 2022
Notes to Financial Statements
1 Significant Accounting Policies
Eaton Vance High Yield Municipal Income Fund (the Fund) is a diversified series of Eaton Vance Municipals Trust II (the Trust). The Trust is a Massachusetts business trust registered under the Investment Company Act of 1940, as amended (the 1940 Act), as an open-end management investment company. The Fund seeks to provide high current income exempt from regular federal income tax. The Fund primarily invests in high yield municipal obligations with maturities of ten years or more. The Fund offers four classes of shares. Class A shares are generally sold subject to a sales charge imposed at time of purchase. Class C shares are sold at net asset value and are generally subject to a contingent deferred sales charge (see Note 5). Effective January 25, 2019, Class C shares generally automatically convert to Class A shares ten years after their purchase and effective November 5, 2020, automatically convert to Class A shares eight years after their purchase as described in the Fund’s prospectus. Class I and Class W shares are sold at net asset value and are not subject to a sales charge. Class W shares are available for purchase only at the direction of the investment adviser or one of its affiliates on behalf of investors that are eligible clients of the investment adviser or its affiliates that have entered into a separate investment management or advisory agreement pursuant to which such clients pay an investment management or advisory fee, including investment vehicles that are sponsored, managed, advised or sub-advised by the investment adviser or its affiliates. Each class represents a pro-rata interest in the Fund, but votes separately on class-specific matters and (as noted below) is subject to different expenses. Realized and unrealized gains and losses are allocated daily to each class of shares based on the relative net assets of each class to the total net assets of the Fund. Net investment income, other than class-specific expenses, is allocated daily to each class of shares based upon the ratio of the value of each class’s paid shares to the total value of all paid shares. Each class of shares differs in its distribution plan and certain other class-specific expenses.
The following is a summary of significant accounting policies of the Fund. The policies are in conformity with accounting principles generally accepted in the United States of America (U.S. GAAP). The Fund is an investment company and follows accounting and reporting guidance in the Financial Accounting Standards Board (FASB) Accounting Standards Codification Topic 946.
A Investment Valuation — The following methodologies are used to determine the market value or fair value of investments.
Debt Obligations. Debt obligations are generally valued on the basis of valuations provided by third party pricing services, as derived from such services’ pricing models. Inputs to the models may include, but are not limited to, reported trades, executable bid and ask prices, broker/dealer quotations, prices or yields of securities with similar characteristics, interest rates, anticipated prepayments, benchmark curves or information pertaining to the issuer, as well as industry and economic events. The pricing services may use a matrix approach, which considers information regarding securities with similar characteristics to determine the valuation for a security. Short-term debt obligations purchased with a remaining maturity of sixty days or less for which a valuation from a third party pricing service is not readily available may be valued at amortized cost, which approximates fair value.
Derivatives. Financial futures contracts are valued at the closing settlement price established by the board of trade or exchange on which they are traded.
Fair Valuation. Investments for which valuations or market quotations are not readily available or are deemed unreliable are valued at fair value using methods determined in good faith by or at the direction of the Trustees of the Fund in a manner that most fairly reflects the security’s “fair value”, which is the amount that the Fund might reasonably expect to receive for the security upon its current sale in the ordinary course. Each such determination is based on a consideration of relevant factors, which are likely to vary from one pricing context to another. These factors may include, but are not limited to, the type of security, the existence of any contractual restrictions on the security’s disposition, the price and extent of public trading in similar securities of the issuer or of comparable companies or entities, quotations or relevant information obtained from broker/dealers or other market participants, information obtained from the issuer, analysts, and/or the appropriate stock exchange (for exchange-traded securities), an analysis of the company’s or entity’s financial statements, and an evaluation of the forces that influence the issuer and the market(s) in which the security is purchased and sold.
B Investment Transactions and Related Income — Investment transactions for financial statement purposes are accounted for on a trade date basis. Realized gains and losses on investments sold are determined on the basis of identified cost. Interest income is recorded on the basis of interest accrued, adjusted for amortization of premium or accretion of discount.
C Federal Taxes — The Fund’s policy is to comply with the provisions of the Internal Revenue Code applicable to regulated investment companies and to distribute to shareholders each year substantially all of its taxable, if any, and tax-exempt net investment income, and all or substantially all of its net realized capital gains. Accordingly, no provision for federal income or excise tax is necessary. The Fund intends to satisfy conditions which will enable it to designate distributions from the interest income generated by its investments in non-taxable municipal securities, which are exempt from regular federal income tax when received by the Fund, as exempt-interest dividends. The portion of such interest, if any, earned on private activity bonds issued after August 7, 1986, may be considered a tax preference item to shareholders.
As of January 31, 2022, the Fund had no uncertain tax positions that would require financial statement recognition, de-recognition, or disclosure. The Fund files a U.S. federal income tax return annually after its fiscal year-end, which is subject to examination by the Internal Revenue Service for a period of three years from the date of filing.
D Expenses — The majority of expenses of the Trust are directly identifiable to an individual fund. Expenses which are not readily identifiable to a specific fund are allocated taking into consideration, among other things, the nature and type of expense and the relative size of the funds.
E Legal Fees — Legal fees and other related expenses incurred as part of negotiations of the terms and requirement of capital infusions, or that are expected to result in the restructuring of, or a plan of reorganization for, an investment are recorded as realized losses. Ongoing expenditures to protect or enhance an investment are treated as operating expenses.
Eaton Vance
High Yield Municipal Income Fund
January 31, 2022
Notes to Financial Statements — continued
F Use of Estimates — The preparation of the financial statements in conformity with U.S. GAAP requires management to make estimates and assumptions that affect the reported amounts of assets and liabilities at the date of the financial statements and the reported amounts of income and expense during the reporting period. Actual results could differ from those estimates.
G Indemnifications — Under the Trust’s organizational documents, its officers and Trustees may be indemnified against certain liabilities and expenses arising out of the performance of their duties to the Fund. Under Massachusetts law, if certain conditions prevail, shareholders of a Massachusetts business trust (such as the Trust) could be deemed to have personal liability for the obligations of the Trust. However, the Trust’s Declaration of Trust contains an express disclaimer of liability on the part of Fund shareholders and the By-laws provide that the Trust shall assume, upon request by the shareholder, the defense on behalf of any Fund shareholders. Moreover, the By-laws also provide for indemnification out of Fund property of any shareholder held personally liable solely by reason of being or having been a shareholder for all loss or expense arising from such liability. Additionally, in the normal course of business, the Fund enters into agreements with service providers that may contain indemnification clauses. The Fund’s maximum exposure under these arrangements is unknown as this would involve future claims that may be made against the Fund that have not yet occurred.
H Floating Rate Notes Issued in Conjunction with Securities Held — The Fund may invest in residual interest bonds, also referred to as inverse floating rate securities, whereby the Fund may sell a variable or fixed rate bond for cash to a Special-Purpose Vehicle (the SPV), (which is generally organized as a trust), while at the same time, buying a residual interest in the assets and cash flows of the SPV. The bond is deposited into the SPV with the same CUSIP number as the bond sold to the SPV by the Fund, and which may have been, but is not required to be, the bond purchased from the Fund (the Bond). The SPV also issues floating rate notes (Floating Rate Notes) which are sold to third-parties. The residual interest bond held by the Fund gives the Fund the right (1) to cause the holders of the Floating Rate Notes to generally tender their notes at par, and (2) to have the Bond held by the SPV transferred to the Fund, thereby terminating the SPV. Should the Fund exercise such right, it would generally pay the SPV the par amount due on the Floating Rate Notes and exchange the residual interest bond for the underlying Bond. Pursuant to generally accepted accounting principles for transfers and servicing of financial assets and extinguishment of liabilities, the Fund accounts for the transaction described above as a secured borrowing by including the Bond in its Portfolio of Investments and the Floating Rate Notes as a liability under the caption “Payable for floating rate notes issued” in its Statement of Assets and Liabilities. The Floating Rate Notes have interest rates that generally reset weekly and their holders have the option to tender their notes to the SPV for redemption at par at each reset date. Accordingly, the fair value of the payable for floating rate notes issued approximates its carrying value. If measured at fair value, the payable for floating rate notes would have been considered as Level 2 in the fair value hierarchy (see Note 10) at January 31, 2022. Interest expense related to the Fund’s liability with respect to Floating Rate Notes is recorded as incurred. The SPV may be terminated by the Fund, as noted above, or by the occurrence of certain termination events as defined in the trust agreement, such as a downgrade in the credit quality of the underlying Bond, bankruptcy of or payment failure by the issuer of the underlying Bond, the inability to remarket Floating Rate Notes that have been tendered due to insufficient buyers in the market, or the failure by the SPV to obtain renewal of the liquidity agreement under which liquidity support is provided for the Floating Rate Notes up to one year. At January 31, 2022, the amount of the Fund’s Floating Rate Notes outstanding and the related collateral were $75,425,886 and $112,218,598, respectively. The range of interest rates on the Floating Rate Notes outstanding at January 31, 2022 was 0.09% to 0.16%. For the year ended January 31, 2022, the Fund’s average settled Floating Rate Notes outstanding and the average interest rate including fees were $79,606,164 and 0.67%, respectively.
In certain circumstances, the Fund may enter into shortfall and forbearance agreements with brokers by which the Fund agrees to reimburse the broker for the difference between the liquidation value of the Bond held by the SPV and the liquidation value of the Floating Rate Notes, as well as any shortfalls in interest cash flows. The Fund had no shortfalls as of January 31, 2022.
The Fund may also purchase residual interest bonds in a secondary market transaction without first owning the underlying bond. Such transactions are not required to be treated as secured borrowings. Shortfall agreements, if any, related to residual interest bonds purchased in a secondary market transaction are disclosed in the Portfolio of Investments.
The Fund’s investment policies and restrictions expressly permit investments in residual interest bonds. Such bonds typically offer the potential for yields exceeding the yields available on fixed rate bonds with comparable credit quality and maturity. These securities tend to underperform the market for fixed rate bonds in a rising long-term interest rate environment, but tend to outperform the market for fixed rate bonds when long-term interest rates decline. The value and income of residual interest bonds are generally more volatile than that of a fixed rate bond. The Fund’s investment policies do not allow the Fund to borrow money except as permitted by the 1940 Act. Management believes that the Fund’s restrictions on borrowing money and issuing senior securities (other than as specifically permitted) do not apply to Floating Rate Notes issued by the SPV and included as a liability in the Fund’s Statement of Assets and Liabilities. As secured indebtedness issued by an SPV, Floating Rate Notes are distinct from the borrowings and senior securities to which the Fund’s restrictions apply. Residual interest bonds held by the Fund are securities exempt from registration under Rule 144A of the Securities Act of 1933.
I Financial Futures Contracts — Upon entering into a financial futures contract, the Fund is required to deposit with the broker, either in cash or securities, an amount equal to a certain percentage of the contract amount (initial margin). Subsequent payments, known as variation margin, are made or received by the Fund each business day, depending on the daily fluctuations in the value of the underlying security, and are recorded as unrealized gains or losses by the Fund. Gains (losses) are realized upon the expiration or closing of the financial futures contracts. Should market conditions change unexpectedly, the Fund may not achieve the anticipated benefits of the financial futures contracts and may realize a loss. Futures contracts have minimal counterparty risk as they are exchange traded and the clearinghouse for the exchange is substituted as the counterparty, guaranteeing counterparty performance.
Eaton Vance
High Yield Municipal Income Fund
January 31, 2022
Notes to Financial Statements — continued
J When-Issued Securities and Delayed Delivery Transactions — The Fund may purchase securities on a delayed delivery or when-issued basis. Payment and delivery may take place after the customary settlement period for that security. At the time the transaction is negotiated, the price of the security that will be delivered is fixed. The Fund maintains cash and/or security positions for these commitments such that sufficient liquid assets will be available to make payments upon settlement. Securities purchased on a delayed delivery or when-issued basis are marked-to-market daily and begin earning interest on settlement date. Such security purchases are subject to the risk that when delivered they will be worth less than the agreed upon payment price. Losses may also arise if the counterparty does not perform under the contract.
2 Distributions to Shareholders and Income Tax Information
The net investment income of the Fund is determined daily and substantially all of the net investment income so determined is declared as a dividend to shareholders of record at the time of declaration. Distributions are declared separately for each class of shares. Distributions are paid monthly. Distributions of realized capital gains are made at least annually. Shareholders may reinvest income and capital gain distributions in additional shares of the same class of the Fund at the net asset value as of the reinvestment date or, at the election of the shareholder, receive distributions in cash. Distributions to shareholders are determined in accordance with income tax regulations, which may differ from U.S. GAAP. As required by U.S. GAAP, only distributions in excess of tax basis earnings and profits are reported in the financial statements as a return of capital. Permanent differences between book and tax accounting relating to distributions are reclassified to paid-in capital. For tax purposes, distributions from short-term capital gains are considered to be from ordinary income.
The tax character of distributions declared for the years ended January 31, 2022 and January 31, 2021 was as follows:
| | | | | | | | |
| | | Year Ended January 31, | |
| | | 2022 | | | 2021 | |
| | |
Tax-exempt income | | $ | 44,065,031 | | | $ | 44,038,788 | |
| | |
Ordinary income | | $ | 5,373,968 | | | $ | 4,693,395 | |
As of January 31, 2022, the components of distributable earnings (accumulated loss) on a tax basis were as follows:
| | | | |
| | |
Undistributed tax-exempt income | | $ | 624,325 | |
| |
Deferred capital losses | | | (51,887,792 | ) |
| |
Net unrealized appreciation | | | 81,070,566 | |
| |
Distributions payable | | | (621,878 | ) |
| |
Distributable earnings | | $ | 29,185,221 | |
At January 31, 2022, the Fund, for federal income tax purposes, had deferred capital losses of $51,887,792 which would reduce its taxable income arising from future net realized gains on investment transactions, if any, to the extent permitted by the Internal Revenue Code, and thus would reduce the amount of distributions to shareholders, which would otherwise be necessary to relieve the Fund of any liability for federal income or excise tax. The
deferred capital losses are treated as arising on the first day of the Fund’s next taxable year and retain the same short-term or long-term character as when originally deferred. Of the deferred capital losses at January 31, 2022, $17,355,393 are short-term and $34,532,399 are long-term.
The cost and unrealized appreciation (depreciation) of investments, including open derivative contracts, of the Fund at January 31, 2022, as determined on a federal income tax basis, were as follows:
| | | | |
| |
Aggregate cost | | $ | 1,430,827,940 | |
| |
Gross unrealized appreciation | | $ | 96,078,547 | |
| |
Gross unrealized depreciation | | | (15,007,981 | ) |
| |
Net unrealized appreciation | | $ | 81,070,566 | |
Eaton Vance
High Yield Municipal Income Fund
January 31, 2022
Notes to Financial Statements — continued
3 Investment Adviser Fee and Other Transactions with Affiliates
The investment adviser fee is earned by Boston Management and Research (BMR) as compensation for investment advisory services rendered to the Fund. On March 1, 2021, Morgan Stanley acquired Eaton Vance Corp. (the “Transaction”) and BMR became an indirect, wholly-owned subsidiary of Morgan Stanley. In connection with the Transaction, the Fund entered into a new investment advisory agreement (the “New Agreement”) with BMR, which took effect on March 1, 2021. The Fund’s prior fee reduction agreement was incorporated into the New Agreement. Pursuant to the New Agreement (and the Fund’s investment advisory agreement and related fee reduction agreement with BMR in effect prior to March 1, 2021), the fee is based upon a percentage of the Fund’s total daily net assets plus a percentage of total daily gross income (i.e., income other than gains from the sale of securities) as follows and is payable monthly:
| | | | | | | | | | |
| Total Daily Net Assets | | Annual Asset
Rate | | | Total Daily Net Assets | | Daily Income
Rate | |
| | | |
up to $500 million | | | 0.3150 | % | | up to $500 million | | | 3.1500 | % |
| | | |
$500 million but less than $750 million | | | 0.2925 | % | | $500 million but less than $1 billion | | | 2.9250 | % |
| | | |
$750 million but less than $1.5 billion | | | 0.2700 | % | | $1 billion but less than $1.5 billion | | | 2.7000 | % |
| | | |
$1.5 billion but less than $2 billion | | | 0.2475 | % | | $1.5 billion but less than $2 billion | | | 2.4750 | % |
| | | |
$2 billion but less than $3 billion | | | 0.2250 | % | | $2 billion but less than $3 billion | | | 2.2500 | % |
| | | |
$3 billion and over | | | 0.2025 | % | | $3 billion and over | | | 2.0250 | % |
For the year ended January 31, 2022, the investment adviser fee amounted to $6,223,102 or 0.39% of the Fund’s average daily net assets.
BMR has agreed to reimburse the total amount of advisory fees paid by Class W shares. This agreement may be changed or terminated after September 30, 2024. Pursuant to this agreement, BMR was allocated $192 of the advisory fees paid by Class W shares for the period from the commencement of operations, October 1, 2021, to January 31, 2022.
Eaton Vance Management (EVM), an affiliate of BMR and, effective March 1, 2021, an indirect, wholly-owned subsidiary of Morgan Stanley, serves as the administrator of the Fund, but receives no compensation. EVM provides sub-transfer agency and related services to the Fund pursuant to a Sub-Transfer Agency Support Services Agreement. For the year ended January 31, 2022, EVM earned $25,514 from the Fund pursuant to such agreement, which is included in transfer and dividend disbursing agent fees on the Statement of Operations. The Fund was informed that Eaton Vance Distributors, Inc. (EVD), an affiliate of EVM and the Fund’s principal underwriter, received $36,553 as its portion of the sales charge on sales of Class A shares for the year ended January 31, 2022. The Fund was informed that Morgan Stanley affiliated broker-dealers, which may be deemed to be affiliates of BMR, EVM and EVD, also received a portion of the sales charge on sales of Class A shares from March 1, 2021 through January 31, 2022 in the amount of $15,813. EVD also received distribution and service fees from Class A and Class C shares (see Note 4) and contingent deferred sales charges (see Note 5).
Trustees and officers of the Fund who are members of EVM’s or BMR’s organizations receive remuneration for their services to the Fund out of the investment adviser fee. Trustees of the Fund who are not affiliated with the investment adviser may elect to defer receipt of all or a percentage of their annual fees in accordance with the terms of the Trustees Deferred Compensation Plan. For the year ended January 31, 2022, no significant amounts have been deferred. Certain officers and Trustees of the Fund are officers of the above organizations.
4 Distribution Plans
The Fund has in effect a distribution plan for Class A shares (Class A Plan) pursuant to Rule 12b-1 under the 1940 Act. Pursuant to the Class A Plan, the Fund pays EVD a distribution and service fee of 0.25% per annum of its average daily net assets attributable to Class A shares for distribution services and facilities provided to the Fund by EVD, as well as for personal services and/or the maintenance of shareholder accounts. Distribution and service fees paid or accrued to EVD for the year ended January 31, 2022 amounted to $1,043,154 for Class A shares.
The Fund also has in effect a distribution plan for Class C shares (Class C Plan) pursuant to Rule 12b-1 under the 1940 Act. Pursuant to the Class C Plan, the Fund pays EVD amounts equal to 0.75% per annum of its average daily net assets attributable to Class C shares for providing ongoing distribution services and facilities to the Fund. For the year ended January 31, 2022, the Fund paid or accrued to EVD $679,954 for Class C shares.
Pursuant to the Class C Plan, the Fund also makes payments of service fees to EVD, financial intermediaries and other persons in amounts equal to 0.25% per annum of its average daily net assets attributable to Class C shares. Service fees paid or accrued are for personal services and/or the maintenance of shareholder accounts. They are separate and distinct from the sales commissions and distribution fees payable to EVD. Service fees paid or accrued for the year ended January 31, 2022 amounted to $226,651 for Class C shares.
Distribution and service fees are subject to the limitations contained in the Financial Industry Regulatory Authority Rule 2341(d).
Eaton Vance
High Yield Municipal Income Fund
January 31, 2022
Notes to Financial Statements — continued
5 Contingent Deferred Sales Charges
A contingent deferred sales charge (CDSC) of 1% generally is imposed on redemptions of Class C shares made within 12 months of purchase. Class A shares may be subject to a 1% CDSC if redeemed within 18 months of purchase (depending on the circumstances of purchase). Generally, the CDSC is based upon the lower of the net asset value at date of redemption or date of purchase. No charge is levied on shares acquired by reinvestment of dividends or capital gain distributions. For the year ended January 31, 2022, the Fund was informed that EVD received approximately $10,000 and $2,000 of CDSCs paid by Class A and Class C shareholders, respectively.
6 Purchases and Sales of Investments
Purchases and sales of investments, other than short-term obligations, aggregated $493,291,453 and $347,987,906, respectively, for the year ended January 31, 2022.
7 Shares of Beneficial Interest
The Fund’s Declaration of Trust permits the Trustees to issue an unlimited number of full and fractional shares of beneficial interest (without par value). Such shares may be issued in a number of different series (such as the Fund) and classes. Transactions in Fund shares were as follows:
| | | | | | | | |
| | | Year Ended January 31, | |
| Class A | | 2022 | | | 2021 | |
| | |
Sales | | | 6,578,951 | | | | 11,089,108 | |
| | |
Issued to shareholders electing to receive payments of distributions in Fund shares | | | 1,074,501 | | | | 1,209,516 | |
| | |
Redemptions | | | (7,522,378 | ) | | | (14,758,398 | ) |
| | |
Converted from Class C shares | | | 532,706 | | | | 1,708,340 | |
| | |
Net increase (decrease) | | | 663,780 | | | | (751,434 | ) |
| |
| | | Year Ended January 31, | |
| Class C | | 2022 | | | 2021 | |
| | |
Sales | | | 1,266,760 | | | | 1,853,527 | |
| | |
Issued to shareholders electing to receive payments of distributions in Fund shares | | | 214,231 | | | | 317,612 | |
| | |
Redemptions | | | (2,336,171 | ) | | | (5,122,910 | ) |
| | |
Converted to Class A shares | | | (575,943 | ) | | | (1,847,173 | ) |
| | |
Net decrease | | | (1,431,123 | ) | | | (4,798,944 | ) |
| |
| | | Year Ended January 31, | |
| Class I | | 2022 | | | 2021 | |
| | |
Sales | | | 39,654,609 | | | | 63,578,798 | |
| | |
Issued to shareholders electing to receive payments of distributions in Fund shares | | | 3,253,997 | | | | 3,101,533 | |
| | |
Redemptions | | | (32,166,004 | ) | | | (53,992,591 | ) |
| | |
Net increase | | | 10,742,602 | | | | 12,687,740 | |
Eaton Vance
High Yield Municipal Income Fund
January 31, 2022
Notes to Financial Statements — continued
| | | | | | | | |
| Class W | | Period Ended
January 31, 2022(1) | | | | |
| | |
Sales | | | 33,158 | | | | | |
| | |
Issued to shareholders electing to receive payments of distributions in Fund shares | | | 13 | | | | | |
| | |
Net increase | | | 33,171 | | | | | |
| (1) | For the period from the commencement of operations, October 1, 2021, to January 31, 2022. |
8 Line of Credit
The Fund participates with other portfolios and funds managed by EVM and its affiliates in an $800 million unsecured line of credit agreement with a group of banks, which is in effect through October 25, 2022. Borrowings are made by the Fund solely for temporary purposes related to redemptions and other short-term cash needs. Interest is charged to the Fund based on its borrowings at an amount above either the Secured Overnight Financing Rate (SOFR) or Federal Funds rate. In addition, a fee computed at an annual rate of 0.15% on the daily unused portion of the line of credit is allocated among the participating portfolios and funds at the end of each quarter. In connection with the renewal of the agreement in October 2021, an upfront fee and arrangement fee totaling $150,000 was incurred that was allocated to the participating portfolios and funds. Because the line of credit is not available exclusively to the Fund, it may be unable to borrow some or all of its requested amounts at any particular time. The Fund did not have any significant borrowings or allocated fees during the year ended January 31, 2022.
9 Financial Instruments
The Fund may trade in financial instruments with off-balance sheet risk in the normal course of its investing activities. These financial instruments may include financial futures contracts and may involve, to a varying degree, elements of risk in excess of the amounts recognized for financial statement purposes. The notional or contractual amounts of these instruments represent the investment the Fund has in particular classes of financial instruments and do not necessarily represent the amounts potentially subject to risk. The measurement of the risks associated with these instruments is meaningful only when all related and offsetting transactions are considered. A summary of obligations under these financial instruments at January 31, 2022 is included in the Portfolio of Investments. At January 31, 2022, the Fund had sufficient cash and/or securities to cover commitments under these contracts.
The Fund is subject to interest rate risk in the normal course of pursuing its investment objective. Because the Fund holds fixed-rate bonds, the value of these bonds may decrease if interest rates rise. The Fund enters into U.S. Treasury futures contracts to hedge against changes in interest rates.
The fair value of open derivative instruments (not considered to be hedging instruments for accounting disclosure purposes) and whose primary underlying risk exposure is interest rate risk at January 31, 2022 was as follows:
| | | | | | | | |
| | | Fair Value | |
| Derivative | | Asset Derivative(1) | | | Liability Derivative | |
| | |
Futures Contracts | | $ | 490,663 | | | $ | — | |
| (1) | Only the current day’s variation margin on open futures contracts is reported within the Statement of Assets and Liabilities as Receivable or Payable for variation margin on open financial futures contracts, as applicable. |
The effect of derivative instruments (not considered to be hedging instruments for accounting disclosure purposes) on the Statement of Operations and whose primary underlying risk exposure is interest rate risk for the year ended January 31, 2022 was as follows:
| | | | | | | | |
| Derivative | | Realized Gain (Loss)
on Derivatives Recognized
in Income(1) | | | Change in Unrealized
Appreciation (Depreciation) on
Derivatives Recognized in Income(2) | |
| | |
Futures Contracts | | $ | 2,186,916 | | | $ | (426,198 | ) |
| (1) | Statement of Operations location: Net realized gain (loss) – Financial futures contracts. |
| (2) | Statement of Operations location: Change in unrealized appreciation (depreciation) – Financial futures contracts. |
The average notional cost of futures contracts (short) outstanding during the year ended January 31, 2022, which is indicative of the volume of this derivative type, was approximately $41,211,000.
Eaton Vance
High Yield Municipal Income Fund
January 31, 2022
Notes to Financial Statements — continued
10 Fair Value Measurements
Under generally accepted accounting principles for fair value measurements, a three-tier hierarchy to prioritize the assumptions, referred to as inputs, is used in valuation techniques to measure fair value. The three-tier hierarchy of inputs is summarized in the three broad levels listed below.
| • | | Level 1 – quoted prices in active markets for identical investments |
| • | | Level 2 – other significant observable inputs (including quoted prices for similar investments, interest rates, prepayment speeds, credit risk, etc.) |
| • | | Level 3 – significant unobservable inputs (including a fund’s own assumptions in determining the fair value of investments) |
In cases where the inputs used to measure fair value fall in different levels of the fair value hierarchy, the level disclosed is determined based on the lowest level input that is significant to the fair value measurement in its entirety. The inputs or methodology used for valuing securities are not necessarily an indication of the risk associated with investing in those securities.
At January 31, 2022, the hierarchy of inputs used in valuing the Fund’s investments and open derivative instruments, which are carried at value, were as follows:
| | | | | | | | | | | | | | | | |
| Asset Description | | Level 1 | | | Level 2 | | | Level 3 | | | Total | |
| | | | |
Corporate Bonds | | $ | — | | | $ | 43,557,743 | | | $ | — | | | $ | 43,557,743 | |
| | | | |
Tax-Exempt Municipal Obligations | | | — | | | | 1,459,613,747 | | | | — | | | | 1,459,613,747 | |
| | | | |
Taxable Municipal Obligations | | | — | | | | 84,152,902 | | | | — | | | | 84,152,902 | |
| | | | |
Total Investments | | $ | — | | | $ | 1,587,324,392 | | | $ | — | | | $ | 1,587,324,392 | |
| | | | |
Futures Contracts | | $ | 490,663 | | | $ | — | | | $ | — | | | $ | 490,663 | |
| | | | |
Total | | $ | 490,663 | | | $ | 1,587,324,392 | | | $ | — | | | $ | 1,587,815,055 | |
11 Risks and Uncertainties
Pandemic Risk
An outbreak of respiratory disease caused by a novel coronavirus was first detected in China in late 2019 and subsequently spread internationally. This coronavirus has resulted in closing borders, enhanced health screenings, changes to healthcare service preparation and delivery, quarantines, cancellations, disruptions to supply chains and customer activity, as well as general concern and uncertainty. Health crises caused by outbreaks, such as the coronavirus outbreak, may exacerbate other pre-existing political, social and economic risks and disrupt normal market conditions and operations. The impact of this outbreak has negatively affected the worldwide economy, the economies of individual countries, individual companies, and the market in general, and may continue to do so in significant and unforeseen ways, as may other epidemics and pandemics that may arise in the future. Any such impact could adversely affect the Fund’s performance, or the performance of the securities in which the Fund invests.
Eaton Vance
High Yield Municipal Income Fund
January 31, 2022
Report of Independent Registered Public Accounting Firm
To the Trustees of Eaton Vance Municipals Trust II and Shareholders of Eaton Vance High Yield Municipal Income Fund:
Opinion on the Financial Statements and Financial Highlights
We have audited the accompanying statement of assets and liabilities of Eaton Vance High Yield Municipal Income Fund (the “Fund”) (one of the funds constituting Eaton Vance Municipals Trust II), including the portfolio of investments, as of January 31, 2022, the related statement of operations for the year then ended, the statements of changes in net assets for each of the two years in the period then ended, the financial highlights for each of the five years in the period then ended, and the related notes. In our opinion, the financial statements and financial highlights present fairly, in all material respects, the financial position of the Fund as of January 31, 2022, and the results of its operations for the year then ended, the changes in its net assets for each of the two years in the period then ended, and the financial highlights for each of the five years in the period then ended, in conformity with accounting principles generally accepted in the United States of America.
Basis for Opinion
These financial statements and financial highlights are the responsibility of the Fund’s management. Our responsibility is to express an opinion on the Fund’s financial statements and financial highlights based on our audits. We are a public accounting firm registered with the Public Company Accounting Oversight Board (United States) (PCAOB) and are required to be independent with respect to the Fund in accordance with the U.S. federal securities laws and the applicable rules and regulations of the Securities and Exchange Commission and the PCAOB.
We conducted our audits in accordance with the standards of the PCAOB. Those standards require that we plan and perform the audit to obtain reasonable assurance about whether the financial statements and financial highlights are free of material misstatement, whether due to error or fraud. The Fund is not required to have, nor were we engaged to perform, an audit of its internal control over financial reporting. As part of our audits, we are required to obtain an understanding of internal control over financial reporting but not for the purpose of expressing an opinion on the effectiveness of the Fund’s internal control over financial reporting. Accordingly, we express no such opinion.
Our audits included performing procedures to assess the risks of material misstatement of the financial statements and financial highlights, whether due to error or fraud, and performing procedures that respond to those risks. Such procedures included examining, on a test basis, evidence regarding the amounts and disclosures in the financial statements and financial highlights. Our audits also included evaluating the accounting principles used and significant estimates made by management, as well as evaluating the overall presentation of the financial statements and financial highlights. Our procedures included confirmation of securities owned as of January 31, 2022, by correspondence with the custodian and brokers; when replies were not received from brokers, we performed other auditing procedures. We believe that our audits provide a reasonable basis for our opinion.
/s/ Deloitte & Touche LLP
Boston, Massachusetts
March 22, 2022
We have served as the auditor of one or more Eaton Vance investment companies since 1959.
Eaton Vance
High Yield Municipal Income Fund
January 31, 2022
Federal Tax Information (Unaudited)
The Form 1099-DIV you receive in February 2023 will show the tax status of all distributions paid to your account in calendar year 2022. Shareholders are advised to consult their own tax adviser with respect to the tax consequences of their investment in the Fund. As required by the Internal Revenue Code and/or regulations, shareholders must be notified regarding exempt-interest dividends.
Exempt-Interest Dividends. For the fiscal year ended January 31, 2022, the Fund designates 89.13% of distributions from net investment income as an exempt-interest dividend.
Eaton Vance
High Yield Municipal Income Fund
January 31, 2022
Management and Organization
Fund Management. The Trustees of Eaton Vance Municipals Trust II (the Trust) are responsible for the overall management and supervision of the Trust’s affairs. The Board members and officers of the Trust are listed below. Except as indicated, each individual has held the office shown or other offices in the same company for the last five years. Board members hold indefinite terms of office. Each Trustee holds office until his or her successor is elected and qualified, subject to a prior death, resignation, retirement, disqualification or removal. Under the terms of the Fund’s current Trustee retirement policy, an Independent Trustee must retire and resign as a Trustee on the earlier of: (i) the first day of July following his or her 74th birthday; or (ii), with limited exception, December 31st of the 20th year in which he or she has served as a Trustee. However, if such retirement and resignation would cause the Fund to be out of compliance with Section 16 of the 1940 Act or any other regulations or guidance of the SEC, then such retirement and resignation will not become effective until such time as action has been taken for the Fund to be in compliance therewith. The “noninterested Trustees” consist of those Trustees who are not “interested persons” of the Trust, as that term is defined under the 1940 Act. The business address of each Board member and officer is Two International Place, Boston, Massachusetts 02110. As used below, “BMR” refers to Boston Management and Research, “EVC” refers to Eaton Vance Corp., “EV” refers to EV LLC, “EVM” refers to Eaton Vance Management and “EVD” refers to Eaton Vance Distributors, Inc. EV is the trustee of each of EVM and BMR. Effective March 1, 2021, each of EVM, BMR, EVD and EV are indirect, wholly owned subsidiaries of Morgan Stanley. Each officer affiliated with EVM may hold a position with other EVM affiliates that is comparable to his or her position with EVM listed below. Each Trustee oversees 138 funds (with the exception of Messrs. Faust and Wennerholm and Ms. Frost who oversee 137 funds) in the Eaton Vance fund complex (including both funds and portfolios in a hub and spoke structure).
| | | | | | |
| Name and Year of Birth | | Trust
Position(s) | | Length of Service | | Principal Occupation(s) and Other Directorships During Past Five Years and Other Relevant Experience |
|
| Interested Trustee |
| | | |
Thomas E. Faust Jr. 1958 | | Trustee | | Since 2007 | | Chairman of Morgan Stanley Investment Management, Inc. (MSIM), member of the Board of Managers and President of EV, Chief Executive Officer of EVM and BMR, and Director of EVD. Formerly, Chairman, Chief Executive Officer and President of EVC. Mr. Faust is an interested person because of his positions with MSIM, BMR, EVM, EVD, and EV, which are affiliates of the Trust, and his former position with EVC, which was an affiliate of the Trust prior to March 1, 2021. Other Directorships. Formerly, Director of EVC (2007-2021) and Hexavest Inc. (investment management firm) (2012-2021). |
| | |
| Noninterested Trustees | | | | |
| | | |
Mark R. Fetting 1954 | | Trustee | | Since 2016 | | Private investor. Formerly held various positions at Legg Mason, Inc. (investment management firm) (2000-2012), including President, Chief Executive Officer, Director and Chairman (2008-2012), Senior Executive Vice President (2004-2008) and Executive Vice President (2001-2004). Formerly, President of Legg Mason family of funds (2001-2008). Formerly, Division President and Senior Officer of Prudential Financial Group, Inc. and related companies (investment management firm) (1991-2000). Other Directorships. None. |
| | | |
Cynthia E. Frost 1961 | | Trustee | | Since 2014 | | Private investor. Formerly, Chief Investment Officer of Brown University (university endowment) (2000-2012). Formerly, Portfolio Strategist for Duke Management Company (university endowment manager) (1995-2000). Formerly, Managing Director, Cambridge Associates (investment consulting company) (1989-1995). Formerly, Consultant, Bain and Company (management consulting firm) (1987-1989). Formerly, Senior Equity Analyst, BA Investment Management Company (1983-1985). Other Directorships. None. |
| | | |
George J. Gorman 1952 | | Chairperson of the Board and Trustee | | Since 2021 (Chairperson) and 2014 (Trustee) | | Principal at George J. Gorman LLC (consulting firm). Formerly, Senior Partner at Ernst & Young LLP (a registered public accounting firm) (1974-2009). Other Directorships. None. |
| | | |
Valerie A. Mosley 1960 | | Trustee | | Since 2014 | | Chairwoman and Chief Executive Officer of Valmo Ventures (a consulting and investment firm). Founder of Upward Wealth, Inc., dba BrightUP, a fintech platform. Formerly, Partner and Senior Vice President, Portfolio Manager and Investment Strategist at Wellington Management Company, LLP (investment management firm) (1992-2012). Formerly, Chief Investment Officer, PG Corbin Asset Management (1990-1992). Formerly worked in institutional corporate bond sales at Kidder Peabody (1986-1990). Other Directorships. Director of DraftKings, Inc. (digital sports entertainment and gaming company) (since September 2020). Director of Groupon, Inc. (e-commerce provider) (since April 2020). Director of Envestnet, Inc. (provider of intelligent systems for wealth management and financial wellness) (since 2018). Formerly, Director of Dynex Capital, Inc. (mortgage REIT) (2013-2020). |
Eaton Vance
High Yield Municipal Income Fund
January 31, 2022
Management and Organization — continued
| | | | | | |
| Name and Year of Birth | | Trust
Position(s) | | Length of Service | | Principal Occupation(s) and Other Directorships During Past Five Years and Other Relevant Experience |
| | |
| Noninterested Trustees (continued) | | | | |
| | | |
William H. Park 1947 | | Trustee | | Since 2003 | | Private investor. Formerly, Consultant (management and transactional) (2012-2014). Formerly, Chief Financial Officer, Aveon Group L.P. (investment management firm) (2010-2011). Formerly, Vice Chairman, Commercial Industrial Finance Corp. (specialty finance company) (2006-2010). Formerly, President and Chief Executive Officer, Prizm Capital Management, LLC (investment management firm) (2002-2005). Formerly, Executive Vice President and Chief Financial Officer, United Asset Management Corporation (investment management firm) (1982-2001). Formerly, Senior Manager, Price Waterhouse (now PricewaterhouseCoopers) (a registered public accounting firm) (1972-1981). Other Directorships. None. |
| | | |
Helen Frame Peters 1948 | | Trustee | | Since 2008 | | Professor of Finance, Carroll School of Management, Boston College. Formerly, Dean, Carroll School of Management, Boston College (2000-2002). Formerly, Chief Investment Officer, Fixed Income, Scudder Kemper Investments (investment management firm) (1998-1999). Formerly, Chief Investment Officer, Equity and Fixed Income, Colonial Management Associates (investment management firm) (1991-1998). Other Directorships. None. |
| | | |
Keith Quinton 1958 | | Trustee | | Since 2018 | | Private investor, researcher and lecturer. Formerly, Independent Investment Committee Member at New Hampshire Retirement System (2017-2021). Formerly, Portfolio Manager and Senior Quantitative Analyst at Fidelity Investments (investment management firm) (2001-2014). Other Directorships. Formerly, Director (2016-2021) and Chairman (2019-2021) of New Hampshire Municipal Bond Bank. |
| | | |
Marcus L. Smith 1966 | | Trustee | | Since 2018 | | Private investor and independent corporate director. Formerly, Chief Investment Officer, Canada (2012-2017), Chief Investment Officer, Asia (2010-2012), Director of Asian Research (2004-2010) and portfolio manager (2001-2017) at MFS Investment Management (investment management firm). Other Directorships. Director of First Industrial Realty Trust, Inc. (an industrial REIT) (since 2021). Director of MSCI Inc. (global provider of investment decision support tools) (since 2017). Formerly, Director of DCT Industrial Trust Inc. (logistics real estate company) (2017-2018). |
| | | |
Susan J. Sutherland 1957 | | Trustee | | Since 2015 | | Private investor. Director of Ascot Group Limited and certain of its subsidiaries (insurance and reinsurance) (since 2017). Formerly, Director of Hagerty Holding Corp. (insurance) (2015-2018) and Montpelier Re Holdings Ltd. (insurance and reinsurance) (2013-2015). Formerly, Associate, Counsel and Partner at Skadden, Arps, Slate, Meagher & Flom LLP (law firm) (1982-2013). Other Directorships. Director of Kairos Acquisition Corp. (insurance/InsurTech acquisition company) (since 2021). |
| | | |
Scott E. Wennerholm 1959 | | Trustee | | Since 2016 | | Private investor. Formerly, Trustee at Wheelock College (postsecondary institution) (2012-2018). Formerly, Consultant at GF Parish Group (executive recruiting firm) (2016-2017). Formerly, Chief Operating Officer and Executive Vice President at BNY Mellon Asset Management (investment management firm) (2005-2011). Formerly, Chief Operating Officer and Chief Financial Officer at Natixis Global Asset Management (investment management firm) (1997-2004). Formerly, Vice President at Fidelity Investments Institutional Services (investment management firm) (1994-1997). Other Directorships. None. |
| | | | | | |
| Name and Year of Birth | | Trust
Position(s) | | Length of Service | | Principal Occupation(s) During Past Five Years |
| |
| Principal Officers who are not Trustees | | |
| | | |
Eric A. Stein 1980 | | President | | Since 2020 | | Vice President and Chief Investment Officer, Fixed Income of EVM and BMR. Prior to November 1, 2020, Mr. Stein was a co-Director of Eaton Vance’s Global Income Investments. Also Vice President of Calvert Research and Management (“CRM”). |
Eaton Vance
High Yield Municipal Income Fund
January 31, 2022
Management and Organization — continued
| | | | | | |
| Name and Year of Birth | | Trust
Position(s) | | Length of Service | | Principal Occupation(s) During Past Five Years |
| |
| Principal Officers who are not Trustees (continued) | | |
| | | |
Deidre E. Walsh 1971 | | Vice President and Chief Legal Officer | | Since 2009 | | Vice President of EVM and BMR. Also Vice President of CRM. |
| | | |
James F. Kirchner 1967 | | Treasurer | | Since 2007 | | Vice President of EVM and BMR. Also Vice President of CRM. |
| | | |
Jill R. Damon 1984 | | Secretary | | Since 2022 | | Vice President of EVM and BMR since 2017. Formerly, associate at Dechert LLP (2009-2017). |
| | | |
Richard F. Froio 1968 | | Chief Compliance Officer | | Since 2017 | | Vice President of EVM and BMR since 2017. Formerly, Deputy Chief Compliance Officer (Adviser/Funds) and Chief Compliance Officer (Distribution) at PIMCO (2012-2017) and Managing Director at BlackRock/Barclays Global Investors (2009-2012). |
The SAI for the Fund includes additional information about the Trustees and officers of the Trust and can be obtained without charge on Eaton Vance’s website at www.eatonvance.com or by calling 1-800-262-1122.
Eaton Vance Funds
| | |
| Privacy Notice | | April 2021 |
| | |
| |
| FACTS | | WHAT DOES EATON VANCE DO WITH YOUR
PERSONAL INFORMATION? |
| | | |
| |
| | |
| Why? | | Financial companies choose how they share your personal information. Federal law gives consumers the right to limit some but not all sharing. Federal law also requires us to tell you how we collect, share, and protect your personal information. Please read this notice carefully to understand what we do. |
| | |
| | | |
| What? | | The types of personal information we collect and share depend on the product or service you have with us. This information can include: ∎ Social Security number and income ∎ investment experience and risk tolerance ∎ checking account number and wire transfer instructions |
| | |
| | | |
| How? | | All financial companies need to share customers’ personal information to run their everyday business. In the section below, we list the reasons financial companies can share their customers’ personal information; the reasons Eaton Vance chooses to share; and whether you can limit this sharing. |
| | |
| | | |
| | | | |
Reasons we can share your
personal information | | Does Eaton Vance share? | | Can you limit this sharing? |
| For our everyday business purposes — such as to process your transactions, maintain your account(s), respond to court orders and legal investigations, or report to credit bureaus | | Yes | | No |
| For our marketing purposes — to offer our products and services to you | | Yes | | No |
| For joint marketing with other financial companies | | No | | We don’t share |
| For our investment management affiliates’ everyday business purposes — information about your transactions, experiences, and creditworthiness | | Yes | | Yes |
| For our affiliates’ everyday business purposes — information about your transactions and experiences | | Yes | | No |
| For our affiliates’ everyday business purposes — information about your creditworthiness | | No | | We don’t share |
| For our investment management affiliates to market to you | | Yes | | Yes |
| For our affiliates to market to you | | No | | We don’t share |
| For nonaffiliates to market to you | | No | | We don’t share |
| | |
| To limit our sharing | | Call toll-free 1-800-262-1122 or email: EVPrivacy@eatonvance.com Please note: If you are a new customer, we can begin sharing your information 30 days from the date we sent this notice. When you are no longer our customer, we continue to share your information as described in this notice. However, you can contact us at any time to limit our sharing. |
| | |
| | | |
| | |
| Questions? | | Call toll-free 1-800-262-1122 or email: EVPrivacy@eatonvance.com |
| | |
| | | |
Eaton Vance Funds
| | |
| Privacy Notice — continued | | April 2021 |
| | |
| Who we are |
| Who is providing this notice? | | Eaton Vance Management, Eaton Vance Distributors, Inc., Eaton Vance Trust Company, Eaton Vance Management (International) Limited, Eaton Vance Advisers International Ltd., Eaton Vance Global Advisors Limited, Eaton Vance Management’s Real Estate Investment Group, Boston Management and Research, Calvert Research and Management, Eaton Vance and Calvert Fund Families and our investment advisory affiliates (“Eaton Vance”) (see Investment Management Affiliates definition below) |
| What we do |
| How does Eaton Vance protect my personal information? | | To protect your personal information from unauthorized access and use, we use security measures that comply with federal law. These measures include computer safeguards and secured files and buildings. We have policies governing the proper handling of customer information by personnel and requiring third parties that provide support to adhere to appropriate security standards with respect to such information. |
| How does Eaton Vance collect my personal information? | | We collect your personal information, for example, when you ∎ open an account or make deposits or withdrawals from your account ∎ buy securities from us or make a wire transfer ∎ give us your contact information We also collect your personal information from others, such as credit bureaus, affiliates, or other companies. |
| Why can’t I limit all sharing? | | Federal law gives you the right to limit only ∎ sharing for affiliates’ everyday business purposes — information about your creditworthiness ∎ affiliates from using your information to market to you ∎ sharing for nonaffiliates to market to you State laws and individual companies may give you additional rights to limit sharing. See below for more on your rights under state law. |
| Definitions |
| Investment Management Affiliates | | Eaton Vance Investment Management Affiliates include registered investment advisers, registered broker-dealers, and registered and unregistered funds. Investment Management Affiliates does not include entities associated with Morgan Stanley Wealth Management, such as Morgan Stanley Smith Barney LLC and Morgan Stanley & Co. |
| Affiliates | | Companies related by common ownership or control. They can be financial and nonfinancial companies. ∎ Our affiliates include companies with a Morgan Stanley name and financial companies such as Morgan Stanley Smith Barney LLC and Morgan Stanley & Co. |
| Nonaffiliates | | Companies not related by common ownership or control. They can be financial and nonfinancial companies. ∎ Eaton Vance does not share with nonaffiliates so they can market to you. |
| Joint marketing | | A formal agreement between nonaffiliated financial companies that together market financial products or services to you. ∎ Eaton Vance doesn’t jointly market. |
| Other important information |
Vermont: Except as permitted by law, we will not share personal information we collect about Vermont residents with Nonaffiliates unless you provide us with your written consent to share such information. California: Except as permitted by law, we will not share personal information we collect about California residents with Nonaffiliates and we will limit sharing such personal information with our Affiliates to comply with California privacy laws that apply to us. |
Eaton Vance Funds
IMPORTANT NOTICES
Delivery of Shareholder Documents. The Securities and Exchange Commission (SEC) permits funds to deliver only one copy of shareholder documents, including prospectuses, proxy statements and shareholder reports, to fund investors with multiple accounts at the same residential or post office box address. This practice is often called “householding” and it helps eliminate duplicate mailings to shareholders. Eaton Vance, or your financial intermediary, may household the mailing of your documents indefinitely unless you instruct Eaton Vance, or your financial intermediary, otherwise. If you would prefer that your Eaton Vance documents not be householded, please contact Eaton Vance at 1-800-262-1122, or contact your financial intermediary. Your instructions that householding not apply to delivery of your Eaton Vance documents will typically be effective within 30 days of receipt by Eaton Vance or your financial intermediary.
Portfolio Holdings. Each Eaton Vance Fund and its underlying Portfolio(s) (if applicable) files a schedule of portfolio holdings on Part F to Form N-PORT with the SEC. Certain information filed on Form N-PORT may be viewed on the Eaton Vance website at www.eatonvance.com, by calling Eaton Vance at 1-800-262-1122 or in the EDGAR database on the SEC’s website at www.sec.gov.
Proxy Voting. From time to time, funds are required to vote proxies related to the securities held by the funds. The Eaton Vance Funds or their underlying Portfolios (if applicable) vote proxies according to a set of policies and procedures approved by the Funds’ and Portfolios’ Boards. You may obtain a description of these policies and procedures and information on how the Funds or Portfolios voted proxies relating to portfolio securities during the most recent 12-month period ended June 30, without charge, upon request, by calling 1-800-262-1122 and by accessing the SEC’s website at www.sec.gov.
This Page Intentionally Left Blank
This Page Intentionally Left Blank
This Page Intentionally Left Blank
Investment Adviser
Boston Management and Research
Two International Place
Boston, MA 02110
Administrator
Eaton Vance Management
Two International Place
Boston, MA 02110
Principal Underwriter*
Eaton Vance Distributors, Inc.
Two International Place
Boston, MA 02110
(617) 482-8260
Custodian
State Street Bank and Trust Company
State Street Financial Center, One Lincoln Street
Boston, MA 02111
Transfer Agent
BNY Mellon Investment Servicing (US) Inc.
Attn: Eaton Vance Funds
P.O. Box 9653
Providence, RI 02940-9653
(800) 262-1122
Independent Registered Public Accounting Firm
Deloitte & Touche LLP
200 Berkeley Street
Boston, MA 02116-5022
Fund Offices
Two International Place
Boston, MA 02110
| * | FINRA BrokerCheck. Investors may check the background of their Investment Professional by contacting the Financial Industry Regulatory Authority (FINRA). FINRA BrokerCheck is a free tool to help investors check the professional background of current and former FINRA-registered securities firms and brokers. FINRA BrokerCheck is available by calling 1-800-289-9999 and at www.FINRA.org. The FINRA BrokerCheck brochure describing this program is available to investors at www.FINRA.org. |
416 1.31.22

Parametric
TABS Municipal Bond Funds
Annual Report
January 31, 2022

Commodity Futures Trading Commission Registration. The Commodity Futures Trading Commission (“CFTC”) has adopted regulations that subject registered investment companies and advisers to regulation by the CFTC if a fund invests more than a prescribed level of its assets in certain CFTC-regulated instruments (including futures, certain options and swap agreements) or markets itself as providing investment exposure to such instruments. The investment adviser has claimed an exclusion from the definition of “commodity pool operator” under the Commodity Exchange Act with respect to its management of each Fund. Accordingly, neither the Funds nor the adviser with respect to the operation of the Funds is subject to CFTC regulation. Because of its management of other strategies, the Funds’ adviser and Parametric Portfolio Associates LLC (Parametric), sub-adviser to the Funds, are registered with the CFTC as commodity pool operators. The adviser and Parametric are also registered as commodity trading advisors.
Fund shares are not insured by the FDIC and are not deposits or other obligations of, or guaranteed by, any depository institution. Shares are subject to investment risks, including possible loss of principal invested.
This report must be preceded or accompanied by a current summary prospectus or prospectus. Before investing, investors should consider carefully the investment objective, risks, and charges and expenses of a mutual fund. This and other important information is contained in the summary prospectus and prospectus, which can be obtained from a financial intermediary. Prospective investors should read the prospectus carefully before investing. For further information, please call 1-800-260-0761.
Annual Report January 31, 2022
Parametric
TABS Municipal Bond Funds
Parametric
TABS Municipal Bond Funds
January 31, 2022
Management’s Discussion of Fund Performance1
Economic and Market Conditions
As the 12-month period began on February 1, 2021, municipal bonds were at the tail end of a bond rally that had begun in November 2020. From mid-February through June 2021, the bond market reversed course. Yields on municipal bonds and U.S. Treasurys rose and prices declined in anticipation of rising economic growth, driven by a federal government infusion of stimulus financing and progress on COVID-19 vaccinations. In late spring-early summer, high year-over-year inflation also raised investor concerns, putting further upward pressure on interest rates.
By July, however, the emergence of a more contagious Delta variant of COVID-19 threatened the U.S. economic rebound and diminished inflation concerns. Investors again turned to U.S. Treasurys and municipal bonds as relatively safe-haven assets, leading bond prices to rise and interest rates to fall in July.
From August through October, bond prices declined again due, in part, to anticipation that the U.S. Federal Reserve (the Fed) would begin tapering monthly bond purchases, which had helped hold interest rates down through much of the pandemic.
In the closing months of 2021, the Fed confirmed that tapering would begin in November and accelerate in the months to come. The reduction of monetary stimulus put upward pressure on shorter term interest rates, as did passage of President Biden’s $1 trillion infrastructure bill. As the Fed issued more hawkish monetary statements, U.S. Treasury rates rose in December against the backdrop of inflationary concerns and potential interest rate hikes. Municipal bond rates, however, were nearly unchanged during the month.
But as the new year began, municipal investors appeared to reevaluate the twin threats of inflation and projected rate hikes. The Bloomberg Municipal Bond Index, a broad measure of the municipal bond market, declined 2.74% in January 2022, its worst monthly performance in several years. In the third week of January, municipal bond mutual funds and exchange-traded funds experienced net weekly outflows for only the second time in 87 weeks.
For the period as a whole, the municipal bond yield curve experienced a “bear market flattening” in which interest rates rose across the curve, but more so at the shorter maturity end of the curve. The Bloomberg Municipal Bond Index returned -1.89% during the period. While municipal bonds outperformed U.S. Treasurys at the short end of the yield curve — that is, maturities of 5 years or less — municipals underperformed U.S. Treasurys in the middle and long end of the curve — maturities of about 10 years and 30 years, respectively.
Fund Performance
For the 12-month period ended January 31, 2022, Parametric TABS Short-Term Municipal Bond Fund (the Short-Term Fund) returned -2.39% for Class A shares at net asset value (NAV), outperforming its primary benchmark, the Bloomberg Municipal Managed Money 1-7 Year Bond Index (the 1-7 Year Index), which returned -2.57%.
For the 12-month period ended January 31, 2022, Parametric TABS Intermediate-Term Municipal Bond Fund (the Intermediate-Term Fund) returned -3.08% for Class A shares at NAV, underperforming its primary benchmark, the Bloomberg Municipal Managed Money Intermediate 1-17 Year Bond Index (the 1-17 Year Index), which returned -2.94%.
Both indexes are unmanaged, and returns do not reflect any applicable sales charges, commissions, or expenses.
The Short-Term Fund and the Intermediate-Term Fund (the Funds) seek after-tax total returns. The Funds generally invest in investment-grade municipal securities of limited or intermediate durations. The Funds pursue after-tax total returns through relative-value trading — a strategy that seeks to take advantage of price and rate differences among similar securities. Management seeks to add incremental return through active security selection and in-depth credit analysis.
In addition, each Fund may allocate up to 20% of net assets to municipal obligations not exempt from regular federal income tax, direct obligations of the U.S. Treasury, and obligations of U.S. government agencies, instrumentalities, and government-sponsored enterprises. This strategy helps pursue additional value by crossing over from tax-exempt municipal bonds to certain taxable bonds, and vice versa (the crossover-trading strategy), according to which sector the adviser believes may be more attractively valued on an after-tax basis.
During the period, the largest contributors to the performance of both Funds versus their respective indexes were active security selection and relative-value trading. In particular, both Funds’ security selections and overweight positions relative to their respective indexes in the health care sector — which recovered during the period from a sharp downturn early in the pandemic — contributed to returns relative to their respective indexes during the period.
Use of the crossover-trading strategy contributed to relative performance of both Funds as well. Early in the period, management judged that municipal bonds were overvalued relative to U.S. Treasurys, and the Funds traded about 16% of their tax-exempt municipal holdings for taxable U.S. Treasury bonds. This provided a boost to relative performance, most notably in the final month of the period, when U.S. Treasurys significantly outperformed municipal bonds.
See Endnotes and Additional Disclosures in this report.
Past performance is no guarantee of future results. Returns are historical and are calculated by determining the percentage change in net asset value (NAV) or offering price (as applicable) with all distributions reinvested. Investment return and principal value will fluctuate so that shares, when redeemed, may be worth more or less than their original cost. Performance for periods less than or equal to one year is cumulative. Performance is for the stated time period only; due to market volatility, current Fund performance may be lower or higher than the quoted return. For performance as of the most recent month-end, please refer to eatonvance.com.
Parametric
TABS Municipal Bond Funds
January 31, 2022
Management’s Discussion of Fund Performance1 — continued
Credit quality also contributed to the Funds’ performance versus their respective indexes. Each Fund held overweight positions relative to its index in A rated and BBB rated securities. Those overweight positions benefitted relative performance as credit spreads tightened during the period and lower rated bonds generally outperformed higher rated bonds.
Fund-Specific Results
For the Short-Term Fund, yield-curve positioning — in addition to active security selection, relative-value trading, crossover trading, and credit quality — contributed to performance versus the 1-7 Year Index.
During the period, the Short-Term Fund had an allocation to bonds with maturities of 12 years or longer, an area of the yield curve where the 1-7 Year Index had no exposure. The Fund’s longer maturity holdings outperformed shorter maturity bonds within the 1-7 Year Index and, thus, yield-curve positioning helped relative returns.
In contrast, duration — a Fund’s sensitivity to interest rate changes — detracted from the Short-Term Fund’s performance relative to the 1-7 Year Index. For most of the period, the Short-Term Fund’s duration closely matched its Index. But in the final quarter of 2021, the Short-Term Fund’s duration was increased to attempt to capture more performance from trading opportunities. When both U.S. Treasury and municipal bond rates increased sharply in January 2022, the Short-Term Fund’s longer duration than the 1-7 Year Index hurt relative performance.
For the Intermediate-Term Fund, yield-curve positioning detracted from performance versus the 1-17 Year Index. The Fund’s overweight position in bonds in the middle of its maturity range — around eight years — hurt relative performance as bonds in that part of the yield curve underperformed both shorter maturities and longer maturities. In contrast, active security selection, relative-value trading, crossover trading, and credit quality all contributed to performance versus the 1-17 Year Index during the period.
See Endnotes and Additional Disclosures in this report.
Past performance is no guarantee of future results. Returns are historical and are calculated by determining the percentage change in net asset value (NAV) or offering price (as applicable) with all distributions reinvested. Investment return and principal value will fluctuate so that shares, when redeemed, may be worth more or less than their original cost. Performance for periods less than or equal to one year is cumulative. Performance is for the stated time period only; due to market volatility, current Fund performance may be lower or higher than the quoted return. For performance as of the most recent month-end, please refer to eatonvance.com.
Parametric
TABS Short-Term Municipal Bond Fund
January 31, 2022
Performance2,3
Portfolio Manager(s) James H. Evans, CFA, Brian C. Barney, CFA and Devin J. Cooch, CFA, each of Parametric Portfolio Associates LLC
| | | | | | | | | | | | | | | | | | | | |
| % Average Annual Total Returns | | Class
Inception Date | | | Performance
Inception Date | | | One Year | | | Five Years | | | Ten Years | |
| | | | | |
Class A at NAV | | | 03/27/2009 | | | | 12/31/1998 | | | | –2.39 | % | | | 1.84 | % | | | 1.35 | % |
Class A with 2.25% Maximum Sales Charge | | | — | | | | — | | | | –4.59 | | | | 1.38 | | | | 1.12 | |
Class C at NAV | | | 03/27/2009 | | | | 12/31/1998 | | | | –3.11 | | | | 1.10 | | | | 0.74 | |
Class C with 1% Maximum Sales Charge | | | — | | | | — | | | | –4.07 | | | | 1.10 | | | | 0.74 | |
Class I at NAV | | | 03/27/2009 | | | | 12/31/1998 | | | | –2.14 | | | | 2.10 | | | | 1.60 | |
|
| |
| | | | | |
Bloomberg Municipal Managed Money 1–7 Year Bond Index | | | — | | | | — | | | | –2.57 | % | | | 1.81 | % | | | 1.59 | % |
Bloomberg 5 Year Municipal Bond Index | | | — | | | | — | | | | –2.41 | | | | 2.25 | | | | 2.02 | |
| | | | | |
| % After-Tax Returns with Maximum Sales Charge | | Class
Inception Date | | | Performance
Inception Date | | | One Year | | | Five Years | | | Ten Years | |
| | | | | |
Class A After Taxes on Distributions | | | 03/27/2009 | | | | 12/31/1998 | | | | –4.79 | % | | | 1.19 | % | | | 0.94 | % |
Class A After Taxes on Distributions and Sale of Fund Shares | | | — | | | | — | | | | –2.46 | | | | 1.26 | | | | 1.04 | |
| | | | | |
Class C After Taxes on Distributions | | | 03/27/2009 | | | | 12/31/1998 | | | | –4.26 | | | | 0.93 | | | | 0.57 | |
Class C After Taxes on Distributions and Sale of Fund Shares | | | — | | | | — | | | | –2.35 | | | | 0.91 | | | | 0.64 | |
| | | | | |
Class I After Taxes on Distributions | | | 03/27/2009 | | | | 12/31/1998 | | | | –2.35 | | | | 1.91 | | | | 1.42 | |
Class I After Taxes on Distributions and Sale of Fund Shares | | | — | | | | — | | | | –0.91 | | | | 1.88 | | | | 1.48 | |
| | | | | |
| % Total Annual Operating Expense Ratios4 | | | | | | | | Class A | | | Class C | | | Class I | |
| | | | | |
| | | | | | | | | | | 0.82 | % | | | 1.57 | % | | | 0.57 | % |
| | | | | |
| % Distribution Rates/Yields5 | | | | | | | | Class A | | | Class C | | | Class I | |
| | | | | |
Distribution Rate | | | | | | | | | | | 0.62 | % | | | 0.00 | % | | | 0.87 | % |
SEC 30-day Yield | | | | | | | | | | | 0.18 | | | | –0.57 | | | | 0.43 | |
Growth of $10,000
This graph shows the change in value of a hypothetical investment of $10,000 in Class A of the Fund for the period indicated. For comparison, the same investment is shown in the indicated index.
| | | | | | | | | | | | | | | | |
| Growth of Investment | | Amount Invested | | | Period Beginning | | | At NAV | | | With Maximum Sales Charge | |
| | | | |
Class C | | | $10,000 | | | | 01/31/2012 | | | | $10,769 | | | | N.A. | |
Class I | | | $250,000 | | | | 01/31/2012 | | | | $293,039 | | | | N.A. | |
See Endnotes and Additional Disclosures in this report.
Past performance is no guarantee of future results. Returns are historical and are calculated by determining the percentage change in net asset value (NAV) or offering price (as applicable) with all distributions reinvested. Investment return and principal value will fluctuate so that shares, when redeemed, may be worth more or less than their original cost. Performance for periods less than or equal to one year is cumulative. Performance is for the stated time period only; due to market volatility, current Fund performance may be lower or higher than the quoted return. For performance as of the most recent month-end, please refer to eatonvance.com.
Parametric
TABS Short-Term Municipal Bond Fund
January 31, 2022
Fund Profile
Credit Quality (% of total investments)6
See Endnotes and Additional Disclosures in this report.
Parametric
TABS Intermediate-Term Municipal Bond Fund
January 31, 2022
Performance2,3
Portfolio Manager(s) James H. Evans, CFA, Brian C. Barney, CFA and Devin J. Cooch, CFA, each of Parametric Portfolio Associates LLC
| | | | | | | | | | | | | | | | | | | | |
| % Average Annual Total Returns | | Class
Inception Date | | | Performance
Inception Date | | | One Year | | | Five Years | | | Ten Years | |
| | | | | |
Class A at NAV | | | 02/01/2010 | | | | 02/01/2010 | | | | –3.08 | % | | | 2.65 | % | | | 2.45 | % |
Class A with 4.75% Maximum Sales Charge | | | — | | | | — | | | | –7.67 | | | | 1.66 | | | | 1.96 | |
Class C at NAV | | | 02/01/2010 | | | | 02/01/2010 | | | | –3.88 | | | | 1.89 | | | | 1.85 | |
Class C with 1% Maximum Sales Charge | | | — | | | | — | | | | –4.83 | | | | 1.89 | | | | 1.85 | |
Class I at NAV | | | 02/01/2010 | | | | 02/01/2010 | | | | –2.90 | | | | 2.91 | | | | 2.71 | |
|
| |
| | | | | |
Bloomberg Municipal Managed Money Intermediate 1–17 Year Bond Index | | | — | | | | — | | | | –2.94 | % | | | 3.05 | % | | | 2.67 | % |
Bloomberg 7 Year Municipal Bond Index | | | — | | | | — | | | | –2.79 | | | | 2.88 | | | | 2.62 | |
| | | | | |
| % After-Tax Returns with Maximum Sales Charge | | Class
Inception Date | | | Performance
Inception Date | | | One Year | | | Five Years | | | Ten Years | |
| | | | | |
Class A After Taxes on Distributions | | | 02/01/2010 | | | | 02/01/2010 | | | | –7.82 | % | | | 1.57 | % | | | 1.85 | % |
Class A After Taxes on Distributions and Sale of Fund Shares | | | — | | | | — | | | | –4.14 | | | | 1.63 | | | | 1.83 | |
| | | | | |
Class C After Taxes on Distributions | | | 02/01/2010 | | | | 02/01/2010 | | | | –4.96 | | | | 1.80 | | | | 1.74 | |
Class C After Taxes on Distributions and Sale of Fund Shares | | | — | | | | — | | | | –2.72 | | | | 1.68 | | | | 1.63 | |
| | | | | |
Class I After Taxes on Distributions | | | 02/01/2010 | | | | 02/01/2010 | | | | –3.07 | | | | 2.81 | | | | 2.60 | |
Class I After Taxes on Distributions and Sale of Fund Shares | | | — | | | | — | | | | –1.21 | | | | 2.69 | | | | 2.50 | |
| | | | | |
| % Total Annual Operating Expense Ratios4 | | | | | | | | Class A | | | Class C | | | Class I | |
| | | | | |
Gross | | | | | | | | | | | 0.99 | % | | | 1.74 | % | | | 0.74 | % |
Net | | | | | | | | | | | 0.90 | | | | 1.65 | | | | 0.65 | |
| | | | | |
| % Distribution Rates/Yields5 | | | | | | | | Class A | | | Class C | | | Class I | |
| | | | | |
Distribution Rate | | | | | | | | | | | 1.06 | % | | | 0.29 | % | | | 1.31 | % |
SEC 30-day Yield - Subsidized | | | | | | | | | | | 0.39 | | | | –0.34 | | | | 0.66 | |
| | | | | |
SEC 30-day Yield - Unsubsidized | | | | | | | | | | | 0.27 | | | | –0.46 | | | | 0.54 | |
Growth of $10,000
This graph shows the change in value of a hypothetical investment of $10,000 in Class A of the Fund for the period indicated. For comparison, the same investment is shown in the indicated index.
| | | | | | | | | | | | | | | | |
| Growth of Investment | | Amount Invested | | | Period Beginning | | | At NAV | | | With Maximum Sales Charge | |
| | | | |
Class C | | | $10,000 | | | | 01/31/2012 | | | | $12,010 | | | | N.A. | |
Class I | | | $250,000 | | | | 01/31/2012 | | | | $326,693 | | | | N.A. | |
See Endnotes and Additional Disclosures in this report.
Past performance is no guarantee of future results. Returns are historical and are calculated by determining the percentage change in net asset value (NAV) or offering price (as applicable) with all distributions reinvested. Investment return and principal value will fluctuate so that shares, when redeemed, may be worth more or less than their original cost. Performance for periods less than or equal to one year is cumulative. Performance is for the stated time period only; due to market volatility, current Fund performance may be lower or higher than the quoted return. For performance as of the most recent month-end, please refer to eatonvance.com.
Parametric
TABS Intermediate-Term Municipal Bond Fund
January 31, 2022
Fund Profile
Credit Quality (% of total investments)6
See Endnotes and Additional Disclosures in this report.
Parametric
TABS Municipal Bond Funds
January 31, 2022
Endnotes and Additional Disclosures
| 1 | The views expressed in this report are those of the portfolio manager(s) and are current only through the date stated at the top of this page. These views are subject to change at any time based upon market or other conditions, and Eaton Vance and the Fund(s) disclaim any responsibility to update such views. These views may not be relied upon as investment advice and, because investment decisions are based on many factors, may not be relied upon as an indication of trading intent on behalf of any Eaton Vance fund. This commentary may contain statements that are not historical facts, referred to as “forward-looking statements.” The Fund’s actual future results may differ significantly from those stated in any forward-looking statement, depending on factors such as changes in securities or financial markets or general economic conditions, the volume of sales and purchases of Fund shares, the continuation of investment advisory, administrative and service contracts, and other risks discussed from time to time in the Fund’s filings with the Securities and Exchange Commission. |
| 2 | Bloomberg Municipal Managed Money 1–7 Year Bond Index is an unmanaged, tax-exempt bond market index that measures the 1–7 year maturity component of the Bloomberg Municipal Managed Money Bond Index. Bloomberg 5 Year Municipal Bond Index is an unmanaged index of municipal bonds traded in the U.S. with maturities ranging from 4-6 years. Bloomberg Municipal Managed Money Intermediate 1–17 Year Bond Index is an unmanaged, tax-exempt bond market index that measures the 1–17 year maturity component of the Bloomberg Municipal Managed Money Bond Index. Bloomberg 7 Year Municipal Bond Index is an unmanaged index of municipal bonds traded in the U.S. with maturities ranging from 6-8 years. Unless otherwise stated, index returns do not reflect the effect of any applicable sales charges, commissions, expenses, taxes or leverage, as applicable. It is not possible to invest directly in an index. |
| 3 | Total Returns at NAV do not include applicable sales charges. If sales charges were deducted, the returns would be lower. Total Returns shown with maximum sales charge reflect the stated maximum sales charge. Unless otherwise stated, performance does not reflect the deduction of taxes on Fund distributions or redemptions of Fund shares. After-tax returns are calculated using certain assumptions, including using the highest individual federal income tax rates in effect at the time of the distributions and do not reflect the impact of state/local taxes. Actual after-tax returns depend on a shareholder’s tax situation and the actual characterization of distributions and may differ from those shown. After-tax returns are not relevant to shareholders who hold shares in tax-deferred accounts or shares held by nontaxable entities. Return After Taxes on Distributions may be the same as Return Before Taxes for the same period because no taxable distributions were made during that period. Return After Taxes on Distributions and Sale of Fund Shares may be greater than or equal to Return After Taxes on Distributions for the same period because of losses realized on the sale of Fund shares. |
Effective February 17, 2015, each Fund changed its name and investment strategy to invest (under normal market conditions) at least 80% of its net assets in a diversified portfolio of municipal obligations, the interest on which is exempt from regular federal income tax. Performance prior to February 17, 2015 reflects each Fund’s performance under its former investment strategy to invest at least 80% of its net assets in a diversified portfolio of municipal obligations that are exempt from regular federal income tax, municipal obligations
that are not exempt from regular federal income tax, direct obligations of the U.S. Treasury and/or obligations of U.S. Government agencies, instrumentalities and government-sponsored enterprises.
Effective November 5, 2020, Class C shares automatically convert to Class A shares eight years after purchase. The average annual total returns listed for Class C reflect conversion to Class A shares after eight years. Prior to November 5, 2020, Class C shares automatically converted to Class A shares ten years after purchase.
| 4 | Source: Fund prospectus. Net expense ratios for Parametric TABS Intermediate-Term Municipal Bond Fund reflect a contractual expense reimbursement that continues through 5/31/22. The expense ratios for the current reporting period can be found in the Financial Highlights section of this report. Performance reflects expenses waived and/or reimbursed, if applicable. Without such waivers and/or reimbursements, performance would have been lower. |
| 5 | The Distribution Rate is based on the Fund’s last regular distribution per share in the period (annualized) divided by the Fund’s NAV at the end of the period. The Fund’s distributions may be comprised of amounts characterized for federal income tax purposes as tax-exempt income, qualified and non-qualified ordinary dividends, capital gains and nondividend distributions, also known as return of capital. The Fund will determine the federal income tax character of distributions paid to a shareholder after the end of the calendar year. This is reported on the IRS form 1099-DIV and provided to the shareholder shortly after each year-end. The Fund’s distributions are determined by the investment adviser based on its current assessment of the Fund’s long-term return potential. As portfolio and market conditions change, the rate of distributions paid by the Fund could change. Taxable-equivalent performance is based on the highest combined federal and state income tax rates, where applicable. Lower tax rates would result in lower tax-equivalent performance. Actual tax rates will vary depending on your income, exemptions and deductions. Rates do not include local taxes. The SEC Yield is a standardized measure based on the estimated yield to maturity of a fund’s investments over a 30-day period and is based on the maximum offer price at the date specified. The SEC Yield is not based on the distributions made by the Fund, which may differ. Subsidized yield reflects the effect of fee waivers and expense reimbursements. |
| 6 | For purposes of the Fund’s rating restrictions, ratings are based on Moody’s Investors Service, Inc. (“Moody’s”), S&P Global Ratings (“S&P”) or Fitch Ratings (“Fitch”), as applicable. If securities are rated differently by the ratings agencies, the highest rating is applied. Ratings, which are subject to change, apply to the creditworthiness of the issuers of the underlying securities and not to the Fund or its shares. Credit ratings measure the quality of a bond based on the issuer’s creditworthiness, with ratings ranging from AAA, being the highest, to D, being the lowest based on S&P’s measures. Ratings of BBB or higher by S&P or Fitch (Baa or higher by Moody’s) are considered to be investment-grade quality. Credit ratings are based largely on the ratings agency’s analysis at the time of rating. The rating assigned to any particular security is not necessarily a reflection of the issuer’s current financial condition and does not necessarily reflect its assessment of the volatility of a security’s market value or of the liquidity of an investment in the security. Holdings designated as “Not Rated” (if any) are not rated by the national ratings agencies stated above. |
Parametric
TABS Municipal Bond Funds
January 31, 2022
Endnotes and Additional Disclosures — continued
Fund profiles subject to change due to active management.
Additional Information
Bloomberg Municipal Bond Index is an unmanaged index of municipal bonds traded in the U.S.
Yield curve is a graphical representation of the yields offered by bonds of various maturities. The yield curve flattens when long-term interest rates fall and/or short-term interest rates increase, and the yield curve steepens when long-term interest rates increase and/or short-term interest rates fall.
Credit spread is the difference in yield between a U.S. Treasury bond and another debt security of the same maturity but different credit quality.
Duration is a measure of the expected change in price of a bond — in percentage terms — given a one percent change in interest rates, all else being constant. Securities with lower durations tend to be less sensitive to interest rate changes.
Parametric
TABS Municipal Bond Funds
January 31, 2022
Fund Expenses
Example: As a Fund shareholder, you incur two types of costs: (1) transaction costs, including sales charges (loads) on purchases and redemption fees (if applicable); and (2) ongoing costs, including management fees; distribution and/or service fees; and other Fund expenses. This Example is intended to help you understand your ongoing costs (in dollars) of Fund investing and to compare these costs with the ongoing costs of investing in other mutual funds. The Example is based on an investment of $1,000 invested at the beginning of the period and held for the entire period (August 1, 2021 – January 31, 2022).
Actual Expenses: The first section of each table below provides information about actual account values and actual expenses. You may use the information in this section, together with the amount you invested, to estimate the expenses that you paid over the period. Simply divide your account value by $1,000 (for example, an $8,600 account value divided by $1,000 = 8.6), then multiply the result by the number in the first section under the heading entitled “Expenses Paid During Period” to estimate the expenses you paid on your account during this period.
Hypothetical Example for Comparison Purposes: The second section of each table below provides information about hypothetical account values and hypothetical expenses based on the actual Fund expense ratio and an assumed rate of return of 5% per year (before expenses), which is not the actual Fund return. The hypothetical account values and expenses may not be used to estimate the actual ending account balance or expenses you paid for the period. You may use this information to compare the ongoing costs of investing in your Fund and other funds. To do so, compare this 5% hypothetical example with the 5% hypothetical examples that appear in the shareholder reports of the other funds.
Please note that the expenses shown in each table are meant to highlight your ongoing costs only and do not reflect any transactional costs, such as sales charges (loads) or redemption fees (if applicable). Therefore, the second section of each table is useful in comparing ongoing costs only, and will not help you determine the relative total costs of owning different funds. In addition, if these transactional costs were included, your costs would be higher.
Parametric TABS Short-Term Municipal Bond Fund
| | | | | | | | | | | | | | | | |
| | | Beginning
Account Value
(8/1/21) | | | Ending
Account Value
(1/31/22) | | | Expenses Paid
During Period*
(8/1/21 – 1/31/22) | | | Annualized
Expense
Ratio | |
| | | | |
Actual | | | | | | | | | | | | | | | | |
Class A | | $ | 1,000.00 | | | $ | 974.20 | | | $ | 3.98 | | | | 0.80 | % |
Class C | | $ | 1,000.00 | | | $ | 970.70 | | | $ | 7.70 | | | | 1.55 | % |
Class I | | $ | 1,000.00 | | | $ | 975.50 | | | $ | 2.74 | | | | 0.55 | % |
| | | | | |
Hypothetical | | | | | | | | | | | | | | | | |
(5% return per year before expenses) | | | | | | | | | | | | | | | | |
Class A | | $ | 1,000.00 | | | $ | 1,021.17 | | | $ | 4.08 | | | | 0.80 | % |
Class C | | $ | 1,000.00 | | | $ | 1,017.39 | | | $ | 7.88 | | | | 1.55 | % |
Class I | | $ | 1,000.00 | | | $ | 1,022.43 | | | $ | 2.80 | | | | 0.55 | % |
| * | Expenses are equal to the Fund’s annualized expense ratio for the indicated Class, multiplied by the average account value over the period, multiplied by 184/365 (to reflect the one-half year period). The Example assumes that the $1,000 was invested at the net asset value per share determined at the close of business on July 31, 2021. |
Parametric
TABS Municipal Bond Funds
January 31, 2022
Fund Expenses — continued
Parametric TABS Intermediate-Term Municipal Bond Fund
| | | | | | | | | | | | | | | | |
| | | Beginning
Account Value
(8/1/21) | | | Ending
Account Value
(1/31/22) | | | Expenses Paid
During Period*
(8/1/21 – 1/31/22) | | | Annualized
Expense
Ratio | |
| | | | |
Actual | | | | | | | | | | | | | | | | |
Class A | | $ | 1,000.00 | | | $ | 964.80 | | | $ | 4.46 | ** | | | 0.90 | % |
Class C | | $ | 1,000.00 | | | $ | 960.40 | | | $ | 8.15 | ** | | | 1.65 | % |
Class I | | $ | 1,000.00 | | | $ | 965.30 | | | $ | 3.22 | ** | | | 0.65 | % |
| | | | | |
Hypothetical | | | | | | | | | | | | | | | | |
(5% return per year before expenses) | | | | | | | | | | | | | | | | |
Class A | | $ | 1,000.00 | | | $ | 1,020.67 | | | $ | 4.58 | ** | | | 0.90 | % |
Class C | | $ | 1,000.00 | | | $ | 1,016.89 | | | $ | 8.39 | ** | | | 1.65 | % |
Class I | | $ | 1,000.00 | | | $ | 1,021.93 | | | $ | 3.31 | ** | | | 0.65 | % |
| * | Expenses are equal to the Fund’s annualized expense ratio for the indicated Class, multiplied by the average account value over the period, multiplied by 184/365 (to reflect the one-half year period). The Example assumes that the $1,000 was invested at the net asset value per share determined at the close of business on July 31, 2021. |
| ** | Absent an allocation of certain expenses to affiliates, expenses would be higher. |
Parametric
TABS Short-Term Municipal Bond Fund
January 31, 2022
Portfolio of Investments
| | | | | | | | |
| Tax-Exempt Municipal Obligations — 82.8% | |
| Security | | Principal
Amount
(000’s omitted) | | | Value | |
| | | | | | | | |
|
| Bond Bank — 1.5% | |
| | |
New York State Environmental Facilities Corp., (State Revolving Fund), Green Bonds, 4.00%, 8/15/38 | | $ | 1,910 | | | $ | 2,281,495 | |
| | |
Ohio Water Development Authority, Water Pollution Control Loan Fund, 5.00%, 6/1/25 | | | 2,550 | | | | 2,870,943 | |
| | |
| | | | | | | $ | 5,152,438 | |
|
| Education — 8.2% | |
| | |
California State University, 5.00%, 11/1/24 | | $ | 2,500 | | | $ | 2,764,900 | |
| | |
Connecticut Health and Educational Facilities Authority,
(Sacred Heart University): | | | | | | |
| | |
5.00%, 7/1/25 | | | 30 | | | | 33,506 | |
| | |
5.00%, 7/1/26 | | | 15 | | | | 17,180 | |
| | |
New Jersey Educational Facilities Authority, (Princeton University), 5.00%, 7/1/22 | | | 3,495 | | | | 3,561,405 | |
| | |
Southwest Higher Education Authority, Inc., TX, (Southern Methodist University), 5.00%, 10/1/23 | | | 225 | | | | 239,884 | |
| | |
University of Michigan, 4.00% to 4/1/24 (Put Date), 4/1/49 | | | 3,000 | | | | 3,156,570 | |
| | |
University of New Mexico, (SPA: U.S. Bank, N.A.), 0.06%, 6/1/30(1) | | | 7,315 | | | | 7,315,000 | |
| | |
| University of Texas: | | | | | | |
| | |
5.00%, 8/15/24 | | | 1,000 | | | | 1,098,580 | |
| | |
Prerefunded to 8/15/22, 5.00%, 8/15/29 | | | 2,000 | | | | 2,048,780 | |
| | |
| Winston-Salem State University, NC: | | | | | | |
| | |
4.00%, 4/1/33 | | | 1,065 | | | | 1,236,337 | |
| | |
4.00%, 4/1/34 | | | 825 | | | | 954,558 | |
| | |
4.00%, 4/1/35 | | | 860 | | | | 993,231 | |
| | |
4.00%, 4/1/36 | | | 625 | | | | 721,000 | |
| | |
5.00%, 4/1/27 | | | 580 | | | | 677,045 | |
| | |
5.00%, 4/1/29 | | | 875 | | | | 1,057,709 | |
| | |
5.00%, 4/1/31 | | | 970 | | | | 1,210,298 | |
| | |
| | | | | | | $ | 27,085,983 | |
|
| Electric Utilities — 0.4% | |
| | |
American Municipal Power, Inc., OH, (AMP Fremont Energy Center), Prerefunded to 2/15/22, 5.25%, 2/15/27 | | $ | 115 | | | $ | 115,207 | |
| | |
Denton, TX, Utility System Revenue, 5.00%, 12/1/26 | | | 1,000 | | | | 1,168,540 | |
| | |
| | | | | | | $ | 1,283,747 | |
|
| Escrowed / Prerefunded — 5.9% | |
| | |
| Illinois Development Finance Authority, (Regency Park): | | | | | | |
| | |
Escrowed to Maturity, 0.00%, 7/15/23 | | $ | 5,000 | | | $ | 4,921,600 | |
| | |
Escrowed to Maturity, 0.00%, 7/15/25 | | | 5,750 | | | | 5,463,363 | |
| | | | | | | | |
| Security | | Principal
Amount
(000’s omitted) | | | Value | |
|
| Escrowed / Prerefunded (continued) | |
| | |
Maryland, Escrowed to Maturity, 5.00%, 3/1/22 | | $ | 50 | | | $ | 50,193 | |
| | |
New York Dormitory Authority, Personal Income Tax Revenue, Escrowed to Maturity, 5.00%, 2/15/25 | | | 120 | | | | 133,770 | |
| | |
Orange County School Board, FL, Prerefunded to 8/1/22, 5.00%, 8/1/26 | | | 5,000 | | | | 5,113,150 | |
| | |
Sales Tax Asset Receivable Corp., NY, Prerefunded to 10/15/24, 5.00%, 10/15/27 | | | 1,500 | | | | 1,657,230 | |
| | |
Springfield School District No. 19, OR, Prerefunded to 6/15/25, 5.00%, 6/15/30 | | | 855 | | | | 962,627 | |
| | |
Utah Transit Authority, Sales Tax Revenue, Prerefunded to 6/15/22, 5.00%, 6/15/25 | | | 1,220 | | | | 1,240,813 | |
| | |
| | | | | | | $ | 19,542,746 | |
|
| General Obligations — 29.1% | |
| | |
Alexandria, VA, 5.00%, 7/1/27 | | $ | 200 | | | $ | 238,630 | |
| | |
Arlington Independent School District, TX, (PSF Guaranteed), 5.00%, 2/15/22 | | | 1,260 | | | | 1,262,167 | |
| | |
Austin Independent School District, TX, (PSF Guaranteed), 4.00%, 8/1/32(2) | | | 5,000 | | | | 6,004,598 | |
| | |
| Bellevue, WA: | | | | | | |
| | |
4.00%, 12/1/32(2) | | | 1,135 | | | | 1,351,592 | |
| | |
4.00%, 12/1/37(2) | | | 1,000 | | | | 1,180,130 | |
| | |
Bryan Independent School District, TX, (PSF Guaranteed), 4.00%, 2/15/33 | | | 2,270 | | | | 2,638,035 | |
| | |
California, 1.60%, 12/1/29 | | | 1,520 | | | | 1,483,991 | |
| | |
| Carlsbad Municipal School District, NM: | | | | | | |
| | |
2.00%, 8/1/32 | | | 1,650 | | | | 1,644,060 | |
| | |
2.00%, 8/1/34 | | | 1,650 | | | | 1,630,266 | |
| | |
Chaffey Joint Union High School District, CA, (Election of 2012), 0.00%, 8/1/22 | | | 155 | | | | 154,585 | |
| | |
Chambers County Improvement District No. 1, TX, 2.00%, 9/1/26 | | | 970 | | | | 993,493 | |
| | |
Cleveland Heights-University Heights City School District, OH, 0.00%, 12/1/23 | | | 150 | | | | 146,471 | |
| | |
Columbus, OH, 5.00%, 4/1/22 | | | 1,050 | | | | 1,058,117 | |
| | |
| Connecticut: | | | | | | |
| | |
3.00%, 1/15/32 | | | 1,000 | | | | 1,074,510 | |
| | |
3.00%, 6/1/32 | | | 2,250 | | | | 2,423,273 | |
| | |
3.00%, 6/1/33 | | | 2,375 | | | | 2,539,896 | |
| | |
3.00%, 6/1/35 | | | 520 | | | | 548,818 | |
| | |
3.00%, 1/15/36 | | | 2,945 | | | | 3,095,460 | |
| | |
4.00%, 6/1/34 | | | 1,000 | | | | 1,162,470 | |
| | |
| Corpus Christi, TX: | | | | | | |
| | |
5.00%, 3/1/25 | | | 985 | | | | 1,098,108 | |
| | |
5.00%, 3/1/26 | | | 1,025 | | | | 1,170,714 | |
| | | | |
| | 12 | | See Notes to Financial Statements. |
Parametric
TABS Short-Term Municipal Bond Fund
January 31, 2022
Portfolio of Investments — continued
| | | | | | | | |
| Security | | Principal
Amount
(000’s omitted) | | | Value | |
|
| General Obligations (continued) | |
| | |
| Corpus Christi, TX: (continued) | | | | | | |
| | |
5.00%, 3/1/27 | | $ | 1,080 | | | $ | 1,264,702 | |
| | |
5.00%, 3/1/28 | | | 1,135 | | | | 1,357,880 | |
| | |
5.00%, 3/1/29 | | | 1,180 | | | | 1,439,093 | |
| | |
5.00%, 3/1/30 | | | 1,250 | | | | 1,552,338 | |
| | |
Cypress-Fairbanks Independent School District, TX, (PSF Guaranteed), 5.00%, 2/15/22 | | | 1,355 | | | | 1,357,331 | |
| | |
Denton Independent School District, TX, (PSF Guaranteed), 0.00%, 8/15/24 | | | 3,000 | | | | 2,917,650 | |
| | |
Edina, MN, 5.00%, 2/1/30 | | | 125 | | | | 149,775 | |
| | |
Florida Board of Education, 5.00%, 6/1/22 | | | 8,415 | | | | 8,543,413 | |
| | |
Hartnell Community College District, CA, (Election of 2002), 0.00% to 8/1/22, 8/1/34 | | | 85 | | | | 104,094 | |
| | |
Henrico County, VA, 5.00%, 8/1/27 | | | 200 | | | | 238,878 | |
| | |
Hutto Independent School District, TX, (PSF Guaranteed), 0.00%, 8/1/22 | | | 525 | | | | 523,362 | |
| | |
Lamar Consolidated Independent School District, TX, (PSF Guaranteed), 3.00%, 2/15/36 | | | 1,500 | | | | 1,620,255 | |
| | |
Leander Independent School District, TX, (PSF Guaranteed), 0.00%, 8/15/22 | | | 700 | | | | 698,110 | |
| | |
Massachusetts, 5.00%, 12/1/24 | | | 5,000 | | | | 5,541,250 | |
| | |
Meramec Valley R-III School District, MO, 3.00%, 3/1/35 | | | 30 | | | | 31,759 | |
| | |
Mercer County, NJ, 2.00%, 2/15/32 | | | 3,295 | | | | 3,225,673 | |
| | |
Miami-Dade County, FL, 5.00%, 7/1/26 | | | 1,000 | | | | 1,159,200 | |
| | |
Montgomery, AL, 3.00%, 2/1/22 | | | 1,685 | | | | 1,685,000 | |
| | |
Mountain View Whisman School District, CA,
(Election of 2020): | | | | | | |
| | |
4.00%, 9/1/32 | | | 10 | | | | 11,821 | |
| | |
4.00%, 9/1/33 | | | 25 | | | | 29,452 | |
| | |
| Mountain View-Los Altos Union High School District, CA: | | | | | | |
| | |
0.00%, 8/1/23 | | | 945 | | | | 933,244 | |
| | |
0.00%, 8/1/24 | | | 900 | | | | 874,899 | |
| | |
New York, NY, 5.00%, 8/1/26 | | | 1,000 | | | | 1,155,660 | |
| | |
Oconee County, GA, 4.00%, 1/1/34 | | | 15 | | | | 17,710 | |
| | |
Ohio, 5.00%, 12/15/23 | | | 1,000 | | | | 1,075,670 | |
| | |
Oregon, 1.90%, 6/1/30 | | | 950 | | | | 945,735 | |
| | |
Paradise Valley Unified School District No. 69, AZ, 5.00%, 7/1/22 | | | 2,080 | | | | 2,119,686 | |
| | |
Ridgefield, CT, 5.00%, 7/15/22 | | | 2,425 | | | | 2,475,464 | |
| | |
| River Vale Township Board of Education, NJ: | | | | | | |
| | |
2.00%, 6/15/32 | | | 1,280 | | | | 1,226,995 | |
| | |
2.00%, 6/15/33 | | | 1,300 | | | | 1,230,827 | |
| | |
Rose Tree Media School District, PA, 5.00%, 4/1/27 | | | 1,000 | | | | 1,149,940 | |
| | |
| St. Helens School District No. 502, OR: | | | | | | |
| | |
0.00%, 6/15/38 | | | 1,000 | | | | 650,340 | |
| | | | | | | | |
| Security | | Principal
Amount
(000’s omitted) | | | Value | |
|
| General Obligations (continued) | |
| | |
| St. Helens School District No. 502, OR: (continued) | | | | | | |
| | |
5.00%, (0.00% until 6/15/22), 6/15/30 | | $ | 880 | | | $ | 1,080,895 | |
| | |
Sugar Land, TX, 5.00%, 2/15/23 | | | 1,105 | | | | 1,154,780 | |
| | |
Texas Public Finance Authority, 5.00%, 10/1/22 | | | 100 | | | | 102,984 | |
| | |
Utah, 5.00%, 7/1/22 | | | 3,915 | | | | 3,990,051 | |
| | |
Wake County, NC, 5.00%, 4/1/22 | | | 1,000 | | | | 1,007,730 | |
| | |
Wauwatosa School District, WI, 5.00%, 9/1/22 | | | 105 | | | | 107,771 | |
| | |
West Valley-Mission Community College District, CA, 5.00%, 8/1/25 | | | 300 | | | | 339,975 | |
| | |
Williamson County, TN, 5.00%, 4/1/25 | | | 3,475 | | | | 3,892,834 | |
| | |
Wylie Independent School District, TX, (PSF Guaranteed), 2.25% to 8/15/23, 8/15/41(3) | | | 4,525 | | | | 4,591,608 | |
| | |
| | | | | | | $ | 96,475,218 | |
|
| Hospital — 9.1% | |
| | |
Cobb County Kennestone Hospital Authority, GA,
(WellStar Health System, Inc.): | | | | | | |
| | |
4.00%, 4/1/33 | | $ | 90 | | | $ | 103,037 | |
| | |
4.00%, 4/1/36 | | | 555 | | | | 630,752 | |
| | |
Indiana Finance Authority, (Community Foundation of Northwest Indiana Obligated Group), 5.00%, 9/1/25 | | | 650 | | | | 735,976 | |
| | |
Missouri Health and Educational Facilities Authority,
(Mercy Health): | | | | | | |
| | |
5.00%, 6/1/26 | | | 2,500 | | | | 2,881,150 | |
| | |
5.00%, 6/1/27 | | | 3,500 | | | | 4,135,880 | |
| | |
New Jersey Health Care Facilities Financing Authority, (Virtua Health), (LOC: TD Bank, N.A.), 0.03%, 7/1/43(1) | | | 5,000 | | | | 5,000,000 | |
| | |
| New York Dormitory Authority, (Maimonides Medical Center): | | | | | | |
| | |
3.00%, 8/1/38 | | | 610 | | | | 651,919 | |
| | |
3.00%, 8/1/40 | | | 170 | | | | 181,099 | |
| | |
4.00%, 8/1/31 | | | 350 | | | | 393,012 | |
| | |
University of Colorado Hospital Authority, (SPA: TD Bank, N.A.), 0.06%, 11/15/39(1) | | | 7,725 | | | | 7,725,000 | |
| | |
Wisconsin Health and Educational Facilities Authority, (Advocate Aurora Health Credit Group), 5.00% to 1/31/24 (Put Date), 8/15/54 | | | 6,000 | | | | 6,495,660 | |
| | |
Wisconsin Health and Educational Facilities Authority, (Aspirus, Inc. Obligated Group), 5.00%, 8/15/34 | | | 1,000 | | | | 1,249,400 | |
| | |
| | | | | | | $ | 30,182,885 | |
|
| Housing — 2.1% | |
| | |
Connecticut Housing Finance Authority, 1.85%, 11/15/31 | | $ | 390 | | | $ | 377,118 | |
| | |
New York Dormitory Authority, (State University Dormitory Facilities), Prerefunded to 7/1/22, 5.00%, 7/1/26 | | | 135 | | | | 137,558 | |
| | |
New York Housing Finance Agency, Green Bonds, 2.75%, 11/1/22 | | | 2,205 | | | | 2,236,907 | |
| | | | |
| | 13 | | See Notes to Financial Statements. |
Parametric
TABS Short-Term Municipal Bond Fund
January 31, 2022
Portfolio of Investments — continued
| | | | | | | | |
| Security | | Principal
Amount
(000’s omitted) | | | Value | |
|
| Housing (continued) | |
| | |
New York Housing Finance Agency, Sustainability Bonds, 1.10%, 5/1/26 | | $ | 625 | | | $ | 617,144 | |
| | |
North Dakota Housing Finance Agency, (SPA: TD Bank, N.A.), 0.06%, 1/1/46(1) | | | 3,600 | | | | 3,600,000 | |
| | |
| | | | | | | $ | 6,968,727 | |
|
| Insured – Electric Utilities — 2.3% | |
| | |
| Lower Colorado River Authority, TX: | | | | | | |
| | |
(AGM), 5.00%, 5/15/27(2) | | $ | 1,380 | | | $ | 1,626,371 | |
| | |
(AGM), 5.00%, 5/15/28(2) | | | 2,285 | | | | 2,730,392 | |
| | |
(AGM), 5.00%, 5/15/29(2) | | | 1,790 | | | | 2,193,717 | |
| | |
(AGM), 5.00%, 5/15/30(2) | | | 960 | | | | 1,198,877 | |
| | |
| | | | | | | $ | 7,749,357 | |
|
| Insured – Water and Sewer — 0.1% | |
| | |
Harris County Municipal Utility District No. 374, TX, (BAM), 3.00%, 9/1/26 | | $ | 310 | | | $ | 324,173 | |
| | |
| | | | | | | $ | 324,173 | |
|
| Lease Revenue / Certificates of Participation — 13.4% | |
| | |
Arizona, Certificates of Participation, Escrowed to Maturity, 5.00%, 10/1/24 | | $ | 2,000 | | | $ | 2,203,900 | |
| | |
| California Public Works Board: | | | | | | |
| | |
5.00%, 8/1/29(2) | | | 2,400 | | | | 2,852,208 | |
| | |
5.00%, 8/1/30(2) | | | 2,785 | | | | 3,361,746 | |
| | |
5.00%, 8/1/31(2) | | | 2,560 | | | | 3,138,253 | |
| | |
5.00%, 9/1/39 | | | 4,850 | | | | 5,291,495 | |
| | |
Colorado, (Rural Colorado), 5.00%, 12/15/25 | | | 6,000 | | | | 6,839,040 | |
| | |
| Malibu, CA: | | | | | | |
| | |
5.00%, 11/1/38 | | | 275 | | | | 276,125 | |
| | |
5.00%, 11/1/43 | | | 225 | | | | 225,909 | |
| | |
5.00%, 11/1/48 | | | 375 | | | | 376,403 | |
| | |
Palm Beach County School Board, FL, 5.00%, 8/1/31 | | | 5,000 | | | | 5,600,400 | |
| | |
Pasadena Area Community College District, CA, Certificates of Participation, 4.00%, 8/1/51 | | | 13,780 | | | | 14,376,536 | |
| | |
| | | | | | | $ | 44,542,015 | |
|
| Other Revenue — 3.0% | |
| | |
Johnson County Public Building Commission, KS, (Courthouse and Medical Examiner’s Facility), 5.00%, 9/1/25 | | $ | 3,025 | | | $ | 3,423,967 | |
| | |
New York Dormitory Authority, Personal Income Tax Revenue, 5.00%, 3/15/35 | | | 5,000 | | | | 6,424,690 | |
| | |
| | | | | | | $ | 9,848,657 | |
| | | | | | | | |
| Security | | Principal
Amount
(000’s omitted) | | | Value | |
|
| Special Tax Revenue — 5.1% | |
| | |
District of Columbia, Income Tax Revenue, 5.00%, 10/1/22 | | $ | 1,500 | | | $ | 1,545,465 | |
| | |
New York City Transitional Finance Authority, NY, Future Tax Revenue, 5.00%, 11/1/23 | | | 1,000 | | | | 1,071,660 | |
| | |
| New York Dormitory Authority, Personal Income Tax Revenue: | | | | | | |
| | |
5.00%, 2/15/24 | | | 1,500 | | | | 1,622,415 | |
| | |
5.00%, 2/15/25 | | | 50 | | | | 55,651 | |
| | |
5.00%, 3/15/32 | | | 2,790 | | | | 3,536,185 | |
| | |
New York Dormitory Authority, Sales Tax Revenue, 5.00%, 3/15/28 | | | 5,770 | | | | 6,511,849 | |
| | |
New York State Urban Development Corp., Personal Income Tax Revenue, 5.00%, 3/15/22 | | | 2,750 | | | | 2,765,565 | |
| | |
| | | | | | | $ | 17,108,790 | |
|
| Transportation — 0.7% | |
| | |
Wisconsin, Transportation Revenue, 5.00%, 7/1/24 | | $ | 2,000 | | | $ | 2,183,960 | |
| | |
| | | | | | | $ | 2,183,960 | |
|
| Water and Sewer — 1.9% | |
| | |
Clear Lake City Water Authority, TX, 3.00%, 3/1/37 | | $ | 700 | | | $ | 732,305 | |
| | |
Coeur d’Alene, ID, Wastewater Revenue, 4.00%, 9/1/33 | | | 625 | | | | 746,400 | |
| | |
Kansas City, MO, Sanitary Sewer System Revenue, 5.00%, 1/1/25 | | | 500 | | | | 555,705 | |
| | |
North Texas Municipal Water District, 5.00%, 9/1/24 | | | 1,120 | | | | 1,210,843 | |
| | |
Raleigh, NC, Combined Enterprise System Revenue, 5.00%, 3/1/26 | | | 360 | | | | 414,889 | |
| | |
San Francisco City and County Public Utilities Commission, CA, Wastewater Revenue, Green Bonds, 2.125% to 10/1/23 (Put Date), 10/1/48 | | | 2,500 | | | | 2,539,450 | |
| | |
| | | | | | | $ | 6,199,592 | |
| | |
Total Tax-Exempt Municipal Obligations — 82.8%
(identified cost $272,509,539) | | | | | | $ | 274,648,288 | |
|
| Taxable Municipal Obligations — 0.8% | |
| Security | | Principal
Amount
(000’s omitted) | | | Value | |
|
| Bond Bank — 0.2% | |
| | |
Fond du Lac County, WI, (Bug Tussel 1, LLC), Social Bonds, 2.165%, 11/1/27(4) | | $ | 715 | | | $ | 707,063 | |
| | |
| | | | | | | $ | 707,063 | |
| | | | |
| | 14 | | See Notes to Financial Statements. |
Parametric
TABS Short-Term Municipal Bond Fund
January 31, 2022
Portfolio of Investments — continued
| | | | | | | | |
| Security | | Principal
Amount
(000’s omitted) | | | Value | |
|
| Special Tax Revenue — 0.6% | |
| | |
| Louisiana, Unclaimed Property Special Revenue: | | | | | | |
| | |
1.979%, 9/1/32 | | $ | 1,000 | | | $ | 935,890 | |
| | |
2.179%, 9/1/34 | | | 1,000 | | | | 926,300 | |
| | |
| | | | | | | $ | 1,862,190 | |
|
| Water and Sewer — 0.0%(5) | |
| | |
Decatur, AL, Water and Sewer Revenue, 0.95%, 8/15/26 | | $ | 120 | | | $ | 115,888 | |
| | |
| | | | | | | $ | 115,888 | |
| | |
Total Taxable Municipal Obligations — 0.8%
(identified cost $2,835,000) | | | | | | $ | 2,685,141 | |
|
| U.S. Treasury Obligations — 13.2% | |
| Security | | Principal
Amount
(000’s omitted) | | | Value | |
| | |
| U.S. Treasury Notes: | | | | | | |
| | |
0.375%, 12/31/25 | | $ | 24,565 | | | $ | 23,495,079 | |
| | |
1.125%, 2/15/31 | | | 16,244 | | | | 15,388,018 | |
| | |
1.25%, 5/31/28 | | | 4,000 | | | | 3,886,406 | |
| | |
1.625%, 5/15/31 | | | 976 | | | | 964,486 | |
| | |
Total U.S. Treasury Obligations — 13.2%
(identified cost $44,772,250) | | | | | | $ | 43,733,989 | |
| | |
Total Investments — 96.8%
(identified cost $320,116,789) | | | | | | $ | 321,067,418 | |
| | |
Other Assets, Less Liabilities — 3.2% | | | | | | $ | 10,742,651 | |
| | |
Net Assets — 100.0% | | | | | | $ | 331,810,069 | |
The percentage shown for each investment category in the Portfolio of Investments is based on net assets.
At January 31, 2022, the concentration of the Fund’s investments in the various states, determined as a percentage of net assets, is as follows:
| | | | |
| |
| Texas | | | 14.0% | |
| |
| California | | | 11.8% | |
| |
| Others, representing less than 10% individually | | | 57.8% | |
The Fund invests primarily in debt securities issued by municipalities. The ability of the issuers of the debt securities to meet their obligations may be affected by economic developments in a specific industry or municipality. At January 31, 2022, 2.5% of total investments are backed by bond insurance of various financial institutions and financial guaranty assurance agencies. The aggregate percentage insured by an individual financial institution or financial guaranty assurance agency ranged from 0.1% to 2.4% of total investments.
| (1) | Variable rate demand obligation that may be tendered at par on any day for payment the lesser of 5 business days or 7 calendar days. The stated interest rate, which generally resets weekly, is determined by the remarketing agent and represents the rate in effect at January 31, 2022. |
| (2) | When-issued security. |
| (3) | Multi-step coupon security. Interest rate represents the rate in effect at January 31, 2022. |
| (4) | Security exempt from registration under Rule 144A of the Securities Act of 1933, as amended. These securities may be sold in certain transactions in reliance on an exemption from registration (normally to qualified institutional buyers). At January 31, 2022, the aggregate value of these securities is $707,063 or 0.2% of the Fund’s net assets. |
| (5) | Amount is less than 0.05%. |
Abbreviations:
| | | | |
| | |
| AGM | | – | | Assured Guaranty Municipal Corp. |
| | |
| BAM | | – | | Build America Mutual Assurance Co. |
| | |
| LOC | | – | | Letter of Credit |
| | |
| PSF | | – | | Permanent School Fund |
| | |
| SPA | | – | | Standby Bond Purchase Agreement |
| | | | |
| | 15 | | See Notes to Financial Statements. |
Parametric
TABS Intermediate-Term Municipal Bond Fund
January 31, 2022
Portfolio of Investments
| | | | | | | | |
| Tax-Exempt Municipal Obligations — 81.8% | |
| Security | | Principal
Amount
(000’s omitted) | | | Value | |
|
| Bond Bank — 1.5% | |
| | |
Alaska Municipal Bond Bank Authority, 5.00%, 3/1/30 | | $ | 1,145 | | | $ | 1,260,748 | |
| | |
New York State Environmental Facilities Corp., (State Revolving Fund), Green Bonds, 4.00%, 8/15/51 | | | 2,000 | | | | 2,327,840 | |
| | |
Ohio Water Development Authority, Water Pollution Control Loan Fund, Green Bonds, 4.00%, 12/1/46 | | | 6,000 | | | | 6,973,620 | |
| | |
| | | | | | | $ | 10,562,208 | |
|
| Education — 2.5% | |
| | |
| Bethlehem Area School District Authority, PA: | | | | | | |
| | |
0.377%, (67% of SOFR + 0.35%), 11/1/25 (Put Date), 1/1/30(1) | | $ | 3,990 | | | $ | 3,970,808 | |
| | |
0.377%, (67% of SOFR + 0.35%), 11/1/25 (Put Date), 1/1/32(1) | | | 1,000 | | | | 995,190 | |
| | |
Connecticut Health and Educational Facilities Authority, (Westminster School), 4.00%, 7/1/38 | | | 2,050 | | | | 2,232,942 | |
| | |
Los Ranchos de Albuquerque, NM, (Albuquerque Academy), 4.00%, 9/1/40 | | | 600 | | | | 668,172 | |
| | |
Miami University, OH, 5.00%, 9/1/33(2) | | | 775 | | | | 968,246 | |
| | |
Nevada System of Higher Education, 5.00%, 7/1/23 | | | 500 | | | | 529,820 | |
| | |
New York Dormitory Authority, (School Districts Revenue Bond Financing Program), 5.00%, 10/1/32 | | | 1,530 | | | | 1,901,346 | |
| | |
South Dakota Health and Educational Facilities Authority, (Vocation Education Program), 5.00%, 8/1/27 | | | 1,200 | | | | 1,347,588 | |
| | |
University of Hawaii, 3.00%, 10/1/31 | | | 2,435 | | | | 2,643,388 | |
| | |
Virginia Commonwealth University, 4.00%, 11/1/32 | | | 1,285 | | | | 1,468,228 | |
| | |
Zionsville Community Schools Building Corp., IN, 5.00%, 7/15/25 | | | 350 | | | | 382,575 | |
| | |
| | | | | | | $ | 17,108,303 | |
|
| Electric Utilities — 3.5% | |
| | |
American Municipal Power-Ohio, Inc., OH, (Freemont Energy Center), 4.00%, 2/15/38 | | $ | 2,500 | | | $ | 2,872,275 | |
| | |
| Florida Municipal Power Agency: | | | | | | |
| | |
3.00%, 10/1/32 | | | 1,750 | | | | 1,865,482 | |
| | |
3.00%, 10/1/33 | | | 1,100 | | | | 1,170,719 | |
| | |
| Garland, TX, Electric Utility System Revenue: | | | | | | |
| | |
4.00%, 3/1/32 | | | 1,015 | | | | 1,166,134 | |
| | |
4.00%, 3/1/33 | | | 1,055 | | | | 1,211,520 | |
| | |
4.00%, 3/1/34 | | | 375 | | | | 430,410 | |
| | |
New Braunfels, TX, Utility System Revenue, 4.00%, 7/1/33 | | | 1,070 | | | | 1,215,167 | |
| | |
North Carolina Municipal Power Agency Number 1, (Catawba), 5.00%, 1/1/23 | | | 1,485 | | | | 1,543,702 | |
| | |
Seattle, WA, Municipal Light and Power Revenue, 0.31%, (SIFMA + 0.25%), 11/1/26 (Put Date), 5/1/45(1) | | | 2,000 | | | | 2,017,360 | |
| | | | | | | | |
| Security | | Principal
Amount
(000’s omitted) | | | Value | |
|
| Electric Utilities (continued) | |
| | |
| Springfield Electric System Revenue, IL: | | | | | | |
| | |
5.00%, 3/1/27 | | $ | 3,000 | | | $ | 3,330,990 | |
| | |
5.00%, 3/1/28 | | | 3,475 | | | | 3,852,837 | |
| | |
5.00%, 3/1/29 | | | 3,325 | | | | 3,681,207 | |
| | |
| | | | | | | $ | 24,357,803 | |
|
| Escrowed / Prerefunded — 2.0% | |
| | |
Homewood, AL, Prerefunded to 9/1/26, 5.00%, 9/1/32 | | $ | 370 | | | $ | 428,153 | |
| | |
Illinois Finance Authority, (Northwestern Memorial HealthCare), Prerefunded to 8/15/22, 4.00%, 8/15/42 | | | 1,000 | | | | 1,018,500 | |
| | |
Louisiana Transportation Authority: | | | | | | | | |
| | |
Prerefunded to 8/15/23, 5.00%, 8/15/30 | | | 1,885 | | | | 2,003,906 | |
| | |
Prerefunded to 8/15/23, 5.00%, 8/15/31 | | | 1,230 | | | | 1,307,588 | |
| | |
Prerefunded to 8/15/23, 5.00%, 8/15/32 | | | 1,090 | | | | 1,158,757 | |
| | |
Massachusetts School Building Authority, Dedicated Sales Tax Revenue, Prerefunded to 5/15/23, 5.00%, 5/15/33 | | | 2,000 | | | | 2,109,180 | |
| | |
South Dakota Building Authority: | | | | | | | | |
| | |
Prerefunded to 6/1/24, 5.00%, 6/1/26 | | | 1,000 | | | | 1,091,490 | |
| | |
Prerefunded to 6/1/24, 5.00%, 6/1/32 | | | 1,500 | | | | 1,637,235 | |
| | |
Wisconsin Health and Educational Facilities Authority, (Ministry Health Care), Prerefunded to 8/15/22, 5.00%, 8/15/32 | | | 2,885 | | | | 2,954,586 | |
| | |
| | | | | | | $ | 13,709,395 | |
|
| General Obligations — 28.4% | |
| | |
Adams 12 Five Star Schools, CO, 5.00%, 12/15/30 | | $ | 5,000 | | | $ | 5,827,950 | |
| | |
Anchorage, AK, Prerefunded to 9/1/25, 5.00%, 9/1/28 | | | 1,835 | | | | 2,078,394 | |
| | |
Austin Independent School District, TX, (PSF Guaranteed), 4.00%, 8/1/32(2) | | | 5,355 | | | | 6,430,925 | |
| | |
Batavia, IL, 4.00%, 11/1/24 | | | 755 | | | | 774,086 | |
| | |
| Beaumont, TX, Certificates of Obligation: | | | | | | |
| | |
4.00%, 3/1/31 | | | 930 | | | | 1,078,577 | |
| | |
4.00%, 3/1/33 | | | 500 | | | | 575,790 | |
| | |
4.00%, 3/1/34 | | | 1,000 | | | | 1,149,370 | |
| | |
5.00%, 3/1/30 | | | 1,000 | | | | 1,242,720 | |
| | |
Brazoria County, TX, 5.00%, 3/1/29 | | | 1,685 | | | | 2,053,712 | |
| | |
Brookline, MA, 5.00%, 3/15/30 | | | 2,270 | | | | 2,796,595 | |
| | |
| California: | | | | | | |
| | |
0.49%, (SIFMA + 0.43%), 12/1/23 (Put Date), 12/1/29(1) | | | 23,160 | | | | 23,197,751 | |
| | |
4.00%, 8/1/36 | | | 2,025 | | | | 2,216,160 | |
| | |
Cape May County, NJ, 3.00%, 10/1/29 | | | 1,095 | | | | 1,174,037 | |
| | |
Chaffey Joint Union High School District, CA, (Election of 2012), 0.00%, 8/1/36 | | | 1,035 | | | | 689,455 | |
| | |
Cleveland Municipal School District, OH, 5.00%, 12/1/32 | | | 4,260 | | | | 4,479,731 | |
| | | | |
| | 16 | | See Notes to Financial Statements. |
Parametric
TABS Intermediate-Term Municipal Bond Fund
January 31, 2022
Portfolio of Investments — continued
| | | | | | | | |
| Security | | Principal
Amount
(000’s omitted) | | | Value | |
|
| General Obligations (continued) | |
| | |
| Connecticut: | | | | | | |
| | |
3.00%, 1/15/32 | | $ | 2,900 | | | $ | 3,116,079 | |
| | |
4.00%, 1/15/34 | | | 7,500 | | | | 8,790,450 | |
| | |
Crystal Lake, IL, 4.00%, 12/15/23 | | | 455 | | | | 467,149 | |
| | |
Dallas County, TX, 5.00%, 8/15/29 | | | 5,200 | | | | 6,025,344 | |
| | |
Decatur, IL, 5.00%, 3/1/23 | | | 1,030 | | | | 1,073,672 | |
| | |
Denton County, TX, 4.00%, 7/15/30 | | | 1,000 | | | | 1,141,580 | |
| | |
| El Monte Union High School District, CA, (Election of 2018): | | | | | | |
| | |
4.00%, 6/1/33 | | | 250 | | | | 278,963 | |
| | |
4.00%, 6/1/34 | | | 300 | | | | 334,269 | |
| | |
Frisco Independent School District, TX, (PSF Guaranteed), 4.00%, 2/15/32 | | | 3,260 | | | | 3,877,998 | |
| | |
Gladstone School District No. 115, Clackamas County, OR, 0.00%, 6/15/26 | | | 1,000 | | | | 935,350 | |
| | |
Glendale Unified School District, CA, 0.00%, 9/1/30 | | | 5,280 | | | | 4,065,864 | |
| | |
Greensboro, NC, 5.00%, 2/1/28 | | | 1,790 | | | | 2,079,210 | |
| | |
Hawaii County, HI, 5.00%, 9/1/24 | | | 1,000 | | | | 1,100,140 | |
| | |
Kennewick School District No. 17, WA, 4.00%, 12/1/32 | | | 1,095 | | | | 1,291,782 | |
| | |
La Grange Park District, IL, 5.00%, 12/1/22 | | | 440 | | | | 455,690 | |
| | |
Lakeland, FL, 5.00%, 10/1/31 | | | 1,860 | | | | 2,072,561 | |
| | |
| Long Beach Unified School District, CA, (Election of 2008): | | | | | | |
| | |
0.00%, 8/1/31 | | | 1,675 | | | | 1,216,201 | |
| | |
0.00%, 8/1/32 | | | 1,500 | | | | 1,041,570 | |
| | |
Los Angeles Community College District, CA, (Election of 2008), 4.00%, 8/1/34 | | | 5,000 | | | | 5,570,450 | |
| | |
| Los Angeles Unified School District, CA: | | | | | | |
| | |
4.00%, 7/1/33 | | | 1,000 | | | | 1,164,760 | |
| | |
4.00%, 7/1/38 | | | 6,550 | | | | 7,480,297 | |
| | |
Macomb County, MI, 4.00%, 5/1/24 | | | 1,000 | | | | 1,064,250 | |
| | |
Madison County, TN, 5.00%, 5/1/23 | | | 1,115 | | | | 1,173,749 | |
| | |
Morris Township, NJ, 3.00%, 11/1/29 | | | 85 | | | | 90,171 | |
| | |
Mountain View-Los Altos Union High School District, CA, 0.00%, 8/1/25 | | | 2,115 | | | | 2,019,529 | |
| | |
Neshaminy School District, PA, 4.00%, 11/1/26 | | | 660 | | | | 694,927 | |
| | |
New Hampshire, 4.00%, 12/1/32 | | | 2,085 | | | | 2,401,628 | |
| | |
New Jersey, 4.00%, 6/1/31 | | | 8,450 | | | | 9,811,210 | |
| | |
| New York Dormitory Authority, Personal Income Tax Revenue: | | | | | | |
| | |
3.00%, 3/15/41 | | | 8,100 | | | | 8,264,389 | |
| | |
5.00%, 3/15/35 | | | 5,000 | | | | 6,424,690 | |
| | |
5.00%, 3/15/36 | | | 5,000 | | | | 6,407,000 | |
| | |
Pacifica School District, CA, (Election of 2018), 4.00%, 8/1/50 | | | 2,000 | | | | 2,249,720 | |
| | |
Pennsylvania, Prerefunded to 6/1/22, 4.00%, 6/1/30 | | | 1,400 | | | | 1,416,744 | |
| | |
Richland County School District No. 2, SC, 4.00%, 3/1/32 | | | 3,000 | | | | 3,512,580 | |
| | |
Rio Grande City Grulla Independent School District, TX,
(PSF Guaranteed): | | | | | | |
| | |
4.00%, 8/15/32 | | | 1,160 | | | | 1,388,474 | |
| | | | | | | | |
| Security | | Principal
Amount
(000’s omitted) | | | Value | |
|
| General Obligations (continued) | |
| | |
Rio Grande City Grulla Independent School District, TX,
(PSF Guaranteed): (continued) | | | | | | |
| | |
4.00%, 8/15/33 | | $ | 1,175 | | | $ | 1,403,432 | |
| | |
4.00%, 8/15/34 | | | 1,345 | | | | 1,603,173 | |
| | |
Rowland Unified School District, CA, (Election of 2012), 0.00%, 8/1/33 | | | 2,735 | | | | 1,732,294 | |
| | |
San Diego Community College District, CA, Prerefunded to 8/1/26, 4.00%, 8/1/32 | | | 5,000 | | | | 5,595,950 | |
| | |
San Dieguito Union High School District, CA, (Election of 2012), 4.00%, 8/1/42 | | | 8,075 | | | | 9,124,669 | |
| | |
San Francisco Bay Area Rapid Transit District, CA, 4.00%, 8/1/33 | | | 1,350 | | | | 1,468,179 | |
| | |
San Juan Unified School District, CA, (Election of 2012), 4.00%, 8/1/31 | | | 3,250 | | | | 3,602,820 | |
| | |
South Suburban Park and Recreation District, CO, 5.00%, 12/15/29 | | | 1,120 | | | | 1,397,670 | |
| | |
Southfield, MI, 4.00%, 5/1/28 | | | 1,160 | | | | 1,328,362 | |
| | |
Tomball Independent School District, (PSF Guaranteed), 4.00%, 2/15/35(2) | | | 1,755 | | | | 2,087,766 | |
| | |
Township High School District No. 204, IL, 4.25%, 12/15/22 | | | 1,230 | | | | 1,269,262 | |
| | |
Vermont, 4.00%, 8/15/32 | | | 3,365 | | | | 4,057,281 | |
| | |
Washington, 4.00%, 7/1/33 | | | 3,000 | | | | 3,579,420 | |
| | |
Zeeland Public Schools, MI, 5.00%, 5/1/24 | | | 1,000 | | | | 1,085,910 | |
| | |
| | | | | | | $ | 195,599,881 | |
|
| Hospital — 4.5% | |
| | |
Arizona Health Facilities Authority, (Banner Health), 0.31%, (SIFMA + 0.25%), 11/4/26 (Put Date), 1/1/46(1) | | $ | 1,000 | | | $ | 1,000,360 | |
| | |
California Health Facilities Financing Authority, (El Camino Hospital), 5.00%, 2/1/33 | | | 1,000 | | | | 1,171,390 | |
| | |
Carroll City-County Hospital Authority, GA, (Tanner Medical Center, Inc.), 5.00%, 7/1/34 | | | 2,560 | | | | 2,879,232 | |
| | |
Kansas Development Finance Authority, (Adventist Health System), 5.00%, 11/15/28 | | | 5,090 | | | | 5,156,577 | |
| | |
Massachusetts Development Finance Agency,
(Berkshire Health Systems): | | | | | | |
| | |
5.00%, 10/1/29 | | | 400 | | | | 492,984 | |
| | |
5.00%, 10/1/30 | | | 475 | | | | 596,058 | |
| | |
Massachusetts Development Finance Agency, (Partners HealthCare System), 5.00%, 7/1/24 | | | 800 | | | | 845,728 | |
| | |
Monongalia County Building Commission, WV, (Monongalia Health System Obligated Group), 5.00%, 7/1/24 | | | 215 | | | | 233,324 | |
| | |
| Montgomery County, OH, (Dayton Children’s Hospital): | | | | | | |
| | |
4.00%, 8/1/38 | | | 1,950 | | | | 2,233,920 | |
| | |
4.00%, 8/1/40 | | | 3,000 | | | | 3,424,920 | |
| | |
Montgomery County, OH, (Kettering Health Network
Obligated Group): | | | | | | |
| | |
3.00%, 8/1/34 | | | 300 | | | | 314,256 | |
| | | | |
| | 17 | | See Notes to Financial Statements. |
Parametric
TABS Intermediate-Term Municipal Bond Fund
January 31, 2022
Portfolio of Investments — continued
| | | | | | | | |
| Security | | Principal
Amount
(000’s omitted) | | | Value | |
|
| Hospital (continued) | |
| | |
Montgomery County, OH, (Kettering Health Network Obligated
Group): (continued) | | | | | | |
| | |
5.00%, 8/1/31 | | $ | 500 | | | $ | 629,210 | |
| | |
Pennsylvania Higher Educational Facilities Authority, (University of Pennsylvania Health System), 4.00%, 8/15/34 | | | 1,360 | | | | 1,563,728 | |
| | |
Pima County Industrial Development Authority, AZ,
(Tucson Medical Center): | | | | | | |
| | |
4.00%, 4/1/35 | | | 800 | | | | 926,584 | |
| | |
4.00%, 4/1/36 | | | 845 | | | | 977,682 | |
| | |
4.00%, 4/1/37 | | | 875 | | | | 1,011,334 | |
| | |
5.00%, 4/1/33 | | | 1,000 | | | | 1,260,280 | |
| | |
Richmond County Hospital Authority, GA, (University Health Services, Inc.), 4.00%, 1/1/36 | | | 1,100 | | | | 1,190,618 | |
| | |
Royal Oak Hospital Finance Authority, MI, (William Beaumont Hospital), 5.00%, 9/1/24 | | | 520 | | | | 562,401 | |
| | |
St. Paul Housing and Redevelopment Authority, MN, (HealthPartners Obligated Group), 5.00%, 7/1/30 | | | 600 | | | | 670,122 | |
| | |
| Tampa, FL, (H. Lee Moffitt Cancer Center): | | | | | | |
| | |
4.00%, 7/1/38 | | | 250 | | | | 283,243 | |
| | |
4.00%, 7/1/39 | | | 400 | | | | 452,532 | |
| | |
University of North Carolina Hospitals at Chapel Hill, 5.00%, 2/1/33 | | | 1,540 | | | | 1,873,749 | |
| | |
Yuma Industrial Development Authority, AZ, (Yuma Regional Medical Center), 5.00%, 8/1/22 | | | 1,000 | | | | 1,022,270 | |
| | |
| | | | | | | $ | 30,772,502 | |
|
| Housing — 1.3% | |
| | |
Massachusetts Housing Finance Agency, 1.45% to 12/1/22 (Put Date), 12/1/49 | | $ | 1,800 | | | $ | 1,803,456 | |
| | |
| New York Mortgage Agency: | | | | | | |
| | |
2.05%, 4/1/28 | | | 1,000 | | | | 1,003,140 | |
| | |
2.15%, 4/1/29 | | | 1,390 | | | | 1,395,880 | |
| | |
2.25%, 4/1/30 | | | 1,000 | | | | 1,000,070 | |
| | |
2.35%, 4/1/31 | | | 1,835 | | | | 1,840,119 | |
| | |
2.40%, 10/1/31 | | | 1,130 | | | | 1,135,345 | |
| | |
Seattle Housing Authority, WA, (Northgate Plaza), 1.00%, 6/1/26 | | | 1,000 | | | | 976,540 | |
| | |
| | | | | | | $ | 9,154,550 | |
|
| Insured – Electric Utilities — 0.5% | |
| | |
Municipal Electric Authority of Georgia, (Plant Vogtle Units 3
and 4): | | | | | | |
| | |
(AGM), 4.00%, 1/1/38 | | $ | 300 | | | $ | 337,725 | |
| | |
(AGM), 4.00%, 1/1/38 | | | 300 | | | | 338,421 | |
| | |
(AGM), 4.00%, 1/1/39 | | | 345 | | | | 387,849 | |
| | | | | | | | |
| Security | | Principal
Amount
(000’s omitted) | | | Value | |
|
| Insured – Electric Utilities (continued) | |
| | |
Municipal Electric Authority of Georgia, (Plant Vogtle Units 3
and 4): (continued) | | | | | | |
| | |
(AGM), 4.00%, 1/1/39 | | $ | 305 | | | $ | 343,589 | |
| | |
(AGM), 4.00%, 1/1/40 | | | 315 | | | | 353,562 | |
| | |
(AGM), 4.00%, 1/1/40 | | | 400 | | | | 449,892 | |
| | |
(AGM), 4.00%, 1/1/41 | | | 485 | | | | 543,646 | |
| | |
(AGM), 4.00%, 1/1/41 | | | 500 | | | | 561,230 | |
| | |
| | | | | | | $ | 3,315,914 | |
|
| Insured – General Obligations — 1.6% | |
| | |
Grossmont Union High School District, CA, (Election of 2008), (AGM), 0.00%, 8/1/33 | | $ | 3,535 | | | $ | 2,213,617 | |
| | |
Port Arthur Independent School District, TX, (AGM), 4.00%, 2/15/34 | | | 1,425 | | | | 1,654,582 | |
| | |
San Mateo County Community College District, CA, (Election of 2005), (NPFG), 0.00%, 9/1/29 | | | 5,000 | | | | 4,384,600 | |
| | |
| Yonkers, NY: | | | | | | |
| | |
(BAM), 4.00%, 5/1/34 | | | 695 | | | | 792,487 | |
| | |
(BAM), 4.00%, 5/1/34 | | | 1,755 | | | | 2,013,371 | |
| | |
| | | | | | | $ | 11,058,657 | |
|
| Insured – Special Tax Revenue — 0.5% | |
| | |
Westwood Magnolia Parkway Improvement District, TX: | | | | | | | | |
| | |
(BAM), 4.00%, 6/15/38 | | $ | 755 | | | $ | 852,448 | |
| | |
(BAM), 4.00%, 6/15/39 | | | 785 | | | | 884,404 | |
| | |
(BAM), 4.00%, 6/15/40 | | | 820 | | | | 920,975 | |
| | |
(BAM), 4.00%, 6/15/41 | | | 850 | | | | 954,023 | |
| | |
| | | | | | | $ | 3,611,850 | |
|
| Insured – Transportation — 0.8% | |
| | |
Metropolitan Transportation Authority, NY, (AGM), 0.827%, (67% of SOFR + 0.80%), 4/1/26 (Put Date), 11/1/32(1) | | $ | 5,500 | | | $ | 5,494,115 | |
| | |
| | | | | | | $ | 5,494,115 | |
|
| Insured – Water and Sewer — 0.4% | |
| | |
Pittsburgh Water and Sewer Authority, PA, (AGM), 0.71%, (SIFMA + 0.65%), 12/1/23 (Put Date), 9/1/40(1) | | $ | 3,000 | | | $ | 3,019,530 | |
| | |
| | | | | | | $ | 3,019,530 | |
|
| Lease Revenue / Certificates of Participation — 2.2% | |
| | |
| Aspen Fire Protection District, CO: | | | | | | |
| | |
4.00%, 12/1/24 | | $ | 130 | | | $ | 139,593 | |
| | |
4.00%, 12/1/28 | | | 225 | | | | 255,821 | |
| | | | |
| | 18 | | See Notes to Financial Statements. |
Parametric
TABS Intermediate-Term Municipal Bond Fund
January 31, 2022
Portfolio of Investments — continued
| | | | | | | | |
| Security | | Principal
Amount
(000’s omitted) | | | Value | |
|
| Lease Revenue / Certificates of Participation (continued) | |
| | |
Greater Texas Cultural Education Facilities Finance Corp.,
(Epicenter Multipurpose Facilities): | | | | | | |
| | |
5.00%, 3/1/30 | | $ | 475 | | | $ | 586,269 | |
| | |
5.00%, 3/1/31 | | | 500 | | | | 627,705 | |
| | |
5.00%, 3/1/32 | | | 750 | | | | 938,415 | |
| | |
Oklahoma County Finance Authority, OK, (Deer Creek Public Schools), 5.00%, 12/1/26 | | | 1,410 | | | | 1,595,739 | |
| | |
Orange County School Board, FL, 5.00%, 8/1/26 | | | 4,300 | | | | 4,971,402 | |
| | |
| Palo Alto, CA, (California Avenue Parking Garage): | | | | | | |
| | |
5.00%, 11/1/36 | | | 1,295 | | | | 1,579,589 | |
| | |
5.00%, 11/1/37 | | | 260 | | | | 317,062 | |
| | |
5.00%, 11/1/38 | | | 420 | | | | 511,405 | |
| | |
5.00%, 11/1/39 | | | 425 | | | | 516,881 | |
| | |
Palo Alto, CA, Certificates of Participation, 3.00%, 11/1/33 | | | 1,310 | | | | 1,443,803 | |
| | |
St. Louis County Special School District, MO, 4.00%, 4/1/29 | | | 525 | | | | 600,337 | |
| | |
Virginia Public Building Authority, 4.00%, 8/1/35 | | | 800 | | | | 924,896 | |
| | |
| | | | | | | $ | 15,008,917 | |
|
| Other Revenue — 11.3% | |
| | |
Bexar County, TX, Motor Vehicle Rental Tax Revenue, 4.00%, 8/15/36 | | $ | 1,000 | | | $ | 1,119,190 | |
| | |
Black Belt Energy Gas District, AL, 4.00% to 12/1/26 (Put Date), 10/1/52 | | | 16,500 | | | | 18,146,865 | |
| | |
California Infrastructure and Economic Development Bank, (California Academy of Sciences), 0.41%, (SIFMA + 0.35%), 8/1/24 (Put Date), 8/1/47(1) | | | 2,500 | | | | 2,502,825 | |
| | |
| Fort Myers, FL, Capital Improvement Revenue: | | | | | | |
| | |
5.00%, 12/1/30 | | | 1,055 | | | | 1,198,712 | |
| | |
5.00%, 12/1/31 | | | 965 | | | | 1,096,066 | |
| | |
5.00%, 12/1/35 | | | 380 | | | | 429,788 | |
| | |
5.00%, 12/1/36 | | | 450 | | | | 508,239 | |
| | |
Hudson Yards Infrastructure Corp., NY, Green Bonds, 4.00%, 2/15/37 | | | 2,000 | | | | 2,326,500 | |
| | |
Kentucky Public Energy Authority, Gas Supply Revenue: | | | | | | | | |
| | |
4.00% to 6/1/25 (Put Date), 12/1/49 | | | 5,000 | | | | 5,378,000 | |
| | |
4.00% to 2/1/28 (Put Date), 2/1/50 | | | 16,500 | | | | 18,394,860 | |
| | |
Louisiana Local Government Environmental Facilities and Community Development Authority, (Jefferson Parish), 5.00%, 12/1/33 | | | 2,425 | | | | 2,969,340 | |
| | |
Main Street Natural Gas, Inc., GA, Gas Supply Revenue: | | | | | | | | |
| | |
(Liq: Royal Bank of Canada), 0.63%, (SIFMA + 0.57%), 12/1/23 (Put Date), 8/1/48(1) | | | 8,000 | | | | 8,017,360 | |
| | |
Orange County, FL, Tourist Development Tax Revenue, 4.00%, 10/1/32 | | | 4,585 | | | | 5,097,328 | |
| | | | | | | | |
| Security | | Principal
Amount
(000’s omitted) | | | Value | |
|
| Other Revenue (continued) | |
| | |
Patriots Energy Group Financing Agency, SC, Gas Supply Revenue, (Liq: Royal Bank of Canada), 4.00% to 2/1/24 (Put Date), 10/1/48 | | $ | 10,000 | | | $ | 10,527,800 | |
| | |
| | | | | | | $ | 77,712,873 | |
|
| Senior Living / Life Care — 0.2% | |
| | |
Colorado Health Facilities Authority, (Covenant Living Communities and Services), 4.00%, 12/1/40 | | $ | 500 | | | $ | 561,920 | |
| | |
North Carolina Medical Care Commission, (Deerfield Episcopal Retirement Community, Inc.), 5.00%, 11/1/31 | | | 1,000 | | | | 1,135,390 | |
| | |
| | | | | | | $ | 1,697,310 | |
|
| Special Tax Revenue — 2.5% | |
| | |
New York City Transitional Finance Authority, NY, Future Tax
Revenue: | | | | | | |
| | |
4.00%, 11/1/38 | | $ | 1,500 | | | $ | 1,719,930 | |
| | |
4.00%, 2/1/40(2) | | | 2,500 | | | | 2,865,850 | |
| | |
4.00%, 2/1/42(2) | | | 5,700 | | | | 6,502,959 | |
| | |
5.00%, 11/1/31 | | | 3,220 | | | | 3,321,913 | |
| | |
New York Dormitory Authority, Personal Income Tax Revenue, 4.00%, 3/15/38 | | | 1,250 | | | | 1,424,362 | |
| | |
New York State Urban Development Corp., Sales Tax Revenue, 3.00%, 3/15/40 | | | 1,035 | | | | 1,058,567 | |
| | |
| | | | | | | $ | 16,893,581 | |
|
| Transportation — 12.7% | |
| | |
Bay Area Toll Authority, CA, Toll Bridge Revenue, (San Francisco Bay Area), 0.51%, (SIFMA + 0.45%), 4/1/26 (Put Date), 4/1/56(1) | | $ | 2,000 | | | $ | 2,014,860 | |
| | |
Central Texas Regional Mobility Authority, 5.00%, 1/1/34 | | | 1,250 | | | | 1,543,600 | |
| | |
Charlotte, NC, (Charlotte Douglas International Airport), 4.00%, 7/1/38 | | | 1,000 | | | | 1,159,130 | |
| | |
| Chicago, IL, (O’Hare International Airport): | | | | | | |
| | |
5.00%, 1/1/33 | | | 1,000 | | | | 1,093,890 | |
| | |
5.00%, 1/1/34 | | | 1,000 | | | | 1,092,400 | |
| | |
5.00%, 1/1/34 | | | 2,500 | | | | 3,053,125 | |
| | |
5.25%, 1/1/33 | | | 3,750 | | | | 4,407,675 | |
| | |
5.25%, 1/1/34 | | | 3,750 | | | | 4,404,562 | |
| | |
5.25%, 1/1/37 | | | 1,500 | | | | 1,762,365 | |
| | |
Dallas and Fort Worth, TX, (Dallas/Fort Worth International Airport), 5.25%, 11/1/32 | | | 3,825 | | | | 4,087,969 | |
| | |
| El Paso, TX, (El Paso International Airport): | | | | | | |
| | |
5.00%, 8/15/22 | | | 655 | | | | 671,028 | |
| | |
5.00%, 8/15/33 | | | 955 | | | | 1,181,755 | |
| | |
Florida Department of Transportation, 5.00%, 7/1/28 | | | 2,455 | | | | 2,856,172 | |
| | | | |
| | 19 | | See Notes to Financial Statements. |
Parametric
TABS Intermediate-Term Municipal Bond Fund
January 31, 2022
Portfolio of Investments — continued
| | | | | | | | |
| Security | | Principal
Amount
(000’s omitted) | | | Value | |
|
| Transportation (continued) | |
| | |
| Georgia Ports Authority: | | | | | | |
| | |
5.00%, 7/1/30 | | $ | 1,400 | | | $ | 1,759,072 | |
| | |
5.00%, 7/1/33 | | | 2,625 | | | | 3,358,766 | |
| | |
Idaho Housing and Finance Association, Federal Highway Trust Fund, 5.00%, 7/15/25 | | | 1,000 | | | | 1,125,220 | |
| | |
Illinois Toll Highway Authority, 5.00%, 1/1/33 | | | 100 | | | | 112,653 | |
| | |
| Maine Turnpike Authority: | | | | | | |
| | |
4.00%, 7/1/42(2) | | | 2,400 | | | | 2,771,136 | |
| | |
5.00%, 7/1/35(2) | | | 1,000 | | | | 1,282,210 | |
| | |
| Metropolitan Transportation Authority, NY: | | | | | | |
| | |
0.363%, (67% of SOFR + 0.33%), 4/1/24 (Put Date), 11/1/35(1) | | | 2,375 | | | | 2,356,903 | |
| | |
5.00%, 11/15/29 | | | 5,965 | | | | 6,677,579 | |
| | |
5.00%, 11/15/29 | | | 1,390 | | | | 1,576,802 | |
| | |
Series 2015F, 5.00%, 11/15/28 | | | 2,560 | | | | 2,868,275 | |
| | |
| Metropolitan Transportation Authority, NY, Green Bonds: | | | | | | |
| | |
4.00%, 11/15/32 | | | 5,000 | | | | 5,467,100 | |
| | |
5.00%, 11/15/25 | | | 3,480 | | | | 3,925,196 | |
| | |
Pennsylvania Turnpike Commission, 4.00%, 12/1/43 | | | 1,325 | | | | 1,512,488 | |
| | |
| Riverside County Transportation Commission, CA: | | | | | | |
| | |
4.00%, 6/1/37 | | | 2,375 | | | | 2,751,129 | |
| | |
4.00%, 6/1/38 | | | 2,625 | | | | 3,032,138 | |
| | |
4.00%, 6/1/39 | | | 2,575 | | | | 2,964,958 | |
| | |
| Salt Lake City, UT, (Salt Lake City International Airport): | | | | | | |
| | |
5.00%, 7/1/35 | | | 1,685 | | | | 2,011,755 | |
| | |
5.00%, 7/1/36 | | | 1,615 | | | | 1,925,548 | |
| | |
San Francisco City and County Airport Commission, CA, (San Francisco International Airport), 5.00%, 5/1/34 | | | 2,950 | | | | 3,721,100 | |
| | |
Triborough Bridge and Tunnel Authority, NY, 0.407%, (67% of SOFR + 0.38%), 2/1/24 (Put Date), 1/1/32(1) | | | 3,000 | | | | 3,000,960 | |
| | |
Wayne County Airport Authority, MI, (Detroit Metropolitan Wayne County Airport), 5.00%, 12/1/34 | | | 3,000 | | | | 3,642,900 | |
| | |
| | | | | | | $ | 87,172,419 | |
|
| Water and Sewer — 5.4% | |
| | |
East Bay Municipal Utility District, CA, Water System Revenue, 5.00%, 6/1/30 | | $ | 3,870 | | | $ | 4,334,129 | |
| | |
Garland, TX, Water and Sewer System Revenue, 4.00%, 3/1/31 | | | 1,370 | | | | 1,572,335 | |
| | |
Hamilton County, OH, Sewer System, 5.00%, 12/1/24 | | | 1,000 | | | | 1,073,210 | |
| | |
Kansas City, MO, Sanitary Sewer System Revenue, 5.00%, 1/1/30 | | | 600 | | | | 719,424 | |
| | |
New York City Municipal Water Finance Authority, NY,
(Water and Sewer System): | | | | | | |
| | |
4.00%, 6/15/36 | | | 6,000 | | | | 6,818,340 | |
| | |
4.00%, 6/15/39 | | | 6,000 | | | | 6,944,160 | |
| | |
Series EE, 5.00%, 6/15/35 | | | 1,155 | | | | 1,219,830 | |
| | | | | | | | |
| Security | | Principal
Amount
(000’s omitted) | | | Value | |
|
| Water and Sewer (continued) | |
| | |
| Rancho California Water District Financing Authority: | | | | | | |
| | |
4.00%, 8/1/37 | | $ | 2,275 | | | $ | 2,644,392 | |
| | |
4.00%, 8/1/38 | | | 4,500 | | | | 5,210,415 | |
| | |
San Diego Public Facilities Financing Authority, CA, Water Revenue: | | | | | | | | |
| | |
4.00%, 8/1/38 | | | 1,000 | | | | 1,156,780 | |
| | |
4.00%, 8/1/39 | | | 1,000 | | | | 1,153,390 | |
| | |
South Central Connecticut Regional Water Authority: | | | | | | | | |
| | |
5.00%, 8/1/25(2) | | | 1,195 | | | | 1,326,331 | |
| | |
5.00%, 8/1/26(2) | | | 1,000 | | | | 1,135,210 | |
| | |
Westmoreland County Municipal Authority, PA, Water and Sewer Revenue, Prerefunded to 8/15/23, 5.00%, 8/15/31 | | | 1,735 | | | | 1,844,444 | |
| | |
| | | | | | | $ | 37,152,390 | |
| |
Total Tax-Exempt Municipal Obligations — 81.8%
(identified cost $551,661,269) | | | $ | 563,402,198 | |
|
| Taxable Municipal Obligations — 0.4% | |
| Security | | Principal
Amount
(000’s omitted) | | | Value | |
|
| General Obligations — 0.2% | |
| | |
Charleston County, SC, 1.773%, 12/1/28 | | $ | 1,430 | | | $ | 1,400,528 | |
| | |
| | | | | | | $ | 1,400,528 | |
|
| Special Tax Revenue — 0.2% | |
| | |
Successor Agency to San Diego Redevelopment Agency, CA: | | | | | | | | |
| | |
3.625%, 9/1/25 | | $ | 500 | | | $ | 533,025 | |
| | |
3.75%, 9/1/26 | | | 625 | | | | 670,375 | |
| | |
| | | | | | | $ | 1,203,400 | |
| |
Total Taxable Municipal Obligations — 0.4%
(identified cost $2,552,842) | | | $ | 2,603,928 | |
|
| U.S. Treasury Obligations — 14.9% | |
| Security | | Principal
Amount
(000’s omitted) | | | Value | |
| | |
| U.S. Treasury Notes: | | | | | | |
| | |
1.125%, 2/29/28 | | $ | 60,000 | | | $ | 57,993,750 | |
| | |
1.125%, 2/15/31 | | | 40,850 | | | | 38,697,397 | |
| | |
1.75%, 11/15/29 | | | 14 | | | | 14,023 | |
| | | | |
| | 20 | | See Notes to Financial Statements. |
Parametric
TABS Intermediate-Term Municipal Bond Fund
January 31, 2022
Portfolio of Investments — continued
| | | | | | | | |
| Security | | Principal
Amount
(000’s omitted) | | | Value | |
| | |
| U.S. Treasury Notes: (continued) | | | | | | |
| | |
2.25%, 11/15/27 | | $ | 6,000 | | | $ | 6,186,328 | |
| |
Total U.S. Treasury Obligations — 14.9%
(identified cost $104,916,817) | | | $ | 102,891,498 | |
| |
Total Investments — 97.1%
(identified cost $659,130,928) | | | $ | 668,897,624 | |
| |
Other Assets, Less Liabilities — 2.9% | | | $ | 20,188,037 | |
| |
Net Assets — 100.0% | | | $ | 689,085,661 | |
The percentage shown for each investment category in the Portfolio of Investments is based on net assets.
At January 31, 2022, the concentration of the Fund’s investments in the various states, determined as a percentage of net assets, is as follows:
| | | | |
| |
| California | | | 17.1% | |
| |
| New York | | | 14.5% | |
| |
| Others, representing less than 10% individually | | | 50.6% | |
The Fund invests primarily in debt securities issued by municipalities. The ability of the issuers of the debt securities to meet their obligations may be affected by economic developments in a specific industry or municipality. At January 31, 2022, 4.0% of total investments are backed by bond insurance of various financial institutions and financial guaranty assurance agencies. The aggregate percentage insured by an individual financial institution or financial guaranty assurance agency ranged from 0.7% to 2.3% of total investments.
| (1) | Variable rate security. The stated interest rate represents the rate in effect at January 31, 2022. |
| (2) | When-issued security. |
Abbreviations:
| | | | |
| | |
| AGM | | – | | Assured Guaranty Municipal Corp. |
| | |
| BAM | | – | | Build America Mutual Assurance Co. |
| | |
| Liq | | – | | Liquidity Provider |
| | |
| NPFG | | – | | National Public Finance Guarantee Corp. |
| | |
| PSF | | – | | Permanent School Fund |
| | |
| SIFMA | | – | | Securities Industry and Financial Markets Association Municipal Swap Index |
| | |
| SOFR | | – | | Secured Overnight Financing Rate |
| | | | |
| | 21 | | See Notes to Financial Statements. |
Parametric
TABS Municipal Bond Funds
January 31, 2022
Statements of Assets and Liabilities
| | | | | | | | |
| | | January 31, 2022 | |
| Assets | | Short-Term
Municipal Bond Fund | | | Intermediate-Term
Municipal Bond Fund | |
| | |
Investments — | | | | | | | | |
| | |
Identified cost | | $ | 320,116,789 | | | $ | 659,130,928 | |
| | |
Unrealized appreciation | | | 950,629 | | | | 9,766,696 | |
| | |
Investments, at value | | $ | 321,067,418 | | | $ | 668,897,624 | |
| | |
Cash | | $ | 26,047,285 | | | $ | 26,122,740 | |
| | |
Interest receivable | | | 2,548,846 | | | | 5,540,821 | |
| | |
Receivable for investments sold | | | 31,183,232 | | | | 31,255,507 | |
| | |
Receivable for Fund shares sold | | | 539,451 | | | | 1,774,494 | |
| | |
Receivable from affiliates | | | — | | | | 99,361 | |
| | |
Total assets | | $ | 381,386,232 | | | $ | 733,690,547 | |
| | |
| Liabilities | | | | | | | | |
| | |
Payable for investments purchased | | $ | 22,675,683 | | | $ | 15,822,496 | |
| | |
Payable for when-issued securities | | | 26,025,946 | | | | 25,695,414 | |
| | |
Payable for Fund shares redeemed | | | 548,009 | | | | 2,000,539 | |
| | |
Distributions payable | | | 63,533 | | | | 445,338 | |
| | |
Payable to affiliates: | | | | | | | | |
| | |
Investment adviser and administration fee | | | 129,041 | | | | 358,007 | |
| | |
Distribution and service fees | | | 30,081 | | | | 20,649 | |
| | |
Accrued expenses | | | 103,870 | | | | 262,443 | |
| | |
Total liabilities | | $ | 49,576,163 | | | $ | 44,604,886 | |
| | |
Net Assets | | $ | 331,810,069 | | | $ | 689,085,661 | |
| | |
| Sources of Net Assets | | | | | | | | |
| | |
Paid-in capital | | $ | 330,705,971 | | | $ | 679,031,903 | |
| | |
Distributable earnings | | | 1,104,098 | | | | 10,053,758 | |
| | |
Net Assets | | $ | 331,810,069 | | | $ | 689,085,661 | |
| | |
| Class A Shares | | | | | | | | |
| | |
Net Assets | | $ | 119,419,435 | | | $ | 61,491,937 | |
| | |
Shares Outstanding | | | 11,427,958 | | | | 4,923,720 | |
| | |
Net Asset Value and Redemption Price Per Share | | | | | | | | |
| | |
(net assets ÷ shares of beneficial interest outstanding) | | $ | 10.45 | | | $ | 12.49 | |
| | |
Maximum Offering Price Per Share | | | | | | | | |
| | |
(100 ÷ 97.75 and 95.25, respectively, of net asset value per share) | | $ | 10.69 | | | $ | 13.11 | |
| | |
| Class C Shares | | | | | | | | |
| | |
Net Assets | | $ | 4,603,144 | | | $ | 8,362,085 | |
| | |
Shares Outstanding | | | 443,111 | | | | 669,903 | |
| | |
Net Asset Value and Offering Price Per Share* | | | | | | | | |
| | |
(net assets ÷ shares of beneficial interest outstanding) | | $ | 10.39 | | | $ | 12.48 | |
| | |
| Class I Shares | | | | | | | | |
| | |
Net Assets | | $ | 207,787,490 | | | $ | 619,231,639 | |
| | |
Shares Outstanding | | | 19,877,275 | | | | 49,534,061 | |
| | |
Net Asset Value, Offering Price and Redemption Price Per Share | | | | | | | | |
| | |
(net assets ÷ shares of beneficial interest outstanding) | | $ | 10.45 | | | $ | 12.50 | |
On sales of $100,000 or more ($50,000 or more for Intermediate-Term Municipal Bond Fund), the offering price of Class A shares is reduced.
| * | Redemption price per share is equal to the net asset value less any applicable contingent deferred sales charge. |
| | | | |
| | 22 | | See Notes to Financial Statements. |
Parametric
TABS Municipal Bond Funds
January 31, 2022
Statements of Operations
| | | | | | | | |
| | | Year Ended January 31, 2022 | |
| Investment Income | | Short-Term
Municipal Bond Fund | | | Intermediate-Term
Municipal Bond Fund | |
| | |
Interest | | $ | 5,083,879 | | | $ | 13,400,960 | |
| | |
Total investment income | | $ | 5,083,879 | | | $ | 13,400,960 | |
| | |
| Expenses | | | | | | | | |
| | |
Investment adviser and administration fee | | $ | 1,646,969 | | | $ | 4,045,771 | |
| | |
Distribution and service fees | | | | | | | | |
| | |
Class A | | | 322,524 | | | | 164,529 | |
| | |
Class C | | | 58,872 | | | | 98,112 | |
| | |
Trustees’ fees and expenses | | | 17,754 | | | | 34,000 | |
| | |
Custodian fee | | | 89,966 | | | | 162,731 | |
| | |
Transfer and dividend disbursing agent fees | | | 104,126 | | | | 679,918 | |
| | |
Legal and accounting services | | | 55,628 | | | | 60,075 | |
| | |
Printing and postage | | | 12,547 | | | | 45,839 | |
| | |
Registration fees | | | 75,004 | | | | 115,121 | |
| | |
Miscellaneous | | | 19,203 | | | | 27,320 | |
| | |
Total expenses | | $ | 2,402,593 | | | $ | 5,433,416 | |
| | |
Deduct — | | | | | | | | |
| | |
Allocation of expenses to affiliates | | $ | — | | | $ | 787,856 | |
| | |
Total expense reductions | | $ | — | | | $ | 787,856 | |
| | |
Net expenses | | $ | 2,402,593 | | | $ | 4,645,560 | |
| | |
Net investment income | | $ | 2,681,286 | | | $ | 8,755,400 | |
| | |
| Realized and Unrealized Gain (Loss) | | | | | | | | |
| | |
Net realized gain (loss) — | | | | | | | | |
| | |
Investment transactions | | $ | 772,723 | | | $ | 436,464 | |
| | |
Net realized gain | | $ | 772,723 | | | $ | 436,464 | |
| | |
Change in unrealized appreciation (depreciation) — | | | | | | | | |
| | |
Investments | | $ | (11,253,128 | ) | | $ | (29,594,234 | ) |
| | |
Net change in unrealized appreciation (depreciation) | | $ | (11,253,128 | ) | | $ | (29,594,234 | ) |
| | |
Net realized and unrealized loss | | $ | (10,480,405 | ) | | $ | (29,157,770 | ) |
| | |
Net decrease in net assets from operations | | $ | (7,799,119 | ) | | $ | (20,402,370 | ) |
| | | | |
| | 23 | | See Notes to Financial Statements. |
Parametric
TABS Municipal Bond Funds
January 31, 2022
Statements of Changes in Net Assets
| | | | | | | | |
| | | Year Ended January 31, 2022 | |
| Increase (Decrease) in Net Assets | | Short-Term
Municipal Bond Fund | | | Intermediate-Term
Municipal Bond Fund | |
| | |
From operations — | | | | | | | | |
| | |
Net investment income | | $ | 2,681,286 | | | $ | 8,755,400 | |
| | |
Net realized gain | | | 772,723 | | | | 436,464 | |
| | |
Net change in unrealized appreciation (depreciation) | | | (11,253,128 | ) | | | (29,594,234 | ) |
| | |
Net decrease in net assets from operations | | $ | (7,799,119 | ) | | $ | (20,402,370 | ) |
| | |
Distributions to shareholders — | | | | | | | | |
| | |
Class A | | $ | (1,469,566 | ) | | $ | (925,027 | ) |
| | |
Class C | | | (30,531 | ) | | | (62,438 | ) |
| | |
Class I | | | (3,179,062 | ) | | | (10,113,572 | ) |
| | |
Total distributions to shareholders | | $ | (4,679,159 | ) | | $ | (11,101,037 | ) |
| | |
Transactions in shares of beneficial interest — | | | | | | | | |
| | |
Proceeds from sale of shares | | | | | | | | |
| | |
Class A | | $ | 12,793,020 | | | $ | 15,541,810 | |
| | |
Class C | | | 544,607 | | | | 1,040,821 | |
| | |
Class I | | | 74,416,982 | | | | 267,233,472 | |
| | |
Net asset value of shares issued to shareholders in payment of distributions declared | | | | | | | | |
| | |
Class A | | | 1,246,260 | | | | 467,442 | |
| | |
Class C | | | 22,375 | | | | 27,373 | |
| | |
Class I | | | 2,157,637 | | | | 4,193,986 | |
| | |
Cost of shares redeemed | | | | | | | | |
| | |
Class A | | | (27,132,468 | ) | | | (19,390,738 | ) |
| | |
Class C | | | (1,866,052 | ) | | | (3,100,767 | ) |
| | |
Class I | | | (114,372,021 | ) | | | (161,288,683 | ) |
| | |
Net asset value of shares converted | | | | | | | | |
| | |
Class A | | | 1,367,757 | | | | 403,852 | |
| | |
Class C | | | (1,367,757 | ) | | | (403,852 | ) |
| | |
Net increase (decrease) in net assets from Fund share transactions | | $ | (52,189,660 | ) | | $ | 104,724,716 | |
| | |
Net increase (decrease) in net assets | | $ | (64,667,938 | ) | | $ | 73,221,309 | |
|
| Net Assets | |
| | |
At beginning of year | | $ | 396,478,007 | | | $ | 615,864,352 | |
| | |
At end of year | | $ | 331,810,069 | | | $ | 689,085,661 | |
| | | | |
| | 24 | | See Notes to Financial Statements. |
Parametric
TABS Municipal Bond Funds
January 31, 2022
Statements of Changes in Net Assets — continued
| | | | | | | | |
| | | Year Ended January 31, 2021 | |
| Increase (Decrease) in Net Assets | | Short-Term
Municipal Bond Fund | | | Intermediate-Term
Municipal Bond Fund | |
| | |
From operations — | | | | | | | | |
| | |
Net investment income | | $ | 2,843,920 | | | $ | 8,502,207 | |
| | |
Net realized gain | | | 10,214,030 | | | | 6,573,299 | |
| | |
Net change in unrealized appreciation (depreciation) | | | 1,177,456 | | | | 9,520,145 | |
| | |
Net increase in net assets from operations | | $ | 14,235,406 | | | $ | 24,595,651 | |
| | |
Distributions to shareholders — | | | | | | | | |
| | |
Class A | | $ | (3,541,498 | ) | | $ | (1,397,936 | ) |
| | |
Class C | | | (225,972 | ) | | | (236,214 | ) |
| | |
Class I | | | (7,550,247 | ) | | | (12,206,858 | ) |
| | |
Total distributions to shareholders | | $ | (11,317,717 | ) | | $ | (13,841,008 | ) |
| | |
Transactions in shares of beneficial interest — | | | | | | | | |
| | |
Proceeds from sale of shares | | | | | | | | |
| | |
Class A | | $ | 37,249,781 | | | $ | 26,132,084 | |
| | |
Class C | | | 2,669,333 | | | | 3,433,108 | |
| | |
Class I | | | 205,494,247 | | | | 283,643,750 | |
| | |
Net asset value of shares issued to shareholders in payment of distributions declared | | | | | | | | |
| | |
Class A | | | 3,020,755 | | | | 737,478 | |
| | |
Class C | | | 191,875 | | | | 108,364 | |
| | |
Class I | | | 5,658,271 | | | | 5,773,149 | |
| | |
Cost of shares redeemed | | | | | | | | |
| | |
Class A | | | (28,758,476 | ) | | | (13,990,430 | ) |
| | |
Class C | | | (6,597,195 | ) | | | (12,480,513 | ) |
| | |
Class I | | | (116,376,065 | ) | | | (165,714,673 | ) |
| | |
Net asset value of shares converted | | | | | | | | |
| | |
Class A | | | 13,939,311 | | | | 2,763,847 | |
| | |
Class C | | | (13,939,311 | ) | | | (2,763,847 | ) |
| | |
Net increase in net assets from Fund share transactions | | $ | 102,552,526 | | | $ | 127,642,317 | |
| | |
Net increase in net assets | | $ | 105,470,215 | | | $ | 138,396,960 | |
|
| Net Assets | |
| | |
At beginning of year | | $ | 291,007,792 | | | $ | 477,467,392 | |
| | |
At end of year | | $ | 396,478,007 | | | $ | 615,864,352 | |
| | | | |
| | 25 | | See Notes to Financial Statements. |
Parametric
TABS Municipal Bond Funds
January 31, 2022
Financial Highlights
| | | | | | | | | | | | | | | | | | | | |
| | | Short-Term Municipal Bond Fund — Class A | |
| |
| | | Year Ended January 31, | |
| | | 2022 | | | 2021 | | | 2020 | | | 2019 | | | 2018 | |
| | | | | |
Net asset value — Beginning of year | | $ | 10.830 | | | $ | 10.660 | | | $ | 10.350 | | | $ | 10.300 | | | $ | 10.370 | |
| | | | | |
| Income (Loss) From Operations | | | | | | | | | | | | | | | | | | | | |
| | | | | |
Net investment income | | $ | 0.059 | | | $ | 0.077 | (1) | | $ | 0.160 | (1) | | $ | 0.154 | (1) | | $ | 0.149 | |
| | | | | |
Net realized and unrealized gain (loss) | | | (0.316 | ) | | | 0.401 | | | | 0.308 | | | | 0.049 | | | | (0.074 | ) |
| | | | | |
Total income (loss) from operations | | $ | (0.257 | ) | | $ | 0.478 | | | $ | 0.468 | | | $ | 0.203 | | | $ | 0.075 | |
| | | | | |
| Less Distributions | | | | | | | | | | | | | | | | | | | | |
| | | | | |
From net investment income | | $ | (0.057 | ) | | $ | (0.078 | ) | | $ | (0.158 | ) | | $ | (0.153 | ) | | $ | (0.145 | ) |
| | | | | |
From net realized gain | | | (0.066 | ) | | | (0.230 | ) | | | — | | | | — | | | | — | |
| | | | | |
Total distributions | | $ | (0.123 | ) | | $ | (0.308 | ) | | $ | (0.158 | ) | | $ | (0.153 | ) | | $ | (0.145 | ) |
| | | | | |
Net asset value — End of year | | $ | 10.450 | | | $ | 10.830 | | | $ | 10.660 | | | $ | 10.350 | | | $ | 10.300 | |
| | | | | |
Total Return(2) | | | (2.39 | )% | | | 4.51 | % | | | 4.56 | % | | | 2.00 | % | | | 0.71 | % |
|
| Ratios/Supplemental Data | |
| | | | | |
Net assets, end of year (000’s omitted) | | $ | 119,419 | | | $ | 135,622 | | | $ | 109,210 | | | $ | 113,654 | | | $ | 149,651 | |
| | | | | |
Ratios (as a percentage of average daily net assets): | | | | | | | | | | | | | | | | | | | | |
| | | | | |
Expenses | | | 0.80 | % | | | 0.82 | % | | | 0.88 | % | | | 0.91 | % | | | 0.90 | % |
| | | | | |
Net investment income | | | 0.59 | % | | | 0.71 | % | | | 1.52 | % | | | 1.50 | % | | | 1.39 | % |
| | | | | |
Portfolio Turnover | | | 96 | % | | | 176 | % | | | 51 | % | | | 67 | % | | | 54 | % |
| (1) | Computed using average shares outstanding. |
| (2) | Returns are historical and are calculated by determining the percentage change in net asset value with all distributions reinvested and do not reflect the effect of sales charges. |
| | | | |
| | 26 | | See Notes to Financial Statements. |
Parametric
TABS Municipal Bond Funds
January 31, 2022
Financial Highlights — continued
| | | | | | | | | | | | | | | | | | | | |
| | | Short-Term Municipal Bond Fund — Class C | |
| |
| | | Year Ended January 31, | |
| | | 2022 | | | 2021 | | | 2020 | | | 2019 | | | 2018 | |
| | | | | |
Net asset value — Beginning of year | | $ | 10.790 | | | $ | 10.640 | | | $ | 10.320 | | | $ | 10.270 | | | $ | 10.340 | |
| | | | | |
| Income (Loss) From Operations | | | | | | | | | | | | | | | | | | | | |
| | | | | |
Net investment income (loss)(1) | | $ | (0.017 | ) | | $ | 0.005 | | | $ | 0.082 | | | $ | 0.077 | | | $ | 0.067 | |
| | | | | |
Net realized and unrealized gain (loss) | | | (0.317 | ) | | | 0.387 | | | | 0.317 | | | | 0.049 | | | | (0.071 | ) |
| | | | | |
Total income (loss) from operations | | $ | (0.334 | ) | | $ | 0.392 | | | $ | 0.399 | | | $ | 0.126 | | | $ | (0.004 | ) |
| | | | | |
| Less Distributions | | | | | | | | | | | | | | | | | | | | |
| | | | | |
From net investment income | | $ | — | | | $ | (0.012 | ) | | $ | (0.079 | ) | | $ | (0.076 | ) | | $ | (0.066 | ) |
| | | | | |
From net realized gain | | | (0.066 | ) | | | (0.230 | ) | | | — | | | | — | | | | — | |
| | | | | |
Total distributions | | $ | (0.066 | ) | | $ | (0.242 | ) | | $ | (0.079 | ) | | $ | (0.076 | ) | | $ | (0.066 | ) |
| | | | | |
Net asset value — End of year | | $ | 10.390 | | | $ | 10.790 | | | $ | 10.640 | | | $ | 10.320 | | | $ | 10.270 | |
| | | | | |
Total Return(2) | | | (3.11 | )% | | | 3.70 | % | | | 3.88 | % | | | 1.24 | % | | | (0.04 | )% |
| | | | | |
| Ratios/Supplemental Data | | | | | | | | | | | | | | | | | | | | |
| | | | | |
Net assets, end of year (000’s omitted) | | $ | 4,603 | | | $ | 7,473 | | | $ | 24,622 | | | $ | 35,832 | | | $ | 52,079 | |
| | | | | |
Ratios (as a percentage of average daily net assets): | | | | | | | | | | | | | | | | | | | | |
| | | | | |
Expenses | | | 1.55 | % | | | 1.57 | % | | | 1.63 | % | | | 1.66 | % | | | 1.65 | % |
| | | | | |
Net investment income (loss) | | | (0.16 | )% | | | 0.05 | % | | | 0.78 | % | | | 0.75 | % | | | 0.64 | % |
| | | | | |
Portfolio Turnover | | | 96 | % | | | 176 | % | | | 51 | % | | | 67 | % | | | 54 | % |
| (1) | Computed using average shares outstanding. |
| (2) | Returns are historical and are calculated by determining the percentage change in net asset value with all distributions reinvested and do not reflect the effect of sales charges. |
| | | | |
| | 27 | | See Notes to Financial Statements. |
Parametric
TABS Municipal Bond Funds
January 31, 2022
Financial Highlights — continued
| | | | | | | | | | | | | | | | | | | | |
| | | Short-Term Municipal Bond Fund — Class I | |
| |
| | | Year Ended January 31, | |
| | | 2022 | | | 2021 | | | 2020 | | | 2019 | | | 2018 | |
| | | | | |
Net asset value — Beginning of year | | $ | 10.830 | | | $ | 10.660 | | | $ | 10.350 | | | $ | 10.300 | | | $ | 10.370 | |
| | | | | |
| Income (Loss) From Operations | | | | | | | | | | | | | | | | | | | | |
| | | | | |
Net investment income | | $ | 0.086 | | | $ | 0.105 | | | $ | 0.186 | | | $ | 0.181 | | | $ | 0.172 | |
| | | | | |
Net realized and unrealized gain (loss) | | | (0.316 | ) | | | 0.400 | | | | 0.308 | | | | 0.048 | | | | (0.071 | ) |
| | | | | |
Total income (loss) from operations | | $ | (0.230 | ) | | $ | 0.505 | | | $ | 0.494 | | | $ | 0.229 | | | $ | 0.101 | |
| | | | | |
| Less Distributions | | | | | | | | | | | | | | | | | | | | |
| | | | | |
From net investment income | | $ | (0.084 | ) | | $ | (0.105 | ) | | $ | (0.184 | ) | | $ | (0.179 | ) | | $ | (0.171 | ) |
| | | | | |
From net realized gain | | | (0.066 | ) | | | (0.230 | ) | | | — | | | | — | | | | — | |
| | | | | |
Total distributions | | $ | (0.150 | ) | | $ | (0.335 | ) | | $ | (0.184 | ) | | $ | (0.179 | ) | | $ | (0.171 | ) |
| | | | | |
Net asset value — End of year | | $ | 10.450 | | | $ | 10.830 | | | $ | 10.660 | | | $ | 10.350 | | | $ | 10.300 | |
| | | | | |
Total Return(1) | | | (2.14 | )% | | | 4.77 | % | | | 4.82 | % | | | 2.25 | % | | | 0.96 | % |
| | | | | |
| Ratios/Supplemental Data | | | | | | | | | | | | | | | | | | | | |
| | | | | |
Net assets, end of year (000’s omitted) | | $ | 207,787 | | | $ | 253,382 | | | $ | 157,176 | | | $ | 164,679 | | | $ | 179,156 | |
| | | | | |
Ratios (as a percentage of average daily net assets): | | | | | | | | | | | | | | | | | | | | |
| | | | | |
Expenses | | | 0.55 | % | | | 0.57 | % | | | 0.63 | % | | | 0.66 | % | | | 0.65 | % |
| | | | | |
Net investment income | | | 0.84 | % | | | 0.92 | % | | | 1.77 | % | | | 1.75 | % | | | 1.64 | % |
| | | | | |
Portfolio Turnover | | | 96 | % | | | 176 | % | | | 51 | % | | | 67 | % | | | 54 | % |
| (1) | Returns are historical and are calculated by determining the percentage change in net asset value with all distributions reinvested. |
| | | | |
| | 28 | | See Notes to Financial Statements. |
Parametric
TABS Municipal Bond Funds
January 31, 2022
Financial Highlights — continued
| | | | | | | | | | | | | | | | | | | | |
| | | Intermediate-Term Municipal Bond Fund — Class A | |
| |
| | | Year Ended January 31, | |
| | | 2022 | | | 2021 | | | 2020 | | | 2019 | | | 2018 | |
| | | | | |
Net asset value — Beginning of year | | $ | 13.070 | | | $ | 12.810 | | | $ | 12.210 | | | $ | 12.160 | | | $ | 12.070 | |
| | | | | |
| Income (Loss) From Operations | | | | | | | | | | | | | | | | | | | | |
| | | | | |
Net investment income | | $ | 0.135 | | | $ | 0.184 | | | $ | 0.228 | | | $ | 0.235 | | | $ | 0.227 | |
| | | | | |
Net realized and unrealized gain (loss) | | | (0.532 | ) | | | 0.385 | | | | 0.637 | | | | 0.050 | | | | 0.090 | |
| | | | | |
Total income (loss) from operations | | $ | (0.397 | ) | | $ | 0.569 | | | $ | 0.865 | | | $ | 0.285 | | | $ | 0.317 | |
| | | | | |
| Less Distributions | | | | | | | | | | | | | | | | | | | | |
| | | | | |
From net investment income | | $ | (0.135 | ) | | $ | (0.184 | ) | | $ | (0.228 | ) | | $ | (0.235 | ) | | $ | (0.227 | ) |
| | | | | |
From net realized gain | | | (0.048 | ) | | | (0.125 | ) | | | (0.037 | ) | | | — | | | | — | |
| | | | | |
Total distributions | | $ | (0.183 | ) | | $ | (0.309 | ) | | $ | (0.265 | ) | | $ | (0.235 | ) | | $ | (0.227 | ) |
| | | | | |
Net asset value — End of year | | $ | 12.490 | | | $ | 13.070 | | | $ | 12.810 | | | $ | 12.210 | | | $ | 12.160 | |
| | | | | |
Total Return(1)(2) | | | (3.08 | )% | | | 4.49 | % | | | 7.15 | % | | | 2.38 | % | | | 2.62 | % |
| | | | | |
| Ratios/Supplemental Data | | | | | | | | | | | | | | | | | | | | |
| | | | | |
Net assets, end of year (000’s omitted) | | $ | 61,492 | | | $ | 67,422 | | | $ | 50,697 | | | $ | 42,715 | | | $ | 48,494 | |
| | | | | |
Ratios (as a percentage of average daily net assets): | | | | | | | | | | | | | | | | | | | | |
| | | | | |
Expenses(2) | | | 0.90 | % | | | 0.90 | % | | | 0.90 | % | | | 0.90 | % | | | 0.90 | % |
| | | | | |
Net investment income | | | 1.09 | % | | | 1.41 | % | | | 1.81 | % | | | 1.95 | % | | | 1.85 | % |
| | | | | |
Portfolio Turnover | | | 61 | % | | | 104 | % | | | 74 | % | | | 86 | % | | | 62 | % |
| (1) | Returns are historical and are calculated by determining the percentage change in net asset value with all distributions reinvested and do not reflect the effect of sales charges. |
| (2) | The investment adviser and administrator and/or sub-adviser reimbursed certain operating expenses (equal to 0.12%, 0.09%, 0.08%, 0.08% and 0.07% of average daily net assets for the years ended January 31, 2022, 2021, 2020, 2019 and 2018, respectively). Absent this reimbursement, total return would be lower. |
| | | | |
| | 29 | | See Notes to Financial Statements. |
Parametric
TABS Municipal Bond Funds
January 31, 2022
Financial Highlights — continued
| | | | | | | | | | | | | | | | | | | | |
| | | Intermediate-Term Municipal Bond Fund — Class C | |
| |
| | | Year Ended January 31, | |
| | | 2022 | | | 2021 | | | 2020 | | | 2019 | | | 2018 | |
| | | | | |
Net asset value — Beginning of year | | $ | 13.070 | | | $ | 12.810 | | | $ | 12.210 | | | $ | 12.160 | | | $ | 12.060 | |
| | | | | |
| Income (Loss) From Operations | | | | | | | | | | | | | | | | | | | | |
| | | | | |
Net investment income | | $ | 0.044 | (1) | | $ | 0.092 | (1) | | $ | 0.133 | | | $ | 0.143 | | | $ | 0.134 | |
| | | | | |
Net realized and unrealized gain (loss) | | | (0.548 | ) | | | 0.379 | | | | 0.638 | | | | 0.051 | | | | 0.101 | |
| | | | | |
Total income (loss) from operations | | $ | (0.504 | ) | | $ | 0.471 | | | $ | 0.771 | | | $ | 0.194 | | | $ | 0.235 | |
| | | | | |
| Less Distributions | | | | | | | | | | | | | | | | | | | | |
| | | | | |
From net investment income | | $ | (0.038 | ) | | $ | (0.086 | ) | | $ | (0.134 | ) | | $ | (0.144 | ) | | $ | (0.135 | ) |
| | | | | |
From net realized gain | | | (0.048 | ) | | | (0.125 | ) | | | (0.037 | ) | | | — | | | | — | |
| | | | | |
Total distributions | | $ | (0.086 | ) | | $ | (0.211 | ) | | $ | (0.171 | ) | | $ | (0.144 | ) | | $ | (0.135 | ) |
| | | | | |
Net asset value — End of year | | $ | 12.480 | | | $ | 13.070 | | | $ | 12.810 | | | $ | 12.210 | | | $ | 12.160 | |
| | | | | |
Total Return(2)(3) | | | (3.88 | )% | | | 3.70 | % | | | 6.35 | % | | | 1.61 | % | | | 1.94 | % |
| | | | | |
| Ratios/Supplemental Data | | | | | | | | | | | | | | | | | | | | |
| | | | | |
Net assets, end of year (000’s omitted) | | $ | 8,362 | | | $ | 11,226 | | | $ | 22,557 | | | $ | 24,456 | | | $ | 29,221 | |
| | | | | |
Ratios (as a percentage of average daily net assets): | | | | | | | | | | | | | | | | | | | | |
| | | | | |
Expenses(3) | | | 1.65 | % | | | 1.65 | % | | | 1.65 | % | | | 1.65 | % | | | 1.65 | % |
| | | | | |
Net investment income | | | 0.34 | % | | | 0.72 | % | | | 1.08 | % | | | 1.20 | % | | | 1.10 | % |
| | | | | |
Portfolio Turnover | | | 61 | % | | | 104 | % | | | 74 | % | | | 86 | % | | | 62 | % |
| (1) | Computed using average shares outstanding. |
| (2) | Returns are historical and are calculated by determining the percentage change in net asset value with all distributions reinvested and do not reflect the effect of sales charges. |
| (3) | The investment adviser and administrator and/or sub-adviser reimbursed certain operating expenses (equal to 0.12%, 0.09%, 0.08%, 0.08% and 0.07% of average daily net assets for the years ended January 31, 2022, 2021, 2020, 2019 and 2018, respectively). Absent this reimbursement, total return would be lower. |
| | | | |
| | 30 | | See Notes to Financial Statements. |
Parametric
TABS Municipal Bond Funds
January 31, 2022
Financial Highlights — continued
| | | | | | | | | | | | | | | | | | | | |
| | | Intermediate-Term Municipal Bond Fund — Class I | |
| |
| | | Year Ended January 31, | |
| | | 2022 | | | 2021 | | | 2020 | | | 2019 | | | 2018 | |
| | | | | |
Net asset value — Beginning of year | | $ | 13.090 | | | $ | 12.820 | | | $ | 12.220 | | | $ | 12.180 | | | $ | 12.080 | |
| | | | | |
| Income (Loss) From Operations | | | | | | | | | | | | | | | | | | | | |
| | | | | |
Net investment income | | $ | 0.167 | | | $ | 0.216 | | | $ | 0.260 | | | $ | 0.265 | | | $ | 0.258 | |
| | | | | |
Net realized and unrealized gain (loss) | | | (0.542 | ) | | | 0.395 | | | | 0.636 | | | | 0.040 | | | | 0.100 | |
| | | | | |
Total income (loss) from operations | | $ | (0.375 | ) | | $ | 0.611 | | | $ | 0.896 | | | $ | 0.305 | | | $ | 0.358 | |
| | | | | |
| Less Distributions | | | | | | | | | | | | | | | | | | | | |
| | | | | |
From net investment income | | $ | (0.167 | ) | | $ | (0.216 | ) | | $ | (0.259 | ) | | $ | (0.265 | ) | | $ | (0.258 | ) |
| | | | | |
From net realized gain | | | (0.048 | ) | | | (0.125 | ) | | | (0.037 | ) | | | — | | | | — | |
| | | | | |
Total distributions | | $ | (0.215 | ) | | $ | (0.341 | ) | | $ | (0.296 | ) | | $ | (0.265 | ) | | $ | (0.258 | ) |
| | | | | |
Net asset value — End of year | | $ | 12.500 | | | $ | 13.090 | | | $ | 12.820 | | | $ | 12.220 | | | $ | 12.180 | |
| | | | | |
Total Return(1)(2) | | | (2.90 | )% | | | 4.82 | % | | | 7.41 | % | | | 2.63 | % | | | 2.87 | % |
| | | | | |
| Ratios/Supplemental Data | | | | | | | | | | | | | | | | | | | | |
| | | | | |
Net assets, end of year (000’s omitted) | | $ | 619,232 | | | $ | 537,216 | | | $ | 404,214 | | | $ | 396,647 | | | $ | 413,436 | |
| | | | | |
Ratios (as a percentage of average daily net assets): | | | | | | | | | | | | | | | | | | | | |
| | | | | |
Expenses(2) | | | 0.65 | % | | | 0.65 | % | | | 0.65 | % | | | 0.65 | % | | | 0.65 | % |
| | | | | |
Net investment income | | | 1.34 | % | | | 1.66 | % | | | 2.07 | % | | | 2.19 | % | | | 2.10 | % |
| | | | | |
Portfolio Turnover | | | 61 | % | | | 104 | % | | | 74 | % | | | 86 | % | | | 62 | % |
| (1) | Returns are historical and are calculated by determining the percentage change in net asset value with all distributions reinvested. |
| (2) | The investment adviser and administrator and/or sub-adviser reimbursed certain operating expenses (equal to 0.12%, 0.09%, 0.08%, 0.08% and 0.07% of average daily net assets for the years ended January 31, 2022, 2021, 2020, 2019 and 2018, respectively). Absent this reimbursement, total return would be lower. |
| | | | |
| | 31 | | See Notes to Financial Statements. |
Parametric
TABS Municipal Bond Funds
January 31, 2022
Notes to Financial Statements
1 Significant Accounting Policies
Eaton Vance Municipals Trust II (the Trust) is a Massachusetts business trust registered under the Investment Company Act of 1940, as amended (the 1940 Act), as an open-end management investment company. The Trust presently consists of six funds, two of which, each diversified, are included in these financial statements. They include Parametric TABS Short-Term Municipal Bond Fund (Short-Term Municipal Bond Fund) and Parametric TABS Intermediate-Term Municipal Bond Fund (Intermediate-Term Municipal Bond Fund), (each individually referred to as the Fund, and collectively, the Funds). The Funds’ investment objective is to seek after-tax total return. The Funds offer three classes of shares. Class A shares are generally sold subject to a sales charge imposed at time of purchase. Class C shares are sold at net asset value and are generally subject to a contingent deferred sales charge (see Note 5). Effective January 25, 2019, Class C shares generally automatically convert to Class A shares ten years after their purchase and, effective November 5, 2020, automatically convert to Class A shares eight years after their purchase as described in the Funds’ prospectus. Class I shares are sold at net asset value and are not subject to a sales charge. Each class represents a pro-rata interest in the Fund, but votes separately on class-specific matters and (as noted below) is subject to different expenses. Realized and unrealized gains and losses are allocated daily to each class of shares based on the relative net assets of each class to the total net assets of the Fund. Net investment income, other than class-specific expenses, is allocated daily to each class of shares based upon the ratio of the value of each class’s paid shares to the total value of all paid shares. Each class of shares differs in its distribution plan and certain other class-specific expenses.
The following is a summary of significant accounting policies of the Funds. The policies are in conformity with accounting principles generally accepted in the United States of America (U.S. GAAP). Each Fund is an investment company and follows accounting and reporting guidance in the Financial Accounting Standards Board (FASB) Accounting Standards Codification Topic 946.
A Investment Valuation — The following methodologies are used to determine the market value or fair value of investments.
Debt Obligations. Debt obligations are generally valued on the basis of valuations provided by third party pricing services, as derived from such services’ pricing models. Inputs to the models may include, but are not limited to, reported trades, executable bid and ask prices, broker/dealer quotations, prices or yields of securities with similar characteristics, interest rates, anticipated prepayments, benchmark curves or information pertaining to the issuer, as well as industry and economic events. The pricing services may use a matrix approach, which considers information regarding securities with similar characteristics to determine the valuation for a security. Short-term debt obligations purchased with a remaining maturity of sixty days or less for which a valuation from a third party pricing service is not readily available may be valued at amortized cost, which approximates fair value.
Fair Valuation. Investments for which valuations or market quotations are not readily available or are deemed unreliable are valued at fair value using methods determined in good faith by or at the direction of the Trustees of a Fund in a manner that most fairly reflects the security’s “fair value”, which is the amount that a Fund might reasonably expect to receive for the security upon its current sale in the ordinary course. Each such determination is based on a consideration of relevant factors, which are likely to vary from one pricing context to another. These factors may include, but are not limited to, the type of security, the existence of any contractual restrictions on the security’s disposition, the price and extent of public trading in similar securities of the issuer or of comparable companies or entities, quotations or relevant information obtained from broker/dealers or other market participants, information obtained from the issuer, analysts, and/or the appropriate stock exchange (for exchange-traded securities), an analysis of the company’s or entity’s financial statements, and an evaluation of the forces that influence the issuer and the market(s) in which the security is purchased and sold.
B Investment Transactions and Related Income — Investment transactions for financial statement purposes are accounted for on a trade date basis. Realized gains and losses on investments sold are determined on the basis of identified cost. Interest income is recorded on the basis of interest accrued, adjusted for amortization of premium or accretion of discount.
C Federal Taxes — Each Fund’s policy is to comply with the provisions of the Internal Revenue Code applicable to regulated investment companies and to distribute to shareholders each year substantially all of its taxable, if any, and tax-exempt net investment income, and all or substantially all of its net realized capital gains. Accordingly, no provision for federal income or excise tax is necessary. Each Fund intends to satisfy conditions which will enable it to designate distributions from the interest income generated by its investments in non-taxable municipal securities, which are exempt from regular federal income tax when received by each Fund, as exempt-interest dividends. The portion of such interest, if any, earned on private activity bonds issued after August 7, 1986, may be considered a tax preference item to shareholders.
As of January 31, 2022, the Funds had no uncertain tax positions that would require financial statement recognition, de-recognition, or disclosure. Each Fund files a U.S. federal income tax return annually after its fiscal year-end, which is subject to examination by the Internal Revenue Service for a period of three years from the date of filing.
D Expenses — The majority of expenses of the Trust are directly identifiable to an individual fund. Expenses which are not readily identifiable to a specific fund are allocated taking into consideration, among other things, the nature and type of expense and the relative size of the funds.
E Legal Fees — Legal fees and other related expenses incurred as part of negotiations of the terms and requirement of capital infusions, or that are expected to result in the restructuring of, or a plan of reorganization for, an investment are recorded as realized losses. Ongoing expenditures to protect or enhance an investment are treated as operating expenses.
Parametric
TABS Municipal Bond Funds
January 31, 2022
Notes to Financial Statements — continued
F Use of Estimates — The preparation of the financial statements in conformity with U.S. GAAP requires management to make estimates and assumptions that affect the reported amounts of assets and liabilities at the date of the financial statements and the reported amounts of income and expense during the reporting period. Actual results could differ from those estimates.
G Indemnifications — Under the Trust’s organizational documents, its officers and Trustees may be indemnified against certain liabilities and expenses arising out of the performance of their duties to the Funds. Under Massachusetts law, if certain conditions prevail, shareholders of a Massachusetts business trust (such as the Trust) could be deemed to have personal liability for the obligations of the Trust. However, the Trust’s Declaration of Trust contains an express disclaimer of liability on the part of Fund shareholders and the By-laws provide that the Trust shall assume, upon request by the shareholder, the defense on behalf of any Fund shareholders. Moreover, the By-laws also provide for indemnification out of Fund property of any shareholder held personally liable solely by reason of being or having been a shareholder for all loss or expense arising from such liability. Additionally, in the normal course of business, each Fund enters into agreements with service providers that may contain indemnification clauses. Each Fund’s maximum exposure under these arrangements is unknown as this would involve future claims that may be made against each Fund that have not yet occurred.
H When-Issued Securities and Delayed Delivery Transactions — The Funds may purchase securities on a delayed delivery or when-issued basis. Payment and delivery may take place after the customary settlement period for that security. At the time the transaction is negotiated, the price of the security that will be delivered is fixed. The Funds maintain cash and/or security positions for these commitments such that sufficient liquid assets will be available to make payments upon settlement. Securities purchased on a delayed delivery or when-issued basis are marked-to-market daily and begin earning interest on settlement date. Such security purchases are subject to the risk that when delivered they will be worth less than the agreed upon payment price. Losses may also arise if the counterparty does not perform under the contract.
2 Distributions to Shareholders and Income Tax Information
The net investment income of each Fund is determined daily and substantially all of the net investment income so determined is declared as a dividend to shareholders of record at the time of declaration. Distributions are declared separately for each class of shares. Distributions are paid monthly. Distributions of realized capital gains are made at least annually. Shareholders may reinvest income and capital gain distributions in additional shares of the same class of a Fund at the net asset value as of the reinvestment date or, at the election of the shareholder, receive distributions in cash. Distributions to shareholders are determined in accordance with income tax regulations, which may differ from U.S. GAAP. As required by U.S. GAAP, only distributions in excess of tax basis earnings and profits are reported in the financial statements as a return of capital. Permanent differences between book and tax accounting relating to distributions are reclassified to paid-in capital. For tax purposes, distributions from short-term capital gains are considered to be from ordinary income.
The tax character of distributions declared for the years ended January 31, 2022 and January 31, 2021 was as follows:
| | | | | | | | |
| | | Year Ended January 31, 2022 | |
| | | Short-Term
Municipal Bond Fund | | | Intermediate-Term
Municipal Bond Fund | |
| | |
Tax-exempt income | | $ | 2,121,312 | | | $ | 7,501,575 | |
| | |
Ordinary income | | $ | 1,771,614 | | | $ | 2,683,514 | |
| | |
Long-term capital gains | | $ | 786,233 | | | $ | 915,948 | |
| |
| | | Year Ended January 31, 2021 | |
| | | Short-Term
Municipal Bond Fund | | | Intermediate-Term Municipal Bond Fund | |
| | |
Tax-exempt income | | $ | 2,632,760 | | | $ | 8,325,258 | |
| | |
Ordinary income | | $ | 3,759,564 | | | $ | 204,373 | |
| | |
Long-term capital gains | | $ | 4,925,393 | | | $ | 5,311,377 | |
Parametric
TABS Municipal Bond Funds
January 31, 2022
Notes to Financial Statements — continued
During the year ended January 31, 2022, the following amounts were reclassified due to the Funds’ use of equalization accounting. Tax equalization accounting allows a Fund to treat as a distribution that portion of redemption proceeds representing a redeeming shareholder’s portion of undistributed taxable income and net capital gains.
| | | | | | | | |
| | | Short-Term
Municipal Bond Fund | | | Intermediate-Term
Municipal Bond Fund | |
|
Change in: | |
| | |
Paid-in capital | | $ | 438,646 | | | $ | 437,529 | |
| | |
Distributable earnings | | $ | (438,646 | ) | | $ | (437,529 | ) |
These reclassifications had no effect on the net assets or net asset value per share of the Funds.
As of January 31, 2022, the components of distributable earnings (accumulated loss) on a tax basis were as follows:
| | | | | | | | |
| | | Short-Term
Municipal Bond Fund | | | Intermediate-Term
Municipal Bond Fund | |
| | |
Undistributed tax-exempt income | | $ | — | | | $ | 430,878 | |
| | |
Net unrealized appreciation | | | 1,167,631 | | | | 10,068,218 | |
| | |
Distributions payable | | | (63,533 | ) | | | (445,338 | ) |
| | |
Distributable earnings | | $ | 1,104,098 | | | $ | 10,053,758 | |
The cost and unrealized appreciation (depreciation) of investments of each Fund at January 31, 2022, as determined on a federal income tax basis, were as follows:
| | | | | | | | |
| | | Short-Term
Municipal Bond Fund | | | Intermediate-Term
Municipal Bond Fund | |
| | |
Aggregate cost | | $ | 319,899,787 | | | $ | 658,829,406 | |
| | |
Gross unrealized appreciation | | $ | 4,576,677 | | | $ | 17,813,955 | |
| | |
Gross unrealized depreciation | | | (3,409,046 | ) | | | (7,745,737 | ) |
| | |
Net unrealized appreciation | | $ | 1,167,631 | | | $ | 10,068,218 | |
3 Investment Adviser and Administration Fee and Other Transactions with Affiliates
The investment adviser and administration fee is earned by Eaton Vance Management (EVM) as compensation for investment advisory and administrative services rendered to each Fund. On March 1, 2021, Morgan Stanley acquired Eaton Vance Corp. (the “Transaction”) and EVM became an indirect, wholly-owned subsidiary of Morgan Stanley. In connection with the Transaction, each Fund entered into a new investment advisory and administrative agreement (the “New Agreement”) with EVM, which took effect on March 1, 2021. Short-Term Municipal Bond Fund’s prior fee reduction agreement was incorporated into its New Agreement. Pursuant to each Fund’s New Agreement (and each Fund’s investment advisory and administrative agreement and
Parametric
TABS Municipal Bond Funds
January 31, 2022
Notes to Financial Statements — continued
for Short-Term Municipal Bond Fund, its related fee reduction agreement, in effect prior to March 1, 2021), the fee is computed at an annual rate as a percentage of average daily net assets as follows and is payable monthly:
| | | | | | | | |
| | | Annual Fee Rate | |
| Average Daily Net Assets | | Short-Term
Municipal Bond Fund | | | Intermediate-Term
Municipal Bond Fund | |
| | |
Up to $500 million | | | 0.45 | % | | | 0.600 | % |
| | |
$500 million but less than $1 billion | | | 0.44 | % | | | 0.600 | % |
| | |
$1 billion but less than $2 billion | | | 0.43 | % | | | 0.575 | % |
| | |
$2 billion but less than $5 billion | | | 0.41 | % | | | 0.550 | % |
| | |
$5 billion and over | | | 0.40 | % | | | 0.530 | % |
For the year ended January 31, 2022, investment adviser and administration fees incurred by the Funds and the effective annual rates, as a percentage of average daily net assets, were as follows:
| | | | | | | | |
| | | Short-Term
Municipal Bond Fund | | | Intermediate-Term
Municipal Bond Fund | |
| | |
Investment Adviser and Administration Fee | | $ | 1,646,969 | | | $ | 4,045,771 | |
| | |
Effective Annual Rate | | | 0.45 | % | | | 0.60 | % |
Pursuant to an investment sub-advisory agreement, EVM has delegated the investment management of each Fund to Parametric Portfolio Associates LLC (Parametric), an affiliate of EVM and, effective March 1, 2021, an indirect, wholly-owned subsidiary of Morgan Stanley. In connection with the Transaction, EVM entered into a new investment sub-advisory agreement with Parametric, which took effect on March 1, 2021. EVM pays Parametric a portion of its investment adviser and administration fee for sub-advisory services provided to the Funds.
For Intermediate-Term Municipal Bond Fund, EVM and Parametric have agreed to reimburse the Fund’s expenses to the extent that total annual operating expenses (relating to ordinary operating expenses only) exceed 0.90%, 1.65% and 0.65% of the Fund’s average daily net assets for Class A, Class C and Class I, respectively. This agreement may be changed or terminated after May 31, 2022. Pursuant to this agreement, EVM and Parametric were allocated $787,856 in total of Intermediate-Term Municipal Bond Fund’s operating expenses for the year ended January 31, 2022.
EVM provides sub-transfer agency and related services to the Funds pursuant to a Sub-Transfer Agency Support Services Agreement. Eaton Vance Distributors, Inc. (EVD), an affiliate of EVM and the Funds’ principal underwriter, received a portion of the sales charge on sales of Class A shares of the Funds. Morgan Stanley affiliated broker-dealers, which may be deemed to be affiliates of EVM and EVD, also received a portion of the sales charge on the sales of Class A shares from March 1, 2021 through January 31, 2022. EVD also received distribution and service fees from Class A and Class C shares (see Note 4) and contingent deferred sales charges (see Note 5). Sub-transfer agent fees earned by EVM, which are included in transfer and dividend disbursing agent fees on the Statements of Operations, and Class A sales charges that the Funds were informed were received by EVD and Morgan Stanley affiliated broker-dealers for the year ended January 31, 2022 were as follows:
| | | | | | | | |
| | | Short-Term
Municipal Bond Fund | | | Intermediate-Term
Municipal Bond Fund | |
| | |
EVM’s Sub-Transfer Agent Fees | | $ | 6,028 | | | $ | 4,482 | |
| | |
EVD’s Class A Sales Charges | | $ | 548 | | | $ | 1,998 | |
| | |
Morgan Stanley affiliated broker-dealers’ Class A Sales Charges | | $ | 1,567 | | | $ | 600 | |
Trustees and officers of the Funds who are members of EVM’s organization receive remuneration for their services to the Funds out of the investment adviser and administration fee. Trustees of the Funds who are not affiliated with EVM may elect to defer receipt of all or a percentage of their annual fees in accordance with the terms of the Trustees Deferred Compensation Plan. For the year ended January 31, 2022, no significant amounts have been deferred. Certain officers and Trustees of the Funds are officers of EVM.
Parametric
TABS Municipal Bond Funds
January 31, 2022
Notes to Financial Statements — continued
4 Distribution Plans
Each Fund has in effect a distribution plan for Class A shares (Class A Plan) pursuant to Rule 12b-1 under the 1940 Act. Pursuant to the Class A Plan, each Fund pays EVD a distribution and service fee of 0.25% per annum of its average daily net assets attributable to Class A shares for distribution services and facilities provided to each Fund by EVD, as well as for personal services and/or the maintenance of shareholder accounts. Distribution and service fees paid or accrued to EVD for the year ended January 31, 2022 for Class A shares amounted to the following:
| | | | | | | | |
| | | Short-Term
Municipal Bond Fund | | | Intermediate-Term
Municipal Bond Fund | |
| | |
Class A Distribution and Service Fees | | $ | 322,524 | | | $ | 164,529 | |
Each Fund also has in effect a distribution plan for Class C shares (Class C Plan) pursuant to Rule 12b-1 under the 1940 Act. Pursuant to the Class C Plan, each Fund pays EVD amounts equal to 0.75% per annum of its average daily net assets attributable to Class C shares for providing ongoing distribution services and facilities to the Funds. For the year ended January 31, 2022, the Funds paid or accrued to EVD the following distribution fees:
| | | | | | | | |
| | | Short-Term
Municipal Bond Fund | | | Intermediate-Term
Municipal Bond Fund | |
| | |
Class C Distribution Fees | | $ | 44,154 | | | $ | 73,584 | |
Pursuant to the Class C Plan, the Funds also make payments of service fees to EVD, financial intermediaries and other persons in amounts equal to 0.25% per annum of the average daily net assets attributable to Class C shares. Service fees paid or accrued are for personal services and/or the maintenance of shareholder accounts. They are separate and distinct from the sales commissions and distribution fees payable to EVD. Service fees paid or accrued for the year ended January 31, 2022 amounted to the following:
| | | | | | | | |
| | | Short-Term
Municipal Bond Fund | | | Intermediate-Term
Municipal Bond Fund | |
| | |
Class C Service Fees | | $ | 14,718 | | | $ | 24,528 | |
Distribution and service fees are subject to the limitations contained in the Financial Industry Regulatory Authority Rule 2341(d).
5 Contingent Deferred Sales Charges
A contingent deferred sales charge (CDSC) of 1% generally is imposed on redemptions of Class C shares made within 12 months of purchase. Class A shares may be subject to a 1% CDSC if redeemed within 18 months of purchase (depending on the circumstances of purchase). Generally, the CDSC is based upon the lower of the net asset value at date of redemption or date of purchase. No charge is levied on shares acquired by reinvestment of dividends or capital gain distributions. For the year ended January 31, 2022, the Funds were informed that EVD received approximately the following amounts of CDSCs paid by Class A and Class C shareholders:
| | | | | | | | |
| | | Short-Term
Municipal Bond Fund | | | Intermediate-Term
Municipal Bond Fund | |
| | |
Class A | | $ | 20,000 | | | $ | 6,000 | |
| | |
Class C | | $ | 500 | | | $ | 2,000 | |
Parametric
TABS Municipal Bond Funds
January 31, 2022
Notes to Financial Statements — continued
6 Purchases and Sales of Investments
Purchases and sales of investments, other than short-term obligations, for the year ended January 31, 2022 were as follows:
| | | | | | | | |
| | | Short-Term
Municipal Bond Fund | | | Intermediate-Term
Municipal Bond Fund | |
| | |
Purchases: | | | | | | | | |
| | |
Investments (non-U.S. Government) | | $ | 268,060,492 | | | $ | 338,411,075 | |
| | |
U.S. Government and Agency Securities | | $ | 73,999,985 | | | $ | 187,363,736 | |
| | |
Sales: | | | | | | | | |
| | |
Investments (non-U.S. Government) | | $ | 296,859,147 | | | $ | 273,755,994 | |
| | |
U.S. Government and Agency Securities | | $ | 80,494,220 | | | $ | 108,639,078 | |
7 Shares of Beneficial Interest
Each Fund’s Declaration of Trust permits the Trustees to issue an unlimited number of full and fractional shares of beneficial interest (without par value). Such shares may be issued in a number of different series (such as the Funds) and classes. Transactions in Fund shares were as follows:
| | | | | | | | | | | | |
Short-Term Municipal Bond Fund | | | | | | | | | |
| | | Year Ended January 31, 2022 | |
| | | Class A | | | Class C | | | Class I | |
| | | |
Sales | | | 1,192,418 | | | | 50,891 | | | | 6,930,959 | |
| | | |
Issued to shareholders electing to receive payments of distributions in Fund shares | | | 116,663 | | | | 2,109 | | | | 201,729 | |
| | | |
Redemptions | | | (2,532,674 | ) | | | (174,871 | ) | | | (10,646,030 | ) |
| | | |
Converted from Class C shares | | | 127,144 | | | | — | | | | — | |
| | | |
Converted to Class A shares | | | — | | | | (127,673 | ) | | | — | |
| | | |
Net decrease | | | (1,096,449 | ) | | | (249,544 | ) | | | (3,513,342 | ) |
| |
| | | Year Ended January 31, 2021 | |
| | | Class A | | | Class C | | | Class I | |
| | | |
Sales | | | 3,415,718 | | | | 247,178 | | | | 18,932,254 | |
| | | |
Issued to shareholders electing to receive payments of distributions in Fund shares | | | 279,515 | | | | 17,800 | | | | 523,032 | |
| | | |
Redemptions | | | (2,690,725 | ) | | | (606,887 | ) | | | (10,802,550 | ) |
| | | |
Converted from Class C shares | | | 1,276,780 | | | | — | | | | — | |
| | | |
Converted to Class A shares | | | — | | | | (1,280,210 | ) | | | — | |
| | | |
Net increase (decrease) | | | 2,281,288 | | | | (1,622,119 | ) | | | 8,652,736 | |
Parametric
TABS Municipal Bond Funds
January 31, 2022
Notes to Financial Statements — continued
| | | | | | | | | | | | |
Intermediate-Term Municipal Bond Fund | | | | | | | | | |
| | | Year Ended January 31, 2022 | |
| | | Class A | | | Class C | | | Class I | |
| | | |
Sales | | | 1,201,456 | | | | 80,394 | | | | 20,658,776 | |
| | | |
Issued to shareholders electing to receive payments of distributions in Fund shares | | | 36,308 | | | | 2,128 | | | | 325,454 | |
| | | |
Redemptions | | | (1,501,941 | ) | | | (240,442 | ) | | | (12,498,276 | ) |
| | | |
Converted from Class C shares | | | 31,216 | | | | — | | | | — | |
| | | |
Converted to Class A shares | | | — | | | | (31,222 | ) | | | — | |
| | | |
Net increase (decrease) | | | (232,961 | ) | | | (189,142 | ) | | | 8,485,954 | |
| |
| | | Year Ended January 31, 2021 | |
| | | Class A | | | Class C | | | Class I | |
| | | |
Sales | | | 2,016,840 | | | | 265,644 | | | | 22,050,838 | |
| | | |
Issued to shareholders electing to receive payments of distributions in Fund shares | | | 56,936 | | | | 8,367 | | | | 445,203 | |
| | | |
Redemptions | | | (1,088,604 | ) | | | (962,471 | ) | | | (12,972,373 | ) |
| | | |
Converted from Class C shares | | | 213,829 | | | | — | | | | — | |
| | | |
Converted to Class A shares | | | — | | | | (213,865 | ) | | | — | |
| | | |
Net increase (decrease) | | | 1,199,001 | | | | (902,325 | ) | | | 9,523,668 | |
8 Line of Credit
The Funds participate with other portfolios and funds managed by EVM and its affiliates in an $800 million unsecured line of credit agreement with a group of banks, which is in effect through October 25, 2022. Borrowings are made by the Funds solely for temporary purposes related to redemptions and other short-term cash needs. Interest is charged to each Fund based on its borrowings at an amount above either the Secured Overnight Financing Rate (SOFR) or Federal Funds rate. In addition, a fee computed at an annual rate of 0.15% on the daily unused portion of the line of credit is allocated among the participating portfolios and funds at the end of each quarter. In connection with the renewal of the agreement in October 2021, an arrangement fee totaling $150,000 was incurred that was allocated to the participating portfolios and funds. Because the line of credit is not available exclusively to the Funds, a Fund may be unable to borrow some or all of its requested amounts at any particular time. The Funds did not have any significant borrowings or allocated fees during the year ended January 31, 2022.
9 Fair Value Measurements
Under generally accepted accounting principles for fair value measurements, a three-tier hierarchy to prioritize the assumptions, referred to as inputs, is used in valuation techniques to measure fair value. The three-tier hierarchy of inputs is summarized in the three broad levels listed below.
| • | | Level 1 – quoted prices in active markets for identical investments |
| • | | Level 2 – other significant observable inputs (including quoted prices for similar investments, interest rates, prepayment speeds, credit risk, etc.) |
| • | | Level 3 – significant unobservable inputs (including a fund’s own assumptions in determining the fair value of investments) |
In cases where the inputs used to measure fair value fall in different levels of the fair value hierarchy, the level disclosed is determined based on the lowest level input that is significant to the fair value measurement in its entirety. The inputs or methodology used for valuing securities are not necessarily an indication of the risk associated with investing in those securities.
Parametric
TABS Municipal Bond Funds
January 31, 2022
Notes to Financial Statements — continued
At January 31, 2022, the hierarchy of inputs used in valuing the Funds’ investments, which are carried at value, were as follows:
| | | | | | | | | | | | | | | | |
Short-Term Municipal Bond Fund | |
| Asset Description | | Level 1 | | | Level 2 | | | Level 3 | | | Total | |
| | | | |
Tax-Exempt Municipal Obligations | | $ | — | | | $ | 274,648,288 | | | $ | — | | | $ | 274,648,288 | |
| | | | |
Taxable Municipal Obligations | | | — | | | | 2,685,141 | | | | — | | | | 2,685,141 | |
| | | | |
U.S. Treasury Obligations | | | — | | | | 43,733,989 | | | | — | | | | 43,733,989 | |
| | | | |
Total Investments | | $ | — | | | $ | 321,067,418 | | | $ | — | | | $ | 321,067,418 | |
|
Intermediate-Term Municipal Bond Fund | |
| Asset Description | | Level 1 | | | Level 2 | | | Level 3 | | | Total | |
| | | | |
Tax-Exempt Municipal Obligations | | $ | — | | | $ | 563,402,198 | | | $ | — | | | $ | 563,402,198 | |
| | | | |
Taxable Municipal Obligations | | | — | | | | 2,603,928 | | | | — | | | | 2,603,928 | |
| | | | |
U.S. Treasury Obligations | | | — | | | | 102,891,498 | | | | — | | | | 102,891,498 | |
| | | | |
Total Investments | | $ | — | | | $ | 668,897,624 | | | $ | — | | | $ | 668,897,624 | |
10 Risks and Uncertainties
Pandemic Risk
An outbreak of respiratory disease caused by a novel coronavirus was first detected in China in late 2019 and subsequently spread internationally. This coronavirus has resulted in closing borders, enhanced health screenings, changes to healthcare service preparation and delivery, quarantines, cancellations, disruptions to supply chains and customer activity, as well as general concern and uncertainty. Health crises caused by outbreaks, such as the coronavirus outbreak, may exacerbate other pre-existing political, social and economic risks and disrupt normal market conditions and operations. The impact of this outbreak has negatively affected the worldwide economy, the economies of individual countries, individual companies, and the market in general, and may continue to do so in significant and unforeseen ways, as may other epidemics and pandemics that may arise in the future. Any such impact could adversely affect the Funds’ performance, or the performance of the securities in which the Funds invest.
Parametric
TABS Municipal Bond Funds
January 31, 2022
Report of Independent Registered Public Accounting Firm
To the Trustees of Eaton Vance Municipals Trust II and Shareholders of Parametric TABS Short-Term Municipal Bond Fund and Parametric TABS Intermediate-Term Municipal Bond Fund:
Opinion on the Financial Statements and Financial Highlights
We have audited the accompanying statements of assets and liabilities of Parametric TABS Short-Term Municipal Bond Fund and Parametric TABS Intermediate-Term Municipal Bond Fund (collectively, the “Funds”) (certain of the funds constituting Eaton Vance Municipals Trust II), including the portfolios of investments, as of January 31, 2022, the related statements of operations for the year then ended, the statements of changes in net assets for each of the two years in the period then ended, the financial highlights for each of the five years in the period then ended, and the related notes. In our opinion, the financial statements and financial highlights present fairly, in all material respects, the financial position of the Funds as of January 31, 2022, and the results of their operations for the year then ended, the changes in their net assets for each of the two years in the period then ended, and the financial highlights for each of the five years in the period then ended, in conformity with accounting principles generally accepted in the United States of America.
Basis for Opinion
These financial statements and financial highlights are the responsibility of the Funds’ management. Our responsibility is to express an opinion on the Funds’ financial statements and financial highlights based on our audits. We are a public accounting firm registered with the Public Company Accounting Oversight Board (United States) (PCAOB) and are required to be independent with respect to the Funds in accordance with the U.S. federal securities laws and the applicable rules and regulations of the Securities and Exchange Commission and the PCAOB.
We conducted our audits in accordance with the standards of the PCAOB. Those standards require that we plan and perform the audits to obtain reasonable assurance about whether the financial statements and financial highlights are free of material misstatement, whether due to error or fraud. The Funds are not required to have, nor were we engaged to perform, an audit of their internal control over financial reporting. As part of our audits, we are required to obtain an understanding of internal control over financial reporting but not for the purpose of expressing an opinion on the effectiveness of the Funds’ internal control over financial reporting. Accordingly, we express no such opinion.
Our audits included performing procedures to assess the risks of material misstatement of the financial statements and financial highlights, whether due to error or fraud, and performing procedures that respond to those risks. Such procedures included examining, on a test basis, evidence regarding the amounts and disclosures in the financial statements and financial highlights. Our audits also included evaluating the accounting principles used and significant estimates made by management, as well as evaluating the overall presentation of the financial statements and financial highlights. Our procedures included confirmation of securities owned as of January 31, 2022, by correspondence with the custodian and brokers; when replies were not received from brokers, we performed other auditing procedures. We believe that our audits provide a reasonable basis for our opinion.
/s/ Deloitte & Touche LLP
Boston, Massachusetts
March 23, 2022
We have served as the auditor of one or more Eaton Vance investment companies since 1959.
Parametric
TABS Municipal Bond Funds
January 31, 2022
Federal Tax Information (Unaudited)
The Form 1099-DIV you receive in February 2023 will show the tax status of all distributions paid to your account in calendar year 2022. Shareholders are advised to consult their own tax adviser with respect to the tax consequences of their investment in the Funds. As required by the Internal Revenue Code and/or regulations, shareholders must be notified regarding exempt-interest dividends and capital gains dividends.
Exempt-Interest Dividends. For the fiscal year ended January 31, 2022, the Funds designate the following percentages of distributions from net investment income as exempt-interest dividends:
| | | | |
| |
TABS Short-Term Municipal Bond Fund | | | 54.49 | % |
| |
TABS Intermediate-Term Municipal Bond Fund | | | 73.65 | % |
Capital Gains Dividends. The Funds hereby designate the following amounts as a capital gain dividend with respect to the taxable year ended January 31, 2022, or, if subsequently determined to be different, the net capital gains of such year:
| | | | |
| |
TABS Short-Term Municipal Bond Fund | | $ | 832,154 | |
| |
TABS Intermediate-Term Municipal Bond Fund | | $ | 488,151 | |
Parametric
TABS Municipal Bond Funds
January 31, 2022
Management and Organization
Fund Management. The Trustees of Eaton Vance Municipals Trust II (the Trust) are responsible for the overall management and supervision of the Trust’s affairs. The Board members and officers of the Trust are listed below. Except as indicated, each individual has held the office shown or other offices in the same company for the last five years. Board members hold indefinite terms of office. Each Trustee holds office until his or her successor is elected and qualified, subject to a prior death, resignation, retirement, disqualification or removal. Under the terms of each Fund’s current Trustee retirement policy, an Independent Trustee must retire and resign as a Trustee on the earlier of: (i) the first day of July following his or her 74th birthday; or (ii), with limited exception, December 31st of the 20th year in which he or she has served as a Trustee. However, if such retirement and resignation would cause each Fund to be out of compliance with Section 16 of the 1940 Act or any other regulations or guidance of the SEC, then such retirement and resignation will not become effective until such time as action has been taken for each Fund to be in compliance therewith. The “noninterested Trustees” consist of those Trustees who are not “interested persons” of the Trust, as that term is defined under the 1940 Act. The business address of each Board member and officer is Two International Place, Boston, Massachusetts 02110. As used below, “BMR” refers to Boston Management and Research, “EVC” refers to Eaton Vance Corp., “EV” refers to EV LLC, “EVM” refers to Eaton Vance Management and “EVD” refers to Eaton Vance Distributors, Inc. EV is the trustee of each of EVM and BMR. Effective March 1, 2021, each of EVM, BMR, EVD and EV are indirect, wholly owned subsidiaries of Morgan Stanley. Each officer affiliated with EVM may hold a position with other EVM affiliates that is comparable to his or her position with EVM listed below. Each Trustee oversees 138 funds (with the exception of Messrs. Faust and Wennerholm and Ms. Frost who oversee 137 funds) in the Eaton Vance fund complex (including both funds and portfolios in a hub and spoke structure).
| | | | | | |
| Name and Year of Birth | | Trust
Position(s) | | Length of Service | | Principal Occupation(s) and Other Directorships During Past Five Years and Other Relevant Experience |
|
| Interested Trustee |
| | | |
Thomas E. Faust Jr. 1958 | | Trustee | | Since 2007 | | Chairman of Morgan Stanley Investment Management, Inc. (MSIM), member of the Board of Managers and President of EV, Chief Executive Officer of EVM and BMR, and Director of EVD. Formerly, Chairman, Chief Executive Officer and President of EVC. Mr. Faust is an interested person because of his positions with MSIM, BMR, EVM, EVD, and EV, which are affiliates of the Trust, and his former position with EVC, which was an affiliate of the Trust prior to March 1, 2021. Other Directorships. Formerly, Director of EVC (2007-2021) and Hexavest Inc. (investment management firm) (2012-2021). |
| | |
| Noninterested Trustees | | | | |
| | | |
Mark R. Fetting 1954 | | Trustee | | Since 2016 | | Private investor. Formerly held various positions at Legg Mason, Inc. (investment management firm) (2000-2012), including President, Chief Executive Officer, Director and Chairman (2008-2012), Senior Executive Vice President (2004-2008) and Executive Vice President (2001-2004). Formerly, President of Legg Mason family of funds (2001-2008). Formerly, Division President and Senior Officer of Prudential Financial Group, Inc. and related companies (investment management firm) (1991-2000). Other Directorships. None. |
| | | |
Cynthia E. Frost 1961 | | Trustee | | Since 2014 | | Private investor. Formerly, Chief Investment Officer of Brown University (university endowment) (2000-2012). Formerly, Portfolio Strategist for Duke Management Company (university endowment manager) (1995-2000). Formerly, Managing Director, Cambridge Associates (investment consulting company) (1989-1995). Formerly, Consultant, Bain and Company (management consulting firm) (1987-1989). Formerly, Senior Equity Analyst, BA Investment Management Company (1983-1985). Other Directorships. None. |
| | | |
George J. Gorman 1952 | | Chairperson of the Board and Trustee | | Since 2021 (Chairperson) and 2014 (Trustee) | | Principal at George J. Gorman LLC (consulting firm). Formerly, Senior Partner at Ernst & Young LLP (a registered public accounting firm) (1974-2009). Other Directorships. None. |
| | | |
Valerie A. Mosley 1960 | | Trustee | | Since 2014 | | Chairwoman and Chief Executive Officer of Valmo Ventures (a consulting and investment firm). Founder of Upward Wealth, Inc., dba BrightUP, a fintech platform. Formerly, Partner and Senior Vice President, Portfolio Manager and Investment Strategist at Wellington Management Company, LLP (investment management firm) (1992-2012). Formerly, Chief Investment Officer, PG Corbin Asset Management (1990-1992). Formerly worked in institutional corporate bond sales at Kidder Peabody (1986-1990). Other Directorships. Director of DraftKings, Inc. (digital sports entertainment and gaming company) (since September 2020). Director of Groupon, Inc. (e-commerce provider) (since April 2020). Director of Envestnet, Inc. (provider of intelligent systems for wealth management and financial wellness) (since 2018). Formerly, Director of Dynex Capital, Inc. (mortgage REIT) (2013-2020). |
Parametric
TABS Municipal Bond Funds
January 31, 2022
Management and Organization — continued
| | | | | | |
| Name and Year of Birth | | Trust
Position(s) | | Length of Service | | Principal Occupation(s) and Other Directorships During Past Five Years and Other Relevant Experience |
| | |
| Noninterested Trustees (continued) | | | | |
| | | |
William H. Park 1947 | | Trustee | | Since 2003 | | Private investor. Formerly, Consultant (management and transactional) (2012-2014). Formerly, Chief Financial Officer, Aveon Group L.P. (investment management firm) (2010-2011). Formerly, Vice Chairman, Commercial Industrial Finance Corp. (specialty finance company) (2006-2010). Formerly, President and Chief Executive Officer, Prizm Capital Management, LLC (investment management firm) (2002-2005). Formerly, Executive Vice President and Chief Financial Officer, United Asset Management Corporation (investment management firm) (1982-2001). Formerly, Senior Manager, Price Waterhouse (now PricewaterhouseCoopers) (a registered public accounting firm) (1972-1981). Other Directorships. None. |
| | | |
Helen Frame Peters 1948 | | Trustee | | Since 2008 | | Professor of Finance, Carroll School of Management, Boston College. Formerly, Dean, Carroll School of Management, Boston College (2000-2002). Formerly, Chief Investment Officer, Fixed Income, Scudder Kemper Investments (investment management firm) (1998-1999). Formerly, Chief Investment Officer, Equity and Fixed Income, Colonial Management Associates (investment management firm) (1991-1998). Other Directorships. None. |
| | | |
Keith Quinton 1958 | | Trustee | | Since 2018 | | Private investor, researcher and lecturer. Formerly, Independent Investment Committee Member at New Hampshire Retirement System (2017-2021). Formerly, Portfolio Manager and Senior Quantitative Analyst at Fidelity Investments (investment management firm) (2001-2014). Other Directorships. Formerly, Director (2016-2021) and Chairman (2019-2021) of New Hampshire Municipal Bond Bank. |
| | | |
Marcus L. Smith 1966 | | Trustee | | Since 2018 | | Private investor and independent corporate director. Formerly, Chief Investment Officer, Canada (2012-2017), Chief Investment Officer, Asia (2010-2012), Director of Asian Research (2004-2010) and portfolio manager (2001-2017) at MFS Investment Management (investment management firm). Other Directorships. Director of First Industrial Realty Trust, Inc. (an industrial REIT) (since 2021). Director of MSCI Inc. (global provider of investment decision support tools) (since 2017). Formerly, Director of DCT Industrial Trust Inc. (logistics real estate company) (2017-2018). |
| | | |
Susan J. Sutherland 1957 | | Trustee | | Since 2015 | | Private investor. Director of Ascot Group Limited and certain of its subsidiaries (insurance and reinsurance) (since 2017). Formerly, Director of Hagerty Holding Corp. (insurance) (2015-2018) and Montpelier Re Holdings Ltd. (insurance and reinsurance) (2013-2015). Formerly, Associate, Counsel and Partner at Skadden, Arps, Slate, Meagher & Flom LLP (law firm) (1982-2013). Other Directorships. Director of Kairos Acquisition Corp. (insurance/InsurTech acquisition company) (since 2021). |
| | | |
Scott E. Wennerholm 1959 | | Trustee | | Since 2016 | | Private investor. Formerly, Trustee at Wheelock College (postsecondary institution) (2012-2018). Formerly, Consultant at GF Parish Group (executive recruiting firm) (2016-2017). Formerly, Chief Operating Officer and Executive Vice President at BNY Mellon Asset Management (investment management firm) (2005-2011). Formerly, Chief Operating Officer and Chief Financial Officer at Natixis Global Asset Management (investment management firm) (1997-2004). Formerly, Vice President at Fidelity Investments Institutional Services (investment management firm) (1994-1997). Other Directorships. None. |
Parametric
TABS Municipal Bond Funds
January 31, 2022
Management and Organization — continued
| | | | | | |
| Name and Year of Birth | | Trust
Position(s) | | Length of Service | | Principal Occupation(s) During Past Five Years |
|
| Principal Officers who are not Trustees |
| | | |
Eric A. Stein 1980 | | President | | Since 2020 | | Vice President and Chief Investment Officer, Fixed Income of EVM and BMR. Prior to November 1, 2020, Mr. Stein was a co-Director of Eaton Vance’s Global Income Investments. Also Vice President of Calvert Research and Management (“CRM”). |
| | | |
Deidre E. Walsh 1971 | | Vice President and Chief Legal Officer | | Since 2009 | | Vice President of EVM and BMR. Also Vice President of CRM. |
| | | |
James F. Kirchner 1967 | | Treasurer | | Since 2007 | | Vice President of EVM and BMR. Also Vice President of CRM. |
| | | |
Jill R. Damon 1984 | | Secretary | | Since 2022 | | Vice President of EVM and BMR since 2017. Formerly, associate at Dechert LLP (2009-2017). |
| | | |
Richard F. Froio 1968 | | Chief Compliance Officer | | Since 2017 | | Vice President of EVM and BMR since 2017. Formerly, Deputy Chief Compliance Officer (Adviser/Funds) and Chief Compliance Officer (Distribution) at PIMCO (2012-2017) and Managing Director at BlackRock/Barclays Global Investors (2009-2012). |
The SAI for the Fund includes additional information about the Trustees and officers of the Trust and can be obtained without charge on Eaton Vance’s website at www.eatonvance.com or by calling 1-800-262-1122.
Eaton Vance Funds
| | |
| Privacy Notice | | April 2021 |
| | |
| |
| FACTS | | WHAT DOES EATON VANCE DO WITH YOUR
PERSONAL INFORMATION? |
| | | |
| |
| | |
| Why? | | Financial companies choose how they share your personal information. Federal law gives consumers the right to limit some but not all sharing. Federal law also requires us to tell you how we collect, share, and protect your personal information. Please read this notice carefully to understand what we do. |
| | |
| | | |
| What? | | The types of personal information we collect and share depend on the product or service you have with us. This information can include: ∎ Social Security number and income ∎ investment experience and risk tolerance ∎ checking account number and wire transfer instructions |
| | |
| | | |
| How? | | All financial companies need to share customers’ personal information to run their everyday business. In the section below, we list the reasons financial companies can share their customers’ personal information; the reasons Eaton Vance chooses to share; and whether you can limit this sharing. |
| | |
| | | |
| | | | |
Reasons we can share your
personal information | | Does Eaton Vance share? | | Can you limit this sharing? |
| For our everyday business purposes — such as to process your transactions, maintain your account(s), respond to court orders and legal investigations, or report to credit bureaus | | Yes | | No |
| For our marketing purposes — to offer our products and services to you | | Yes | | No |
| For joint marketing with other financial companies | | No | | We don’t share |
| For our investment management affiliates’ everyday business purposes — information about your transactions, experiences, and creditworthiness | | Yes | | Yes |
| For our affiliates’ everyday business purposes — information about your transactions and experiences | | Yes | | No |
| For our affiliates’ everyday business purposes — information about your creditworthiness | | No | | We don’t share |
| For our investment management affiliates to market to you | | Yes | | Yes |
| For our affiliates to market to you | | No | | We don’t share |
| For nonaffiliates to market to you | | No | | We don’t share |
| | |
| To limit our sharing | | Call toll-free 1-800-262-1122 or email: EVPrivacy@eatonvance.com Please note: If you are a new customer, we can begin sharing your information 30 days from the date we sent this notice. When you are no longer our customer, we continue to share your information as described in this notice. However, you can contact us at any time to limit our sharing. |
| | |
| | | |
| | |
| Questions? | | Call toll-free 1-800-262-1122 or email: EVPrivacy@eatonvance.com |
| | |
| | | |
Eaton Vance Funds
| | |
| Privacy Notice — continued | | April 2021 |
| | |
| Who we are |
| Who is providing this notice? | | Eaton Vance Management, Eaton Vance Distributors, Inc., Eaton Vance Trust Company, Eaton Vance Management (International) Limited, Eaton Vance Advisers International Ltd., Eaton Vance Global Advisors Limited, Eaton Vance Management’s Real Estate Investment Group, Boston Management and Research, Calvert Research and Management, Eaton Vance and Calvert Fund Families and our investment advisory affiliates (“Eaton Vance”) (see Investment Management Affiliates definition below) |
| What we do |
| How does Eaton Vance protect my personal information? | | To protect your personal information from unauthorized access and use, we use security measures that comply with federal law. These measures include computer safeguards and secured files and buildings. We have policies governing the proper handling of customer information by personnel and requiring third parties that provide support to adhere to appropriate security standards with respect to such information. |
| How does Eaton Vance collect my personal information? | | We collect your personal information, for example, when you ∎ open an account or make deposits or withdrawals from your account ∎ buy securities from us or make a wire transfer ∎ give us your contact information We also collect your personal information from others, such as credit bureaus, affiliates, or other companies. |
| Why can’t I limit all sharing? | | Federal law gives you the right to limit only ∎ sharing for affiliates’ everyday business purposes — information about your creditworthiness ∎ affiliates from using your information to market to you ∎ sharing for nonaffiliates to market to you State laws and individual companies may give you additional rights to limit sharing. See below for more on your rights under state law. |
| Definitions |
| Investment Management Affiliates | | Eaton Vance Investment Management Affiliates include registered investment advisers, registered broker-dealers, and registered and unregistered funds. Investment Management Affiliates does not include entities associated with Morgan Stanley Wealth Management, such as Morgan Stanley Smith Barney LLC and Morgan Stanley & Co. |
| Affiliates | | Companies related by common ownership or control. They can be financial and nonfinancial companies. ∎ Our affiliates include companies with a Morgan Stanley name and financial companies such as Morgan Stanley Smith Barney LLC and Morgan Stanley & Co. |
| Nonaffiliates | | Companies not related by common ownership or control. They can be financial and nonfinancial companies. ∎ Eaton Vance does not share with nonaffiliates so they can market to you. |
| Joint marketing | | A formal agreement between nonaffiliated financial companies that together market financial products or services to you. ∎ Eaton Vance doesn’t jointly market. |
| Other important information |
Vermont: Except as permitted by law, we will not share personal information we collect about Vermont residents with Nonaffiliates unless you provide us with your written consent to share such information. California: Except as permitted by law, we will not share personal information we collect about California residents with Nonaffiliates and we will limit sharing such personal information with our Affiliates to comply with California privacy laws that apply to us. |
Eaton Vance Funds
IMPORTANT NOTICES
Delivery of Shareholder Documents. The Securities and Exchange Commission (SEC) permits funds to deliver only one copy of shareholder documents, including prospectuses, proxy statements and shareholder reports, to fund investors with multiple accounts at the same residential or post office box address. This practice is often called “householding” and it helps eliminate duplicate mailings to shareholders. Eaton Vance, or your financial intermediary, may household the mailing of your documents indefinitely unless you instruct Eaton Vance, or your financial intermediary, otherwise. If you would prefer that your Eaton Vance documents not be householded, please contact Eaton Vance at 1-800-260-0761, or contact your financial intermediary. Your instructions that householding not apply to delivery of your Eaton Vance documents will typically be effective within 30 days of receipt by Eaton Vance or your financial intermediary.
Portfolio Holdings. Each Eaton Vance Fund and its underlying Portfolio(s) (if applicable) files a schedule of portfolio holdings on Part F to Form N-PORT with the SEC. Certain information filed on Form N-PORT may be viewed on the Eaton Vance website at www.eatonvance.com, by calling Eaton Vance at 1-800-260-0761 or in the EDGAR database on the SEC’s website at www.sec.gov.
Proxy Voting. From time to time, funds are required to vote proxies related to the securities held by the funds. The Eaton Vance Funds or their underlying Portfolios (if applicable) vote proxies according to a set of policies and procedures approved by the Funds’ and Portfolios’ Boards. You may obtain a description of these policies and procedures and information on how the Funds or Portfolios voted proxies relating to portfolio securities during the most recent 12-month period ended June 30, without charge, upon request, by calling 1-800-260-0761 and by accessing the SEC’s website at www.sec.gov.
This Page Intentionally Left Blank
Investment Adviser and Administrator
Eaton Vance Management
Two International Place
Boston, MA 02110
Investment Sub-Adviser
Parametric Portfolio Associates LLC
800 Fifth Avenue, Suite 2800
Seattle, WA 98104
Principal Underwriter*
Eaton Vance Distributors, Inc.
Two International Place
Boston, MA 02110
(617) 482-8260
Custodian
State Street Bank and Trust Company
State Street Financial Center, One Lincoln Street
Boston, MA 02111
Transfer Agent
BNY Mellon Investment Servicing (US) Inc.
Attn: Eaton Vance Funds
P.O. Box 9653
Providence, RI 02940-9653
(800) 260-0761
Independent Registered Public Accounting Firm
Deloitte & Touche LLP
200 Berkeley Street
Boston, MA 02116-5022
Fund Offices
Two International Place
Boston, MA 02110
| * | FINRA BrokerCheck. Investors may check the background of their Investment Professional by contacting the Financial Industry Regulatory Authority (FINRA). FINRA BrokerCheck is a free tool to help investors check the professional background of current and former FINRA-registered securities firms and brokers. FINRA BrokerCheck is available by calling 1-800-289-9999 and at www.FINRA.org. The FINRA BrokerCheck brochure describing this program is available to investors at www.FINRA.org. |
6096 1.31.22

Parametric
TABS Laddered Municipal Bond Funds
Annual Report
January 31, 2022

Commodity Futures Trading Commission Registration. The Commodity Futures Trading Commission (“CFTC”) has adopted regulations that subject registered investment companies and advisers to regulation by the CFTC if a fund invests more than a prescribed level of its assets in certain CFTC-regulated instruments (including futures, certain options and swap agreements) or markets itself as providing investment exposure to such instruments. The investment adviser has claimed an exclusion from the definition of “commodity pool operator” under the Commodity Exchange Act with respect to its management of each Fund. Accordingly, neither the Funds nor the adviser with respect to the operation of the Funds is subject to CFTC regulation. Because of its management of other strategies, the Funds’ adviser and Parametric Portfolio Associates LLC (Parametric), sub-adviser to the Funds, are registered with the CFTC as commodity pool operators. The adviser and Parametric are also registered as commodity trading advisors.
Fund shares are not insured by the FDIC and are not deposits or other obligations of, or guaranteed by, any depository institution. Shares are subject to investment risks, including possible loss of principal invested.
This report must be preceded or accompanied by a current summary prospectus or prospectus. Before investing, investors should consider carefully the investment objective, risks, and charges and expenses of a mutual fund. This and other important information is contained in the summary prospectus and prospectus, which can be obtained from a financial intermediary. Prospective investors should read the prospectus carefully before investing. For further information, please call 1-800-260-0761.
Annual Report January 31, 2022
Parametric
TABS Laddered Municipal Bond Funds
Parametric
TABS Laddered Municipal Bond Funds
January 31, 2022
Management’s Discussion of Fund Performance1
Economic and Market Conditions
As the 12-month period began on February 1, 2021, municipal bonds were at the tail end of a bond rally that had begun in November 2020. From mid-February through June 2021, the bond market reversed course. Yields on municipal bonds and U.S. Treasurys rose and prices declined in anticipation of rising economic growth, driven by a federal government infusion of stimulus financing and progress on COVID-19 vaccinations. In late spring-early summer, high year-over-year inflation also raised investor concerns, putting further upward pressure on interest rates.
By July, however, the emergence of a more contagious Delta variant of COVID-19 threatened the U.S. economic rebound and diminished inflation concerns. Investors again turned to U.S. Treasurys and municipal bonds as relatively safe-haven assets, leading bond prices to rise and interest rates to fall in July.
From August through October, bond prices declined again due, in part, to anticipation that the U.S. Federal Reserve (the Fed) would begin tapering monthly bond purchases, which had helped hold interest rates down through much of the pandemic.
In the closing months of 2021, the Fed confirmed that tapering would begin in November and accelerate in the months to come. The reduction of monetary stimulus put upward pressure on shorter term interest rates, as did passage of President Biden’s $1 trillion infrastructure bill. As the Fed issued more hawkish monetary statements, U.S. Treasury rates rose in December against the backdrop of inflationary concerns and potential interest rate hikes. Municipal bond rates, however, were nearly unchanged during the month.
But as the new year began, municipal investors appeared to reevaluate the twin threats of inflation and projected rate hikes. The Bloomberg Municipal Bond Index, a broad measure of the municipal bond market, declined 2.74% in January 2022, its worst monthly performance in several years. In the third week of January, municipal bond mutual funds and exchange-traded funds experienced net weekly outflows for only the second time in 87 weeks.
For the period as a whole, the municipal bond yield curve experienced a “bear market flattening” in which interest rates rose across the curve, but more so at the shorter maturity end of the curve. The Bloomberg Municipal Bond Index returned -1.89% during the period. While municipal bonds outperformed U.S. Treasurys at the short end of the yield curve — that is, maturities of 5 years or less — municipals underperformed U.S. Treasurys in the middle and long end of the curve — maturities of about 10 years and 30 years, respectively.
Fund Performance
For the 12-month period ended January 31, 2022, Parametric TABS 1-to-10 Year Laddered Municipal Bond Fund (the 1-to-10 Year Fund) returned -1.87% for Class A shares at net asset value (NAV), outperforming its benchmark, the Bloomberg Short-Intermediate 1-10 Year Municipal Bond Index, which returned -2.02%.
For the 12-month period ended January 31, 2022, Parametric TABS 10-to-20 Year Laddered Municipal Bond Fund (the 10-to-20 Year Fund) returned -1.69% for Class A shares at NAV, outperforming its benchmark, the Bloomberg 15 Year Municipal Bond Index, which returned -2.07%.
Both indexes are unmanaged, and returns do not reflect any applicable sales charges, commissions, or expenses.
Each of the TABS Laddered Municipal Bond Funds (the Funds) provides rules-based, approximately equal-weighted exposure across its respective maturity portion of the yield curve, with the objective of seeking current income exempt from regular federal income tax. Management seeks to add incremental return through active security selection and in-depth credit analysis.
During the period, the largest contributors to the performance of both Funds versus their respective indexes were active security selection and relative-value trading — a strategy that seeks to take advantage of price and rate differences among similar securities. In particular, both Funds’ overweight positions and security selections in the health care and transportation sectors — which recovered during the period from sharp downturns early in the pandemic — contributed strongly to returns relative to their indexes.
Credit quality contributed to both Funds’ performance versus their respective indexes, as well. Each Fund held overweight positions relative to its index in A rated and BBB rated securities. Those overweight positions benefitted relative performance as credit spreads tightened during the period and lower rated bonds generally outperformed higher rated bonds.
In contrast, yield-curve positioning detracted from the relative performance of both Funds during the period.
See Endnotes and Additional Disclosures in this report.
Past performance is no guarantee of future results. Returns are historical and are calculated by determining the percentage change in net asset value (NAV) or offering price (as applicable) with all distributions reinvested. Investment return and principal value will fluctuate so that shares, when redeemed, may be worth more or less than their original cost. Performance for periods less than or equal to one year is cumulative. Performance is for the stated time period only; due to market volatility, current Fund performance may be lower or higher than the quoted return. For performance as of the most recent month-end, please refer to eatonvance.com.
Parametric
TABS Laddered Municipal Bond Funds
January 31, 2022
Management’s Discussion of Fund Performance1 — continued
Fund-specific Results
For Parametric TABS 1-to-10 Year Laddered Municipal Bond Fund, duration — in addition to active security selection, relative-value trading, and credit quality — contributed to performance versus its index. The 1-to-10 Year Fund had a modestly shorter duration — or sensitivity to interest rate changes — than its index. This aided relative returns because the 1-to-10 Year Fund’s performance was hurt less than its index’s performance by rising interest rates and declining bond prices during the period.
In contrast, yield-curve positioning — which was largely determined by the 1-to-10 Year Fund’s equal-weighted laddered structure — detracted from performance versus its index. The 1-to-10 Year Fund had an overweight position relative to its index in bonds at the longer end of the maturity range in which it invests. During a period when shorter maturity bonds outperformed longer maturity issues, this positioning hurt relative performance.
For Parametric TABS 10-to-20 Year Laddered Municipal Bond Fund, active security selection, relative-value trading, and credit quality contributed to performance versus its index.
In contrast, duration and yield-curve positioning detracted from performance of the 10-to-20 Year Fund relative to its index. As a result of its equal- weighted laddered structure, the 10-to-20 Year Fund had a modestly longer duration than its index. This detracted from relative returns because the 10-to-20 Year Fund’s performance was hurt more than its index’s performance by rising interest rates and declining bond prices during the period.
The 10-to-20 Year Fund’s yield-curve positioning was largely determined by the Fund’s equal-weighted laddered structure. The Fund’s holdings in bonds with maturities shorter than 12 years — an area of the curve where its 15-year index had no exposure — underperformed longer maturity bonds and, thus, yield-curve positioning detracted from relative returns.
See Endnotes and Additional Disclosures in this report.
Past performance is no guarantee of future results. Returns are historical and are calculated by determining the percentage change in net asset value (NAV) or offering price (as applicable) with all distributions reinvested. Investment return and principal value will fluctuate so that shares, when redeemed, may be worth more or less than their original cost. Performance for periods less than or equal to one year is cumulative. Performance is for the stated time period only; due to market volatility, current Fund performance may be lower or higher than the quoted return. For performance as of the most recent month-end, please refer to eatonvance.com.
Parametric
TABS 1-to-10 Year Laddered Municipal Bond Fund
January 31, 2022
Performance2,3
Portfolio Manager(s) James H. Evans, CFA, Brian C. Barney, CFA and Alison Wagner, CFA, each of Parametric Portfolio Associates LLC
| | | | | | | | | | | | | | | | | | | | |
| % Average Annual Total Returns | | Class
Inception Date | | | Performance
Inception Date | | | One Year | | | Five Years | | | Since Inception | |
| | | | | |
Class A at NAV | | | 05/04/2015 | | | | 05/04/2015 | | | | –1.87 | % | | | 2.29 | % | | | 2.15 | % |
Class A with 2.25% Maximum Sales Charge | | | — | | | | — | | | | –4.07 | | | | 1.83 | | | | 1.80 | |
Class C at NAV | | | 05/04/2015 | | | | 05/04/2015 | | | | –2.60 | | | | 1.52 | | | | 1.39 | |
Class C with 1% Maximum Sales Charge | | | — | | | | — | | | | –3.57 | | | | 1.52 | | | | 1.39 | |
Class I at NAV | | | 05/04/2015 | | | | 05/04/2015 | | | | –1.62 | | | | 2.54 | | | | 2.42 | |
|
| |
| | | | | |
Bloomberg Short-Intermediate 1-10 Year Municipal Bond Index | | | — | | | | — | | | | –2.02 | % | | | 2.26 | % | | | 2.01 | % |
| | | | | |
| % Total Annual Operating Expense Ratios4 | | | | | | | | Class A | | | Class C | | | Class I | |
| | | | | |
Gross | | | | | | | | | | | 0.81 | % | | | 1.56 | % | | | 0.56 | % |
Net | | | | | | | | | | | 0.65 | | | | 1.40 | | | | 0.40 | |
| | | | | |
| % Distribution Rates/Yields5 | | | | | | | | Class A | | | Class C | | | Class I | |
| | | | | |
Distribution Rate | | | | | | | | | | | 0.81 | % | | | 0.05 | % | | | 1.07 | % |
SEC 30-day Yield - Subsidized | | | | | | | | | | | 0.25 | | | | –0.49 | | | | 0.51 | |
| | | | | |
SEC 30-day Yield - Unsubsidized | | | | | | | | | | | 0.15 | | | | –0.61 | | | | 0.40 | |
Growth of $10,000
This graph shows the change in value of a hypothetical investment of $10,000 in Class A of the Fund for the period indicated. For comparison, the same investment is shown in the indicated index.
| | | | | | | | | | | | | | | | |
| Growth of Investment | | Amount Invested | | | Period Beginning | | | At NAV | | | With Maximum Sales Charge | |
| | | | |
Class C | | | $10,000 | | | | 05/04/2015 | | | | $10,974 | | | | N.A. | |
Class I | | | $250,000 | | | | 05/04/2015 | | | | $293,781 | | | | N.A. | |
See Endnotes and Additional Disclosures in this report.
Past performance is no guarantee of future results. Returns are historical and are calculated by determining the percentage change in net asset value (NAV) or offering price (as applicable) with all distributions reinvested. Investment return and principal value will fluctuate so that shares, when redeemed, may be worth more or less than their original cost. Performance for periods less than or equal to one year is cumulative. Performance is for the stated time period only; due to market volatility, current Fund performance may be lower or higher than the quoted return. For performance as of the most recent month-end, please refer to eatonvance.com.
Parametric
TABS 1-to-10 Year Laddered Municipal Bond Fund
January 31, 2022
Fund Profile
Credit Quality (% of total investments)6
See Endnotes and Additional Disclosures in this report.
Parametric
TABS 10-to-20 Year Laddered Municipal Bond Fund
January 31, 2022
Performance2,3
Portfolio Manager(s) James H. Evans, CFA, Brian C. Barney, CFA and Devin J. Cooch, CFA, each of Parametric Portfolio Associates LLC
| | | | | | | | | | | | | | | | | | | | |
| % Average Annual Total Returns | | Class
Inception Date | | | Performance
Inception Date | | | One Year | | | Five Years | | | Since Inception | |
| | | | | |
Class A at NAV | | | 05/04/2015 | | | | 05/04/2015 | | | | –1.69 | % | | | 4.73 | % | | | 4.56 | % |
Class A with 4.75% Maximum Sales Charge | | | — | | | | — | | | | –6.33 | | | | 3.72 | | | | 3.80 | |
Class C at NAV | | | 05/04/2015 | | | | 05/04/2015 | | | | –2.43 | | | | 3.93 | | | | 3.77 | |
Class C with 1% Maximum Sales Charge | | | — | | | | — | | | | –3.38 | | | | 3.93 | | | | 3.77 | |
Class I at NAV | | | 05/04/2015 | | | | 05/04/2015 | | | | –1.45 | | | | 4.97 | | | | 4.82 | |
|
| |
| | | | | |
Bloomberg 15 Year Municipal Bond Index | | | — | | | | — | | | | –2.07 | % | | | 4.27 | % | | | 3.88 | % |
| | | | | |
| % Total Annual Operating Expense Ratios4 | | | | | | | | Class A | | | Class C | | | Class I | |
| | | | | |
Gross | | | | | | | | | | | 1.26 | % | | | 2.01 | % | | | 1.01 | % |
Net | | | | | | | | | | | 0.65 | | | | 1.40 | | | | 0.40 | |
| | | | | |
| % Distribution Rates/Yields5 | | | | | | | | Class A | | | Class C | | | Class I | |
| | | | | |
Distribution Rate | | | | | | | | | | | 1.69 | % | | | 0.93 | % | | | 1.95 | % |
SEC 30-day Yield - Subsidized | | | | | | | | | | | 0.91 | | | | 0.20 | | | | 1.21 | |
| | | | | |
SEC 30-day Yield - Unsubsidized | | | | | | | | | | | 0.39 | | | | –0.34 | | | | 0.66 | |
Growth of $10,000
This graph shows the change in value of a hypothetical investment of $10,000 in Class A of the Fund for the period indicated. For comparison, the same investment is shown in the indicated index.
| | | | | | | | | | | | | | | | |
| Growth of Investment | | Amount Invested | | | Period Beginning | | | At NAV | | | With Maximum Sales Charge | |
| | | | |
Class C | | | $10,000 | | | | 05/04/2015 | | | | $12,842 | | | | N.A. | |
Class I | | | $250,000 | | | | 05/04/2015 | | | | $343,580 | | | | N.A. | |
See Endnotes and Additional Disclosures in this report.
Past performance is no guarantee of future results. Returns are historical and are calculated by determining the percentage change in net asset value (NAV) or offering price (as applicable) with all distributions reinvested. Investment return and principal value will fluctuate so that shares, when redeemed, may be worth more or less than their original cost. Performance for periods less than or equal to one year is cumulative. Performance is for the stated time period only; due to market volatility, current Fund performance may be lower or higher than the quoted return. For performance as of the most recent month-end, please refer to eatonvance.com.
Parametric
TABS 10-to-20 Year Laddered Municipal Bond Fund
January 31, 2022
Fund Profile
Credit Quality (% of total investments)6
See Endnotes and Additional Disclosures in this report.
Parametric
TABS Laddered Municipal Bond Funds
January 31, 2022
Endnotes and Additional Disclosures
| 1 | The views expressed in this report are those of the portfolio manager(s) and are current only through the date stated at the top of this page. These views are subject to change at any time based upon market or other conditions, and Eaton Vance and the Fund(s) disclaim any responsibility to update such views. These views may not be relied upon as investment advice and, because investment decisions are based on many factors, may not be relied upon as an indication of trading intent on behalf of any Eaton Vance fund. This commentary may contain statements that are not historical facts, referred to as “forward-looking statements.” The Fund’s actual future results may differ significantly from those stated in any forward-looking statement, depending on factors such as changes in securities or financial markets or general economic conditions, the volume of sales and purchases of Fund shares, the continuation of investment advisory, administrative and service contracts, and other risks discussed from time to time in the Fund’s filings with the Securities and Exchange Commission. |
| 2 | Bloomberg Short-Intermediate 1-10 Year Municipal Bond Index is an unmanaged index of municipal bonds traded in the U.S. with maturities ranging from 1-10 years. Bloomberg 15 Year Municipal Bond Index is an unmanaged index of municipal bonds traded in the U.S. with maturities ranging from 12-17 years. Unless otherwise stated, index returns do not reflect the effect of any applicable sales charges, commissions, expenses, taxes or leverage, as applicable. It is not possible to invest directly in an index. |
| 3 | Total Returns at NAV do not include applicable sales charges. If sales charges were deducted, the returns would be lower. Total Returns shown with maximum sales charges reflect the stated maximum sales charge. Unless otherwise stated, performance does not reflect the deduction of taxes on Fund distributions or redemptions of Fund shares. Performance since inception for an index, if presented, is the performance since the Fund’s or oldest share class’ inception, as applicable. |
| 4 | Source: Fund prospectus. Net expense ratios reflect a contractual expense reimbursement that continues through 5/31/22. The expense ratios for the current reporting period can be found in the Financial Highlights section of this report. Performance reflects expenses waived and/or reimbursed, if applicable. Without such waivers and/or reimbursements, performance would have been lower. |
| 5 | The Distribution Rate is based on the Fund’s last regular distribution per share in the period (annualized) divided by the Fund’s NAV at the end of the period. The Fund’s distributions may be comprised of amounts characterized for federal income tax purposes as tax-exempt income, qualified and non-qualified ordinary dividends, capital gains and nondividend distributions, also known as return of capital. The Fund will determine the federal income tax character of distributions paid to a shareholder after the end of the calendar year. This is reported on the IRS form 1099-DIV and provided to the shareholder shortly after each year-end. The Fund’s distributions are determined by the investment adviser based on its current assessment of the Fund’s long-term return potential. As portfolio and market conditions change, the rate of distributions paid by the Fund could change. The SEC Yield is a standardized measure based on the estimated yield to maturity of a fund’s investments over a 30-day period and is based on the maximum offer price at the date specified. The SEC Yield is not based on the |
| | distributions made by the Fund, which may differ. Subsidized yield reflects the effect of fee waivers and expense reimbursements. |
| 6 | For purposes of the Fund’s rating restrictions, ratings are based on Moody’s Investors Service, Inc. (“Moody’s”), S&P Global Ratings (“S&P”) or Fitch Ratings (“Fitch”), as applicable. If securities are rated differently by the ratings agencies, the highest rating is applied. Ratings, which are subject to change, apply to the creditworthiness of the issuers of the underlying securities and not to the Fund or its shares. Credit ratings measure the quality of a bond based on the issuer’s creditworthiness, with ratings ranging from AAA, being the highest, to D, being the lowest based on S&P’s measures. Ratings of BBB or higher by S&P or Fitch (Baa or higher by Moody’s) are considered to be investment-grade quality. Credit ratings are based largely on the ratings agency’s analysis at the time of rating. The rating assigned to any particular security is not necessarily a reflection of the issuer’s current financial condition and does not necessarily reflect its assessment of the volatility of a security’s market value or of the liquidity of an investment in the security. Holdings designated as “Not Rated” (if any) are not rated by the national ratings agencies stated above. |
Fund profiles subject to change due to active management.
Additional Information
Bloomberg Municipal Bond Index is an unmanaged index of municipal bonds traded in the U.S.
Yield curve is a graphical representation of the yields offered by bonds of various maturities. The yield curve flattens when long-term interest rates fall and/or short-term interest rates increase, and the yield curve steepens when long-term interest rates increase and/or short-term interest rates fall.
Credit spread is the difference in yield between a U.S. Treasury bond and another debt security of the same maturity but different credit quality.
Duration is a measure of the expected change in price of a bond — in percentage terms — given a one percent change in interest rates, all else being constant. Securities with lower durations tend to be less sensitive to interest rate changes.
Parametric
TABS Laddered Municipal Bond Funds
January 31, 2022
Fund Expenses
Example: As a Fund shareholder, you incur two types of costs: (1) transaction costs, including sales charges (loads) on purchases and redemption fees (if applicable); and (2) ongoing costs, including management fees; distribution and/or service fees; and other Fund expenses. This Example is intended to help you understand your ongoing costs (in dollars) of Fund investing and to compare these costs with the ongoing costs of investing in other mutual funds. The Example is based on an investment of $1,000 invested at the beginning of the period and held for the entire period (August 1, 2021 – January 31, 2022).
Actual Expenses: The first section of each table below provides information about actual account values and actual expenses. You may use the information in this section, together with the amount you invested, to estimate the expenses that you paid over the period. Simply divide your account value by $1,000 (for example, an $8,600 account value divided by $1,000 = 8.6), then multiply the result by the number in the first section under the heading entitled “Expenses Paid During Period” to estimate the expenses you paid on your account during this period.
Hypothetical Example for Comparison Purposes: The second section of each table below provides information about hypothetical account values and hypothetical expenses based on the actual Fund expense ratio and an assumed rate of return of 5% per year (before expenses), which is not the actual Fund return. The hypothetical account values and expenses may not be used to estimate the actual ending account balance or expenses you paid for the period. You may use this information to compare the ongoing costs of investing in your Fund and other funds. To do so, compare this 5% hypothetical example with the 5% hypothetical examples that appear in the shareholder reports of the other funds.
Please note that the expenses shown in each table are meant to highlight your ongoing costs only and do not reflect any transactional costs, such as sales charges (loads) or redemption fees (if applicable). Therefore, the second section of each table is useful in comparing ongoing costs only, and will not help you determine the relative total costs of owning different funds. In addition, if these transactional costs were included, your costs would be higher.
Parametric TABS 1-to-10 Year Laddered Municipal Bond Fund
| | | | | | | | | | | | | | | | |
| | | Beginning
Account Value
(8/1/21) | | | Ending
Account Value
(1/31/22) | | | Expenses Paid
During Period*
(8/1/21 – 1/31/22) | | | Annualized
Expense
Ratio | |
| | | | |
Actual | | | | | | | | | | | | | | | | |
Class A | | $ | 1,000.00 | | | $ | 973.00 | | | $ | 3.23 | ** | | | 0.65 | % |
Class C | | $ | 1,000.00 | | | $ | 969.30 | | | $ | 6.95 | ** | | | 1.40 | % |
Class I | | $ | 1,000.00 | | | $ | 974.20 | | | $ | 1.99 | ** | | | 0.40 | % |
| | | | | |
Hypothetical | | | | | | | | | | | | | | | | |
(5% return per year before expenses) | | | | | | | | | | | | | | | | |
Class A | | $ | 1,000.00 | | | $ | 1,021.93 | | | $ | 3.31 | ** | | | 0.65 | % |
Class C | | $ | 1,000.00 | | | $ | 1,018.15 | | | $ | 7.12 | ** | | | 1.40 | % |
Class I | | $ | 1,000.00 | | | $ | 1,023.19 | | | $ | 2.04 | ** | | | 0.40 | % |
| * | Expenses are equal to the Fund’s annualized expense ratio for the indicated Class, multiplied by the average account value over the period, multiplied by 184/365 (to reflect the one-half year period). The Example assumes that the $1,000 was invested at the net asset value per share determined at the close of business on July 31, 2021. |
| ** | Absent an allocation of certain expenses to affiliates, expenses would be higher. |
Parametric
TABS Laddered Municipal Bond Funds
January 31, 2022
Fund Expenses — continued
Parametric TABS 10-to-20 Year Laddered Municipal Bond Fund
| | | | | | | | | | | | | | | | |
| | | Beginning
Account Value
(8/1/21) | | | Ending
Account Value
(1/31/22) | | | Expenses Paid
During Period*
(8/1/21 – 1/31/22) | | | Annualized
Expense
Ratio | |
| | | | |
Actual | | | | | | | | | | | | | | | | |
Class A | | $ | 1,000.00 | | | $ | 963.40 | | | $ | 3.22 | ** | | | 0.65 | % |
Class C | | $ | 1,000.00 | | | $ | 958.90 | | | $ | 6.91 | ** | | | 1.40 | % |
Class I | | $ | 1,000.00 | | | $ | 964.60 | | | $ | 1.98 | ** | | | 0.40 | % |
| | | | | |
Hypothetical | | | | | | | | | | | | | | | | |
(5% return per year before expenses) | | | | | | | | | | | | | | | | |
Class A | | $ | 1,000.00 | | | $ | 1,021.93 | | | $ | 3.31 | ** | | | 0.65 | % |
Class C | | $ | 1,000.00 | | | $ | 1,018.15 | | | $ | 7.12 | ** | | | 1.40 | % |
Class I | | $ | 1,000.00 | | | $ | 1,023.19 | | | $ | 2.04 | ** | | | 0.40 | % |
| * | Expenses are equal to the Fund’s annualized expense ratio for the indicated Class, multiplied by the average account value over the period, multiplied by 184/365 (to reflect the one-half year period). The Example assumes that the $1,000 was invested at the net asset value per share determined at the close of business on July 31, 2021. |
| ** | Absent an allocation of certain expenses to affiliates, expenses would be higher. |
Parametric
TABS 1-to-10 Year Laddered Municipal Bond Fund
January 31, 2022
Portfolio of Investments
| | | | | | | | |
| Tax-Exempt Municipal Obligations — 97.7% | |
| Security | | Principal
Amount
(000’s omitted) | | | Value | |
|
| Bond Bank — 0.2% | |
| | |
Vermont Municipal Bond Bank, 5.00%, 12/1/28 | | $ | 200 | | | $ | 227,726 | |
| | |
| | | | | | | $ | 227,726 | |
|
| Education — 7.1% | |
| | |
Allegheny County Higher Education Building Authority, PA, (Carnegie Mellon University), 0.325%, (70% of SOFR + 0.29%), 8/1/27 (Put Date), 2/1/33(1) | | $ | 1,000 | | | $ | 995,110 | |
| | |
Bethlehem Area School District Authority, PA, 0.384%, (67% of SOFR + 0.35%), 11/1/25 (Put Date), 1/1/32(1) | | | 2,300 | | | | 2,288,937 | |
| | |
Los Ranchos de Albuquerque, NM,
(Albuquerque Academy): | | | | | | |
| | |
5.00%, 9/1/26 | | | 150 | | | | 171,002 | |
| | |
5.00%, 9/1/27 | | | 100 | | | | 116,395 | |
| | |
Miami University, OH, 5.00%, 9/1/30(2) | | | 500 | | | | 616,600 | |
| | |
Oklahoma Agricultural and Mechanical Colleges, (Oklahoma State University), 4.00%, 9/1/32 | | | 465 | | | | 554,703 | |
| | |
Southcentral Pennsylvania General Authority, (York College of Pennsylvania), 5.00%, 11/1/24 | | | 250 | | | | 273,000 | |
| | |
UCF Stadium Corp., FL, 5.00%, 3/1/23 | | | 250 | | | | 259,772 | |
| | |
University of Florida, 4.00%, 7/1/31 | | | 1,000 | | | | 1,189,380 | |
| | |
Vermont State Colleges, 5.00%, 7/1/24 | | | 100 | | | | 104,810 | |
| | |
West Clark 2000 School Building Corp., IN, 5.00%, 1/15/23 | | | 100 | | | | 104,062 | |
| | |
| | | | | | | $ | 6,673,771 | |
|
| Electric Utilities — 1.0% | |
| | |
Redding Joint Powers Financing Authority, CA, Electric System Revenue, 4.00%, 6/1/23 | | $ | 175 | | | $ | 182,578 | |
| | |
Seattle, WA, Municipal Light and Power Revenue, 0.31%, (SIFMA + 0.25%), 11/1/26 (Put Date), 5/1/45(1) | | | 500 | | | | 504,340 | |
| | |
Springfield, IL, Electric System Revenue, 5.00%, 3/1/25 | | | 250 | | | | 276,702 | |
| | |
| | | | | | | $ | 963,620 | |
|
| Escrowed / Prerefunded — 1.4% | |
| | |
Michigan Finance Authority, (Trinity Health Credit Group), Prerefunded to 6/1/22, 5.00%, 12/1/27 | | $ | 500 | | | $ | 507,630 | |
| | |
North Carolina Medical Care Commission, (United Methodist Retirement Homes), Escrowed to Maturity, 5.00%, 10/1/22 | | | 150 | | | | 154,415 | |
| | |
Revere Local School District, OH, Prerefunded to 6/1/22, 5.00%, 12/1/27 | | | 200 | | | | 203,052 | |
| | |
Scotts Bluff County School District 0016, NE,
(Gering Public Schools): | | | | | | |
| | |
Prerefunded to 5/30/22, 5.00%, 12/1/25 | | | 120 | | | | 121,808 | |
| | | | | | | | |
| Security | | Principal
Amount
(000’s omitted) | | | Value | |
|
| Escrowed / Prerefunded (continued) | |
| | |
Scotts Bluff County School District 0016, NE,
(Gering Public Schools): (continued) | | | | | | |
| | |
Prerefunded to 5/30/22, 5.00%, 12/1/26 | | $ | 115 | | | $ | 116,733 | |
| | |
Prerefunded to 5/30/22, 5.00%, 12/1/27 | | | 170 | | | | 172,562 | |
| | |
| | | | | | | $ | 1,276,200 | |
|
| General Obligations — 14.4% | |
| | |
Beaumont, TX, Certificates of Obligation, 4.00%, 3/1/32 | | $ | 500 | | | $ | 577,675 | |
| | |
Boulder Valley School District No. Re-2, CO, 4.00%, 12/1/23 | | | 125 | | | | 132,053 | |
| | |
| Campton Township, IL: | | | | | | |
| | |
5.00%, 12/15/22 | | | 200 | | | | 207,504 | |
| | |
5.00%, 12/15/23 | | | 105 | | | | 112,215 | |
| | |
Carrollton-Farmers Branch Independent School District, TX, (PSF Guaranteed), 4.00%, 2/15/32 | | | 750 | | | | 879,967 | |
| | |
Decatur City Board of Education, AL, 5.00%, 2/1/25 | | | 50 | | | | 55,572 | |
| | |
| El Monte Union High School District, CA, (Election of 2018): | | | | | | |
| | |
4.00%, 6/1/31 | | | 100 | | | | 111,802 | |
| | |
4.00%, 6/1/32 | | | 150 | | | | 167,458 | |
| | |
Grand Blanc Community Schools, MI, Prerefunded to 5/1/22, 4.00%, 5/1/27 | | | 455 | | | | 458,990 | |
| | |
| Illinois: | | | | | | |
| | |
5.00%, 9/1/27 | | | 2,500 | | | | 2,888,175 | |
| | |
5.50%, 5/1/30 | | | 1,500 | | | | 1,857,105 | |
| | |
| Lakeland, FL: | | | | | | |
| | |
5.00%, 10/1/22 | | | 100 | | | | 102,997 | |
| | |
5.00%, 10/1/24 | | | 50 | | | | 55,014 | |
| | |
McLean County Public Building Commission, IL, 5.00%, 12/1/22 | | | 250 | | | | 258,767 | |
| | |
New Jersey, 4.00%, 6/1/31 | | | 500 | | | | 580,545 | |
| | |
New York, NY, (LOC: TD Bank, N.A.), 0.05%, 9/1/27(3) | | | 500 | | | | 500,000 | |
| | |
| Ohio, (Adult Correctional Building Fund): | | | | | | |
| | |
5.00%, 10/1/29 | | | 500 | | | | 621,500 | |
| | |
5.00%, 10/1/30 | | | 750 | | | | 950,085 | |
| | |
Richland County School District No. 2, SC, 4.00%, 3/1/32 | | | 500 | | | | 585,430 | |
| | |
Rio Grande City Grulla Independent School District, TX, (PSF Guaranteed), 4.00%, 8/15/32 | | | 500 | | | | 598,480 | |
| | |
West Virginia, 5.00%, 12/1/30 | | | 820 | | | | 1,016,054 | |
| | |
Wickliffe School District, OH, 5.00%, 12/1/27 | | | 665 | | | | 785,724 | |
| | |
| | | | | | | $ | 13,503,112 | |
|
| Hospital — 15.6% | |
| | |
Allegheny County Hospital Development Authority, PA, (Allegheny Health Network Obligated Group), 5.00%, 4/1/31 | | $ | 1,000 | | | $ | 1,186,890 | |
| | | | |
| | 11 | | See Notes to Financial Statements. |
Parametric
TABS 1-to-10 Year Laddered Municipal Bond Fund
January 31, 2022
Portfolio of Investments — continued
| | | | | | | | |
| Security | | Principal
Amount
(000’s omitted) | | | Value | |
|
| Hospital (continued) | |
| | |
Arizona Health Facilities Authority, (Banner Health), 0.31%, (SIFMA + 0.25%), 11/4/26 (Put Date), 1/1/46(1) | | $ | 2,000 | | | $ | 2,000,720 | |
| | |
Arizona Health Facilities Authority, (Phoenix Children’s Hospital), 1.91%, (SIFMA + 1.85%), 2/1/23 (Put Date), 2/1/48(1) | | | 500 | | | | 503,410 | |
| | |
Colorado Health Facilities Authority, (Vail Valley
Medical Center): | | | | | | |
| | |
4.00%, 1/15/25 | | | 25 | | | | 26,912 | |
| | |
5.00%, 1/15/23 | | | 25 | | | | 26,020 | |
| | |
Duluth Economic Development Authority, MN, (St. Luke’s
Hospital of Duluth Obligated Group): | | | | | | |
| | |
4.00%, 6/15/32 | | | 175 | | | | 199,826 | |
| | |
5.00%, 6/15/24(2) | | | 250 | | | | 268,420 | |
| | |
5.00%, 6/15/25(2) | | | 275 | | | | 302,585 | |
| | |
5.00%, 6/15/26(2) | | | 360 | | | | 404,111 | |
| | |
5.00%, 6/15/27(2) | | | 310 | | | | 354,578 | |
| | |
5.00%, 6/15/32(2) | | | 475 | | | | 582,326 | |
| | |
Greeneville Health and Educational Facilities Board, TN, (Ballad Health), 5.00%, 7/1/28 | | | 1,000 | | | | 1,201,200 | |
| | |
Kentucky Economic Development Finance Authority, (Catholic Health Initiatives), 1.46%, (SIFMA + 1.40%), 2/1/25 (Put Date), 2/1/46(1) | | | 2,000 | | | | 2,014,520 | |
| | |
Maricopa County Industrial Development Authority, AZ, (Banner Health), 0.63%, (SIFMA + 0.57%), 10/18/24 (Put Date), 1/1/35(1) | | | 915 | | | | 919,447 | |
| | |
| New York City Health and Hospitals Corp., NY: | | | | | | |
| | |
3.00%, 2/15/24 | | | 535 | | | | 555,924 | |
| | |
5.00%, 2/15/24 | | | 740 | | | | 798,675 | |
| | |
Northampton County General Purpose Authority, PA,
(St. Luke’s University Health Network): | | | | | | |
| | |
5.00%, 8/15/25 | | | 30 | | | | 33,836 | |
| | |
5.00%, 8/15/26 | | | 85 | | | | 98,410 | |
| | |
Pima County Industrial Development Authority, AZ,
(Tucson Medical Center): | | | | | | |
| | |
5.00%, 4/1/31 | | | 225 | | | | 284,609 | |
| | |
5.00%, 4/1/32 | | | 1,000 | | | | 1,260,910 | |
| | |
Public Finance Authority, WI, (Renown Regional Medical
Center): | | | | | | |
| | |
5.00%, 6/1/25 | | | 375 | | | | 420,233 | |
| | |
5.00%, 6/1/26 | | | 300 | | | | 345,465 | |
| | |
Royal Oak Hospital Finance Authority, MI, (William Beaumont Hospital), 5.00%, 9/1/23 | | | 35 | | | | 37,256 | |
| | |
San Diego County, CA, (Sanford Burnham Prebys Medical Discovery Institute), 5.00%, 11/1/25 | | | 35 | | | | 39,719 | |
| | |
Southcentral Pennsylvania General Authority, (Hanover Hospital, Inc.), 5.00%, 12/1/22 | | | 200 | | | | 207,132 | |
| | | | | | | | |
| Security | | Principal
Amount
(000’s omitted) | | | Value | |
|
| Hospital (continued) | |
| | |
Wisconsin Health and Educational Facilities Authority, (Advocate Aurora Health Credit Group), 5.00% to 7/29/26 (Put Date), 8/15/54 | | $ | 500 | | | $ | 575,865 | |
| | |
| | | | | | | $ | 14,648,999 | |
|
| Housing — 4.7% | |
| | |
| Iowa Finance Authority, SFMR, (FHLMC), (FNMA), (GNMA): | | | | | | |
| | |
0.85%, 1/1/28 | | $ | 100 | | | $ | 95,114 | |
| | |
0.95%, 7/1/28 | | | 285 | | | | 270,924 | |
| | |
1.05%, 1/1/29 | | | 250 | | | | 236,878 | |
| | |
1.15%, 7/1/29 | | | 250 | | | | 236,278 | |
| | |
1.30%, 1/1/30 | | | 200 | | | | 188,628 | |
| | |
(SPA: TD Bank, N.A.), 0.06%, 7/1/49(3) | | | 1,500 | | | | 1,500,000 | |
| | |
Massachusetts Housing Finance Agency, 1.45% to 12/1/22 (Put Date), 12/1/49 | | | 700 | | | | 701,344 | |
| | |
| New York Mortgage Agency: | | | | | | |
| | |
2.05%, 4/1/28 | | | 230 | | | | 230,722 | |
| | |
2.10%, 10/1/28 | | | 250 | | | | 250,922 | |
| | |
2.25%, 4/1/30 | | | 325 | | | | 325,023 | |
| | |
2.30%, 10/1/30 | | | 395 | | | | 395,521 | |
| | |
| | | | | | | $ | 4,431,354 | |
|
| Insured – Education — 0.6% | |
| | |
Northern Arizona University, (BAM), 5.00%, 6/1/30 | | $ | 450 | | | $ | 563,355 | |
| | |
| | | | | | | $ | 563,355 | |
|
| Insured – Escrowed / Prerefunded — 0.3% | |
| | |
Albertville, AL, (BAM), Prerefunded to 6/1/22, 4.00%, 6/1/28 | | $ | 250 | | | $ | 252,990 | |
| | |
| | | | | | | $ | 252,990 | |
|
| Insured – General Obligations — 0.8% | |
| | |
Fort Bend County Municipal Utility District No. 58, TX, (BAM), 3.00%, 4/1/27 | | $ | 405 | | | $ | 427,834 | |
| | |
Montgomery County Municipal Utility District No. 9, TX, (BAM), 3.00%, 4/1/27 | | | 100 | | | | 102,190 | |
| | |
| New Britain, CT: | | | | | | |
| | |
(BAM), 5.00%, 3/1/25 | | | 50 | | | | 55,468 | |
| | |
(BAM), Escrowed to Maturity, 5.00%, 3/1/23 | | | 105 | | | | 109,824 | |
| | |
(BAM), Escrowed to Maturity, 5.00%, 3/1/25 | | | 5 | | | | 5,573 | |
| | |
| | | | | | | $ | 700,889 | |
| | | | |
| | 12 | | See Notes to Financial Statements. |
Parametric
TABS 1-to-10 Year Laddered Municipal Bond Fund
January 31, 2022
Portfolio of Investments — continued
| | | | | | | | |
| Security | | Principal
Amount
(000’s omitted) | | | Value | |
|
| Insured – Lease Revenue / Certificates of Participation — 0.2% | |
| | |
Highlands County School Board, FL, (BAM), 5.00%, 3/1/26 | | $ | 180 | | | $ | 199,744 | |
| | |
| | | | | | | $ | 199,744 | |
|
| Insured – Special Tax Revenue — 1.5% | |
| | |
Successor Agency to Riverside County Redevelopment Agency, CA, (AGM), 5.00%, 10/1/24 | | $ | 10 | | | $ | 10,994 | |
| | |
| Vineyard Redevelopment Agency, UT: | | | | | | |
| | |
(AGM), 4.00%, 5/1/32 | | | 420 | | | | 484,583 | |
| | |
(AGM), 5.00%, 5/1/27 | | | 315 | | | | 368,900 | |
| | |
(AGM), 5.00%, 5/1/28 | | | 235 | | | | 280,729 | |
| | |
(AGM), 5.00%, 5/1/29 | | | 200 | | | | 243,036 | |
| | |
| | | | | | | $ | 1,388,242 | |
|
| Insured – Transportation — 3.2% | |
| | |
| New Orleans Aviation Board, LA: | | | | | | |
| | |
(AGM), 5.00%, 1/1/28 | | $ | 1,000 | | | $ | 1,192,200 | |
| | |
(AGM), 5.00%, 1/1/29 | | | 1,510 | | | | 1,797,383 | |
| | |
| | | | | | | $ | 2,989,583 | |
|
| Insured – Water and Sewer — 1.7% | |
| | |
Beaumont, TX, Waterworks and Sewer System Revenue, (BAM), 3.00%, 9/1/22 | | $ | 25 | | | $ | 25,350 | |
| | |
| Hamburg Municipal Authority, PA, Sewer Revenue: | | | | | | |
| | |
(AGM), 1.50%, 10/1/28 | | | 100 | | | | 98,805 | |
| | |
(AGM), 1.50%, 10/1/29 | | | 115 | | | | 110,251 | |
| | |
(AGM), 2.00%, 10/1/30 | | | 125 | | | | 125,897 | |
| | |
Pittsburgh Water and Sewer Authority, PA, (AGM), 0.71%, (SIFMA + 0.65%), 12/1/23 (Put Date), 9/1/40(1) | | | 1,000 | | | | 1,006,510 | |
| | |
Western Riverside Water and Wastewater Financing Authority, CA, (AGM), 4.00%, 9/1/29 | | | 180 | | | | 208,492 | |
| | |
| | | | | | | $ | 1,575,305 | |
|
| Lease Revenue / Certificates of Participation — 7.4% | |
| | |
| Aspen Fire Protection District, CO: | | | | | | |
| | |
4.00%, 12/1/23 | | $ | 120 | | | $ | 126,209 | |
| | |
4.00%, 12/1/25 | | | 255 | | | | 278,746 | |
| | |
4.00%, 12/1/26 | | | 225 | | | | 250,326 | |
| | |
Forsyth County, NC, Limited Obligation Bonds, 5.00%, 4/1/27 | | | 1,000 | | | | 1,182,010 | |
| | |
Georgia Municipal Association, Inc., Certificates of Participation, (Atlanta Public Safety), 5.00%, 12/1/23 | | | 225 | | | | 241,601 | |
| | |
Greater Texas Cultural Education Facilities Finance Corp., (Epicenter Multipurpose Facilities), 5.00%, 3/1/29 | | | 150 | | | | 182,043 | |
| | |
Indiana Finance Authority, (Stadium Project), (SPA: U.S. Bank, N.A.), 0.11%, 2/1/35(4) | | | 1,960 | | | | 1,960,000 | |
| | | | | | | | |
| Security | | Principal
Amount
(000’s omitted) | | | Value | |
|
| Lease Revenue / Certificates of Participation (continued) | |
| | |
| Lake Houston Redevelopment Authority, TX: | | | | | | |
| | |
5.00%, 9/1/27 | | $ | 175 | | | $ | 202,687 | |
| | |
5.00%, 9/1/28 | | | 225 | | | | 264,559 | |
| | |
5.00%, 9/1/29 | | | 225 | | | | 267,896 | |
| | |
5.00%, 9/1/30 | | | 235 | | | | 282,862 | |
| | |
Miami-Dade County School Board, FL, 5.00%, 2/1/24 | | | 300 | | | | 322,749 | |
| | |
Palm Beach County School Board, FL, 5.00%, 8/1/31 | | | 1,000 | | | | 1,120,080 | |
| | |
St. Charles County Public Water Supply District No. 2, MO, 3.00%, 12/1/25 | | | 250 | | | | 253,330 | |
| | |
| | | | | | | $ | 6,935,098 | |
|
| Other Revenue — 7.2% | |
| | |
California Infrastructure and Economic Development Bank, (California Academy of Sciences), 0.41%, (SIFMA + 0.35%), 8/1/24 (Put Date), 8/1/47(1) | | $ | 500 | | | $ | 500,565 | |
| | |
| Fort Myers, FL, Capital Improvement Revenue: | | | | | | |
| | |
5.00%, 12/1/27 | | | 330 | | | | 376,147 | |
| | |
5.00%, 12/1/28 | | | 545 | | | | 619,899 | |
| | |
5.00%, 12/1/29 | | | 600 | | | | 681,732 | |
| | |
Kentucky Public Energy Authority, Gas Supply Revenue, 4.00% to 2/1/28 (Put Date), 2/1/50 | | | 1,500 | | | | 1,672,260 | |
| | |
Main Street Natural Gas, Inc., GA, Gas Supply Revenue, (Liq: Royal Bank of Canada), 0.63%, (SIFMA + 0.57%), 12/1/23 (Put Date), 8/1/48(1) | | | 2,000 | | | | 2,004,340 | |
| | |
New York City Cultural Resources Trust, NY, (Carnegie Hall), 5.00%, 12/1/26 | | | 275 | | | | 319,253 | |
| | |
Tennessee Energy Acquisition Corp., Gas Project Revenue, 5.00%, 11/1/22 | | | 300 | | | | 309,036 | |
| | |
| West Virginia School Building Authority, Lottery Revenue: | | | | | | |
| | |
5.00%, 7/1/24 | | | 100 | | | | 109,223 | |
| | |
5.00%, 7/1/25 | | | 100 | | | | 112,506 | |
| | |
| | | | | | | $ | 6,704,961 | |
|
| Senior Living / Life Care — 5.4% | |
| | |
Baltimore County, MD, (Riderwood Village, Inc.), 4.00%, 1/1/31 | | $ | 1,225 | | | $ | 1,396,537 | |
| | |
Buffalo and Erie County Industrial Land Development
Corp., NY, (Orchard Park CCRC, Inc.): | | | | | | |
| | |
5.00%, 11/15/24 | | | 60 | | | | 66,140 | |
| | |
5.00%, 11/15/25 | | | 60 | | | | 68,032 | |
| | |
5.00%, 11/15/29 | | | 830 | | | | 924,827 | |
| | |
California Statewide Communities Development Authority, (American Baptist Homes of the West), 5.00%, 10/1/23 | | | 100 | | | | 106,220 | |
| | |
Orange County, FL, Health Facilities Authority, (Presbyterian Retirement Communities), 4.00%, 8/1/24 | | | 50 | | | | 53,350 | |
| | | | |
| | 13 | | See Notes to Financial Statements. |
Parametric
TABS 1-to-10 Year Laddered Municipal Bond Fund
January 31, 2022
Portfolio of Investments — continued
| | | | | | | | |
| Security | | Principal
Amount
(000’s omitted) | | | Value | |
|
| Senior Living / Life Care (continued) | |
| | |
Virginia Small Business Financing Authority, (LifeSpire
of Virginia): | | | | | | |
| | |
3.00%, 12/1/24 | | $ | 220 | | | $ | 230,483 | |
| | |
3.00%, 12/1/25 | | | 210 | | | | 222,566 | |
| | |
3.00%, 12/1/26 | | | 225 | | | | 240,448 | |
| | |
4.00%, 12/1/31 | | | 500 | | | | 557,215 | |
| | |
West Cornwall Township Municipal Authority, PA, (Lebanon
Valley Brethren Home): | | | | | | |
| | |
4.00%, 11/15/22 | | | 70 | | | | 71,539 | |
| | |
4.00%, 11/15/23 | | | 75 | | | | 78,658 | |
| | |
4.00%, 11/15/24 | | | 115 | | | | 123,271 | |
| | |
4.00%, 11/15/25 | | | 125 | | | | 136,603 | |
| | |
4.00%, 11/15/26 | | | 120 | | | | 133,040 | |
| | |
4.00%, 11/15/27 | | | 120 | | | | 134,723 | |
| | |
4.00%, 11/15/28 | | | 105 | | | | 119,117 | |
| | |
4.00%, 11/15/29 | | | 140 | | | | 160,418 | |
| | |
4.00%, 11/15/30 | | | 190 | | | | 218,055 | |
| | |
| | | | | | | $ | 5,041,242 | |
|
| Special Tax Revenue — 0.9% | |
| | |
Allentown Neighborhood Improvement Zone Development
Authority, PA: | | | | | | |
| | |
5.00%, 5/1/24(2) | | $ | 150 | | | $ | 161,322 | |
| | |
5.00%, 5/1/25(2) | | | 500 | | | | 551,410 | |
| | |
New York Urban Development Corp., Personal Income Tax Revenue, 5.00%, 3/15/26 | | | 100 | | | | 104,663 | |
| | |
| | | | | | | $ | 817,395 | |
|
| Transportation — 17.0% | |
| | |
Bay Area Toll Authority, CA, Toll Bridge Revenue, (San
Francisco Bay Area): | | | | | | |
| | |
0.36%, (SIFMA + 0.30%), 4/1/27 (Put Date), 4/1/56(1) | | $ | 2,000 | | | $ | 2,001,040 | |
| | |
0.51%, (SIFMA + 0.45%), 4/1/26 (Put Date), 4/1/56(1) | | | 1,000 | | | | 1,007,430 | |
| | |
0.96%, (SIFMA + 0.90%), 5/1/23 (Put Date), 4/1/47(1) | | | 500 | | | | 502,160 | |
| | |
| Central Texas Regional Mobility Authority: | | | | | | |
| | |
5.00%, 1/1/25 | | | 500 | | | | 541,775 | |
| | |
5.00%, 1/1/27 | | | 500 | | | | 564,295 | |
| | |
El Paso, TX, (El Paso International Airport), 5.00%, 8/15/25 | | | 660 | | | | 742,685 | |
| | |
| Hawaii, Highway Revenue: | | | | | | |
| | |
5.00%, 1/1/28 | | | 500 | | | | 601,105 | |
| | |
5.00%, 1/1/30 | | | 250 | | | | 306,650 | |
| | |
Idaho Housing and Finance Association, Federal Highway Trust Fund, 5.00%, 7/15/25 | | | 250 | | | | 281,305 | |
| | |
Maine Turnpike Authority, 5.00%, 7/1/31(2) | | | 1,400 | | | | 1,768,354 | |
| | | | | | | | |
| Security | | Principal
Amount
(000’s omitted) | | | Value | |
|
| Transportation (continued) | |
| | |
| Metropolitan Transportation Authority, NY: | | | | | | |
| | |
5.00%, 11/15/28 | | $ | 750 | | | $ | 840,315 | |
| | |
Green Bonds, 5.00%, 11/15/25 | | | 2,030 | | | | 2,289,698 | |
| | |
Green Bonds, 5.00%, 11/15/26 | | | 1,000 | | | | 1,151,200 | |
| | |
New York Transportation Development Corp., (Terminal 4 John F. Kennedy International Airport), 5.00%, 12/1/26 | | | 1,000 | | | | 1,141,870 | |
| | |
North Carolina Turnpike Authority, (Triangle Expressway System), 5.00%, 2/1/24 | | | 1,000 | | | | 1,073,770 | |
| | |
North Carolina, (Federal-Aid Highway Projects), 5.00%, 3/1/22 | | | 100 | | | | 100,384 | |
| | |
Triborough Bridge and Tunnel Authority, NY, 0.414%, (67% of SOFR + 0.38%), 2/1/24 (Put Date), 1/1/32(1) | | | 1,000 | | | | 1,000,320 | |
| | |
| | | | | | | $ | 15,914,356 | |
|
| Water and Sewer — 7.1% | |
| | |
Arizona Water Infrastructure Finance Authority, 5.00%, 10/1/25 | | $ | 55 | | | $ | 60,653 | |
| | |
Brushy Creek Regional Utility Authority, Inc., TX, 5.00%, 8/1/24 | | | 500 | | | | 545,880 | |
| | |
DeKalb County, GA, Water and Sewerage Revenue, 5.00%, 10/1/24 | | | 335 | | | | 369,338 | |
| | |
Glendale, AZ, Water and Sewer Revenue, 5.00%, 7/1/28 | | | 500 | | | | 560,210 | |
| | |
King County, WA, Sewer Revenue, 0.29%, (SIFMA + 0.23%), 1/1/27 (Put Date), 1/1/40(1) | | | 2,000 | | | | 2,000,760 | |
| | |
North Penn Water Authority, PA, 0.52%, (SIFMA + 0.46%), 11/1/23(1) | | | 400 | | | | 400,724 | |
| | |
| South Central Connecticut Regional Water Authority: | | | | | | |
| | |
4.00%, 8/1/23(2) | | | 1,000 | | | | 1,035,260 | |
| | |
5.00%, 8/1/26(2) | | | 1,220 | | | | 1,384,956 | |
| | |
Western Riverside Water and Wastewater Financing Authority, CA, 4.00%, 9/1/25 | | | 300 | | | | 327,213 | |
| | |
| | | | | | | $ | 6,684,994 | |
| |
Total Tax-Exempt Municipal Obligations — 97.7%
(identified cost $90,285,760) | | | $ | 91,492,936 | |
|
| Short-Term Investments — 10.3% | |
| Description | | Units | | | Value | |
| | |
Eaton Vance Cash Reserves Fund, LLC, 0.08%(5) | | | 9,634,827 | | | $ | 9,633,863 | |
| |
Total Short-Term Investments
(identified cost $9,633,864) | | | $ | 9,633,863 | |
| |
Total Investments — 108.0%
(identified cost $99,919,624) | | | $ | 101,126,799 | |
| |
Other Assets, Less Liabilities — (8.0)% | | | $ | (7,462,702 | ) |
| |
Net Assets — 100.0% | | | $ | 93,664,097 | |
| | | | |
| | 14 | | See Notes to Financial Statements. |
Parametric
TABS 1-to-10 Year Laddered Municipal Bond Fund
January 31, 2022
Portfolio of Investments — continued
The percentage shown for each investment category in the Portfolio of Investments is based on net assets.
At January 31, 2022, the concentration of the Fund’s investments in the various states, determined as a percentage of net assets, is as follows:
| | | | |
| |
| New York | | | 11.7% | |
| |
| Others, representing less than 10% individually | | | 86.0% | |
The Fund invests primarily in debt securities issued by municipalities. The ability of the issuers of the debt securities to meet their obligations may be affected by economic developments in a specific industry or municipality. At January 31, 2022, 7.6% of total investments are backed by bond insurance of various financial institutions and financial guaranty assurance agencies. The aggregate percentage insured by an individual financial institution or financial guaranty assurance agency ranged from 1.7% to 5.9% of total investments.
| (1) | Floating rate security. The stated interest rate represents the rate in effect at January 31, 2022. |
| (2) | When-issued security. |
| (3) | Variable rate demand obligation that may be tendered at par on any day for payment the lesser of 5 business days or 7 calendar days. The stated interest rate, which generally resets weekly, is determined by the remarketing agent and represents the rate in effect at January 31, 2022. |
| (4) | Variable rate demand obligation that may be tendered at par on any day for payment the same or next business day. The stated interest rate, which generally resets daily, is determined by the remarketing agent and represents the rate in effect at January 31, 2022. |
| (5) | Affiliated investment company, available to Eaton Vance portfolios and funds, which invests in high quality, U.S. dollar denominated money market instruments. The rate shown is the annualized seven-day yield as of January 31, 2022. |
Abbreviations:
| | | | |
| | |
| AGM | | – | | Assured Guaranty Municipal Corp. |
| | |
| BAM | | – | | Build America Mutual Assurance Co. |
| | |
| FHLMC | | – | | Federal Home Loan Mortgage Corp. |
| | |
| FNMA | | – | | Federal National Mortgage Association |
| | |
| GNMA | | – | | Government National Mortgage Association |
| | |
| Liq | | – | | Liquidity Provider |
| | |
| LOC | | – | | Letter of Credit |
| | |
| PSF | | – | | Permanent School Fund |
| | |
| SFMR | | – | | Single Family Mortgage Revenue |
| | |
| SIFMA | | – | | Securities Industry and Financial Markets Association Municipal Swap Index |
| | |
| SOFR | | – | | Secured Overnight Financing Rate |
| | |
| SPA | | – | | Standby Bond Purchase Agreement |
| | | | |
| | 15 | | See Notes to Financial Statements. |
Parametric
TABS 10-to-20 Year Laddered Municipal Bond Fund
January 31, 2022
Portfolio of Investments
| | | | | | | | |
| Tax-Exempt Municipal Obligations — 96.7% | |
| Security | | Principal
Amount
(000’s omitted) | | | Value | |
|
| Bond Bank — 2.5% | |
| | |
Vermont Bond Bank, (Vermont State Colleges System), 3.00%, 10/1/36 | | $ | 460 | | | $ | 496,105 | |
| | |
| | | | | | | $ | 496,105 | |
|
| Education — 7.4% | |
| | |
Arizona State University, 4.00%, 7/1/40 | | $ | 500 | | | $ | 573,785 | |
| | |
Los Ranchos de Albuquerque, NM, (Albuquerque Academy), 4.00%, 9/1/40 | | | 250 | | | | 278,405 | |
| | |
University of Florida, 4.00%, 7/1/31 | | | 215 | | | | 255,717 | |
| | |
| University of Michigan: | | | | | | |
| | |
4.00%, 4/1/38 | | | 60 | | | | 69,310 | |
| | |
4.00%, 4/1/40 | | | 250 | | | | 287,502 | |
| | |
| | | | | | | $ | 1,464,719 | |
|
| Electric Utilities — 0.3% | |
| | |
Missouri Joint Municipal Electric Utility Commission, (Prairie State Energy Campus), 4.00%, 12/1/35 | | $ | 50 | | | $ | 54,318 | |
| | |
| | | | | | | $ | 54,318 | |
|
| Escrowed / Prerefunded — 0.3% | |
| | |
Tucson, AZ, Water System Revenue, Prerefunded to 7/1/25, 5.00%, 7/1/32 | | $ | 60 | | | $ | 67,740 | |
| | |
| | | | | | | $ | 67,740 | |
|
| General Obligations — 17.3% | |
| | |
California, 4.00%, 9/1/32 | | $ | 225 | | | $ | 247,277 | |
| | |
Colonial School District, PA, 5.00%, 2/15/36 | | | 100 | | | | 112,712 | |
| | |
Connecticut, 4.00%, 6/1/33 | | | 350 | | | | 407,736 | |
| | |
Illinois, 5.50%, 5/1/39 | | | 700 | | | | 852,887 | |
| | |
La Canada Unified School District, CA, (Election of 2017), 4.00%, 8/1/40 | | | 140 | | | | 160,944 | |
| | |
| Lakeland, FL: | | | | | | |
| | |
5.00%, 10/1/29 | | | 100 | | | | 111,461 | |
| | |
5.00%, 10/1/31 | | | 100 | | | | 111,428 | |
| | |
Lewis and Thurston Counties Centralia School District No. 401, WA, 5.00%, 12/1/37 | | | 145 | | | | 168,996 | |
| | |
Los Angeles Community College District, CA, (Election of 2008), 4.00%, 8/1/33 | | | 125 | | | | 139,378 | |
| | |
Mississippi Development Bank, (Rankin County School District), 4.00%, 6/1/38 | | | 160 | | | | 178,885 | |
| | |
Monterey Peninsula Community College District, CA, 4.00%, 8/1/33 | | | 100 | | | | 109,353 | |
| | | | | | | | |
| Security | | Principal
Amount
(000’s omitted) | | | Value | |
|
| General Obligations (continued) | |
| | |
Rio Grande City Grulla Independent School District, TX,
(PSF Guaranteed): | | | | | | |
| | |
4.00%, 8/15/33 | | $ | 250 | | | $ | 298,602 | |
| | |
4.00%, 8/15/34 | | | 250 | | | | 297,988 | |
| | |
Rowland Unified School District, CA, (Election of 2012), 0.00%, 8/1/34 | | | 400 | | | | 240,388 | |
| | |
| | | | | | | $ | 3,438,035 | |
|
| Hospital — 17.7% | |
| | |
Allegheny County Hospital Development Authority, PA, (Allegheny Health Network Obligated Group), 5.00%, 4/1/31 | | $ | 250 | | | $ | 296,722 | |
| | |
Cobb County Kennestone Hospital Authority, GA, (WellStar
Health System, Inc.): | | | | | | |
| | |
4.00%, 4/1/34 | | | 250 | | | | 286,035 | |
| | |
4.00%, 4/1/39 | | | 500 | | | | 564,680 | |
| | |
Glynn-Brunswick Memorial Hospital Authority, GA, (Southeast Georgia Health System), 4.00%, 8/1/35 | | | 500 | | | | 571,595 | |
| | |
Massachusetts Development Finance Agency, (Berkshire Retirement Community, Inc.), 5.00%, 7/1/31 | | | 50 | | | | 55,496 | |
| | |
| New York City Health and Hospitals Corp., NY: | | | | | | |
| | |
5.00%, 2/15/37 | | | 325 | | | | 407,062 | |
| | |
5.00%, 2/15/38 | | | 345 | | | | 431,278 | |
| | |
New York Dormitory Authority, (Catholic Health System Obligated Group), 4.00%, 7/1/39 | | | 250 | | | | 266,573 | |
| | |
Pima County Industrial Development Authority, AZ, (Tucson Medical Center), 5.00%, 4/1/33 | | | 150 | | | | 189,042 | |
| | |
Richmond County Hospital Authority, GA, (University Health Services, Inc.), 4.00%, 1/1/36 | | | 150 | | | | 162,357 | |
| | |
| Tampa, FL, (H. Lee Moffitt Cancer Center): | | | | | | |
| | |
4.00%, 7/1/38 | | | 150 | | | | 169,946 | |
| | |
5.00%, 7/1/35 | | | 100 | | | | 123,855 | |
| | |
| | | | | | | $ | 3,524,641 | |
|
| Housing — 0.5% | |
| | |
Vermont Housing Finance Agency, (FHLMC), (FNMA), (GNMA), 3.85%, 11/1/33 | | $ | 91 | | | $ | 94,633 | |
| | |
| | | | | | | $ | 94,633 | |
|
| Insured – Education — 1.2% | |
| | |
Patterson Joint Unified School District, CA, (Election 2018), (BAM), 5.00%, 8/1/29 | | $ | 200 | | | $ | 230,002 | |
| | |
| | | | | | | $ | 230,002 | |
| | | | |
| | 16 | | See Notes to Financial Statements. |
Parametric
TABS 10-to-20 Year Laddered Municipal Bond Fund
January 31, 2022
Portfolio of Investments — continued
| | | | | | | | |
| Security | | Principal
Amount
(000’s omitted) | | | Value | |
|
| Insured – General Obligations — 1.5% | |
| | |
| Grossmont Union High School District, CA, (Election of 2008): | | | | | | |
| | |
(AGM), 0.00%, 8/1/33 | | $ | 100 | | | $ | 62,620 | |
| | |
(AGM), 0.00%, 8/1/35 | | | 100 | | | | 56,533 | |
| | |
Yonkers, NY, (BAM), Series 2019A, 5.00%, 5/1/31 | | | 150 | | | | 184,595 | |
| | |
| | | | | | | $ | 303,748 | |
|
| Insured – Special Tax Revenue — 1.5% | |
| | |
| Vineyard Redevelopment Agency, UT: | | | | | | |
| | |
(AGM), 4.00%, 5/1/33 | | $ | 150 | | | $ | 172,977 | |
| | |
(AGM), 4.00%, 5/1/35 | | | 115 | | | | 132,084 | |
| | |
| | | | | | | $ | 305,061 | |
|
| Insured – Transportation — 2.1% | |
| | |
| New Orleans Aviation Board, LA: | | | | | | |
| | |
(AGM), 5.00%, 1/1/32 | | $ | 100 | | | $ | 118,293 | |
| | |
(AGM), 5.00%, 1/1/33 | | | 100 | | | | 118,237 | |
| | |
(AGM), 5.00%, 1/1/34 | | | 150 | | | | 177,300 | |
| | |
| | | | | | | $ | 413,830 | |
|
| Lease Revenue / Certificates of Participation — 3.9% | |
| | |
| Lake Houston Redevelopment Authority, TX: | | | | | | |
| | |
3.00%, 9/1/34 | | $ | 190 | | | $ | 192,033 | |
| | |
4.00%, 9/1/33 | | | 150 | | | | 168,855 | |
| | |
New Jersey Economic Development Authority, (School Facilities Construction), 5.00%, 6/15/33 | | | 150 | | | | 162,417 | |
| | |
| Palo Alto, CA, (California Avenue Parking Garage): | | | | | | |
| | |
5.00%, 11/1/37 | | | 100 | | | | 121,947 | |
| | |
5.00%, 11/1/38 | | | 115 | | | | 140,027 | |
| | |
| | | | | | | $ | 785,279 | |
|
| Other Revenue — 2.8% | |
| | |
| Fort Myers, FL, Capital Improvement Revenue: | | | | | | |
| | |
5.00%, 12/1/30 | | $ | 100 | | | $ | 113,622 | |
| | |
5.00%, 12/1/36 | | | 250 | | | | 282,355 | |
| | |
| Wisconsin, Environmental Improvement Fund Revenue: | | | | | | |
| | |
5.00%, 6/1/34 | | | 50 | | | | 55,805 | |
| | |
5.00%, 6/1/35 | | | 100 | | | | 111,542 | |
| | |
| | | | | | | $ | 563,324 | |
|
| Senior Living / Life Care — 11.4% | |
| | |
Baltimore County, MD, (Riderwood Village, Inc.), 4.00%, 1/1/32 | | $ | 350 | | | $ | 398,314 | |
| | |
Colorado Health Facilities Authority, (Covenant Living Communities and Services), 4.00%, 12/1/40 | | | 500 | | | | 561,920 | |
| | | | | | | | |
| Security | | Principal
Amount
(000’s omitted) | | | Value | |
|
| Senior Living / Life Care (continued) | |
| | |
Maryland Health and Higher Educational Facilities Authority,
(Broadmead): | | | | | | |
| | |
5.00%, 7/1/31 | | $ | 150 | | | $ | 171,232 | |
| | |
5.00%, 7/1/32 | | | 220 | | | | 250,901 | |
| | |
Missouri Health and Educational Facilities Authority, (Lutheran Senior Services), 5.00%, 2/1/31 | | | 100 | | | | 111,388 | |
| | |
Orange County Health Facilities Authority, FL, (Presbyterian Retirement Communities), 5.00%, 8/1/35 | | | 150 | | | | 166,050 | |
| | |
West Cornwall Township Municipal Authority, PA, (Lebanon
Valley Brethren Home): | | | | | | |
| | |
4.00%, 11/15/31 | | | 200 | | | | 228,292 | |
| | |
4.00%, 11/15/36 | | | 220 | | | | 248,422 | |
| | |
4.00%, 11/15/41 | | | 125 | | | | 139,884 | |
| | |
| | | | | | | $ | 2,276,403 | |
|
| Special Tax Revenue — 6.0% | |
| | |
Baltimore, MD, Special Tax Obligation, 5.00%, 6/15/29 | | $ | 50 | | | $ | 53,772 | |
| | |
New York City Transitional Finance Authority, NY, Future Tax Revenue, 4.00%, 2/1/42(1) | | | 500 | | | | 570,435 | |
| | |
Queen Creek, AZ, Excise Tax and State Shared Revenue, 4.00%, 8/1/37 | | | 480 | | | | 560,798 | |
| | |
| | | | | | | $ | 1,185,005 | |
|
| Transportation — 17.1% | |
| | |
Bay Area Toll Authority, CA, Toll Bridge Revenue, (San Francisco Bay Area), 0.96%, (SIFMA + 0.90%), 5/1/23 (Put Date), 4/1/47(2) | | $ | 150 | | | $ | 150,648 | |
| | |
| Central Texas Regional Mobility Authority: | | | | | | |
| | |
4.00%, 1/1/35 | | | 250 | | | | 282,730 | |
| | |
4.00%, 1/1/36 | | | 200 | | | | 225,970 | |
| | |
| Chicago, IL, (O’Hare International Airport): | | | | | | |
| | |
4.00%, 1/1/36 | | | 500 | | | | 571,560 | |
| | |
5.00%, 1/1/37 | | | 250 | | | | 290,910 | |
| | |
Pennsylvania Turnpike Commission, 5.00%, 12/1/34 | | | 500 | | | | 629,750 | |
| | |
Port Authority of New York and New Jersey, 4.00%, 7/15/38 | | | 500 | | | | 568,005 | |
| | |
Salt Lake City, UT, (Salt Lake City International Airport), 5.00%, 7/1/36 | | | 200 | | | | 238,458 | |
| | |
Texas Transportation Commission, (Central Texas
Turnpike System): | | | | | | |
| | |
0.00%, 8/1/35 | | | 300 | | | | 188,046 | |
| | |
0.00%, 8/1/38 | | | 500 | | | | 266,905 | |
| | |
| | | | | | | $ | 3,412,982 | |
| | | | |
| | 17 | | See Notes to Financial Statements. |
Parametric
TABS 10-to-20 Year Laddered Municipal Bond Fund
January 31, 2022
Portfolio of Investments — continued
| | | | | | | | |
| Security | | Principal
Amount
(000’s omitted) | | | Value | |
|
| Water and Sewer — 3.2% | |
| | |
Buffalo Municipal Water Finance Authority, NY, 5.00%, 7/1/30 | | $ | 50 | | | $ | 56,021 | |
| | |
San Diego Public Facilities Financing Authority, CA, Water Revenue, 4.00%, 8/1/40 | | | 500 | | | | 574,040 | |
| | |
| | | | | | | $ | 630,061 | |
| |
Total Tax-Exempt Municipal Obligations — 96.7%
(identified cost $18,649,492) | | | $ | 19,245,886 | |
|
| Short-Term Investments — 7.0% | |
| Description | | Units | | | Value | |
| | |
Eaton Vance Cash Reserves Fund, LLC, 0.08%(3) | | | 1,399,692 | | | $ | 1,399,552 | |
| |
Total Short-Term Investments
(identified cost $1,399,552) | | | $ | 1,399,552 | |
| |
Total Investments — 103.7%
(identified cost $20,049,044) | | | $ | 20,645,438 | |
| |
Other Assets, Less Liabilities — (3.7)% | | | $ | (740,518 | ) |
| |
Net Assets — 100.0% | | | $ | 19,904,920 | |
The percentage shown for each investment category in the Portfolio of Investments is based on net assets.
At January 31, 2022, the concentration of the Fund’s investments in the various states, determined as a percentage of net assets, is as follows:
| | | | |
| |
| New York | | | 12.5% | |
| |
| California | | | 11.2% | |
| |
| Others, representing less than 10% individually | | | 73.0% | |
The Fund invests primarily in debt securities issued by municipalities. The ability of the issuers of the debt securities to meet their obligations may be affected by economic developments in a specific industry or municipality. At January 31, 2022, 6.1% of total investments are backed by bond insurance of various financial institutions and financial guaranty assurance agencies. The aggregate percentage insured by an individual financial institution or financial guaranty assurance agency ranged from 2.0% to 4.1% of total investments.
| (1) | When-issued security. |
| (2) | Floating rate security. The stated interest rate represents the rate in effect at January 31, 2022. |
| (3) | Affiliated investment company, available to Eaton Vance portfolios and funds, which invests in high quality, U.S. dollar denominated money market instruments. The rate shown is the annualized seven-day yield as of January 31, 2022. |
Abbreviations:
| | | | |
| | |
| AGM | | – | | Assured Guaranty Municipal Corp. |
| | |
| BAM | | – | | Build America Mutual Assurance Co. |
| | |
| FHLMC | | – | | Federal Home Loan Mortgage Corp. |
| | |
| FNMA | | – | | Federal National Mortgage Association |
| | |
| GNMA | | – | | Government National Mortgage Association |
| | |
| PSF | | – | | Permanent School Fund |
| | |
| SIFMA | | – | | Securities Industry and Financial Markets Association Municipal Swap Index |
| | | | |
| | 18 | | See Notes to Financial Statements. |
Parametric
TABS Laddered Municipal Bond Funds
January 31, 2022
Statements of Assets and Liabilities
| | | | | | | | |
| | | January 31, 2022 | |
| Assets | | 1-to-10 Year
Laddered Fund | | | 10-to-20 Year
Laddered Fund | |
| | |
Unaffiliated investments, at value (identified cost, $90,285,760 and $18,649,492, respectively) | | $ | 91,492,936 | | | $ | 19,245,886 | |
| | |
Affiliated investment, at value (identified cost, $9,633,864 and $1,399,552, respectively) | | | 9,633,863 | | | | 1,399,552 | |
| | |
Interest receivable | | | 632,214 | | | | 175,044 | |
| | |
Dividends receivable from affiliated investment | | | 1,296 | | | | 154 | |
| | |
Receivable for investments sold | | | — | | | | 6,058 | |
| | |
Receivable for Fund shares sold | | | 65,261 | | | | 730 | |
| | |
Receivable from affiliates | | | 8,935 | | | | 9,000 | |
| | |
Total assets | | $ | 101,834,505 | | | $ | 20,836,424 | |
| | |
| Liabilities | | | | | | | | |
| | |
Payable for when-issued securities | | $ | 7,632,287 | | | $ | 580,880 | |
| | |
Payable for Fund shares redeemed | | | 415,765 | | | | 285,385 | |
| | |
Distributions payable | | | 207 | | | | — | |
| | |
Payable to affiliates: | | | | | | | | |
| | |
Investment adviser and administration fee | | | 26,221 | | | | 5,597 | |
| | |
Distribution and service fees | | | 6,399 | | | | 1,526 | |
| | |
Accrued expenses | | | 89,529 | | | | 58,116 | |
| | |
Total liabilities | | $ | 8,170,408 | | | $ | 931,504 | |
| | |
Net Assets | | $ | 93,664,097 | | | $ | 19,904,920 | |
| | |
| Sources of Net Assets | | | | | | | | |
| | |
Paid-in capital | | $ | 92,384,640 | | | $ | 19,298,629 | |
| | |
Distributable earnings | | | 1,279,457 | | | | 606,291 | |
| | |
Net Assets | | $ | 93,664,097 | | | $ | 19,904,920 | |
| | |
| Class A Shares | | | | | | | | |
| | |
Net Assets | | $ | 14,525,682 | | | $ | 5,139,103 | |
| | |
Shares Outstanding | | | 1,371,692 | | | | 457,543 | |
| | |
Net Asset Value and Redemption Price Per Share | | | | | | | | |
| | |
(net assets ÷ shares of beneficial interest outstanding) | | $ | 10.59 | | | $ | 11.23 | |
| | |
Maximum Offering Price Per Share | | | | | | | | |
| | |
(100 ÷ 97.75 and 95.25, respectively, of net asset value per share) | | $ | 10.83 | | | $ | 11.79 | |
| | |
| Class C Shares | | | | | | | | |
| | |
Net Assets | | $ | 3,590,899 | | | $ | 475,763 | |
| | |
Shares Outstanding | | | 339,073 | | | | 42,352 | |
| | |
Net Asset Value and Offering Price Per Share* | | | | | | | | |
| | |
(net assets ÷ shares of beneficial interest outstanding) | | $ | 10.59 | | | $ | 11.23 | |
| | |
| Class I Shares | | | | | | | | |
| | |
Net Assets | | $ | 75,547,516 | | | $ | 14,290,054 | |
| | |
Shares Outstanding | | | 7,125,985 | | | | 1,272,094 | |
| | |
Net Asset Value, Offering Price and Redemption Price Per Share | | | | | | | | |
| | |
(net assets ÷ shares of beneficial interest outstanding) | | $ | 10.60 | | | $ | 11.23 | |
On sales of $100,000 or more ($50,000 or more for 10-to-20 Year Laddered Fund), the offering price of Class A shares is reduced.
| * | Redemption price per share is equal to the net asset value less any applicable contingent deferred sales charge. |
| | | | |
| | 19 | | See Notes to Financial Statements. |
Parametric
TABS Laddered Municipal Bond Funds
January 31, 2022
Statements of Operations
| | | | | | | | |
| | | Year Ended January 31, 2022 | |
| Investment Income | | 1-to-10 Year
Laddered Fund | | | 10-to-20 Year
Laddered Fund | |
| | |
Interest | | $ | 1,410,683 | | | $ | 492,915 | |
| | |
Dividends from affiliated investment | | | 8,747 | | | | 1,127 | |
| | |
Total investment income | | $ | 1,419,430 | | | $ | 494,042 | |
| | |
| Expenses | | | | | | | | |
| | |
Investment adviser and administration fee | | $ | 289,839 | | | $ | 67,511 | |
| | |
Distribution and service fees | | | | | | | | |
| | |
Class A | | | 39,940 | | | | 14,583 | |
| | |
Class C | | | 39,557 | | | | 6,045 | |
| | |
Trustees’ fees and expenses | | | 4,952 | | | | 1,513 | |
| | |
Custodian fee | | | 30,796 | | | | 19,048 | |
| | |
Transfer and dividend disbursing agent fees | | | 29,506 | | | | 8,345 | |
| | |
Legal and accounting services | | | 43,477 | | | | 38,273 | |
| | |
Printing and postage | | | 7,679 | | | | 7,488 | |
| | |
Registration fees | | | 57,349 | | | | 43,935 | |
| | |
Miscellaneous | | | 12,379 | | | | 10,233 | |
| | |
Total expenses | | $ | 555,474 | | | $ | 216,974 | |
| | |
Deduct — | | | | | | | | |
| | |
Allocation of expenses to affiliates | | $ | 113,981 | | | $ | 111,643 | |
| | |
Total expense reductions | | $ | 113,981 | | | $ | 111,643 | |
| | |
Net expenses | | $ | 441,493 | | | $ | 105,331 | |
| | |
Net investment income | | $ | 977,937 | | | $ | 388,711 | |
|
| Realized and Unrealized Gain (Loss) | |
| | |
Net realized gain (loss) — | | | | | | | | |
| | |
Investment transactions | | $ | 186,033 | | | $ | 145,304 | |
| | |
Investment transactions — affiliated investment | | | (885 | ) | | | (53 | ) |
| | |
Net realized gain | | $ | 185,148 | | | $ | 145,251 | |
| | |
Change in unrealized appreciation (depreciation) — | | | | | | | | |
| | |
Investments | | $ | (2,947,008 | ) | | $ | (898,194 | ) |
| | |
Investments — affiliated investment | | | (1 | ) | | | — | |
| | |
Net change in unrealized appreciation (depreciation) | | $ | (2,947,009 | ) | | $ | (898,194 | ) |
| | |
Net realized and unrealized loss | | $ | (2,761,861 | ) | | $ | (752,943 | ) |
| | |
Net decrease in net assets from operations | | $ | (1,783,924 | ) | | $ | (364,232 | ) |
| | | | |
| | 20 | | See Notes to Financial Statements. |
Parametric
TABS Laddered Municipal Bond Funds
January 31, 2022
Statements of Changes in Net Assets
| | | | | | | | |
| | | Year Ended January 31, 2022 | |
| Increase (Decrease) in Net Assets | | 1-to-10 Year
Laddered Fund | | | 10-to-20 Year
Laddered Fund | |
| | |
From operations — | | | | | | | | |
| | |
Net investment income | | $ | 977,937 | | | $ | 388,711 | |
| | |
Net realized gain | | | 185,148 | | | | 145,251 | |
| | |
Net change in unrealized appreciation (depreciation) | | | (2,947,009 | ) | | | (898,194 | ) |
| | |
Net decrease in net assets from operations | | $ | (1,783,924 | ) | | $ | (364,232 | ) |
| | |
Distributions to shareholders — | | | | | | | | |
| | |
Class A | | $ | (172,745 | ) | | $ | (153,766 | ) |
| | |
Class C | | | (13,244 | ) | | | (12,069 | ) |
| | |
Class I | | | (952,556 | ) | | | (419,328 | ) |
| | |
Total distributions to shareholders | | $ | (1,138,545 | ) | | $ | (585,163 | ) |
| | |
Transactions in shares of beneficial interest — | | | | | | | | |
| | |
Proceeds from sale of shares | | | | | | | | |
| | |
Class A | | $ | 6,050,061 | | | $ | 2,139,678 | |
| | |
Class C | | | 366,553 | | | | 182,531 | |
| | |
Class I | | | 33,631,922 | | | | 8,326,515 | |
| | |
Net asset value of shares issued to shareholders in payment of distributions declared | | | | | | | | |
| | |
Class A | | | 167,915 | | | | 153,766 | |
| | |
Class C | | | 13,244 | | | | 12,069 | |
| | |
Class I | | | 949,843 | | | | 418,129 | |
| | |
Cost of shares redeemed | | | | | | | | |
| | |
Class A | | | (14,026,180 | ) | | | (1,794,498 | ) |
| | |
Class C | | | (672,446 | ) | | | (216,405 | ) |
| | |
Class I | | | (23,039,153 | ) | | | (10,985,720 | ) |
| | |
Net increase (decrease) in net assets from Fund share transactions | | $ | 3,441,759 | | | $ | (1,763,935 | ) |
| | |
Net increase (decrease) in net assets | | $ | 519,290 | | | $ | (2,713,330 | ) |
|
| Net Assets | |
| | |
At beginning of year | | $ | 93,144,807 | | | $ | 22,618,250 | |
| | |
At end of year | | $ | 93,664,097 | | | $ | 19,904,920 | |
| | | | |
| | 21 | | See Notes to Financial Statements. |
Parametric
TABS Laddered Municipal Bond Funds
January 31, 2022
Statements of Changes in Net Assets — continued
| | | | | | | | |
| | | Year Ended January 31, 2021 | |
| Increase (Decrease) in Net Assets | | 1-to-10 Year
Laddered Fund | | | 10-to-20 Year
Laddered Fund | |
| | |
From operations — | | | | | | | | |
| | |
Net investment income | | $ | 1,029,142 | | | $ | 371,450 | |
| | |
Net realized gain | | | 274,344 | | | | 442,586 | |
| | |
Net change in unrealized appreciation (depreciation) | | | 1,927,774 | | | | 513,841 | |
| | |
Net increase in net assets from operations | | $ | 3,231,260 | | | $ | 1,327,877 | |
| | |
Distributions to shareholders — | | | | | | | | |
| | |
Class A | | $ | (252,689 | ) | | $ | (118,225 | ) |
| | |
Class C | | | (19,185 | ) | | | (13,636 | ) |
| | |
Class I | | | (754,023 | ) | | | (575,792 | ) |
| | |
Total distributions to shareholders | | $ | (1,025,897 | ) | | $ | (707,653 | ) |
| | |
Transactions in shares of beneficial interest — | | | | | | | | |
| | |
Proceeds from sale of shares | | | | | | | | |
| | |
Class A | | $ | 7,403,194 | | | $ | 3,909,826 | |
| | |
Class C | | | 700,981 | | | | 123,501 | |
| | |
Class I | | | 35,431,942 | | | | 13,588,704 | |
| | |
Net asset value of shares issued to shareholders in payment of distributions declared | | | | | | | | |
| | |
Class A | | | 235,755 | | | | 118,225 | |
| | |
Class C | | | 18,961 | | | | 13,636 | |
| | |
Class I | | | 753,018 | | | | 575,792 | |
| | |
Cost of shares redeemed | | | | | | | | |
| | |
Class A | | | (5,402,755 | ) | | | (293,488 | ) |
| | |
Class C | | | (679,401 | ) | | | (148,325 | ) |
| | |
Class I | | | (19,089,916 | ) | | | (10,089,195 | ) |
| | |
Net asset value of shares converted | | | | | | | | |
| | |
Class A | | | 45,630 | | | | — | |
| | |
Class C | | | (45,630 | ) | | | — | |
| | |
Net increase in net assets from Fund share transactions | | $ | 19,371,779 | | | $ | 7,798,676 | |
| | |
Net increase in net assets | | $ | 21,577,142 | | | $ | 8,418,900 | |
|
| Net Assets | |
| | |
At beginning of year | | $ | 71,567,665 | | | $ | 14,199,350 | |
| | |
At end of year | | $ | 93,144,807 | | | $ | 22,618,250 | |
| | | | |
| | 22 | | See Notes to Financial Statements. |
Parametric
TABS Laddered Municipal Bond Funds
January 31, 2022
Financial Highlights
| | | | | | | | | | | | | | | | | | | | |
| | | 1-to-10 Year Laddered Fund — Class A | |
| |
| | | Year Ended January 31, | |
| | | 2022 | | | 2021 | | | 2020 | | | 2019 | | | 2018 | |
| | | | | |
Net asset value — Beginning of year | | $ | 10.910 | | | $ | 10.600 | | | $ | 10.240 | | | $ | 10.170 | | | $ | 10.120 | |
| | | | | |
| Income (Loss) From Operations | | | | | | | | | | | | | | | | | | | | |
| | | | | |
Net investment income | | $ | 0.102 | | | $ | 0.132 | | | $ | 0.172 | | | $ | 0.157 | | | $ | 0.129 | |
| | | | | |
Net realized and unrealized gain (loss) | | | (0.303 | ) | | | 0.308 | | | | 0.360 | | | | 0.070 | | | | 0.050 | |
| | | | | |
Total income (loss) from operations | | $ | (0.201 | ) | | $ | 0.440 | | | $ | 0.532 | | | $ | 0.227 | | | $ | 0.179 | |
| | | | | |
| Less Distributions | | | | | | | | | | | | | | | | | | | | |
| | | | | |
From net investment income | | $ | (0.100 | ) | | $ | (0.130 | ) | | $ | (0.172 | ) | | $ | (0.157 | ) | | $ | (0.129 | ) |
| | | | | |
From net realized gain | | | (0.019 | ) | | | — | | | | — | | | | — | | | | — | |
| | | | | |
Total distributions | | $ | (0.119 | ) | | $ | (0.130 | ) | | $ | (0.172 | ) | | $ | (0.157 | ) | | $ | (0.129 | ) |
| | | | | |
Net asset value — End of year | | $ | 10.590 | | | $ | 10.910 | | | $ | 10.600 | | | $ | 10.240 | | | $ | 10.170 | |
| | | | | |
Total Return(1)(2) | | | (1.87 | )% | | | 4.19 | % | | | 5.23 | % | | | 2.26 | % | | | 1.76 | % |
|
| Ratios/Supplemental Data | |
| | | | | |
Net assets, end of year (000’s omitted) | | $ | 14,526 | | | $ | 22,853 | | | $ | 19,901 | | | $ | 17,978 | | | $ | 16,877 | |
| | | | | |
Ratios (as a percentage of average daily net assets): | | | | | | | | | | | | | | | | | | | | |
| | | | | |
Expenses(2) | | | 0.65 | % | | | 0.65 | % | | | 0.65 | % | | | 0.65 | % | | | 0.65 | % |
| | | | | |
Net investment income | | | 0.92 | % | | | 1.23 | % | | | 1.64 | % | | | 1.56 | % | | | 1.25 | % |
| | | | | |
Portfolio Turnover | | | 34 | % | | | 81 | % | | | 41 | % | | | 91 | % | | | 19 | % |
| (1) | Returns are historical and are calculated by determining the percentage change in net asset value with all distributions reinvested and do not reflect the effect of sales charges. |
| (2) | The investment adviser and administrator and the sub-adviser reimbursed certain operating expenses (equal to 0.13%, 0.16%, 0.18%, 0.20% and 0.24% of average daily net assets for the years ended January 31, 2022, 2021, 2020, 2019 and 2018, respectively). Absent this reimbursement, total return would be lower. |
| | | | |
| | 23 | | See Notes to Financial Statements. |
Parametric
TABS Laddered Municipal Bond Funds
January 31, 2022
Financial Highlights — continued
| | | | | | | | | | | | | | | | | | | | |
| | | 1-to-10 Year Laddered Fund — Class C | |
| |
| | | Year Ended January 31, | |
| | | 2022 | | | 2021 | | | 2020 | | | 2019 | | | 2018 | |
| | | | | |
Net asset value — Beginning of year | | $ | 10.910 | | | $ | 10.590 | | | $ | 10.240 | | | $ | 10.170 | | | $ | 10.120 | |
| | | | | |
| Income (Loss) From Operations | | | | | | | | | | | | | | | | | | | | |
| | | | | |
Net investment income | | $ | 0.019 | | | $ | 0.053 | | | $ | 0.093 | | | $ | 0.081 | | | $ | 0.052 | |
| | | | | |
Net realized and unrealized gain (loss) | | | (0.302 | ) | | | 0.318 | | | | 0.350 | | | | 0.070 | | | | 0.050 | |
| | | | | |
Total income (loss) from operations | | $ | (0.283 | ) | | $ | 0.371 | | | $ | 0.443 | | | $ | 0.151 | | | $ | 0.102 | |
| | | | | |
| Less Distributions | | | | | | | | | | | | | | | | | | | | |
| | | | | |
From net investment income | | $ | (0.018 | ) | | $ | (0.051 | ) | | $ | (0.093 | ) | | $ | (0.081 | ) | | $ | (0.052 | ) |
| | | | | |
From net realized gain | | | (0.019 | ) | | | — | | | | — | | | | — | | | | — | |
| | | | | |
Total distributions | | $ | (0.037 | ) | | $ | (0.051 | ) | | $ | (0.093 | ) | | $ | (0.081 | ) | | $ | (0.052 | ) |
| | | | | |
Net asset value — End of year | | $ | 10.590 | | | $ | 10.910 | | | $ | 10.590 | | | $ | 10.240 | | | $ | 10.170 | |
| | | | | |
Total Return(1)(2) | | | (2.60 | )% | | | 3.52 | % | | | 4.35 | % | | | 1.50 | % | | | 1.00 | % |
|
| Ratios/Supplemental Data | |
| | | | | |
Net assets, end of year (000’s omitted) | | $ | 3,591 | | | $ | 3,994 | | | $ | 3,875 | | | $ | 3,951 | | | $ | 3,638 | |
| | | | | |
Ratios (as a percentage of average daily net assets): | | | | | | | | | | | | | | | | | | | | |
| | | | | |
Expenses(2) | | | 1.40 | % | | | 1.40 | % | | | 1.40 | % | | | 1.40 | % | | | 1.40 | % |
| | | | | |
Net investment income | | | 0.17 | % | | | 0.48 | % | | | 0.90 | % | | | 0.80 | % | | | 0.50 | % |
| | | | | |
Portfolio Turnover | | | 34 | % | | | 81 | % | | | 41 | % | | | 91 | % | | | 19 | % |
| (1) | Returns are historical and are calculated by determining the percentage change in net asset value with all distributions reinvested and do not reflect the effect of sales charges. |
| (2) | The investment adviser and administrator and the sub-adviser reimbursed certain operating expenses (equal to 0.13%, 0.16%, 0.18%, 0.20% and 0.24% of average daily net assets for the years ended January 31, 2022, 2021, 2020, 2019 and 2018, respectively). Absent this reimbursement, total return would be lower. |
| | | | |
| | 24 | | See Notes to Financial Statements. |
Parametric
TABS Laddered Municipal Bond Funds
January 31, 2022
Financial Highlights — continued
| | | | | | | | | | | | | | | | | | | | |
| | | 1-to-10 Year Laddered Fund — Class I | |
| |
| | | Year Ended January 31, | |
| | | 2022 | | | 2021 | | | 2020 | | | 2019 | | | 2018 | |
| | | | | |
Net asset value — Beginning of year | | $ | 10.920 | | | $ | 10.610 | | | $ | 10.250 | | | $ | 10.180 | | | $ | 10.130 | |
| | | | | |
| Income (Loss) From Operations | | | | | | | | | | | | | | | | | | | | |
| | | | | |
Net investment income | | $ | 0.127 | | | $ | 0.159 | | | $ | 0.198 | | | $ | 0.182 | | | $ | 0.156 | |
| | | | | |
Net realized and unrealized gain (loss) | | | (0.301 | ) | | | 0.308 | | | | 0.360 | | | | 0.070 | | | | 0.050 | |
| | | | | |
Total income (loss) from operations | | $ | (0.174 | ) | | $ | 0.467 | | | $ | 0.558 | | | $ | 0.252 | | | $ | 0.206 | |
| | | | | |
| Less Distributions | | | | | | | | | | | | | | | | | | | | |
| | | | | |
From net investment income | | $ | (0.127 | ) | | $ | (0.157 | ) | | $ | (0.198 | ) | | $ | (0.182 | ) | | $ | (0.156 | ) |
| | | | | |
From net realized gain | | | (0.019 | ) | | | — | | | | — | | | | — | | | | — | |
| | | | | |
Total distributions | | $ | (0.146 | ) | | $ | (0.157 | ) | | $ | (0.198 | ) | | $ | (0.182 | ) | | $ | (0.156 | ) |
| | | | | |
Net asset value — End of year | | $ | 10.600 | | | $ | 10.920 | | | $ | 10.610 | | | $ | 10.250 | | | $ | 10.180 | |
| | | | | |
Total Return(1)(2) | | | (1.62 | )% | | | 4.45 | % | | | 5.49 | % | | | 2.51 | % | | | 2.03 | % |
|
| Ratios/Supplemental Data | |
| | | | | |
Net assets, end of year (000’s omitted) | | $ | 75,548 | | | $ | 66,298 | | | $ | 47,792 | | | $ | 31,936 | | | $ | 42,106 | |
| | | | | |
Ratios (as a percentage of average daily net assets): | | | | | | | | | | | | | | | | | | | | |
| | | | | |
Expenses(2) | | | 0.40 | % | | | 0.40 | % | | | 0.40 | % | | | 0.40 | % | | | 0.40 | % |
| | | | | |
Net investment income | | | 1.17 | % | | | 1.46 | % | | | 1.88 | % | | | 1.79 | % | | | 1.51 | % |
| | | | | |
Portfolio Turnover | | | 34 | % | | | 81 | % | | | 41 | % | | | 91 | % | | | 19 | % |
| (1) | Returns are historical and are calculated by determining the percentage change in net asset value with all distributions reinvested. |
| (2) | The investment adviser and administrator and the sub-adviser reimbursed certain operating expenses (equal to 0.13%, 0.16%, 0.18%, 0.20% and 0.24% of average daily net assets for the years ended January 31, 2022, 2021, 2020, 2019 and 2018, respectively). Absent this reimbursement, total return would be lower. |
| | | | |
| | 25 | | See Notes to Financial Statements. |
Parametric
TABS Laddered Municipal Bond Funds
January 31, 2022
Financial Highlights — continued
| | | | | | | | | | | | | | | | | | | | |
| | | 10-to-20 Year Laddered Fund — Class A | |
| |
| | | Year Ended January 31, | |
| | | 2022 | | | 2021 | | | 2020 | | | 2019 | | | 2018 | |
| | | | | |
Net asset value — Beginning of year | | $ | 11.730 | | | $ | 11.410 | | | $ | 10.560 | | | $ | 10.530 | | | $ | 10.260 | |
| | | | | |
| Income (Loss) From Operations | | | | | | | | | | | | | | | | | | | | |
| | | | | |
Net investment income | | $ | 0.198 | | | $ | 0.218 | | | $ | 0.275 | | | $ | 0.272 | | | $ | 0.255 | |
| | | | | |
Net realized and unrealized gain (loss) | | | (0.389 | ) | | | 0.492 | | | | 0.870 | | | | 0.068 | | | | 0.270 | |
| | | | | |
Total income (loss) from operations | | $ | (0.191 | ) | | $ | 0.710 | | | $ | 1.145 | | | $ | 0.340 | | | $ | 0.525 | |
| | | | | |
| Less Distributions | | | | | | | | | | | | | | | | | | | | |
| | | | | |
From net investment income | | $ | (0.198 | ) | | $ | (0.215 | ) | | $ | (0.277 | ) | | $ | (0.271 | ) | | $ | (0.255 | ) |
| | | | | |
From net realized gain | | | (0.111 | ) | | | (0.175 | ) | | | (0.018 | ) | | | (0.039 | ) | | | — | |
| | | | | |
Total distributions | | $ | (0.309 | ) | | $ | (0.390 | ) | | $ | (0.295 | ) | | $ | (0.310 | ) | | $ | (0.255 | ) |
| | | | | |
Net asset value — End of year | | $ | 11.230 | | | $ | 11.730 | | | $ | 11.410 | | | $ | 10.560 | | | $ | 10.530 | |
| | | | | |
Total Return(1)(2) | | | (1.69 | )% | | | 6.35 | % | | | 10.97 | % | | | 3.30 | % | | | 5.14 | % |
|
| Ratios/Supplemental Data | |
| | | | | |
Net assets, end of year (000’s omitted) | | $ | 5,139 | | | $ | 4,881 | | | $ | 970 | | | $ | 297 | | | $ | 336 | |
| | | | | |
Ratios (as a percentage of average daily net assets): | | | | | | | | | | | | | | | | | | | | |
| | | | | |
Expenses(2) | | | 0.65 | % | | | 0.65 | % | | | 0.65 | % | | | 0.65 | % | | | 0.65 | % |
| | | | | |
Net investment income | | | 1.69 | % | | | 1.79 | % | | | 2.45 | % | | | 2.59 | % | | | 2.44 | % |
| | | | | |
Portfolio Turnover | | | 24 | % | | | 62 | % | | | 33 | % | | | 44 | % | | | 53 | % |
| (1) | Returns are historical and are calculated by determining the percentage change in net asset value with all distributions reinvested and do not reflect the effect of sales charges. |
| (2) | The investment adviser and administrator and the sub-adviser reimbursed certain operating expenses (equal to 0.53%, 0.61%, 0.94%, 1.25% and 1.42% of average daily net assets for the years ended January 31, 2022, 2021, 2020, 2019 and 2018, respectively). Absent this reimbursement, total return would be lower. |
| | | | |
| | 26 | | See Notes to Financial Statements. |
Parametric
TABS Laddered Municipal Bond Funds
January 31, 2022
Financial Highlights — continued
| | | | | | | | | | | | | | | | | | | | |
| | | 10-to-20 Year Laddered Fund — Class C | |
| |
| | | Year Ended January 31, | |
| | | 2022 | | | 2021 | | | 2020 | | | 2019 | | | 2018 | |
| | | | | |
Net asset value — Beginning of year | | $ | 11.730 | | | $ | 11.410 | | | $ | 10.570 | | | $ | 10.540 | | | $ | 10.270 | |
| | | | | |
| Income (Loss) From Operations | | | | | | | | | | | | | | | | | | | | |
| | | | | |
Net investment income | | $ | 0.111 | | | $ | 0.135 | | | $ | 0.193 | | | $ | 0.194 | | | $ | 0.176 | |
| | | | | |
Net realized and unrealized gain (loss) | | | (0.389 | ) | | | 0.490 | | | | 0.859 | | | | 0.068 | | | | 0.270 | |
| | | | | |
Total income (loss) from operations | | $ | (0.278 | ) | | $ | 0.625 | | | $ | 1.052 | | | $ | 0.262 | | | $ | 0.446 | |
| | | | | |
| Less Distributions | | | | | | | | | | | | | | | | | | | | |
| | | | | |
From net investment income | | $ | (0.111 | ) | | $ | (0.130 | ) | | $ | (0.194 | ) | | $ | (0.193 | ) | | $ | (0.176 | ) |
| | | | | |
From net realized gain | | | (0.111 | ) | | | (0.175 | ) | | | (0.018 | ) | | | (0.039 | ) | | | — | |
| | | | | |
Total distributions | | $ | (0.222 | ) | | $ | (0.305 | ) | | $ | (0.212 | ) | | $ | (0.232 | ) | | $ | (0.176 | ) |
| | | | | |
Net asset value — End of year | | $ | 11.230 | | | $ | 11.730 | | | $ | 11.410 | | | $ | 10.570 | | | $ | 10.540 | |
| | | | | |
Total Return(1)(2) | | | (2.43 | )% | | | 5.56 | % | | | 10.04 | % | | | 2.53 | % | | | 4.35 | % |
|
| Ratios/Supplemental Data | |
| | | | | |
Net assets, end of year (000’s omitted) | | $ | 476 | | | $ | 522 | | | $ | 521 | | | $ | 331 | | | $ | 380 | |
| | | | | |
Ratios (as a percentage of average daily net assets): | | | | | | | | | | | | | | | | | | | | |
| | | | | |
Expenses(2) | | | 1.40 | % | | | 1.40 | % | | | 1.40 | % | | | 1.40 | % | | | 1.40 | % |
| | | | | |
Net investment income | | | 0.95 | % | | | 1.14 | % | | | 1.73 | % | | | 1.85 | % | | | 1.66 | % |
| | | | | |
Portfolio Turnover | | | 24 | % | | | 62 | % | | | 33 | % | | | 44 | % | | | 53 | % |
| (1) | Returns are historical and are calculated by determining the percentage change in net asset value with all distributions reinvested and do not reflect the effect of sales charges. |
| (2) | The investment adviser and administrator and the sub-adviser reimbursed certain operating expenses (equal to 0.53%, 0.61%, 0.94%, 1.25% and 1.42% of average daily net assets for the years ended January 31, 2022, 2021, 2020, 2019 and 2018, respectively). Absent this reimbursement, total return would be lower. |
| | | | |
| | 27 | | See Notes to Financial Statements. |
Parametric
TABS Laddered Municipal Bond Funds
January 31, 2022
Financial Highlights — continued
| | | | | | | | | | | | | | | | | | | | |
| | | 10-to-20 Year Laddered Fund — Class I | |
| |
| | | Year Ended January 31, | |
| | | 2022 | | | 2021 | | | 2020 | | | 2019 | | | 2018 | |
| | | | | |
Net asset value — Beginning of year | | $ | 11.730 | | | $ | 11.410 | | | $ | 10.560 | | | $ | 10.530 | | | $ | 10.270 | |
| | | | | |
| Income (Loss) From Operations | | | | | | | | | | | | | | | | | | | | |
| | | | | |
Net investment income | | $ | 0.228 | | | $ | 0.248 | | | $ | 0.304 | | | $ | 0.298 | | | $ | 0.281 | |
| | | | | |
Net realized and unrealized gain (loss) | | | (0.390 | ) | | | 0.491 | | | | 0.869 | | | | 0.069 | | | | 0.261 | |
| | | | | |
Total income (loss) from operations | | $ | (0.162 | ) | | $ | 0.739 | | | $ | 1.173 | | | $ | 0.367 | | | $ | 0.542 | |
| | | | | |
| Less Distributions | | | | | | | | | | | | | | | | | | | | |
| | | | | |
From net investment income | | $ | (0.227 | ) | | $ | (0.244 | ) | | $ | (0.305 | ) | | $ | (0.298 | ) | | $ | (0.282 | ) |
| | | | | |
From net realized gain | | | (0.111 | ) | | | (0.175 | ) | | | (0.018 | ) | | | (0.039 | ) | | | — | |
| | | | | |
Total distributions | | $ | (0.338 | ) | | $ | (0.419 | ) | | $ | (0.323 | ) | | $ | (0.337 | ) | | $ | (0.282 | ) |
| | | | | |
Net asset value — End of year | | $ | 11.230 | | | $ | 11.730 | | | $ | 11.410 | | | $ | 10.560 | | | $ | 10.530 | |
| | | | | |
Total Return(1)(2) | | | (1.45 | )% | | | 6.61 | % | | | 11.25 | % | | | 3.56 | % | | | 5.30 | % |
|
| Ratios/Supplemental Data | |
| | | | | |
Net assets, end of year (000’s omitted) | | $ | 14,290 | | | $ | 17,216 | | | $ | 12,708 | | | $ | 8,415 | | | $ | 8,358 | |
| | | | | |
Ratios (as a percentage of average daily net assets): | | | | | | | | | | | | | | | | | | | | |
| | | | | |
Expenses(2) | | | 0.40 | % | | | 0.40 | % | | | 0.40 | % | | | 0.40 | % | | | 0.40 | % |
| | | | | |
Net investment income | | | 1.94 | % | | | 2.10 | % | | | 2.73 | % | | | 2.85 | % | | | 2.65 | % |
| | | | | |
Portfolio Turnover | | | 24 | % | | | 62 | % | | | 33 | % | | | 44 | % | | | 53 | % |
| (1) | Returns are historical and are calculated by determining the percentage change in net asset value with all distributions reinvested. |
| (2) | The investment adviser and administrator and the sub-adviser reimbursed certain operating expenses (equal to 0.53%, 0.61%, 0.94%, 1.25% and 1.42% of average daily net assets for the years ended January 31, 2022, 2021, 2020, 2019 and 2018, respectively). Absent this reimbursement, total return would be lower. |
| | | | |
| | 28 | | See Notes to Financial Statements. |
Parametric
TABS Laddered Municipal Bond Funds
January 31, 2022
Notes to Financial Statements
1 Significant Accounting Policies
Eaton Vance Municipals Trust II (the Trust) is a Massachusetts business trust registered under the Investment Company Act of 1940, as amended (the 1940 Act), as an open-end management investment company. The Trust presently consists of six funds, two of which, each diversified, are included in these financial statements. They include Parametric TABS 1-to-10 Year Laddered Municipal Bond Fund (1-to-10 Year Laddered Fund) and Parametric TABS 10-to-20 Year Laddered Municipal Bond Fund (10-to-20 Year Laddered Fund) (each individually referred to as the Fund, and collectively, the Funds). The Funds’ investment objective is to provide current income exempt from regular federal income tax. The Funds offer three classes of shares. Class A shares are generally sold subject to a sales charge imposed at time of purchase. Class C shares are sold at net asset value and are generally subject to a contingent deferred sales charge (see Note 5). Effective January 25, 2019, Class C shares generally automatically convert to Class A shares ten years after their purchase and, effective November 5, 2020, automatically convert to Class A shares eight years after their purchase as described in the Funds’ prospectus. Class I shares are sold at net asset value and are not subject to a sales charge. Each class represents a pro-rata interest in the Fund, but votes separately on class-specific matters and (as noted below) is subject to different expenses. Realized and unrealized gains and losses are allocated daily to each class of shares based on the relative net assets of each class to the total net assets of the Fund. Net investment income, other than class-specific expenses, is allocated daily to each class of shares based upon the ratio of the value of each class’s paid shares to the total value of all paid shares. Each class of shares differs in its distribution plan and certain other class-specific expenses.
The following is a summary of significant accounting policies of the Funds. The policies are in conformity with accounting principles generally accepted in the United States of America (U.S. GAAP). Each Fund is an investment company and follows accounting and reporting guidance in the Financial Accounting Standards Board (FASB) Accounting Standards Codification Topic 946.
A Investment Valuation — The following methodologies are used to determine the market value or fair value of investments.
Debt Obligations. Debt obligations are generally valued on the basis of valuations provided by third party pricing services, as derived from such services’ pricing models. Inputs to the models may include, but are not limited to, reported trades, executable bid and ask prices, broker/dealer quotations, prices or yields of securities with similar characteristics, interest rates, anticipated prepayments, benchmark curves or information pertaining to the issuer, as well as industry and economic events. The pricing services may use a matrix approach, which considers information regarding securities with similar characteristics to determine the valuation for a security. Short-term debt obligations purchased with a remaining maturity of sixty days or less for which a valuation from a third party pricing service is not readily available may be valued at amortized cost, which approximates fair value.
Affiliated Fund. The Funds may invest in Eaton Vance Cash Reserves Fund, LLC (Cash Reserves Fund), an affiliated investment company managed by Eaton Vance Management (EVM). While Cash Reserves Fund is not a registered money market mutual fund, it conducts all of its investment activities in accordance with the requirements of Rule 2a-7 under the 1940 Act. Investments in Cash Reserves Fund are valued at the closing net asset value per unit on the valuation day. Cash Reserves Fund generally values its investment securities based on available market quotations provided by a third party pricing service.
Fair Valuation. Investments for which valuations or market quotations are not readily available or are deemed unreliable are valued at fair value using methods determined in good faith by or at the direction of the Trustees of a Fund in a manner that most fairly reflects the security’s “fair value”, which is the amount that a Fund might reasonably expect to receive for the security upon its current sale in the ordinary course. Each such determination is based on a consideration of relevant factors, which are likely to vary from one pricing context to another. These factors may include, but are not limited to, the type of security, the existence of any contractual restrictions on the security’s disposition, the price and extent of public trading in similar securities of the issuer or of comparable entities, quotations or relevant information obtained from broker/dealers or other market participants, information obtained from the issuer, analysts, and/or the appropriate stock exchange (for exchange-traded securities), an analysis of the entity’s financial statements, and an evaluation of the forces that influence the issuer and the market(s) in which the security is purchased and sold.
B Investment Transactions and Related Income — Investment transactions for financial statement purposes are accounted for on a trade date basis. Realized gains and losses on investments sold are determined on the basis of identified cost. Interest income is recorded on the basis of interest accrued, adjusted for amortization of premium or accretion of discount. Dividend income is recorded on the ex-dividend date for dividends received in cash and/or securities.
C Federal Taxes — Each Fund’s policy is to comply with the provisions of the Internal Revenue Code applicable to regulated investment companies and to distribute to shareholders each year substantially all of its taxable, if any, and tax-exempt net investment income, and all or substantially all of its net realized capital gains. Accordingly, no provision for federal income or excise tax is necessary. Each Fund intends to satisfy conditions which will enable it to designate distributions from the interest income generated by its investments in municipal obligations, which are exempt from regular federal income tax when received by each Fund, as exempt-interest dividends. The portion of such interest, if any, earned on private activity bonds issued after August 7, 1986, may be considered a tax preference item to shareholders.
As of January 31, 2022, the Funds had no uncertain tax positions that would require financial statement recognition, de-recognition, or disclosure. Each Fund files a U.S. federal income tax return annually after its fiscal year-end, which is subject to examination by the Internal Revenue Service for a period of three years from the date of filing.
D Expenses — The majority of expenses of the Trust are directly identifiable to an individual fund. Expenses which are not readily identifiable to a specific fund are allocated taking into consideration, among other things, the nature and type of expense and the relative size of the funds.
Parametric
TABS Laddered Municipal Bond Funds
January 31, 2022
Notes to Financial Statements — continued
E Legal Fees — Legal fees and other related expenses incurred as part of negotiations of the terms and requirement of capital infusions, or that are expected to result in the restructuring of, or a plan of reorganization for, an investment are recorded as realized losses. Ongoing expenditures to protect or enhance an investment are treated as operating expenses.
F Use of Estimates — The preparation of the financial statements in conformity with U.S. GAAP requires management to make estimates and assumptions that affect the reported amounts of assets and liabilities at the date of the financial statements and the reported amounts of income and expense during the reporting period. Actual results could differ from those estimates.
G Indemnifications — Under the Trust’s organizational documents, its officers and Trustees may be indemnified against certain liabilities and expenses arising out of the performance of their duties to the Funds. Under Massachusetts law, if certain conditions prevail, shareholders of a Massachusetts business trust (such as the Trust) could be deemed to have personal liability for the obligations of the Trust. However, the Trust’s Declaration of Trust contains an express disclaimer of liability on the part of Fund shareholders and the By-laws provide that the Trust shall assume, upon request by the shareholder, the defense on behalf of any Fund shareholders. Moreover, the By-laws also provide for indemnification out of Fund property of any shareholder held personally liable solely by reason of being or having been a shareholder for all loss or expense arising from such liability. Additionally, in the normal course of business, each Fund enters into agreements with service providers that may contain indemnification clauses. Each Fund’s maximum exposure under these arrangements is unknown as this would involve future claims that may be made against each Fund that have not yet occurred.
H When-Issued Securities and Delayed Delivery Transactions — The Funds may purchase securities on a delayed delivery or when-issued basis. Payment and delivery may take place after the customary settlement period for that security. At the time the transaction is negotiated, the price of the security that will be delivered is fixed. The Funds maintain cash and/or security positions for these commitments such that sufficient liquid assets will be available to make payments upon settlement. Securities purchased on a delayed delivery or when-issued basis are marked-to-market daily and begin earning interest on settlement date. Such security purchases are subject to the risk that when delivered they will be worth less than the agreed upon payment price. Losses may also arise if the counterparty does not perform under the contract.
2 Distributions to Shareholders and Income Tax Information
The net investment income of each Fund is determined daily and substantially all of the net investment income so determined is declared as a dividend to shareholders of record at the time of declaration. Distributions are declared separately for each class of shares. Distributions are paid monthly. Distributions of realized capital gains are made at least annually. Shareholders may reinvest income and capital gain distributions in additional shares of the same class of a Fund at the net asset value as of the reinvestment date or, at the election of the shareholder, receive distributions in cash. Distributions to shareholders are determined in accordance with income tax regulations, which may differ from U.S. GAAP. As required by U.S. GAAP, only distributions in excess of tax basis earnings and profits are reported in the financial statements as a return of capital. Permanent differences between book and tax accounting relating to distributions are reclassified to paid-in capital. For tax purposes, distributions from short-term capital gains are considered to be from ordinary income.
The tax character of distributions declared for the years ended January 31, 2022 and January 31, 2021 was as follows:
| | | | | | | | |
| | | Year Ended January 31, 2022 | |
| | | 1-to-10 Year
Laddered Fund | | | 10-to-20 Year
Laddered Fund | |
| | |
Tax-exempt income | | $ | 966,408 | | | $ | 387,220 | |
| | |
Ordinary income | | $ | 110,494 | | | $ | 116,103 | |
| | |
Long-term capital gains | | $ | 61,643 | | | $ | 81,840 | |
| |
| | | Year Ended January 31, 2021 | |
| | | 1-to-10 Year
Laddered Fund | | | 10-to-20 Year
Laddered Fund | |
| | |
Tax-exempt income | | $ | 988,634 | | | $ | 356,656 | |
| | |
Ordinary income | | $ | 37,263 | | | $ | 155,495 | |
| | |
Long-term capital gains | | $ | — | | | $ | 195,502 | |
Parametric
TABS Laddered Municipal Bond Funds
January 31, 2022
Notes to Financial Statements — continued
During the year ended January 31, 2022, the following amounts were reclassified due to the Funds’ use of equalization accounting. Tax equalization accounting allows the Funds to treat as a distribution that portion of redemption proceeds representing a redeeming shareholder’s portion of undistributed taxable income and net capital gains. These reclassifications had no effect on the net assets or net asset value per share of the Funds.
| | | | | | | | |
| | | 1-to-10 Year
Laddered Fund | | | 10-to-20 Year
Laddered Fund | |
|
Change in: | |
| | |
Paid-in capital | | $ | 32,998 | | | $ | 74,320 | |
| | |
Distributable earnings | | $ | (32,998 | ) | | $ | (74,320 | ) |
As of January 31, 2022, the components of distributable earnings (accumulated loss) on a tax basis were as follows:
| | | | | | | | |
| | | 1-to-10 Year
Laddered Fund | | | 10-to-20 Year
Laddered Fund | |
| | |
Undistributed tax-exempt income | | $ | 15,551 | | | $ | 8,363 | |
| | |
Undistributed ordinary income | | | 16,687 | | | | 675 | |
| | |
Undistributed long-term capital gains | | | 30,809 | | | | 761 | |
| | |
Net unrealized appreciation | | | 1,216,617 | | | | 596,492 | |
| | |
Distributions payable | | | (207 | ) | | | — | |
| | |
Distributable earnings | | $ | 1,279,457 | | | $ | 606,291 | |
The cost and unrealized appreciation (depreciation) of investments of each Fund at January 31, 2022, as determined on a federal income tax basis, were as follows:
| | | | | | | | |
| | | 1-to-10 Year
Laddered Fund | | | 10-to-20 Year
Laddered Fund | |
| | |
Aggregate cost | | $ | 99,910,182 | | | $ | 20,048,946 | |
| | |
Gross unrealized appreciation | | $ | 2,181,946 | | | $ | 724,580 | |
| | |
Gross unrealized depreciation | | | (965,329 | ) | | | (128,088 | ) |
| | |
Net unrealized appreciation | | $ | 1,216,617 | | | $ | 596,492 | |
3 Investment Adviser and Administration Fee and Other Transactions with Affiliates
The investment adviser and administration fee is earned by EVM as compensation for investment advisory and administrative services rendered to each Fund. On March 1, 2021, Morgan Stanley acquired Eaton Vance Corp. (the “Transaction”) and EVM became an indirect, wholly-owned subsidiary of Morgan Stanley. In connection with the Transaction, each Fund entered into a new investment advisory and administrative agreement (the “New Agreement”) with EVM, which took effect on March 1, 2021. Pursuant to each Fund’s New Agreement (and each Fund’s investment advisory and administrative agreement with EVM in effect prior to March 1, 2021), the fee is computed at an annual rate as a percentage of average daily net assets as follows and is payable monthly:
| | | | | | | | |
| | | Annual Fee Rate | |
| Average Daily Net Assets | | 1-to-10 Year
Laddered Fund | | | 10-to-20 Year
Laddered Fund | |
| | |
Up to $1 billion | | | 0.3200 | % | | | 0.3200 | % |
| | |
$1 billion but less than $2.5 billion | | | 0.3075 | % | | | 0.3075 | % |
| | |
$2.5 billion but less than $5 billion | | | 0.2950 | % | | | 0.2950 | % |
| | |
$5 billion and over | | | 0.2875 | % | | | 0.2875 | % |
Parametric
TABS Laddered Municipal Bond Funds
January 31, 2022
Notes to Financial Statements — continued
The Funds may invest their cash in Cash Reserves Fund. EVM does not currently receive a fee for advisory services provided to Cash Reserves Fund. For the year ended January 31, 2022, investment adviser and administration fees incurred by the Funds and the effective annual rates, as a percentage of average daily net assets, were as follows:
| | | | | | | | |
| | | 1-to-10 Year
Laddered Fund | | | 10-to-20 Year
Laddered Fund | |
| | |
Investment Adviser and Administration Fee | | $ | 289,839 | | | $ | 67,511 | |
| | |
Effective Annual Rate | | | 0.32 | % | | | 0.32 | % |
Pursuant to an investment sub-advisory agreement, EVM has delegated the investment management of each Fund to Parametric Portfolio Associates LLC (Parametric), an affiliate of EVM and, effective March 1, 2021, an indirect, wholly-owned subsidiary of Morgan Stanley. In connection with the Transaction, EVM entered into a new investment sub-advisory agreement with Parametric, which took effect on March 1, 2021. EVM pays Parametric a portion of its investment adviser and administration fee for sub-advisory services provided to the Funds. EVM and Parametric have agreed to reimburse each Fund’s expenses to the extent that total annual operating expenses (relating to ordinary operating expenses only and excluding such expenses as borrowing costs, taxes or litigation expenses) exceed 0.65%, 1.40% and 0.40% of each Fund’s average daily net assets for Class A, Class C and Class I, respectively. These agreements may be changed or terminated after May 31, 2022. Pursuant to these agreements, EVM and Parametric were allocated $113,981 and $111,643 in total of operating expenses of 1-to-10 Year Laddered Fund and 10-to-20 Year Laddered Fund, respectively, for the year ended January 31, 2022.
EVM provides sub-transfer agency and related services to the Funds pursuant to a Sub-Transfer Agency Support Services Agreement. Eaton Vance Distributors, Inc. (EVD), an affiliate of EVM and the Funds’ principal underwriter, received a portion of the sales charge on sales of Class A shares of the Funds. EVD also received distribution and service fees from Class A and Class C shares (see Note 4) and contingent deferred sales charges (see Note 5). Sub-transfer agent fees earned by EVM, which are included in transfer and dividend disbursing agent fees on the Statements of Operations, and Class A sales charges that the Funds were informed were received by EVD for the year ended January 31, 2022 were as follows:
| | | | | | | | |
| | | 1-to-10 Year
Laddered Fund | | | 10-to-20 Year
Laddered Fund | |
| | |
EVM’s Sub-Transfer Agent Fees | | $ | 2,298 | | | $ | 1,120 | |
| | |
EVD’s Class A Sales Charges | | $ | 1,024 | | | $ | 857 | |
Trustees and officers of the Funds who are members of EVM’s organization receive remuneration for their services to the Funds out of the investment adviser and administration fee. Trustees of the Funds who are not affiliated with EVM may elect to defer receipt of all or a percentage of their annual fees in accordance with the terms of the Trustees Deferred Compensation Plan. For the year ended January 31, 2022, no significant amounts have been deferred. Certain officers and Trustees of the Funds are officers of EVM.
4 Distribution Plans
Each Fund has in effect a distribution plan for Class A shares (Class A Plan) pursuant to Rule 12b-1 under the 1940 Act. Pursuant to the Class A Plan, each Fund pays EVD a distribution and service fee of 0.25% per annum of its average daily net assets attributable to Class A shares for distribution services and facilities provided to each Fund by EVD, as well as for personal services and/or the maintenance of shareholder accounts. Distribution and service fees paid or accrued to EVD for the year ended January 31, 2022 for Class A shares amounted to the following:
| | | | | | | | |
| | | 1-to-10 Year
Laddered Fund | | | 10-to-20 Year
Laddered Fund | |
| | |
Class A Distribution and Service Fees | | $ | 39,940 | | | $ | 14,583 | |
Parametric
TABS Laddered Municipal Bond Funds
January 31, 2022
Notes to Financial Statements — continued
Each Fund also has in effect a distribution plan for Class C shares (Class C Plan) pursuant to Rule 12b-1 under the 1940 Act. Pursuant to the Class C Plan, each Fund pays EVD amounts equal to 0.75% per annum of its average daily net assets attributable to Class C shares for providing ongoing distribution services and facilities to the respective Fund. For the year ended January 31, 2022, the Funds paid or accrued to EVD the following distribution fees:
| | | | | | | | |
| | | 1-to-10 Year
Laddered Fund | | | 10-to-20 Year
Laddered Fund | |
| | |
Class C Distribution Fees | | $ | 29,668 | | | $ | 4,534 | |
Pursuant to the Class C Plan, the Funds also make payments of service fees to EVD, financial intermediaries and other persons in amounts equal to 0.25% per annum of the average daily net assets attributable to Class C shares. Service fees paid or accrued are for personal services and/or the maintenance of shareholder accounts. They are separate and distinct from the sales commissions and distribution fees payable to EVD. Service fees paid or accrued for the year ended January 31, 2022 amounted to the following:
| | | | | | | | |
| | | 1-to-10 Year
Laddered Fund | | | 10-to-20 Year
Laddered Fund | |
| | |
Class C Service Fees | | $ | 9,889 | | | $ | 1,511 | |
Distribution and service fees are subject to the limitations contained in the Financial Industry Regulatory Authority Rule 2341(d).
5 Contingent Deferred Sales Charges
A contingent deferred sales charge (CDSC) of 1% generally is imposed on redemptions of Class C shares made within 12 months of purchase. Class A shares may be subject to a 1% CDSC if redeemed within 18 months of purchase (depending on the circumstances of purchase). Generally, the CDSC is based upon the lower of the net asset value at date of redemption or date of purchase. No charge is levied on shares acquired by reinvestment of dividends or capital gain distributions. For the year ended January 31, 2022, the Funds were informed that EVD received approximately the following amounts of CDSCs paid by Class A and Class C shareholders:
| | | | | | | | |
| | | 1-to-10 Year
Laddered Fund | | | 10-to-20 Year
Laddered Fund | |
| | |
Class A | | $ | 300 | | | $ | — | |
| | |
Class C | | $ | 500 | | | $ | — | |
6 Purchases and Sales of Investments
Purchases and sales of investments, other than short-term obligations, for the year ended January 31, 2022 were as follows:
| | | | | | | | |
| | | 1-to-10 Year
Laddered Fund | | | 10-to-20 Year
Laddered Fund | |
| | |
Purchases | | $ | 42,267,742 | | | $ | 4,744,196 | |
| | |
Sales | | $ | 27,989,568 | | | $ | 5,255,064 | |
Parametric
TABS Laddered Municipal Bond Funds
January 31, 2022
Notes to Financial Statements — continued
7 Shares of Beneficial Interest
Each Fund’s Declaration of Trust permits the Trustees to issue an unlimited number of full and fractional shares of beneficial interest (without par value). Such shares may be issued in a number of different series (such as the Funds) and classes. Transactions in Fund shares were as follows:
| | | | | | | | | | | | |
1-to-10 Year Laddered Fund | | | | | | | | | |
| | | Year Ended January 31, 2022 | |
| | | Class A | | | Class C | | | Class I | |
| | | |
Sales | | | 556,525 | | | | 33,698 | | | | 3,090,695 | |
| | | |
Issued to shareholders electing to receive payments of distributions in Fund shares | | | 15,497 | | | | 1,221 | | | | 87,577 | |
| | | |
Redemptions | | | (1,294,640 | ) | | | (61,857 | ) | | | (2,122,112 | ) |
| | | |
Net increase (decrease) | | | (722,618 | ) | | | (26,938 | ) | | | 1,056,160 | |
| |
| | | Year Ended January 31, 2021 | |
| | | Class A | | | Class C | | | Class I | |
| | | |
Sales | | | 692,277 | | | | 66,880 | | | | 3,308,389 | |
| | | |
Issued to shareholders electing to receive payments of distributions in Fund shares | | | 22,188 | | | | 1,789 | | | | 70,658 | |
| | | |
Redemptions | | | (502,737 | ) | | | (64,096 | ) | | | (1,815,567 | ) |
| | | |
Converted from Class C shares | | | 4,304 | | | | — | | | | — | |
| | | |
Converted to Class A shares | | | — | | | | (4,304 | ) | | | — | |
| | | |
Net increase | | | 216,032 | | | | 269 | | | | 1,563,480 | |
| | | |
10-to-20 Year Laddered Fund | | | | | | | | | |
| | | Year Ended January 31, 2022 | |
| | | Class A | | | Class C | | | Class I | |
| | | |
Sales | | | 182,612 | | | | 15,466 | | | | 712,417 | |
| | | |
Issued to shareholders electing to receive payments of distributions in Fund shares | | | 13,227 | | | | 1,038 | | | | 35,986 | |
| | | |
Redemptions | | | (154,396 | ) | | | (18,628 | ) | | | (943,932 | ) |
| | | |
Net increase (decrease) | | | 41,443 | | | | (2,124 | ) | | | (195,529 | ) |
| |
| | | Year Ended January 31, 2021 | |
| | | Class A | | | Class C | | | Class I | |
| | | |
Sales | | | 346,372 | | | | 10,766 | | | | 1,190,190 | |
| | | |
Issued to shareholders electing to receive payments of distributions in Fund shares | | | 10,273 | | | | 1,187 | | | | 50,091 | |
| | | |
Redemptions | | | (25,542 | ) | | | (13,130 | ) | | | (886,249 | ) |
| | | |
Net increase (decrease) | | | 331,103 | | | | (1,177 | ) | | | 354,032 | |
8 Line of Credit
The Funds participate with other portfolios and funds managed by EVM and its affiliates in an $800 million unsecured line of credit agreement with a group of banks, which is in effect through October 25, 2022. Borrowings are made by the Funds solely for temporary purposes related to redemptions and other short-term cash needs. Interest is charged to each Fund based on its borrowings at an amount above either the Secured Overnight Financing Rate (SOFR) or Federal Funds rate. In addition, a fee computed at an annual rate of 0.15% on the daily unused portion of the line of credit is allocated among
Parametric
TABS Laddered Municipal Bond Funds
January 31, 2022
Notes to Financial Statements — continued
the participating portfolios and funds at the end of each quarter. In connection with the renewal of the agreement in October 2021, an arrangement fee totaling $150,000 was incurred that was allocated to the participating portfolios and funds. Because the line of credit is not available exclusively to the Funds, a Fund may be unable to borrow some or all of its requested amounts at any particular time. The Funds did not have any significant borrowings or allocated fees during the year ended January 31, 2022.
9 Investments in Affiliated Funds
At January 31, 2022, the value of investments in affiliated funds was $9,633,863 for 1-to-10 Year Laddered Fund, representing 10.3% of its net assets and $1,399,552 for 10-to-20 Year Laddered Fund, representing 7.0% of its net assets. Transactions in affiliated funds by the Funds for the year ended January 31, 2022 were as follows:
| | | | | | | | | | | | | | | | | | | | | | | | | | | | | | | | |
1-to-10 Year Laddered Fund | | | | | | | | | | | | | | | | | | | |
| Name | | Value,
beginning of
period | | | Purchases | | | Sales
proceeds | | | Net
realized
gain (loss) | | | Change in
unrealized
appreciation
(depreciation) | | | Value, end
of period | | | Dividend
income | | | Units, end
of period | |
|
Short-Term Investments | |
| | | | | | | | |
Eaton Vance Cash Reserves Fund, LLC | | $ | 15,536,959 | | | $ | 51,908,950 | | | $ | (57,811,160 | ) | | $ | (885 | ) | | $ | (1 | ) | | $ | 9,633,863 | | | $ | 8,747 | | | | 9,634,827 | |
| | | | | | | | | | | | | | | | | | | | | | | | | | | | | | | | |
10-to-20 Year Laddered Fund | | | | | | | | | | | | | | | | | | | |
| Name | | Value,
beginning of
period | | | Purchases | | | Sales
proceeds | | | Net
realized
gain (loss) | | | Change in
unrealized
appreciation
(depreciation) | | | Value, end
of period | | | Dividend
income | | | Units, end
of period | |
|
Short-Term Investments | |
| | | | | | | | |
Eaton Vance Cash Reserves Fund, LLC | | $ | 1,767,705 | | | $ | 12,084,665 | | | $ | (12,452,765 | ) | | $ | (53 | ) | | $ | — | | | $ | 1,399,552 | | | $ | 1,127 | | | | 1,399,692 | |
10 Fair Value Measurements
Under generally accepted accounting principles for fair value measurements, a three-tier hierarchy to prioritize the assumptions, referred to as inputs, is used in valuation techniques to measure fair value. The three-tier hierarchy of inputs is summarized in the three broad levels listed below.
| • | | Level 1 – quoted prices in active markets for identical investments |
| • | | Level 2 – other significant observable inputs (including quoted prices for similar investments, interest rates, prepayment speeds, credit risk, etc.) |
| • | | Level 3 – significant unobservable inputs (including a fund’s own assumptions in determining the fair value of investments) |
In cases where the inputs used to measure fair value fall in different levels of the fair value hierarchy, the level disclosed is determined based on the lowest level input that is significant to the fair value measurement in its entirety. The inputs or methodology used for valuing securities are not necessarily an indication of the risk associated with investing in those securities.
At January 31, 2022, the hierarchy of inputs used in valuing the Funds’ investments, which are carried at value, were as follows:
1-to-10 Year Laddered Fund
| | | | | | | | | | | | | | | | |
| Asset Description | | Level 1 | | | Level 2 | | | Level 3 | | | Total | |
| | | | |
Tax-Exempt Municipal Obligations | | $ | — | | | $ | 91,492,936 | | | $ | — | | | $ | 91,492,936 | |
| | | | |
Short-Term Investments | | | — | | | | 9,633,863 | | | | — | | | | 9,633,863 | |
| | | | |
Total Investments | | $ | — | | | $ | 101,126,799 | | | $ | — | | | $ | 101,126,799 | |
Parametric
TABS Laddered Municipal Bond Funds
January 31, 2022
Notes to Financial Statements — continued
| | | | | | | | | | | | | | | | |
10-to-20 Year Laddered Fund | | | | | | | | | | | | |
| Asset Description | | Level 1 | | | Level 2 | | | Level 3 | | | Total | |
| | | | |
Tax-Exempt Municipal Obligations | | $ | — | | | $ | 19,245,886 | | | $ | — | | | $ | 19,245,886 | |
| | | | |
Short-Term Investments | | | — | | | | 1,399,552 | | | | — | | | | 1,399,552 | |
| | | | |
Total Investments | | $ | — | | | $ | 20,645,438 | | | $ | — | | | $ | 20,645,438 | |
11 Risks and Uncertainties
Pandemic Risk
An outbreak of respiratory disease caused by a novel coronavirus was first detected in China in late 2019 and subsequently spread internationally. This coronavirus has resulted in closing borders, enhanced health screenings, changes to healthcare service preparation and delivery, quarantines, cancellations, disruptions to supply chains and customer activity, as well as general concern and uncertainty. Health crises caused by outbreaks, such as the coronavirus outbreak, may exacerbate other pre-existing political, social and economic risks and disrupt normal market conditions and operations. The impact of this outbreak has negatively affected the worldwide economy, the economies of individual countries, individual companies, and the market in general, and may continue to do so in significant and unforeseen ways, as may other epidemics and pandemics that may arise in the future. Any such impact could adversely affect the Funds’ performance, or the performance of the securities in which the Funds invest.
Parametric
TABS Laddered Municipal Bond Funds
January 31, 2022
Report of Independent Registered Public Accounting Firm
To the Trustees of Eaton Vance Municipals Trust II and Shareholders of Parametric TABS 1-to-10 Year Laddered Municipal Bond Fund and Parametric TABS 10-to-20 Year Laddered Municipal Bond Fund:
Opinion on the Financial Statements and Financial Highlights
We have audited the accompanying statements of assets and liabilities of Parametric TABS 1-to-10 Year Laddered Municipal Bond Fund and Parametric TABS 10-to-20 Year Laddered Municipal Bond Fund (collectively, the “Funds”) (certain of the funds constituting Eaton Vance Municipals Trust II), including the portfolios of investments, as of January 31, 2022, the related statements of operations for the year then ended, the statements of changes in net assets for each of the two years in the period then ended, the financial highlights for each of the five years in the period then ended, and the related notes. In our opinion, the financial statements and financial highlights present fairly, in all material respects, the financial position of the Funds as of January 31, 2022, and the results of their operations for the year then ended, the changes in their net assets for each of the two years in the period then ended, and the financial highlights for each of the five years in the period then ended, in conformity with accounting principles generally accepted in the United States of America.
Basis for Opinion
These financial statements and financial highlights are the responsibility of the Funds’ management. Our responsibility is to express an opinion on the Funds’ financial statements and financial highlights based on our audits. We are a public accounting firm registered with the Public Company Accounting Oversight Board (United States) (PCAOB) and are required to be independent with respect to the Funds in accordance with the U.S. federal securities laws and the applicable rules and regulations of the Securities and Exchange Commission and the PCAOB.
We conducted our audits in accordance with the standards of the PCAOB. Those standards require that we plan and perform the audits to obtain reasonable assurance about whether the financial statements and financial highlights are free of material misstatement, whether due to error or fraud. The Funds are not required to have, nor were we engaged to perform, an audit of their internal control over financial reporting. As part of our audits, we are required to obtain an understanding of internal control over financial reporting but not for the purpose of expressing an opinion on the effectiveness of the Funds’ internal control over financial reporting. Accordingly, we express no such opinion.
Our audits included performing procedures to assess the risks of material misstatement of the financial statements and financial highlights, whether due to error or fraud, and performing procedures that respond to those risks. Such procedures included examining, on a test basis, evidence regarding the amounts and disclosures in the financial statements and financial highlights. Our audits also included evaluating the accounting principles used and significant estimates made by management, as well as evaluating the overall presentation of the financial statements and financial highlights. Our procedures included confirmation of securities owned as of January 31, 2022, by correspondence with the custodian and brokers; when replies were not received from brokers, we performed other auditing procedures. We believe that our audits provide a reasonable basis for our opinion.
/s/ Deloitte & Touche LLP
Boston, Massachusetts
March 23, 2022
We have served as the auditor of one or more Eaton Vance investment companies since 1959.
Parametric
TABS Laddered Municipal Bond Funds
January 31, 2022
Federal Tax Information (Unaudited)
The Form 1099-DIV you receive in February 2023 will show the tax status of all distributions paid to your account in calendar year 2022. Shareholders are advised to consult their own tax adviser with respect to the tax consequences of their investment in the Funds. As required by the Internal Revenue Code and/or regulations, shareholders must be notified regarding exempt-interest dividends and capital gains dividends.
Exempt-Interest Dividends. For the fiscal year ended January 31, 2022, the Funds designate the following percentages of distributions from net investment income as exempt-interest dividends:
| | | | |
| |
TABS 1-to-10 Year Laddered Municipal Bond Fund | | | 89.74 | % |
| |
TABS 10-to-20 Year Laddered Municipal Bond Fund | | | 76.93 | % |
Capital Gains Dividends. The Funds hereby designate as a capital gain dividend with respect to the taxable year ended January 31, 2022, the following amounts or, if subsequently determined to be different, the net capital gain of such year:
| | | | |
| |
TABS 1-to-10 Year Laddered Municipal Bond Fund | | $ | 113,213 | |
| |
TABS 10-to-20 Year Laddered Municipal Bond Fund | | $ | 74,014 | |
Parametric
TABS Laddered Municipal Bond Funds
January 31, 2022
Management and Organization
Fund Management. The Trustees of Eaton Vance Municipals Trust II (the Trust) are responsible for the overall management and supervision of the Trust’s affairs. The Board members and officers of the Trust are listed below. Except as indicated, each individual has held the office shown or other offices in the same company for the last five years. Board members hold indefinite terms of office. Each Trustee holds office until his or her successor is elected and qualified, subject to a prior death, resignation, retirement, disqualification or removal. Under the terms of each Fund’s current Trustee retirement policy, an Independent Trustee must retire and resign as a Trustee on the earlier of: (i) the first day of July following his or her 74th birthday; or (ii), with limited exception, December 31st of the 20th year in which he or she has served as a Trustee. However, if such retirement and resignation would cause the Fund to be out of compliance with Section 16 of the 1940 Act or any other regulations or guidance of the SEC, then such retirement and resignation will not become effective until such time as action has been taken for each Fund to be in compliance therewith. The “noninterested Trustees” consist of those Trustees who are not “interested persons” of the Trust, as that term is defined under the 1940 Act. The business address of each Board member and officer is Two International Place, Boston, Massachusetts 02110. As used below, “BMR” refers to Boston Management and Research, “EVC” refers to Eaton Vance Corp., “EV” refers to EV LLC, “EVM” refers to Eaton Vance Management and “EVD” refers to Eaton Vance Distributors, Inc. EV is the trustee of each of EVM and BMR. Effective March 1, 2021, each of EVM, BMR, EVD and EV are indirect, wholly-owned subsidiaries of Morgan Stanley. Each officer affiliated with EVM may hold a position with other EVM affiliates that is comparable to his or her position with EVM listed below. Each Trustee oversees 138 funds (with the exception of Messrs. Faust and Wennerholm and Ms. Frost who oversee 137 funds) in the Eaton Vance fund complex (including both funds and portfolios in a hub and spoke structure).
| | | | | | |
| Name and Year of Birth | | Trust
Position(s) | | Length of Service | | Principal Occupation(s) and Other Directorships During Past Five Years and Other Relevant Experience |
|
| Interested Trustee |
| | | |
Thomas E. Faust Jr. 1958 | | Trustee | | Since 2007 | | Chairman of Morgan Stanley Investment Management, Inc. (MSIM), member of the Board of Managers and President of EV, Chief Executive Officer of EVM and BMR, and Director of EVD. Formerly, Chairman, Chief Executive Officer and President of EVC. Mr. Faust is an interested person because of his positions with MSIM, BMR, EVM, EVD, and EV, which are affiliates of the Trust, and his former position with EVC, which was an affiliate of the Trust prior to March 1, 2021. Other Directorships. Formerly, Director of EVC (2007-2021) and Hexavest Inc. (investment management firm) (2012-2021). |
|
| Noninterested Trustees |
| | | |
Mark R. Fetting 1954 | | Trustee | | Since 2016 | | Private investor. Formerly held various positions at Legg Mason, Inc. (investment management firm) (2000-2012), including President, Chief Executive Officer, Director and Chairman (2008-2012), Senior Executive Vice President (2004-2008) and Executive Vice President (2001-2004). Formerly, President of Legg Mason family of funds (2001-2008). Formerly, Division President and Senior Officer of Prudential Financial Group, Inc. and related companies (investment management firm) (1991-2000). Other Directorships. None. |
| | | |
Cynthia E. Frost 1961 | | Trustee | | Since 2014 | | Private investor. Formerly, Chief Investment Officer of Brown University (university endowment) (2000-2012). Formerly, Portfolio Strategist for Duke Management Company (university endowment manager) (1995-2000). Formerly, Managing Director, Cambridge Associates (investment consulting company) (1989-1995). Formerly, Consultant, Bain and Company (management consulting firm) (1987-1989). Formerly, Senior Equity Analyst, BA Investment Management Company (1983-1985). Other Directorships. None. |
| | | |
George J. Gorman 1952 | | Chairperson
of the Board and Trustee | | Since 2021 (Chairperson) and 2014 (Trustee) | | Principal at George J. Gorman LLC (consulting firm). Formerly, Senior Partner at Ernst & Young LLP (a registered public accounting firm) (1974-2009). Other Directorships. None. |
| | | |
Valerie A. Mosley 1960 | | Trustee | | Since 2014 | | Chairwoman and Chief Executive Officer of Valmo Ventures (a consulting and investment firm). Founder of Upward Wealth, Inc., dba BrightUP, a fintech platform. Formerly, Partner and Senior Vice President, Portfolio Manager and Investment Strategist at Wellington Management Company, LLP (investment management firm) (1992-2012). Formerly, Chief Investment Officer, PG Corbin Asset Management (1990-1992). Formerly worked in institutional corporate bond sales at Kidder Peabody (1986-1990). Other Directorships. Director of DraftKings, Inc. (digital sports entertainment and gaming company) (since September 2020). Director of Groupon, Inc. (e-commerce provider) (since April 2020). Director of Envestnet, Inc. (provider of intelligent systems for wealth management and financial wellness) (since 2018). Formerly, Director of Dynex Capital, Inc. (mortgage REIT) (2013-2020). |
Parametric
TABS Laddered Municipal Bond Funds
January 31, 2022
Management and Organization — continued
| | | | | | |
| Name and Year of Birth | | Trust
Position(s) | | Length of Service | | Principal Occupation(s) and Other Directorships During Past Five Years and Other Relevant Experience |
|
| Noninterested Trustees (continued) |
| | | |
William H. Park 1947 | | Trustee | | Since 2003 | | Private investor. Formerly, Consultant (management and transactional) (2012-2014). Formerly, Chief Financial Officer, Aveon Group L.P. (investment management firm) (2010-2011). Formerly, Vice Chairman, Commercial Industrial Finance Corp. (specialty finance company) (2006-2010). Formerly, President and Chief Executive Officer, Prizm Capital Management, LLC (investment management firm) (2002-2005). Formerly, Executive Vice President and Chief Financial Officer, United Asset Management Corporation (investment management firm) (1982-2001). Formerly, Senior Manager, Price Waterhouse (now PricewaterhouseCoopers) (a registered public accounting firm) (1972-1981). Other Directorships. None. |
| | | |
Helen Frame Peters 1948 | | Trustee | | Since 2008 | | Professor of Finance, Carroll School of Management, Boston College. Formerly, Dean, Carroll School of Management, Boston College (2000-2002). Formerly, Chief Investment Officer, Fixed Income, Scudder Kemper Investments (investment management firm) (1998-1999). Formerly, Chief Investment Officer, Equity and Fixed Income, Colonial Management Associates (investment management firm) (1991-1998). Other Directorships. None. |
| | | |
Keith Quinton 1958 | | Trustee | | Since 2018 | | Private investor, researcher and lecturer. Formerly, Independent Investment Committee Member at New Hampshire Retirement System (2017-2021). Formerly, Portfolio Manager and Senior Quantitative Analyst at Fidelity Investments (investment management firm) (2001-2014). Other Directorships. Formerly, Director (2016-2021) and Chairman (2019-2021) of New Hampshire Municipal Bond Bank. |
| | | |
Marcus L. Smith 1966 | | Trustee | | Since 2018 | | Private investor and independent corporate director. Formerly, Chief Investment Officer, Canada (2012-2017), Chief Investment Officer, Asia (2010-2012), Director of Asian Research (2004-2010) and portfolio manager (2001-2017) at MFS Investment Management (investment management firm). Other Directorships. Director of First Industrial Realty Trust, Inc. (an industrial REIT) (since 2021). Director of MSCI Inc. (global provider of investment decision support tools) (since 2017). Formerly, Director of DCT Industrial Trust Inc. (logistics real estate company) (2017-2018). |
| | | |
Susan J. Sutherland 1957 | | Trustee | | Since 2015 | | Private investor. Director of Ascot Group Limited and certain of its subsidiaries (insurance and reinsurance) (since 2017). Formerly, Director of Hagerty Holding Corp. (insurance) (2015-2018) and Montpelier Re Holdings Ltd. (insurance and reinsurance) (2013-2015). Formerly, Associate, Counsel and Partner at Skadden, Arps, Slate, Meagher & Flom LLP (law firm) (1982-2013). Other Directorships. Director of Kairos Acquisition Corp. (insurance/InsurTech acquisition company) (since 2021). |
| | | |
Scott E. Wennerholm 1959 | | Trustee | | Since 2016 | | Private investor. Formerly, Trustee at Wheelock College (postsecondary institution) (2012-2018). Formerly, Consultant at GF Parish Group (executive recruiting firm) (2016-2017). Formerly, Chief Operating Officer and Executive Vice President at BNY Mellon Asset Management (investment management firm) (2005-2011). Formerly, Chief Operating Officer and Chief Financial Officer at Natixis Global Asset Management (investment management firm) (1997-2004). Formerly, Vice President at Fidelity Investments Institutional Services (investment management firm) (1994-1997). Other Directorships. None. |
| | | | | | |
| Name and Year of Birth | | Trust
Position(s) | | Length of Service | | Principal Occupation(s) During Past Five Years |
|
| Principal Officers who are not Trustees |
| | | |
Eric A. Stein 1980 | | President | | Since 2020 | | Vice President and Chief Investment Officer, Fixed Income of EVM and BMR. Prior to November 1, 2020, Mr. Stein was a co-Director of Eaton Vance’s Global Income Investments. Also Vice President of Calvert Research and Management (“CRM”). |
Parametric
TABS Laddered Municipal Bond Funds
January 31, 2022
Management and Organization — continued
| | | | | | |
| Name and Year of Birth | | Trust
Position(s) | | Length of Service | | Principal Occupation(s) During Past Five Years |
|
| Principal Officers who are not Trustees (continued) |
| | | |
Deidre E. Walsh 1971 | | Vice President and Chief Legal Officer | | Since 2009 | | Vice President of EVM and BMR. Also Vice President of CRM. |
| | | |
James F. Kirchner 1967 | | Treasurer | | Since 2007 | | Vice President of EVM and BMR. Also Vice President of CRM. |
| | | |
Jill R. Damon 1984 | | Secretary | | Since 2022 | | Vice President of EVM and BMR since 2017. Formerly, associate at Dechert LLP (2009-2017). |
| | | |
Richard F. Froio 1968 | | Chief Compliance Officer | | Since 2017 | | Vice President of EVM and BMR since 2017. Formerly, Deputy Chief Compliance Officer (Adviser/Funds) and Chief Compliance Officer (Distribution) at PIMCO (2012-2017) and Managing Director at BlackRock/Barclays Global Investors (2009-2012). |
The SAI for each Fund includes additional information about the Trustees and officers of the Trust and can be obtained without charge on Eaton Vance’s website at www.eatonvance.com or by calling 1-800-260-0761.
Eaton Vance Funds
| | |
| Privacy Notice | | April 2021 |
| | |
| |
| FACTS | | WHAT DOES EATON VANCE DO WITH YOUR
PERSONAL INFORMATION? |
| | | |
| |
| | |
| Why? | | Financial companies choose how they share your personal information. Federal law gives consumers the right to limit some but not all sharing. Federal law also requires us to tell you how we collect, share, and protect your personal information. Please read this notice carefully to understand what we do. |
| | |
| | | |
| What? | | The types of personal information we collect and share depend on the product or service you have with us. This information can include: ∎ Social Security number and income ∎ investment experience and risk tolerance ∎ checking account number and wire transfer instructions |
| | |
| | | |
| How? | | All financial companies need to share customers’ personal information to run their everyday business. In the section below, we list the reasons financial companies can share their customers’ personal information; the reasons Eaton Vance chooses to share; and whether you can limit this sharing. |
| | |
| | | |
| | | | |
Reasons we can share your
personal information | | Does Eaton Vance share? | | Can you limit this sharing? |
| For our everyday business purposes — such as to process your transactions, maintain your account(s), respond to court orders and legal investigations, or report to credit bureaus | | Yes | | No |
| For our marketing purposes — to offer our products and services to you | | Yes | | No |
| For joint marketing with other financial companies | | No | | We don’t share |
| For our investment management affiliates’ everyday business purposes — information about your transactions, experiences, and creditworthiness | | Yes | | Yes |
| For our affiliates’ everyday business purposes — information about your transactions and experiences | | Yes | | No |
| For our affiliates’ everyday business purposes — information about your creditworthiness | | No | | We don’t share |
| For our investment management affiliates to market to you | | Yes | | Yes |
| For our affiliates to market to you | | No | | We don’t share |
| For nonaffiliates to market to you | | No | | We don’t share |
| | |
| To limit our sharing | | Call toll-free 1-800-262-1122 or email: EVPrivacy@eatonvance.com Please note: If you are a new customer, we can begin sharing your information 30 days from the date we sent this notice. When you are no longer our customer, we continue to share your information as described in this notice. However, you can contact us at any time to limit our sharing. |
| | |
| | | |
| | |
| Questions? | | Call toll-free 1-800-262-1122 or email: EVPrivacy@eatonvance.com |
| | |
| | | |
Eaton Vance Funds
| | |
| Privacy Notice — continued | | April 2021 |
| | |
| Who we are |
| Who is providing this notice? | | Eaton Vance Management, Eaton Vance Distributors, Inc., Eaton Vance Trust Company, Eaton Vance Management (International) Limited, Eaton Vance Advisers International Ltd., Eaton Vance Global Advisors Limited, Eaton Vance Management’s Real Estate Investment Group, Boston Management and Research, Calvert Research and Management, Eaton Vance and Calvert Fund Families and our investment advisory affiliates (“Eaton Vance”) (see Investment Management Affiliates definition below) |
| What we do |
| How does Eaton Vance protect my personal information? | | To protect your personal information from unauthorized access and use, we use security measures that comply with federal law. These measures include computer safeguards and secured files and buildings. We have policies governing the proper handling of customer information by personnel and requiring third parties that provide support to adhere to appropriate security standards with respect to such information. |
| How does Eaton Vance collect my personal information? | | We collect your personal information, for example, when you ∎ open an account or make deposits or withdrawals from your account ∎ buy securities from us or make a wire transfer ∎ give us your contact information We also collect your personal information from others, such as credit bureaus, affiliates, or other companies. |
| Why can’t I limit all sharing? | | Federal law gives you the right to limit only ∎ sharing for affiliates’ everyday business purposes — information about your creditworthiness ∎ affiliates from using your information to market to you ∎ sharing for nonaffiliates to market to you State laws and individual companies may give you additional rights to limit sharing. See below for more on your rights under state law. |
| Definitions |
| Investment Management Affiliates | | Eaton Vance Investment Management Affiliates include registered investment advisers, registered broker-dealers, and registered and unregistered funds. Investment Management Affiliates does not include entities associated with Morgan Stanley Wealth Management, such as Morgan Stanley Smith Barney LLC and Morgan Stanley & Co. |
| Affiliates | | Companies related by common ownership or control. They can be financial and nonfinancial companies. ∎ Our affiliates include companies with a Morgan Stanley name and financial companies such as Morgan Stanley Smith Barney LLC and Morgan Stanley & Co. |
| Nonaffiliates | | Companies not related by common ownership or control. They can be financial and nonfinancial companies. ∎ Eaton Vance does not share with nonaffiliates so they can market to you. |
| Joint marketing | | A formal agreement between nonaffiliated financial companies that together market financial products or services to you. ∎ Eaton Vance doesn’t jointly market. |
| Other important information |
Vermont: Except as permitted by law, we will not share personal information we collect about Vermont residents with Nonaffiliates unless you provide us with your written consent to share such information. California: Except as permitted by law, we will not share personal information we collect about California residents with Nonaffiliates and we will limit sharing such personal information with our Affiliates to comply with California privacy laws that apply to us. |
Eaton Vance Funds
IMPORTANT NOTICES
Delivery of Shareholder Documents. The Securities and Exchange Commission (SEC) permits funds to deliver only one copy of shareholder documents, including prospectuses, proxy statements and shareholder reports, to fund investors with multiple accounts at the same residential or post office box address. This practice is often called “householding” and it helps eliminate duplicate mailings to shareholders. Eaton Vance, or your financial intermediary, may household the mailing of your documents indefinitely unless you instruct Eaton Vance, or your financial intermediary, otherwise. If you would prefer that your Eaton Vance documents not be householded, please contact Eaton Vance at 1-800-260-0761, or contact your financial intermediary. Your instructions that householding not apply to delivery of your Eaton Vance documents will typically be effective within 30 days of receipt by Eaton Vance or your financial intermediary.
Portfolio Holdings. Each Eaton Vance Fund and its underlying Portfolio(s) (if applicable) files a schedule of portfolio holdings on Part F to Form N-PORT with the SEC. Certain information filed on Form N-PORT may be viewed on the Eaton Vance website at www.eatonvance.com, by calling Eaton Vance at 1-800-260-0761 or in the EDGAR database on the SEC’s website at www.sec.gov.
Proxy Voting. From time to time, funds are required to vote proxies related to the securities held by the funds. The Eaton Vance Funds or their underlying Portfolios (if applicable) vote proxies according to a set of policies and procedures approved by the Funds’ and Portfolios’ Boards. You may obtain a description of these policies and procedures and information on how the Funds or Portfolios voted proxies relating to portfolio securities during the most recent 12-month period ended June 30, without charge, upon request, by calling 1-800-260-0761 and by accessing the SEC’s website at www.sec.gov.
Investment Adviser and Administrator
Eaton Vance Management
Two International Place
Boston, MA 02110
Investment Sub-Adviser
Parametric Portfolio Associates LLC
800 Fifth Avenue, Suite 2800
Seattle, WA 98104
Principal Underwriter*
Eaton Vance Distributors, Inc.
Two International Place
Boston, MA 02110
(617) 482-8260
Custodian
State Street Bank and Trust Company
State Street Financial Center, One Lincoln Street
Boston, MA 02111
Transfer Agent
BNY Mellon Investment Servicing (US) Inc.
Attn: Eaton Vance Funds
P.O. Box 9653
Providence, RI 02940-9653
(800) 260-0761
Independent Registered Public Accounting Firm
Deloitte & Touche LLP
200 Berkeley Street
Boston, MA 02116-5022
Fund Offices
Two International Place
Boston, MA 02110
| * | FINRA BrokerCheck. Investors may check the background of their Investment Professional by contacting the Financial Industry Regulatory Authority (FINRA). FINRA BrokerCheck is a free tool to help investors check the professional background of current and former FINRA-registered securities firms and brokers. FINRA BrokerCheck is available by calling 1-800-289-9999 and at www.FINRA.org. The FINRA BrokerCheck brochure describing this program is available to investors at www.FINRA.org. |
21124 1.31.22

Parametric
TABS 5-to-15 Year Laddered Municipal Bond Fund
Annual Report
January 31, 2022

Commodity Futures Trading Commission Registration. The Commodity Futures Trading Commission (“CFTC”) has adopted regulations that subject registered investment companies and advisers to regulation by the CFTC if a fund invests more than a prescribed level of its assets in certain CFTC-regulated instruments (including futures, certain options and swap agreements) or markets itself as providing investment exposure to such instruments. The investment adviser has claimed an exclusion from the definition of “commodity pool operator” under the Commodity Exchange Act with respect to its management of the Fund. Accordingly, neither the Fund nor the adviser with respect to the operation of the Fund is subject to CFTC regulation. Because of its management of other strategies, the Fund’s adviser and Parametric Portfolio Associates LLC (Parametric), sub-adviser to the Fund, are registered with the CFTC as commodity pool operators. The adviser and Parametric are also registered as commodity trading advisors.
Fund shares are not insured by the FDIC and are not deposits or other obligations of, or guaranteed by, any depository institution. Shares are subject to investment risks, including possible loss of principal invested.
This report must be preceded or accompanied by a current summary prospectus or prospectus. Before investing, investors should consider carefully the investment objective, risks, and charges and expenses of a mutual fund. This and other important information is contained in the summary prospectus and prospectus, which can be obtained from a financial intermediary. Prospective investors should read the prospectus carefully before investing. For further information, please call 1-800-260-0761.
Annual Report January 31, 2022
Parametric
TABS 5-to-15 Year Laddered Municipal Bond Fund
Parametric
TABS 5-to-15 Year Laddered Municipal Bond Fund
January 31, 2022
Management’s Discussion of Fund Performance1
Economic and Market Conditions
As the 12-month period began on February 1, 2021, municipal bonds were at the tail end of a bond rally that had begun in November 2020. From mid-February through June 2021, the bond market reversed course. Yields on municipal bonds and U.S. Treasurys rose and prices declined in anticipation of rising economic growth, driven by a federal government infusion of stimulus financing and progress on COVID-19 vaccinations. In late spring-early summer, high year-over-year inflation also raised investor concerns, putting further upward pressure on interest rates.
By July, however, the emergence of a more contagious Delta variant of COVID-19 threatened the U.S. economic rebound and diminished inflation concerns. Investors again turned to U.S. Treasurys and municipal bonds as relatively safe-haven assets, leading bond prices to rise and interest rates to fall in July.
From August through October, bond prices declined again due, in part, to anticipation that the U.S. Federal Reserve (the Fed) would begin tapering monthly bond purchases, which had helped hold interest rates down through much of the pandemic.
In the closing months of 2021, the Fed confirmed that tapering would begin in November and accelerate in the months to come. The reduction of monetary stimulus put upward pressure on shorter term interest rates, as did passage of President Biden’s $1 trillion infrastructure bill. As the Fed issued more hawkish monetary statements, U.S. Treasury rates rose in December against the backdrop of inflationary concerns and potential interest rate hikes. Municipal bond rates, however, were nearly unchanged during the month.
But as the new year began, municipal investors appeared to reevaluate the twin threats of inflation and projected rate hikes. The Bloomberg Municipal Bond Index, a broad measure of the municipal bond market, declined 2.74% in January 2022, its worst monthly performance in several years. In the third week of January, municipal bond mutual funds and exchange-traded funds experienced net weekly outflows for only the second time in 87 weeks.
For the period as a whole, the municipal bond yield curve experienced a “bear market flattening” in which interest rates rose across the curve, but more so at the shorter maturity end of the curve. The Bloomberg Municipal Bond Index returned -1.89% during the period. While municipal bonds outperformed U.S. Treasurys at the short end of the yield curve — that is, maturities of 5 years or less — municipals underperformed U.S. Treasurys in the middle and long end of the curve — maturities of about 10 years and 30 years, respectively.
Fund Performance
For the 12-month period ended January 31, 2022, Parametric TABS 5-to-15 Year Laddered Municipal Bond Fund (the Fund) returned -2.73% for Class A shares at net asset value (NAV), underperforming its primary benchmark, the Bloomberg 10 Year Municipal Bond Index (the Index), which returned -2.52%.
The Index is unmanaged, and returns do not reflect any applicable sales charges, commissions, or expenses.
The Fund provides rules-based, approximately equal-weighted exposure in each year across the 5-to-15-year maturity portion of the yield curve, with the objective of seeking current income exempt from regular federal income tax. Management seeks to add incremental return through active security selection and in-depth credit analysis.
Yield-curve positioning, which was largely determined by the Fund’s equal-weighted laddered structure, detracted from Fund performance versus the Index. The Fund’s holdings in bonds with maturities shorter than eight years — an area of the curve where the Index had no exposure — underperformed longer maturity bonds and, thus, detracted from relative returns during the period.
In contrast, active security selection, relative-value trading, duration, and credit quality contributed to Fund performance versus the Index during the period.
Active security selection and relative-value trading — a strategy that seeks to take advantage of price and rate differences among similar securities — were the largest contributors to relative returns. In particular, relative performance benefited from security selections and overweight positions relative to the Index in the health care and transportation sectors, which recovered during the period from sharp downturns early in the pandemic.
In addition, the Fund had a modestly shorter duration — or sensitivity to interest rate changes — than the Index. This aided relative returns because Fund performance was hurt less than Index performance by rising interest rates and declining bond prices during the period.
With regard to credit quality, the Fund’s overweight positions in A rated and BBB rated bonds benefitted performance as credit spreads tightened during the period and lower rated bonds generally outperformed higher rated bonds.
See Endnotes and Additional Disclosures in this report.
Past performance is no guarantee of future results. Returns are historical and are calculated by determining the percentage change in net asset value (NAV) or offering price (as applicable) with all distributions reinvested. Investment return and principal value will fluctuate so that shares, when redeemed, may be worth more or less than their original cost. Performance for periods less than or equal to one year is cumulative. Performance is for the stated time period only; due to market volatility, current Fund performance may be lower or higher than the quoted return. For performance as of the most recent month-end, please refer to eatonvance.com.
Parametric
TABS 5-to-15 Year Laddered Municipal Bond Fund
January 31, 2022
Performance2,3
Portfolio Manager(s) James H. Evans, CFA, Brian C. Barney, CFA and Devin J. Cooch, CFA, each of Parametric Portfolio Associates LLC
| | | | | | | | | | | | | | | | | | | | |
| % Average Annual Total Returns | | Class Inception Date | | | Performance Inception Date | | | One Year | | | Five Years | | | Ten Years | |
| | | | | |
Class A at NAV | | | 02/01/2010 | | | | 02/01/2010 | | | | –2.73 | % | | | 3.04 | % | | | 3.64 | % |
Class A with 4.75% Maximum Sales Charge | | | — | | | | — | | | | –7.35 | | | | 2.05 | | | | 3.14 | |
Class C at NAV | | | 02/01/2010 | | | | 02/01/2010 | | | | –3.47 | | | | 2.28 | | | | 3.03 | |
Class C with 1% Maximum Sales Charge | | | — | | | | — | | | | –4.42 | | | | 2.28 | | | | 3.03 | |
Class I at NAV | | | 02/01/2010 | | | | 02/01/2010 | | | | –2.49 | | | | 3.30 | | | | 3.90 | |
|
| |
| | | | | |
Bloomberg 10 Year Municipal Bond Index | | | — | | | | — | | | | –2.52 | % | | | 3.51 | % | | | 3.20 | % |
Bloomberg 15 Year Municipal Bond Index | | | — | | | | — | | | | –2.07 | | | | 4.27 | | | | 3.90 | |
| | | | | |
| % Total Annual Operating Expense Ratios4 | | | | | | | | Class A | | | Class C | | | Class I | |
| | | | | |
Gross | | | | | | | | | | | 0.68 | % | | | 1.43 | % | | | 0.43 | % |
Net | | | | | | | | | | | 0.65 | | | | 1.40 | | | | 0.40 | |
| | | | | |
| % Distribution Rates/Yields5 | | | | | | | | Class A | | | Class C | | | Class I | |
| | | | | |
Distribution Rate | | | | | | | | | | | 1.38 | % | | | 0.61 | % | | | 1.63 | % |
SEC 30-day Yield - Subsidized | | | | | | | | | | | 0.59 | | | | –0.14 | | | | 0.87 | |
SEC 30-day Yield - Unsubsidized | | | | | | | | | | | 0.57 | | | | –0.16 | | | | 0.85 | |
Growth of $10,000
This graph shows the change in value of a hypothetical investment of $10,000 in Class A of the Fund for the period indicated. For comparison, the same investment is shown in the indicated index.
| | | | | | | | | | | | | | | | |
| Growth of Investment | | Amount Invested | | | Period Beginning | | | At NAV | | | With Maximum Sales Charge | |
| | | | |
Class C | | | $10,000 | | | | 01/31/2012 | | | | $13,476 | | | | N.A. | |
Class I | | | $250,000 | | | | 01/31/2012 | | | | $366,746 | | | | N.A. | |
See Endnotes and Additional Disclosures in this report.
Past performance is no guarantee of future results. Returns are historical and are calculated by determining the percentage change in net asset value (NAV) or offering price (as applicable) with all distributions reinvested. Investment return and principal value will fluctuate so that shares, when redeemed, may be worth more or less than their original cost. Performance for periods less than or equal to one year is cumulative. Performance is for the stated time period only; due to market volatility, current Fund performance may be lower or higher than the quoted return. For performance as of the most recent month-end, please refer to eatonvance.com.
Parametric
TABS 5-to-15 Year Laddered Municipal Bond Fund
January 31, 2022
Fund Profile6
Credit Quality (% of total investments)7
See Endnotes and Additional Disclosures in this report.
Parametric
TABS 5-to-15 Year Laddered Municipal Bond Fund
January 31, 2022
Endnotes and Additional Disclosures
| 1 | The views expressed in this report are those of the portfolio manager(s) and are current only through the date stated at the top of this page. These views are subject to change at any time based upon market or other conditions, and Eaton Vance and the Fund(s) disclaim any responsibility to update such views. These views may not be relied upon as investment advice and, because investment decisions are based on many factors, may not be relied upon as an indication of trading intent on behalf of any Eaton Vance fund. This commentary may contain statements that are not historical facts, referred to as “forward-looking statements.” The Fund’s actual future results may differ significantly from those stated in any forward-looking statement, depending on factors such as changes in securities or financial markets or general economic conditions, the volume of sales and purchases of Fund shares, the continuation of investment advisory, administrative and service contracts, and other risks discussed from time to time in the Fund’s filings with the Securities and Exchange Commission. |
| 2 | Bloomberg 10 Year Municipal Bond Index is an unmanaged index of municipal bonds traded in the U.S. with maturities ranging from 8-12 years. Bloomberg 15 Year Municipal Bond Index is an unmanaged index of municipal bonds traded in the U.S. with maturities ranging from 12-17 years. Unless otherwise stated, index returns do not reflect the effect of any applicable sales charges, commissions, expenses, taxes or leverage, as applicable. It is not possible to invest directly in an index. |
| 3 | Total Returns at NAV do not include applicable sales charges. If sales charges were deducted, the returns would be lower. Total Returns shown with maximum sales charges reflect the stated maximum sales charge. Unless otherwise stated, performance does not reflect the deduction of taxes on Fund distributions or redemptions of Fund shares. |
Effective April 15, 2015, the Fund changed its investment objective and investment strategy. Performance prior to April 15, 2015 reflects the Fund’s performance under its former investment objective and policies.
Effective November 5, 2020, Class C shares automatically convert to Class A shares eight years after purchase. The average annual total returns listed for Class C reflect conversion to Class A shares after eight years. Prior to November 5, 2020, Class C shares automatically converted to Class A shares ten years after purchase.
| 4 | Source: Fund prospectus. Net expense ratios reflect a contractual expense reimbursement that continues through 5/31/22. The expense ratios for the current reporting period can be found in the Financial Highlights section of this report. Performance reflects expenses waived and/or reimbursed, if applicable. Without such waivers and/or reimbursements, performance would have been lower. |
| 5 | The Distribution Rate is based on the Fund’s last regular distribution per share in the period (annualized) divided by the Fund’s NAV at the end of the period. The Fund’s distributions may be comprised of amounts characterized for federal income tax purposes as tax-exempt income, qualified and non-qualified ordinary dividends, capital gains and nondividend distributions, also known as return of capital. The Fund will determine the federal income tax character of distributions paid to a shareholder after the end of the calendar year. This is |
| | reported on the IRS form 1099-DIV and provided to the shareholder shortly after each year-end. The Fund’s distributions are determined by the investment adviser based on its current assessment of the Fund’s long-term return potential. As portfolio and market conditions change, the rate of distributions paid by the Fund could change. The SEC Yield is a standardized measure based on the estimated yield to maturity of a fund’s investments over a 30-day period and is based on the maximum offer price at the date specified. The SEC Yield is not based on the distributions made by the Fund, which may differ. Subsidized yield reflects the effect of fee waivers and expense reimbursements. |
| 6 | The Fund primarily invests in an affiliated investment company (Portfolio) with substantially the same objective(s) and policies as the Fund and may also invest directly. Unless otherwise noted, references to investments are to the aggregate holdings of the Fund and the Portfolio. |
| 7 | For purposes of the Fund’s rating restrictions, ratings are based on Moody’s Investors Service, Inc. (“Moody’s”), S&P Global Ratings (“S&P”) or Fitch Ratings (“Fitch”), as applicable. If securities are rated differently by the ratings agencies, the highest rating is applied. Ratings, which are subject to change, apply to the creditworthiness of the issuers of the underlying securities and not to the Fund or its shares. Credit ratings measure the quality of a bond based on the issuer’s creditworthiness, with ratings ranging from AAA, being the highest, to D, being the lowest based on S&P’s measures. Ratings of BBB or higher by S&P or Fitch (Baa or higher by Moody’s) are considered to be investment-grade quality. Credit ratings are based largely on the ratings agency’s analysis at the time of rating. The rating assigned to any particular security is not necessarily a reflection of the issuer’s current financial condition and does not necessarily reflect its assessment of the volatility of a security’s market value or of the liquidity of an investment in the security. Holdings designated as “Not Rated” (if any) are not rated by the national ratings agencies stated above. |
Fund profile subject to change due to active management.
Additional Information
Bloomberg Municipal Bond Index is an unmanaged index of municipal bonds traded in the U.S.
Yield curve is a graphical representation of the yields offered by bonds of various maturities. The yield curve flattens when long-term interest rates fall and/or short-term interest rates increase, and the yield curve steepens when long-term interest rates increase and/or short-term interest rates fall.
Duration is a measure of the expected change in price of a bond—in percentage terms — given a one percent change in interest rates, all else being constant. Securities with lower durations tend to be less sensitive to interest rate changes.
Credit spread is the difference in yield between a U.S. Treasury bond and another debt security of the same maturity but different credit quality.
Parametric
TABS 5-to-15 Year Laddered Municipal Bond Fund
January 31, 2022
Fund Expenses
Example: As a Fund shareholder, you incur two types of costs: (1) transaction costs, including sales charges (loads) on purchases and redemption fees (if applicable); and (2) ongoing costs, including management fees; distribution and/or service fees; and other Fund expenses. This Example is intended to help you understand your ongoing costs (in dollars) of Fund investing and to compare these costs with the ongoing costs of investing in other mutual funds. The Example is based on an investment of $1,000 invested at the beginning of the period and held for the entire period (August 1, 2021 – January 31, 2022).
Actual Expenses: The first section of the table below provides information about actual account values and actual expenses. You may use the information in this section, together with the amount you invested, to estimate the expenses that you paid over the period. Simply divide your account value by $1,000 (for example, an $8,600 account value divided by $1,000 = 8.6), then multiply the result by the number in the first section under the heading entitled “Expenses Paid During Period” to estimate the expenses you paid on your account during this period.
Hypothetical Example for Comparison Purposes: The second section of the table below provides information about hypothetical account values and hypothetical expenses based on the actual Fund expense ratio and an assumed rate of return of 5% per year (before expenses), which is not the actual Fund return. The hypothetical account values and expenses may not be used to estimate the actual ending account balance or expenses you paid for the period. You may use this information to compare the ongoing costs of investing in your Fund and other funds. To do so, compare this 5% hypothetical example with the 5% hypothetical examples that appear in the shareholder reports of the other funds.
Please note that the expenses shown in the table are meant to highlight your ongoing costs only and do not reflect any transactional costs, such as sales charges (loads) or redemption fees (if applicable). Therefore, the second section of the table is useful in comparing ongoing costs only, and will not help you determine the relative total costs of owning different funds. In addition, if these transactional costs were included, your costs would be higher.
| | | | | | | | | | | | | | | | |
| | | Beginning
Account Value
(8/1/21) | | | Ending
Account Value
(1/31/22) | | | Expenses Paid
During Period*
(8/1/21 – 1/31/22) | | | Annualized
Expense
Ratio | |
| | | | |
Actual | | | | | | | | | | | | | | | | |
Class A | | $ | 1,000.00 | | | $ | 963.70 | | | $ | 3.22 | ** | | | 0.65 | % |
Class C | | $ | 1,000.00 | | | $ | 959.30 | | | $ | 6.91 | ** | | | 1.40 | % |
Class I | | $ | 1,000.00 | | | $ | 964.90 | | | $ | 1.98 | ** | | | 0.40 | % |
| | | | | |
Hypothetical | | | | | | | | | | | | | | | | |
(5% return per year before expenses) | | | | | | | | | | | | | | | | |
Class A | | $ | 1,000.00 | | | $ | 1,021.93 | | | $ | 3.31 | ** | | | 0.65 | % |
Class C | | $ | 1,000.00 | | | $ | 1,018.15 | | | $ | 7.12 | ** | | | 1.40 | % |
Class I | | $ | 1,000.00 | | | $ | 1,023.19 | | | $ | 2.04 | ** | | | 0.40 | % |
| * | Expenses are equal to the Fund’s annualized expense ratio for the indicated Class, multiplied by the average account value over the period, multiplied by 184/365 (to reflect the one-half year period). The Example assumes that the $1,000 was invested at the net asset value per share determined at the close of business on July 31, 2021.The Example reflects the expenses of both the Fund and the Portfolio. |
| ** | Absent an allocation of certain expenses to affiliates, expenses would be higher. |
Parametric
TABS 5-to-15 Year Laddered Municipal Bond Fund
January 31, 2022
Statement of Assets and Liabilities
| | | | |
| Assets | | January 31, 2022 | |
| |
Investment in 5-to-15 Year Laddered Municipal Bond Portfolio, at value (identified cost, $920,130,526) | | $ | 936,704,158 | |
| |
Receivable for Fund shares sold | | | 4,593,889 | |
| |
Total assets | | $ | 941,298,047 | |
|
| Liabilities | |
| |
Payable for Fund shares redeemed | | $ | 2,821,930 | |
| |
Distributions payable | | | 263,823 | |
| |
Payable to affiliates: | | | | |
| |
Distribution and service fees | | | 44,422 | |
| |
Other | | | 5,442 | |
| |
Accrued expenses | | | 143,428 | |
| |
Total liabilities | | $ | 3,279,045 | |
| |
Net Assets | | $ | 938,019,002 | |
|
| Sources of Net Assets | |
| |
Paid-in capital | | $ | 925,843,785 | |
| |
Distributable earnings | | | 12,175,217 | |
| |
Net Assets | | $ | 938,019,002 | |
| |
| Class A Shares | | | | |
| |
Net Assets | | $ | 81,891,961 | |
| |
Shares Outstanding | | | 6,449,287 | |
| |
Net Asset Value and Redemption Price Per Share | | | | |
| |
(net assets ÷ shares of beneficial interest outstanding) | | $ | 12.70 | |
| |
Maximum Offering Price Per Share | | | | |
| |
(100 ÷ 95.25 of net asset value per share) | | $ | 13.33 | |
|
| Class C Shares | |
| |
Net Assets | | $ | 30,794,830 | |
| |
Shares Outstanding | | | 2,426,151 | |
| |
Net Asset Value and Offering Price Per Share* | | | | |
| |
(net assets ÷ shares of beneficial interest outstanding) | | $ | 12.69 | |
|
| Class I Shares | |
| |
Net Assets | | $ | 825,332,211 | |
| |
Shares Outstanding | | | 65,042,607 | |
| |
Net Asset Value, Offering Price and Redemption Price Per Share | | | | |
| |
(net assets ÷ shares of beneficial interest outstanding) | | $ | 12.69 | |
On sales of $50,000 or more, the offering price of Class A shares is reduced.
| * | Redemption price per share is equal to the net asset value less any applicable contingent deferred sales charge. |
| | | | |
| | 7 | | See Notes to Financial Statements. |
Parametric
TABS 5-to-15 Year Laddered Municipal Bond Fund
January 31, 2022
Statement of Operations
| | | | |
| Investment Income | | Year Ended January 31, 2022 | |
| |
Interest allocated from Portfolio | | $ | 19,372,416 | |
| |
Expenses allocated from Portfolio | | | (3,329,874 | ) |
| |
Total investment income from Portfolio | | $ | 16,042,542 | |
| |
| Expenses | | | | |
| |
Distribution and service fees | | | | |
| |
Class A | | $ | 210,591 | |
| |
Class C | | | 348,216 | |
| |
Trustees’ fees and expenses | | | 500 | |
| |
Custodian fee | | | 59,482 | |
| |
Transfer and dividend disbursing agent fees | | | 295,937 | |
| |
Legal and accounting services | | | 31,474 | |
| |
Printing and postage | | | 35,246 | |
| |
Registration fees | | | 113,076 | |
| |
Miscellaneous | | | 12,751 | |
| |
Total expenses | | $ | 1,107,273 | |
| |
Deduct — | | | | |
| |
Allocation of expenses to affiliates | | $ | 75,791 | |
| |
Total expense reductions | | $ | 75,791 | |
| |
Net expenses | | $ | 1,031,482 | |
| |
Net investment income | | $ | 15,011,060 | |
| |
| Realized and Unrealized Gain (Loss) from Portfolio | | | | |
| |
Net realized gain (loss) — | | | | |
| |
Investment transactions | | $ | 3,489,360 | |
| |
Net realized gain | | $ | 3,489,360 | |
| |
Change in unrealized appreciation (depreciation) — | | | | |
| |
Investments | | $ | (42,921,803 | ) |
| |
Net change in unrealized appreciation (depreciation) | | $ | (42,921,803 | ) |
| |
Net realized and unrealized loss | | $ | (39,432,443 | ) |
| |
Net decrease in net assets from operations | | $ | (24,421,383 | ) |
| | | | |
| | 8 | | See Notes to Financial Statements. |
Parametric
TABS 5-to-15 Year Laddered Municipal Bond Fund
January 31, 2022
Statements of Changes in Net Assets
| | | | | | | | |
| | | Year Ended January 31, | |
| Increase (Decrease) in Net Assets | | 2022 | | | 2021 | |
| | |
From operations — | | | | | | | | |
| | |
Net investment income | | $ | 15,011,060 | | | $ | 14,224,357 | |
| | |
Net realized gain | | | 3,489,360 | | | | 4,289,976 | |
| | |
Net change in unrealized appreciation (depreciation) | | | (42,921,803 | ) | | | 16,851,140 | |
| | |
Net increase (decrease) in net assets from operations | | $ | (24,421,383 | ) | | $ | 35,365,473 | |
| | |
Distributions to shareholders — | | | | | | | | |
| | |
Class A | | $ | (1,170,757 | ) | | $ | (1,369,835 | ) |
| | |
Class C | | | (222,704 | ) | | | (346,962 | ) |
| | |
Class I | | | (13,597,794 | ) | | | (12,491,775 | ) |
| | |
Total distributions to shareholders | | $ | (14,991,255 | ) | | $ | (14,208,572 | ) |
| | |
Transactions in shares of beneficial interest — | | | | | | | | |
| | |
Proceeds from sale of shares | | | | | | | | |
| | |
Class A | | $ | 13,882,492 | | | $ | 18,833,667 | |
| | |
Class C | | | 3,320,306 | | | | 6,662,582 | |
| | |
Class I | | | 239,662,679 | | | | 319,722,524 | |
| | |
Net asset value of shares issued to shareholders in payment of distributions declared | | | | | | | | |
| | |
Class A | | | 923,920 | | | | 1,143,526 | |
| | |
Class C | | | 173,741 | | | | 257,716 | |
| | |
Class I | | | 10,714,522 | | | | 9,777,443 | |
| | |
Cost of shares redeemed | | | | | | | | |
| | |
Class A | | | (18,585,038 | ) | | | (19,938,216 | ) |
| | |
Class C | | | (8,395,703 | ) | | | (11,050,734 | ) |
| | |
Class I | | | (166,794,634 | ) | | | (167,437,325 | ) |
| | |
Net asset value of shares converted | | | | | | | | |
| | |
Class A | | | 191,346 | | | | 1,172,423 | |
| | |
Class C | | | (191,346 | ) | | | (1,172,423 | ) |
| | |
Net increase in net assets from Fund share transactions | | $ | 74,902,285 | | | $ | 157,971,183 | |
|
Other capital — | |
| | |
Portfolio transaction fee contributed to Portfolio | | $ | (240,536 | ) | | $ | (394,679 | ) |
| | |
Portfolio transaction fee allocated from Portfolio | | | 249,295 | | | | 391,381 | |
| | |
Net increase (decrease) in net assets from other capital | | $ | 8,759 | | | $ | (3,298 | ) |
| | |
Net increase in net assets | | $ | 35,498,406 | | | $ | 179,124,786 | |
|
| Net Assets | |
| | |
At beginning of year | | $ | 902,520,596 | | | $ | 723,395,810 | |
| | |
At end of year | | $ | 938,019,002 | | | $ | 902,520,596 | |
| | | | |
| | 9 | | See Notes to Financial Statements. |
Parametric
TABS 5-to-15 Year Laddered Municipal Bond Fund
January 31, 2022
Financial Highlights
| | | | | | | | | | | | | | | | | | | | |
| | | Class A | |
| | | Year Ended January 31, | |
| | | 2022 | | | 2021 | | | 2020 | | | 2019 | | | 2018 | |
| | | | | |
Net asset value — Beginning of year | | $ | 13.240 | | | $ | 12.900 | | | $ | 12.220 | | | $ | 12.110 | | | $ | 11.900 | |
| | | | | |
| Income (Loss) From Operations | | | | | | | | | | | | | | | | | | | | |
| | | | | |
Net investment income | | $ | 0.182 | | | $ | 0.213 | | | $ | 0.237 | | | $ | 0.225 | | | $ | 0.210 | |
| | | | | |
Net realized and unrealized gain (loss) | | | (0.540 | ) | | | 0.340 | | | | 0.680 | | | | 0.110 | | | | 0.210 | |
| | | | | |
Total income (loss) from operations | | $ | (0.358 | ) | | $ | 0.553 | | | $ | 0.917 | | | $ | 0.335 | | | $ | 0.420 | |
| | | | | |
| Less Distributions | | | | | | | | | | | | | | | | | | | | |
| | | | | |
From net investment income | | $ | (0.182 | ) | | $ | (0.213 | ) | | $ | (0.237 | ) | | $ | (0.225 | ) | | $ | (0.210 | ) |
| | | | | |
Total distributions | | $ | (0.182 | ) | | $ | (0.213 | ) | | $ | (0.237 | ) | | $ | (0.225 | ) | | $ | (0.210 | ) |
| | | | | |
Net asset value — End of year | | $ | 12.700 | | | $ | 13.240 | | | $ | 12.900 | | | $ | 12.220 | | | $ | 12.110 | |
| | | | | |
Total Return(1)(2) | | | (2.73 | )% | | | 4.34 | % | | | 7.56 | % | | | 2.80 | % | | | 3.53 | % |
| | | | | |
| Ratios/Supplemental Data | | | | | | | | | | | | | | | | | | | | |
| | | | | |
Net assets, end of year (000’s omitted) | | $ | 81,892 | | | $ | 88,983 | | | $ | 85,608 | | | $ | 87,287 | | | $ | 104,397 | |
| | | | | |
Ratios (as a percentage of average daily net assets):(3) | | | | | | | | | | | | | | | | | | | | |
| | | | | |
Expenses(2) | | | 0.65 | % | | | 0.65 | % | | | 0.65 | % | | | 0.65 | % | | | 0.65 | % |
| | | | | |
Net investment income | | | 1.39 | % | | | 1.65 | % | | | 1.88 | % | | | 1.87 | % | | | 1.72 | % |
| | | | | |
Portfolio Turnover of the Portfolio | | | 22 | % | | | 51 | % | | | 28 | % | | | 78 | % | | | 35 | % |
| (1) | Returns are historical and are calculated by determining the percentage change in net asset value with all distributions reinvested and do not reflect the effect of sales charges. |
| (2) | The investment adviser and administrator and the sub-adviser of the Fund and the investment adviser and the sub-adviser of the Portfolio reimbursed certain operating expenses (equal to 0.01%, 0.03%, 0.02%, 0.04% and 0.05% of average daily net assets for the years ended January 31, 2022, 2021, 2020, 2019 and 2018, respectively). Absent this reimbursement, total return would be lower. |
| (3) | Includes the Fund’s share of the Portfolio’s allocated expenses. |
| | | | |
| | 10 | | See Notes to Financial Statements. |
Parametric
TABS 5-to-15 Year Laddered Municipal Bond Fund
January 31, 2022
Financial Highlights — continued
| | | | | | | | | | | | | | | | | | | | |
| | | Class C | |
| | | Year Ended January 31, | |
| | | 2022 | | | 2021 | | | 2020 | | | 2019 | | | 2018 | |
| | | | | |
Net asset value — Beginning of year | | $ | 13.230 | | | $ | 12.890 | | | $ | 12.220 | | | $ | 12.100 | | | $ | 11.890 | |
| | | | | |
| Income (Loss) From Operations | | | | | | | | | | | | | | | | | | | | |
| | | | | |
Net investment income | | $ | 0.084 | | | $ | 0.116 | | | $ | 0.142 | | | $ | 0.134 | | | $ | 0.118 | |
| | | | | |
Net realized and unrealized gain (loss) | | | (0.540 | ) | | | 0.340 | | | | 0.670 | | | | 0.120 | | | | 0.210 | |
| | | | | |
Total income (loss) from operations | | $ | (0.456 | ) | | $ | 0.456 | | | $ | 0.812 | | | $ | 0.254 | | | $ | 0.328 | |
| | | | | |
| Less Distributions | | | | | | | | | | | | | | | | | | | | |
| | | | | |
From net investment income | | $ | (0.084 | ) | | $ | (0.116 | ) | | $ | (0.142 | ) | | $ | (0.134 | ) | | $ | (0.118 | ) |
| | | | | |
Total distributions | | $ | (0.084 | ) | | $ | (0.116 | ) | | $ | (0.142 | ) | | $ | (0.134 | ) | | $ | (0.118 | ) |
| | | | | |
Net asset value — End of year | | $ | 12.690 | | | $ | 13.230 | | | $ | 12.890 | | | $ | 12.220 | | | $ | 12.100 | |
| | | | | |
Total Return(1)(2) | | | (3.47 | )% | | | 3.56 | % | | | 6.68 | % | | | 2.12 | % | | | 2.75 | % |
| | | | | |
| Ratios/Supplemental Data | | | | | | | | | | | | | | | | | | | | |
| | | | | |
Net assets, end of year (000’s omitted) | | $ | 30,795 | | | $ | 37,239 | | | $ | 41,689 | | | $ | 45,309 | | | $ | 55,476 | |
| | | | | |
Ratios (as a percentage of average daily net assets):(3) | | | | | | | | | | | | | | | | | | | | |
| | | | | |
Expenses(2) | | | 1.40 | % | | | 1.40 | % | | | 1.40 | % | | | 1.40 | % | | | 1.40 | % |
| | | | | |
Net investment income | | | 0.64 | % | | | 0.91 | % | | | 1.13 | % | | | 1.11 | % | | | 0.96 | % |
| | | | | |
Portfolio Turnover of the Portfolio | | | 22 | % | | | 51 | % | | | 28 | % | | | 78 | % | | | 35 | % |
| (1) | Returns are historical and are calculated by determining the percentage change in net asset value with all distributions reinvested and do not reflect the effect of sales charges. |
| (2) | The investment adviser and administrator and the sub-adviser of the Fund and the investment adviser and the sub-adviser of the Portfolio reimbursed certain operating expenses (equal to 0.01%, 0.03%, 0.02%, 0.04% and 0.05% of average daily net assets for the years ended January 31, 2022, 2021, 2020, 2019 and 2018, respectively). Absent this reimbursement, total return would be lower. |
| (3) | Includes the Fund’s share of the Portfolio’s allocated expenses. |
| | | | |
| | 11 | | See Notes to Financial Statements. |
Parametric
TABS 5-to-15 Year Laddered Municipal Bond Fund
January 31, 2022
Financial Highlights — continued
| | | | | | | | | | | | | | | | | | | | |
| | | Class I | |
| | | Year Ended January 31, | |
| | | 2022 | | | 2021 | | | 2020 | | | 2019 | | | 2018 | |
| | | | | |
Net asset value — Beginning of year | | $ | 13.230 | | | $ | 12.890 | | | $ | 12.210 | | | $ | 12.100 | | | $ | 11.890 | |
| | | | | |
| Income (Loss) From Operations | | | | | | | | | | | | | | | | | | | | |
| | | | | |
Net investment income | | $ | 0.215 | | | $ | 0.245 | | | $ | 0.268 | | | $ | 0.255 | | | $ | 0.240 | |
| | | | | |
Net realized and unrealized gain (loss) | | | (0.540 | ) | | | 0.340 | | | | 0.680 | | | | 0.110 | | | | 0.210 | |
| | | | | |
Total income (loss) from operations | | $ | (0.325 | ) | | $ | 0.585 | | | $ | 0.948 | | | $ | 0.365 | | | $ | 0.450 | |
| | | | | |
| Less Distributions | | | | | | | | | | | | | | | | | | | | |
| | | | | |
From net investment income | | $ | (0.215 | ) | | $ | (0.245 | ) | | $ | (0.268 | ) | | $ | (0.255 | ) | | $ | (0.240 | ) |
| | | | | |
Total distributions | | $ | (0.215 | ) | | $ | (0.245 | ) | | $ | (0.268 | ) | | $ | (0.255 | ) | | $ | (0.240 | ) |
| | | | | |
Net asset value — End of year | | $ | 12.690 | | | $ | 13.230 | | | $ | 12.890 | | | $ | 12.210 | | | $ | 12.100 | |
| | | | | |
Total Return(1)(2) | | | (2.49 | )% | | | 4.60 | % | | | 7.83 | % | | | 3.06 | % | | | 3.79 | % |
| | | | | |
| Ratios/Supplemental Data | | | | | | | | | | | | | | | | | | | | |
| | | | | |
Net assets, end of year (000’s omitted) | | $ | 825,332 | | | $ | 776,298 | | | $ | 596,099 | | | $ | 472,656 | | | $ | 510,220 | |
| | | | | |
Ratios (as a percentage of average daily net assets):(3) | | | | | | | | | | | | | | | | | | | | |
| | | | | |
Expenses(2) | | | 0.40 | % | | | 0.40 | % | | | 0.40 | % | | | 0.40 | % | | | 0.40 | % |
| | | | | |
Net investment income | | | 1.64 | % | | | 1.89 | % | | | 2.12 | % | | | 2.11 | % | | | 1.94 | % |
| | | | | |
Portfolio Turnover of the Portfolio | | | 22 | % | | | 51 | % | | | 28 | % | | | 78 | % | | | 35 | % |
| (1) | Returns are historical and are calculated by determining the percentage change in net asset value with all distributions reinvested. |
| (2) | The investment adviser and administrator and the sub-adviser of the Fund and the investment adviser and the sub-adviser of the Portfolio reimbursed certain operating expenses (equal to 0.01%, 0.03%, 0.02%, 0.04% and 0.05% of average daily net assets for the years ended January 31, 2022, 2021, 2020, 2019 and 2018, respectively). Absent this reimbursement, total return would be lower. |
| (3) | Includes the Fund’s share of the Portfolio’s allocated expenses. |
| | | | |
| | 12 | | See Notes to Financial Statements. |
Parametric
TABS 5-to-15 Year Laddered Municipal Bond Fund
January 31, 2022
Notes to Financial Statements
1 Significant Accounting Policies
Parametric TABS 5-to-15 Year Laddered Municipal Bond Fund (the Fund) is a diversified series of Eaton Vance Municipals Trust II (the Trust). The Trust is a Massachusetts business trust registered under the Investment Company Act of 1940, as amended (the 1940 Act), as an open-end management investment company. The Fund offers three classes of shares. Class A shares are generally sold subject to a sales charge imposed at time of purchase. Class C shares are sold at net asset value and are generally subject to a contingent deferred sales charge (see Note 5). Effective January 25, 2019, Class C shares generally automatically convert to Class A shares ten years after their purchase and, effective November 5, 2020, automatically convert to Class A shares eight years after their purchase as described in the Fund’s prospectus. Class I shares are sold at net asset value and are not subject to a sales charge. Each class represents a pro-rata interest in the Fund, but votes separately on class-specific matters and (as noted below) is subject to different expenses. Realized and unrealized gains and losses and net investment income and losses, other than class-specific expenses, are allocated daily to each class of shares based on the relative net assets of each class to the total net assets of the Fund. Each class of shares differs in its distribution plan and certain other class-specific expenses. The Fund invests all of its investable assets in interests in 5-to-15 Year Laddered Municipal Bond Portfolio (the Portfolio), a Massachusetts business trust, having the same investment objective and policies as the Fund. The value of the Fund’s investment in the Portfolio reflects the Fund’s proportionate interest in the net assets of the Portfolio (99.9% at January 31, 2022). The performance of the Fund is directly affected by the performance of the Portfolio. The financial statements of the Portfolio, including the portfolio of investments, are included elsewhere in this report and should be read in conjunction with the Fund’s financial statements.
The following is a summary of significant accounting policies of the Fund. The policies are in conformity with accounting principles generally accepted in the United States of America (U.S. GAAP). The Fund is an investment company and follows accounting and reporting guidance in the Financial Accounting Standards Board (FASB) Accounting Standards Codification Topic 946.
A Investment Valuation — Valuation of securities by the Portfolio is discussed in Note 1A of the Portfolio’s Notes to Financial Statements, which are included elsewhere in this report.
B Income — The Fund’s net investment income or loss consists of the Fund’s pro-rata share of the net investment income or loss of the Portfolio, less all actual and accrued expenses of the Fund.
C Federal Taxes — The Fund’s policy is to comply with the provisions of the Internal Revenue Code applicable to regulated investment companies and to distribute to shareholders each year substantially all of its taxable, if any, and tax-exempt net investment income, and all or substantially all of its net realized capital gains. Accordingly, no provision for federal income or excise tax is necessary. The Fund intends to satisfy conditions which will enable it to designate distributions from the interest income generated by the Portfolio’s investments in municipal obligations, which are exempt from regular federal income tax when received by the Portfolio, as exempt-interest dividends. The portion of such interest, if any, earned on private activity bonds issued after August 7, 1986, may be considered a tax preference item to shareholders.
As of January 31, 2022, the Fund had no uncertain tax positions that would require financial statement recognition, de-recognition, or disclosure. The Fund files a U.S. federal income tax return annually after its fiscal year-end, which is subject to examination by the Internal Revenue Service for a period of three years from the date of filing.
D Expenses — The majority of expenses of the Trust are directly identifiable to an individual fund. Expenses which are not readily identifiable to a specific fund are allocated taking into consideration, among other things, the nature and type of expense and the relative size of the funds.
E Use of Estimates — The preparation of the financial statements in conformity with U.S. GAAP requires management to make estimates and assumptions that affect the reported amounts of assets and liabilities at the date of the financial statements and the reported amounts of income and expense during the reporting period. Actual results could differ from those estimates.
F Indemnifications — Under the Trust’s organizational documents, its officers and Trustees may be indemnified against certain liabilities and expenses arising out of the performance of their duties to the Fund. Under Massachusetts law, if certain conditions prevail, shareholders of a Massachusetts business trust (such as the Trust) could be deemed to have personal liability for the obligations of the Trust. However, the Trust’s Declaration of Trust contains an express disclaimer of liability on the part of Fund shareholders and the By-laws provide that the Trust shall assume, upon request by the shareholder, the defense on behalf of any Fund shareholders. Moreover, the By-laws also provide for indemnification out of Fund property of any shareholder held personally liable solely by reason of being or having been a shareholder for all loss or expense arising from such liability. Additionally, in the normal course of business, the Fund enters into agreements with service providers that may contain indemnification clauses. The Fund’s maximum exposure under these arrangements is unknown as this would involve future claims that may be made against the Fund that have not yet occurred.
G Other — Investment transactions are accounted for on a trade date basis.
2 Distributions to Shareholders and Income Tax Information
The Fund declares dividends daily to shareholders of record at the time of declaration. Distributions are generally paid monthly. Distributions of realized capital gains are made at least annually. Distributions are declared separately for each class of shares. Shareholders may reinvest income and capital gain distributions in additional shares of the same class of the Fund at the net asset value as of the reinvestment date or, at the election of the shareholder,
Parametric
TABS 5-to-15 Year Laddered Municipal Bond Fund
January 31, 2022
Notes to Financial Statements — continued
receive distributions in cash. Distributions to shareholders are determined in accordance with income tax regulations, which may differ from U.S. GAAP. As required by U.S. GAAP, only distributions in excess of tax basis earnings and profits are reported in the financial statements as a return of capital. Permanent differences between book and tax accounting relating to distributions are reclassified to paid-in capital. For tax purposes, distributions from short-term capital gains are considered to be from ordinary income.
The tax character of distributions declared for the years ended January 31, 2022 and January 31, 2021 was as follows:
| | | | | | | | |
| | | Year Ended January 31, | |
| | | 2022 | | | 2021 | |
| | |
Tax-exempt income | | $ | 14,991,255 | | | $ | 14,208,572 | |
As of January 31, 2022, the components of distributable earnings (accumulated loss) on a tax basis were as follows:
| | | | |
| | |
Undistributed tax-exempt income | | $ | 267,437 | |
| |
Deferred capital losses | | | (4,620,910 | ) |
| |
Net unrealized appreciation | | | 16,792,513 | |
| |
Distributions payable | | | (263,823 | ) |
| |
Distributable earnings | | $ | 12,175,217 | |
At January 31, 2022, the Fund, for federal income tax purposes, had deferred capital losses of $4,620,910 which would reduce its taxable income arising from future net realized gains on investment transactions, if any, to the extent permitted by the Internal Revenue Code, and thus would reduce the amount of distributions to shareholders, which would otherwise be necessary to relieve the Fund of any liability for federal income or excise tax. The deferred capital losses are treated as arising on the first day of the Fund’s next taxable year and retain the same short-term or long-term character as when originally deferred. Of the deferred capital losses at January 31, 2022, $4,620,910 are short-term.
3 Investment Adviser and Administration Fee and Other Transactions with Affiliates
The investment adviser and administration fee is earned by Eaton Vance Management (EVM) as compensation for investment advisory and administrative services rendered to the Fund. On March 1, 2021, Morgan Stanley acquired Eaton Vance Corp. (the “Transaction”) and EVM became an indirect, wholly-owned subsidiary of Morgan Stanley. In connection with the Transaction, the Fund entered into a new investment advisory and administrative agreement (the “New Agreement”) with EVM, which took effect on March 1, 2021. Pursuant to the New Agreement (and the Fund’s investment advisory and administrative agreement with EVM in effect prior to March 1, 2021), the investment adviser and administration fee is computed at an annual rate as a percentage of the Fund’s average daily net assets that are not invested in other investment companies for which EVM or its affiliates serve as investment adviser and receive an advisory fee, as follows and is payable monthly:
| | | | |
| Average Daily Net Assets | | Annual Fee
Rate | |
| |
Up to $1 billion | | | 0.3200 | % |
| |
$1 billion but less than $2.5 billion | | | 0.3075 | % |
| |
$2.5 billion but less than $5 billion | | | 0.2950 | % |
| |
$5 billion and over | | | 0.2875 | % |
For the year ended January 31, 2022, the Fund incurred no investment adviser and administration fee on such assets. To the extent the Fund’s assets are invested in the Portfolio, the Fund is allocated its pro rata share of the Portfolio’s investment adviser fee. The Portfolio has engaged Boston Management and Research (BMR) to render investment advisory services. See Note 2 of the Portfolio’s Notes to Financial Statements which are included elsewhere in this report.
Pursuant to an investment sub-advisory agreement, EVM has delegated the investment management of the Fund to Parametric Portfolio Associates LLC (Parametric), an affiliate of EVM and, effective March 1, 2021, an indirect, wholly-owned subsidiary of Morgan Stanley. In connection with the Transaction, EVM entered into a new investment sub-advisory agreement with Parametric, which took effect on March 1, 2021. EVM pays Parametric a portion of its investment adviser and administration fee for sub-advisory services provided to the Fund.
Parametric
TABS 5-to-15 Year Laddered Municipal Bond Fund
January 31, 2022
Notes to Financial Statements — continued
EVM and Parametric have agreed to reimburse the Fund’s expenses to the extent that total annual operating expenses (relating to ordinary operating expenses only and excluding such expenses as borrowing costs, taxes or litigation expenses) exceed 0.65%, 1.40% and 0.40% of the Fund’s average daily net assets for Class A, Class C and Class I, respectively. This agreement may be changed or terminated after May 31, 2022. Pursuant to this agreement, EVM and Parametric were allocated $75,791 in total of the Fund’s operating expenses for the year ended January 31, 2022.
EVM provides sub-transfer agency and related services to the Fund pursuant to a Sub-Transfer Agency Support Services Agreement. For the year ended January 31, 2022, EVM earned $9,220 from the Fund pursuant to such agreement, which is included in transfer and dividend disbursing agent fees on the Statement of Operations. The Fund was informed that Eaton Vance Distributors, Inc. (EVD), an affiliate of EVM and the Fund’s principal underwriter, received $2,165 as its portion of the sales charge on sales of Class A shares for the year ended January 31, 2022. EVD also received distribution and service fees from Class A and Class C shares (see Note 4) and contingent deferred sales charges (see Note 5).
Trustees and officers of the Fund who are members of EVM’s or BMR’s organizations receive remuneration for their services to the Fund out of the investment adviser fee. Certain officers and Trustees of the Fund and the Portfolio are officers of the above organizations.
4 Distribution Plans
The Fund has in effect a distribution plan for Class A shares (Class A Plan) pursuant to Rule 12b-1 under the 1940 Act. Pursuant to the Class A Plan, the Fund pays EVD a distribution and service fee of 0.25% per annum of its average daily net assets attributable to Class A shares for distribution services and facilities provided to the Fund by EVD, as well as for personal services and/or the maintenance of shareholder accounts. Distribution and service fees paid or accrued to EVD for the year ended January 31, 2022 amounted to $210,591 for Class A shares.
The Fund also has in effect a distribution plan for Class C shares (Class C Plan) pursuant to Rule 12b-1 under the 1940 Act. Pursuant to the Class C Plan, the Fund pays EVD amounts equal to 0.75% per annum of its average daily net assets attributable to Class C shares for providing ongoing distribution services and facilities to the Fund. For the year ended January 31, 2022, the Fund paid or accrued to EVD $261,161 for Class C shares.
Pursuant to the Class C Plan, the Fund also makes payments of service fees to EVD, financial intermediaries and other persons in amounts equal to 0.25% per annum of its average daily net assets attributable to that class. Service fees paid or accrued are for personal services and/or the maintenance of shareholder accounts. They are separate and distinct from the sales commissions and distribution fees payable to EVD. Service fees paid or accrued for the year ended January 31, 2022 amounted to $87,055 for Class C shares.
Distribution and service fees are subject to the limitations contained in the Financial Industry Regulatory Authority Rule 2341(d).
5 Contingent Deferred Sales Charges
A contingent deferred sales charge (CDSC) of 1% generally is imposed on redemptions of Class C shares made within 12 months of purchase. Class A shares may be subject to a 1% CDSC if redeemed within 18 months of purchase (depending on the circumstances of purchase). Generally, the CDSC is based upon the lower of the net asset value at date of redemption or date of purchase. No charge is levied on shares acquired by reinvestment of dividends or capital gain distributions. For the year ended January 31, 2022, the Fund was informed that EVD received approximately $1,000 of CDSCs paid by Class C shareholders and no CDSCs paid by Class A shareholders.
6 Investment Transactions
For the year ended January 31, 2022, increases and decreases in the Fund’s investment in the Portfolio aggregated $108,843,213 and $51,793,218, respectively. In addition, a Portfolio transaction fee is imposed by the Portfolio on the combined daily inflows or outflows of the Fund and the Portfolio��s other investors as more fully described at Note 1H of the Portfolio’s financial statements included herein. Such fee is allocated to the Fund based on its pro-rata interest in the Portfolio. The amount of the Portfolio transaction fee imposed on the Fund, if any, and the allocation of such fee are presented as Other capital on the Statements of Changes in Net Assets.
Parametric
TABS 5-to-15 Year Laddered Municipal Bond Fund
January 31, 2022
Notes to Financial Statements — continued
7 Shares of Beneficial Interest
The Fund’s Declaration of Trust permits the Trustees to issue an unlimited number of full and fractional shares of beneficial interest (without par value). Such shares may be issued in a number of different series (such as the Fund) and classes. Transactions in Fund shares were as follows:
| | | | | | | | |
| | | Year Ended January 31, | |
| Class A | | 2022 | | | 2021 | |
| | |
Sales | | | 1,058,328 | | | | 1,454,551 | |
| | |
Issued to shareholders electing to receive payments of distributions in Fund shares | | | 70,602 | | | | 88,554 | |
| | |
Redemptions | | | (1,416,785 | ) | | | (1,547,677 | ) |
| | |
Converted from Class C shares | | | 14,622 | | | | 89,879 | |
| | |
Net increase (decrease) | | | (273,233 | ) | | | 85,307 | |
| |
| | | Year Ended January 31, | |
| Class C | | 2022 | | | 2021 | |
| | |
Sales | | | 253,506 | | | | 517,231 | |
| | |
Issued to shareholders electing to receive payments of distributions in Fund shares | | | 13,279 | | | | 19,985 | |
| | |
Redemptions | | | (640,444 | ) | | | (866,281 | ) |
| | |
Converted to Class A shares | | | (14,628 | ) | | | (89,919 | ) |
| | |
Net decrease | | | (388,287 | ) | | | (418,984 | ) |
| |
| | | Year Ended January 31, | |
| Class I | | 2022 | | | 2021 | |
| | |
Sales | | | 18,257,870 | | | | 24,809,152 | |
| | |
Issued to shareholders electing to receive payments of distributions in Fund shares | | | 819,220 | | | | 756,576 | |
| | |
Redemptions | | | (12,724,163 | ) | | | (13,124,951 | ) |
| | |
Net increase | | | 6,352,927 | | | | 12,440,777 | |
Parametric
TABS 5-to-15 Year Laddered Municipal Bond Fund
January 31, 2022
Report of Independent Registered Public Accounting Firm
To the Trustees of Eaton Vance Municipals Trust II and Shareholders of Parametric TABS 5-to-15 Year Laddered Municipal Bond Fund:
Opinion on the Financial Statements and Financial Highlights
We have audited the accompanying statement of assets and liabilities of Parametric TABS 5-to-15 Year Laddered Municipal Bond Fund (the “Fund”) (one of the funds constituting Eaton Vance Municipals Trust II), as of January 31, 2022, the related statement of operations for the year then ended, the statements of changes in net assets for each of the two years in the period then ended, the financial highlights for each of the five years in the period then ended, and the related notes. In our opinion, the financial statements and financial highlights present fairly, in all material respects, the financial position of the Fund as of January 31, 2022, and the results of its operations for the year then ended, the changes in its net assets for each of the two years in the period then ended, and the financial highlights for each of the five years in the period then ended, in conformity with accounting principles generally accepted in the United States of America.
Basis for Opinion
These financial statements and financial highlights are the responsibility of the Fund’s management. Our responsibility is to express an opinion on the Fund’s financial statements and financial highlights based on our audits. We are a public accounting firm registered with the Public Company Accounting Oversight Board (United States) (PCAOB) and are required to be independent with respect to the Fund in accordance with the U.S. federal securities laws and the applicable rules and regulations of the Securities and Exchange Commission and the PCAOB.
We conducted our audits in accordance with the standards of the PCAOB. Those standards require that we plan and perform the audit to obtain reasonable assurance about whether the financial statements and financial highlights are free of material misstatement, whether due to error or fraud. The Fund is not required to have, nor were we engaged to perform, an audit of its internal control over financial reporting. As part of our audits, we are required to obtain an understanding of internal control over financial reporting but not for the purpose of expressing an opinion on the effectiveness of the Fund’s internal control over financial reporting. Accordingly, we express no such opinion.
Our audits included performing procedures to assess the risks of material misstatement of the financial statements and financial highlights, whether due to error or fraud, and performing procedures that respond to those risks. Such procedures included examining, on a test basis, evidence regarding the amounts and disclosures in the financial statements and financial highlights. Our audits also included evaluating the accounting principles used and significant estimates made by management, as well as evaluating the overall presentation of the financial statements and financial highlights. We believe that our audits provide a reasonable basis for our opinion.
/s/ Deloitte & Touche LLP
Boston, Massachusetts
March 23, 2022
We have served as the auditor of one or more Eaton Vance investment companies since 1959.
Parametric
TABS 5-to-15 Year Laddered Municipal Bond Fund
January 31, 2022
Federal Tax Information (Unaudited)
The Form 1099-DIV you receive in February 2023 will show the tax status of all distributions paid to your account in calendar year 2022. Shareholders are advised to consult their own tax adviser with respect to the tax consequences of their investment in the Fund. As required by the Internal Revenue Code and/or regulations, shareholders must be notified regarding exempt-interest dividends.
Exempt-Interest Dividends. For the fiscal year ended January 31, 2022, the Fund designates 100% of distributions from net investment income as an exempt-interest dividend.
5-to-15 Year Laddered Municipal Bond Portfolio
January 31, 2022
Portfolio of Investments
| | | | | | | | |
| Tax-Exempt Municipal Obligations — 97.3% | |
| Security | | Principal
Amount
(000’s omitted) | | | Value | |
|
| Bond Bank — 0.5% | |
| | |
Ohio Water Development Authority, Water Pollution Control Loan Fund, Green Bonds, 4.00%, 12/1/37 | | $ | 2,475 | | | $ | 2,929,261 | |
| | |
Vermont Bond Bank, (Vermont State Colleges System), 3.00%, 10/1/35 | | | 500 | | | | 539,805 | |
| | |
Virginia Resources Authority, (Pooled Financing Program), 4.00%, 11/1/35 | | | 1,175 | | | | 1,348,125 | |
| | |
| | | | | | | $ | 4,817,191 | |
|
| Education — 4.7% | |
| | |
Allegheny County Higher Education Building Authority, PA, (Carnegie Mellon University), 0.325%, (70% of SOFR + 0.29%), 8/1/27 (Put Date), 2/1/33(1) | | $ | 2,750 | | | $ | 2,736,552 | |
| | |
| Arizona State University: | | | | | | |
| | |
5.00%, 7/1/35 | | | 1,500 | | | | 1,877,670 | |
| | |
5.00%, 7/1/36 | | | 1,000 | | | | 1,249,620 | |
| | |
Connecticut Health and Educational Facilities Authority,
(Fairfield University): | | | | | | |
| | |
5.00%, 7/1/25 | | | 875 | | | | 976,955 | |
| | |
5.00%, 7/1/26 | | | 1,000 | | | | 1,143,930 | |
| | |
Louisiana Public Facilities Authority, (Tulane University), 5.00%, 12/15/27 | | | 505 | | | | 587,477 | |
| | |
Miami University, OH, 5.00%, 9/1/32(2) | | | 735 | | | | 918,713 | |
| | |
New York Dormitory Authority, (Rochester Institute of
Technology): | | | | | | |
| | |
5.00%, 7/1/35 | | | 540 | | | | 661,252 | |
| | |
5.00%, 7/1/36 | | | 395 | | | | 483,255 | |
| | |
5.00%, 7/1/37 | | | 840 | | | | 1,026,413 | |
| | |
New York Dormitory Authority, (School Districts Revenue Bond
Financing Program): | | | | | | |
| | |
5.00%, 10/1/32 | | | 1,500 | | | | 1,864,065 | |
| | |
5.00%, 10/1/33 | | | 1,175 | | | | 1,459,585 | |
| | |
North Carolina Capital Facilities Finance Agency, (Davidson College), 5.00%, 3/1/29 | | | 200 | | | | 200,782 | |
| | |
Oklahoma Agricultural and Mechanical Colleges, (Oklahoma
State University): | | | | | | |
| | |
4.00%, 9/1/33 | | | 305 | | | | 362,471 | |
| | |
4.00%, 9/1/34 | | | 350 | | | | 415,065 | |
| | |
| Saginaw Valley State University, MI: | | | | | | |
| | |
5.00%, 7/1/27 | | | 500 | | | | 576,810 | |
| | |
5.00%, 7/1/28 | | | 1,000 | | | | 1,150,380 | |
| | |
Swarthmore Borough Authority, PA, (Swarthmore College), 4.00%, 9/15/37 | | | 1,925 | | | | 2,273,271 | |
| | |
Texas A&M University, 4.00%, 5/15/34 | | | 1,000 | | | | 1,186,920 | |
| | | | | | | | |
| Security | | Principal
Amount
(000’s omitted) | | | Value | |
|
| Education (continued) | |
| | |
| University of Florida: | | | | | | |
| | |
4.00%, 7/1/31 | | $ | 5,000 | | | $ | 5,946,900 | |
| | |
4.00%, 7/1/32 | | | 6,465 | | | | 7,613,249 | |
| | |
4.00%, 7/1/33 | | | 6,720 | | | | 7,896,873 | |
| | |
University of Hawaii, 3.00%, 10/1/31 | | | 1,000 | | | | 1,085,580 | |
| | |
| | | | | | | $ | 43,693,788 | |
|
| Electric Utilities — 2.1% | |
| | |
Brownsville, TX, Utilities System Revenue, 5.00%, 9/1/29 | | $ | 1,000 | | | $ | 1,122,170 | |
| | |
| Energy Northwest, WA, Wind Project Revenue: | | | | | | |
| | |
5.00%, 7/1/25 | | | 365 | | | | 409,994 | |
| | |
5.00%, 7/1/26 | | | 1,000 | | | | 1,120,780 | |
| | |
Garland, TX, Electric Utility System Revenue, 5.00%, 3/1/32 | | | 250 | | | | 283,202 | |
| | |
Marquette Board of Light and Power, MI, 5.00%, 7/1/27 | | | 735 | | | | 850,983 | |
| | |
New Braunfels, TX, Utility System Revenue, 4.00%, 7/1/34 | | | 770 | | | | 873,796 | |
| | |
North Carolina Municipal Power Agency No. 1, (Catawba), 5.00%, 1/1/29 | | | 500 | | | | 575,560 | |
| | |
Redding Joint Powers Financing Authority, CA, Electric System Revenue, 5.00%, 6/1/26 | | | 250 | | | | 285,867 | |
| | |
Seattle, WA, Municipal Light and Power Revenue, 0.31%, (SIFMA + 0.25%), 11/1/26 (Put Date), 5/1/45(1) | | | 2,000 | | | | 2,017,360 | |
| | |
Seattle, WA, Municipal Light and Power Revenue, Green Bonds, 4.00%, 7/1/34 | | | 5,035 | | | | 5,880,225 | |
| | |
| Springfield Electric System Revenue, IL: | | | | | | |
| | |
5.00%, 3/1/27 | | | 250 | | | | 277,582 | |
| | |
5.00%, 3/1/28 | | | 250 | | | | 277,183 | |
| | |
5.00%, 3/1/29 | | | 250 | | | | 276,783 | |
| | |
| Tallahassee, FL, Energy System Revenue: | | | | | | |
| | |
5.00%, 10/1/27 | | | 300 | | | | 330,501 | |
| | |
5.00%, 10/1/28 | | | 400 | | | | 440,000 | |
| | |
5.00%, 10/1/29 | | | 1,120 | | | | 1,231,698 | |
| | |
5.00%, 10/1/30 | | | 1,500 | | | | 1,649,595 | |
| | |
5.00%, 10/1/31 | | | 1,000 | | | | 1,099,730 | |
| | |
5.00%, 10/1/33 | | | 300 | | | | 329,586 | |
| | |
Walnut Energy Center Authority, CA, 5.00%, 1/1/33 | | | 250 | | | | 271,993 | |
| | |
| | | | | | | $ | 19,604,588 | |
|
| Escrowed / Prerefunded — 0.7% | |
| | |
North Carolina Medical Care Commission, (United Methodist
Retirement Homes): | | | | | | |
| | |
Prerefunded to 10/1/23, 5.00%, 10/1/24 | | $ | 150 | | | $ | 164,403 | |
| | |
Prerefunded to 10/1/23, 5.00%, 10/1/25 | | | 100 | | | | 109,602 | |
| | |
Prerefunded to 10/1/23, 5.00%, 10/1/26 | | | 1,100 | | | | 1,205,622 | |
| | |
Prerefunded to 10/1/23, 5.00%, 10/1/27 | | | 50 | | | | 54,801 | |
| | | | |
| | 19 | | See Notes to Financial Statements. |
5-to-15 Year Laddered Municipal Bond Portfolio
January 31, 2022
Portfolio of Investments — continued
| | | | | | | | |
| Security | | Principal
Amount
(000’s omitted) | | | Value | |
|
| Escrowed / Prerefunded (continued) | |
| | |
North Carolina Medical Care Commission, (United Methodist
Retirement Homes): (continued) | | | | | | |
| | |
Prerefunded to 10/1/23, 5.00%, 10/1/29 | | $ | 125 | | | $ | 137,003 | |
| | |
Prerefunded to 10/1/23, 5.00%, 10/1/32 | | | 225 | | | | 246,604 | |
| | |
Series 2017A, Prerefunded to 10/1/23, 5.00%, 10/1/30 | | | 250 | | | | 274,005 | |
| | |
Pennington County, SD, Certificates of Participation, Prerefunded to 6/1/25, 5.00%, 6/1/27 | | | 1,300 | | | | 1,461,798 | |
| | |
Seward County Unified School District No. 480, KS, Prerefunded to 9/1/25, 5.00%, 9/1/29 | | | 2,000 | | | | 2,265,280 | |
| | |
| South Dakota Building Authority: | | | | | | |
| | |
Prerefunded to 6/1/25, 5.00%, 6/1/28 | | | 210 | | | | 236,504 | |
| | |
Series 2015B, Prerefunded to 6/1/25, 5.00%, 6/1/30 | | | 200 | | | | 225,242 | |
| | |
| | | | | | | $ | 6,380,864 | |
|
| General Obligations — 25.7% | |
| | |
Addison, TX, Prerefunded to 2/15/23, 5.00%, 2/15/26 | | $ | 270 | | | $ | 282,118 | |
| | |
| Anchorage, AK: | | | | | | |
| | |
5.00%, 9/1/25 | | | 100 | | | | 113,039 | |
| | |
5.00%, 9/1/27 | | | 780 | | | | 876,455 | |
| | |
Beaumont, TX, Certificates of Obligation, 4.00%, 3/1/32 | | | 500 | | | | 577,675 | |
| | |
| Belding Area Schools, MI: | | | | | | |
| | |
5.00%, 5/1/28 | | | 250 | | | | 287,585 | |
| | |
5.00%, 5/1/30 | | | 250 | | | | 286,693 | |
| | |
Birmingham, AL: | | | | | | | | |
| | |
5.00%, 12/1/25 | | | 1,050 | | | | 1,195,141 | |
| | |
5.00%, 12/1/27 | | | 2,460 | | | | 2,944,325 | |
| | |
Bonneville and Bingham Counties Joint School District No. 93, ID, 5.00%, 9/15/32 | | | 450 | | | | 511,988 | |
| | |
| Brookline, MA: | | | | | | |
| | |
5.00%, 3/15/30 | | | 2,000 | | | | 2,463,960 | |
| | |
5.00%, 3/15/31 | | | 3,825 | | | | 4,710,411 | |
| | |
| Burlington, VT: | | | | | | |
| | |
5.00%, 11/1/27 | | | 255 | | | | 305,730 | |
| | |
5.00%, 11/1/29 | | | 75 | | | | 93,252 | |
| | |
5.00%, 11/1/30 | | | 300 | | | | 371,979 | |
| | |
Series 2016A, 5.00%, 11/1/26 | | | 150 | | | | 175,509 | |
| | |
Series 2019A, 5.00%, 11/1/26 | | | 210 | | | | 245,713 | |
| | |
| California: | | | | | | |
| | |
4.00%, 8/1/36 | | | 5,000 | | | | 5,472,000 | |
| | |
5.00%, 12/1/29 | | | 700 | | | | 873,488 | |
| | |
5.00%, 12/1/30 | | | 2,750 | | | | 3,499,347 | |
| | |
5.00%, 12/1/31 | | | 1,550 | | | | 2,011,419 | |
| | |
5.00%, 8/1/32 | | | 1,590 | | | | 1,827,021 | |
| | |
5.00%, 12/1/34 | | | 2,500 | | | | 3,153,400 | |
| | |
Cape May County, NJ, 3.00%, 10/1/31 | | | 1,000 | | | | 1,068,580 | |
| | | | | | | | |
| Security | | Principal
Amount
(000’s omitted) | | | Value | |
|
| General Obligations (continued) | |
| | |
Carrollton-Farmers Branch Independent School District, TX,
(PSF Guaranteed): | | | | | | |
| | |
4.00%, 2/15/32 | | $ | 650 | | | $ | 762,638 | |
| | |
4.00%, 2/15/33 | | | 1,000 | | | | 1,174,380 | |
| | |
4.00%, 2/15/34 | | | 1,010 | | | | 1,186,386 | |
| | |
Chaffey Joint Union High School District, CA, (Election of 2012), 0.00%, 8/1/33 | | | 1,000 | | | | 746,160 | |
| | |
Clark County, NV, 3.00%, 11/1/36 | | | 3,580 | | | | 3,822,581 | |
| | |
| Colonial School District, PA: | | | | | | |
| | |
5.00%, 2/15/32 | | | 100 | | | | 113,120 | |
| | |
5.00%, 2/15/33 | | | 200 | | | | 226,092 | |
| | |
Connecticut: | | | | | | | | |
| | |
4.00%, 6/1/32 | | | 1,000 | | | | 1,167,180 | |
| | |
4.00%, 6/1/33 | | | 600 | | | | 698,976 | |
| | |
4.00%, 1/15/34 | | | 1,500 | | | | 1,758,090 | |
| | |
4.00%, 6/1/35 | | | 850 | | | | 981,580 | |
| | |
4.00%, 6/1/36 | | | 1,000 | | | | 1,149,500 | |
| | |
Contra Costa Community College District, CA,
(Election of 2014): | | | | | | |
| | |
4.00%, 8/1/32 | | | 650 | | | | 760,890 | |
| | |
4.00%, 8/1/33 | | | 100 | | | | 116,934 | |
| | |
Cook County School District No. 25, IL, (Arlington Heights), 5.00%, 12/15/32 | | | 630 | | | | 735,292 | |
| | |
Dallas Independent School District, TX, (PSF Guaranteed), 3.00%, 2/15/35(2) | | | 4,095 | | | | 4,412,608 | |
| | |
Dallas, TX, 5.00%, 2/15/31 | | | 3,465 | | | | 3,609,317 | |
| | |
Delaware, 5.00%, 2/1/29 | | | 1,000 | | | | 1,205,750 | |
| | |
Denton County, TX, 4.00%, 7/15/31 | | | 1,500 | | | | 1,707,540 | |
| | |
District of Columbia, 5.00%, 6/1/33 | | | 6,690 | | | | 7,277,783 | |
| | |
Dowagiac Union School District, MI, 4.00%, 5/1/26 | | | 350 | | | | 390,061 | |
| | |
Dublin City School District, OH, 5.00%, 12/1/29 | | | 500 | | | | 612,210 | |
| | |
Easton Area School District, PA, 5.00%, 2/1/31 | | | 1,400 | | | | 1,681,974 | |
| | |
Elgin Independent School District, TX, (PSF Guaranteed), 3.00%, 8/1/37(2) | | | 2,070 | | | | 2,235,973 | |
| | |
Elk Grove Unified School District, CA, 4.00%, 8/1/32 | | | 2,305 | | | | 2,733,177 | |
| | |
Flower Mound, TX, 5.00%, 3/1/27 | | | 510 | | | | 586,883 | |
| | |
Franklin County, OH, Prerefunded to 6/1/23, 4.25%, 12/1/35 | | | 1,100 | | | | 1,150,809 | |
| | |
Frisco Independent School District, TX, (PSF Guaranteed), 4.00%, 8/15/30 | | | 400 | | | | 431,448 | |
| | |
Georgia, 5.00%, 2/1/32 | | | 1,000 | | | | 1,176,080 | |
| | |
Granville Exempted Village School District, OH, 5.00%, 12/1/26 | | | 500 | | | | 571,130 | |
| | |
Harlandale Independent School District, TX, 5.00%, 8/1/29 | | | 845 | | | | 988,236 | |
| | |
Hawaii, 5.00%, 1/1/30 | | | 3,730 | | | | 4,575,218 | |
| | |
Hennepin County, MN, 5.00%, 12/1/33 | | | 1,000 | | | | 1,170,580 | |
| | | | |
| | 20 | | See Notes to Financial Statements. |
5-to-15 Year Laddered Municipal Bond Portfolio
January 31, 2022
Portfolio of Investments — continued
| | | | | | | | |
| Security | | Principal
Amount
(000’s omitted) | | | Value | |
|
| General Obligations (continued) | |
| | |
| Homewood, AL: | | | | | | |
| | |
5.00%, 9/1/28 | | $ | 2,000 | | | $ | 2,320,000 | |
| | |
5.00%, 9/1/29 | | | 2,000 | | | | 2,313,520 | |
| | |
Honolulu City and County, HI, 3.00%, 9/1/31 | | | 110 | | | | 117,161 | |
| | |
| Illinois: | | | | | | |
| | |
5.00%, 9/1/27 | | | 12,035 | | | | 13,903,674 | |
| | |
5.00%, 3/1/28 | | | 2,000 | | | | 2,006,680 | |
| | |
5.00%, 4/1/29 | | | 1,190 | | | | 1,279,262 | |
| | |
5.00%, 3/1/34 | | | 6,000 | | | | 6,017,940 | |
| | |
5.00%, 3/1/35 | | | 1,000 | | | | 1,002,970 | |
| | |
5.50%, 5/1/30 | | | 5,500 | | | | 6,809,385 | |
| | |
Kane, Cook and DuPage Counties School District No. 46, IL, 5.00%, 1/1/29 | | | 1,000 | | | | 1,073,410 | |
| | |
Kane, McHenry, Cook and DeKalb Counties Community Unit School District No. 300, IL, 5.00%, 1/1/28 | | | 2,370 | | | | 2,822,314 | |
| | |
| Kennewick School District No. 17, WA: | | | | | | |
| | |
4.00%, 12/1/33 | | | 655 | | | | 772,350 | |
| | |
4.00%, 12/1/34 | | | 1,200 | | | | 1,412,796 | |
| | |
| Lakeland, FL: | | | | | | |
| | |
5.00%, 10/1/25 | | | 635 | | | | 707,777 | |
| | |
5.00%, 10/1/28 | | | 1,500 | | | | 1,674,885 | |
| | |
5.00%, 10/1/30 | | | 1,000 | | | | 1,114,610 | |
| | |
Leander Independent School District, TX, (PSF Guaranteed), 0.00%, 8/15/31 | | | 380 | | | | 267,809 | |
| | |
Lewisville Independent School District, TX, (PSF Guaranteed), 4.00%, 8/15/27 | | | 1,600 | | | | 1,750,032 | |
| | |
Los Angeles Community College District, CA, (Election of 2008), 4.00%, 8/1/34 | | | 1,690 | | | | 1,882,812 | |
| | |
| Los Angeles Unified School District, CA: | | | | | | |
| | |
4.00%, 7/1/33 | | | 2,500 | | | | 2,911,900 | |
| | |
4.00%, 7/1/36 | | | 3,000 | | | | 3,454,800 | |
| | |
Maine, 5.00%, 6/1/30 | | | 2,105 | | | | 2,668,845 | |
| | |
McLean County Public Building Commission, IL, 5.00%, 12/1/28 | | | 200 | | | | 220,412 | |
| | |
Miami-Dade County School District, FL, 5.00%, 3/15/28 | | | 300 | | | | 334,539 | |
| | |
Miami-Dade County, FL, 5.00%, 7/1/29 | | | 1,000 | | | | 1,126,490 | |
| | |
Milpitas Unified School District, CA, (Election of 2012), 4.00%, 8/1/32 | | | 560 | | | | 598,091 | |
| | |
Morris Township, NJ, 3.00%, 11/1/27 | | | 440 | | | | 470,620 | |
| | |
Mountain View-Los Altos Union High School District, CA, 0.00%, 8/1/27 | | | 175 | | | | 160,302 | |
| | |
| Navasota Independent School District, TX, (PSF Guaranteed): | | | | | | |
| | |
Prerefunded to 2/15/25, 5.00%, 2/15/28 | | | 195 | | | | 217,066 | |
| | |
Prerefunded to 2/15/25, 5.00%, 2/15/29 | | | 340 | | | | 378,474 | |
| | |
Prerefunded to 2/15/25, 5.00%, 2/15/30 | | | 725 | | | | 807,041 | |
| | |
Prerefunded to 2/15/25, 5.00%, 2/15/31 | | | 885 | | | | 985,147 | |
| | |
Prerefunded to 2/15/25, 5.00%, 2/15/32 | | | 720 | | | | 801,475 | |
| | | | | | | | |
| Security | | Principal
Amount
(000’s omitted) | | | Value | |
|
| General Obligations (continued) | |
| | |
| New Jersey: | | | | | | |
| | |
4.00%, 6/1/31 | | $ | 5,000 | | | $ | 5,805,450 | |
| | |
5.00%, 6/1/28 | | | 10,000 | | | | 11,912,600 | |
| | |
New York, 5.00%, 3/15/31 | | | 3,000 | | | | 3,870,300 | |
| | |
| Ohio, (Adult Correctional Building Fund): | | | | | | |
| | |
5.00%, 10/1/28 | | | 1,000 | | | | 1,218,300 | |
| | |
5.00%, 10/1/29 | | | 1,500 | | | | 1,864,500 | |
| | |
5.00%, 10/1/30 | | | 1,000 | | | | 1,266,780 | |
| | |
| Oregon: | | | | | | |
| | |
2.35%, 6/1/25 | | | 165 | | | | 171,131 | |
| | |
2.40%, 12/1/25 | | | 1,050 | | | | 1,094,635 | |
| | |
| Pasadena, TX: | | | | | | |
| | |
4.00%, 2/15/28 | | | 500 | | | | 540,245 | |
| | |
4.00%, 2/15/29 | | | 150 | | | | 161,886 | |
| | |
4.00%, 2/15/30 | | | 500 | | | | 539,310 | |
| | |
4.00%, 2/15/31 | | | 650 | | | | 700,499 | |
| | |
Pendleton School District No. 16R, Umatilla County, OR, 0.00%, 6/15/27 | | | 1,060 | | | | 968,925 | |
| | |
| Pennsylvania: | | | | | | |
| | |
4.00%, 6/15/31 | | | 135 | | | | 143,243 | |
| | |
Prerefunded to 6/1/22, 4.00%, 6/1/30 | | | 5,000 | | | | 5,059,800 | |
| | |
| Philadelphia, PA: | | | | | | |
| | |
5.00%, 2/1/26 | | | 1,150 | | | | 1,315,381 | |
| | |
5.00%, 2/1/31 | | | 1,550 | | | | 1,911,305 | |
| | |
Pittsburg Unified School District, CA, 5.00%, 8/1/28 | | | 920 | | | | 1,093,466 | |
| | |
Portland, OR, 5.00%, 6/1/30 | | | 6,515 | | | | 8,260,108 | |
| | |
| Ravenswood City School District, CA, (Election of 2016): | | | | | | |
| | |
5.00%, 8/1/25 | | | 485 | | | | 548,380 | |
| | |
5.00%, 8/1/26 | | | 505 | | | | 586,962 | |
| | |
5.00%, 8/1/27 | | | 530 | | | | 613,756 | |
| | |
5.00%, 8/1/28 | | | 555 | | | | 642,179 | |
| | |
5.00%, 8/1/29 | | | 575 | | | | 664,781 | |
| | |
Richland County School District No. 2, SC, 4.00%, 3/1/32 | | | 2,290 | | | | 2,681,269 | |
| | |
Romeo Community Schools, MI, 5.00%, 5/1/30 | | | 700 | | | | 803,985 | |
| | |
| Romulus, MI: | | | | | | |
| | |
4.00%, 11/1/31 | | | 250 | | | | 273,733 | |
| | |
4.00%, 11/1/32 | | | 100 | | | | 109,493 | |
| | |
4.00%, 11/1/33 | | | 250 | | | | 273,638 | |
| | |
SCAGO Educational Facilities Corp. for Pickens School District, SC, 5.00%, 12/1/26 | | | 1,650 | | | | 1,847,142 | |
| | |
School District 27J, Adams and Weld Counties and City and County of Broomfield, CO, 4.00%, 12/1/30 | | | 450 | | | | 495,086 | |
| | |
Seguin Independent School District, TX, (PSF Guaranteed), 4.00%, 8/15/29 | | | 300 | | | | 327,150 | |
| | | | |
| | 21 | | See Notes to Financial Statements. |
5-to-15 Year Laddered Municipal Bond Portfolio
January 31, 2022
Portfolio of Investments — continued
| | | | | | | | |
| Security | | Principal
Amount
(000’s omitted) | | | Value | |
|
| General Obligations (continued) | |
| | |
| Southfield Public Schools, MI: | | | | | | |
| | |
5.00%, 5/1/25 | | $ | 1,100 | | | $ | 1,233,485 | |
| | |
5.00%, 5/1/27 | | | 1,000 | | | | 1,183,830 | |
| | |
| St. Mary’s County, MD: | | | | | | |
| | |
5.00%, 5/1/28 | | | 1,255 | | | | 1,522,415 | |
| | |
5.00%, 5/1/30 | | | 1,245 | | | | 1,571,514 | |
| | |
| St. Vrain Valley School District RE-1J, CO: | | | | | | |
| | |
5.00%, 12/15/28 | | | 1,700 | | | | 1,993,743 | |
| | |
5.00%, 12/15/29 | | | 1,000 | | | | 1,169,700 | |
| | |
Stamford, CT, 4.00%, 8/1/27 | | | 650 | | | | 711,795 | |
| | |
| Sun Valley, ID: | | | | | | |
| | |
5.00%, 9/15/25 | | | 755 | | | | 858,095 | |
| | |
5.00%, 9/15/26 | | | 695 | | | | 812,142 | |
| | |
Tomball Independent School District, TX, (PSF Guaranteed), 4.00%, 2/15/35(2) | | | 5,000 | | | | 5,948,050 | |
| | |
| Torrance Unified School District, CA, (Election of 2014): | | | | | | |
| | |
5.00%, 8/1/30 | | | 515 | | | | 595,654 | |
| | |
5.00%, 8/1/31 | | | 450 | | | | 518,990 | |
| | |
Tuloso-Midway Independent School District, TX, (PSF
Guaranteed): | | | | | | |
| | |
4.00%, 8/15/27 | | | 510 | | | | 557,083 | |
| | |
4.00%, 8/15/28 | | | 530 | | | | 577,583 | |
| | |
4.00%, 8/15/29 | | | 545 | | | | 593,734 | |
| | |
University City School District, MO, 4.00%, 2/15/35(2) | | | 790 | | | | 897,535 | |
| | |
| Washington: | | | | | | |
| | |
5.00%, 8/1/28 | | | 1,485 | | | | 1,716,868 | |
| | |
5.00%, 8/1/29 | | | 1,400 | | | | 1,616,608 | |
| | |
| Wellesley, MA: | | | | | | |
| | |
5.00%, 4/1/30 | | | 1,990 | | | | 2,514,763 | |
| | |
5.00%, 4/1/31 | | | 1,985 | | | | 2,557,275 | |
| | |
Will and Kendall Counties Community Consolidated School District No. 202, IL, 4.00%, 1/1/27 | | | 2,825 | | | | 3,170,130 | |
| | |
Will County Community Unit School District No. 365-U, IL, 4.00%, 1/1/30 | | | 360 | | | | 395,266 | |
| | |
York County, PA, 5.00%, 6/1/27 | | | 1,225 | | | | 1,357,974 | |
| | |
| | | | | | | $ | 241,487,643 | |
|
| Hospital — 14.5% | |
| | |
Allegheny County Hospital Development Authority, PA,
(Allegheny Health Network Obligated Group): | | | | | | |
| | |
5.00%, 4/1/31 | | $ | 1,750 | | | $ | 2,077,057 | |
| | |
5.00%, 4/1/33 | | | 3,000 | | | | 3,553,290 | |
| | |
Arizona Health Facilities Authority, (Banner Health), 0.31%, (SIFMA + 0.25%), 11/4/26 (Put Date), 1/1/46(1) | | | 5,000 | | | | 5,001,800 | |
| | |
Buffalo and Erie County Industrial Land Development Corp., NY, (Catholic Health System, Inc.), 5.00%, 7/1/25 | | | 250 | | | | 271,723 | |
| | | | | | | | |
| Security | | Principal
Amount
(000’s omitted) | | | Value | |
|
| Hospital (continued) | |
| | |
California Health Facilities Financing Authority, (Adventist Health System/West), 4.00%, 3/1/27 | | $ | 90 | | | $ | 92,990 | |
| | |
California Health Facilities Financing Authority, (CommonSpirit Health), 4.00%, 4/1/36 | | | 2,870 | | | | 3,236,528 | |
| | |
California Health Facilities Financing Authority, (El Camino Hospital), 5.00%, 2/1/29 | | | 750 | | | | 880,125 | |
| | |
Clarke County Hospital Authority, GA, (Piedmont Healthcare, Inc.), 5.00%, 7/1/30 | | | 335 | | | | 385,377 | |
| | |
Cobb County Kennestone Hospital Authority, GA, (WellStar
Health System, Inc.): | | | | | | |
| | |
4.00%, 4/1/34 | | | 100 | | | | 114,414 | |
| | |
4.00%, 4/1/35 | | | 290 | | | | 330,826 | |
| | |
4.00%, 4/1/36 | | | 300 | | | | 340,947 | |
| | |
| Colorado Health Facilities Authority, (CommonSpirit Health): | | | | | | |
| | |
5.00%, 8/1/34 | | | 2,000 | | | | 2,408,180 | |
| | |
5.00%, 8/1/35 | | | 3,000 | | | | 3,603,480 | |
| | |
5.00% to 8/1/26 (Put Date), 8/1/49 | | | 5,000 | | | | 5,666,800 | |
| | |
Colorado Health Facilities Authority, (NCMC, Inc.), Escrowed to Maturity, 5.00%, 5/15/25 | | | 150 | | | | 168,210 | |
| | |
Colorado Health Facilities Authority, (Sanford Health), 5.00%, 11/1/32 | | | 3,000 | | | | 3,686,370 | |
| | |
Connecticut Health and Educational Facilities Authority,
(Stamford Hospital): | | | | | | |
| | |
4.00%, 7/1/26 | | | 600 | | | | 664,944 | |
| | |
4.00%, 7/1/27 | | | 700 | | | | 788,179 | |
| | |
4.00%, 7/1/28 | | | 650 | | | | 741,838 | |
| | |
4.00%, 7/1/29 | | | 500 | | | | 577,195 | |
| | |
4.00%, 7/1/30 | | | 750 | | | | 866,025 | |
| | |
Duluth Economic Development Authority, MN, (St. Luke’s
Hospital of Duluth Obligated Group): | | | | | | |
| | |
Series 2021A, 5.00%, 6/15/29 | | | 285 | | | | 342,103 | |
| | |
Series 2021A, 5.00%, 6/15/30 | | | 285 | | | | 347,124 | |
| | |
Series 2021A, 5.00%, 6/15/31 | | | 285 | | | | 351,630 | |
| | |
Series 2022A, 5.00%, 6/15/28(2) | | | 460 | | | | 533,756 | |
| | |
Series 2022A, 5.00%, 6/15/29(2) | | | 375 | | | | 440,944 | |
| | |
Series 2022A, 5.00%, 6/15/30(2) | | | 425 | | | | 506,808 | |
| | |
Series 2022A, 5.00%, 6/15/31(2) | | | 450 | | | | 543,902 | |
| | |
Geisinger Authority, PA, (Geisinger Health System), 5.00%, 4/1/35 | | | 6,000 | | | | 7,363,080 | |
| | |
Glynn-Brunswick Memorial Hospital Authority, GA, (Southeast Georgia Health System), 4.00%, 8/1/35 | | | 1,000 | | | | 1,143,190 | |
| | |
Greeneville Health and Educational Facilities Board, TN, (Ballad Health), 5.00%, 7/1/33 | | | 4,000 | | | | 4,214,120 | |
| | |
Illinois Finance Authority, (Riverside Health System), 5.00%, 11/15/27 | | | 500 | | | | 581,080 | |
| | |
| Illinois Finance Authority, (Rush University Medical Center): | | | | | | |
| | |
5.00%, 11/15/31 | | | 1,000 | | | | 1,105,570 | |
| | |
5.00%, 11/15/32 | | | 1,000 | | | | 1,104,890 | |
| | | | |
| | 22 | | See Notes to Financial Statements. |
5-to-15 Year Laddered Municipal Bond Portfolio
January 31, 2022
Portfolio of Investments — continued
| | | | | | | | |
| Security | | Principal
Amount
(000’s omitted) | | | Value | |
|
| Hospital (continued) | |
| | |
Kentucky Economic Development Finance Authority, (Catholic Health Initiatives), 1.46%, (SIFMA + 1.40%), 2/1/25 (Put Date), 2/1/46(1) | | $ | 12,715 | | | $ | 12,807,311 | |
| | |
Knox County Health, Educational and Housing Facility Board, TN, (University Health System, Inc.), 5.00%, 9/1/30 | | | 1,000 | | | | 1,134,260 | |
| | |
Louisiana Public Facilities Authority, (Ochsner Clinic
Foundation): | | | | | | |
| | |
5.00%, 5/15/25 | | | 250 | | | | 279,800 | |
| | |
5.00%, 5/15/26 | | | 250 | | | | 277,833 | |
| | |
5.00%, 5/15/27 | | | 250 | | | | 277,240 | |
| | |
Louisville/Jefferson County Metro Government, KY, (Norton
Healthcare, Inc.): | | | | | | |
| | |
5.00%, 10/1/30 | | | 2,000 | | | | 2,302,640 | |
| | |
5.00%, 10/1/31 | | | 1,500 | | | | 1,725,525 | |
| | |
5.00%, 10/1/32 | | | 2,000 | | | | 2,297,780 | |
| | |
Maricopa County Industrial Development Authority, AZ, (Banner Health), 0.63%, (SIFMA + 0.57%), 10/18/24 (Put Date), 1/1/35(1) | | | 4,575 | | | | 4,597,234 | |
| | |
Maryland Health and Higher Educational Facilities Authority, (MedStar Health, Inc.), 5.00%, 8/15/31 | | | 1,000 | | | | 1,106,380 | |
| | |
Massachusetts Development Finance Agency, (Berkshire Retirement Community, Inc.), 5.00%, 7/1/25 | | | 485 | | | | 520,997 | |
| | |
Massachusetts Development Finance Agency, (South Shore
Hospital): | | | | | | |
| | |
5.00%, 7/1/24 | | | 550 | | | | 596,601 | |
| | |
5.00%, 7/1/26 | | | 500 | | | | 571,735 | |
| | |
5.00%, 7/1/28 | | | 245 | | | | 278,925 | |
| | |
Medford Hospital Facilities Authority, OR, (Asante Health
System): | | | | | | |
| | |
5.00%, 8/15/34 | | | 1,000 | | | | 1,230,780 | |
| | |
5.00%, 8/15/35 | | | 700 | | | | 860,461 | |
| | |
5.00%, 8/15/36 | | | 1,000 | | | | 1,226,180 | |
| | |
Michigan Finance Authority, (Beaumont Health Credit Group), 5.00%, 8/1/28 | | | 1,315 | | | | 1,435,322 | |
| | |
Missouri Health and Educational Facilities Authority, (CoxHealth), 5.00%, 11/15/31 | | | 490 | | | | 553,558 | |
| | |
Missouri Health and Educational Facilities Authority, (Saint Luke’s Health System), 5.00%, 11/15/31 | | | 1,000 | | | | 1,139,430 | |
| | |
Monongalia County Building Commission, WV, (Monongalia
Health System Obligated Group): | | | | | | |
| | |
5.00%, 7/1/23 | | | 400 | | | | 421,528 | |
| | |
5.00%, 7/1/28 | | | 1,340 | | | | 1,487,078 | |
| | |
5.00%, 7/1/29 | | | 775 | | | | 857,863 | |
| | |
| Montgomery County, OH, (Dayton Children’s Hospital): | | | | | | |
| | |
4.00%, 8/1/36 | | | 1,000 | | | | 1,150,560 | |
| | |
4.00%, 8/1/37 | | | 1,100 | | | | 1,262,767 | |
| | |
5.00%, 8/1/31 | | | 800 | | | | 1,021,240 | |
| | | | | | | | |
| Security | | Principal
Amount
(000’s omitted) | | | Value | |
|
| Hospital (continued) | |
| | |
Montgomery County, OH, (Dayton Children’s
Hospital): (continued) | | | | | | |
| | |
5.00%, 8/1/32 | | $ | 750 | | | $ | 955,777 | |
| | |
5.00%, 8/1/33 | | | 800 | | | | 1,015,800 | |
| | |
5.00%, 8/1/34 | | | 1,150 | | | | 1,458,522 | |
| | |
5.00%, 8/1/35 | | | 1,750 | | | | 2,216,357 | |
| | |
Montgomery County, OH, (Kettering Health Network Obligated
Group): | | | | | | |
| | |
5.00%, 8/1/32 | | | 275 | | | | 344,985 | |
| | |
5.00%, 8/1/33 | | | 300 | | | | 375,606 | |
| | |
New Hampshire Health and Education Facilities Authority,
(Dartmouth-Hitchcock Obligated Group): | | | | | | |
| | |
5.00%, 8/1/25 | | | 400 | | | | 450,660 | |
| | |
5.00%, 8/1/28 | | | 500 | | | | 596,360 | |
| | |
5.00%, 8/1/29 | | | 500 | | | | 593,875 | |
| | |
New Jersey Health Care Facilities Financing Authority,
(Princeton HealthCare System): | | | | | | |
| | |
5.00%, 7/1/25 | | | 1,000 | | | | 1,126,850 | |
| | |
5.00%, 7/1/27 | | | 700 | | | | 812,749 | |
| | |
5.00%, 7/1/28 | | | 700 | | | | 811,111 | |
| | |
5.00%, 7/1/30 | | | 520 | | | | 600,122 | |
| | |
5.00%, 7/1/31 | | | 700 | | | | 805,588 | |
| | |
Norman Regional Hospital Authority, OK, 5.00%, 9/1/25 | | | 1,000 | | | | 1,125,150 | |
| | |
Oregon Facilities Authority, (Samaritan Health Services), 5.00%, 10/1/32 | | | 750 | | | | 866,355 | |
| | |
Pennsylvania Economic Development Financing Authority, (UPMC), 4.00%, 10/15/37 | | | 1,375 | | | | 1,586,255 | |
| | |
Pennsylvania Higher Educational Facilities Authority, (University of Pennsylvania Health System), 5.00%, 8/15/33 | | | 2,250 | | | | 2,765,092 | |
| | |
Pima County Industrial Development Authority, AZ, (Tucson
Medical Center): | | | | | | |
| | |
5.00%, 4/1/31 | | | 1,000 | | | | 1,264,930 | |
| | |
5.00%, 4/1/34 | | | 1,590 | | | | 2,000,951 | |
| | |
Public Finance Authority, WI, (Renown Regional Medical
Center): | | | | | | |
| | |
4.00%, 6/1/35 | | | 795 | | | | 903,017 | |
| | |
5.00%, 6/1/34 | | | 1,320 | | | | 1,618,426 | |
| | |
5.00%, 6/1/36 | | | 2,310 | | | | 2,825,523 | |
| | |
Richmond County Hospital Authority, GA, (University Health Services, Inc.), 5.00%, 1/1/28 | | | 1,000 | | | | 1,149,450 | |
| | |
Royal Oak Hospital Finance Authority, MI, (William Beaumont Hospital), 5.00%, 9/1/29 | | | 250 | | | | 269,203 | |
| | |
Southcentral Pennsylvania General Authority, (Hanover Hospital, Inc.), 4.00%, 12/1/30 | | | 150 | | | | 160,781 | |
| | |
St. Paul Housing and Redevelopment Authority, MN, (Fairview Health Services), 5.00%, 11/15/25 | | | 500 | | | | 563,670 | |
| | | | |
| | 23 | | See Notes to Financial Statements. |
5-to-15 Year Laddered Municipal Bond Portfolio
January 31, 2022
Portfolio of Investments — continued
| | | | | | | | |
| Security | | Principal
Amount
(000’s omitted) | | | Value | |
|
| Hospital (continued) | |
| | |
St. Paul Housing and Redevelopment Authority, MN, (HealthPartners Obligated Group), 5.00%, 7/1/30 | | $ | 625 | | | $ | 698,044 | |
| | |
University of Kansas Hospital Authority, (KU Health System), 5.00%, 9/1/27 | | | 1,655 | | | | 1,866,443 | |
| | |
Utah County, UT, (IHC Health Services, Inc.), 5.00% to 8/1/26 (Put Date), 5/15/60 | | | 3,500 | | | | 4,051,460 | |
| | |
Vermont Educational and Health Buildings Financing Agency,
(University of Vermont Medical Center): | | | | | | |
| | |
5.00%, 12/1/25 | | | 335 | | | | 379,696 | |
| | |
5.00%, 12/1/27 | | | 205 | | | | 234,764 | |
| | |
5.00%, 12/1/28 | | | 500 | | | | 572,145 | |
| | |
5.00%, 12/1/30 | | | 400 | | | | 457,356 | |
| | |
5.00%, 12/1/31 | | | 300 | | | | 342,609 | |
| | |
Washington Health Care Facilities Authority, (Overlake Hospital Medical Center), 5.00%, 7/1/27 | | | 1,575 | | | | 1,862,028 | |
| | |
Wisconsin Health and Educational Facilities Authority, (Agnesian HealthCare, Inc.), 5.00%, 7/1/26 | | | 400 | | | | 461,632 | |
| | |
| | | | | | | $ | 135,644,865 | |
|
| Housing — 2.1% | |
| | |
Georgia Housing & Finance Authority, 3.65%, 12/1/32 | | $ | 630 | | | $ | 660,322 | |
| | |
| Iowa Finance Authority, SFMR, (FHLMC), (FNMA), (GNMA): | | | | | | |
| | |
1.50%, 1/1/31 | | | 300 | | | | 283,242 | |
| | |
1.60%, 7/1/31 | | | 250 | | | | 237,030 | |
| | |
| Minnesota Housing Finance Agency: | | | | | | |
| | |
2019 Series A, 4.00%, 8/1/34 | | | 295 | | | | 336,123 | |
| | |
2019 Series A, 4.00%, 8/1/35 | | | 440 | | | | 500,742 | |
| | |
2019 Series C, 4.00%, 8/1/33 | | | 525 | | | | 600,731 | |
| | |
2019 Series C, 4.00%, 8/1/34 | | | 240 | | | | 274,174 | |
| | |
2019 Series C, 4.00%, 8/1/35 | | | 285 | | | | 324,344 | |
| | |
| New York City Housing Development Corp., NY: | | | | | | |
| | |
2.65%, 11/1/27 | | | 870 | | | | 899,667 | |
| | |
2.80%, 5/1/29 | | | 655 | | | | 680,866 | |
| | |
2.85%, 11/1/29 | | | 300 | | | | 312,006 | |
| | |
New York Housing Finance Agency, (FHLMC), (FNMA),
(GNMA): | | | | | | |
| | |
2.20%, 5/1/25 | | | 190 | | | | 194,020 | |
| | |
2.25%, 11/1/25 | | | 225 | | | | 230,454 | |
| | |
2.40%, 11/1/26 | | | 225 | | | | 232,002 | |
| | |
2.50%, 11/1/27 | | | 140 | | | | 144,074 | |
| | |
2.60%, 5/1/28 | | | 110 | | | | 113,463 | |
| | |
| New York Mortgage Agency: | | | | | | |
| | |
2.30%, 10/1/30 | | | 1,000 | | | | 1,001,320 | |
| | |
3.65%, 4/1/32 | | | 425 | | | | 447,988 | |
| | | | | | | | |
| Security | | Principal
Amount
(000’s omitted) | | | Value | |
|
| Housing (continued) | |
| | |
| Seattle Housing Authority, WA: | | | | | | |
| | |
2.875%, 12/1/25 | | $ | 900 | | | $ | 944,532 | |
| | |
3.00%, 12/1/26 | | | 920 | | | | 974,308 | |
| | |
Seattle Housing Authority, WA, (Northgate Plaza), 1.00%, 6/1/26 | | | 7,675 | | | | 7,494,944 | |
| | |
Tennessee Housing Development Agency, 2.80%, 7/1/26 | | | 250 | | | | 261,225 | |
| | |
Vermont Housing Finance Agency, (FHLMC), (FNMA), (GNMA), 3.85%, 11/1/33 | | | 1,163 | | | | 1,209,427 | |
| | |
Virginia Housing Development Authority, 2.55%, 5/1/27 | | | 630 | | | | 645,674 | |
| | |
| Washington Housing Finance Commission: | | | | | | |
| | |
2.25%, 6/1/25 | | | 105 | | | | 107,384 | |
| | |
2.30%, 12/1/25 | | | 130 | | | | 133,370 | |
| | |
2.40%, 6/1/26 | | | 105 | | | | 107,586 | |
| | |
| | | | | | | $ | 19,351,018 | |
|
| Insured – Education — 0.7% | |
| | |
New York Dormitory Authority, (School Districts Revenue Bond Financing Program), (AGM), 5.00%, 10/1/33 | | $ | 1,625 | | | $ | 2,011,978 | |
| | |
| Patterson Joint Unified School District, CA, (Election 2018): | | | | | | |
| | |
(BAM), 5.00%, 8/1/28 | | | 1,065 | | | | 1,228,275 | |
| | |
(BAM), 5.00%, 8/1/29 | | | 1,000 | | | | 1,150,010 | |
| | |
University of Central Florida, (AGM), 4.00%, 10/1/34 | | | 1,805 | | | | 2,121,922 | |
| | |
| | | | | | | $ | 6,512,185 | |
|
| Insured – Electric Utilities — 0.2% | |
| | |
Municipal Electric Authority of Georgia, (Plant Vogtle Units 3
and 4 Project J): | | | | | | |
| | |
(AGM), 4.00%, 1/1/36 | | $ | 335 | | | $ | 378,242 | |
| | |
(AGM), 4.00%, 1/1/37 | | | 655 | | | | 738,669 | |
| | |
Municipal Electric Authority of Georgia, (Plant Vogtle Units 3
and 4 Project M): | | | | | | |
| | |
(AGM), 4.00%, 1/1/36 | | | 435 | | | | 492,159 | |
| | |
(AGM), 4.00%, 1/1/37 | | | 470 | | | | 531,133 | |
| | |
| | | | | | | $ | 2,140,203 | |
|
| Insured – Escrowed / Prerefunded — 0.0%(3) | |
| | |
| New Britain, CT: | | | | | | |
| | |
(BAM), Escrowed to Maturity, 5.00%, 3/1/25 | | $ | 5 | | | $ | 5,573 | |
| | |
(BAM), Escrowed to Maturity, 5.00%, 3/1/25 | | | 100 | | | | 111,612 | |
| | |
| | | | | | | $ | 117,185 | |
|
| Insured – General Obligations — 1.0% | |
| | |
| Fort Bend County Municipal Utility District No. 58, TX: | | | | | | |
| | |
(BAM), 3.00%, 4/1/26 | | $ | 185 | | | $ | 194,861 | |
| | | | |
| | 24 | | See Notes to Financial Statements. |
5-to-15 Year Laddered Municipal Bond Portfolio
January 31, 2022
Portfolio of Investments — continued
| | | | | | | | |
| Security | | Principal
Amount
(000’s omitted) | | | Value | |
|
| Insured – General Obligations (continued) | |
| | |
Fort Bend County Municipal Utility District No. 58,
TX: (continued) | | | | | | |
| | |
(BAM), 3.00%, 4/1/30 | | $ | 25 | | | $ | 26,389 | |
| | |
(BAM), 3.00%, 4/1/32 | | | 360 | | | | 378,839 | |
| | |
New Britain, CT, (BAM), 5.00%, 3/1/25 | | | 135 | | | | 149,765 | |
| | |
Ogle and Winnebago Counties Community Unit School District No. 223, IL, (BAM), 4.00%, 12/1/25 | | | 470 | | | | 507,816 | |
| | |
| Pharr, TX: | | | | | | |
| | |
(AGM), 4.00%, 8/15/35 | | | 2,190 | | | | 2,585,623 | |
| | |
(AGM), 4.00%, 8/15/37 | | | 2,485 | | | | 2,923,950 | |
| | |
Pocono Mountain School District, PA, (AGM), 4.00%, 9/1/27 | | | 690 | | | | 772,531 | |
| | |
| Yonkers, NY: | | | | | | |
| | |
(BAM), Series 2019A, 5.00%, 5/1/31 | | | 750 | | | | 922,972 | |
| | |
(BAM), Series 2019B, 5.00%, 5/1/31 | | | 825 | | | | 1,015,270 | |
| | |
| | | | | | | $ | 9,478,016 | |
|
| Insured – Housing — 0.1% | |
| | |
California Municipal Finance Authority, (CHF-Davis II, LLC -
Orchard Park Student Housing): | | | | | | |
| | |
Green Bonds, (BAM), 4.00%, 5/15/35 | | $ | 600 | | | $ | 691,620 | |
| | |
Green Bonds, (BAM), 4.00%, 5/15/36 | | | 600 | | | | 690,864 | |
| | |
| | | | | | | $ | 1,382,484 | |
|
| Insured – Lease Revenue / Certificates of Participation — 0.2% | |
| | |
Clermont County Port Authority, OH, (West Clermont Local
School District): | | | | | | |
| | |
(BAM), 5.00%, 12/1/26 | | $ | 250 | | | $ | 283,455 | |
| | |
(BAM), 5.00%, 12/1/29 | | | 100 | | | | 112,624 | |
| | |
| Highlands County School Board, FL: | | | | | | |
| | |
(BAM), 5.00%, 3/1/26 | | | 400 | | | | 443,876 | |
| | |
(BAM), 5.00%, 3/1/27 | | | 200 | | | | 221,618 | |
| | |
| Pasco County School Board, FL: | | | | | | |
| | |
(BAM), 5.00%, 8/1/27 | | | 605 | | | | 700,034 | |
| | |
(BAM), 5.00%, 8/1/29 | | | 310 | | | | 355,486 | |
| | |
| | | | | | | $ | 2,117,093 | |
|
| Insured – Other Revenue — 0.4% | |
| | |
New York Dormitory Authority, School Districts Revenue Bond
Financing Program: | | | | | | |
| | |
(AGM), 5.00%, 10/1/33 | | $ | 500 | | | $ | 602,980 | |
| | |
(AGM), 5.00%, 10/1/34 | | | 1,250 | | | | 1,506,787 | |
| | |
(AGM), 5.00%, 10/1/35 | | | 1,000 | | | | 1,202,200 | |
| | |
| | | | | | | $ | 3,311,967 | |
| | | | | | | | |
| Security | | Principal
Amount
(000’s omitted) | | | Value | |
|
| Insured – Special Tax Revenue — 0.1% | |
| | |
Successor Agency to Yuba City Redevelopment Agency, CA, (AGM), 5.00%, 9/1/25 | | $ | 420 | | | $ | 473,189 | |
| | |
| Vineyard Redevelopment Agency, UT: | | | | | | |
| | |
(AGM), 4.00%, 5/1/34 | | | 115 | | | | 132,403 | |
| | |
(AGM), 4.00%, 5/1/36 | | | 135 | | | | 155,375 | |
| | |
| | | | | | | $ | 760,967 | |
|
| Insured – Transportation — 1.2% | |
| | |
| New Brunswick Parking Authority, NJ: | | | | | | |
| | |
(BAM), 5.00%, 9/1/25 | | $ | 500 | | | $ | 564,445 | |
| | |
(BAM), 5.00%, 9/1/27 | | | 375 | | | | 423,473 | |
| | |
| New Orleans Aviation Board, LA: | | | | | | |
| | |
(AGM), 5.00%, 1/1/30 | | | 1,000 | | | | 1,185,960 | |
| | |
(AGM), 5.00%, 1/1/31 | | | 1,250 | | | | 1,480,113 | |
| | |
(AGM), 5.00%, 1/1/32 | | | 1,650 | | | | 1,951,834 | |
| | |
(AGM), 5.00%, 1/1/33 | | | 2,450 | | | | 2,896,806 | |
| | |
(AGM), 5.00%, 1/1/34 | | | 2,485 | | | | 2,937,270 | |
| | |
| | | | | | | $ | 11,439,901 | |
|
| Insured – Water and Sewer — 0.1% | |
| | |
Gulf Coast Waste Disposal Authority, TX, (AGM), 5.00%, 10/1/30 | | $ | 250 | | | $ | 282,582 | |
| | |
| Hamburg Municipal Authority, PA, Sewer Revenue: | | | | | | |
| | |
(AGM), 2.00%, 10/1/32 | | | 370 | | | | 368,254 | |
| | |
(AGM), 2.00%, 10/1/34 | | | 200 | | | | 197,934 | |
| | |
(AGM), 2.00%, 10/1/36 | | | 255 | | | | 246,616 | |
| | |
Western Riverside Water and Wastewater Financing Authority, CA, (AGM), 4.00%, 9/1/28 | | | 250 | | | | 285,940 | |
| | |
| | | | | | | $ | 1,381,326 | |
|
| Lease Revenue / Certificates of Participation — 5.5% | |
| | |
Adams County, CO, Certificates of Participation, 4.00%, 12/1/28 | | $ | 1,000 | | | $ | 1,095,080 | |
| | |
| Aspen Fire Protection District, CO: | | | | | | |
| | |
4.00%, 12/1/30 | | | 235 | | | | 268,206 | |
| | |
4.00%, 12/1/31 | | | 250 | | | | 283,570 | |
| | |
4.00%, 12/1/32 | | | 205 | | | | 232,343 | |
| | |
| Broward County School Board, FL: | | | | | | |
| | |
5.00%, 7/1/25 | | | 500 | | | | 561,995 | |
| | |
5.00%, 7/1/27 | | | 500 | | | | 580,300 | |
| | |
5.00%, 7/1/29 | | | 500 | | | | 574,495 | |
| | |
| California Public Works Board: | | | | | | |
| | |
4.00%, 5/1/36 | | | 880 | | | | 1,014,411 | |
| | |
5.00%, 11/1/29 | | | 1,000 | | | | 1,157,570 | |
| | | | |
| | 25 | | See Notes to Financial Statements. |
5-to-15 Year Laddered Municipal Bond Portfolio
January 31, 2022
Portfolio of Investments — continued
| | | | | | | | |
| Security | | Principal
Amount
(000’s omitted) | | | Value | |
|
| Lease Revenue / Certificates of Participation (continued) | |
| | |
Canadian County Educational Facilities Authority, OK, (Mustang Public Schools), 5.00%, 9/1/26 | | $ | 500 | | | $ | 580,755 | |
| | |
| Colorado Department of Transportation: | | | | | | |
| | |
5.00%, 6/15/30 | | | 350 | | | | 399,140 | |
| | |
5.00%, 6/15/31 | | | 310 | | | | 353,384 | |
| | |
| Colorado, (Building Excellent Schools Today): | | | | | | |
| | |
4.00%, 3/15/37 | | | 1,000 | | | | 1,165,950 | |
| | |
5.00%, 3/15/33 | | | 1,150 | | | | 1,459,051 | |
| | |
Commonwealth Financing Authority, PA, Tobacco Master
Settlement Payment Revenue: | | | | | | |
| | |
5.00%, 6/1/25 | | | 500 | | | | 559,790 | |
| | |
5.00%, 6/1/29 | | | 3,000 | | | | 3,583,200 | |
| | |
5.00%, 6/1/30 | | | 3,000 | | | | 3,568,230 | |
| | |
Eagle County, CO, Certificates of Participation, 5.00%, 12/1/26 | | | 200 | | | | 227,164 | |
| | |
Forsyth County, NC, Limited Obligation Bonds, 5.00%, 4/1/27 | | | 1,300 | | | | 1,536,613 | |
| | |
| Fountain Valley Public Financing Authority, CA: | | | | | | |
| | |
4.00%, 11/1/25 | | | 570 | | | | 626,960 | |
| | |
4.00%, 11/1/26 | | | 595 | | | | 659,450 | |
| | |
4.00%, 11/1/27 | | | 620 | | | | 683,922 | |
| | |
4.00%, 11/1/28 | | | 645 | | | | 709,261 | |
| | |
Georgia Municipal Association, Inc., Certificates of Participation, (Atlanta Public Safety), 5.00%, 12/1/28 | | | 410 | | | | 490,446 | |
| | |
Indiana Finance Authority, (Stadium Project), (SPA: U.S. Bank, N.A.), 0.11%, 2/1/35(4) | | | 4,800 | | | | 4,800,000 | |
| | |
| Lake Houston Redevelopment Authority, TX: | | | | | | |
| | |
3.00%, 9/1/37 | | | 300 | | | | 299,253 | |
| | |
4.00%, 9/1/32 | | | 200 | | | | 225,254 | |
| | |
4.00%, 9/1/35 | | | 200 | | | | 224,174 | |
| | |
4.00%, 9/1/36 | | | 200 | | | | 223,908 | |
| | |
5.00%, 9/1/31 | | | 250 | | | | 304,148 | |
| | |
Lee County School Board, FL, Certificates of Participation, 5.00%, 8/1/32 | | | 1,495 | | | | 1,714,361 | |
| | |
Moulton Niguel Water District, CA, Certificates of Participation, 3.00%, 9/1/35 | | | 815 | | | | 881,398 | |
| | |
Oklahoma County Finance Authority, OK, (Deer Creek Public
Schools): | | | | | | |
| | |
5.00%, 12/1/25 | | | 1,405 | | | | 1,590,081 | |
| | |
5.00%, 12/1/26 | | | 2,000 | | | | 2,263,460 | |
| | |
Oklahoma County Finance Authority, OK, (Midwest City-Del
City Public Schools): | | | | | | |
| | |
5.00%, 10/1/25 | | | 1,000 | | | | 1,127,270 | |
| | |
5.00%, 10/1/26 | | | 1,000 | | | | 1,156,680 | |
| | |
Orange County School Board, FL, Prerefunded to 8/1/25, 5.00%, 8/1/32 | | | 1,935 | | | | 2,186,434 | |
| | |
Palm Beach County School Board, FL, 5.00%, 8/1/31 | | | 4,000 | | | | 4,480,320 | |
| | | | | | | | |
| Security | | Principal
Amount
(000’s omitted) | | | Value | |
|
| Lease Revenue / Certificates of Participation (continued) | |
| | |
Palo Alto, CA, Certificates of Participation, 3.00%, 11/1/32 | | $ | 2,585 | | | $ | 2,865,912 | |
| | |
Plymouth Intermediate District No. 287, MN, Certificates of Participation, 5.00%, 2/1/30 | | | 385 | | | | 440,186 | |
| | |
Public Finance Authority, WI, (KU Campus Development Corp.), 5.00%, 3/1/29 | | | 500 | | | | 567,675 | |
| | |
| Riverside County Public Financing Authority, CA: | | | | | | |
| | |
Prerefunded to 11/1/25, 5.00%, 11/1/27 | | | 850 | | | | 966,960 | |
| | |
Prerefunded to 11/1/25, 5.00%, 11/1/28 | | | 950 | | | | 1,080,720 | |
| | |
South Dakota Building Authority, 5.00%, 6/1/26 | | | 500 | | | | 575,775 | |
| | |
Virginia Public Building Authority, 4.00%, 8/1/35 | | | 1,140 | | | | 1,317,977 | |
| | |
| | | | | | | $ | 51,663,232 | |
|
| Other Revenue — 10.9% | |
| | |
Bexar County, TX, Combination Tax and Revenue Certificates of Obligation, 4.00%, 6/15/34 | | $ | 905 | | | $ | 1,017,799 | |
| | |
| Bexar County, TX, Motor Vehicle Rental Tax Revenue: | | | | | | |
| | |
4.00%, 8/15/33 | | | 690 | | | | 777,085 | |
| | |
4.00%, 8/15/34 | | | 810 | | | | 911,420 | |
| | |
4.00%, 8/15/35 | | | 510 | | | | 572,603 | |
| | |
Black Belt Energy Gas District, AL, 4.00% to 12/1/26 (Put Date), 10/1/52 | | | 18,500 | | | | 20,346,485 | |
| | |
| District of Columbia, (National Public Radio, Inc.): | | | | | | |
| | |
Prerefunded to 4/1/26, 5.00%, 4/1/28 | | | 1,000 | | | | 1,153,460 | |
| | |
Prerefunded to 4/1/26, 5.00%, 4/1/29 | | | 1,000 | | | | 1,153,460 | |
| | |
| Fort Myers, FL, Capital Improvement Revenue: | | | | | | |
| | |
5.00%, 12/1/32 | | | 825 | | | | 936,392 | |
| | |
5.00%, 12/1/33 | | | 640 | | | | 725,901 | |
| | |
5.00%, 12/1/34 | | | 510 | | | | 577,636 | |
| | |
Hudson Yards Infrastructure Corp., NY, Green Bonds, 4.00%, 2/15/37 | | | 3,400 | | | | 3,955,050 | |
| | |
Hyland Hills Park & Recreation District, CO, 5.00%, 12/15/26 | | | 150 | | | | 175,455 | |
| | |
| Kentucky Public Energy Authority, Gas Supply Revenue: | | | | | | |
| | |
4.00%, 7/1/24 | | | 5,000 | | | | 5,294,400 | |
| | |
4.00% to 2/1/28 (Put Date), 2/1/50 | | | 19,000 | | | | 21,181,960 | |
| | |
Knoxville, TN, Gas System Revenue, 4.00%, 3/1/33 | | | 3,245 | | | | 3,696,087 | |
| | |
Lancaster Port Authority, OH, Gas Supply Revenue, (Liq: Royal Bank of Canada), 5.00% to 2/1/25 (Put Date), 8/1/49 | | | 5,000 | | | | 5,526,400 | |
| | |
Louisiana Local Government Environmental Facilities and
Community Development Authority, (Bossier City): | | | | | | |
| | |
5.00%, 12/1/32 | | | 2,355 | | �� | | 2,888,101 | |
| | |
5.00%, 12/1/34 | | | 2,425 | | | | 2,963,956 | |
| | |
Louisiana Local Government Environmental Facilities and
Community Development Authority, (Jefferson Parish): | | | | | | |
| | |
5.00%, 4/1/27 | | | 500 | | | | 575,190 | |
| | |
5.00%, 4/1/29 | | | 275 | | | | 314,911 | |
| | | | |
| | 26 | | See Notes to Financial Statements. |
5-to-15 Year Laddered Municipal Bond Portfolio
January 31, 2022
Portfolio of Investments — continued
| | | | | | | | |
| Security | | Principal
Amount
(000’s omitted) | | | Value | |
|
| Other Revenue (continued) | |
| | |
Mississippi Development Bank, Special Obligation Bond, (Jackson Public School District), 5.00%, 4/1/25 | | $ | 1,270 | | | $ | 1,413,878 | |
| | |
| New York City Cultural Resources Trust, NY, (Carnegie Hall): | | | | | | |
| | |
5.00%, 12/1/27 | | | 100 | | | | 118,642 | |
| | |
5.00%, 12/1/29 | | | 325 | | | | 400,173 | |
| | |
5.00%, 12/1/31 | | | 250 | | | | 307,998 | |
| | |
5.00%, 12/1/32 | | | 550 | | | | 677,974 | |
| | |
5.00%, 12/1/33 | | | 200 | | | | 246,600 | |
| | |
5.00%, 12/1/34 | | | 300 | | | | 369,393 | |
| | |
5.00%, 12/1/35 | | | 700 | | | | 861,084 | |
| | |
New York City Educational Construction Fund, NY, 5.00%, 4/1/29 | | | 2,765 | | | | 3,381,789 | |
| | |
| New York Dormitory Authority, Personal Income Tax Revenue: | | | | | | |
| | |
4.00%, 3/15/38 | | | 1,750 | | | | 1,994,107 | |
| | |
5.00%, 3/15/36 | | | 5,000 | | | | 6,407,000 | |
| | |
Rhode Island Health and Educational Building Corp., (Barrington), 5.00%, 5/15/28 | | | 1,060 | | | | 1,248,913 | |
| | |
Tennessee Energy Acquisition Corp., Gas Project Revenue, 4.00% to 11/1/25 (Put Date), 11/1/49 | | | 5,000 | | | | 5,403,550 | |
| | |
Texas Municipal Gas Acquisition and Supply Corp. III, Gas Supply Revenue, 5.00%, 12/15/26 | | | 1,000 | | | | 1,135,830 | |
| | |
| Wisconsin, Environmental Improvement Fund Revenue: | | | | | | |
| | |
5.00%, 6/1/31 | | | 2,500 | | | | 2,796,350 | |
| | |
5.00%, 6/1/32 | | | 1,000 | | | | 1,117,840 | |
| | |
| | | | | | | $ | 102,624,872 | |
|
| Senior Living / Life Care — 1.9% | |
| | |
Atlantic Beach, FL, (Fleet Landing), 3.00%, 11/15/23 | | $ | 2,500 | | | $ | 2,500,925 | |
| | |
| Baltimore County, MD, (Riderwood Village, Inc.): | | | | | | |
| | |
4.00%, 1/1/30 | | | 1,655 | | | | 1,891,020 | |
| | |
4.00%, 1/1/31 | | | 250 | | | | 285,007 | |
| | |
4.00%, 1/1/32 | | | 350 | | | | 398,314 | |
| | |
4.00%, 1/1/33 | | | 600 | | | | 682,854 | |
| | |
4.00%, 1/1/34 | | | 685 | | | | 779,023 | |
| | |
4.00%, 1/1/35 | | | 615 | | | | 698,726 | |
| | |
Buffalo and Erie County Industrial Land Development Corp.,
NY, (Orchard Park CCRC, Inc.): | | | | | | |
| | |
5.00%, 11/15/28 | | | 50 | | | | 55,888 | |
| | |
5.00%, 11/15/30 | | | 910 | | | | 1,010,446 | |
| | |
California Statewide Communities Development Authority, (American Baptist Homes of the West), 5.00%, 10/1/25 | | | 100 | | | | 112,612 | |
| | |
Cumberland County Municipal Authority, PA, (Diakon Lutheran
Social Ministries): | | | | | | |
| | |
2.50%, 1/1/26 | | | 640 | | | | 668,960 | |
| | |
5.00%, 1/1/27 | | | 1,035 | | | | 1,174,715 | |
| | | | | | | | |
| Security | | Principal
Amount
(000’s omitted) | | | Value | |
|
| Senior Living / Life Care (continued) | |
| | |
East Hempfield Township Industrial Development Authority, PA, (Willow Valley Communities), 5.00%, 12/1/31 | | $ | 310 | | | $ | 344,497 | |
| | |
Illinois Finance Authority, (Presbyterian Homes Obligated Group), 5.00%, 5/1/22 | | | 225 | | | | 227,380 | |
| | |
Missouri Health and Educational Facilities Authority, (Lutheran
Senior Services): | | | | | | |
| | |
3.00%, 2/1/27 | | | 1,000 | | | | 1,050,030 | |
| | |
5.00%, 2/1/23 | | | 600 | | | | 623,448 | |
| | |
5.00%, 2/1/29 | | | 600 | | | | 672,498 | |
| | |
5.00%, 2/1/30 | | | 200 | | | | 223,264 | |
| | |
5.00%, 2/1/31 | | | 250 | | | | 278,470 | |
| | |
North Carolina Medical Care Commission, (The Forest at Duke), 4.00%, 9/1/41 | | | 715 | | | | 796,510 | |
| | |
North Carolina Medical Care Commission, (United Methodist
Retirement Homes): | | | | | | |
| | |
Series 2016A, 5.00%, 10/1/30 | | | 230 | | | | 262,556 | |
| | |
Series 2016A, 5.00%, 10/1/31 | | | 675 | | | | 768,271 | |
| | |
Virginia Small Business Financing Authority, (LifeSpire of Virginia), 4.00%, 12/1/31 | | | 2,000 | | | | 2,228,860 | |
| | |
| | | | | | | $ | 17,734,274 | |
|
| Special Tax Revenue — 4.3% | |
| | |
Allentown Neighborhood Improvement Zone Development
Authority, PA: | | | | | | |
| | |
5.00%, 5/1/26(2) | | $ | 500 | | | $ | 562,820 | |
| | |
5.00%, 5/1/27(2) | | | 500 | | | | 573,870 | |
| | |
5.00%, 5/1/28(2) | | | 575 | | | | 669,461 | |
| | |
5.00%, 5/1/29(2) | | | 600 | | | | 709,434 | |
| | |
5.00%, 5/1/30(2) | | | 650 | | | | 779,857 | |
| | |
5.00%, 5/1/31(2) | | | 675 | | | | 820,537 | |
| | |
5.00%, 5/1/32(2) | | | 725 | | | | 892,605 | |
| | |
| Downtown Smyrna Development Authority, GA: | | | | | | |
| | |
3.00%, 2/1/36 | | | 100 | | | | 108,765 | |
| | |
4.00%, 2/1/35 | | | 430 | | | | 507,043 | |
| | |
Los Angeles County Metropolitan Transportation Authority, CA, Sales Tax Revenue, 5.00%, 6/1/32 | | | 500 | | | | 574,865 | |
| | |
Metropolitan Atlanta Rapid Transit Authority, GA, Sales Tax Revenue, Green Bonds, 3.00%, 7/1/37 | | | 5,000 | | | | 5,267,750 | |
| | |
| Miami-Dade County, FL, Special Obligation Bonds: | | | | | | |
| | |
5.00%, 4/1/25 | | | 250 | | | | 279,893 | |
| | |
5.00%, 4/1/26 | | | 1,025 | | | | 1,180,943 | |
| | |
5.00%, 4/1/29 | | | 900 | | | | 1,031,796 | |
| | |
5.00%, 4/1/30 | | | 950 | | | | 1,086,629 | |
| | |
5.00%, 4/1/31 | | | 895 | | | | 1,022,546 | |
| | |
5.00%, 4/1/32 | | | 735 | | | | 839,429 | |
| | | | |
| | 27 | | See Notes to Financial Statements. |
5-to-15 Year Laddered Municipal Bond Portfolio
January 31, 2022
Portfolio of Investments — continued
| | | | | | | | |
| Security | | Principal
Amount
(000’s omitted) | | | Value | |
|
| Special Tax Revenue (continued) | |
| | |
New York City Transitional Finance Authority, NY, Future Tax
Revenue: | | | | | | |
| | |
4.00%, 5/1/36 | | $ | 2,000 | | | $ | 2,302,520 | |
| | |
4.00%, 11/1/36 | | | 1,000 | | | | 1,152,910 | |
| | |
5.00%, 8/1/33 | | | 1,190 | | | | 1,300,123 | |
| | |
5.00%, 2/1/36(2) | | | 3,310 | | | | 4,211,280 | |
| | |
| New York Dormitory Authority, Sales Tax Revenue: | | | | | | |
| | |
5.00%, 3/15/32 | | | 1,800 | | | | 2,030,760 | |
| | |
5.00%, 3/15/34 | | | 5,000 | | | | 5,762,500 | |
| | |
| Queen Creek, AZ, Excise Tax and State Shared Revenue: | | | | | | |
| | |
4.00%, 8/1/35 | | | 3,120 | | | | 3,651,242 | |
| | |
4.00%, 8/1/36 | | | 1,000 | | | | 1,169,020 | |
| | |
| Successor Agency to San Mateo Redevelopment Agency, CA: | | | | | | |
| | |
5.00%, 8/1/26 | | | 100 | | | | 112,008 | |
| | |
5.00%, 8/1/29 | | | 140 | | | | 155,498 | |
| | |
Tri-County Metropolitan Transportation District, OR, Payroll Tax Revenue, Prerefunded to 9/1/26, 5.00%, 9/1/32 | | | 1,000 | | | | 1,166,840 | |
| | |
| | | | | | | $ | 39,922,944 | |
|
| Transportation — 16.6% | |
| | |
Arizona Transportation Board, Highway Revenue, 5.00%, 7/1/27 | | $ | 2,005 | | | $ | 2,321,389 | |
| | |
Bay Area Toll Authority, CA, Toll Bridge Revenue, (San
Francisco Bay Area): | | | | | | |
| | |
0.36%, (SIFMA + 0.30%), 4/1/27 (Put Date), 4/1/56(1) | | | 4,000 | | | | 4,002,080 | |
| | |
2.95% to 4/1/26 (Put Date), 4/1/47 | | | 1,800 | | | | 1,890,558 | |
| | |
Central Florida Expressway Authority, 4.00%, 7/1/35 | | | 3,150 | | | | 3,469,693 | |
| | |
| Central Texas Regional Mobility Authority: | | | | | | |
| | |
4.00%, 1/1/34 | | | 200 | | | | 226,680 | |
| | |
4.00%, 1/1/36 | | | 1,490 | | | | 1,683,476 | |
| | |
5.00%, 1/1/27 | | | 2,500 | | | | 2,821,475 | |
| | |
5.00%, 1/1/36 | | | 1,130 | | | | 1,389,663 | |
| | |
| Chicago, IL, (O’Hare International Airport): | | | | | | |
| | |
4.00%, 1/1/35 | | | 5,000 | | | | 5,705,300 | |
| | |
4.00%, 1/1/36 | | | 3,500 | | | | 4,000,920 | |
| | |
5.00%, 1/1/26 | | | 1,000 | | | | 1,136,710 | |
| | |
5.00%, 1/1/28 | | | 150 | | | | 164,714 | |
| | |
5.00%, 1/1/29 | | | 150 | | | | 164,714 | |
| | |
5.00%, 1/1/30 | | | 500 | | | | 548,445 | |
| | |
5.00%, 1/1/31 | | | 1,000 | | | | 1,095,390 | |
| | |
5.00%, 1/1/33 | | | 125 | | | | 136,736 | |
| | |
5.00%, 1/1/34 | | | 7,500 | | | | 9,159,375 | |
| | |
5.25%, 1/1/28 | | | 2,905 | | | | 3,411,254 | |
| | |
5.25%, 1/1/29 | | | 3,060 | | | | 3,593,236 | |
| | |
5.25%, 1/1/30 | | | 1,000 | | | | 1,174,760 | |
| | | | | | | | |
| Security | | Principal
Amount
(000’s omitted) | | | Value | |
|
| Transportation (continued) | |
| | |
| Chicago, IL, (O’Hare International Airport): (continued) | | | | | | |
| | |
5.25%, 1/1/31 | | $ | 1,000 | | | $ | 1,174,750 | |
| | |
5.25%, 1/1/32 | | | 2,565 | | | | 3,013,388 | |
| | |
Clark County, NV, Highway Revenue, 5.00%, 7/1/33 | | | 840 | | | | 911,803 | |
| | |
Commonwealth Transportation Board, VA, 5.00%, 9/15/30 | | | 1,240 | | | | 1,440,520 | |
| | |
Denver City and County, CO, Airport System Revenue, 5.00%, 11/15/31 | | | 1,450 | | | | 1,689,540 | |
| | |
Fort Bend County, TX, Toll Road Revenue, 5.00%, 3/1/28 | | | 500 | | | | 555,325 | |
| | |
Hawaii, Highway Revenue, 5.00%, 1/1/31 | | | 805 | | | | 983,855 | |
| | |
Idaho Housing and Finance Association, Federal Highway Trust Fund, 5.00%, 7/15/25 | | | 650 | | | | 731,393 | |
| | |
| Illinois Toll Highway Authority: | | | | | | |
| | |
5.00%, 1/1/29 | | | 175 | | | | 198,924 | |
| | |
5.00%, 12/1/32 | | | 350 | | | | 394,569 | |
| | |
Kentucky Turnpike Authority, Prerefunded to 7/1/23, 5.00%, 7/1/33 | | | 300 | | | | 317,544 | |
| | |
| Maine Turnpike Authority: | | | | | | |
| | |
5.00%, 7/1/36(2) | | | 1,150 | | | | 1,472,782 | |
| | |
5.00%, 7/1/37(2) | | | 1,200 | | | | 1,533,060 | |
| | |
Massachusetts Bay Transportation Authority, 4.00%, 7/1/36 | | | 2,900 | | | | 3,411,560 | |
| | |
Massachusetts Department of Transportation, 5.00%, 1/1/30 | | | 4,235 | | | | 5,157,425 | |
| | |
| Metropolitan Transportation Authority, NY: | | | | | | |
| | |
0.364%, (67% of SOFR + 0.33%), 11/1/35(1) | | | 7,125 | | | | 7,070,707 | |
| | |
0.464%, (67% of SOFR + 0.43%), 11/1/26(1) | | | 2,500 | | | | 2,439,800 | |
| | |
5.00%, 11/15/41 | | | 415 | | | | 427,595 | |
| | |
5.25%, 11/15/30 | | | 500 | | | | 565,055 | |
| | |
Green Bonds, 4.00%, 11/15/32 | | | 5,000 | | | | 5,467,100 | |
| | |
Green Bonds, 5.00%, 11/15/25 | | | 5,000 | | | | 5,639,650 | |
| | |
Green Bonds, 5.00%, 11/15/26 | | | 5,815 | | | | 6,694,228 | |
| | |
Series 2012D, 5.00%, 11/15/28 | | | 1,070 | | | | 1,102,475 | |
| | |
Series 2015F, 5.00%, 11/15/28 | | | 640 | | | | 717,069 | |
| | |
New Orleans Aviation Board, LA, 5.00%, 1/1/28 | | | 150 | | | | 174,296 | |
| | |
New York Transportation Development Corp., (Terminal 4
John F. Kennedy International Airport): | | | | | | |
| | |
5.00%, 12/1/28 | | | 1,200 | | | | 1,410,720 | |
| | |
5.00%, 12/1/30 | | | 1,000 | | | | 1,207,680 | |
| | |
| North Carolina, Grant Anticipation Revenue Vehicle Bonds: | | | | | | |
| | |
5.00%, 3/1/29 | | | 550 | | | | 610,264 | |
| | |
5.00%, 3/1/30 | | | 400 | | | | 443,984 | |
| | |
| Pennsylvania Turnpike Commission: | | | | | | |
| | |
4.00%, 12/1/37 | | | 3,850 | | | | 4,473,892 | |
| | |
5.00%, 12/1/34 | | | 250 | | | | 314,875 | |
| | |
5.00%, 12/1/35 | | | 500 | | | | 631,865 | |
| | |
5.00%, 12/1/36 | | | 1,165 | | | | 1,455,423 | |
| | | | |
| | 28 | | See Notes to Financial Statements. |
5-to-15 Year Laddered Municipal Bond Portfolio
January 31, 2022
Portfolio of Investments — continued
| | | | | | | | |
| Security | | Principal
Amount
(000’s omitted) | | | Value | |
|
| Transportation (continued) | |
| | |
| Port Authority of New York and New Jersey: | | | | | | |
| | |
4.00%, 7/15/36 | | $ | 1,605 | | | $ | 1,833,199 | |
| | |
5.00%, 9/1/34 | | | 3,595 | | | | 4,443,672 | |
| | |
| Port of Seattle, WA: | | | | | | |
| | |
5.00%, 3/1/27 | | | 250 | | | | 273,158 | |
| | |
5.00%, 3/1/29 | | | 250 | | | | 272,825 | |
| | |
| Portland, ME, Airport Revenue: | | | | | | |
| | |
Green Bonds, 5.00%, 1/1/29 | | | 225 | | | | 268,178 | |
| | |
Green Bonds, 5.00%, 1/1/31 | | | 370 | | | | 446,856 | |
| | |
| Salt Lake City, UT, (Salt Lake City International Airport): | | | | | | |
| | |
5.00%, 7/1/28 | | | 1,370 | | | | 1,610,010 | |
| | |
5.00%, 7/1/31 | | | 300 | | | | 359,238 | |
| | |
5.00%, 7/1/32 | | | 660 | | | | 790,139 | |
| | |
5.00%, 7/1/33 | | | 600 | | | | 718,050 | |
| | |
5.00%, 7/1/34 | | | 450 | | | | 538,137 | |
| | |
San Francisco City and County Airport Commission, CA,
(San Francisco International Airport): | | | | | | |
| | |
5.00%, 5/1/35 | | | 1,950 | | | | 2,455,810 | |
| | |
5.00%, 5/1/36 | | | 1,950 | | | | 2,451,345 | |
| | |
Texas Transportation Commission, (Central Texas Turnpike
System): | | | | | | |
| | |
0.00%, 8/1/34 | | | 1,000 | | | | 661,360 | |
| | |
0.00%, 8/1/35 | | | 500 | | | | 313,410 | |
| | |
Triborough Bridge and Tunnel Authority, NY, 5.00%, 11/15/29 | | | 14,400 | | | | 16,958,304 | |
| | |
Wayne County Airport Authority, MI, (Detroit Metropolitan
Wayne County Airport): | | | | | | |
| | |
5.00%, 12/1/31 | | | 2,920 | | | | 3,541,201 | |
| | |
5.00%, 12/1/34 | | | 1,005 | | | | 1,220,371 | |
| | |
| Wisconsin, Transportation Revenue: | | | | | | |
| | |
5.00%, 7/1/31 | | | 3,450 | | | | 3,765,606 | |
| | |
Prerefunded to 7/1/24, 5.00%, 7/1/32 | | | 700 | | | | 765,261 | |
| | |
| | | | | | | $ | 155,615,814 | |
|
| Water and Sewer — 3.8% | |
| | |
| Buffalo Municipal Water Finance Authority, NY: | | | | | | |
| | |
5.00%, 7/1/25 | | $ | 300 | | | $ | 335,808 | |
| | |
5.00%, 7/1/29 | | | 115 | | | | 128,848 | |
| | |
5.00%, 7/1/30 | | | 100 | | | | 112,042 | |
| | |
Glendale, AZ, Water and Sewer Revenue, 5.00%, 7/1/28 | | | 1,500 | | | | 1,680,630 | |
| | |
| Hillsborough County, FL, Wastewater Impact Fee: | | | | | | |
| | |
5.00%, 5/1/26 | | | 3,000 | | | | 3,440,310 | |
| | |
5.00%, 5/1/27 | | | 2,315 | | | | 2,716,213 | |
| | |
5.00%, 5/1/29 | | | 1,220 | | | | 1,488,998 | |
| | |
King County, WA, Sewer Revenue, 0.29%, (SIFMA + 0.23%), 1/1/27 (Put Date), 1/1/40(1) | | | 2,500 | | | | 2,500,950 | |
| | | | | | | | |
| Security | | Principal
Amount
(000’s omitted) | | | Value | |
|
| Water and Sewer (continued) | |
| | |
Marin Public Financing Authority, CA, (Sausalito-Marin City Sanitary District), 4.00%, 4/1/32 | | $ | 575 | | | $ | 638,607 | |
| | |
McAllen, TX, Waterworks and Sewer System Revenue, 4.00%, 2/1/27 | | | 1,000 | | | | 1,093,990 | |
| | |
Memphis, TN, Sanitary Sewerage System Revenue, 4.00%, 10/1/32 | | | 1,895 | | | | 2,111,276 | |
| | |
| Mesa, AZ, Utility Systems Revenue: | | | | | | |
| | |
5.00%, 7/1/27 | | | 600 | | | | 693,288 | |
| | |
5.00%, 7/1/29 | | | 500 | | | | 575,885 | |
| | |
Portland, OR, Water System Revenue, 4.00%, 5/1/33 | | | 2,470 | | | | 2,932,532 | |
| | |
| Rapid City, SD, Water Revenue: | | | | | | |
| | |
4.00%, 11/1/29 | | | 600 | | | | 654,198 | |
| | |
4.00%, 11/1/30 | | | 670 | | | | 729,757 | |
| | |
5.00%, 11/1/27 | | | 515 | | | | 583,232 | |
| | |
Richmond, VA, Public Utility Revenue, 4.00%, 1/15/36 | | | 6,955 | | | | 8,076,563 | |
| | |
Spotsylvania County, VA, Water and Sewer System Revenue, 3.00%, 12/1/31 | | | 1,845 | | | | 2,052,267 | |
| | |
St. Joseph Industrial Development Authority, MO, (Sewerage System Improvements), 5.00%, 4/1/26 | | | 500 | | | | 558,465 | |
| | |
Western Riverside Water and Wastewater Financing Authority,
CA: | | | | | | |
| | |
4.00%, 9/1/26 | | | 435 | | | | 483,342 | |
| | |
4.00%, 9/1/27 | | | 445 | | | | 502,552 | |
| | |
| Wyoming, MI, Water Supply System Revenue: | | | | | | |
| | |
5.00%, 6/1/27 | | | 505 | | | | 584,760 | |
| | |
5.00%, 6/1/28 | | | 550 | | | | 635,355 | |
| | |
| | | | | | | $ | 35,309,868 | |
| |
Total Tax-Exempt Municipal Obligations — 97.3%
(identified cost $895,333,166) | | | $ | 912,492,288 | |
| |
Other Assets, Less Liabilities — 2.7% | | | $ | 25,558,697 | |
| | |
Net Assets — 100.0% | | | | | | $ | 938,050,985 | |
The percentage shown for each investment category in the Portfolio of Investments is based on net assets.
At January 31, 2022, the concentration of the Portfolio’s investments in the various states and territories, determined as a percentage of net assets, is as follows:
| | |
| |
| New York | | 12.2% |
| |
| Others, representing less than 10% individually | | 85.1% |
| | | | |
| | 29 | | See Notes to Financial Statements. |
5-to-15 Year Laddered Municipal Bond Portfolio
January 31, 2022
Portfolio of Investments — continued
The Portfolio invests primarily in debt securities issued by municipalities. The ability of the issuers of the debt securities to meet their obligations may be affected by economic developments in a specific industry or municipality. At January 31, 2022, 4.2% of total investments are backed by bond insurance of various financial institutions and financial guaranty assurance agencies. The aggregate percentage insured by an individual financial institution or financial guaranty assurance agency ranged from 1.1% to 3.1% of total investments.
| (1) | Floating-rate security. The stated interest rate represents the rate in effect at January 31, 2022. |
| (2) | When-issued security. |
| (3) | Amount is less than 0.05%. |
| (4) | Variable rate demand obligation that may be tendered at par on any day for payment the same or next business day. The stated interest rate, which generally resets daily, is determined by the remarketing agent and represents the rate in effect at January 31, 2022. |
Abbreviations:
| | | | |
| | |
| AGM | | – | | Assured Guaranty Municipal Corp. |
| | |
| BAM | | – | | Build America Mutual Assurance Co. |
| | |
| FHLMC | | – | | Federal Home Loan Mortgage Corp. |
| | |
| FNMA | | – | | Federal National Mortgage Association |
| | |
| GNMA | | – | | Government National Mortgage Association |
| | |
| Liq | | – | | Liquidity Provider |
| | |
| PSF | | – | | Permanent School Fund |
| | |
| SFMR | | – | | Single Family Mortgage Revenue |
| | |
| SIFMA | | – | | Securities Industry and Financial Markets Association Municipal Swap Index |
| | |
| SOFR | | – | | Secured Overnight Financing Rate |
| | |
| SPA | | – | | Standby Bond Purchase Agreement |
| | | | |
| | 30 | | See Notes to Financial Statements. |
5-to-15 Year Laddered Municipal Bond Portfolio
January 31, 2022
Statement of Assets and Liabilities
| | | | |
| Assets | | January 31, 2022 | |
| |
Unaffiliated investments, at value (identified cost, $895,333,166) | | $ | 912,492,288 | |
| |
Cash | | | 37,956,415 | |
| |
Interest receivable | | | 8,653,881 | |
| |
Receivable for investments sold | | | 8,647,316 | |
| |
Receivable from affiliates | | | 7,155 | |
| |
Total assets | | $ | 967,757,055 | |
| |
| Liabilities | | | | |
| |
Payable for when-issued securities | | $ | 29,328,170 | |
| |
Payable to affiliate: | | | | |
| |
Investment adviser fee | | | 260,006 | |
| |
Accrued expenses | | | 117,894 | |
| |
Total liabilities | | $ | 29,706,070 | |
| |
Net Assets applicable to investors’ interest in Portfolio | | $ | 938,050,985 | |
| | | | |
| | 31 | | See Notes to Financial Statements. |
5-to-15 Year Laddered Municipal Bond Portfolio
January 31, 2022
Statement of Operations
| | | | |
| Investment Income | | Year Ended January 31, 2022 | |
| |
Interest | | $ | 19,490,562 | |
| |
Total investment income | | $ | 19,490,562 | |
|
| Expenses | |
| |
Investment adviser fee | | $ | 3,057,043 | |
| |
Trustees’ fees and expenses | | | 46,919 | |
| |
Custodian fee | | | 229,942 | |
| |
Legal and accounting services | | | 57,476 | |
| |
Miscellaneous | | | 23,348 | |
| |
Total expenses | | $ | 3,414,728 | |
| |
Deduct — | | | | |
| |
Allocation of expenses to affiliates | | $ | 64,587 | |
| |
Total expense reductions | | $ | 64,587 | |
| |
Net expenses | | $ | 3,350,141 | |
| |
Net investment income | | $ | 16,140,421 | |
|
| Realized and Unrealized Gain (Loss) | |
| |
Net realized gain (loss) — | | | | |
| |
Investment transactions | | $ | 3,510,528 | |
| |
Net realized gain | | $ | 3,510,528 | |
| |
Change in unrealized appreciation (depreciation) — | | | | |
| |
Investments | | $ | (43,090,606 | ) |
| |
Net change in unrealized appreciation (depreciation) | | $ | (43,090,606 | ) |
| |
Net realized and unrealized loss | | $ | (39,580,078 | ) |
| |
Net decrease in net assets from operations | | $ | (23,439,657 | ) |
| | | | |
| | 32 | | See Notes to Financial Statements. |
5-to-15 Year Laddered Municipal Bond Portfolio
January 31, 2022
Statements of Changes in Net Assets
| | | | | | | | |
| | | Year Ended January 31, | |
| Increase (Decrease) in Net Assets | | 2022 | | | 2021 | |
| | |
From operations — | | | | | | | | |
| | |
Net investment income | | $ | 16,140,421 | | | $ | 15,352,513 | |
| | |
Net realized gain | | | 3,510,528 | | | | 4,325,390 | |
| | |
Net change in unrealized appreciation (depreciation) | | | (43,090,606 | ) | | | 17,011,685 | |
| | |
Net increase (decrease) in net assets from operations | | $ | (23,439,657 | ) | | $ | 36,689,588 | |
| | |
Capital transactions — | | | | | | | | |
| | |
Contributions | | $ | 108,966,195 | | | $ | 203,943,194 | |
| | |
Withdrawals | | | (58,460,755 | ) | | | (59,666,246 | ) |
| | |
Portfolio transaction fee | | | 250,960 | | | | 395,167 | |
| | |
Net increase in net assets from capital transactions | | $ | 50,756,400 | | | $ | 144,672,115 | |
| | |
Net increase in net assets | | $ | 27,316,743 | | | $ | 181,361,703 | |
|
| Net Assets | |
| | |
At beginning of year | | $ | 910,734,242 | | | $ | 729,372,539 | |
| | |
At end of year | | $ | 938,050,985 | | | $ | 910,734,242 | |
| | | | |
| | 33 | | See Notes to Financial Statements. |
5-to-15 Year Laddered Municipal Bond Portfolio
January 31, 2022
Financial Highlights
| | | | | | | | | | | | | | | | | | | | |
| | | Year Ended January 31, | |
| Ratios/Supplemental Data | | 2022 | | | 2021 | | | 2020 | | | 2019 | | | 2018 | |
| | | | | |
Ratios (as a percentage of average daily net assets): | | | | | | | | | | | | | | | | | | | | |
| | | | | |
Expenses(1) | | | 0.35 | % | | | 0.35 | % | | | 0.35 | % | | | 0.35 | % | | | 0.35 | % |
| | | | | |
Net investment income | | | 1.69 | % | | | 1.94 | % | | | 2.17 | % | | | 2.16 | % | | | 2.01 | % |
| | | | | |
Portfolio Turnover | | | 22 | % | | | 51 | % | | | 28 | % | | | 78 | % | | | 35 | % |
| | | | | |
Total Return(1) | | | (2.44 | )% | | | 4.66 | % | | | 7.88 | % | | | 3.11 | % | | | 3.83 | % |
| | | | | |
Net assets, end of year (000’s omitted) | | $ | 938,051 | | | $ | 910,734 | | | $ | 729,373 | | | $ | 612,428 | | | $ | 676,300 | |
| (1) | The investment adviser and sub-adviser reimbursed certain operating expenses (equal to 0.01% of average daily net assets for each of the years ended January 31, 2022, 2021, 2020, 2019 and 2018). Absent this reimbursement, total return would be lower. |
| | | | |
| | 34 | | See Notes to Financial Statements. |
5-to-15 Year Laddered Municipal Bond Portfolio
January 31, 2022
Notes to Financial Statements
1 Significant Accounting Policies
5-to-15 Year Laddered Municipal Bond Portfolio (the Portfolio) is a Massachusetts business trust registered under the Investment Company Act of 1940, as amended (the 1940 Act), as a diversified, open-end management investment company. The Portfolio’s investment objective is to seek current income exempt from regular federal income tax. The Declaration of Trust permits the Trustees to issue interests in the Portfolio. At January 31, 2022, Parametric TABS 5-to-15 Year Laddered Municipal Bond Fund and Eaton Vance TABS 5-to-15 Year Laddered Municipal Bond NextShares held an interest of 99.9% and 0.1%, respectively, in the Portfolio.
The following is a summary of significant accounting policies of the Portfolio. The policies are in conformity with accounting principles generally accepted in the United States of America (U.S. GAAP). The Portfolio is an investment company and follows accounting and reporting guidance in the Financial Accounting Standards Board (FASB) Accounting Standards Codification Topic 946.
A Investment Valuation — The following methodologies are used to determine the market value or fair value of investments.
Debt Obligations. Debt obligations are generally valued on the basis of valuations provided by third party pricing services, as derived from such services’ pricing models. Inputs to the models may include, but are not limited to, reported trades, executable bid and ask prices, broker/dealer quotations, prices or yields of securities with similar characteristics, interest rates, anticipated prepayments, benchmark curves or information pertaining to the issuer, as well as industry and economic events. The pricing services may use a matrix approach, which considers information regarding securities with similar characteristics to determine the valuation for a security. Short-term debt obligations purchased with a remaining maturity of sixty days or less for which a valuation from a third party pricing service is not readily available may be valued at amortized cost, which approximates fair value.
Fair Valuation. Investments for which valuations or market quotations are not readily available or are deemed unreliable are valued at fair value using methods determined in good faith by or at the direction of the Trustees of the Portfolio in a manner that most fairly reflects the security’s “fair value”, which is the amount that the Portfolio might reasonably expect to receive for the security upon its current sale in the ordinary course. Each such determination is based on a consideration of relevant factors, which are likely to vary from one pricing context to another. These factors may include, but are not limited to, the type of security, the existence of any contractual restrictions on the security’s disposition, the price and extent of public trading in similar securities of the issuer or of comparable entities, quotations or relevant information obtained from broker/dealers or other market participants, information obtained from the issuer, analysts, and/or the appropriate stock exchange (for exchange-traded securities), an analysis of the entity’s financial statements, and an evaluation of the forces that influence the issuer and the market(s) in which the security is purchased and sold.
B Investment Transactions — Investment transactions for financial statement purposes are accounted for on a trade date basis. Realized gains and losses on investments sold are determined on the basis of identified cost.
C Income — Interest income is recorded on the basis of interest accrued, adjusted for amortization of premium or accretion of discount.
D Federal Taxes — The Portfolio has elected to be treated as a partnership for federal tax purposes. No provision is made by the Portfolio for federal or state taxes on any taxable income of the Portfolio because each investor in the Portfolio is ultimately responsible for the payment of any taxes on its share of taxable income. Since at least one of the Portfolio’s investors is a regulated investment company that invests all or substantially all of its assets in the Portfolio, the Portfolio normally must satisfy the applicable source of income and diversification requirements (under the Internal Revenue Code) in order for its investors to satisfy them. The Portfolio will allocate, at least annually among its investors, each investor’s distributive share of the Portfolio’s net investment income, net realized capital gains and losses and any other items of income, gain, loss, deduction or credit.
As of January 31, 2022, the Portfolio had no uncertain tax positions that would require financial statement recognition, de-recognition, or disclosure. The Portfolio files a U.S. federal income tax return annually after its fiscal year-end, which is subject to examination by the Internal Revenue Service for a period of three years from the date of filing.
E Use of Estimates — The preparation of the financial statements in conformity with U.S. GAAP requires management to make estimates and assumptions that affect the reported amounts of assets and liabilities at the date of the financial statements and the reported amounts of income and expense during the reporting period. Actual results could differ from those estimates.
F Indemnifications — Under the Portfolio’s organizational documents, its officers and Trustees may be indemnified against certain liabilities and expenses arising out of the performance of their duties to the Portfolio. Under Massachusetts law, if certain conditions prevail, interestholders in the Portfolio could be deemed to have personal liability for the obligations of the Portfolio. However, the Portfolio’s Declaration of Trust contains an express disclaimer of liability on the part of Portfolio interestholders. Additionally, in the normal course of business, the Portfolio enters into agreements with service providers that may contain indemnification clauses. The Portfolio’s maximum exposure under these arrangements is unknown as this would involve future claims that may be made against the Portfolio that have not yet occurred.
G When-Issued Securities and Delayed Delivery Transactions — The Portfolio may purchase securities on a delayed delivery or when issued basis. Payment and delivery may take place after the customary settlement period for that security. At the time the transaction is negotiated, the price of the security that will be delivered is fixed. The Portfolio maintains cash and/or security positions for these commitments such that sufficient liquid assets will be available to make payments upon settlement. Securities purchased on a delayed delivery or when-issued basis are marked-to-market daily and begin
5-to-15 Year Laddered Municipal Bond Portfolio
January 31, 2022
Notes to Financial Statements — continued
earning interest on settlement date. Such security purchases are subject to the risk that when delivered they will be worth less than the agreed upon payment price. Losses may also arise if the counterparty does not perform under the contract.
H Capital Transactions — To seek to protect the Portfolio (and, indirectly, other investors in the Portfolio) against the costs of accommodating investor inflows and outflows, the Portfolio imposes a fee (“Portfolio transaction fee”) on inflows and outflows by Portfolio investors. The Portfolio transaction fee is sized to cover the estimated cost to the Portfolio of, in connection with issuing interests, converting the cash and/or other instruments it receives to the desired composition and, in connection with redeeming its interests, converting Portfolio holdings to cash and/or other instruments to be distributed. Such fee, which may vary over time, is limited to amounts that have been authorized by the Board of Trustees and determined by Eaton Vance Management (EVM) to be appropriate. The maximum Portfolio transaction fee is 2% of the amount of net contributions or withdrawals. The Portfolio transaction fee is recorded as a component of capital transactions on the Statements of Changes in Net Assets.
2 Investment Adviser Fee and Other Transactions with Affiliates
The investment adviser fee is earned by Boston Management and Research (BMR) as compensation for investment advisory services rendered to the Portfolio. On March 1, 2021, Morgan Stanley acquired Eaton Vance Corp. (the “Transaction”) and BMR became an indirect, wholly-owned subsidiary of Morgan Stanley. In connection with the Transaction, the Portfolio entered into a new investment advisory agreement (the “New Agreement”) with BMR, which took effect on March 1, 2021. The Portfolio’s prior fee reduction agreement was incorporated into the New Agreement. Pursuant to the New Agreement (and the Portfolio’s investment advisory agreement and related fee reduction agreement with BMR in effect prior to March 1, 2021), the investment adviser fee is computed at an annual rate as a percentage of the Portfolio’s average daily net assets as follows and is payable monthly:
| | | | |
| Average Daily Net Assets | | Annual Fee
Rate | |
| |
Up to $1 billion | | | 0.3200 | % |
| |
$1 billion but less than $2.5 billion | | | 0.3075 | % |
| |
$2.5 billion but less than $5 billion | | | 0.2950 | % |
| |
$5 billion and over | | | 0.2875 | % |
For the year ended January 31, 2022, the Portfolio’s investment adviser fee amounted to $3,057,043 or 0.32% of the Portfolio’s average daily net assets. Pursuant to an investment sub-advisory agreement, BMR has delegated the investment management of the Portfolio to Parametric Portfolio Associates LLC (Parametric), an affiliate of BMR and, effective March 1, 2021, an indirect, wholly-owned subsidiary of Morgan Stanley. In connection with the Transaction, BMR entered into a new investment sub-advisory agreement with Parametric, which took effect on March 1, 2021. BMR pays Parametric a portion of its investment adviser fee for sub-advisory services provided to the Portfolio. Pursuant to a voluntary expense reimbursement, BMR and Parametric were allocated $64,587 in total of the Portfolio’s operating expenses for the year ended January 31, 2022.
Trustees and officers of the Portfolio who are members of EVM’s or BMR’s organizations receive remuneration for their services to the Portfolio out of the investment adviser fee. Trustees of the Portfolio who are not affiliated with the investment adviser may elect to defer receipt of all or a percentage of their annual fees in accordance with the terms of the Trustees Deferred Compensation Plan. For the year ended January 31, 2022, no significant amounts have been deferred. Certain officers and Trustees of the Portfolio are officers of the above organizations.
3 Purchases and Sales of Investments
Purchases and sales of investments, other than short-term obligations, aggregated $359,890,505 and $193,607,861, respectively, for the year ended January 31, 2022.
4 Federal Income Tax Basis of Investments
The cost and unrealized appreciation (depreciation) of investments of the Portfolio at January 31, 2022, as determined on a federal income tax basis, were as follows:
| | | | |
| |
Aggregate cost | | $ | 895,298,175 | |
| |
Gross unrealized appreciation | | $ | 26,968,619 | |
| |
Gross unrealized depreciation | | | (9,774,506 | ) |
| |
Net unrealized appreciation | | $ | 17,194,113 | |
5-to-15 Year Laddered Municipal Bond Portfolio
January 31, 2022
Notes to Financial Statements — continued
5 Line of Credit
The Portfolio participates with other portfolios and funds managed by EVM and its affiliates in an $800 million unsecured line of credit agreement with a group of banks, which is in effect through October 25, 2022. Borrowings are made by the Portfolio solely for temporary purposes related to redemptions and other short-term cash needs. Interest is charged to the Portfolio based on its borrowings at an amount above either the Secured Overnight Financing Rate (SOFR) or Federal Funds rate. In addition, a fee computed at an annual rate of 0.15% on the daily unused portion of the line of credit is allocated among the participating portfolios and funds at the end of each quarter. In connection with the renewal of the agreement in October 2021, an arrangement fee totaling $150,000 was incurred that was allocated to the participating portfolios and funds. Because the line of credit is not available exclusively to the Portfolio, it may be unable to borrow some or all of its requested amounts at any particular time. The Portfolio did not have any significant borrowings or allocated fees during the year ended January 31, 2022.
6 Fair Value Measurements
Under generally accepted accounting principles for fair value measurements, a three-tier hierarchy to prioritize the assumptions, referred to as inputs, is used in valuation techniques to measure fair value. The three-tier hierarchy of inputs is summarized in the three broad levels listed below.
| • | | Level 1 – quoted prices in active markets for identical investments |
| • | | Level 2 – other significant observable inputs (including quoted prices for similar investments, interest rates, prepayment speeds, credit risk, etc.) |
| • | | Level 3 – significant unobservable inputs (including a fund’s own assumptions in determining the fair value of investments) |
In cases where the inputs used to measure fair value fall in different levels of the fair value hierarchy, the level disclosed is determined based on the lowest level input that is significant to the fair value measurement in its entirety. The inputs or methodology used for valuing securities are not necessarily an indication of the risk associated with investing in those securities.
At January 31, 2022, the hierarchy of inputs used in valuing the Portfolio’s investments, which are carried at value, were as follows:
| | | | | | | | | | | | | | | | |
| Asset Description | | Level 1 | | | Level 2 | | | Level 3 | | | Total | |
| | | | |
Tax-Exempt Municipal Obligations | | $ | — | | | $ | 912,492,288 | | | $ | — | | | $ | 912,492,288 | |
| | | | |
Total Investments | | $ | — | | | $ | 912,492,288 | | | $ | — | | | $ | 912,492,288 | |
7 Risks and Uncertainties
Pandemic Risk
An outbreak of respiratory disease caused by a novel coronavirus was first detected in China in late 2019 and subsequently spread internationally. This coronavirus has resulted in closing borders, enhanced health screenings, changes to healthcare service preparation and delivery, quarantines, cancellations, disruptions to supply chains and customer activity, as well as general concern and uncertainty. Health crises caused by outbreaks, such as the coronavirus outbreak, may exacerbate other pre-existing political, social and economic risks and disrupt normal market conditions and operations. The impact of this outbreak has negatively affected the worldwide economy, the economies of individual countries, individual companies, and the market in general, and may continue to do so in significant and unforeseen ways, as may other epidemics and pandemics that may arise in the future. Any such impact could adversely affect the Portfolio’s performance, or the performance of the securities in which the Portfolio invests.
5-to-15 Year Laddered Municipal Bond Portfolio
January 31, 2022
Report of Independent Registered Public Accounting Firm
To the Trustees and Investors of 5-to-15 Year Laddered Municipal Bond Portfolio:
Opinion on the Financial Statements and Financial Highlights
We have audited the accompanying statement of assets and liabilities of 5-to-15 Year Laddered Municipal Bond Portfolio (the “Portfolio”), including the portfolio of investments, as of January 31, 2022, the related statement of operations for the year then ended, the statements of changes in net assets for each of the two years in the period then ended, the financial highlights for each of the five years in the period then ended, and the related notes. In our opinion, the financial statements and financial highlights present fairly, in all material respects, the financial position of the Portfolio as of January 31, 2022, and the results of its operations for the year then ended, the changes in its net assets for each of the two years in the period then ended, and the financial highlights for each of the five years in the period then ended, in conformity with accounting principles generally accepted in the United States of America.
Basis for Opinion
These financial statements and financial highlights are the responsibility of the Portfolio’s management. Our responsibility is to express an opinion on the Portfolio’s financial statements and financial highlights based on our audits. We are a public accounting firm registered with the Public Company Accounting Oversight Board (United States) (PCAOB) and are required to be independent with respect to the Portfolio in accordance with the U.S. federal securities laws and the applicable rules and regulations of the Securities and Exchange Commission and the PCAOB.
We conducted our audits in accordance with the standards of the PCAOB. Those standards require that we plan and perform the audit to obtain reasonable assurance about whether the financial statements and financial highlights are free of material misstatement, whether due to error or fraud. The Portfolio is not required to have, nor were we engaged to perform, an audit of its internal control over financial reporting. As part of our audits, we are required to obtain an understanding of internal control over financial reporting but not for the purpose of expressing an opinion on the effectiveness of the Portfolio’s internal control over financial reporting. Accordingly, we express no such opinion.
Our audits included performing procedures to assess the risks of material misstatement of the financial statements and financial highlights, whether due to error or fraud, and performing procedures that respond to those risks. Such procedures included examining, on a test basis, evidence regarding the amounts and disclosures in the financial statements and financial highlights. Our audits also included evaluating the accounting principles used and significant estimates made by management, as well as evaluating the overall presentation of the financial statements and financial highlights. Our procedures included confirmation of securities owned as of January 31, 2022, by correspondence with the custodian and brokers; when replies were not received from brokers, we performed other auditing procedures. We believe that our audits provide a reasonable basis for our opinion.
/s/ Deloitte & Touche LLP
Boston, Massachusetts
March 23, 2022
We have served as the auditor of one or more Eaton Vance investment companies since 1959.
Parametric
TABS 5-to-15 Year Laddered Municipal Bond Fund
January 31, 2022
Management and Organization
Fund Management. The Trustees of Eaton Vance Municipals Trust II (the Trust) and 5-to-15 Year Laddered Municipal Bond Portfolio (the Portfolio) are responsible for the overall management and supervision of the Trust’s and the Portfolio’s affairs. The Board members and officers of the Trust and the Portfolio are listed below. Except as indicated, each individual has held the office shown or other offices in the same company for the last five years. Board members hold indefinite terms of office. Each Trustee holds office until his or her successor is elected and qualified, subject to a prior death, resignation, retirement, disqualification or removal. Under the terms of the Fund’s and the Portfolio’s current Trustee retirement policy, an Independent Trustee must retire and resign as a Trustee on the earlier of: (i) the first day of July following his or her 74th birthday; or (ii), with limited exception, December 31st of the 20th year in which he or she has served as a Trustee. However, if such retirement and resignation would cause the Fund or Portfolio to be out of compliance with Section 16 of the 1940 Act or any other regulations or guidance of the SEC, then such retirement and resignation will not become effective until such time as action has been taken for the Fund or Portfolio to be in compliance therewith. The “noninterested Trustees” consist of those Trustees who are not “interested persons” of the Trust and the Portfolio, as that term is defined under the 1940 Act. The business address of each Board member and officer is Two International Place, Boston, Massachusetts 02110. As used below, “BMR” refers to Boston Management and Research, “EVC” refers to Eaton Vance Corp., “EV” refers to EV LLC, “EVM” refers to Eaton Vance Management and “EVD” refers to Eaton Vance Distributors, Inc. EV is the trustee of each of EVM and BMR. Effective March 1, 2021, each of EVM, BMR, EVD and EV are indirect, wholly-owned subsidiaries of Morgan Stanley. Each officer affiliated with EVM may hold a position with other EVM affiliates that is comparable to his or her position with EVM listed below. Each Trustee oversees 138 funds (with the exception of Messrs. Faust and Wennerholm and Ms. Frost who oversee 137 funds) in the Eaton Vance fund complex (including both funds and portfolios in a hub and spoke structure).
| | | | | | |
| Name and Year of Birth | | Trust/Portfolio
Position(s) | | Length of Service | | Principal Occupation(s) and Other Directorships During Past Five Years and Other Relevant Experience |
|
| Interested Trustee |
| | | |
Thomas E. Faust Jr. 1958 | | Trustee | | Since 2007 | | Chairman of Morgan Stanley Investment Management, Inc. (MSIM), member of the Board of Managers and President of EV, Chief Executive Officer of EVM and BMR, and Director of EVD. Formerly, Chairman, Chief Executive Officer and President of EVC. Mr. Faust is an interested person because of his positions with MSIM, BMR, EVM, EVD, and EV, which are affiliates of the Trust and the Portfolio, and his former position with EVC, which was an affiliate of the Trust and the Portfolio prior to March 1, 2021. Other Directorships. Formerly, Director of EVC (2007-2021) and Hexavest Inc. (investment management firm) (2012-2021). |
|
| Noninterested Trustees |
| | | |
Mark R. Fetting 1954 | | Trustee | | Since 2016 | | Private investor. Formerly held various positions at Legg Mason, Inc. (investment management firm) (2000-2012), including President, Chief Executive Officer, Director and Chairman (2008-2012), Senior Executive Vice President (2004-2008) and Executive Vice President (2001-2004). Formerly, President of Legg Mason family of funds (2001-2008). Formerly, Division President and Senior Officer of Prudential Financial Group, Inc. and related companies (investment management firm) (1991-2000). Other Directorships. None. |
| | | |
Cynthia E. Frost 1961 | | Trustee | | Since 2014 | | Private investor. Formerly, Chief Investment Officer of Brown University (university endowment) (2000-2012). Formerly, Portfolio Strategist for Duke Management Company (university endowment manager) (1995-2000). Formerly, Managing Director, Cambridge Associates (investment consulting company) (1989-1995). Formerly, Consultant, Bain and Company (management consulting firm) (1987-1989). Formerly, Senior Equity Analyst, BA Investment Management Company (1983-1985). Other Directorships. None. |
| | | |
George J. Gorman 1952 | | Chairperson of the Board and Trustee | | Since 2021 (Chairperson) and 2014 (Trustee) | | Principal at George J. Gorman LLC (consulting firm). Formerly, Senior Partner at Ernst & Young LLP (a registered public accounting firm) (1974-2009). Other Directorships. None. |
Parametric
TABS 5-to-15 Year Laddered Municipal Bond Fund
January 31, 2022
Management and Organization — continued
| | | | | | |
| Name and Year of Birth | | Trust/Portfolio
Position(s) | | Length of Service | | Principal Occupation(s) and Other Directorships During Past Five Years and Other Relevant Experience |
|
| Noninterested Trustees (continued) |
| | | |
Valerie A. Mosley 1960 | | Trustee | | Since 2014 | | Chairwoman and Chief Executive Officer of Valmo Ventures (a consulting and investment firm). Founder of Upward Wealth, Inc., dba BrightUP, a fintech platform. Formerly, Partner and Senior Vice President, Portfolio Manager and Investment Strategist at Wellington Management Company, LLP (investment management firm) (1992-2012). Formerly, Chief Investment Officer, PG Corbin Asset Management (1990-1992). Formerly worked in institutional corporate bond sales at Kidder Peabody (1986-1990). Other Directorships. Director of DraftKings, Inc. (digital sports entertainment and gaming company) (since September 2020). Director of Groupon, Inc. (e-commerce provider) (since April 2020). Director of Envestnet, Inc. (provider of intelligent systems for wealth management and financial wellness) (since 2018). Formerly, Director of Dynex Capital, Inc. (mortgage REIT) (2013-2020). |
| | | |
William H. Park 1947 | | Trustee | | Since 2003 | | Private investor. Formerly, Consultant (management and transactional) (2012-2014). Formerly, Chief Financial Officer, Aveon Group L.P. (investment management firm) (2010-2011). Formerly, Vice Chairman, Commercial Industrial Finance Corp. (specialty finance company) (2006-2010). Formerly, President and Chief Executive Officer, Prizm Capital Management, LLC (investment management firm) (2002-2005). Formerly, Executive Vice President and Chief Financial Officer, United Asset Management Corporation (investment management firm) (1982-2001). Formerly, Senior Manager, Price Waterhouse (now PricewaterhouseCoopers) (a registered public accounting firm) (1972-1981). Other Directorships. None. |
| | | |
Helen Frame Peters 1948 | | Trustee | | Since 2008 | | Professor of Finance, Carroll School of Management, Boston College. Formerly, Dean, Carroll School of Management, Boston College (2000-2002). Formerly, Chief Investment Officer, Fixed Income, Scudder Kemper Investments (investment management firm) (1998-1999). Formerly, Chief Investment Officer, Equity and Fixed Income, Colonial Management Associates (investment management firm) (1991-1998). Other Directorships. None. |
| | | |
Keith Quinton 1958 | | Trustee | | Since 2018 | | Private investor, researcher and lecturer. Formerly, Independent Investment Committee Member at New Hampshire Retirement System (2017-2021). Formerly, Portfolio Manager and Senior Quantitative Analyst at Fidelity Investments (investment management firm) (2001-2014). Other Directorships. Formerly, Director (2016-2021) and Chairman (2019-2021) of New Hampshire Municipal Bond Bank. |
| | | |
Marcus L. Smith 1966 | | Trustee | | Since 2018 | | Private investor and independent corporate director. Formerly, Chief Investment Officer, Canada (2012-2017), Chief Investment Officer, Asia (2010-2012), Director of Asian Research (2004-2010), and portfolio manager (2001-2017) at MFS Investment Management (investment management firm). Other Directorships. Director of First Industrial Realty Trust, Inc. (an industrial REIT) (since 2021). Director of MSCI Inc. (global provider of investment decision support tools) (since 2017). Formerly, Director of DCT Industrial Trust Inc. (logistics real estate company) (2017-2018). |
| | | |
Susan J. Sutherland 1957 | | Trustee | | Since 2015 | | Private investor. Director of Ascot Group Limited and certain of its subsidiaries (insurance and reinsurance) (since 2017). Formerly, Director of Hagerty Holding Corp. (insurance) (2015-2018) and Montpelier Re Holdings Ltd. (insurance and reinsurance) (2013-2015). Formerly, Associate, Counsel and Partner at Skadden, Arps, Slate, Meagher & Flom LLP (law firm) (1982-2013). Other Directorships. Director of Kairos Acquisition Corp. (insurance/InsurTech acquisition company) (since 2021). |
| | | |
Scott E. Wennerholm 1959 | | Trustee | | Since 2016 | | Private investor. Formerly, Trustee at Wheelock College (postsecondary institution) (2012-2018). Formerly, Consultant at GF Parish Group (executive recruiting firm) (2016-2017). Formerly, Chief Operating Officer and Executive Vice President at BNY Mellon Asset Management (investment management firm) (2005-2011). Formerly, Chief Operating Officer and Chief Financial Officer at Natixis Global Asset Management (investment management firm) (1997-2004). Formerly, Vice President at Fidelity Investments Institutional Services (investment management firm) (1994-1997). Other Directorships. None. |
Parametric
TABS 5-to-15 Year Laddered Municipal Bond Fund
January 31, 2022
Management and Organization — continued
| | | | | | |
| Name and Year of Birth | | Trust/Portfolio
Position(s) | | Length of Service | | Principal Occupation(s) During Past Five Years |
|
| Principal Officers who are not Trustees |
| | | |
Eric A. Stein 1980 | | President of the Trust | | Since 2020 | | Vice President and Chief Investment Officer, Fixed Income of EVM and BMR. Prior to November 1, 2020, Mr. Stein was a co-Director of Eaton Vance’s Global Income Investments. Also Vice President of Calvert Research and Management (“CRM”). |
| | | |
Deidre E. Walsh 1971 | | Vice President and Chief Legal Officer | | Since 2009 | | Vice President of EVM and BMR. Also Vice President of CRM. |
| | | |
James F. Kirchner 1967 | | Treasurer | | Since 2007 | | Vice President of EVM and BMR. Also Vice President of CRM. |
| | | |
Jill R. Damon 1984 | | Secretary | | Since 2022 | | Vice President of EVM and BMR since 2017. Formerly, associate at Dechert LLP (2009-2017). |
| | | |
Richard F. Froio 1968 | | Chief Compliance Officer | | Since 2017 | | Vice President of EVM and BMR since 2017. Formerly, Deputy Chief Compliance Officer (Adviser/Funds) and Chief Compliance Officer (Distribution) at PIMCO (2012-2017) and Managing Director at BlackRock/Barclays Global Investors (2009-2012). |
The SAI for the Fund includes additional information about the Trustees and officers of the Trust and the Portfolio and can be obtained without charge on Eaton Vance’s website at www.eatonvance.com or by calling 1-800-260-0761.
Eaton Vance Funds
| | |
| Privacy Notice | | April 2021 |
| | |
| |
| FACTS | | WHAT DOES EATON VANCE DO WITH YOUR
PERSONAL INFORMATION? |
| | | |
| |
| | |
| Why? | | Financial companies choose how they share your personal information. Federal law gives consumers the right to limit some but not all sharing. Federal law also requires us to tell you how we collect, share, and protect your personal information. Please read this notice carefully to understand what we do. |
| | |
| | | |
| What? | | The types of personal information we collect and share depend on the product or service you have with us. This information can include: ∎ Social Security number and income ∎ investment experience and risk tolerance ∎ checking account number and wire transfer instructions |
| | |
| | | |
| How? | | All financial companies need to share customers’ personal information to run their everyday business. In the section below, we list the reasons financial companies can share their customers’ personal information; the reasons Eaton Vance chooses to share; and whether you can limit this sharing. |
| | |
| | | |
| | | | |
Reasons we can share your
personal information | | Does Eaton Vance share? | | Can you limit this sharing? |
| For our everyday business purposes — such as to process your transactions, maintain your account(s), respond to court orders and legal investigations, or report to credit bureaus | | Yes | | No |
| For our marketing purposes — to offer our products and services to you | | Yes | | No |
| For joint marketing with other financial companies | | No | | We don’t share |
| For our investment management affiliates’ everyday business purposes — information about your transactions, experiences, and creditworthiness | | Yes | | Yes |
| For our affiliates’ everyday business purposes — information about your transactions and experiences | | Yes | | No |
| For our affiliates’ everyday business purposes — information about your creditworthiness | | No | | We don’t share |
| For our investment management affiliates to market to you | | Yes | | Yes |
| For our affiliates to market to you | | No | | We don’t share |
| For nonaffiliates to market to you | | No | | We don’t share |
| | |
| To limit our sharing | | Call toll-free 1-800-262-1122 or email: EVPrivacy@eatonvance.com Please note: If you are a new customer, we can begin sharing your information 30 days from the date we sent this notice. When you are no longer our customer, we continue to share your information as described in this notice. However, you can contact us at any time to limit our sharing. |
| | |
| | | |
| | |
| Questions? | | Call toll-free 1-800-262-1122 or email: EVPrivacy@eatonvance.com |
| | |
| | | |
Eaton Vance Funds
| | |
| Privacy Notice — continued | | April 2021 |
| | |
| Who we are |
| Who is providing this notice? | | Eaton Vance Management, Eaton Vance Distributors, Inc., Eaton Vance Trust Company, Eaton Vance Management (International) Limited, Eaton Vance Advisers International Ltd., Eaton Vance Global Advisors Limited, Eaton Vance Management’s Real Estate Investment Group, Boston Management and Research, Calvert Research and Management, Eaton Vance and Calvert Fund Families and our investment advisory affiliates (“Eaton Vance”) (see Investment Management Affiliates definition below) |
| What we do |
| How does Eaton Vance protect my personal information? | | To protect your personal information from unauthorized access and use, we use security measures that comply with federal law. These measures include computer safeguards and secured files and buildings. We have policies governing the proper handling of customer information by personnel and requiring third parties that provide support to adhere to appropriate security standards with respect to such information. |
| How does Eaton Vance collect my personal information? | | We collect your personal information, for example, when you ∎ open an account or make deposits or withdrawals from your account ∎ buy securities from us or make a wire transfer ∎ give us your contact information We also collect your personal information from others, such as credit bureaus, affiliates, or other companies. |
| Why can’t I limit all sharing? | | Federal law gives you the right to limit only ∎ sharing for affiliates’ everyday business purposes — information about your creditworthiness ∎ affiliates from using your information to market to you ∎ sharing for nonaffiliates to market to you State laws and individual companies may give you additional rights to limit sharing. See below for more on your rights under state law. |
| Definitions |
| Investment Management Affiliates | | Eaton Vance Investment Management Affiliates include registered investment advisers, registered broker-dealers, and registered and unregistered funds. Investment Management Affiliates does not include entities associated with Morgan Stanley Wealth Management, such as Morgan Stanley Smith Barney LLC and Morgan Stanley & Co. |
| Affiliates | | Companies related by common ownership or control. They can be financial and nonfinancial companies. ∎ Our affiliates include companies with a Morgan Stanley name and financial companies such as Morgan Stanley Smith Barney LLC and Morgan Stanley & Co. |
| Nonaffiliates | | Companies not related by common ownership or control. They can be financial and nonfinancial companies. ∎ Eaton Vance does not share with nonaffiliates so they can market to you. |
| Joint marketing | | A formal agreement between nonaffiliated financial companies that together market financial products or services to you. ∎ Eaton Vance doesn’t jointly market. |
| Other important information |
Vermont: Except as permitted by law, we will not share personal information we collect about Vermont residents with Nonaffiliates unless you provide us with your written consent to share such information. California: Except as permitted by law, we will not share personal information we collect about California residents with Nonaffiliates and we will limit sharing such personal information with our Affiliates to comply with California privacy laws that apply to us. |
Eaton Vance Funds
IMPORTANT NOTICES
Delivery of Shareholder Documents. The Securities and Exchange Commission (SEC) permits funds to deliver only one copy of shareholder documents, including prospectuses, proxy statements and shareholder reports, to fund investors with multiple accounts at the same residential or post office box address. This practice is often called “householding” and it helps eliminate duplicate mailings to shareholders. Eaton Vance, or your financial intermediary, may household the mailing of your documents indefinitely unless you instruct Eaton Vance, or your financial intermediary, otherwise. If you would prefer that your Eaton Vance documents not be householded, please contact Eaton Vance at 1-800-260-0761, or contact your financial intermediary. Your instructions that householding not apply to delivery of your Eaton Vance documents will typically be effective within 30 days of receipt by Eaton Vance or your financial intermediary.
Portfolio Holdings. Each Eaton Vance Fund and its underlying Portfolio(s) (if applicable) files a schedule of portfolio holdings on Part F to Form N-PORT with the SEC. Certain information filed on Form N-PORT may be viewed on the Eaton Vance website at www.eatonvance.com, by calling Eaton Vance at 1-800-260-0761 or in the EDGAR database on the SEC’s website at www.sec.gov.
Proxy Voting. From time to time, funds are required to vote proxies related to the securities held by the funds. The Eaton Vance Funds or their underlying Portfolios (if applicable) vote proxies according to a set of policies and procedures approved by the Funds’ and Portfolios’ Boards. You may obtain a description of these policies and procedures and information on how the Funds or Portfolios voted proxies relating to portfolio securities during the most recent 12-month period ended June 30, without charge, upon request, by calling 1-800-260-0761 and by accessing the SEC’s website at www.sec.gov.
Investment Adviser of 5-to-15 Year Laddered Municipal Bond Portfolio
Boston Management and Research
Two International Place
Boston, MA 02110
Investment Adviser and Administrator of Parametric TABS 5-to-15 Year Laddered Municipal Bond Fund
Eaton Vance Management
Two International Place
Boston, MA 02110
Investment Sub-Adviser
Parametric Portfolio Associates LLC
800 Fifth Avenue, Suite 2800
Seattle, WA 98104
Principal Underwriter*
Eaton Vance Distributors, Inc.
Two International Place
Boston, MA 02110
(617) 482-8260
Custodian
State Street Bank and Trust Company
State Street Financial Center, One Lincoln Street
Boston, MA 02111
Transfer Agent
BNY Mellon Investment Servicing (US) Inc.
Attn: Eaton Vance Funds
P.O. Box 9653
Providence, RI 02940-9653
(800) 260-0761
Independent Registered Public Accounting Firm
Deloitte & Touche LLP
200 Berkeley Street
Boston, MA 02116-5022
Fund Offices
Two International Place
Boston, MA 02110
| * | FINRA BrokerCheck. Investors may check the background of their Investment Professional by contacting the Financial Industry Regulatory Authority (FINRA). FINRA BrokerCheck is a free tool to help investors check the professional background of current and former FINRA-registered securities firms and brokers. FINRA BrokerCheck is available by calling 1-800-289-9999 and at www.FINRA.org. The FINRA BrokerCheck brochure describing this program is available to investors at www.FINRA.org. |
22626 1.31.22
Item 2. Code of Ethics
The registrant (sometimes referred to as the “Fund”) has adopted a code of ethics applicable to its Principal Executive Officer, Principal Financial Officer and Principal Accounting Officer. The registrant undertakes to provide a copy of such code of ethics to any person upon request, without charge, by calling 1-800-262-1122. The registrant has not amended the code of ethics as described in Form N-CSR during the period covered by this report. The registrant has not granted any waiver, including an implicit waiver, from a provision of the code of ethics as described in Form N-CSR during the period covered by this report.
Item 3. Audit Committee Financial Expert
The registrant’s Board of Trustees (the “Board”) has designated George J. Gorman, William H. Park and Scott E. Wennerholm, each an independent trustee, as audit committee financial experts. Mr. Gorman is a certified public accountant who is the Principal at George J. Gorman LLC (a consulting firm). Previously, Mr. Gorman served in various capacities at Ernst & Young LLP (a registered public accounting firm), including as Senior Partner. Mr. Gorman also has experience serving as an independent trustee and audit committee financial expert of other mutual fund complexes. Mr. Park is a certified public accountant who is a private investor.
Previously, he served as a consultant, as the Chief Financial Officer of Aveon Group, L.P. (an investment management firm), as the Vice Chairman of Commercial Industrial Finance Corp. (specialty finance company), as President and Chief Executive Officer of Prizm Capital Management, LLC (investment management firm), as Executive Vice President and Chief Financial Officer of United Asset Management Corporation (an institutional investment management firm) and as a Senior Manager at Price Waterhouse (now PricewaterhouseCoopers) (a registered public accounting firm). Mr. Wennerholm is a private investor. Previously, Mr. Wennerholm served as a Trustee at Wheelock College (postsecondary institution), as a Consultant at GF Parish Group (executive recruiting firm), Chief Operating Officer and Executive Vice President at BNY Mellon Asset Management (investment management firm), Chief Operating Officer and Chief Financial Officer at Natixis Global Asset Management (investment management firm), and Vice President at Fidelity Investments Institutional Services (investment management firm).
Item 4. Principal Accountant Fees and Services
Eaton Vance High Yield Municipal Income Fund, Parametric TABS Intermediate-Term Municipal Bond Fund, Parametric TABS Short-Term Municipal Bond Fund, Parametric TABS 5-to-15 Year Laddered Municipal Bond Fund, Parametric TABS 1-to-10 Year Laddered Municipal Bond Fund and Parametric TABS 10-to-20 Year Laddered Municipal Bond Fund (the “Fund(s)”) are series of Eaton Vance Municipals Trust II (the “Trust”), a Massachusetts business trust, which, including the Funds, contains a total of 6 series (the “Series”). The Trust is registered under the Investment Company Act of 1940 as an open-end management investment company. This Form N-CSR relates to the Funds’ annual reports.
(a)-(d)
The following tables present the aggregate fees billed to each Fund for the Fund’s fiscal years ended January 31, 2021 and January 31, 2022 by the registrant’s principal accountant, Deloitte & Touche LLP (“D&T”), for professional services rendered for the audit of the Fund’s annual financial statements and fees billed for other services rendered by D&T during such periods.
Eaton Vance High Yield Municipal Income Fund
| | | | | | | | |
Fiscal Years Ended | | 1/31/21 | | | 1/31/22 | |
Audit Fees | | $ | 81,900 | | | $ | 79,050 | |
Audit-Related Fees(1) | | $ | 0 | | | $ | 0 | |
Tax Fees(2) | | $ | 12,988 | | | $ | 13,338 | |
All Other Fees(3) | | $ | 0 | | | $ | 0 | |
| | | | | | | | |
Total | | $ | 94,888 | | | $ | 92,388 | |
| | | | | | | | |
Parametric TABS Intermediate-Term Municipal Bond Fund
| | | | | | | | |
Fiscal Years Ended | | 1/31/21 | | | 1/31/22 | |
Audit Fees | | $ | 40,950 | | | $ | 40,950 | |
Audit-Related Fees(1) | | $ | 0 | | | $ | 0 | |
Tax Fees(2) | | $ | 9,508 | | | $ | 9,508 | |
All Other Fees(3) | | $ | 0 | | | $ | 0 | |
| | | | | | | | |
Total | | $ | 50,458 | | | $ | 50,458 | |
| | | | | | | | |
Parametric TABS 5-to-15 Year Laddered Municipal Bond Fund
| | | | | | | | |
Fiscal Years Ended | | 1/31/21 | | | 1/31/22 | |
Audit Fees | | $ | 15,150 | | | $ | 15,150 | |
Audit-Related Fees(1) | | $ | 0 | | | $ | 0 | |
Tax Fees(2) | | $ | 6,483 | | | $ | 6,483 | |
All Other Fees(3) | | $ | 0 | | | $ | 0 | |
| | | | | | | | |
Total | | $ | 21,633 | | | $ | 21,633 | |
| | | | | | | | |
Parametric TABS Short-Term Municipal Bond Fund
| | | | | | | | |
Fiscal Years Ended | | 1/31/21 | | | 1/31/22 | |
Audit Fees | | $ | 40,650 | | | $ | 40,650 | |
Audit-Related Fees(1) | | $ | 0 | | | $ | 0 | |
Tax Fees(2) | | $ | 7,783 | | | $ | 9,858 | |
All Other Fees(3) | | $ | 0 | | | $ | 0 | |
| | | | | | | | |
Total | | $ | 48,433 | | | $ | 50,508 | |
| | | | | | | | |
Parametric TABS 1-to-10 Year Laddered Municipal Bond Fund
| | | | | | | | |
Fiscal Years Ended | | 1/31/21 | | | 1/31/21 | |
Audit Fees | | $ | 29,650 | | | $ | 31,150 | |
Audit-Related Fees(1) | | $ | 0 | | | $ | 0 | |
Tax Fees(2) | | $ | 6,671 | | | $ | 8,321 | |
All Other Fees(3) | | $ | 0 | | | $ | 0 | |
| | | | | | | | |
Total | | $ | 36,321 | | | $ | 39,471 | |
| | | | | | | | |
Parametric TABS 10-to-20 Year Laddered Municipal Bond Fund
| | | | | | | | |
Fiscal Years Ended | | 1/31/21 | | | 1/31/22 | |
Audit Fees | | $ | 25,075 | | | $ | 26,050 | |
Audit-Related Fees(1) | | $ | 0 | | | $ | 0 | |
Tax Fees(2) | | $ | 9,171 | | | $ | 10,046 | |
All Other Fees(3) | | $ | 0 | | | $ | 0 | |
| | | | | | | | |
Total | | $ | 34,246 | | | $ | 36,096 | |
| | | | | | | | |
| (1) | Audit-related fees consist of the aggregate fees billed for assurance and related services that are reasonably related to the performance of the audit of financial statements and are not reported under the category of audit fees. |
| (2) | Tax fees consist of the aggregate fees billed for professional services rendered by the principal accountant relating to tax compliance, tax advice, and tax planning and specifically include fees for tax return preparation and other related tax compliance/planning matters. |
| (3) | All other fees consist of the aggregate fees billed for products and services provided by the principal accountant other than audit, audit-related, and tax services. |
The Funds comprised all of the Series of the Trust at January 31, 2022, and have the same fiscal year end (January 31). The following table presents the aggregate audit, audit-related, tax, and other fees billed to all of the Series in the Trust by D&T for the last two fiscal years of each Series.
| | | | | | | | |
Fiscal Years Ended | | 1/31/21 | | | 1/31/22 | |
Audit Fees | | $ | 233,375 | | | $ | 233,000 | |
Audit-Related Fees(1) | | $ | 0 | | | $ | 0 | |
Tax Fees(2) | | $ | 52,604 | | | $ | 57,554 | |
All Other Fees(3) | | $ | 0 | | | $ | 0 | |
| | | | | | | | |
Total | | $ | 285,979 | | | $ | 290,554 | |
| | | | | | | | |
| (1) | Audit-related fees consist of the aggregate fees billed for assurance and related services that are reasonably related to the performance of the audit of financial statements and are not reported under the category of audit fees. |
| (2) | Tax fees consist of the aggregate fees billed for professional services rendered by the principal accountant relating to tax compliance, tax advice, and tax planning and specifically include fees for tax return preparation and other related tax compliance/planning matters. |
| (3) | All other fees consist of the aggregate fees billed for products and services provided by the principal accountant other than audit, audit-related, and tax services. |
(e)(1) The registrant’s audit committee has adopted policies and procedures relating to the pre-approval of services provided by the registrant’s principal accountant (the “Pre-Approval Policies”). The Pre-Approval Policies establish a framework intended to assist the audit committee in the proper discharge of its pre-approval
responsibilities. As a general matter, the Pre-Approval Policies (i) specify certain types of audit, audit-related, tax, and other services determined to be pre-approved by the audit committee; and (ii) delineate specific procedures governing the mechanics of the pre-approval process, including the approval and monitoring of audit and non-audit service fees. Unless a service is specifically pre-approved under the Pre-Approval Policies, it must be separately pre-approved by the audit committee.
The Pre-Approval Policies and the types of audit and non-audit services pre-approved therein must be reviewed and ratified by the registrant’s audit committee at least annually. The registrant’s audit committee maintains full responsibility for the appointment, compensation, and oversight of the work of the registrant’s principal accountant.
(e)(2) No services described in paragraphs (b)-(d) above were approved by the registrant’s audit committee pursuant to the “de minimis exception” set forth in Rule 2-01(c)(7)(i)(C) of Regulation S-X.
(f) Not applicable.
(g) The following table presents (i) the aggregate non-audit fees (i.e., fees for audit-related, tax, and other services) billed for services rendered to all of the Series in the Trust by D&T for the last two fiscal years of each Series; and (ii) the aggregate non-audit fees (i.e., fees for audit-related, tax, and other services) billed to the Eaton Vance organization by D&T for the last two fiscal years of each Series.
| | | | | | | | |
Fiscal Years Ended | | 1/31/21 | | | 1/31/22 | |
Registrant(1) | | $ | 52,604 | | | $ | 57,554 | |
Eaton Vance(2) | | $ | 150,300 | | | $ | 51,800 | |
| (1) | Includes all of the Series of the Trust. |
| (2) | The investment adviser to the Series, as well as any of its affiliates that provide ongoing services to the Series, are subsidiaries of Morgan Stanley. |
(h) The registrant’s audit committee has considered whether the provision by the registrant’s principal accountant of non-audit services to the registrant’s investment adviser and any entity controlling, controlled by, or under common control with the adviser that provides ongoing services to the registrant that were not pre-approved pursuant to Rule 2-01(c)(7)(ii) of Regulation S-X is compatible with maintaining the principal accountant’s independence.
Item 5. Audit Committee of Listed Registrant
Not applicable.
Item 6. Schedule of Investments
Please see schedule of investments contained in the Report to Stockholders included under Item 1 of this Form N-CSR.
Item 7. Disclosure of Proxy Voting Policies and Procedures for Closed-End Management Investment Companies
Not applicable.
Item 8. Portfolio Managers of Closed-End Management Investment Companies
Not applicable.
Item 9. Purchases of Equity Securities by Closed-End Management Investment Company and Affiliated Purchasers
Not applicable.
Item 10. Submission of Matters to a Vote of Security Holders
No material changes.
Item 11. Controls and Procedures
(a) It is the conclusion of the registrant’s principal executive officer and principal financial officer that the effectiveness of the registrant’s current disclosure controls and procedures (such disclosure controls and procedures having been evaluated within 90 days of the date of this filing) provide reasonable assurance that the information required to be disclosed by the registrant has been recorded, processed, summarized and reported within the time period specified in the Commission’s rules and forms and that the information required to be disclosed by the registrant has been accumulated and communicated to the registrant’s principal executive officer and principal financial officer in order to allow timely decisions regarding required disclosure.
(b) There have been no changes in the registrant’s internal controls over financial reporting during the period covered by this report that has materially affected, or is reasonably likely to materially affect, the registrant’s internal control over financial reporting.
Item 12. Disclosure of Securities Lending Activities for Closed-End Management Investment Companies
Not applicable.
Item 13. Exhibits
Signatures
Pursuant to the requirements of the Securities Exchange Act of 1934 and the Investment Company Act of 1940, the registrant has duly caused this report to be signed on its behalf by the undersigned, thereunto duly authorized.
| | |
| Eaton Vance Municipals Trust II |
| |
| By: | | /s/ Eric A. Stein |
| | Eric A. Stein |
| | President |
| |
| Date: | | March 28, 2022 |
Pursuant to the requirements of the Securities Exchange Act of 1934 and the Investment Company Act of 1940, this report has been signed below by the following persons on behalf of the registrant and in the capacities and on the dates indicated.
| | |
| By: | | /s/ James F. Kirchner |
| | James F. Kirchner |
| | Treasurer |
| |
| Date: | | March 28, 2022 |
| |
| By: | | /s/ Eric A. Stein |
| | Eric A. Stein |
| | President |
| |
| Date: | | March 28, 2022 |